
the Creative Commons Attribution 4.0 License.
the Creative Commons Attribution 4.0 License.
 | 24 Jul 2026
Contribution of free tropospheric aerosols to Arctic low-level cloud droplets formation and longwave radiative forcing

Heather Guy
Ian Morley Brooks
Lea Haberstock
Nicolas Fauré
Paul Zieger
Julia Kojoj
Sonja Murto
Radiance Calmer
Benjamin Heutte
Michael Lonardi
Erik Schurch Thomson
Michael Tjernström
Jessie Creamean
Athanasios Nenes
Aerosol-cloud-radiation interactions are a major source of uncertainty in the Arctic climate, particularly for low-level clouds (LLC) that dominate cloud cover. This study presents in situ measurements of aerosols and cloud droplets collected with a tethered balloon between 16 May and 10 June 2023, during the Atmospheric Rivers and the onseT of sea ice MELT campaign above sea ice in the Fram Strait. The objective was to quantify the contributions of boundary-layer and free-tropospheric sources to the cloud condensation nuclei (CCN) budget of LLCs. Above- and below-cloud observations of five LLCs showed enhanced aerosol concentrations above cloud top in four cases.
The analysis of a case study, in which the cloud was coupled to the surface, revealed a complex layered structure of aerosol properties, including multiple distinct size distributions. Aerosol concentrations above the cloud were up to four times higher than below, and measurements at the cloud-top interface indicated mixing consistent with entrainment of free-tropospheric aerosol. Simulations of cloud droplet concentrations based on measured particle size distributions showed that including aerosols from above cloud, rather than only below, improved agreement with observed droplet concentrations. Our observations through the cloud allowed us to highlight the potential importance of free-tropospheric CCN sources, which influence Arctic cloud microphysical and radiative properties. Concretely, not accounting for additional CCN would have resulted in a low bias in the longwave radiative forcing of 1.3 W m−2. These findings highlight the need for systematic vertical aerosol observations and improved model representation of elevated aerosol layers.
- Article
(7065 KB) - Full-text XML
-
Supplement
(1959 KB) - BibTeX
- EndNote


The Arctic climate is changing rapidly, and the surface energy budget (SEB) is highly dependent on the presence of clouds and their macro and microphysical properties (e.g., Intrieri et al., 2002; Sedlar et al., 2011; Tjernström et al., 2008). In the Arctic, low-level mixed-phase and liquid stratocumulus clouds (referred to hereafter as low-level clouds (LLCs) for simplicity) commonly occur year-round (Mioche et al., 2015; Morrison et al., 2012; Shupe, 2011). Clouds affect both the downwelling shortwave radiative fluxes by reflecting incoming solar radiation and net longwave radiation by radiating towards the surface as black bodies. While clouds generally have a cooling effect globally, Arctic LLCs above snow-covered sea ice lead to positive radiative forcing for much of the year (Shupe and Intrieri, 2004). This is because positive longwave radiative forcing dominates over negative shortwave forcing due to absence of sunlight in winter (Curry et al., 1993; Intrieri et al., 2002; Kay et al., 2016; Sedlar et al., 2011), and high surface albedo in summer and low solar zenith angle (except for a short period when the sea ice includes many melt ponds). Although the importance of clouds for the Arctic SEB is well established, accurately simulating their radiative forcing remains difficult with models (McCusker et al., 2023). As a result, cloud-related radiative fluxes constitute the largest source of errors in Arctic SEB predictions (Sedlar et al., 2020; Solomon et al., 2023; Tjernström et al., 2008).
One of the sources of this uncertainty arises from aerosol-cloud interactions, whose representation in models remains challenging (Morrison et al., 2012; Tjernström et al., 2008). Aerosols play crucial roles in modulating cloud properties by acting as cloud condensation nuclei (CCN) that form liquid droplets and ice-nucleating particles (INPs) that form ice crystals. Their presence can influence cloud formation, total condensate amount, phase partitioning, lifetime, dynamics and radiative effects (e.g., Fan et al., 2016; Lohmann and Feichter, 2005). Accurate knowledge of the aerosol properties that seed clouds is therefore fundamental.
In the Arctic, above sea ice, aerosol concentrations can be low, limiting the formation of clouds (e.g., Bigg et al., 1996; Boyer et al., 2023; Creamean et al., 2022; Lannefors et al., 1983; Mauritsen et al., 2011). Furthermore, frequent surface-based or low-level temperature inversions (Akansu et al., 2023; Bradley et al., 1992; Jozef et al., 2024) and decoupling layers (i.e., vertically discontinuous turbulent mixing) between the surface and LLCs can inhibit the supply of aerosols from local surface sources upwards to the clouds (Brooks et al., 2017; Shupe et al., 2013). Under these conditions, ground-based measurements of aerosols are not necessarily representative of the aerosols seeding the clouds (Creamean et al., 2021). Given the specific conditions of the Arctic, the free troposphere can constitute an alternative important source of CCN and INPs for cloud formation and sustainment (Igel et al., 2017; Sterzinger and Igel, 2024), much like humidity inversions above clouds have been shown to sustain Arctic LLCs (Solomon et al., 2014).
The importance of elevated aerosol layers located above cloud top has already been observed in previous studies like Kupiszewski et al. (2013) and Pilz et al. (2024) who performed vertical measurements of size-resolved aerosol concentrations in the Arctic. They measured increasing aerosol concentrations with altitude in the free troposphere on several occasions. The observed concentrations for CCN-sized particles were up to an order of magnitude greater than within the boundary layer.
Their studies showed higher aerosol concentrations in the free troposphere than within the boundary layer on several occasions. These layers had concentrations of up to about an order of magnitude greater than within the boundary layer for CCN-sized particles. In a modeling study, Price et al. (2023) found that aerosols from remote sources, entrained into the boundary layer from the free troposphere, accounted for nucleation (<10 nm) and Aitken (10–100 nm) mode particle concentrations that were otherwise underestimated by the model. In another study, using large-eddy simulations, Igel et al. (2017) showed that when layers of enhanced aerosol number concentrations were present above Arctic LLCs, these particles could activate at cloud top and be entrained into the cloud. Thereby they showed that aerosol properties at the surface were not always a good indicator of all aerosol particles feeding the cloud.
Despite mounting evidence that more concentrated aerosol layers above Arctic LLCs are common and that entrainment from the free troposphere can replenish boundary-layer aerosol, key uncertainties remain regarding how frequently this pathway is relevant across the Arctic and how strongly it perturbs cloud microphysical and radiative properties. Observational evidence for enhanced aerosol concentrations aloft has often relied on limited observations and did not provide a direct microphysical closure linking CCN availability above cloud to in-cloud droplet number concentrations or resulting radiative properties (Creamean et al., 2021; Kupiszewski et al., 2013; Pilz et al., 2024). Hence, an important outstanding question is whether and when entrainment of free-tropospheric aerosol in LLCs measurably alters cloud droplet activation and the associated radiative properties of the LLCs.
To answer these questions, we first need more extensive profiling observations of CCN, INP and cloud microphysical properties (Kretzschmar et al., 2020; Sedlar et al., 2020; Wendisch et al., 2023) in order to characterize the aerosol seeding of clouds, their origin and under which conditions the aerosols at the surface are or are not representative of the aerosols in the cloud layer and when aerosols in the free troposphere become important to consider.
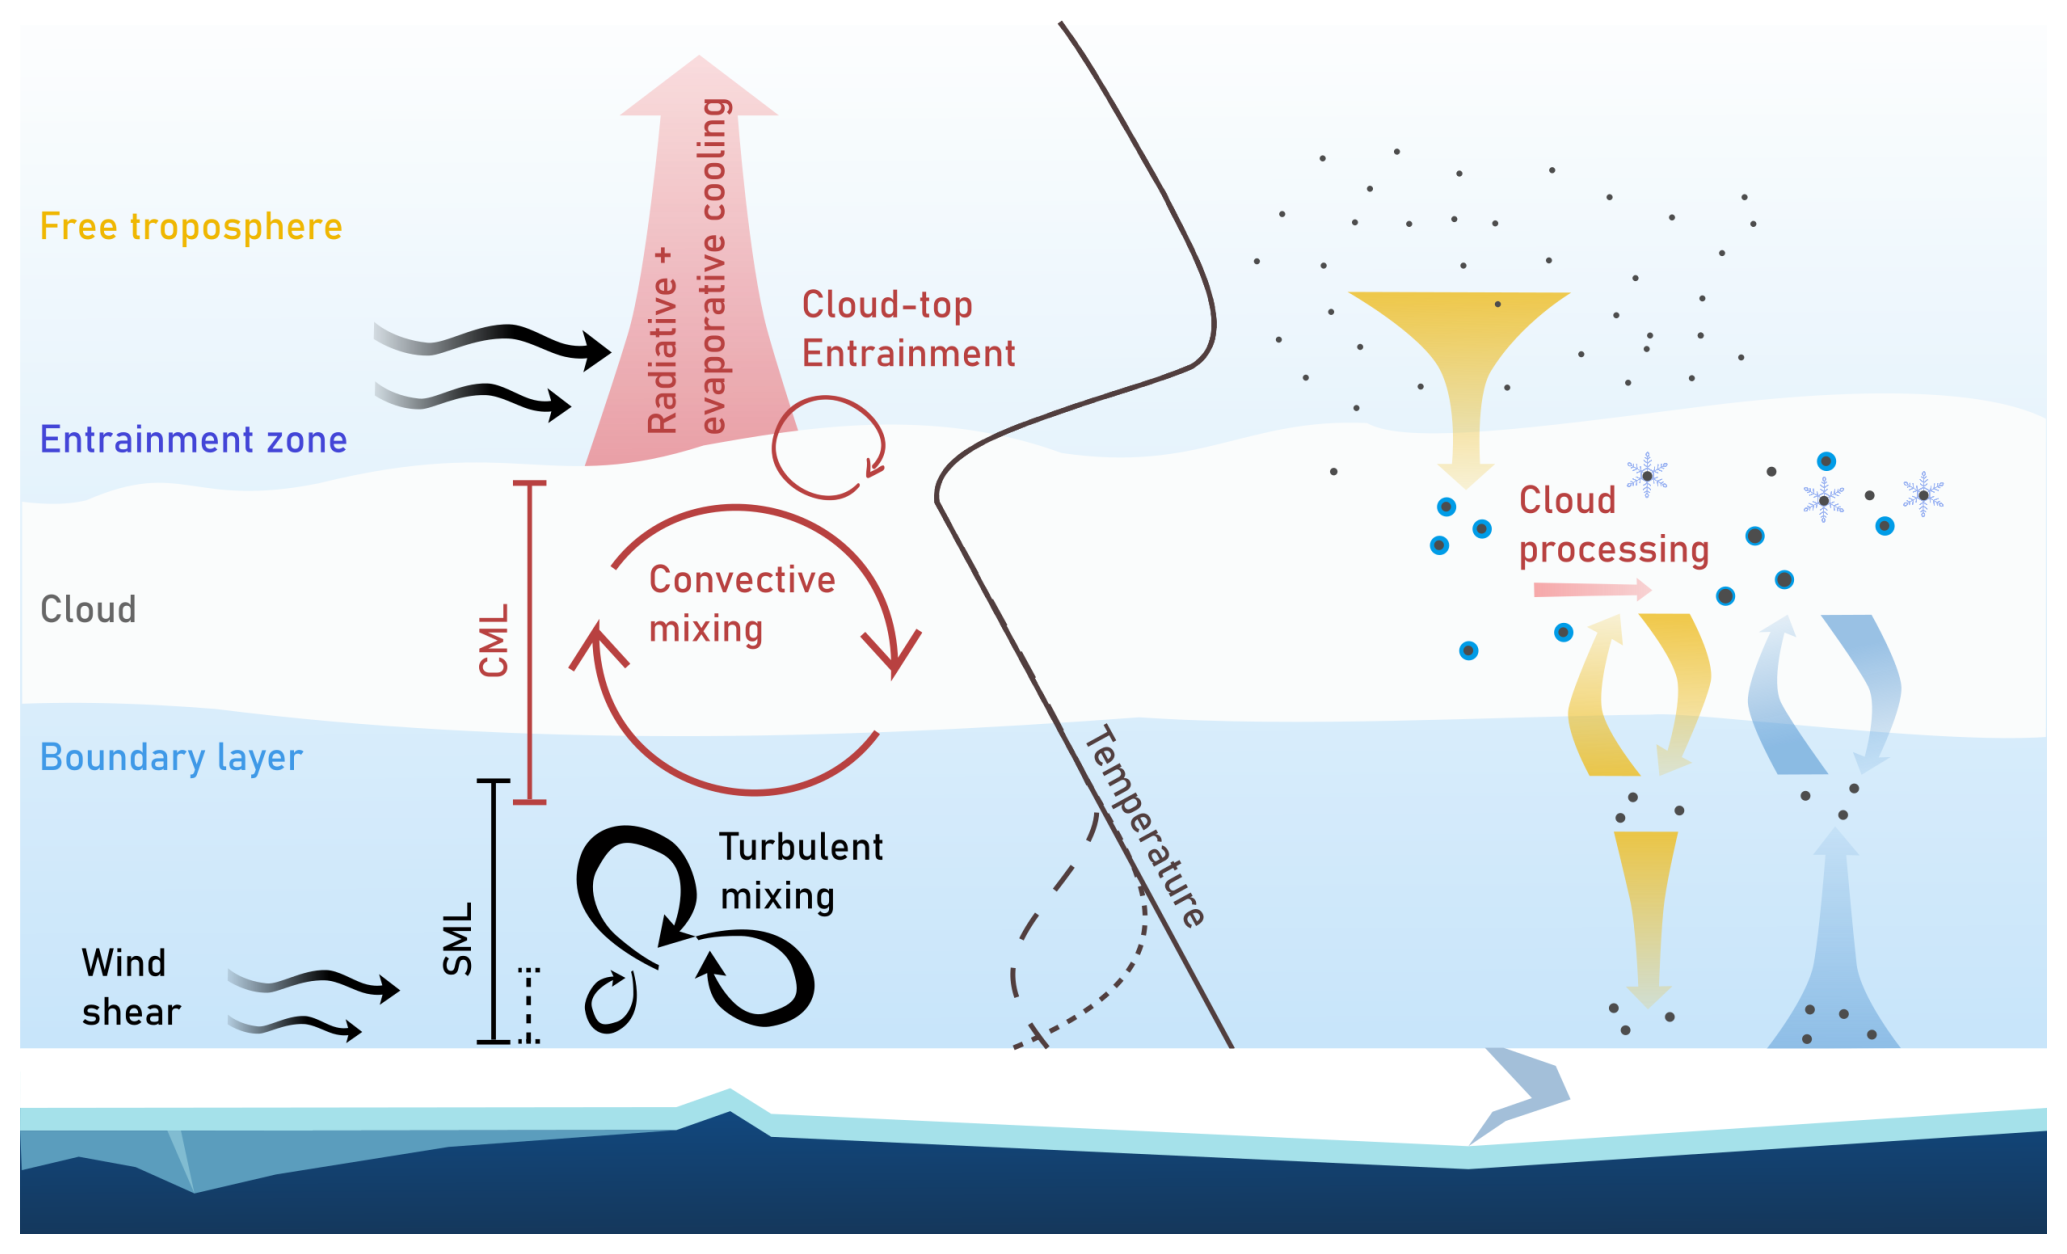
Figure 1Schematic of low-level cloud over the pack ice in the Arctic. On the left, the different elements of the cloud-topped Arctic boundary layer are illustrated, based on Fig. 2 from Brooks et al. (2017), including the surface mixing layer (SML), the convective mixing layer (CML) and entrainment from cloud-top cooling. An idealized temperature profile represents a well-mixed boundary layer for a cloud base coupled to the surface (full line) and two alternative situations with an elevated inversion below the cloud base (long, dashed line) and a surface-based inversion (short, dashed lines). On the right, two idealized pathways of cloud-feeding aerosols are depicted. Blue arrows represent a situation with only boundary layer contributions of cloud condensation nuclei (CCN) and ice-nucleating particles (INP). Yellow arrows also include a contribution of free tropospheric aerosols to the cloud's CCN and INP budget.
In this study, we explicitly address the role of the free troposphere as a source of CCN (and by extension INPs, although not explicitly analyzed here) for Arctic LLCs and investigate how accounting for this source modifies cloud microphysical and longwave radiative properties compared to a framework that only considers boundary-layer aerosols. In particular, we aim to
- i.
assess whether the free troposphere can supply a measurable addition of CCN for Arctic LLC formation and sustainment, and
- ii.
examine how cloud microphysical and radiative characteristics differ depending on whether aerosol sources above the cloud are included.
To address these questions, we follow a framework that links aerosol pathways to the thermodynamic and turbulent structure of the cloud-topped Arctic boundary layer. The framework, illustrated in Fig. 1, includes the different Arctic LLC components. In the lowest portion of the boundary layer a surface mixing layer (SML) is maintained just above the surface, driven primarily by surface wind shear. At the upper part of the boundary layer and including LLCs themselves is a cloud mixed layer (CML), where turbulence is driven by buoyant overturning within the clouds resulting from cloud top radiative cooling. Turbulence at cloud top promotes entrainment of free tropospheric air. Depending on the extent of the layers, turbulence may span the full boundary layer depth or be vertically discontinuous. The dynamics discussed here are critical to understanding the influence of below- and above-cloud aerosol on the cloud properties as they determine from where aerosols are mostly transported into the cloud. On the right, two aerosol pathways are shown. The first (represented by blue arrows) only considers surface and boundary layer aerosols as an important source of CCN and INPs for the cloud and a re-circulation of those particles between the cloud and the atmospheric column below. The second pathway (yellow arrows) also considers the incorporation of free tropospheric aerosols as an additional significant source of CCN and INPs.
To investigate how relevant the free tropospheric pathway can be for Arctic LLCs and address the research questions stated above, a tethered ballon-based platform, the Modular Multiplatform Air Compatible Measurement System (MoMuCAMS, Pohorsky et al., 2024) was deployed during the 2023 Atmospheric Rivers and the onseT of sea ice MELT (ARTofMELT) expedition. Tethered balloons are an advantageous platform for high-resolution vertical measurements. They can carry significant instrument payloads (compared to drones), can hover at fixed altitudes and operate in clouds even under icing conditions (e.g., Creamean et al., 2021; Pilz et al., 2022; Pohorsky et al., 2024). The deployment of such balloons enables very detailed measurements between the surface and the lower free troposphere (altitudes that are often too low for crewed aircraft). The ability of MoMuCAMS to measure the size distribution of nucleation, Aitken and accumulation mode (100–1000 nm) particles (a novelty for tethered balloon observations) is a distinction that is critical to identifying different aerosol populations, observing aerosol processing in the vicinity of the clouds and better quantifying CCN concentrations. Additionally, cloud droplet number concentration measurements are a direct characterization of clouds' microphysical properties. Here, we leveraged the measurement and flying capabilities of the MoMuCAMS platform to perform a closure analysis of cloud droplets, which was used to evaluate the role of CCN contributions from above an observed cloud. That analysis is complemented with cloud droplet activation simulations and radiative transfer modeling to quantify how different the microphysical and longwave radiative properties of the cloud are when considering cloud seeding from aerosol particles located above.
The ARTofMELT expedition took place in the Fram Strait onboard the Swedish icebreaker Oden from 9 May to 13 June 2023. The cruise began and ended in Longyearbyen and included two ice camps, where vertical measurements were performed with a 45 m3 Helikite lifting the MoMuCAMS (Fig. 2). In total, 23 flights on 13 different days were carried out between 16 May and 10 June (see Table S1 in the Supplement).
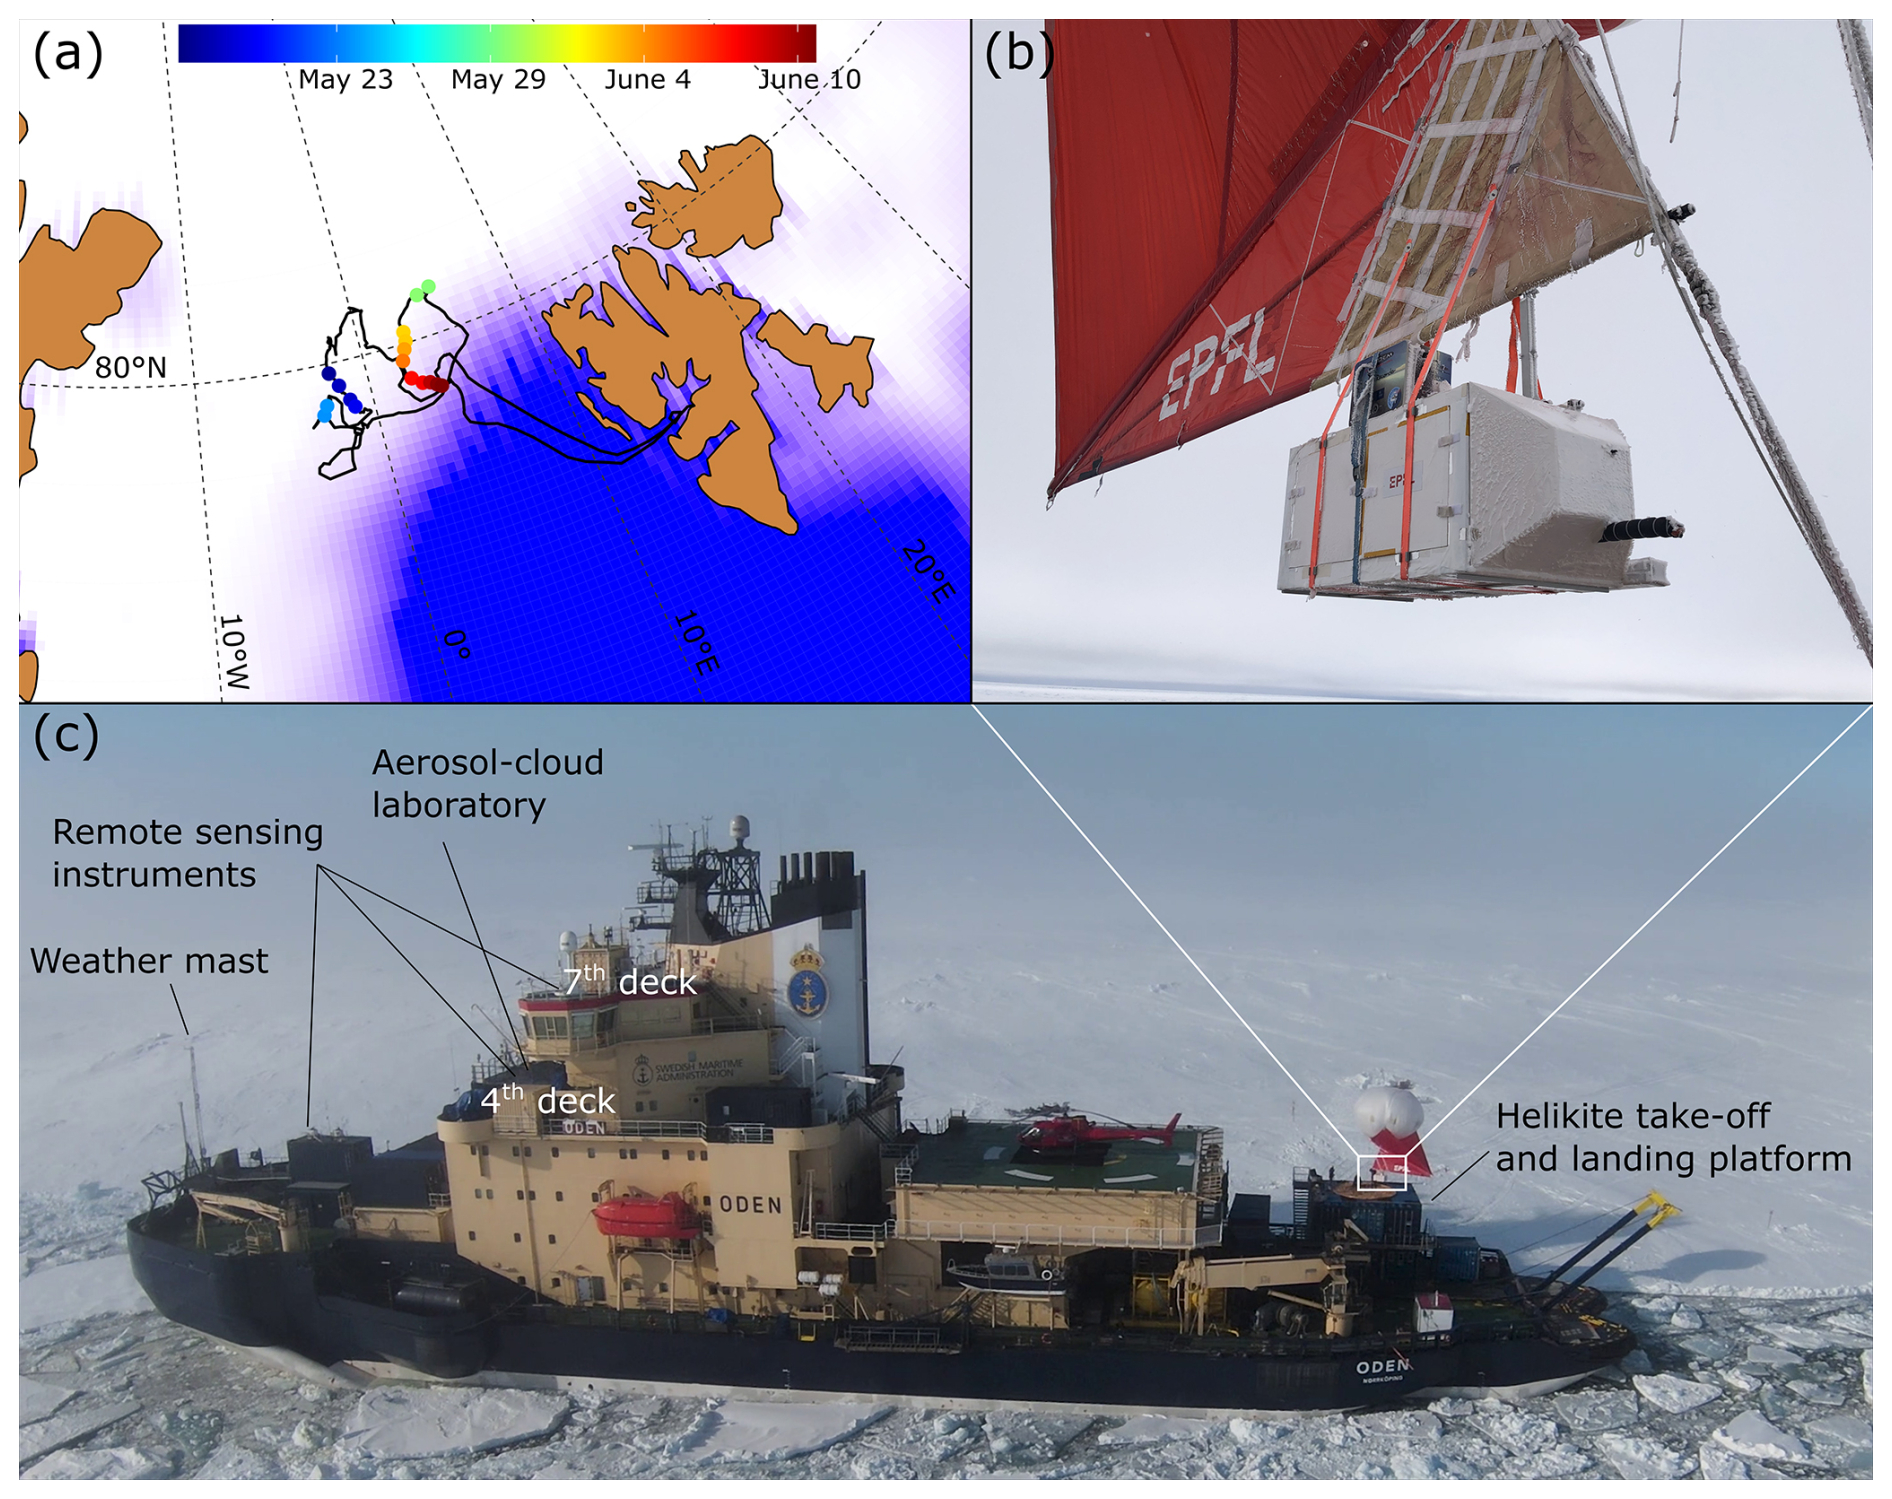
Figure 2(a) Ship track and location of Helikite flights during the ARTofMELT campaign. The colored dots represents the Helikite flights dates and locations. The white to blue ocean surface shading depicts the 16 May 2023 sea ice concentration (day of the first Helikite flight). Data source: https://www.ncei.noaa.gov/products/climate-data-records/sea-ice-concentration (last access: 27 August 2024). (b) Close-up view of MoMuCAMS attached to the Helikite. The LOAC is placed on top of the enclosure. Photo credit: Roman Pohorsky. (c) The IB Oden moored to an ice floe with different measurement platforms indicated. Photo credit: Christopher Groop.
2.1 Helikite instrumentation
The in situ measurements were performed with the MoMuCAMS described in Pohorsky et al. (2024). It was deployed from a container platform located on the aft deck of the ship (see Fig. 2c) and equipped with instruments to characterize aerosol and cloud droplet properties. The maximum altitude reached was 645 m above sea level (m a.s.l.) and the average vertical velocity of the balloon during operations was ≈15 m min−1.
A miniaturized scanning electrical mobility spectrometer (mSEMS model 9404, Brechtel Manufacturing Inc., USA) provided particle number size distribution (PNSD) measurements for particles with electrical mobility diameters between 8 and 280 nm with 40 log-spaced size bins and a bin time of 4 s, yielding a time resolution of 2 min 40 s per scan, which corresponds to ≈40 m on average during ascents and descents of the Helikite. A portable optical particle spectrometer (POPS, Handix Scientific, USA) provided PNSD measurements for optical diameters between 186 and 3370 nm. The POPS was operated with 16 log-spaced size bins and a 1 Hz acquisition frequency.
A light optical aerosols counter (LOAC, Meteomodem, France) was installed on top of MoMuCAMS to measure the size distribution of aerosols and cloud droplets from 200 nm up to 50 µm with a time resolution of 30 s (Renard et al., 2016). In the LOAC, two detectors measure the scattering, at 12 and 60°, produced by the sampled particles traveling through a laser beam. The intensity of the forward scattering signal is used to measure the size of the particles and the difference between the two angles provides additional information to classify particle types (e.g., carbonaceous, minerals, liquid droplets).
In addition to aerosol measurements, meteorological variables were measured during the flights. A wind probe (SmartTether, Anasphere, USA) attached directly to the tether, ≈1.5 m below the MoMuCAMS collected wind speed and direction data at 0.5 Hz. Two sensors (SHT85, Sensirion, CH), installed in an insulated and actively ventilated radiation shield casing attached to the side of MoMuCAMS, measured temperature and relative humidity (RH). Pressure was recorded in triplicate by sensors located on the MoMuCAMS's board computer (MPL115A2, Adafruit, USA), the SmartTether and the POPS. A summary of deployed instruments for each flight during the campaign is listed in Table S1.
2.2 Helikite data processing
Data processing followed the procedure described in Schmale et al. (2026) based on the EBAS guidelines (https://ebas-submit.nilu.no/, last access: 20 December 2025). Raw mSEMS data files were inverted using a software package provided by the manufacturer. At level 0, one data file per flight that includes the data from the different instruments, was created. At level 1, the meteorological variables were cleaned for invalid data. Because the ship was warmed by incoming solar radiation, an influence on the temperature profiles was observed in the first tens of meters. This influence was identified by a steeper temperature gradient relative to that observed higher up. The altitude of influence on the temperature measurements was manually identified for each profile and data below this altitude were flagged. Additionally, a corrected temperature profile was produced. The temperature profile was reconstructed between the take-off altitude and the highest point of temperature influence by extrapolating the temperature data above and assuming the same temperature gradient as the observed mean gradient. An example of the temperature influence of the ship, data flagging and reconstructed temperature profile is shown in Fig. S1 in the Supplement.
The altitude above sea level was calculated using the barometric formula,
where T0 is the temperature at the surface, L0=6.5 K km−1 is the mean environmental lapse rate, p0 and pb are the pressure at the surface and balloon height, respectively, R=287 is the gas constant for dry air and g is the Earth's gravitational constant.
Aerosol data were manually inspected for outliers and anomalous data, which were flagged and removed. An intercomparison of the MoMuCAMS with the ship-based aerosol instruments (see Sect. 2.3) indicated an undercounting of aerosol number concentration by the POPS (about 30 %). A size-dependent correction for aerosol counting was applied based on a comparison with a differential mobility particle sizer (DMPS) during a ground-based intercomparison. Aerosol concentrations were then converted to standard temperature and pressure using the temperature measured in the sampling line. Results of the comparison and corrected size distribution are shown in Fig. S2 and correction factors are listed in Table S2.
To derive the total aerosol number concentration (N8–3370), the mSEMS and POPS measurements were merged. For each mSEMS measurement, the higher temporal resolution POPS data were averaged over the corresponding mSEMS sampling interval. The merged size distribution consisted of the mSEMS measurements between 8 nm and the lower detection limit of the POPS (186 nm), combined with the POPS size distribution above this diameter, resulting in a total size range from 8–3370 nm.
For the cloud droplet size distribution and concentration, we selected “particles” larger than 3 µm, that were classified as droplets by the LOAC. Concentrations for different bin sizes are normalized by the respective bin width (dN dlog (Dp)−1). A comparison of the data from the LOAC and a fog monitor (FM120, Droplet Measurement Technologies, USA) shows that the LOAC droplet number concentration agrees within 20 %–30 % with the reference instrument. Details of the analysis are shown in the Supplement (Fig. S3).
Pollution from the ship exhaust was identified visually for each profile. Ship exhaust plumes were identified by strong and rapid increases in the aerosol number concentration (typically between 30 and 50 m altitude). Polluted data points were flagged and removed from the analysis. An example of a profile with flagged ship pollution is shown in Fig. S1.
Finally, a 10 s arithmetic averaging was applied to the data (except for the mSEMS and LOAC data with initial coarser resolutions). For the analysis of vertical profiles presented in this study, the data were spatially averaged into 10 m altitude bins and plotted at the midpoint altitude.
2.3 Supporting data from IB Oden
To complement the analysis of the MoMuCAMS vertical profiles, ship-based remote sensing and in situ observations were used. At the front of the ship's superstructure, on the fourth deck, the mobile aerosol-cloud laboratory container from Stockholm University was equipped with a suite of aerosol instruments (see location in Fig. 2c). A differential mobility particle spectrometer (DMPS) sampled from a total inlet (i.e., sampling all aerosol sizes), providing aerosol number size distribution measurements for particles with an electrical mobility between 15 and 840 nm at a time resolution of 12 min (as in Karlsson et al., 2022). A cloud condensation nuclei counter (CCNC, Droplet Measurement Technologies, USA) (Lance et al., 2006; Roberts and Nenes, 2005) operated in parallel to measure the CCN concentration. The CCNC operated at supersaturations of 0.1 %, 0.2 %, 0.3 %, 0.5 % and 1.0 % with a duration of 15 min per supersaturation level.
A suite of remote sensing instrumentation made continuous measurements throughout the cruise. A 94 GHz W-band Doppler Cloud Radar (RPG-FMCW-94-SP, Radiometer Physics GmbH, Germany) was installed on top of a container on the 4th deck, this provided measurements of radar backscatter and Doppler velocities with a vertical resolution between 7.45 and 28.6 m (depending on range) and time resolution of approximately 5.4 s. A laser ceilometer (CL31, Vaisala, Finland) installed on the 7th deck, provided measurements of cloud base every 30 s with a range resolution of 10 m. Liquid water path was estimated by a microwave radiometer (HATPRO, Radiometer Physics GmbH, Germany). Here cloud boundaries are derived from the cloud radar and laser ceilometer. Profiles of liquid water content are derived via the Cloudnet algorithm (Illingworth et al., 2007) using data from the radar, ceilometer, HATPRO, and radiosondes. A HALO Photonics Streamline Doppler Lidar (HALO Photonics, UK), installed above a container on the 2nd deck, was used to measure the vertical velocities at cloud base and in the lower part of the cloud.
Radiosondes (RS41, Vaisala, Finland) were launched every 6 h during the campaign (nominally at 05:30, 11:30, 17:30 and 23:30 UTC). Data from the radiosondes were used to complete meteorological data from the Helikite flights, which were more sporadic in time and limited in altitude. The data used from the radiosoundings included pressure, temperature, and relative and specific humidity.
Measurements of near surface meteorology (temperature, pressure, relative humidity, wind speed and wind direction, upwelling and downwelling longwave and shortwave radiation) were obtained from a weather station composed of a meteorological mast and a radiometer stand installed on the sea ice and from the ship's weather station (at 25 m altitude).
Finally, synoptic conditions were inspected with ERA5 data (Soci et al., 2024), and backward trajectory analysis data from the Lagrangian analysis tool (LAGRANTO; Sprenger and Wernli, 2015) were used to determine the origin and influences of air masses arriving at the ship location during Helikite flights. For each backward trajectory simulation, an ensemble of ≈37 5 d trajectories was calculated. The arrival point of each trajectory was located in a 100 km circle around the ship's location at 50 hPa above sea level. Shapes and tracks of surface cyclones were calculated on ERA5 dataset based on the MOAAP tracking algorithm (Prein et al., 2023); continuous areas in the sea level pressure (SLP) anomaly field below −8 hPa and persisting for more than 12 h are identified as cyclones.
2.4 Temperature inversion and cloud coupling analysis
Temperature profiles from radiosoundings and Helikite flights were analyzed to identify the heights of temperature inversions. Inversions were identified by layers with a positive vertical temperature gradient () for at least 25 m (Jozef et al., 2022; Kahl, 1990). The temperature inversion height was used to characterize thermodynamic coupling between observed LLCs and the surface. Following Pilz et al. (2024), a cloud is considered to be decoupled (thermodynamically) if a surface-based inversion was detected or if the base of an elevated inversion was located below the cloud base.
2.5 Cloud boundaries determination
An inherent challenge in analyzing tethered balloon profiles that extend through clouds is to accurately determine cloud base and cloud top boundaries. In this study, we estimated these boundaries using a combination of relative humidity (RH≈100 %), in-flight video recordings and observed aerosol concentrations. Within clouds the MoMuCAMS' low sampling flow rate means that primarily interstitial aerosol (i.e., non-activated particles) is sampled, because cloud droplets are too heavy to be drawn into instruments. Consequently, observed aerosol concentrations decreased within cloud layers.
To validate cloud boundary estimates, and monitor changes over time, we compared them with ceilometer-derived cloud base heights and radar reflectivity data. An example of the cloud boundary determination is shown in Fig. S4. It should be noted that cloud boundaries, particularly cloud base, are inherently diffuse, and their exact definition is subject to interpretation, introducing an inherent uncertainty of approximately ±30 m.
2.6 Droplet activation parametrization
We use an aerosol activation parametrization developed by Nenes and Seinfeld (2003) and further improved by Fountoukis and Nenes (2005), Barahona et al. (2010) and Morales Betancourt and Nenes (2014) to calculate the number of cloud droplets (Nd) formed in observed clouds and compare those values with the in situ LOAC measurements. The parametrization requires aerosol PNSD, hygroscopicity, updraft velocity and environmental conditions at cloud height (pressure and temperature) as inputs.
In the parametrization, we used the approach introduced by Morales and Nenes (2010) to calculate the probability density function (PDF)-averaged Nd and supersaturation (smax) in the cloud (which is representative of the measured droplet number concentration) by applying the parametrization using a single characteristic velocity, (Conant et al., 2004; Fountoukis et al., 2007; Georgakaki et al., 2021; Motos et al., 2023). The σw is the standard deviation of a gaussian fit of the vertical velocity data at cloud base obtained from the Doppler Lidar. To be representative of the variability of the vertical velocity, the PDF is generated from data over one hour. The pressure and temperature data at cloud base are obtained from Helikite and radiosonde measurements. For parametrizations with data collected between profiles, the Helikite and radiosonde pressure and temperature measurements are interpolated.
The aerosol number size distribution data measured directly below cloud base (i.e. 50 m layer below cloud base) and in the entrainment zone were used as inputs for different simulation scenarios. The PNSDs were fitted with lognormal distributions using a multipeak fitting package in IGOR Pro v9.02 and reconstructed to fit the required number of bins assumed by the parametrization scheme.
The hygroscopicity parameter (κ) was calculated from ship-based measurements of aerosol PNSD and CCN concentrations following the method of Petters and Kreidenweis (2007),
where Sc is the critical saturation ratio (), with ssc = critical supersaturation in %. The critical dry diameter (Dd) at each supersaturation was calculated by integrating the aerosol size distribution from the larger particle sizes to the lowest until the integrated concentration matched the CCN concentration.
The A is defined as follows:
where the surface tension of water in air J m−2 and the temperature of T=298.15 K is used. ρw=997 kg m−3 is the density of water, kg mol−1 is the molecular weight of water and R=8.3145 is the ideal gas constant.
2.7 Radiative transfer modeling
To assess clouds' influence on downwelling longwave radiation in response to the number and size of cloud droplets, radiative transfer modeling (RTM) was performed. We used a plane-parallel radiative transfer model with the DISORT solver (Stamnes et al., 1988) implemented in the libRadtran 2.0.6 software package (Emde et al., 2016; Mayer and Kylling, 2005). Simulations were performed with the LOWTRAN parametrization for gaseous absorption (Ricchiazzi et al., 1998). For aerosols, we used standard maritime profiles based on the model of Shettle (1990). The season was set to “summer”. Temperature and relative humidity profiles were based on radiosoundings and complemented with Helikite measurements in the lower layers as in Lonardi et al. (2024).
A profile of liquid water content (LWC) and droplet effective radius (reff) is included to account for cloud effects on radiation. The reff is obtained as in Lonardi et al. (2024),
where ρw is the density of liquid water and the parameter k converts the effective droplet radius into the volumetric droplet radius and was set to 0.8, which is representative for stratocumulus clouds (Brenguier et al., 2011). The LWC was retrieved from remote sensing data and reff was calculated by assuming a constant Nd profile throughout the cloud column.
The remote-sensing retrievals were used because they provide continuous cloud microphysical information throughout the day, whereas the LOAC measurements were only available during balloon profiles and occasionally contained data gaps caused by detector saturation at high droplet concentrations. To evaluate the consistency between both approaches, LWC derived from the LOAC droplet size distributions was compared with the remote-sensing retrievals and showed good agreement (Fig. S5). Details on LWC and reff calculation from the LOAC measurements are provided in the Supplement.
We present here an overview of the conditions during the ARTofMELT campaign to provide a broader context for the following analysis of a case study. Figure 3 shows near surface meteorology, cloud conditions, surface radiation and aerosol concentrations between 16 May (establishment of the first ice camp) and 13 June (ship leaving the ice).
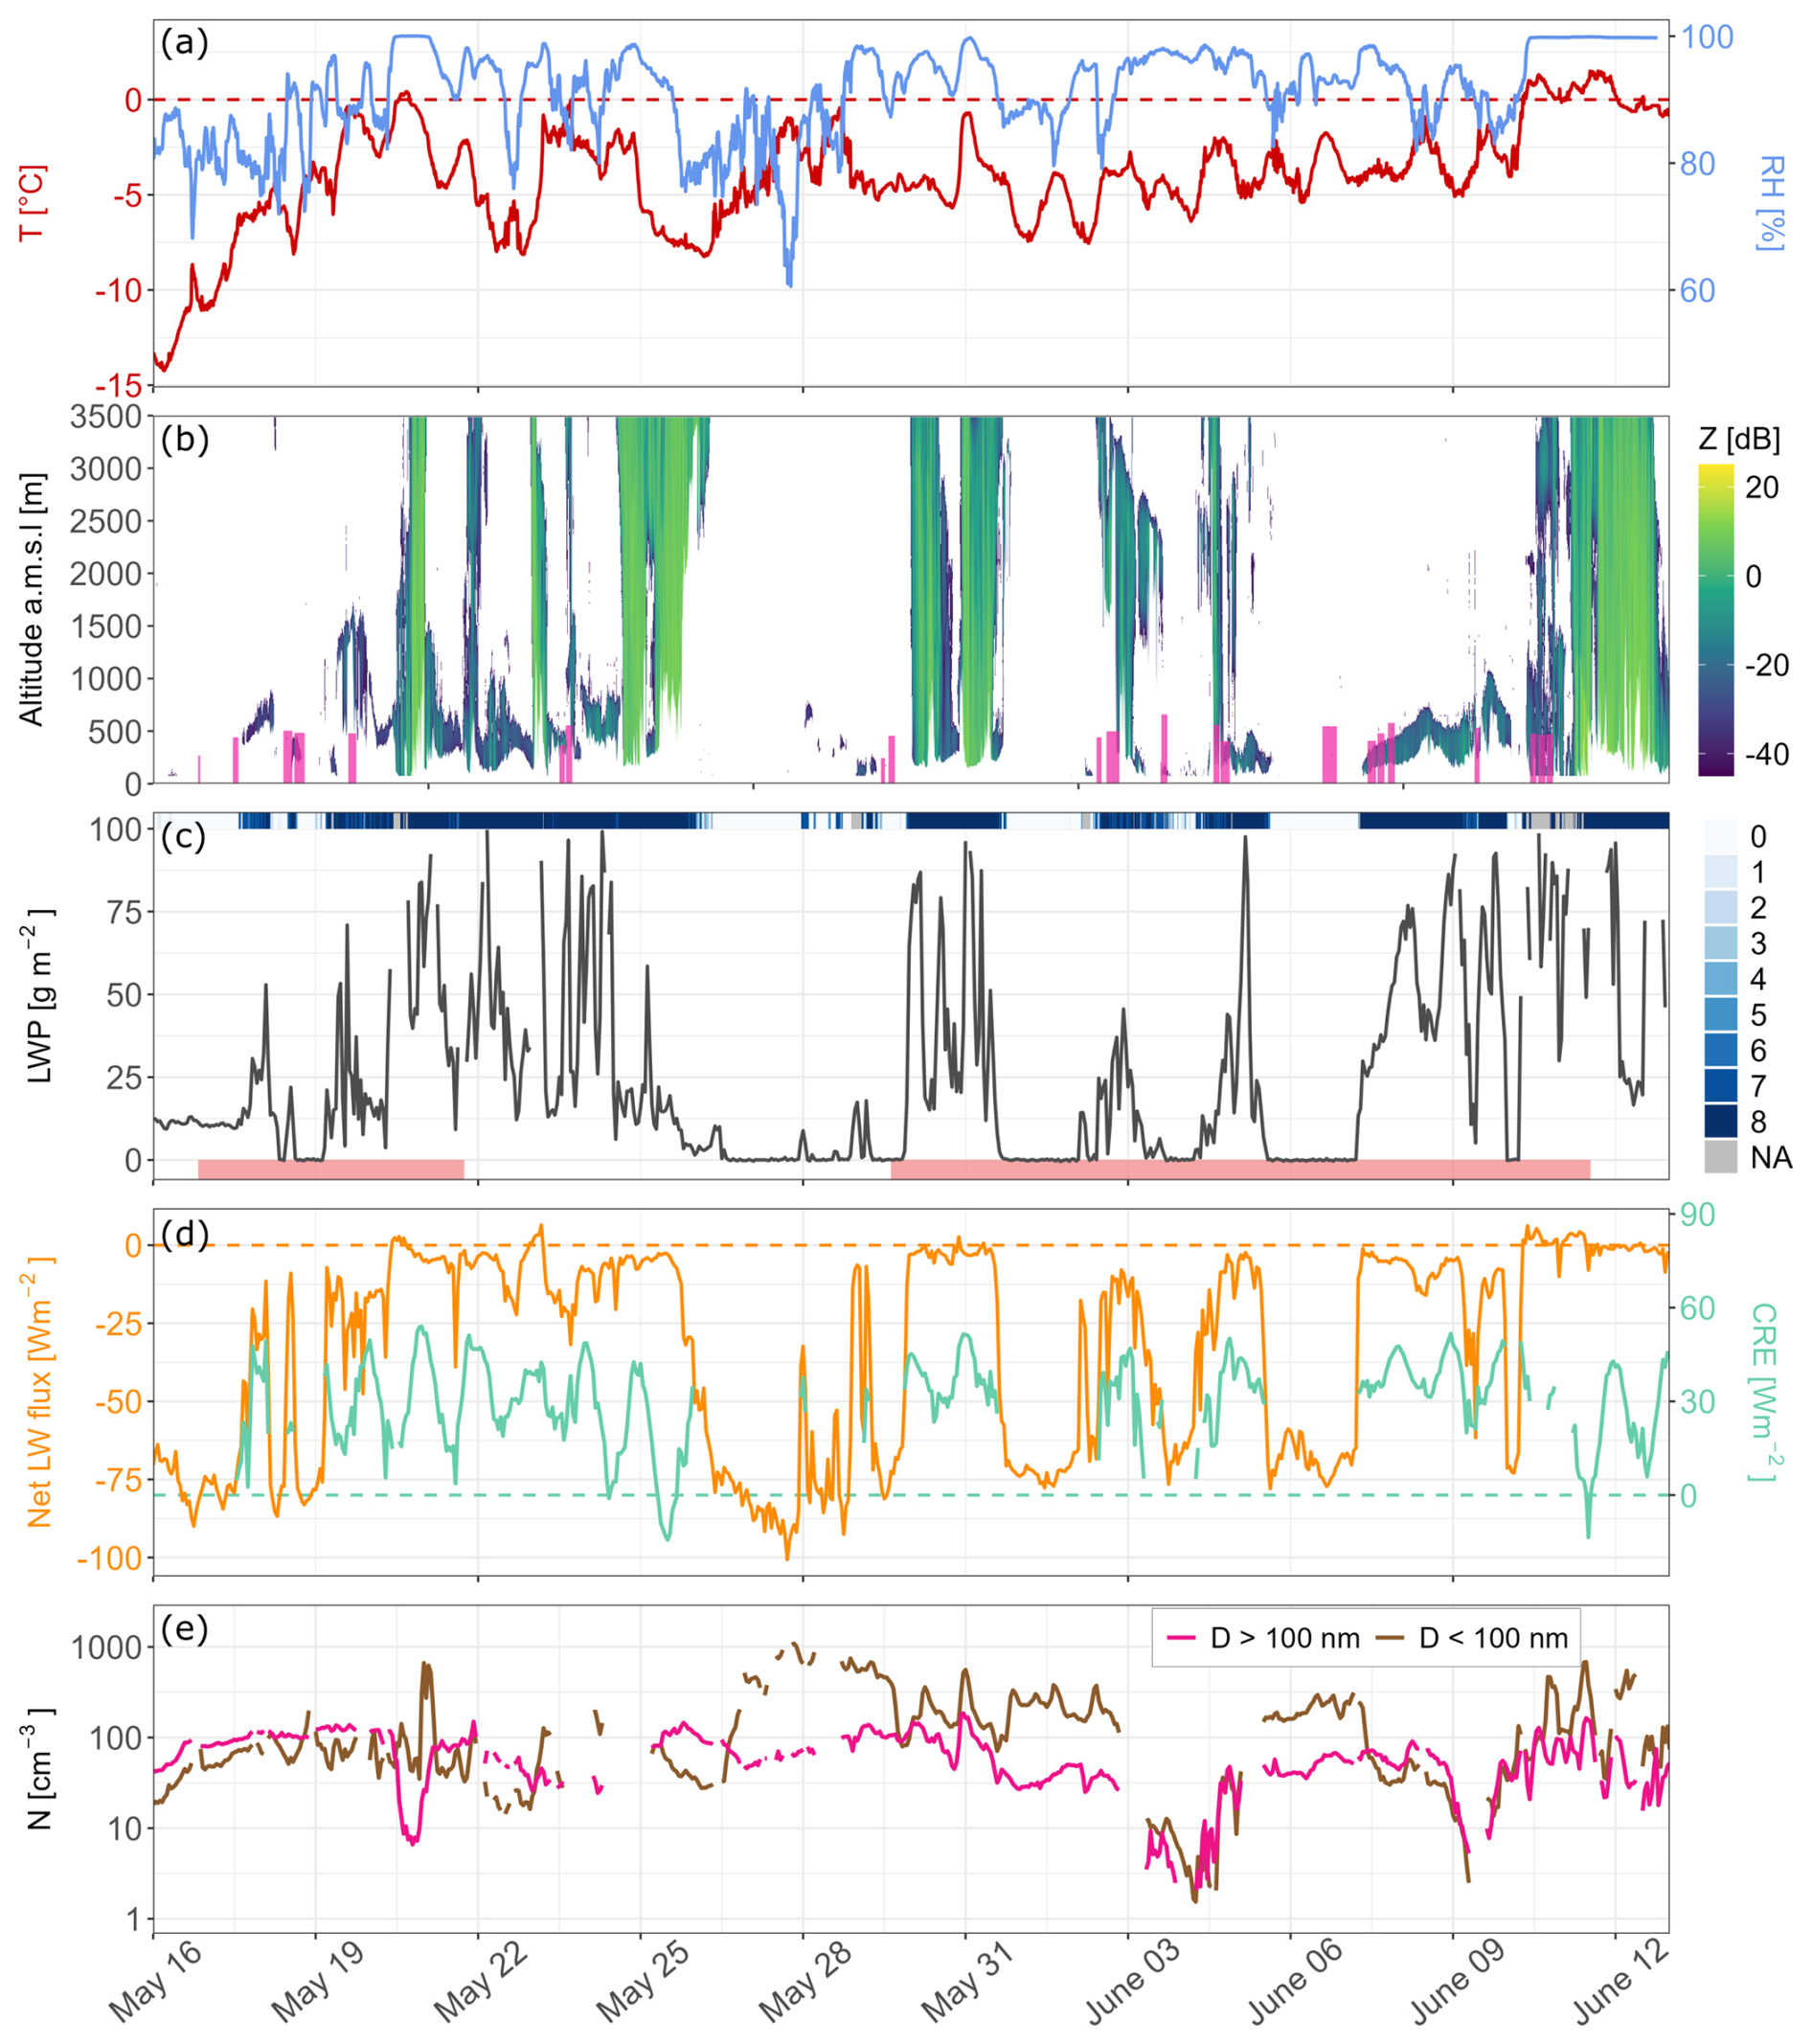
Figure 3Overview of cloud relevant variables during the ARTofMELT campaign, 16 May to 23 June. (a) Ship-based temperature (red) and relative humidity (blue) measurements 25 m a.s.l. Horizontal dashed line indicates 0 °C. (b) Radar reflectivity measurements, up to 3500 m, show the presence of LLCs. Purple rectangles indicate each Helikite flight, including its maximum altitude and duration. (c) Liquid water path (LWP) measured with the HATPRO microwave radiometer. The top bar indicates the cloud fraction in oktas while the lower pink bars indicate the two ice camp periods. (d) Net longwave radiation (orange) and cloud radiative effect (CRE, green). (e) Aerosol particle concentration at ship level for particles with diameters below (brown) and above (pink) 100 nm, respectively. Periods influenced by ship pollution were removed in panel (e).
During the first days, the temperature rose from −14 °C to just above 0 °C on 20 May (Fig. 3a). It then varied between 0 and −8 °C until 10 June, when it again exceeded 0 °C, coinciding with the onset of sea-ice melt. The relative humidity was continuously high with values usually exceeding 80 %.
Overall, a cloud fraction above 5 oktas (representing a cloudy sky) represented 64 % of the observation period (Fig. 3c). Within these cloudy conditions, a cloud base below 2000 m was detected 97 % of the time. Although some of these clouds might have been deep frontal clouds, Fig. 3b shows that clouds with a base below 2000 m were mainly shallow stratiform clouds. The cloudiness during ARTofMELT falls at the lower end of cloud fractions reported during major Arctic field campaigns such as the Surface Heat Budget of the Arctic Ocean campaign (SHEBA, ≈88 % monthly average in May and June; Intrieri et al., 2002), the Arctic Ocean 2018 (AO2018, ≈96 % cloud occurrence in August and September; Vüllers et al., 2021), and the Multidisciplinary drifting Observatory for the Study of Arctic Climate (MOSAiC, 74 % and 82 % cloud occurrence in May and June, respectively; Achtert et al., 2026); yet the dominance of low-level clouds during ARTofMELT is consistent with the well-established prevalence of LLCs in the central Arctic (Intrieri et al., 2002; Jimenez et al., 2025; Vüllers et al., 2021).
The 23 Helikite flights and their respective maximum altitude are displayed in Fig. 3b. Flights covered the full period and sampled all the conditions encountered during the campaign. Clouds were sampled on 8 d with the Helikite (16/23 Helikite flights in total). Out of these 8 cloud situations, the Helikite flew above the cloud top on 5 different days (8 different flights in total). More details on the vertical measurements of these 5 clouds are provided below (Sect. 3.1).
The median LWP (Fig. 3c) was 27.9 g m−2 during cloudy conditions with an interquartile range (IQR) from 12.3 to 65.1 g m−2. These values are similar to previously reported values from 2.5 years of cloud observations conducted at Ny-Ålesund by Gierens et al. (2020), who observed a median LWP of 24.3 g m−2 [IQR=7.3–55.6 g m−2] for the summer season, and are to be expected for Arctic clouds (Sedlar, 2014).
In Fig. 3d, we can see how the presence of clouds affects the surface radiative budget. The net longwave flux (i.e., downwelling minus upwelling radiation fluxes) shows a bimodal pattern with values W m−2 during clear sky conditions and W m−2 during cloudy conditions, which are typical for the Arctic summer (e.g., Solomon et al., 2023). We also assessed the total cloud radiative effect (CRE) by comparing measured downwelling fluxes (both longwave and shortwave) to simulated fluxes with a radiative transfer model assuming clear sky conditions. More details on the data and radiative transfer simulations are provided in the data descriptor (Murto et al., 2024a).
The total CRE was calculated as,
where and represent the measured and simulated clear sky downwelling longwave radiation fluxes, respectively. and represent the same but for the shortwave radiation. The α is the surface albedo and was obtained from the on ice weather station measurements. By multiplying the difference in SW↓ by 1−α, we obtain the difference of absorbed shortwave radiation between clear sky and cloudy conditions. The albedo data was interpolated between the two ice camps to provide a representative value for snow covered ice conditions. Here we assume the LW↑ (upwelling longwave radiation) is the same for clear sky and cloudy situation and α is independent of SW↓. The CRE (Fig. 3d) during the campaign was generally positive with maximum values of ≈50 W m−2 at local midnight when the sun was at its lowest point. At noon, the CRE was lower but usually remained positive. These observations confirm the warming effect of clouds in the Arctic and their importance for the SEB and sea-ice melt.
Figure 3e shows the aerosol concentration measured by the DMPS onboard IB Oden for two size ranges (<100 nm for nucleation and Aitken mode particles and >100 nm for accumulation and coarse mode particles). The total concentration varied between a maximum of ≈1200 cm−3 and a minimum of below 5 cm−3, while the median was ≈170 cm−3. Excluding a few brief interruptions, the first period (until 25 May) is marked by a dominance of accumulation mode particles, a signature of Arctic haze, characteristic of spring conditions (e.g., Boyer et al., 2023; Freud et al., 2017; Heutte et al., 2025; Schmale et al., 2022). The median concentrations were 81 and 45 cm−3 for particles greater than and smaller than 100 nm, respectively. On 26 May, we observe a shift to a summer regime with more dominance of nucleation and Aitken mode particles from local natural sources such as emissions from biological activity (e.g., Leck and Persson, 1996; Pereira Freitas et al., 2025). The respective median concentrations were then 50 and 160 cm−3 for particles greater than and smaller than 100 nm.
Diverse aerosol profiles through clouds measured with the Helikite
Here we focus on the five cloud cases where the Helikite flew above the cloud top, allowing aerosol measurements to be collected aloft. Average temperature and aerosol profiles for each case study are shown in Fig. 4. To facilitate comparison across cases, the altitude of each profile was normalized such that the distances between the lowest altitude and cloud base, cloud base and cloud top, and cloud top and the maximum altitude are each mapped onto one third of the profile. The flight on 3 June was conducted in fog; therefore, the profile begins at the cloud base, which coincides with the start altitude.
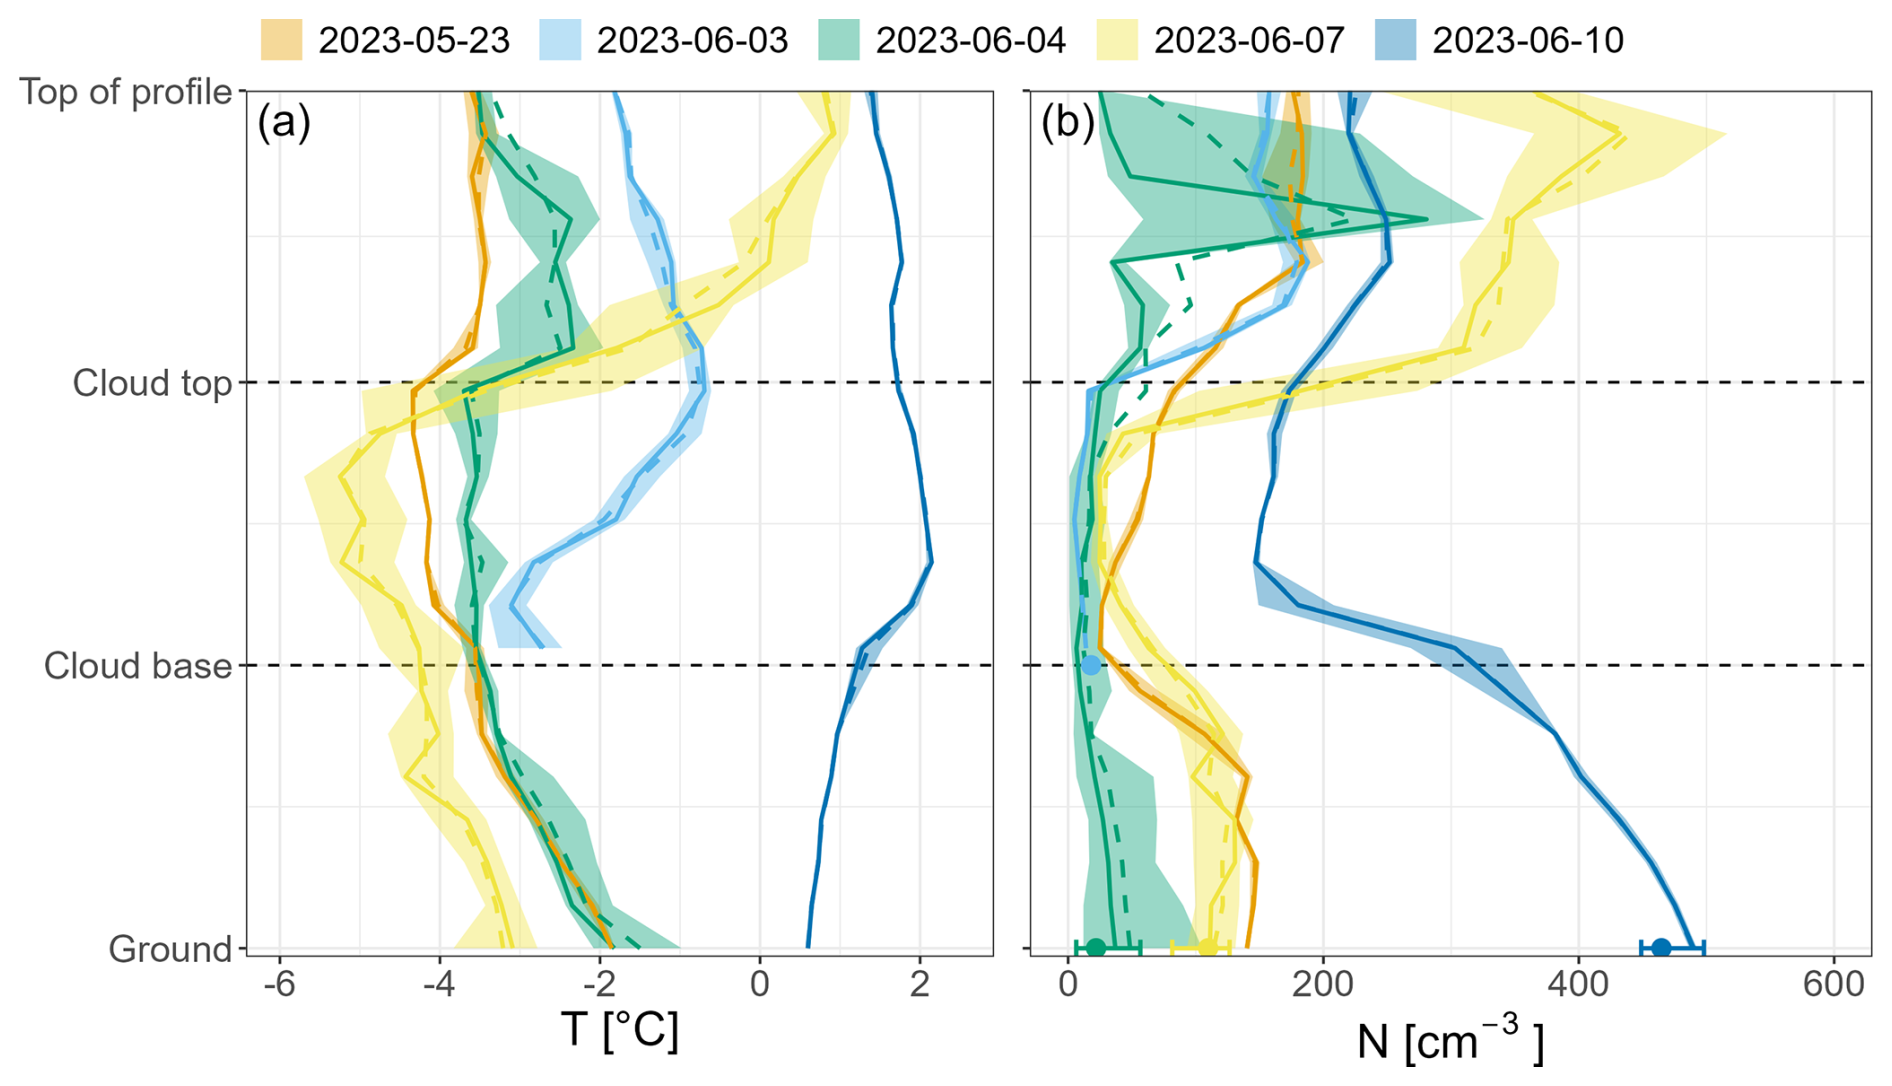
Figure 4Averaged profiles of (a) temperature and (b) aerosol concentrations (for particles with diameters from 8–3370 nm) through low-level clouds or fog layers (dates are indicated in the color legend). The altitude of each profile was normalized to the altitude of the cloud base and top, such that below, within and above cloud each represent one third of the vertical profile. Full lines represent the median of all profiles per day, the dashed line is the mean, and the shading represents the interquartile range. Dots and error bars represent the median and interquartile range from ship-based measurements with the DMPS (15–870 nm, no data on 23 May).
The flights conducted on 23 May, 4 June, and 7 June exhibited a relatively well mixed boundary layer with no significant aerosol concentration gradients between the surface and cloud base. Measured aerosol concentrations progressively decreased with altitude as the Helikite approached cloud base and reached a minimum inside the cloud, suggesting they were progressively activated with height into cloud droplets over a distance of a few tens of meters and were therefore not sampled by the inlet (as illustrated in Fig. S4). These concentration gradients reflect the diffuse cloud boundaries discussed in Sect. 2.5, where the clouds' optical depth gradually increases along with the number of cloud droplets but is initially below the remote sensing instruments detection limit. The well-mixed boundary layer below the clouds was consistent with the temperature profiles (Fig. 4a), which showed no inversion below the cloud base on any of these days. In contrast, the 10 June flight displayed a pronounced negative aerosol gradient from the surface to the cloud base. On this day, a surface-based temperature inversion due to the advection of a warm air mass was observed, indicating reduced vertical mixing between the surface and the cloud base. This indicates that surface-based measurements were not representative of cloud-level conditions for CCN and INP concentrations at that time.
For the 10 June flight, the concentration of interstitial aerosols (≈150 cm−3) was greater than on other days consistent with increased concentrations of Aitken- and nucleation-mode particles, which likely remained below the activation size under the cloud conditions encountered during this flight. Except for 10 June higher aerosol concentrations were observed above the cloud compared to below with enhancement factors between 1.3 and 3.9. These findings are consistent with previous studies (e.g., Kupiszewski et al., 2013; Pilz et al., 2024) underlining the likely relevance of free tropospheric aerosols as an important source of CCN and INPs for Arctic LLCs, which is not captured by surface-based measurements. To further investigate the contribution of particles below and above the cloud to the cloud droplet number concentration and longwave radiative properties, a detailed case study is presented in the following section.
On the morning of 7 June 2023, a low-level cloud was advected over the ship location at 79.64° N, 2.52° E. The cloud cover persisted through the day and continued until late on 9 June, allowing several Helikite flights through the cloud to collect detailed information on aerosol and cloud microphysical characteristics.
4.1 Synoptic conditions and air mass history
In Fig. 5 the sea-level pressure (SLP) anomalies north of 60° N are visualized for 7 June and complemented by five-day back trajectories arriving at 50 hPa above sea level (≈ cloud height) at the ship location. The SLP anomalies show a low-pressure trough extending along the East coast of Greenland and high-pressure ridge over the Greenland Sea that extends over the sea ice. The Oden was located at the tip of the ridge. Not seen in Fig. 5 is a cyclone located north of Svalbard between 2 June and 5 June. The back trajectories indicate that the air arriving at Oden originated from the central Arctic (north of Greenland) and followed the trough along the Greenlandic East coast before turning and traveling north towards the ship, along the marginal ice zone between the low-pressure trough and high-pressure ridge. The arriving air (at the surface) initially travelled in the free troposphere (see vertical cross-sections of trajectories in Fig. S6) and began descending approximately 72 h before reaching Oden, entering the boundary layer ≈36 h before arrival and following the surface for the last 24 h. The air arriving in the lower troposphere mainly remained in the free troposphere but trajectories show more spread compared to the trajectories arriving at the surface. About half of the trajectories exhibited subsidence over the last 36 h before reaching Oden, which is consistent with the presence of the high-pressure system.
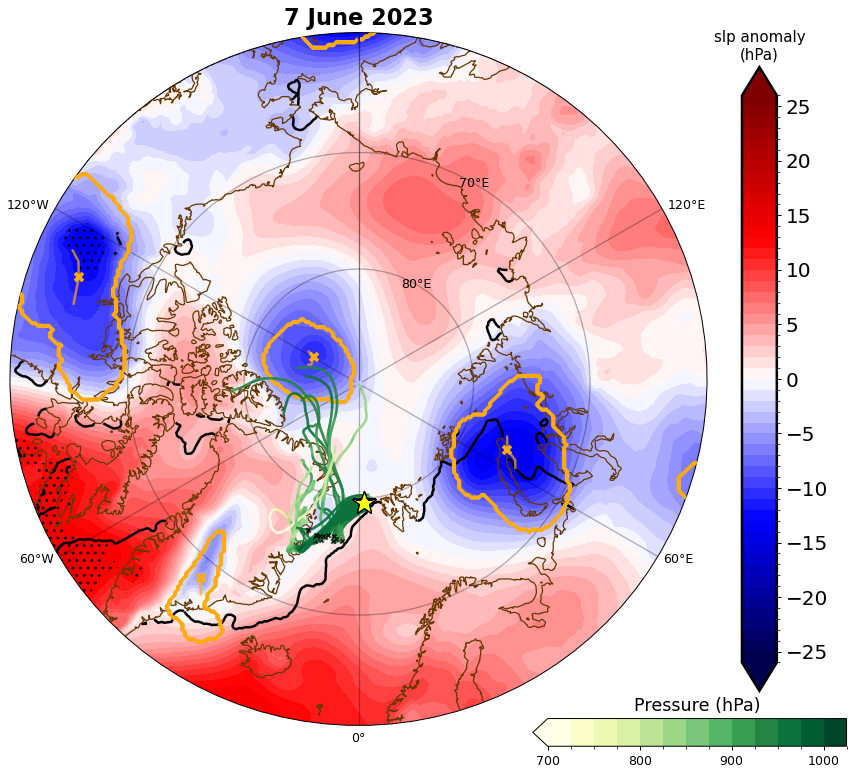
Figure 5Synoptic chart of the northern hemisphere between 60 and 90° N on 7 June. Red and blue shading indicate daily-mean sea-level pressure anomalies (hPa) with respect to the climatological mean (May–June 1981–2020; significant anomalies as hatching). Cyclone objects are indicated in orange contours, cyclone tracks in orange thin lines and crosses mark their location at 12:00 UTC. The thick black contours denote sea ice concentration of 15 %. Five-day back trajectories initialized at 12:00 UTC from the surface (50 hPa AGL) at equidistant spacing of 30 km within a circle (100 km radius) around the location of Oden (yellow star) are shown with green lines (green tone indicates the atmospheric pressure along the air parcels; black crosses show the location at -1d prior to arrival). Significance of anomalies is assessed using a Monte Carlo test: daily means are randomly sampled 1000 times over the climatological period. Daily anomalies exceeding the 5–95th percentile range are considered significant.
Figure 6 shows how the cloud developed during the day on 7 June. The cloud base was initially very low (<100 m, which is below the first range gate of the cloud radar). Around 09:00 UTC, the cloud base began to rise to approximately 150 m a.s.l. and remained roughly stationary throughout the day. The radar reflectivity indicates that the cloud top increased in altitude throughout the day from ≈200 m at 06:00 UTC to ≈500 m at the end of the day. Note that a cirrus cloud was detected by the cloud radar around 7 km a.s.l. for the majority of the morning and intermittently during the afternoon (Fig. S7). However, it was not obvious from the photo records of the Helikite camera, indicating that the cirrus was likely optically thin.
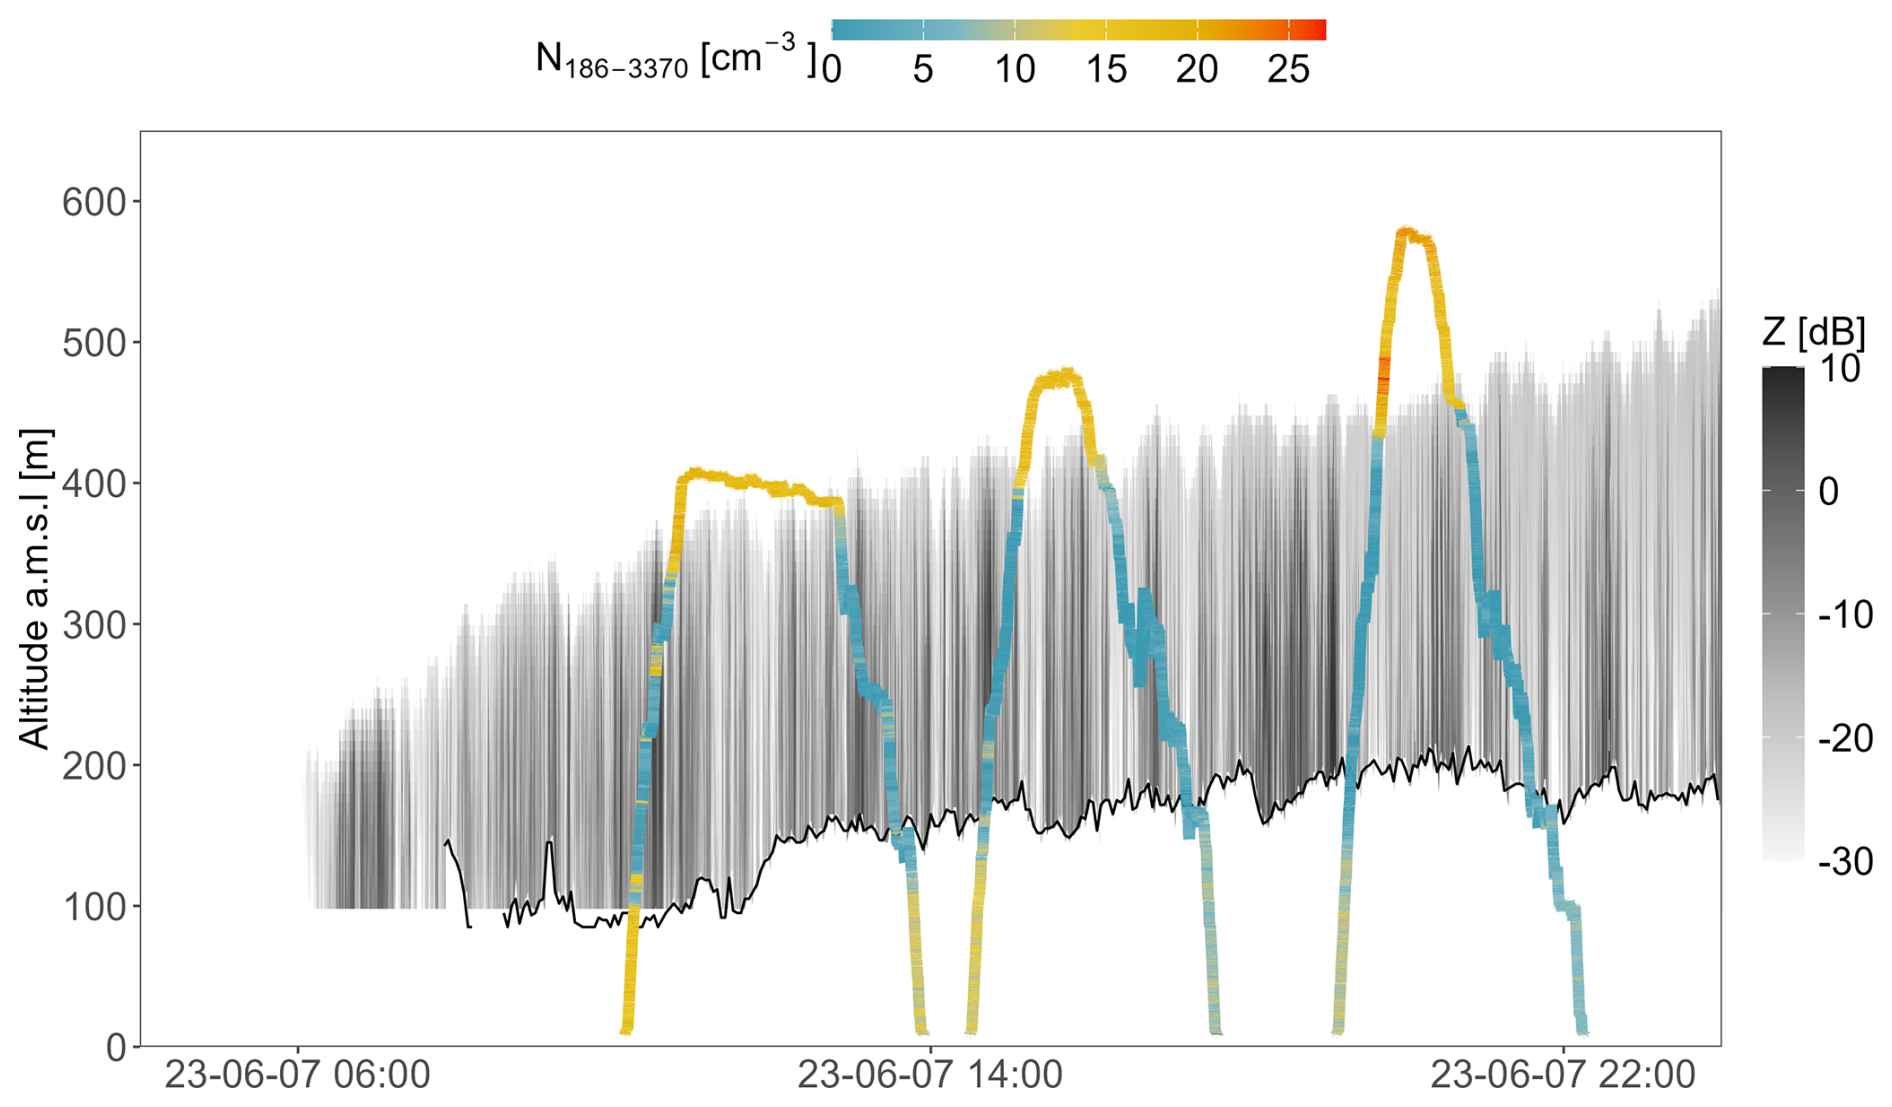
Figure 6Time series of the Helikite flight paths as a function of altitude during the three flights on 7 June 2023. The paths are colored according to measured N186–3370. Grey shading is the measured radar reflectivity, indicating the cloud's presence. The black line indicates the measured cloud base from the ceilometer.
Light snowfall was observed on the ground throughout the day, indicating that the cloud was a mixed-phase cloud. However, no direct in situ measurements with the Helikite could provide information on the ice water content.
Three Helikite flights traversed the cloud between 10:07 and 22:16 UTC. In Fig. 6, the altitude of the Helikite is represented by the colored path, indicative of the measured concentration of aerosols (N186–3370). In addition to the apparent depletion within the cloud due to cloud droplet formation, we observe a decrease in N186–3370 at the surface throughout the day, possibly due to scavenging by snowfall. At the same time, concentrations above the cloud increase, although the cause of this increase remains unclear.
4.2 Vertical distribution of aerosol properties and cloud droplets
Figure 7 shows a representative snapshot of the atmospheric column during the third ascent of the day (from 19:09 to 20:06 UTC). This profile is presented to illustrate the vertical structure of the atmosphere, cloud, and aerosol layers. Unless otherwise stated, the subsequent aerosol size distribution and cloud microphysical analyses are based on data from all six profiles obtained on 7 June.
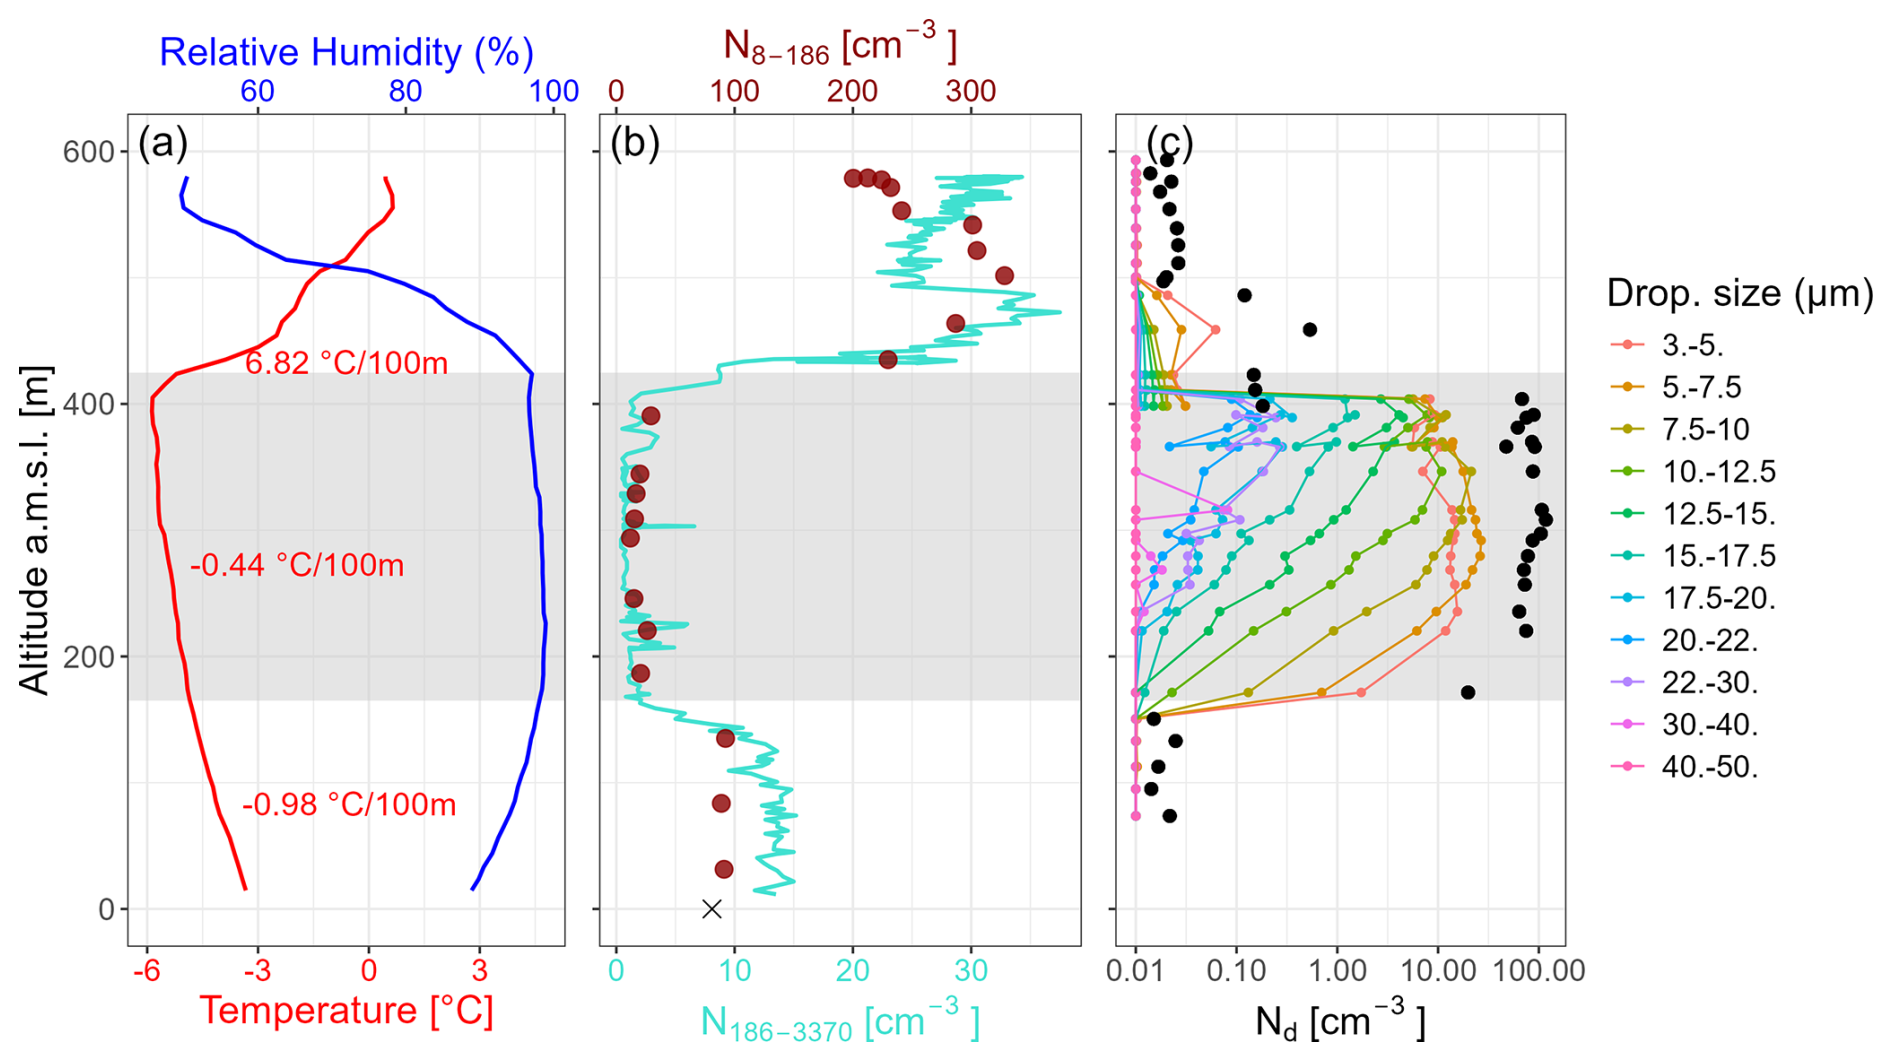
Figure 7Vertical profiles for the 3rd ascent (19:09 to 20:06 UTC) on 7 June of (a) Temperature (red) and relative humidity (blue) spatially averaged every 10 m, (b) aerosol number concentration from 8–186 nm at a 2 min and 40 s time resolution measured with the mSEMS (brick) and 186–3370 nm at a 10 s time resolution measured with the POPS (turquoise), (c) droplet number concentrations (30 s resolution) for various sizes and total droplet concentration (black) measured with the LOAC. The cross on panel (b) represents the mean particle number concentration measured with the DMPS (15–870 nm) at ship level during the profile. The grey shading represents the defined cloud boundaries.
In Fig. 7a, we observe a temperature profile with a dry adiabatic lapse rate below the cloud and wet-adiabatic lapse rate inside the cloud. Starting just below cloud top (≈25 m), a temperature inversion marks the transition to the free troposphere and shows the presence of a warm air mass aloft. The temperature below the cloud ranged from −4.8 to −3.3 °C, within the cloud from −5.8 to −4.8 °C and above cloud reached as high as +0.7 °C. The aerosol profile (N8–3370) indicates an average concentration of ≈100 cm−3 between the surface and cloud base (Fig. 7b). From about 40 m below cloud, at 125 m, the concentration decreases to reach its minimum at the defined cloud base of 165 m. Inside the cloud, the 10 s averaged N186–3370 does not exceed 6 cm−3. At the top of the cloud, the aerosol concentration increases gradually between 400 and 440 m, while the cloud top was identified at 425 m. This 40 m thick layer corresponds to the entrainment zone (the thin, turbulent layer where dry free tropospheric air mixes into the cloud), located between the boundary layer and the free troposphere. In the free troposphere, the aerosol concentration exceeds the boundary layer concentration with a maximum concentration (N8–3370) of up to about 350 cm−3. The free tropospheric aerosol profile presents, in addition, a layered structure with concentration differences between the layer in the direct vicinity of the cloud and a layer located above 500 m. Examining the temperature and relative humidity profiles, we do not identify any major features or differences indicating a separation of air masses that could explain these observations, besides a small fluctuation in the temperature profile (i.e. slightly stronger temperature gradient) around 500 m. The profile of cloud droplets (Fig. 7c) shows an increasing number concentration with altitude for all droplets equal to or larger than 3 µm. In the upper part of the cloud, Nd is around 100 cm−3 with a maximum ≈130 cm−3. Throughout the day, the median Nd was 88 cm−3. Of the measured Nd, 25 % was equal to or higher than 107 cm−3 and 10 % was equal to or higher than 125 cm−3. Such values are typically on the upper end of cloud droplet number concentrations observed in Arctic LLCs, but are realistic. For instance, from two years of continuous observations of aerosols and clouds at the Mount Zeppelin Observatory, Koike et al. (2019) reported a median Nd of 65 cm−3 between May and July, with a 75th quantile around 110 cm−3. In the present context, the observed cloud droplet concentrations are relatively high compared to the aerosol concentrations measured below cloud. This suggests that additional aerosol sources or vertical transport processes may contribute to the in-cloud CCN population, a hypothesis that is explored in the following part through analysis of the aerosol size distributions.
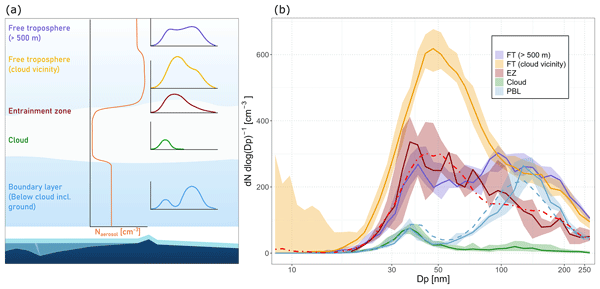
Based on the observed vertical profile of aerosols, we identified five different layers with distinct aerosol characteristics: the boundary layer, the cloud layer, the cloud-top entrainment zone, the free troposphere in the direct vicinity of the cloud, and above 500 m. The latter was only reached on the last of the three flights and therefore has fewer observations.
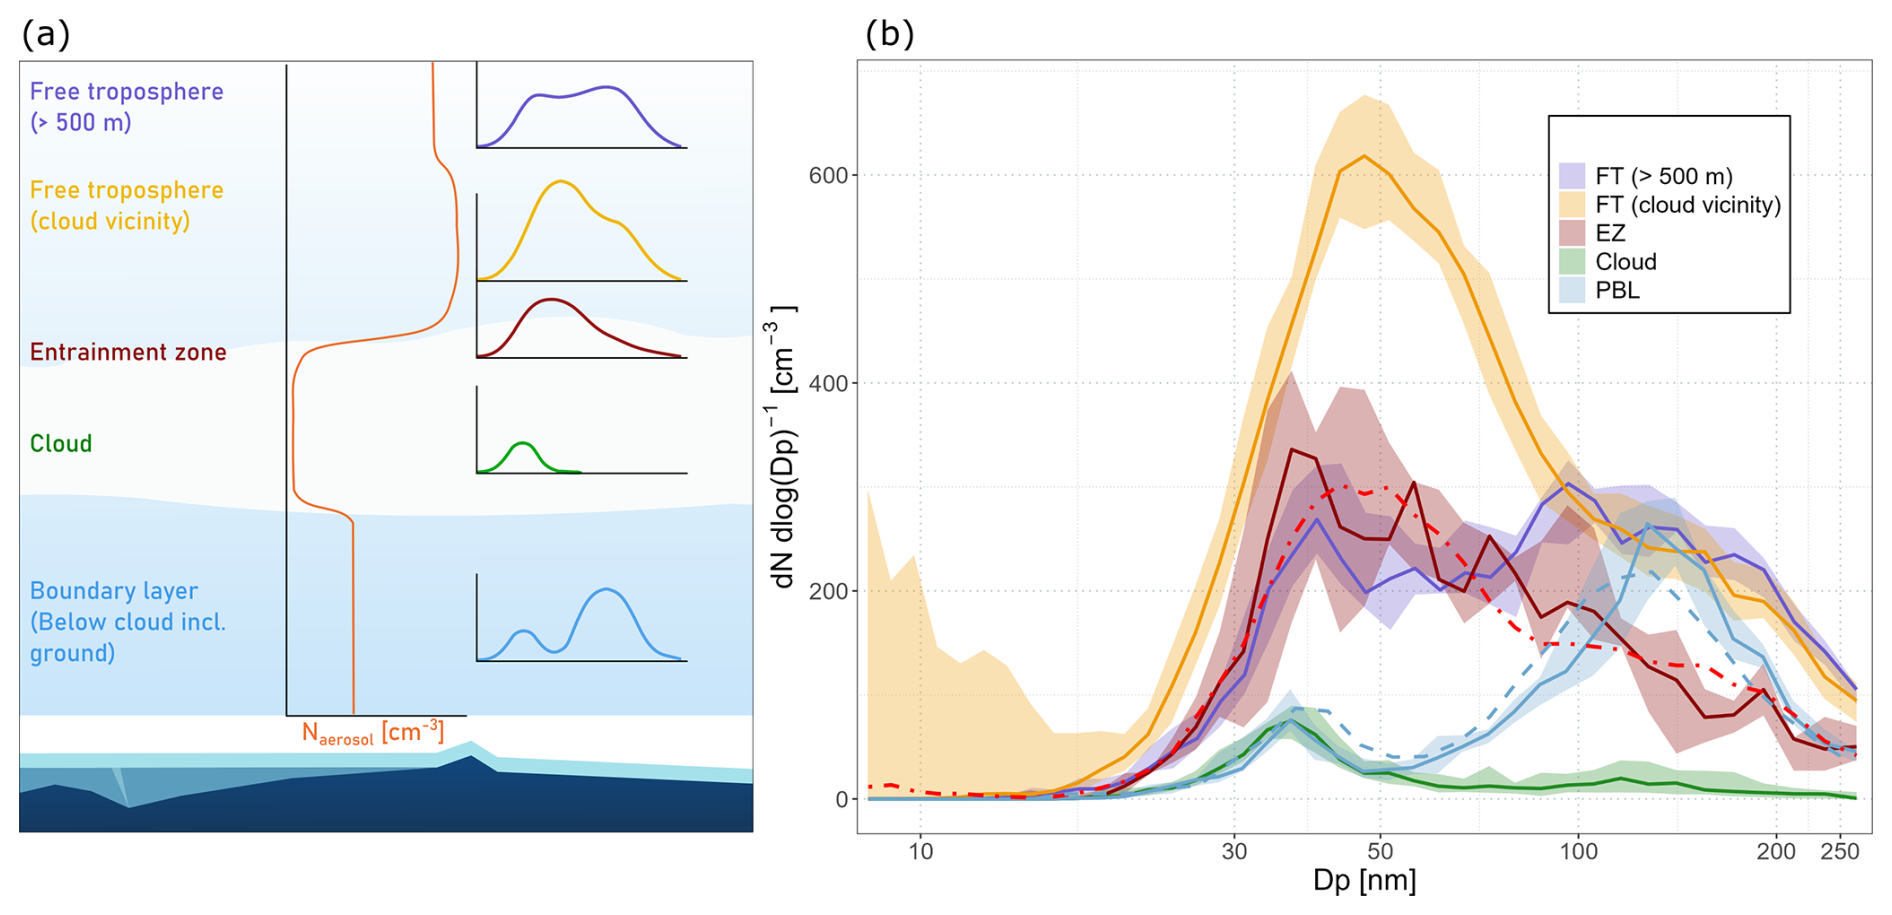
Figure 8Particle number size distributions (corrected to standard temperature and pressure) measured in the boundary layer (PBL), cloud, entrainment zone (EZ) and free troposphere (FT) in the vicinity of the cloud and above 500 m between 10:10 and 22:15 UTC on 7 June 2023. The full line represents the median of all distributions and the shading is the interquartile range. The dashed red PNSD represents the average of the in-cloud (green) and above cloud (yellow) size distribution. The dashed blue line represents the average PNSD measured from the ship with the DMPS from the first to the last Helikite flight.
We extracted the PNSD in each layer for all three Helikite flights from 10:10 to 22:15 UTC. The measured PNSDs are shown in Fig. 8b, while Fig. 8a provides an illustration to help the reader identify which vertical layer is associated with each PNSD. Starting from the surface, the boundary layer PNSD (blue) exhibited a bimodal distribution with an Aitken mode peaking at 37 nm and a dominant accumulation mode at 125 nm. A distinct Hoppel minimum was located at 52 nm (exact value obtained from a distribution fit), indicating that the boundary layer aerosols have been cloud processed. This distribution was observed from the surface to the cloud base. In the cloud (green), the Aitken mode was identical to that in the boundary layer, but accumulation mode particles were activated into droplets and not sampled. The difference between boundary layer and in-cloud distributions appeared at the Hoppel minimum, indicating activation of particles as small as ≈52 nm. The similarity of these size distributions confirms that the cloud was coupled to the surface and that aerosols were well mixed within these two layers. In the entrainment zone, we obtained only five mSEMS scans. These scans were obtained at the cloud top interface, at the base of the temperature inversion, and were identified because of their distinct shape that differed from the cloud and free tropospheric PNSDs. Although quite noisy, we observed an Aitken mode somewhere between 30 and 50 nm. The PNSD extended into an accumulation mode but with no distinct separation between the two modes. In the free troposphere, the PNSD exhibited a different shape compared to the boundary layer. In the lower part (<500 m), the PNSD was dominated by an Aitken mode with a peak at 47 nm with an accumulation mode shoulder at 130 nm. We also observed a burst of nucleation mode particles during the first flight between 10:50 and 12:50 UTC when the Helikite remained within 50 m of the cloud top. This burst is indicative of new particles being formed in the direct vicinity of cloud top, which could be explained by increased UV irradiance due to the cloud's reflection (Wehner et al., 2015), mixing of dry and wet air in the entrainment zone and potentially a supersaturation of precursor gases that could have been transported in updrafts (Kerminen et al., 2018; Wu et al., 2021). Despite not observing these particles, nor a growth during the subsequent flights, these observations underline the potential of cloud-mediated NPF events in the free troposphere as a source of CCN in the Arctic. Without more detailed information on the composition of the particle precursors and direct observations of a growth event, we cannot speculate on the origin of this event or its impact on the aerosol population. Above 500 m, the PNSD exhibits a different shape from the one below 500 m. Because of limited sampling time, the PNSD looks noisier, but we can identify a similar accumulation mode as seen below 500 m. These particles seem to constitute an older background of the free tropospheric aerosol population. However, we see a smaller Aitken mode and no distinct Hoppel minimum. The reason for the difference between these two free tropospheric layers is not clear. As indicated earlier, we do not observe a distinct indication of a separation of air masses and back trajectory analysis suggests the same origins (Figs. 5 and S6). We can only hypothesize that the layer up to 500 m is more directly influenced by the cloud and the Aitken mode is the result of more recently formed particles directly above the cloud which then grew further.
Observations of the PNSD in the boundary layer, cloud, and lower free troposphere tend to indicate that aerosols within the boundary layer – and consequently at the surface – are representative of the population governing cloud microphysical properties. However, the number of observed cloud droplets cannot be explained solely by boundary layer CCN. The integrated aerosol number concentration above the Hoppel minimum (below the cloud) is ≈80 cm−3, which represents a gap of ≈50 cm−3 (±25, taking into account uncertainties of Nd measurements) compared to the observed droplet concentration.
These results indicate that the aerosol population within the boundary layer alone is insufficient to explain the observed cloud droplet number concentrations. Therefore, an additional source of CCN is required. The observations in the entrainment zone and lower free troposphere suggest that entrainment of aerosol-rich air from above the cloud provides a plausible source of these additional CCN.
To understand how significant the contribution from the free troposphere is, we investigate more deeply the interface between the very top of the cloud and the free troposphere, i.e. the entrainment zone. There, the concentration of Aitken mode particles is greater than in the boundary layer but smaller than in the free troposphere, suggesting a mix of free tropospheric and boundary layer air, with some accumulation mode particles that are activated, and hence not sampled. To verify this hypothesis, we computed the mean of the low free troposphere PNSD (yellow) and in-cloud PNSD (green), assuming a one-to-one mixing ratio, and compared it to the entrainment zone PNSD. The resulting PNSD shows a good agreement with the observed PNSD in the entrainment zone (Fig. 8b, red dashed line) strongly supporting the idea that the air from the free troposphere is mixed downwards, contributing to the cloud's CCN population. To further assess the contribution of the entrained air at the top of the cloud, we use a cloud droplet parametrization based on the PNSD measured in the boundary layer and an average of the boundary layer and free tropospheric PNSDs and compare the results to the in situ observations of cloud droplets.
4.3 Cloud droplet activation parametrization
Here we used the methodology introduced in Sect. 2.6 to parametrize the number of droplets in the cloud using two different PNSD inputs. First, we used the boundary layer PNSD, which is in this case representative of the surface measurements. In a second set of parametrizations, we used the average distribution of the boundary layer and lower free tropospheric PNSDs (referred hereafter as EZ PNSD for simplicity), which is a proxy for the total aerosol PNSD in the entrainment zone and represents the cloud-top particle entrainment scenario. We applied the parametrization using the hourly updraft velocity fits from the Doppler Lidar between 10:00 and 23:00 UTC. While this approach is appropriate for a parametrization based on boundary-layer aerosol properties, it represents a simplification for the case including entrainment of aerosols at cloud top. In particular, the vertical velocity and supersaturation conditions near cloud top may differ substantially from those at cloud base, and cloud-top supersaturation can be influenced by different processes than the expansion of air in updrafts, notably by longwave radiative cooling. These processes are not explicitly represented in the present framework. However, due to the lack of direct constraints on cloud-top updrafts and radiatively driven supersaturation, a consistent characteristic velocity based on cloud base measurements is retained for both parametrizations. This limitation should be considered when interpreting the results and highlights the need for future studies to better account for such mechanisms when parametrizing cloud droplet formation in Arctic LLCs.
The κ value was calculated as described in Sect. 2.6. Since the value obtained with this method depends on the considered supersaturation, the Dd (i.e. minimum dry diameter of activated particles) in the cloud was estimated from the difference between the in-cloud and boundary layer size distributions. The supersaturation of the cloud was then estimated by interpolating that from the CCNC for the two nearest Dd. The κ value was then calculated using Eq. (2) with the best estimates of Dd and supersaturation (details are shown in Fig. S9).
The κ (based on ship-based measurements) was calculated as 0.58 with an uncertainty range from 0.57 to 0.66 corresponding to a supersaturation range between 0.35 % and 0.49 %.
To account for the uncertainty range in the κ-value and the unknown κ-value of free tropospheric aerosols, we performed a sensitivity analysis with an extended range of values between 0.5 and 0.9. Results indicate no significant difference for each end of the κ-value range for parametrizations with the boundary layer PNSD input. The median Nd ranges from 67 to 70 cm−3 (see Fig. S9a). For the parametrizations with the EZ aerosols, results of the sensitivity analysis range between 117 and 130 cm−3.
Another sensitivity analysis was performed on the characteristic velocity (w∗) where different coefficients of σ were used to account for the uncertainties related to processes controlling the supersaturation in our comparison (see Fig. S9b). We observe a similar behavior as for the sensitivity test on κ-values, where Nd is almost not sensitive to different coefficients of σ for parametrizations with the boundary layer PNSD. For parametrizations with the EZ aerosols, the median ranges from 116 to 133 cm−3. Overall, parametrizations with the EZ aerosols show slightly higher sensitivity to κ and w∗ but the absolute Nd difference between the two scenarios remains within the same order of magnitude (i.e., a difference ranging between ≈50–60 cm−3). The higher sensitivity to κ and w∗ suggests that with the contribution of free tropospheric CCN, the cloud was in an updraft-limited regime but if we only consider the boundary layer aerosols, the number of cloud droplets would be more limited by the availability of CCN within the tested range of κ and w∗ as an increase in the updraft velocity or κ did not lead to an increase in Nd (or is only limited).
In Fig. 9, we see results of (a) Nd and (b) maximum supersaturation (ssmax) for parametrizations with a κ of 0.58 and (center estimates). The median Nd for boundary layer and EZ aerosols is 68 and 122 cm−3, respectively, which represents an increase of 80 % for the EZ scenario. The ssmax is lower for the parametrization with EZ aerosols, because of the higher number of CCN but the values remain similar to the estimated ssmax range from the κ-value calculations (see Fig. S8).
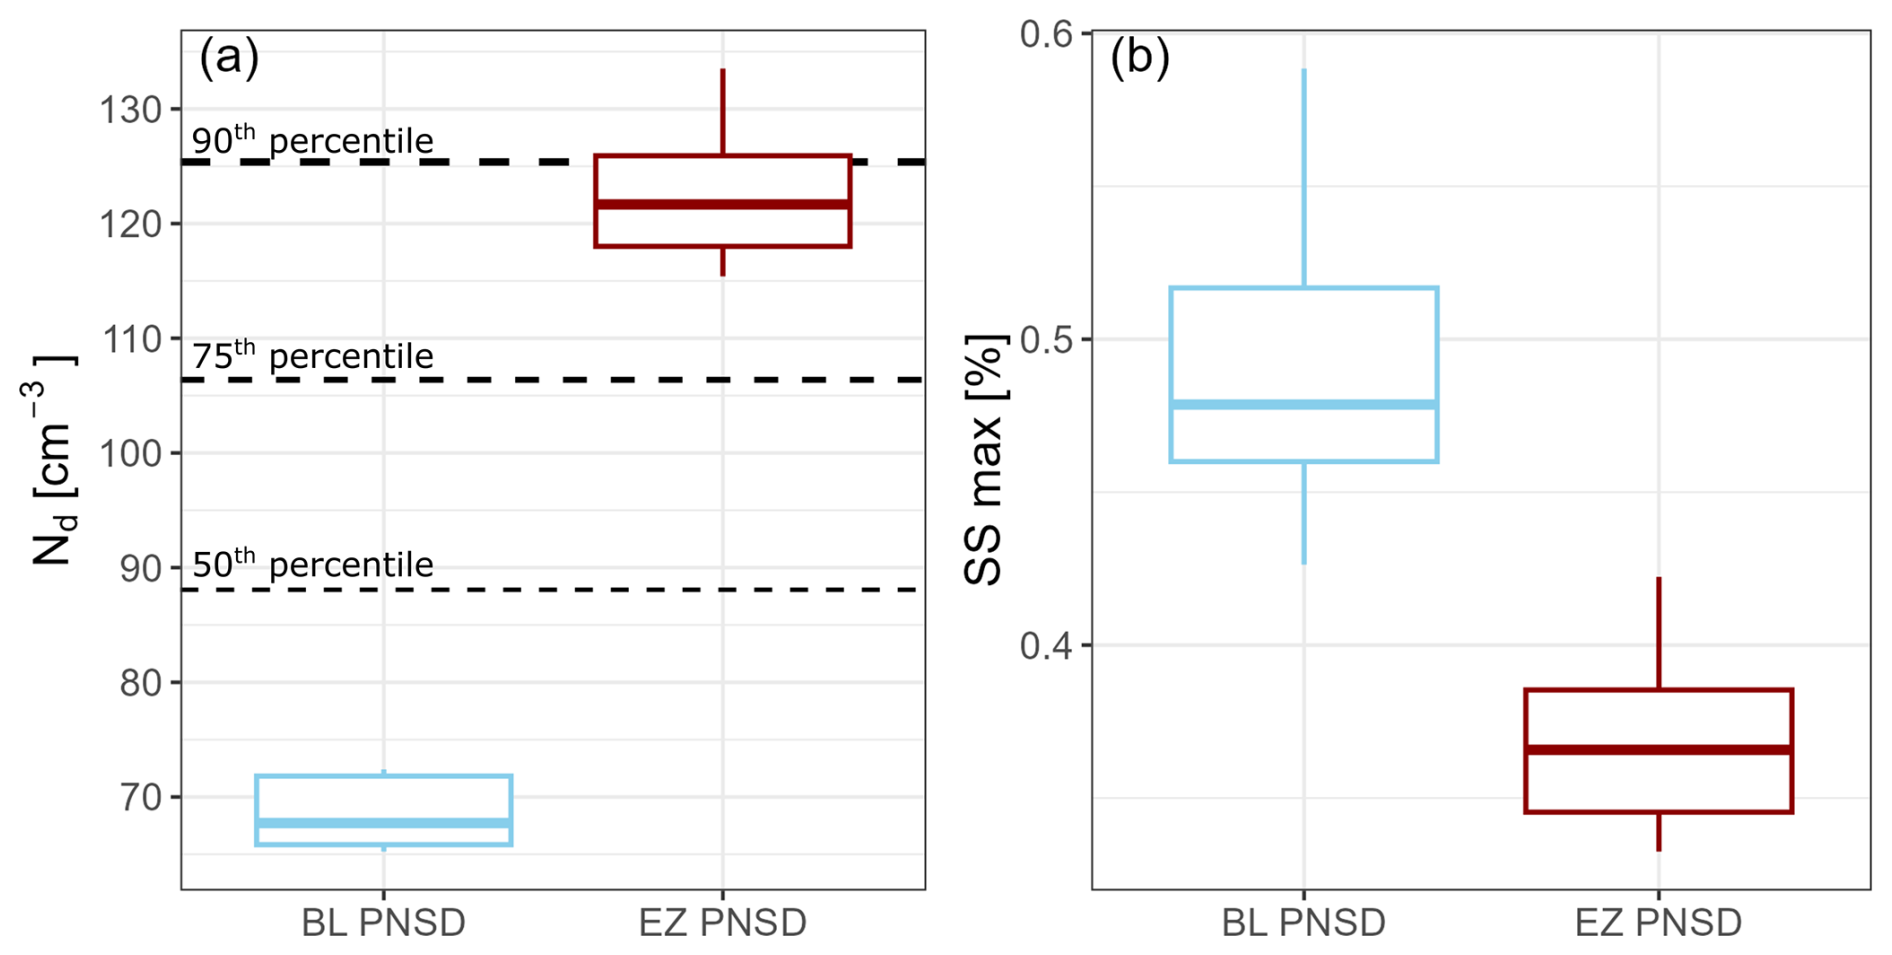
Figure 9(a) Boxplot of droplet numbers from the aerosol activation parametrization using the boundary layer PNSD (blue) and entrainment zone PNSD (dark red) as inputs. The horizontal dashed lines represent the 50th, 75th and 90th percentiles of cloud droplet concentrations observed with the LOAC. (b) Parametrized maximum supersaturation with the two different PNSD inputs. The boxplots represent the median and interquartile range, the whiskers' length equals to 1.5 times the interquartile range.
The Nd results from the parametrization show a very good agreement between the EZ scenario and the in situ observations with concentrations around 100 cm−3 and occasionally over 130 cm−3 (Fig. 7). This confirms the significant influence of entrained free tropospheric aerosols on the cloud's microphysics.
4.4 Influence of the free tropospheric aerosols on the cloud longwave radiative forcing
The longwave radiative absorption, re-emission and transmission through a cloud are a function of the cloud's optical depth, cloud phase, droplet size and emitting temperature (Stephens, 1978). The longwave flux follows the Stefan–Bolzmann relationship:
where F is the radiation flux, ε is the apparent emissivity, σ ( ) is the Stefan–Bolzmann constant and T is the emitting temperature in Kelvin. The emissivity is a function of the longwave optical depth and is often specified as a function of the LWP,
wherein a0 (m2 g−1) is the mass-absorption coefficient (Stephens, 1978). For a cloud with a LWP between roughly 30 to 50 g m−2, the emissivity approaches unity (Shupe and Intrieri, 2004). Although it is not explicitly included in Eq. (7), the effective radius of cloud droplets can alter emissivity for non-opaque clouds (Garrett et al., 2002; Garrett and Zhao, 2006). This effect has been found to be negligible at the global scale (Rotstayn and Penner, 2001) but observations suggest that the effect can be significant for Arctic clouds where the longwave warming effect is dominant and where CCN concentrations are typically orders of magnitude lower than in the midlatitudes (e.g., Curry and Herman, 1985; Garrett et al., 2002; Garrett and Zhao, 2006).
Here, we use idealized RTM to examine how additional CCN originating from the free troposphere modify the cloud's emissivity and surface longwave radiative forcing through their impact on cloud droplet number concentrations (cf. Sect. 2.7). We focus on the longwave part of the radiation spectrum to specifically evaluate the difference in emissivity for different Nd. Simulations were performed omitting the ice phase since we do not have direct measurements of the ice water content and because the longwave emissions are largely dominated by the liquid droplets (Curry et al., 1993; Hofer et al., 2024).
The RTM simulation was run using data at 11:30 and 17:30 UTC (radiosonde launches) with LWPs for the first and second profiles of 26.2 and 37.9 g m−2, respectively. Figure 10a shows results of longwave radiative forcing for simulations with different cloud droplet number concentration profiles. The longwave forcing was determined by computing the difference in downwelling longwave radiation (LW↓) between cloudy conditions and a cloud-free (cloud was removed) scenario. The cloud's microphysical properties were based on the Nd parametrization outputs from Sect. 4.3 (located on each side of the grey stripe in Fig. 10), representing a scenario with and without free tropospheric CCN contribution. We also extended the simulation to lower and higher Nd to create broader context for the interpretation of the results. The reff profiles typically increase with height inside the cloud because of the increase in LWC near cloud top.
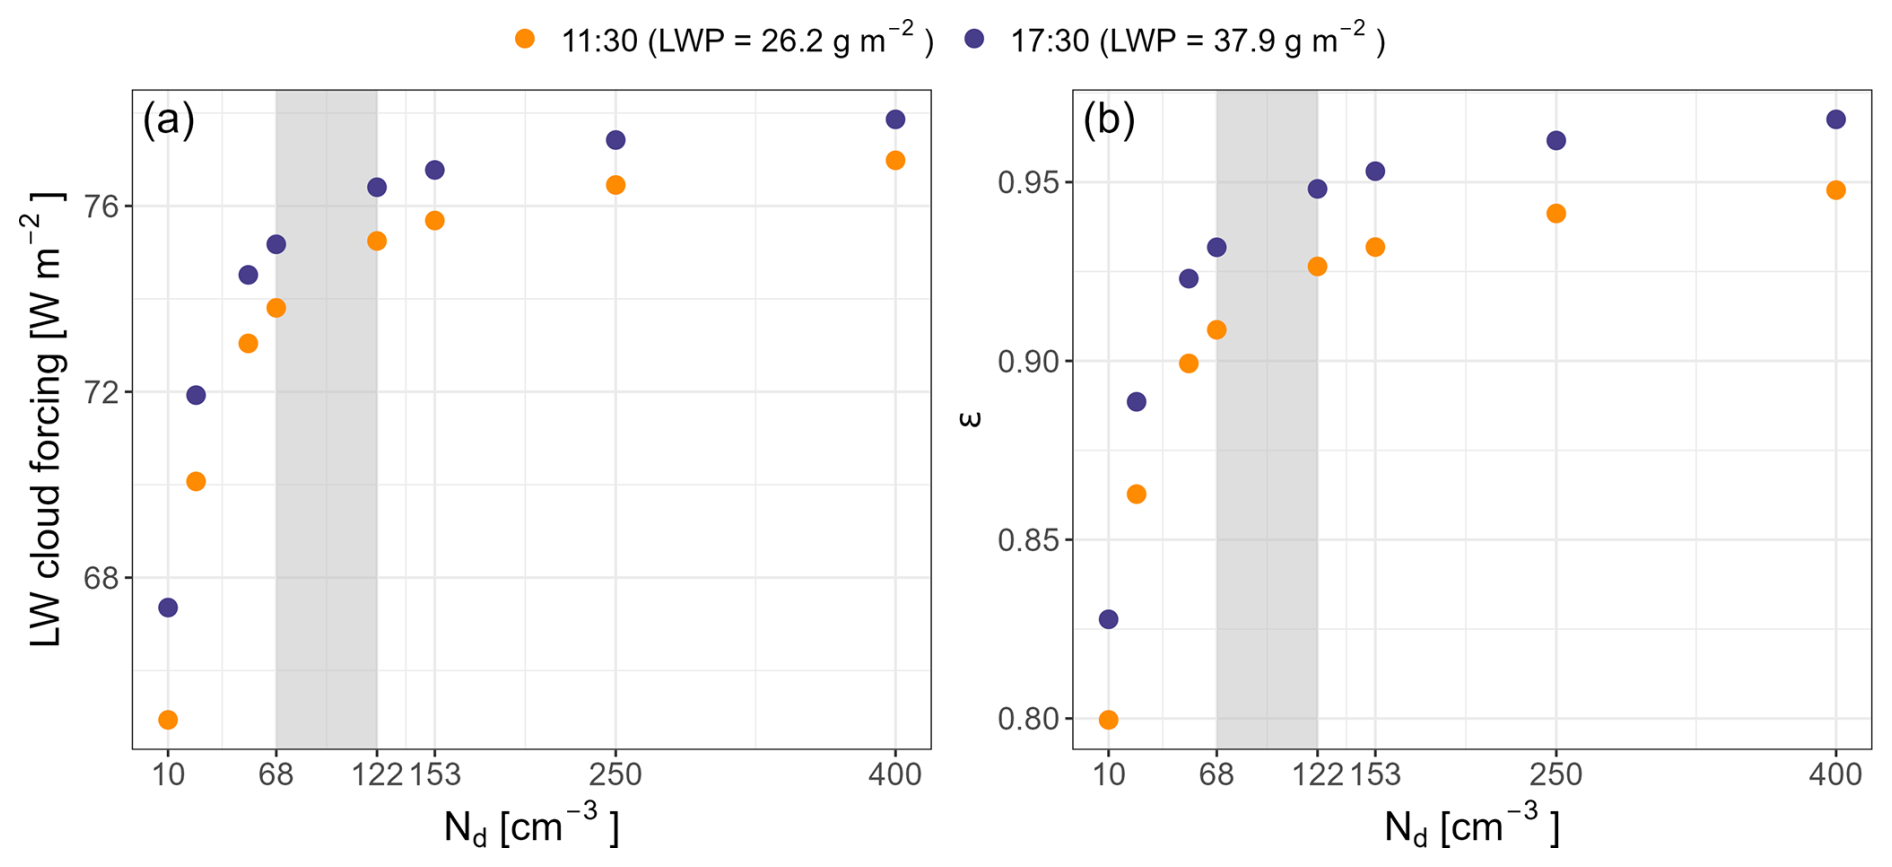
Figure 10(a) Simulated longwave cloud forcing at the surface as a function of cloud droplet number concentration for the radiosonde of 11:30 UTC (dark yellow points) and 17:30 UTC (dark blue points) on 7 June 2023. (b) Calculated cloud's emissivity for different cloud droplet profiles. The grey shaded region helps to identify and compare results of cloud droplet number concentration from the parametrization presented and discussed in Sect. 4.3.
The reff values at cloud base are around 1 µm and range between ≈5 and 18 µm at cloud top. for profiles with the lowest and highest Nd, respectively. An example of the corresponding reff profiles for the data at 11:30 UTC is shown in Fig. S10. Results from the RTM remain within 10 W m−2 from surface-based observations on the ice, an uncertainty which is to be expected for such simulations (Lonardi et al., 2024; Mauritsen et al., 2011). Because of these uncertainties, our analysis focuses mainly on the absolute difference between the various simulations, and we do not use the observations to directly validate the simulated values.
The average difference for simulations with Nd=68 and 122 is equal to 1.3 W m−2. This difference accounts for ≈2 % of the longwave cloud forcing in this range of Nd (and measured LWP). By rearranging Eq. (6), we can calculate the cloud's apparent emissivity from the longwave radiation results. Apparent emissivity values are generally high (between 0.89 and 0.95 for ) and Fig. 10b shows that the emissivity is slightly higher for the later profile (dark blue points), which is consistent with the increase in LWP between 11:30 and 17:30 UTC.
To put these results in perspective, we compare them to the study of Garrett and Zhao (2006) who performed a similar analysis but compared clouds affected by local anthropogenic pollution to clouds formed in clean background conditions over four years of observations at Utqiagvik (Alaska). They reported increased longwave radiative forcing between 3.3 and 5.2 W m−2 due to the increased cloud droplet concentrations when clouds were affected by pollution. They reported an average Nd of 53 cm−3 and a LWP of 31.1 g m−2 for clean conditions and 153 cm−3 and 33.5 g m−2 for polluted conditions. While the LWP reported by Garrett and Zhao (2006) is similar to the LWP of our case study, the increase in Nd between their clean and polluted cases was larger than in our observations, with Nd increasing from 53 to 153 cm−3 (a factor of approximately 2.9). We performed additional simulations with Nd=53 and 153 cm−3 to compare our case study with their results and observe an increase in the cloud's longwave radiative forcing between 2.5 and 3.4 W m−2. The similarity of our results indicates that the influence of free tropospheric CCN sources on Arctic cloud radiative properties may be as important as the perturbations from local anthropogenic sources.
Further examining the simulations with even fewer or more droplets, i.e. beyond the grey bar in Fig. 10a, we find that the cloud's emissivity and radiative forcing exhibit the greatest sensitivity to Nd for values at low concentrations ( cm−3). As the concentration increases, the emissivity tends to approach a maximum for the given LWP and cloud's temperature. Conditions with low aerosol concentration (<100 or even <10 cm−3) are commonly observed in the central Arctic year-round (e.g., Bigg et al., 1996; Boyer et al., 2023; Lannefors et al., 1983). Hence, under those conditions, the impact on the radiative properties of a cloud from the presence of enhanced aerosol layers located above becomes important and model representations of clouds based on surface-based measurements will lead to a negative longwave forcing bias. This is especially true for clouds with low LWP, e.g., during foggy conditions in the marginal ice zone and in summer and fall over the sea ice. For reference, during ARTofMELT, 50 % of the measurements indicated a LWP below 27.9 g m−2 and 25 % below 12.3 g m−2. It is important to note, however, that while higher aerosol concentrations above the boundary layer/cloud-top are likely common, they are not universal and concentrations might also be lower.
This study has examined vertical in situ measurements of particle number size distributions, cloud droplets number concentrations and meteorological variables collected with an instrumented Helikite from the icebreaker Oden between 16 May and 10 June 2023, as part of the ARTofMELT expedition. The primary objective was to evaluate the importance of free tropospheric aerosol sources to form and sustain Arctic LLCs and see to what extent the entrainment of these particles could impact the microphysical and radiative properties of the clouds.
In total, five clouds were profiled up to and above their tops, allowing for observations of particle number size distributions below, within, and above the clouds. Four of the five cases indicated enhanced aerosol concentrations above the cloud, which is consistent with previous observations in the Arctic and illustrates the importance of considering elevated aerosol sources for forming and sustaining clouds.
We selected a cloud observed on 7 June for a detailed case study. The analysis revealed a complex vertically-layered aerosol structure with several distinct particle size distributions. Starting from the surface, we observed a relatively constant concentration profile, with characteristics of cloud processing, up to the cloud base. Inside the cloud, the interstitial fraction of these aerosols was measured, indicating mixing between the surface and the cloud. Above the cloud, an aerosol population with concentrations 2 to 3 times greater than below the cloud was observed, extending about 100 m above the cloud top. The PNSD was dominated by an Aitken mode but no Hoppel minimum indicating the absence of recent cloud processing. At the cloud top, between free tropospheric and cloud air, we observed a size distribution corresponding to a mixture of the in-cloud and above-cloud PNSDs, indicating mixing between cloud air and air from above the cloud, consistent with the entrainment of free-tropospheric aerosols into the cloud. The analysis of the cloud microphysical properties indicated that the aerosol particles measured in the boundary layer alone may not fully explain the observed cloud droplet concentrations, suggesting that an additional source of CCN associated with aerosol above the cloud likely contributed to droplet formation.
The impact of the free-tropospheric source was evaluated using an aerosol activation parameterization based on the PNSDs measured in the boundary layer and in the entrainment zone. Parametrizations including aerosols measured above the cloud in addition to those in the boundary layer produced approximately 80 % more cloud droplets than input based solely on boundary layer aerosols. The resulting cloud droplet concentrations were in substantially better agreement with the in situ observations, supporting the interpretation that aerosol entrained from above cloud contributed to the observed droplet population. Although the cloud appeared coupled to the surface, surface-based measurements alone may not fully represent the aerosol populations available near cloud top, and therefore may not adequately capture the influence of aerosol entrainment from above.
Radiative transfer modeling indicated a marginal increase in surface cloud longwave radiative forcing for a scenario where the effect of entrained aerosols at cloud top on the cloud droplet concentration was considered (≈2 % of the total surface longwave radiative forcing). However, extended simulations with different cloud droplet number concentrations showed a higher sensitivity of the longwave radiative forcing at low Nd (<70 cm−3). Results from these simulations suggest that under conditions where near-surface aerosol concentrations are low (e.g., <100 cm−3 or even <10 cm−3, including also non-activating particles), aerosol above cloud top can have a significant impact on cloud radiative properties and model representations based on surface-based measurements might lead to significant biases with respect to cloud radiative forcing. In addition, while we kept the LWP constant for all simulations, a lower LWP will generally make a cloud more sensitive to Nd, indicating that under such conditions the contribution of aerosol sources above the cloud may become increasingly important.
More generally, while the results of this study are based on a limited amount of data, our findings suggest that above the sea ice, where aerosol sources are often limited, aerosol layers above clouds may constitute an important source of CCN and INPs and that their entrainment should be considered when studying Arctic low-level clouds. It is also important to note that our study presents limitations regarding the simulation of supersaturation conditions at cloud top but a sensitivity analysis of the cloud's characteristic updraft velocity (which drives the supersaturation in the cloud) indicates that our conclusions hold true even for different supersaturations. These limitations should be considered when improving the representation of Arctic LLCs in models. In particular, aerosol sources aloft and the associated entrainment processes may need to be represented more explicitly.
Here, we focused on the number of cloud droplets and their effective radius and how they affected the cloud longwave radiative forcing. To obtain a complete understanding of the role of free tropospheric aerosols on Arctic LLCs, future studies should also focus on how the total condensate and the phase partitioning of clouds are affected and consequently their total radiative forcing and lifetime. More observations combining radiation measurements and detailed in situ aerosol measurements including INPs and cloud microphysical properties (i.e., cloud droplets and ice crystals) are essential to improve our process understanding of Arctic mixed-phase clouds and their representation in models.
All datasets used in this study can be accessed on the Bolin Centre for Climate Research database following this link: https://bolin.su.se/data/oden-artofmelt-2023/ (last access: 26 January 2026). The individual DOI entries are listed here.
-
Tethered balloon vertical in situ measurements: https://doi.org/10.17043/oden-artofmelt-2023-aerosols-vertical-1 (Pohorsky et al., 2025);
-
Ship-based aerosol measurements: https://doi.org/10.17043/oden-artofmelt-2023-aerosol-source-samples-1 (Kojoj et al., 2025);
-
Radiosonde profiles: https://doi.org/10.17043/oden-artofmelt-2023-radiosonde-1 (Murto et al., 2024b);
-
Cloud radar data: https://doi.org/10.17043/oden-artofmelt-2023-cloud-radar-1 (Guy et al., 2024a);
-
Ceilometer cloud base heights: https://doi.org/10.17043/oden-artofmelt-2023-ceilometer-cloudnetpy-1 (Guy et al., 2025);
-
Halo lidar: https://doi.org/10.17043/oden-artofmelt-2023-halo-lidar-1 (Brooks and Guy, 2026);
-
Ice-station meteorological measurements: https://doi.org/10.17043/oden-artofmelt-2023-surface-meteorology-ice-station-1 (Guy et al., 2024b);
-
Ship-based meteorological measurements: https://doi.org/10.17043/oden-artofmelt-2023-weather-station-1 (Murto et al., 2024a);
-
Backward trajectory data: https://doi.org/10.17043/oden-artofmelt-2023-trajectories-backward-circle-1 (Murto and Tjernström, 2024).
The data from the LOAC and from the ship-based DMPS can be obtained upon request by contacting the author and is currently being prepared for publication on the Bolin data Centre.
The supplement related to this article is available online at https://doi.org/10.5194/acp-26-10331-2026-supplement.
RP: Measurements, data curation and analysis, manuscript original writing. JS: Principal investigator, supervision of the study, data interpretation and manuscript editing. RC contributed to the data processing. LH, IMB, HG and NF participated in the deployment of the Helikite. IMB and HG conducted remote sensing measurements and provided the data. JK, LH and PZ conducted ship-based aerosol and LOAC measurements and provided the data. SM provided LAGRANTO back trajectories and produced figures for the analysis of the synoptic situation. ML helped with the radiative transfer simulations. All co-authors commented on the manuscript drafts and contributed to the interpretation of the results.
At least one of the (co-)authors is a member of the editorial board of Atmospheric Chemistry and Physics. The peer-review process was guided by an independent editor, and the authors also have no other competing interests to declare.
Publisher's note: Copernicus Publications remains neutral with regard to jurisdictional claims made in the text, published maps, institutional affiliations, or any other geographical representation in this paper. The authors bear the ultimate responsibility for providing appropriate place names. Views expressed in the text are those of the authors and do not necessarily reflect the views of the publisher.
This work is part of the ARTofMELT (Atmospheric Rivers and the onseT of sea ice MELT) project. The ARTofMELT expedition was supported and organized by the Swedish Polar Research Secretariat (SPRS) on the Swedish research icebreaker Oden in spring 2023 under the SWEDARCTIC program. Support was given by the Ymer-80-foundation, and the Ivar Bendixsons scholarship. EST and NF contributed to the Strategic Research Area “ModElling the Regional and Global Earth system”, MERGE, funded by the Swedish government.
The Doppler lidar were provided by the UK ational Centre for Atmospheric Science (NCAS) Atmospheric Measurement and Observation Facility (AMOF).
The authors are grateful to the SPRS coordinator Åsa Lindgren and the SPRS support team and to Captain Mattias Petersson and the crew on Oden. The authors would also like to thank Anaïs Bretones for her help with the Helikite operations. The authors also thank Lars Aue (AWI Bremerhaven) for providing data for the cyclone tracks and objects. Julia Schmale holds the Ingvar Kamprad Chair for Extreme Environments Research sponsored by Ferring Pharmaceuticals.
We highly appreciate the constructive feedback of the two referees who helped to improve our study.
This research has been supported by the Schweizerischer Nationalfonds zur Förderung der Wissenschaftlichen Forschung (grant no. 200021_212101), the US National Science Foundation (grant no. OPP-2226864), the Knut och Alice Wallenbergs Stiftelse (grant no. 2016-0024), the Natural Environment Research Council UK (grant no. NE/X000087/1), Swedish Council for Research Infrastructures (grant no. 2021-00153), the Carl Tryggers Stiftelse för Vetenskaplig Forskning (grant nos. CTS 22:2148 and CTS 24:03137), the Bolincentret för klimatforskning, Stockholms Universitet (grant no. RA2), and the Vetenskapsrådet (grant no. 2020-03497). This work also received funding from the European Union's Horizon 2020 research and innovation program (grant agreement no. 101003826) via project CRiceS (Climate Relevant interactions and feedbacks: the key role of sea ice and Snow in the polar and global climate system) and the European Research Council (Consolidator grant INTEGRATE no. 865799) and the European Union's Horizon Europe project “CleanCloud” (Grant agreement no. 101137639).
This paper was edited by Matthias Tesche and reviewed by Christian Pilz and one anonymous referee.
Achtert, P., Seelig, T., Wallentin, G., Ickes, L., Shupe, M. D., Hoose, C., and Tesche, M.: Occurrence of seeding multi-layer clouds in the Arctic from ground-based observations, Atmos. Chem. Phys., 26, 3049–3068, https://doi.org/10.5194/acp-26-3049-2026, 2026.
Akansu, E. F., Dahlke, S., Siebert, H., and Wendisch, M.: Evaluation of methods to determine the surface mixing layer height of the atmospheric boundary layer in the central Arctic during polar night and transition to polar day in cloudless and cloudy conditions, Atmos. Chem. Phys., 23, 15473–15489, https://doi.org/10.5194/acp-23-15473-2023, 2023.
Barahona, D., West, R. E. L., Stier, P., Romakkaniemi, S., Kokkola, H., and Nenes, A.: Comprehensively accounting for the effect of giant CCN in cloud activation parameterizations, Atmos. Chem. Phys., 10, 2467–2473, https://doi.org/10.5194/acp-10-2467-2010, 2010.
Bigg, E. K., Leck, C., and Nilsson, E. D.: Sudden changes in arctic atmospheric aerosol concentrations during summer and autumn, Tellus B, 48, 254–271, https://doi.org/10.1034/j.1600-0889.1996.t01-1-00009.x, 1996.
Boyer, M., Aliaga, D., Pernov, J. B., Angot, H., Quéléver, L. L. J., Dada, L., Heutte, B., Dall'Osto, M., Beddows, D. C. S., Brasseur, Z., Beck, I., Bucci, S., Duetsch, M., Stohl, A., Laurila, T., Asmi, E., Massling, A., Thomas, D. C., Nøjgaard, J. K., Chan, T., Sharma, S., Tunved, P., Krejci, R., Hansson, H. C., Bianchi, F., Lehtipalo, K., Wiedensohler, A., Weinhold, K., Kulmala, M., Petäjä, T., Sipilä, M., Schmale, J., and Jokinen, T.: A full year of aerosol size distribution data from the central Arctic under an extreme positive Arctic Oscillation: insights from the Multidisciplinary drifting Observatory for the Study of Arctic Climate (MOSAiC) expedition, Atmos. Chem. Phys., 23, 389–415, https://doi.org/10.5194/acp-23-389-2023, 2023.
Bradley, R. S., Keimig, F. T., and Diaz, H. F.: Climatology of surface-based inversions in the North American Arctic, J. Geophys. Res.-Atmos., 97, 15699–15712, https://doi.org/10.1029/92JD01451, 1992.
Brenguier, J.-L., Burnet, F., and Geoffroy, O.: Cloud optical thickness and liquid water path – does the k coefficient vary with droplet concentration?, Atmos. Chem. Phys., 11, 9771–9786, https://doi.org/10.5194/acp-11-9771-2011, 2011.
Brooks, I. and Guy, H.: HALO lidar vertical stare data from expedition ARTofMELT, Arctic Ocean, 2023, Dataset version 1, Bolin Centre Database [data set], https://doi.org/10.17043/oden-artofmelt-2023-halo-lidar-1, 2026.
Brooks, I. M., Tjernström, M., Persson, P. O. G., Shupe, M. D., Atkinson, R. A., Canut, G., Birch, C. E., Mauritsen, T., Sedlar, J., and Brooks, B. J.: The Turbulent Structure of the Arctic Summer Boundary Layer During The Arctic Summer Cloud-Ocean Study, J. Geophys. Res.-Atmos., 122, 9685–9704, https://doi.org/10.1002/2017JD027234, 2017.
Conant, W. C., VanReken, T. M., Rissman, T. A., Varutbangkul, V., Jonsson, H. H., Nenes, A., Jimenez, J. L., Delia, A. E., Bahreini, R., Roberts, G. C., Flagan, R. C., and Seinfeld, J. H.: Aerosol–cloud drop concentration closure in warm cumulus, J. Geophys. Res., 109, 2003JD004324, https://doi.org/10.1029/2003JD004324, 2004.
Creamean, J. M., de Boer, G., Telg, H., Mei, F., Dexheimer, D., Shupe, M. D., Solomon, A., and McComiskey, A.: Assessing the vertical structure of Arctic aerosols using balloon-borne measurements, Atmos. Chem. Phys., 21, 1737–1757, https://doi.org/10.5194/acp-21-1737-2021, 2021.
Creamean, J. M., Barry, K., Hill, T. C. J., Hume, C., DeMott, P. J., Shupe, M. D., Dahlke, S., Willmes, S., Schmale, J., Beck, I., Hoppe, C. J. M., Fong, A., Chamberlain, E., Bowman, J., Scharien, R., and Persson, O.: Annual cycle observations of aerosols capable of ice formation in central Arctic clouds, Nat. Commun., 13, 3537, https://doi.org/10.1038/s41467-022-31182-x, 2022.
Curry, J. A. and Herman, G. F.: Infrared radiative properties of summertime Arctic stratus clouds, J. Appl. Meteorol. Clim., 24, 525–538, https://doi.org/10.1175/1520-0450(1985)024<0525:IRPOSA>2.0.CO;2, 1985.
Curry, J. A., Schramm, J. L., and Ebert, E. E.: Impact of clouds on the surface radiation balance of the Arctic Ocean, Meteorol. Atmos. Phys., 51, 197–217, https://doi.org/10.1007/BF01030494, 1993.
Emde, C., Buras-Schnell, R., Kylling, A., Mayer, B., Gasteiger, J., Hamann, U., Kylling, J., Richter, B., Pause, C., Dowling, T., and Bugliaro, L.: The libRadtran software package for radiative transfer calculations (version 2.0.1), Geosci. Model Dev., 9, 1647–1672, https://doi.org/10.5194/gmd-9-1647-2016, 2016.
Fan, J., Wang, Y., Rosenfeld, D., and Liu, X.: Review of Aerosol–Cloud Interactions: Mechanisms, Significance, and Challenges, J. Atmos. Sci., 73, 4221–4252, https://doi.org/10.1175/JAS-D-16-0037.1, 2016.
Fountoukis, C. and Nenes, A.: Continued development of a cloud droplet formation parameterization for global climate models, J. Geophys. Res., 110, 2004JD005591, https://doi.org/10.1029/2004JD005591, 2005.
Fountoukis, C., Nenes, A., Meskhidze, N., Bahreini, R., Conant, W. C., Jonsson, H., Murphy, S., Sorooshian, A., Varutbangkul, V., Brechtel, F., Flagan, R. C., and Seinfeld, J. H.: Aerosol–cloud drop concentration closure for clouds sampled during the International Consortium for Atmospheric Research on Transport and Transformation 2004 campaign, J. Geophys. Res.-Atmos., 112, https://doi.org/10.1029/2006JD007272, 2007.
Freud, E., Krejci, R., Tunved, P., Leaitch, R., Nguyen, Q. T., Massling, A., Skov, H., and Barrie, L.: Pan-Arctic aerosol number size distributions: seasonality and transport patterns, Atmos. Chem. Phys., 17, 8101–8128, https://doi.org/10.5194/acp-17-8101-2017, 2017.
Garrett, T. J. and Zhao, C.: Increased Arctic cloud longwave emissivity associated with pollution from mid-latitudes, Nature, 440, 787–789, https://doi.org/10.1038/nature04636, 2006.
Garrett, T. J., Radke, L. F., and Hobbs, P. V.: Aerosol Effects on Cloud Emissivity and Surface Longwave Heating in the Arctic, J. Atmos. Sci., 59, 769–778, https://doi.org/10.1175/1520-0469(2002)059<0769:AEOCEA>2.0.CO;2, 2002.
Georgakaki, P., Bougiatioti, A., Wieder, J., Mignani, C., Ramelli, F., Kanji, Z. A., Henneberger, J., Hervo, M., Berne, A., Lohmann, U., and Nenes, A.: On the drivers of droplet variability in alpine mixed-phase clouds, Atmos. Chem. Phys., 21, 10993–11012, https://doi.org/10.5194/acp-21-10993-2021, 2021.
Gierens, R., Kneifel, S., Shupe, M. D., Ebell, K., Maturilli, M., and Löhnert, U.: Low-level mixed-phase clouds in a complex Arctic environment, Atmos. Chem. Phys., 20, 3459–3481, https://doi.org/10.5194/acp-20-3459-2020, 2020.
Guy, H., Brooks, I., Murto, S., Tjernström, M., Karalis, M., and Prytherch, J.: Cloud radar data from expedition ARTofMELT, Arctic Ocean, 2023, Dataset version 1, Bolin Centre Database [data set], https://doi.org/10.17043/oden-artofmelt-2023-cloud-radar-1, 2024a.
Guy, H., Brooks, I., Murto, S., Karalis, M., and Tjernström, M.: Ice station surface meteorology and radiation data from expedition ARTofMELT, Arctic Ocean, 2023, Dataset version 1, Bolin Centre Database [data set], https://doi.org/10.17043/oden-artofmelt-2023-surface-meteorology-ice-station-1, 2024b.
Guy, H., Murto, S., Tjernström, M., Karalis, M., Prytherch, J., and Brooks, I.: Cloud base heights and atmospheric backscatter observations from expedition ARTofMELT, Arctic Ocean, 2023 – cloudnetpy input, Dataset version 1, Bolin Centre Database [data set], https://doi.org/10.17043/oden-artofmelt-2023-ceilometer-cloudnetpy-1, 2025.
Heutte, B., Bergner, N., Angot, H., Pernov, J. B., Dada, L., Mirrielees, J. A., Beck, I., Baccarini, A., Boyer, M., Creamean, J. M., Daellenbach, K. R., El Haddad, I., Frey, M. M., Henning, S., Laurila, T., Moschos, V., Petäjä, T., Pratt, K. A., Quéléver, L. L. J., Shupe, M. D., Zieger, P., Jokinen, T., and Schmale, J.: Observations of high-time-resolution and size-resolved aerosol chemical composition and microphysics in the central Arctic: implications for climate-relevant particle properties, Atmos. Chem. Phys., 25, 2207–2241, https://doi.org/10.5194/acp-25-2207-2025, 2025.
Hofer, S., Hahn, L. C., Shaw, J. K., McGraw, Z. S., Bruno, O., Hellmuth, F., Pietschnig, M., Mostue, I. A., David, R. O., Carlsen, T., and Storelvmo, T.: Realistic representation of mixed-phase clouds increases projected climate warming, Commun. Earth Environ., 5, 390, https://doi.org/10.1038/s43247-024-01524-2, 2024.
Igel, A. L., Ekman, A. M. L., Leck, C., Tjernström, M., Savre, J., and Sedlar, J.: The free troposphere as a potential source of arctic boundary layer aerosol particles, Geophys. Res. Lett., 44, 7053–7060, https://doi.org/10.1002/2017GL073808, 2017.
Illingworth, A. J., Hogan, R. J., O'Connor, E. J., Bouniol, D., Brooks, M. E., Delanoé, J., Donovan, D. P., Eastment, J. D., Gaussiat, N., Goddard, J. W. F., Haeffelin, M., Baltink, H. K., Krasnov, O. A., Pelon, J., Piriou, J.-M., Protat, A., Russchenberg, H. W. J., Seifert, A., Tompkins, A. M., van Zadelhoff, G.-J., Vinit, F., Willén, U., Wilson, D. R., and Wrench, C. L.: Cloudnet: Continuous Evaluation of Cloud Profiles in Seven Operational Models Using Ground-Based Observations, B. Am. Meteorol. Soc., 88, 883–898, https://doi.org/10.1175/BAMS-88-6-883, 2007.
Intrieri, J. M., Shupe, M. D., Uttal, T., and McCarty, B. J.: An annual cycle of Arctic cloud characteristics observed by radar and lidar at SHEBA, J. Geophys. Res.-Oceans, 107, SHE 5-1–SHE 5-15, https://doi.org/10.1029/2000JC000423, 2002.
Jimenez, C., Ansmann, A., Ohneiser, K., Griesche, H., Engelmann, R., Radenz, M., Hofer, J., Althausen, D., Knopf, D. A., Dahlke, S., Bühl, J., Baars, H., Seifert, P., and Wandinger, U.: MOSAiC studies of long-lasting mixed-phase cloud events and analysis of the liquid-phase properties of Arctic clouds, Atmos. Chem. Phys., 25, 12955–12981, https://doi.org/10.5194/acp-25-12955-2025, 2025.
Jozef, G., Cassano, J., Dahlke, S., and de Boer, G.: Testing the efficacy of atmospheric boundary layer height detection algorithms using uncrewed aircraft system data from MOSAiC, Atmos. Meas. Tech., 15, 4001–4022, https://doi.org/10.5194/amt-15-4001-2022, 2022.
Jozef, G. C., Cassano, J. J., Dahlke, S., Dice, M., Cox, C. J., and de Boer, G.: An overview of the vertical structure of the atmospheric boundary layer in the central Arctic during MOSAiC, Atmos. Chem. Phys., 24, 1429–1450, https://doi.org/10.5194/acp-24-1429-2024, 2024.
Kahl, J. D.: Characteristics of the low-level temperature inversion along the Alaskan Arctic coast, Int. J. Climatol., 10, 537–548, https://doi.org/10.1002/joc.3370100509, 1990.
Karlsson, L., Baccarini, A., Duplessis, P., Baumgardner, D., Brooks, I. M., Chang, R. Y.-W., Dada, L., Dällenbach, K. R., Heikkinen, L., Krejci, R., Leaitch, W. R., Leck, C., Partridge, D. G., Salter, M. E., Wernli, H., Wheeler, M. J., Schmale, J., and Zieger, P.: Physical and Chemical Properties of Cloud Droplet Residuals and Aerosol Particles During the Arctic Ocean 2018 Expedition, J. Geophys. Res.-Atmos., 127, e2021JD036383, https://doi.org/10.1029/2021JD036383, 2022.
Kay, J. E., L'Ecuyer, T., Chepfer, H., Loeb, N., Morrison, A., and Cesana, G.: Recent Advances in Arctic Cloud and Climate Research, Curr. Clim. Change Rep., 2, 159–169, https://doi.org/10.1007/s40641-016-0051-9, 2016.
Kerminen, V.-M., Chen, X., Vakkari, V., Petäjä, T., Kulmala, M., and Bianchi, F.: Atmospheric new particle formation and growth: review of field observations, Environ. Res. Lett., 13, 103003, https://doi.org/10.1088/1748-9326/aadf3c, 2018.
Koike, M., Ukita, J., Ström, J., Tunved, P., Shiobara, M., Vitale, V., Lupi, A., Baumgardner, D., Ritter, C., Hermansen, O., Yamada, K., and Pedersen, C. A.: Year-Round In Situ Measurements of Arctic Low-Level Clouds: Microphysical Properties and Their Relationships With Aerosols, J. Geophys. Res.-Atmos., 124, 1798–1822, https://doi.org/10.1029/2018JD029802, 2019.
Kojoj, J., Pereira Freitas, G., Mavis, C., Creamean, J., Mattsson, F., Nilsson, L., Spicker Schmidt, J., Adachi, K., Santl-Temkiv, T., Ahlberg, E., Mohr, C., Riipinen, I., and Zieger, P.: A comprehensive characterisation of natural aerosol source samples from expedition ARTofMELT, Arctic Ocean, 2023, Dataset version 1, Bolin Centre Database [data set], https://doi.org/10.17043/oden-artofmelt-2023-aerosol-source-samples-1, 2025.
Kretzschmar, J., Stapf, J., Klocke, D., Wendisch, M., and Quaas, J.: Employing airborne radiation and cloud microphysics observations to improve cloud representation in ICON at kilometer-scale resolution in the Arctic, Atmos. Chem. Phys., 20, 13145–13165, https://doi.org/10.5194/acp-20-13145-2020, 2020.
Kupiszewski, P., Leck, C., Tjernström, M., Sjogren, S., Sedlar, J., Graus, M., Müller, M., Brooks, B., Swietlicki, E., Norris, S., and Hansel, A.: Vertical profiling of aerosol particles and trace gases over the central Arctic Ocean during summer, Atmos. Chem. Phys., 13, 12405–12431, https://doi.org/10.5194/acp-13-12405-2013, 2013.
Lance, S., Nenes, A., Medina, J., and Smith, J. N.: Mapping the Operation of the DMT Continuous Flow CCN Counter, Aerosol Sci. Tech., 40, 242–254, https://doi.org/10.1080/02786820500543290, 2006.
Lannefors, H., Heintzenberg, J., and Hansson, H. C.: A comprehensive study of physical and chemical parameters of the Arctic summer aerosol; results from the Swedish expedition Ymer-80, Tellus B, 35B, 40–54, https://doi.org/10.1111/j.1600-0889.1983.tb00006.x, 1983.
Leck, C. and Persson, C.: The central Arctic Ocean as a source of dimethyl sulfide Seasonal variability in relation to biological activity, Tellus B, 48, https://doi.org/10.3402/tellusb.v48i2.15834, 1996.
Lohmann, U. and Feichter, J.: Global indirect aerosol effects: a review, Atmos. Chem. Phys., 5, 715–737, https://doi.org/10.5194/acp-5-715-2005, 2005.
Lonardi, M., Akansu, E. F., Ehrlich, A., Mazzola, M., Pilz, C., Shupe, M. D., Siebert, H., and Wendisch, M.: Tethered balloon-borne observations of thermal-infrared irradiance and cooling rate profiles in the Arctic atmospheric boundary layer, Atmos. Chem. Phys., 24, 1961–1978, https://doi.org/10.5194/acp-24-1961-2024, 2024.
Mauritsen, T., Sedlar, J., Tjernström, M., Leck, C., Martin, M., Shupe, M., Sjogren, S., Sierau, B., Persson, P. O. G., Brooks, I. M., and Swietlicki, E.: An Arctic CCN-limited cloud-aerosol regime, Atmos. Chem. Phys., 11, 165–173, https://doi.org/10.5194/acp-11-165-2011, 2011.
Mayer, B. and Kylling, A.: Technical note: The libRadtran software package for radiative transfer calculations – description and examples of use, Atmos. Chem. Phys., 5, 1855–1877, https://doi.org/10.5194/acp-5-1855-2005, 2005.
McCusker, G. Y., Vüllers, J., Achtert, P., Field, P., Day, J. J., Forbes, R., Price, R., O'Connor, E., Tjernström, M., Prytherch, J., Neely III, R., and Brooks, I. M.: Evaluating Arctic clouds modelled with the Unified Model and Integrated Forecasting System, Atmos. Chem. Phys., 23, 4819–4847, https://doi.org/10.5194/acp-23-4819-2023, 2023.
Mioche, G., Jourdan, O., Ceccaldi, M., and Delanoë, J.: Variability of mixed-phase clouds in the Arctic with a focus on the Svalbard region: a study based on spaceborne active remote sensing, Atmos. Chem. Phys., 15, 2445–2461, https://doi.org/10.5194/acp-15-2445-2015, 2015.
Morales, R. and Nenes, A.: Characteristic updrafts for computing distribution-averaged cloud droplet number and stratocumulus cloud properties, J. Geophys. Res.-Atmos., 115, https://doi.org/10.1029/2009JD013233, 2010.
Morales Betancourt, R. and Nenes, A.: Understanding the contributions of aerosol properties and parameterization discrepancies to droplet number variability in a global climate model, Atmos. Chem. Phys., 14, 4809–4826, https://doi.org/10.5194/acp-14-4809-2014, 2014.
Morrison, H., de Boer, G., Feingold, G., Harrington, J., Shupe, M. D., and Sulia, K.: Resilience of persistent Arctic mixed-phase clouds, Nat. Geosci., 5, 11–17, https://doi.org/10.1038/ngeo1332, 2012.
Motos, G., Freitas, G., Georgakaki, P., Wieder, J., Li, G., Aas, W., Lunder, C., Krejci, R., Pasquier, J. T., Henneberger, J., David, R. O., Ritter, C., Mohr, C., Zieger, P., and Nenes, A.: Aerosol and dynamical contributions to cloud droplet formation in Arctic low-level clouds, Atmos. Chem. Phys., 23, 13941–13956, https://doi.org/10.5194/acp-23-13941-2023, 2023.
Murto, S. and Tjernström, M.: Backward trajectories within a circle around the ship using the LAGRANTO model, for the expedition ARTofMELT, Arctic Ocean, 2023, Dataset version 1, Bolin Centre Database [data set], https://doi.org/10.17043/oden-artofmelt-2023-trajectories-backward-circle-1, 2024.
Murto, S., Tjernström, M., Karalis, M., and Prytherch, J.: Wind, temperature, relative humidity, surface temperature and radiation from expedition ARTofMELT, Arctic Ocean, 2023, Dataset version 1, Bolin Centre Database [data set], https://doi.org/10.17043/oden-artofmelt-2023-weather-station-1, 2024a.
Murto, S., Tjernström, M., Brooks, I., Guy, H., Karalis, M., Vihma, T., Urbancic, G., and Prytherch, J.: Radiosonde profiles from expedition ARTofMELT, Arctic Ocean, 2023, Dataset version 1, Bolin Centre Database [data set], https://doi.org/10.17043/oden-artofmelt-2023-radiosonde-1, 2024b.
Nenes, A. and Seinfeld, J. H.: Parameterization of cloud droplet formation in global climate models, J. Geophys. Res., 108, 2002JD002911, https://doi.org/10.1029/2002JD002911, 2003.
Pereira Freitas, G., Kojoj, J., Mavis, C., Creamean, J., Mattsson, F., Nilsson, L., Spicker Schmidt, J., Adachi, K., Šantl-Temkiv, T., Ahlberg, E., Mohr, C., Riipinen, I., and Zieger, P.: A comprehensive characterisation of natural aerosol sources in the high Arctic during the onset of sea ice melt, Faraday Discuss., 258, 120–146, https://doi.org/10.1039/D4FD00162A, 2025.
Petters, M. D. and Kreidenweis, S. M.: A single parameter representation of hygroscopic growth and cloud condensation nucleus activity, Atmos. Chem. Phys., 7, 1961–1971, https://doi.org/10.5194/acp-7-1961-2007, 2007.
Pilz, C., Düsing, S., Wehner, B., Müller, T., Siebert, H., Voigtländer, J., and Lonardi, M.: CAMP: an instrumented platform for balloon-borne aerosol particle studies in the lower atmosphere, Atmos. Meas. Tech., 15, 6889–6905, https://doi.org/10.5194/amt-15-6889-2022, 2022.
Pilz, C., Cassano, J. J., de Boer, G., Kirbus, B., Lonardi, M., Pöhlker, M., Shupe, M. D., Siebert, H., Wendisch, M., and Wehner, B.: Tethered balloon measurements reveal enhanced aerosol occurrence aloft interacting with Arctic low-level clouds, Elem. Sci. Anth., 12, 00120, https://doi.org/10.1525/elementa.2023.00120, 2024.
Pohorsky, R., Baccarini, A., Tolu, J., Winkel, L. H. E., and Schmale, J.: Modular Multiplatform Compatible Air Measurement System (MoMuCAMS): a new modular platform for boundary layer aerosol and trace gas vertical measurements in extreme environments, Atmos. Meas. Tech., 17, 731–754, https://doi.org/10.5194/amt-17-731-2024, 2024.
Pohorsky, R., Calmer, R., Brooks, I., Guy, H., Fauré, N., Haberstock, L., Creamean, J., Mavis, C., and Schmale, J.: Vertical in situ measurements of aerosols and meteorological variables from expedition ARTofMELT, Arctic Ocean, 2023, Dataset version 1, Bolin Centre Database [data set], https://doi.org/10.17043/oden-artofmelt-2023-aerosols-vertical-1, 2025.
Prein, A. F., Mooney, P. A., and Done, J. M.: The Multi-Scale Interactions of Atmospheric Phenomenon in Mean and Extreme Precipitation, Earths Future, 11, e2023EF003534, https://doi.org/10.1029/2023EF003534, 2023.
Price, R., Baccarini, A., Schmale, J., Zieger, P., Brooks, I. M., Field, P., and Carslaw, K. S.: Late summer transition from a free-tropospheric to boundary layer source of Aitken mode aerosol in the high Arctic, Atmos. Chem. Phys., 23, 2927–2961, https://doi.org/10.5194/acp-23-2927-2023, 2023.
Renard, J.-B., Dulac, F., Berthet, G., Lurton, T., Vignelles, D., Jégou, F., Tonnelier, T., Jeannot, M., Couté, B., Akiki, R., Verdier, N., Mallet, M., Gensdarmes, F., Charpentier, P., Mesmin, S., Duverger, V., Dupont, J.-C., Elias, T., Crenn, V., Sciare, J., Zieger, P., Salter, M., Roberts, T., Giacomoni, J., Gobbi, M., Hamonou, E., Olafsson, H., Dagsson-Waldhauserova, P., Camy-Peyret, C., Mazel, C., Décamps, T., Piringer, M., Surcin, J., and Daugeron, D.: LOAC: a small aerosol optical counter/sizer for ground-based and balloon measurements of the size distribution and nature of atmospheric particles – Part 1: Principle of measurements and instrument evaluation, Atmos. Meas. Tech., 9, 1721–1742, https://doi.org/10.5194/amt-9-1721-2016, 2016.
Ricchiazzi, P., Yang, S., Gautier, C., and Sowle, D.: SBDART: A Research and Teaching Software Tool for Plane-Parallel Radiative Transfer in the Earth's Atmosphere, B. Am. Meteorol. Soc., 79, 2101–2114, https://doi.org/10.1175/1520-0477(1998)079<2101:SARATS>2.0.CO;2, 1998.
Roberts, G. C. and Nenes, A.: A Continuous-Flow Streamwise Thermal-Gradient CCN Chamber for Atmospheric Measurements, Aerosol Sci. Tech., 39, 206–221, https://doi.org/10.1080/027868290913988, 2005.
Rotstayn, L. D. and Penner, J. E.: Indirect Aerosol Forcing, Quasi Forcing, and Climate Response, J. Climate, 14, 2960–2975, https://doi.org/10.1175/1520-0442(2001)014<2960:IAFQFA>2.0.CO;2, 2001.
Schmale, J., Sharma, S., Decesari, S., Pernov, J., Massling, A., Hansson, H.-C., von Salzen, K., Skov, H., Andrews, E., Quinn, P. K., Upchurch, L. M., Eleftheriadis, K., Traversi, R., Gilardoni, S., Mazzola, M., Laing, J., and Hopke, P.: Pan-Arctic seasonal cycles and long-term trends of aerosol properties from 10 observatories, Atmos. Chem. Phys., 22, 3067–3096, https://doi.org/10.5194/acp-22-3067-2022, 2022.
Schmale, J., Pohorsky, R., Temel, Y., Lonardi, M., Alden, J., Calmer, R., Thomas, E., Baccarini, A., Bergner, N., Dönmez, B., Favre, L., Helmig, H., Heutte, B., Hirschy, M. L., Phan, R., Solidakis, O., Streltsova, A., Surdu, M., and Tabary, A.: Vertical observations of aerosol properties in the Arctic, Antarctic and Alpine atmospheric boundary layers with a tethered balloon, Earth Syst. Sci. Data Discuss. [preprint], https://doi.org/10.5194/essd-2026-146, in review, 2026.
Sedlar, J.: Implications of Limited Liquid Water Path on Static Mixing within Arctic Low-Level Clouds, J. Appl. Meteorol. Clim., 53, 2775–2789, https://doi.org/10.1175/JAMC-D-14-0065.1, 2014.
Sedlar, J., Tjernström, M., Mauritsen, T., Shupe, M. D., Brooks, I. M., Persson, P. O. G., Birch, C. E., Leck, C., Sirevaag, A., and Nicolaus, M.: A transitioning Arctic surface energy budget: the impacts of solar zenith angle, surface albedo and cloud radiative forcing, Clim. Dynam., 37, 1643–1660, https://doi.org/10.1007/s00382-010-0937-5, 2011.
Sedlar, J., Tjernström, M., Rinke, A., Orr, A., Cassano, J., Fettweis, X., Heinemann, G., Seefeldt, M., Solomon, A., Matthes, H., Phillips, T., and Webster, S.: Confronting Arctic Troposphere, Clouds, and Surface Energy Budget Representations in Regional Climate Models With Observations, J. Geophys. Res.-Atmos., 125, e2019JD031783, https://doi.org/10.1029/2019JD031783, 2020.
Shettle, E. P.: Models of aerosols, clouds and precipitation for atmospheric propagation studies, in: AGARD Conference Proceedings, 454 pp., 1990.
Shupe, M. D.: Clouds at Arctic Atmospheric Observatories. Part II: Thermodynamic Phase Characteristics, J. Appl. Meteorol. Clim., 50, 645–661, https://doi.org/10.1175/2010JAMC2468.1, 2011.
Shupe, M. D. and Intrieri, J. M.: Cloud Radiative Forcing of the Arctic Surface: The Influence of Cloud Properties, Surface Albedo, and Solar Zenith Angle, J. Climate, 17, 616–628, https://doi.org/10.1175/1520-0442(2004)017<0616:CRFOTA>2.0.CO;2, 2004.
Shupe, M. D., Persson, P. O. G., Brooks, I. M., Tjernström, M., Sedlar, J., Mauritsen, T., Sjogren, S., and Leck, C.: Cloud and boundary layer interactions over the Arctic sea ice in late summer, Atmos. Chem. Phys., 13, 9379–9399, https://doi.org/10.5194/acp-13-9379-2013, 2013.
Soci, C., Hersbach, H., Simmons, A., Poli, P., Bell, B., Berrisford, P., Horányi, A., Muñoz-Sabater, J., Nicolas, J., Radu, R., Schepers, D., Villaume, S., Haimberger, L., Woollen, J., Buontempo, C., and Thépaut, J.-N.: The ERA5 global reanalysis from 1940 to 2022, Q. J. Roy. Meteor. Soc., 150, 4014–4048, https://doi.org/10.1002/qj.4803, 2024.
Solomon, A., Shupe, M. D., Persson, O., Morrison, H., Yamaguchi, T., Caldwell, P. M., and De Boer, G.: The Sensitivity of Springtime Arctic Mixed-Phase Stratocumulus Clouds to Surface-Layer and Cloud-Top Inversion-Layer Moisture Sources, J. Atmos. Sci., 71, 574–595, https://doi.org/10.1175/JAS-D-13-0179.1, 2014.
Solomon, A., Shupe, M. D., Svensson, G., Barton, N. P., Batrak, Y., Bazile, E., Day, J. J., Doyle, J. D., Frank, H. P., Keeley, S., Remes, T., and Tolstykh, M.: The winter central Arctic surface energy budget: A model evaluation using observations from the MOSAiC campaign, Elem. Sci. Anth., 11, 00104, https://doi.org/10.1525/elementa.2022.00104, 2023.
Sprenger, M. and Wernli, H.: The LAGRANTO Lagrangian analysis tool – version 2.0, Geosci. Model Dev., 8, 2569–2586, https://doi.org/10.5194/gmd-8-2569-2015, 2015.
Stamnes, K., Tsay, S.-C., Wiscombe, W., and Jayaweera, K.: Numerically stable algorithm for discrete-ordinate-method radiative transfer in multiple scattering and emitting layered media, Appl. Optics, 27, 2502–2509, https://doi.org/10.1364/AO.27.002502, 1988.
Stephens, G. L.: Radiation profiles in extended water clouds. I: Theory, J. Atmos. Sci., 35, 2111–2122, https://doi.org/10.1175/1520-0469(1978)035<2111:RPIEWC>2.0.CO;2, 1978.
Sterzinger, L. J. and Igel, A. L.: Above-cloud concentrations of cloud condensation nuclei help to sustain some Arctic low-level clouds, Atmos. Chem. Phys., 24, 3529–3540, https://doi.org/10.5194/acp-24-3529-2024, 2024.
Tjernström, M., Sedlar, J., and Shupe, M. D.: How Well Do Regional Climate Models Reproduce Radiation and Clouds in the Arctic? An Evaluation of ARCMIP Simulations, J. Appl. Meteorol. Clim., 47, 2405–2422, https://doi.org/10.1175/2008JAMC1845.1, 2008.
Vüllers, J., Achtert, P., Brooks, I. M., Tjernström, M., Prytherch, J., Burzik, A., and Neely III, R.: Meteorological and cloud conditions during the Arctic Ocean 2018 expedition, Atmos. Chem. Phys., 21, 289–314, https://doi.org/10.5194/acp-21-289-2021, 2021.
Wehner, B., Werner, F., Ditas, F., Shaw, R. A., Kulmala, M., and Siebert, H.: Observations of new particle formation in enhanced UV irradiance zones near cumulus clouds, Atmos. Chem. Phys., 15, 11701–11711, https://doi.org/10.5194/acp-15-11701-2015, 2015.
Wendisch, M., Brückner, M., Crewell, S., Ehrlich, A., Notholt, J., Lüpkes, C., Macke, A., Burrows, J. P., Rinke, A., Quaas, J., Maturilli, M., Schemann, V., Shupe, M. D., Akansu, E. F., Barrientos-Velasco, C., Bärfuss, K., Blechschmidt, A.-M., Block, K., Bougoudis, I., Bozem, H., Böckmann, C., Bracher, A., Bresson, H., Bretschneider, L., Buschmann, M., Chechin, D. G., Chylik, J., Dahlke, S., Deneke, H., Dethloff, K., Donth, T., Dorn, W., Dupuy, R., Ebell, K., Egerer, U., Engelmann, R., Eppers, O., Gerdes, R., Gierens, R., Gorodetskaya, I. V., Gottschalk, M., Griesche, H., Gryanik, V. M., Handorf, D., Harm-Altstädter, B., Hartmann, J., Hartmann, M., Heinold, B., Herber, A., Herrmann, H., Heygster, G., Höschel, I., Hofmann, Z., Hölemann, J., Hünerbein, A., Jafariserajehlou, S., Jäkel, E., Jacobi, C., Janout, M., Jansen, F., Jourdan, O., Jurányi, Z., Kalesse-Los, H., Kanzow, T., Käthner, R., Kliesch, L. L., Klingebiel, M., Knudsen, E. M., Kovács, T., Körtke, W., Krampe, D., Kretzschmar, J., Kreyling, D., Kulla, B., Kunkel, D., Lampert, A., Lauer, M., Lelli, L., von Lerber, A., Linke, O., Löhnert, U., Lonardi, M., Losa, S. N., Losch, M., Maahn, M., Mech, M., Mei, L., Mertes, S., Metzner, E., Mewes, D., Michaelis, J., Mioche, G., Moser, M., Nakoudi, K., Neggers, R., Neuber, R., Nomokonova, T., Oelker, J., Papakonstantinou-Presvelou, I., Pätzold, F., Pefanis, V., Pohl, C., van Pinxteren, M., Radovan, A., Rhein, M., Rex, M., Richter, A., Risse, N., Ritter, C., Rostosky, P., Rozanov, V. V., Ruiz Donoso, E., Saavedra Garfias, P., Salzmann, M., Schacht, J., Schäfer, M., Schneider, J., Schnierstein, N., Seifert, P., Seo, S., Siebert, H., Soppa, M. A., Spreen, G., Stachlewska, I. S., Stapf, J., Stratmann, F., Tegen, I., Viceto, C., Voigt, C., Vountas, M., Walbröl, A., Walter, M., Wehner, B., Wex, H., Willmes, S., Zanatta, M., and Zeppenfeld, S.: Atmospheric and Surface Processes, and Feedback Mechanisms Determining Arctic Amplification: A Review of First Results and Prospects of the (AC)3 Project, B. Am. Meteorol. Soc., 104, E208–E242, https://doi.org/10.1175/BAMS-D-21-0218.1, 2023.
Wu, H., Li, Z., Li, H., Luo, K., Wang, Y., Yan, P., Hu, F., Zhang, F., Sun, Y., Shang, D., Liang, C., Zhang, D., Wei, J., Wu, T., Jin, X., Fan, X., Cribb, M., Fischer, M. L., Kulmala, M., and Petäjä, T.: The impact of the atmospheric turbulence-development tendency on new particle formation: a common finding on three continents, Natl. Sci. Rev., 8, nwaa157, https://doi.org/10.1093/nsr/nwaa157, 2021.
- Abstract
- Introduction
- Methods
- Overview of meteorological conditions, aerosols and clouds during ARTofMELT
- Case study of free tropospheric CCN influence on long-lived low-level mixed phase cloud
- Conclusions
- Data availability
- Author contributions
- Competing interests
- Disclaimer
- Acknowledgements
- Financial support
- Review statement
- References
- Supplement
- Abstract
- Introduction
- Methods
- Overview of meteorological conditions, aerosols and clouds during ARTofMELT
- Case study of free tropospheric CCN influence on long-lived low-level mixed phase cloud
- Conclusions
- Data availability
- Author contributions
- Competing interests
- Disclaimer
- Acknowledgements
- Financial support
- Review statement
- References
- Supplement