
the Creative Commons Attribution 4.0 License.
the Creative Commons Attribution 4.0 License.
 | 21 Jul 2026
From continental to street scales: climate change impacts on atmospheric composition over Europe and London
Massimo Vieno
Oliver Wild
Fiona M. O'Connor
Steven T. Turnock
Christina M. Hood
Jenny R. Stocker
Mathew R. Heal
Dwayne E. Heard
Emma G. Sands
David J. Carruthers
Lisa K. Whalley
Climate change will impact ozone (O3) and fine particulate matter (PM2.5) through its influence on natural emissions, atmospheric chemistry, deposition and transport. A coupled modelling approach is employed to identify the key processes and determine how regional air pollution across Europe and urban-scale air quality in London in the 2090s are impacted by climate change under Representative Concentration Pathway (RCP) 8.5. Climate change projections from the HadGEM2-ES Earth System Model nudge the nested WRF-EMEP4UK model, which drives the street-scale ADMS-Urban model. Annual-mean temperature increases exceeding 4 °C produce substantial increases in summer biogenic isoprene emissions. There is a strong contrast in the summer and winter-mean O3 responses to climate change, with large summer increases over southern Europe (up to 10 ppbv) and winter decreases over Europe. Annual-average PM2.5 concentrations are elevated (5–10 µg m−3) over most of Europe, also driven by higher summer isoprene emissions that promote secondary organic aerosol formation. Decreases in primary and inorganic PM2.5 components are prominent in winter. The seasonality of urban air pollution is modified over London under climate change: the O3 peak amplitude is reduced, whilst the winter peaks in PM2.5 and NO2 are more pronounced, with nighttime increases. The diurnal profile of urban air pollution typically flattens. Climate induced changes in O3 aid attainment of long-term air quality guidelines in northern Europe, but pose challenges elsewhere. Achieving long-term PM2.5 guidelines over much of Europe becomes increasing difficult with climate change, while attaining short-term air quality guidelines in London remains a major challenge, especially for NO2.
- Article
(9622 KB) - Full-text XML
- BibTeX
- EndNote


Climate change, even in the absence of anthropogenic emission changes, will influence regional air quality with implications for human and ecosystem health (Silva et al., 2017; Emberson, 2020). The impacts of climate change on atmospheric composition and air quality have been widely studied at global and continental scales using coupled chemistry-climate models, Earth System Models (ESMs) or atmospheric chemistry transport models driven by meteorology from global or regional climate models. Many of these studies focus on understanding change in O3 or PM2.5 air quality. Climate change influences both background and local air quality by altering meteorological conditions that affect (a) atmospheric chemistry and physical processes (b) natural emissions of air pollutant precursors and deposition, and (c) long-range transport and mixing processes. These processes are often interconnected; for example, climate change affects vegetation functioning, modifying atmosphere-biosphere interactions.
Previous studies have outlined key effects through the direct impact of meteorological variables on atmospheric chemical kinetics. Over remote regions, higher temperatures lead to more water vapour and greater O3 destruction resulting in lower surface O3 background levels (Johnson et al., 1999; Doherty et al., 2013; West et al., 2013; Schnell et al., 2016; Turnock et al., 2022). High confidence in this effect was noted in the IPCC 5th Assessment (Kirtman et al., 2013). Higher humidities also enhance hydroxyl radical (OH) abundances leading to greater O3 formation, but also greater O3 loss through conversion of NOx to nitric acid (HNO3) in polluted regions (Jacob and Winner, 2009; Lu et al., 2019). In winter in the midlatitudes, such changes in photochemistry compete with direct titration of O3 by NO in high NOx regions (Lacressonnière re et al., 2014). Faster thermal decomposition of peroxyacetyl nitrate (PAN) reduces O3 production in remote regions but increases NOx in source regions, which typically promotes O3 formation (Doherty et al., 2013). These processes impact NOx, O3 and CH4 lifetimes leading to further changes in atmospheric chemistry (Thornhill et al., 2021). Schnell et al. (2016) summarises the overall O3 impact of climate change through warmer temperatures, more water vapor, and faster chemical kinetics, as an increase in the efficiency of precursor emissions to generate surface O3 in polluted regions, reducing precursor export to neighbouring downwind locations. For surface PM2.5, studies note the important kinetic effects of temperature rise on inorganic and organic aerosol species abundances. Higher temperatures lead to faster oxidation that increases formation of sulphate, and potentially organic aerosol, but reduces the partitioning of nitrate to its condensed phase, decreasing nitrate aerosol loading (Dawson et al., 2007; Pye et al., 2009; Fiore et al., 2012; Doherty et al., 2017).
Changes in climate will impact atmosphere-biosphere interactions. The response of biogenic emissions to climate change remains debated (Langner et al., 2012; Lu et al., 2019; Zanis et al., 2022). Isoprene and monoterpene emissions from vegetation are strongly temperature dependent, but the effect of increasing atmospheric CO2 concentrations (the CO2 inhibition effect; Arneth et al., 2008) has been shown to offset a temperature-driven isoprene emissions response. Uncertainties in isoprene nitrate chemistry further complicate understanding of the influence of climate changes on isoprene, the dominant global volatile organic compound (VOC), that strongly influences O3 levels (Fu and Tian, 2019). Isoprene and monoterpenes are also key secondary organic aerosol (SOA) precursors. Climate-driven isoprene-derived SOA effects have been widely studied (e.g., Lin et al., 2016; Gomez et al., 2023). Fewer studies have considered the sensitivity of monoterpene emissions to climate, but those that have suggest a large temperature-driven response, leading to higher PM2.5 through greater SOA abundance (Lin et al., 2016; Turnock et al., 2022; Gomez et al., 2023). Natural primary emissions of coarse sea-salt and dust particles, which partly contribute to PM2.5, respond to climate change through changes in wind speeds and transport patterns and impacts on soil moisture (Thornhill et al., 2021; Turnock et al., 2022); however, the dust response to climate change is highly uncertain (Gomez et al., 2023; Liu et al., 2024). Deposition processes can also be altered under climate change. Climate-driven changes in stomatal functioning and in aerodynamic resistance are likely to suppress O3 dry deposition in summer (Andersson and Engardt, 2010; Vieno et al., 2010). Several studies also highlight increases in surface PM2.5 attributed to reduced large-scale precipitation and hence less wet deposition over land (Allen et al., 2016; Allen et al., 2019; Banks et al., 2022).
Atmospheric composition and air quality will be impacted by changes in transport and local mixing in response to climate change. Climate induced changes in anticyclone frequency and longevity may drive changes in local stagnation that are associated with air pollutant build-up and in summer. When anticyclonic conditions lead to heatwaves this will modify air pollution levels (Vieno et al., 2010; RS, 2021). Enhanced stratosphere-troposphere exchange (STE) of O3 may also influence surface O3 (Zeng and Pyle, 2003; Young et al., 2013; Zanis et al., 2022).
Climate change impacts over Europe have been quantified in a considerable number of studies, most of which have applied global climate models, although a few studies have employed regional models (Andersson and Engardt, 2010; Colette et al., 2015; Langner et al., 2012; Lacressonnière et al., 2016). For surface O3, most studies for Europe have focussed on the summer season (either June–July–August or April–September). Colette et al. (2015) performed a meta-analysis of 25 model projections (Special Report on Emissions Scenarios (SRES) and Representative Concentration Pathway (RCP) pathways) with present-day air pollutant emissions, that revealed a latitudinal gradient in the impacts of climate change on surface O3 in summer over Europe, with reductions over the North Atlantic region and northern Europe and increases over large areas of continental Europe of up to 5 ppbv by 2071–2100, that they associate with the processes described above. The representation of hemispheric background O3 (influenced by O3 destruction under climate change) and of isoprene are the main sources of uncertainty in this regional model intercomparison. Subsequent studies have reported consistent spatial patterns and magnitudes of change in surface O3 in summer across Europe due to climate change in 2100 when using scenarios with a large projected global warming (RCP 8.5 or Shared Socioeconomic Pathways (SSP)3-7.0) (Schnell et al., 2016; Silva et al., 2017; Turnock et al., 2022). Schnell et al. (2016) notes that even with constant biogenic isoprene emissions, some models suggest summer mean O3 increases in southern Europe under RCP8.5.
For PM2.5 over Europe, typically the impact of climate change on the annual mean abundance has been analysed. Studies using RCP 8.5 and SSP3-7.0 pathways for climate change in 2100 typically show a latitudinal gradient with small absolute changes of 0–1 µg m−3 over northern Europe and more pronounced changes over southern Europe (∼3 µg m−3). These changes are attributed to elevated biogenic emissions under climate change (Turnock et al., 2020, 2022; Gomez et al., 2023) and less wet deposition arising from reduced large-scale precipitation (Silva et al., 2017). A regional model intercomparison by Lacressonnière et al. (2016) highlights that the response of PM2.5 to climate change over Europe depends largely on emissions driven changes in SOA. Meanwhile, changes in precipitation, relative humidity and winds are important drivers for other PM2.5 components, with dust representation being a major uncertainty.
A small number of studies, using global and regional models, have isolated the impacts of climate change on air quality over the UK. An analysis of model output from the Coupled Model Intercomparison Project (CMIP6) suggests that under the SSP3-7.0 pathway, annual-mean surface O3 mixing ratios over the UK decrease by 3 ppbv in 2100 due to greater O3 destruction over the Atlantic (RS, 2021). A meta-analysis by Colette et al. (2015) identified summer mean surface O3 reductions of up to 3 ppbv under RCP8.5 by the end of the century. At the urban-scale, one study examined climate change effects on air quality over London using a dispersion model driven by outputs from the HadCM3 climate model under the SRES A2 scenario for 2071–2100 (Athanassiadou et al., 2010). Urban annual-average O3 concentrations increased in the future, while PM10 showed little change. However, this study used a simple statistical model to represent background concentrations that neglected the relationship between O3 and specific humidity. All the processes described above are important at the local-scale. Furthermore, the magnitude of O3 and PM2.5 responses to climate change may vary with model resolution since underlying processes and their representation e.g., of emissions and the resulting chemical regime may be resolution dependent (Zanis et al., 2022).
UK Climate Projections 2018 (UKCP18) based on RCP8.5 simulations are available at high resolution through dynamical downscaling of the HadGEM3 model, and include estimates of uncertainty (Murphy et al., 2018). However, there is a lack of high-resolution future projections that include air quality and climate interactions due to the computational expense of incorporating interactive chemistry (Doherty et al., 2022; Fiore et al., 2022) and dynamical downscaling. This study therefore seeks to use multi-scale nested modelling (global to regional to local) to address this issue and capture important processes relevant to the different scales. The need for regional and urban-scale capabilities for future projections is pertinent for the revised 2021 World Health Organisation guidelines. These provide new air quality guidelines and interim targets that are considerably more stringent, and include for the first time peak season O3 targets and guidelines (WHO, 2021). Future emission policies will need to account for the climate change impacts on both background and local O3 and PM2.5 air quality in order to achieve these targets/guidelines. In addition, studies of NO2 changes driven by climate change in relation to WHO guidelines are absent. Hence the capability to simulate regional and street-scale atmospheric composition together using a consistent approach that identifies the key driving processes is a pressing requirement.
The aim of this study is therefore to employ a consistent nested global-regional-urban scale modelling system to investigate how substantial future changes in climate may impact continental, regional and urban-scale atmospheric composition over Europe, the UK and London, focussing on the key drivers at different spatial and temporal scales, and the implications for meeting WHO air quality guidelines. The nested modelling approach and simulations performed are described in Sect. 2. Climate change impacts on atmospheric composition over Europe are discussed in Sect. 3, focusing on surface O3 and PM2.5 and its components and investigating the key driving processes. Climate-change driven changes in seasonal variability of surface O3, PM2.5 and for the first time NO2 are examined for the UK and London as well as the change in diurnal cycles over the UK in Sect. 4. The influence of climate change for achieving WHO (2021) air quality interim targets and guidelines for O3, PM2.5 and NO2 are explored in Sect. 5. Conclusions are presented in Sect. 6.
A multi-scale nested modelling approach, which couples regional and urban-scale processes, is employed in this study. The modelling framework integrates a regional atmospheric chemistry transport model, a local dispersion model, and a numerical weather prediction model, driven by global change climate projections from an Earth System Model. Details of each model and the coupling chain are presented in the following sections.
2.1 Global-scale climate modelling
The global model used to provide climate change projections in this study, is the HadGEM2-ES Earth System Model (Collins et al., 2011). HadGEM2-ES is a coupled atmosphere-ocean model, with additional Earth system components such as dynamic vegetation, interactive chemistry and aerosols, and a terrestrial and ocean carbon cycle (Collins et al., 2011). HadGEM2-ES was used extensively to contribute model outputs from ensembles of historical and future simulations to Phase 5 of the Coupled Model Intercomparison Project (CMIP5; Taylor et al., 2012). Further details on the implementation of forcings for all CMIP5 simulations are provided in Jones et al. (2011). 3-D distributions of temperature, specific humidity, U and V wind components, surface pressure, soil temperature and moisture from HadGEM2-ES were used as initial and 6-hourly boundary conditions for nested regional numerical weather prediction simulations described below (Sect. 2.2).
2.2 Regional-scale modelling
The EMEP4UK model is based on the European Monitoring and Evaluation Programme Meteorological Synthesizing Centre-West (EMEP MSC-W) chemistry transport model, used by the UNECE Convention on Long-range Transboundary Air Pollution to assess trans-boundary air pollution in Europe. The EMEP4UK model version applied in this study to simulate regional atmospheric composition and air quality metrics is based on EMEP MSC-W rv4.6 (Simpson et al., 2012, 2015). It uses a one-way nested approach with two domains: an outer domain covering the majority of Europe which provides boundary conditions for a UK nested domain (Vieno et al., 2010, 2014, 2016). The EMEP4UK model meteorological driver is the WRF model version 3.6.1 (https://www2.mmm.ucar.edu/wrf/users/wrf_wps_v3_info.html, last access: 1 September 2016). In addition to using initial and 6-hourly lateral boundary conditions from HadGEM2-ES, WRF simulations are nudged every 6 h in 3-D, using temperature and U and V wind components from HadGEM2-ES.
The EMEP4UK and WRF models use the same grid definition, with a horizontal resolution of 50 km×50 km for the European domain and 5 km×5 km for the UK domain. An intermediate domain with 10 km×10 km horizontal resolution is also used for WRF. The models also share the same vertical grid that employs 21 vertical levels from the surface to 100 hPa, with the lowest vertical layer ∼50 m deep. Modelled air pollutant concentrations described here as surface concentrations have been adjusted to correspond to 3 m above the surface (Simpson et al., 2012).
EMEP4UK uses the CRI-v2-R5 gaseous chemical mechanism (Watson et al., 2008), which has 220 species and 609 reactions. Five classes of fine and coarse particles are represented in EMEP4UK. Gas–aerosol partitioning of secondary inorganic aerosol utilises the Model for an Aerosol Reacting System (MARS) equilibrium module (Simpson et al., 2012); secondary organic aerosol formation uses the volatility basis set approach (Bergström et al., 2012). PM2.5 is the sum of fine ammonium (), sulphate (), fine nitrate (), fine elemental carbon (EC), fine organic matter (OM), fine sea salt (SS), fine mineral dust, and 27 % of the coarse nitrate aerosol (Vieno et al., 2016). The WRF-EMEP4UK nested model system used here has been thoroughly evaluated against measurements (Vieno et al., 2010; Ots et al., 2016, Lin et al., 2017), including provision of evidence on air quality to the UK government (e.g., AQEG, 2021).
Anthropogenic and greenhouse gas emissions are annually invariant to permit a clearer isolation of the climate change signal. Anthropogenic emissions of NOx, NH3, SO2, primary PM2.5, primary coarse PM (PM2.5–10), CO and non-methane VOCs for 2012 are derived from the EMEP Centre for Emission Inventories and Projections (CEIP, https://www.ceip.at, last access: 1 August 2018). The National Atmospheric Emission Inventory (NAEI, https://naei.energysecurity.gov.uk/data-archive, last access: 1 December 2016) is used for anthropogenic emissions for the UK for 2012 at 1 km resolution. Shipping emission estimates for the UK domain are derived from ENTEC (2010), projected to 2012. Annual total anthropogenic emissions derived from the inventories are resolved to hourly resolution using prescribed monthly, day-of-week and diurnal hourly emissions factors and distributed vertically (Simpson et al., 2012). Biomass burning emissions are not included here. The standard EMEP4UK model uses prescribed daily biomass burning emissions derived from satellite-based inventories. To ensure that interannual variability in the model experiments is due to climate alone, biomass burning emissions are turned off altogether. Biomass burning makes a relatively small contribution to total regional emissions over Europe (∼1 % for NO, 8 %–10 % for CO and PM2.5), but estimates vary substantially (see e.g., Pan et al., 2020) and there is considerable uncertainty in how they will respond to climate change.
Biogenic emissions of isoprene and monoterpene (α-pinene) in EMEP4UK are calculated interactively using surface temperature and insolation (Guenther et al., 1995; Simpson et al., 2012) and therefore respond to the changes in climate as simulated in these nudged WRF simulations. CO2 inhibition of isoprene emission (Arneth et al., 2008) is not included in this EMEP4UK model version. Emissions of NOx from soils, which are temperature dependent, and of wind-driven sea salt are also calculated interactively (Simpson et al., 2012). Other natural emissions (lightning, DMS, volcanic) are fixed and hence invariant between the present-day and future coupled model simulations. Lightning NOx emissions are prescribed here. Interactive schemes used in other studies have shown strong responses to climate change globally, but relatively small responses over Europe (Finney et al., 2018), hence the impact of this simplification is likely small. The impacts of climate change on DMS are uncertain (Thornhill et al., 2021; Zhao et al., 2024; Joge et al., 2025). The import of Saharan dust is treated using a monthly climatology of fine and course dust concentrations. Since the response of dust to climate change is uncertain (Sect. 1), Saharan dust is also treated as invariant between present-day and future.
Longer lived gaseous species are provided as boundary and initial conditions for 2012 and these are used for all EMEP4UK simulation years. Atmospheric CO2 concentrations, which influence sulphate production and dry deposition of sulphur dioxide in this version of EMEP are fixed at 392 ppmv. Mixing ratios of methane are specified across the whole model domain at 1780 ppb for every year. O3 boundary conditions at the edge of the European domain are based on climatological ozone-sonde data, modified monthly against climatological clean-air surface observations (Simpson et al., 2012). Hence, the same present-day O3 boundary conditions for the outer European domain are used for each year. Boundary conditions for gas-phase (CO, PAN, NOx, SOx, HNO3, H2O2, VOCs) and inorganic aerosol species are also prescribed climatologies based on measurements (Simpson et al., 2012). This excludes the influence of climate-driven concentration changes outside the European domain on European air quality but allows us to isolate the signature of climate change over Europe alone.
For O3 and NO2 model evaluation (performed using the R openair package), hourly observational data over Europe for 2012 from “rural” sites were obtained from EMEP (https://www.eea.europa.eu/data-and-maps/data/airbase-the-european-air-quality-database-8, last access: 1 April 2026), with 365 and 265 sites respectively meeting the 75 % hourly data capture criteria. Slightly fewer sites met additional data capture criteria within the peak season required for calculating MDA8 O3 (332). Observations from urban and suburban background sites were also included in the comparisons for PM2.5, giving a total of 170 sites, due to the small number of rural PM2.5 monitoring sites available in 2012 (38). Model-observation comparisons are performed by extracting values from the closest EMEP4UK grid cell to each monitoring location.
2.3 Coupled regional and urban-scale modelling
The Atmospheric Dispersion Modelling System (ADMS) Urban model version 3.4.6 is used in this study. ADMS-Urban is a quasi-Gaussian model that simulates the dispersion of emissions based on meteorological stability, which is influenced by urban land use and building morphology (Carruthers et al., 1994; Stocker et al., 2012; Hood et al., 2018). The model uses meteorological profiles of wind speed and direction, among other parameters, to define atmospheric conditions. Emissions from industrial, domestic and road traffic sources are included, either explicitly with detailed time-varying profiles e.g., for major road and industrial sources, or as 1 km grid-averaged emissions. A street canyon module modifies the dispersion of emissions from all roads in the modelling domain with adjacent buildings, while an urban canopy module calculates modified wind speed and turbulence flow profiles to represent larger-scale urban conditions. ADMS-Urban uses a semi-empirical NOx photolytic chemistry module (Venkatram et al., 1994), which accounts for fast, near-road oxidation of NO by O3 to form NO2 (Smith et al., 2017) and a simplified sulphate chemistry scheme for conversion of SO2 to PM2.5. The NOX chemistry scheme performance has been compared with the detailed Master Chemical Mechanism over London by Hood et al. (2018). This highlighted reasonable agreement (within 20 %–40 %) except during summer air pollution episodes (Malkin et al., 2016). Further details of the ADMS-Urban model set-up can be found in Hood et al. (2018).
Emissions for all sources other than road traffic are from the London Atmospheric Emissions Inventory 2010 (GLA, 2013), projected from the LAEI base year 2010 to the modelled year 2012. Time-varying profiles are applied. Road traffic emissions were calculated using activity data from the LAEI with adjustments to NOX, NO2 and PM2.5 emissions factors to improve consistency with real-world emissions measurements as described in Hood et al. (2018). The ADMS-Urban outputs for this study are for specified receptor locations corresponding to 56 reference air quality monitoring sites from the Automatic Urban and Rural Network (AURN) and from the London Air Quality Network (LAQN) (Hood et al., 2018).
The coupled WRF-EMEP4UK-ADMS-Urban regional to urban model system is used to simulate continental and urban street-scale air pollution and relevant metrics. Consistent anthropogenic emissions for the year 2012 are used in WRF-EMEP4UK and ADMS-Urban. Hourly meteorological and chemical boundary concentrations from WRF-EMEP4UK grid-cells are used as input to ADMS-Urban through one-way coupling. This ensures that the long-range transport and chemical environment is adequately represented in terms of physical and chemical processes at all relevant time and spatial scales, from regional to street scale. Model evaluation (performed using the R openair package), used hourly observational data for London for the years 1996–2005 and 2012 from the LAQN for “background” and “near-road” sites that met the requirement of at least 70 % data capture of hourly data during the relevant year. For 2012, 20, 11 and 42 sites for O3, PM2.5 and NO2 met this requirement (see Hood et al., 2018). For the 1996 to 2005 period, considerably fewer data were available: for O3 (NO2) the number of sites increased from 7 (9) in 1996 to 16 (40) in 2005. For PM2.5 for this period only “roadside” data were available (1 site from 1998 and 2 sites from 2004), hence the measurements do not reflect ambient conditions well; also, observations exhibit considerable year-to-year variation (between 28.9 and 56.0 µg m−3), which may reflect equipment error. Model-observation comparisons are made at directly corresponding locations due to the high spatial resolution of ADMS-Urban model output. The coupled system and the standard ADMS-Urban model configuration for 2012 is extensively evaluated in Hood et al. (2018).
2.4 Present-day and future model experiments
Present-day and future experiments were performed using the regional and urban coupled models to quantify changes in atmospheric composition due to climate change under RCP 8.5 at the regional scale over Europe and the UK and at urban scale over London. Air quality metrics were calculated to evaluate the implications for attaining World Health Organisation (WHO) air quality guidelines and interim targets (WHO, 2021).
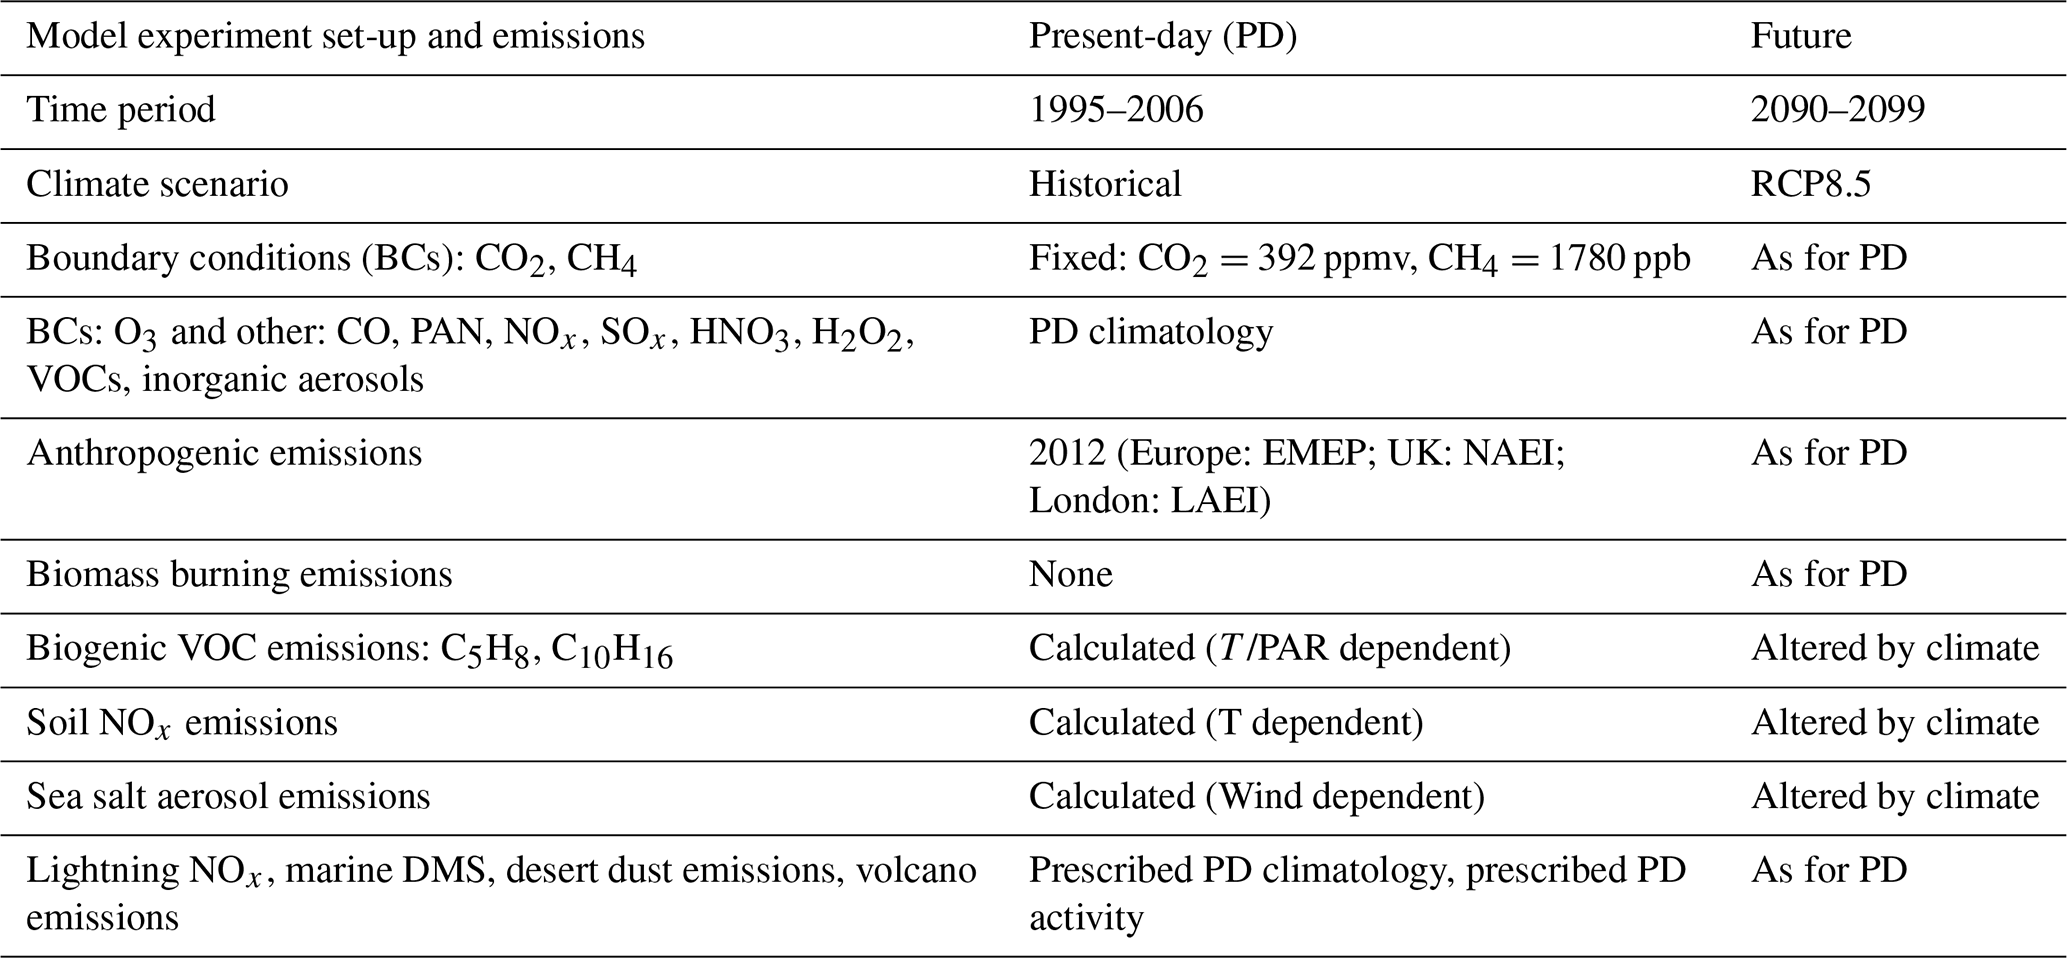
Coupled model simulations were performed for two 10-year time periods: present-day (1996–2005) and future (2090–2099) following RCP8.5 using HadGEM2-ES climate outputs based on historical and RCP8.5 (Lamarque et al., 2010; Meinshausen et al., 2011) future simulations from CMIP5. The difference between these two periods results in a large global mean near-surface temperature change of 4.7 °C (Met Office Hadley Centre, 2012). Anthropogenic emissions representative of the year 2012 (Sect. 2.3) are used for all 10-year present-day and future simulations in order to isolate the impacts of climate change alone on atmospheric composition. The model experiment set-up, shown in Table 1, enables quantification of the coupled EMEP4UK and ADMS-Urban responses to climate change due to the combined effects of changes in atmospheric chemistry and physics processes, climate-sensitive emissions, deposition and transport (Sect. 1).
This section examines the impacts of climate change on annual and season mean distributions of O3, PM2.5 (both total and individual components) and their precursors, assuming no change in anthropogenic emissions.
3.1 Annual and seasonal mean changes
Annual mean near-surface temperatures increase by more than 4 °C across Europe and up to 8 °C in northern Scandinavia and Alpine regions under RCP 8.5 in the 2090s (2090–2099) compared to 2000s (1996–2005; Fig. 1d). HadGEM2-ES suggests little change in temperature over the North Atlantic, a common feature of other CMIP models, and this has been attributed to a reduction in the meridional overturning in this Atlantic Ocean region (e.g., Park and Yeh, 2024).
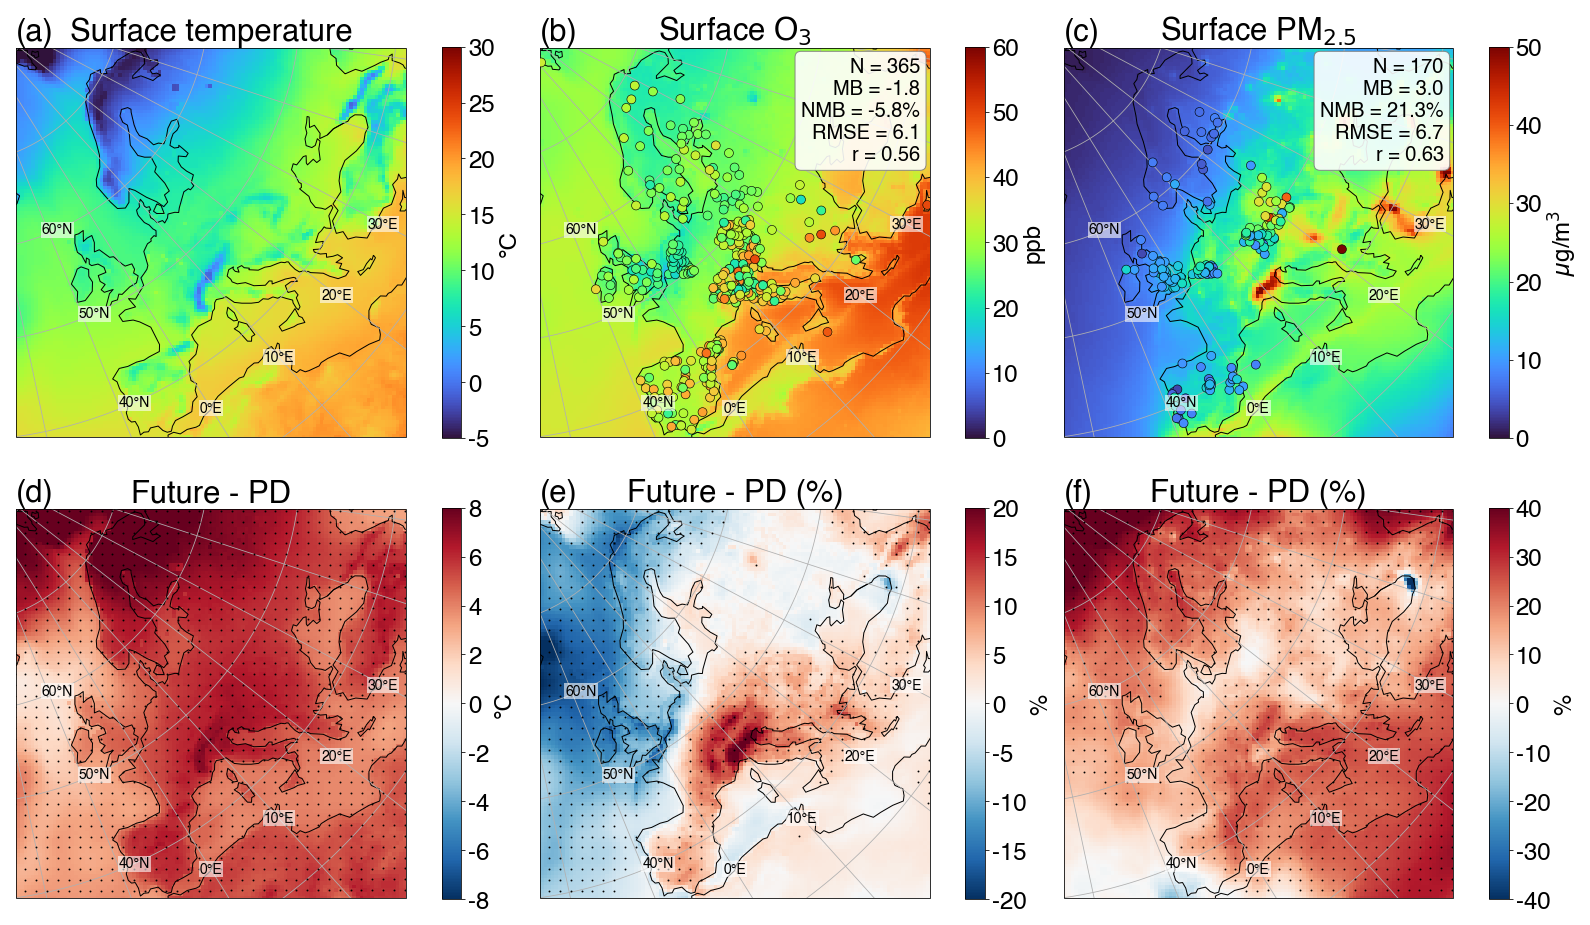
Figure 1Annual mean distributions of (a) temperature (2 m) (°C), (b) surface O3 (ppbv) (c) surface PM2.5 (µg m−3) for present-day (PD; 1996–2005; 2012 anthropogenic emissions) and the differences between future (2090–2099) – present day (1996–2005) in (d) temperature (2 m), (e) surface O3 (f) surface PM2.5 (same units) simulated by WRF EMEP4UK (50 km×50 km European domain). Statistically significant changes between the 10-year present-day and future periods are depicted as dots (student t-Test with a p value<0.05). Panels (b) and (c) include summary model-observation comparison statistics at rural observation site locations (O3) and background sites (PM2.5) for year 2012. N: number of sites included in comparison; MB: mean bias; NMB: normalised mean bias; RMSE: root mean square error; r: correlation coefficient.
Present day annual-mean surface O3 mixing ratios averaged over the period 1996–2005 (that use anthropogenic emissions for 2012) show a North–South gradient, with values greater than 30 ppbv in southern parts of Europe (higher over the Mediterranean and the Alps) and lower values ∼20 ppbv in northern Europe (Fig. 1b). These annual average modelled O3 concentrations are compared to observations for rural sites for the year 2012, assuming that the dominant influence on air pollutant concentrations arises from underlying anthropogenic emissions. The observed annual-average O3 values are generally well captured by the model although slightly underestimated, with small magnitudes of mean bias (−1.8 ppbv), normalised mean bias (−6 %) and RMSE=6 (Fig. 1). Some of the largest underestimates for individual sites occur when monitors are located at high elevation (>1500 m; Fig. A1) e.g., in the Alps/Balkans. The spatial correlation coefficient is moderate r=0.56 (Fig. 1b); this may partly reflect differences in meteorological impacts on concentrations that arise through a comparison of observations from the year 2012 against the 1996–2005 modelled period average. The annual mean O3 response to climate change shows a strong regional contrast, as noted in previous studies for summer O3 (e.g. Colette et al., 2015; Schnell et al., 2016; Sect. 1), with statistically significant increases of up to 20 % over southern and central Europe (centred on the Alps) and decreases of up to 15 % over northern Europe (Fig. 1e).
Present-day annual-mean PM2.5 concentrations are typically between 10–20 µg m−3 but show hotspot locations e.g., northern Italy ∼50 µg m−3 (Fig. 1c). Annual average PM2.5 concentrations are overestimated by the model in 2012, with a mean bias of 3 µg m−3 (NMB=21 %) and an RMSE=7, and a moderate spatial correlation (r=0.63). Annual mean PM2.5 concentrations are elevated over most of Europe (up to 30 %; typically between 5–10 µg m−3) under RCP8.5 (Fig. 1f); these values are similar in sign but higher than reported from global models following RCP8.5 and SSP3-7.0 pathways in previous studies (Silva et al., 2017; Turnock et al., 2022; Gomez et al., 2023).
To understand the drivers of these changes, winter and summer mean changes in O3, PM2.5 and key precursor species are shown in Fig. 2. The response of surface O3 to climate change exhibits a strong contrast between winter and summer. In winter, surface O3 decreases significantly over a substantial part of continental Europe (2–8 ppbv; Fig. 2a), whilst in summer substantive O3 increases are evident across nearly all of continental Europe (5–10 ppbv; Fig. 2f); with small decreases (that are statistically significant at the 95 % confidence interval) over Nordic regions and the UK, consistent with the findings of Colette et al. (2015). In this warmer climate, increased water vapor concentrations reduce background O3 levels, explaining reductions across the Atlantic in both seasons, and may largely drive the O3 decreases across northern Europe in winter. The response of surface PM2.5 to climate change is far more muted in winter compared to summer which shows significant increases of up to 15 µg m−3 in parts of Southern Europe, the Mediterranean and Northern Africa (Fig. 2b and g).
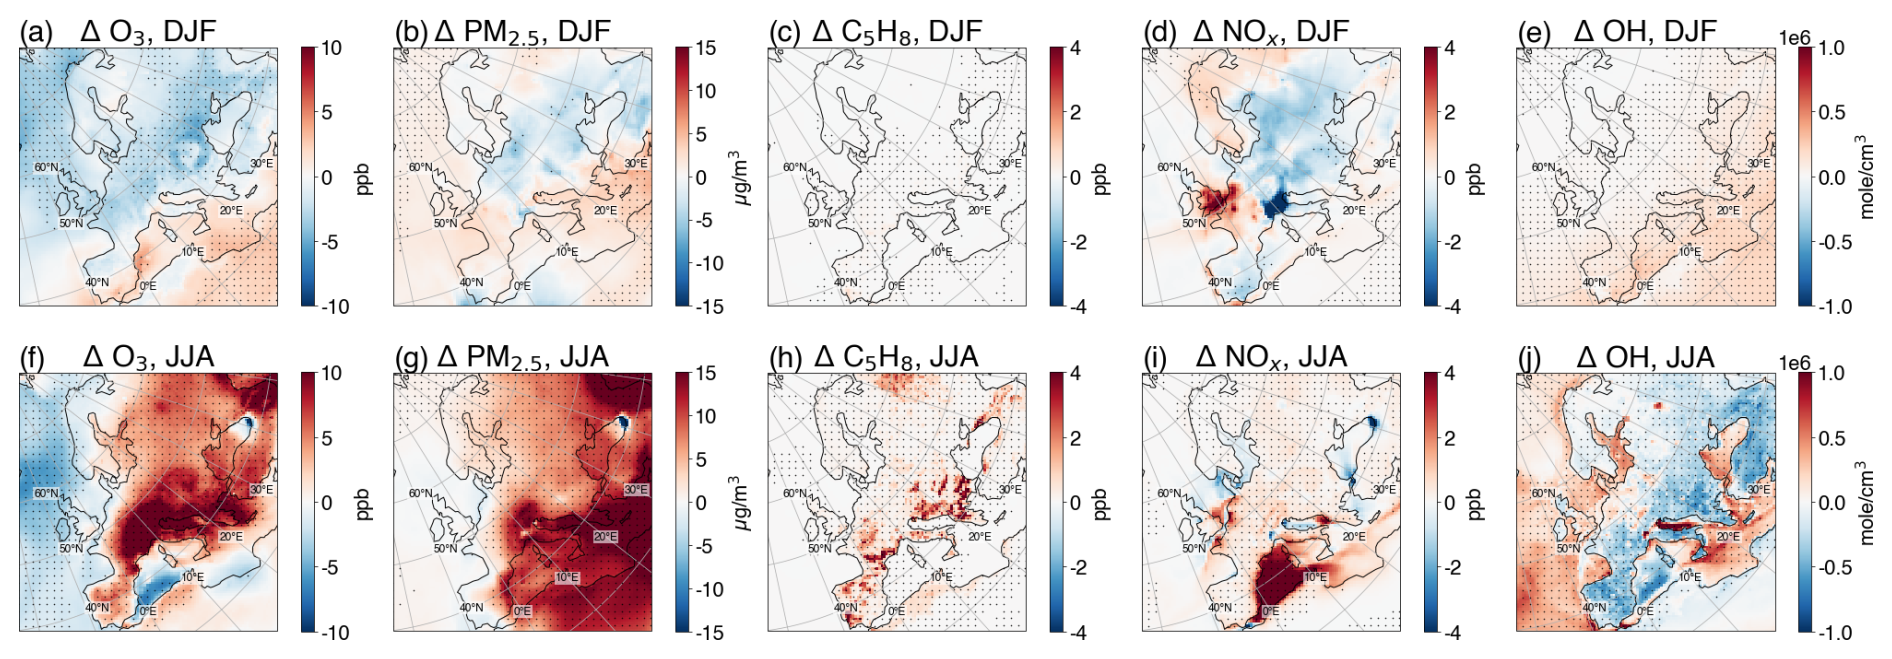
Figure 2Top panels show winter mean distributions of surface changes in (a) O3 (ppbv), (b) PM2.5 (µg m−3) (c) isoprene (ppbv) (d) NOx (ppbv), and (e) OH×106 (molecule cm−3), under future conditions (2090–2099) compared to the present day (1996–2005). Lower panels (f–j) show the corresponding summertime changes. Statistically significant changes between the 10-year periods are indicated with dots (student t-Test with p value<0.05).
Whilst anthropogenic emissions remain unaltered, biogenic isoprene emissions respond to elevated temperatures increasing from 10.4 to 22.5 mg m−2 (116 %) associated with a 4.8 °C increase over the European domain (35–70° N and 20° W–40° E), corresponding to 24 % increase per 1 °C (Table A1). This doubling of annual-mean isoprene emissions (Fig. A1c), results in isoprene mixing ratios significantly elevated by up to 4 ppb in summer in parts of southern Europe, with much smaller changes in winter (Fig. 2c and h). These elevated isoprene levels are the main driver of higher O3 and PM2.5 in summer across continental Europe. Andersson and Engardt (2010) found increases in isoprene emissions of 83 % over Europe in the 21st Century under the SRES A2 scenario, smaller than the changes reported here, but for a smaller temperature increase. Langner et al. (2012) showed that under the SRESA1B scenario isoprene emissions over Europe increased by 21 %–26 % in four out of five regional model simulations over the first four decades of the 21st Century associated with a 1.27 °C temperature increase. The sensitivity of the isoprene response to climate change over Europe was comprehensively examined using the MEGAN-MOHYCAN model by Bauwens et al. (2018). Under RCP8.5 they suggest isoprene emission increases of 83 % over the 21st Century for an average increase in temperature of 4 °C (21 % per 1 °C). Larger increases were found when CO2 fertilisation effects were included, but there were substantial decreases when considering CO2 inhibition. Overall, the changes in isoprene emissions reported in our study are large but consistent with other studies that do not include CO2 inhibition or fertilisation effects. Large uncertainties remain in the interplay between these complex effects on isoprene emissions (Do et al., 2025). Consistent with changes in isoprene, α-Pinene concentrations also strongly increase with temperature in both winter and summer throughout Europe (except in northern Scandinavia)(not shown).
Dry deposition of O3 is also altered significantly by climate change. Across almost all of Europe, future wintertime deposition velocities that are up to 0.1 cm s−1 larger contribute to lower surface O3 mixing ratios in winter, whilst deposition velocities up to 0.1 cm s−1 (∼15 %) smaller support higher surface O3 in summer (Fig. 3a and d). Climate change simulations under the SRES A2 scenario found reductions in O3 deposition velocities in summer of up to 40 % over southern Europe between 1961–1990 and 2071–2100, leading to increases in summer mean O3 of up to 6 ppbv (Andersson and Engardt, 2010). Vieno et al. (2010) also noted severely restricted O3 dry deposition during the 2003 heatwave in the UK.
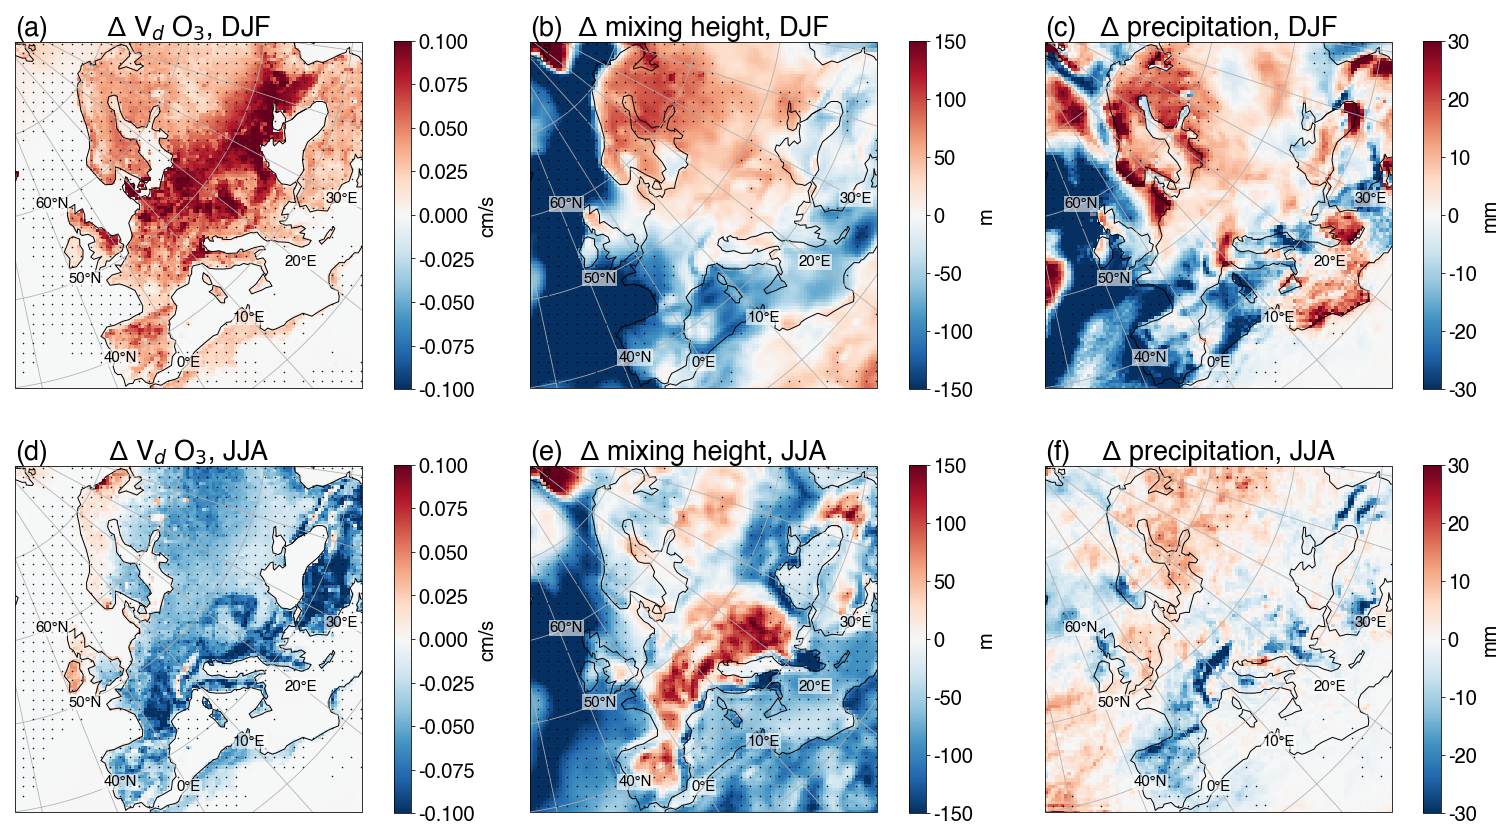
Figure 3Top panels show wintertime changes in (a) O3 deposition velocities (cm s−1), (b) mixing layer height (m) and (c) precipitation (mm) in future (2090–2099) compared to the present day (1996–2005). Bottom panels (d–f) show the corresponding summertime changes. Statistically significant changes between the 10-year periods are indicated with dots (student t-Test with p value<0.05).
Changes in oxidants were also examined. Hydroxyl radical (OH) concentrations generally increase slightly in winter but decrease more prominently in summer over most of Europe and the Mediterranean by up to 0.75×10⁶ molecules cm−3, with small OH increases for the UK and Benelux regions (Fig. 2e and j). These changes are statistically significant at the 95 % confidence interval. Most oceanic regions show summer increases reflecting greater OH production associated with higher humidity and O3 destruction. HO2 and RO2 radical species also change slightly in winter, but exhibit an opposing response to that of OH, that is similar or greater in magnitude. There are many formation and loss processes affecting oxidant levels that may be influenced by climate change. In summer, the primary influence on OH changes across continental Europe is likely to be higher abundances of biogenic VOCs, whose oxidation acts as a OH sink that enhances HO2 and RO2 levels. In winter, the small uniform OH increases may be a consequence of greater OH formation as a result of higher O3 destruction due to humidities.
Annual-mean soil NO emissions increase under this large climate signal (Fig. A1f) across almost all of Europe yielding a 64 % increase in the future compared to present-day or a 13 % increase per 1 °C (Table A1), potentially influencing land summer NOx concentrations (Fig. 2i). Previous experimental studies have suggested a 100 % (or doubling) of NO emissions for each 10 °C rise, although sub-ranges of temperatures showed differing levels of linearity (Laville et al., 2009); with the parametrisation used in this study based on such results (Simpson et al., 2012). Few studies have reported soil NO emissions changes over Europe. A 9 % increase in NO emissions averaged over Europe was simulated under a regional warming of 1.8 °C on average across Europe in the 2030s compared to the 1990s (a 5.2 % increase per 1 °C) by Kesik et al. (2006). The lower sensitivity to climate change compared to this study, is likely due to their inclusion of soil moisture effects on NO emissions. A recent experimental field study found that dryer soils in a warmer climate could reduce NO emissions (Huang et al., 2025), suggesting there is also uncertainty in the impact of this climate-sensitive emission process. Unlike isoprene, this natural soil emission source is minor compared to current anthropogenic NOx emissions as noted by Simpson et al. (2012). In response to climate change, surface NOx mixing ratios show distinct patterns of change over Europe in winter that are most prominent over major source regions. NOx increases strongly over the UK, Benelux region and northern France (∼4 ppbv) but generally decrease elsewhere, most notably over northern Italy (4 ppbv; Fig. 2d and i), although these changes are not found to be statistically significant. In contrast, in summer there are small but significant NOx increases over Europe, with large increases apparent in a few emission regions, and notably over the Mediterranean coincident with OH reductions. The most prominent changes in NOx mixing ratios over land are more localised than the O3 and PM2.5 responses reflecting the shorter atmospheric lifetime of NOx.
In winter, the areas of largest change are coincident with strong NOx emission source locations. Winter NOx increases in northern European source regions are consistent with the findings of previous studies that highlight the reduced role of peroxyacetylnitrate (PAN) with warmer temperatures. Using a global model, Doherty et al. (2013) found a widespread increase in annual mean surface O3 of up to 1 ppbv over Europe under a global warming signal of 3 °C, as a result of higher NOx concentrations over source regions due to greater PAN decomposition. However, winter NOx decreases in southern Europe suggests photochemistry or mixing effects may be more important. In summer, reduced formation of PAN and OH decreases may increase NOx lifetimes and promote higher NOx over sources regions in Europe and the Mediterranean.
Higher latitude increases in surface NOx suggest titration of O3 by NO in winter, that leads to reduced O3 mixing ratios, as photochemistry is less active to replenish O3 in northern Europe. (Fig. 2a and e). In southern Europe, reduced surface NOx in winter is coincident with lower O3 mixing ratios. To investigate the O3 chemical environment the changes in NOxVOC concentration ratios are depicted in Fig. A2. There is a strong contrast between northern and southern Europe in winter with the highest ratios, indicating most VOC-limited conditions, over Benelux and the UK. In summer marine regions with heavy shipping in the North Sea, English Channel/North Atlantic and the northern Mediterranean display the highest NOxVOC ratios. NOxVOC ratios increase in winter in northern Europe due to higher NOx suggesting climate change would lead a more VOC-limited regime in future here, and decrease elsewhere suggesting more widespread NOx-limited regimes (Fig. A2c). Conversely, in summer NOxVOC ratios decrease over continental Europe because of higher biogenic VOC levels due to climate change, implying a more NOx-limited regime, but increase over the Mediterranean due to higher NOx (Fig. A2f). The different seasonal and latitudinal responses in the NOxVOC ratio highlight the challenge for designing future O3 mitigation strategies across Europe when considering the impacts of climate change. Overall, it is clear that climate-driven changes in isoprene emissions, O3 dry deposition and chemistry have impacts on oxidant levels and surface O3 right across Europe, as reported in previous studies.
Climate change may also influence local mixing and transport patterns. Mean mixing heights over the 10-year present-day and future periods show distinct patterns of change over Europe. In winter, mixing heights decrease significantly over western Europe and ocean regions and increase over central, eastern and northern Europe by up to ∼100 m (Fig. 3b). In summer a strong land-ocean contrast is evident, with significant increases over continental Europe (up to 150 m) and decreases over oceans (Fig. 3e). In winter, over central Europe, the spatial pattern of surface O3 and NOx decreases resembles that of mixing height increases, suggesting that changes in mixing height may influence their responses to climate change. In summer, O3 and PM2.5 responses do not appear to be impacted by changes in boundary layer mixing height. Precipitation in winter exhibits a similar east-west contrast, with increases in central and northern Europe and decreases in western Europe that are statistically significant (∼10 mm and up to 30 mm; Fig. 3c). Summer precipitation changes are mixed across Europe with increases in eastern areas and larger reductions over mountainous regions (Alps/Pyrenees) (Fig. 3f). These precipitation changes may also influence PM2.5 concentrations e.g., increases over the Alps in summer (Fig. 2g). Several previous global model studies have suggested that reduced large-scale precipitation over northern hemisphere midlatitudes land regions under climate change especially in summer may lead to increases in surface PM2.5 due to less wet deposition (Allen et al., 2016; Banks et al., 2022).
3.2 PM composition changes
In the absence of anthropogenic emission changes, climate change impacts PM2.5 through changes in natural aerosols and/or aerosol precursor emissions, oxidising capacity and secondary aerosol formation pathways, and/or aerosol sink processes. In this section we assess how the composition of annual and seasonal mean PM2.5 may change in the future, and the key driving processes. The present-day (1996–2005) spatial distribution of annual-mean PM2.5 components in Fig. 4 highlights that the inorganic contribution to PM2.5 is dominated by sulphate from energy generation in south east Europe and shipping in the Mediterranean, as well as nitrate (and to a lesser extent ammonium) in the Alps/Po valley region. Primary black and organic carbon emission hotspots are responsible for a strong urban/anthropogenic fingerprint and a large natural Saharan dust component is also evident in overall PM2.5 levels, particularly over south-west Europe. A substantial widespread secondary organic source of PM2.5 is evident almost everywhere. In winter, the abundances of sulphate, nitrate and primary PM2.5 are larger over land, whilst in summer sulphate is higher over the Mediterranean and SOA levels are substantially higher (exceeding 10 µg m−3) over all of continental Europe and the Mediterranean (not shown).
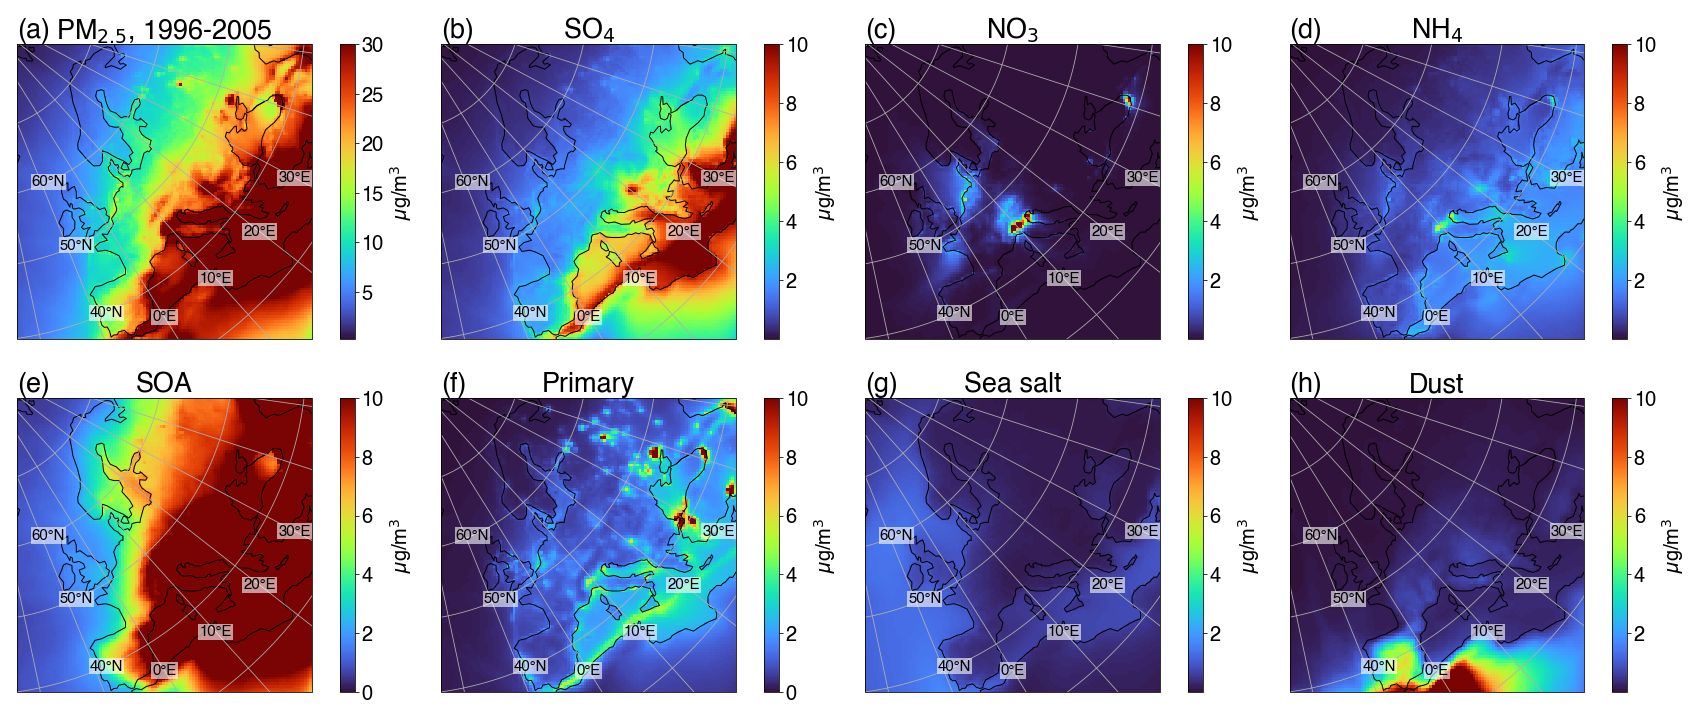
Figure 4Present-day (1996–2005) spatial distributions of annual mean (a) PM2.5 and its secondary components: (b) sulphate (SO4), (c) nitrate (NO3), (d) ammonium (NH4), (e) secondary organic aerosol (SOA); and primary components: (f) primary organic matter and elemental carbon, (g) sea salt and (h) desert dust aerosol; all in µg m−3.
The seasonal changes in these PM2.5 components in the 2090s compared with 2000s are shown in Fig. 5. Numerous climate sensitive processes influence the concentrations of inorganic aerosol in the atmosphere. Of the inorganic components of PM2.5, sulphate displays the largest response to climate change under RCP8.5. Sulphate aerosols exhibit a large and statistically significant wintertime decrease (>2 µg m−3) over central Europe and an increase over ocean regions (Fig. 5a). A smaller significant summertime decrease in sulphate occurs over the Balkan regions with more widespread increases (notably in the Mediterranean) or no change elsewhere (Fig. 5h).
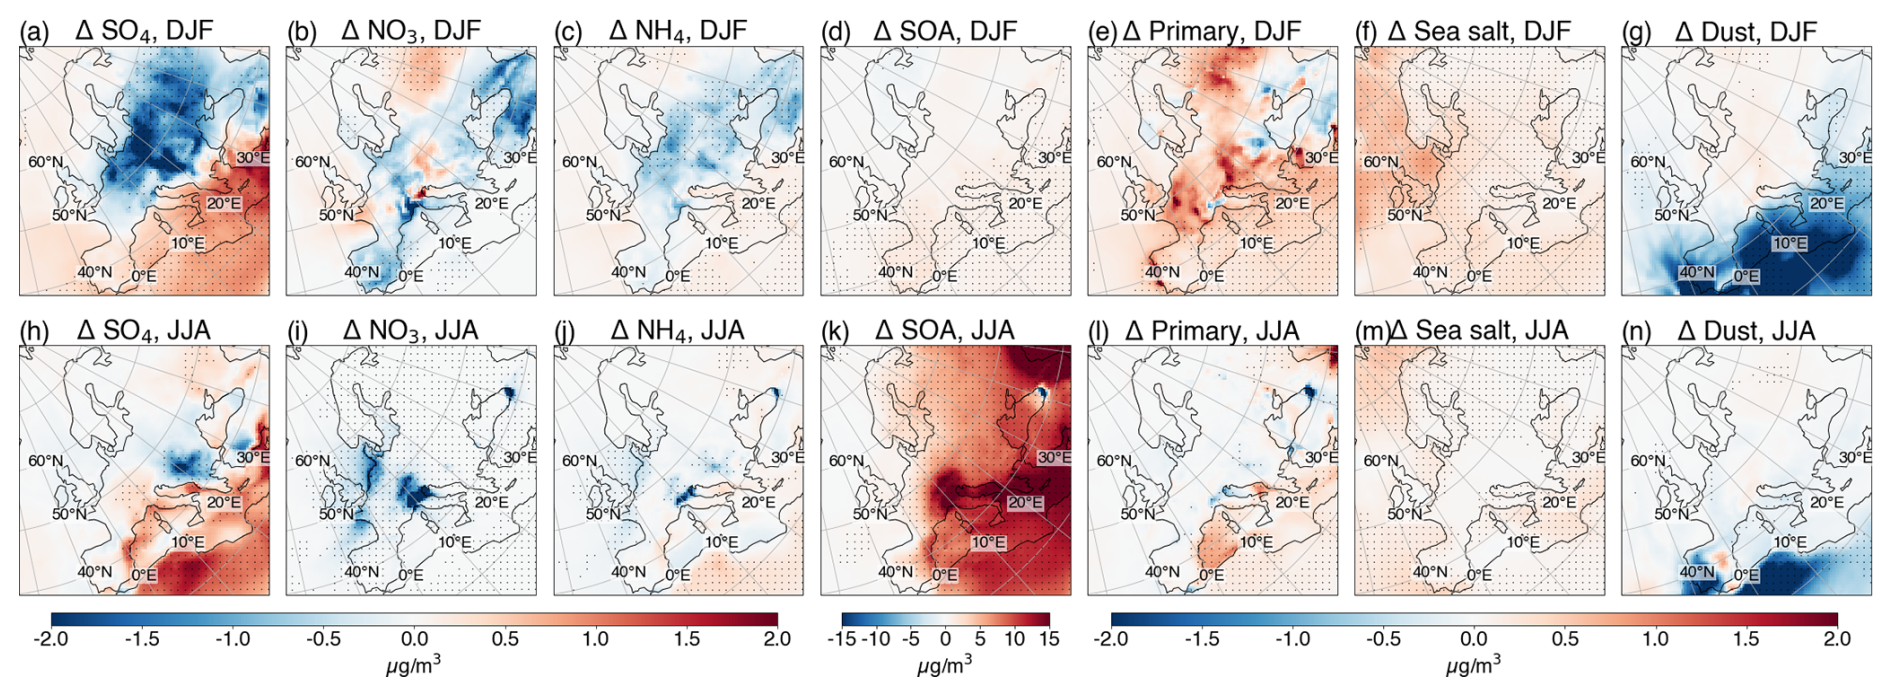
Figure 5Top panels show changes in spatial distribution of PM2.5 components in winter due to climate change: (a) sulphate (SO4), (b) nitrate (NO3), (c) ammonium (NH4), (d) SOA, (e) primary organic matter and elemental carbon, (f) sea salt and (g) desert dust aerosol, all in µg m−3 in future (2090–2099) compared with present day (1996–2005) conditions. The lower panels (h–n) show the corresponding changes in summertime. Statistically significant changes between the 10-year periods are indicated with dots (student t-Test with p value<0.05).
A key driver of winter changes in sulphate levels in the 2090s is changes in its deposition. Both wet deposition of sulphur dioxide (SO2) and dry deposition of SOx (SO2 + SO4) and increase prominently in winter over central Europe (Fig. A3a and b), whilst SO2 concentrations decrease significantly, and hence there is less sulphate formation. Greater washout of SO2 seems likely associated with higher precipitation over this region (Fig. 3c). In addition, the winter increase in mixing height may reduce sulphate aerosol levels at the surface (cf. similar spatial features Figs. 3b and 5a). Similar wet deposition (Racherla and Adams, 2006) and precipitation responses over continental land regions have been reported in previous studies (e.g., Allen et al., 2016). Other studies have noted winter sulphate decreases in Northern Hemisphere industrialised regions associated with oxidant limitation (Berglen et al., 2004; Shindell et al., 2009). As noted in Sect. 3.1, OH increases slightly in winter in the future (Fig. 2e), suggesting oxidant limitation does not worsen in the future. However, O3 is also important for in-cloud oxidation of SO2 to SO4 and lower O3 concentrations in winter suggest this could be important in limiting SO4 formation. In summer, the decreases in wet and dry deposition of SO2 and SOx respectively (Fig. A3e and f) over the Balkans coincide with lower sulphate concentrations (Fig. 5h), suggesting that deposition is not the main driver of this sulphate response. Under a warmer climate, an increase in sulphate loading could be expected as the oxidation of SO2 to sulphate is faster at higher temperatures. However, as both SO2 and OH (Fig. 2j) decrease in summer in this region, a reduced level of reactants may explain the sulphate decreases. Over the Mediterranean region, a combination of processes, such as faster oxidation with higher OH in eastern seas, seems likely to cause elevated sulphate aerosol concentrations in both seasons.
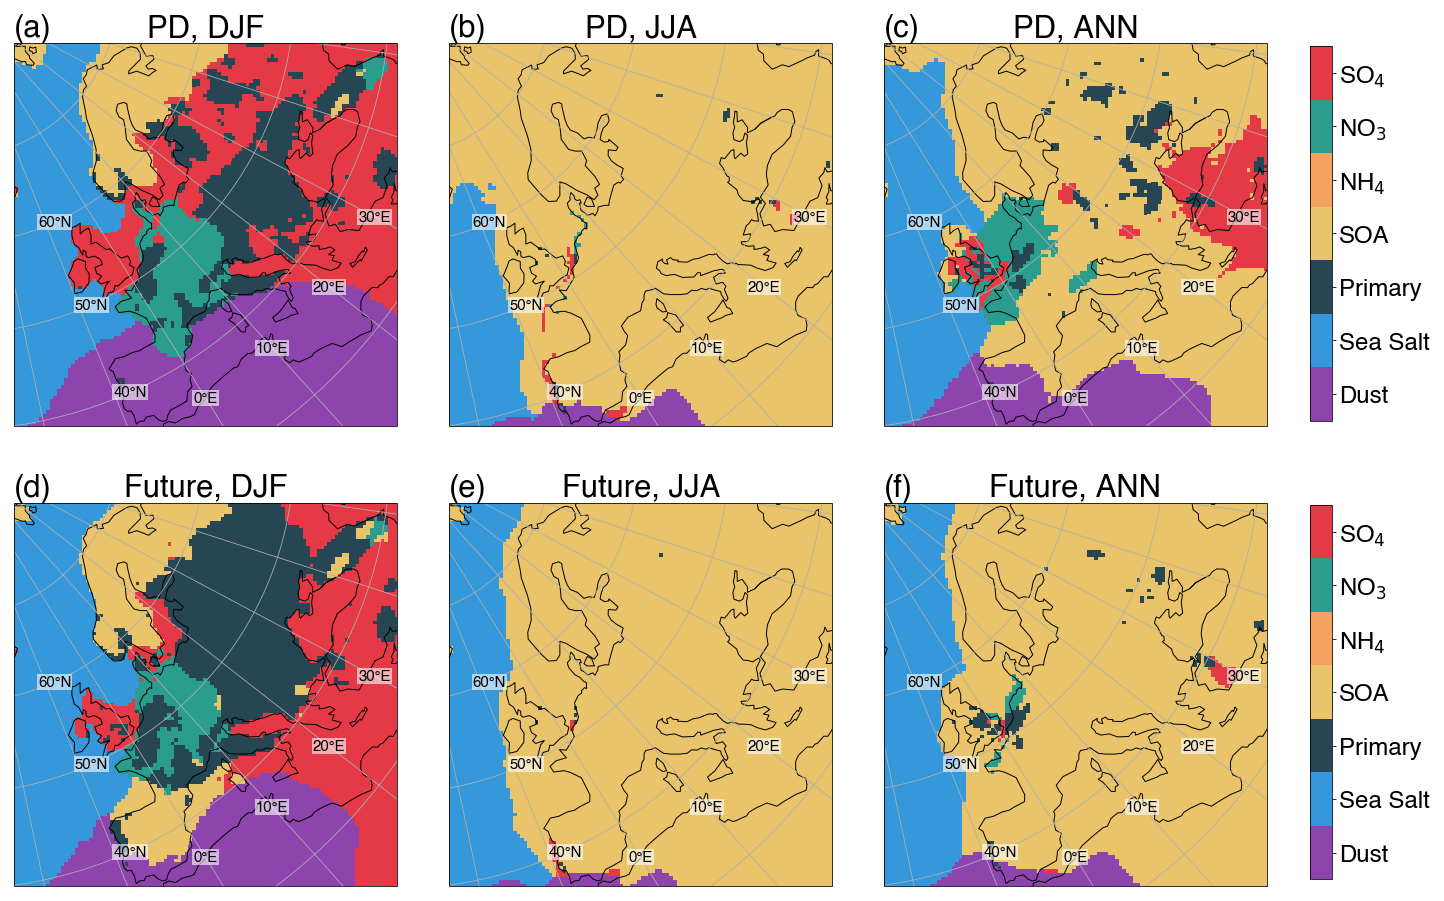
Figure 6Dominant components of PM2.5 for present-day (1996–2005) for (a) winter, (b) summer, (c) annual and for future (2090–2099), (d) winter, (e) summer, (f) annual.
The response of nitrate aerosol to climate change in winter is mixed across Europe but with more widespread decreases (0–1 µg m−3) than increases; in summer, nitrate decreases in some hotspot emissions source locations (Fig. 5b and i). In the future, dry deposition of oxidised nitrogen increases over the European continent in winter; with a more mixed response in summer (Fig. A3c and g). Wet deposition of nitric acid (HNO3) is similarly influenced by climate-driven changes in precipitation in winter but only increases slightly over central and northern Europe and decreases elsewhere (Fig. A3d). Hence winter nitrate decreases across Europe seem influenced mainly by dry deposition increases than wet deposition responses. The response of this semi-volatile species to climate change may also be driven by enhanced partitioning into the gas phase with higher temperatures in both winter and summer reducing nitrate aerosol concentrations, as noted in other studies (Dawson et al., 2007; Pye et al., 2009). Ammonium concentrations also decrease (up to 1 µg m−3) mostly strongly in winter over the European continent (Fig. 5j) reflecting concomitant reductions in sulphate and nitrate aerosol loadings.
SOA shows by far the largest and most widespread summertime increase across Europe of all the PM2.5 components (>5 µg m−3) in the 2090s driven by the response of its natural isoprene and monoterpene precursor sources to climate change (Fig. 5k). Increases are also found in winter across continental Europe that are largest over western Europe (up to 2 µg m−3). Primary PM2.5 sources are also influenced by climate change. There are notable wintertime future increases in primary fine organic matter and fine elemental carbon concentrations in source regions which can be related to reductions in precipitation over certain regions (cf. Figs. 3c and 5e), but little change in summer.
Sea salt and dust, that contribute a small fraction of their mass to PM2.5, are sensitive to changes in wind speed and transport patterns. Sea salt aerosol loadings increase slightly in the future (up to 0.5 µg m−3 across Europe) whilst desert dust from the Sahara strongly decreases (by more than 2 µg m−3) in both seasons in the future (Fig. 5f, g and m, n). Both components primarily affect oceanic and maritime regions. These modified distributions in sea-salt and dust aerosols can be explained by changes in wind speed under RCP8.5 in the 2090s. Wind speeds generally increase by up to 1 m s−1 in the Atlantic in both seasons and by >2 m s−1 polewards of 60° N in winter, aiding sea-salt aerosol formation; whilst wind speeds are reduced over the Mediterranean in both seasons, hindering Saharan dust transport (by up to 1 m s−1; Fig. A4c and f). Similar responses were seen in a study by Turnock et al. (2022) under SSP3-7.0, which found enhanced sea salt aerosols in maritime parts of northern Europe and a reduction in fine dust aerosol across North Africa.
Primary organic matter and elemental carbon replaces sulphate (and to a lesser extend nitrate) to become the dominant component of wintertime PM2.5 in the 2090s over central northern Europe (Fig. 6a and d). Across the Iberian Peninsula SOA replaces dust as the dominant winter PM2.5 component (Fig. 6a and d). In summer, across all of continental Europe, SOA remains the dominant PM2.5 constituent in the future, whilst over certain oceanic locations (e.g., the Atlantic), the spatial dominance of Saharan dust decreases, and that of sea-salt increases in the future (Fig. 6b and e). Considering annual average PM2.5, the most evident changes are an increase in SOA as the dominant PM2.5 component driven by the reduction in sulphate over Central Europe, the reduction in nitrate and sulphate over the North Sea and the reduction in Saharan dust over the Iberian Peninsula (Fig. 6c and f).
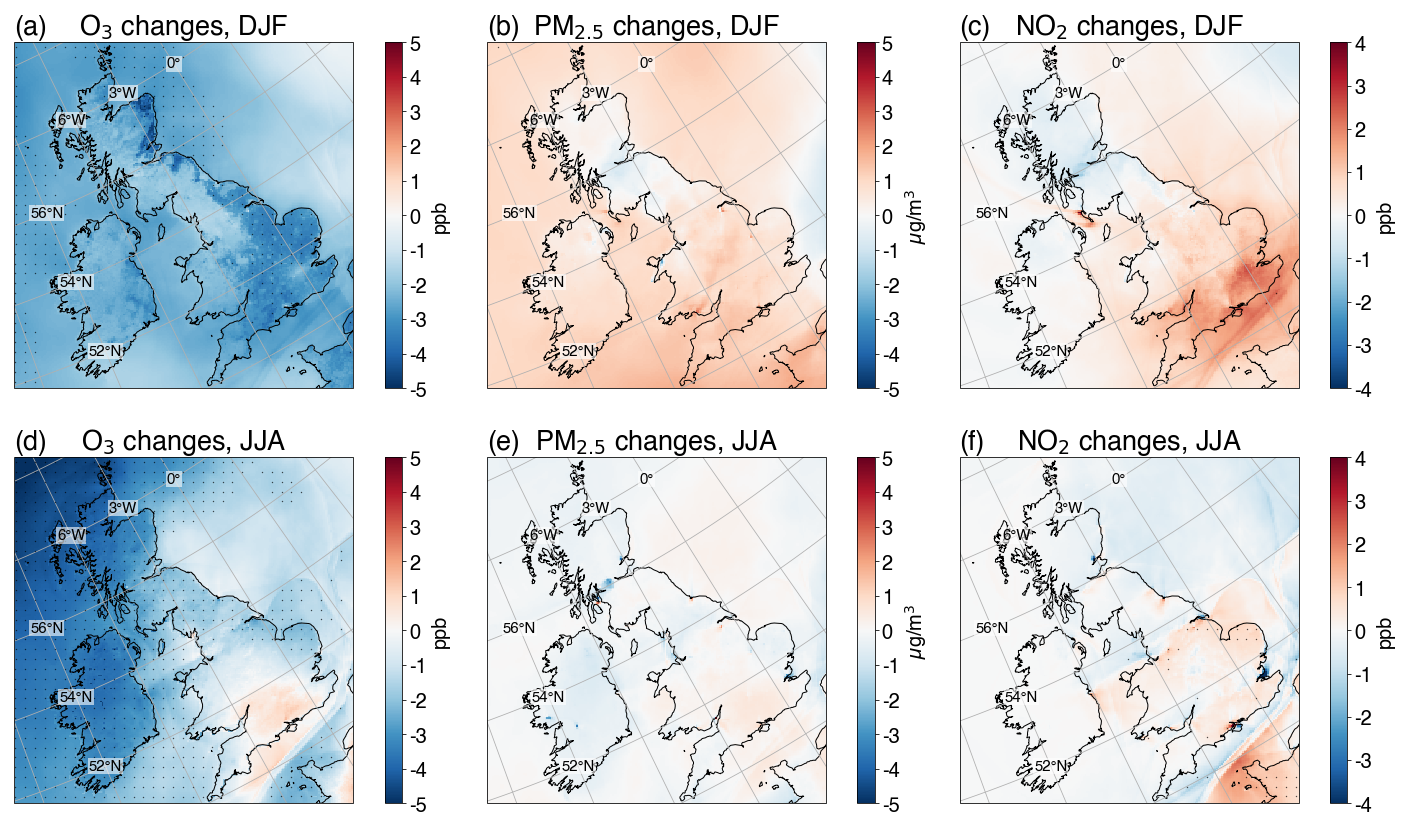
Figure 7Top panels show changes in winter due to climate change in (a) surface O3 mixing ratios (ppbv) (b) surface PM2.5 concentrations (µg m−3) (c) surface NO2 mixing ratios (ppbv) from EMEP4UK over the UK domain at 5 km×5 km resolution in future (2090–2099) compared with present-day (1996–2005). The lower panels (d–f) show the corresponding changes in summertime. Statistically significant changes between the 10-year periods are indicated with dots (student t-Test with p value<0.05).
This section examines simulated surface O3 and NO2 mixing ratios and PM2.5 concentrations across the UK from the finer-scale regional EMEP4UK model at 5 km resolution. It then compares the seasonal cycles of these air pollutants between EMEP4UK and the street-scale ADMS-Urban models and examines the diurnal variation of these species simulated by ADMS-Urban over London.
4.1 UK distributions
The finer-scale 5 km×5 km simulations show significant surface O3 decreases across the UK of ∼2–4 ppbv in winter in the 2090s compared to the 2000s with the largest decreases over eastern parts of the UK (Fig. 7a). Surface O3 decreases of a similar magnitude occur in summer, except in the southern UK (including London) where there are O3 increases of up to 1 ppbv in future (Fig. 7d). These patterns of change are similar to those seen in the European 50 km×50 km resolution model domain in Fig. 2a and f; and largely due to background O3 reductions. The magnitudes of winter and summer mean O3 simulated over the UK at the finer resolution are about 2 ppbv (∼5 %) higher than at the coarser resolution (Table A2). However, the reductions between present-day and future climate (∼5 ppbv in DJF and 3 ppbv in JJA over the UK) at the two resolutions are only very slightly different (0.1/0.4 ppbv in DJF/JJA; Table A2). The magnitudes of the O3 decreases are consistent with estimates of annual-average reductions from global models by Zanis et al. (2022), as reported in RS (2021), although Colette et al. (2015) report smaller summer O3 decreases, likely due to the larger areal extent of their UK region that includes surrounding oceans.
Surface PM2.5 concentrations simulated within the 5 km×5 km UK domain increase moderately in winter over much of the UK (∼1–2 µg m−3) and show smaller (up to 1 µg m−3) but mixed responses for summer with slight increases over southernmost UK in the future (Fig. 7b and e). These patterns of changes again resemble those simulated over the UK with the 50 km×50 km European domain (Fig. 2c and d). However, these changes are not statistically significant at the 95 % confidence level. In both seasons, the magnitudes of PM2.5 simulated over the UK at the finer 5 km resolution are slightly lower (up to 2.1 µg m−3; ∼10 %) than at the coarser 50 km resolution, and the changes between present-day and future (∼0.8 µg m−3 in DJF and 0.1 µg m−3 in JJA over the UK) from the two resolutions for winter/summer differ marginally (∼0/0.3 µg m−3; Table A2).
Surface NO2 increases by ∼2 ppbv in winter over the southern UK and the English Channel, but changes elsewhere in the UK are small (Fig. 7c and f). Smaller and mixed NO2 responses are seen in summer. These differences are generally not statistically significant. Like the other two air pollutants, the patterns of NO2 changes are very similar to those simulated at the coarser resolution, with the magnitudes slightly lower (∼1 ppbv; ∼5 %; Table A2) as found for PM2.5 changes at the coarser resolution.
In summary, differences in horizontal resolutions employed by EMEP4UK model do not seem to influence the patterns, and only minorly influence the magnitudes, of changes in simulated concentrations of surface O3, PM2.5 and NO2 between present-day and future. To provide context to our results, the impact of model structural uncertainty on O3 and PM2.5 climate change projections over the UK region is also assessed, using results from three to five global-scale models from Zanis et al. (2022) as presented in RS (2021). In this study, the impact of climate change was evaluated for a baseline SSP3-7.0 anthropogenic emissions scenario for simulations with SSTs for present-day compared to SSTs for SSP3-7.0 for the 2090s. The summer mean surface O3 response to climate change over the UK is −2.4 ± 1.1 ppbv across the five models (Table A2). These multiple global-scale earth system model results suggest structural uncertainty in projected surface O3 mixing ratios is greater than the uncertainty associated with spatial resolution identified using EMEP4UK e.g., that shows a summer O3 response of −2.8 ppbv at 50 km and −3.2 ppbv at 5 km resolution (Table A2). Annual-average PM2.5 concentrations across the three models reduces slightly but the standard deviation is substantial (−0.14 ± 0.18 µg m−3, Table A2). The structural uncertainty in annual-mean PM2.5 projections associated with the three global models used in Zanis et al. (2022) appears considerably larger than the uncertainty associated the spatial resolution of the EMEP4UK model over the UK (which exhibits an annual-mean PM2.5 response to climate change of 1.4 µg m−3 at 50 km resolution and 1.1 µg m−3 at 50 km resolution). However, the underlying emissions used in Zanis et al. (2022) are very different to this study, and the UK regional extent is somewhat larger (and includes the surrounding ocean) than used in this study, hence only a qualitative comparison is possible.
4.2 Regional- and urban-scale seasonal cycles for London
To explore the changes in key pollutants at an urban scale, concentrations at 56 receptor sites representing UK reference air quality measurement network locations across London are considered. Statistics based on these 56 locations for the ADMS-Urban model, are compared these with those from 10 model grid cells that span these locations from the EMEP4UK model simulations at 5 km×5 km resolution. Surface O3, PM2.5 and NO2 distributions across London from both models are shown in Fig. 8, and median values are summarised in Table A3.
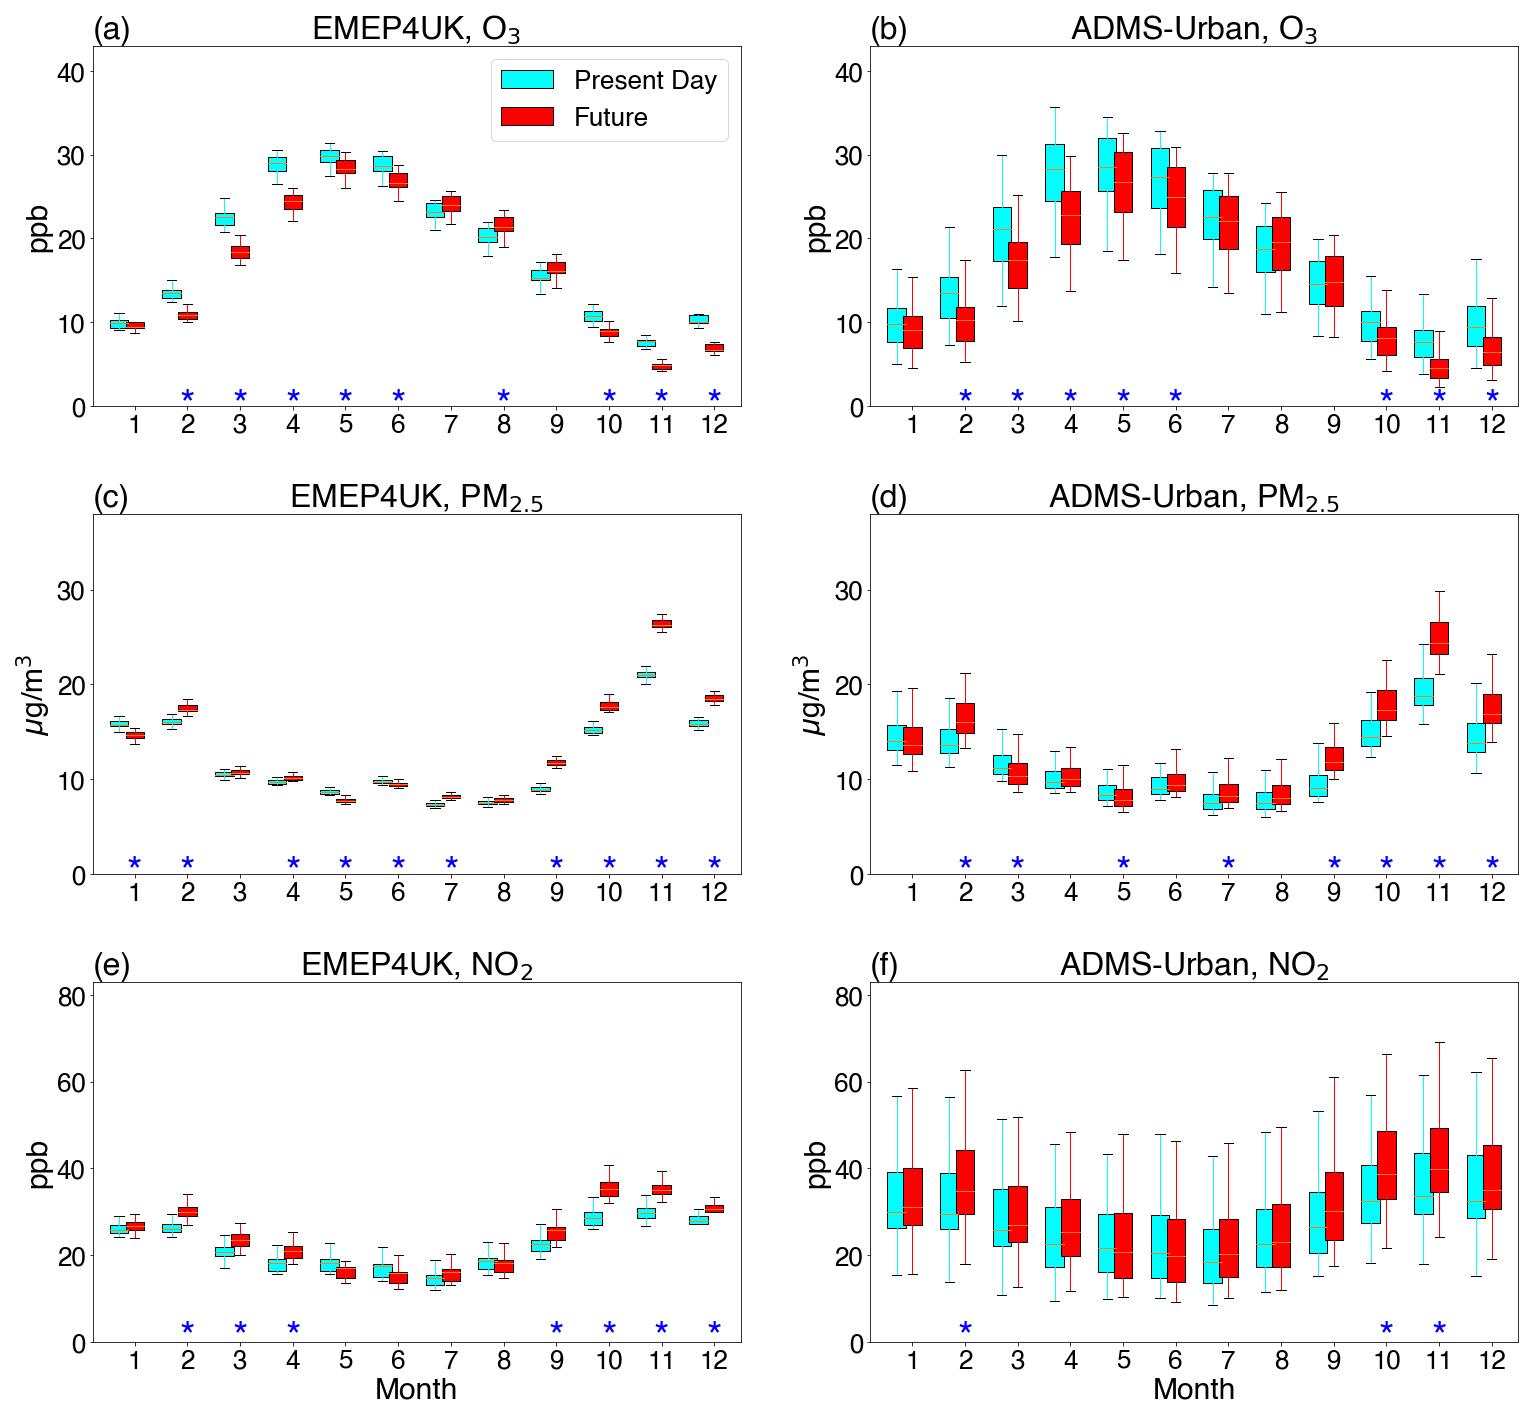
Figure 8Seasonal cycles for present-day and future across London from EMEP4UK and ADMS-Urban for (a, b) surface O3, mixing ratios (ppbv) (c, d) PM2.5 concentrations (µg m−3) and (e, f) NO2 mixing ratios (ppbv) respectively. Monthly mean values, calculated as averages over the respective 10-year periods for each of 10 EMEP4UK grid boxes and 56 ADMS-Urban locations, are used to produce spatial statistics represented by box (the interquartile range) and whisker plots. The blue ⋆ denotes months where surface distributions are significantly different between present-day and future according to a student t-Test with a p value<0.05.
The seasonal cycles of O3 across London, from both the regional and urban street-scale models, have very similar amplitudes of ∼20 ppbv; with the lowest median mixing ratios in winter of ∼10 ppbv and highest in spring/summer of ∼30 ppbv (Fig. 8a and b). Differences in magnitudes of present-day values between the two models are relatively small (less than 1.5 ppbv; Table A3) and differences in future changes are also small (0.1–0.9 ppbv). To assess model performance of simulated seasonal cycles relative to observations; monthly O3, PM2.5 and NO2 distributions were calculated using data from the Hood et al. (2018) study, which employed the same set-up as used here, enabling a direct comparison for the year 2012. The amplitudes of the median values of surface O3 seasonal cycles for both models are also ∼20 ppb in 2012, which is an overestimate compared to observations of ∼16 ppbv, arsing from a smaller spring/summer peak (Fig. A5, Table A4). Differences in magnitudes between the two models are also small (1–3 ppbv) for 2012 (Table A4).
In the future, O3 mixing ratio decreases (Sect. 4.1) are largest in November and December, up to ∼3 ppbv for both models. Surface O3 over London has a springtime peak, and the amplitude of this decreases significantly in future by up to 5 ppbv in April in both regional and urban-scale model simulations. This is in agreement with global model results for northern Europe by Schnell et al. (2016), who also noted changes in climate-sensitive BVOC precursor emissions could also impact seasonal cycles. In all months except January, July and September (and August for ADMS-Urban) surface O3 distributions simulated by the two models differ significantly between present-day and future.
Both models simulate an autumn/winter peak in the seasonal cycles of PM2.5 concentrations across London (median values ∼20 µg m−3 in November and ∼15 µg m−3 in December/January) which significantly increases in the future by as much as 5 µg m−3 in November (Fig. 8c and d; Table A3). For the year 2012, observations show the wintertime peak in PM2.5 concentrations occurs later in February/March and this timing is captured by the two models, but the maxima are substantially underestimated (by 13 µg m−3; Fig. A5; Table A4), which Hood et al. (2018) attribute to underestimated regional contributions. There are fewer sites available for evaluation of PM2.5 concentrations and over 50 % of these are near road sites which may be more challenging to simulate than background and rural locations. In spring and summer, median surface PM2.5 concentrations (7–11 µg m−3) only marginally change in the future. Comparing the two models, differences in both present-day values (up to 2 µg m−3 between November–February) and present-day and future changes (less than 1.1 µg m−3) are small; in agreement with results for 2012. A previous street-scale modelling study for London using the ADMS-Urban model found different results because they neglected the processes affecting background O3 (Athanassiadou et al., 2010).
NO2 seasonal cycles also exhibit an autumn/winter peak (median value of ∼30 ppbv in November) for both models with median values between 15–26 ppbv in other seasons (Fig. 8e and f; Table A3). Unlike for O3 and PM2.5, median monthly NO2 values are consistently 3–5 ppbv higher (∼15 %) for the ADMS-Urban compared to the EMEP4UK model. This difference is likely to be due to the inclusion of near-road locations in the ADMS-Urban model, where NO2 concentrations are strongly influenced by NOx emissions from the nearest road. For 2012, seasonal cycle peak and amplitude values for NO2 are similar to those for the present-day period; median values are also higher for ADMS-Urban and in good agreement with observations (Fig. A4; Table A4). In the future, the largest increases in NO2 mixing ratios, exceeding 4 ppbv for both models, occur in October, November and February and are statistically significant in both models.
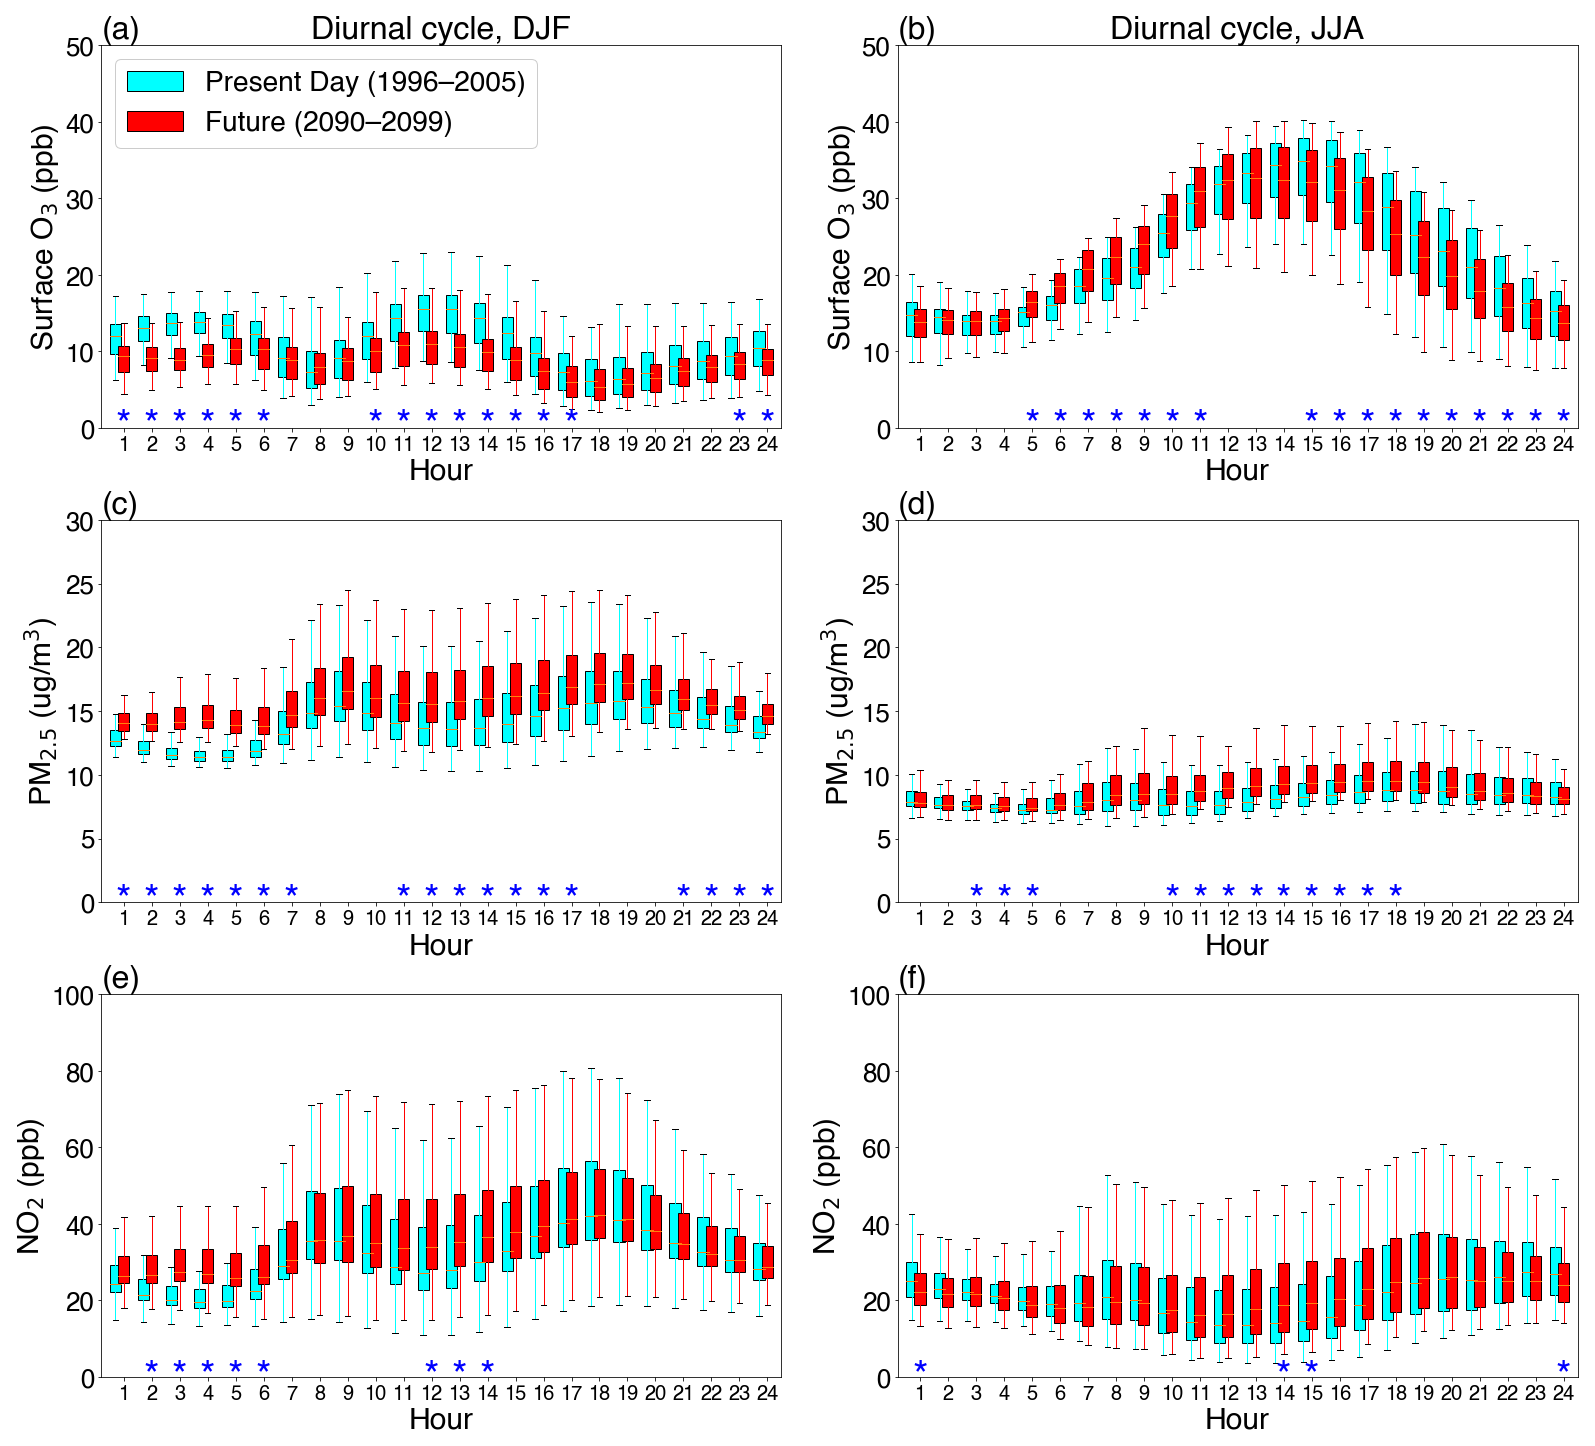
Figure 9Diurnal cycles for present-day and future from ADMS-Urban for (a, b) surface O3 mixing ratios (ppbv) (c, d) PM2.5 concentrations (µg m−3) and (e, f) NO2 mixing ratios (ppbv) for winter and summer respectively for London over 56 ADMS-Urban receptor locations sites. Data are hourly mean values averaged over the respective 10-year periods at each location to produce box (interquartile ranges) and whisker plots depicting the spatial variation across London. ⋆ Denotes months where surface distributions are significantly different between present-day and future according to a student t-Test with a p value<0.05.
Overall, the magnitudes of the median monthly concentrations, and changes between present-day and future, are in good agreement between both models for all three air pollutants, although NO2 values are higher. However, considerably larger spatial variability across the 56 locations is simulated by the urban street-scale (ADMS-Urban) model compared to the 10 fine-scale EMEP4UK regional model grid cells, and this is most prominent for NO2. This is also the case for the year 2012, where the spatial variability simulated using the ADMS-Urban model is similar to (for NO2) or smaller (for O3 and PM2.5) than for the observations. There are also fewer months with significant differences between present-day and future distributions simulated for all three air pollutants simulated by the street-scale model as compared to the high-resolution regional model. The sensitivity of the street-scale model outputs to the number of sampling sites employed was examined by randomly sampling 10 of the 56 locations to produce distributions for London. Small changes between the results for 10 compared to 56 locations were found. This finding adds confidence to the conclusion that the street-scale simulation exhibits larger spatial variability in air pollutant concentrations, that agrees well with the observed spatial variability for 2012, due to its ability to explicitly represent road emissions sources as compared to the grid-box representation in the regional model that can lead to the dilution of emissions.
4.3 Urban-scale diurnal cycles for London
The diurnal variation in surface O3, PM2.5 and NO2 concentrations simulated at 56 locations across London with the street-scale model is shown in Fig. 9. The diurnal cycle of surface O3 mixing ratios is much more pronounced in summer than in winter due to longer daylight hours and higher temperatures increasing its photochemical formation, with daytime median values exceeding 30 ppbv between 12:00 and 17:00 LT, and nighttime median values below 15 ppbv for present-day (Fig. 9b). In winter, the diurnal variation of surface O3 is much flatter than in summer, with a slight afternoon peak (median value ∼15 ppbv at 12:00–13:00 LT) and evening to nighttime median levels of 6–13 ppbv (Fig. 9a). Across the 56 locations, the largest variability occurs in summer during afternoon to early evening hours (up to 10 ppbv for the interquartile range). The close agreement between the simulated ADMS-Urban and observed diurnal cycles for 2012, that capture the key features described above, is evident in Fig. A6. The greater ability of the ADMS-Urban urban model to capture O3 diurnal cycles for London as compared to the regional EMEP4UK model has been highlighted by Hood et al. (2018). A statistically significant decrease in winter surface O3 in the future is apparent for early morning and afternoon hours. In summer, surface O3 is significantly higher by up to 3 ppbv in the morning but significantly lower by up to 4 ppbv in the afternoon and evening in the future. This leads to a small shift in the diurnal cycle of summertime surface O3, with the peak occurring about one hour earlier, although the amplitude of the diurnal cycle remains very similar.
For surface PM2.5 concentrations the diurnal variation in both seasons is relatively small with median concentrations between 11–16 µg m−3 in winter and ∼8 µg m−3 in summer for present-day (Fig. 9c and d). The spatial variability across the 56 locations is largest for winter daytime hours (up to 4 µg m−3 for the interquartile range). The underestimate in simulated PM2.5 concentrations compared to observations, as noted in Sect. 4.2, is apparent in these diurnal cycles (Fig. A6). Higher median wintertime levels (by up to 3 µg m−3) are evident at all times of day in the future, with statistically significant differences between present-day and future for most hours (Fig. 9c). Additionally in winter, PM2.5 increases are considerably larger at night-time leading to reduced diurnal variability in the future, with similar spatial variability. Summertime median levels are slightly higher during daytime with significant increases between 10:00 and 18:00 LT of about 1 µg m−3 in the future.
The diurnal variation of NO2 mixing ratios is similar to that of PM2.5 concentrations in winter, highlighting similar anthropogenic emissions sources, but is more pronounced with median values around 20 ppbv between 02:00–05:00 LT and increasing at 07:00 LT and from 15:00 LT, reaching 42 ppb at 18:00 LT for present day (Fig. 9e and f). Summer NO2 mixing ratios additionally exhibit an early afternoon dip, likely related to the surface O3 peak. In both seasons there is substantial spatial variability, notably for daytime hours, across the 56 locations (up to 20 ppbv for the interquartile range) driven by differences in dispersion reflecting the differing proximities of the sites to road NOx emissions sources (as noted in Hood et al., 2018). Observed and modelled NO2 diurnal cycles for 2012 agree well (Fig. A6). In the future, larger significant winter NO2 increases (median values up to 7.6 ppbv) in the early morning lead to a flatter distribution, although significantly higher NO2 also occurs in early afternoon (Fig. 9e and f). In the summer, significant higher mid-afternoon NO2 values also cause a flattened distribution in the future. The spatial variability for NO2 across the 56 locations is similar for the two time periods. Fewer hours show statistical differences between present-day and future for NO2, as compared to O3 and PM2.5, again due to the dominance of unchanged road emissions in NO2 concentrations.
The broad changes in the diurnal cycles of surface O3, PM2.5 and NO2 concentrations are consistent with the changes in the described in Sect. 4.2 for the seasonal cycles of these air pollutants. Here, the effect of night-time/early morning changes in winter for the three air pollutants, and changes either side of peak levels for summer O3 is additionally highlighted Distributions of winter O3, and PM2.5 and NO2 in both seasons, flatten in the future.
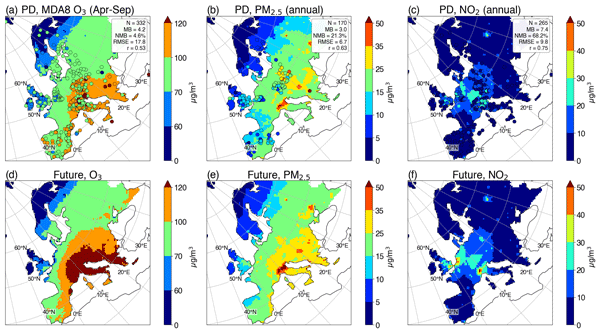
These regional and street-scale results can be used to evaluate the likelihood of achieving the latest WHO air quality guidelines (AQG; WHO, 2021), under the RCP8.5 climate change signal as compared to present-day. These guidelines are based on two averaging periods to reflect the health effects associated with both acute and chronic exposures to air pollutants. For long-term exposure, peak season daily maximum 8 h mean (MDA8) values are used for O3 and annual mean concentrations for PM2.5 and NO2. Short-term exposures utilise the 99th percentile value of MDA8 for O3 and the 24 h mean for PM2.5 and NO2. Interim target values towards achieving these more stringent air quality levels are also outlined. For present-day and future, long-term exposures are evaluated across Europe whilst short-term exposures are assessed for London – as hourly outputs are only retained from the ADMS-Urban model simulations for this study. For peak season O3 results over Europe (Fig. 10), MDA8 was estimated based on fitting a relationship between MDA8 and daily maximum and daily mean O3 (the EMEP4UK outputs available) over London as follows:
MDA8 . To assess the sensitivity of the results, long-term and short-term metrics are also calculated from available observations for 2012 (and for 1996–2005 for short-term metrics for London).
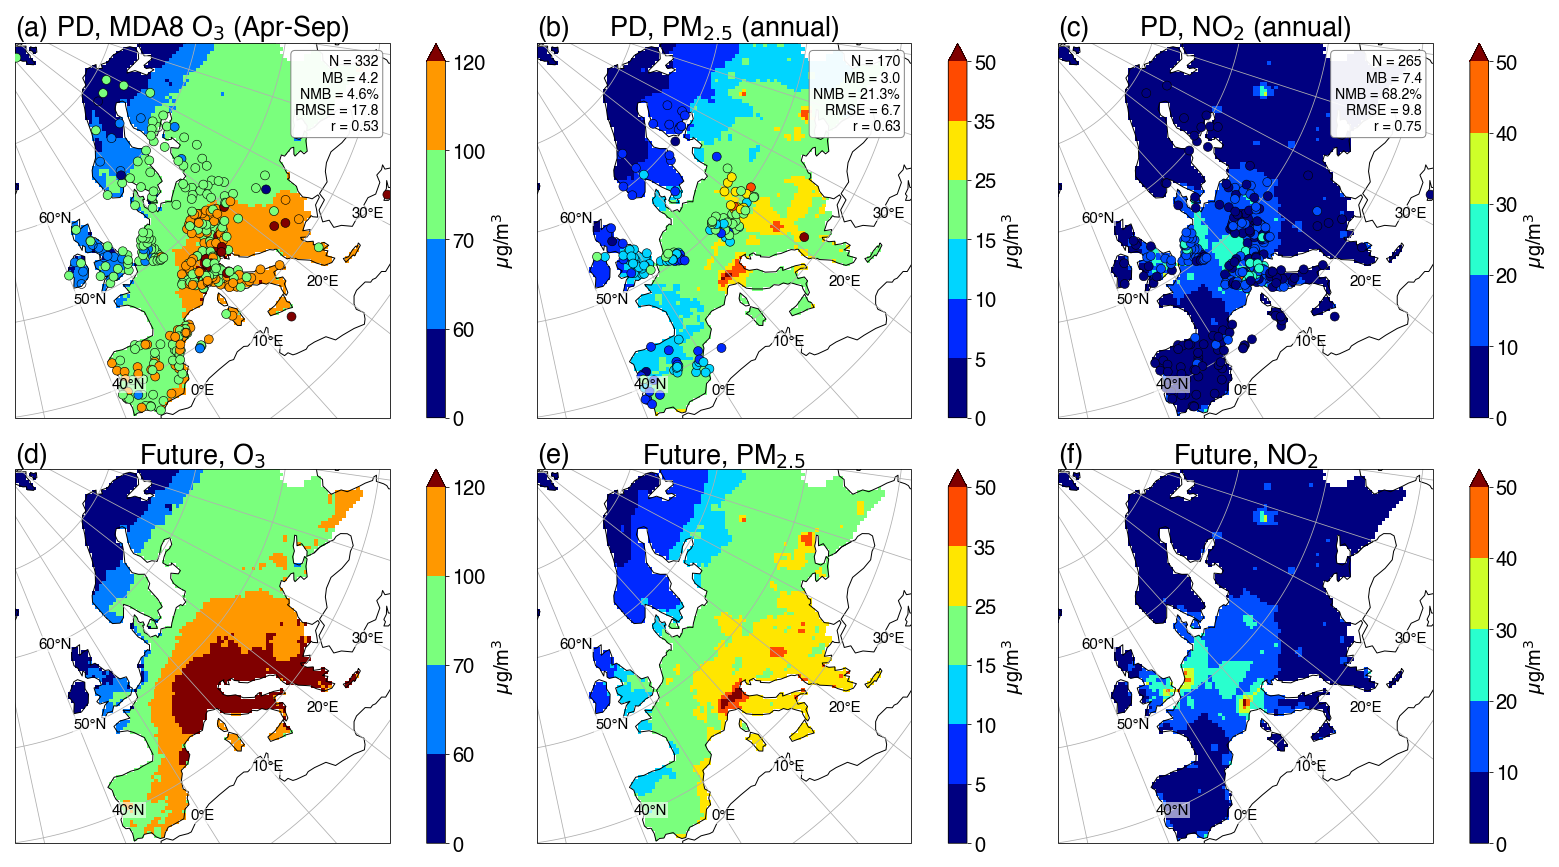
Figure 10(a) Peak season (April to September) daily maximum 8 h average (MDA8) O3 and annual average (b) PM2.5 (c) NO2 concentrations for present-day (1996–2005; with 2012 anthropogenic emissions) and (d) MDA8 O3 and annual average (e) PM2.5 and (f) NO2 concentrations for future (2090–2099) calculated from monthly mean values for each year averaged over the respective ten-year periods from EMEP4UK (European domain). Scales depict interim target values and the air quality guidelines for each of these air pollutants. For MDA8 O3 interim targets are 100 and 70 µg m−3and the air quality guideline (AQG) is 60 µg m−3. For PM2.5 interim targets are 35, 25, 15, 10 µg m−3 and the AQG is 5 µg m−3. For NO2 interim targets are 40, 30, 20 µg m−3 and the AQG is 10 µg m−3 (see WHO, 2021). Panels (a–c) include summary model-observation comparison statistics at rural observation site locations (O3, NO2) and background sites (PM2.5) for year 2012. Note the PM2.5 statistics are the same as in Fig. 1. N: number of sites included in comparison; MB: mean bias; NMB: normalised mean bias; RMSE: root mean square error; r: correlation coefficient.
The immediate and future challenges for Europe, and especially southern Europe, to attain these interim targets and guidelines for long-term O3 exposure based on the regional model simulations are clear. The peak season first interim target is largely met except over southern Europe but the second interim target is only achieved in northernmost Europe, whilst the AQG is only met in northern Scandinavia and a few locations in the UK and Benelux region (Fig. 10a). The model-observation comparison shows peak season MDA8 O3 across 332 rural sites is slightly overestimated (MB=4.2 ppbv; NMB=5 %; RMSE=17.8; Fig. 10a), although the MB is less than the difference between successive AQG targets. This MDA8 O3 overestimate is most notable in small area of southern Europe that has the highest simulated MDA8 O3 values, suggesting that here the first interim target may have been met in the year 2012. However, MDA8 O3 is underestimated over the UK and northern Scandinavia, suggesting fewer locations meet the second interim target in the year 2012.
In the future, fewer areas of continental Europe meet the first interim target and smaller parts of northern Europe meet the second interim target (Fig. 10d). As for present-day, the AQG value of 60 µg m−3 is only met in parts of northernmost Europe in the future. However, the areal extent of attainment of this air quality guideline value expands and extends to larger parts of the UK, due to background surface O3 decreases within parts of this region. Examining extreme O3 episodes (87th percentile), Schnell et al. (2016) found qualitatively similar results with higher O3 levels, implying less attainment of these air quality guidelines in the future under RCP8.5 for southern Europe for 3 out of 4 global models; as well as small reductions in percentile values, aiding attainment of air quality guidelines, for northern Europe.
For PM2.5, for present-day, the first interim target is met across Europe except in a few hotspot regions, and the second interim target is also largely achieved (Figs. 1c and 10b). In contrast, much of continental Europe does not meet the third interim target for present-day in these simulations. Very limited parts of Scandinavia and the UK meet the fourth interim target and even fewer locations achieve the 5 µg m−3 AQG (Fig. 10b). The summary evaluation results for annual-average PM2.5 concentrations (Fig. 10b, as in Sect. 3.1) outline a MB of 3 µg m−3 over 170 rural and background sites, which is also smaller than the difference between successive AQG targets. Overestimates in PM2.5 concentrations are most prominent for the Iberian Peninsula suggesting greater attainment of the third and lower interim targets at these locations in 2012; whilst in parts of central Europe and the UK PM2.5 underestimates may reflect lesser regional attainment of interim targets/AQGs in these regions compared to observations for 2012. In the future, the first interim target remains largely achieved, fewer areas in southern and Central Europe achieve the second interim target, the third interim target is exceeded across almost all of continental Europe, less of Scandinavia achieves the 4th interim target and only northernmost Scandinavia meets the air quality guideline (Fig. 10e).
Table 2Short-term 99th percentile values of MDA8 O3, and 24 h mean PM2.5 and NO2 calculated annually from hourly data for the respective present-day and future 10-year periods for each of the 56 locations over London. Mean values across all 56 locations are given in the 2nd column. The WHO short-term averaging period interim target and air quality guideline (AQG) values (WHO, 2021) are shown in bold. Exceedance days per year are calculated over the full 10-year period and divided by 10 to estimate exceedance days per year for the WHO interim target values and the relevant air quality guideline value (rightmost column). The spatial variation in exceedance days across the 56 locations are represented by the standard deviation.
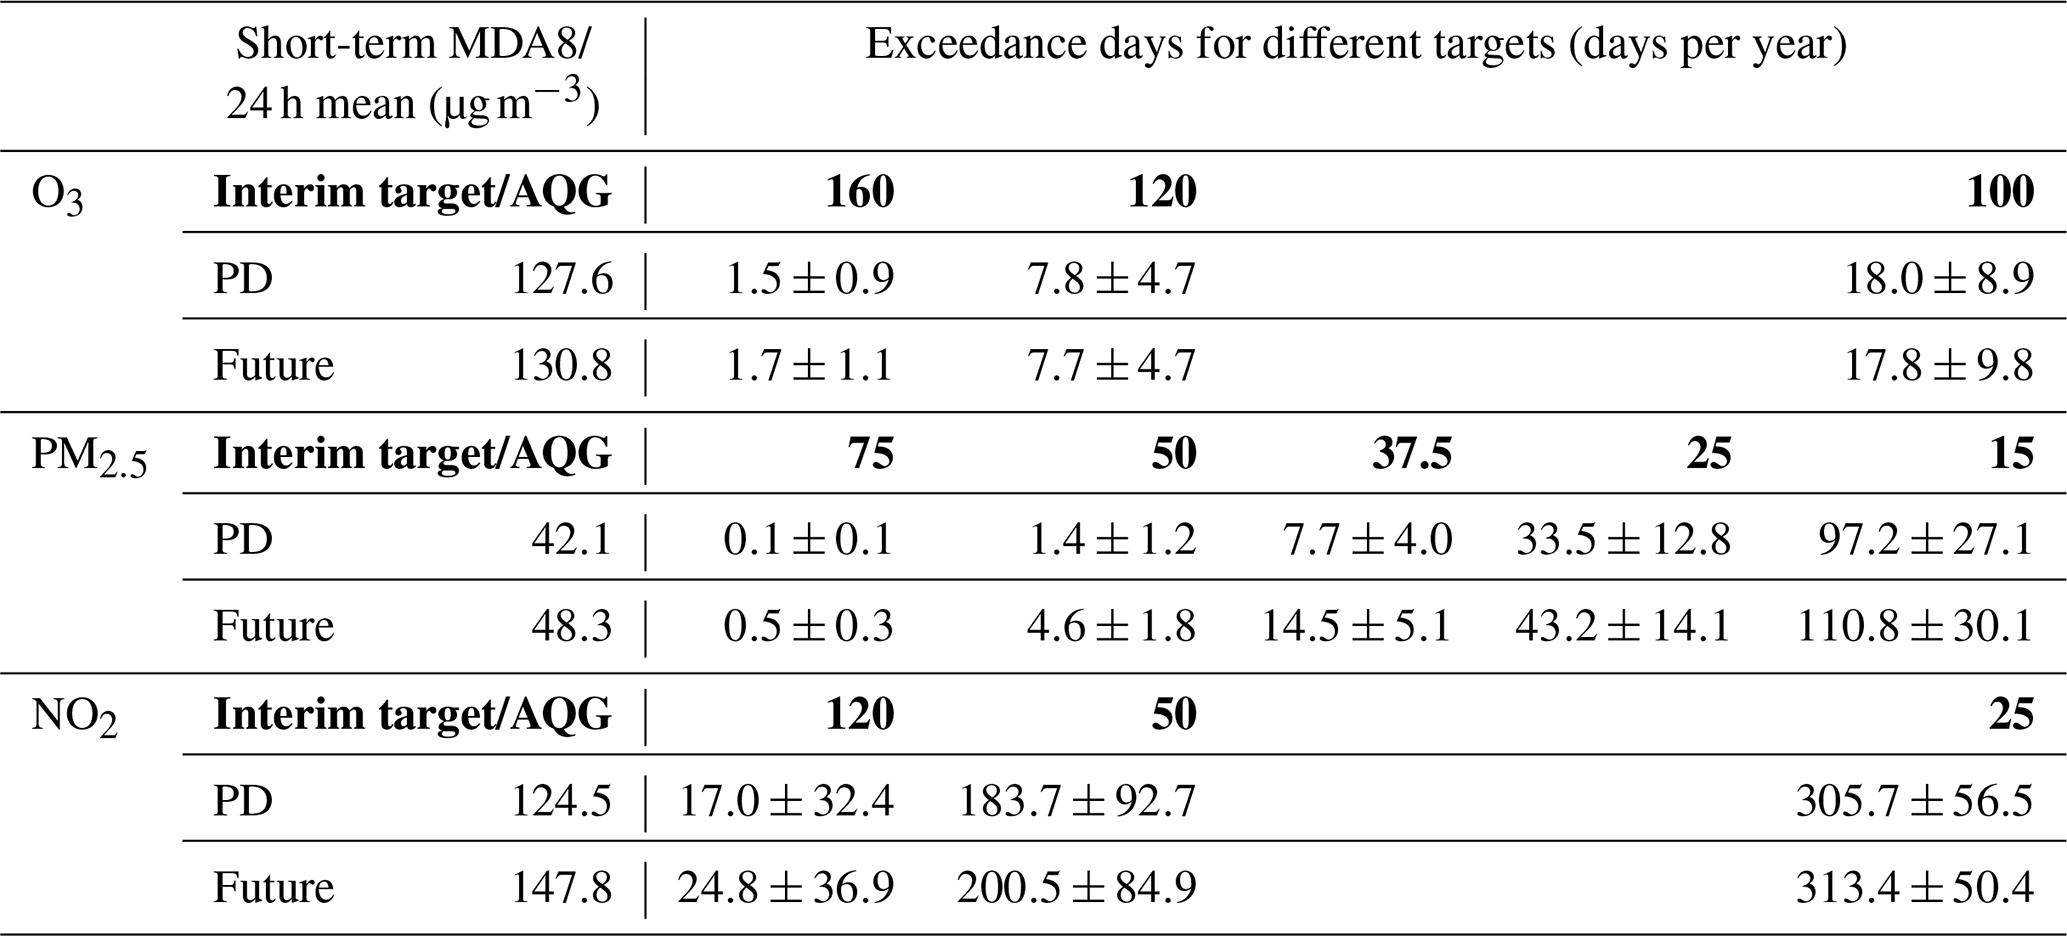
For NO2 for present-day and future the spatial patterns are very similar; the first and second interim targets are achieved everywhere except in a few hotspot locations such as in the Po valley and the Netherlands (evident in Fig. 10f). The third interim target is also largely met except in parts of western and central Europe and the southern UK. Much of western, easternmost and northern Europe achieve the NO2 air quality guideline, but western-central Europe does not. Differences in attainment of this air quality guideline between present-day and future are small (Fig. 10f) due to large anthropogenic contribution to NO2 levels. Annual average simulated NO2 is overestimated compared to observations at 265 rural sites (NB=7.4 µg m−3; NMB=68 %; RMSE=9.8; Fig. 10c). This may reflect influences of urban NOx emissions being included in the same model grid cells as the rural observation sites. The spatial correlation coefficient (r=0.75) is higher than for the other air pollutants which may reflect a stronger influence of anthropogenic emissions on the spatial distribution of NO2 given its shorter lifetime. However, the MB is less than the difference between successive AQG targets for NO2. The observations for 2012 suggest that NO2 concentrations at rural sites within these hotspot areas are overestimated. More locations in central Europe but fewer locations in western Europe meet the NO2 AQG. Overall, the current WHO air quality guidelines for long-term exposure to peak season MDA8 O3 and annual average PM2.5 are challenging to achieve across most of Europe in the present-day; based on the 2012 anthropogenic emission dataset employed in this study. They become increasingly difficult to achieve in the future under the effects of a changing climate except in a few northern locations, meaning that future mitigation of anthropogenic emissions will need to go further to achieve benefits to human health. As noted above, these findings are sensitive to anthropogenic emissions levels. For NO2, under these 2012 anthropogenic emissions, central Europe fails to achieve the long-term air quality guideline value, but the influence of climate change is small.
The influence of climate change under RCP 8.5 on achieving the WHO guidelines and interim targets for annual short-term exposure over London is shown in Table 2. To assess the robustness of these results for the present-day period, short-term metric values are also calculated from observations for 2012 and for the period 1996–2005 for background and near-road sites with available observations (which are fewer than the 56 sites used for the comparison with present-day ADMS-Urban simulations). Averaged over London, the 99th percentile MDA8 O3 value increases by 3 µg m−3 in the future (Table 2). For both periods, the first interim target is achieved, but the second interim target and the air quality guideline for short-term exposure are not met. Considering the 10-year periods, the first interim target is not met on ∼2 d, on average, while the AQG is not met on about 20 d for both present-day and future. There is close agreement in observational and model-derived results of the 99th percentile MDA8 O3 values in 2012 that show the first and second interim targets are met, while the AQG is exceeded on 7–8 d (Table A5). For 1996–2005, the first and second interim targets are met when using the observations, but the second interim target is not met with AMS-Urban model results. Although the magnitude of the short term MDA8 O3 metric is highly sensitive to the underlying emissions and meteorology, the overall result that the AQG is not met for the present-day period is consistent between datasets.
The 99th percentile of 24 h mean surface PM2.5 concentrations averaged over London suggest that the first and second interim targets are achieved for both time periods (Table 2). The number of exceedance days of the PM2.5 air quality guidelines increases from ∼97 d for present-day to ∼111 d in the future. The ADMS-Urban results underestimate 99th percentile 24-mean PM2.5 concentrations compared to observations in 2012 (as noted in Sects. 4.2 and 4.3), but overestimate this PM2.5 metric over 1996–2005. Observational-based estimates of the 99th percentile of 24 h mean PM2.5 concentrations for 2012 suggest the first but not the second interim target is met; whilst for 1996–2005 the first and second interim targets are met (Table A5). When utilising ADMS-Urban results, the third interim target is narrowly met for 2012, and for 1996–2005 the first and second interim targets are met. The number of exceedance days of the PM2.5 short-term AQG in 2012 is 115 d based on observations and 59 d when using ADMS-Urban results. As noted in Sect. 4.2, PM2.5 observations are limited over the present-day time period considered, with only 11 sites available for 2012 and only 1–2 sites available for 1996–2005. The short-term PM2.5 AQG is not met whichever dataset is used.
For NO2, the 99th percentile values averaged over London increase from 125 to 148 µg m−3 between present-day and future; both values exceed the first interim target for short-term NO2 exposure (Table 2). The air quality guideline is exceeded on ∼306 d for present day and ∼313 d in the future 10-year periods, with differences in exceedances of ∼50 d over the different London locations for both periods. These results are also found using observations for 2012, but when using observations over the 1996–2005 the first interim target for the 99th percentile values NO2 is met (Table A5). In all cases the number of exceedance days of the AQG is similar at between 300–310 d.
Hence, for the three air pollutants, the short-term air quality guideline values are not met for present-day or in the future when utilising 2012 anthropogenic emissions in these simulations. Consistent AQG exceedance results are found when using observations for 2012.
Climate change alone is likely to worsen O3 and PM2.5 air quality over much of continental Europe but improve O3 air quality over parts of northern Europe including the UK. This study uses an innovative coupled and nested approach to determine the importance of key processes in governing the responses of surface ozone (O3), fine particulate matter (PM2.5) and nitrogen dioxide (NO2) to climate change in the 21st century across a range of spatial scales: the continental scale across Europe, regional scale across the UK and at the street scale across London. The one-way nested WRF-EMEP4UK regional atmospheric chemistry transport model (50 km×50 km resolution over Europe; 5 km×5 km over the UK) is driven by climate change projections from the Representative Concentration Pathway (RCP) 8.5 from the UK Earth System Model HadGEM2-ES, which produces annual-mean temperature increases exceeding 4 °C across Europe. The regional WRF-EMEP4UK model is coupled to the street-scale ADMS-Urban model. This methodology allows for a consistent assessment of the impacts of large-scale climate change on air quality to be simulated over Europe, the UK and in London. Simulated surface O3 mixing ratios are slightly underestimated ( ppbv) and surface PM2.5 concentrations are somewhat overestimated (MB=3 µg m−3). Changes in O3 and PM2.5 over Europe due to a large climate change signal show good agreement with previous findings using RCP8.5 or SSP3-7.0. There is a strong contrast in the summer and winter-mean O3 responses to climate change. Surface O3 decreases (up to 8 ppbv) in winter over most of Europe, and in summer, large O3 increases are found over southern Europe (up to 10 ppbv) but O3 reductions occur over northern Europe. Lower hemispheric background O3 levels are highlighted as the driver of future O3 decreases over northern Europe in numerous studies (e.g., Colette et al., 2015; Turnock et al., 2022). In addition, higher NOx concentrations in winter over parts of northern Europe under climate change, lead to greater titration of O3 by NO reducing surface O3 levels. Larger O3 dry deposition velocities and a higher mixing layer may also contribute to winter surface O3 decreases. Higher temperatures lead to a doubling of natural biogenic isoprene emissions in summer over Europe, and this likely dominates the increases in summer O3 in southern Europe. Reductions in O3 dry deposition in summer may also contribute to summer surface O3 increases. This O3 increase has been referred to as the O3 climate penalty (e.g., Wu et al., 2008; Colette et al., 2015). However, these simulations do not consider the posited CO2 inhibition effect on isoprene emissions or represent detailed isoprene nitrate chemistry. The size of the O3 climate penalty remains uncertain because of uncertainty in the magnitude of isoprene and monoterpene emissions and their sensitivity to climate and associated atmospheric CO2 and vegetation changes and the interplay of these factors (e.g., Lin et al., 2016).
Annual-average surface PM2.5 concentrations increase by 5–10 µg m−3 (up to 30 %) over most of Europe by the 2090s. This increase is also driven by higher biogenic isoprene and monoterpene emissions, promoting secondary organic aerosol (SOA) formation, most notably in summer. Changes in climate-sensitive biogenic emissions are the dominant driver of both surface O3 and PM2.5 responses to climate change in summer over continental Europe in this study; therefore, uncertainties in biogenic emission processes represents a major limitation for the findings of this study.
Increased wintertime precipitation over Central Europe promotes more wet deposition of sulphur dioxide (SO2) which reduces sulphate aerosol loadings in the 2090s; a similar but much smaller response is found for nitrate. For both species, increases in dry deposition of SOx (SO2 + SO4) and oxidised nitrogen in winter are prominent across Europe. Primary organic matter also shows larger changes in winter with increases over emission source locations. Summer responses of inorganic and primary organic matter PM2.5 components are more muted. Wind-driven increases in sea-salt aerosol are found over much of Atlantic whilst Saharan dust transported to Europe is reduced. However, the impact of climate change on dust is highly uncertain due to uncertainties in changes to meteorological and soil properties. Winter increases in mixing layer height over Central Europe also influence surface O3, NOx and, via sulphate, PM2.5 levels.
Over the UK, the spatial patterns and magnitudes of O3, PM2.5 and NO2 responses to climate change simulated over the UK domain at 5 km×5 km resolution are similar to those simulated at 50 km×50 km resolution over the European domain, suggesting that our results are not strongly sensitive to model resolution.
Examining the seasonality of urban air pollution across London, the O3 peak amplitude is reduced in the 2090s under climate change. In contrast, PM2.5 and NO2 concentrations exhibit a more pronounced wintertime peak; with PM2.5 concentrations underestimated compared to observations for 2012. For all air pollutants, the urban model simulates substantially greater spatial variability than the regional model over London due to its representation of local concentration gradients close to road sources, in good agreement with observations for 2012. The diurnal cycle of urban O3 for London in winter is flatter and in summer displays a shift towards higher morning and lower afternoon values under climate change. Higher PM2.5 and NO2 levels and reduced diurnal variability are found in both seasons in the future, with larger night-time increases evident in winter. Monthly mean NO2 magnitudes are ∼10 % higher at the street scale using ADMS-Urban compared to the regional EMEP4UK model, with the ADMS-Urban model results capturing well key features of observed seasonal and diurnal NO2 cycles. Overall, both models show consistent responses to climate change for all three air pollutants.
The changes in O3, PM2.5 and NO2 concentrations under climate change have implications for achieving the 2021 WHO long and short-term air quality guidelines in the 2000s and 2090s under RCP8.5. For peak season (April–September) maximum daily 8 h (MDA8) surface O3, whilst much of Europe meets the first interim target of 100 µg m−3, the air quality guideline of 60 µg m−3 is exceeded except in parts of northern Europe in the present day (with observations for 2012 showing less attainment for this region than EMEP4UK model simulations). While the reduction in hemispheric background O3 due to climate change benefits attainment of these guidelines in northern Europe, it hinders attainment elsewhere in Europe. Hence, under this high warming scenario, without concurrent emission reductions, WHO air quality guidelines for peak season O3 will be even more challenging to meet, except in parts of northern Europe. Annual-average PM2.5 concentrations meet the first and second interim targets for much of Europe. Very limited areas of northern Europe meet the stringent WHO guidelines for annual mean PM2.5 of 5 µg m−3 for present-day (consistent with observations for 2012 in this region). Under climate change alone, this target will be extremely difficult to meet. However, Turnock et al. (2022) showed that implementing future O3 precursor emission reductions alongside climate change mitigation reduced exceedances of both these long-term WHO air quality guideline values across the globe. The long-term air quality guidelines of annual-average NO2≤10 µg m−3 are viable for much of Europe for present-day (and for observations in 2012) and, despite climate-induced changes in NOx, remain unaltered in the future.
Considering short-term air quality guidelines over London, whilst the first interim target is achieved for the 99th percentile values of MDA8 O3 and 24 h mean PM2.5, it is not for 24 h mean NO2. None of these air pollutants met the short-term AQGs for present-day or in future under this climate change scenario and fixed 2012 anthropogenic emissions.
This study finds that robust projections of the magnitude of the impact of climate change on surface O3 and PM2.5 for Europe crucially rely on accurate representation of climate-sensitive biogenic emissions, which remain highly uncertain between studies. Climate driven changes in dry and wet deposition and mixing layer height also have an important influence on surface O3 and PM2.5 concentrations. Changes in other climate-sensitive natural emissions sources including lighting and wildfires are neglected in these simulations; wildfires in particular, are likely to become a much more important source in the future. Studies that assess climate change impacts on natural emissions focus on overall changes in air pollutant concentrations; few provide quantitative estimates of natural emission changes to compare with this study. Whilst the focus of the model simulations is to isolate the climate change response, the assumption of present-day levels for anthropogenic emissions (and the lack of wildfire emissions), as well as atmospheric methane and CO2 concentrations and boundary conditions for O3 and other species, means the chemical environment and the resulting atmospheric chemistry kinetics and atmospheric composition changes would be different if emission changes under RCP8.5 (or another scenario/pathway) were also employed. Notably, large methane increases projected for high warming RCP8.5 and SSP3-7.0 scenarios would substantially increase background O3 levels (by ∼50 %; Turnock et al., 2022). Therefore, both emissions and climate change need to be considered in relation to future mitigation policies.
The coupled modelling approach to enable nested regional and urban modelling of climate change is computationally intensive, but adds substantial value to conventional regional modelling approaches. For seasonal-average air pollutant concentrations over the UK, similar patterns and magnitudes of change are simulated using the 50 km×50 km and 5 km×5 km modelling domains, indicating that a regional modelling strategy may be sufficient for assessment of attainment and exceedances of long-term WHO air quality guidelines at the country or regional level. However, seasonal and diurnal cycle representation at the city scale is shown to be in closer agreement to observations when using the urban model compared to the 5 km×5 km regional model for London, especially for the magnitude and spatial variation of surface NO2 concentrations driven by sharp traffic-related gradients, as previously highlighted by Hood et al. (2018). Therefore, to evaluate long-term and short-term targets and guidelines at the city-scale, and in particular for attainment of NO2 AQGs, high resolution and explicit representation of its emission sources are crucial.
However, it is noted, that these results are based on one climate scenario and present-day anthropogenic emissions, which is a major caveat of this study. Dynamical downscaling studies to achieve finer spatial representation of atmospheric composition change, as presented here, limit the use of multiple models with ensemble members that would be required for a comprehensive quantification of uncertainties (scenario, structural, internal climate variability) related to climate change. Indeed, although not a like-for-like comparison, uncertainties associated with model spatial resolution (for EMEP4UK) are smaller than model structural uncertainty derived from (three to five) different global models. However, such high-resolution projections are largely only available from climate models, such as CORDEX at the regional-scale for Europe or UKCP18 at the local-scale for the UK, but these do not include projections of atmospheric composition needed for full uncertainty quantification. New variable resolution modelling capabilities will enhance two-way nested high-resolution simulation of future atmospheric composition, but extension to the urban street-scale remains a challenge, despite the importance for air quality guideline assessment and for health effects. Nevertheless, this study adds to the evidence that although parts of northern Europe may benefit from lower hemispheric background O3, strong future mitigation measures will need to be implemented for continental Europe to meet the ambitious WHO air quality guidelines, especially for short-term exposure, in the future.
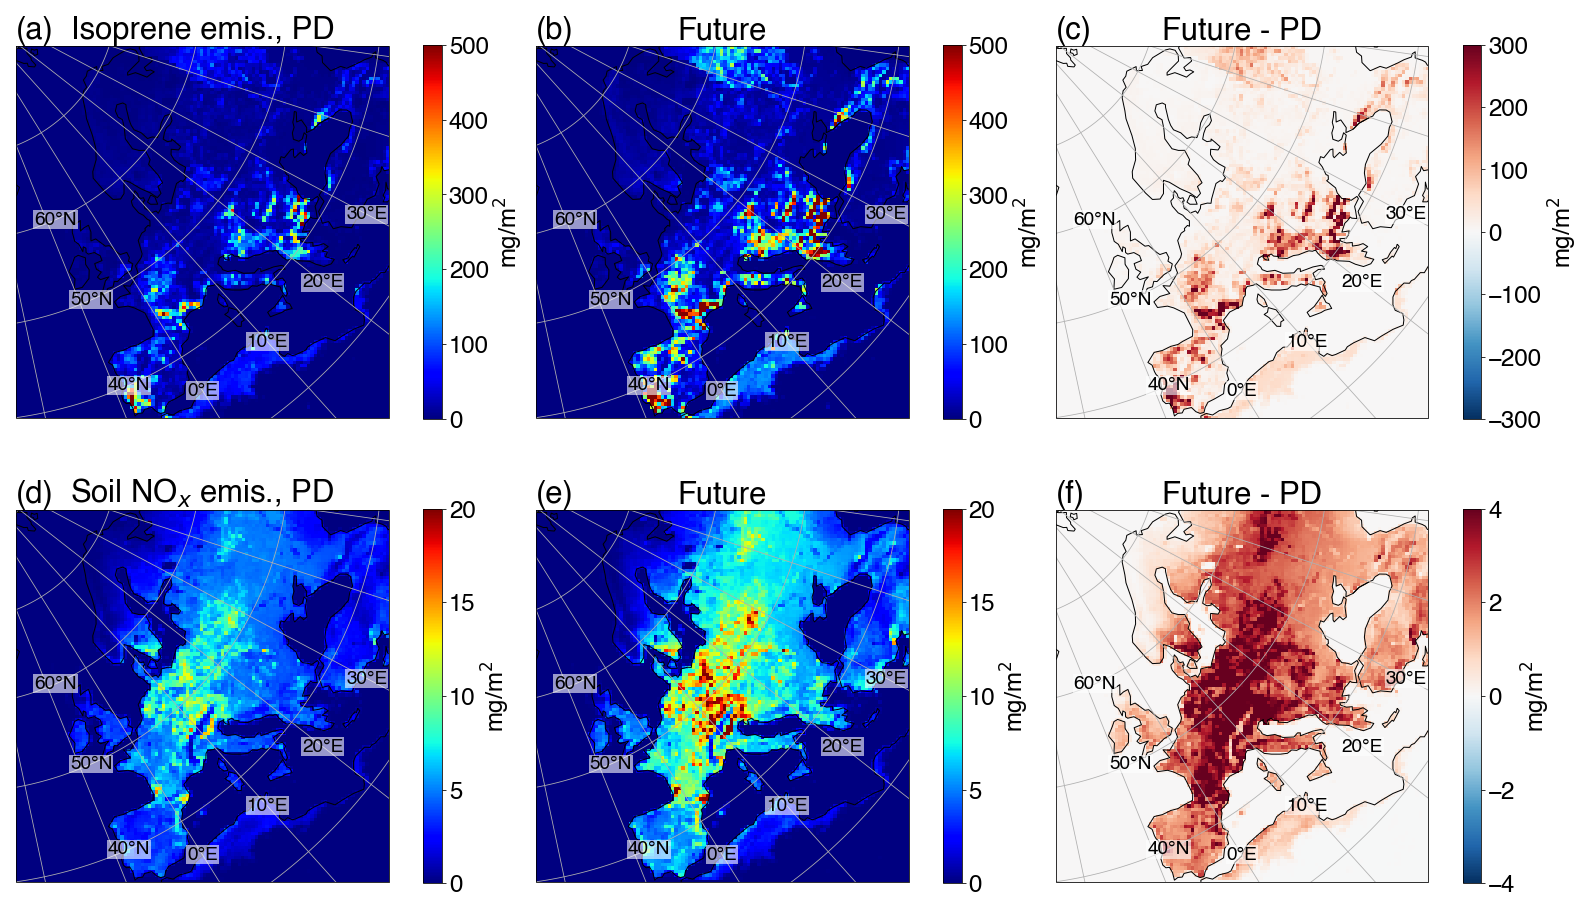
Figure A1Annual natural emissions for present-day and future of (a, b) isoprene and (d, e) soil NO and (c, f) differences between future and present-day due to climate change.
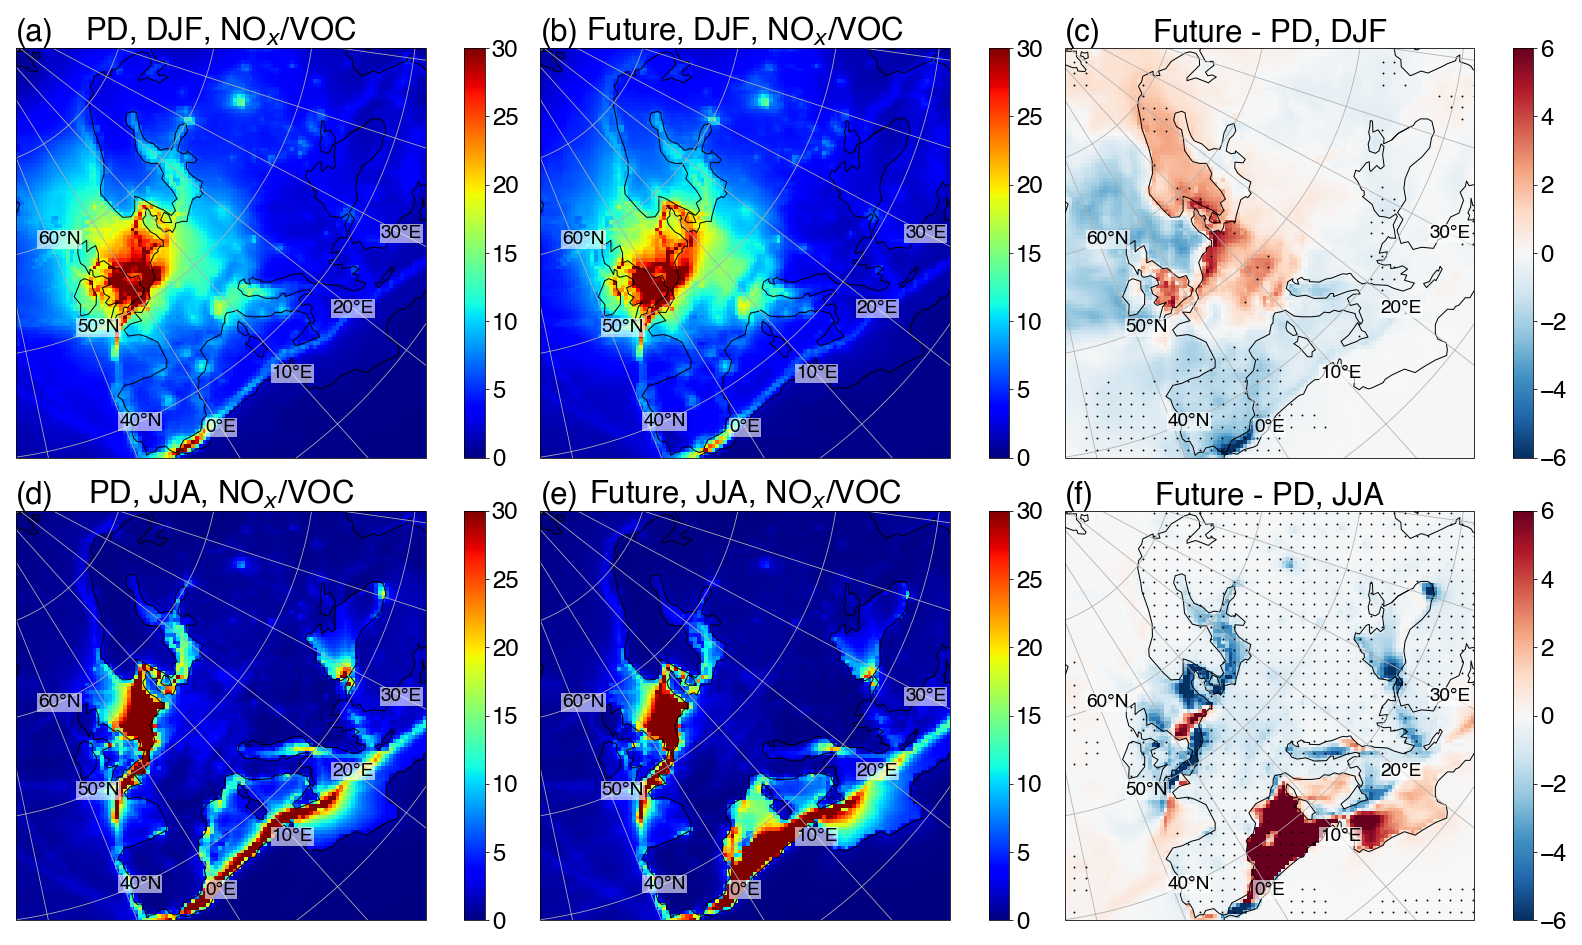
Figure A2Surface NOxVOC mixing ratios as indicators of O3 chemical environments for present day (1996–2005) in (a) winter and (d) summer, and for future (2090–2099) in (b) winter and (e) summer and differences in chemical environments between future and present-day in (c) winter and (f) summer. VOC concentrations are represented as the sum of isoprene (C5H8) and formaldehyde (HCHO).
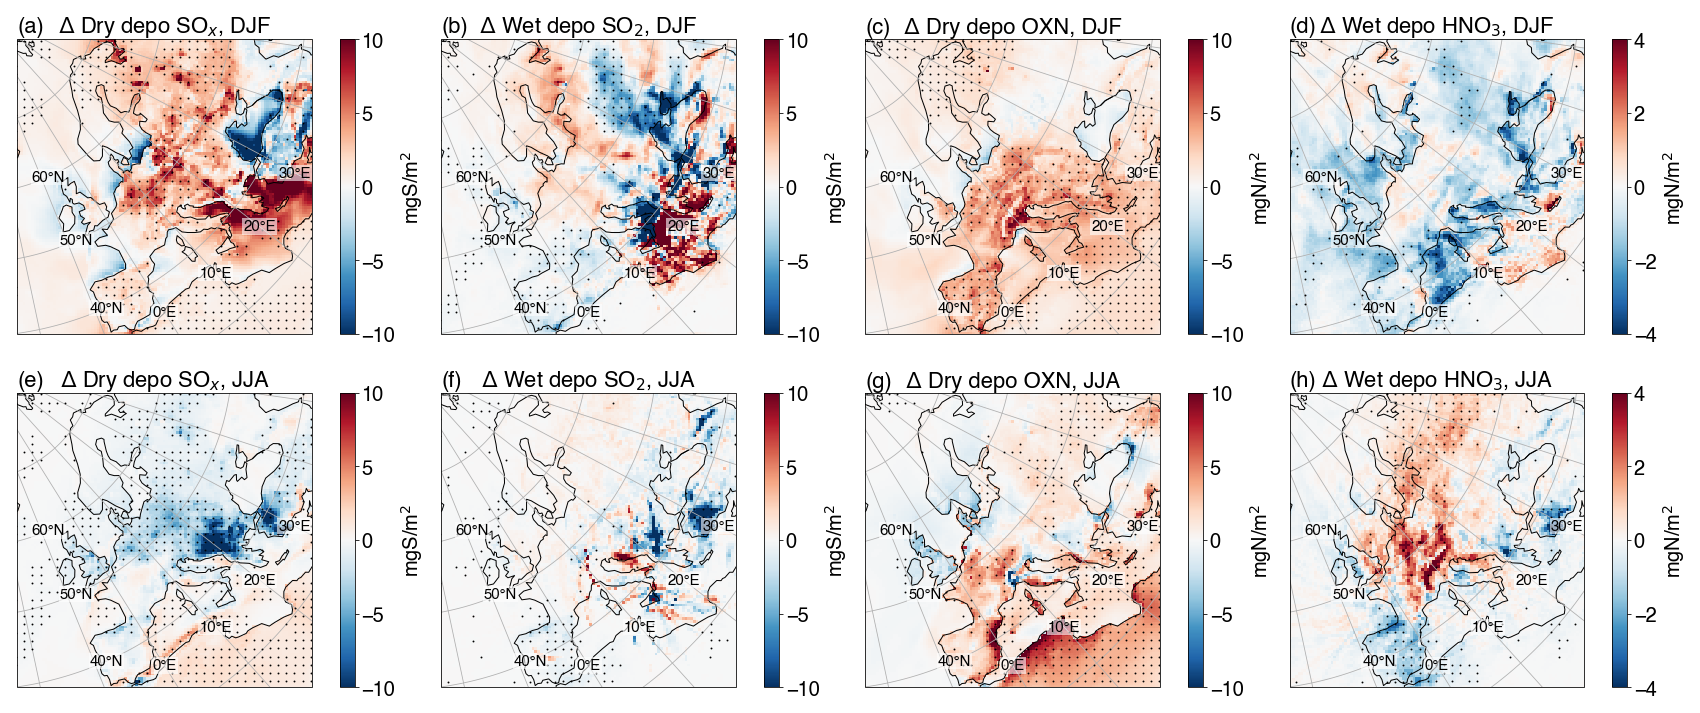
Figure A3Differences in dry deposition of SOx (SO2 + SO4) in (a) winter, (e) summer, in wet deposition of SO2 in (b) winter, (f) summer, in dry deposition of oxidised Nitrogen OXN (largely HNO3) in (c) winter and (g) summer and in wet deposition of HNO3 in (d) winter and (h) summer between present day (1996–2005) and future (2090–2099).
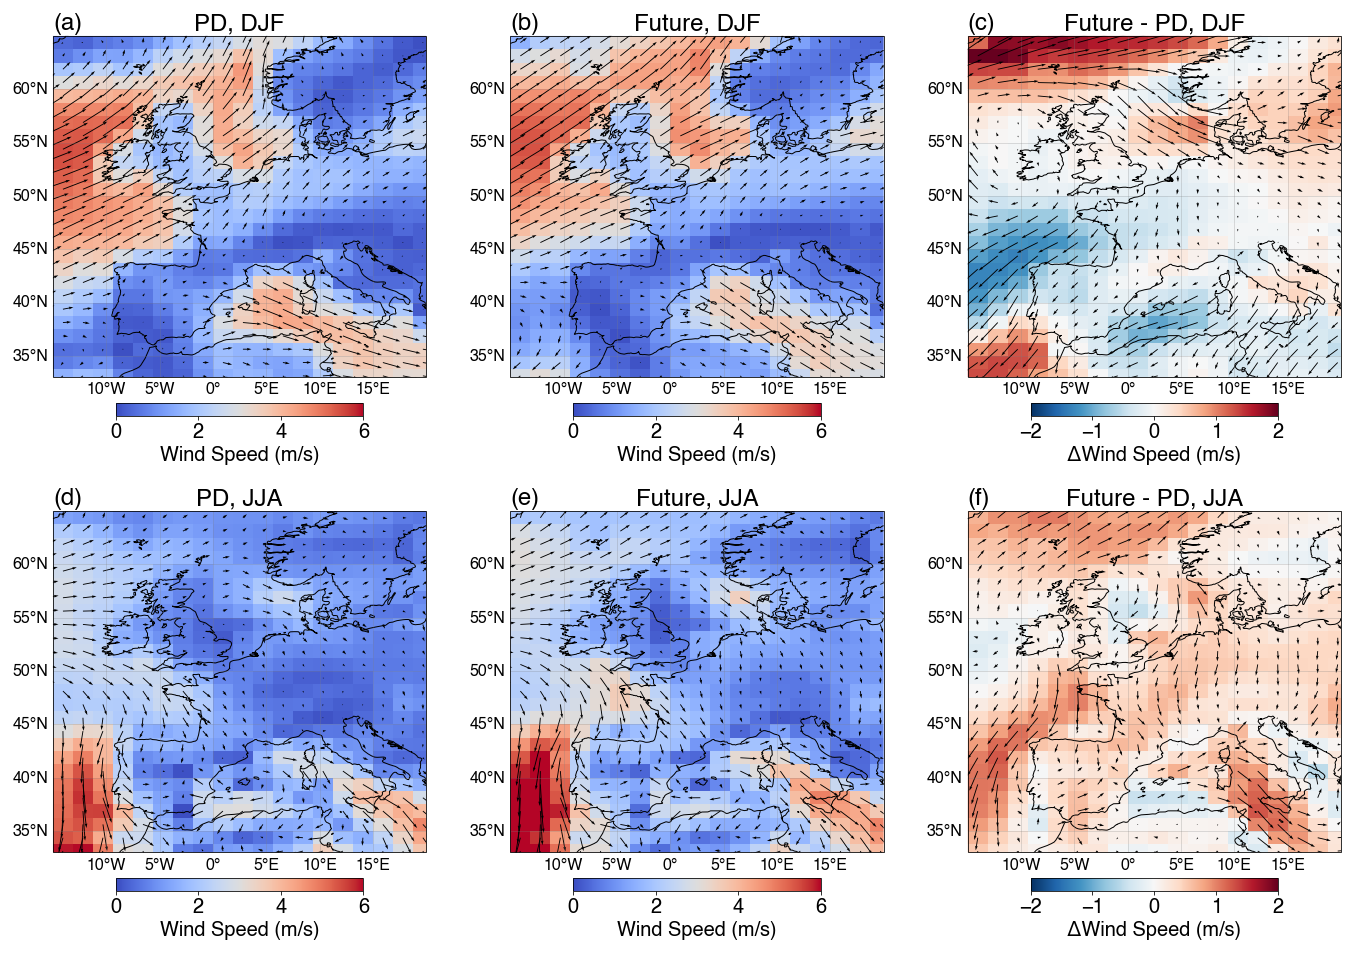
Figure A4Wind speed and directions (uas, vas) for present day (1996–2005) for (a) winter, (d) summer and for future (2090–2099) for (b) winter and (e) summer and differences between present-day and future for (c) winter and (f) summer from the HadGEM2-ES model. Model outputs from WRF-EMEP4UK were not available for U and V winds, but 6-hourly nudging propagates this climate change signal across the WRF-EMEP4UK model domains.
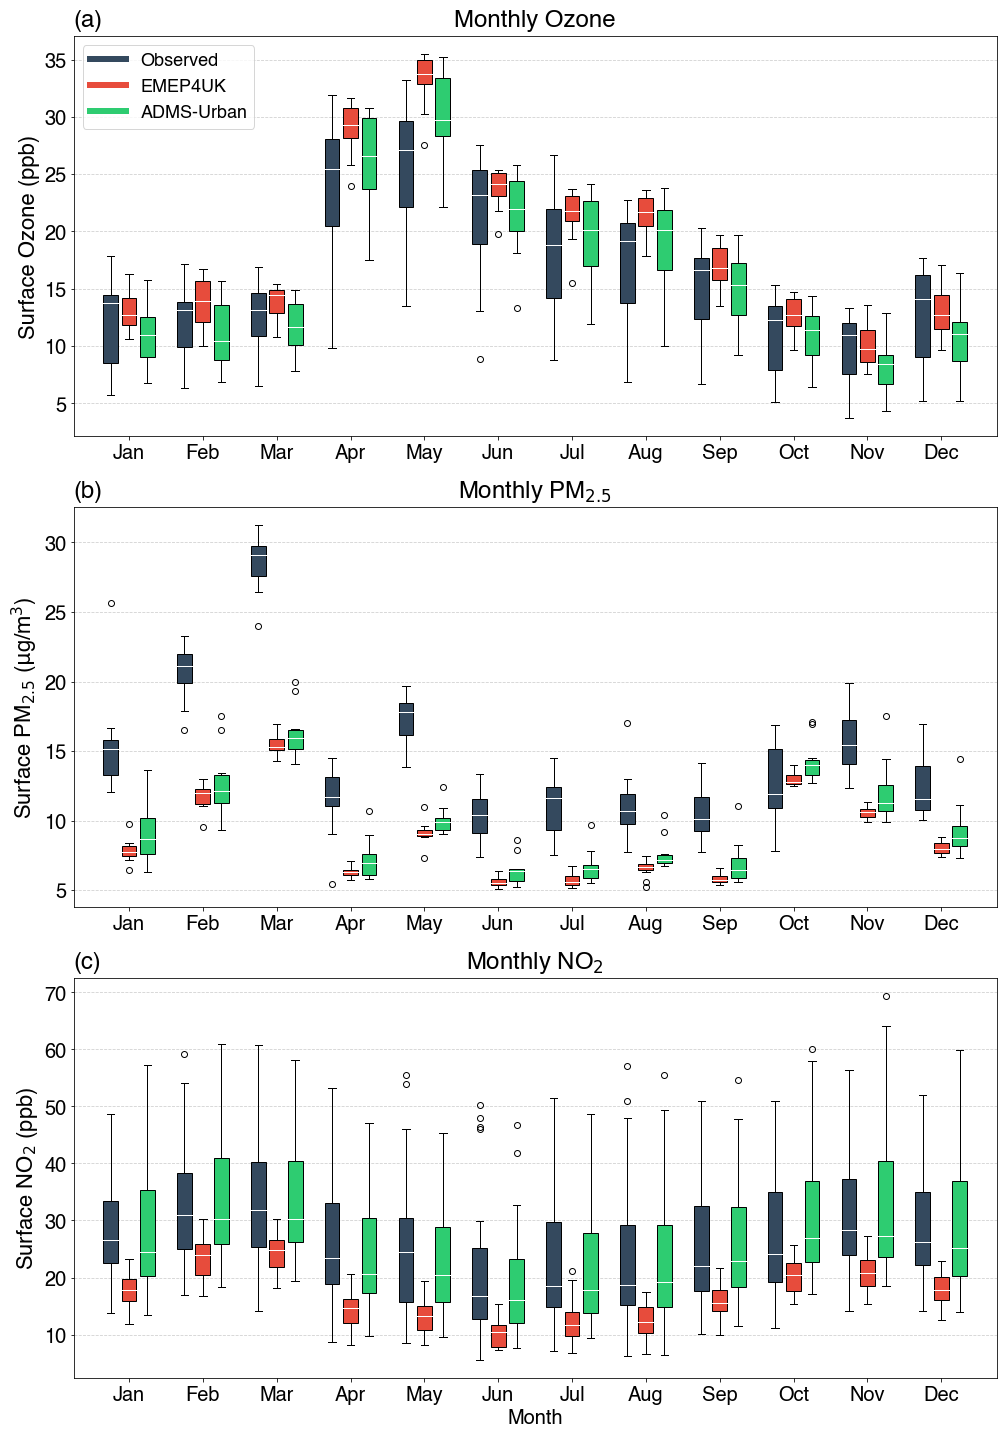
Figure A5Seasonal cycles for the year 2012 across London from “background” and “near-road” site observations, EMEP4UK and ADMS-Urban for (a) surface O3, mixing ratios (ppbv) (b) PM2.5 concentrations (µg m−3) and (c) NO2 mixing ratios (ppbv) respectively. For O3 n=20 sites; for PM2.5 n=11 sites; for NO2 n=42 sites. Detailed site information can be found in Hood et al. (2018).
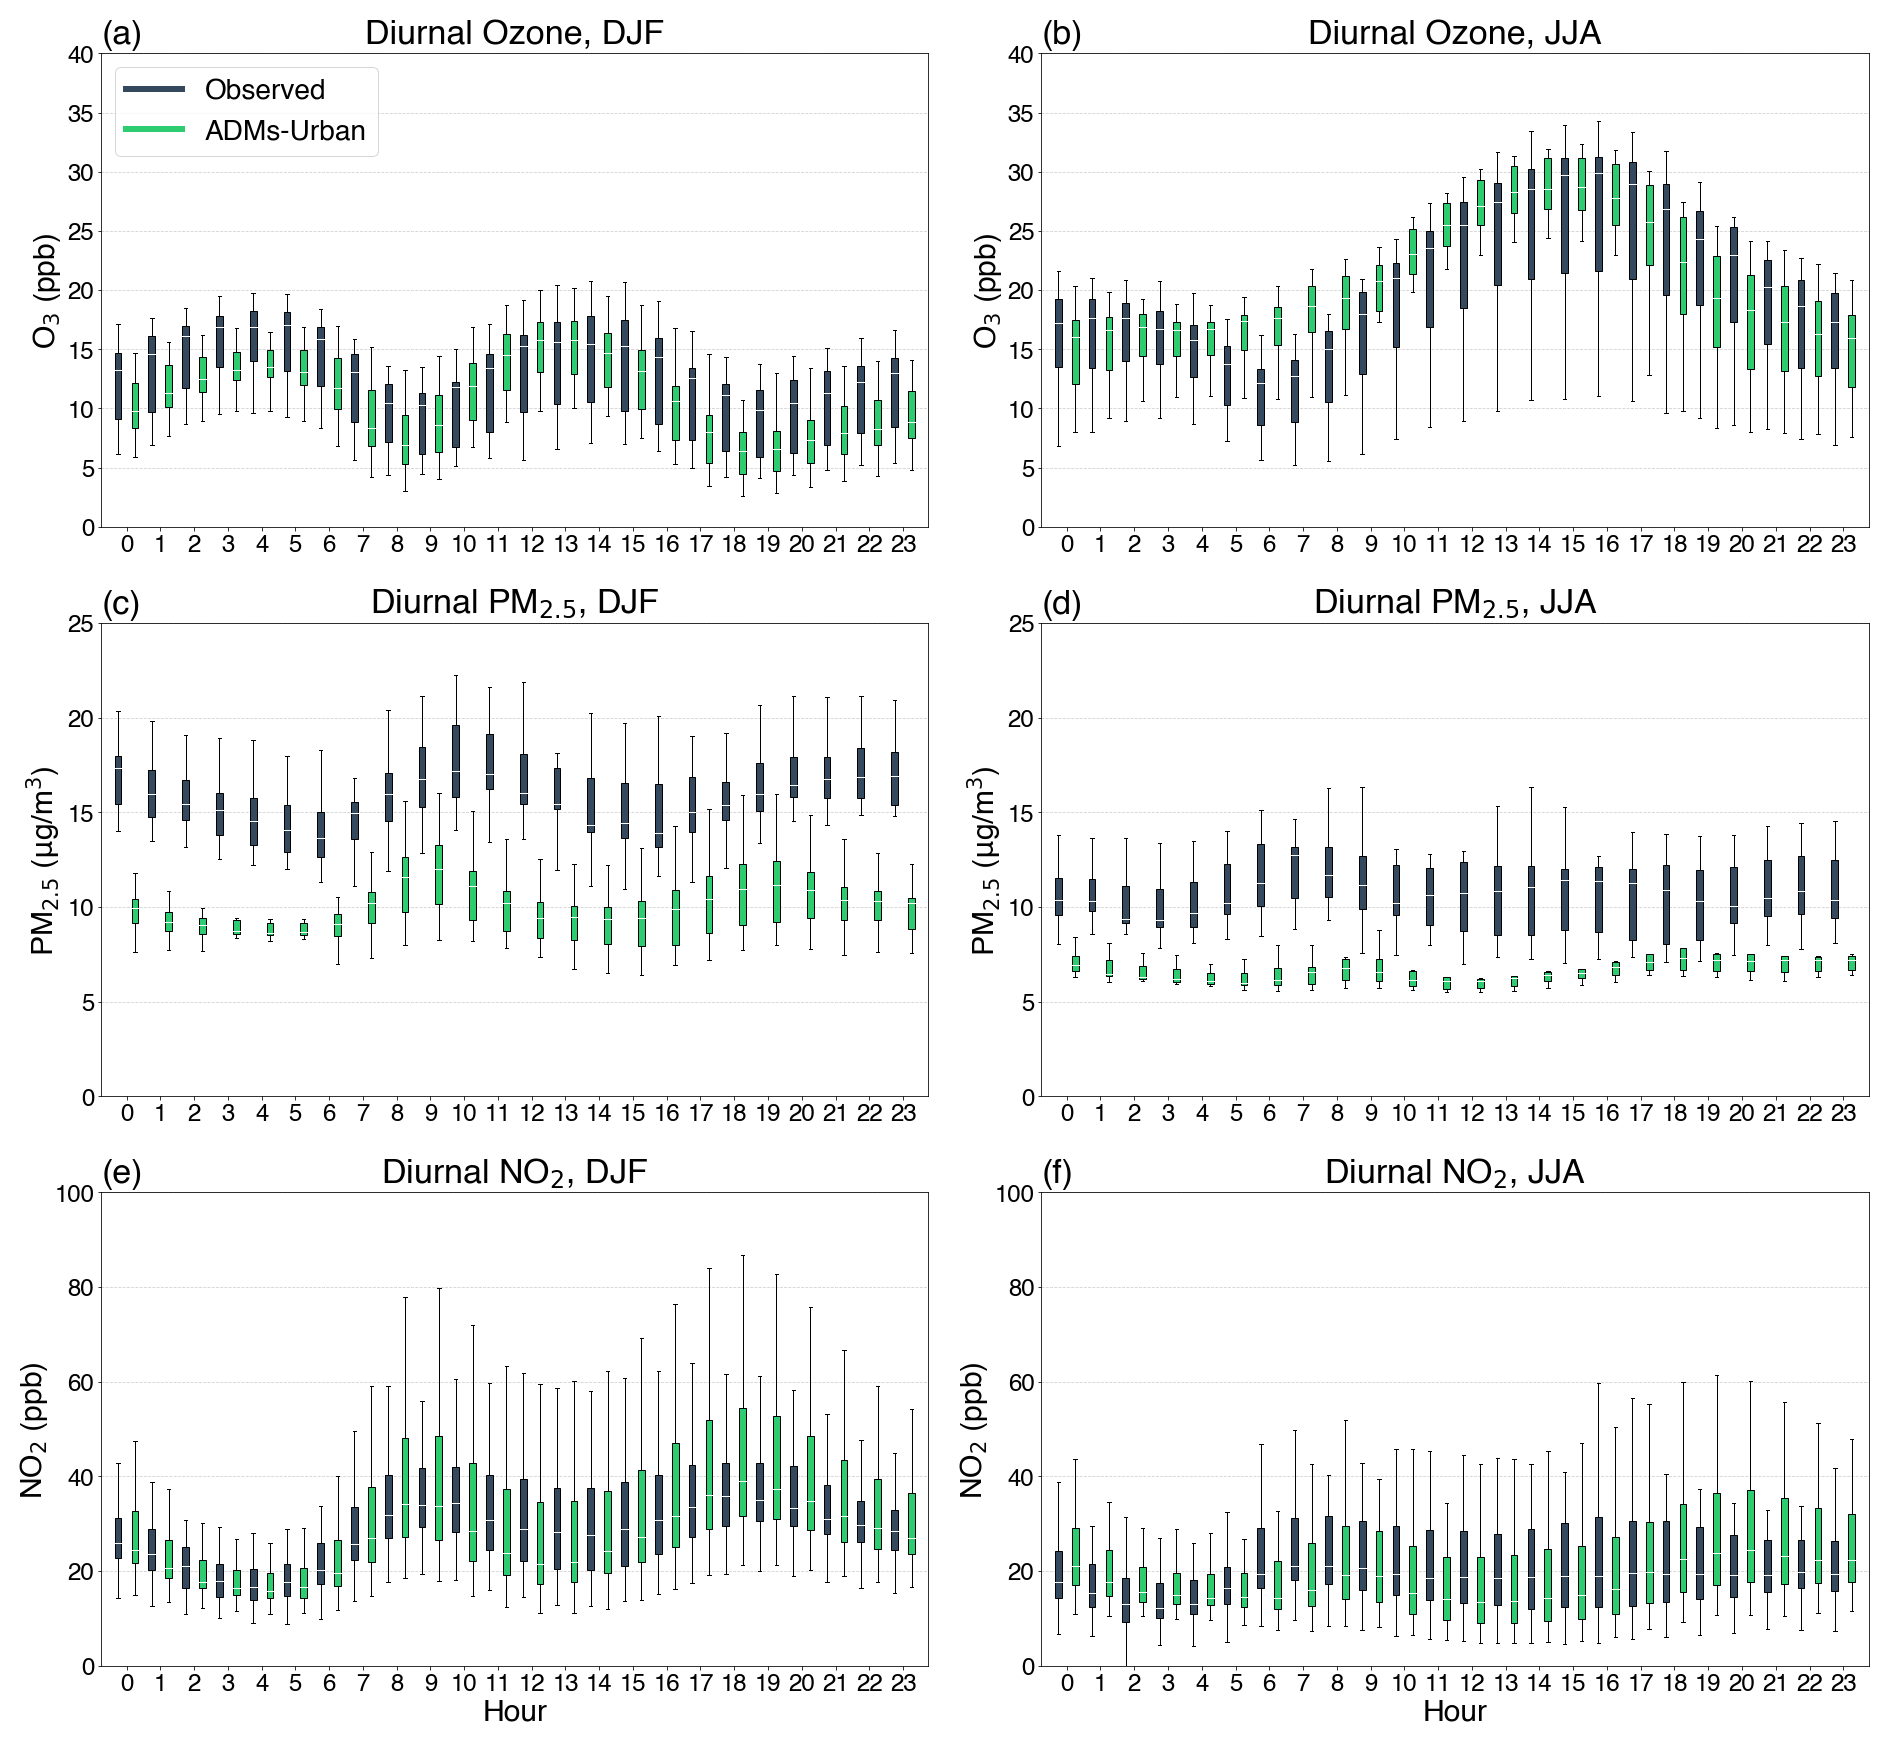
Figure A6Diurnal cycles for winter and summer for the year 2012 across London from “background” and “near-road” site observations and ADMS-Urban for (a, b) surface O3, mixing ratios (ppbv) (c, d) PM2.5 concentrations (µg m−3) and (e, f) NO2 mixing ratios (ppbv) respectively. For O3 n=20 sites; for PM2.5 n=11 sites; for NO2 n=42 sites. Detailed site information can be found in Hood et al. (2018).
Table A1European domain average temperature, isoprene (C5H8) and Soil NO emissions for present day (1996–2005) and future (2090–2099) along with the % change and % change per 1 °C.

Table A2Winter and summer mean O3 (ppbv), PM2.5 (µg m−3) and NO2 (ppbv) concentrations simulated over the UK at 50 km×50 km and 5 km×5 km resolution averaged over the whole UK, and North (above 54° N) and South (below 54° N) UK.
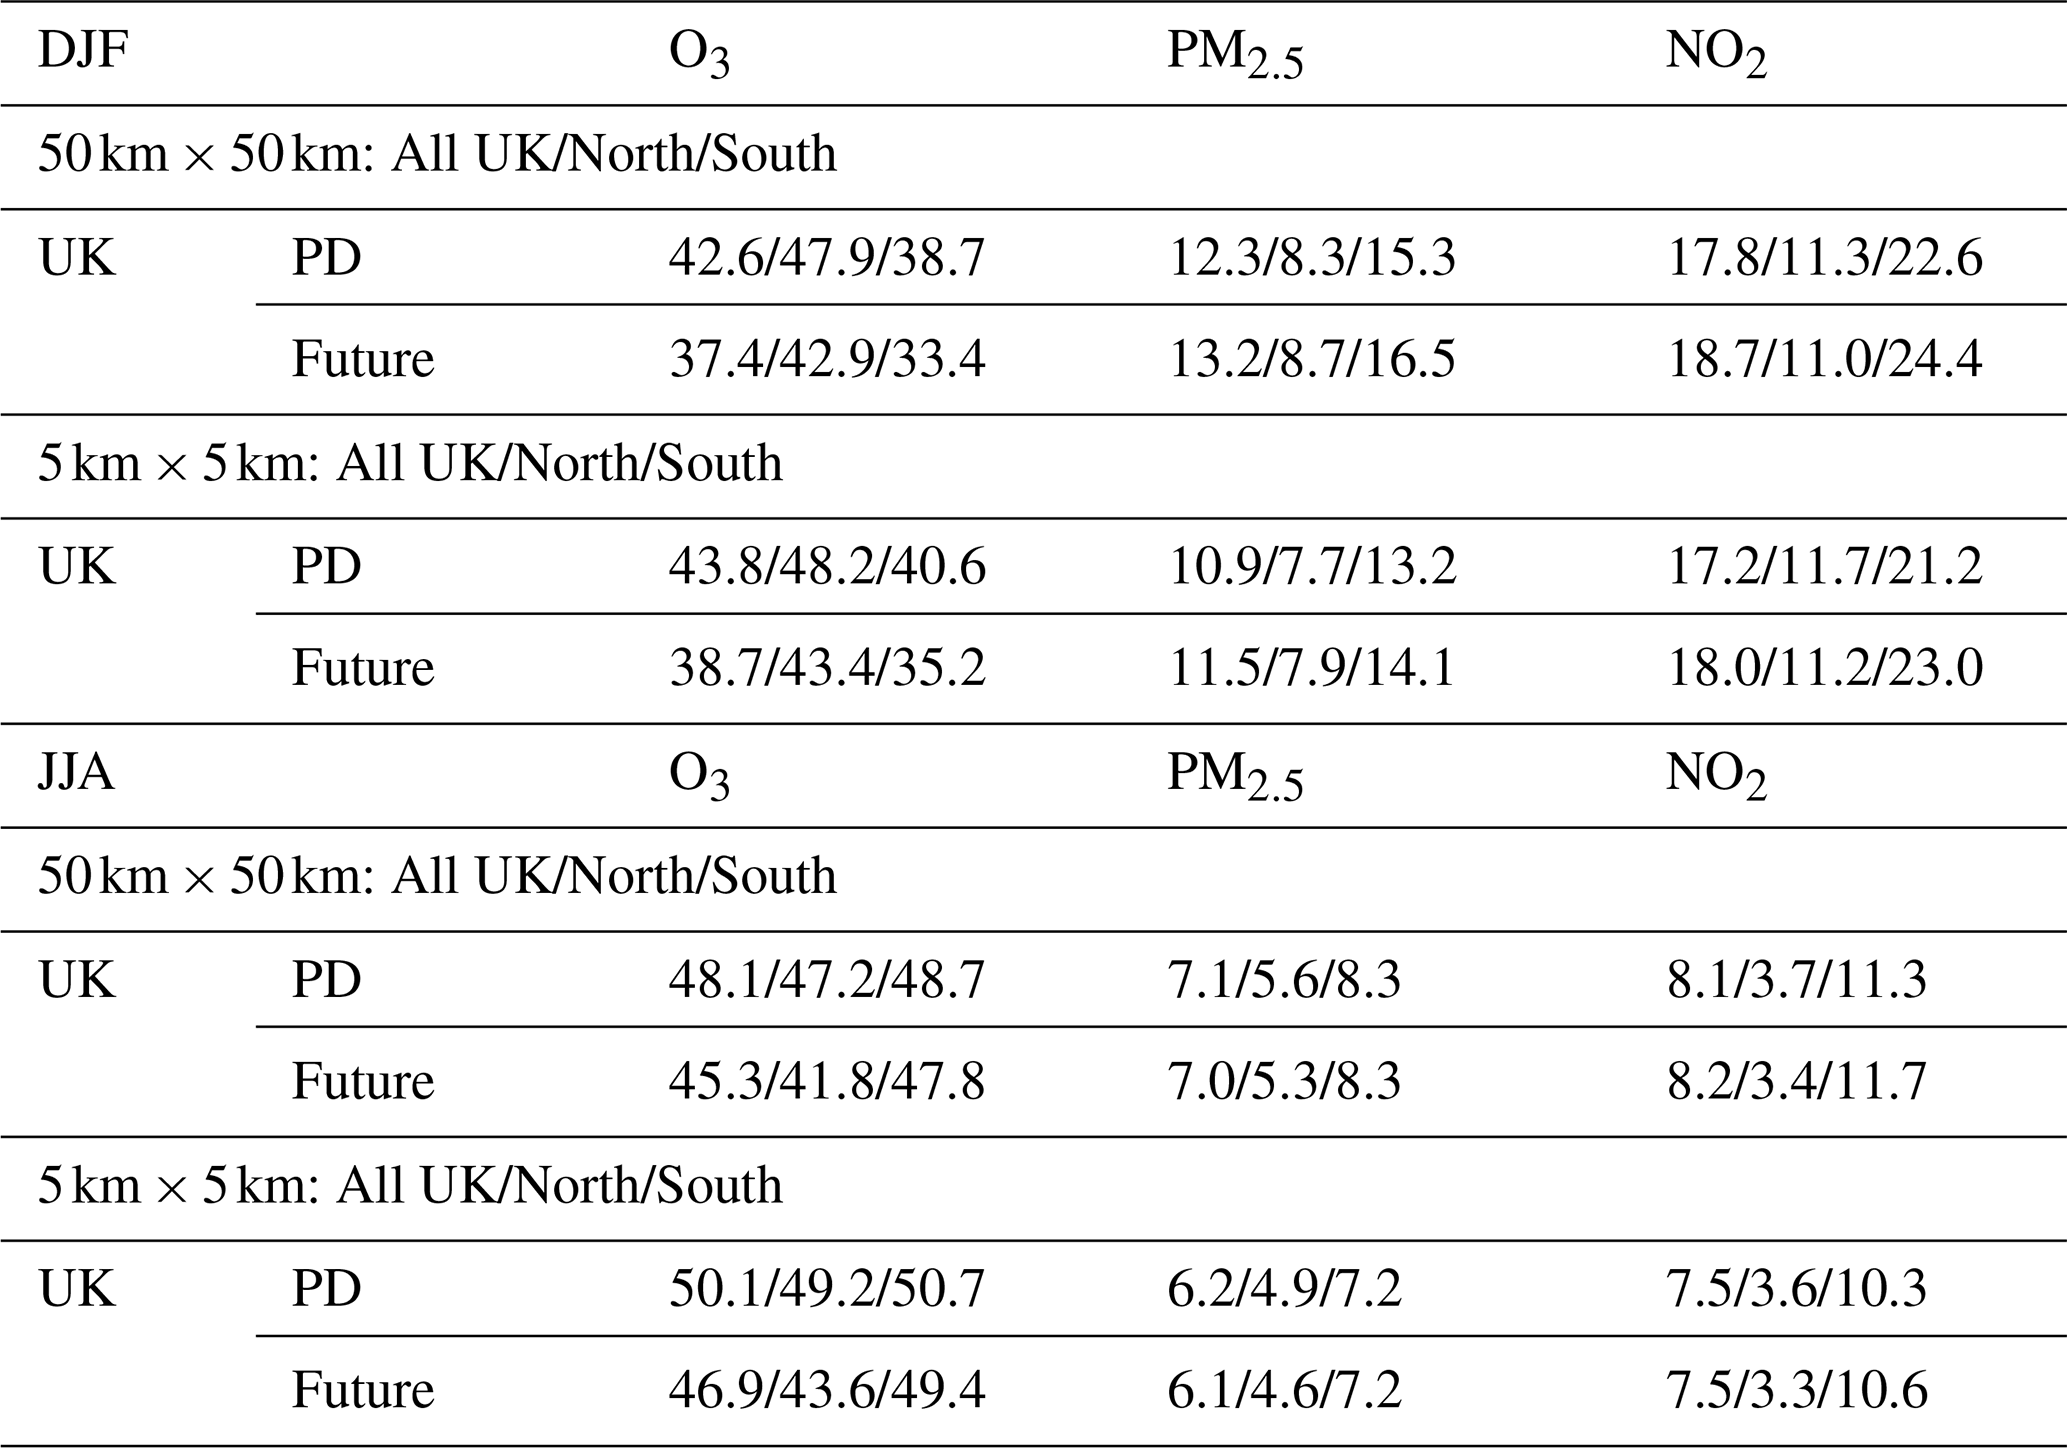
Table A3Median monthly values over London for surface O3 (ppbv), PM2.5 (µg m−3) and NO2 (ppbv) concentrations for present-day (PD) and future from the EMEP4UK 5 km×5 km UK domain (10 grid-boxes) and from the ADMS-Urban (56 receptor locations) models. Month 1 = January etc.
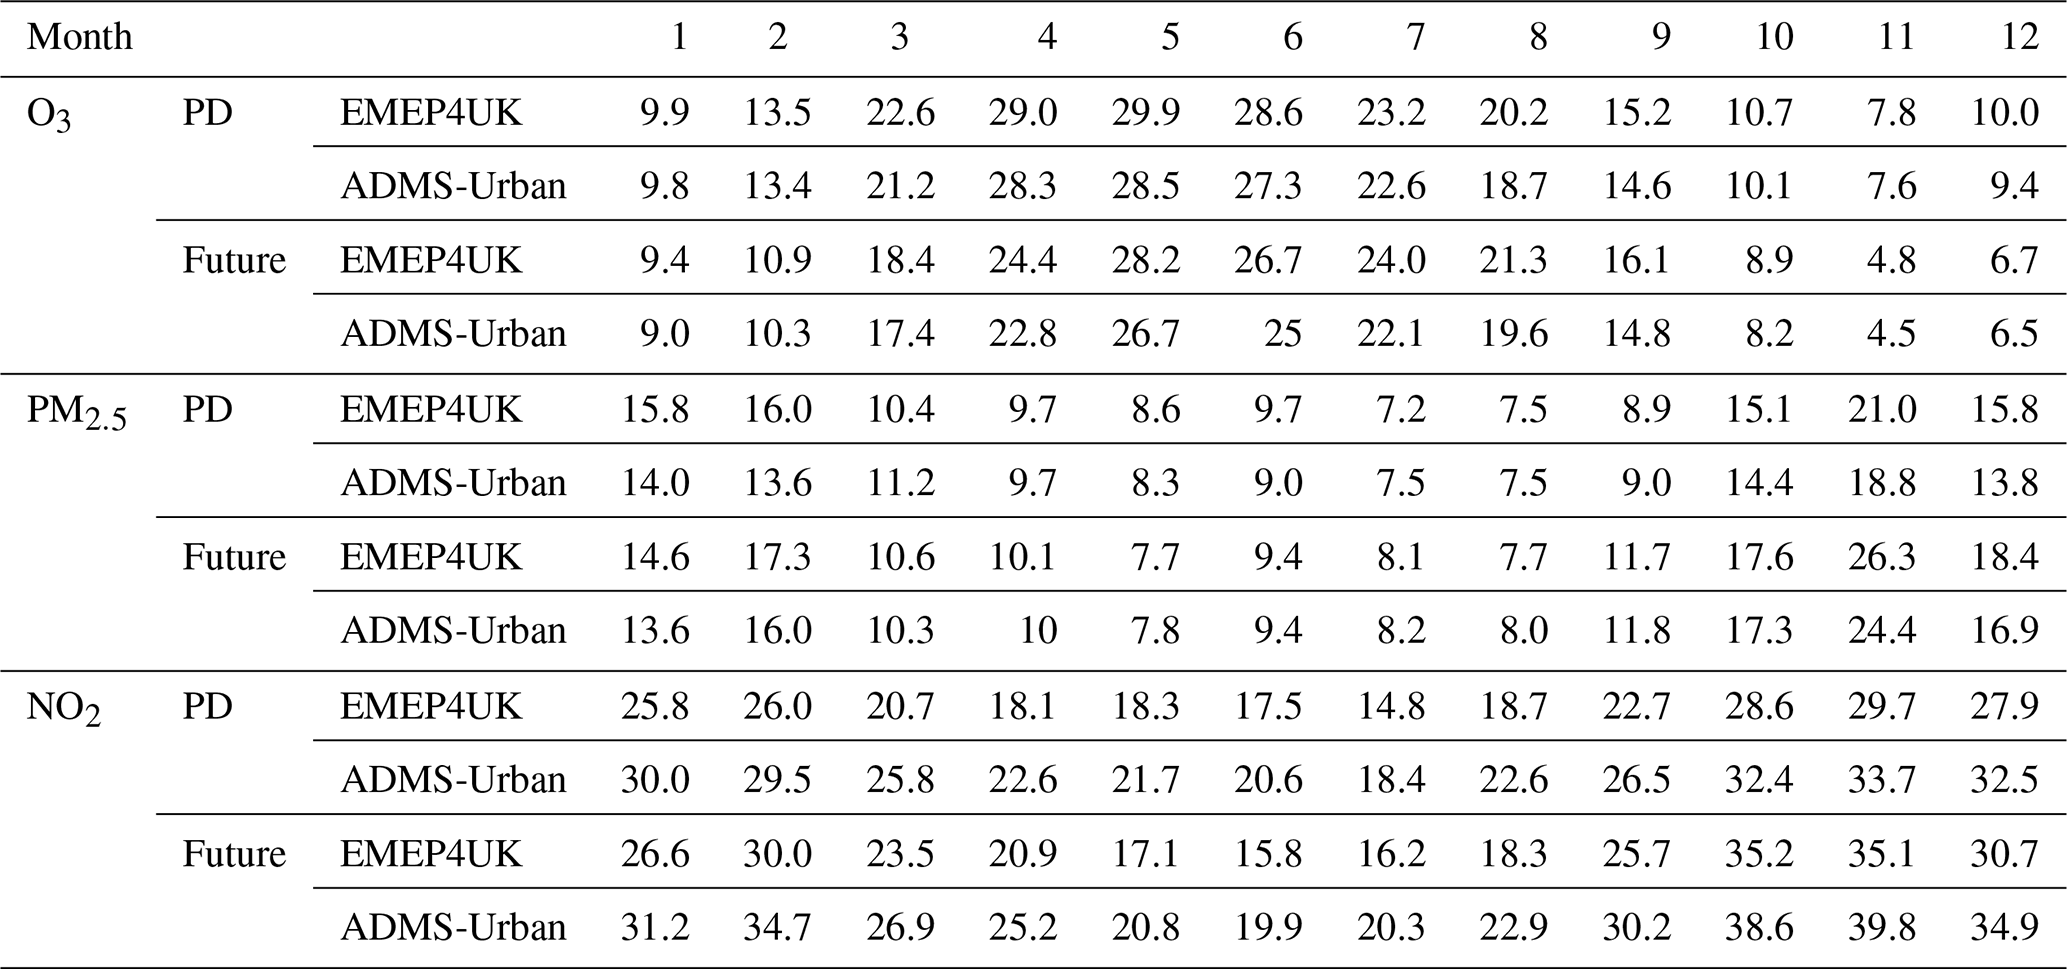
Table A4Median monthly values for “background” and “near-road” London sites for the year 2012 for surface O3 mixing ratios (ppbv), PM2.5 concentrations (µg m−3) and NO2 mixing ratios (ppbv) for the year 2012 from (a) observations, (b) EMEP4UK 5 km×5 km and (c) from ADMS-Urban as used in Hood et al. (2018) that employed a similar coupling approach to this study. Month 1 = January etc. For O3 n=20 sites; for PM2.5 n=11 sites; for NO2 n=42 sites. Detailed site information can be found in Hood et al. (2018).
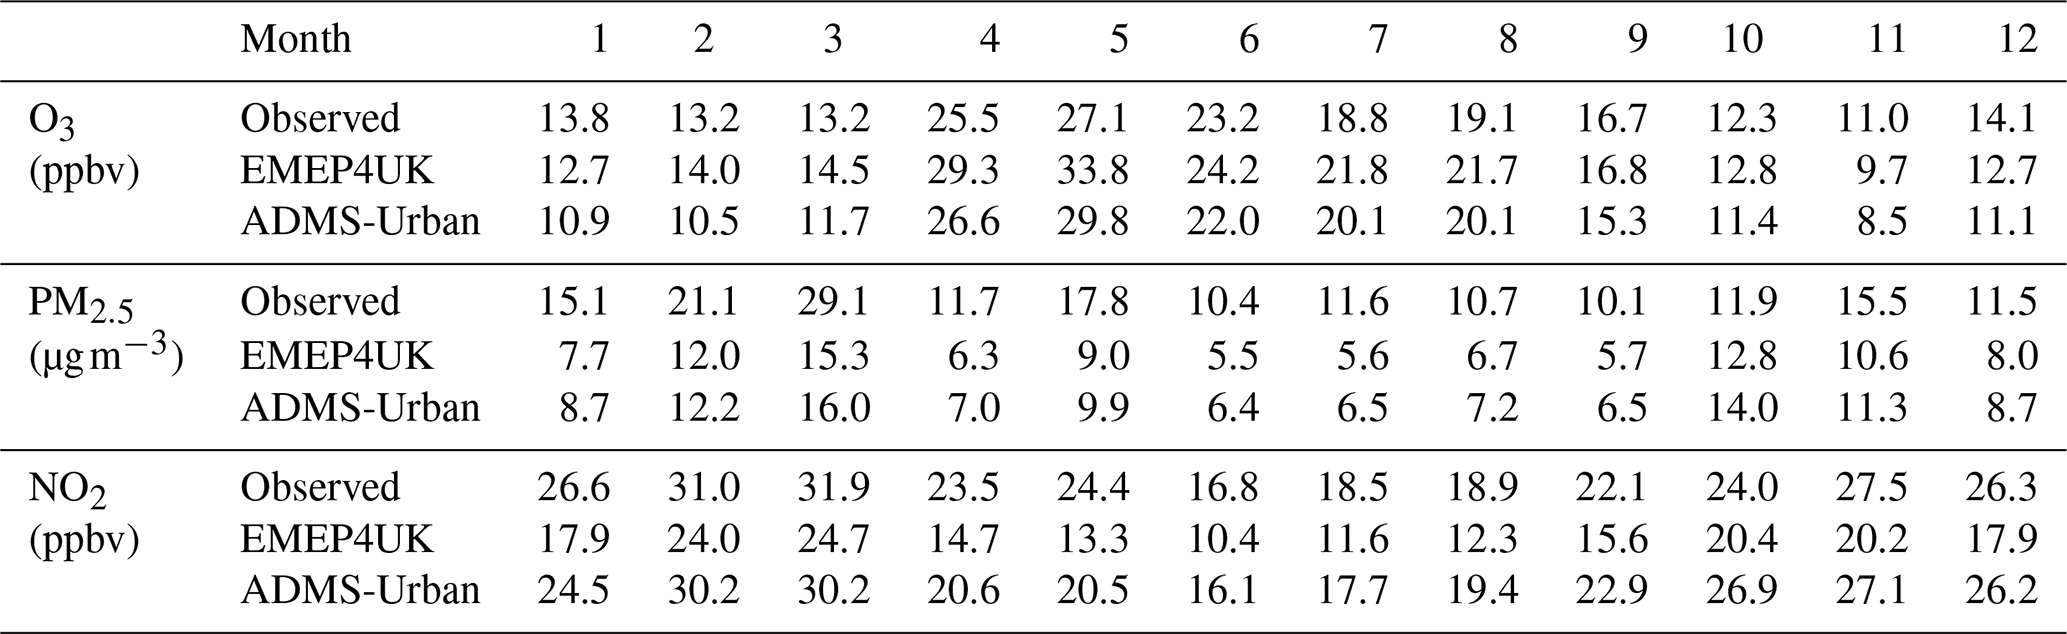
Table A5Short-term 99th percentile values of MDA8 O3, and 24 h mean PM2.5 and NO2 calculated annually from hourly data for present-day (1996–2005) as in Table 2, for 2012 from observations (Obs.) and ADMS-Urban results (Mod.), and for 1996–2005 from observations and ADMS-Urban results for sites/receptor locations where observations are available. Hence 1996–2005 model results will differ from the PD results because of differences in the number of sites are available for different years (for O3 n = up to 16, for PM2.5 n=0–2, for NO2 n = up to 40). Mean values across all locations are given in the 2nd column. The WHO short-term averaging period interim target and air quality guideline (AQG) values (WHO, 2021) are shown in bold. Exceedance days per year are calculated for present-day and for 2012 for the WHO interim target values and the relevant AQG value (rightmost column). The spatial variation in exceedance days across the locations are represented by the standard deviation.
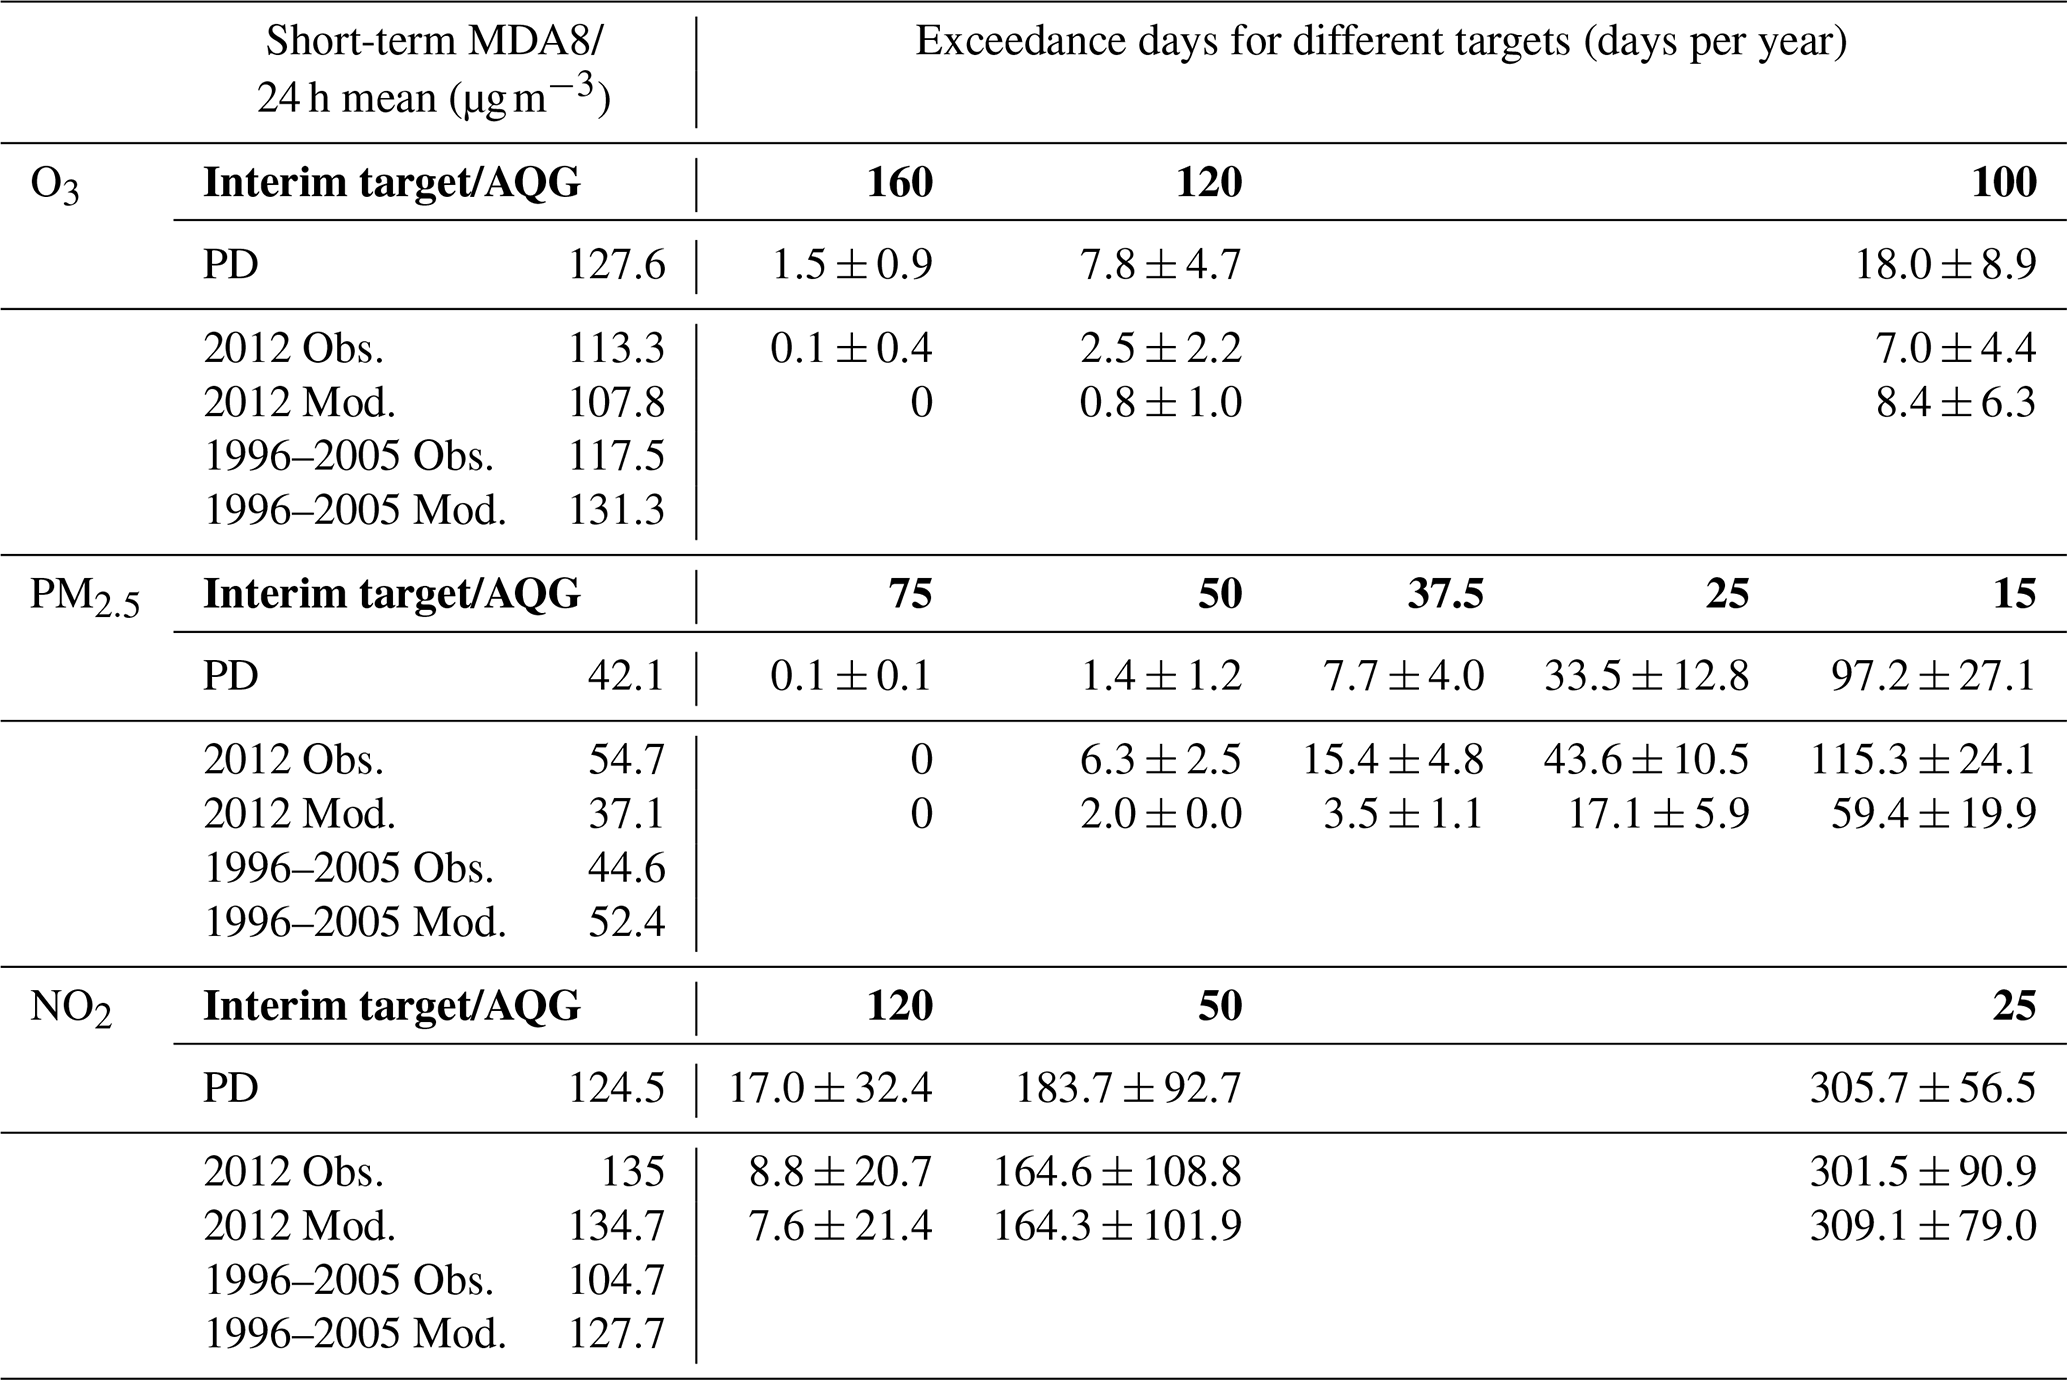
Processed model data used in the figures in this study can be found on Zenodo at https://doi.org/10.5281/zenodo.21133558 (Doherty and Liu, 2026). Data for wind fields were obtained from the CMIP5 data archive, which is hosted at the Earth System Grid Federation and is freely available to download from https://esgf-node.llnl.gov/search/cmip5/ (last access: 12 December 2025).
RMD, ZL, MV and OW conceptualised the research study. The main formal analysis was conducted by ZL, RMD and OW with inputs from MV, FMO'C, STT, with the figures created by ZL. MV, CMH and JRS developed the coupled model aided by FMO'C. Funding acquisition was led by RMD, aided by DEH, MRH and contributions from LKW, JRS and DJC. RMD and ZL prepared the manuscript aided by OW with contributions from STT and FMO'C. All co-authors reviewed and edited the manuscript.
At least one of the (co-)authors is a member of the editorial board of Atmospheric Chemistry and Physics. The peer-review process was guided by an independent editor, and the authors also have no other competing interests to declare.
Publisher's note: Copernicus Publications remains neutral with regard to jurisdictional claims made in the text, published maps, institutional affiliations, or any other geographical representation in this paper. The authors bear the ultimate responsibility for providing appropriate place names. Views expressed in the text are those of the authors and do not necessarily reflect the views of the publisher.
We thank Kate Johnson for ADMS-Urban model evaluation, David Simpson for providing EMEP MSC-W model code and Ian MacKenzie for his contribution to the coupled model development and performing model simulations, and James Weber for insightful discussions. This work used the ARCHER UK National Supercomputing Service.
The model simulations were supported by funding under the UK Natural Environment Research Council via grants: NE/M003906/1 and NE/M002381/1. Zhenze Liu thanks the National Natural Science Foundation of China (NSFC), the Natural Science Foundation of Jiangsu Province and the China Postdoctoral Science Foundation for funding under grants 42307140, SBK2023043946 and 2023M731749. Fiona M. O'Connor was supported by the Met Office Hadley Centre Climate Programme funded by DSIT. The contributions of Steven Turnock were funded by the Met Office Climate Science for Service Partnership (CSSP) China project under the International Science Partnerships Fund (ISPF).
This paper was edited by Zhonghua Zheng and reviewed by Mariano Mertens and one anonymous referee.
Allen, R. J., Landuyt, W., and Rumbold, S. T.: An increase in aerosol burden and radiative effects in a warmer world, Nat. Clim. Change, 6, 269–274, https://doi.org/10.1038/nclimate2827, 2016.
Allen, R. J., Hassan, T., Randles, C. A., and Su, H.: Enhanced land–sea warming contrast elevates aerosol pollution in a warmer world, Nat. Clim. Change, 9, 300–305, https://doi.org/10.1038/s41558-019-0401-4, 2019.
Andersson, C. and Engardt, M.: European ozone in a future climate: Importance of changes in dry deposition and isoprene emissions, J. Geophys. Res., 115, D02303, https://doi.org/10.1029/2008JD011690, 2010.
AQEG – Air Quality Expert Group: Ozone in the UK – Recent Trends and Future Projections, https://uk-air.defra.gov.uk/library/reports?report_id=1064 (last access: 12 October 2025), 2021.
Arneth, A., Schurgers, G., Hickler, T., and Miller, P.: Effects of species composition, land surface cover, CO2 concentration and climate on isoprene emissions from European forests, Plant Biol., 10, 150–162, https://doi.org/10.1055/s-2007-965247, 2008.
Athanassiadou, M., Baker, J., Carruthers, D., Collins, W., Girnary, S., Hassell, D., Hort, M., Johnson, C., Johnson, K., Jones, R., Thomson, D., Trought, N., and Witham, C. S.: An assessment of the impact of climate change on air quality at two UK sites, Atmos. Environ., 44, 1877–1886, https://doi.org/10.1016/j.atmosenv.2010.02.024, 2010.
Banks, A., Kooperman, G. J., and Xu, Y.: Meteorological influences on anthropogenic PM2.5 in future climates: Species level analysis in the Community Earth System Model v2, Earths Future, 10, e2021EF002298, https://doi.org/10.1029/2021EF002298, 2022.
Bauwens, M., Stavrakou, T., Müller, J.-F., Van Schaeybroeck, B., De Cruz, L., De Troch, R., Giot, O., Hamdi, R., Termonia, P., Laffineur, Q., Amelynck, C., Schoon, N., Heinesch, B., Holst, T., Arneth, A., Ceulemans, R., Sanchez-Lorenzo, A., and Guenther, A.: Recent past (1979–2014) and future (2070–2099) isoprene fluxes over Europe simulated with the MEGAN–MOHYCAN model, Biogeosciences, 15, 3673–3690, https://doi.org/10.5194/bg-15-3673-2018, 2018.
Berglen, T. F., Berntsen, T. K., Isaksen, I. S. A., and Sundet, J. K.: A global model of the coupled sulfur/oxidant chemistry in the troposphere: The sulfur cycle, J. Geophys. Res., 109, D19310, https://doi.org/10.1029/2003JD003948, 2004.
Bergström, R., Denier van der Gon, H. A. C., Prévôt, A. S. H., Yttri, K. E., and Simpson, D.: Modelling of organic aerosols over Europe (2002–2007) using a volatility basis set (VBS) framework: application of different assumptions regarding the formation of secondary organic aerosol, Atmos. Chem. Phys., 12, 8499–8527, https://doi.org/10.5194/acp-12-8499-2012, 2012.
Carruthers, D. J., Holroyd, R. J., Hunt, J. C. R., Weng, W. S., Robins, A. G., Apsley, D. D., Thomson, D. J., and Smith, F. B.: UK-ADMS: a new approach to modelling dispersion in the Earth's atmospheric boundary layer, J. Wind Eng. Ind. Aerod., 52, 139–153, https://doi.org/10.1016/0167-6105(94)90044-2, 1994.
Colette, A., Andersson, C., Baklanov, A., Bessagnet, B., Brandt, J., Christensen, J. H., Doherty, R. M., Engardt, M., Geels, C., Giannakopoulos, G., Hedegaard, G. B., Katragkou, E., Langner, J., Lei, H., Manders, A., Melas, D., Meleux, F., Rouïl, L., Sofiev, M., Soares, J., Stevenson, D. S., Tombrou-Tzella, M., Varotsos, K. V., and Young, P. J.: Is the ozone climate penalty robust in Europe?, Environ. Res. Lett., 10, 084015, https://doi.org/10.1088/1748-9326/10/8/084015, 2015.
Collins, W. J., Bellouin, N., Doutriaux-Boucher, M., Gedney, N., Halloran, P., Hinton, T., Hughes, J., Jones, C. D., Joshi, M., Liddicoat, S., Martin, G., O'Connor, F., Rae, J., Senior, C., Sitch, S., Totterdell, I., Wiltshire, A., and Woodward, S.: Development and evaluation of an Earth-System model – HadGEM2, Geosci. Model Dev., 4, 1051–1075, https://doi.org/10.5194/gmd-4-1051-2011, 2011.
Dawson, J. P., Adams, P. J., and Pandis, S. N.: Sensitivity of PM2.5 to climate in the Eastern US: a modeling case study, Atmos. Chem. Phys., 7, 4295–4309, https://doi.org/10.5194/acp-7-4295-2007, 2007.
Do, N. T. N., Sudo, K., Ito, A., Emmons, L. K., Naik, V., Tsigaridis, K., Seland, Ø., Folberth, G. A., and Kelley, D. I.: Historical trends and controlling factors of isoprene emissions in CMIP6 Earth system models, Geosci. Model Dev., 18, 2079–2109, https://doi.org/10.5194/gmd-18-2079-2025, 2025.
Doherty, R. M. and Liu, Z.: Dataset for “From Continental to Street Scales: Climate Change Impacts on Atmospheric Composition over Europe and London”, in: From Continental to Street Scales: Climate Change Impacts on Atmospheric Composition over Europe and London, Zenodo [data set], https://doi.org/10.5281/zenodo.21133558, 2026.
Doherty, R. M., Wild, O., Shindell, D. T., Zeng, G., MacKenzie, I. A., Collins, W. J., Fiore, A. M., Stevenson, D. S., Dentener, F. J., Schultz, M. G., Hess, P., Derwent, R. G., and Keating, T. J.: Impacts of climate change on surface ozone and intercontinental ozone pollution: a multi-model study, J. Geophys. Res.-Atmos., 118, 3744–3763, https://doi.org/10.1002/jgrd.50266, 2013.
Doherty, R. M., Heal, M. R., and O'Connor, F. M.: Climate change impacts on human health over Europe through its effect on air quality, Environ. Health, 16, 118, https://doi.org/10.1186/s12940-017-0325-2, 2017.
Doherty, R. M., O'Connor, F. M., and Turnock, S. T.: Projections of future air quality are uncertain, but which source of uncertainty is most important?, J. Geophys. Res.-Atmos., 127, e2022JD037948, https://doi.org/10.1029/2022JD037948, 2022.
Emberson, L.: Effects of ozone on agriculture, forests and grasslands, Philos. T. R. Soc. A, 378, 20190327, https://doi.org/10.1098/rsta.2019.0327, 2020.
ENTEC: Defra UK ship emissions inventory, final report, http://uk-air.defra.gov.uk/reports/cat15/1012131459_21897_Final_Report_291110.pdf (last access: 1 December 2016), 2010.
Finney, D., Doherty, R., Wild, O., Stevenson, D., MacKenzie, I., and Blyth, A. M.: A projected decrease in lightning under climate change, Nat. Clim. Change, 8, 210–213, https://doi.org/10.1038/s41558-018-0072-6, 2018.
Fiore, A. M., Naik, V., Spracklen, D. V., Steiner, A., Unger, N., Prather, M., Bergmann, D., Cameron-Smith, P. J., Cionni, I., Collins, W. J., Dalsøren, S., Eyring, V., Folberth, G. A., Ginoux, P., Horowitz, L. W., Josse, B., Lamarque, J.-F., MacKenzie, I. A., Nagashima, T., O'Connor, F. M., Righi, M., Rumbold, S. T., Shindell, D. T., Skeie, R. B., Sudo, K., Szopa, S., Takemura, T., and Zeng, G.: Global air quality and climate, Chem. Soc. Rev., 41, 6663–6683, https://doi.org/10.1039/C2CS35095E, 2012.
Fiore, A. M., Milly, G. P., Hancock, S. E., Quiñones, L., Bowden, J. H., Helstrom, E., Lamarque, J.-F., Schnell, J., West, J. J., and Xu, Y.: Characterizing changes in eastern U. S. pollution events in a warming world, J. Geophys. Res.-Atmos., 127, e2021JD035985, https://doi.org/10.1029/2021JD035985, 2022.
Fu, T. M. and Tian, H.: Climate change penalty to ozone air quality: review of current understandings and knowledge gaps, Curr. Pollut. Rep., 5, 159–171, https://doi.org/10.1007/s40726-019-00115-6, 2019.
GLA – Greater London Authority: London Atmospheric Emissions Inventory (LAEI), https://data.london.gov.uk/dataset/london-atmospheric-emissions-inventory-2010 (last access: 7 December 2017), 2013.
Gomez, J., Allen, R. J., Turnock, S. T., Horowitz, L. W., Tsigaridis, K., Bauer, S. E., Olivié, D., Thomson, E. S., and Ginoux, P.: The projected future degradation in air quality is caused by more abundant natural aerosols in a warmer world, Commun. Earth Environ., 4, 22, https://doi.org/10.1038/s43247-023-00688-7, 2023.
Guenther, A., Hewitt, C., Erickson, D., Fall, R., Geron, C., Graedel, T., Harley, P., Klinger, L., Lerdau, M., McKay, W., Pierce, T., Scholes, R., Steinbrecher, R., Tallamraju, R., Taylor, J., and Zimmerman, P.: A global model of natural volatile organic compound emissions, J. Geophys. Res., 100, 8873–8892, 1995.
Hood, C., MacKenzie, I., Stocker, J., Johnson, K., Carruthers, D., Vieno, M., and Doherty, R.: Air quality simulations for London using a coupled regional-to-local modelling system, Atmos. Chem. Phys., 18, 11221–11245, https://doi.org/10.5194/acp-18-11221-2018, 2018.
Huang, K., Wu, D., Liu, D., Duan, Y., Dörsch, P., Butterbach-Bahl, K., Fang, X., Liu, Y., Wang, C., Yu, H., Qu, L., Xu, J., Gurmesa, G. A., Kang, R., Peng, S., Hobbie, E. A., Ju, X., Hu, S., Phillips, O. L., Gundersen, P., Zhu, W., Homyak, P. M., and Fang, Y.: Climate warming reduces soil gaseous nitrogen losses in a temperate forest, P. Natl. Acad. Sci. USA, 122, e2513401122, https://doi.org/10.1073/pnas.2513401122, 2025.
Jacob, D. J. and Winner, D. A.: Effect of climate change on air quality, Atmos. Environ., 43, 51–63, https://doi.org/10.1016/j.atmosenv.2008.09.051, 2009.
Joge, S. D., Mansour, K., Simó, R., Galí, M., Steiner, N., Saiz-Lopez, A., and Mahajan, A. S.: Climate warming increases global oceanic dimethyl sulfide emissions, P. Natl. Acad. Sci. USA, 122, e2502077122, https://doi.org/10.1073/pnas.2502077122, 2025.
Johnson, C. E., Collins, W. J., Stevenson, D. S., and Derwent, R. G.: Relative roles of climate and emissions changes on future tropospheric oxidant concentrations, J. Geophys. Res.-Atmos., 104, 18631–18645, https://doi.org/10.1029/1999JD900204, 1999.
Jones, C. D., Hughes, J. K., Bellouin, N., Hardiman, S. C., Jones, G. S., Knight, J., Liddicoat, S., O'Connor, F. M., Andres, R. J., Bell, C., Boo, K.-O., Bozzo, A., Butchart, N., Cadule, P., Corbin, K. D., Doutriaux-Boucher, M., Friedlingstein, P., Gornall, J., Gray, L., Halloran, P. R., Hurtt, G., Ingram, W. J., Lamarque, J.-F., Law, R. M., Meinshausen, M., Osprey, S., Palin, E. J., Parsons Chini, L., Raddatz, T., Sanderson, M. G., Sellar, A. A., Schurer, A., Valdes, P., Wood, N., Woodward, S., Yoshioka, M., and Zerroukat, M.: The HadGEM2-ES implementation of CMIP5 centennial simulations, Geosci. Model Dev., 4, 543–570, https://doi.org/10.5194/gmd-4-543-2011, 2011.
Kesik, M., Brüggemann, N., Forkel, R., Kiese, R., Knoche, R., Li, C., Seufert, G., Simpson, D. W., and Butterbach-Bahl, K.: Future scenarios of N2O and NO emissions from European forest soils, J. Geophys. Res., 111, G02018, https://doi.org/10.1029/2005JG000115, 2006.
Kirtman, B., Power, S. B., Adedoyin, J. A., Boer, G. J., Bojariu, R., Camilloni, I., Doblas-Reyes, F. J., Fiore, A. M., Kimoto, M., Meehl, G. A., Prather, M., Sarr, A., Schär, C., Sutton, R., van Oldenborgh, G. J., Vecchi, G., and Wang, H. J.: Near-term Climate Change: Projections and Predictability, in: Climate Change 2013: The Physical Science Basis. Contribution of Working Group I to the Fifth Assessment Report of the Intergovernmental Panel on Climate Change, edited by: Stocker, T. F., Qin, D., Plattner, G.-K., Tignor, M., Allen, S. K., Boschung, J., Nauels, A., Xia, Y., Bex, V., and Midgley, P. M., Cambridge University Press, Cambridge, United Kingdom and New York, NY, USA, https://www.ipcc.ch/site/assets/uploads/2018/02/WG1AR5_Chapter11_FINAL.pdf (last access: 1 November 2025), 2013.
Lacressonnière, G., Peuch, V.-H., Vautard, R., Arteta, J., Déqué, M., Joly, M., Josse, B., Marécal, V., and Saint-Martin, D.: European air quality in the 2030s and 2050s: Impacts of global regional emission trends and of climate change, Atmos. Environ., 92, 348–358, https://doi.org/10.1016/j.atmosenv.2014.04.033, 2014.
Lacressonnière, G., Foret, G., Beekmann, M., Siour, G., Engardt, M., Gauss, M., Watson, L., Andersson, C., Colette, A., Josse, B., Marécal, V., Nyiri, A., and Vautard, R.: Impacts of regional climate change on air quality projections and associated uncertainties, Climatic Change, 136, 309–324, https://doi.org/10.1007/s10584-016-1619-z, 2016.
Lamarque, J.-F., Bond, T. C., Eyring, V., Granier, C., Heil, A., Klimont, Z., Lee, D., Liousse, C., Mieville, A., Owen, B., Schultz, M. G., Shindell, D., Smith, S. J., Stehfest, E., Van Aardenne, J., Cooper, O. R., Kainuma, M., Mahowald, N., McConnell, J. R., Naik, V., Riahi, K., and van Vuuren, D. P.: Historical (1850–2000) gridded anthropogenic and biomass burning emissions of reactive gases and aerosols: methodology and application, Atmos. Chem. Phys., 10, 7017–7039, https://doi.org/10.5194/acp-10-7017-2010, 2010.
Langner, J., Engardt, M., Baklanov, A., Christensen, J. H., Gauss, M., Geels, C., Hedegaard, G. B., Nuterman, R., Simpson, D., Soares, J., Sofiev, M., Wind, P., and Zakey, A.: A multi-model study of impacts of climate change on surface ozone in Europe, Atmos. Chem. Phys., 12, 10423–10440, https://doi.org/10.5194/acp-12-10423-2012, 2012.
Laville, P., Flura, D., Gabrielle, B., Loubet, B., Fanucci, O., Rolland, M. N., and Cellier, P.: Characterisation of soil emissions of nitric oxide at field and laboratory scale using high resolution method, Atmos. Environ., 43, 2648–2658, https://doi.org/10.1016/j.atmosenv.2009.01.043, 2009.
Lin, C., Heal, M. R., Vieno, M., MacKenzie, I. A., Armstrong, B. G., Butland, B. K., Milojevic, A., Chalabi, Z., Atkinson, R. W., Stevenson, D. S., Doherty, R. M., and Wilkinson, P.: Spatiotemporal evaluation of EMEP4UK-WRF v4.3 atmospheric chemistry transport simulations of health-related metrics for NO2, O3, PM10, and PM2.5 for 2001–2010, Geosci. Model Dev., 10, 1767–1787, https://doi.org/10.5194/gmd-10-1767-2017, 2017.
Lin, G., Penner, J. E., and Zhou, C.: How will SOA change in the future?, Geophys. Res. Lett., 43, 1718–1726, https://doi.org/10.1002/2015GL067137, 2016.
Liu, J., Wang, X., Wu, D., Ji, M., Wei, H., and Li, Y.: Historical footprints and future projections of global dust burden from bias-corrected CMIP6 models, npj Clim. Atmos. Sci., 7, 1, https://doi.org/10.1038/s41612-023-00550-9, 2024.
Lu, X., Zhang, L., and Shen, L.: Meteorology and climate influences on tropospheric ozone: a review of natural sources, chemistry, and transport patterns, Curr. Pollut. Rep., 5, 238–260, https://doi.org/10.1007/s40726-019-00118-3, 2019.
Malkin, T. L., Heard, D. E., Hood, C., Stocker, J., Carruthers, D., MacKenzie, I. A., Doherty, R. M., Vieno, M., Lee, J., Kleffmann, J., Laufs, S., and Whalley, L. K.: Assessing chemistry schemes and constraints in air quality models used to predict ozone in London against the detailed Master Chemical Mechanism, Faraday Discuss., 189, 589–616, https://doi.org/10.1039/C5FD00218D, 2016.
Meinshausen, M., Smith, S. J., Calvin, K., Daniel, J. S., Kainuma, M. L. T., Lamarque, J.-F., Matsumoto, K., Montzka, S. A., Raper, S. C. B., Riahi, K., Thomson, A., Velders, G. J. M., and van Vuuren, D. P.: The RCP greenhouse gas concentrations and their extensions from 1765 to 2500, Climatic Change, 109, 213–241, https://doi.org/10.1007/s10584-011-0156-z, 2011.
MOHC – Met Office Hadley Centre: WCRP CMIP5: Met Office Hadley Centre (MOHC) HadGEM2-ES model output collection, Centre for Environmental Data Analysis, https://catalogue.ceda.ac.uk/uuid/216becee8a6844ba8f8f98b9f075a635 (last access: 8 December 2025), 2012.
Murphy, J. M., Harris, G. R., Sexton, D. M. H., Kendon, E. J., Bett, P. E., Clark, R. T., Eagle, K. E., Fosser, G., Fung, F., Lowe, J., McDonald, R. E., McInnes, R. N., McSweeney, C. F., Mitchell, J. F. B., Rostron, J. W., Thornton, H. E., Tucker, S., and Yamazaki, K.: UKCP18 Land Projections: Science Report, Met Office, https://www.metoffice.gov.uk/pub/data/weather/uk/ukcp18/science-reports/UKCP18-Land-report.pdf (last access: 10 September 2024), 2018.
Ots, R., Young, D. E., Vieno, M., Xu, L., Dunmore, R. E., Allan, J. D., Coe, H., Williams, L. R., Herndon, S. C., Ng, N. L., Hamilton, J. F., Bergström, R., Di Marco, C., Nemitz, E., Mackenzie, I. A., Kuenen, J. J. P., Green, D. C., Reis, S., and Heal, M. R.: Simulating secondary organic aerosol from missing diesel-related intermediate-volatility organic compound emissions during the Clean Air for London (ClearfLo) campaign, Atmos. Chem. Phys., 16, 6453–6473, https://doi.org/10.5194/acp-16-6453-2016, 2016.
Pan, X., Ichoku, C., Chin, M., Bian, H., Darmenov, A., Colarco, P., Ellison, L., Kucsera, T., da Silva, A., Wang, J., Oda, T., and Cui, G.: Six global biomass burning emission datasets: intercomparison and application in one global aerosol model, Atmos. Chem. Phys., 20, 969–994, https://doi.org/10.5194/acp-20-969-2020, 2020.
Park, I. H. and Yeh, S. W.: Projections of the North Atlantic warming hole can be constrained using ocean surface density as an emergent constraint, Commun. Earth Environ., 5, 98, https://doi.org/10.1038/s43247-024-01269-y, 2024.
Pye, H. O. T., Liao, H., Wu, S., Mickley, L. J., Jacob, D. J., Henze, D. K., and Seinfeld, J. H.: Effect of changes in climate and emissions on future sulfate-nitrate-ammonium aerosol levels in the United States, J. Geophys. Res.-Atmos., 114, D01205, https://doi.org/10.1029/2008JD010701, 2009.
Racherla, P. N. and Adams, P. J.: Sensitivity of global tropospheric ozone and fine particulate matter concentrations to climate change, J. Geophys. Res.-Atmos., 111, D24103, https://doi.org/10.1029/2005JD006939, 2006.
RS – The Royal Society: Effects of net-zero policies and climate change on air quality, The Royal Society, ISBN 978-1-78252-558-5, https://royalsociety.org/-/media/policy/projects/air-quality/air-quality-and-climate-change-report.pdf (last access: 10 December 2025), 2021.
Schnell, J. L., Prather, M. J., Josse, B., Naik, V., Horowitz, L. W., Zeng, G., Shindell, D. T., and Faluvegi, G.: Effect of climate change on surface ozone over North America, Europe, and East Asia, Geophys. Res. Lett., 43, 3509–3518, https://doi.org/10.1002/2016GL068060, 2016.
Shindell, D. T., Faluvegi, G., Koch, D. M., Schmidt, G. A., Unger, N., and Bauer, S. E.: Improved attribution of climate forcing to emissions, Science, 326, 716–718, https://doi.org/10.1126/science.1174760, 2009.
Silva, R. A., West, J. J., Lamarque, J.-F., Shindell, D. T., Collins, W. J., Faluvegi, G., Folberth, G. A., Horowitz, L. W., Nagashima, T., Naik, V., Rumbold, S. T., Sudo, K., Takemura, T., Bergmann, D., Cameron-Smith, P., Doherty, R. M., Josse, B., MacKenzie, I. A., Stevenson, D. S., and Zeng, G.: Future global mortality from changes in air pollution attributable to climate change, Nat. Clim. Change, 7, 647–651, https://doi.org/10.1038/nclimate3354, 2017.
Simpson, D., Benedictow, A., Berge, H., Bergström, R., Emberson, L. D., Fagerli, H., Flechard, C. R., Hayman, G. D., Gauss, M., Jonson, J. E., Jenkin, M. E., Nyíri, A., Richter, C., Semeena, V. S., Tsyro, S., Tuovinen, J.-P., Valdebenito, Á., and Wind, P.: The EMEP MSC-W chemical transport model – technical description, Atmos. Chem. Phys., 12, 7825–7865, https://doi.org/10.5194/acp-12-7825-2012, 2012.
Simpson, D., Tsyro, S., and Wind, P.: Updates to the EMEP/MSC-W model, in: Transboundary particulate matter, photo-oxidants, acidifying and eutrophying components. EMEP Status Report 1/2015, The Norwegian Meteorological Institute, Oslo, Norway, 129–138, https://emep.int/publ/reports/2015/EMEP_Status_Report_1_2015.pdf (last access: 12 October 2025), 2015.
Smith, S. E., Stocker, J., Seaton, M., and Carruthers, D.: Model inter-comparison and validation study of ADMS plume chemistry schemes, Int. J. Environ. Pollut., 62, 395–406, https://doi.org/10.1504/IJEP.2017.089427, 2017.
Stocker, J., Hood, C., Carruthers, D., and McHugh, C.: ADMS-Urban: developments in modelling dispersion from the city scale to the local scale, Int. J. Environ. Pollut., 50, 308–316, https://doi.org/10.1504/IJEP.2012.051202, 2012.
Taylor, K. E., Stouffer, R. J., and Meehl, G. A.: An overview of CMIP5 and the experiment design, B. Am. Meteorol. Soc., 93, 485–498, https://doi.org/10.1175/BAMS-D-11-00094.1, 2012.
Thornhill, G., Collins, W., Olivié, D., Skeie, R. B., Archibald, A., Bauer, S., Checa-Garcia, R., Fiedler, S., Folberth, G., Gjermundsen, A., Horowitz, L., Lamarque, J.-F., Michou, M., Mulcahy, J., Nabat, P., Naik, V., O'Connor, F. M., Paulot, F., Schulz, M., Scott, C. E., Séférian, R., Smith, C., Takemura, T., Tilmes, S., Tsigaridis, K., and Weber, J.: Climate-driven chemistry and aerosol feedbacks in CMIP6 Earth system models, Atmos. Chem. Phys., 21, 1105–1126, https://doi.org/10.5194/acp-21-1105-2021, 2021.
Turnock, S. T., Allen, R. J., Andrews, M., Bauer, S. E., Deushi, M., Emmons, L., Good, P., Horowitz, L., John, J. G., Michou, M., Nabat, P., Naik, V., Neubauer, D., O'Connor, F. M., Olivié, D., Oshima, N., Schulz, M., Sellar, A., Shim, S., Takemura, T., Tilmes, S., Tsigaridis, K., Wu, T., and Zhang, J.: Historical and future changes in air pollutants from CMIP6 models, Atmos. Chem. Phys., 20, 14547–14579, https://doi.org/10.5194/acp-20-14547-2020, 2020.
Turnock, S. T., Allen, R., Archibald, A. T., Dalvi, M., Folberth, G. A., Griffiths, P. T., Keeble, J., Robertson, E., and O'Connor, F. M.: The future climate and air quality response from different near-term climate forcer, climate, and land-use scenarios using UKESM1, Earths Future, 10, e2022EF002687, https://doi.org/10.1029/2022EF002687, 2022.
Venkatram, A., Karamchandani, P., Pai, P., and Goldstein, R.: The development and application of a simplified ozone modeling system (SOMS), Atmos. Environ., 28, 3665–3678, https://doi.org/10.1016/1352-2310(94)00190-V, 1994.
Vieno, M., Dore, A. J., Stevenson, D. S., Doherty, R., Heal, M. R., Reis, S., Hallsworth, S., Tarrason, L., Wind, P., Fowler, D., Simpson, D., and Sutton, M. A.: Modelling surface ozone during the 2003 heat-wave in the UK, Atmos. Chem. Phys., 10, 7963–7978, https://doi.org/10.5194/acp-10-7963-2010, 2010.
Vieno, M., Heal, M. R., Hallsworth, S., Famulari, D., Doherty, R. M., Dore, A. J., Tang, Y. S., Braban, C. F., Leaver, D., Sutton, M. A., and Reis, S.: The role of long-range transport and domestic emissions in determining atmospheric secondary inorganic particle concentrations across the UK, Atmos. Chem. Phys., 14, 8435–8447, https://doi.org/10.5194/acp-14-8435-2014, 2014.
Vieno, M., Heal, M. R., Williams, M. L., Carnell, E. J., Nemitz, E., Stedman, J. R., and Reis, S.: The sensitivities of emissions reductions for the mitigation of UK PM2.5, Atmos. Chem. Phys., 16, 265–276, https://doi.org/10.5194/acp-16-265-2016, 2016.
Watson, L. A., Shallcross, D. E., Utembe, S. R., and Jenkin, M. E.: A Common Representative Intermediates (CRI) mechanism for VOC degradation, Part 2: Gas phase mechanism reduction, Atmos. Environ., 42, 7196–7204, https://doi.org/10.1016/j.atmosenv.2008.07.034, 2008.
West, J. J., Smith, S. J., Silva, R. A., Naik, V., Zhang, Y., Adelman, Z., Fry, M. M., Anenberg, S. C., Horowitz, L. W., and Lamarque, J.-F.: Co-benefits of mitigating global greenhouse gas emissions for future air quality and human health, Nat. Clim. Change, 3, 885–889, https://doi.org/10.1038/nclimate2009, 2013.
World Health Organization: WHO global air quality guidelines: particulate matter (PM2.5 and PM10), ozone, nitrogen dioxide, sulfur dioxide and carbon monoxide, World Health Organization, Geneva, ISBN 9789240034228, https://www.who.int/publications/i/item/9789240034228 (last access: 11 December 2025), 2021.
Wu, S., Mickley, L. J., Leibensperger, E. M., Jacob, D. J., Rind, D., and Streets, D. G.: Effects of 2000–2050 global change on ozone air quality in the United States, J. Geophys. Res.-Atmos., 113, D06302, https://doi.org/10.1029/2007JD008917, 2008.
Young, P. J., Archibald, A. T., Bowman, K. W., Lamarque, J.-F., Naik, V., Stevenson, D. S., Tilmes, S., Voulgarakis, A., Wild, O., Bergmann, D., Cameron-Smith, P., Cionni, I., Collins, W. J., Dalsøren, S. B., Doherty, R. M., Eyring, V., Faluvegi, G., Horowitz, L. W., Josse, B., Lee, Y. H., MacKenzie, I. A., Nagashima, T., Plummer, D. A., Righi, M., Rumbold, S. T., Skeie, R. B., Shindell, D. T., Strode, S. A., Sudo, K., Szopa, S., and Zeng, G.: Pre-industrial to end 21st century projections of tropospheric ozone from the Atmospheric Chemistry and Climate Model Intercomparison Project (ACCMIP), Atmos. Chem. Phys., 13, 2063–2090, https://doi.org/10.5194/acp-13-2063-2013, 2013.
Zanis, P., Akritidis, D., Turnock, S., Naik, V., Szopa, S., Georgoulias, A. K., Bauer, S. E., Deushi, M., Horowitz, L. W., Keeble, J., Le Sager, P., O'Connor, F. M., Oshima, N., Tsigaridis, K., and van Noije, T.: Climate change penalty and benefit on surface ozone: A global perspective based on CMIP6 Earth system models, Environ. Res. Lett., 17, 024014, https://doi.org/10.1088/1748-9326/ac4a34, 2022.
Zeng, G. and Pyle, J. A.: Changes in tropospheric ozone between 2000 and 2100 modeled in a chemistry-climate model, Geophys. Res. Lett., 30, 1392, https://doi.org/10.1029/2002GL016708, 2003.
Zhao, J., Zhang, Y., Bie, S., Bilsback, K. R, Jeffrey, R. Pierce, J. R., and Chen, Y.: Changes in global DMS production driven by increased CO2 levels and its impact on radiative forcing, npj Clim. Atmos. Sci., 7, 18, https://doi.org/10.1038/s41612-024-00563-y, 2024.
- Abstract
- Introduction
- Methods
- Regional-scale climate change impacts over Europe
- Climate change impacts over the UK and for London
- Implications for achieving long-term and short-term WHO guidelines
- Conclusions
- Appendix A: Additional figures and tables
- Data availability
- Author contributions
- Competing interests
- Disclaimer
- Acknowledgements
- Financial support
- Review statement
- References
- Abstract
- Introduction
- Methods
- Regional-scale climate change impacts over Europe
- Climate change impacts over the UK and for London
- Implications for achieving long-term and short-term WHO guidelines
- Conclusions
- Appendix A: Additional figures and tables
- Data availability
- Author contributions
- Competing interests
- Disclaimer
- Acknowledgements
- Financial support
- Review statement
- References