the Creative Commons Attribution 4.0 License.
the Creative Commons Attribution 4.0 License.
 | 08 Sep 2025
Tropical cirrus evolution in a kilometer-scale model with improved ice microphysics
Blaž Gasparini
Rachel Atlas
Aiko Voigt
Martina Krämer
Peter N. Blossey
Tropical cirrus clouds form through in situ ice nucleation below the homogeneous freezing temperature of water or through detrainment from deep convection. Despite their importance, limited understanding of their evolution and formation pathways contributes to large uncertainty in climate projections. To address these challenges, we implement novel passive tracers in the System for Atmospheric Modeling (SAM) cloud-resolving model to track the three-dimensional development of cirrus clouds. One tracer tracks air parcels exiting convective updrafts, revealing a rapid decline in ice crystal size and number as anvils age. Another tracer focuses on in situ cirrus, capturing their formation in the cold upper atmosphere and the subsequent reduction in their ice crystal number over time. We find that in situ cirrus dominate at colder temperatures and lower ice water contents, while anvil cirrus prevail at temperatures > −60 °C. Despite the frequent occurrence of in situ cirrus within the tropical tropopause layer, they account for only 6 %–7 % of the total tropical cirrus cloud top-of-the-atmosphere radiative effect. These findings improve our ability to assess the distinct roles of convective and in situ cirrus in shaping tropical cirrus properties and their impacts on climate.
We also improve the model's representation of tropical cirrus through simple, computationally inexpensive microphysics modifications, improving agreement with tropical aircraft observations. We show that updrafts critical for tropical cirrus formation are only resolved in our simulations at a horizontal grid spacing of 250 m – much finer than those used in global storm-resolving models.
- Article
(8443 KB) - Full-text XML
- BibTeX
- EndNote


Tropical cirrus clouds, defined as ice clouds with tops at temperatures colder than −40 °C, dominate regions of tropical ascent in both cloud fraction and radiative effects (Berry and Mace, 2014; Hartmann and Berry, 2017). These clouds are diverse, with their origins and properties shaped by distinct formation mechanisms: convective cirrus originating from deep convective updrafts and in situ cirrus that are formed by ice nucleation in the cold tropical upper troposphere. Understanding the relative contributions and characteristics of these two cloud types is crucial for improving their representation in atmospheric models. The distinction between convective and in situ cirrus has practical implications for climate projections, as their formation mechanisms may respond differently to greenhouse gas forcing, potentially leading to different cloud feedbacks.
Convective cirrus, or anvil clouds, are initially thick and optically dense but rapidly lose mass through precipitation as they spread horizontally over large areas (Gasparini et al., 2021). Over time, they evolve into thinner clouds, often with optical depths of 1 to 2, which represent the most common form of tropical cirrus (Sokol and Hartmann, 2020). In contrast, in situ cirrus typically form in the tropical tropopause layer (TTL), above the mean detrainment level of convection. These clouds arise from ice nucleation triggered by small-scale dynamical processes, such as gravity-wave-induced temperature and wind fluctuations (Hoyle et al., 2005; Kim et al., 2016; Chang and Ecuyer, 2020; Bramberger et al., 2022). Unlike anvils, in situ cirrus are optically thin and display distinct microphysical properties, such as ice crystals smaller than 20 µm (Krämer et al., 2020a).
This study focuses on the life cycle and microphysical evolution of both anvil and in situ cirrus. Snapshots or long-term averages of cloud properties, typically provided by model output or observations, do not reveal enough information to fully understand the processes that shape tropical cirrus. Lagrangian methods, such as tracking cloud properties using trajectories, have been widely used in both models (Wernli et al., 2016; Gasparini et al., 2021; Sullivan et al., 2022) and observations (Horner and Gryspeerdt, 2023; Jeggle et al., 2024). Passive tracers, an alternative approach to disentangle the origin and evolution of cirrus clouds, are more flexible in their use compared to trajectories, easier to implement, and computationally more efficient.
Tropical cirrus formation is shaped by processes spanning a wide range of spatial and temporal scales, from microphysical mechanisms such as ice nucleation, deposition, and sublimation to dynamical influences including gravity waves, turbulence, and mesoscale circulations (Corcos et al., 2023; Jensen et al., 2024; Gasparini et al., 2022). However, even the most advanced models struggle to capture these complexities. Anvils originate in deep convective updrafts, which are unresolved in traditional general circulation models (GCMs). Although global storm-resolving models (GSRMs) with kilometer-scale grid spacings capture larger-scale convective dynamics, they fail to resolve the fine-scale dynamics critical to both anvil and in situ cirrus life cycles (Atlas and Bretherton, 2023; Köhler et al., 2023; Achatz et al., 2024).
Moreover, GSRMs show large variability in simulating the microphysical properties of tropical cirrus (Atlas et al., 2024) and their radiative effects (Turbeville et al., 2022), sometimes performing worse than traditional GCMs. This reflects the trade-offs inherent in GSRMs, where the computational costs of high horizontal resolution are typically offset by simplified parameterizations of subgrid processes, particularly cloud microphysics.
In this work, we demonstrate that simple and inexpensive modifications to cloud microphysics can largely improve the simulation of tropical cirrus. By tracking cloudy air parcels from detrainment or in situ nucleation, we identify key differences in their life cycle and microphysical properties, offering new insights into their respective contributions to tropical cirrus climatology and their radiative impacts. Furthermore, while kilometer-scale GSRMs can resolve updrafts near deep convection, we show that the dynamics critical for cirrus cloud formation in non-convective regions are only resolved at hectometer-scale grid spacings. These findings highlight some limitations of current modeling approaches and provide a pathway toward a more accurate representation of tropical cirrus in climate models.
2.1 Model
We use the System for Atmospheric Modeling (SAM) cloud-resolving model (Khairoutdinov and Randall, 2003) version 6.10.9. SAM uses a 1.5-order Smagorinsky-type closure scheme to represent subgrid-scale turbulence and subgrid-scale motions. The time step in SAM is adaptive and set based on the Courant–Friedrichs–Lewy criterion, which typically leads to a time step of about 4.5 s for simulations at the horizontal grid spacing of 1 km. Radiative fluxes and heating rates are computed with the Rapid Radiative Transfer Model for GCMs (RRTMG; Mlawer et al., 1997; Iacono et al., 2008), which is called every 3 min. Cloud and precipitation processes use the Predicted Particle Property (P3; Morrison and Milbrandt, 2015) microphysical scheme version 3.1.14.
2.1.1 Description and issues of ice nucleation in the standard P3 scheme
In mixed-phase conditions, ice crystals are formed by the following processes (Fig. 1a).
-
Immersion freezing of cloud droplets and rain: a volume-dependent formulation from Bigg (1953) with parameters following Barklie and Gokhale (1959).
-
Deposition nucleation: a temperature-dependent formulation by Cooper (1986) that is limited to relative humidities with respect to ice (RHice) of > 105 % and temperatures colder than −15 °C. Alternatively, a supersaturation-dependent Meyers et al. (1992) parameterization can be used. The maximum number of newly nucleated ice crystals for both deposition freezing mechanisms is limited to 0.1 cm−3 s−1.
-
Homogeneous freezing of cloud droplets and rain: occurs instantaneously at a temperature of −40 °C.
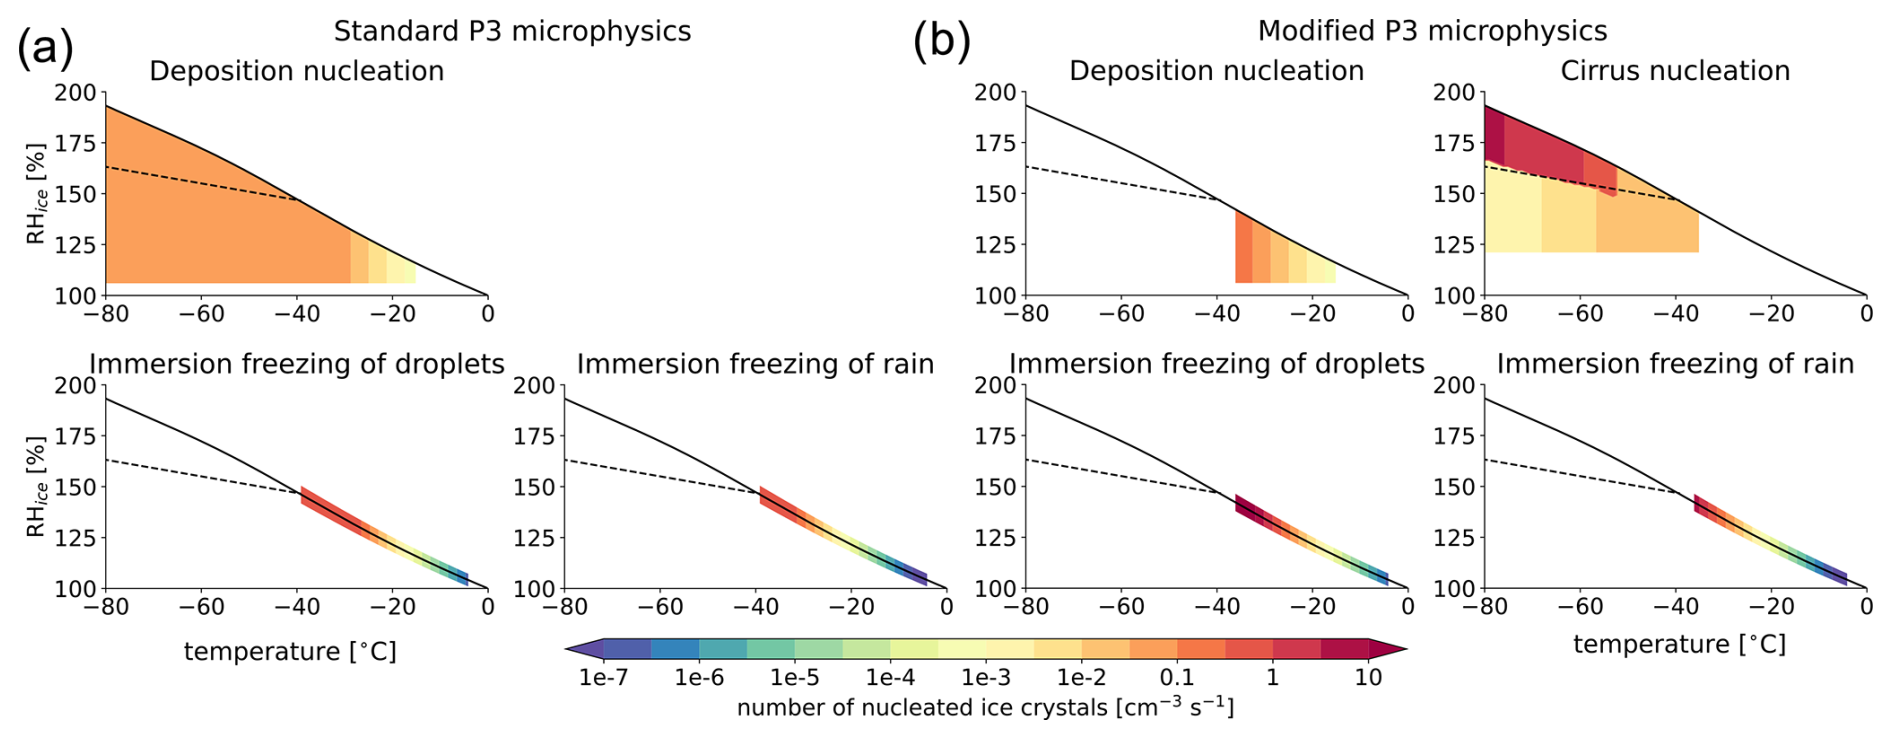
Figure 1A visualization of the number of nucleated ice crystals from ice-nucleating schemes in (a) the standard P3 freezing scheme and (b) its modified version. The solid line represents water saturation, and the dashed line represents the homogeneous nucleation limit following Koop et al. (2000).
Ice crystals continue to be nucleated at temperatures below −40 °C using the Cooper (1986) or Meyers et al. (1992) parameterizations, even though these schemes are not designed for such conditions. Moreover, nucleation events at such cold temperatures always lead to ice crystal concentrations of 0.1 cm−3 s−1, as set by the ice nucleation limit. Such an approach therefore cannot lead to realistic cloud microphysical properties. Nevertheless, similar approaches to ice nucleation are used in a large number of microphysical schemes beyond the one used here (e.g., Morrison et al., 2005; Thompson et al., 2008).
2.1.2 Modifications to ice nucleation: mixed-phase freezing
Due to issues with freezing parameterizations discussed above, we limit the deposition nucleation parameterizations to temperatures warmer than −37 °C. Moreover, because deposition freezing is thought to be negligible in mixed-phase conditions (e.g., Ansmann et al., 2008; DeMott et al., 2010; Hoose et al., 2008; Lohmann et al., 2016), the ice crystals are allowed to form only in the presence of cloud droplets, effectively changing the deposition freezing parameterizations into a type of condensation freezing. The maximum number of nucleated ice crystals by the modified Cooper (1986) (or, alternatively, Meyers et al., 1992) scheme is increased to 0.15 cm−3 s−1. While these modifications aim to provide a more physically consistent representation of mixed-phase clouds, we did not explicitly evaluate the scheme's performance for this cloud type, as it lies outside the main scope of this study. A number of further refinements would be necessary to achieve a more accurate simulation of mixed-phase clouds, as discussed in Sect. 6.1.
2.1.3 Modifications to ice nucleation: cirrus ice nucleation
As we limited the existing ice nucleation mechanisms to the mixed-phase regime (Sect. 2.1.2), we implement a new ice nucleation scheme for T < −37 °C, which helps mitigate the bias in ice crystal number concentration (ICNC; see also Sect. 3.1 for more detail). The newly implemented approach follows Shi et al. (2015) (Fig. 1b, labeled as cirrus nucleation) and represents the competition between homogeneous and heterogeneous nucleation in cirrus clouds (Liu and Penner, 2005) and the effect of pre-existing ice crystals. The scheme is fed by a predefined, temperature-dependent value of ice-nucleating particles (INPs). In this work, the INP number is set to 2 × 10⁻³ cm−3 at temperatures colder than −70 °C and increases linearly to 20 × 10−3 cm−3 at temperatures of −40 °C and warmer. While the INP number in the upper troposphere is subjected to large uncertainties, the suggested numbers are plausible for relatively clean, aerosol-free environments in the tropical Pacific and follow model-simulated INP concentrations (Gasparini and Lohmann, 2016). The number of sulfate aerosols is set to 20 cm−3 and is thus not a limiting factor in ice nucleation.
2.1.4 Modifications to ice nucleation: ice crystal number limit
Very importantly, the maximum allowed ICNC is relaxed from a very limiting 0.5 to 20 cm−3. Such high concentrations were occasionally observed in aircraft measurements of fresh anvils (Krämer et al., 2020a; Jensen et al., 2018). Increasing the ICNC limit alone was previously shown to change anvil cloud properties, leading to more thin cirrus (e.g., Fig. 11a in Gasparini et al., 2019).
2.1.5 Other changes impacting cirrus
The cirrus nucleation scheme requires the input of an updraft velocity, and we choose to input the sum of the resolved vertical wind and an estimate of subgrid-scale updraft strength derived from the subgrid-scale turbulent kinetic energy (TKESGS) as , given that not all updrafts relevant for cloud formation are resolved at horizontal grid spacings of about 1 km (see more in Sect. 5.2). The WTKE,SGS term is computed assuming that the TKESGS ()) is equally partitioned in the three directions (), and therefore , where .
We use a more accurate formulation for the saturation vapor pressure of liquid water and ice (Murphy and Koop, 2005), replacing the Flatau et al. (1992) formulation, which performs poorly at cold temperatures in the TTL. This change particularly affects in situ ice nucleation at temperatures below −70 °C in the TTL (see Fig. 11 in Murphy and Koop, 2005).
Additionally, we adjust the homogeneous freezing threshold for cloud droplets from −40 to −37 °C. While droplets can freeze over a wide temperature range, larger droplets may freeze as warm as −35 °C (Ickes et al., 2015; Shardt et al., 2022). Despite issues with using a fixed temperature freezing threshold (Herbert et al., 2015), −37 °C is a more physically justified value than the −40 °C used in the reference version of the P3 microphysical scheme.
2.1.6 Passive tracers
We implemented two passive tracers to facilitate the analysis of the tropical cirrus life cycle. The “time after detrainment” or simply “detrainment” tracer, denoted A, evolves as
where m s−1, kg kg−1, and and
where w is the vertical wind, qc and qi the cloud liquid and ice mass mixing ratios, the density temperature anomaly from the domain mean (which is proportional to buoyancy), and τA=80 min is an arbitrary decay timescale for A that allows for analysis of processes on timescales of hours to days. Neglecting the effects of subgrid-scale mixing on the passive tracer, A, the time since detrainment from active convection can be calculated as
The behavior of the tracer in the context of idealized tropical convection is described in the Appendix of Gasparini et al. (2022).
Additionally, we implement an analogous tracer to determine the time after in situ ice nucleation. The tracer is set to 1 in all grid cells with active cirrus ice nucleation and decays elsewhere with the same decay timescale τA. We note that both implemented tracers follow air parcels and not ice crystals, which results in biases when ice crystals sediment out of air parcels.
2.2 Simulation setup
We use a tropical channel setup that is wide in the zonal direction (3888 km) and narrow in the meridional direction (36 km) with double-periodic boundary conditions. The prescribed sea surface temperatures vary sinusoidally in the zonal direction between 24 °C at the domain edge and 28 °C in the middle of the domain. Convection develops over the warmer sea surface temperatures (SSTs) and gives rise to a large-scale overturning circulation in the zonal direction reminiscent of the Walker circulation. Such a “mock-Walker” circulation setup is therefore appropriate for studying the interplay between convection, clouds, and radiation in the tropics (Bretherton et al., 2006; Bretherton, 2007; Wing et al., 2024; Silvers et al., 2023). To accurately represent processes in the TTL, we impose a mean large-scale vertical wind based on observations by Yang et al. (2008). Zonal winds increase linearly with altitude from 0 m s−1 at the surface to 5 m s−1 at altitudes above 14 km. Our “mock-Walker” setup follows the one described in more detail by Blossey et al. (2010). The simulations are performed for 30 d, the last 20 of which are used for analysis.
2.3 In situ observations
For a fairer comparison with model data, which simulates a climate comparable to that of the tropical Pacific, we use airborne data from three campaigns in the tropical western Pacific: the Airborne Tropical TRopopause EXperiment (ATTREX; Jensen et al., 2017); the Pacific Oxidants, Sulfur, Ice, Dehydration, and cONvection experiment (POSIDON; Jensen et al., 2018); and the CONvective TRansport of Active Species in the Tropics (CONTRAST) experiment (Pan et al., 2017).
Vertical wind data are only used from the tropical western Pacific flights of the ATTREX and POSIDON campaigns. The data are sampled using NASA's Meteorological Measurement System (MMS) instrument (Scott et al., 1990), which has a time resolution of 20 Hz. Vertical wind data are corrected by detrending and removing the mean of each flight leg. More details on the processing are described in Atlas and Bretherton (2023).
In situ data for ice cloud properties for the three campaigns are taken from the Krämer et al. (2020a) dataset. The measurement resolution is 1 Hz, with an aircraft velocity of 170 m s−1 in POSIDON and ATTREX and 200 m s−1 in the CONTRAST campaign. The lower limit of detectable particle concentration in a given sampling time depends on the aircraft velocity and sampling area of the respective instrument (Krämer et al., 2020a; Costa et al., 2017). This limits the measurements for CONTRAST of ice crystals at ICNC < 0.01 cm−3 and mean mass ice radii smaller than 35 µm. For consistency, model output under such conditions is not included in the calculation of model performance. Due to the slower aircraft speed and different instrumentation, there is no such limitation for POSIDON and ATTREX. The dataset contains limited measurements within or very near active deep convection (see Fig. A3).
2.4 Satellite retrievals
We use satellite retrievals from the years 2007–2010 for the tropical western Pacific (TWP) (20° S–20° N, 145–180° E), an almost exclusively ocean-covered area characterized by persistent deep convection throughout the year. In the selected years, all the satellite products used have complete data coverage.
2.4.1 DARDAR
This dataset is derived from combined retrievals from the CloudSat Cloud Profiling Radar (Stephens et al., 2008) and the Cloud–Aerosol Lidar with Orthogonal Polarization (CALIOP; Winker et al., 2010). Merged CloudSat radar reflectivity and CALIOP lidar-attenuated backscatter signals were used to build the radar/lidar product (DARDAR; Delanoë and Hogan, 2008, 2010) that estimates ice water content (IWC), effective ice crystal size, and the extinction coefficient. DARDAR has a horizontal footprint of 1.7 km and a vertical resolution of 60 m. We only use the vertically integrated IWC, which includes all frozen hydrometeors and is denoted here as ice water path (IWP). Since the lidar signal is noisier during daytime, resulting in the detection of fewer thin clouds (Avery et al., 2012), we use nighttime-only data. While this may lead to a bias, the diurnal cycle of tropical oceanic convection is small and of second-order importance for the comparison with model results (Wall et al., 2020; Gasparini et al., 2022). As one measure of uncertainty in the retrievals, IWP comparisons are made with both the newest dataset (DARDARv3) and an older version of the retrieval algorithm (DARDARv2) (Cazenave et al., 2019). IWP retrievals in DARDAR products are expected to reliably detect clouds down to an IWP of about 0.5 g m−2 (Sourdeval et al., 2016).
2.4.2 2C-ICE
We also use retrievals of IWP from the Cloudsat and CALIPSO Ice Cloud Property Product (2C-ICE) version RF05 (Deng et al., 2015). Despite originating from the same input data as the DARDAR product, analyzing it along with DARDAR helps quantify the uncertainty in satellite-retrieved quantities.
2.4.3 Cloudsat-Calipso-CERES-MODIS (CCCM)
The CALIPSO-CloudSat-CERES-MODIS (CCCM) dataset (Kato et al., 2011) merges cloud fraction data from the CALIPSO lidar (Winker et al., 2010) and CloudSat radar (Stephens et al., 2008) with the Moderate Resolution Imaging Spectroradiometer (MODIS) IWP data and Clouds and the Earth's Radiant Energy System (CERES) radiative fluxes (Wielicki et al., 1996). MODIS IWP retrievals are unreliable for detection of thin cirrus (IWP smaller than about 4 g m−2; Sourdeval et al., 2016). CCCM's horizontal resolution is about 30 km, equivalent to CERES retrievals. Shortwave (SW) radiative fluxes from CERES used in this work are from the measured fluxes during the 13:30 LT satellite overpass, accounting for diurnally averaged insolation values. Data points with zenith angles greater than 70° are excluded to mitigate issues at high solar zenith angles. Albedo is computed based on incoming and outgoing SW fluxes at the top of the atmosphere (TOA). The average reflected SW flux during the day is calculated by multiplying the albedo by the daily and yearly average incoming radiation, set at 409.6 W m−2, the annual average insolation for the band between 20° S and 20° N (Wing et al., 2018). This ensures that values of radiative fluxes are comparable to the climatological cloud radiative effects.
The TOA albedo (α) and SW cloud radiative effect (CRE) are computed as
In addition, Fig. B2 compares model-computed quantities with directly retrieved radiative fluxes to ensure better consistency with retrievals. SW CRE is thus computed as
The LW CRE is computed as
where OLR is outgoing LW radiation at the TOA.
2.5 Global storm-resolving models from DYAMOND-1
We compare the power spectral density of vertical wind between SAM and four global storm-resolving models (GSRMs) in Sect. 5.2. GSRM simulations were run with the Nonhydrostatic ICosahedral Atmospheric Model (NICAM), Global System for Atmospheric Modeling (gSAM), Finite Volume Cubed-Sphere Dynamical Core (FV3), and Icosahedral Nonhydrostatic Weather and Climate Model (ICON), as part of the DYAMOND-1 experiment (Stevens et al., 2019). The GSRM simulations have horizontal grid spacings of 2.5–5 km and vertical grid spacings of 400–500 m. Vertical winds are analyzed within a square swath in the tropical western Pacific (4° S–4° N, 144–152° E), a region overlapping the aircraft measurements with a climatology comparable to the SAM simulations. Vertical winds are analyzed for model levels closest to 14.2 km, the most common height for ATTREX level-leg sampling.
3.1 Simulated tropical cirrus cloud properties and their comparison with aircraft observations and satellite retrievals
This section first outlines the step-by-step changes implemented in the ice microphysics scheme. We focus on changes under cirrus conditions, limiting the analysis to temperatures colder than −40 °C and ice water contents larger than 10−5 g m−3, which is close to the detectability threshold of the aircraft observations. The data are first presented in the ICNC–ice crystal mean mass radius (from now on: ice number–radius) space, which provides an intuitive aggregated perspective on ice cloud properties (Krämer et al., 2016; Gasparini et al., 2018).
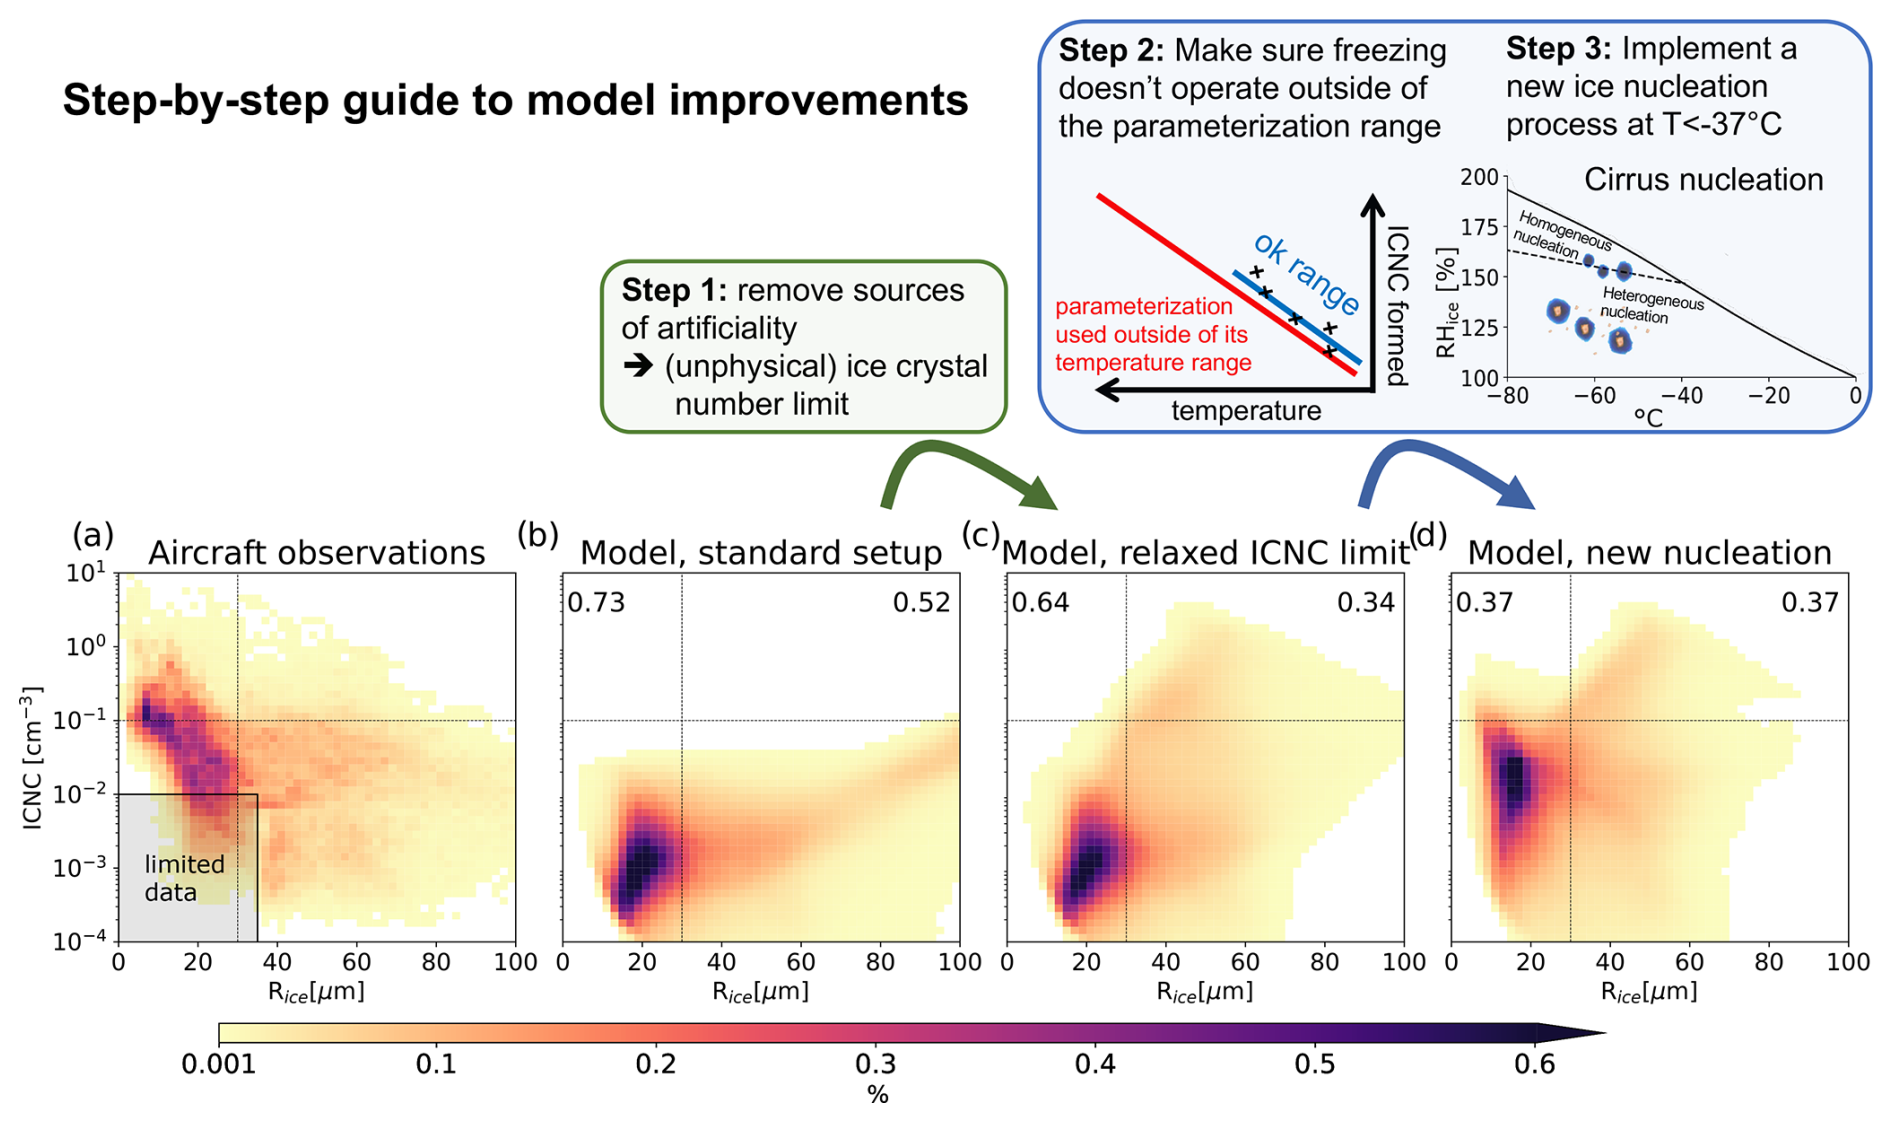
Figure 2Probability density function of ice properties for clouds at T < −40 °C as a function of ICNC and ice mass radius (computed as the radius of a solid ice sphere with mass IWC/ICNC, as in Krämer et al., 2020a) for (a) tropical Pacific aircraft observations and three versions of the SAM model: (b) the standard setup (Sect. 2.1.1), (c) the intermediate model version with a relaxed ICNC limit (Sect. 2.1.4), and (d) the final version with a modified ice nucleation scheme (also including improvements described in Sect. 2.1.2, 2.1.3, and 2.1.5). The numbers in the upper left and right corner represent a 2D total variation distance of model data compared to aircraft observations (the smaller the number, the better the agreement), calculated separately for small (1–30 µm) and large particle sizes (30–120 µm). Observations are limited or not available in the shaded area.
Aircraft observations in Fig. 2a show a peak ICNC between 1 and 10−2 cm−3 for particles with mean mass radii smaller than 30 µm. For concentrations smaller than 10−1 cm−3, the observed particle size often exceeds 50 µm. We note that due to retrieval limits, there are limited measurements available for ice radii smaller than 35 µm at number concentrations below about 10−2 cm−3 (see the Methods section).
The standard version of the SAM model coupled with the P3 scheme (Fig. 2b, Sect. 2.1.1) is strongly biased compared to observations. Most notably, the model drastically underestimates ICNC as it lacks concentrations larger than 3 × 10⁻² cm−3. We resolve a large part of the bias by implementing three key changes to the ice microphysics.
We first relax the maximum ICNC limit from 5 × 10⁻² to 20 cm−3 (Fig. 2c, Sect. 2.1.4). This particularly improves the representation of particles larger than 30 µm, reducing the total variation distance metric (Gibbs and Su, 2002, a 2D analog to the root mean square error) from 0.52 to 0.35. However, the model still strongly underestimates the number densities of small ice crystals in the top left quadrant, indicating errors in parameterizing ice formation under cirrus conditions.
The second key modification addresses the deposition freezing parameterization, which was incorrectly active at temperatures both below and above the homogeneous freezing threshold. Originally calibrated for temperatures warmer than −25 °C (Fig. 1), this parameterization extended far beyond its intended range. We restrict it to T > −37 °C and introduce a scheme to account for competition between homogeneous and heterogeneous nucleation at T < −37 °C (Liu and Penner, 2005; Shi et al., 2015) (Sect. 2.1.2, 2.1.3). We also include a number of small changes to the microphysics, described in Sect. 2.1.5.
All these changes combined cut the microphysical bias in half, improving the representation of both small and large particles (Fig. 2d). Nevertheless, some biases remain. The model continues to underestimate ICNC for small ice crystals and overestimate ICNC for larger crystals. These remaining biases largely originate from persistent challenges in representing ice microphysics (see Sect. 6.1) and from vertical wind variance that is too low in the model (see Sect. 5.2).
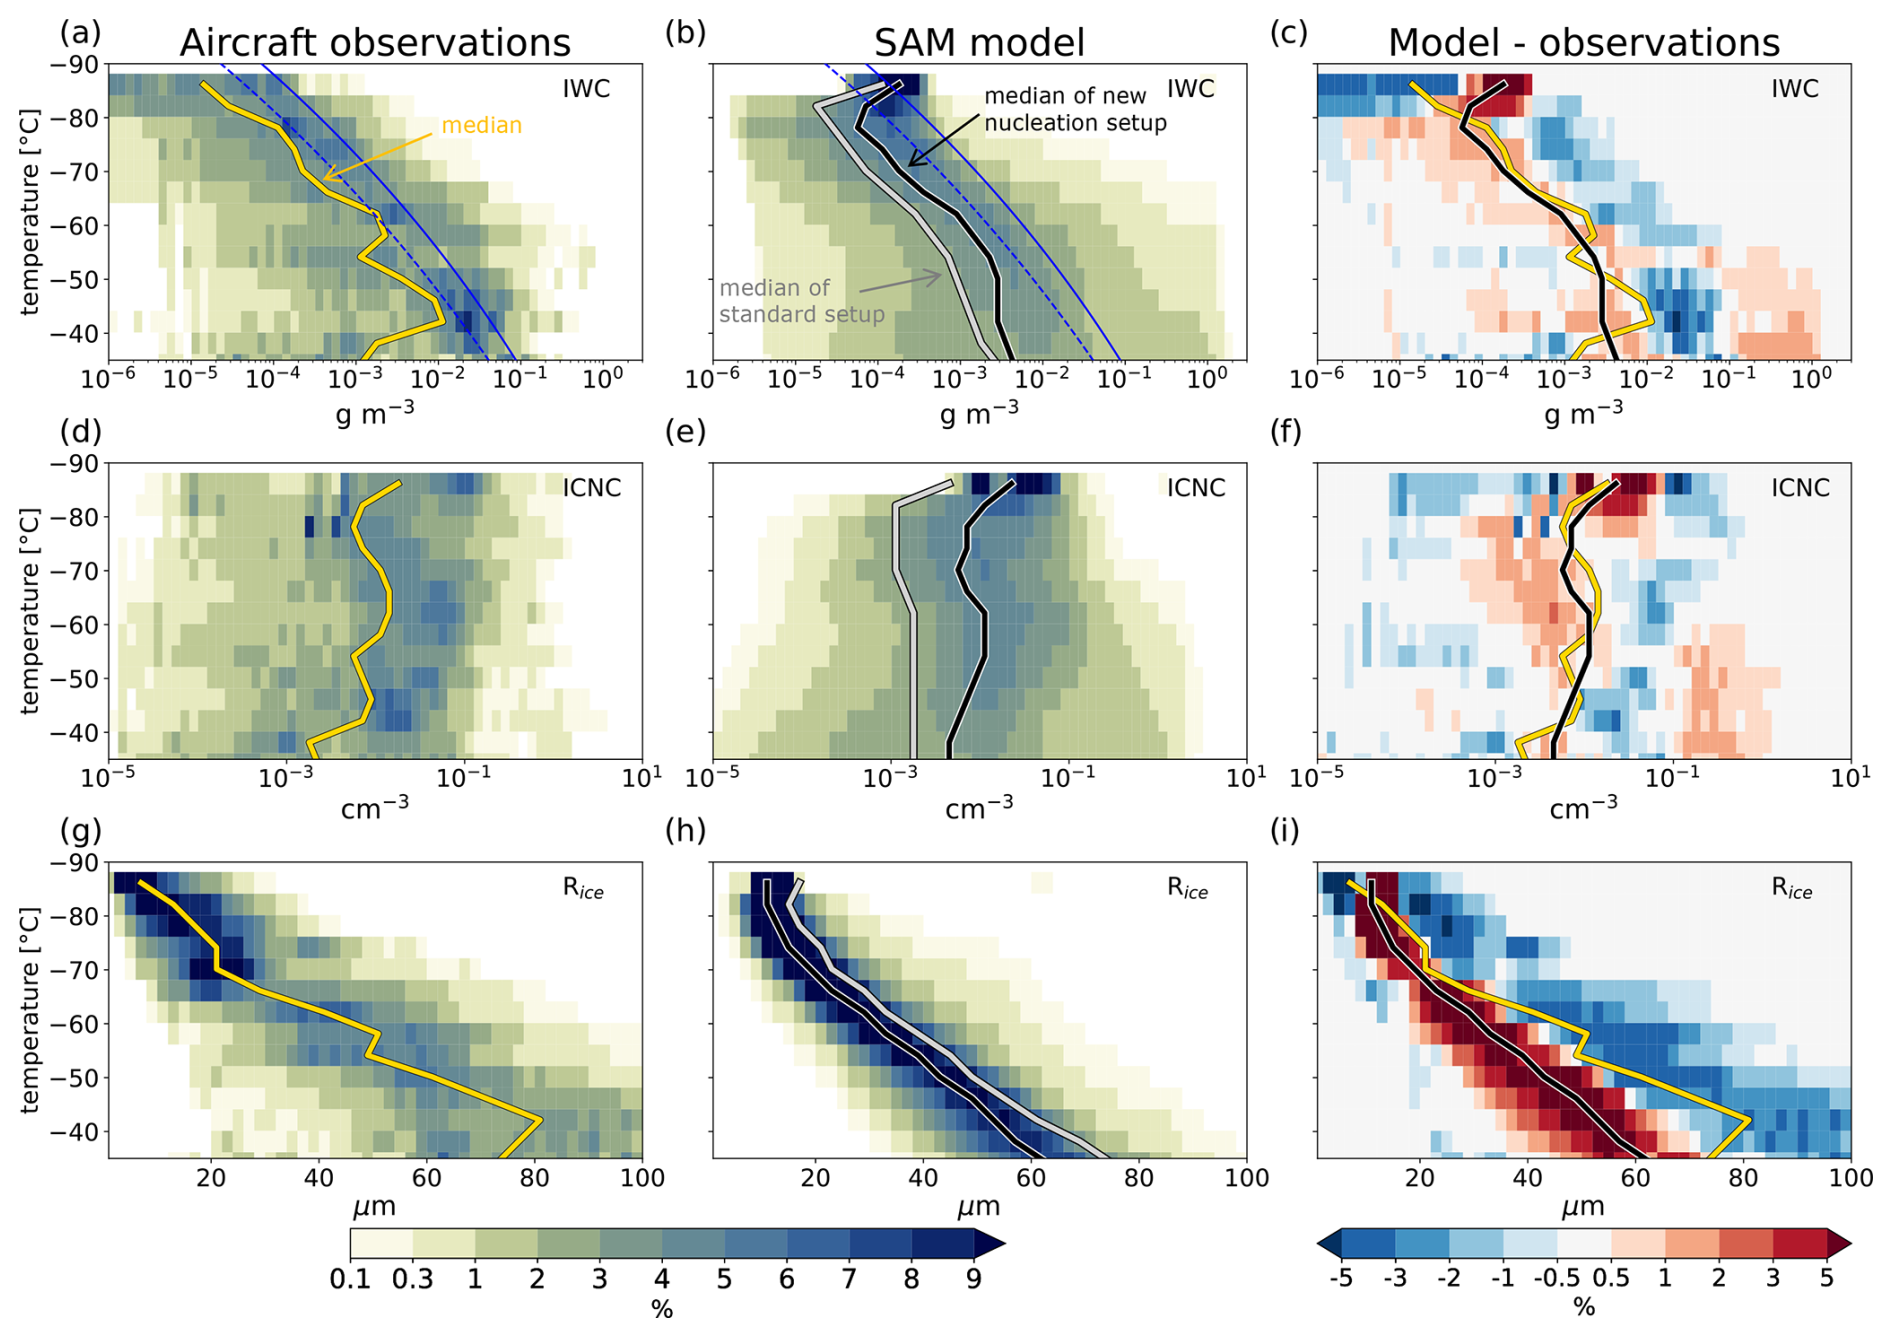
Figure 3Cirrus cloud properties from tropical aircraft measurements (a, d, g) and SAM model simulations with improved microphysics at 1 km horizontal grid spacing (b, e, h). Thick solid lines represent median values. Gray lines in the middle column represent median values of the standard model setup. Panels (c), (f), and (i) display the difference between improved SAM and aircraft data; lines are repeated from the first and second columns for reference. Blue lines in panels (a) and (b) show the theoretical maximum IWC formed locally by vapor deposition under ice-supersaturated conditions based on RHice required to trigger homogeneous nucleation (Koop et al., 2000) (solid) and RHice of 120 %, typical for efficient heterogeneous ice nucleation (dashed). All data are sorted into 4 °C temperature bins, with values normalized to add up to 100 % within each temperature bin.
To provide an alternative perspective, we examine the model's performance by sorting results by temperature. The exponential decrease in IWC with decreasing temperature has improved compared to the standard model version and is well represented by the model (Fig. 3a–c). Both observations and simulations indicate that a substantial portion of IWC must originate at warmer temperatures and be transported upward by convection. This is evident from IWC values that exceed the maximum expected from local ice nucleation and subsequent depositional growth constrained by the Clausius–Clapeyron relationship. The blue lines in Fig. 3a and b illustrate these theoretical limits, derived in Appendix C. They represent the maximum IWC that can form locally through ice nucleation under supersaturated conditions with respect to ice, followed by vapor deposition until saturation is reached.
Observed ICNC shows large variability but only a weak dependence on temperature (Fig. 3d). The model reproduces the observed median and spread, improving the agreement substantially compared to the standard model version (only the gray median is shown). Notably, the model still misses some of the (rather infrequent) high ICNC data points at cold temperatures.
Similarly to IWC, the mean mass radius decreases with temperature, with medians ranging from 80 µm at −40 °C to 15 µm at −80 °C. The model simulates particles that are too small at warmer temperatures (between −65 and −40 °C) and comparable to observations for T < −65 °C. Notably, the spread in simulated particle size is narrower than observed, possibly due to the single-mode description of ice microphysics that is too simple (see Sect. 6.1).
In summary, the temperature-sorted model results offer a complementary perspective on cirrus cloud properties, showing generally good agreement with observations, while also highlighting persistent biases in ICNC at colder temperatures and particle size at warmer temperatures. Nevertheless, this agreement represents a substantial improvement compared with the earlier model version (Fig. 2b), emphasizing processes where further refinement is still needed. The addition of passive tracers discussed in Sect. 4 helps pinpoint processes requiring further refinement, particularly the representation of in situ ice nucleation at cold temperatures.
3.2 The relevance of tropical cirrus for top-of-the-atmosphere radiative fluxes
To link cirrus cloud properties to the TOA radiative budget, we take an integrated perspective and categorize cloud occurrence frequency and radiative effects based on IWP. We neglect infrequent scenes with low clouds underlying thin cirrus, where low clouds are expected to dominate the CRE signal. Figure 4a compares the simulated IWP distribution with four satellite-derived datasets, showing that the improved model generally falls within or near the observed range, which also includes deep convective cores (typically associated with IWP > 103 g m−2, based on Sokol and Hartmann, 2020). We note that this association is statistical and that individual convective cores are unlikely to span a wide range of IWP values. The apparent overrepresentation of the thinnest cirrus in the model and the corresponding slight underestimation of other cloud types in the normalized PDF should not be interpreted as a bias, as satellite retrievals are known to underestimate the thinnest cirrus clouds (Balmes and Fu, 2018; Lesigne et al., 2024). Thin cirrus with IWP < 1 g m−2 make up 52 % of all simulated cirrus but contribute only 6 % to the LW CRE and 5 % to the SW CRE, indicating that their direct radiative impact at the TOA is modest despite their frequency. Focusing on clouds with IWP > 1 g m−2, which have a greater radiative influence, improves the model's agreement with satellite observations (Fig. B1).
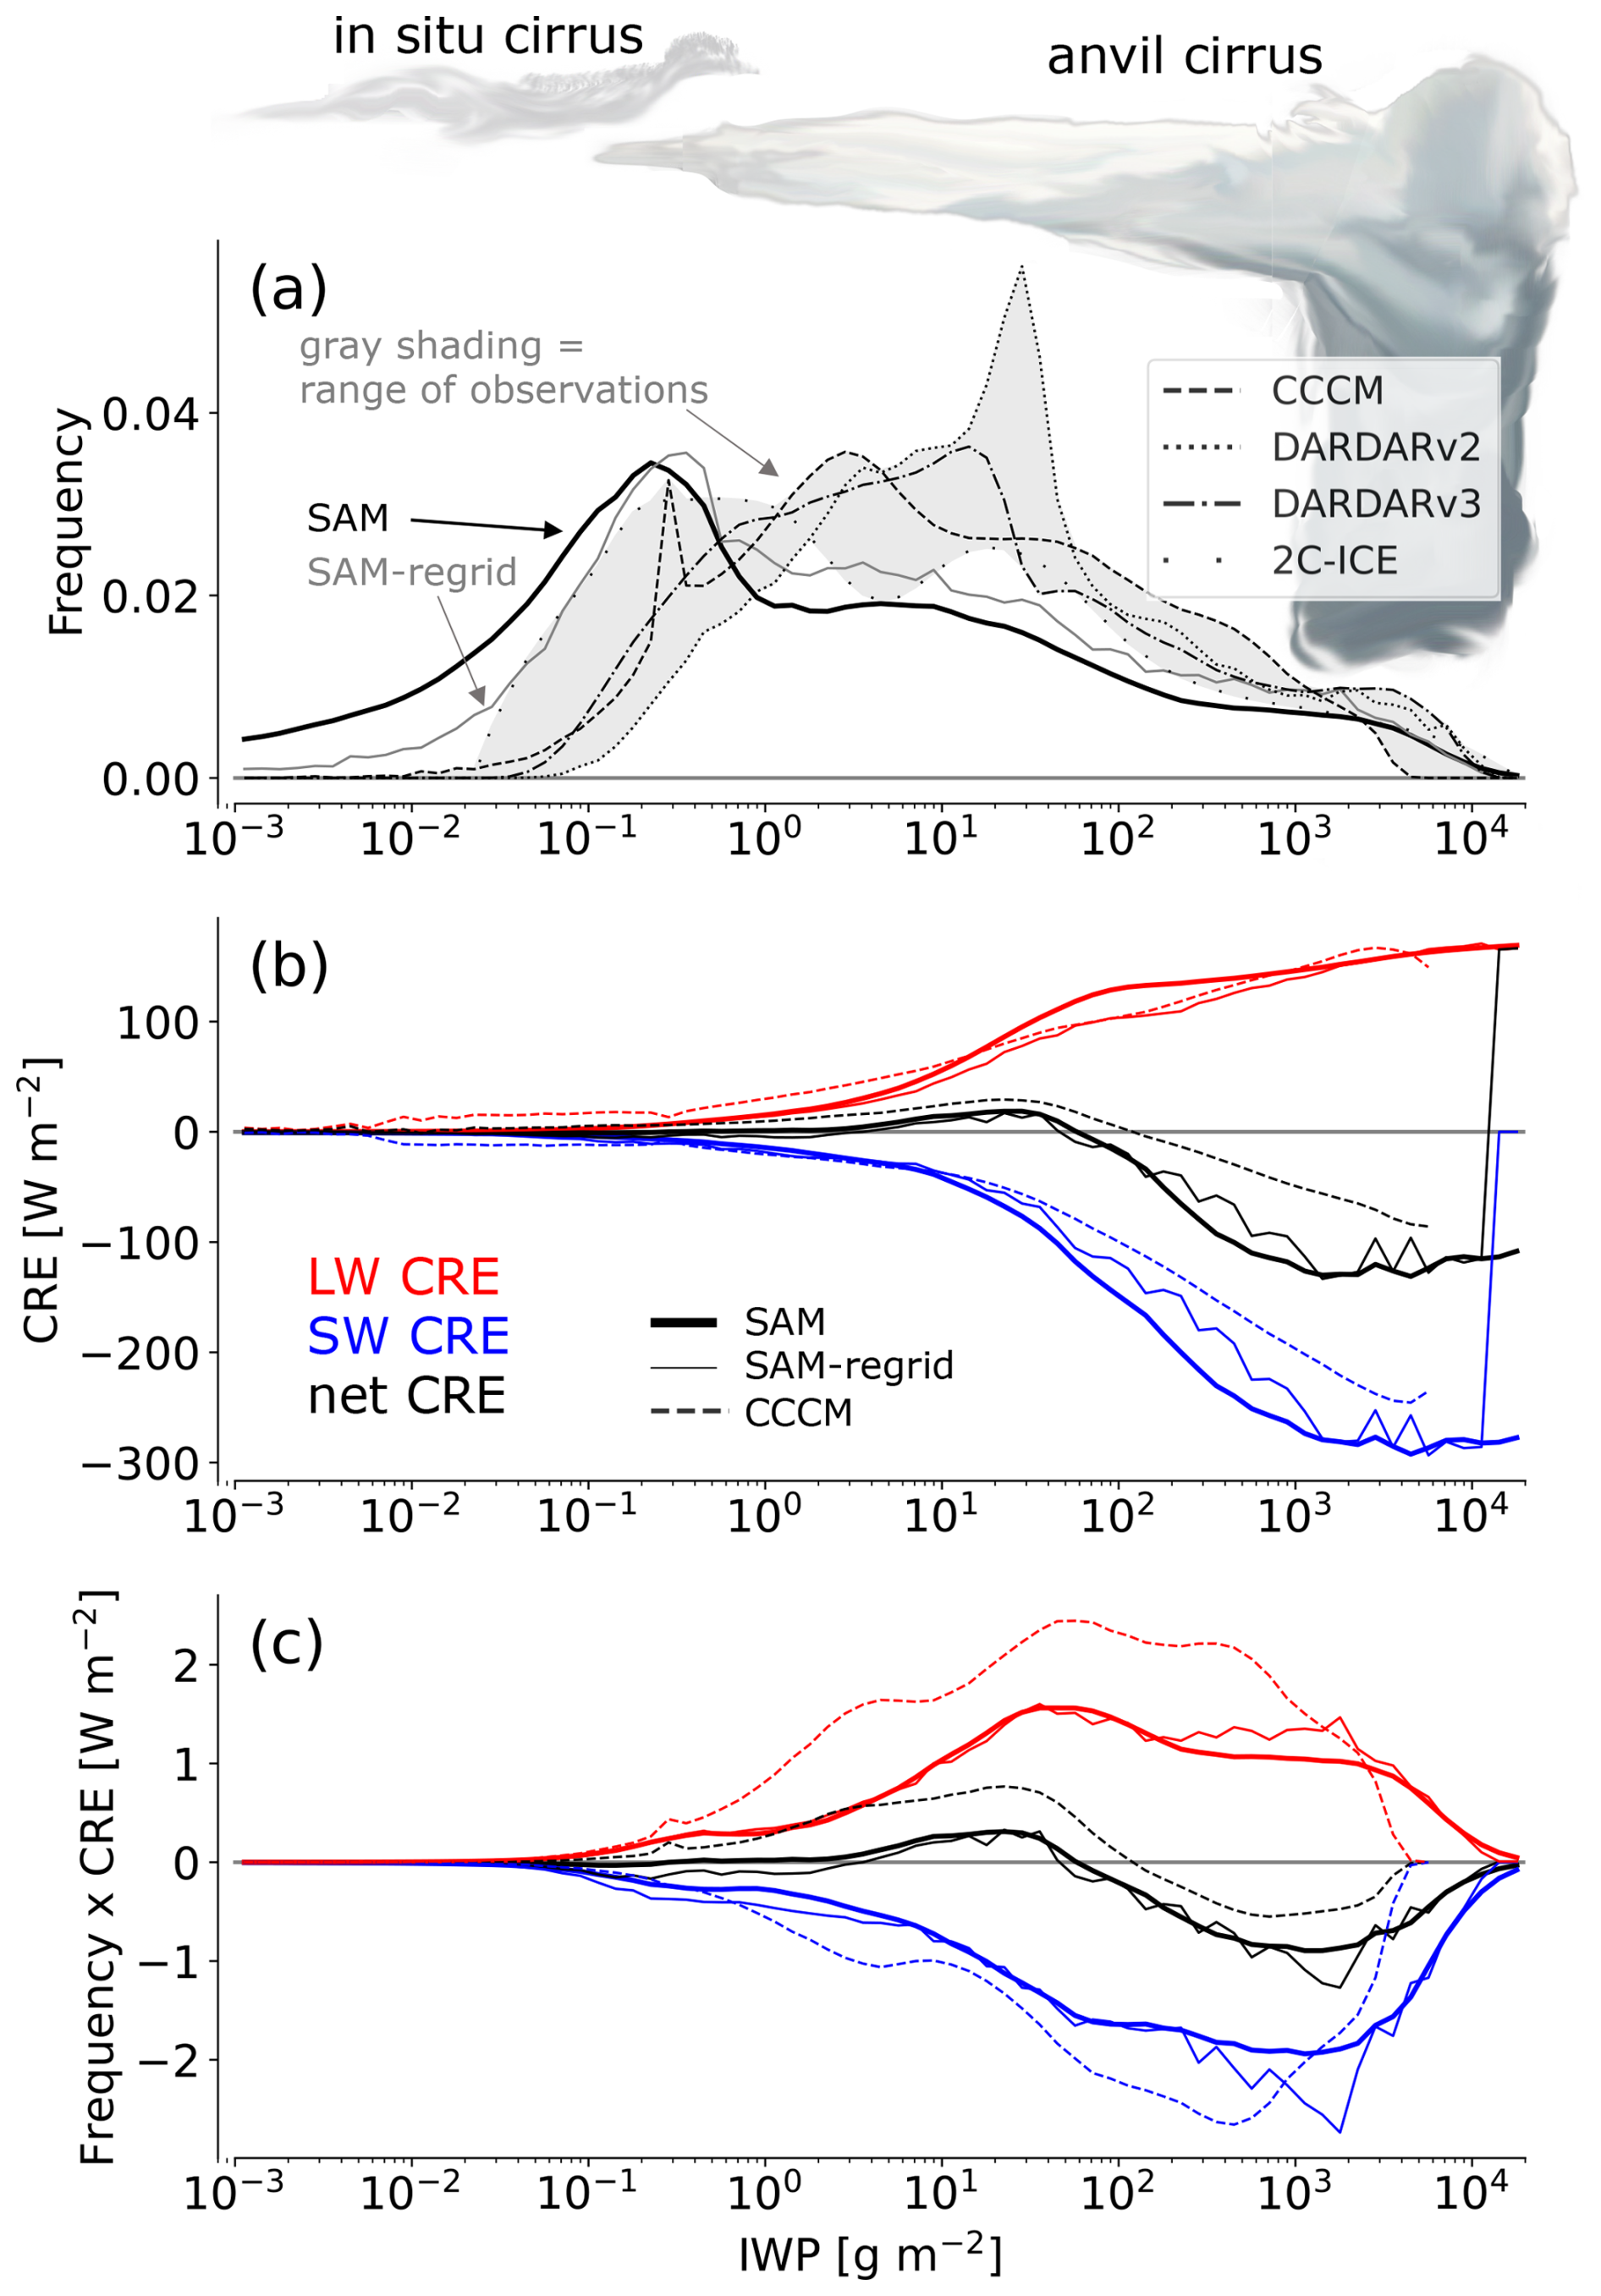
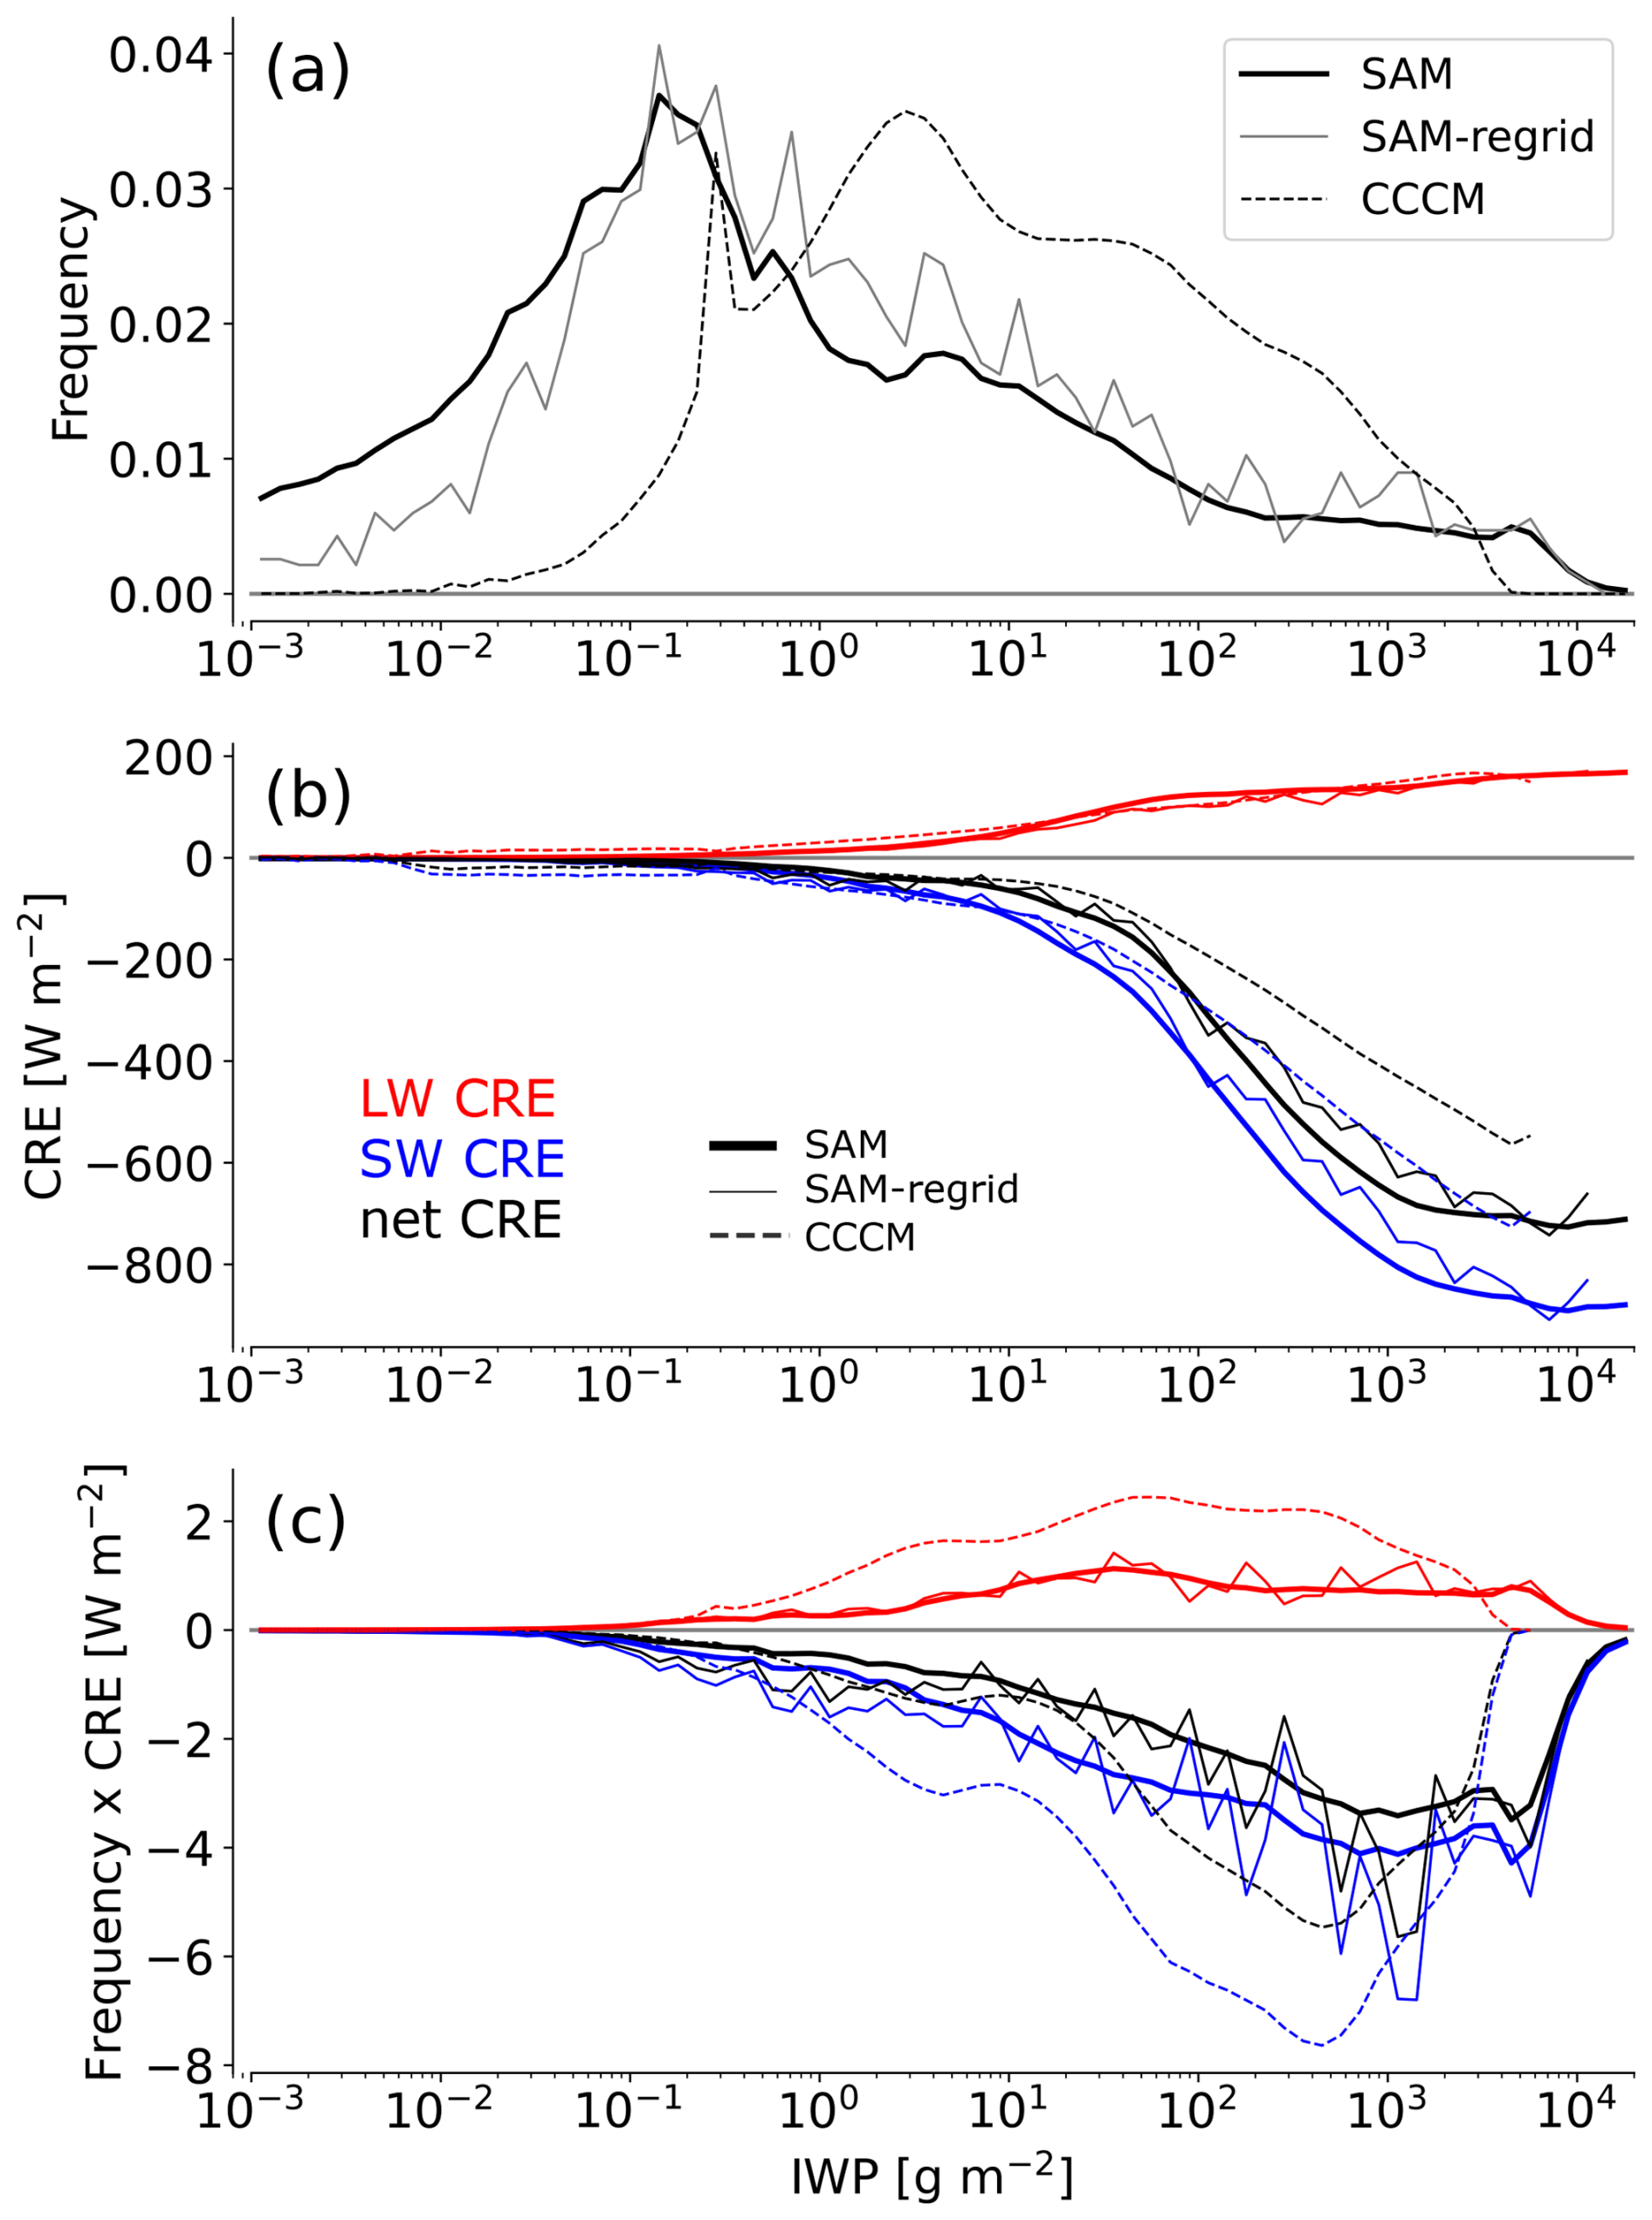
Figure 4(a) Frequency of cloud occurrence in each ice water path (IWP) bin, (b) average CRE in each IWP bin, and (c) the contribution of each IWP bin to the CRE. The gray shading in panel (a) highlights the range of observations. Panels (b) and (c) show results only for the improved SAM model and the CCCM satellite product. Model results are presented for full resolution and regridded to 36 × 36 km grid, similar to the resolution of CERES satellite retrievals of CRE.
Figure 4b shows the averaged CRE for high clouds in each IWP bin. The most frequent anvils according to satellite datasets occur at an IWP of 3–30 g m−2, which corresponds to anvil clouds of intermediate optical depth (1–3) that yield a net positive, LW-dominated CRE (Sokol and Hartmann, 2020). For thicker clouds (IWP > 100 g m−2), both model and satellite data show a dominance of SW CRE, with net CRE exceeding −100 W m−2 for the thickest anvils. However, the model overestimates the SW CRE, a bias partially resolved by averaging the output onto coarser grid scales, similar to the CERES pixel data resolution (36 × 36 km grid boxes). Additionally, a recently identified bug in the ice optics parameterization likely increased the optical depth and radiative effects per unit IWP by ∼ 15 %, but this issue could not be addressed in the current simulations. This SW bias becomes even more apparent when comparing CERES CRE retrieved during daytime satellite overpasses with model-simulated CRE between 13:00 and 14:00 LT (Fig. B2b).
Determining which type of tropical cirrus is radiatively most important is not straightforward. Are the less frequent but thick deep convective cores and fresh anvils, which have a strong influence on both SW and LW CRE, the most dominant, or do the more widespread anvil clouds of intermediate thickness dominate? Figure 4c provides an answer by scaling the CRE in a given IWP bin by that bin's frequency of occurrence: the radiatively most dominant clouds have IWP between 1 and 3000 g m−2, similar to results by Berry and Mace (2014). These include anvil clouds with optical depths greater than approximately 1. Nonetheless, thinner cirrus (IWP 0.3–10 g m−2, Fig. 4c) also contribute meaningfully to the net CRE, underscoring the importance of studying not only the thickest tropical cirrus but also their continued evolution until they reach an IWP of ∼ 0.1 g m−2 (optical depth ∼ 0.005). Additionally, the response of thin cirrus to global warming remains highly uncertain (Sokol et al., 2024) and deserves further investigation.
4.1 Cirrus origin
We illustrate the utility of passive tracers in disentangling convective and in situ contributions to cirrus formation using a case study and statistical estimates of cirrus origin in the SAM model that includes all model improvements (Sect. 2.1.2–2.1.5) and the two passive tracers (Sect. 2.1.6). Our analysis begins with the model snapshot in Fig. 5, while a Video Supplement shows the system's evolution over 2 d. The figure depicts a snapshot of a multicore mesoscale convective system with an anvil cloud shield extending approximately 500 km. This system includes a fresh, thick precipitating anvil cloud that evolves into a thinner, aged anvil cloud. Above this, a thin cirrus layer spans altitudes of 15–16 km. Identifying the origin of such thin cirrus from a single model output time step is challenging. Although thin TTL clouds are typically formed in situ (Krämer et al., 2016; Huang and Dinh, 2022), they might also be remnants of TTL-penetrating deep convection.
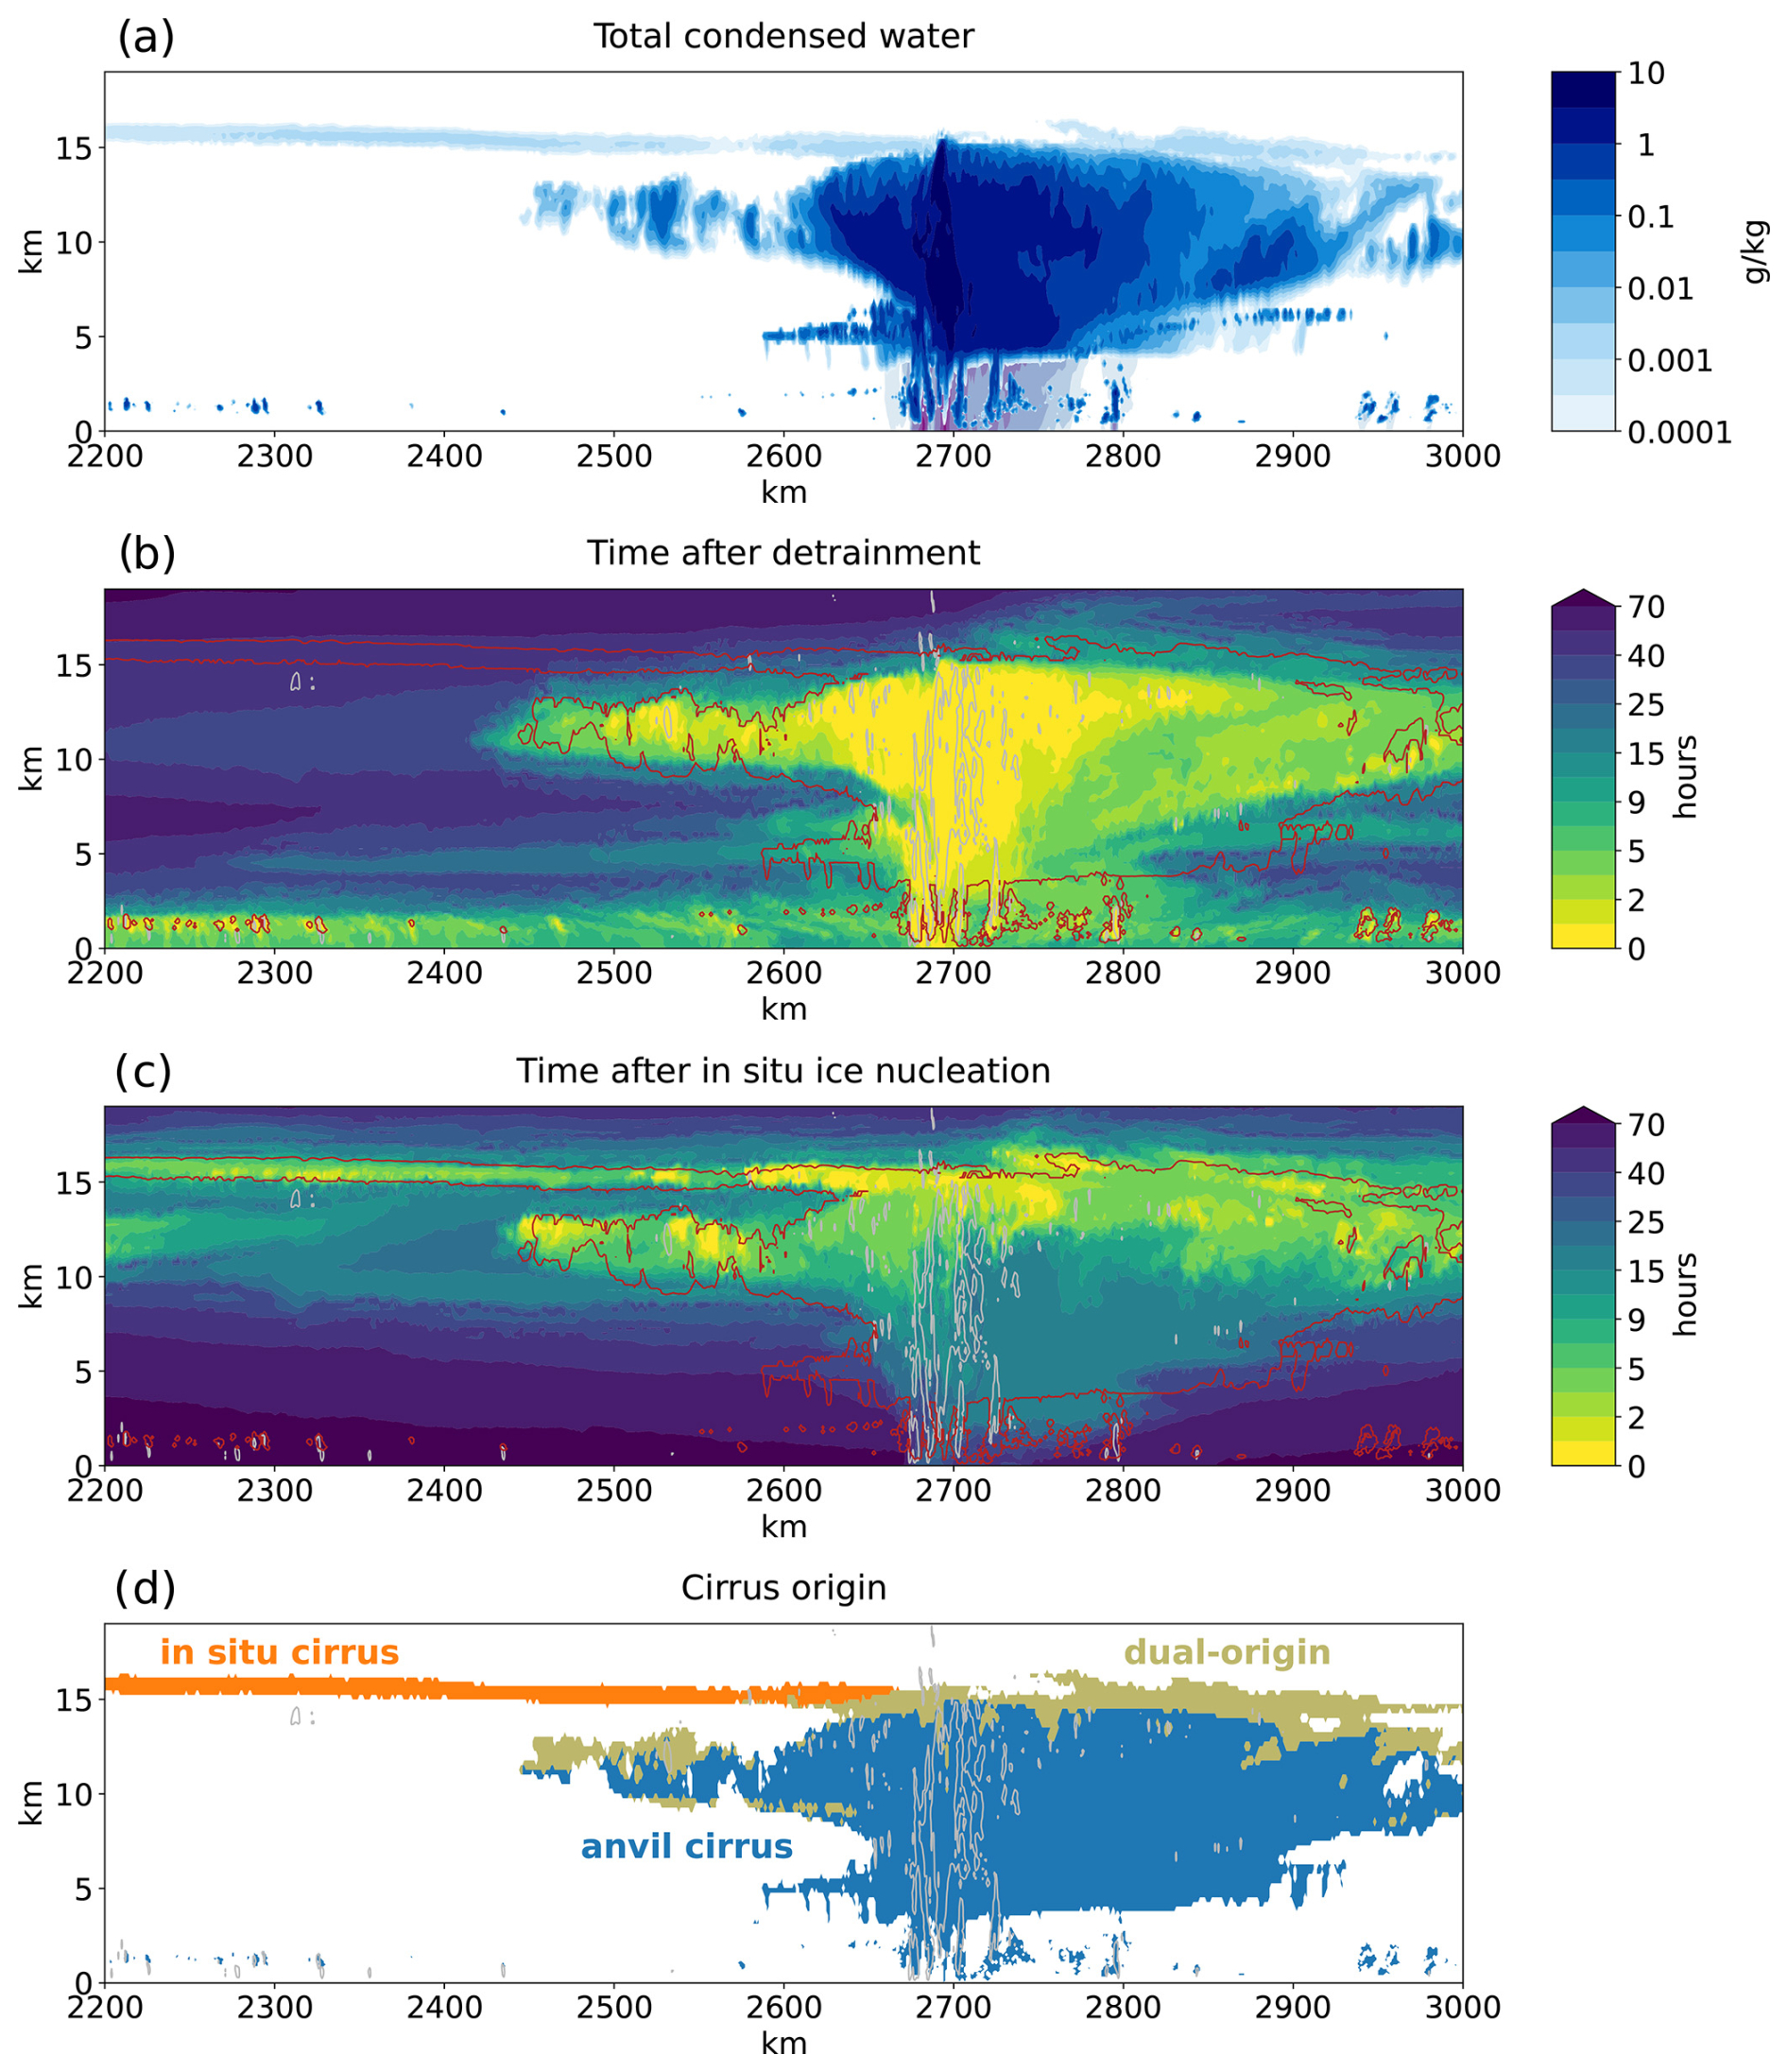
Figure 5A simulated mesoscale convective system with an extensive anvil cloud shield and overlying TTL cirrus. Panel (a) shows total condensed water, with purple contours indicating rain. Panels (b) and (c) show values of detrainment and in situ nucleation tracers for the same cloud system, respectively. Panel (d) presents the outcome of a cirrus origin classification criterion. In situ cirrus (in orange) are defined as cloudy parcels that have not been in contact with detrained air for at least 24 h and where the time since in situ nucleation tracer is shorter compared to the time since detrainment. The remaining clouds are classified as anvil cirrus (blue). Portions of the anvil where the time since in situ nucleation tracer is shorter compared to the time since detrainment are classified as “dual-origin” (in brown). Gray contours in panels (b), (c), and (d) delineate vertical wind velocities of 1 m s−1. Red contours in panels (b) and (c) delineate total cloud condensate of g kg−1.
Passive tracers resolve this uncertainty. The detrainment tracer highlights regions of active deep convection and thick anvil clouds with times since detrainment typically less than 10 h and reveals that the overlying thin cirrus resides predominantly in air undisturbed by convection for at least 24 h (Fig. 5b). The in situ nucleation tracer confirms this, showing that much of the thin cirrus originates from recent ice nucleation events (within the last 5 h; Fig. 5c).
Interestingly, the nucleation tracer also indicates that some parts of the anvils experience ongoing ice nucleation. These events, driven by convective gravity waves or within-anvil updrafts, align with previous observational studies (Jensen et al., 2009; Hartmann et al., 2018; Krämer et al., 2020a; Sokol and Hartmann, 2020). However, their broader significance for tropical cirrus remains uncertain (Dinh et al., 2023; Gasparini et al., 2023).
To better characterize the microphysical origin of cirrus, we classify them into three categories: in situ, anvil, and dual-origin. Anvil cirrus are defined as clouds where the time since detrainment is shorter than the time since in situ nucleation. In situ cirrus are those that have not experienced detrainment for at least 24 h and where the time since nucleation is shorter than the time since detrainment.
Dual-origin cirrus are clouds detrained within the last 24 h that have a shorter time since in situ nucleation compared to time after detrainment. These typically form within or near anvils or in cirrus clouds close to active convection (Fig. 5d). To correct for classification biases due to ice crystal sedimentation impacting older anvils and in situ cirrus, clouds that were initially classified as in situ cirrus but located below dual-origin cirrus are reassigned to the dual-origin category. Although dual-origin cirrus are influenced by in situ nucleation, their total ice mass and number are still dominated by convective outflow (not shown).
Our tracer approach confirms previous findings highlighting IWC as a good predictor of cirrus origin (Krämer et al., 2016). High-IWC tropical cirrus are thought to be of convective origin, while low-IWC cirrus, particularly those at cold temperatures, are more likely of in situ origin (Luebke et al., 2016; Krämer et al., 2016). Using a two-dimensional IWC–temperature space, we find that in situ cirrus dominate only for the coldest low-IWC tropical cirrus (IWC < 10−3 g m−3, T < −65 °C), while high-IWC cirrus and most cirrus at warmer temperatures are of convective origin (Fig. 6a). In situ contributions range from 10 % (T > −50 °C) to more than 70 % (T < −70 °C). Additionally, we repeat the analysis using ICNC, which leads to less distinct patterns (Fig. 6b). While the highest-ICNC bins are clearly associated with anvil cirrus, in situ cirrus fractions remain steady at ∼ 10–40 % for ICNC < 0.03 cm−3, increasing to over 60 % only at temperatures colder than −65 °C.
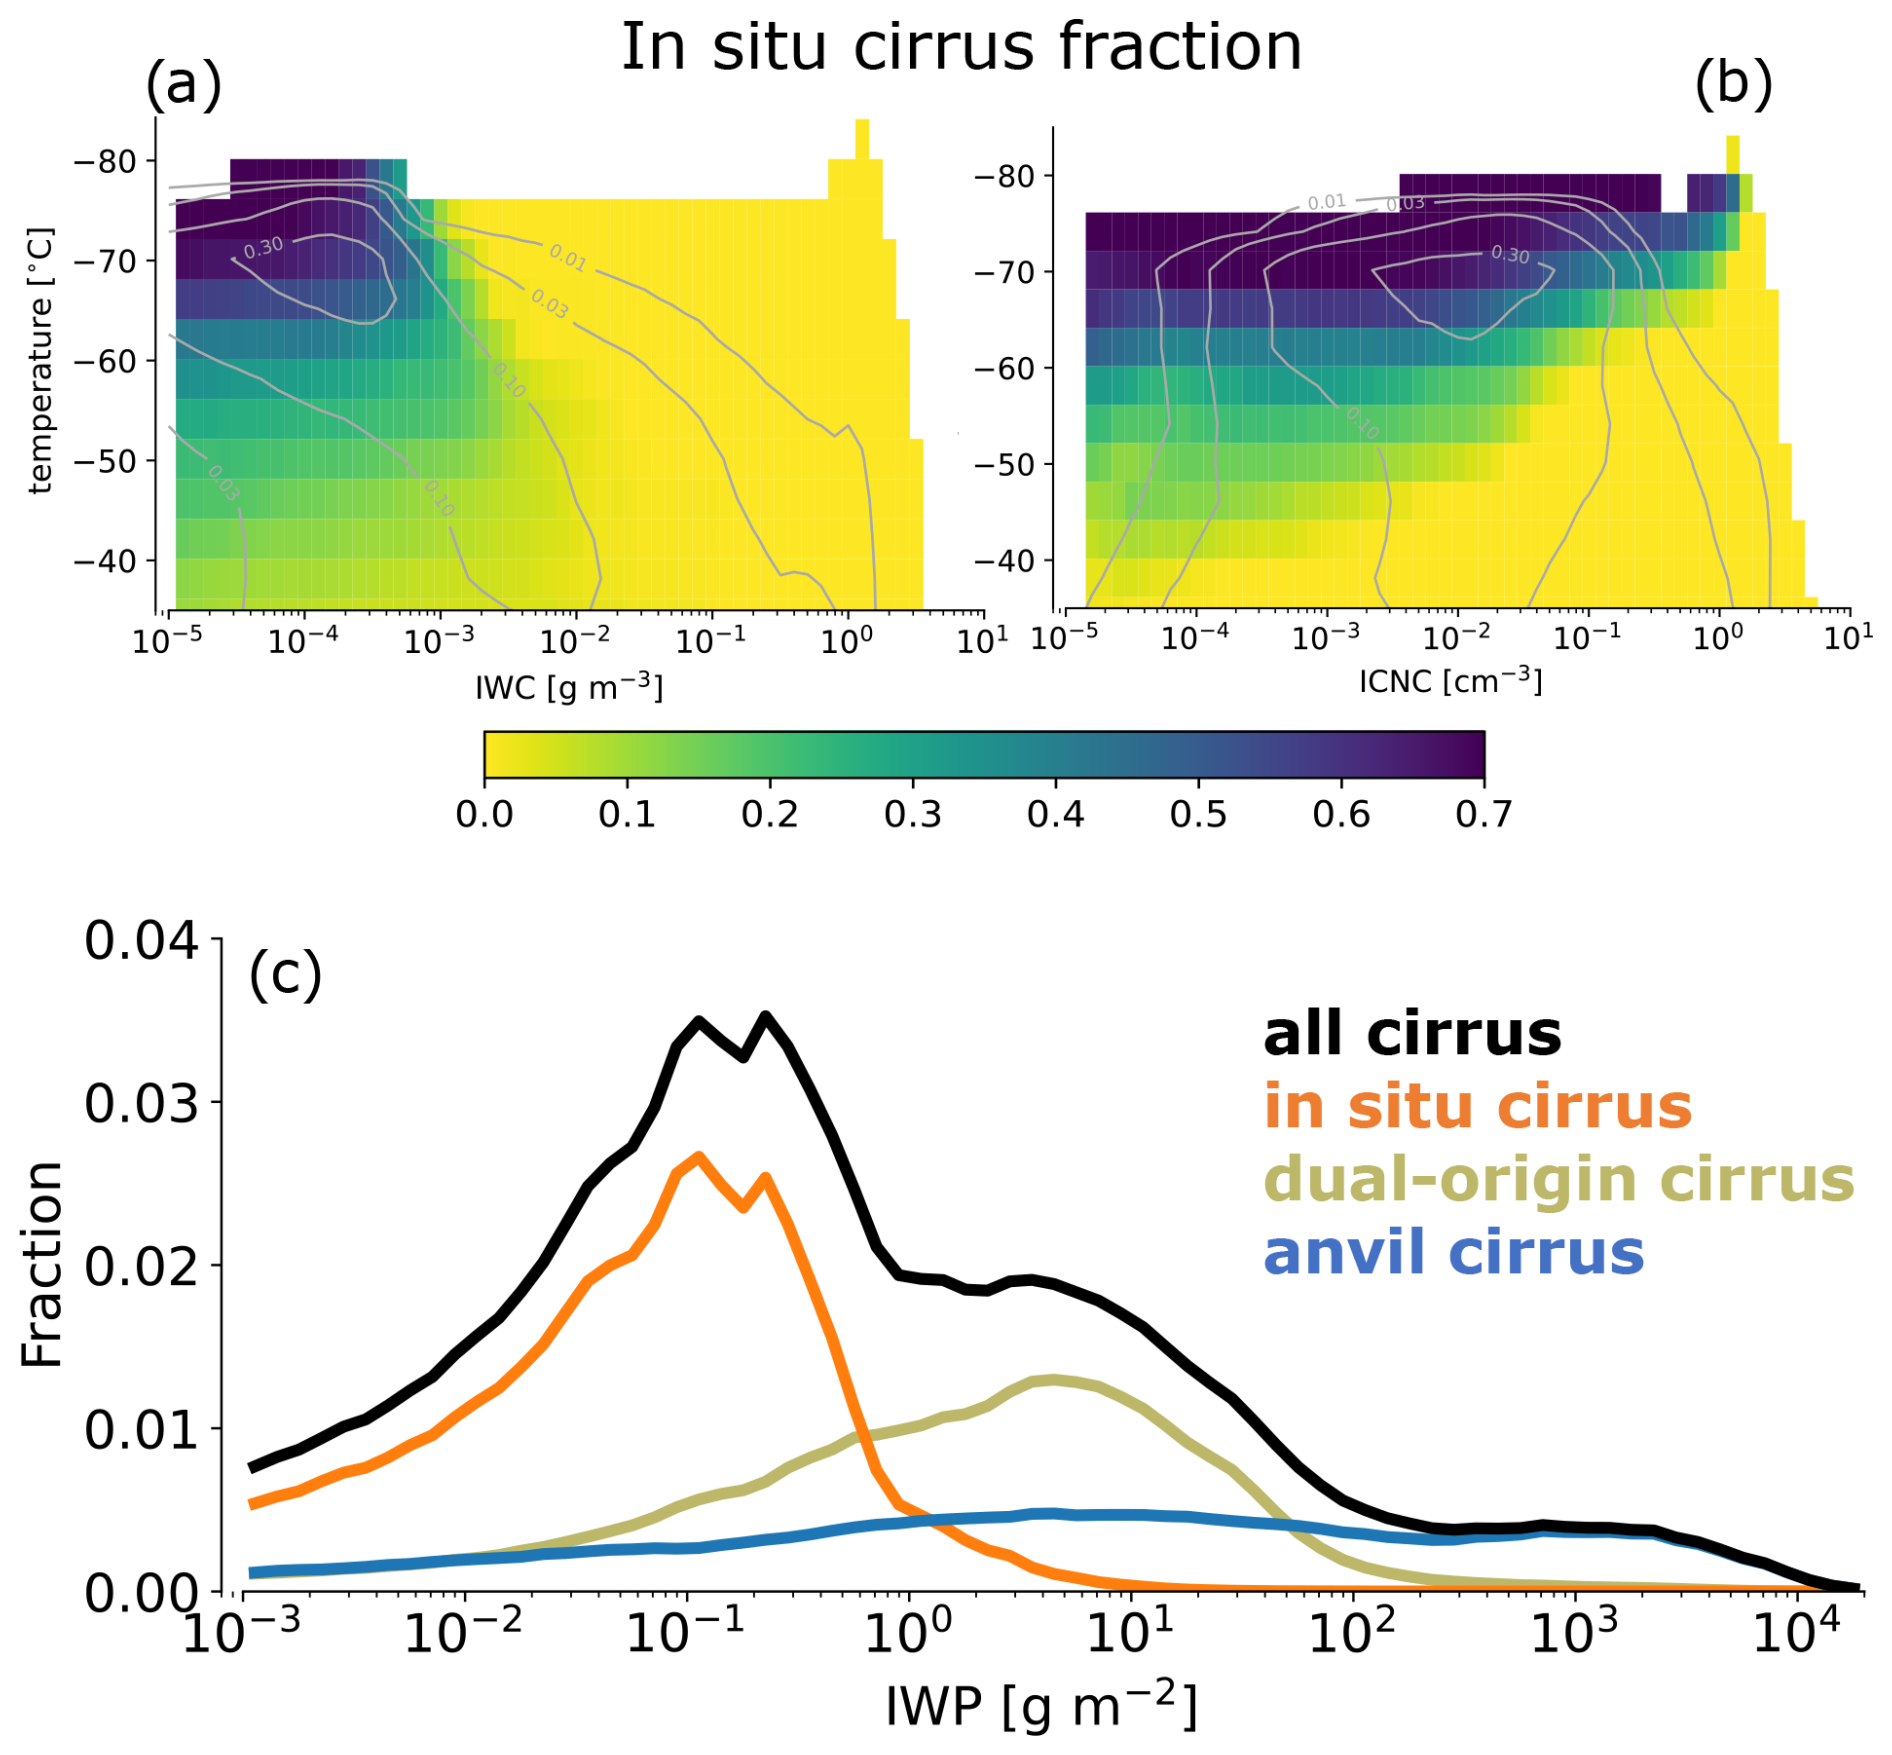
Figure 6Fraction of model-simulated in situ cirrus represented in the (a) temperature–IWC and (b) temperature–ICNC space for the cirrus classification criterion from Fig. 5. The gray lines in the contour indicate the joint distribution of cloud occurrence in each two-dimensional phase space. Panel (c) shows the fraction of cirrus binned by IWP.
Vertically integrated cirrus origin analysis in Fig. 6c shows that in situ cirrus dominate at IWP < 0.4 g m−2 and peak at IWP values between 0.1 and 0.5 g m−2. At IWP > 10 g m−2, in situ nucleation is highly unlikely due to limited vapor availability and slow depositional growth in the TTL. Clouds with IWPs of 1–50 g m−2 often consist of contributions from both in situ and convective sources, suggesting that in situ nucleation plays a role in sustaining and prolonging the lifetime of aged anvil clouds. This analysis, together with our previous findings (Sect. 3.2), provides more information about the evolution of tropical cirrus. These can be split into two separate evolution pathways, as qualitatively depicted in Fig. 4a. Thick anvils originating in high-IWP deep convective towers spread and thin towards IWP ∼ 1 g m−2, while thinner cirrus (IWP < 1 g m−2) predominantly form via in situ ice nucleation. And while ice nucleation is very frequent and may play an important role in prolonging anvil lifetime (Hartmann et al., 2018), dual-origin cirrus generally preserve convective-like properties and could, for simplicity, be merged with the anvil category.
4.2 Radiative importance of tropical cirrus based on their origin
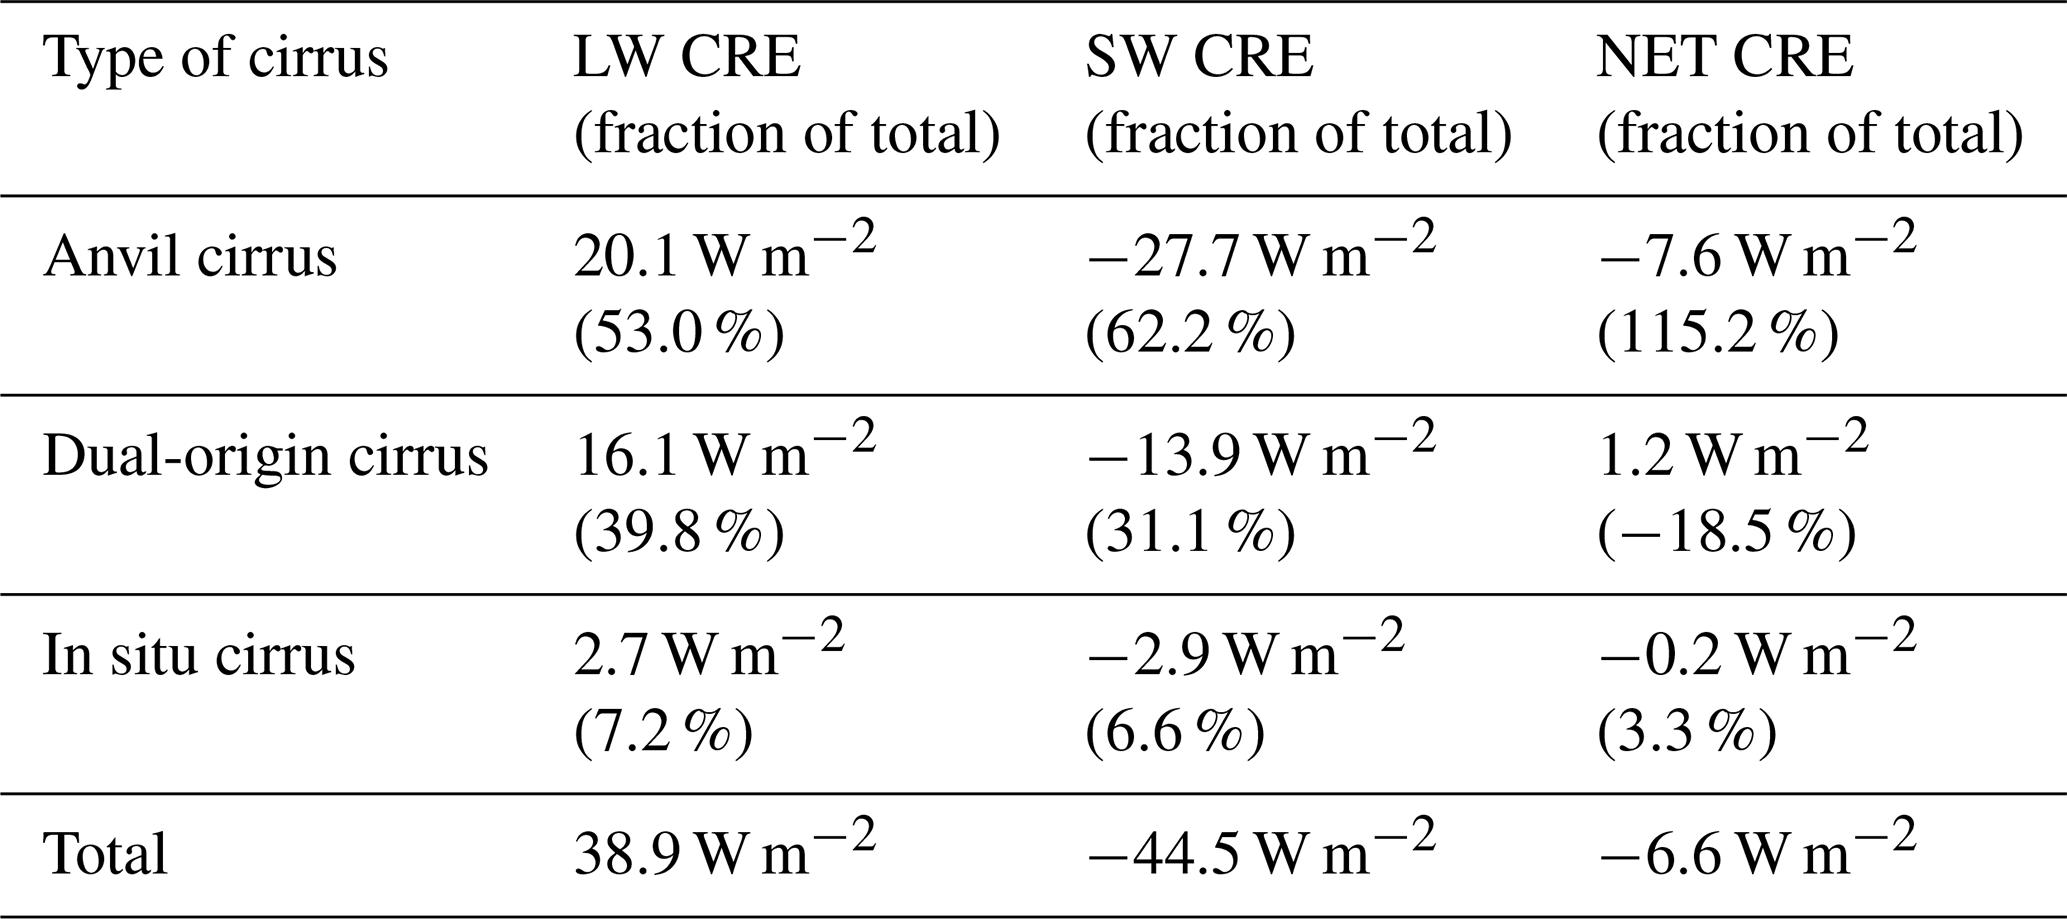
Finally, by multiplying the cloud occurrence frequency in Fig. 6c with the IWP-binned CRE in Fig. 4b we estimate the radiative contribution of each of the three cirrus types, summarized in Table 1. Anvil clouds are radiatively most important, accounting for more than 50 % of both LW and SW CRE of all tropical cirrus. They dominate in the high IWP range, where SW CRE is stronger than LW CRE, leading to a net CRE of about −8 W m−2. Dual-origin cirrus are aged anvils that dominate moderate IWP. They are still radiatively very important, leading to 40 % of the total LW and 30 % of the total SW CRE. Finally, in situ cirrus radiative contribution accounts only for 7 % of the total LW and SW CRE. The estimate of their SW CRE may be biased high due to the occurrence of lower-lying anvils or dual-origin clouds, likely leading to an overestimation of the SW CRE. A more detailed radiative analysis accounting for cloud overlap (see, e.g., Deutloff et al., 2025) is left for future work. We also note that the model-derived in situ cirrus CREs are comparable to satellite-derived CRE for TTL cirrus (Haladay and Stephens, 2009; Lee et al., 2009; Berry and Mace, 2014).
Table 1Model-derived cloud radiative effects (CREs) for cirrus types and their respective relative importance (in parentheses).
4.3 Evolution of tropical cirrus
The two passive tracers provide new insights into the distinct microphysical evolution pathways of detrained anvils and in situ cirrus. This perspective helps differentiate and track the life cycle of numerous cirrus clouds formed in our simulation, offering a more comprehensive understanding of cirrus evolution compared to a snapshot perspective. For detrained anvils, deep convection initially injects high concentrations (ICNC > 0.1 cm−3) of ice crystals spanning a broad size range, including relatively large particles (Fig. 7b). The tracers allow for the study of how these crystals evolve over time: within the first 1–3 h following detrainment, there is a rapid decrease in both number concentration and size due to sedimentation, marking the most dynamic phase of anvil evolution (compare Fig. 7b and c). Beyond this period, the evolution slows, with ice mass and number decreasing gradually as sedimentation and sublimation deplete the ice crystals (compare Fig. 7c and d). Figure 7e shows properties of clouds classified as in situ cirrus in Figs. 5d and 6.
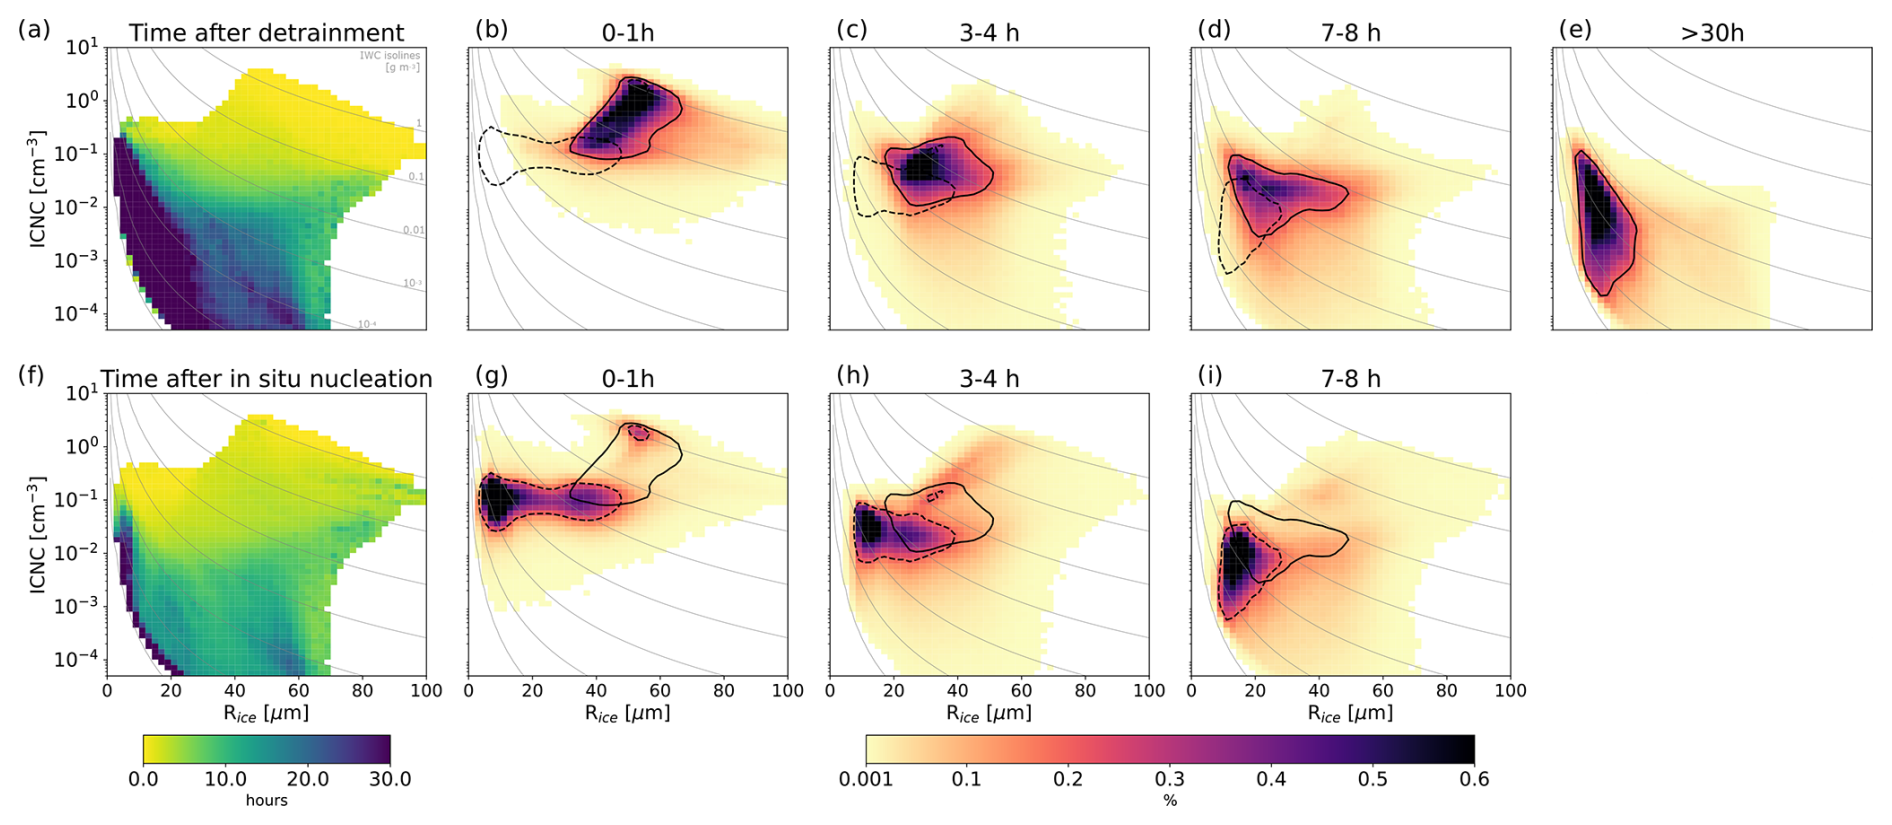
Figure 7Evolution of microphysical properties tracked with passive tracers. Panels (a) and (f) represent the mean time of air parcels after detrainment and in situ nucleation. The other panels present the joint distribution of ICNC and mass radius for the stated time after detrainment (b–e) or time after in situ ice nucleation (g–i). The two contour lines encircle the peak probability distribution of particles under the selected conditions (detrainment = solid lines; nucleation = dashed lines). Isolines of IWC are plotted in gray. Since there are very few grid boxes at times after in situ nucleation of more than 30 h, we omit that panel.
In contrast, freshly nucleated in situ cirrus ice crystals form at smaller sizes and intermediate concentrations (ICNC: 0.02–0.2 cm−3). Homogeneous nucleation events occasionally spike these concentrations but remain transient and thus are barely visible in our frequency figure. Since most of the in situ crystals are smaller than the freshly detrained ones (Fig. 7g–i), sublimation may be a more important ice crystal sink than sedimentation. This may imply a greater sensitivity to atmospheric thermodynamic conditions, such as temperature and supersaturation fluctuations. Over time, in situ cirrus tend to lose ice number and size, approaching microphysical properties that often overlap with those of aged anvil cirrus. In summary, while both in situ and detrained cirrus retain distinct properties in the first 3–5 h, they become harder to distinguish in the later stages of their evolution.
5.1 Impact on cloud properties
All results presented so far are based on simulations with a horizontal grid spacing of 1 km, which is sufficient to represent anvil cloud evolution and their influence on mesoscale circulation (Gasparini et al., 2019, 2022). To assess the impact of model grid spacing, we include additional simulations at coarser (4 km) and finer (250 m) grid spacings. The 4 km grid spacing aligns with current GSRMs, while the 250 m grid spacing approaches the level of convergence for deep convective updraft strength in idealized and realistic tropical convection setups (Khairoutdinov et al., 2009; Jeevanjee, 2017; Prein et al., 2025).
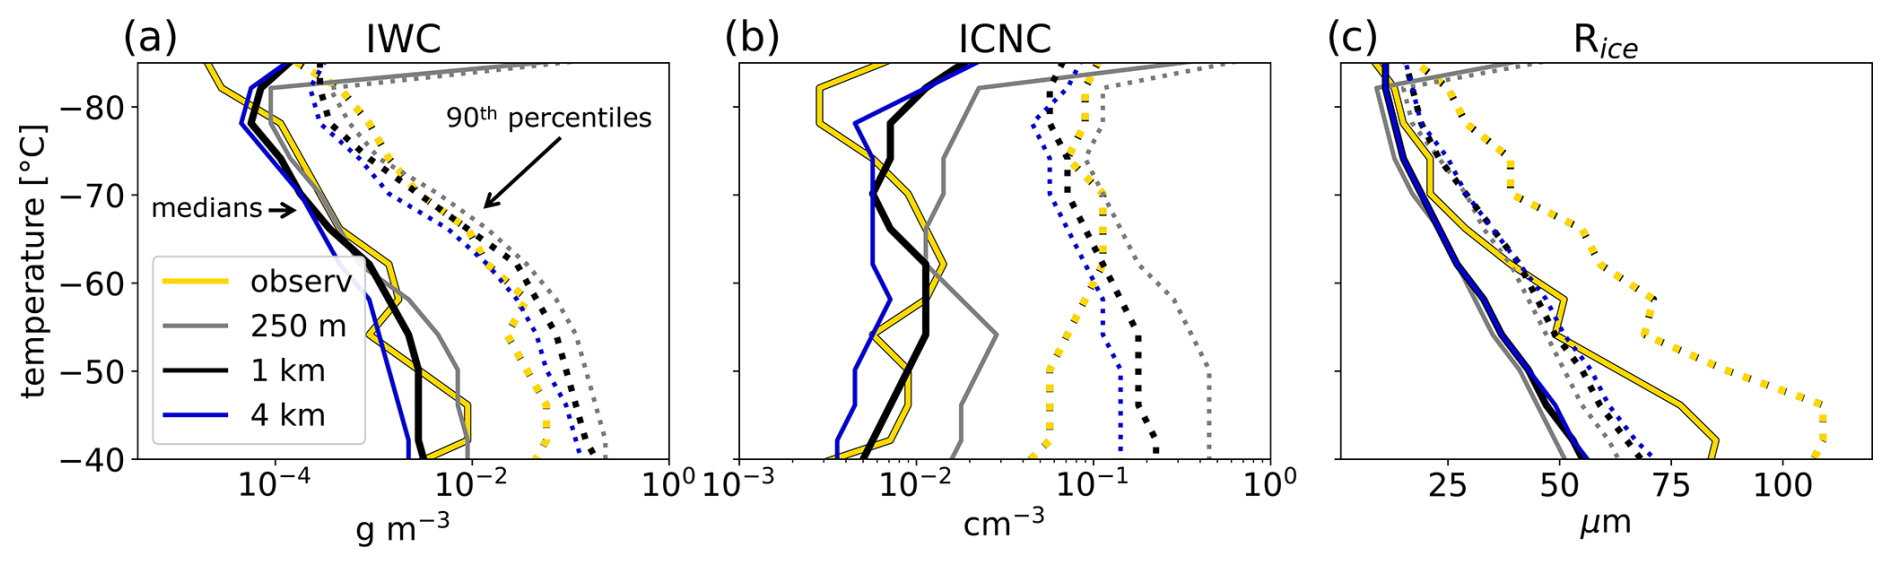
Figure 8Grid spacing dependence of (a) ice water content (IWC), (b) ice crystal number concentration (ICNC), and (c) ice radius (Rice) in SAM with improved microphysics compared to aircraft observations (in yellow). All data are regridded to a horizontal resolution of 4 km. Plotted are median values (solid lines) and 90th percentile values (dotted lines).
The sensitivity of simulated ice properties to horizontal grid spacing is most pronounced for ICNC, which increases by nearly an order of magnitude from the 4 km to the 250 m simulation, a trend also evident in the 90th percentiles (Fig. 8b). IWC exhibits grid spacing dependence only at temperatures warmer than −60 °C, with higher values at finer grid spacings (Fig. 8a). In contrast, ice crystal radius shows little sensitivity to grid spacing (Fig. 8c). Moreover, SAM underestimates the variability in ice crystal size across all grid spacings and fails to reproduce the 90th percentile of observed particle size.
Overall, simulated microphysical properties at all grid spacings fall within the range of observations. However, the 4 km simulations underestimate both IWC and ICNC across most temperatures, but these biases are gone in the 1 km simulation. The ice number–radius perspective provides a clearer view of these improvements, particularly for the low ICNC bias of ice crystals smaller than 30 µm (Fig. A1). Increased model resolution helps identify and understand the sources of model bias. The following section explores vertical wind variability, a likely contributor to these biases and a key factor in the reduced model bias observed for finer horizontal grid spacing.
5.2 Vertical wind variability
Ice formation is strongly influenced by the availability of water vapor and the supersaturation with respect to ice, which depends on the dynamical environment. Of particular significance are the high-frequency fluctuations, which are approximately 10 times larger than the slow synoptic-scale motions (Atlas and Bretherton, 2023). Accurately capturing vertical wind variability is thus critical for modeling cirrus cloud formation and properties (Barahona et al., 2017).
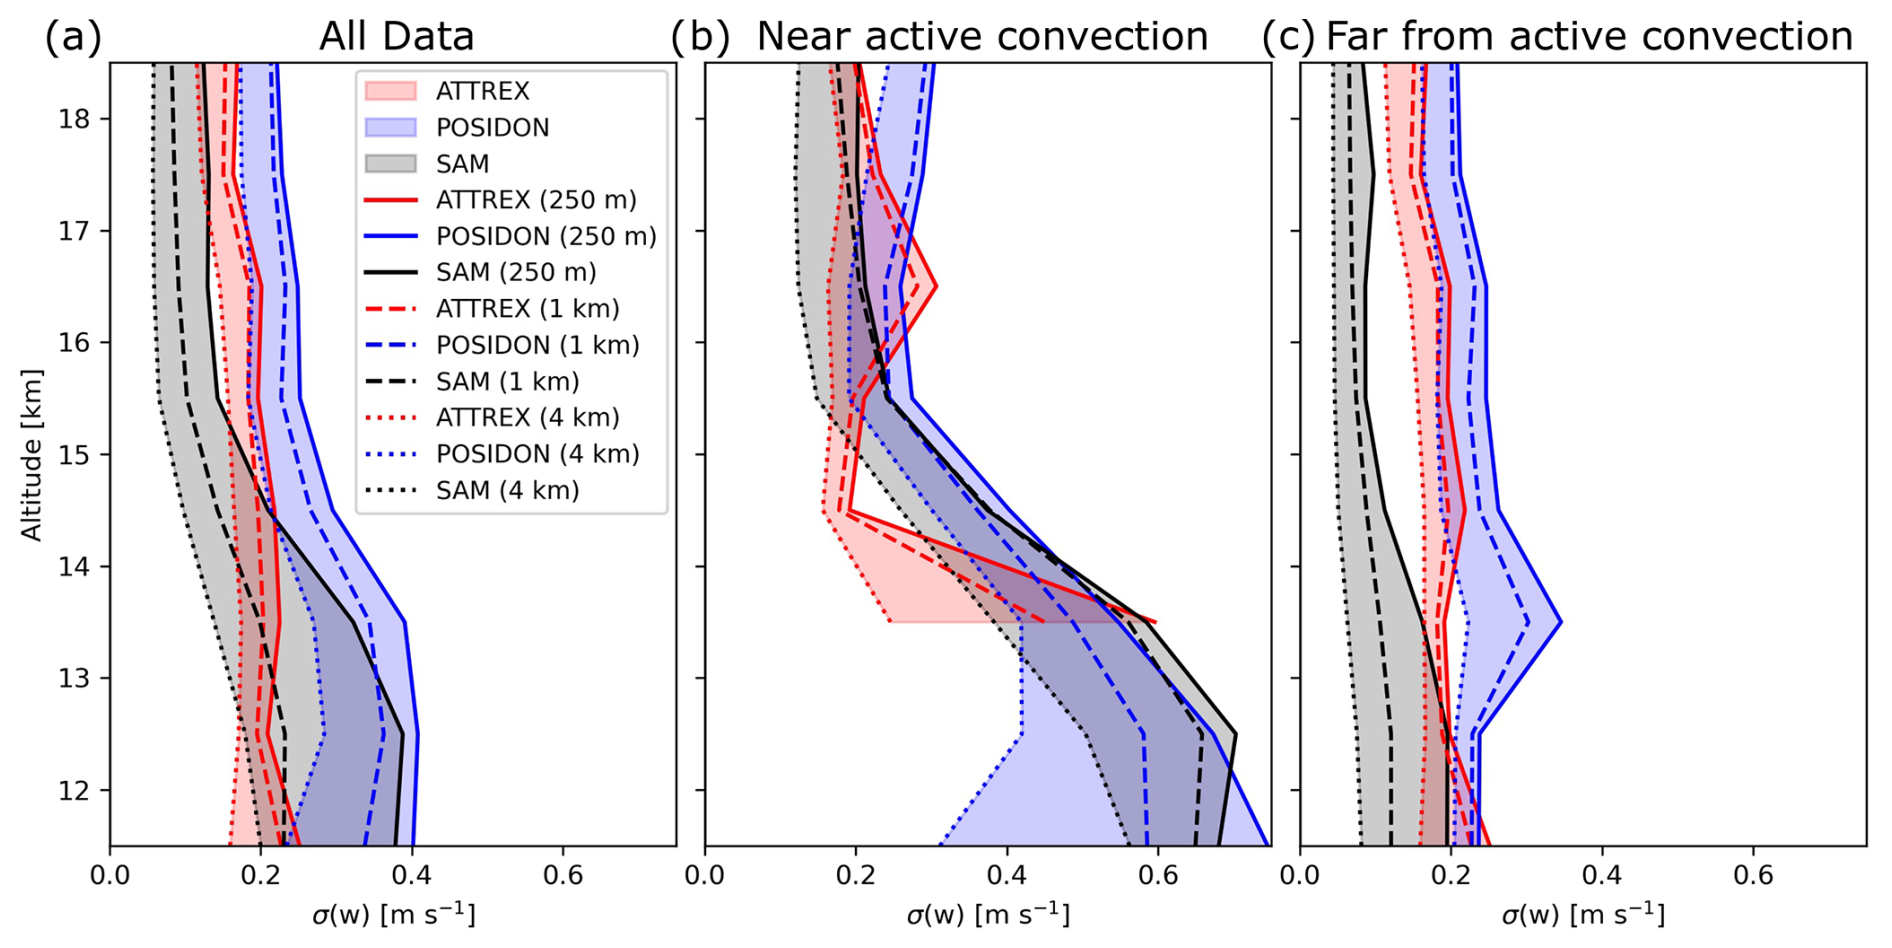
Figure 9Standard deviation of vertical wind from simulations with the improved SAM model and aircraft observations for (a) all data, (b) locations near active deep convection (brightness temperatures < 240 K), and (c) areas far from active deep convection (brightness temperatures > 240 K).
The biases in extreme ICNC values align with the model's underestimate of strong updrafts. This results in a vertical wind distribution that is too narrow and an underestimated standard deviation (Fig. 9). Including a subgrid-scale vertical wind term (Sect. 2.1.5) slightly improves the issue by increasing the standard deviation in vertical wind by 1 %–10 % depending on the model grid spacing (2 %–4 % for 1 km grid spacing). Nevertheless, the model performs well in representing the vertical wind variability near regions of deep convection at all three horizontal grid spacings (4 km, 1 km, 250 m) (Fig. 9b).
However, updraft variability is strongly underestimated in regions far from deep convection (defined as areas with brightness temperature > 240 K) for simulations at 4 and 1 km grid spacing. The 250 m simulation shows better agreement with the measured winds below 14 km, where anvil cloud coverage is the largest, but underestimates wind variability in the TTL, resulting in a persistent ICNC bias for small ice crystals (Fig. A1c and f). This also likely contributes to larger microphysical biases in clouds far from active convection compared to those near convection (Fig. A2).
Power spectra in Fig. 10, calculated following Atlas and Bretherton (2023), provide further insight into updraft variability across different wavelengths of atmospheric disturbances. Variability at wavelengths larger than ∼ 1000 km corresponds to synoptic-scale motion, while convectively generated gravity waves dominate at wavelengths between 1 and 1000 km. Turbulent processes of various sources dominate at wavelengths below ∼ 200 m.
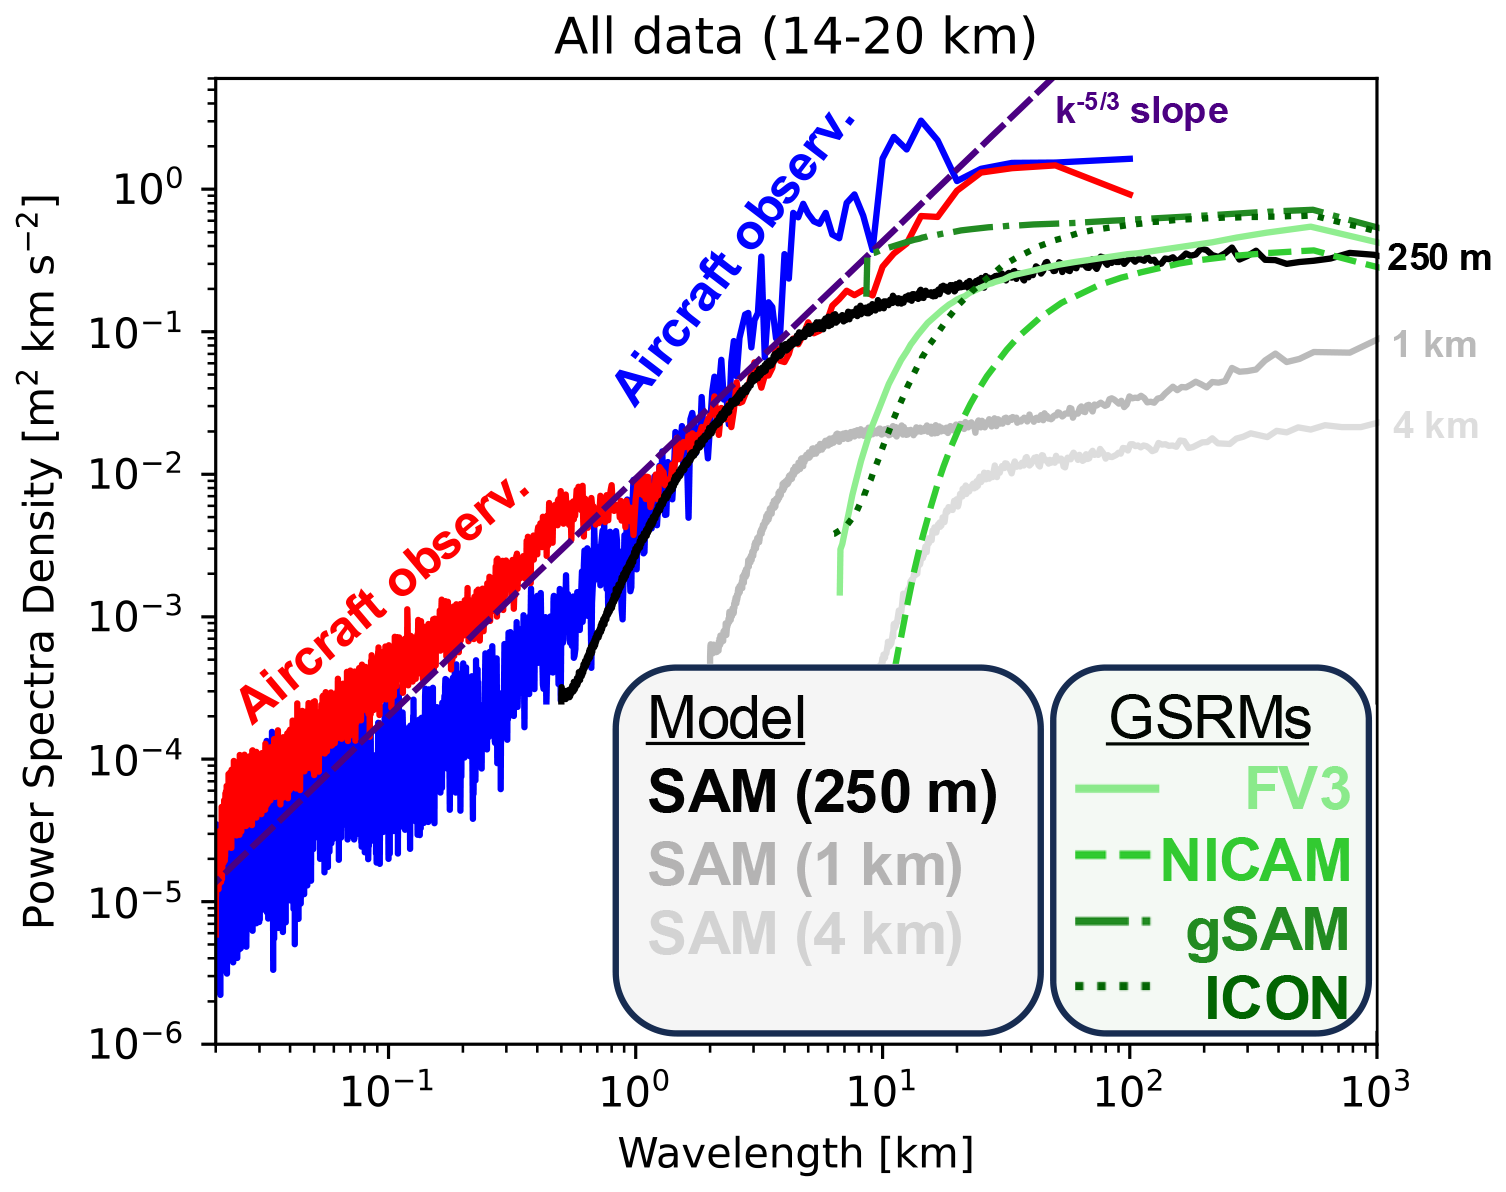
Figure 10Power spectrum of updrafts from ATTREX (red) and POSIDON (blue) aircraft measurements, improved SAM model simulations (in grayscale), and a selection of GSRMs (in green). The dashed pink line represents the slope, where k is the wavenumber.
As already shown by Fig. 9, wind variance increases with finer horizontal grid spacing. While the 4 and 1 km simulations substantially underestimate wind variance and power, the 250 m simulation reproduces the observed wind variability for wavelengths between 1 and 10 km. Moreover, all SAM simulations under-represent variability at scales larger than ∼ 100 km, which are better captured by GSRMs at horizontal grid spacings of about 4 km. Vertical wind spectra from models flatten out at the model effective resolution, which varies across the different GSRMs and SAM simulations shown in Fig. 10. Aircraft observations are most suitable for investigating vertical wind variability < 10 km and flatten out between 10 and 100 km, possibly due to a smaller signal-to-noise ratio, limited data, and/or changing atmospheric dynamics. Gravity waves, originating from deep convective updrafts, propagate hundreds to thousands of kilometers from their source. However, the narrow channel setup of the SAM simulation may restrict the generation and/or propagation of these waves compared to the real atmosphere or global GSRM simulations. While larger-scale updraft variability fosters favorable conditions for deep convection, its direct contribution to cloud formation is limited and of secondary importance for this study.
6.1 Ice microphysics
The representation of ice microphysics remains a limitation in this study, despite notable improvements achieved with the described computationally inexpensive changes. This reflects the broader challenge of accurately modeling ice microphysics in high-resolution models, where computational constraints and incomplete process understanding often impose trade-offs.
For example, the adopted Shi et al. (2015) scheme for ice nucleation, originally designed for coarse climate models, relies on empirical fits to parcel model simulations. While effective, this approach may not capture all the details of ice nucleation at cloud-resolving scales accurately. Future work could address this by implementing a physics-based nucleation scheme, such as the novel Kärcher (2022) scheme, and incorporate a resolution-aware parameterization of wind variability to complement the model-resolved wind variability – similar to approaches being developed for liquid clouds (Salesky et al., 2024).
Secondary ice formation may be another area of interest, given that recent studies have shown that it plays a large role even at temperatures as cold as −50 °C (Hawker et al., 2021; Huang et al., 2022; Qu et al., 2022). Incorporating secondary ice processes into SAM-P3 currently requires additional computationally expensive ice modes, but their inclusion could enhance the model’s ability to simulate anvil cloud evolution. Finally, increased model complexity brings additional challenges, often resulting in hindered process understanding, increased uncertainty, or the problem of equifinality (refer to Proske et al., 2023, and references therein for a complete outline of these issues).
An alternative approach could involve introducing ice tracers for each ice nucleation process, similar to those used by Lüttmer et al. (2025). This would allow for a more accurate classification of cirrus cloud origins without relying on arbitrary thresholds. Although this would increase the model's computational costs, the expense is substantially lower than doubling the model's resolution, making it a viable path forward.
6.2 Resolution and Lagrangian approaches
Our findings confirm that increasing horizontal resolution improves the representation of atmospheric updrafts at scales crucial for cirrus cloud formation. However, this improvement comes at a large cost: a 4-fold increase in horizontal resolution results in a 16-fold increase in data output and a 20–25-fold increase in computational demand. This highlights the importance of exploring less computationally expensive alternatives to improve model performance. For instance, we achieved a large reduction in bias for ice cloud properties through straightforward modifications to the ice microphysics without appreciable increases in computational cost.
Encouragingly, the simulations at a typical GSRM grid spacing of 3–5 km show signs of convergence in updraft variability near active deep convection when compared to updraft observations averaged to same grid spacing, suggesting that the generation of convective gravity waves is reasonably well captured (note that model-simulated updraft variability still increases between simulations of 4 and 1 km grid spacing). However, these waves may not propagate far enough, as indicated by the underestimated updraft variance across all tested horizontal resolutions. Power spectral analyses indicate that grid spacings slightly finer than 250 m may sufficiently capture the scales of motion relevant for cirrus formation and maintenance. This is also the grid spacing at which convergence in cloud macroscopic variables and ice sources and sinks has been observed (Hu et al., 2024).
Vertical resolution also plays a crucial role. Previous studies demonstrate its influence on tropical cirrus properties and their responses to global warming (Ohno et al., 2019), as well as convective self-aggregation (Jenney et al., 2023). We also perform a sensitivity test that halves the vertical grid spacing from 200 to 100 m, leading to the same model improvement as an increase in horizontal grid spacing from 1 km to 250 m (Fig. A1g). Doubling the vertical resolution in the upper troposphere increases the computational costs by only a factor of 2.5. This suggests that refining vertical resolution could be a more computationally efficient way to improve model updraft variability than increases in horizontal resolution, and it should be thoroughly investigated in future studies.
Nevertheless, higher resolution alone cannot address all challenges. Processes at microscopic scales, particularly the interactions between ice microphysics and radiation, remain poorly resolved. Efforts to improve ice microphysics in GSRMs are scarce (e.g., Seiki and Ohno, 2022) yet essential for advancing understanding of tropical cirrus evolution. Our study highlights the importance of accurately modeling cirrus evolution, a key factor in determining their microphysical properties and radiative effects.
Passive tracers, as demonstrated in this study, are a valuable tool for tracking the evolution of ice clouds in models. Although these tracers are purely computational, stable water isotopes, measurable in situ or via satellite, could serve as real-world tracer analogs, offering insights into the pathways of ice cloud evolution (Blossey et al., 2010; de Vries et al., 2022). Trajectory analysis, such as that in Sullivan et al. (2022), can provide additional clarity on cirrus cloud evolution. Based on their analysis of cloud source and sink processes along trajectories, they proposed three cirrus cloud life cycles with distinct radiative signatures. In contrast, our analysis focused only on ice cloud properties. However, by enabling the 3D output of microphysical process rates, we could easily perform a similar process-rate analysis that would provide additional clarity on the two tropical cirrus formation pathways. Future work could explore a consistent integration of these approaches in models and observations, linking simulations with aircraft measurements as in Froyd et al. (2022) and possibly satellite retrievals as well, in an effort to improve process understanding.
The purpose of this work is twofold: first, we demonstrate the usefulness of passive tracers to track the evolution of cirrus microphysical properties. Second, we show that minor changes to cloud microphysics substantially improve the simulation of tropical cirrus at cloud-resolving scales with a minimal change in computational expense.
Our work reveals a simple, numerically inexpensive recipe that substantially improves simulations of tropical cirrus in the SAM cloud-resolving model. Although the recipe was tested only in this specific model, we believe that its elements can be applied to a wider range of models with little or no increase in computational load. The recipe is as follows.
-
Remove all nonphysical microphysical limits (particularly the commonly used ICNC limits, see, e.g., Bacer et al., 2021).
-
Ensure that freezing (or any other) parameterizations do not operate outside of their stated range of validity (e.g., limit mixed-phase freezing parameterizations to mixed-phase conditions).
-
If not present, add a nucleation scheme that is active under cirrus conditions, e.g., homogeneous nucleation of water solution droplets or a combination of homogeneous and heterogeneous nucleation.
We show that anvil clouds remain radiatively important hours after detrainment, despite substantial spreading, thinning, and advection by synoptic and/or mesoscale motion. Therefore, an evolutionary perspective on tropical cirrus is crucial for constraining their radiative impacts. To better capture this evolution, we implemented two passive tracers in the model:
-
A detrainment tracer, useful for tracking the evolution of anvil clouds.
-
An ice nucleation tracer, useful for tracking the evolution of in situ cirrus.
Tracers also provide important insights into the climatology of cirrus cloud formation. We find that in situ cirrus dominate under colder conditions (> 70 % of cirrus at temperatures below −70 °C) and are prevalent at low ice water path values (IWP < 1 g m−2). Despite their low optical depth, in situ cirrus account for 7 % of the total tropical cirrus TOA CRE. However, our estimates are sensitive to the specific classification criteria used for cloud origin and lack considerations of cloud overlap, highlighting the need for more refined approaches.
Our results also suggest that simulations with horizontal grid spacing of 250 m can reproduce the observed power spectrum of vertical wind, capturing the scales of motion relevant for cirrus formation and maintenance, particularly below 14 km.
More broadly, our work highlights a significant limitation in existing global climate and cloud-resolving models, many of which fail to accurately simulate tropical cirrus evolution (Wall and Hartmann, 2018; Turbeville et al., 2022; Atlas et al., 2024). These biases pose difficulties for understanding the processes that occur between the formation of tropical cirrus and their dissipation (Gasparini et al., 2023), leaving large uncertainties in the associated climate feedbacks (Sherwood et al., 2020). Additionally, the interaction of ice crystals with radiation, which influences atmospheric temperatures, can alter cloud lifetimes (Gasparini et al., 2022), regional climate (Voigt et al., 2019), and hydrological sensitivity (McGraw et al., 2025), with potentially important impacts as high clouds shift upward in a warming climate (Voigt et al., 2024; Gasparini et al., 2024). By addressing these gaps, we have demonstrated that our improved SAM model is now equipped to explore these feedbacks with greater confidence.
Building on the advancements presented here, future studies should focus on reducing uncertainties in the fundamental understanding and modeling of cirrus properties and their evolution in the present and in a warmer climate. The combination of passive tracers, improved microphysics, and high-resolution modeling provides a promising pathway to achieve this goal.
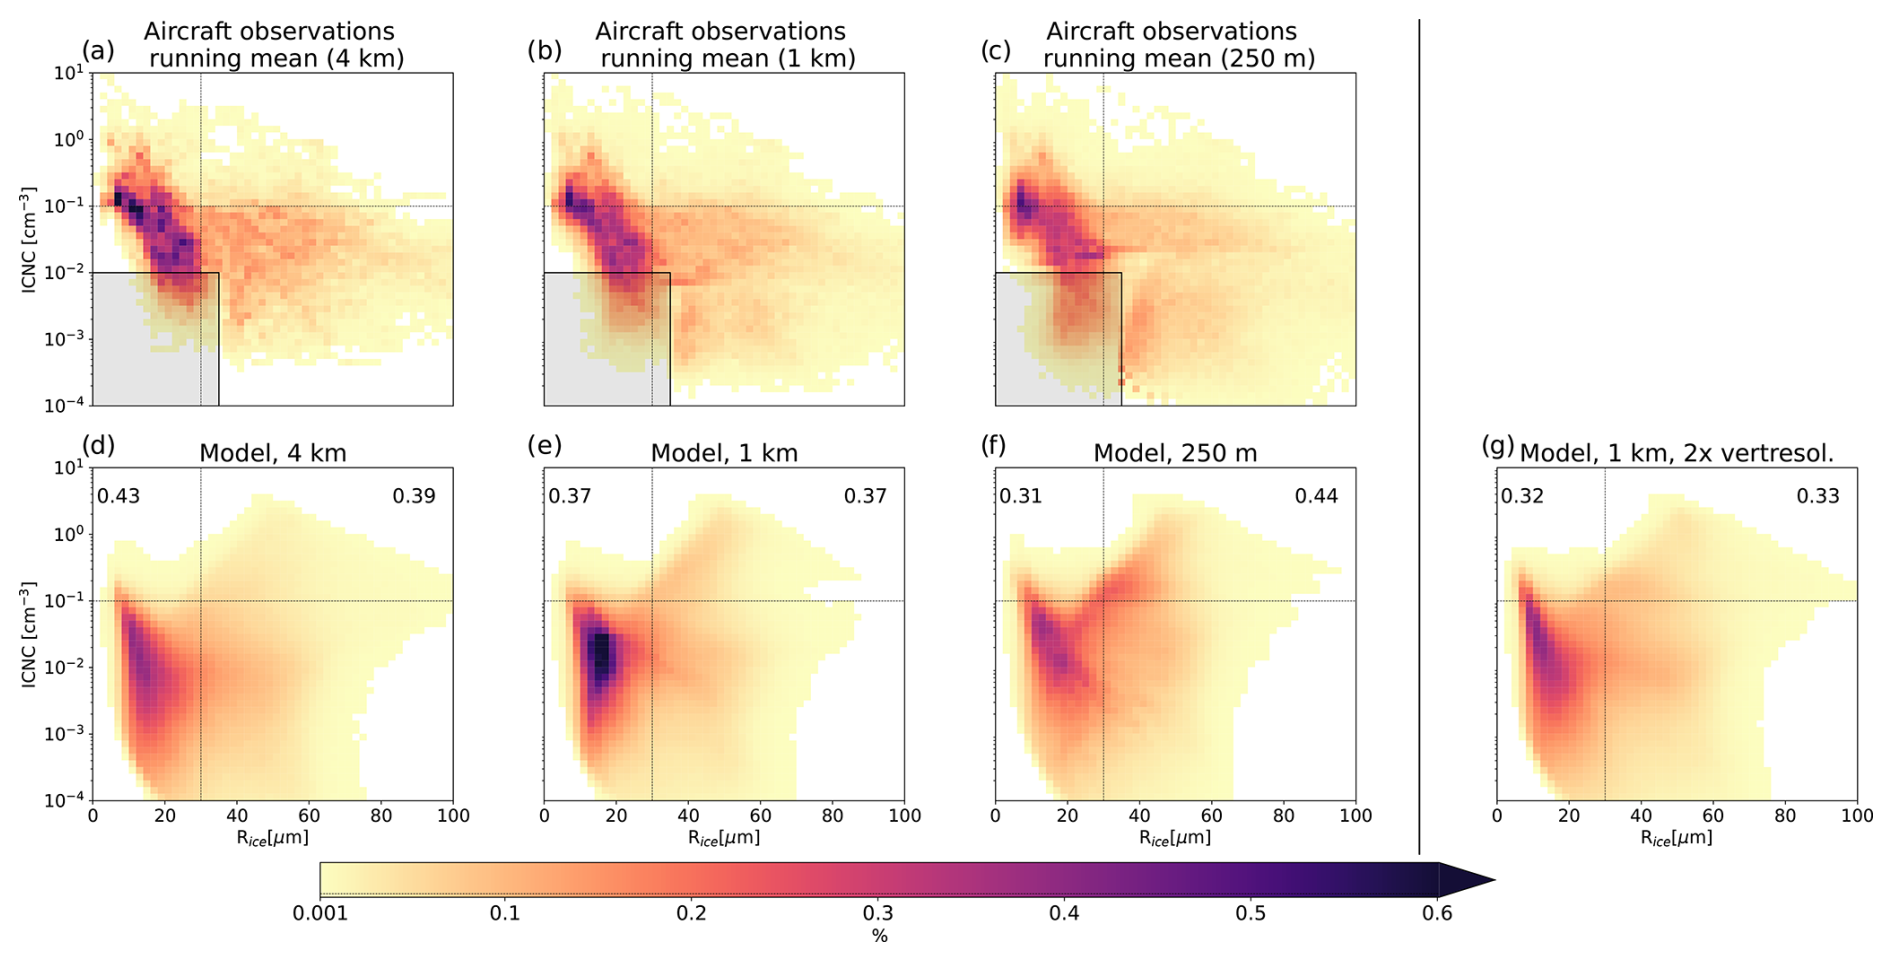
Figure A1Model grid spacing dependence in the ICNC–Rice space. Probability density function of ice properties for clouds at T < −40 °C. The upper row (a–c) shows aircraft observations averaged for consistency to 4 km, 1 km, and 250 m grids. Panels (d)–(f) show modeled properties at different horizontal grid spacings. Panel (g) shows modeled properties at 1 km horizontal grid spacing and doubled upper-tropospheric vertical grid spacing (to about 100 m). The number represents a two-dimensional total variation distance of model data compared to aircraft observations (the smaller, the better). Observations are limited or not available in the shaded area.
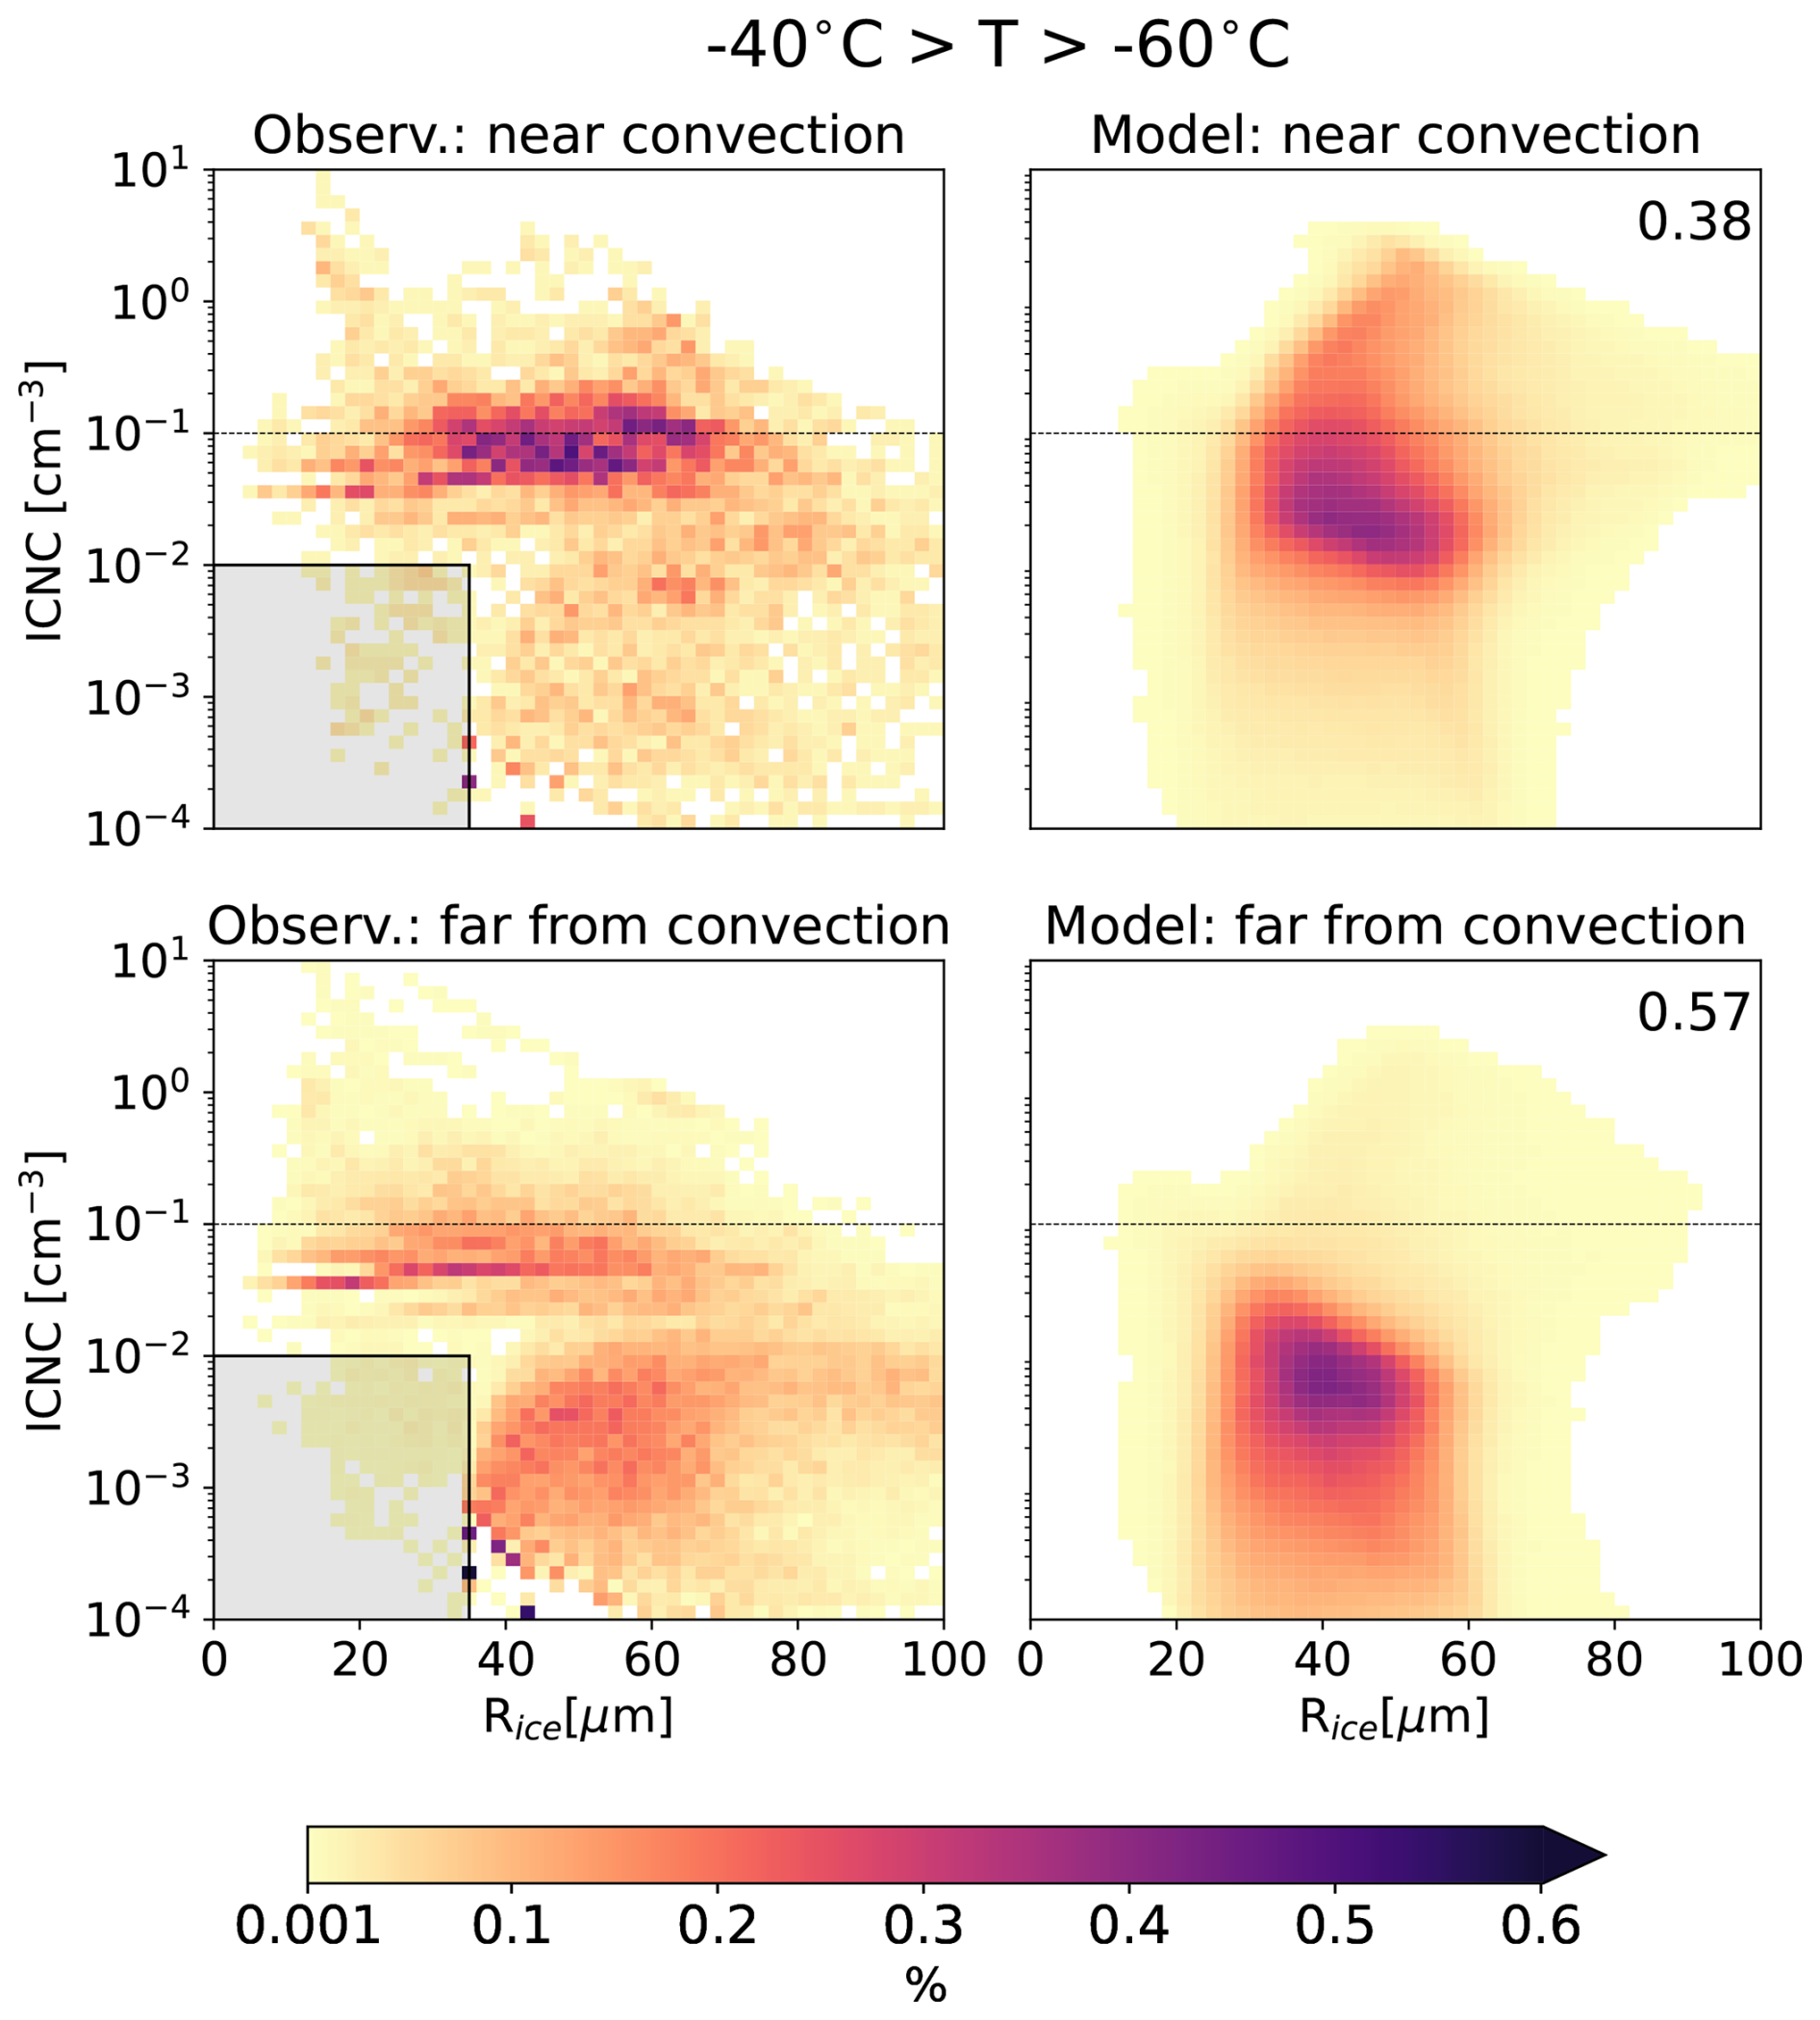
Figure A2Probability density function of ice properties near (brightness temperature < 240 K) and far from active convection (brightness temperature > 240 K) at −40 °C > T > −60 °C. The number on the right is the dimensional total variation distance of model data compared to aircraft observations (the smaller, the better). Observations are limited or not available in the shaded area.
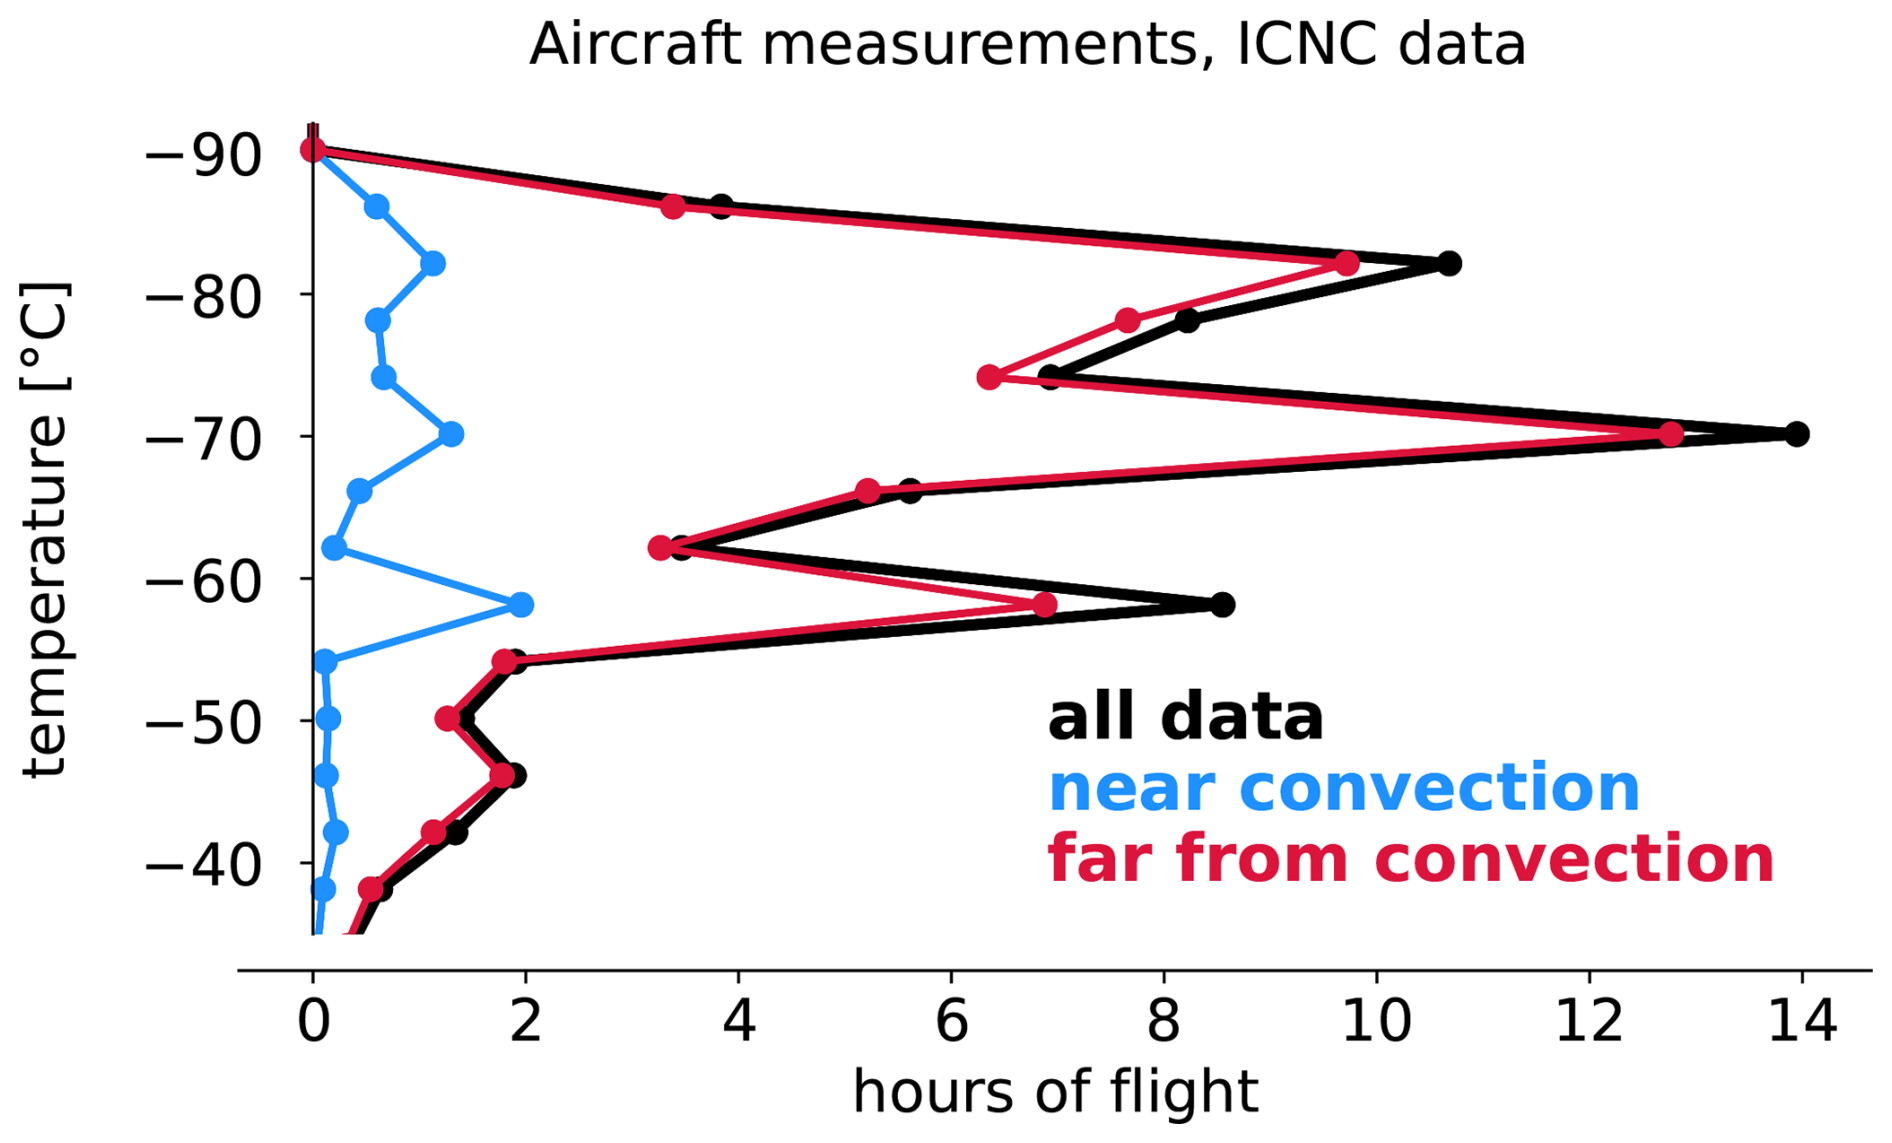
Figure A3Number of measurement hours for ICNC data. The measurement frequency is 1 Hz, so 1 h corresponds to 3600 measurements. The Rice data have the same number of flight hours, while there are slightly more IWC data.
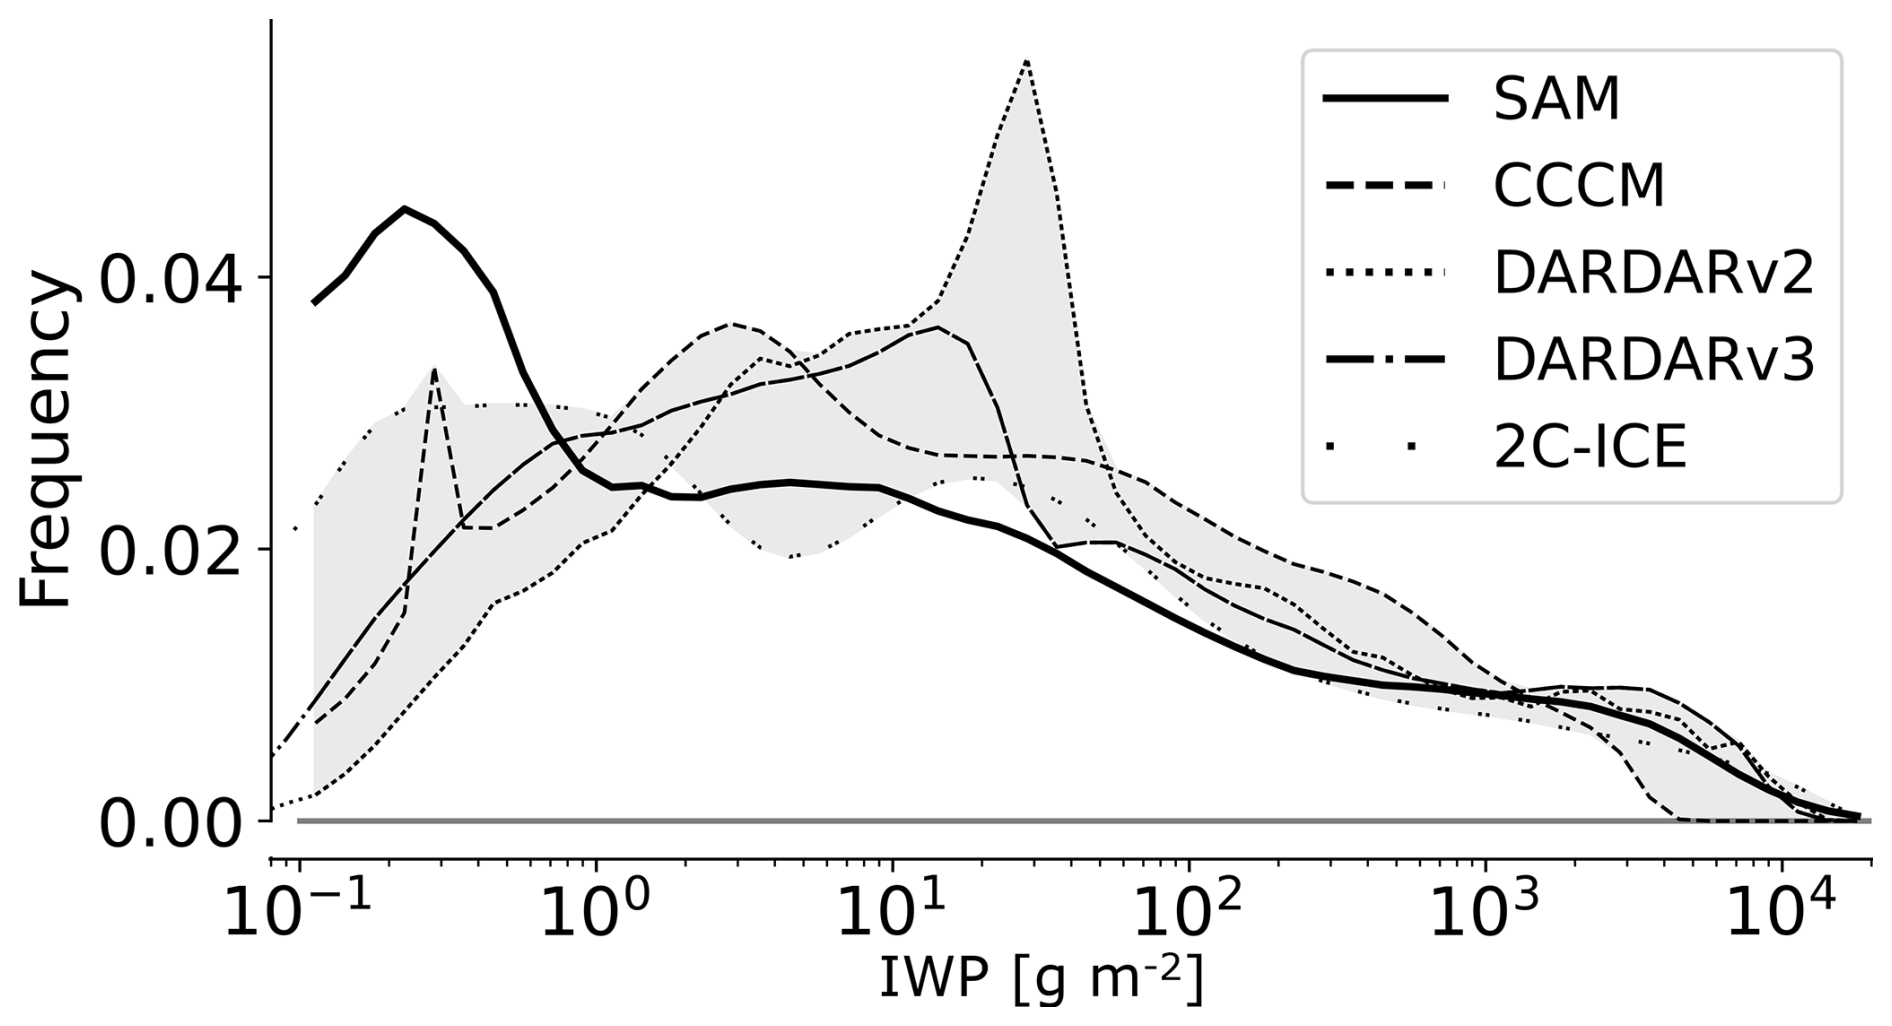
Figure B1Ice water path (IWP)-binned occurrence frequency. As in Fig. 4a, but for IWP > 0.1 g m−2.
The maximum ice water content from in situ homogeneous ice nucleation, IWChom, is derived following Mitchell and Garnier (2024). The critical ice supersaturation ratio for homogeneous ice nucleation is defined as , where ehom(T) is the water vapor pressure at the homogeneous nucleation threshold and esi(T) is the saturation vapor pressure over ice, computed from the temperature-dependent formulation of Murphy and Koop (2005).
We approximate Shom(T) using the expression from Koop et al. (2000) as reformulated by Lamb and Verlinde (2011, Eq. 7.33):
where esw(T) is the saturation vapor pressure over liquid water based on Murphy and Koop (2005). The density of water vapor ρ is calculated from the ideal gas law , where e is the water vapor pressure, Rv is the specific gas constant for water vapor, and T is the temperature.
The maximum ice water content formed by homogeneous nucleation is then the excess vapor density above ice saturation:
Using , we obtain
This expression shows that the excess supersaturation (Shom(T)−1) determines the amount of vapor available for depositional growth after a homogeneous nucleation event. The higher the supersaturation, the greater the potential for ice crystal growth and thus the higher the IWChom. A similar approach can be used to compute IWC at any fixed supersaturation threshold (e.g., S=1.2 or RHice = 120 %, a threshold often associated with heterogeneous ice nucleation triggered by effective ice-nucleating particles) by substituting Shom with the desired value supersaturation threshold.
Data, plotting, and post-processing scripts, as well as key (modified) bits of the SAM model Fortran code, are available on Zenodo at https://doi.org/10.5281/zenodo.15785518 (Gasparini, 2025a). The complete SAM model code is available for download at https://you.stonybrook.edu/somas/sam/ (last access: 1 September 2025). Satellite data from the A-Train Integrated CALIPSO, CloudSat, CERES, and MODIS Merged Product Release B1 (CCCM) were obtained from https://search.earthdata.nasa.gov (last access: 20 February 2024). The DARDAR data are available at http://www.icare.univ-lille1.fr/ (last access: 10 August 2024). The 2C-ICE data are available at https://www.cloudsat.cira.colostate.edu (last access: 9 November 2024). The POSIDON, ATTREX, and CONTRAST data used in this study are available at https://doi.org/10.34730/266CA2A41F4946FF97D874BFA458254C (Krämer et al., 2020b). The original campaign data can be retrieved at https://espoarchive.nasa.gov/archive/browse/posidon/WB57 (last access: 10 December 2024) (POSIDON), https://espo.nasa.gov/attrex/content/Welcome_to_the_ESPO_Data_Archive (last access: 10 December 2024) (ATTREX), and https://www2.acom.ucar.edu/contrast (last access: 10 December 2024) (CONTRAST). The complete model output is available for download at https://hdl.handle.net/11353/10.2150070 (Gasparini, 2025c).
A Video Supplement showing the evolution of clouds in part of the model domain between days 22.75 and 27.75 is available at https://doi.org/10.5281/zenodo.15497521 (Gasparini, 2025b). The panels visualize quantities shown in Fig. 5.
BG conceived the study, implemented code changes, conducted model simulations, processed the majority of the data, and contributed to writing and editing. RA processed part of the data and contributed to writing and editing. AV contributed to writing and editing. MK acquired and processed data and contributed to writing and editing. PNB implemented code changes, provided technical support, and contributed to writing and editing.
At least one of the (co-)authors is a member of the editorial board of Atmospheric Chemistry and Physics. The peer-review process was guided by an independent editor, and the authors also have no other competing interests to declare.
Publisher's note: Copernicus Publications remains neutral with regard to jurisdictional claims made in the text, published maps, institutional affiliations, or any other geographical representation in this paper. While Copernicus Publications makes every effort to include appropriate place names, the final responsibility lies with the authors.
This material is based upon work supported by the National Science Foundation under grant no. OISE-1743753 (Peter N. Blossey). We would also like to acknowledge high-performance computing support from Cheyenne (https://doi.org/10.5065/D6RX99HX, Computational and Information Systems Laboratory, Cheyenne, 2017) and Derecho (https://doi.org/10.5065/qx9a-pg09, Computational and Information Systems Laboratory, Cheyenne, 2023) provided by NCAR's Computational and Information Systems Laboratory, sponsored by the National Science Foundation. The authors would like to thank Bernd Kärcher for useful comments on early work leading to this paper. We acknowledge the use of several AI tools to improve the language and clarity of an earlier version of this paper. We thank the reviewers for their constructive comments that improved the paper.
This project has received funding from the European Union's Horizon 2020 research and innovation program under the Marie Skłodowska-Curie Actions (grant agreement nos. 101025473 and 101151941) and the National Science Foundation (grant no. OISE-1743753).
This paper was edited by Shaocheng Xie and reviewed by four anonymous referees.
Achatz, U., Alexander, M. J., Becker, E., Chun, H.-Y., Dörnbrack, A., Holt, L., Plougonven, R., Polichtchouk, I., Sato, K., Sheshadri, A., Stephan, C. C., van Niekerk, A., and Wright, C. J.: Atmospheric Gravity Waves: Processes and Parameterization, J. Atmos. Sci., 81, 237–262, https://doi.org/10.1175/JAS-D-23-0210.1, 2024. a
Ansmann, A., Tesche, M., Althausen, D., Müller, D., Seifert, P., Freudenthaler, V., Heese, B., Wiegner, M., Pisani, G., Knippertz, P., and Dubovik, O.: Influence of Saharan Dust on Cloud Glaciation in Southern Morocco during the Saharan Mineral Dust Experiment, J. Geophys. Res.-Atmos., 113, 1–16, https://doi.org/10.1029/2007JD008785, 2008. a
Atlas, R. and Bretherton, C. S.: Aircraft observations of gravity wave activity and turbulence in the tropical tropopause layer: prevalence, influence on cirrus clouds, and comparison with global storm-resolving models, Atmos. Chem. Phys., 23, 4009–4030, https://doi.org/10.5194/acp-23-4009-2023, 2023. a, b, c, d
Atlas, R., Bretherton, C. S., Sokol, A. B., Blossey, P. N., and Khairoutdinov, M. F.: Tropical Cirrus Are Highly Sensitive to Ice Microphysics Within a Nudged Global Storm-Resolving Model, Geophys. Res. Lett., 51, e2023GL105868, https://doi.org/10.1029/2023GL105868, 2024. a, b
Avery, M., Winker, D., Heymsfield, A., Vaughan, M., Young, S., Hu, Y., and Trepte, C.: Cloud Ice Water Content Retrieved from the CALIOP Space-Based Lidar, Geophys. Res. Lett., 39, 2–7, https://doi.org/10.1029/2011GL050545, 2012. a
Bacer, S., Sullivan, S. C., Sourdeval, O., Tost, H., Lelieveld, J., and Pozzer, A.: Cold cloud microphysical process rates in a global chemistry–climate model, Atmos. Chem. Phys., 21, 1485–1505, https://doi.org/10.5194/acp-21-1485-2021, 2021. a
Balmes, K. A. and Fu, Q.: An Investigation of Optically Very Thin Ice Clouds from Ground-Based ARM Raman Lidars, Atmosphere, 9, https://doi.org/10.3390/atmos9110445, 2018. a
Barahona, D., Molod, A., and Kalesse, H.: Direct Estimation of the Global Distribution of Vertical Velocity within Cirrus Clouds, Sci. Rep., 7, 6840, https://doi.org/10.1038/s41598-017-07038-6, 2017. a
Barklie, R. H. D. and Gokhale, N. R.: The Freezing of Supercooled Water Drops, Alberta Hail, McGill University Stormy Weather Group Science Rep., MW-30, 43–65, 1959. a
Berry, E. and Mace, G. G.: Cloud Properties and Radiative Effects of the Asian Summer Monsoon Derived from A-Train Data, J. Geophys. Res.-Atmos., 119, 9492–9508, https://doi.org/10.1002/2014JD021458, 2014. a, b, c
Bigg, E. K.: The Supercooling of Water, P. Phys. Soc. B, 66, 688, https://doi.org/10.1088/0370-1301/66/8/309, 1953. a
Blossey, P. N., Kuang, Z., and Romps, D. M.: Isotopic Composition of Water in the Tropical Tropopause Layer in Cloud-Resolving Simulations of an Idealized Tropical Circulation, J. Geophys. Res.-Atmos., 115, 1–23, https://doi.org/10.1029/2010JD014554, 2010. a, b
Bramberger, M., Alexander, M. J., Davis, S., Podglajen, A., Hertzog, A., Kalnajs, L., Deshler, T., Goetz, J. D., and Khaykin, S.: First Super-Pressure Balloon-Borne Fine-Vertical-Scale Profiles in the Upper TTL: Impacts of Atmospheric Waves on Cirrus Clouds and the QBO, Geophys. Res. Lett., 49, e2021GL097596, https://doi.org/10.1029/2021GL097596, 2022. a
Bretherton, C. S.: Challenges in Numerical Modeling of Tropical Circulations, in: The Global Circulation of the Atmosphere, Princeton University Press, vol. 3026330, 302–330, https://doi.org/10.1515/9780691236919, 2007. a
Bretherton, C. S., Blossey, P. N., and Peters, M. E.: Interpretation of Simple and Cloud-Resolving Simulations of Moist Convection–Radiation Interaction with a Mock-Walker Circulation, Theor. Comp. Fluid Dyn., 20, 421–442, https://doi.org/10.1007/s00162-006-0029-7, 2006. a
Cazenave, Q., Ceccaldi, M., Delanoë, J., Pelon, J., Groß, S., and Heymsfield, A.: Evolution of DARDAR-CLOUD ice cloud retrievals: new parameters and impacts on the retrieved microphysical properties, Atmos. Meas. Tech., 12, 2819–2835, https://doi.org/10.5194/amt-12-2819-2019, 2019. a
Chang, K.-W. and L'Ecuyer, T.: Influence of gravity wave temperature anomalies and their vertical gradients on cirrus clouds in the tropical tropopause layer – a satellite-based view, Atmos. Chem. Phys., 20, 12499–12514, https://doi.org/10.5194/acp-20-12499-2020, 2020. a
Cooper, W. A.: Ice Initiation in Natural Clouds, Meteor. Mon., 43, 29–32, https://doi.org/10.1175/0065-9401-21.43.29, 1986. a, b, c
Computational and Information Systems Laboratory, Cheyenne: HPE/SGI ICE XA System (University Community Computing), Boulder, CO, National Center for Atmospheric Research, https://doi.org/10.5065/D6RX99HX, 2017. a
Computational and Information Systems Laboratory, Derecho: HPE Cray EX System (University Community Computing), Boulder, CO, National Center for Atmospheric Research, https://doi.org/10.5065/qx9a-pg09, 2023. a
Corcos, M., Hertzog, A., Plougonven, R., and Podglajen, A.: A simple model to assess the impact of gravity waves on ice-crystal populations in the tropical tropopause layer, Atmos. Chem. Phys., 23, 6923–6939, https://doi.org/10.5194/acp-23-6923-2023, 2023. a
Costa, A., Meyer, J., Afchine, A., Luebke, A., Günther, G., Dorsey, J. R., Gallagher, M. W., Ehrlich, A., Wendisch, M., Baumgardner, D., Wex, H., and Krämer, M.: Classification of Arctic, midlatitude and tropical clouds in the mixed-phase temperature regime, Atmos. Chem. Phys., 17, 12219–12238, https://doi.org/10.5194/acp-17-12219-2017, 2017. a
Delanoë, J. and Hogan, R. J.: Combined CloudSat-CALIPSO-MODIS Retrievals of the Properties of Ice Clouds, J.Geophys. Res., 115, 1–17, https://doi.org/10.1029/2009JD012346, 2010. a
Delanoë, J. M. and Hogan, R. J.: A Variational Scheme for Retrieving Ice Cloud Properties from Combined Radar, Lidar, and Infrared Radiometer, J. Geophys. Res.-Atmos., 113, 1–21, https://doi.org/10.1029/2007JD009000, 2008. a
DeMott, P. J., Prenni, A. J., Liu, X., Kreidenweis, S. M., Petters, M. D., Twohy, C. H., Richardson, M. S., Eidhammer, T., and Rogers, D. C.: Predicting Global Atmospheric Ice Nuclei Distributions and Their Impacts on Climate, P. Natl. Acad. Sci. USA, 107, 11217–11222, https://doi.org/10.1073/pnas.0910818107, 2010. a
Deng, M., Mace, G. G., Wang, Z., and Berry, E.: CloudSat 2C-ICE Product Update with a New Ze Parameterization in Lidar-Only Region, J. Geophys. Res.-Atmos., 120, 12198–12208, https://doi.org/10.1002/2015JD023600, 2015. a
Deutloff, J., Buehler, S. A., Brath, M., and Naumann, A. K.: Insights on Tropical High-Cloud Radiative Effect From a New Conceptual Model, J. Adv. Model. Earth Sy., 17, e2024MS004615, https://doi.org/10.1029/2024MS004615, 2025. a
de Vries, A. J., Aemisegger, F., Pfahl, S., and Wernli, H.: Stable water isotope signals in tropical ice clouds in the West African monsoon simulated with a regional convection-permitting model, Atmos. Chem. Phys., 22, 8863–8895, https://doi.org/10.5194/acp-22-8863-2022, 2022. a
Dinh, T., Gasparini, B., and Bellon, G.: Clouds and Radiatively Induced Circulations, in: Cloud Physics and Dynamics: Showers and Shade from Earth's Atmosphere, edited by: Sullivan, S. C. and Hoose, C., Geophysical Monograph, American Geophysical Union Monograph Series, 239–253, ISBN 978-1-119-70031-9, 2023. a
Flatau, P. J., Walko, R. L., and Cotton, W.: Polynomial Fits to Saturation Vapor Pressure, J. Appl. Meteorol., 31, 1507–1513, 1992. a
Froyd, K. D., Yu, P., Schill, G. P., Brock, C. A., Kupc, A., Williamson, C. J., Jensen, E. J., Ray, E., Rosenlof, K. H., Bian, H., Darmenov, A. S., Colarco, P. R., Diskin, G. S., Bui, T. P., and Murphy, D. M.: Dominant Role of Mineral Dust in Cirrus Cloud Formation Revealed by Global-Scale Measurements, Nat. Geosci., 15, 177–183, https://doi.org/10.1038/s41561-022-00901-w, 2022. a
Gasparini, B.: Tropical cirrus evolution in a km-scale model with improved ice microphysics, in: Atmospheric Chemisty and Physics, Zenodo [data set and code], https://doi.org/10.5281/zenodo.15785518, 2025a. a
Gasparini, B.: Animation for “Tropical cirrus evolution in a km-scale model with improved ice microphysics”, Zenodo [video], https://doi.org/10.5281/zenodo.15497521, 2025b. a
Gasparini, B.: Data and scripts for “Gasparini et al., 2025: Tropical cirrus evolution in a km-scale model with improved ice microphysics” published in ACP, Phaidra [data set], https://hdl.handle.net/11353/10.2150070 (last access: 2 September 2025), 2025c. a
Gasparini, B. and Lohmann, U.: Why Cirrus Cloud Seeding Cannot Substantially Cool the Planet, J. Geophys. Res.-Atmos., 121, 4877–4893, https://doi.org/10.1002/2015JD024666, 2016. a
Gasparini, B., Meyer, A., Neubauer, D., Münch, S., and Lohmann, U.: Cirrus Cloud Properties as Seen by the CALIPSO Satellite and ECHAM-HAM Global Climate Model, J. Climate, 31, 1983–2003, https://doi.org/10.1175/JCLI-D-16-0608.1, 2018. a
Gasparini, B., Blossey, P. N., Hartmann, D. L., Lin, G., and Fan, J.: What Drives the Life Cycle of Tropical Anvil Clouds?, J. Adv. Model. Earth Sy., 11, 2586–2605, https://doi.org/10.1029/2019MS001736, 2019. a, b
Gasparini, B., Rasch, P. J., Hartmann, D. L., Wall, C. J., and Dütsch, M.: A Lagrangian Perspective on Tropical Anvil Cloud Lifecycle in Present and Future Climate, J. Geophys. Res.-Atmos., 126, 1–26, https://doi.org/10.1029/2020jd033487, 2021. a, b
Gasparini, B., Sokol, A. B., Wall, C. J., Hartmann, D. L., and Blossey, P. N.: Diurnal Differences in Tropical Maritime Anvil Cloud Evolution, J. Climate, 35, 1655–1677, https://doi.org/10.1175/jcli-d-21-0211.1, 2022. a, b, c, d, e
Gasparini, B., Sullivan, S. C., Sokol, A. B., Kärcher, B., Jensen, E., and Hartmann, D. L.: Opinion: Tropical cirrus – from micro-scale processes to climate-scale impacts, Atmos. Chem. Phys., 23, 15413–15444, https://doi.org/10.5194/acp-23-15413-2023, 2023. a, b
Gasparini, B., Mandorli, G., Stubenrauch, C., and Voigt, A.: Basic Physics Predicts Stronger High Cloud Radiative Heating With Warming, Geophys. Res. Lett., 51, e2024GL111228, https://doi.org/10.1029/2024GL111228, 2024. a
Gibbs, A. L. and Su, F. E.: On Choosing and Bounding Probability Metrics, Int. Stat. Rev., 70, 419–435, https://doi.org/10.1111/j.1751-5823.2002.tb00178.x, 2002. a
Haladay, T. and Stephens, G.: Characteristics of Tropical Thin Cirrus Clouds Deduced from Joint CloudSat and CALIPSO Observations, J. Geophys. Res., 114, 1–13, https://doi.org/10.1029/2008JD010675, 2009. a
Hartmann, D. L. and Berry, S. E.: The Balanced Radiative Effect of Tropical Anvil Clouds, J. Geophys. Res.-Atmos., 122, https://doi.org/10.1002/2017JD026460, 2017. a
Hartmann, D. L., Gasparini, B., Berry, S. E., and Blossey, P. N.: The Life Cycle and Net Radiative Effect of Tropical Anvil Clouds, J. Adv. Model. Earth Sy., 10, 3012–3029, https://doi.org/10.1029/2018MS001484, 2018. a, b
Hawker, R. E., Miltenberger, A. K., Johnson, J. S., Wilkinson, J. M., Hill, A. A., Shipway, B. J., Field, P. R., Murray, B. J., and Carslaw, K. S.: Model emulation to understand the joint effects of ice-nucleating particles and secondary ice production on deep convective anvil cirrus, Atmos. Chem. Phys., 21, 17315–17343, https://doi.org/10.5194/acp-21-17315-2021, 2021. a
Herbert, R. J., Murray, B. J., Dobbie, S. J., and Koop, T.: Sensitivity of Liquid Clouds to Homogenous Freezing Parameterizations, Geophys. Res. Lett., 42, 1599–1605, https://doi.org/10.1002/2014GL062729, 2015. a
Hoose, C., Lohmann, U., Erdin, R., and Tegen, I.: The Global Influence of Dust Mineralogical Composition on Heterogeneous Ice Nucleation in Mixed-Phase Clouds, Environ. Res. Lett., 3, 025003, https://doi.org/10.1088/1748-9326/3/2/025003, 2008. a
Horner, G. and Gryspeerdt, E.: The evolution of deep convective systems and their associated cirrus outflows, Atmos. Chem. Phys., 23, 14239–14253, https://doi.org/10.5194/acp-23-14239-2023, 2023. a
Hoyle, C. R., Luo, B. P., and Peter, T.: The Origin of High Ice Crystal Number Densities in Cirrus Clouds, J. Atmos. Sci., 62, 2568–2579, https://doi.org/10.1175/JAS3487.1, 2005. a
Hu, Z., Jeevanjee, N., and Kuang, Z.: A Refined Zero-Buoyancy Plume Model for Large-Scale Atmospheric Profiles and Anvil Clouds in Radiative-Convective Equilibrium, J. Adv. Model. Earth Sy., 16, e2023MS004050, https://doi.org/10.1029/2023MS004050, 2024. a
Huang, Q. and Dinh, T.: Tropical cirrus clouds of convective and non-convective origins, Atmos. Chem. Phys. Discuss. [preprint], https://doi.org/10.5194/acp-2022-146, 2022. a
Huang, Y., Wu, W., McFarquhar, G. M., Xue, M., Morrison, H., Milbrandt, J., Korolev, A. V., Hu, Y., Qu, Z., Wolde, M., Nguyen, C., Schwarzenboeck, A., and Heckman, I.: Microphysical processes producing high ice water contents (HIWCs) in tropical convective clouds during the HAIC-HIWC field campaign: dominant role of secondary ice production, Atmos. Chem. Phys., 22, 2365–2384, https://doi.org/10.5194/acp-22-2365-2022, 2022. a
Iacono, M. J., Delamere, J. S., Mlawer, E. J., Shephard, M. W., Clough, S. A., and Collins, W. D.: Radiative Forcing by Long-Lived Greenhouse Gases: Calculations with the AER Radiative Transfer Models, J. Geophys. Res.-Atmos., 113, 2–9, https://doi.org/10.1029/2008JD009944, 2008. a
Ickes, L., Welti, A., Hoose, C., and Lohmann, U.: Classical Nucleation Theory of Homogeneous Freezing of Water: Thermodynamic and Kinetic Parameters, Phys. Chem. Chem. Phys., 17, 5514–5537, https://doi.org/10.1039/C4CP04184D, 2015. a
Jeevanjee, N.: Vertical Velocity in the Gray Zone, J. Adv. Model. Earth Sy., 9, 2304–2316, https://doi.org/10.1002/2017MS001059, 2017. a
Jeggle, K., Czerkawski, M., Serva, F., Saux, B. L., Neubauer, D., and Lohmann, U.: IceCloudNet: 3D Reconstruction of Cloud Ice from Meteosat SEVIRI, arXiv [preprint], https://doi.org/10.48550/arXiv.2410.04135, 5 October 2024. a
Jenney, A. M., Ferretti, S. L., and Pritchard, M. S.: Vertical Resolution Impacts Explicit Simulation of Deep Convection, J. Adv. Model. Earth Sy., 15, e2022MS003444, https://doi.org/10.1029/2022MS003444, 2023. a
Jensen, E. J., Lawson, P., Baker, B., Pilson, B., Mo, Q., Heymsfield, A. J., Bansemer, A., Bui, T. P., McGill, M., Hlavka, D., Heymsfield, G., Platnick, S., Arnold, G. T., and Tanelli, S.: On the importance of small ice crystals in tropical anvil cirrus, Atmos. Chem. Phys., 9, 5519–5537, https://doi.org/10.5194/acp-9-5519-2009, 2009. a
Jensen, E. J., Pfister, L., Jordan, D. E., Bui, T. V., Ueyama, R., Singh, H. B., Thornberry, T., Rollins, A. W., Gao, R.-S., Fahey, D. W., Rosenlof, K. H., Elkins, J. W., Diskin, G. S., DiGangi, J. P., Lawson, R. P., Woods, S., Atlas, E. L., Navarro Rodriguez, M. A., Wofsy, S. C., Pittman, J., Bardeen, C. G., Toon, O. B., Kindel, B. C., Newman, P. A., McGill, M. J., Hlavka, D. L., Lait, L. R., Schoeberl, M. R., Bergman, J. W., Selkirk, H. B., Alexander, M. J., Kim, J.-E., Lim, B. H., Stutz, J., and Pfeilsticker, K.: The NASA Airborne Tropical TRopopause EXperiment (ATTREX): High-Altitude Aircraft Measurements in the Tropical Western Pacific, B. Am. Meteorol. Soc., 98, 129–143, https://doi.org/10.1175/BAMS-D-14-00263.1, 2017. a
Jensen, E. J., Kärcher, B., Ueyama, R., Pfister, L., Bui, T. V., Diskin, G. S., DiGangi, J. P., Woods, S., Lawson, R. P., Froyd, K. D., and Murphy, D. M.: Heterogeneous Ice Nucleation in the Tropical Tropopause Layer, J. Geophys. Res.-Atmos., 123, 12210–12227, https://doi.org/10.1029/2018JD028949, 2018. a, b
Jensen, E. J., Kärcher, B., Woods, S., Krämer, M., and Ueyama, R.: The Impact of Gravity Waves on the Evolution of Tropical Anvil Cirrus Microphysical Properties, J. Geophys. Res.-Atmos., 129, e2023JD039887, https://doi.org/10.1029/2023JD039887, 2024. a
Kärcher, B.: A Parameterization of Cirrus Cloud Formation: Revisiting Competing Ice Nucleation, J. Geophys. Res.-Atmos., 127, e2022JD036907, https://doi.org/10.1029/2022JD036907, 2022. a
Kato, S., Rose, F. G., Sun-Mack, S., Miller, W. F., Chen, Y., Rutan, D. A., Stephens, G. L., Loeb, N. G., Minnis, P., Wielicki, B. A., Winker, D. M., Charlock, T. P., Stackhouse, P. W., Xu, K. M., and Collins, W. D.: Improvements of Top-of-Atmosphere and Surface Irradiance Computations with CALIPSO-, CloudSat-, and MODIS-derived Cloud and Aerosol Properties, J. Geophys. Res.-Atmos., 116, 1–21, https://doi.org/10.1029/2011JD016050, 2011. a
Khairoutdinov, M. F. and Randall, D. A.: Cloud Resolving Modeling of the ARM Summer 1997 IOP: Model Formulation, Results, Uncertainties, and Sensitivities, J. Atmos. Sci., 60, 607–625, https://doi.org/10.1175/1520-0469(2003)060<0607:CRMOTA>2.0.CO;2, 2003. a
Khairoutdinov, M. F., Krueger, S. K., Moeng, C.-H., Bogenschutz, P. A., and Randall, D. A.: Large-Eddy Simulation of Maritime Deep Tropical Convection, J. Adv. Model. Earth Sy., 1, 13 pp., https://doi.org/10.3894/james.2009.1.15, 2009. a
Kim, J.-E., Alexander, M. J., Bui, T. P., Dean-Day, J. M., Lawson, R. P., Woods, S., Hlavka, D., Pfister, L., and Jensen, E. J.: Ubiquitous Influence of Waves on Tropical High Cirrus Clouds, Geophys. Res. Lett., 43, 5895–5901, https://doi.org/10.1002/2016GL069293, 2016. a
Köhler, L., Green, B., and Stephan, C. C.: Comparing Loon Superpressure Balloon Observations of Gravity Waves in the Tropics With Global Storm-Resolving Models, J. Geophys. Res.-Atmos., 128, e2023JD038549, https://doi.org/10.1029/2023JD038549, 2023. a
Koop, T., Luo, B., Tsias, A., and Peter, T.: Water Activity as the Determinant for Homogeneous Ice Nucleation in Aqueous Solutions, Nature, 406, 611–614, 2000. a, b, c
Krämer, M., Rolf, C., Luebke, A., Afchine, A., Spelten, N., Costa, A., Meyer, J., Zöger, M., Smith, J., Herman, R. L., Buchholz, B., Ebert, V., Baumgardner, D., Borrmann, S., Klingebiel, M., and Avallone, L.: A microphysics guide to cirrus clouds – Part 1: Cirrus types, Atmos. Chem. Phys., 16, 3463–3483, https://doi.org/10.5194/acp-16-3463-2016, 2016. a, b, c, d
Krämer, M., Rolf, C., Spelten, N., Afchine, A., Fahey, D., Jensen, E., Khaykin, S., Kuhn, T., Lawson, P., Lykov, A., Pan, L. L., Riese, M., Rollins, A., Stroh, F., Thornberry, T., Wolf, V., Woods, S., Spichtinger, P., Quaas, J., and Sourdeval, O.: A microphysics guide to cirrus – Part 2: Climatologies of clouds and humidity from observations, Atmos. Chem. Phys., 20, 12569–12608, https://doi.org/10.5194/acp-20-12569-2020, 2020a. a, b, c, d, e, f
Krämer, M., Rolf, C., and Spelten, N.: The Cirrus Guide II In-situ Aircraft Data Set, FZ-Juelich B2SHARE [data set], https://doi.org/10.34730/266CA2A41F4946FF97D874BFA458254C, 2020b. a
Lamb, D. and Verlinde, J.: Physics and Chemistry of Clouds, Cambridge University Press, Cambridge, ISBN 9780511976377, 2011. a
Lee, J., Yang, P., Dessler, A. E., Gao, B.-C., and Platnick, S.: Distribution and Radiative Forcing of Tropical Thin Cirrus Clouds, J. Atmos. Sci., 66, 3721–3731, https://doi.org/10.1175/2009JAS3183.1, 2009. a
Lesigne, T., Ravetta, F., Podglajen, A., Mariage, V., and Pelon, J.: Extensive coverage of ultrathin tropical tropopause layer cirrus clouds revealed by balloon-borne lidar observations, Atmos. Chem. Phys., 24, 5935–5952, https://doi.org/10.5194/acp-24-5935-2024, 2024. a
Liu, X. and Penner, J. E.: Ice Nucleation Parameterization for Global Models, Meteorol. Z., 14, 499–514, https://doi.org/10.1127/0941-2948/2005/0059, 2005. a, b
Lohmann, U., Lüond, F., and Mahrt, F.: An Introduction to Clouds: From the Microscale to Climate, Cambridge University Press, ISBN 978-1-107-01822-8, 2016. a
Luebke, A. E., Afchine, A., Costa, A., Grooß, J.-U., Meyer, J., Rolf, C., Spelten, N., Avallone, L. M., Baumgardner, D., and Krämer, M.: The origin of midlatitude ice clouds and the resulting influence on their microphysical properties, Atmos. Chem. Phys., 16, 5793–5809, https://doi.org/10.5194/acp-16-5793-2016, 2016. a
Lüttmer, T., Spichtinger, P., and Seifert, A.: Investigating ice formation pathways using a novel two-moment multi-class cloud microphysics scheme, Atmos. Chem. Phys., 25, 4505–4529, https://doi.org/10.5194/acp-25-4505-2025, 2025. a
McGraw, Z., Polvani, L. M., Gasparini, B., Van de Koot, E. K., and Voigt, A.: The Cloud Radiative Response to Surface Warming Weakens Hydrological Sensitivity, Geophys. Res. Lett., 52, e2024GL112368, https://doi.org/10.1029/2024GL112368, 2025. a
Meyers, M. P., Demott, P. J., and Cotton, W. R.: New Primary Ice-Nucleation Parameterizations in an Explicit Cloud Model, J. Appl. Meteorol., 31, 708–721, https://doi.org/10.1175/1520-0450(1992)031<0708:NPINPI>2.0.CO;2, 1992. a, b, c
Mitchell, D. L. and Garnier, A.: Advances in CALIPSO (IIR) cirrus cloud property retrievals – Part 2: Global estimates of the fraction of cirrus clouds affected by homogeneous ice nucleation, EGUsphere [preprint], https://doi.org/10.5194/egusphere-2024-3814, 2024. a
Mlawer, E. J., Taubman, J., Brown, P. D., Iacono, M. J., and Clough, S. A.: Radiative Transfer for Inhomogeneous Atmospheres: RRTM, a Validated Correlated-k Model for the Longwave, J. Geophys. Res., 102, 16663–16682, https://doi.org/10.1029/97JD00237, 1997. a
Morrison, H. and Milbrandt, J. A.: Parameterization of Cloud Microphysics Based on the Prediction of Bulk Ice Particle Properties. Part I: Scheme Description and Idealized Tests, J. Atmos. Sci., 72, 287–311, https://doi.org/10.1175/JAS-D-14-0065.1, 2015. a
Morrison, H., Curry, J. A., and Khvorostyanov, V. I.: A New Double-Moment Microphysics Parameterization for Application in Cloud and Climate Models. Part I: Description, J. Atmos. Sci., 62, 1665–1677, https://doi.org/10.1175/JAS3446.1, 2005. a
Murphy, D. M. and Koop, T.: Review of the Vapour Pressures of Ice and Supercooled Water for Atmospheric Applications, Q. J. Roy. Meteor. Soc., 131, 1539–1565, https://doi.org/10.1256/qj.04.94, 2005. a, b, c, d
Ohno, T., Satoh, M., and Noda, A.: Fine Vertical Resolution Radiative-Convective Equilibrium Experiments: Roles of Turbulent Mixing on the High-Cloud Response to Sea Surface Temperatures, J. Adv. Model. Earth Sy., 11, 1–18, https://doi.org/10.1029/2019MS001704, 2019. a
Pan, L. L., Atlas, E. L., Salawitch, R. J., Honomichl, S. B., Bresch, J. F., Randel, W. J., Apel, E. C., Hornbrook, R. S., Weinheimer, A. J., Anderson, D. C., Andrews, S. J., Baidar, S., Beaton, S. P., Campos, T. L., Carpenter, L. J., Chen, D., Dix, B., Donets, V., Hall, S. R., Hanisco, T. F., Homeyer, C. R., Huey, L. G., Jensen, J. B., Kaser, L., Kinnison, D. E., Koenig, T. K., Lamarque, J. F., Liu, C., Luo, J., Luo, Z. J., Montzka, D. D., Nicely, J. M., Pierce, R. B., Riemer, D. D., Robinson, T., Romashkin, P., Saiz-Lopez, A., Schauffler, S., Shieh, O., Stell, M. H., Ullmann, K., Vaughan, G., Volkamer, R., and Wolfe, G.: The Convective Transport of Active Species in the Tropics (Contrast) Experiment, B. Am. Meteorol. Soc., 98, 106–128, https://doi.org/10.1175/BAMS-D-14-00272.1, 2017. a
Prein, A. F., Wang, D., Ge, M., Ramos Valle, A., and Chasteen, M. B.: Resolving Mesoscale Convective Systems: Grid Spacing Sensitivity in the Tropics and Midlatitudes, J. Geophys. Res.-Atmos., 130, e2024JD042530, https://doi.org/10.1029/2024JD042530, 2025. a
Proske, U., Ferrachat, S., Klampt, S., Abeling, M., and Lohmann, U.: Addressing Complexity in Global Aerosol Climate Model Cloud Microphysics, J. Adv. Model. Earth Sy., 15, e2022MS003571, https://doi.org/10.1029/2022MS003571, 2023. a
Qu, Z., Korolev, A., Milbrandt, J. A., Heckman, I., Huang, Y., McFarquhar, G. M., Morrison, H., Wolde, M., and Nguyen, C.: The impacts of secondary ice production on microphysics and dynamics in tropical convection, Atmos. Chem. Phys., 22, 12287–12310, https://doi.org/10.5194/acp-22-12287-2022, 2022. a
Salesky, S. T., Gillis, K., Anderson, J., Helman, I., Cantrell, W., and Shaw, R. A.: Modeling the Subgrid-Scale Scalar Variance: A Priori Tests and Application to Supersaturation in Cloud Turbulence, J. Atmos. Sci., 81, 839–853, https://doi.org/10.1175/JAS-D-23-0163.1, 2024. a
Scott, S. G., Bui, T. P., Chan, K. R., and Bowen, S. W.: The Meteorological Measurement System on the NASA ER-2 Aircraft, J. Atmos. Ocean. Tech., 7, 525–540, https://doi.org/10.1175/1520-0426(1990)007<0525:TMMSOT>2.0.CO;2, 1990. a
Seiki, T. and Ohno, T.: Improvements of the Double-Moment Bulk Cloud Microphysics Scheme in the Nonhydrostatic Icosahedral Atmospheric Model (NICAM), J. Atmos. Sci., 80, 111–127, https://doi.org/10.1175/JAS-D-22-0049.1, 2022. a
Shardt, N., Isenrich, F. N., Waser, B., Marcolli, C., Kanji, Z. A., deMello, A. J., and Lohmann, U.: Homogeneous Freezing of Water Droplets for Different Volumes and Cooling Rates, Phys. Chem. Chem. Phys., 24, 28213–28221, https://doi.org/10.1039/D2CP03896J, 2022. a
Sherwood, S. C., Webb, M. J., Annan, J. D., Armour, K. C., Forster, P. M., Hargreaves, J. C., Hegerl, G., Klein, S. A., Marvel, K. D., Rohling, E. J., Watanabe, M., Andrews, T., Braconnot, P., Bretherton, C. S., Foster, G. L., Hausfather, Z., Heydt, A. S., Knutti, R., Mauritsen, T., Norris, J. R., Proistosescu, C., Rugenstein, M., Schmidt, G. A., Tokarska, K. B., and Zelinka, M. D.: An Assessment of Earth's Climate Sensitivity Using Multiple Lines of Evidence, Rev. Geophys., 58, 1–92, https://doi.org/10.1029/2019rg000678, 2020. a
Shi, X., Liu, X., and Zhang, K.: Effects of pre-existing ice crystals on cirrus clouds and comparison between different ice nucleation parameterizations with the Community Atmosphere Model (CAM5), Atmos. Chem. Phys., 15, 1503–1520, https://doi.org/10.5194/acp-15-1503-2015, 2015. a, b, c
Silvers, L. G., Reed, K. A., and Wing, A. A.: The Response of the Large-Scale Tropical Circulation to Warming, J. Adv. Model. Earth Sy., 15, e2021MS002966, https://doi.org/10.1029/2021MS002966, 2023. a
Sokol, A. B. and Hartmann, D. L.: Tropical Anvil Clouds: Radiative Driving Toward a Preferred State, J. Geophys. Res.-Atmos., 125, e2020JD033107, https://doi.org/10.1029/2020JD033107, 2020. a, b, c, d
Sokol, A. B., Wall, C. J., and Hartmann, D. L.: Greater Climate Sensitivity Implied by Anvil Cloud Thinning, Nat. Geosci., 1–6, https://doi.org/10.1038/s41561-024-01420-6, 2024. a
Sourdeval, O., C.-Labonnote, L., Baran, A. J., Mülmenstädt, J., and Brogniez, G.: A Methodology for Simultaneous Retrieval of Ice and Liquid Water Cloud Properties. Part 2: Near-global Retrievals and Evaluation against A-Train Products, Q. J. Roy. Meteor. Soc., 142, 3063–3081, https://doi.org/10.1002/qj.2889, 2016. a, b
Stephens, G. L., Vane, D. G., Tanelli, S., Im, E., Durden, S., Rokey, M., Reinke, D., Partain, P., Mace, G. G., Austin, R., L'Ecuyer, T. S., Haynes, J., Lebsock, M., Suzuki, K., Waliser, D., Wu, D., Kay, J., Gettelman, A., Wang, Z., and Marchand, R.: CloudSat Mission: Performance and Early Science after the First Year of Operation, J. Geophys. Res.-Atmos., 114, 1–18, https://doi.org/10.1029/2008JD009982, 2008. a, b
Stevens, B., Satoh, M., Auger, L., Biercamp, J., Bretherton, C. S., Chen, X., Düben, P., Judt, F., Khairoutdinov, M., Klocke, D., Kodama, C., Kornblueh, L., Lin, S. J., Neumann, P., Putman, W. M., Röber, N., Shibuya, R., Vanniere, B., Vidale, P. L., Wedi, N., and Zhou, L.: DYAMOND: The DYnamics of the Atmospheric General Circulation Modeled On Non-hydrostatic Domains, Progress in Earth and Planetary Science, 6, https://doi.org/10.1186/s40645-019-0304-z, 2019. a
Sullivan, S., Voigt, A., Miltenberger, A., Rolf, C., and Krämer, M.: A Lagrangian Perspective of Microphysical Impact on Ice Cloud Evolution and Radiative Heating, J. Adv. Model. Earth Sy., 14, e2022MS003226, https://doi.org/10.1029/2022MS003226, 2022. a, b
Thompson, G., Field, P. R., Rasmussen, R. M., and Hall, W. D.: Explicit Forecasts of Winter Precipitation Using an Improved Bulk Microphysics Scheme. Part II: Implementation of a New Snow Parameterization, Mon. Weather Rev., 136, 5095–5115, https://doi.org/10.1175/2008MWR2387.1, 2008. a
Turbeville, S. M., Nugent, J. M., Ackerman, T. P., Bretherton, C. S., and Blossey, P. N.: Tropical Cirrus in Global Storm-Resolving Models: 2. Cirrus Life Cycle and Top-of-Atmosphere Radiative Fluxes, Earth and Space Science, 9, e2021EA001978, https://doi.org/10.1029/2021EA001978, 2022. a, b
Voigt, A., Albern, N., and Papavasileiou, G.: The Atmospheric Pathway of the Cloud-Radiative Impact on the Circulation Response to Global Warming: Important and Uncertain, J. Climate, 32, 3051–3067, https://doi.org/10.1175/JCLI-D-18-0810.1, 2019. a
Voigt, A., North, S., Gasparini, B., and Ham, S.-H.: Atmospheric cloud-radiative heating in CMIP6 and observations and its response to surface warming, Atmos. Chem. Phys., 24, 9749–9775, https://doi.org/10.5194/acp-24-9749-2024, 2024. a
Wall, C. J. and Hartmann, D. L.: Balanced Cloud Radiative Effects Across a Range of Dynamical Conditions Over the Tropical West Pacific, Geophys. Res. Lett., 5, 490–498, https://doi.org/10.1029/2018GL080046, 2018. a
Wall, C. J., Norris, J. R., Gasparini, B., Smith, W. L., Thieman, M. M., and Sourdeval, O.: Observational Evidence That Radiative Heating Modifies the Life Cycle of Tropical Anvil Clouds, J. Climate, 33, 8621–8640, https://doi.org/10.1175/JCLI-D-20-0204.1, 2020. a
Wernli, H., Boettcher, M., Joos, H., Miltenberger, A. K., and Spichtinger, P.: A Trajectory-Based Classification of ERA-Interim Ice Clouds in the Region of the North Atlantic Storm Track, Geophys. Res. Lett., 43, 1–8, https://doi.org/10.1002/2016GL068922, 2016. a
Wielicki, B. A., Barkstrom, B. R., Harrison, E. F., Lee, R. B., Smith, G. L., and Cooper, J. E.: Clouds and the Earth's Radiant Energy System (CERES): An Earth Observing System Experiment, B. Am. Meteorol. Soc., 77, 853–868, https://doi.org/10.1175/1520-0477(1996)077<0853:CATERE>2.0.CO;2, 1996. a
Wing, A. A., Reed, K. A., Satoh, M., Stevens, B., Bony, S., and Ohno, T.: Radiative–convective equilibrium model intercomparison project, Geosci. Model Dev., 11, 793–813, https://doi.org/10.5194/gmd-11-793-2018, 2018. a
Wing, A. A., Silvers, L. G., and Reed, K. A.: RCEMIP-II: mock-Walker simulations as phase II of the radiative–convective equilibrium model intercomparison project, Geosci. Model Dev., 17, 6195–6225, https://doi.org/10.5194/gmd-17-6195-2024, 2024. a
Winker, D. M., Pelon, J., Coakley, J. A., Ackerman, S. A., Charlson, R. J., Colarco, P. R., Flamant, P., Fu, Q., Hoff, R. M., Kittaka, C., Kubar, T. L., Le Treut, H., McCormick, M. P., Mégie, G., Poole, L., Powell, K., Trepte, K., Vaughan, M. A., and Wielicki, B. A.: The Calipso Mission: A Global 3D View of Aerosols and Clouds, B. Am. Meteorol. Soc., 91, 1211–1229, https://doi.org/10.1175/2010BAMS3009.1, 2010. a, b
Yang, Q., Fu, Q., Austin, J., Gettelman, A., Li, F., and Vömel, H.: Observationally Derived and General Circulation Model Simulated Tropical Stratospheric Upward Mass Fluxes, J. Geophys. Res.-Atmos., 113, https://doi.org/10.1029/2008JD009945, 2008. a
- Abstract
- Introduction
- Methods
- Cirrus properties
- Origin and evolution of cirrus
- Horizontal grid spacing dependence
- Discussion
- Conclusions
- Appendix A: Additional model evaluation
- Appendix B: Additional IWP-binned perspective on model output and satellite observations
- Appendix C: Computation of the maximum in situ nucleated ice water content in Fig. 3
- Code and data availability
- Video supplement
- Author contributions
- Competing interests
- Disclaimer
- Acknowledgements
- Financial support
- Review statement
- References