the Creative Commons Attribution 4.0 License.
the Creative Commons Attribution 4.0 License.
 | 03 Sep 2025
Impact of convectively coupled tropical waves on the composition, vertical structure of the atmosphere, and tropical cyclogenesis in the region of Cabo Verde in September 2021 during the CADDIWA campaign
Tanguy Jonville
Maurus Borne
Cyrille Flamant
Juan Cuesta
Olivier Bock
Pierre Bosser
Christophe Lavaysse
Andreas Fink
Peter Knippertz
In summer, mixed Rossby gravity waves–tropical depressions (MRG-TD) are known to drive intraseasonal humidity variability in the northeastern Atlantic troposphere, modulated by equatorial Rossby (ER) and Kelvin waves. However, their impact on dust remains poorly understood, and methods in the literature struggle to distinguish the two MRG-TD tracks. During the Clouds–Atmosphere Dynamics–Dust Interaction in West Africa (CADDIWA) campaign in September 2021, in situ data (from dropsondes and radiosondes) and remote sensing data (Global Navigation Satellite System data and Infrared Atmospheric Sounding Interferometer data) were used to investigate the three-dimensional impact of tropical waves on dust and thermodynamics over Cabo Verde. The distinct contributions of Kelvin waves, ER, and MRG-TD were isolated using frequency–wavenumber filtering of total column water vapor. The latter was efficiently split into southern- and northern-track African easterly waves using distinct frequency windows (MRG-TD1 and MRG-TD2) and enabled us to demonstrate their distinct horizontal structures and impacts. ER waves mainly impacted thermodynamics above 750 hPa, MRG-TD1 affected jet-level thermodynamics, and MRG-TD2 modulated moisture in the lower troposphere. MRG-TD2 was identified as the main driver of dust events over Cabo Verde in September 2021. Tropical cyclogenesis was linked to interactions among multiple tropical waves. Notably, a delay of up to 2 d was observed between Kelvin wave interactions with MRG-TD1 and cyclone formation, consistent with previous findings. These results highlight the critical role of tropical wave interactions in cyclogenesis and underscore their potential to improve forecasting.
- Article
(11908 KB) - Full-text XML
- BibTeX
- EndNote


Tropical waves participate in determining synoptic and intraseasonal variability in the tropical atmosphere. They correspond to zonally propagating, equatorially trapped solutions of the shallow water (SW) equations, with each mode characterized by a range of wavenumbers and wave period for a given equivalent depth (Matsuno, 1966; Wheeler and Kiladis, 1999). These solutions exhibit specific horizontal structures (Matsuno, 1966; Wheeler et al., 2000), forming four categories of waves: equatorial Rossby waves (ER), equatorial Kelvin waves, mixed Rossby gravity waves (MRG), and inertia gravity waves (IG). In addition, two quasi-oscillatory phenomena that are not predicted by the SW theory contribute strongly to the variability in the equatorial regions: the Madden–Julian oscillation (MJO) and tropical depressions (TDs). In West Africa and over the North Atlantic, the African easterly jet (AEJ) system favors a specific type of TD, namely, African easterly waves (AEWs) that propagates north (AEW-N) and south (AEW-S) of the AEJ. They will be referred to as TD-AEW in the following. Waves from each wave track present significant differences in their horizontal and vertical structure (Pytharoulis and Thorncroft, 1999; Chen, 2006), as well as different periods and phase speed (Jonville et al., 2025). All together, these waves will be referred to as tropical waves in the following.
Tropical waves are responsible for a significant part of the variability in convection and precipitation above West Africa and the North Atlantic (Kamsu-Tamo et al., 2014; Lubis and Jacobi, 2015; Schlueter et al., 2019b), with TD-AEWs dominating the convection variability in the boreal summer (Lubis and Jacobi, 2015). Kiladis et al. (2006) showed how mesoscale convective systems (MCSs) south of the AEJ can trigger the genesis of an AEW-S, which, in turn, carries and catalyzes convection as the wave propagates westward (Kiladis et al., 2006; Mekonnen et al., 2006). The life cycle of the wave is modulated by precipitation above the continent, with phases of wave growth (decay) being correlated with more (less) intense precipitation (Cornforth et al., 2009; Janiga and Thorncroft, 2013). AEWs strongly impact the generation of squall lines and do so more and more as they reach the coast. Fink and Reiner (2003) found that 20 % of squall line generations are AEWs forced at 15° E as opposed to 68 % at 15° W. Although their genesis is linked to dry convection events above the Sahara (Pytharoulis and Thorncroft, 1999), the impact of AEW-N on convection during later stages of development is still debated. Kiladis et al. (2006) found that AEWs-N were often associated with a convective system to the east of the trough axis, while Agudelo et al. (2011) found no significant coupling between AEW-N and deep convection. During the boreal spring, most of the outgoing longwave radiation signal is explained by Kelvin waves (Nguyen and Duvel, 2008; Sinclaire et al., 2015; Lubis and Jacobi, 2015). The active phase of convectively coupled Kelvin waves favors the initiation of convection above the continent, whereas their inactive phase prevents MCS propagation. In winter, the signal is dominated by ER waves (Lubis and Jacobi, 2015). ER waves present a more barotropic vertical structure (Kiladis and Wheeler, 1995) and tend to favor stratiform precipitation (Schlueter et al., 2019a).
Interactions between different tropical waves are frequent and affect precipitation and convection differently. Independently of the seasonality, ER and MJO control longer-timescale precipitation variability (between 7–20 d), explaining up to a third of the variance (Schlueter et al., 2019b). They have been found to modulate the amplitude of higher-frequency waves. An active ER wave phase favors growth of TD-AEWs and increases convective activity inside such waves, especially above the Gulf of Guinea (Schlueter et al., 2019b). The active phase of the MJO reinforces the convective activity while slowing down the propagation of convective systems (Laing et al., 2011). Kelvin waves favor the initiation of AEWs (Ventrice and Thorncroft, 2013). Lawton and Majumdar (2023) show how the passage of a convectively coupled Kelvin wave increases the spatial coverage of convection inside an AEW and low-level convergence. AEWs also show a gain in moisture and relative vorticity inside the circulation up to 1.5 d after the passage of the Kelvin wave. Due to the close vicinity of TD and MRG waves in wavenumber–frequency space, various interactions have been reported. While “hybrid” waves have been observed over Africa (Cheng et al., 2019), transition from MRG into off-equatorial TD waves has also been documented over the Pacific Ocean (Takayabu and Nitta, 1993; Zhou and Wang, 2007). Tropical waves also interact with extratropical waves. Interaction have been documented between extratropical Rossby waves and ER (Schlueter et al., 2019a) and Kelvin waves (Lubis and Jacobi, 2015) but will remain outside the scope of this study.
Those interactions are especially important in shaping extreme events (Lafore et al., 2017; Peyrillé et al., 2023). Lafore et al. (2017) examined a severe precipitation occurrence in Ouagadougou on 1 September 2009 and showed how the combined effects of a Kelvin wave, an AEW, and an ER wave contributed to its development. The merger of AEW-S and AEW-N has been shown to favor tropical cyclogenesis (Hankes et al., 2015; Duvel, 1990; Jonville et al., 2025). The interaction between AEWs and Kelvin waves can also catalyze cyclogenesis up to 2 d after the moisture peak associated with an AEW encounters a Kelvin wave (Ventrice et al., 2012a; Ventrice and Thorncroft, 2013; Lawton and Majumdar, 2023). The active phase of the MJO also creates favorable conditions for the development of a TD into a tropical cyclone (Frank and Roundy, 2006).
Dust is another important feature of the West African climate. It modifies the cloud structure (Saleeby et al., 2015) and has a very significant impact on tropical cyclogenesis (Fan et al., 2016): the increase in cloud condensation nuclei or ice-nucleating particles may favor liberation of latent heat and increase convective activity (Fan et al., 2016), but the radiative effect in the midtroposphere stabilizes the atmosphere and reduces the sea surface temperature (Evan et al., 2006). The impact is also dependent on the location of the dust-laden layer relative to the center of the convective activity: it has been found to have a catalyzing effect when being in the northwest quadrant further than 360 km from the center of convection but has an inhibiting effect when coming closer than 360 km in the southwest quadrant (Shu and Wu, 2009). Dust has also been documented to interact with TD-AEWs. TD-AEWs favor dust emission and transport (Jones et al., 2004; Knippertz and Todd, 2010; Grogan and Thorncroft, 2019; Cuesta et al., 2020; Nathan and Grogan, 2022), and dust outbreaks in turn modulate the growth phase of TD-AEWs (Jones et al., 2004; Grogan et al., 2016, 2019). To our knowledge, the impact of the other tropical waves on dust outbursts has not been studied.
In this context, the Clouds–Atmosphere Dynamics–Dust Interaction in West Africa (CADDIWA) campaign took place in September 2021 (Flamant et al., 2025) with the aim of operating a suite of relevant observational and modeling devices to better understand the interaction between dust, convection, tropical waves, and tropical cyclogenesis. Ground-based and airborne in situ and remote sensing instruments were deployed in close synergy with satellite overpasses from Aeolus (Stoffelen et al., 2020; Witschas et al., 2022; Borne et al., 2024) and the Infrared Atmospheric Sounding Interferometer (IASI) (Clerbaux et al., 2009; Hilton et al., 2012).
In this study, convectively coupled tropical waves are identified based on the total column water vapor (TCWV) fields from the European Centre for Medium-Range Forecasts (ECMWF) reanalysis (ERA5) using a space–time spectral analysis following the method described by Wheeler and Kiladis (1999) and Kiladis et al. (2009) and the protocol described in Janiga et al. (2018) that consists of taking 2 years of data, followed by 2 years of zero before computing the Fourier transform. The latter is used to isolate ER, Kelvin waves, and TD-AEWs. The impact of tropical waves on the 3D thermodynamic structure of the atmosphere and 3D distribution of dust is investigated using composites of radiosondes and dropsondes launched during the CADDIWA campaign, ERA5 and CAMS reanalysis, and IASI data. Their impact on the tropical cyclogenesis observed during the campaign is particularly highlighted.
2.1 Data
This study relies on observational data collected during the CADDIWA campaign (Flamant et al., 2025). A total of 44 dropsondes were used in nine flights between 9 and the 19 September 2021, and 39 radiosondes were launched from the airport in Sal between 7 and 28 September 2021 (not more than four per day). In situ pressure, humidity, and temperature measurements from both radiosondes and dropsondes were used to determine the vertical structure of the atmosphere during the campaign. Two Global Navigation Satellite System stations (Bock et al., 2021, GNSS) also provided the vertically integrated water content (TCWV, total column water vapor), one permanent in Espargos and the other temporary, installed in Sal for the duration of the campaign.
Information on all datasets used in this study is compiled in Table 1. Satellite data are used for integrated variables (water vapor content, aerosol optical depth) and for vertical profiles of extinction. The Infrared Atmospheric Sounding Interferometer (IASI) is an instrument on board the MetOp polar-orbiting satellites operated by EUMETSAT. IASI provides detailed information on atmospheric temperature, humidity, and chemistry. The instrument captures the spectrum of the radiation emitted by the Earth and the atmosphere for a wide spectral range from 645 to 2760 cm−1 with a spectral resolution of 0.5 cm−1, allowing for precise retrieval of atmospheric profiles and trace gas concentrations. For aerosol optical depth (AOD) and vertical profiles of the dust extinction coefficient at 10 µm, AEROIASI (AEROsols IASI) data are used (Cuesta et al., 2015, 2020). It has been found to give results similar to the Cloud–Aerosol Lidar with Orthogonal Polarization (Cuesta et al., 2015, CALIOP, on board CALIPSO). AEROIASI is a novel IASI-based product that allows the derivation of the dust mean layer height and the 3D dust distribution over land and ocean including the Atlantic. It depicts the vertical structure of the main dust layer in the atmospheric column and is used in addition to the 10 µm dust AOD. TCWV values from ground measurements and from reanalysis are compared. Brightness temperatures are retrieved from the merged-IR dataset (https://doi.org/10.5067/P4HZB9N27EKU, Janowiak et al., 2017), merging data from Japanese, European, and American geostationary missions (METEOSAT-5/7/8/9/10, GMS-5/MTSat-1R/2/Himawari-8, and GOES-8/9/10/11/12/13/14/15/16), interpolated on a grid with a spatiotemporal resolution of 4 km–30 min.
These observations are used in synergy with reanalysis from the European Centre for Medium-Range Weather Forecasts (ECMWF). For physical and dynamical parameters, ERA5 data are used. ERA5 data are generated using ECMWF's Integrated Forecasting System (IFS), which assimilates a wide range of observational data, including satellite radiances, weather station reports, radiosonde measurements, and marine observations. They have a spatial resolution of 0.25°, are gridded into 37 pressure levels (Hersbach et al., 2020), and for this study were acquired twice a day (at 00:00 and 12:00 UTC). As for dust distributions, we relied on Copernicus Atmospheric Monitoring Service (CAMS), generated using ECMWF's Integrated Forecasting System (IFS), coupled with the chemistry module. Two points were taken per day, with a resolution of 0.75° and 25 pressure levels (Inness et al., 2019). It is important to note that, while CAMS assimilates data from a variety of sources, it does not assimilate any data on the vertical distribution of dust. The dataset begins in January 2003, and therefore the climatology presented in this study is computed from 2003 to 2021.
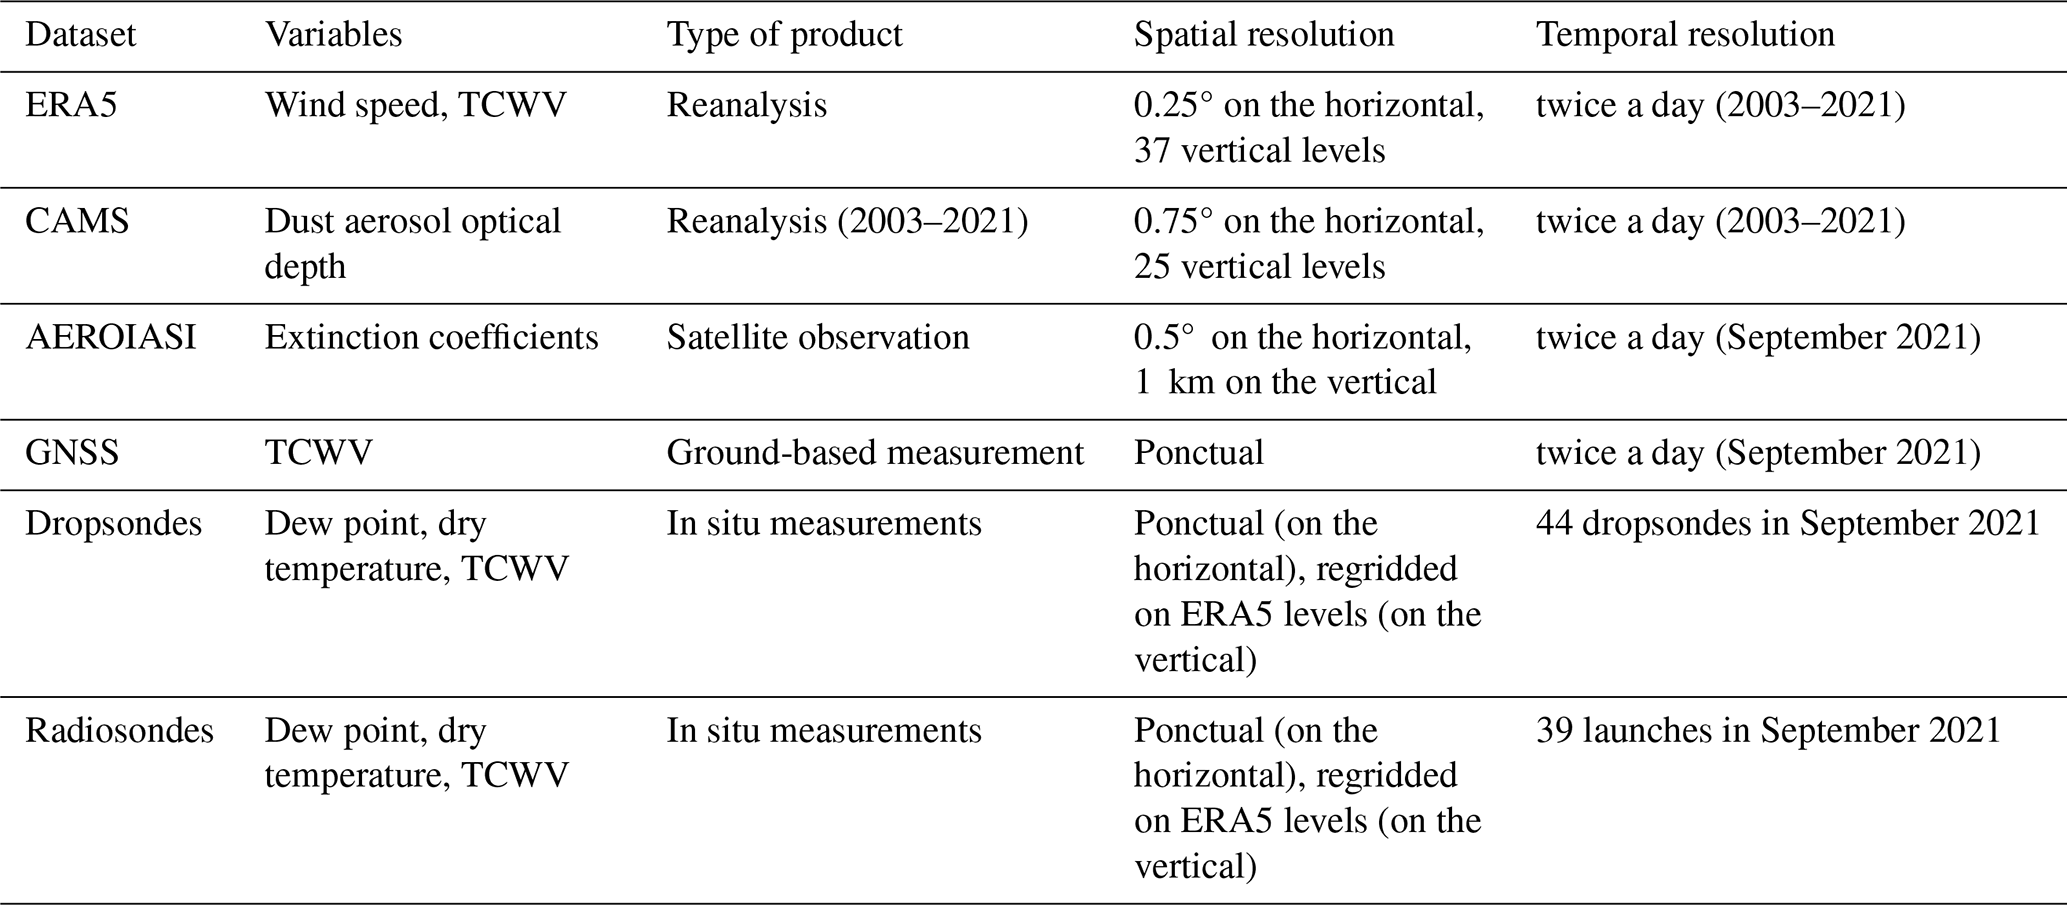
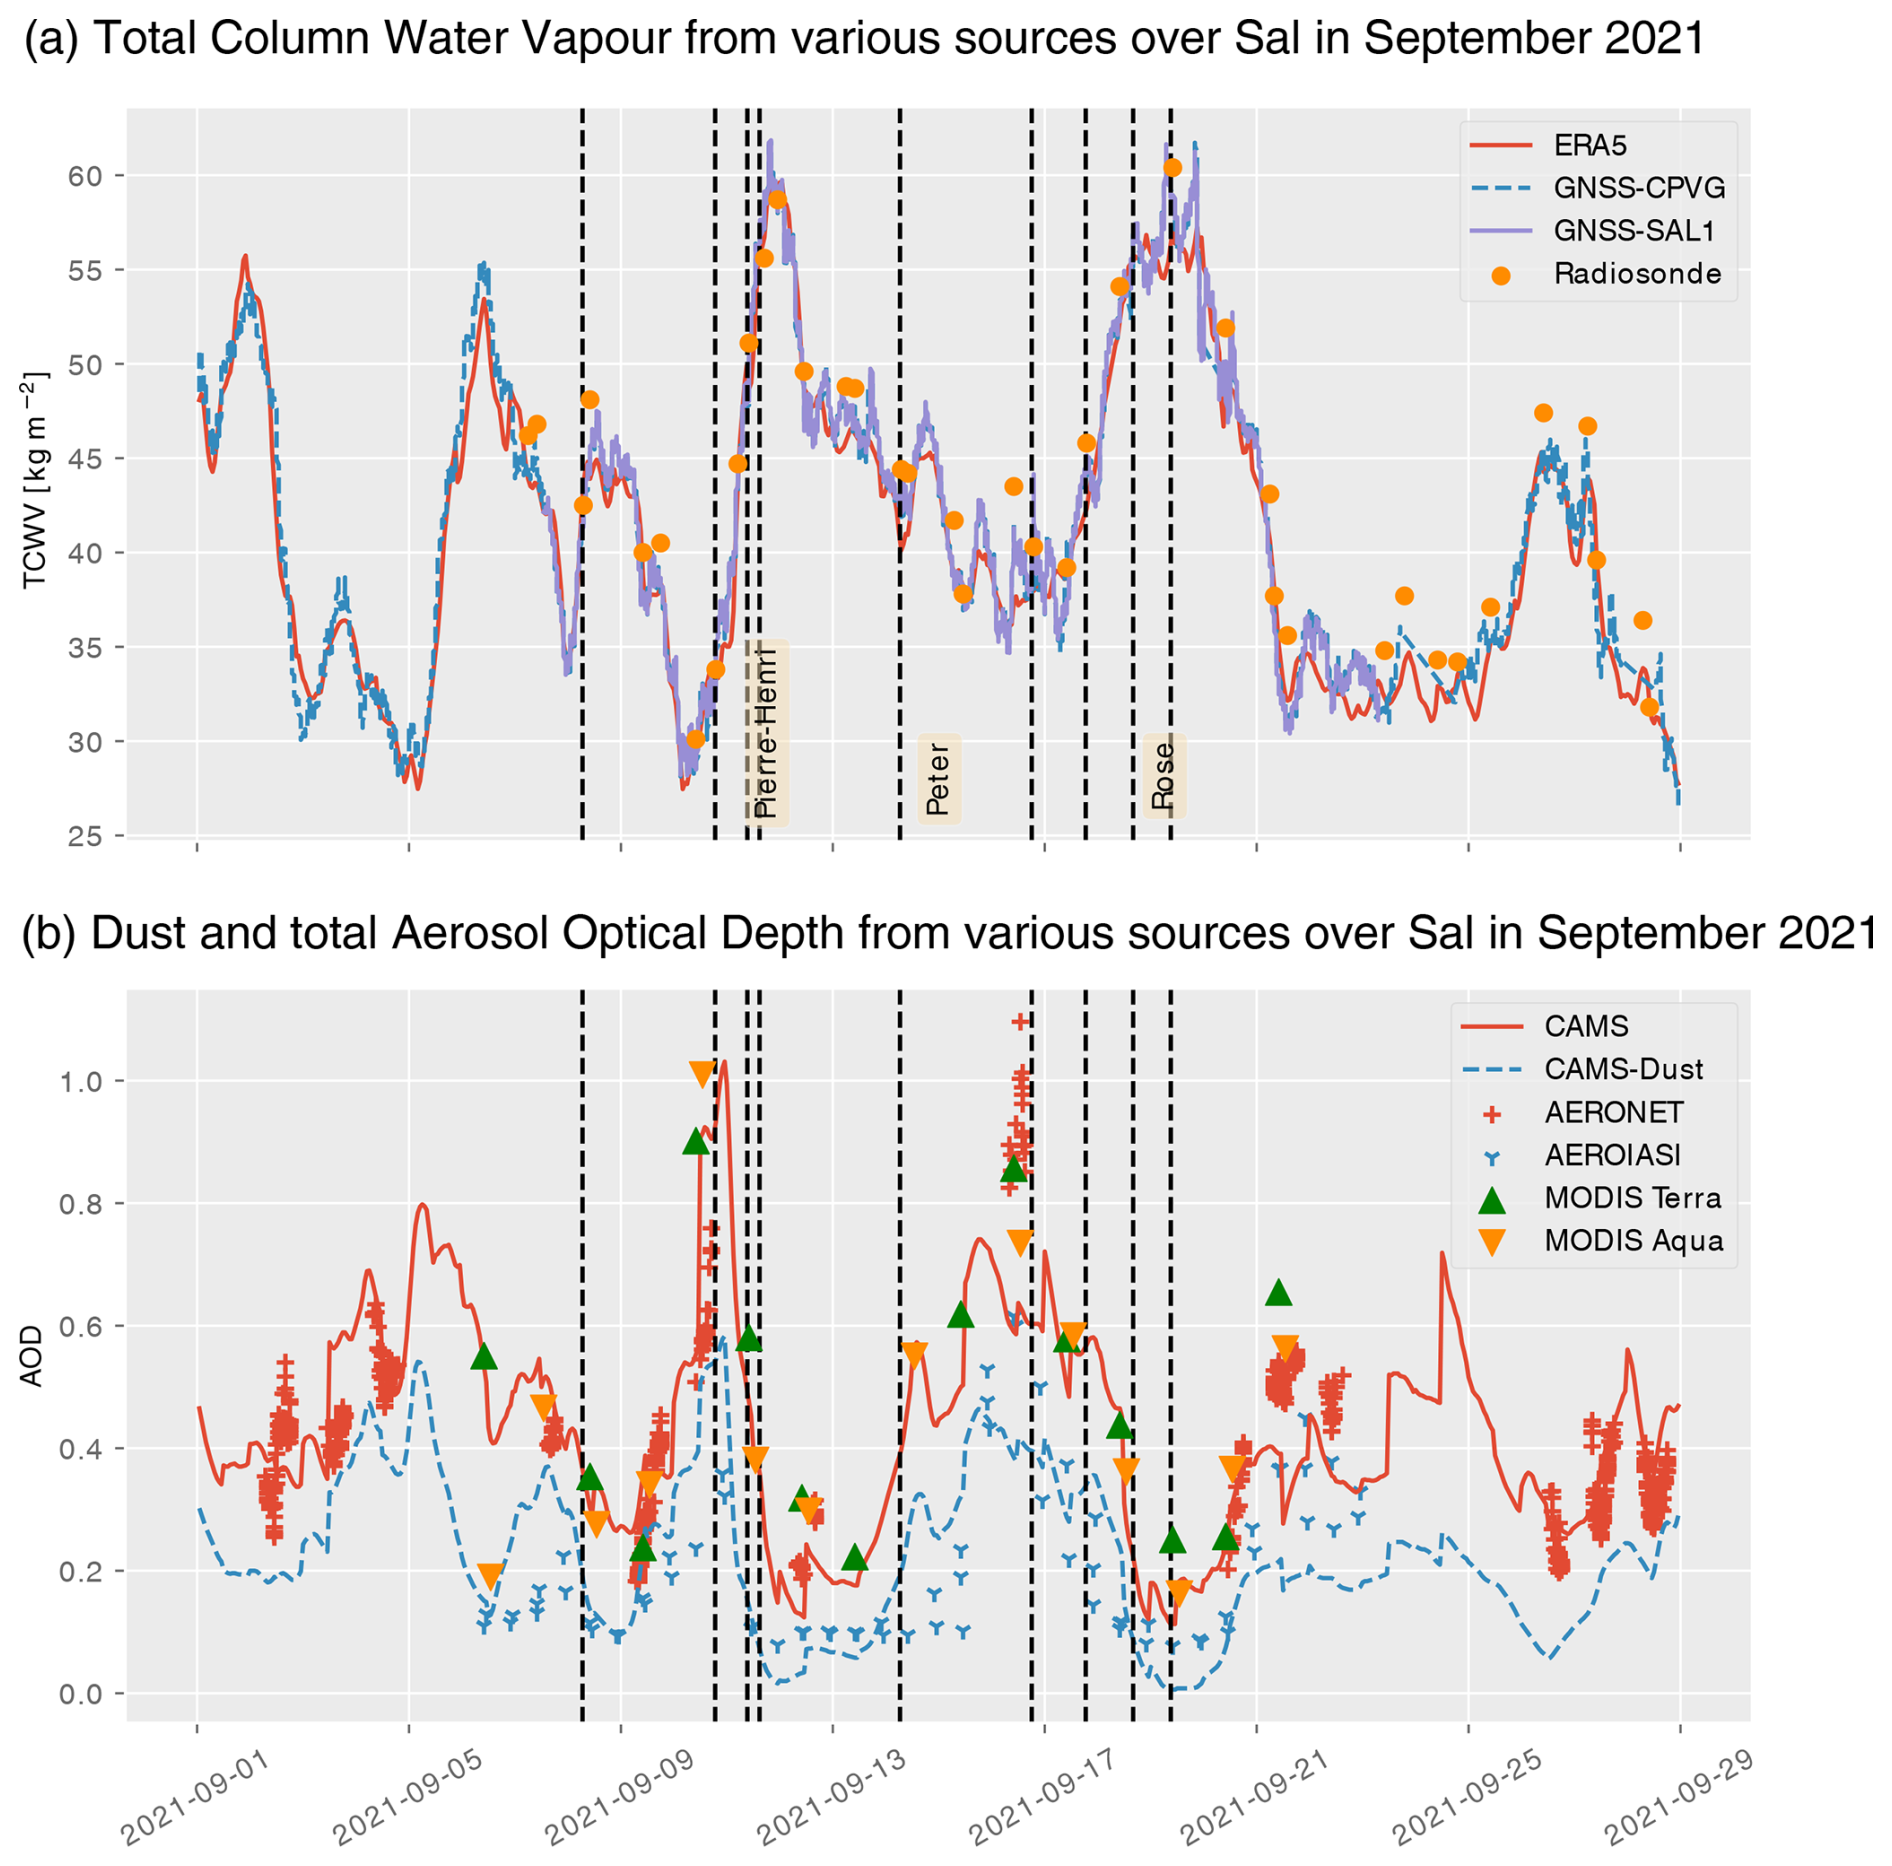
Figure 1(a) TCWV time series for September 2021 at Sal as observed from two GNSS stations: CPVG (blue dashed line), the permanent station operated by INMG and IGN, and SAL1 (purple solid line), the collocated temporary station installed for the CADDIWA campaign, as well as ECMWF ERA5 (red solid line) and radiosondes launched from Sal (orange dots). Black dashed vertical lines indicate the mid-flight times of the Safire FA20 operations on 8 (flight F5), 10 (F6), 11 (F7 and F8), 14 (F9), 16 (F10), 17 (F11), 18 (F12), and 19 (F13) September 2021. The time at which the environment of TS Peter and Rose was probed in Sal is also indicated (note that Peter traveled much further south from Sal than Rose). “Pierre-Henri” refers to a tropical perturbation that passed over the Cabo Verde islands but was not named or numbered by NOAA, as it did not develop into a disturbance or a storm. (b) Same as (a), but for AOD over Sal derived from AERONET (500 nm, red crosses), MODIS Terra and Aqua (550 nm, green and orange triangles, respectively), and CAMS 550 nm, (solid red line). Also shown is dust AOD from AEROIASI (10 µm, blue crosses) and CAMS (dashed blue line).
All sources of data are compared in Fig. 1 and put in context with other measurements. They show overall good agreement. Panel (a) shows the TCWV time series at Sal as observed from two GNSS stations (CPVG, the permanent station of the International GNSS Service – IGS, and SAL1, the collocated temporary station installed for the CADDIWA campaign), ERA5, and radiosondes for September 2021. All three datasets are in very good agreement, especially in representing the day-to-day TCWV variability, which is quite large. A small dry bias (−0.54 kg m−2) is found in ERA5 compared to GNSS, with a standard deviation of 1.55 kg m−2 and a linear regression slope parameter close to 1. The GPS and ERA5 data are available with a 1 h time sampling, so these statistics are rather robust. The small dry bias is also consistent with the findings of Bock et al. (2021) and Bosser et al. (2021) for the Caribbean region in boreal autumn. The radiosonde vs. GNSS and ERA5 comparisons highlight a humid bias (1.7 to 2.0 kg m−2) in the radiosonde data. The numbers of collocated data are small in these comparisons, but the bias is significant. The inspection of observation statistics from the ECMWF operational model seems to confirm a small humid bias in the radiosonde observations in Sal. The mean of observations minus analysis amounts to 0.96 kg m−2 (mean of observations minus first guess: 1.47 kg m−2) (not shown).
Figure 1b shows the AOD time series over Sal, derived from a sun photometer as part of NASA's Aerosol Network (AERONET), MODIS Terra and Aqua, and the ECMWF Copernicus Atmospheric Monitoring Service (CAMS) reanalysis (Flemming et al., 2017). It also shows dust-only AOD (DAOD) time series from CAMS and AEROIASI. In spite of discrepancies between CAMS, AERONET, and MODIS AODs (which are partly explained by the difference in observing wavelength), these products show overall good agreement with respect to the timing of the major dust outbreak events observed over Sal. For instance, a significantly high correlation is found, with a correlation coefficient between AERONET AODs and AEROIASI (MODIS) products of 0.95 (0.82), while the correlation between CAMS DUAOD and AERONET (AEROIASI) is 0.65 (0.59).
2.2 Filtering
Using a shallow water model, Matsuno (1966) proposed dispersion relationships for each type of wave (see Fig. 2a). The equivalent depth, defined as the depth of the shallow water layer of the model, is determined empirically and usually ranges from 8 to 90 m for convectively coupled waves (Wheeler and Kiladis, 1999). In addition to these tropical waves, two quasi-periodic processes that are not predicted by the shallow water theory are usually discussed. Tropical depressions usually encompass all types of dynamical features with a period ranging from 2 to 5 d and westward planetary wavenumber ranging from 6 to 20 (Lubis and Jacobi, 2015). They are of special importance in West Africa as they include AEWs, which are a key feature of the region.
A wide range of identification techniques exist to highlight tropical wave activity (spatial projections, wavelet filters, parabolic cylinder functions filter or Fourier transform filter), among which the Fourier frequency–wavenumber filter is the most commonly used (Knippertz et al., 2022). Though the method can be sensitive to wave pattern generated by red noise, it allows the attribution of each component of the signal to a theoretical wave. It can also identify coherent structures even in a random signal. Hence, the use of different input variables (conducted here in Sect. 3) is important to rule out filtering artifacts. ERA5 TCWV fields are decomposed to identify the different wave signals using the methodology described in Wheeler and Kiladis (1999). The TCWV signal is projected in the frequency–wavenumber space using a Fourier transform. Figure 2b and c show the frequency–wavenumber spectrum for 2018–2022 normalized by a red noise spectrum. Based on either the dispersion relation from Matsuno (1966) or the spectral characteristics of TDs and MJO, each portion of the signal can be attributed to a specific process (see Fig. 2).
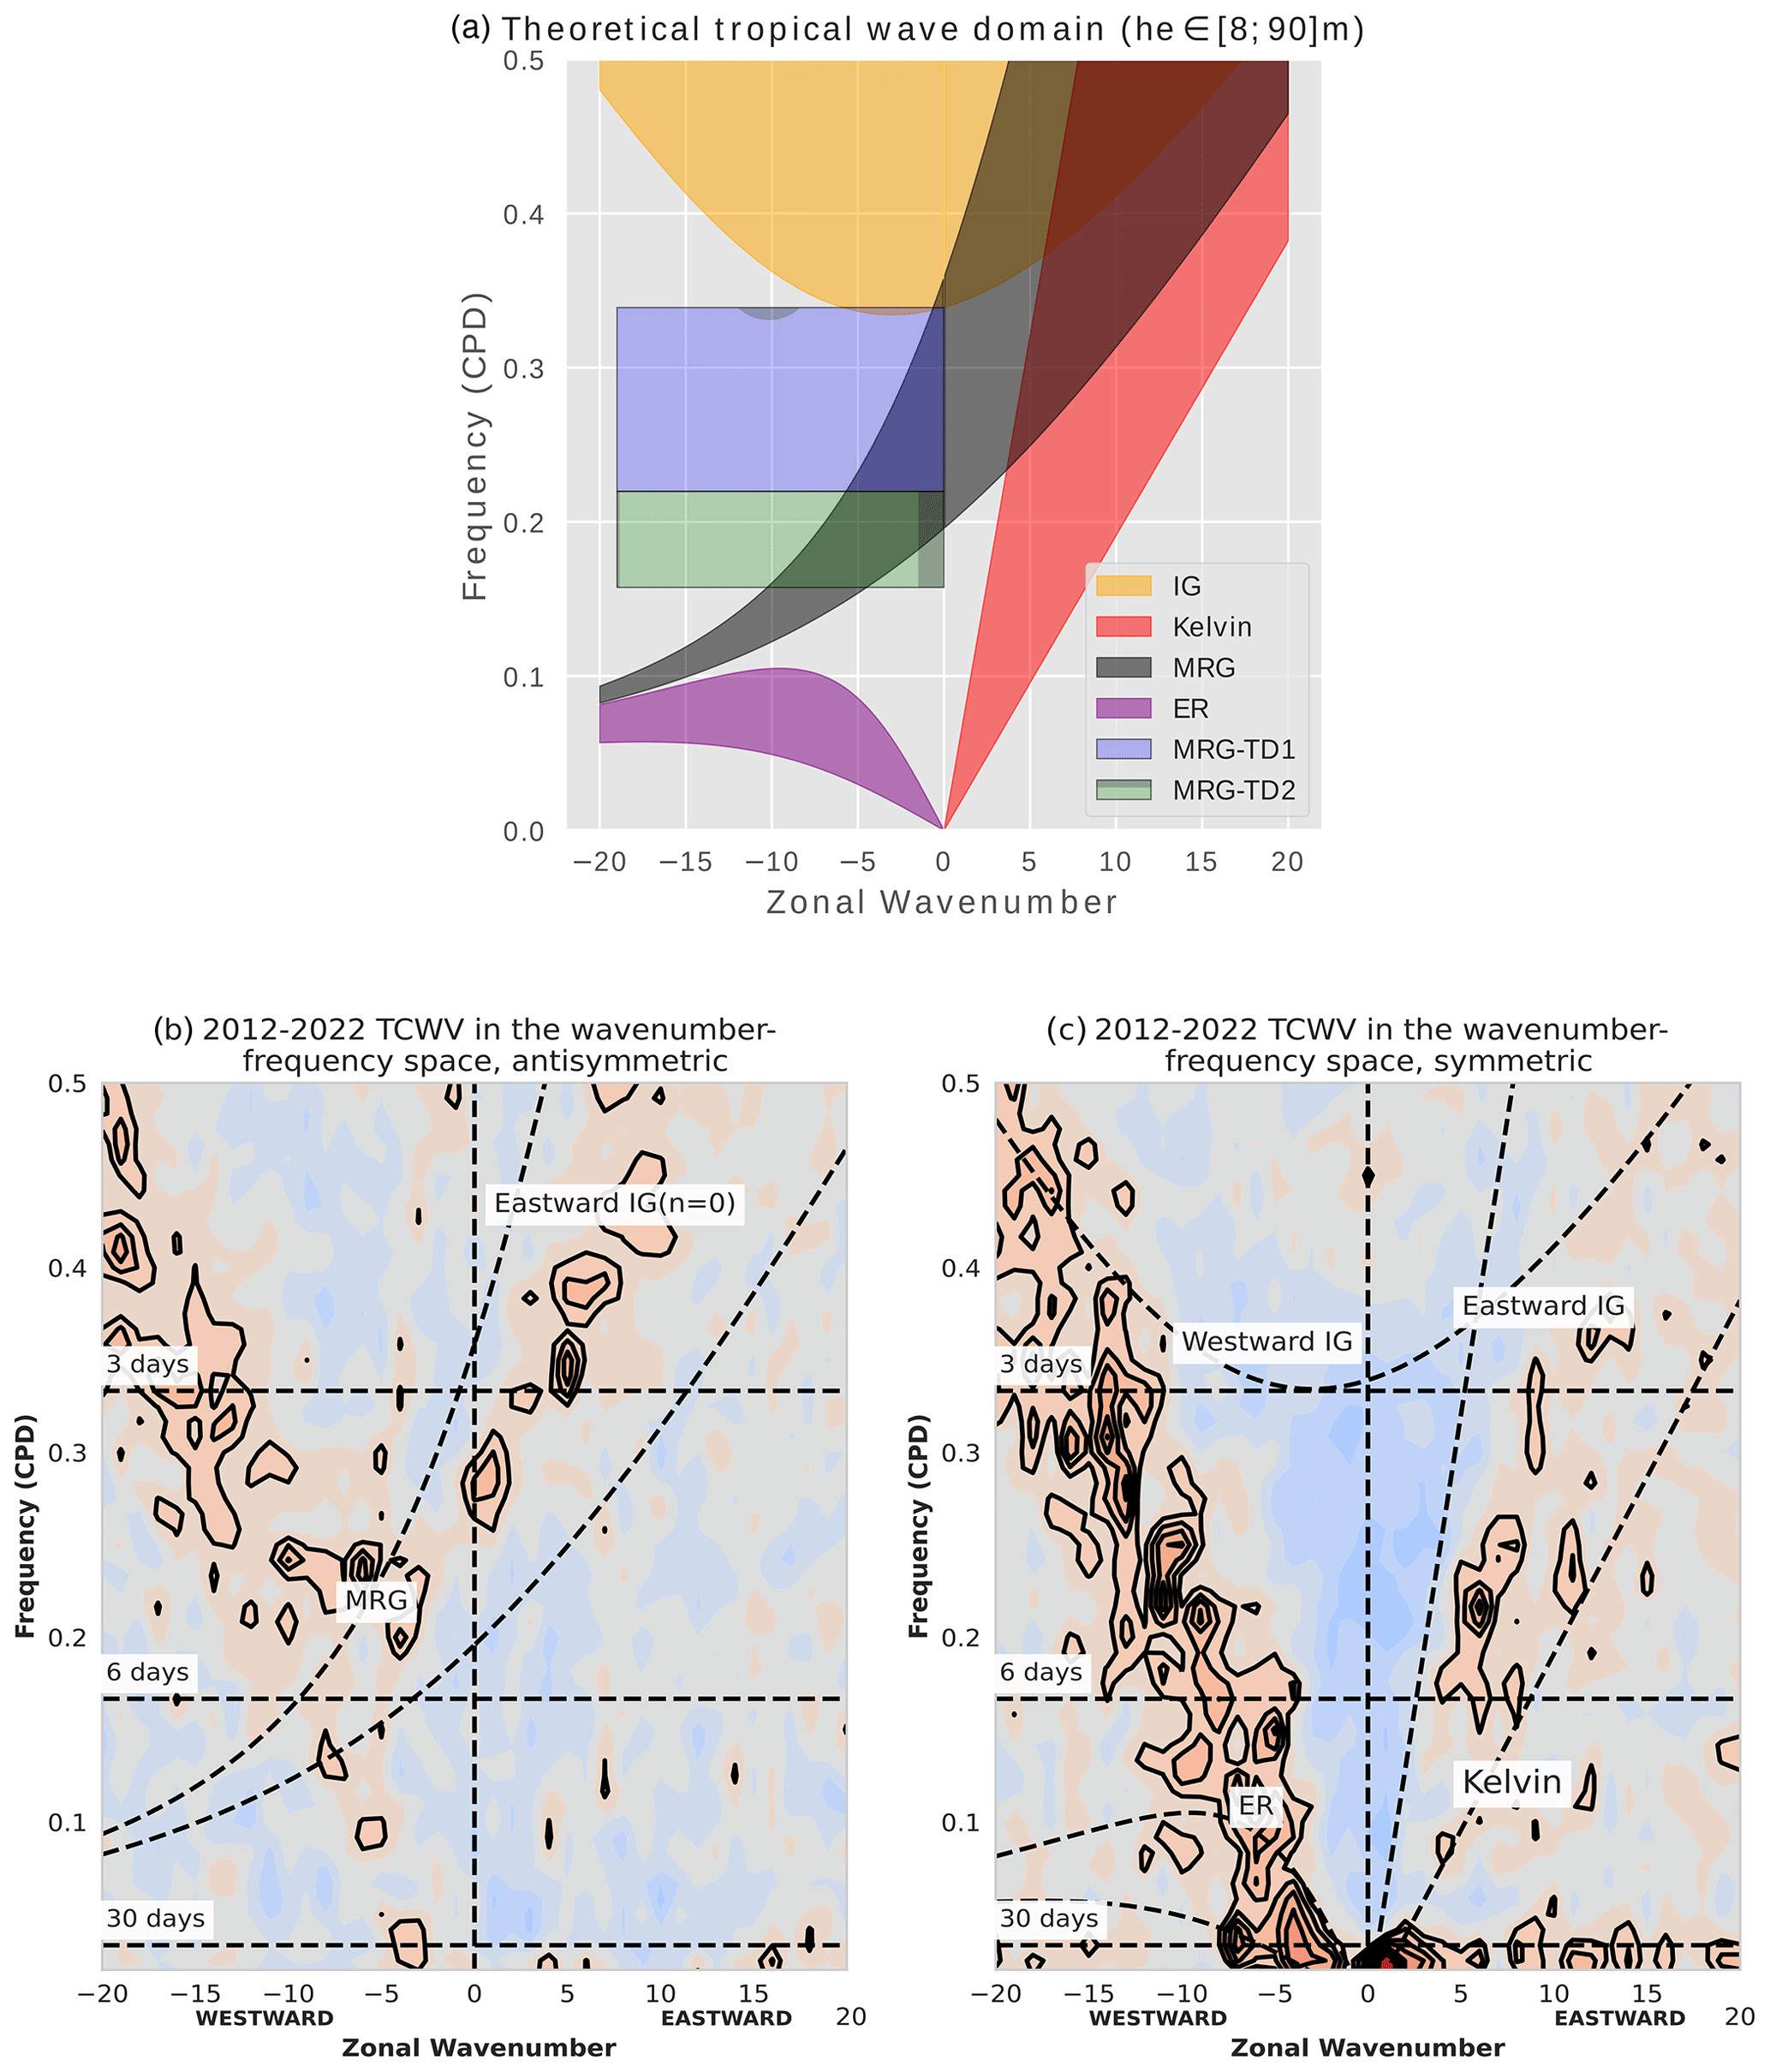
Figure 2(a) Theoretical domain of the different types of tropical waves according to the real shallow water theory with equivalent depths ranging from 8 to 90 m. (b) The 2018–2022 frequency–wavenumber spectrum (latitude ±30°) for antisymmetric waves normalized by red noise. CPD: cycles per day. Black contours are superimposed over the shading for ratios greater than 1.1 to improve readability. (c) Same as panel (b) but for symmetric waves. Symmetry is understood with the Equator as the axis of symmetry. This decomposition allows for a better identification of tropical waves based on their horizontal structure, as presented in Wheeler and Kiladis (1999).
As presented in the “Data and method” section, there were no more than two flights a day and four radiosoundings, resulting in sampling frequencies too low to study the highest-frequency waves (Tulich and Kiladis, 2012, found, for instance, that the mean period of convectively coupled IG was about 8 h). They are therefore not included in this study. For a similar reason, since the period of the MJO ranges between 30 and 90 d (Roundy and Frank, 2004) and the campaign lasted only 3 weeks, the impact of the MJO on the modulation of the dynamics, thermodynamics, and composition variables was ruled out. It is, however, to be noted that during these 3 weeks, the MJO was in an active phase over West Africa and the eastern Atlantic (a result from the TCWV decomposition in the MJO domain, not shown).
Following Jonville et al. (2025), TDs were separated into two modes, TD1-AEW with periods between 2.95 and 4.55 d and TD2-AEW with periods between 4.55 and 6.35 d. Those latter modes are defined in the wavenumber–frequency space, whereas the distinction between TD-AEW-S and TD-AEW-N is only geographical. If the present study confirms the result of Jonville et al. (2025), strong correlations are expected between TD1-AEW and TD-AEW-S activity and TD2-AEW and TD-AEW-N, respectively. Figure 2 shows that the wavenumber–frequency domains of MRG and TDs do overlap significantly. As has been done in previous studies (Frank and Roundy, 2006; Janicot et al., 2010; Janiga et al., 2018), the choice is made here not to separate MRG from TD waves. This choice was also supported by the strong similarity in the composite structure of MRG and TD2 waves (see the Appendices for more details).
To reconstruct the contribution of the different types of waves, 2-year series of TCWV (1 October 2019 to 1 October 2021) are padded with a 2-year-long series of zero based on the padded filtering methodology of Janiga et al. (2018). The four lowest harmonics of the signal are then suppressed to remove any interannual to annual trend or variability. For each wave type (ER, MRG-TD1, MRG-TD2, Kelvin), the corresponding wavenumber–frequency mask is applied before an inverse Fourier transform is performed. The masks are the same as those used by Janiga et al. (2018). They are based on the theoretical curves of Matsuno (1966), with additional conditions on the frequency and wavenumber to better cut off noise. Especially for Kelvin waves, following Wheeler and Kiladis (1999) and Schreck et al. (2012), all signals with frequencies higher than 0.4 CPD (cycles per day) are ruled out to minimize noise. The ER domain is narrowed to zonal westward wavenumbers between −10 and −1. This is consistent with Fig. 2b and c that show no significant activity above 0.3 CPD in the Kelvin domain and for wavenumbers lower than −10 in the ER domain. The MRG-TD1 and MRG-TD2 are distinguished according to the discussion above, with a cutoff period at 4.55 d.
2.3 Composite and significance levels
To study the impact of each wave type on the vertical thermodynamic structure of the atmosphere and the vertical dust distribution, the composites of the quantities of interest are computed based on the phase of each wave (humid or dry). For the horizontal structure, ERA5 wind and TCWV are composited on the peaks and troughs of the 0–20° N averaged wave signal for ER, MRG-TD1, and MRG-TD2 and 10° S–10° N for Kelvin waves (so as to encompass the theoretical peak latitude of activity for each wave as per Matsuno, 1966) at 22° W (longitude of Sal Island, Cabo Verde).
In order to study the vertical structure, since measurements were not necessarily acquired at wave peaks or troughs, each wave signal is decomposed into two phases: a humid phase when the wave-filtered TCWV anomaly is positive and a dry phase when the wave-filtered TCWV anomaly is negative. A humid (dry) composite is calculated for all measurements made during a humid (dry) phase. A Welch's t test is used to assess the significance of the results (Welch, 1947). This protocol is applied for radiosondes, dropsondes, and IASI-derived vertical profiles.
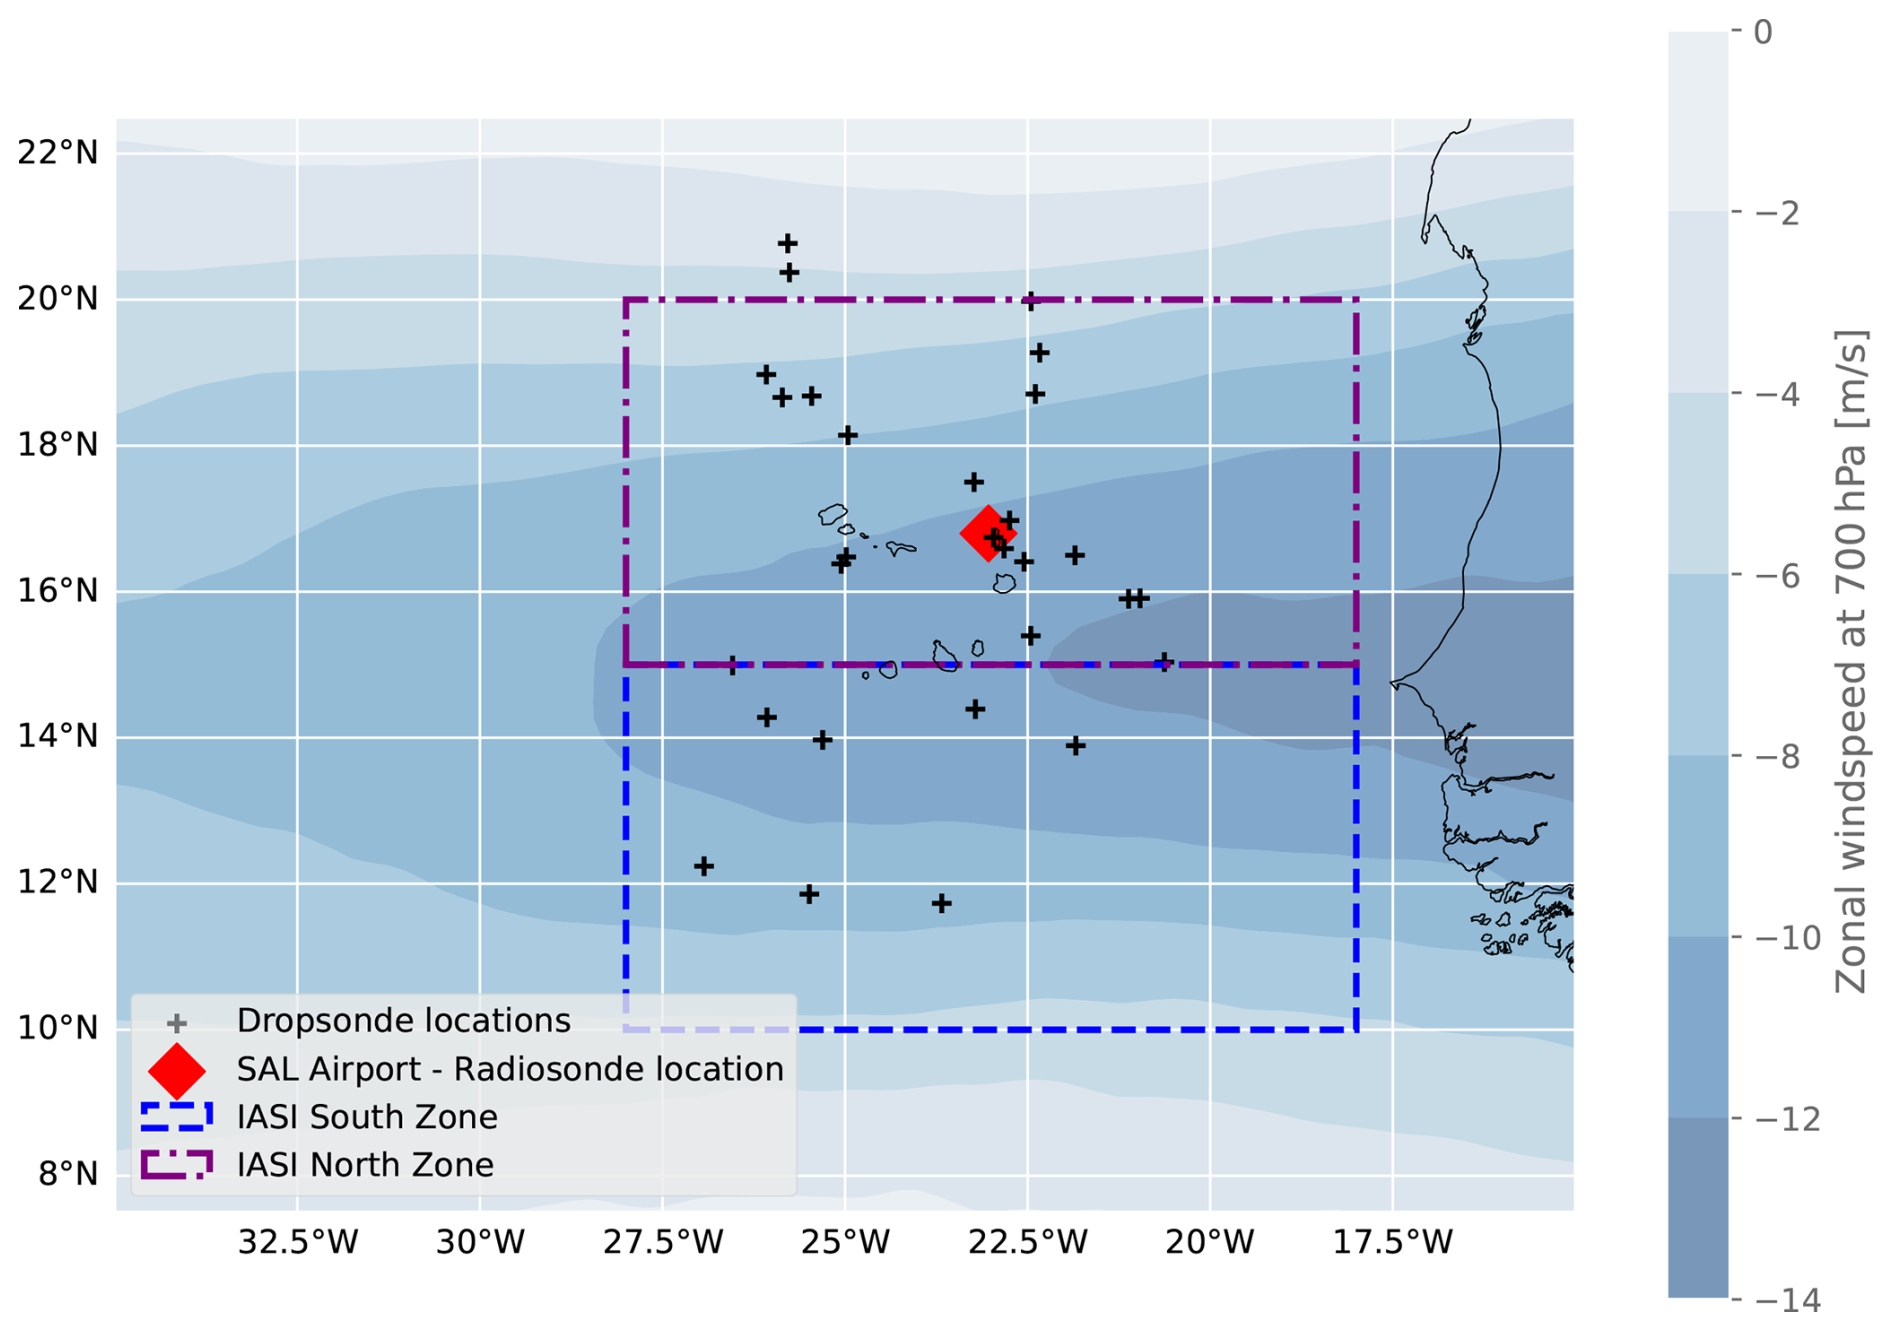
Figure 3Location of radiosondes (Sal Island International Airport, red diamond), dropsondes (black crosses), IASI-CAMS composite zones (purple mixed line and blue dashed line), and mean zonal wind speed at 700 hPa in September 2021. Two composite zones are defined to study the impact of tropical waves north and south of the AEJ.
The in situ measurements offer good coverage of the Cabo Verde region. The dropsondes were launched regularly during campaign flights. Their positions are shown in Fig. 3. All the radiosondes were launched from Sal Island International Airport. As for AEROIASI observations, the product is only available for cloud-free IASI pixels. Therefore, to prevent any gaps in the data, the information from multiple pixels needs to be composited. Two zones are defined in Fig. 3 (IASI South Zone and IASI North Zone) to study the impact of tropical waves north and south of the AEJ and especially distinguish AEW-N and AEW-S structures. For a given date, wave type, and phase, the only pixels that are retained are those that are cloud-free and have the signal of the given wave within the given phase (humid or dry). If these points cover less than 70 % of the South or North IASI Zones, the date is not used for the composite. A drawing is presented in Appendix A for better readability.
The horizontal structure of each wave is studied for July–August–September (JAS) 2021 using 700 hPa wind and TCWV composites on dates of peaks and troughs at 22° W for each 0–20° N averaged wave-filtered TCWV. This choice of latitude window is made because it is consistent with the composites obtained using the peaks at the latitude of activity of each wave (not shown). Results are presented in Figs. 4 and 5.
Figure 4a and b show the composite structure of the ER wave when humid phases and dry phases are located in the vicinity of Sal, respectively. It is consistent with the structure predicted by the theory with an intertropical convergence zone located in the Northern Hemisphere (Matsuno, 1966). The twin cyclonic and anticyclonic cells are well defined at about 15° N and 10° S (at 30° W and 5° E in panel a and at 30° W and 10° E in panel b). In the Northern Hemisphere, the cyclonic circulation is associated with a positive TCWV anomaly. The humid phases (dry phases) are located in the rear of the circulation, where the southerly (northerly) winds predominate. At the Equator, the weak positive TCWV anomalies are collocated with easterlies, whereas areas of westerlies are lacking TCWV. In the Southern Hemisphere, the impact of the ER wave on the TCWV is less defined, maybe due to the fact the intertropical convergence zone is located to the north during the boreal summer and because of our composite method, which focuses on the Northern Hemisphere TCWV wave signal. However, a pattern can still be noted around 10° S. The ER wave is also found to strongly modulate the latitude of dust outbursts, with dusty air masses confined above 20° N when a dry ER phase is above the ocean and dust-laden air located between 10 and 20° N when a dry phase is above Cabo Verde. This might be explained by the strong westerlies associated with the humid phase of ER (see Fig. 4a) south of the AEJ that prevent the exit of air masses from the continent.
Figure 4b and c show the horizontal structure of the Kelvin wave signal. The circulation pattern is consistent with the theory of Matsuno (1966), with a marked region of zonal divergence associated with the dry phase bringing subtropical air masses into the tropics (at 35° W in panel c and regions of zonal convergence associated with the humid phases at 5° E in panel c and 25° W in panel d) driving tropical air poleward. On the other hand, only a few regions show a significant impact of the Kelvin wave on the TCWV and AOD during September 2021, and they are associated with smaller anomalies than for other waves. TCWV anomalies associated with Kelvin waves peak around 5° N, consistent with Tulich et al. (2011). Kelvin waves are not a primary driver of TCWV or AOD variability in the region in September 2021 and rather modulate the synoptic dynamics.
Figure 5a and b show the composite structure of the MRG-TD1 wave when the humid phases and dry phases are located in the vicinity of Sal, respectively. It is strongly consistent with the literature on AEW-S (Thorncroft, 1995; Kiladis et al., 2006; Janiga and Thorncroft, 2013; Brammer and Thorncroft, 2015). They peak at 12° N, with a northward tilt in their trajectory as they exit the West African coast. Positive anomalies of the TCWV are strongly correlated with cyclonic circulation and negative anomalies with anticyclonic circulation. Again, the center of the TCWV anomaly lies slightly behind the dynamic center of the circulation, located either in the dominant southerly flux for the humid phase or in the northerly flux for the dry phase. The impact of MRG-TD1 on dust is small compared to that of ER waves or MRG-TD2.
Figure 5c and d show the composite structure of the MRG-TD2 waves. It is consistent with the dynamic highlighted by Jonville et al. (2025) for AEW-N. The center of the dynamics is located around 21° N. For MRG-TD2 waves, positive anomalies of TCWV are located within the southerlies and negative anomalies within the northerlies. Chen (2006) documented that the genesis of AEW-N could be linked to consecutive intrusion of the monsoon flow (transporting moist air) and of the Harmattan (transporting dry air) across the latitude of the AEJ. This is consistent with the observed pattern of humid southerlies following dry northerlies. The dry anomaly persists as the wave crosses the Atlantic basin, although it has been documented that AEWs-N become moist as they propagate over the ocean (Chen et al., 2008). MRG-TD2 northerlies are associated with strong dust outbursts embedded within the dry phase of the wave. As the wave crosses the basin (not shown) it is advected by the dynamics and can even reach humid phase areas as in panel (d). This is consistent with Chaboureau et al. (2016), who found that dust emissions are predominantly associated with a Harmattan wind regime.
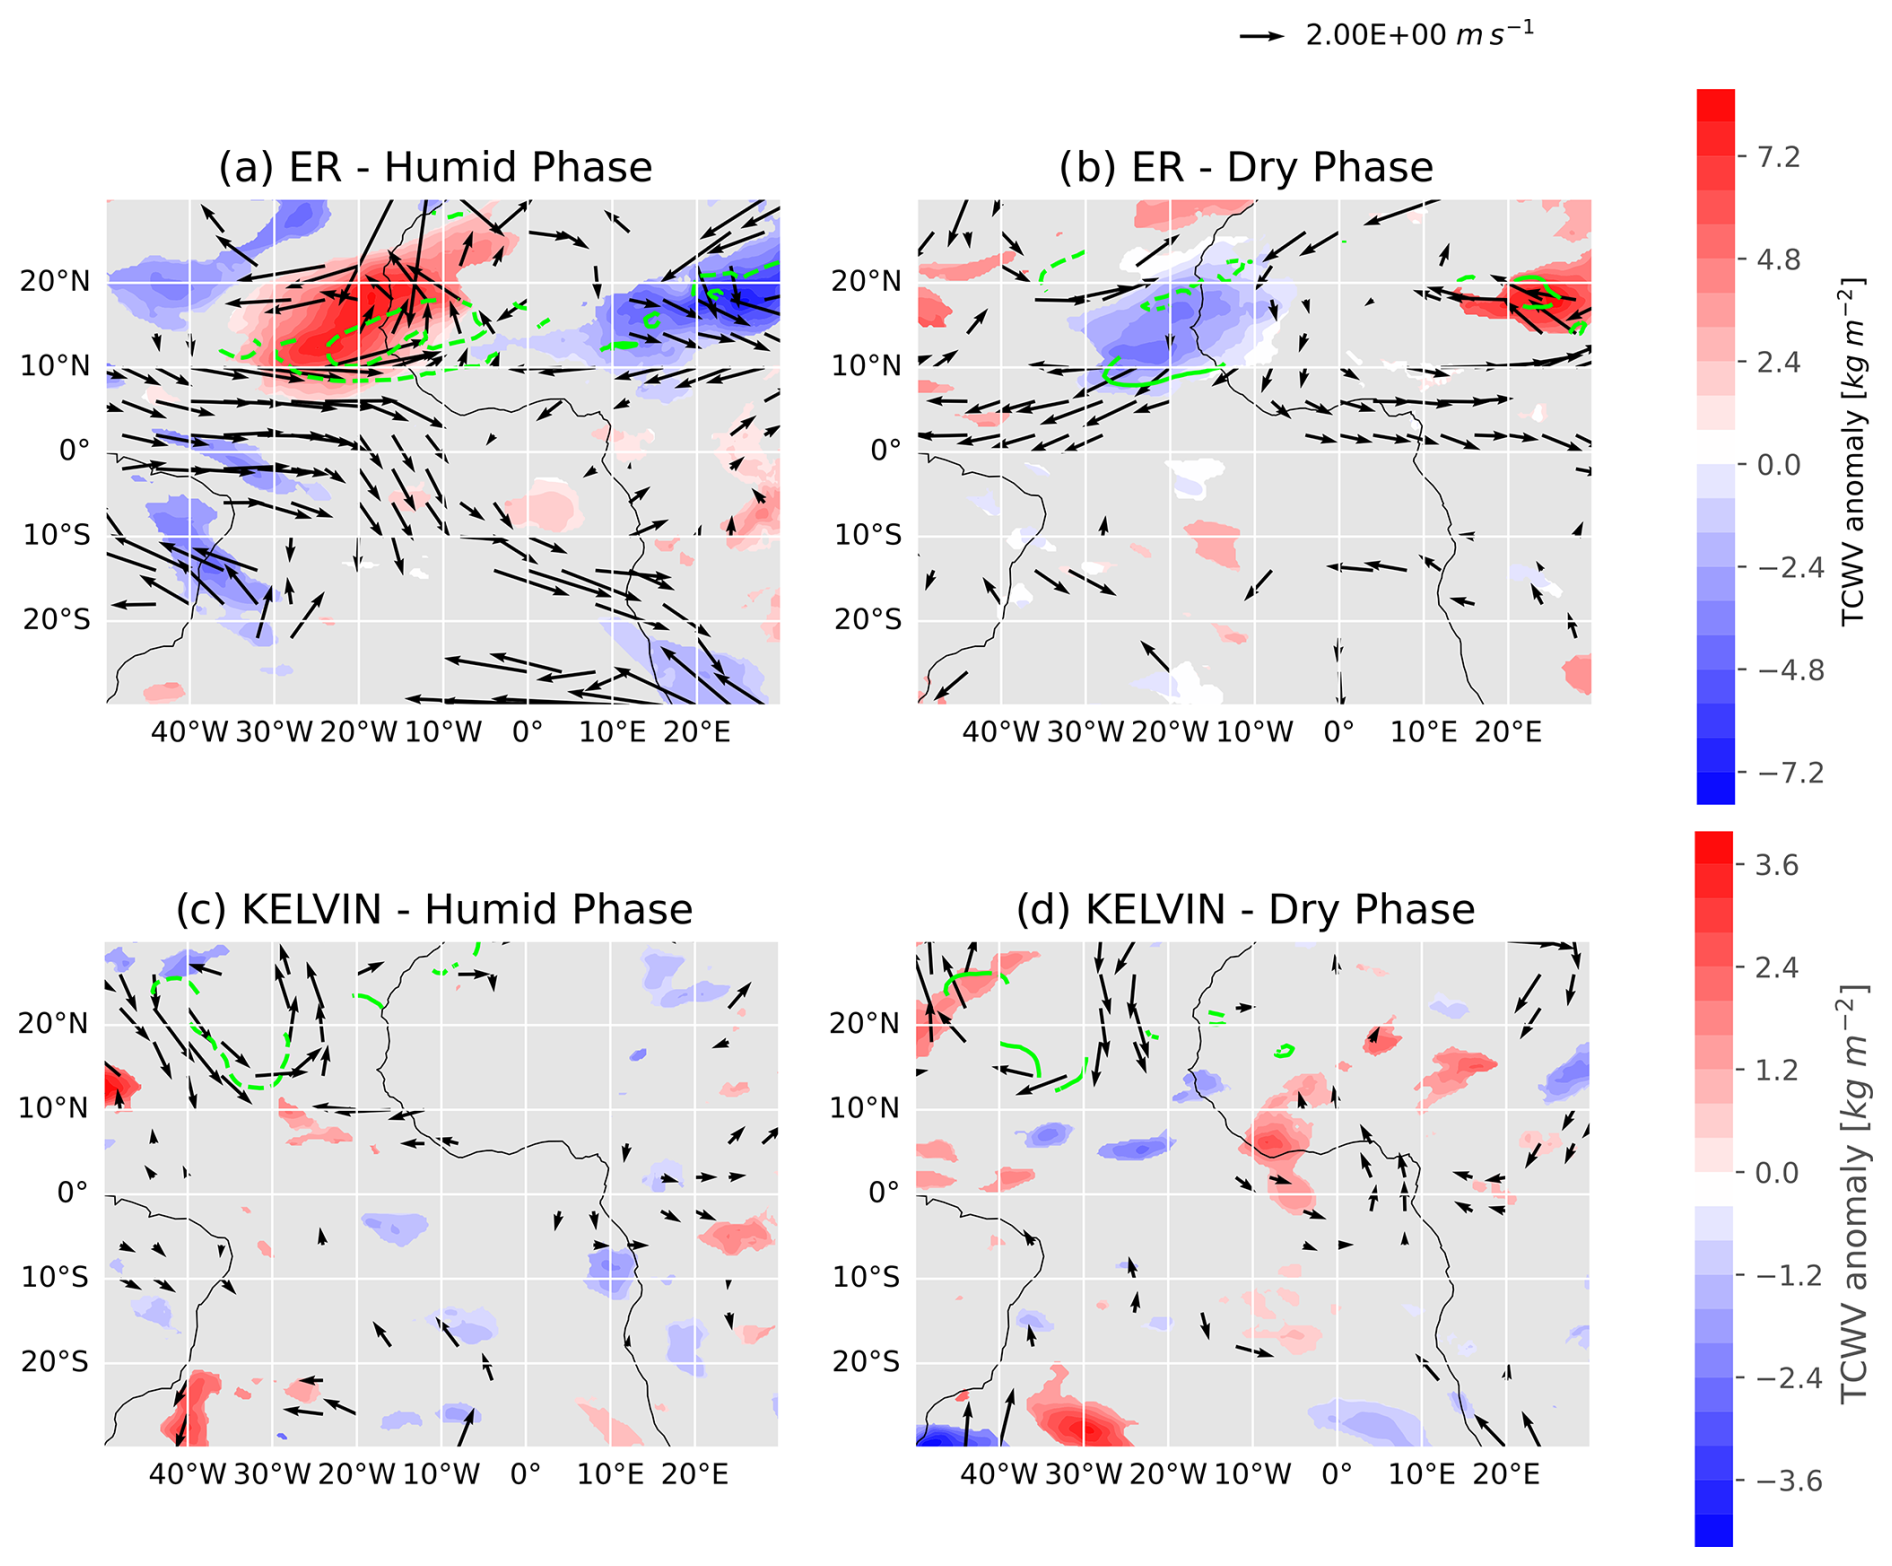
Figure 4Composite of wave-filtered TCWV (shading), with the 700 hPa wind (vector) for ER-related humid phases passing at 22° W during July–September 2021. CAMS wave-filtered dust AOD anomalies are shown in contours (0.04, 0.06, 0.08, 0.12, and 0.16 levels). Only values that are significant at the 10 % level are shown. (a) Composite for ER humid phase at 22° W (four events). (b) Same as panel (a) but for ER dry phases (five events). Panels (c) and (d) are the same as (a) and (b), but for Kelvin waves (24 events for each).
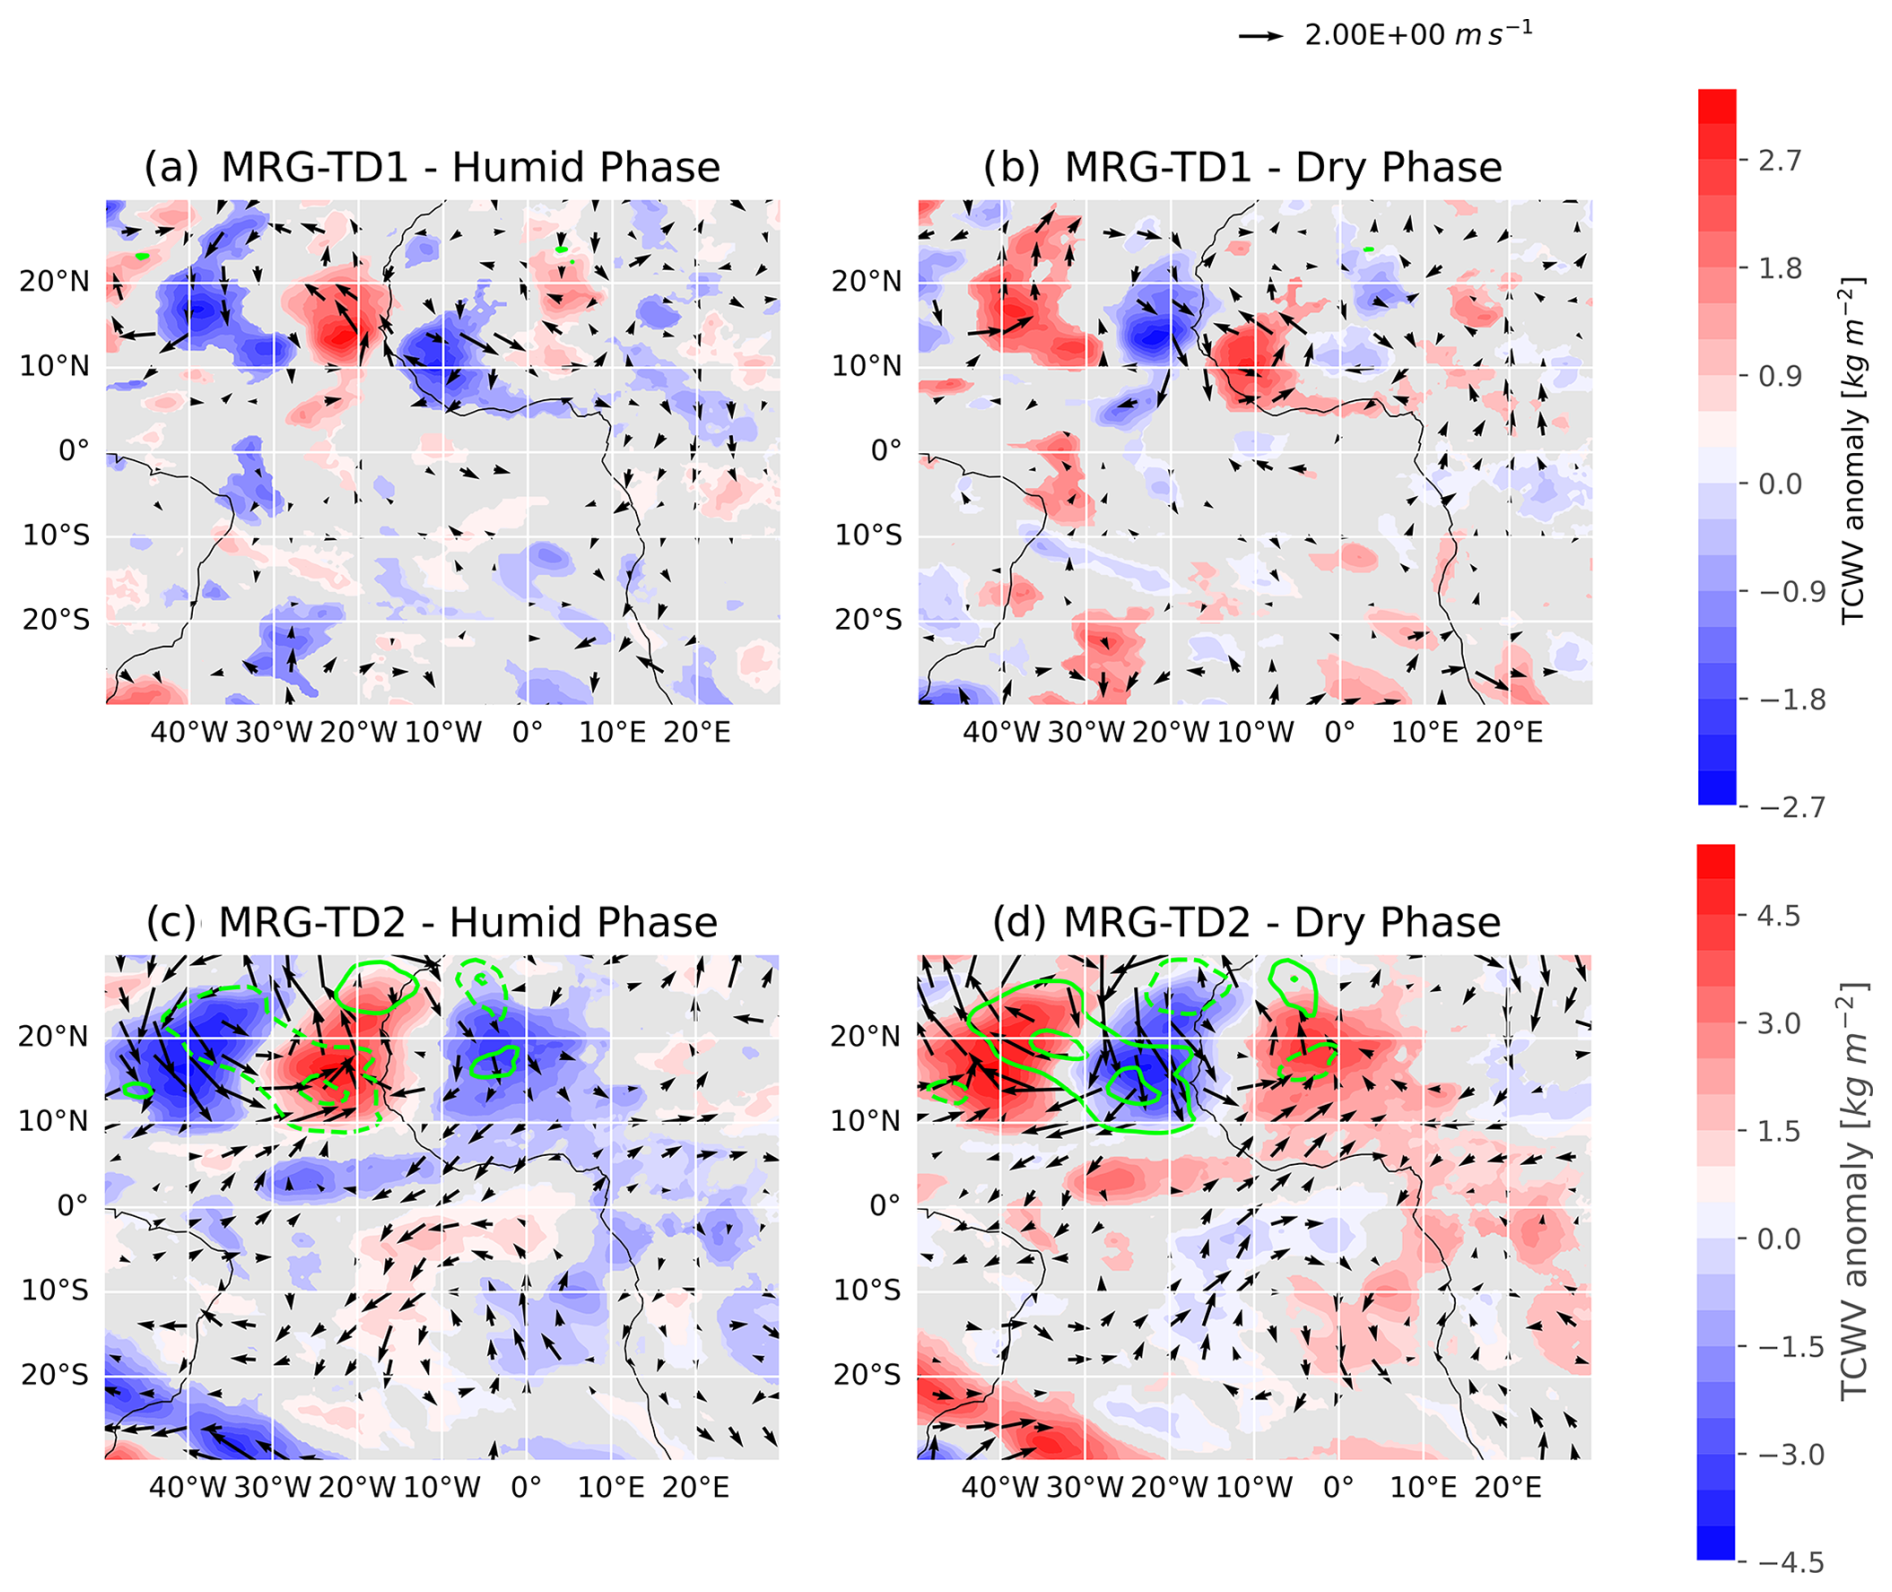
Figure 5Same as Fig. 4 but for MRG-TD1 (a and b, 26 events each) and MRG-TD2 (c and d, 16 events each).
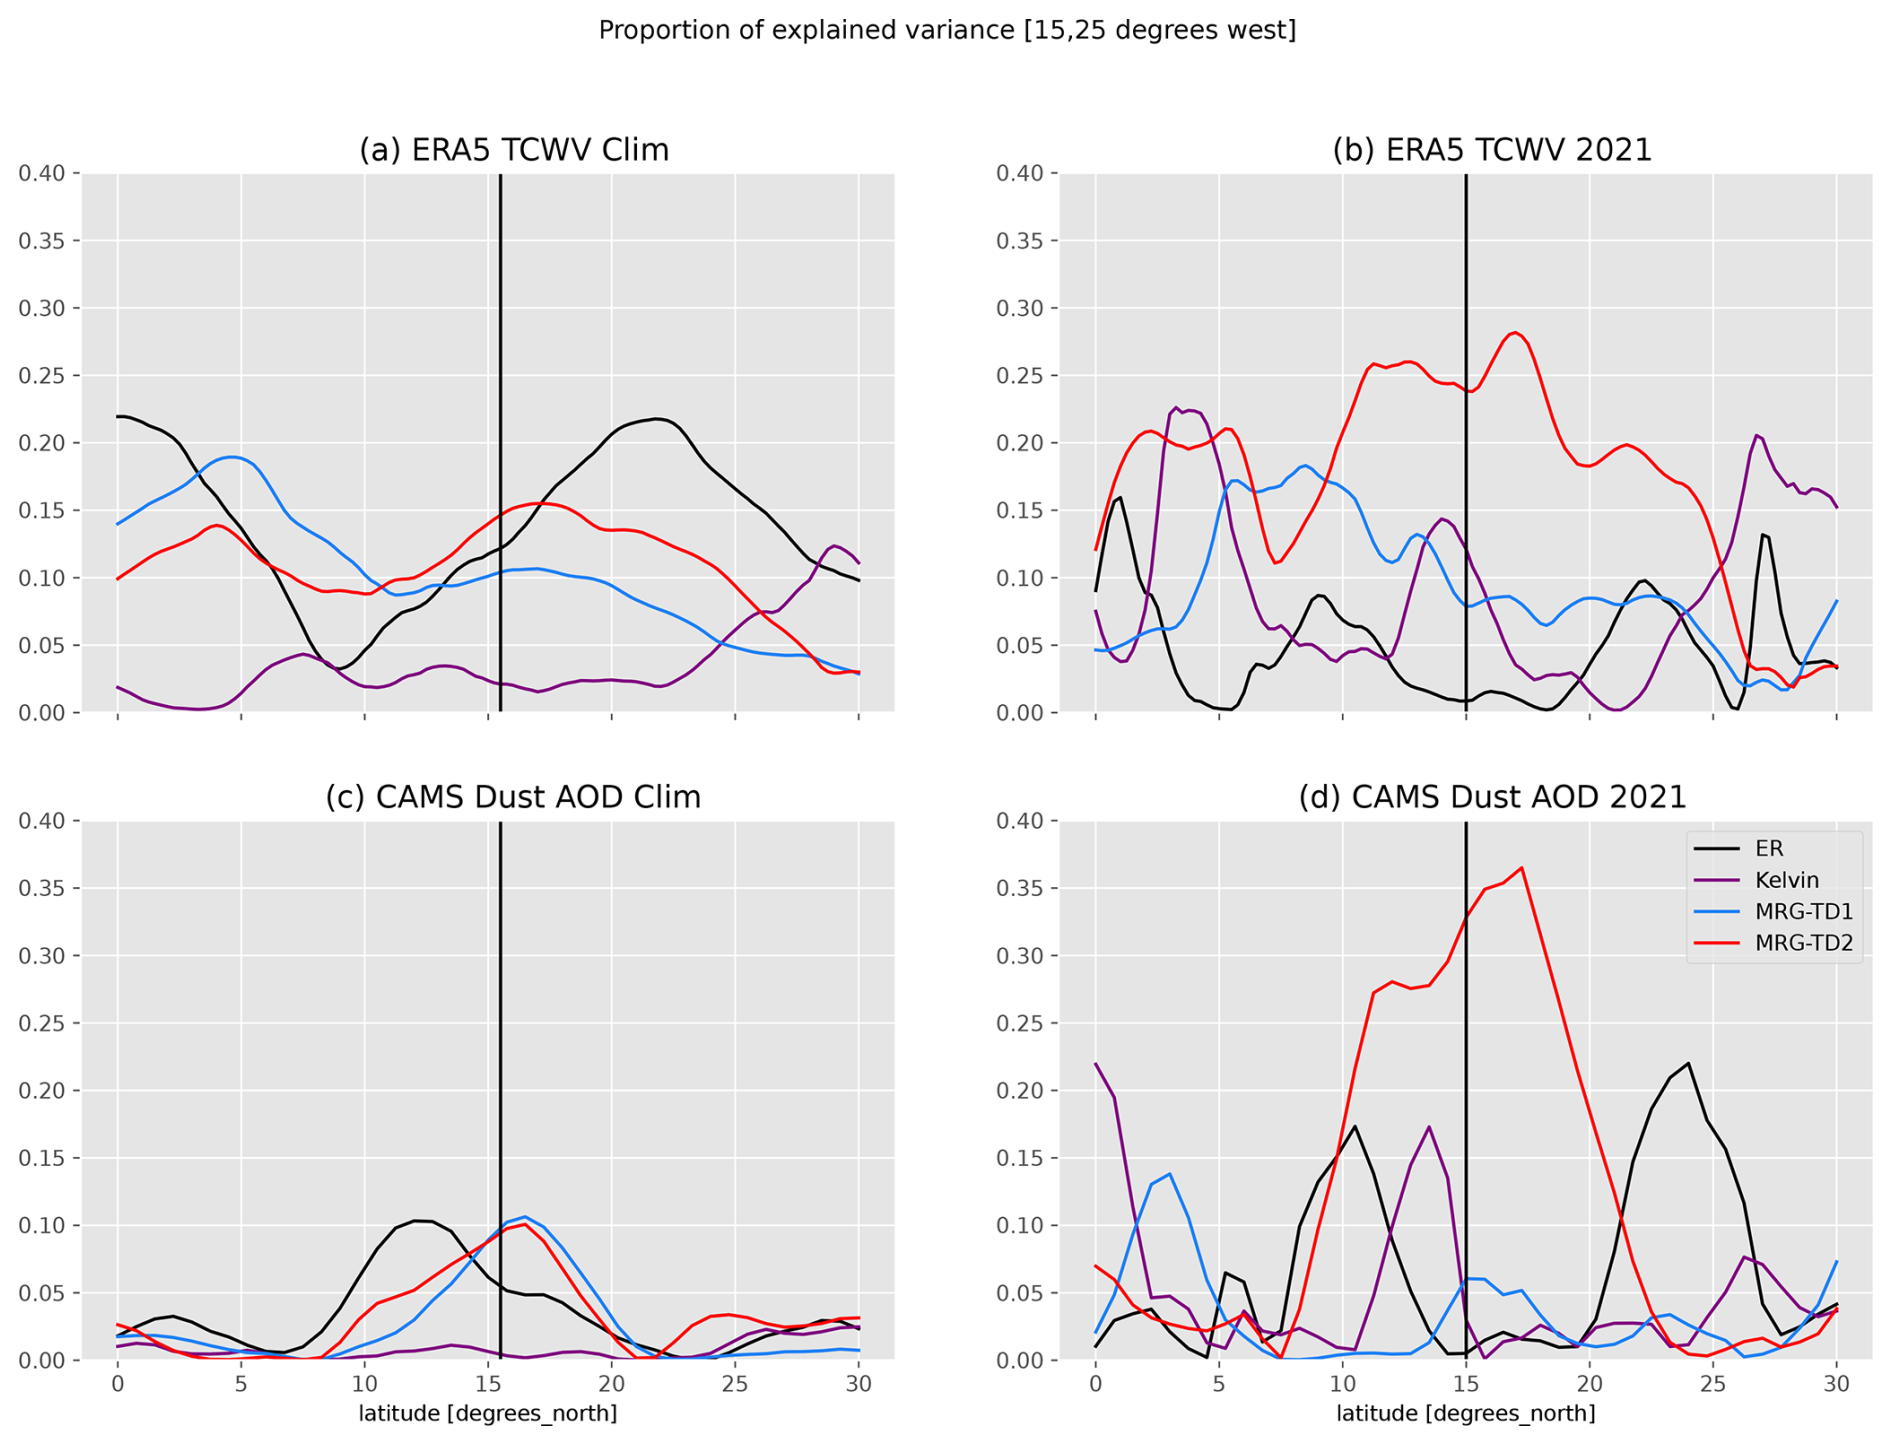
As shown in the previous sections, tropical waves modulate both water vapor content and the 3D dust distribution in the Atlantic. Figures 6 and 7 show the proportion of ERA5 TCWV and CAMS dust AOD variance explained by each wave signal (squared correlation). Each figure shows the explained variance averaged between 5 and 15° W (over the continent) and between 15 and 25° W (over the ocean), respectively, as a function of latitude for a September 2003–2021 climatology and for September 2021.
The climatology from September 2003 to 2021 shows that the TCWV is predominantly modulated by ER waves over West Africa and the tropical east Atlantic near the Equator and around 22° N. In the region of the AEJ, MRG-TD1 and MRG-TD2 are the dominant drivers south and north of the AEJ, respectively, consistent with the dynamics of the AEWs-S and AEWs-N. Note that the peaks of explained variance for MRG-TD1 and MRG-TD2 are wider and overlap more above the Cabo Verde region (Fig. 7a, b) than above the continent (Fig. 6a, b). Climatologically, the wave tracks north and south of the AEJ are well separated above the continent, up to the longitude where the AEJ weakens (Jonville et al., 2025). Then, mergers of AEWs-N and AEWs-S are frequent, mainly in the eastern Atlantic (Jonville et al., 2024; Hankes et al., 2015; Duvel, 1990), and may explain this result. On average, Kelvin waves are the weakest contributors to the TCWV variance, explaining less than 5 % of the variance across the whole region.
The dust AOD signal is mainly explained by ER waves south of the AEJ and by MRG-TD1 and MRG-TD2 north of the AEJ (Figs. 6c and 7c). This result is the same above the continent and above the eastern Atlantic. The fact that MRG-TD1 waves are as significant a driver of AOD variance as MRG-TD2 waves is unexpected and might be due to a correlation between AEW-N and AEW-S activity. Pytharoulis and Thorncroft (1999) documented, for instance, that AEW-N genesis can be triggered by AEWs-S, creating conditions for their combined activity.
The results for September 2021 are qualitatively consistent with the climatology (Figs. 6b, d and 7b, d). The signal is noisier when only September 2021 is considered, and all explained variances are significantly higher than in the climatology. Between 5 and 15° W (Fig. 6), south of 5° N, all wave types play a significant role in modulating the TCWV signal. South of the AEJ, between 5 and 13° N, the MRG-TD1 waves are the only significant drivers of the TCWV variability, explaining 25 % of the variance. North of the AEJ, both MRG-TD2 and Kelvin wave signals modulate the TCWV signal, with 33 % and 29 % of explained variance at 18° N, respectively. The peak in explained variance for Kelvin waves above the continent may be linked to the circulation patterns presented in the previous section (see Fig. 4d that shows southerlies when the Kelvin humid phase is located above the continent, increasing the monsoon flow). This may explain why the impact is greater above the continent than over the ocean. Further north, between 20 and 25° N, the dominant drivers are the ER waves with 42 % of the explained variance at 23° N. Above Cabo Verde (Fig. 7b), all wave types are also drivers of TCWV variability between the Equator and 5° N. Further north, MRG-TD1 waves are the dominant driver between 5 and 10° N, accounting for 18 % of the explained TCWV variance, while the MRG-TD2 waves dominate the signal between 10 and 25° N with 28 % of the explained variance at 17° N. Unlike over the continent, ER waves north of 20° N and Kelvin waves at 18° N do not contribute significantly to the TCWV variance above Cabo Verde.
For dust, the variability of the AOD signal is dominated by MRG-TD1 waves between 0 and 5° N, ER waves south of the AEJ between 10 and 15° N, MRG-TD2 waves north of the AEJ between 15 and 20° N, and ER waves again between 20 and 25° N above the continent (see Fig. 6d). Above the Cabo Verde region (see Fig. 7d), the MRG-TD2 waves strongly dominate the signal with 27 % of the explained variance between 10 and 15° N, rising to 35 % between 15 and 20° N. Weaker maxima of explained AOD variance reaching about 15 % are observed for Kelvin waves near the Equator and around 13° N, for ER waves at 10 and 23° N, and MRG-TD2 waves at 3° N.
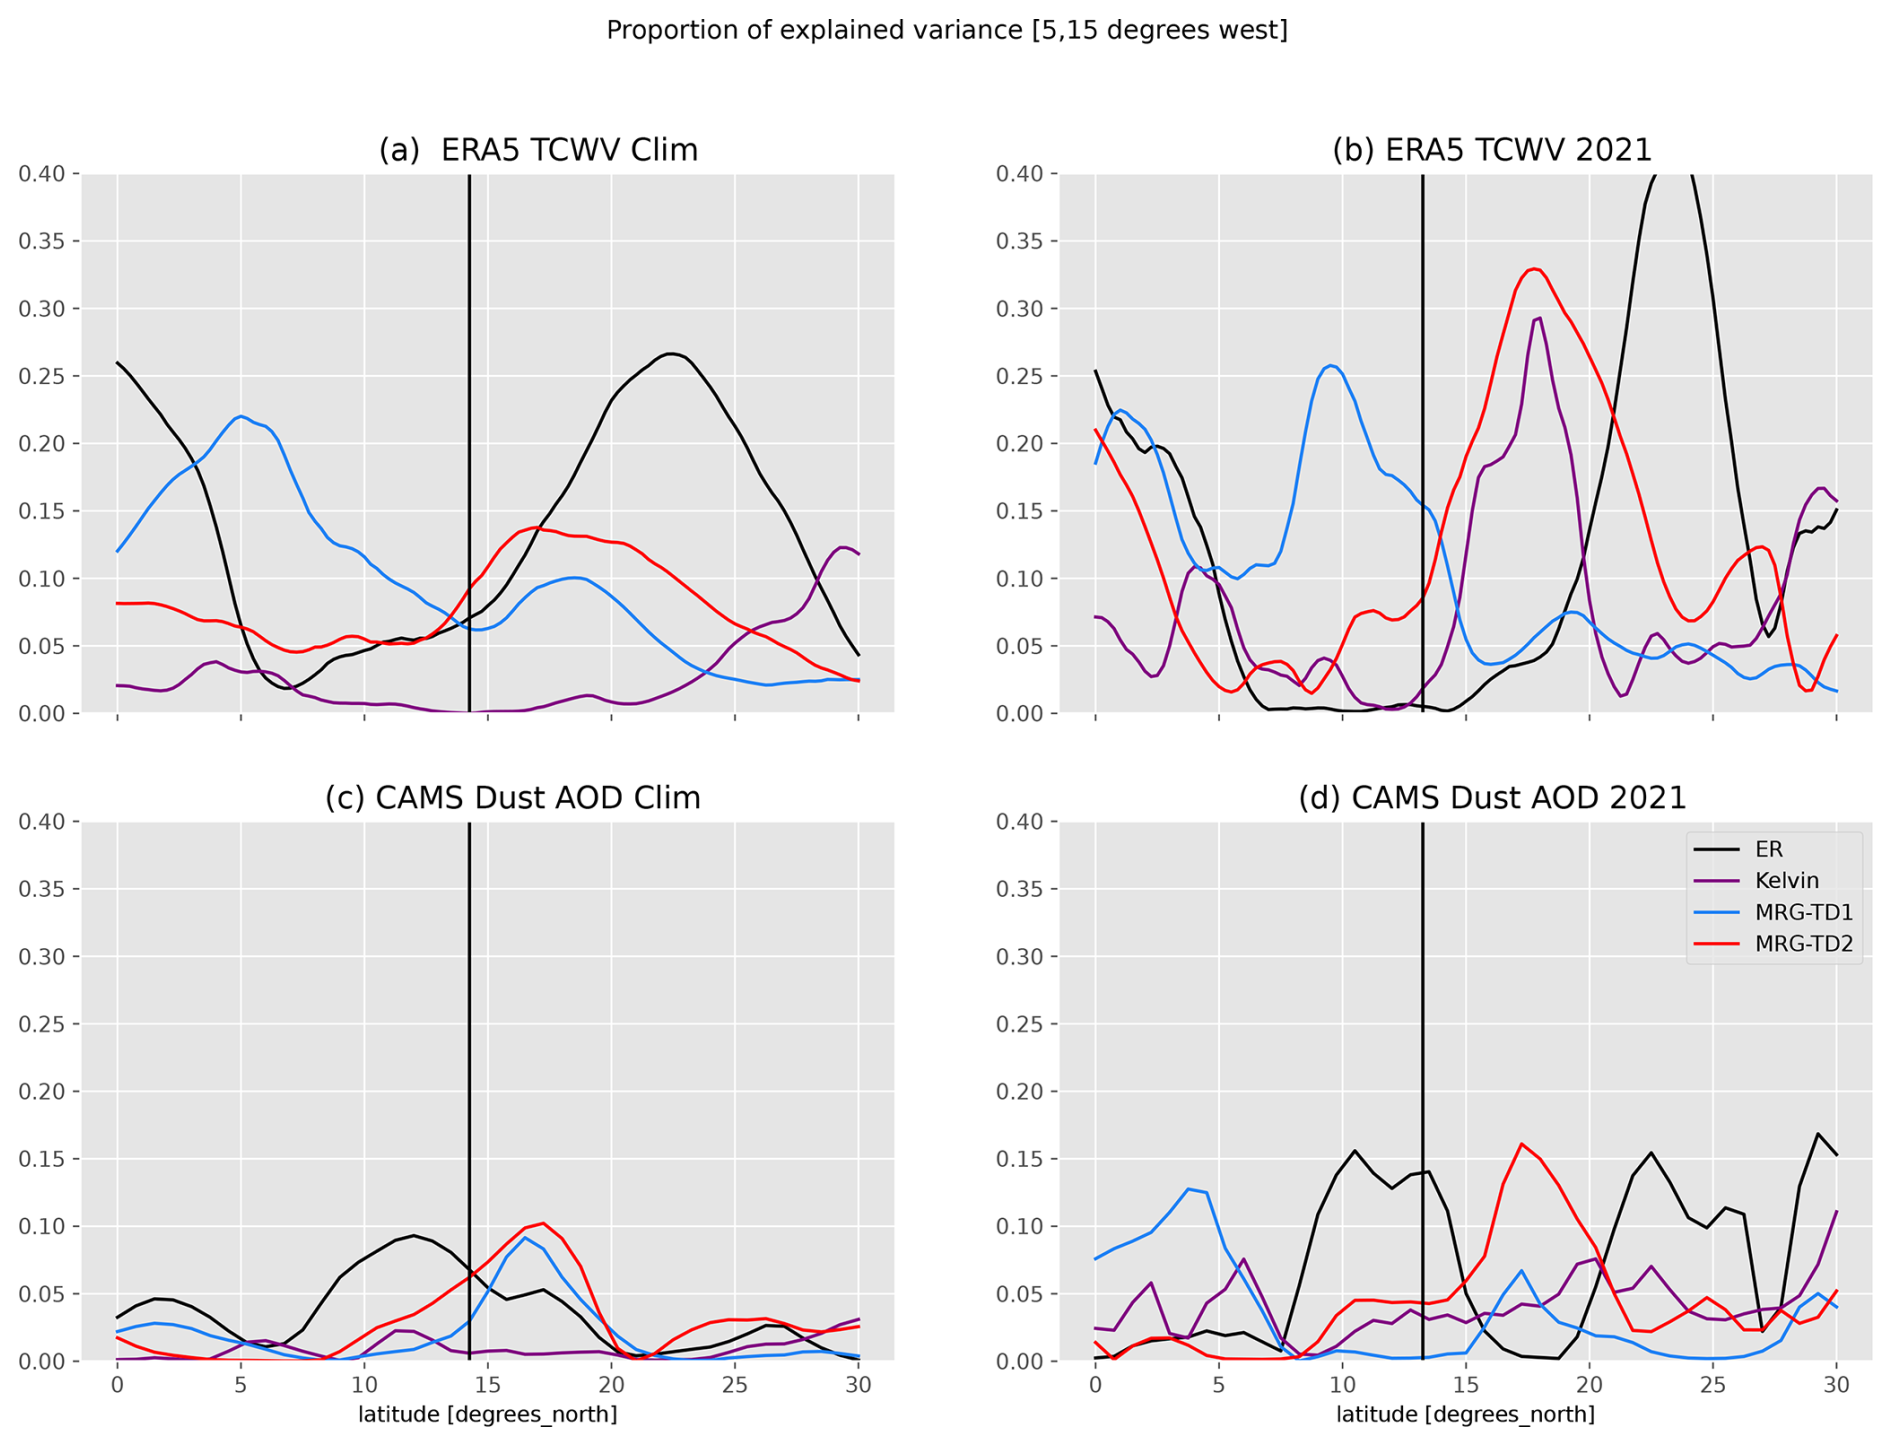
Figure 6Squared correlation coefficient between wave-filtered signal and ERA5 total column water vapor (TCWV, a, b) and CAMS dust aerosol optical depth (c, d) during September 2021 (right column, b, d) and September climatology for the period 2003–2021 (left column, a, c) above West Africa (15 to 5° W). The black line shows the mean position of the AEJ for the period and region considered.
Irrespective of the period of time considered (climatology vs. 2021) and of the region under study (continent vs. ocean), the main results can be summarized as follows.
-
ER waves are the main driver of TCWV variance near the Equator and north of 20° N and the main driver of dust AOD variance south of the AEJ.
-
MRG-TD1 waves dominate in the TCWV signal variability south of the AEJ.
-
MRG-TD2 waves control the TCWV signal variability north of the AEJ and also drive the dust variability north of the AEJ.
-
Kelvin waves have the least significant impact on TCWV and AOD variability, except for TCWV north of the AEJ above the continent in September 2021.
The vertical structure of the atmospheric conditions over Sal during the measurement period is now investigated using composites of temperature and humidity profiles measured in situ (radiosoundings and dropsondes) as well as dust extinction coefficient profiles derived from AEROIASI observations. The comparison between observation and reanalysis products is discussed in the Appendices (see Appendix B).
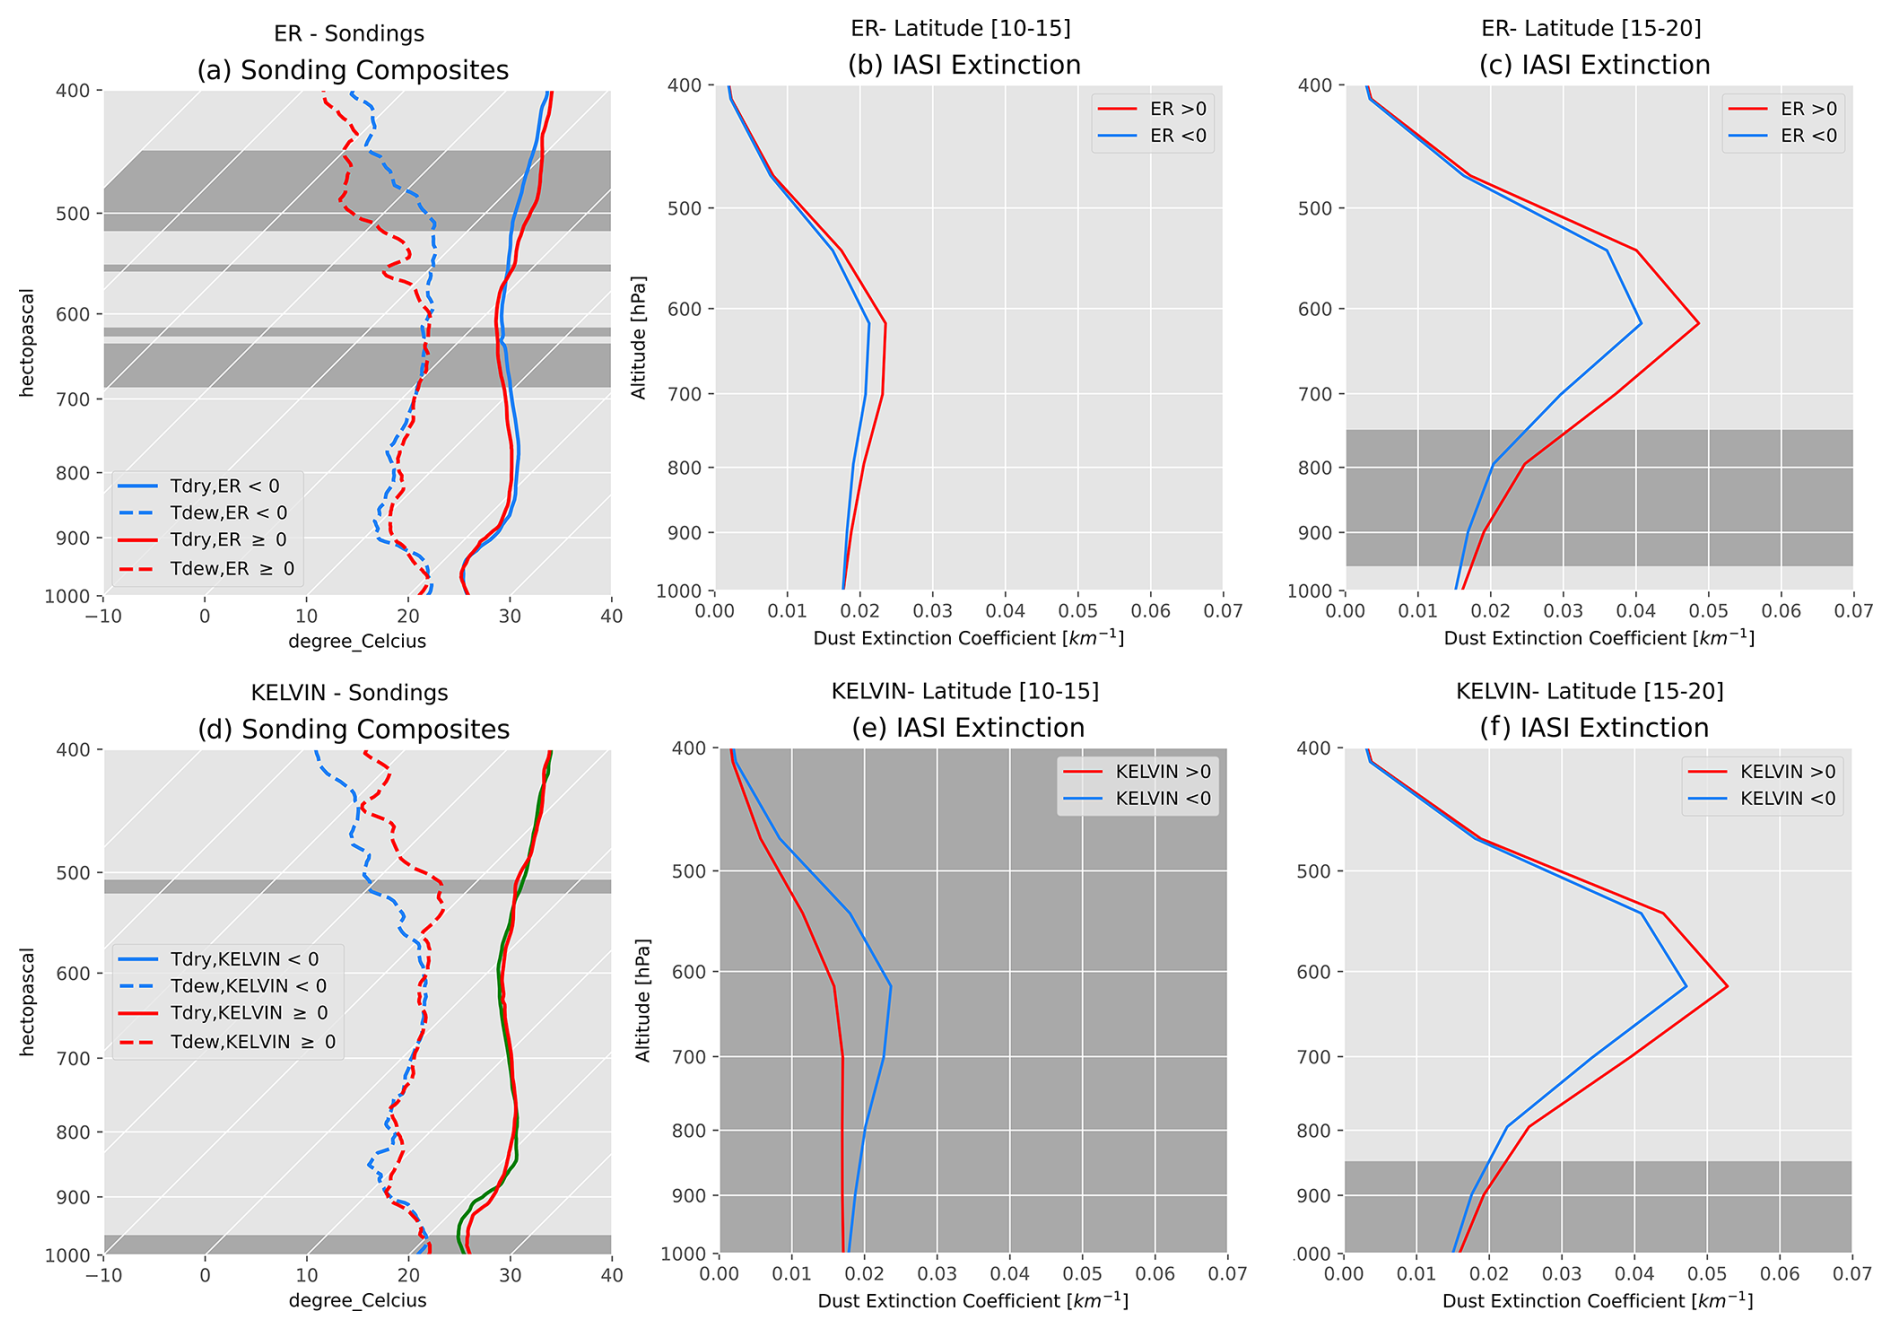
Figure 8Blue lines: dry phase. Red lines: humid phase. (a) Skew-T composite of soundings for the humid and dry phases of ER waves. Dashed lines: dew point, solid lines: dry temperature. (b) AEROIASI vertical dust extinction composite for the humid and dry phases of ER waves in the IASI South Zone. (c) Same as (b) but for the IASI North Zone. The darker gray zones show where there is a significant difference between the two phases according to a Welch's t test (95 % confidence level). For panel (a), we consider the difference significant between the two phases when either the difference in dry temperature or in dew point is significant. Number of soundings in a dry (humid) phase: 43 (34). Number of days in the IASI South Zone in a dry (humid) phase: 23 (17). Number of days in the IASI North Zone in a dry (humid) phase: 20 (17). (d, e, f) Same as (a, b, c) but for Kelvin waves. Number of soundings in a dry (humid) phase: 39 (38). Number of days in the IASI South Zone in a dry (humid) phase: 11 (22). Number of days in the IASI North Zone in a dry (humid) phase: 9 (14).
Figure 8a, b, and c show the composite of the skew-T composites as a function of ER wave phase (humid or dry). The difference in the sounding skew-T (panel a) is statistically significant between 700 and 600 hPa, with the humid phase of the wave showing slightly colder dry temperatures and a higher dew point (moister conditions) and above 550 hPa being significantly hotter and showing a lower dew point. Schlueter et al. (2019a) discussed the fact that the ER waves are generally associated with stratiform precipitation. The presence of stratiform clouds between 600 and 700 hPa associated with the humid phase may explain why the upper part of the column is drier for the humid phase than the dry phase. However, it is important to note that only one humid phase and one dry phase were sampled during the campaign and the composite here may not be representative of all ER waves. As for the dust, the only significant difference is at low levels in the IASI North Zone, with a humid phase associated with slightly more dusty events. The small values of the differences prevent any conclusion on the impact of ER waves on dust during the campaign. The profiles are not significantly different in the IASI South Zone.
Figure 8d, e, and f show the composite of the skew-T composites as a function of Kelvin wave phase (humid or dry). The only significant impact is found for the IASI South Zone, with the dry phase bringing slightly more dust, consistent with the circulation pattern as the dry phase is associated with northerlies (see Fig. 8e).
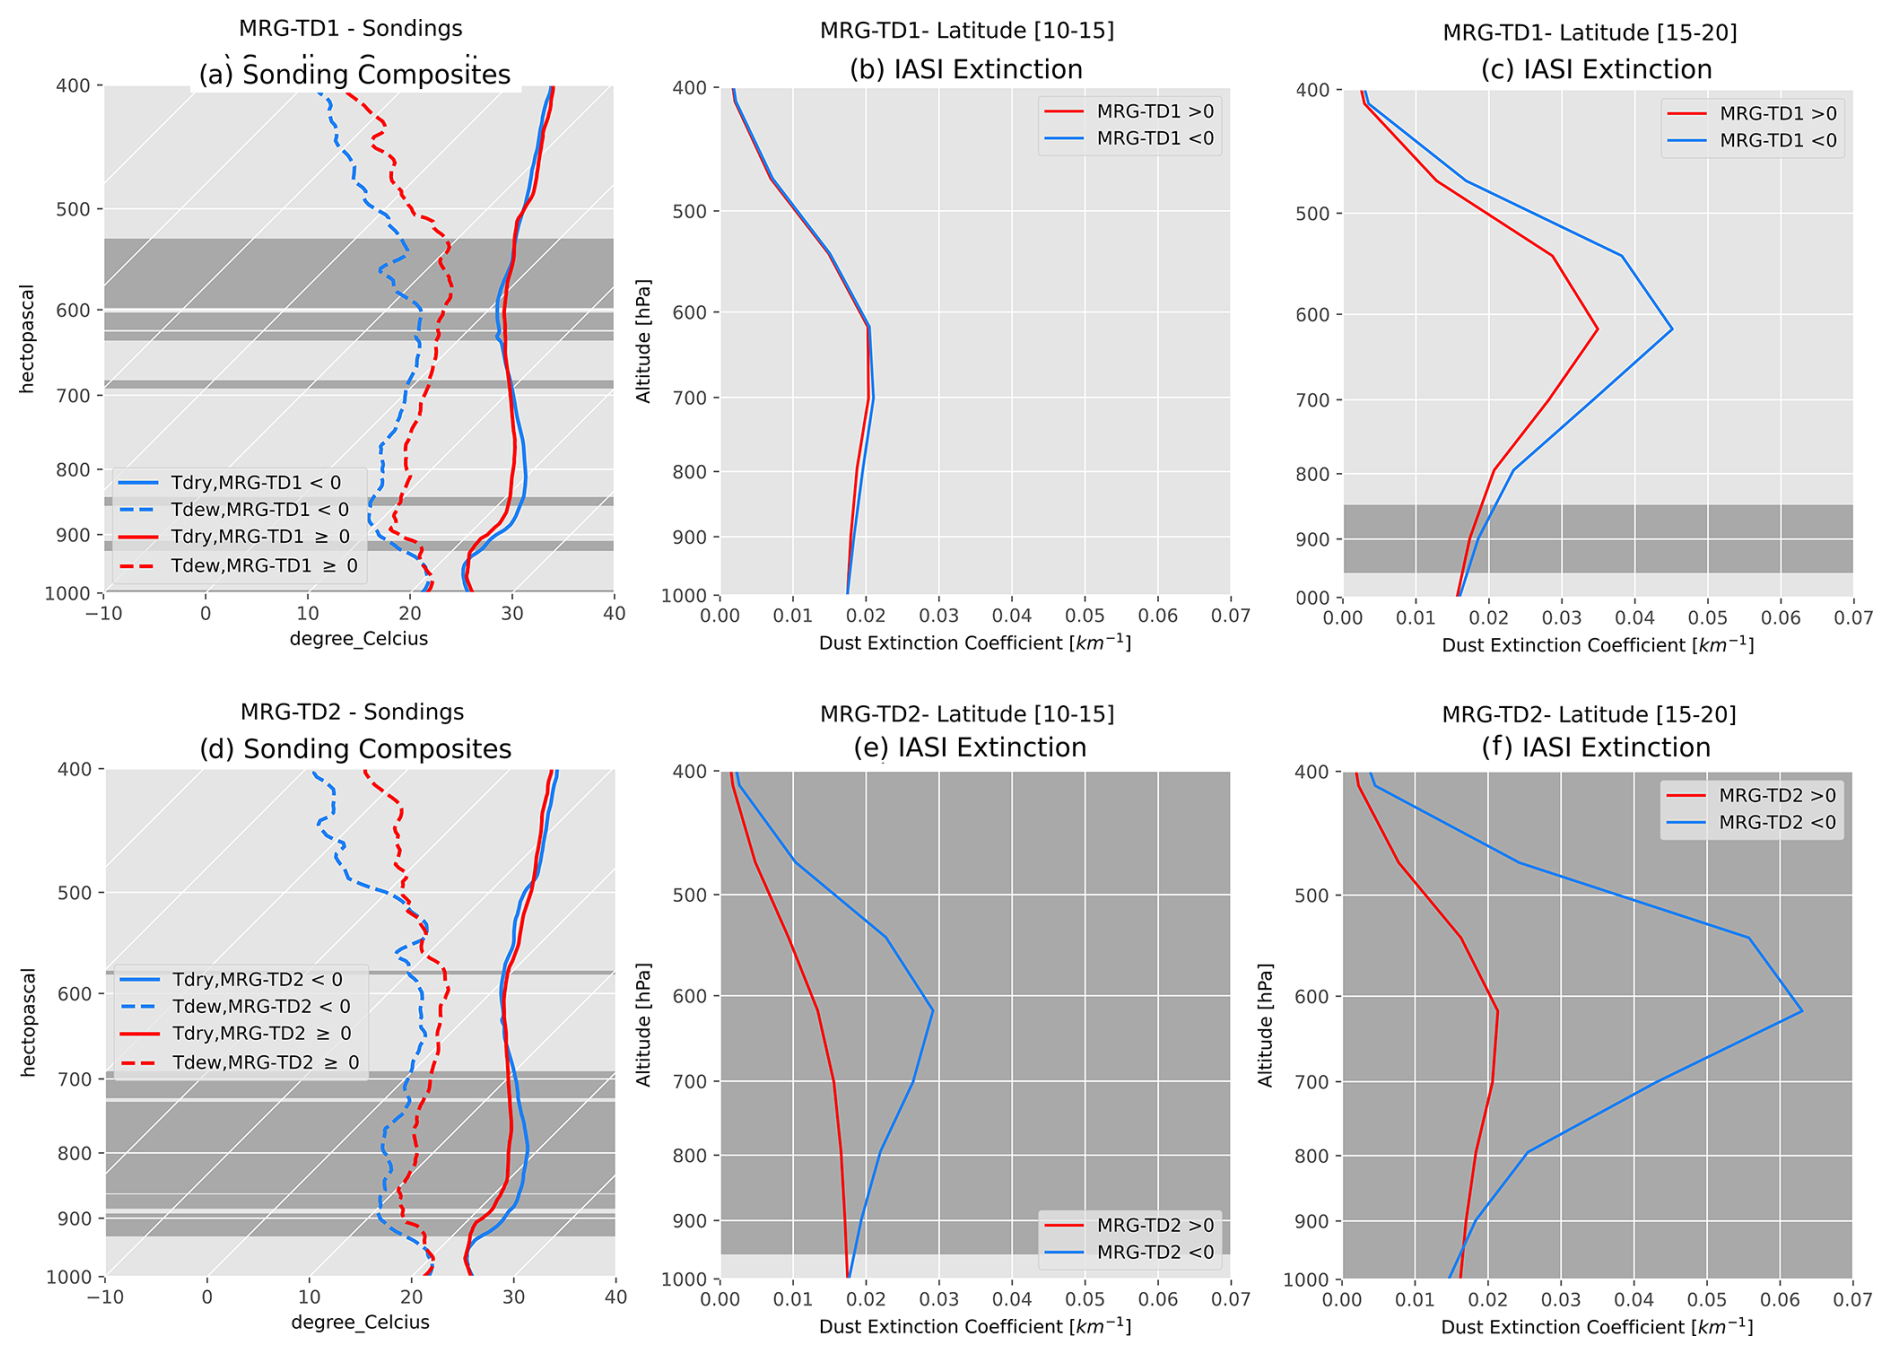
Figure 9(a, b, c) Same as Fig. 8 but for MRG-TD1 waves. Number of soundings in a dry (humid) phase: 40 (37). Number of days in the IASI South Zone in a dry (humid) phase: 16 (19). Number of days in the IASI North Zone in a dry (humid) phase: 11 (10). (d, e, f) Same as figure 8 but for MRG-TD2 waves. Number of soundings in a dry (humid) phase: 45 (32). Number of days in the IASI South Zone in a dry (humid) phase: 17 (14). Number of days in the IASI North Zone in a dry (humid) phase: 19 (20).
MRG-TD1 waves have a strong impact on humidity (Fig. 9a). The difference between the humid and dry phase in the sounding data is especially significant between 650 and 550 hPa. Dust is significantly modulated by the passage of the waves in the IASI North Zone between 950 and 750 hPa for IASI observations, with more dust observed in the dry phase of the wave. On the other hand, in the IASI South Zone, MRG-TD1 waves do not significantly impact the dust distribution.
MRG-TD2 waves have a strong influence on both humidity and dust distribution. The skew-T diagrams show that the dew point is significantly greater for the humid phase from 900 to 700 hPa. MRG-TD2 impacts the thermodynamic structure of the atmosphere at lower altitudes than MRG-TD1. Dust is significantly modulated by the passage of the wave throughout the column and for both IASI regions. Based on IASI observations, the extinction peak at 600 hPa disappears completely during a humid phase. The extinction at 600 hPa during the passage of the dry phase is 3 times that of the humid phase for the IASI North Zone and twice that of the humid phase in the IASI South Zone. The results are consistent with the findings of Grogan and Thorncroft (2019), who documented the fact that north of the AEJ, dust outbursts are found just after the AEW trough in a region of southerly flux. Indeed, the dry phase of MRG-TD2 is slightly behind the dynamic center of the cyclonic pattern and is mainly associated with easterlies.
The sections above have shown that tropical waves play a role in structuring the thermodynamics and composition of the atmosphere. In this section, the impact of tropical wave interplay on tropical cyclogenesis and dust outbursts will be highlighted. To do so, two viewpoints will be adopted: Fig. 10 presents Hovmöller diagrams for each type of wave on the whole Atlantic basin, and Fig. 11 shows the variation of TCWV and dust AOD at the location of Sal, Cabo Verde, in relation to time series of wave-filtered signal at the same location. Four events of interest were captured by the instruments of the CADDIWA campaign: TC Larry, TD Pierre-Henri (PH, unofficial name used in all papers of the CADDIWA campaign, see Flamant et al., 2025; Jonville et al., 2025), TS Peter, and TS Rose (named by the National Hurricane Center). The environments of the MRG-TD1 on which the last three events developed were sampled by the aircraft during the campaign, while Larry was only observed from ground-based measurements.
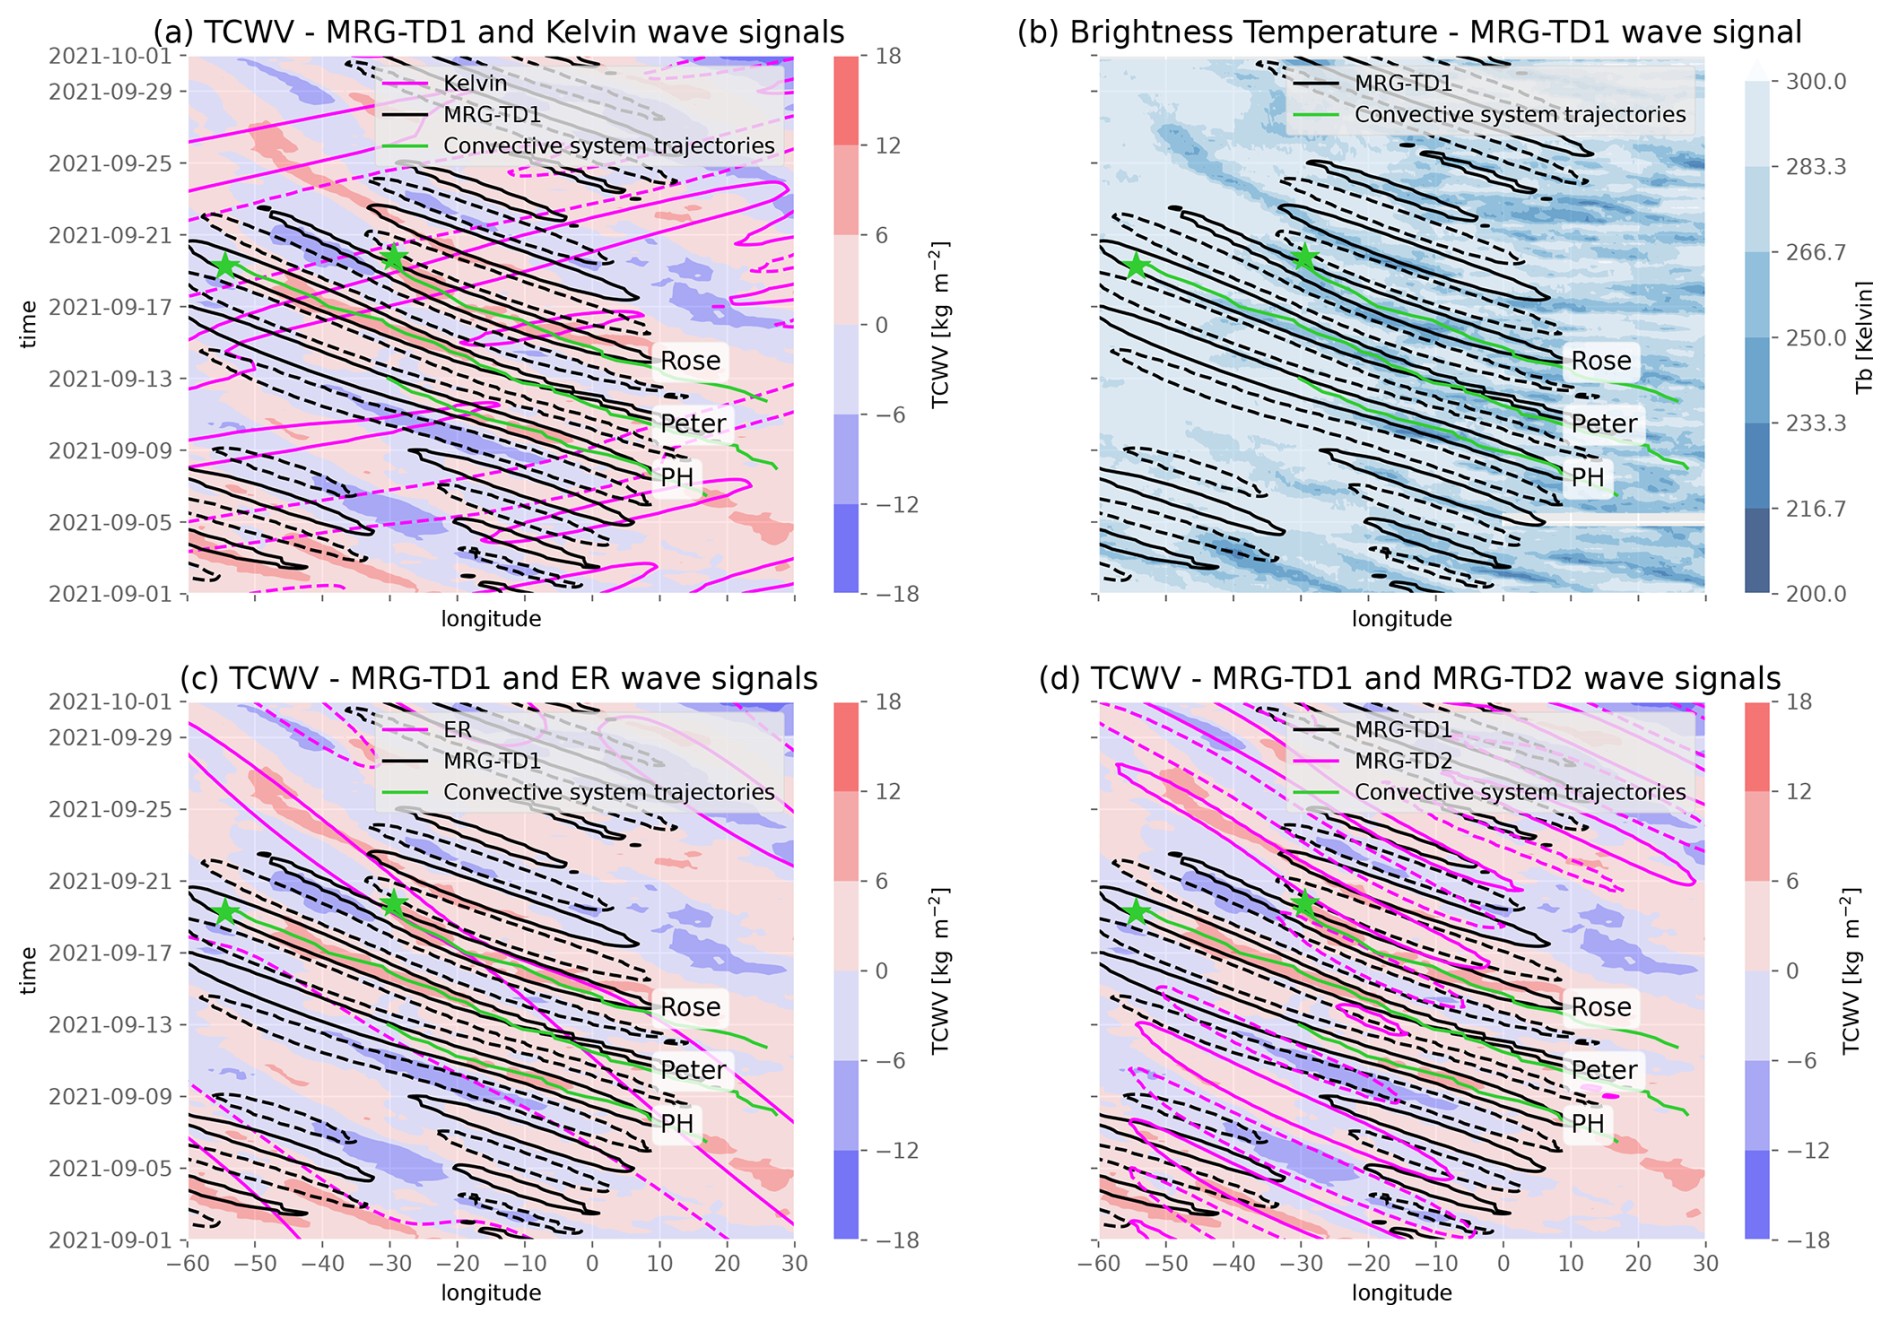
Figure 10(a) Hovmöller diagram of ERA5-derived TCWV anomaly (shading) and Kelvin wave and MRG-TD1 wave signals (magenta and black contours, respectively). (b) Hovmöller diagram of merged-IR brightness temperature and MRG-TD1 wave signal (black contour). (c) Same as panel (a), but for ER and MRG-TD1 waves (magenta and black contours, respectively). (d) Same as panels (a) and (c), but for MRG-TD2 and MRG-TD1 waves (magenta and black contours). Labels for MRG-TD1 associated with tropical disturbance Pierre-Henri (PH) and tropical storms Peter and Rose are shown at the start of MRG-TD1 wave propagation. The tracks of the different convective systems before cyclogenesis from Jonville et al. (2024) are shown in green, and the genesis location of Peter and Rose is shown with a green star. Contours are drawn for plus or minus the root mean square value of each wave signal in September 2021. All values are averaged between 0 and 20° N.
Figure 10 shows the Hovmöller diagrams of ERA5-derived TCWV and brightness temperatures (from merged-IR) in the Atlantic basin between the Equator and 20° N with the different wave components superimposed. Deep convection (brightness temperature below 230 K) and high TCWV are almost always collocated with a positive phase of either MRG-TD1 or MRG-TD2 waves. An important dry ER event is observed during the first 2 weeks of September 2021 (see Fig. 10c), during which MRG-TD1 wave activity is strongly inhibited west of 20° W, but not above the continent. This is consistent with the findings of Schlueter et al. (2019b), who show that the dry phase of an ER wave has no impact on precipitation over the continent. No intense convection is observed during that event (Fig. 10b). On the other hand, intense MRG-TD1 wave activity happens during the humid ER phase. Kelvin waves were active during the whole month (see Fig. 10a). The interaction of Kelvin waves with the systems under study will be discussed extensively in the following paragraphs.
Over Sal in September 2021 (see Fig. 11), four water vapor bursts exceeding 50 kg m−2 are seen on 1–2, 6, 11–12, and 18–19 September, respectively associated with Larry, PH, and Rose, and two additional ones exceeding 40 kg m−2 are seen on 8–9 and 26 September. Figure 11a shows the comparison of the sum of the wave component with the total TCWV signal. Part of the TCWV variability is not explained by tropical waves, but all the most important features can be found in the sum of the tropical wave signal (correlation 61.3 %). The AOD signals and the TCWV signals are anticorrelated, with peaks in AOD coinciding with dry phases (anticorrelation between dust AOD and sum of TCWV tropical wave component −30.8 %). The decomposition of TCWV into MRG-TD1, MRG-TD2, ER, and Kelvin waves is presented in panel (b).
The TCWV maximum observed in Fig. 11 on 1–2 September corresponds to the passage TS Larry (not yet a hurricane), less than 300 nautical miles (nmi; not shown) south of Cabo Verde. It benefits from very favorable conditions, with MRG-TD1, MRG-TD2, and Kelvin waves in their humid phase and the wave-filtered TCWV anomaly associated with the ER wave being null.
On the other hand, the genesis of the three AEW events that were the main focus of the CADDIWA campaign was collocated with the humid ER phase (see Fig. 10c). These three events were associated with positive TCWV anomaly and low brightness temperature, indicating strong convective activity (Fig. 10b).
For tropical disturbance PH, the convective activity and positive TCWV anomaly fade out as the MRG-TD1 wave catches on with the dry phase of the ER wave at around 20° W, the longitude of Sal (Fig. 10c). Over Sal, the TD generates a TCWV maxima on 11–12 September (Fig. 11a) in association with its parent MRG-TD1 wave in its humid phase. When it reaches Cabo Verde, Pierre-Henri propagates in an already unfavorable ER environment. Additionally, Fig. 11b shows that the humid phase associated with Pierre-Henri is collocated with a null Kelvin wave-filtered TCWV anomaly, following a dry phase by 1 d. Ventrice et al. (2012b) and Lawton and Majumdar (2023) have shown that the impact of a Kelvin wave on an AEW can be felt between the time the two waves cross paths with each other and 2 d afterwards. The Kelvin dry phase might therefore still unfavorably impact the environment of PH. Finally, PH comes close to a MRG-TD2 dry phase that has interacted with the MRG-TD1 wave (see Fig. 10d) This case has been documented in detail from a dynamical point of view in Jonville et al. (2024).
The disturbance from which Peter originates leaves the wettest region of the ER wave at approximately 5° W. It crosses the basin without intensification strong enough to trigger a TC genesis until it reaches 53° W (Jonville et al., 2024). There, Jonville et al. (2024) found that an interaction between an AEW-N and the AEW-S led to the development of a vertically coherent vortex that favored the development of TS Peter. The signal from this AEW-N does not appear in the MRG-TD2 signal (Fig. 10d), which is consistent with the idea of Jonville et al. (2024) that the AEW-N moistened before merging with the AEW-S. This moistening may weaken the dry anomaly associated with the cyclonic phase and hinder the detection of this AEW-N in the TCWV signal. The MRG-TD1 wave associated with the disturbance soon to become Peter also crosses a Kelvin wave humid phase on 17 September, i.e., 2 d before the genesis of Peter (see Fig. 10a). Ventrice et al. (2012b) and Lawton and Majumdar (2023) have found that a Kelvin wave can favor TC genesis from an AEW up to 2 d after the two waves cross paths. Peter's genesis may therefore have benefited from this interaction. Ventrice et al. (2012a) have shown that this catalyzing effect was mainly linked to the low-level circulation as the convective system moves in the region of increased westerlies associated with the humid Kelvin phase. The fact that this interaction is mainly dynamic is consistent with our findings that the Kelvin waves' impact on the thermodynamic structure of the atmosphere is weak in the region.
Finally, the MRG-TD1 wave associated with the perturbation soon to become Rose benefited from a constructive interaction with the ER wave along its entire trajectory (Fig. 10c) and crossed a Kelvin wave humid phase at 25° W, within a day from the TC genesis. Above Cabo Verde, a local maxima on 18–19 September (see Fig. 11) is associated with soon-to-become TS Rose propagating westward less than 350 nmi off the island (not shown). Local time series show that it is indeed associated with a very favorable environment (humid phase of ER, MRG-TD1, and MRG-TD2 waves, 2 d after a Kelvin wave humid phase) that may have catalyzed the genesis of Rose in the vicinity of Sal.
To summarize, MRG-TD1 waves are the main precursor of TC in the region in September 2021. Their propagation is inhibited or catalyzed by ER and Kelvin waves. The first strongly impact the propagation of convectively active MRG-TD1 above the ocean, while the latter can catalyze or inhibit the intensification of the systems up to 2 d after the MRG-TD1 crosses the peak or the ridge of a Kelvin wave (respectively). The interaction between MRG-TD2 and MRG-TD1 can help genesis, notably by homogenizing both the vortex and the water vapor content in the tropospheric column as MRG-TD1 and MRG-TD2 do not affect the same altitudes. However, this interaction can also be detrimental to cyclogenesis when the phasing is such that the MRG-TD2 brings dry air inside the MRG-TD1 vortex, thereby inhibiting convection.
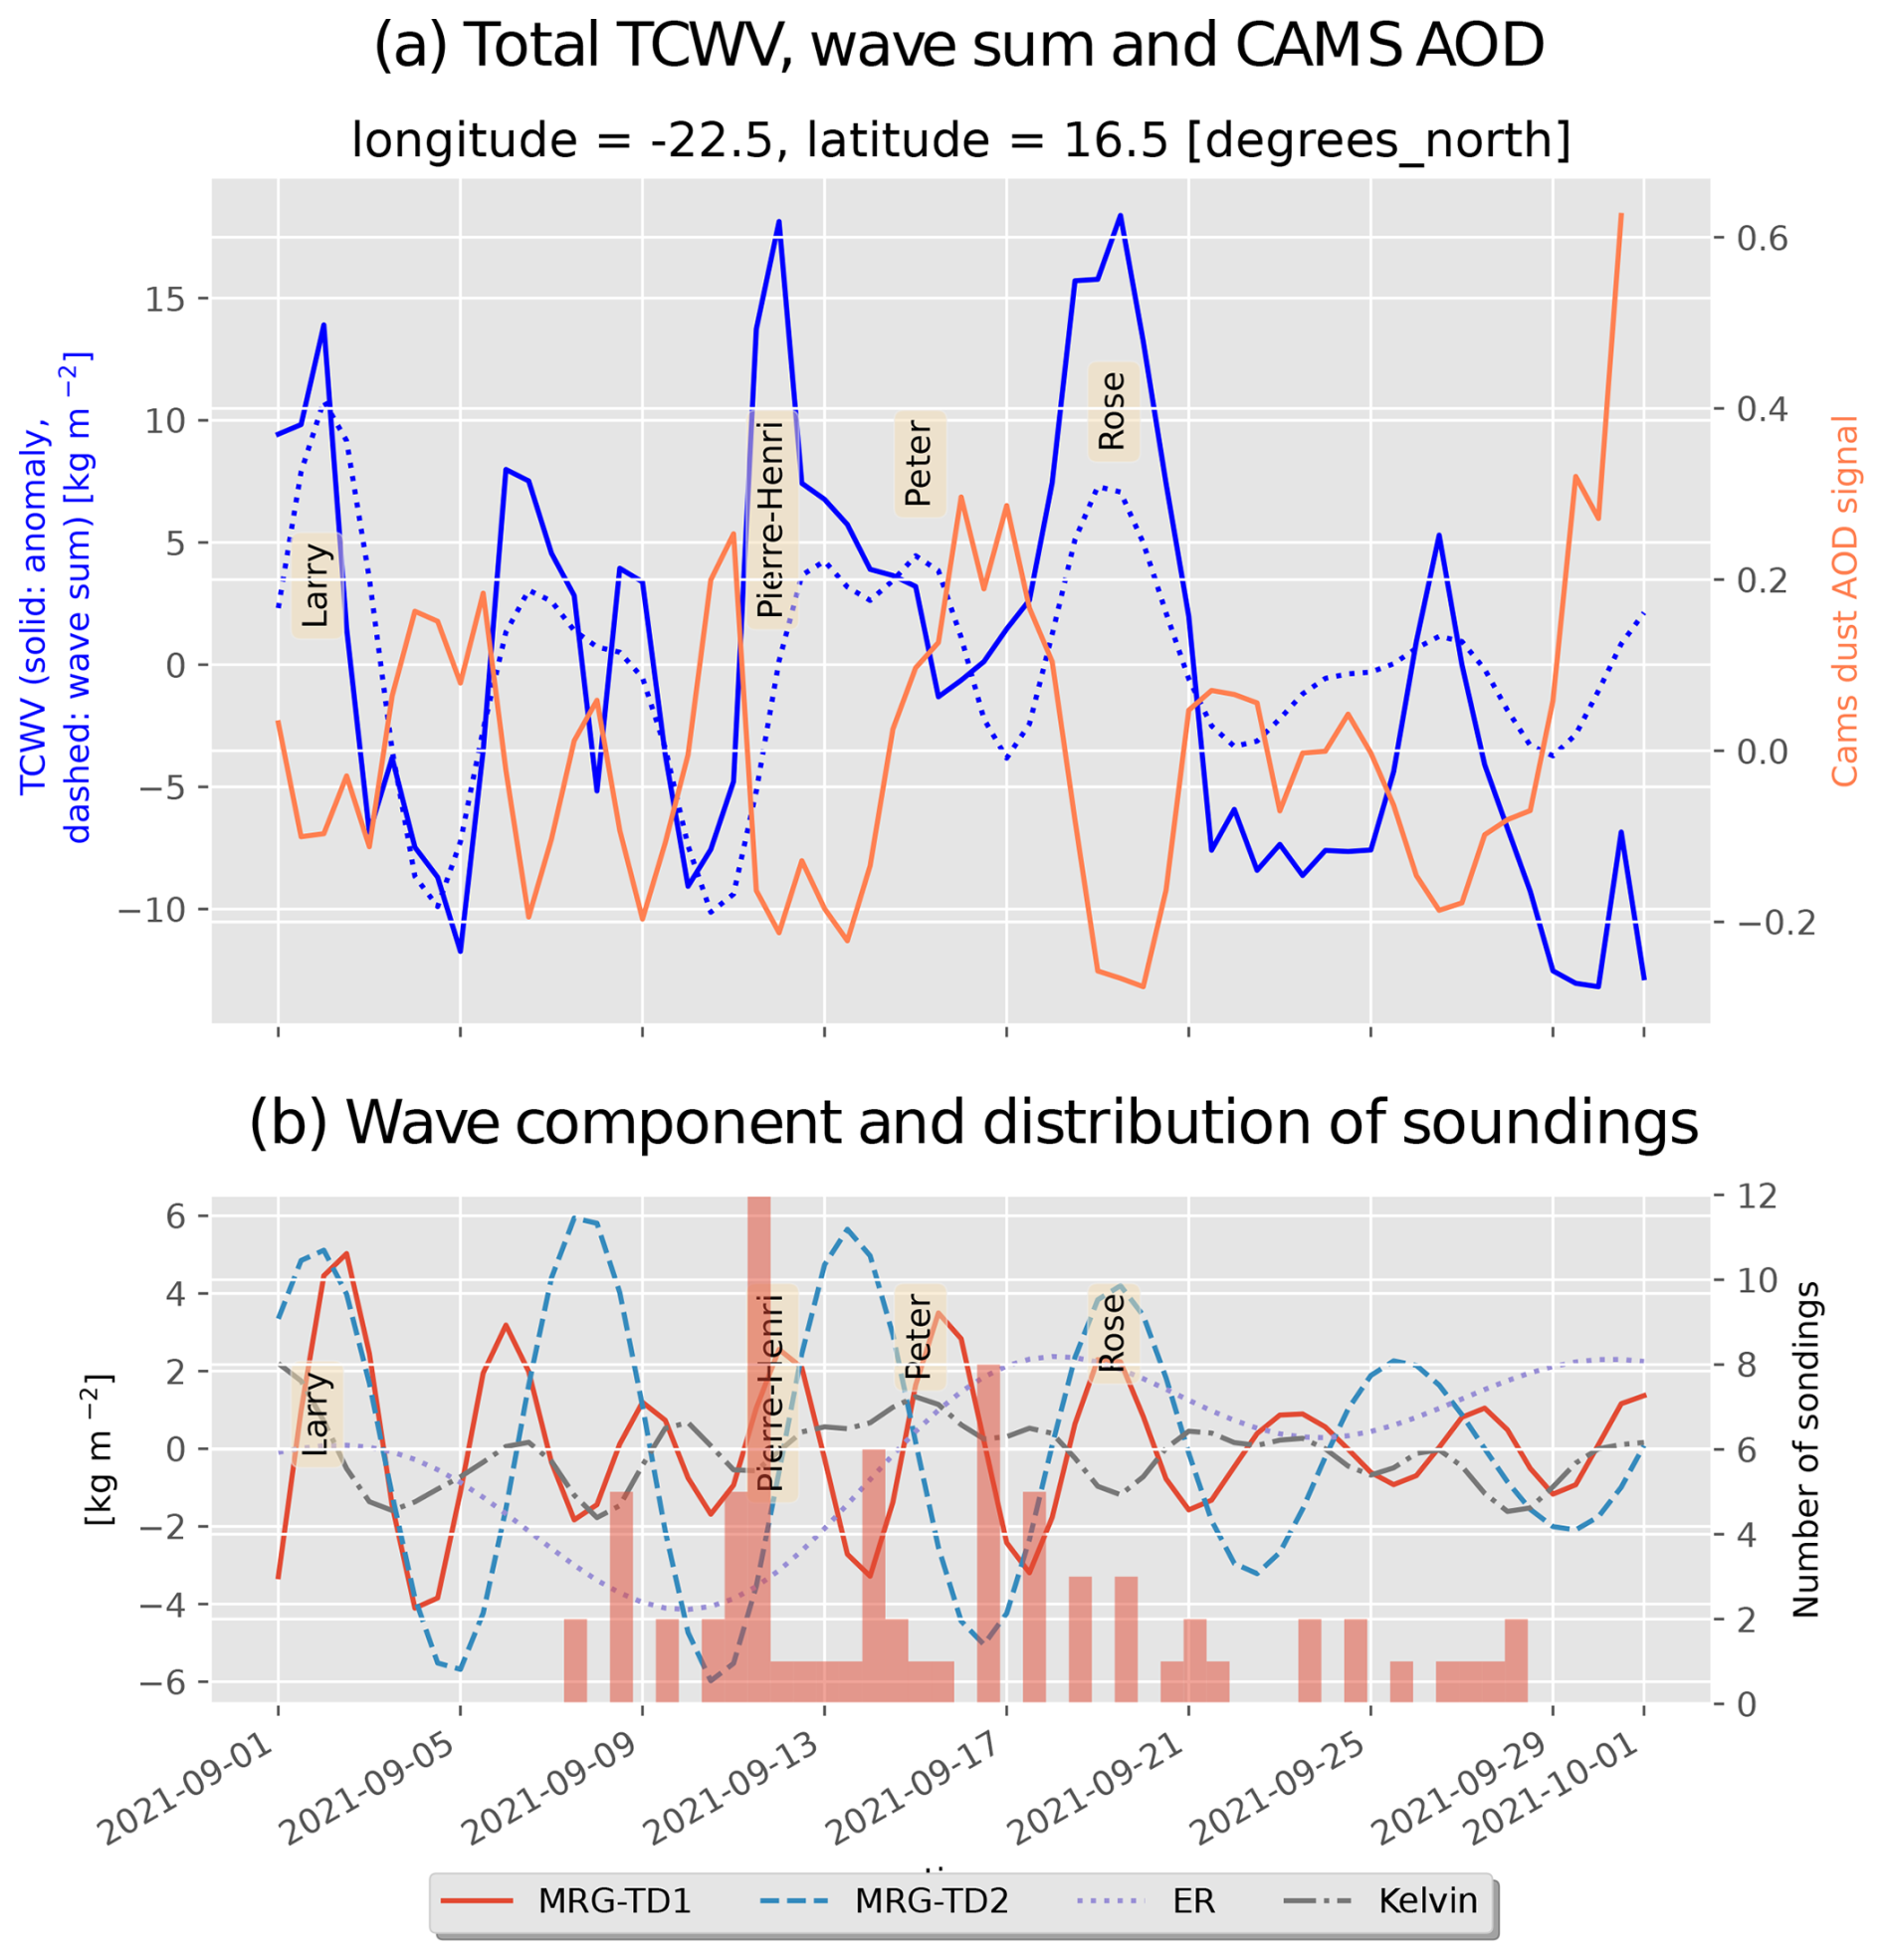
Figure 11Total column water vapor (TCWV) anomaly (solid teal line, ECMWF ERA5), dust aerosol optical depth (AOD) anomaly (solid coral line, ECMWF CAMS), and the sum of tropical wave contributions (dashed teal line) (a) together with individual tropical wave contributions (b) filtered following the Wheeler–Kiladis approach during September 2021 near Sal Island (16.5° N, 22.5° W) as well as a bar plot of the number of soundings each half-day. The anomalies are computed relative to the period 2003–2021. The names of the identified weather events (hurricane “Larry”, tropical perturbation “Pierre-Henri”, and TSs “Peter” and “Rose”) crossing Sal are indicated in panel (a).
Regarding dust outbreak, all events (characterized by peak of AOD, see upper panel in Fig. 11) are collocated with dry phases of MRG-TD2 waves. The four most intense peaks on 5, 10, 17, and 30 September are also collocated with dry phases of MRG-TD1 waves, while the less intense peak on 23 September is collocated with a humid phase of an MRG-TD1 wave. The most intense dust outbreak took place late on 10 September, with AODs around 500–550 nm reaching 0.8–1. Dust aerosol optical depth (DOAD) values reach 0.58 and 0.59 for CAMS (550 nm) and AEROIASI (converted from 10 µm to 500 nm using the scaling factor of 1.7 discussed in Cuesta et al., 2020). According to observations and simulations, the AOD and DAOD dropped significantly in the following 24 h with the arrival of tropical perturbation Pierre-Henri to reach values in the range of 0.2–0.3. The main driver of dust outbreaks during the campaign are MRG-TD2 waves, modulated by the activity of MRG-TD1 on the southern side of the AEJ.
The CADDIWA campaign provided a unique opportunity to investigate the role of tropical waves in structuring the atmosphere in the Cabo Verde region using an extensive range of measurements (radiosondes, dropsondes, satellite). This research focuses on how tropical waves influence atmospheric conditions in this area, where such processes are particularly relevant due to their potential role in tropical cyclone formation.
After decomposing the TCWV signal over Sal based on ERA5 in its tropical wave components, the impact of each tropical wave type on the horizontal structure of atmospheric thermodynamics and composition is discussed. The ER waves display a structure close to that predicted by theory. Kelvin waves exhibit a more patchy pattern, likely due to their maximum being centered at the Equator. The separation between MRG-TD1 and MRG-TD2 waves allows for the detection of AEW-N and AEW-S activity, consistent with the findings of Jonville et al. (2025). The present study demonstrates that this method works for integrated products in addition to the 700 hPa focus of Jonville et al. (2025). An interesting feature of MRG-TD2 waves is that their dry phase is 90° out of phase with the 700 hPa wave-filtered vorticity. This supports the hypothesis of Chen (2006) that successive intrusions of moist monsoon flow (southerlies) and dry Harmattan (northerlies) across the latitude of the AEJ favor the genesis of AEW-N.
Tropical waves do not impact the whole region homogeneously. ER waves are the most significant driver of TCWV variability near the Equator and north of 20° N, possibly due to interactions between ER waves and extratropical Rossby waves (Schlueter et al., 2019a). MRG-TD1 waves (MRG-TD2 waves) account for most of the impact on the atmospheric thermodynamics and composition profiles south (north) of the AEJ location for both September 2021 and climatologically. Composites of radiosoundings (and ERA5) show a significant and important impact of MRG-TD1 on the thermodynamic structure at jet level and of MRG-TD2 in the lower troposphere. These results are consistent with the regions of propagation of MRG-TD1 and MRG-TD2 (Jonville et al., 2025). Kelvin waves have almost no impact on TCWV variability in the climatology, and radiosounding composites for September 2021 show no significant difference between humid and dry phases. The consistency of ERA5 and sounding data shows that the impact of tropical waves on the thermodynamic vertical structure of the atmosphere is well reflected in ERA5.
Dust AOD variability is mainly explained by MRG-TD1 and MRG-TD2 waves north of the AEJ in the September climatology. In 2021, only the MRG-TD2 waves show an explained variance above 10 % north of the AEJ. This is consistent with the satellite-based AEROIASI observations of the vertical structure of aerosol extinction. The composites show that the passage of the dry phases of MRG-TD2 waves is responsible for most of the peak in extinction in both the north and south of the AEJ, whereas the difference between the humid and dry phases of MRG-TD1 waves is insignificant for dust extinction. CAMS tends to overestimate the impact of MRG-TD1 and ER waves on the dust extinction composite profiles. This may explain the important peak of explained variance for CAMS dust AOD south of the AEJ both in the climatology and for September 2021. CAMS also underestimates the altitude of Saharan dust compared to observations in all composites studied. Further research needs to be conducted to assess the sensitivity of CAMS to tropical waves and its performances in retrieving vertical dust profiles above West Africa. The AEROIASI products offer a good opportunity to compare CAMS results with satellite observations.
During the campaign, all MRG-TD1 waves that were associated with tropical cyclogenesis interacted with multiple other tropical waves. Those interactions resulted in conditions favorable to cyclogenesis. The passage of the disturbance soon to become tropical storm Larry over Sal is associated with a humid phase of an MRG-TD2 wave and a humid phase of a Kelvin wave. The collapse of tropical disturbance Pierre-Henri's convective activity happens as its associated MRG-TD1 wave catches up with the dry phase of an ER wave. The genesis of tropical storm Peter occurs 2 d after an MRG-TD1 wave crosses a Kelvin wave humid phase. These results are complementary to those of Jonville et al. (2024), who documented a favorable interaction between an AEW-N and an AEW-S in the case of Peter and a detrimental interaction between an AEW-N and an AEW-S in the case of Pierre-Henri. In addition to the dynamic aspects explored by Jonville et al. (2024), the impact of the MRG-TD2 wave needs to be considered, since the impact of MRG-TD2 waves on TCWV is 90° out of phase with their impact on vorticity. For tropical storm Rose, the genesis occurred near Sal, as the humid phases of an MRG-TD1 and an MRG-TD2 merged, 1 d after the passage of a Kelvin wave humid phase. The 0 to 2 d delay between a Kelvin/MRG-TD1 interaction and a TC genesis, documented by Ventrice et al. (2012b) and theorized by Lawton and Majumdar (2023), is consistent with our observations for both Rose and Peter. The MRG-TD1 wave associated with the genesis of TS Rose was also in phase with a TCWV ER humid phase for most of its life cycle. Jonville et al. (2024) documented how the genesis benefited from a strong interaction with the monsoon trough. The impact of the tropical wave context on this type of interaction requires a more thorough analysis, especially as Janicot et al. (2010) found that ER waves were strongly linked to the variability of the West African monsoon system.
This study explores how different equatorial waves – specifically ER, MRG-TD1, and MRG-TD2 – shape humidity, temperature, and dust distribution over Cabo Verde in September 2021. By analyzing in situ temperature and humidity profiles, dust measurements from satellite data, and reanalysis, this research highlights significant wave-induced variations in atmospheric moisture and dust concentrations. Discrepancies in the dust distribution between satellite products and reanalysis data underscore the need to further refine the modeling of dust transport above the eastern Atlantic. This matter is particularly relevant in the context TC genesis as the impact of dust on TC formation is still poorly understood. Notably, interactions of MRG-TD1 and MRG-TD2 waves are known to favor TC development (Hankes et al., 2015; Duvel, 2021; Jonville et al., 2025). Investigating how dust transported by an MRG-TD2 interacts within an environment made favorable for convection by an MRG-TD1 could help improve our understanding of TC genesis processes in the Atlantic.
A schematic is presented in Fig. A1 to illustrate the method used to composite IASI data for vertical profiles. IASI and CAMS data are first interpolated on the same grid. For a given date, wave type, and phase, only IASI cloud-free pixels with the signal of the specified wave in the given phase (humid or dry) are retained. The same mask is applied to CAMS data. If these points cover less than 70 % of the zone of interest, the date is excluded from the composite.
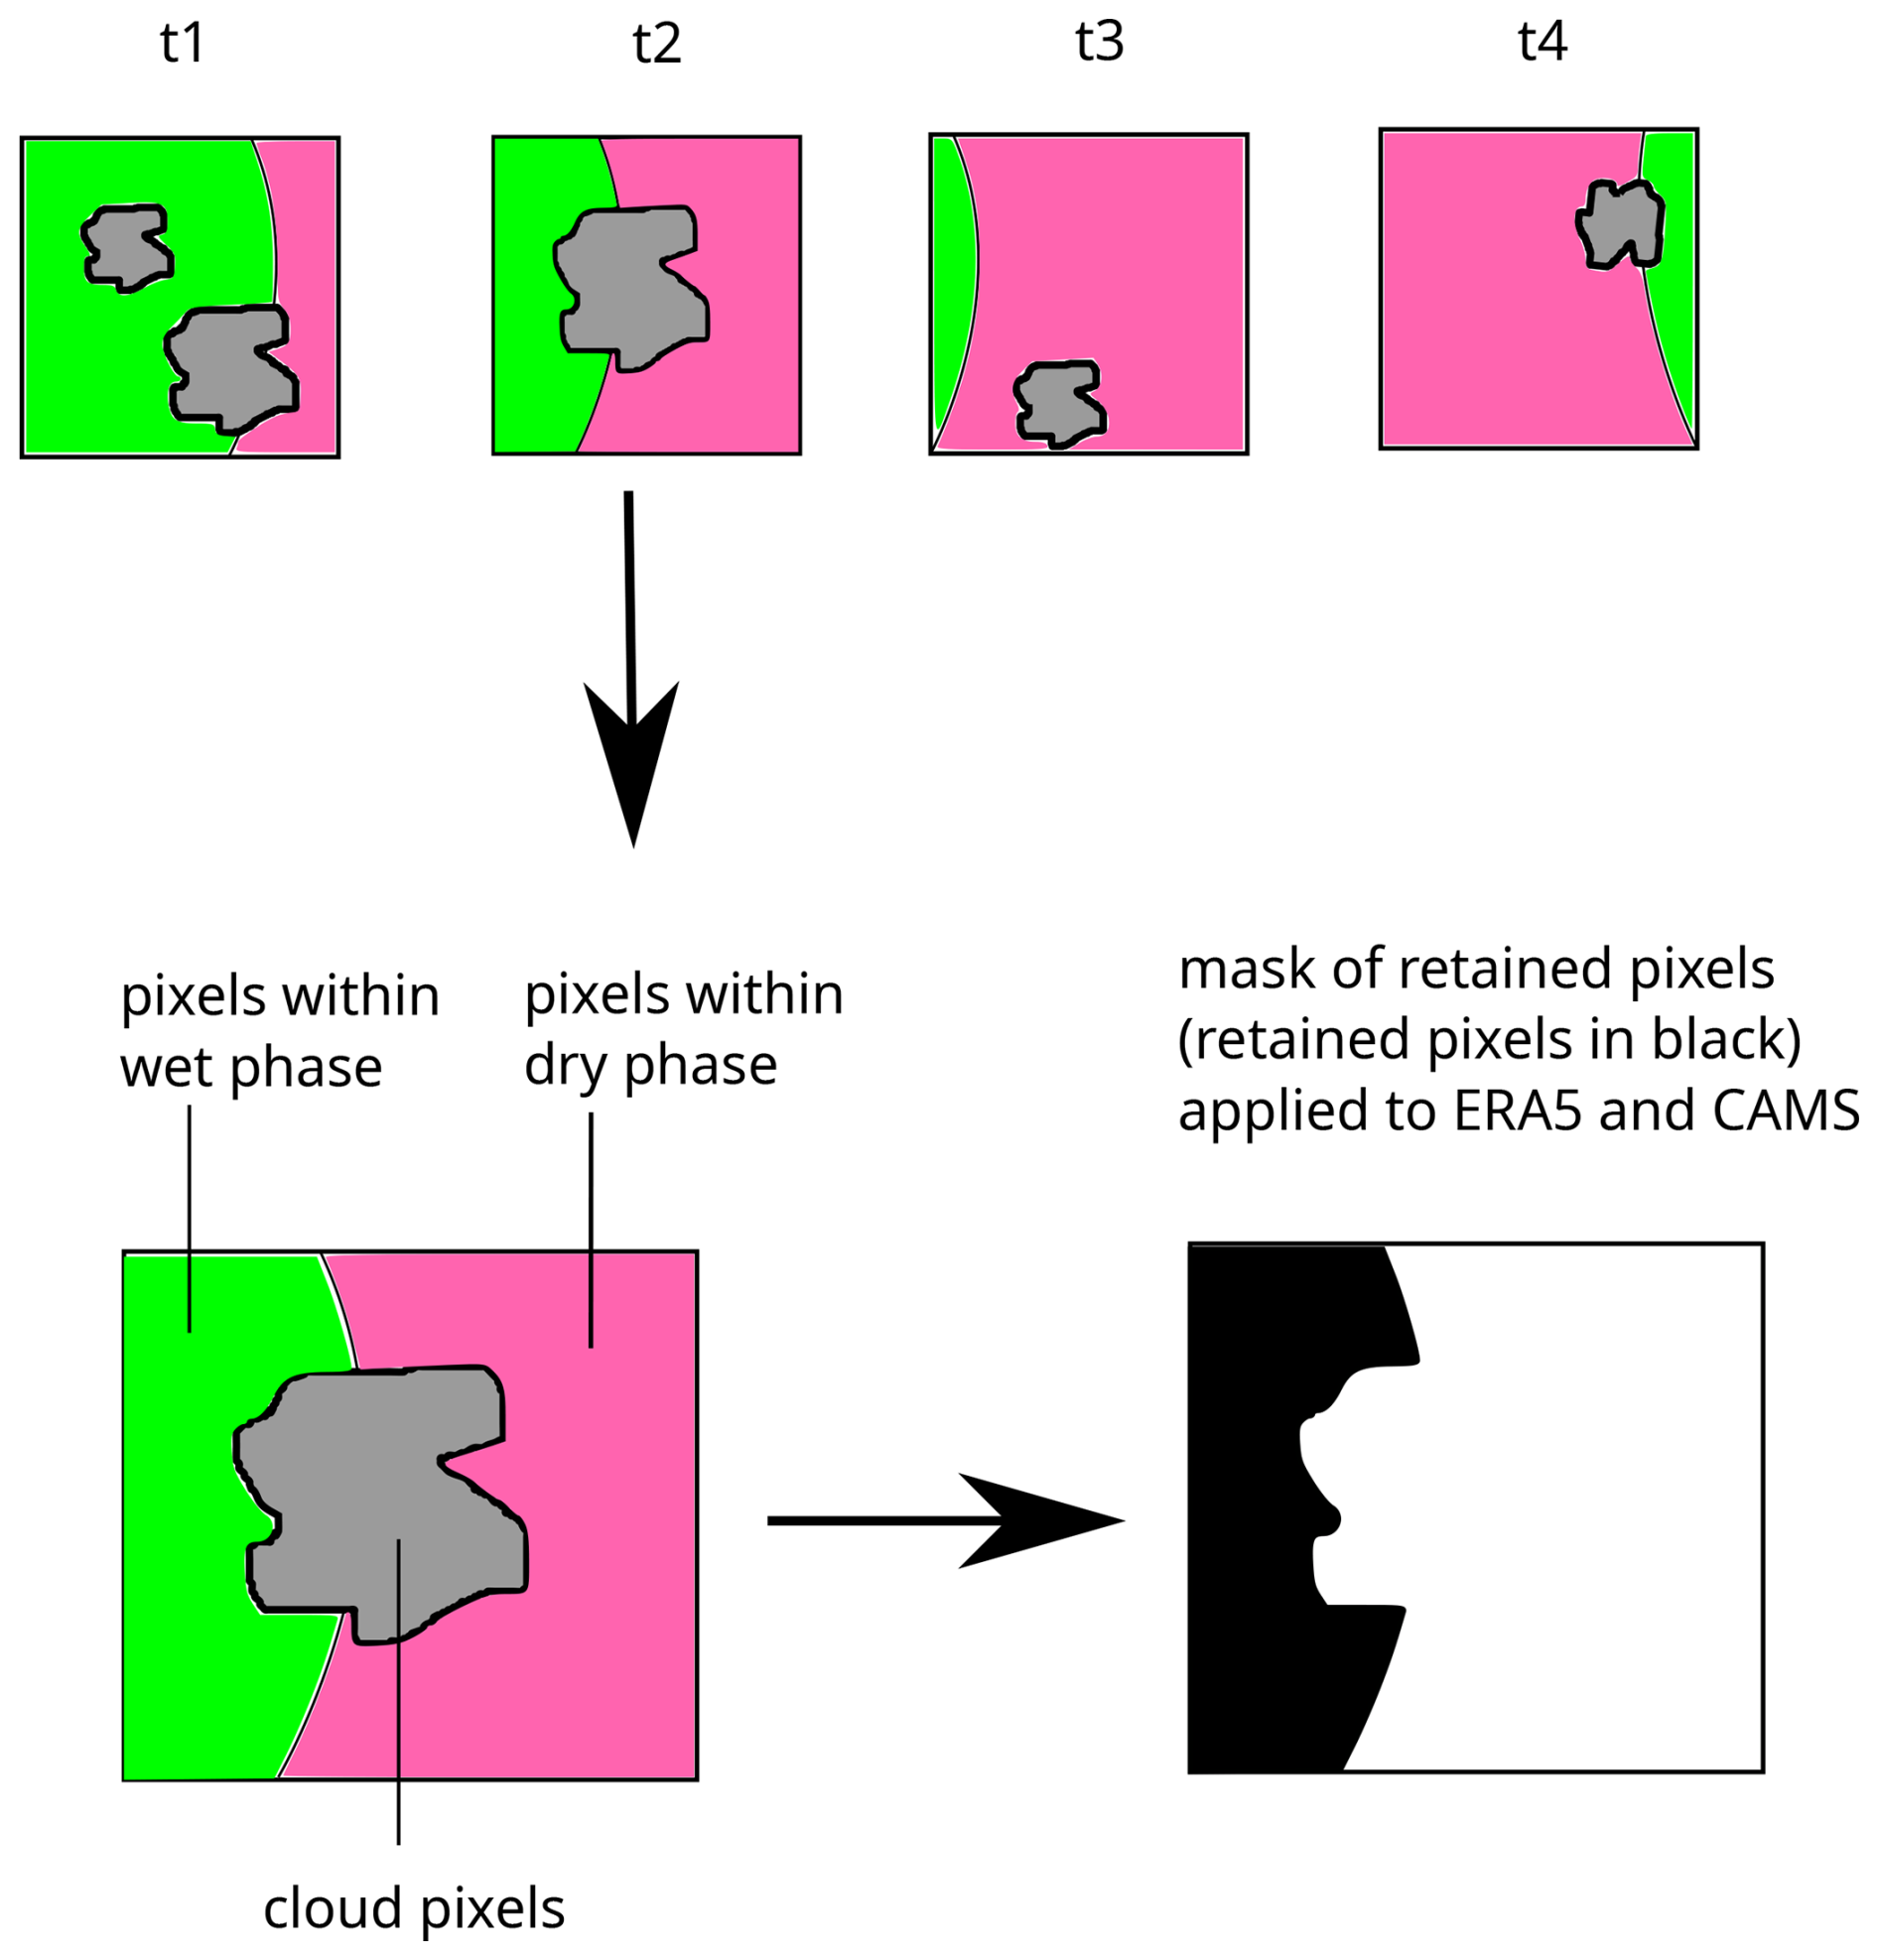
Figure A1Schematic for the IASI composite method: compositing for the humid phase (in green). The phase of the wave signal is computed for each pixel. Then, for each time step, cloud pixels (in gray) and pixels in a dry phase (in pink) are masked out. All retained pixels are then averaged for both IASI and ERA data (re-interpolated on the IASI grid) to create the composites.
To compare observations with reanalysis products, the exact protocol for computing composites presented in the article is applied. For ERA5 data, a linear interpolation is computed from the four closest grid points to the radiosonde or dropsonde launch location. For CAMS, the data are regridded on the IASI grid and the same mask as for IASI data is applied. The comparisons are shown in Fig. B1 for MRG-TD2. The composites for ERA5 and soundings show very good agreement. As for the vertical distribution of dust, CAMS seem to underestimate the altitude of the SAL. This may be due to the absence of assimilation in the vertical distribution of aerosols.
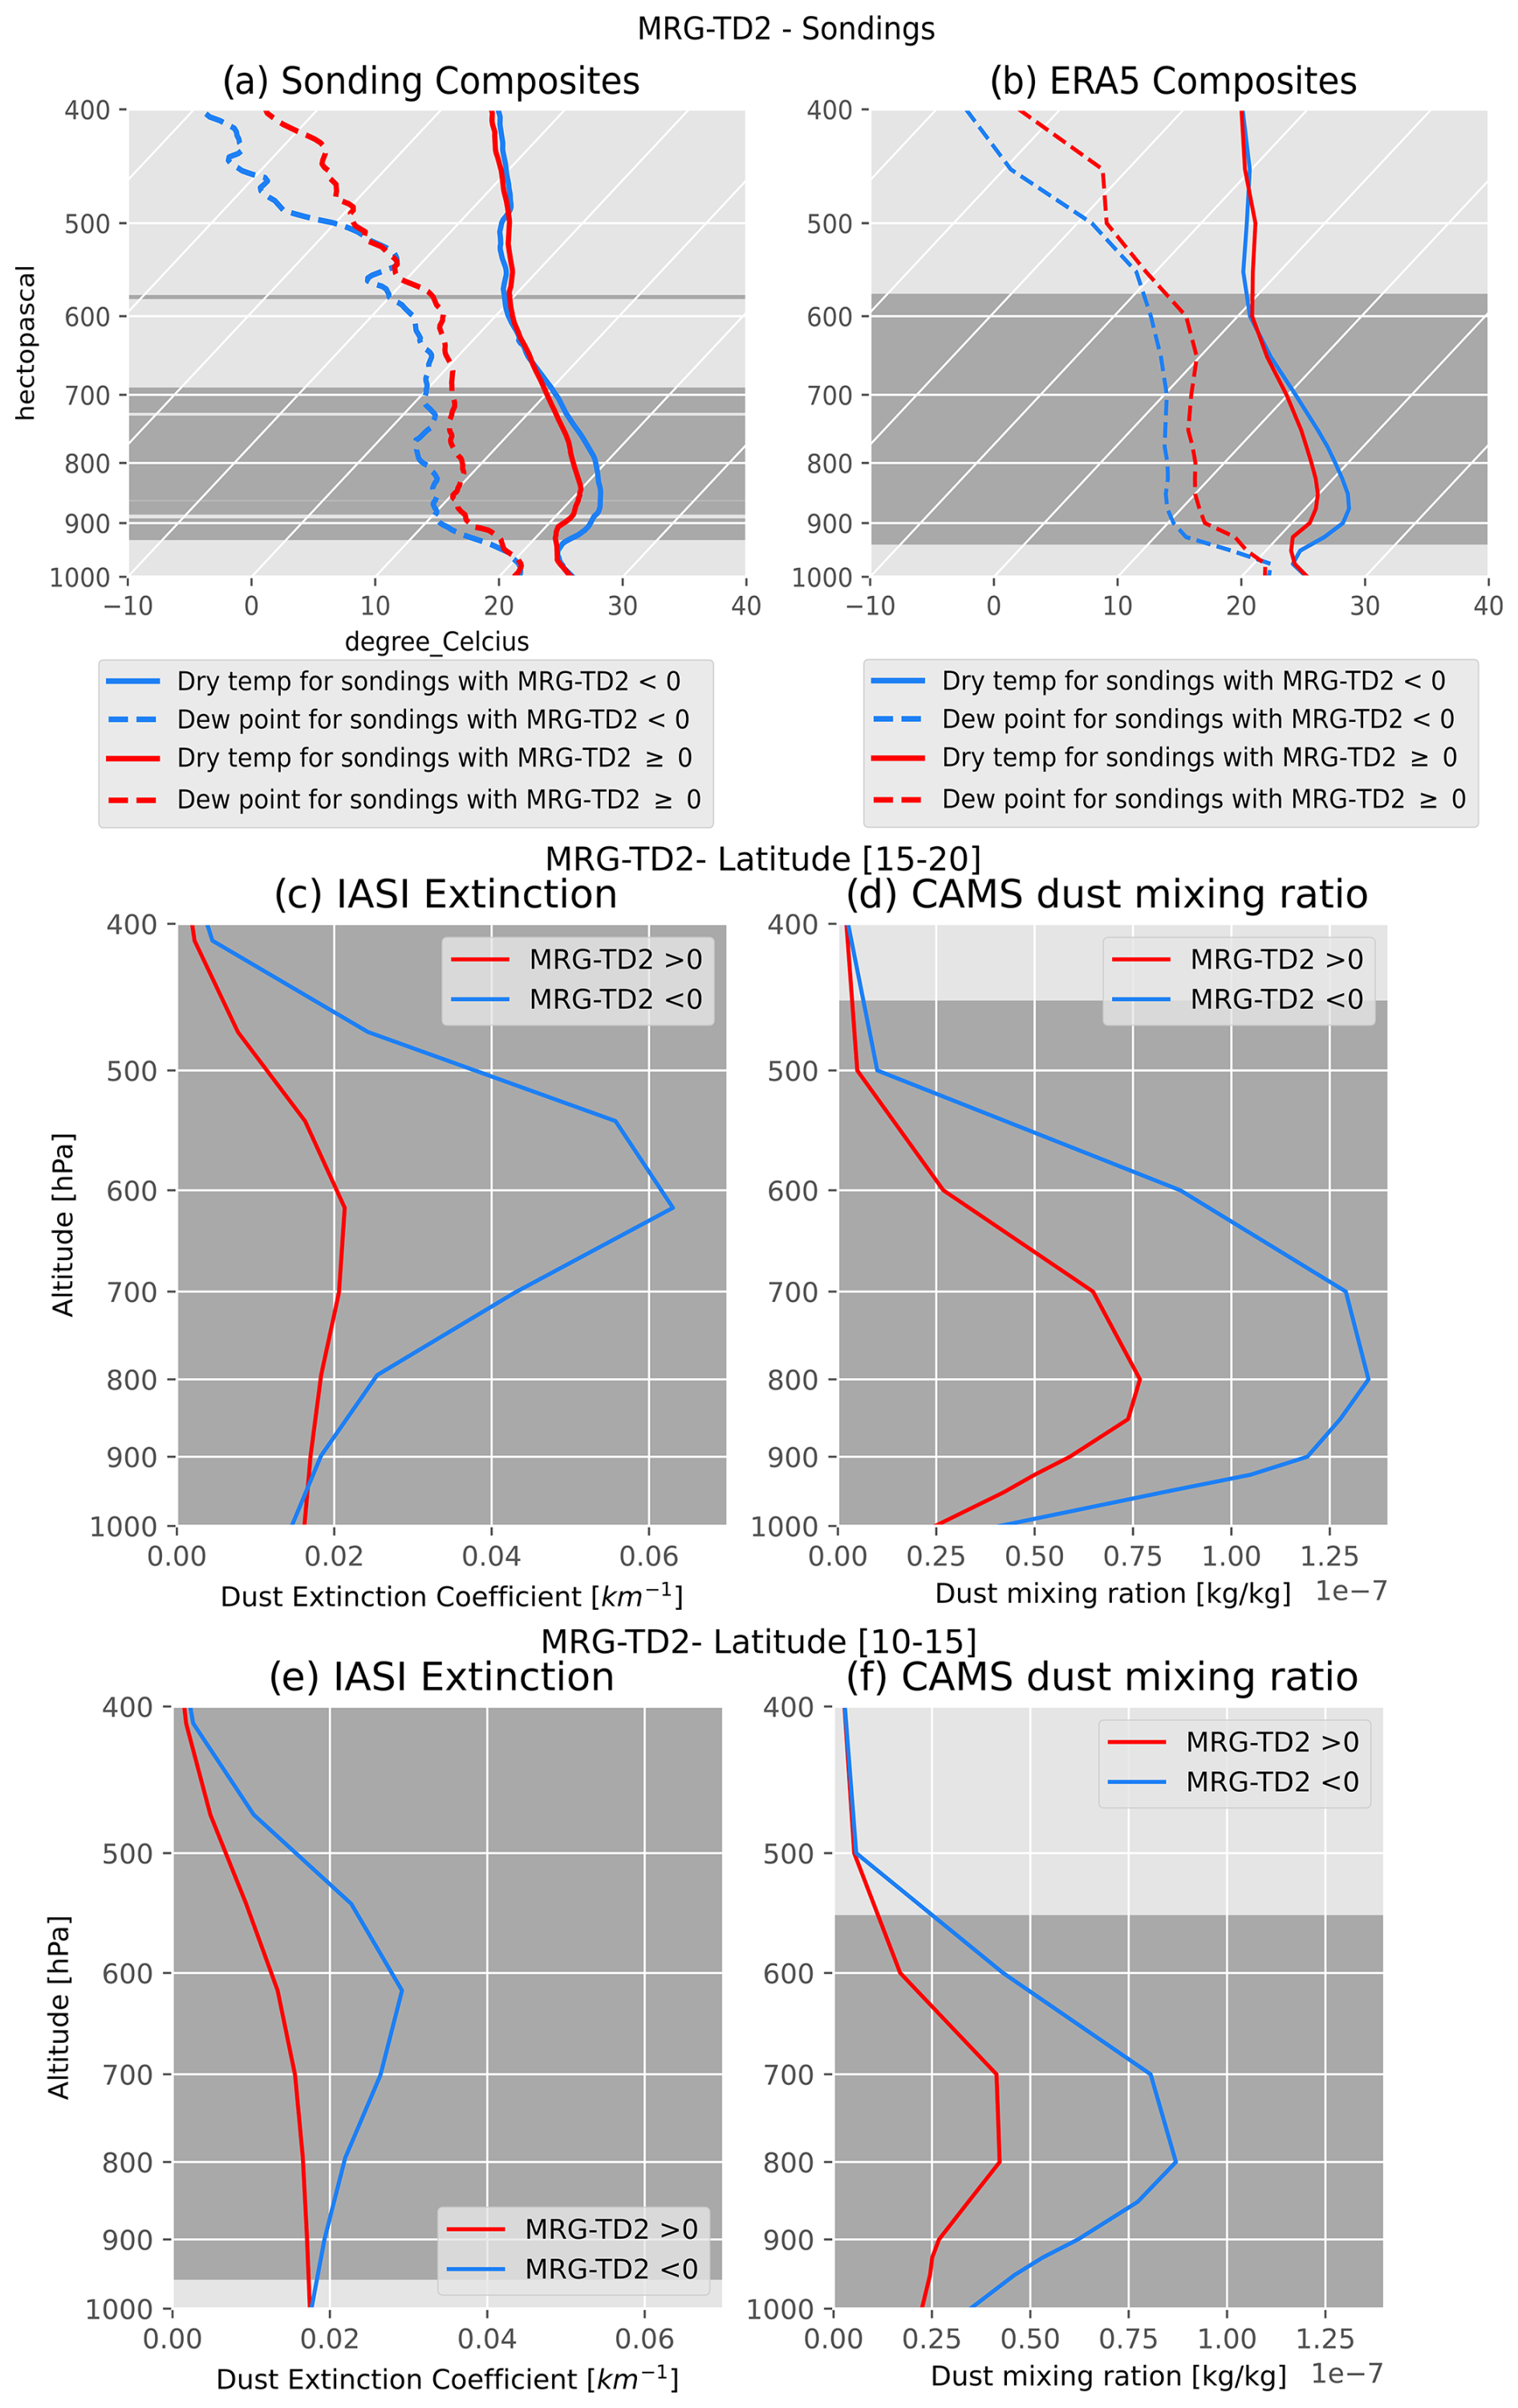
Figure B1Blue lines: dry phase. Red lines: humid phase. (a) Skew-T composite of soundings for the humid and dry phases of MRG-TD2 wave. (b) Skew-T composite of ERA5 data interpolated on the same date and location as the soundings. For (a) and (b) dashed lines show the dew point and solid lines the dry temperature. (c) AEROIASI vertical dust extinction composite for the humid and dry phases of ER waves in the IASI North Zone. (d) Same as (c) but for CAMS dust mixing ratio. (e) Same as (c) but for the IASI South Zone. (f) Same as (d) but for the IASI South Zone. The gray zones show where a significant gap in the two profiles is found, according to a Welch's t test (95 % confidence level). Number of soundings in a dry (humid) phase: 45 (32). Number of days in the IASI North Zone in a dry (humid) phase: 19 (20). Number of days in the IASI South Zone in a dry (humid) phase: 17 (14).
Data and code are available on request from the authors.
CF planned the campaign, acquired the funding, and administrated the project. CF, CL, PK, and AF were responsible for the supervision of this research. TJ, MB, JC, OB, PB, and CL carried out the measurements and prepared the data. TJ and MB developed the methodology and analyzed the data. CF and CL validated the methodology and results. The original draft was prepared by TJ, MB, and CF.
The contact author has declared that none of the authors has any competing interests.
Publisher’s note: Copernicus Publications remains neutral with regard to jurisdictional claims made in the text, published maps, institutional affiliations, or any other geographical representation in this paper. While Copernicus Publications makes every effort to include appropriate place names, the final responsibility lies with the authors.
This article is part of the special issue “The Joint Aeolus Tropical Atlantic Campaign (JATAC) (AMT/ACP inter-journal SI)”. It is not associated with a conference.
Airborne data were obtained using the aircraft managed by Safire, the French facility for airborne research, an infrastructure of the Centre National de la Recherche Scientifique (CNRS), the Centre National d'Etudes Spatiales (CNES), and Météo-France. The airborne component of CADDIWA was supported by the national program LEFE of CNRS-INSU, CNES, the European Space Agency (ESA), and the Institut Pierre-Simon Laplace (IPSL). The AEROIASI products have been developed thanks to the support of CNES and the Programme National de Télédétection Spatiale (PNTS) of CNRS-INSU. We acknowledge the data center AERIS (https://www.aeris-data.fr, last access: 31 March 2024) for providing the level 1 data from IASI (originally supplied by EUMETSAT; http://www.eumetsat.int, last access: 31 March 2024). Meteorological reanalyses produced by ECMWF are supplied by CLIMSERV (http://climserv.ipsl.polytechnique.fr, last access: 31 March 2024). Tanguy Jonville acknowledges the French Ministry for the Environmental Transition (MTECT) for the funding of his PhD. The authors thank anonymous reviewers for their comments and suggestions that have greatly improved the paper.
This study was supported by funding from the Centre National d'Etudes Spatiales (CNES), the European Space Agency (ESA, RFP/3-16595/20/NL/FF/ab), the National program LEFE of the Institut des Sciences de l'Univers (INSU) of the Centre National de la Recherche Scientifique (CNRS), the Institut Pierre-Simon Laplace (IPSL), Météo-France, and the Ministère de la Transition Ecologique et de la Cohésion des Territoires (MTECT).
This paper was edited by Peter Haynes and reviewed by three anonymous referees.
Agudelo, P. A., Hoyos, C. D., Curry, J. A., and Webster, P. J.: Probabilistic Discrimination between Large-Scale Environments of Intensifying and Decaying African Easterly Waves, Clim. Dynam., 36, 1379–1401, https://doi.org/10.1007/s00382-010-0851-x, 2011. a
Bock, O., Bosser, P., Flamant, C., Doerflinger, E., Jansen, F., Fages, R., Bony, S., and Schnitt, S.: Integrated water vapour observations in the Caribbean arc from a network of ground-based GNSS receivers during EUREC4A, Earth Syst. Sci. Data, 13, 2407–2436, https://doi.org/10.5194/essd-13-2407-2021, 2021. a, b
Borne, M., Knippertz, P., Weissmann, M., Witschas, B., Flamant, C., Rios-Berrios, R., and Veals, P.: Validation of Aeolus L2B products over the tropical Atlantic using radiosondes, Atmos. Meas. Tech., 17, 561–581, https://doi.org/10.5194/amt-17-561-2024, 2024. a
Bosser, P., Bock, O., Flamant, C., Bony, S., and Speich, S.: Integrated water vapour content retrievals from ship-borne GNSS receivers during EUREC4A, Earth Syst. Sci. Data, 13, 1499–1517, https://doi.org/10.5194/essd-13-1499-2021, 2021. a
Brammer, A. and Thorncroft, C. D.: Variability and Evolution of African Easterly Wave Structures and Their Relationship with Tropical Cyclogenesis over the Eastern Atlantic, Mon. Weather Rev., 143, 4975–4995, https://doi.org/10.1175/MWR-D-15-0106.1, 2015. a
Chaboureau, J.-P., Flamant, C., Dauhut, T., Kocha, C., Lafore, J.-P., Lavaysse, C., Marnas, F., Mokhtari, M., Pelon, J., Reinares Martínez, I., Schepanski, K., and Tulet, P.: Fennec dust forecast intercomparison over the Sahara in June 2011, Atmos. Chem. Phys., 16, 6977–6995, https://doi.org/10.5194/acp-16-6977-2016, 2016. a
Chen, T.-C.: Characteristics of African Easterly Waves Depicted by ECMWF Reanalyses for 1991–2000, Mon. Weather Rev., 134, 3539–3566, https://doi.org/10.1175/MWR3259.1, 2006. a, b, c
Chen, T.-C., Wang, S.-Y., and Clark, A. J.: North Atlantic Hurricanes Contributed by African Easterly Waves North and South of the African Easterly Jet, J. Climate, 21, 6767–6776, https://doi.org/10.1175/2008JCLI2523.1, 2008. a
Cheng, Y.-M., Thorncroft, C. D., and Kiladis, G. N.: Two Contrasting African Easterly Wave Behaviors, J. Atmos. Sci., 76, 1753–1768, https://doi.org/10.1175/JAS-D-18-0300.1, 2019. a
Clerbaux, C., Boynard, A., Clarisse, L., George, M., Hadji-Lazaro, J., Herbin, H., Hurtmans, D., Pommier, M., Razavi, A., Turquety, S., Wespes, C., and Coheur, P.-F.: Monitoring of atmospheric composition using the thermal infrared IASI/MetOp sounder, Atmos. Chem. Phys., 9, 6041–6054, https://doi.org/10.5194/acp-9-6041-2009, 2009. a
Cornforth, R. J., Hoskins, B. J., and Thorncroft, C. D.: The Impact of Moist Processes on the African Easterly Jet–African Easterly Wave System, Q. J. Roy. Meteor. Soc., 135, 894–913, https://doi.org/10.1002/qj.414, 2009. a
Cuesta, J., Eremenko, M., Flamant, C., Dufour, G., Laurent, B., Bergametti, G., Höpfner, M., Orphal, J., and Zhou, D.: Three-Dimensional Distribution of a Major Desert Dust Outbreak over East Asia in March 2008 Derived from IASI Satellite Observations, J. Geophys. Res.-Atmos., 120, 7099–7127, https://doi.org/10.1002/2014JD022406, 2015. a, b
Cuesta, J., Flamant, C., Gaetani, M., Knippertz, P., Fink, A. H., Chazette, P., Eremenko, M., Dufour, G., Biagio, C. D., and Formenti, P.: Three-Dimensional Pathways of Dust over the Sahara during Summer 2011 as Revealed by New Infrared Atmospheric Sounding Interferometer Observations, Q. J. Roy. Meteor. Soc., 146, 2731–2755, https://doi.org/10.1002/qj.3814, 2020. a, b, c
Duvel, J. P.: Convection over Tropical Africa and the Atlantic Ocean during Northern Summer. Part II: Modulation by Easterly Waves, Mon. Weather Rev., 118, 1855–1868, https://doi.org/10.1175/1520-0493(1990)118<1855:COTAAT>2.0.CO;2, 1990. a, b
Duvel, J.-P.: On Vortices Initiated over West Africa and Their Impact on North Atlantic Tropical Cyclones, Mon. Weather Rev., 149, 585–601, https://doi.org/10.1175/MWR-D-20-0252.1, 2021. a
Evan, A. T., Dunion, J., Foley, J. A., Heidinger, A. K., and Velden, C. S.: New Evidence for a Relationship between Atlantic Tropical Cyclone Activity and African Dust Outbreaks, Geophys. Res. Lett., 33, 4332, https://doi.org/10.1029/2006GL026408, 2006. a
Fan, J., Wang, Y., Rosenfeld, D., and Liu, X.: Review of Aerosol–Cloud Interactions: Mechanisms, Significance, and Challenges, J. Atmos. Sci., 73, 4221–4252, https://doi.org/10.1175/JAS-D-16-0037.1, 2016. a, b
Fink, A. H. and Reiner, A.: Spatiotemporal Variability of the Relation between African Easterly Waves and West African Squall Lines in 1998 and 1999, J. Geophys. Res.-Atmos., 108, L19813, https://doi.org/10.1029/2002JD002816, 2003. a
Flamant, C., Chaboureau, J.-P., Delanoë, J., Gaetani, M., Jamet, C., Lavaysse, C., Bock, O., Borne, M., Cazenave, Q., Coutris, P., Cuesta, J., Menut, L., Aubry, C., Benedetti, A., Bosser, P., Bounissou, S., Caudoux, C., Collomb, H., Donal, T., Febvre, G., Fehr, T., Fink, A. H., Formenti, P., Gomes Araujo, N., Knippertz, P., Lecuyer, E., Neves Andrade, M., Gacial Ngoungué Langué, C., Jonville, T., Schwarzenboeck, A., and Takeishi, A.: Cyclogenesis in the Tropical Atlantic: First Scientific Highlights from the Clouds-Atmospheric Dynamics-Dust Interactions in West Africa (CADDIWA) Field Campaign, B. Am. Meteorol. Soc., 105, E387–E417, https://doi.org/10.1175/BAMS-D-23-0230.1, 2024. a, b, c
Flemming, J., Benedetti, A., Inness, A., Engelen, R. J., Jones, L., Huijnen, V., Remy, S., Parrington, M., Suttie, M., Bozzo, A., Peuch, V.-H., Akritidis, D., and Katragkou, E.: The CAMS interim Reanalysis of Carbon Monoxide, Ozone and Aerosol for 2003–2015, Atmos. Chem. Phys., 17, 1945–1983, https://doi.org/10.5194/acp-17-1945-2017, 2017. a
Frank, W. M. and Roundy, P. E.: The Role of Tropical Waves in Tropical Cyclogenesis, Mon. Weather Rev., 134, 2397–2417, https://doi.org/10.1175/MWR3204.1, 2006. a, b
Grogan, D. F. and Thorncroft, C. D.: The Characteristics of African Easterly Waves Coupled to Saharan Mineral Dust Aerosols, Q. J. Roy. Meteor. Soc., 145, 1130–1146, https://doi.org/10.1002/qj.3483, 2019. a, b
Grogan, D. F. P., Nathan, T. R., and Chen, S.-H.: Effects of Saharan Dust on the Linear Dynamics of African Easterly Waves, J. Atmos. Sci., 73, 891–911, https://doi.org/10.1175/JAS-D-15-0143.1, 2016. a
Grogan, D. F. P., Nathan, T. R., and Chen, S.-H.: Structural Changes in the African Easterly Jet and Its Role in Mediating the Effects of Saharan Dust on the Linear Dynamics of African Easterly Waves, J. Atmos. Sci., 76, 3351–3365, https://doi.org/10.1175/JAS-D-19-0104.1, 2019. a
Hankes, I., Wang, Z., Zhang, G., and Fritz, C.: Merger of African Easterly Waves and Formation of Cape Verde Storms, Q. J. Roy. Meteor. Soc., 141, 1306–1319, https://doi.org/10.1002/qj.2439, 2015. a, b, c
Hersbach, H., Bell, B., Berrisford, P., Hirahara, S., Horányi, A., Muñoz-Sabater, J., Nicolas, J., Peubey, C., Radu, R., Schepers, D., Simmons, A., Soci, C., Abdalla, S., Abellan, X., Balsamo, G., Bechtold, P., Biavati, G., Bidlot, J., Bonavita, M., Chiara, G. D., Dahlgren, P., Dee, D., Diamantakis, M., Dragani, R., Flemming, J., Forbes, R., Fuentes, M., Geer, A., Haimberger, L., Healy, S., Hogan, R. J., Hólm, E., Janisková, M., Keeley, S., Laloyaux, P., Lopez, P., Lupu, C., Radnoti, G., de Rosnay, P., Rozum, I., Vamborg, F., Villaume, S., and Thépaut, J.-N.: The ERA5 Global Reanalysis, Q. J. Roy. Meteor. Soc., 146, 1999–2049, https://doi.org/10.1002/qj.3803, 2020. a
Hilton, F., Armante, R., August, T., Barnet, C., Bouchard, A., Camy-Peyret, C., Capelle, V., Clarisse, L., Clerbaux, C., Coheur, P.-F., Collard, A., Crevoisier, C., Dufour, G., Edwards, D., Faijan, F., Fourrié, N., Gambacorta, A., Goldberg, M., Guidard, V., Hurtmans, D., Illingworth, S., Jacquinet-Husson, N., Kerzenmacher, T., Klaes, D., Lavanant, L., Masiello, G., Matricardi, M., McNally, A., Newman, S., Pavelin, E., Payan, S., Péquignot, E., Peyridieu, S., Phulpin, T., Remedios, J., Schlüssel, P., Serio, C., Strow, L., Stubenrauch, C., Taylor, J., Tobin, D., Wolf, W., and Zhou, D.: Hyperspectral Earth Observation from IASI: Five Years of Accomplishments, B. Am. Meteorol. Soc., 93, 347–370, https://doi.org/10.1175/BAMS-D-11-00027.1, 2012. a
Inness, A., Ades, M., Agustí-Panareda, A., Barré, J., Benedictow, A., Blechschmidt, A.-M., Dominguez, J. J., Engelen, R., Eskes, H., Flemming, J., Huijnen, V., Jones, L., Kipling, Z., Massart, S., Parrington, M., Peuch, V.-H., Razinger, M., Remy, S., Schulz, M., and Suttie, M.: The CAMS reanalysis of atmospheric composition, Atmos. Chem. Phys., 19, 3515–3556, https://doi.org/10.5194/acp-19-3515-2019, 2019. a
Janicot, S., Mounier, F., Gervois, S., Sultan, B., and Kiladis, G. N.: The Dynamics of the West African Monsoon. Part V: The Detection and Role of the Dominant Modes of Convectively Coupled Equatorial Rossby Waves, J. Climate, 23, 4005–4024, https://doi.org/10.1175/2010JCLI3221.1, 2010. a, b
Janiga, M. A. and Thorncroft, C. D.: Regional Differences in the Kinematic and Thermodynamic Structure of African Easterly Waves, Q. J. Roy. Meteor. Soc., 139, 1598–1614, https://doi.org/10.1002/qj.2047, 2013. a, b
Janiga, M. A., Schreck, C. J., Ridout, J. A., Flatau, M., Barton, N. P., Metzger, E. J., and Reynolds, C. A.: Subseasonal Forecasts of Convectively Coupled Equatorial Waves and the MJO: Activity and Predictive Skill, Mon. Weather Rev., 146, 2337–2360, https://doi.org/10.1175/MWR-D-17-0261.1, 2018. a, b, c, d
Janowiak, J., Joyce, B., and Xie, P.: NCEP/CPC L3 Half Hourly 4 km Global (60° S–60° N) Merged IR V1, edited by: Savtchenko, A., Greenbelt, MD, Goddard Earth Sciences Data and Information Services Center (GES DISC), https://doi.org/10.5067/P4HZB9N27EKU, 2017. a
Jones, C., Mahowald, N., and Luo, C.: Observational Evidence of African Desert Dust Intensification of Easterly Waves, Geophys. Res. Lett., 31, L17208, https://doi.org/10.1029/2004GL020107, 2004. a, b
Jonville, T., Flamant, C., and Lavaysse, C.: Dynamical Study of Three African Easterly Waves in September 2021, Q. J. Roy. Meteor. Soc., 150, 2489–2509, https://doi.org/10.1002/qj.4720, 2024b. a, b, c, d, e, f, g, h, i
Jonville, T., Cornillault, E., Lavaysse, C., Peyrillé, P., and Flamant, C.: Distinguishing north and south African Easterly Waves with a spectral method: Implication for tropical cyclogenesis from mergers in the North Atlantic, Q. J. Roy. Meteorol. Soc., 151, e4909, https://doi.org/10.1002/qj.4909, 2025. a, b, c, d, e, f, g, h, i, j, k
Kamsu-Tamo, P. H., Janicot, S., Monkam, D., and Lenouo, A.: Convection Activity over the Guinean Coast and Central Africa during Northern Spring from Synoptic to Intra-Seasonal Timescales, Clim. Dynam., 43, 3377–3401, https://doi.org/10.1007/s00382-014-2111-y, 2014. a
Kiladis, G. N. and Wheeler, M.: Horizontal and Vertical Structure of Observed Tropospheric Equatorial Rossby Waves, J. Geophys. Res.-Atmos., 100, 22981–22997, https://doi.org/10.1029/95JD02415, 1995. a
Kiladis, G. N., Thorncroft, C. D., and Hall, N. M. J.: Three-Dimensional Structure and Dynamics of African Easterly Waves. Part I: Observations, J. Atmos. Sci., 63, 2212–2230, https://doi.org/10.1175/JAS3741.1, 2006. a, b, c, d
Kiladis, G. N., Wheeler, M. C., Haertel, P. T., Straub, K. H., and Roundy, P. E.: Convectively Coupled Equatorial Waves, Rev. Geophys., 47, RG2003, https://doi.org/10.1029/2008RG000266, 2009. a
Knippertz, P. and Todd, M. C.: The Central West Saharan Dust Hot Spot and Its Relation to African Easterly Waves and Extratropical Disturbances, J. Geophys. Res.-Atmos., 115, D12117, https://doi.org/10.1029/2009JD012819, 2010. a
Knippertz, P., Gehne, M., Kiladis, G. N., Kikuchi, K., Rasheeda Satheesh, A., Roundy, P. E., Yang, G.-Y., Žagar, N., Dias, J., Fink, A. H., Methven, J., Schlueter, A., Sielmann, F., and Wheeler, M. C.: The Intricacies of Identifying Equatorial Waves, Q. J. Roy. Meteor. Soc., 148, 2814–2852, https://doi.org/10.1002/qj.4338, 2022. a
Lafore, J.-P., Beucher, F., Peyrillé, P., Diongue-Niang, A., Chapelon, N., Bouniol, D., Caniaux, G., Favot, F., Ferry, F., Guichard, F., Poan, E., Roehrig, R., and Vischel, T.: A Multi-Scale Analysis of the Extreme Rain Event of Ouagadougou in 2009, Q. J. Roy. Meteor. Soc., 143, 3094–3109, https://doi.org/10.1002/qj.3165, 2017. a, b
Laing, A. G., Carbone, R. E., and Levizzani, V.: Cycles and Propagation of Deep Convection over Equatorial Africa, Mon. Weather Rev., 139, 2832–2853, https://doi.org/10.1175/2011MWR3500.1, 2011. a
Lawton, Q. A. and Majumdar, S. J.: Convectively Coupled Kelvin Waves and Tropical Cyclogenesis: Connections through Convection and Moisture, Mon. Weather Rev., 151, 1647–1666, https://doi.org/10.1175/MWR-D-23-0005.1, 2023. a, b, c, d, e
Lubis, S. W. and Jacobi, C.: The Modulating Influence of Convectively Coupled Equatorial Waves (CCEWs) on the Variability of Tropical Precipitation, Int. J. Climatol., 35, 1465–1483, https://doi.org/10.1002/joc.4069, 2015. a, b, c, d, e, f
Matsuno, T.: Quasi-Geostrophic Motions in the Equatorial Area, J. Meteor. Soc. Jpn. Ser. II, 44, 25–43, https://doi.org/10.2151/jmsj1965.44.1_25, 1966. a, b, c, d, e, f, g, h
Mekonnen, A., Thorncroft, C. D., and Aiyyer, A. R.: Analysis of Convection and Its Association with African Easterly Waves, J. Climate, 19, 5405–5421, https://doi.org/10.1175/JCLI3920.1, 2006. a
Nathan, T. R. and Grogan, D. F. P.: Scale-Dependent Transport of Saharan Dust by African Easterly Waves, Geosciences, 12, 337, https://doi.org/10.3390/geosciences12090337, 2022. a
Nguyen, H. and Duvel, J.-P.: Synoptic Wave Perturbations and Convective Systems over Equatorial Africa, J. Climate, 21, 6372–6388, https://doi.org/10.1175/2008JCLI2409.1, 2008. a
Peyrillé, P., Roehrig, R., and Sanogo, S.: Tropical Waves Are Key Drivers of Extreme Precipitation Events in the Central Sahel, Geophys. Res. Lett., 50, e2023GL103715, https://doi.org/10.1029/2023GL103715, 2023. a
Pytharoulis, I. and Thorncroft, C.: The Low-Level Structure of African Easterly Waves in 1995, Mon. Weather Rev., 127, 2266–2280, https://doi.org/10.1175/1520-0493(1999)127<2266:TLLSOA>2.0.CO;2, 1999. a, b, c
Roundy, P. E. and Frank, W. M.: A Climatology of Waves in the Equatorial Region, J. Atmos. Sci., 61, 2105–2132, https://doi.org/10.1175/1520-0469(2004)061<2105:ACOWIT>2.0.CO;2, 2004. a
Saleeby, S. M., Herbener, S. R., van den Heever, S. C., and L'Ecuyer, T.: Impacts of Cloud Droplet–Nucleating Aerosols on Shallow Tropical Convection, J. Atmos. Sci., 72, 1369–1385, https://doi.org/10.1175/JAS-D-14-0153.1, 2015. a
Schlueter, A., Fink, A. H., and Knippertz, P.: A Systematic Comparison of Tropical Waves over Northern Africa. Part II: Dynamics and Thermodynamics, J. Climate, 32, 2605–2625, https://doi.org/10.1175/JCLI-D-18-0651.1, 2019a. a, b, c, d
Schlueter, A., Fink, A. H., Knippertz, P., and Vogel, P.: A Systematic Comparison of Tropical Waves over Northern Africa. Part I: Influence on Rainfall, J. Climate, 32, 1501–1523, https://doi.org/10.1175/JCLI-D-18-0173.1, 2019b. a, b, c, d
Schreck, C. J., Molinari, J., and Aiyyer, A.: A Global View of Equatorial Waves and Tropical Cyclogenesis, Mon. Weather Rev., 140, 774–788, https://doi.org/10.1175/MWR-D-11-00110.1, 2012. a
Shu, S. and Wu, L.: Analysis of the Influence of Saharan Air Layer on Tropical Cyclone Intensity Using AIRS/Aqua Data, Geophys. Res. Lett., 36, L09809, https://doi.org/10.1029/2009GL037634, 2009. a
Sinclaire, Z., Lenouo, A., Tchawoua, C., and Janicot, S.: Synoptic Kelvin Type Perturbation Waves over Congo Basin over the Period 1979–2010, J. Atmos. Sol.-Terr. Phys., 130–131, 43–56, https://doi.org/10.1016/j.jastp.2015.04.015, 2015. a
Stoffelen, A., Benedetti, A., Borde, R., Dabas, A., Flamant, P., Forsythe, M., Hardesty, M., Isaksen, L., Källén, E., Körnich, H., Lee, T., Reitebuch, O., Rennie, M., Riishøjgaard, L.-P., Schyberg, H., Straume, A. G., and Vaughan, M.: Wind Profile Satellite Observation Requirements and Capabilities, B. Am. Meteorol. Soc., 101, E2005–E2021, https://doi.org/10.1175/BAMS-D-18-0202.1, 2020. a
Takayabu, Y. N. and Nitta, T.: 3-5 Day-Period Disturbances Coupled with Convection over the Tropical Pacific Ocean, J. Meteor. Soc. Jpn. Ser. II, 71, 221–246, https://doi.org/10.2151/jmsj1965.71.2_221, 1993. a
Thorncroft, C. D.: An Idealized Study of African Easterly Waves. III: More Realistic Basic States, Q. J. Roy. Meteor. Soc., 121, 1589–1614, https://doi.org/10.1002/qj.49712152706, 1995. a
Tulich, S. N. and Kiladis, G. N.: Squall Lines and Convectively Coupled Gravity Waves in the Tropics: Why Do Most Cloud Systems Propagate Westward?, J. Atmos. Sci., 69, 2995–3012, https://doi.org/10.1175/JAS-D-11-0297.1, 2012. a
Tulich, S. N., Kiladis, G. N., and Suzuki-Parker, A.: Convectively Coupled Kelvin and Easterly Waves in a Regional Climate Simulation of the Tropics, Clim. Dynam., 36, 185–203, https://doi.org/10.1007/s00382-009-0697-2, 2011. a
Ventrice, M. J. and Thorncroft, C. D.: The Role of Convectively Coupled Atmospheric Kelvin Waves on African Easterly Wave Activity, Mon. Weather Rev., 141, 1910–1924, https://doi.org/10.1175/MWR-D-12-00147.1, 2013. a, b
Ventrice, M. J., Thorncroft, C. D., and Janiga, M. A.: Atlantic Tropical Cyclogenesis: A Three-Way Interaction between an African Easterly Wave, Diurnally Varying Convection, and a Convectively Coupled Atmospheric Kelvin Wave, Mon. Weather Rev., 140, 1108–1124, https://doi.org/10.1175/MWR-D-11-00122.1, 2012a. a, b
Ventrice, M. J., Thorncroft, C. D., and Schreck, C. J.: Impacts of Convectively Coupled Kelvin Waves on Environmental Conditions for Atlantic Tropical Cyclogenesis, Mon. Weather Rev., 140, 2198–2214, https://doi.org/10.1175/MWR-D-11-00305.1, 2012b. a, b, c
Welch, B. L.: The Generalization of “Student's” Problem When Several Different Population Variances Are Involved, Biometrika, 34, 28–35, https://doi.org/10.1093/biomet/34.1-2.28, 1947. a
Wheeler, M. and Kiladis, G. N.: Convectively Coupled Equatorial Waves: Analysis of Clouds and Temperature in the Wavenumber–Frequency Domain, J. Atmos. Sci., 56, 374–399, https://doi.org/10.1175/1520-0469(1999)056<0374:CCEWAO>2.0.CO;2, 1999. a, b, c, d, e, f
Wheeler, M., Kiladis, G. N., and Webster, P. J.: Large-Scale Dynamical Fields Associated with Convectively Coupled Equatorial Waves, J. Atmos. Sci., 57, 613–640, https://doi.org/10.1175/1520-0469(2000)057<0613:LSDFAW>2.0.CO;2, 2000. a
Witschas, B., Lemmerz, C., Geiß, A., Lux, O., Marksteiner, U., Rahm, S., Reitebuch, O., Schäfler, A., and Weiler, F.: Validation of the Aeolus L2B wind product with airborne wind lidar measurements in the polar North Atlantic region and in the tropics, Atmos. Meas. Tech., 15, 7049–7070, https://doi.org/10.5194/amt-15-7049-2022, 2022. a
Zhou, X. and Wang, B.: Transition from an Eastern Pacific Upper-Level Mixed Rossby-gravity Wave to a Western Pacific Tropical Cyclone, Geophys. Res. Lett., 34, L24801, https://doi.org/10.1029/2007GL031831, 2007. a
- Abstract
- Introduction
- Data and method
- Horizontal structure
- Impact on dust and total column water vapor
- Impact on the vertical structure of the atmosphere and vertical dust distribution in September 2021
- Impact of tropical waves on cyclogenesis and dust outburst in September 2021
- Conclusions
- Appendix A: Method for IASI composites
- Appendix B: Comparison between observations and reanalysis
- Code and data availability
- Author contributions
- Competing interests
- Disclaimer
- Special issue statement
- Acknowledgements
- Financial support
- Review statement
- References