the Creative Commons Attribution 4.0 License.
the Creative Commons Attribution 4.0 License.
 | 26 Aug 2025
Aerosol impacts on isolated deep convection: findings from TRACER
Roni Kobrosly
Tao Zhang
Tamanna Subba
Susan van den Heever
Siddhant Gupta
Michael Jensen
This study focuses on quantifying the conditional relationship between aerosol and convective precipitation properties of isolated deep convective clouds (DCCs) in the Houston–Galveston region, after adjusting for confounding effects. We leverage comprehensive ground-based observations from the TRacking Aerosol Convection interactions ExpeRiment (TRACER) to estimate aerosol effects on convective echo top height (ETH), intensity, and area separately. Our results show that greater aerosol number concentrations generally have a limited impact on these convective properties, showing relationships consistent with the possibility of both invigoration and suppression effects. Under certain conditions, where ultrafine particles are abundant, aerosols exhibit a positive effect on ETH, increasing it by about 1 km. However, it is inevitable to consider measurement uncertainties and the limitations of temporal and spatial resolution in the data, as these factors can further contribute to uncertainties in our estimates. In DCCs associated with sea breezes, the estimated aerosol effects on DCCs are found to be more pronounced. However, this heightened effect could be attributed to the exclusion of key confounders such as boundary layer updrafts in the analysis.
- Article
(5042 KB) - Full-text XML
-
Supplement
(2308 KB) - BibTeX
- EndNote


This paper has been authored by employees of Brookhaven Science Associates, LLC, under contract DE-SC0012704 with the U.S. DOE. The publisher by accepting the paper for publication acknowledges that the U.S. Government retains a nonexclusive, paid-up, irrevocable, worldwide license to publish or reproduce the published form of this paper, or allow others to do so, for U.S. Government purposes.
Deep convective clouds (DCCs) play a crucial role in the Earth's water cycle, as they generate a significant amount of global precipitation (e.g., Tan et al., 2015; Feng et al., 2016), regulate the global energy cycle through latent heat release (e.g., Tao et al., 2010), and participate in vertical mass transport (e.g., Wang et al., 2019; Gupta et al., 2024), thereby driving large-scale atmospheric circulations that impact climate sensitivity (e.g., Sanderson et al., 2008; Del Genio, 2012). Despite their significance for weather and climate, accurately simulating DCCs in state-of-the-art numerical models remains challenging (e.g., Wang et al., 2020a, 2022b; Prein et al., 2021). Even fundamental convective characteristics such as updraft strength, cloud-top height, anvil mass detrainment, and the variations of these attributes over the diurnal cycle are difficult to simulate (e.g., Moncrieff, 2010; Bony et al., 2016). While field campaign data analyses have provided valuable insights into DCC processes (e.g., Polavarapu and Austin, 1979; Dye et al., 2000; Long et al., 2011; Chi et al., 2014; Barth et al., 2015; Jensen et al., 2016; Martin et al., 2017; Geerts et al., 2017; Varble et al., 2021; van den Heever et al., 2021; Jensen et al., 2022; Reid et al., 2023; Kollias et al., 2025), conventional model–observational validations mostly rely on bulk precipitation characteristics and/or sparse cloud dynamics observations from a small set of cases, thus offering only a limited understanding of the processes involved. Furthermore, case studies, by their nature, are confined to specific geographical regions, restricting model assessments to specific environmental forcing conditions (e.g., Prein et al., 2022; Ramos-Valle et al., 2023).
Aerosol–cloud interactions in DCCs, particularly the aerosol effects on convective dynamics, the focus of this study, are among the most complex and challenging processes to simulate accurately. This difficulty was evidenced in a recent model intercomparison project (MIP) conducted by the Deep Convective Cloud Working Group of the Aerosol, Cloud, Precipitation and Climate (ACPC) initiative. This MIP was the first of its kind to assess the range of DCC sensitivity to aerosol loading across a suite of state-of-the-art convective-system-resolving models (van den Heever et al., 2018). Analysis of this suite of simulations conducted by Marinescu et al. (2021) focused on aerosol-induced changes to the terms in the vertical velocity momentum equation under prescribed low and high number concentrations of cloud condensation nuclei (CCN) for a DCC case. This study showed substantial variability among the models in terms of the precipitation amount and updraft velocity and their sensitivity to aerosol loading. The significant differences among the various models highlight an urgent need to resolve the lack of convergence in aerosol–DCC interaction process representations within such high-resolution modeling frameworks.
Numerous studies have aimed to shed light on the complex nature of aerosol–DCC interactions towards improving their representations in the models, sparking the description of several different underlying physical mechanisms (e.g., Andreae et al., 2004; Khain et al., 2005; van den Heever et al., 2006; Rosenfeld et al., 2008; Lebo and Seinfeld, 2011; Li et al., 2011; Fan et al., 2018; Nishant et al., 2019; Grabowski and Morrison, 2020; Abbott and Cronin, 2021). The leading mechanisms include (1) “cold-phase” invigoration, where high aerosol number concentrations, acting as CCN, nucleate more cloud droplets, delaying hydrometeor growth via reduced collision–coalescence, lofting more liquid water above the freezing level, enhancing the total latent heating associated with freezing, increasing the buoyancy of rising convective parcels, and ultimately invigorating convective updrafts (e.g., Khain et al., 2005; van den Heever et al., 2006; Rosenfeld et al., 2008); (2) “warm-phase” invigoration, where high aerosol number concentrations nucleate more cloud droplets and reduce supersaturation with respect to liquid water, increasing latent heat release through additional condensation of water vapor and invigorating convective updrafts (e.g., Lebo, 2018; Fan et al., 2018, 2020); and (3) “humidity entrainment” invigoration, where high aerosol number concentrations increase the environmental humidity by producing clouds that detrain more condensed water into the surrounding air, leading to higher humidity that favors large-scale ascent and stronger convective updrafts (Abbott and Cronin, 2021). This wide range of plausible mechanisms highlights the need for constraining this important problem with current observations. The lack of clear understanding further underscores the need for more robust and high-resolution observational data along with the development of advanced statistical methods and modeling frameworks that can better elucidate the complexity of aerosol–DCC interactions.
Despite a range of hypothetical mechanisms for aerosol–DCC invigoration, recent studies continue to challenge these theories, revealing a spectrum ranging from enervation to invigoration (e.g., Grabowski and Morrison, 2020; Igel and van den Heever, 2021; Dagan, 2022; Romps et al., 2023; Peters et al., 2023). From an observational perspective, this challenge arises, in part, from a lack of key supporting observations of vertical velocity, hydrometeor microphysical properties, and water vapor supersaturation within the convective core regions of DCCs, all of which would assist in providing further clarity on aerosol–DCC interactions. Moreover, the thermodynamic and kinematic regimes under which these interactions may be significant remain unresolved. Quantifying aerosol impacts on DCCs is further complicated because small-scale perturbations in large-scale vertical velocity, relative humidity, and other meteorological factors, such as wind shear and atmospheric instability, can potentially affect DCC intensity in a manner comparable to aerosol-induced changes (e.g., Fan et al., 2009; Storer et al., 2010; Grant and van den Heever, 2015; Lebo, 2018; Dagan et al., 2020; Park and van den Heever, 2022). Disentangling aerosol impacts on DCCs from those driven by meteorological factors is therefore difficult (e.g., Varble et al., 2023).
To accurately assess the relationships between aerosol and DCC properties, a variety of techniques and methods have been developed from both modeling and observational perspectives. On the modeling side, a range of statistical methods and modeling frameworks have been established, including the simple factor separation approach (van den Heever and Cotton, 2007; Grant and van den Heever, 2014), more sophisticated statistical emulators (Lee et al., 2011; Johnson et al., 2015; Wellmann et al., 2018; Park and van den Heever, 2022), and the piggybacking approach (Grabowski, 2015). These techniques have achieved some success in separating aerosol effects from the impacts of other forcing factors on DCC development. Though individual modeling studies have quantified aerosol effects on DCCs, it is important to note that significant disagreement remains between these studies, even on the sign of the effects, largely due to variations in model configurations and the methods used to analyze them (Varble et al., 2023). From the observational side, achieving this separation remains a long-standing challenge. Many observational studies have used multivariable models or machine learning approaches to quantify the relationships between aerosol and DCC interactions (e.g., Li et al., 2011; Storer et al., 2014; Veals et al., 2022; Zang et al., 2023). However, it is important to emphasize that properly selecting and accounting for meteorological covariates or confounders is key to successfully estimating the changes in DCCs that are solely due to aerosol impacts. Furthermore, it is vital to employ comprehensive, high-resolution observations of DCCs and aerosols to capture these intertwined physical processes and identify potential “fingerprints” of aerosol–DCC invigoration.
This study presents a statistical investigation into the aerosol–DCC interactions using comprehensive ground-based observational datasets. The datasets were collected during the TRacking Aerosol Convection interactions ExpeRiment (TRACER; Jensen et al., 2023) in Houston–Galveston, operated by the US Department of Energy (DOE) Atmospheric Radiation Measurement (ARM) facility (Mather and Voyles, 2013). We focus on DCCs occurring during the summer months in 2022 from June to September, the TRACER intensive operational period (IOP). During the IOP, detailed measurements of cloud, aerosol, and thermodynamic profiles are available and the synoptic conditions show less variation compared to other seasons. We employ a self-organizing map (SOM) approach (Kohonen, 1990) to identify the major synoptic regimes conducive to the formation of isolated DCCs. By performing our analysis on cases within the same synoptic regime, we minimize the impact of large-scale ascent on the convective properties (Wang et al., 2022a). Multiple linear regression (MLR) is then used to estimate the aerosol effects on DCC properties, with the inclusion of essential covariates in the analysis.
2.1 DCC properties
As the first step in the investigation, we employ a Lagrangian framework to detect the formation and propagation of DCC rainfall cores and quantify their convective characteristics throughout their life cycle. The term “DCC rainfall cores” typically refers to the convective regions in DCCs with heavy rainfall rates at the surface with a maximum value exceeding 10 mm h−1 (e.g., Wang et al., 2018; Zhang et al., 2021). The maximum height of these cores can serve as a proxy for the maximum updraft velocity, as it is related to the ability of convective updrafts to lift large hydrometeors to higher altitudes, signifying deeper convective systems (e.g., Heymsfield et al., 2010; Liu and Zipser, 2013; Guo et al., 2018). Note that this simplified representation neglects impacts aerosols may have on cloud microphysical processes (e.g., collision–coalescence, riming), which will, in turn, affect radar reflectivity and, consequently, the DCC echo top height (ETH). Quantifying such influence is challenging in the absence of in situ observations of the cloud microphysical and dynamical properties (e.g., hydrometeor phase/size distribution, updraft velocity). The reliance on this proxy also stems from the lack of direct measurements of convective vertical velocity for DCCs investigated here, a significant limitation not only for this study but also for many previous observational studies. Nevertheless, using ETH as a proxy allows for comparison of our findings with prior studies, which is valuable for the scientific community and for providing modeling constraints on simulations of the aerosol–DCC interactions.
More specifically, we tracked the trajectory of DCC rainfall cores using TINT (TINT Is Not TITAN – Thunderstorm Identification, Tracking Analysis and Nowcasting; Dixon and Wiener, 1993), a convective cell tracking algorithm developed by Raut et al. (2021). Building upon our prior research (Wang et al., 2024), we have effectively used this algorithm to analyze the level-II data (NOAA, 1991) from the S-band Doppler weather radar KHGX-Houston at 1 km horizontal resolution within a domain of 400 km × 400 km centered around the radar location. As a result, we have generated a comprehensive tracked DCC rainfall core dataset for the TRACER IOP during the summer of 2022 (Wang et al., 2024).
In that study and the current one, DCC rainfall cores are defined using radar observations as contiguous areas where the 2 km radar reflectivity (Z) is greater than 10 dBZ, the lower limit for rain echo detection by Next Generation Weather Radar (NEXRAD) systems, and the maximum 2 km Z value exceeds 40 dBZ (Anagnostou, 2004; Moroda et al., 2021). Note that different reflectivity thresholds varying from 30 to 40 dBZ have been selected for studying DCC convective cores in various climate conditions, depending on the objectives of the studies (e.g., Giangrande et al., 2023; Gupta et al., 2024). Additionally, these cores must exhibit a 30 dBZ ETH exceeding 5 km above ground level at some point during their lifetime to exclude shallow convective cells, aligning with a similar definition used by Dixon and Wiener (1993). Further details regarding additional criteria for identifying and tracking these rainfall cores can be found in Sects. S1 and S3 and in Wang et al. (2024). Note that using fixed thresholds may potentially influence the selection of DCCs investigated in the study, particularly in conditions where DCCs contain fewer raindrops due to the presence of a large number of background aerosols.
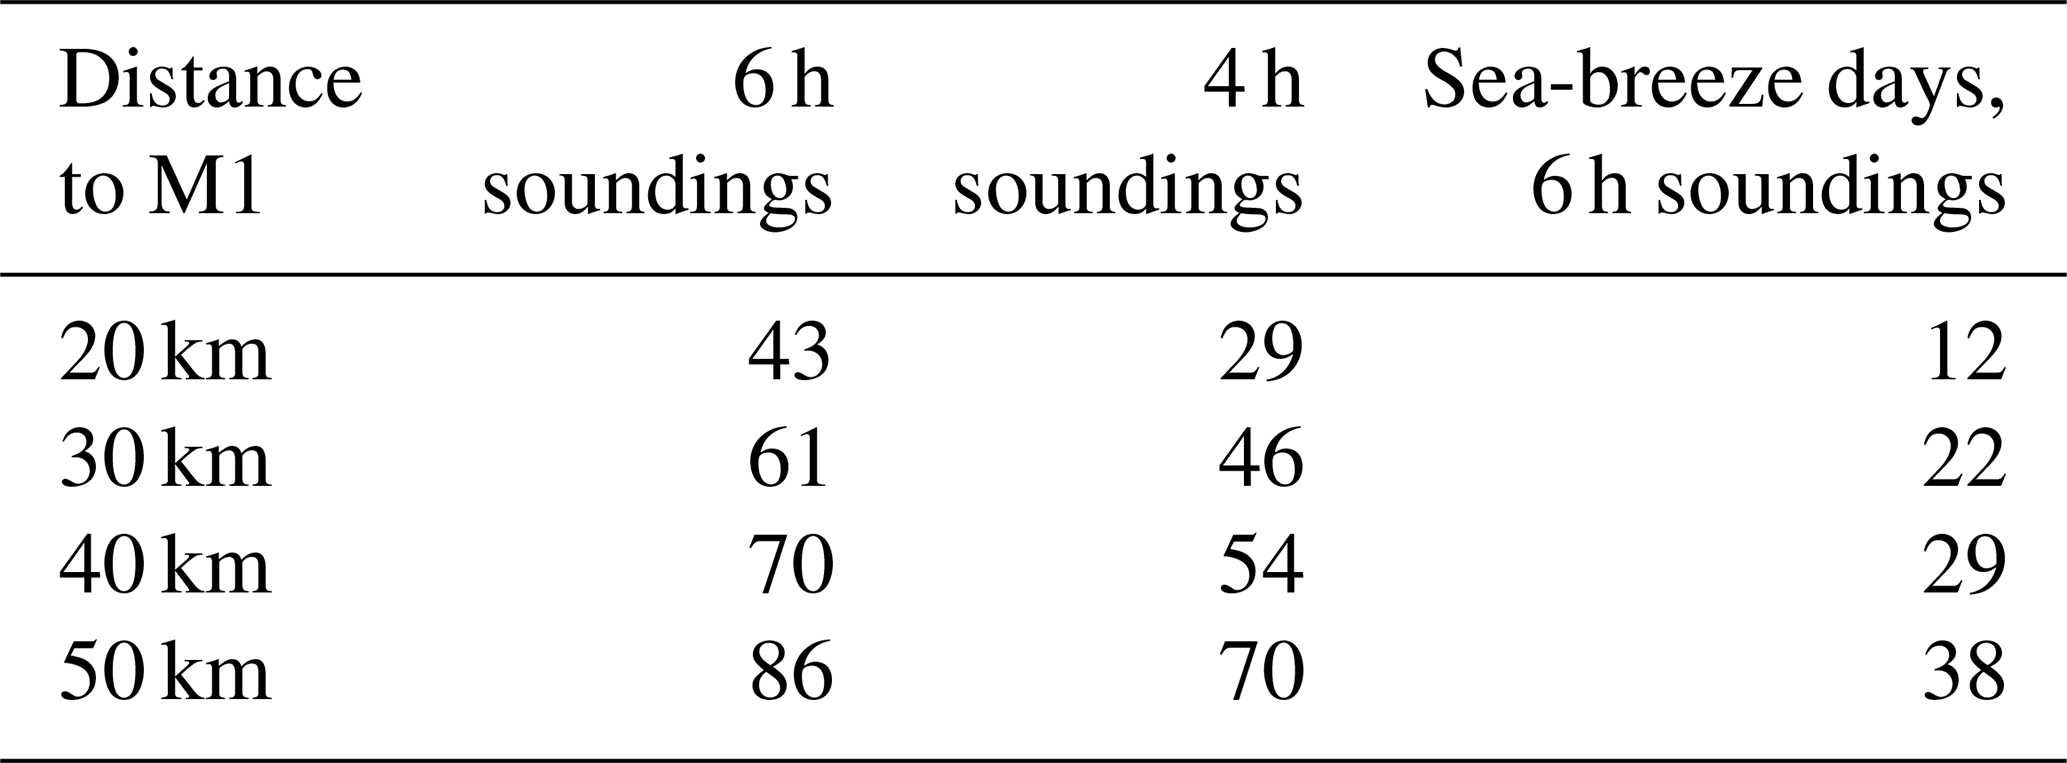
The first identification of the DCC rainfall core using the tracking algorithm is designated as the initiation of surface rainfall associated with the DCC core. The tracking algorithm can no longer identify the core once the DCC ceases to produce moderate precipitation (maximum 2 km Z<40 dBZ), marking the termination of the convective stage. In other words, the tracked lifetime of the cores excludes the early initiation stage of non-precipitating cumulus clouds, the dissipation stage of non-precipitating anvil clouds, and the lightly precipitating periods during either stage. Table 1 details the number of DCC rainfall cores tracked and considered when using different radii from the main TRACER site to identify DCCs.
Table 1Number of DCC cases tracked in 2022 from June to September when considering different radii to the M1 site and under different scenarios.
The DCC intensity is quantified using the maximum 30 dBZ ETH of the tracked core as the primary indicator (e.g., Liu and Zipser, 2013; Guo et al., 2018). Additionally, some studies have used the maximum height of the 10 dBZ or 15 dBZ echo as proxies for cloud depth and convective updraft strength (e.g., Hu et al., 2019; Veals et al., 2022). Therefore, to test the sensitivity of the results to our assumed proxy, we also consider the maximum 15 dBZ ETH, calculated using the KHGX-Houston radar data, as a secondary indicator of convective intensity.
2.2 Meteorological variables
Meteorological conditions are crucial in shaping the formation and evolution of DCCs and may covary with aerosol properties, complicating the accurate quantification of aerosol–DCC interactions (e.g., Lee et al., 2008; Storer et al., 2010; Grant and van den Heever, 2015; Lebo, 2018; Dagan et al., 2020; Park and van den Heever, 2022; Zang et al., 2023; Varble et al., 2023). These meteorological variables or convective indices, influencing both aerosol activation and convective updraft strength, are termed “confounders” or “confounding variables” (Jesson et al., 2021).
The convective indices analyzed in this study include convective available potential energy (CAPE), lifting condensation level (LCL), level of neutral buoyancy (LNB), environmental lapse rate (ELR) between 3 km and the surface (ELR3), ELR between 6 and 3 km (ELR6), low-level vertical wind shear from the surface to 5 km (LWS), and low-level mean relative humidity below 5 km (RH). These variables have been identified in previous studies as the most influential meteorological factors altering the impacts of aerosols on convective updrafts and precipitation because these factors regulate the kinematic and microphysical processes in DCCs and the kinematic–microphysical feedback (e.g., Khain et al., 2008; Khain, 2009; Nishant et al., 2019; Fan et al., 2009; Tao et al., 2012; Storer et al., 2010, 2014; Varble, 2018; Wang et al., 2020a; Veals et al., 2022; Sun et al., 2023; Masrour and Rezazadeh, 2023).
To quantify these convective indices, measurements from the ARM balloon-borne sounding system (SONDE) launched at the M1 site are used. Radiosondes were typically launched four times a day at approximately 05:30, 11:30, 17:30, and 23:30 UTC during the TRACER campaign, with additional launches at 19:00, 20:30, and 22:00 UTC on enhanced operational days (as listed in Table S1 in the Supplement). These radiosondes provide in situ measurements of profiles of atmospheric thermodynamic state, wind speed, and wind direction. To address the sensitivity of the calculation of these variables to the choice of initial parcel conditions, three scenarios are considered. These scenarios involve lifting different air parcels to initiate a convective cloud: the surface-based parcel (sfc), the most unstable parcel (mu), and the mixed-layer parcel (mix). Detailed information on these calculations can be found in Wang et al. (2020b). Note that, in the calculations, we assume that the parcel undergoes undiluted ascent in a pseudo-adiabatic process (neglecting hydrometeor loading).
Note that, in addition to the convective indices mentioned above, other factors such as entrainment rate (Abbott and Cronin, 2021; Peters et al., 2023) may also be important in regulating the aerosol–DCC interactions; however, no direct measurements of these quantities are available from TRACER. Therefore, these factors are not included in the analysis. The potential biases in the quantification of the aerosol effects due to these exclusions will be discussed in Sect. 4.6.
2.3 Surface aerosol measurements
The Aerosol Observing System (AOS; Uin et al., 2019) within the ARM mobile facility (AMF; Miller et al., 2016) was used for in situ aerosol measurements at the surface.
The dual-column CCN counter (Column A and Column B) was used to determine CCN number concentrations (Nccn). This instrument measures the number and size of activated aerosol particles for each column at a specific supersaturation (SS) level. Particle size, after humidification, can be measured between 0.75–10 µm, and the range of particle number concentration measurement depends on the SS caused by the growth kinetics of activated particles. Column A has varying SS set points between 0 % and 1 % at a frequency of 1.5 h, while Column B has a fixed SS set point of 0.35 %. Due to the unavailability of Column B data at the time of the study, only Column A data were considered. The dataset used includes the number concentration of CCN at SS set points of 0.1 %, 0.2 %, 0.4 %, 0.6 %, 0.8 %, and 1 %, which are referred to as Nccn01, Nccn02, Nccn04, Nccn06, Nccn08, and Nccn1, respectively. Note that these measurements were bias-corrected based on a CCN closure study using methods developed by Petters and Kreidenweis (2007). As direct measurements of SS in convective cloud updrafts are not available (i.e., updraft SS is unknown), we consider all six parameters as potential predictors (individually) in the MLR model.
Moreover, the total aerosol number concentrations including ultrafine particles (<100 nm in diameter) in the nucleation and Aitken mode along with larger, accumulation-mode aerosols are considered. The total aerosol number concentrations have the potential to influence DCC evolution, assuming that these particles may be activated as CCN in DCC updrafts in which a range of SS values may be present (e.g., Politovich and Cooper, 1988). These quantities were measured by the condensation particle counter (CPC) installed as part of the ARM AOS (Singh and Kuang, 2024). Two types of CPC instruments were used in the AOS: ultrafine CPC instruments (CPCU) and fine-mode CPC instruments (CPCF). The CPCU counts aerosol particles with diameters ranging from 3 to 3000 nm (Nufp), while CPCF counts aerosol particles with diameters ranging from 10 to 3000 nm (Ncn).
The Ncn and Nufp were measured at a temporal resolution of 1 min; Nccn at various SSs had two measurements per hour, and radiosondes, used to derive meteorological parameters, were launched four to seven times per day. To synchronize the two datasets, we employ two commonly used methods from previous studies to explore the sensitivity of results to the averaging process. One approach entails averaging the aerosol properties over a 1 h period following the launch of a radiosonde (post-sounding averaging; e.g., Veals et al., 2022). The second method involves utilizing a 1 h period preceding the initial identification of the rainfall cores, representing the aerosol conditions before the detection of precipitation at the surface (pre-rain averaging).
Based on a t test (Welch, 2005), the differences between the distributions of the aerosol properties derived using the post-sounding averaging and the pre-rain averaging are statistically insignificant. This is true for all aerosol properties considered in this study. In addition, the median values of the aerosol parameters from these two averaging methods are also comparable, with relative differences ranging from 2 % (Nccn02) to 23 % (Nccn01). Similar results are found when comparing the variability of aerosol properties within the 1 h averaging period, showing a consistent median value of the standard deviation for these parameters across all the DCC samples.
2.4 Pairing environmental variables with tracked DCCs
In the next step, we align environmental variables (aerosol and meteorology) with tracked DCC properties. This is achieved by identifying DCC rainfall cores that form within 6 h after launching each sounding, within a maximum distance of 50 km from the M1 site. The DCC tracking results are then averaged to represent the mean DCC properties for each corresponding sounding. More specifically, in terms of ETH, we identify the maximum ETH throughout a tracked DCC lifetime (one ETH for one DCC), and then we average these ETHs to represent the mean ETH of these qualified DCCs. The specifics of the number of samples are detailed in Table 1.
The choice of a 6 h time gap and a 50 km distance threshold as the upper limit represents a compromise between capturing representative environmental conditions and maintaining a sufficient sample size. We do want to emphasize the possibility of substantial temporal and spatial variability in the thermodynamic conditions around the M1 site. Local phenomena such as sea breeze, bay breeze, urban effects, and other factors may complicate the extent to which the environmental measurements at the M1 site represent the actual air mass injected into the DCCs (e.g., Rapp et al., 2024; Wang et al., 2024).
To account for the heterogeneous and evolving nature of meteorological conditions that may impact DCC development, we evaluate the spatial and temporal scales of meteorological influences on DCC rainfall core characteristics through sensitivity tests. These tests involve examining DCC rainfall cores initially identified within a radius of 20, 30, 40, and 50 km from the M1 site, considering two different groups of soundings: those launched within 4 h and those within 6 h before the initial identification of the DCC rainfall cores.
Given the temporal and spatial constraints of the current observations, the purpose of these tests is to strike the best possible balance between accurately characterizing the initial conditions where DCCs are embedded with the available observations and maintaining a sample size that optimizes the performance of the subsequent analysis.
Note that various pairing methods have been used in prior observational studies on aerosol–DCC interaction with the goal of expanding the sample size. One approach involves searching for a sounding launch within a specific period preceding the identification of each tracked DCC within a defined domain (Veals et al., 2022). This increases the number of samples to be equal to the number of tracked DCCs, in contrast to our original method where the number of samples is equivalent to the number of sounding launches. It is crucial to acknowledge that different DCCs may correspond to the same sounding profiles in the Veals et al. (2022) method, limiting the natural variability of the pre-convection environment across different cases. Therefore, the subsequent analysis is exclusively conducted on datasets generated from the original method of using the mean properties of DCC rainfall cores tracked within 4 or 6 h after the launch of each sounding.
To assess the potential impacts of aerosols on DCC properties, an approach incorporating the use of SOM and MLR is used.
First, we use the SOM method (Sect. 3.1) to classify the synoptic weather regimes with the aim of singling out DCC cases occurring within the context of weak synoptic-scale forcing. This choice serves to mitigate the potential influence of large-scale ascent on the evolution of DCCs. In other words, we aim to exclude large-scale, dynamically driven convective clouds, such as mesoscale convective systems, since the aerosol effect may be overwhelmed by meteorological forcing (Chakraborty et al., 2016; Storer et al., 2010). The characteristics of the synoptic regimes over the Houston–Galveston region, details of the SOM setup, training process, and further information on the SOM method can be found in Wang et al. (2022a).
Second, we determine the relationships between aerosol and DCC properties using the MLR model and estimate the aerosol effects on DCCs based on the partial regression coefficient associated with the aerosol predictor. Note that we control for potential confounding variables, meaning that these variables are also included as independent variables besides aerosol properties. In the context of this study, these confounders refer to convective indices – such as CAPE – that may influence both aerosol number concentrations and DCC characteristics.
3.1 Minimizing the influence of variability in synoptic-scale forcing
In this subsection, we describe the first step in which we use an unsupervised machine learning technique, SOM, to categorize synoptic weather patterns in the Houston–Galveston area. The purpose of this step is to focus on DCC–aerosol relationships while minimizing the influence of synoptic-scale ascents such as those that are associated with strong synoptic-scale troughs and onshore winds.
In our prior studies (Wang et al., 2022a), we identified three main synoptic patterns in the Houston–Galveston region using the SOM approach, including a pre-trough, a post-trough, and an anticyclonic regime. The input data for the SOM analysis were 700 hPa geopotential height anomalies (recorded at 00:00 UTC) from the European Centre for Medium-Range Weather Forecasts (ECMWF) Reanalysis version 5 (ERA5; Hersbach et al., 2020) during the summer months (June to September) of 2010 to 2022. Among these regimes, the anticyclonic regime is the most frequent, representing 49 % of all days across the 13-year dataset, occurring predominantly in July and August. The corresponding regime for each day during the TRACER IOP can be found in Fig. S1 in the Supplement.
During the anticyclonic regime, a high-pressure system typically resides over the Houston–Galveston area as the Bermuda High has shifted toward the west. The region is positioned on the inner eastern edge of a ridge at 500 hPa and on the inner western edge of an anticyclonic system at 850 hPa. This configuration creates a stable synoptic background characterized by large-scale subsidence over the study area, weak horizontal winds throughout the troposphere, and moderate column water vapor content (Wang et al., 2022a). These conditions are favorable for the formation of locally forced, isolated DCCs with minimal LWS and moderate low-level moistening (Wang et al., 2024). As such, this environment is conducive to studying the interactions between DCCs and aerosols. Conversely, the pre-trough and post-trough regimes are associated with large-scale trough intrusions and moisture transport from the Gulf of Mexico, which are more likely to promote organized convective clouds over the region that are primarily driven by large-scale dynamics (Wang et al., 2022a). Therefore, these specific cases are excluded from our study, aligning with our emphasis on evaluating aerosol impacts on locally driven DCCs, which are comparatively less influenced by the large-scale ascent.
3.2 Aerosol–ETH association
Given our potential predictors, namely aerosol or CCN number concentrations at various SS levels, we aim to identify the most relevant aerosol parameters impacting the DCC ETH. In other words, the “valid” predictors are those that demonstrate a significant association with DCC ETH.
To achieve that, we evaluate the performance of a simple linear regression (SLR) model when attempting to predict DCC ETH using each aerosol parameter individually. The p value of each SLR model is assessed, indicating the statistical significance of the associations between ETH and aerosol parameters.
Figure 1 illustrates the p values resulting from each fitted model, with 30 and 15 dBZ ETH as the dependent variable and each aerosol parameter (Nccn at various SSs, Ncn, or Nufp) as the predictor (derived from the two averaging methods described above). A p value below 0.05 signifies a statistically significant association between the predictor and dependent variables. The most notable feature from Fig. 1 is that only a small fraction (20 out of 128, accounting for 16 %) of the SLR models are statistically significant. This result suggests that, in the majority of scenarios, the CCN and aerosol number concentrations are not reliable influencers of changes in DCC ETH, suggesting limited impacts of aerosol loading on DCC ETH. Among the “valid” SLR models (p<0.05), all of them use Ncn or Nufp as the predictor variable. This implies that aerosol loading potentially influences DCC ETH if smaller aerosol particles are considered in the analysis.
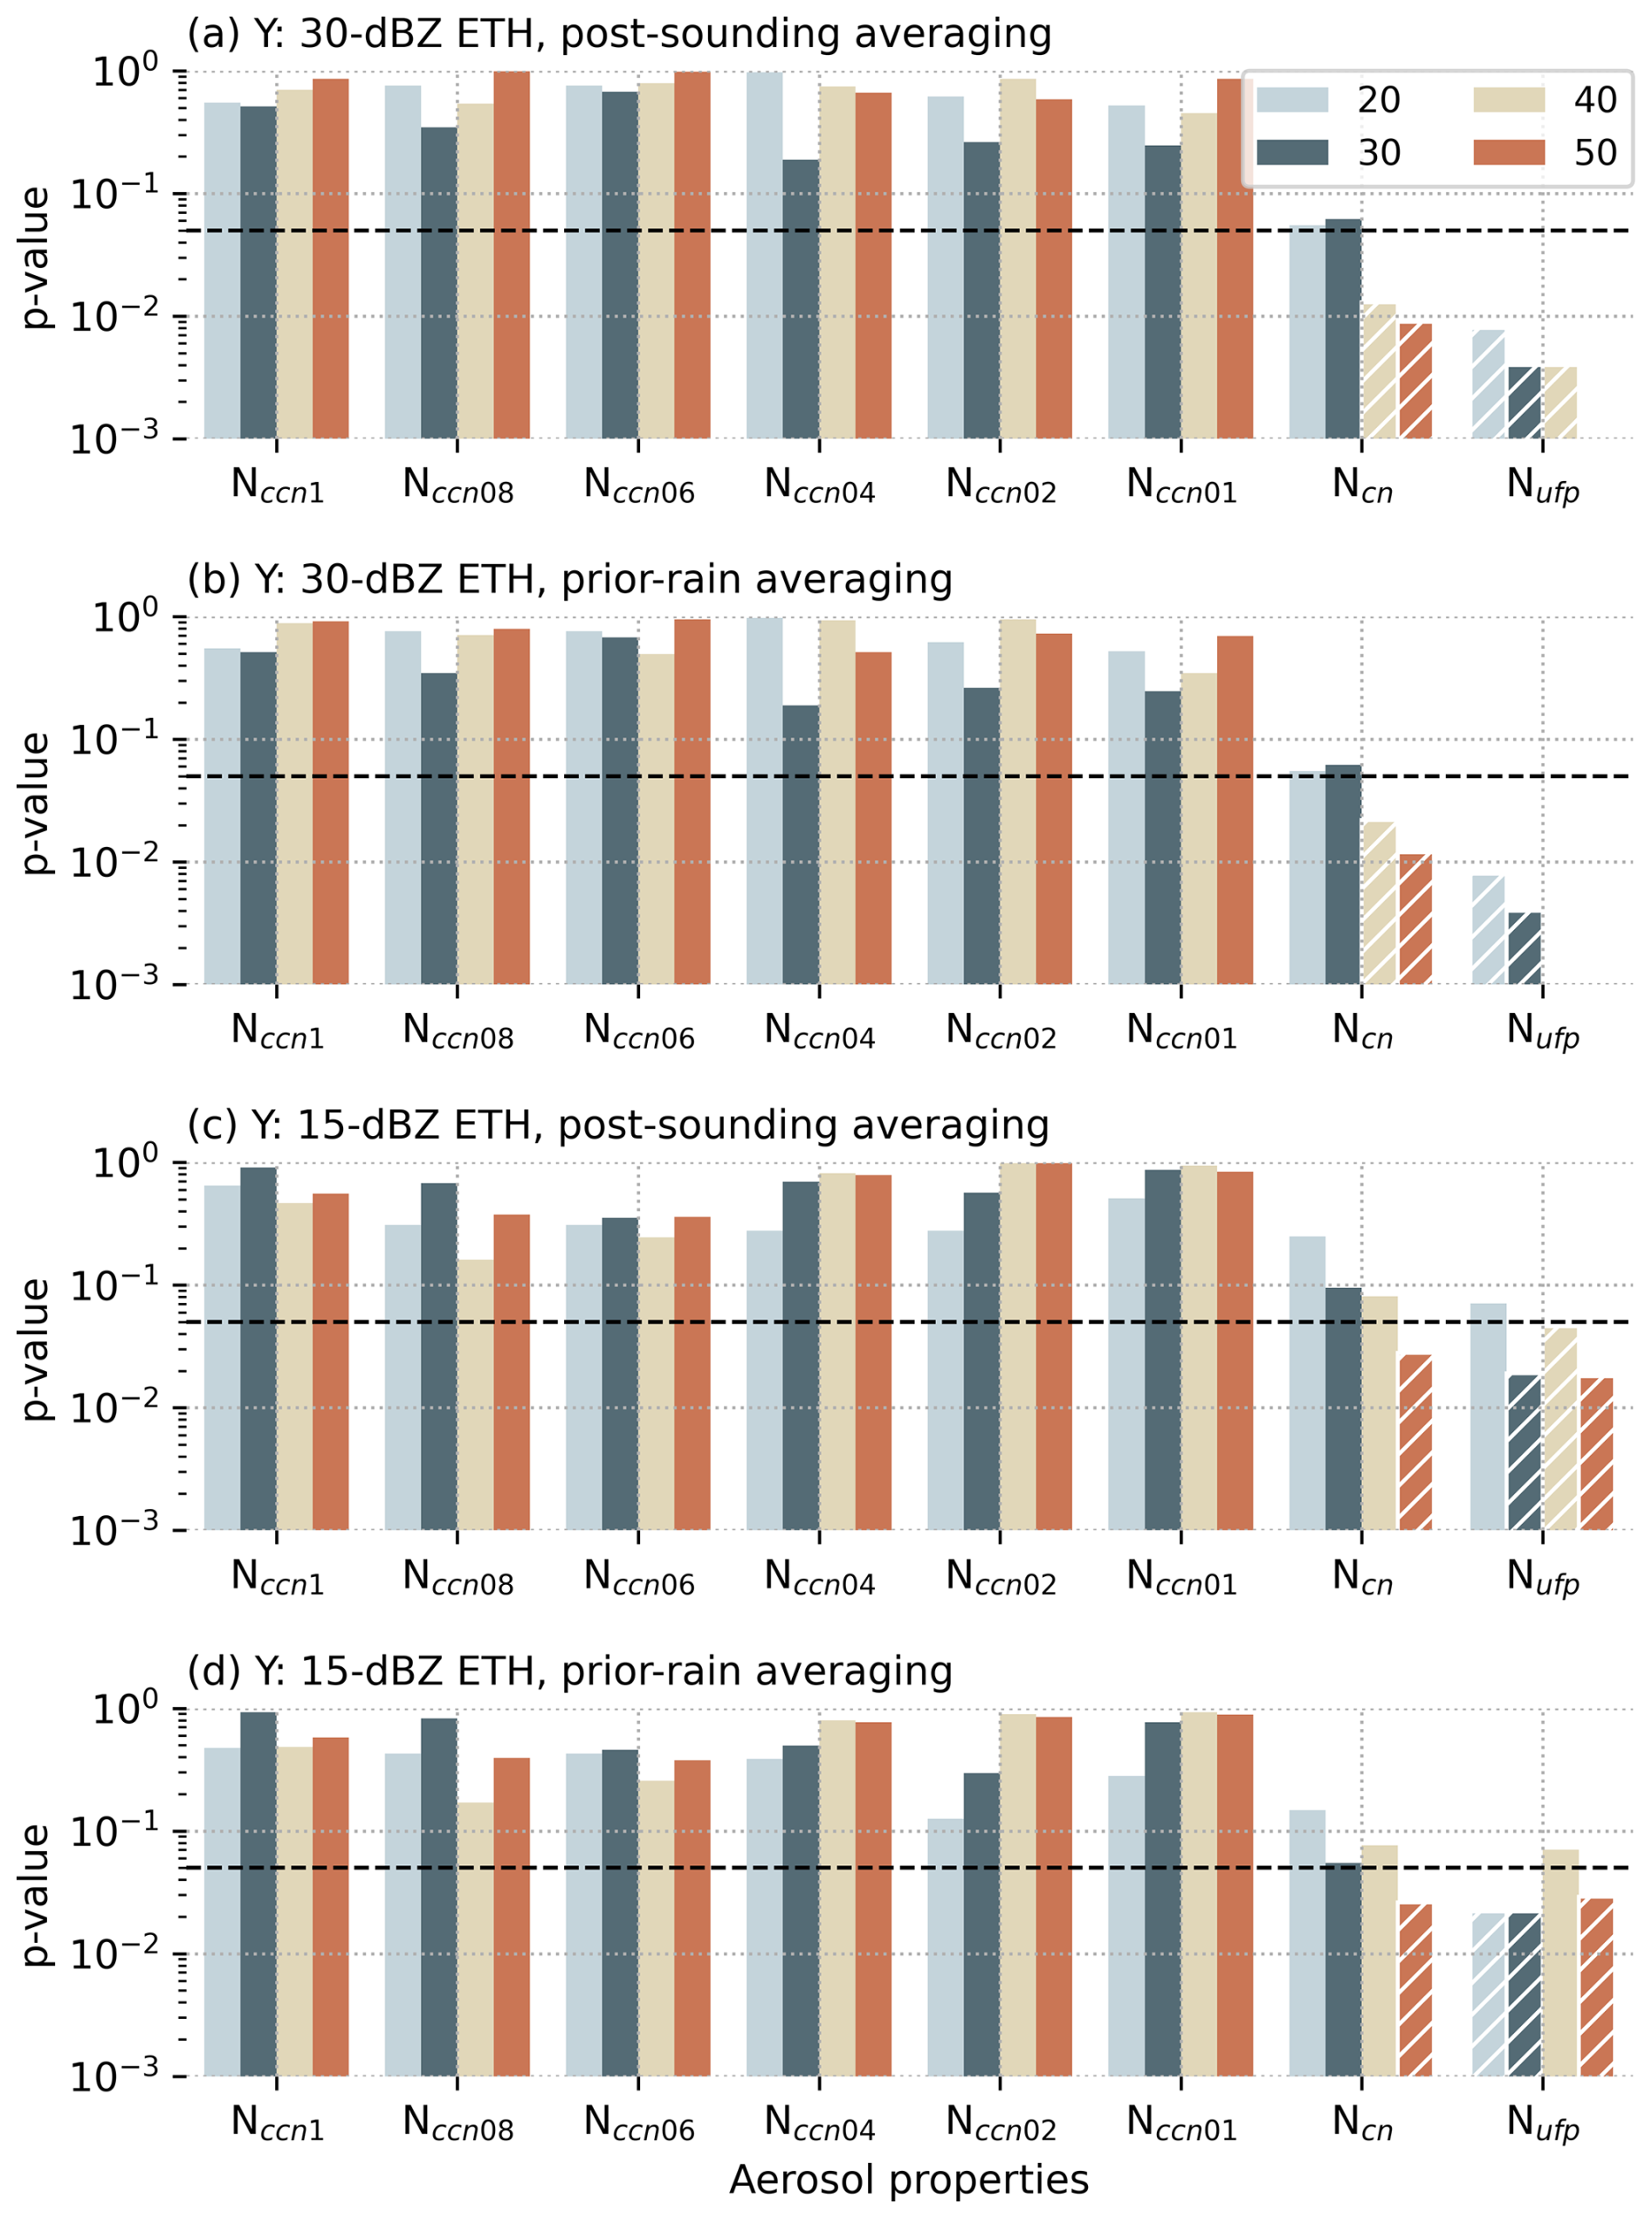
Figure 1Simple linear regression model p value for each aerosol number concentration as a predictor for different aerosol averaging periods. Different colors represent different maximum distances between aerosol and DCC measurements (km in radius from the M1 site). The horizontal line indicates p = 0.05 and the white hatch lines indicate “valid” models (p < 0.05). Note that for some models, the p value is zero, which is not visible on the plot.
3.3 Identification of confounding variables
In this subsection, our primary objective is to identify a specific set of confounding variables from a range of convective indices introduced in Sect. 2.2. To achieve this, we assess the Pearson correlation coefficients (R) between 30 dBZ ETH as well as 15 dBZ ETH and selected convective indices, as delineated in Table 2 and shown in Fig. 2.
Table 2Pearson correlation coefficients (R values) between convective indices and DCC ETH. The most unstable parcel is used in the calculations of the convective indices. DCCs were identified within different distances, ranging from 20 to 50 km, from the ARM M1 site. Only the R values that pass the significance tests are included.
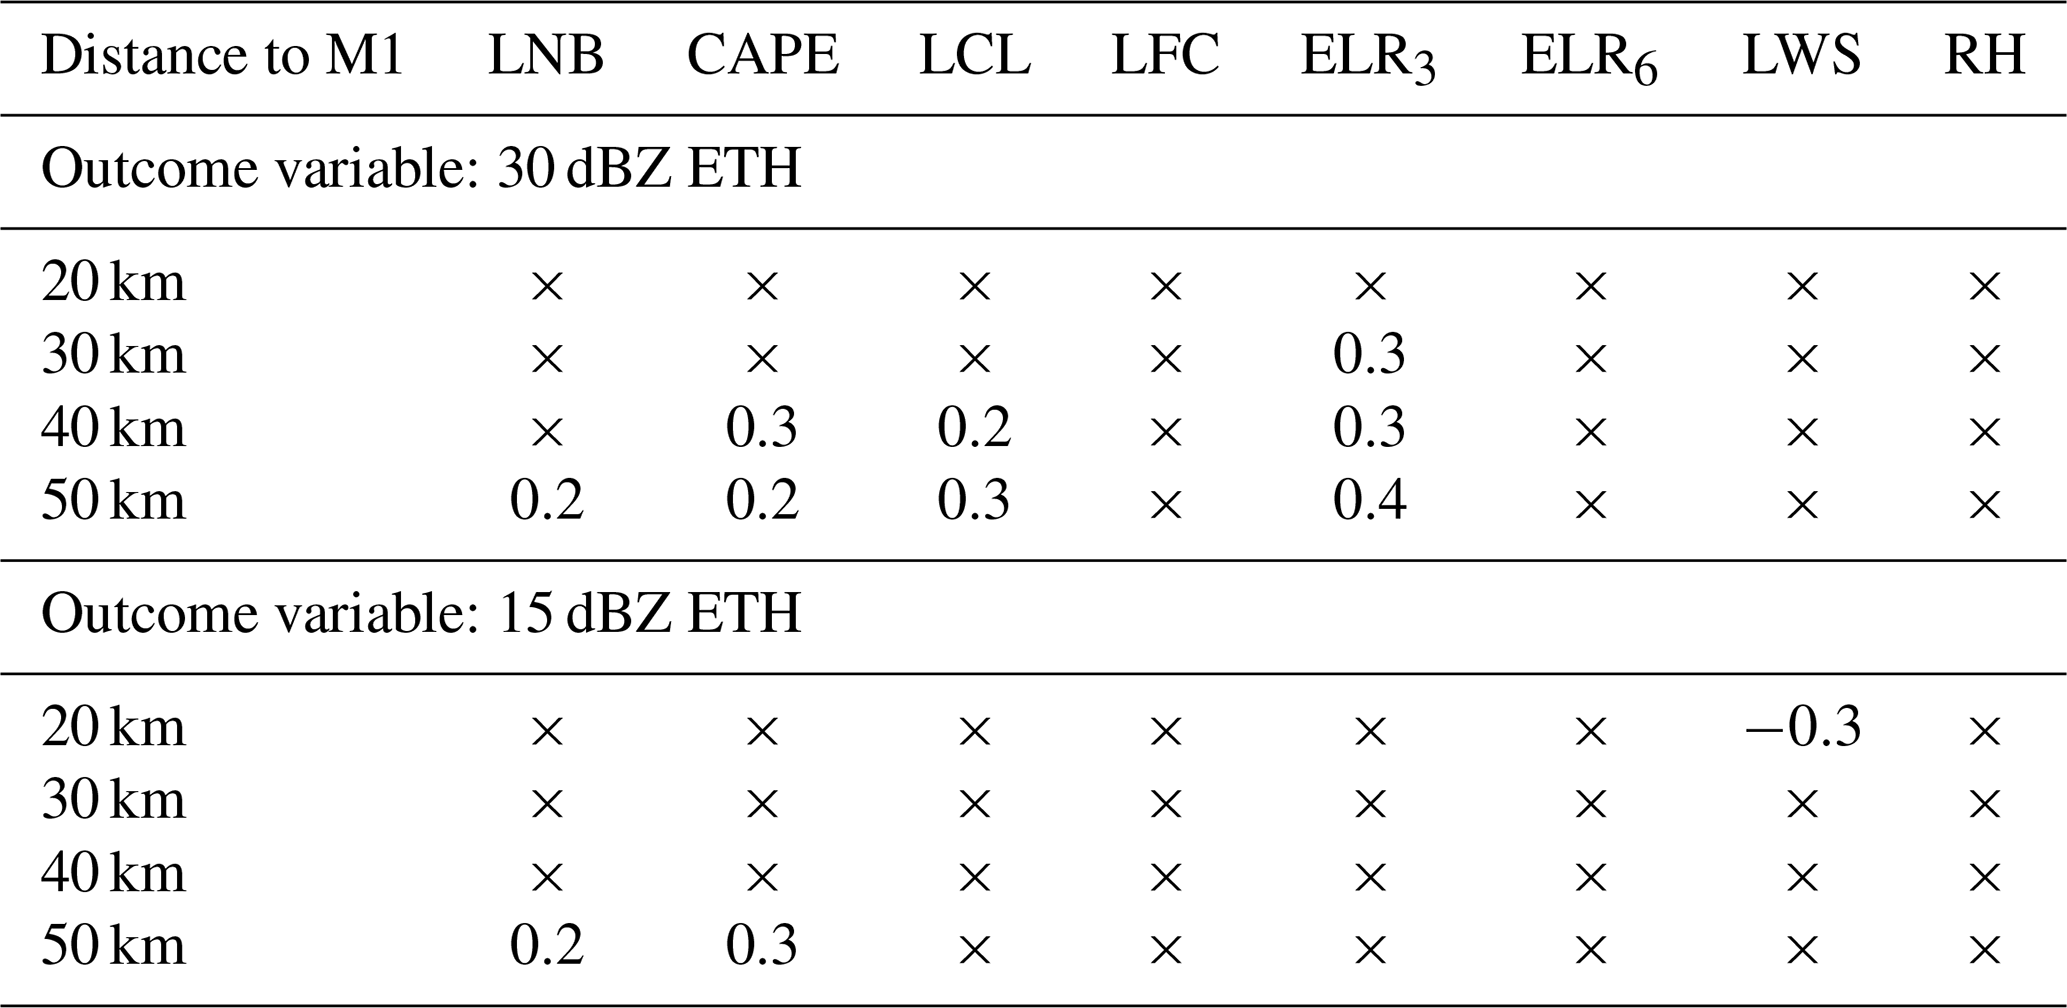
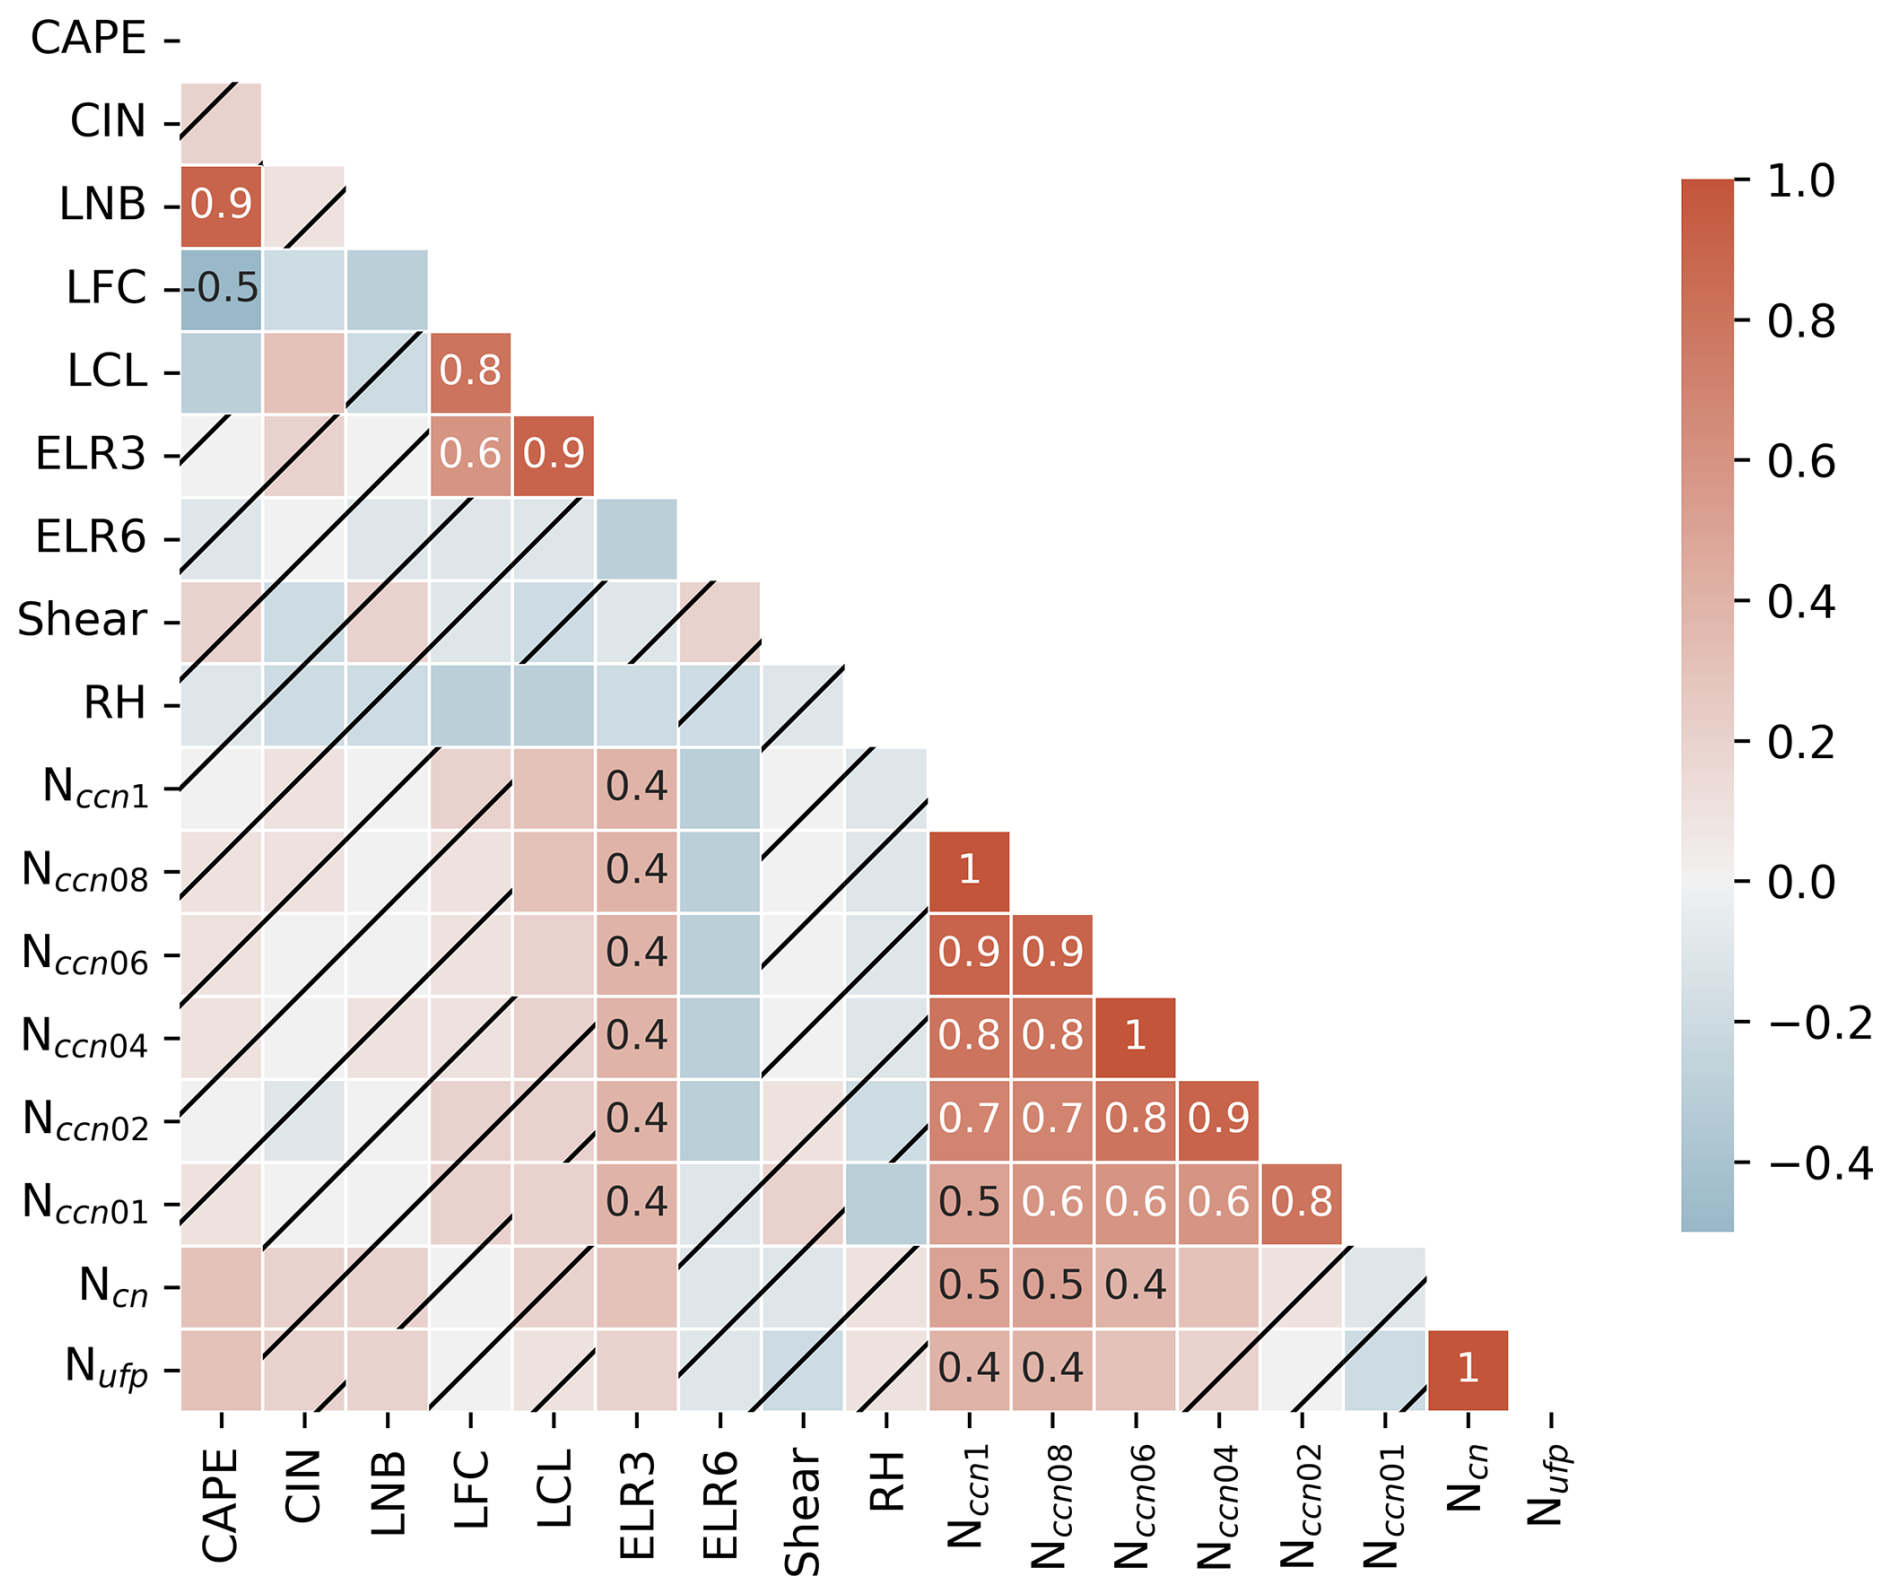
Figure 2Correlation matrix between the meteorological variables and aerosol number concentrations for DCC cases identified within a radius of 50 km from the M1 site. The correlation matrix is a table showing Pearson R values between sets of variables. The meteorological variables are calculated using ARM soundings when assuming that the most unstable parcel would rise to form convection. The black hatch lines indicate nonsignificant R values.
Positive R values between 0.2 and 0.4 are evident when examining the relationship between LNB, CAPEmu, LCL, or ELR3 and 30 dBZ ETH. The positive association between CAPEmu and 30 dBZ ETH can primarily be attributed to the direct impact of CAPE on the maximum potential velocity of updrafts, independent of entrainment and hydrometer loading effects (Weisman and Klemp, 1984; Kirkpatrick et al., 2011). This relationship finds support in observations across diverse climate regions, including Darwin, Australia (Kumar et al., 2013), the Sierras de Córdoba mountain range (Veals et al., 2022), and the central Amazon (Wang et al., 2019). This robust association is also present when using surface parcels but diminishes with mixed-layer parcels (Table S2). Additionally, the LNB shows weak, positive correlation with both 30 and 15 dBZ ETH, since it is highly correlated with CAPE (Fig. 2).
Concerning LCL, its impact on 30 dBZ ETH can be explained by its previously demonstrated positive correlation with the width of updrafts at cloud base (McCaul and Cohen, 2002; Mulholland et al., 2021). In other words, a higher LCL tends to promote wider boundary layer updrafts. These wider updrafts are more likely to evolve into expansive and deeper updraft cores within DCCs since they experience less dilution of buoyancy due to entrainment compared to narrower updraft cores. Consequently, this leads to a higher 30 dBZ ETH. Similarly, a steeper ELR3 is closely linked to a higher LCL (R=0.9, Fig. 2) and, subsequently, a higher 30 dBZ ETH. This steeper ELR3 also corresponds to a “fatter” buoyancy profile (Zipser and LeMone, 1980), where CAPE is concentrated at lower levels. An air parcel accelerates more rapidly through these levels, reducing the exposure time for entrainment and other processes (Wang et al., 2020b). Therefore, a higher 30 dBZ ETH may be expected.
LWS is another essential factor governing DCC updraft intensity and regulating aerosol–DCC interactions, particularly in organized DCCs (e.g., Fan et al., 2009; Baidu et al., 2022). However, in the specific isolated DCC environment studied here, it has no association with 30 dBZ ETH, but it does have a weak, negative correlation with 15 dBZ ETH. Therefore, LWS is excluded (included) as a confounding variable when the 30 dBZ ETH (15 dBZ ETH) is considered to be the dependent variable in the next step.
Overall, LNB, CAPE, LCL, and ELR3 exhibit weak to moderate R values across various scenarios, making them suitable potential covariates for predicting 30 dBZ ETH alongside aerosol properties. However, high correlation is found between LNB and CAPE (R=0.9, Fig. 2) as higher values of CAPE indicate greater atmospheric instability, allowing air parcels to rise to higher altitudes and thus potentially higher LNB. Similarly, strong correlation is also exhibited between ELR3 and LCL (R=0.9, Fig. 2), which can be attributed to their shared relationship with temperature variations in the lower atmosphere. To address multicollinearity concerns, only one variable from each pair is selected as a confounding variable, which can otherwise lead to increased variance in estimated coefficients within the MLR model. Further discussion on multicollinearity is presented in Sect. S4.
Finally, CAPE and ELR3 are chosen due to their higher R values with 30 dBZ ETH compared to their counterparts. Following a similar logic, CAPE and LWS are selected as confounders when the 15 dBZ ETH is used as the dependent variable in the MLR model. Moreover, these selected confounding variables exhibit a stronger association with aerosol parameters compared to other convective indices (Fig. 2). Similar findings are reported in previous studies by Varble (2018). Using the surface and mixed-layer parcel, a consistent conclusion is drawn (Figs. S2 and S3).
3.4 MLR
The main step involves fitting an MLR model to our data. In our case, the MLR model includes the dependent variable, Y, which represents the 30 dBZ (15 dBZ) ETH, and the independent variable, X, which represents aerosol properties. We also include two additional variables, which are A=CAPE and B=ELR3 for Y=30 dBZ ETH and A=CAPE and B=LWS for Y=15 dBZ ETH to account for confounding effects.
Therefore, the MLR model can be expressed as follows.
Here, β0 is the intercept, and β1, β2, and β3 are the estimated regression coefficients.
Note that the aerosol properties, X, are transformed into a binary distribution (0 or 1) to first help address potential biases associated with the Nccn measurements/calculations during TRACER. Cases with Nccn at various SSs, Ncn, or Nufp above the median value are categorized as polluted cases with a scaled value of 1, while cases below the median value are classified as clean cases with a scaled value of 0. Most importantly, this transformation facilitates the estimation of the average aerosol effects on DCCs because in this case, β1 represents the expected difference in Y between when X=1 and X=0, holding A and B constant. In other words, β1 is the average effect (or group difference) of X on Y while adjusting for A and B. The unit of coefficient β1 is the same as the unit of Y.
In addition, we perform standardization on the confounding variables. This standardization process transforms the variables so that they have a mean of 0 and a standard deviation of 1. It is achieved by subtracting the mean of each variable from each observation and then dividing by its standard deviation.
We run model diagnostics to ensure the validity, reliability, and interpretability of the fitted MLR model as well as ensuring the robustness of coefficients. This is achieved by examining the key assumptions (i.e., linearity, homoscedasticity, normality, independence, and multicollinearity) of the MLR models as described in Sect. S4. Overall, all scenarios presented in Sect. 3.2 satisfy these assumptions. In addition, we also calculated the adjusted R2 values, the 95 % confidence intervals for each independent variable (Table S4). The adjusted R2 values are generally below 0.5 and rarely increase even when all the potential confounders discussed in Sect. 2.2 are included. This result indicates that other confounding variables, beyond those included or discussed here, likely exist but are not accounted for. These variables may not have been measured or discovered to have a relationship with the dependent variables, which will be discussed in Sect. 4.6. Additionally, the small sample size may contribute to the low adjusted R2, as high variability in the dependent variable can artificially suppress the correlation.
In this section, we first provide an overview of the characteristics of the DCC properties and their associated aerosol and meteorological conditions in the Houston–Galveston region. Then, we present the estimated aerosol effects on DCC properties and discuss potential uncertainties of the results.
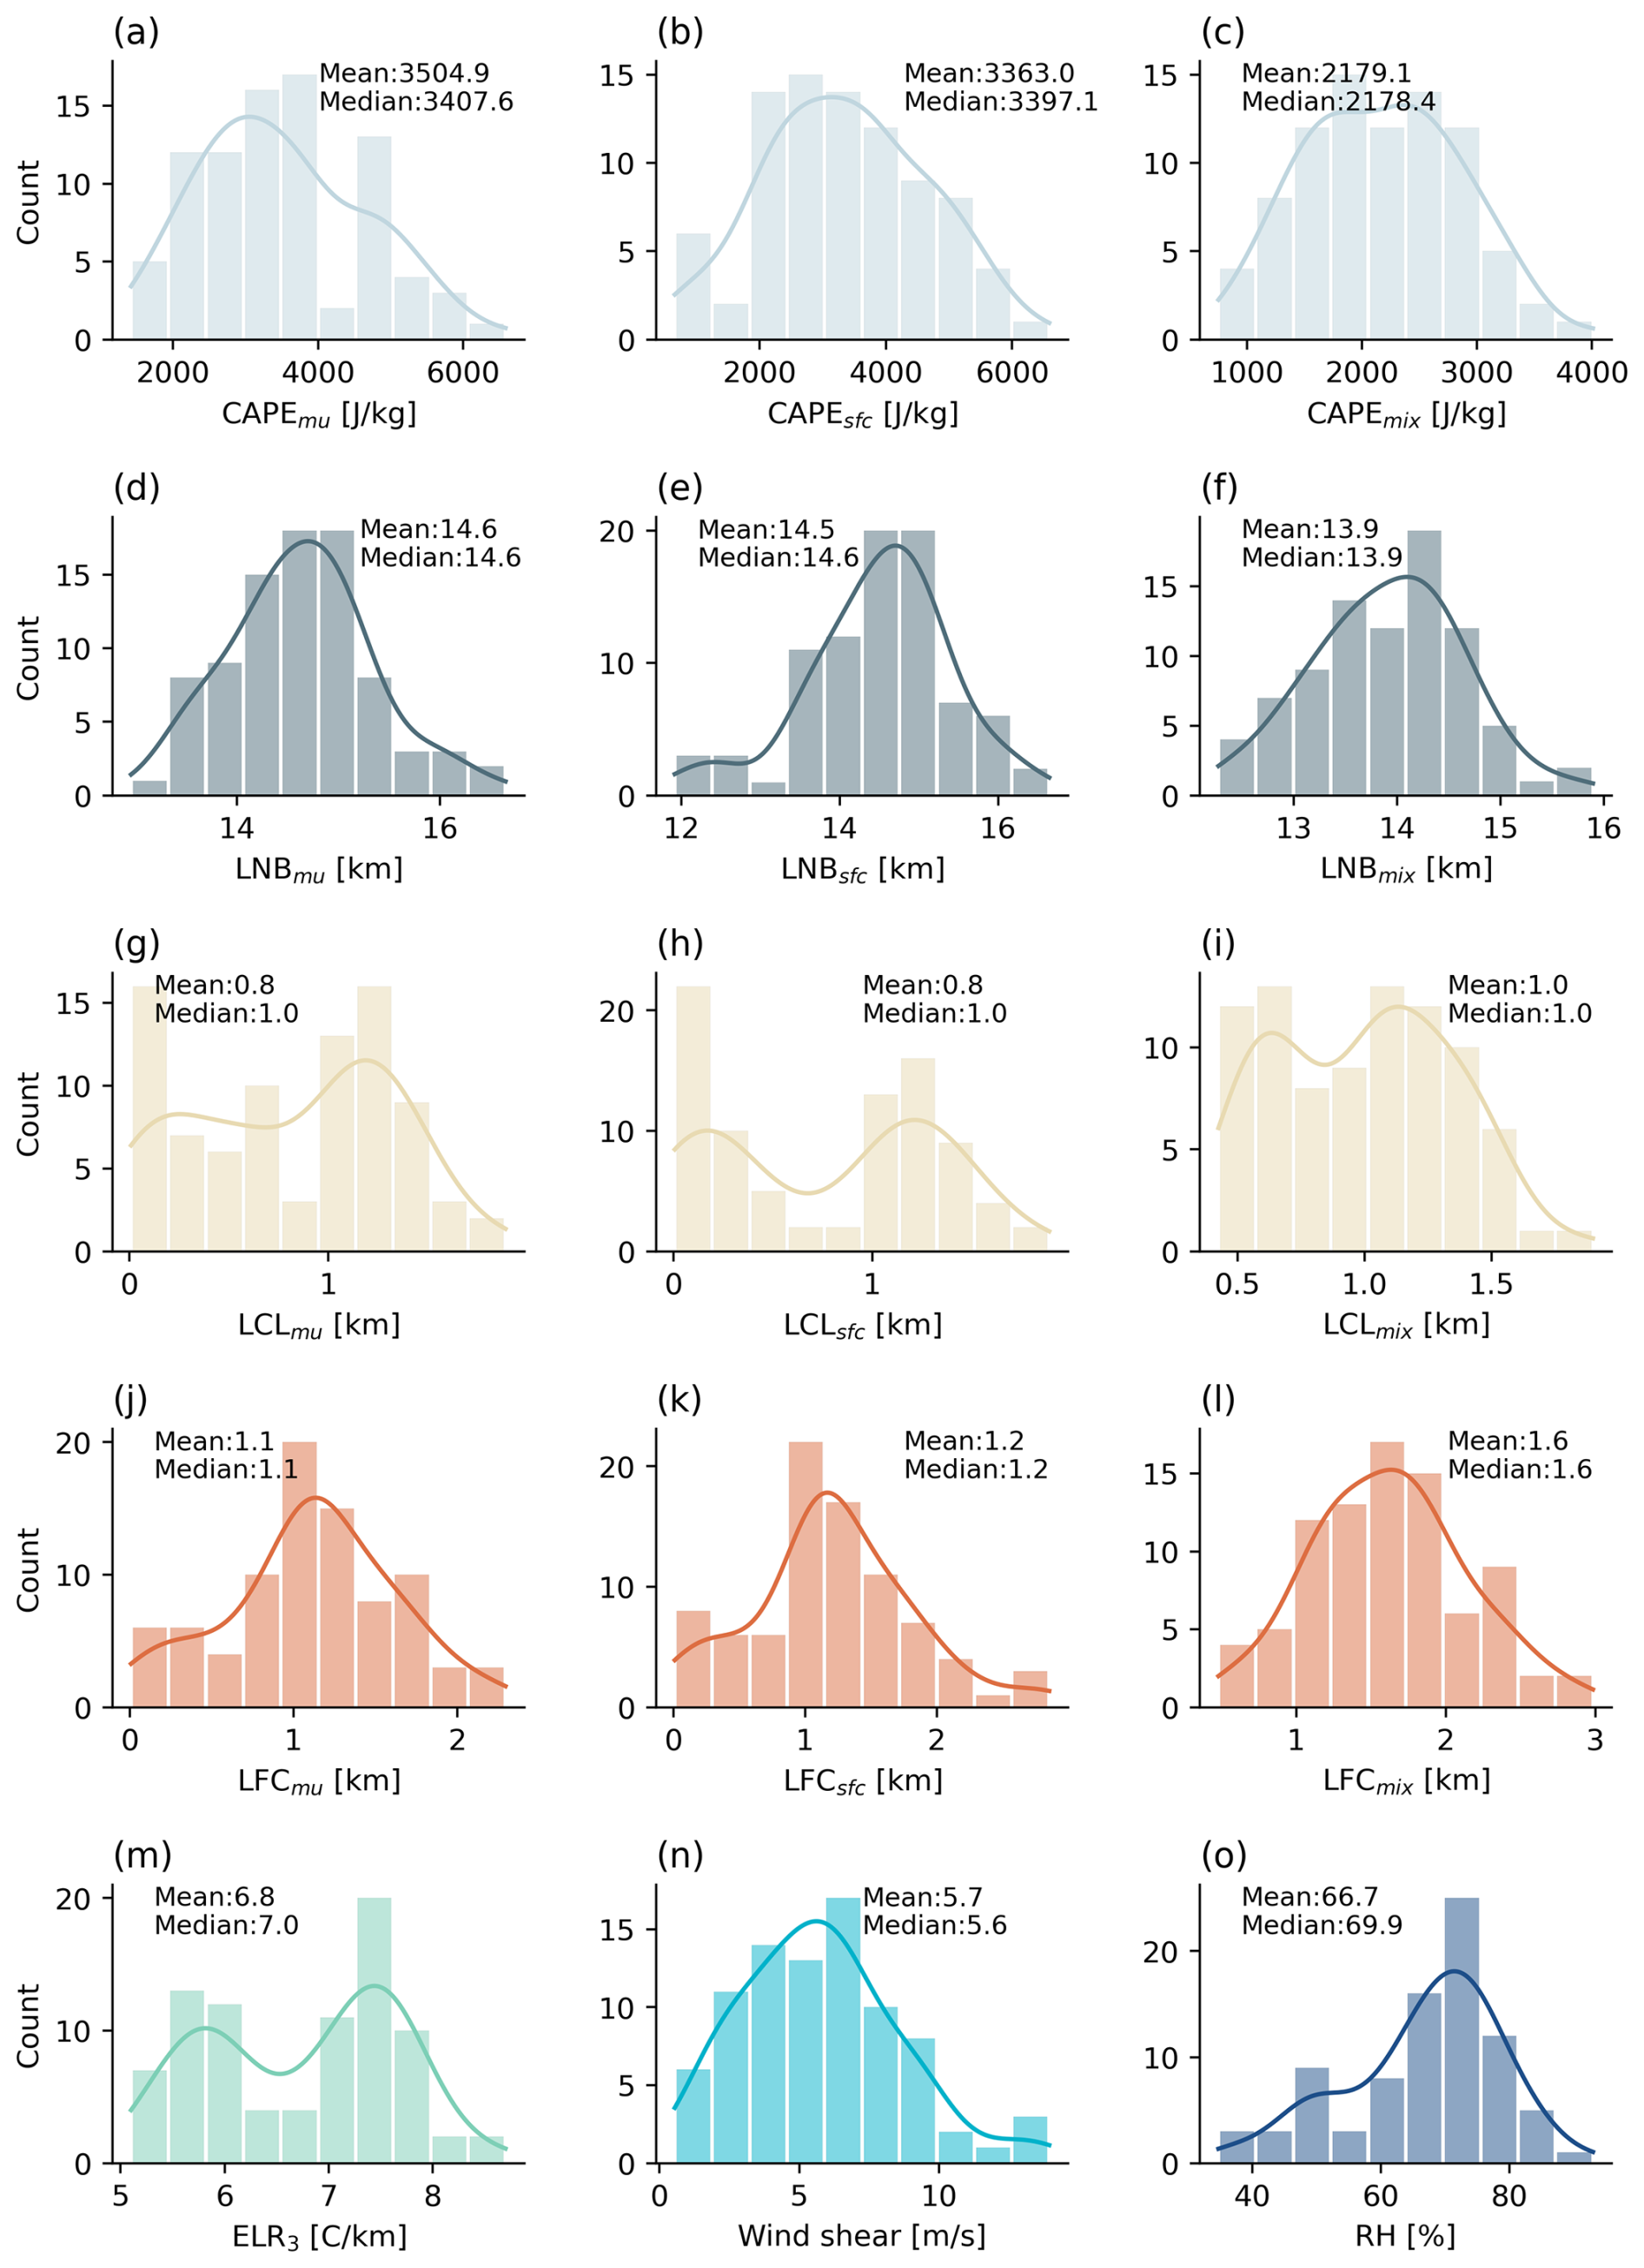
Figure 3Histograms with density kernel estimation (solid lines) of meteorological variables from the ARM soundings launched prior to DCC cases identified within a radius of 50 km from the M1 site. The bin size is defined by the difference between the maximum and minimum values of each variable divided by the number of bins, which is fixed at 10 for each panel.
4.1 DCC properties and their associated environmental conditions
In Fig. 3, we illustrate the distributions of selected convective indices representative of the pre-convective conditions. During the selected DCC days, the influence of anticyclonic large-scale flow leads to moderate low-level moistening, resulting in medium to high low-level RH (mean RH values below 5 km) of approximately 70 % (Fig. 3o). This moistening causes air parcels to saturate quickly at lower levels when lifted, leading to a relatively low mean LCL of 1 km (Fig. 3g–i), although this value is higher compared to the LCL values in more humid conditions, such as an oceanic environment with a mean low-level RH of 80 % (Wang et al., 2020b). The LCL is in close proximity to the LFC, with a smaller median difference of 100 m when using the most unstable parcel and a larger difference of 600 m when using a mixed-layer parcel (Fig. 3j–l). Consequently, the convective inhibition (CINmu) is relatively low, with a median value of −0.7 J kg−1 (not shown).
Under these conditions, (adiabatically) lifted parcels can ascend to significant heights, even reaching the tropopause, with a mean LNBmu of 14.6 km (Fig. 3d). When considering mixed-layer parcels, the mean value of LNBmix decreases to 13.9 km as expected (Fig. 3f). This environment allows for the accumulation of significant CAPEmu throughout the troposphere, with a median value of approximately 3407 J kg−1 (Fig. 3a). There are only small changes in CAPE values when using the surface parcel in the calculation compared to CAPEmu (Fig. 3b), which implies that the majority of the most unstable parcels are from near-surface levels. Under such circumstances, using surface aerosol measurements to represent the in-cloud aerosol properties may result in reduced uncertainty compared to applying the same assumption to study elevated DCCs. The LWS is relatively weak, with a mean value of 5.7 m s−1 (Fig. 3n), compared to LWS values that support the initiation of organized convective systems (Baidu et al., 2022).
The distributions of convective properties associated with DCCs initiated under such meteorological conditions are illustrated in Fig. 4. In this demonstration, the selected DCC cases are those identified within a 50 km radius from the ARM M1 site. The definitions of these properties can be found in Sect. S2. These tracked DCC rainfall cores show intense rainfall rates, exhibiting a mean maximum 2 km Z of 54 dBZ (Fig. 4a). The maximum 30 dBZ ETH for half of these cores extends above 7 km (Fig. 4b). These cores are small in size, with their maximum area having a median value of approximately 52 km2 during their lifetime (Fig. 4c), confirming their more isolated nature. Most of these rainfall cores form in the afternoon hours with a peak in the number of cores initiating around 20:00 UTC, corresponding to 15:00 local time (Fig. 4d). This observation confirms that these cases are predominantly locally driven under weak synoptic forcing and influenced by surface heating and/or sea-breeze circulations (Wang et al., 2022a). It is therefore no surprise that these cores propagate at a relatively slow speed of 5 ms−1 (Fig. 4e) and have a relatively short duration of less than an hour (51 min, Fig. 4f). The influence of aerosol number concentrations on these locally driven DCC rainfall cores is expected to be more discernible compared to DCCs with significant large-scale forcing, given the limited large-scale ascent and minimal convection organization in such cases.
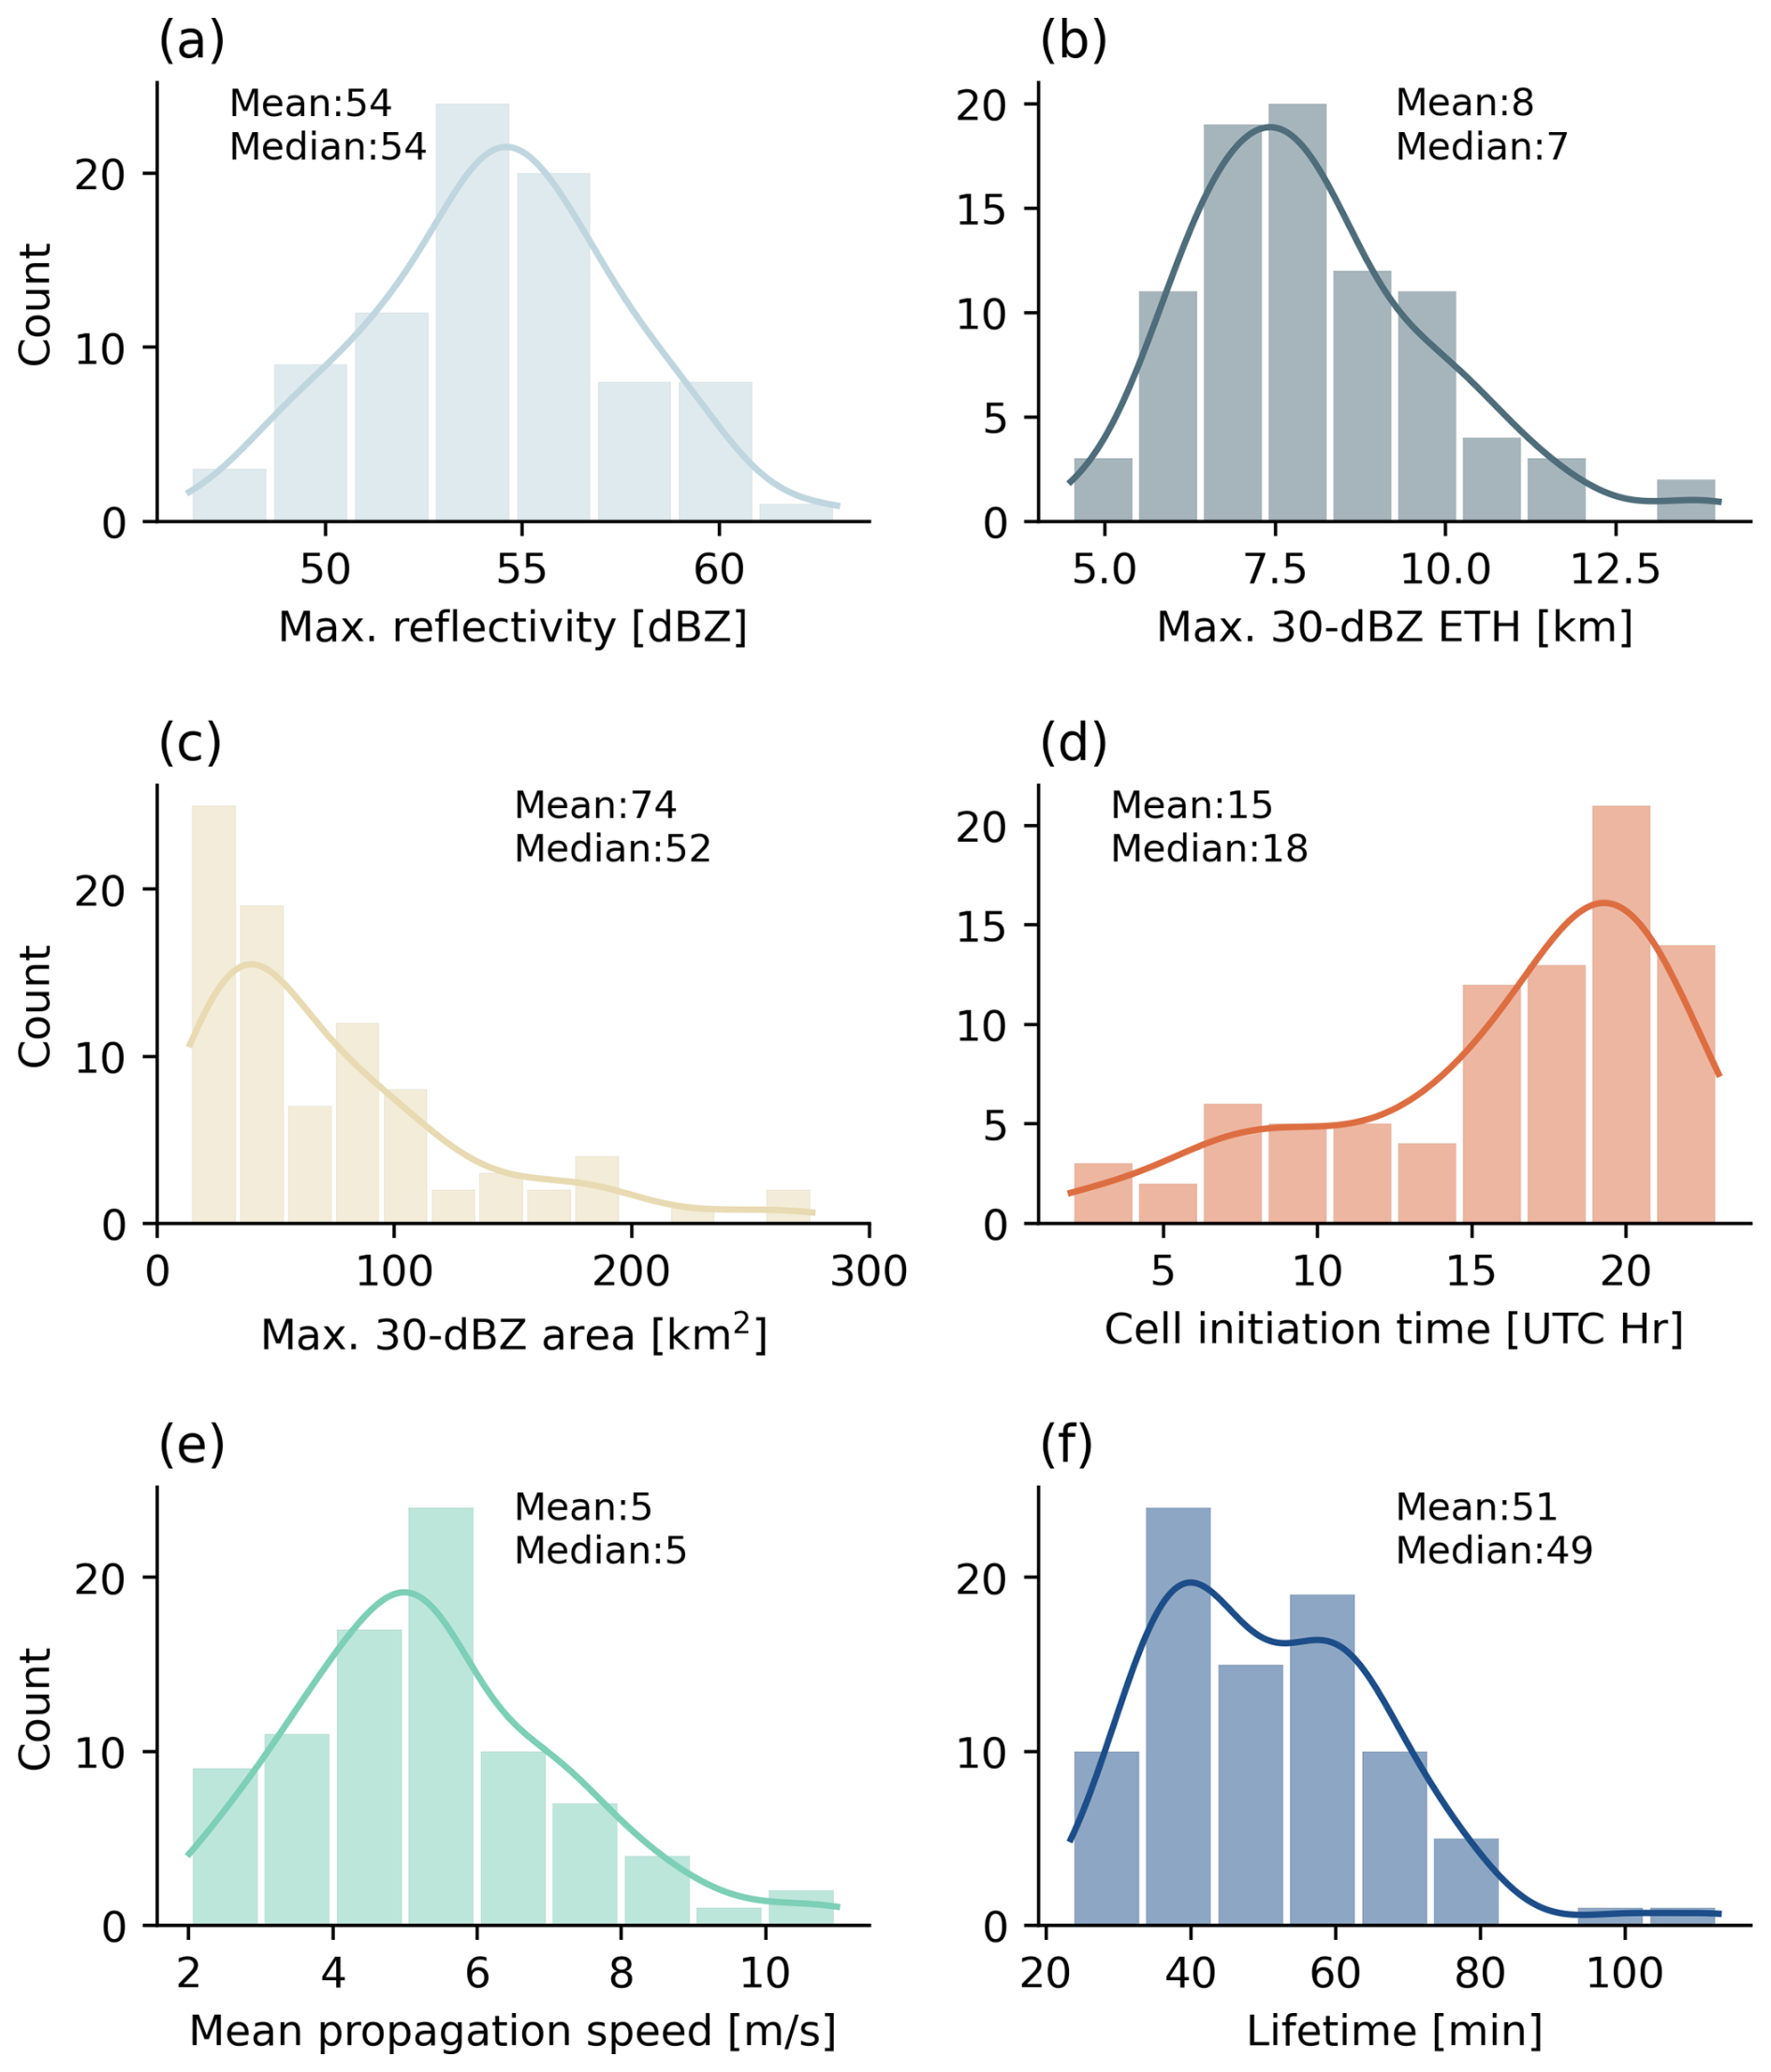
Figure 4Histograms with density kernel estimation (solid lines) of the maximum 2 km radar reflectivity, 30 dBZ ETH, and 30 dBZ rainfall core area along with initiation time, mean propagation speed, and lifetime for each DCC rainfall core identified within a radius of 50 km from the M1 site. The bin width is set to 2 dBZ for (a), 1 km for (b), 20 km2 for (c), 2 h for (d), 0.5 m s−1 for (e), and 10 min for (f).
Figure 5 illustrates the spatial distribution of DCC properties, showing a notable cluster along a line perpendicular to the coastline and northwest of the M1 site. This pattern can potentially be attributed to the interplay between sea breeze, bay breeze, and urban-heat-island-induced circulations, which may create a conducive environment for DCC initiation and/or collisions (Mejia et al., 2024). Such events appear to result in larger cell areas, as depicted in Fig. 5c, and slightly longer lifetimes compared to cells located outside this zone (Fig. 5f), consistent with findings by Hahn et al. (2025). Additionally, it is observed that these cells tend to initiate later in the day (Fig. 5d), aligning with the timing of sea- and bay-breeze propagation and their convergence with urban heat island circulations in this region. Note that the spatiotemporal heterogeneity of these precipitation cores adds complexity to our study, as it relies on point measurements of environmental variables. While this approach is a practical solution given the absence of a comprehensive measurement network during TRACER, it highlights the need for long-term field campaigns with enhanced instrumentation to achieve better spatial coverage across regions with complex multiscale forcings.
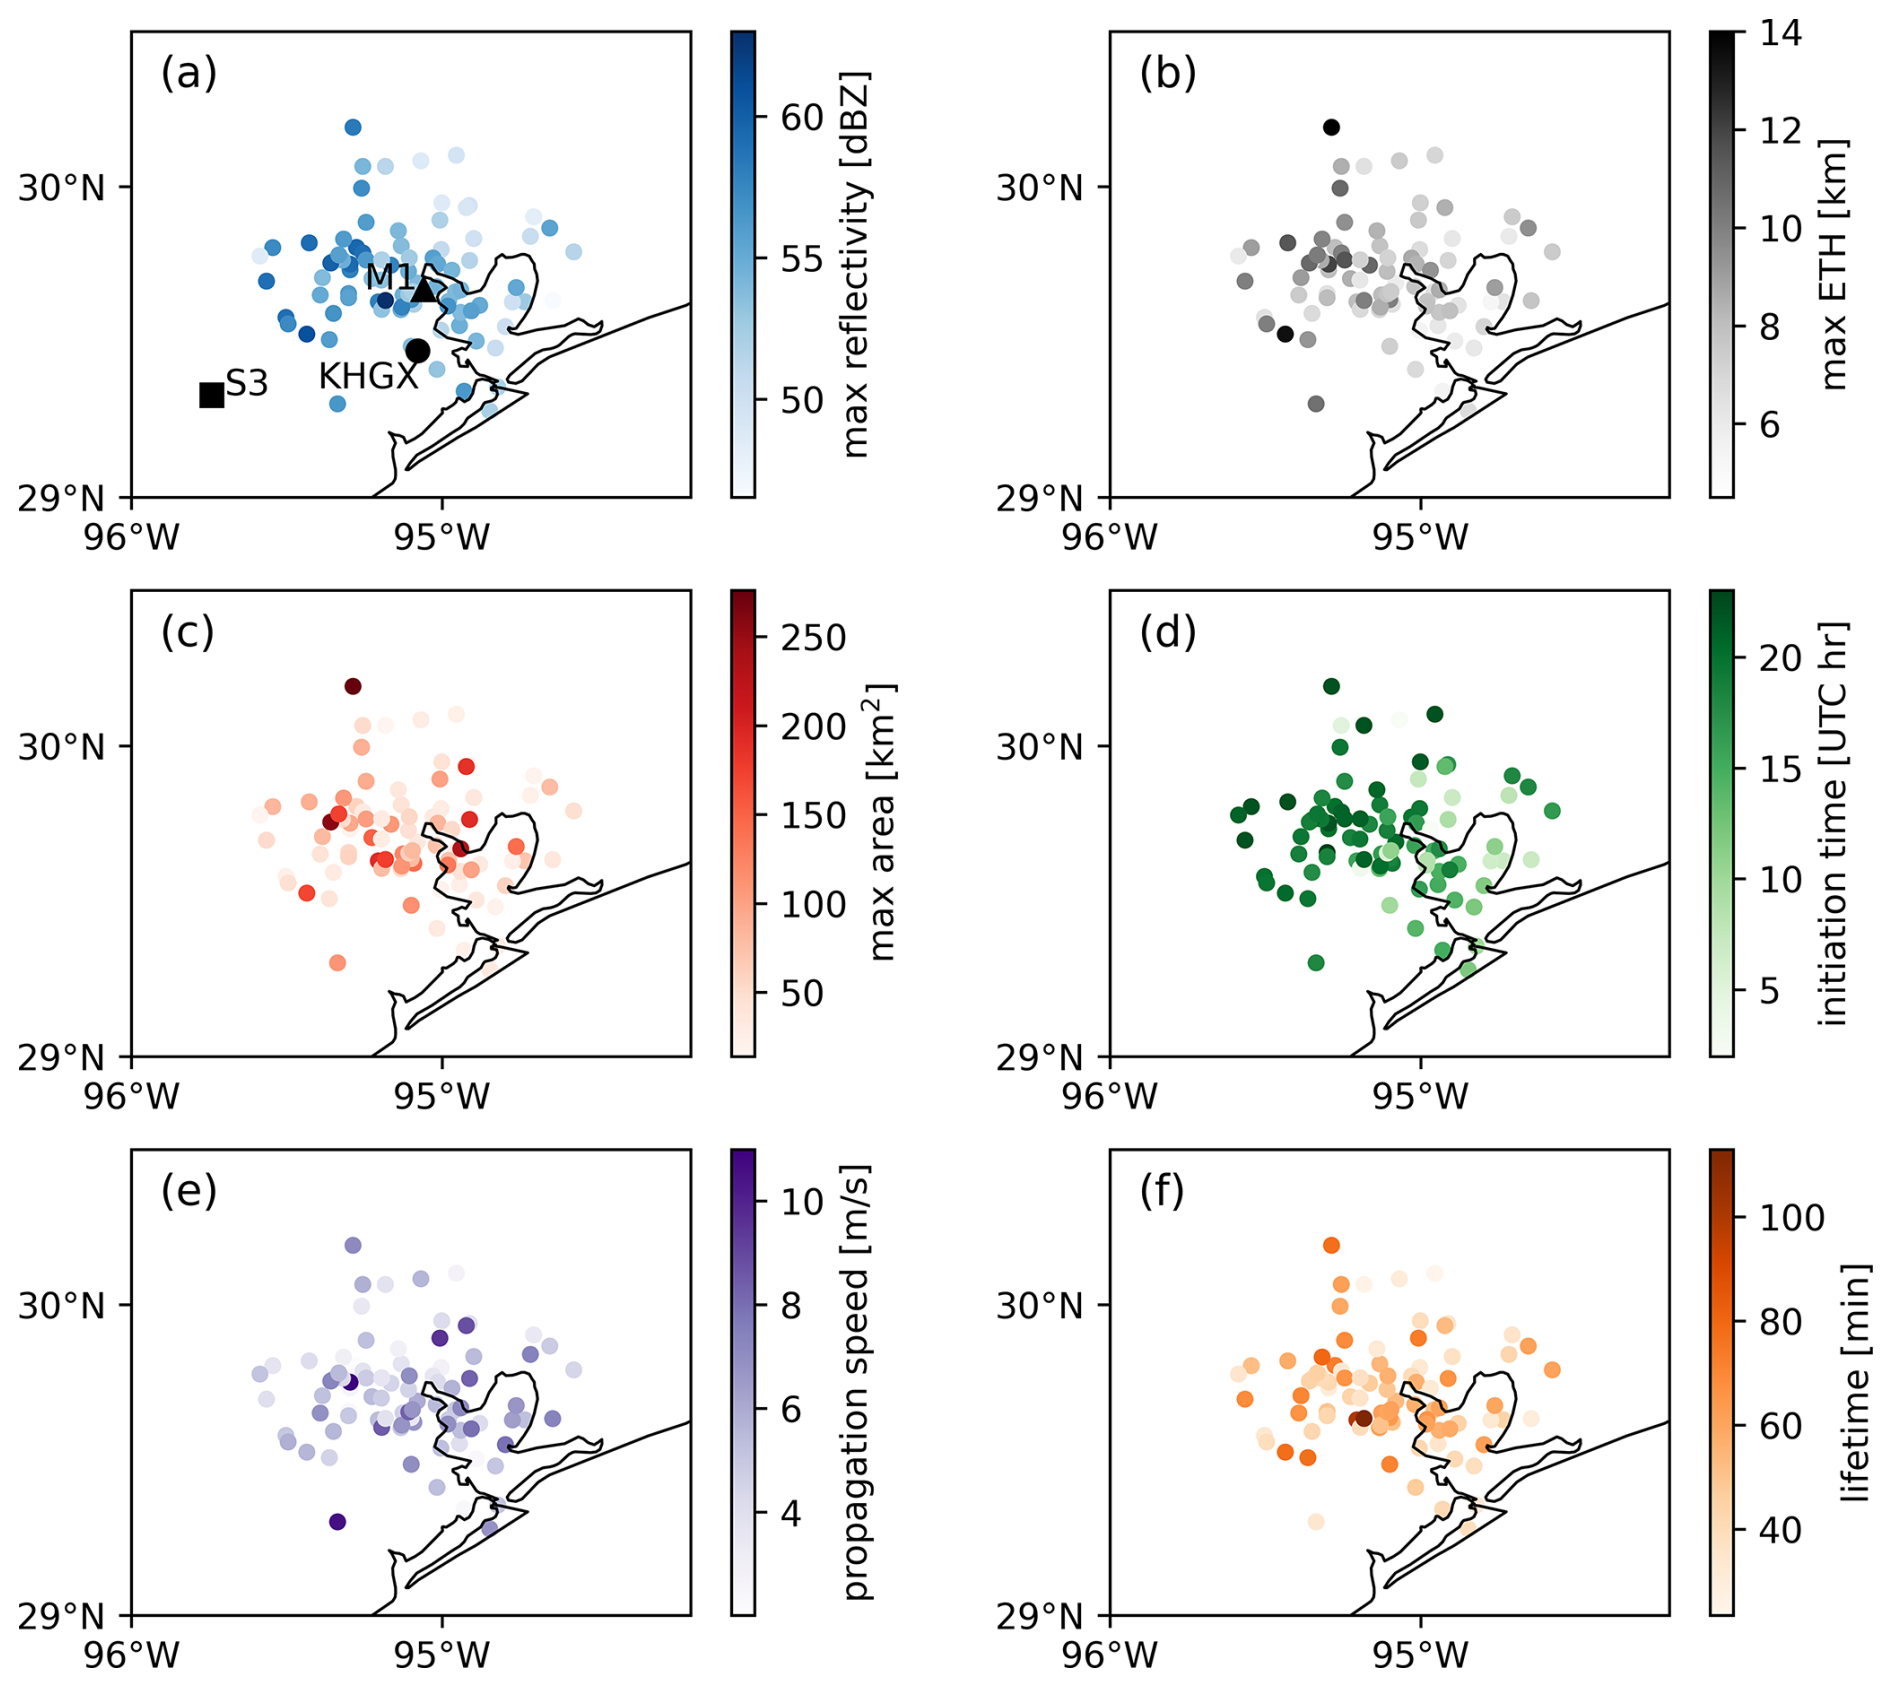
Figure 5Dots indicate locations where the cell ETHs are maximized on maps for cells initiated within 50 km of the M1 site. The colors in these panels indicate cell properties as shown in Fig. 4.
Throughout the DCC days, the Houston–Galveston region experienced diverse aerosol number concentrations. As shown in Fig. 6, the distribution of aerosol number concentrations spans a considerable range, with a prominent peak at smaller-number-concentration bins. The mean values of these SS-determined distributions are significantly different according to results from a t test, except for Nccn1 and Nccn08. More specifically, this environment exhibits mean total aerosol number concentrations of 7332 cm−3 for Ncn and 10 683 cm−3 for Nufp during the study period (Fig. 6g, h), showing high pollution levels. The most polluted instances occurred in mid-July (e.g., 12, 13 July) and mid-August (e.g., 10, 11, 17 August), exceeding the 95th percentile values of the distributions shown in Fig. 6.
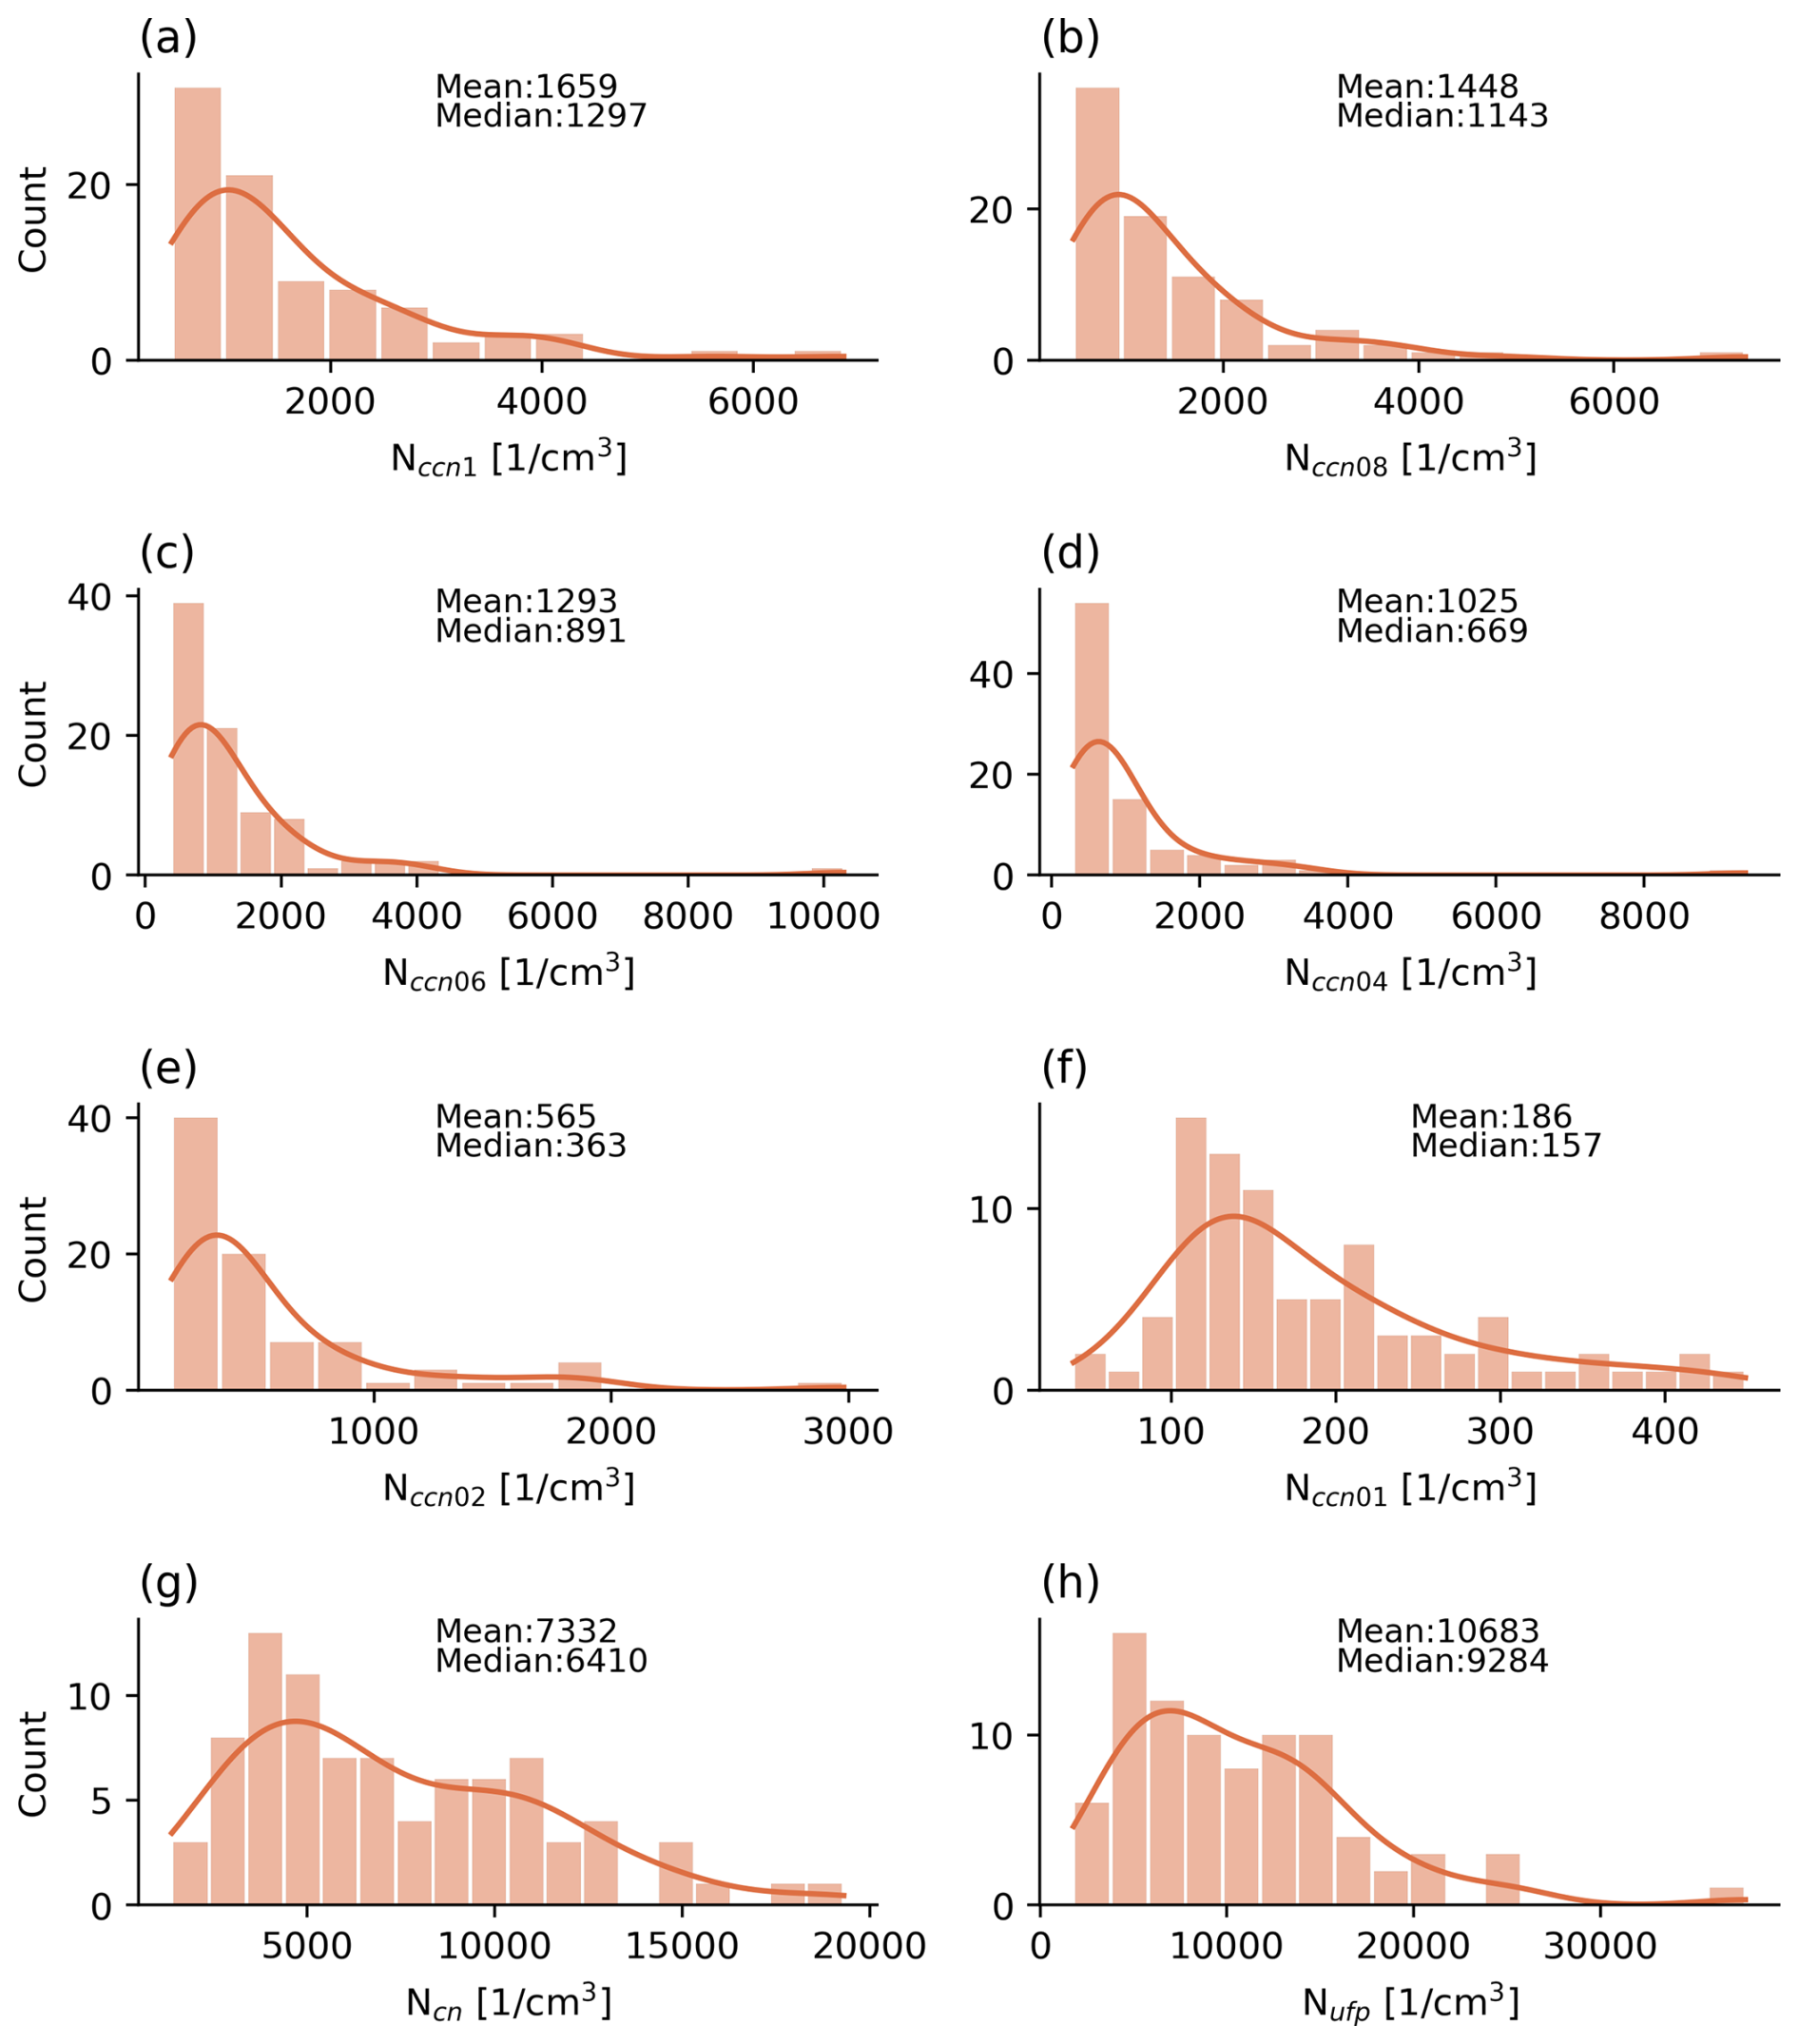
Figure 6Histograms with density kernel estimation (solid lines) of CCN number concentrations measured at different SS levels and total aerosol number concentrations for DCC cases identified within a radius of 50 km from the M1 site. The bin width is set to 500 cm−3 for (a–d), 200 cm−3 for (e), 20 cm−3 for (f), 1000 cm−3 for (g), and 2000 cm−3 for (h).
In addition, the Houston–Galveston region is found to have a unique combination of different aerosol species during the summer months (Fig. S4), according to the aerosol composition measurements from the aerosol chemical speciation monitor (ACSM) at the M1 site. The predominant aerosol type measured is total organics, constituting 49 % (2.24 µg m−3) of the total aerosol mass concentration, followed by sulfate at 34 % (1.54 µg m−3), ammonium at 13 % (0.61 µg m−3), nitrate at 3 % (0.14 µg m−3), and chloride at < 1 % (0.03 µg m−3). This broad spectrum of aerosol species and their mass concentration is indicative of diverse emission sources, including both anthropogenic (e.g., from city, ships, refineries; Rivera et al., 2010; Wallace et al., 2018) and natural emissions (e.g., from agricultural activities, vegetation; Bean et al., 2016; Yoon et al., 2021) from nearby and/or distant locations.
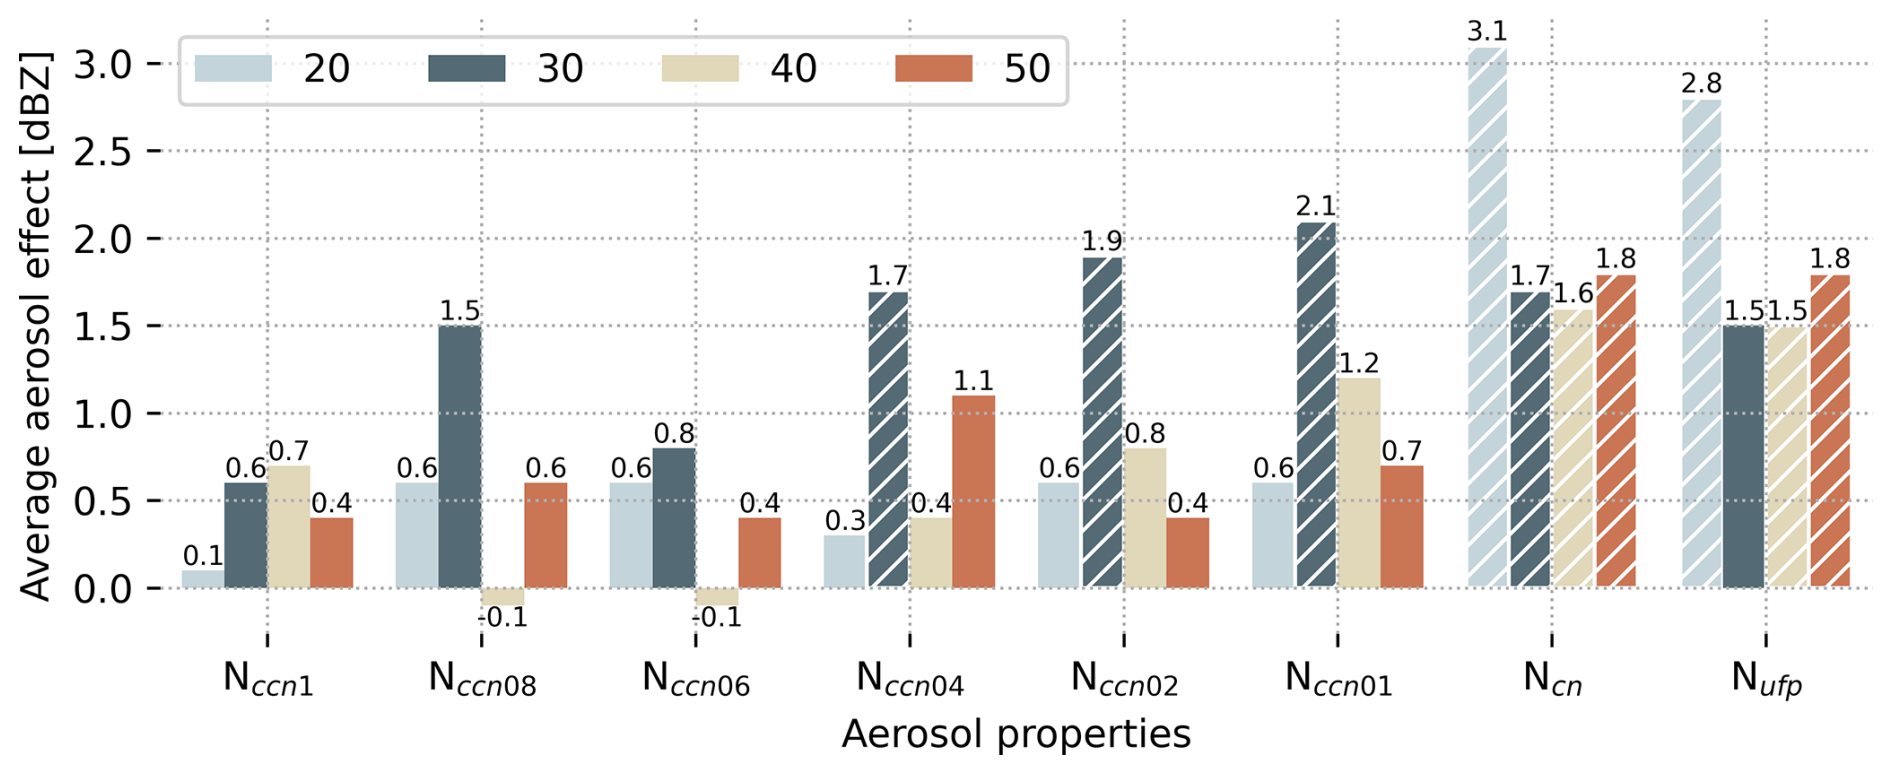
4.2 Average aerosol effects on DCC ETH
Figure 7 illustrates the estimated average effect of aerosol number concentration on 30 and 15 dBZ ETH for all scenarios and varying distances (20 to 50 km) from the M1 site. The “valid” scenarios are indicated by the white hatch lines, representing cases with a relatively higher association between aerosol number concentration and ETH. The confounding meteorological variables are calculated using the most unstable parcel in this figure, and the post-sounding aerosol averaging method is used.
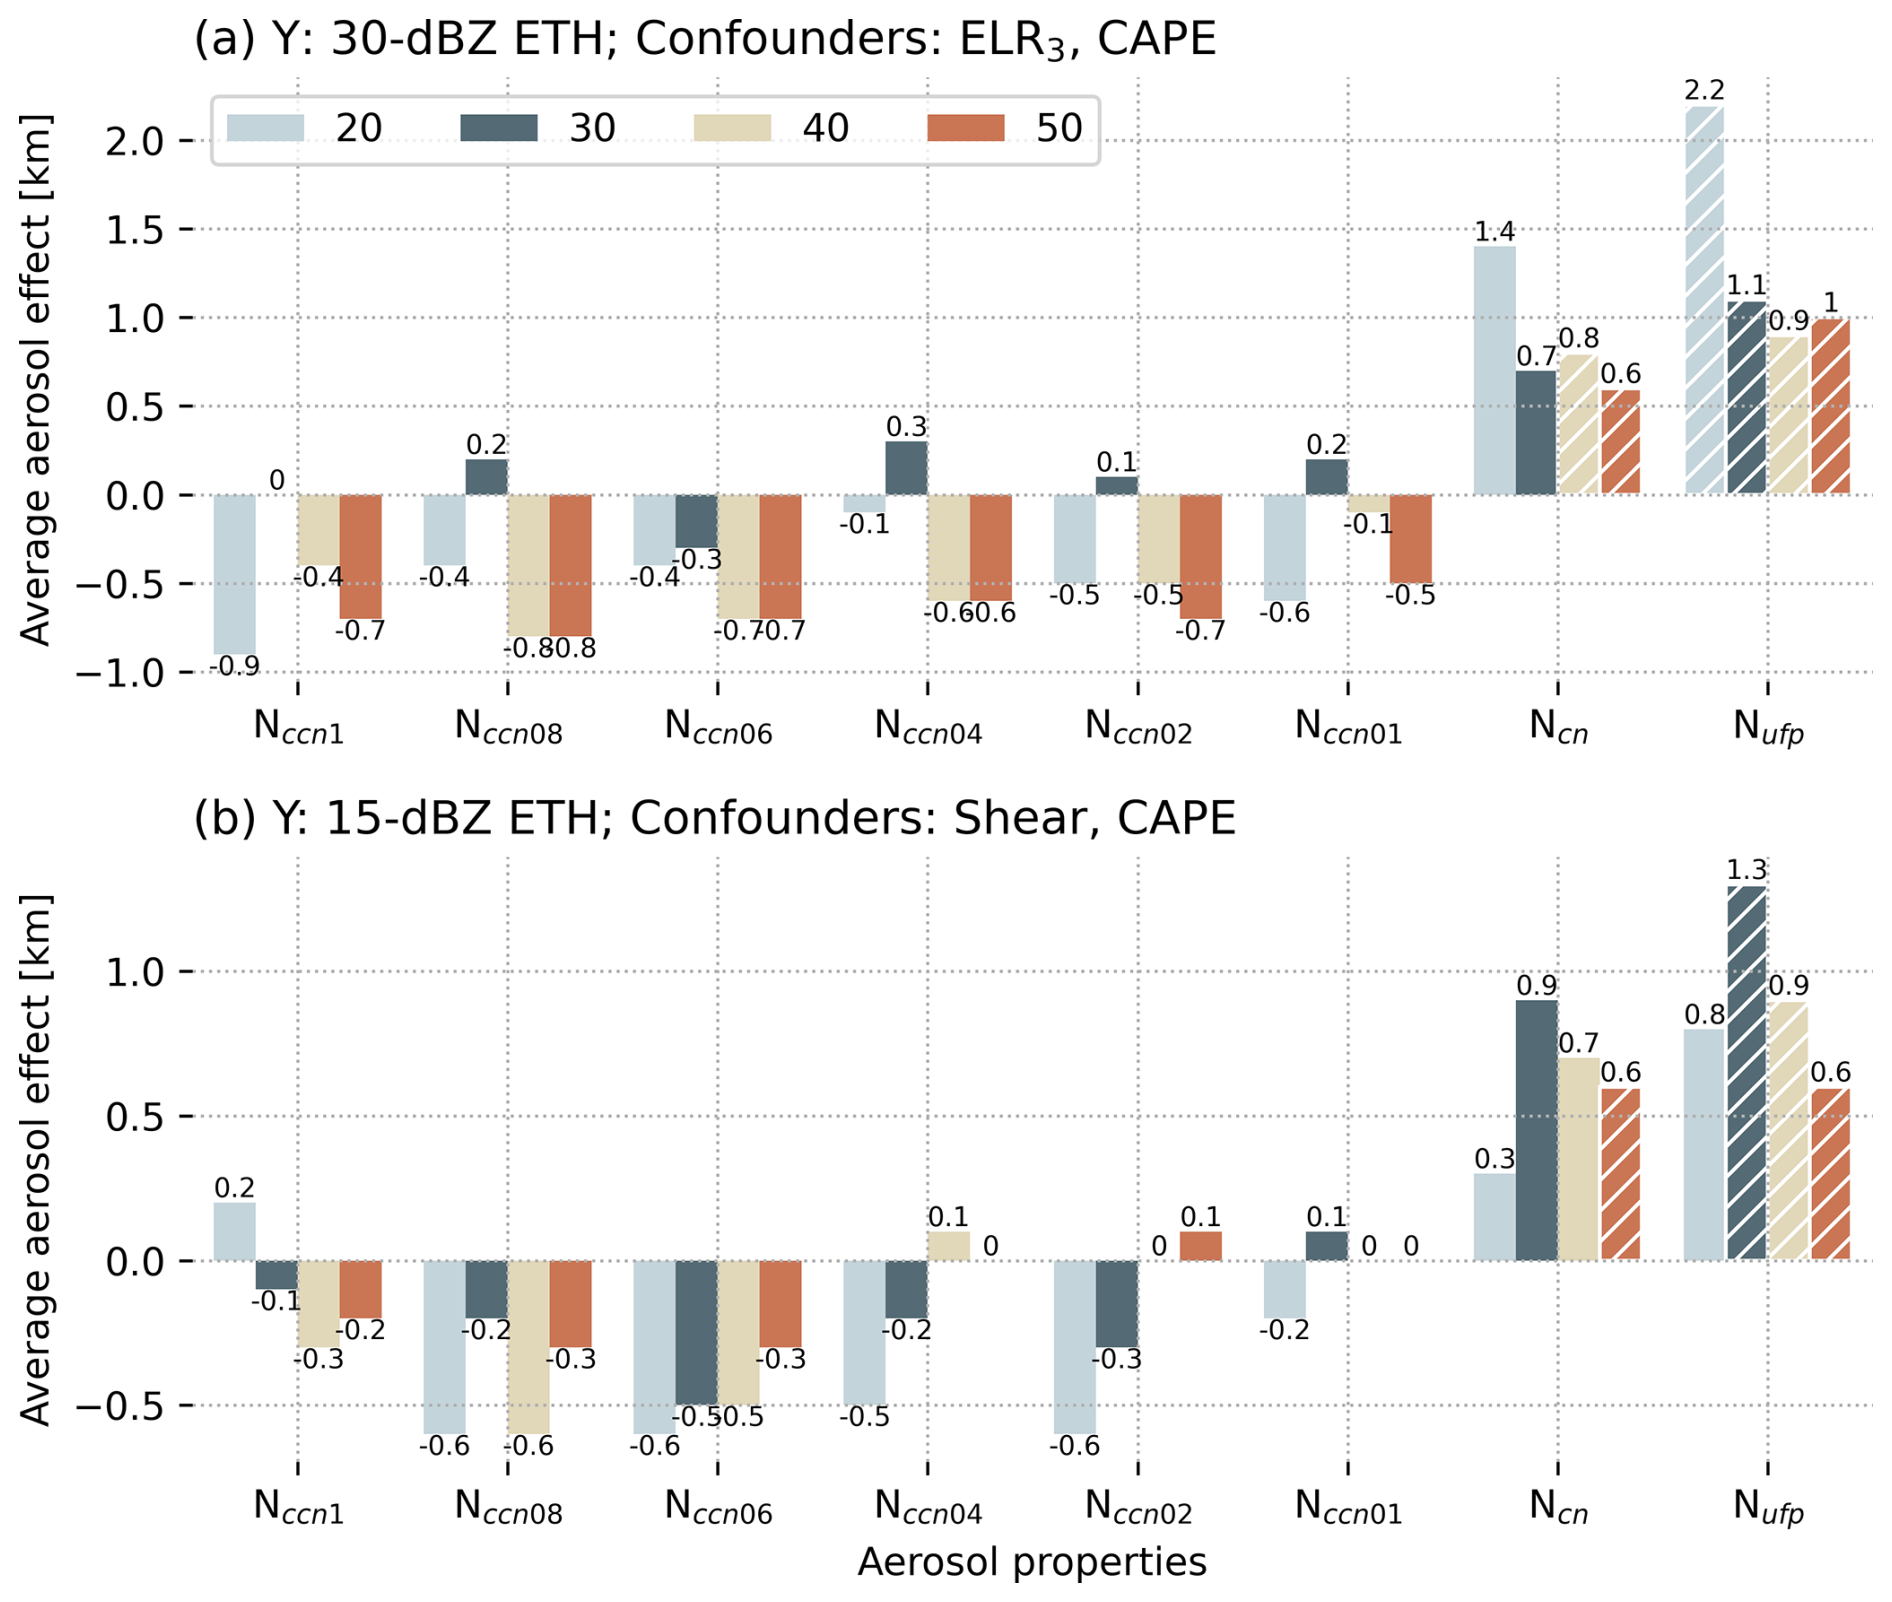
Figure 7Average aerosol effects on (a) 30 dBZ ETH and (b) 15 dBZ ETH estimated for each potential exposure variable. Different colors represent different maximum distances between measurements of environmental variables and DCC properties. The meteorological variables are calculated using ARM soundings (6 h) when assuming that the most unstable parcel would rise to form convection. The white hatch lines indicate “valid” results.
The findings reveal a positive average aerosol effect for Ncn and Nufp with values ranging from 0.7 to 2.2 km. It implies that higher aerosol number concentration values correspond to an increase in 30 dBZ ETH within DCCs, thereby suggesting a deeper DCC in polluted conditions compared to that in clean conditions. We observe similar results when using 15 dBZ ETH as the dependent variable and when using different air parcels for calculating confounding variables, as illustrated in Table 3.
Interestingly, for the remaining scenarios, the estimated average aerosol effects are mostly negative (Fig. 7), highlighting the potential for contradictory results when a different aerosol variable is used in the analysis. Even for the “valid” scenarios, the significance of the estimated aerosol effects is challenged by the inconsistent 95 % confidence intervals for the coefficients of the aerosol variables in the fitted MLR models (Table S4). Specifically, the 95 % confidence intervals for the aerosol variables sometimes cross 0, making it difficult to conclude that the aerosols have a clear and meaningful relationship with the ETH. This finding is consistent with the relatively small or minimal average aerosol effects observed for these scenarios in Figs. 7 and 8. These aerosol effects could also be likely within the natural variability of these variables and the uncertainty range of the measurements or may be influenced by the sampling methods used.
In a separate test, we ran the MLR model without any confounders, and we found that the estimated mean aerosol effects on 30 dBZ ETH across all “value” scenarios increased by about 0.4 km. These results highlight the importance of controlling for confounders while quantifying aerosol impacts on convective properties.
We also conducted a sensitivity test to examine whether the diurnal cycle affects the estimated aerosol effects on ETH. The results indicate that the average aerosol effects are only around 0.1 km lower than those presented in Fig. 7 for those “valid” scenarios, where the diurnal cycle was not controlled for. This suggests that the diurnal cycle has a limited influence on the aerosol effects on ETH under the specific environmental conditions of this study.
Note that the observational findings presented in this study do not unequivocally lend support to or negate the warm-phase invigoration pathway. The role of in-cloud SS is vital in determining the occurrence of warm-phase invigoration within DCCs (e.g., Romps et al., 2023). Unfortunately, direct in situ measurements of SS within convective updrafts remain unavailable, despite estimates using aircraft measurements for limited climate and vertical velocity regimes (e.g., Politovich and Cooper, 1988; Pinsky and Khain, 2002; Korolev and Mazin, 2003; Prabha et al., 2011; Romps et al., 2023).
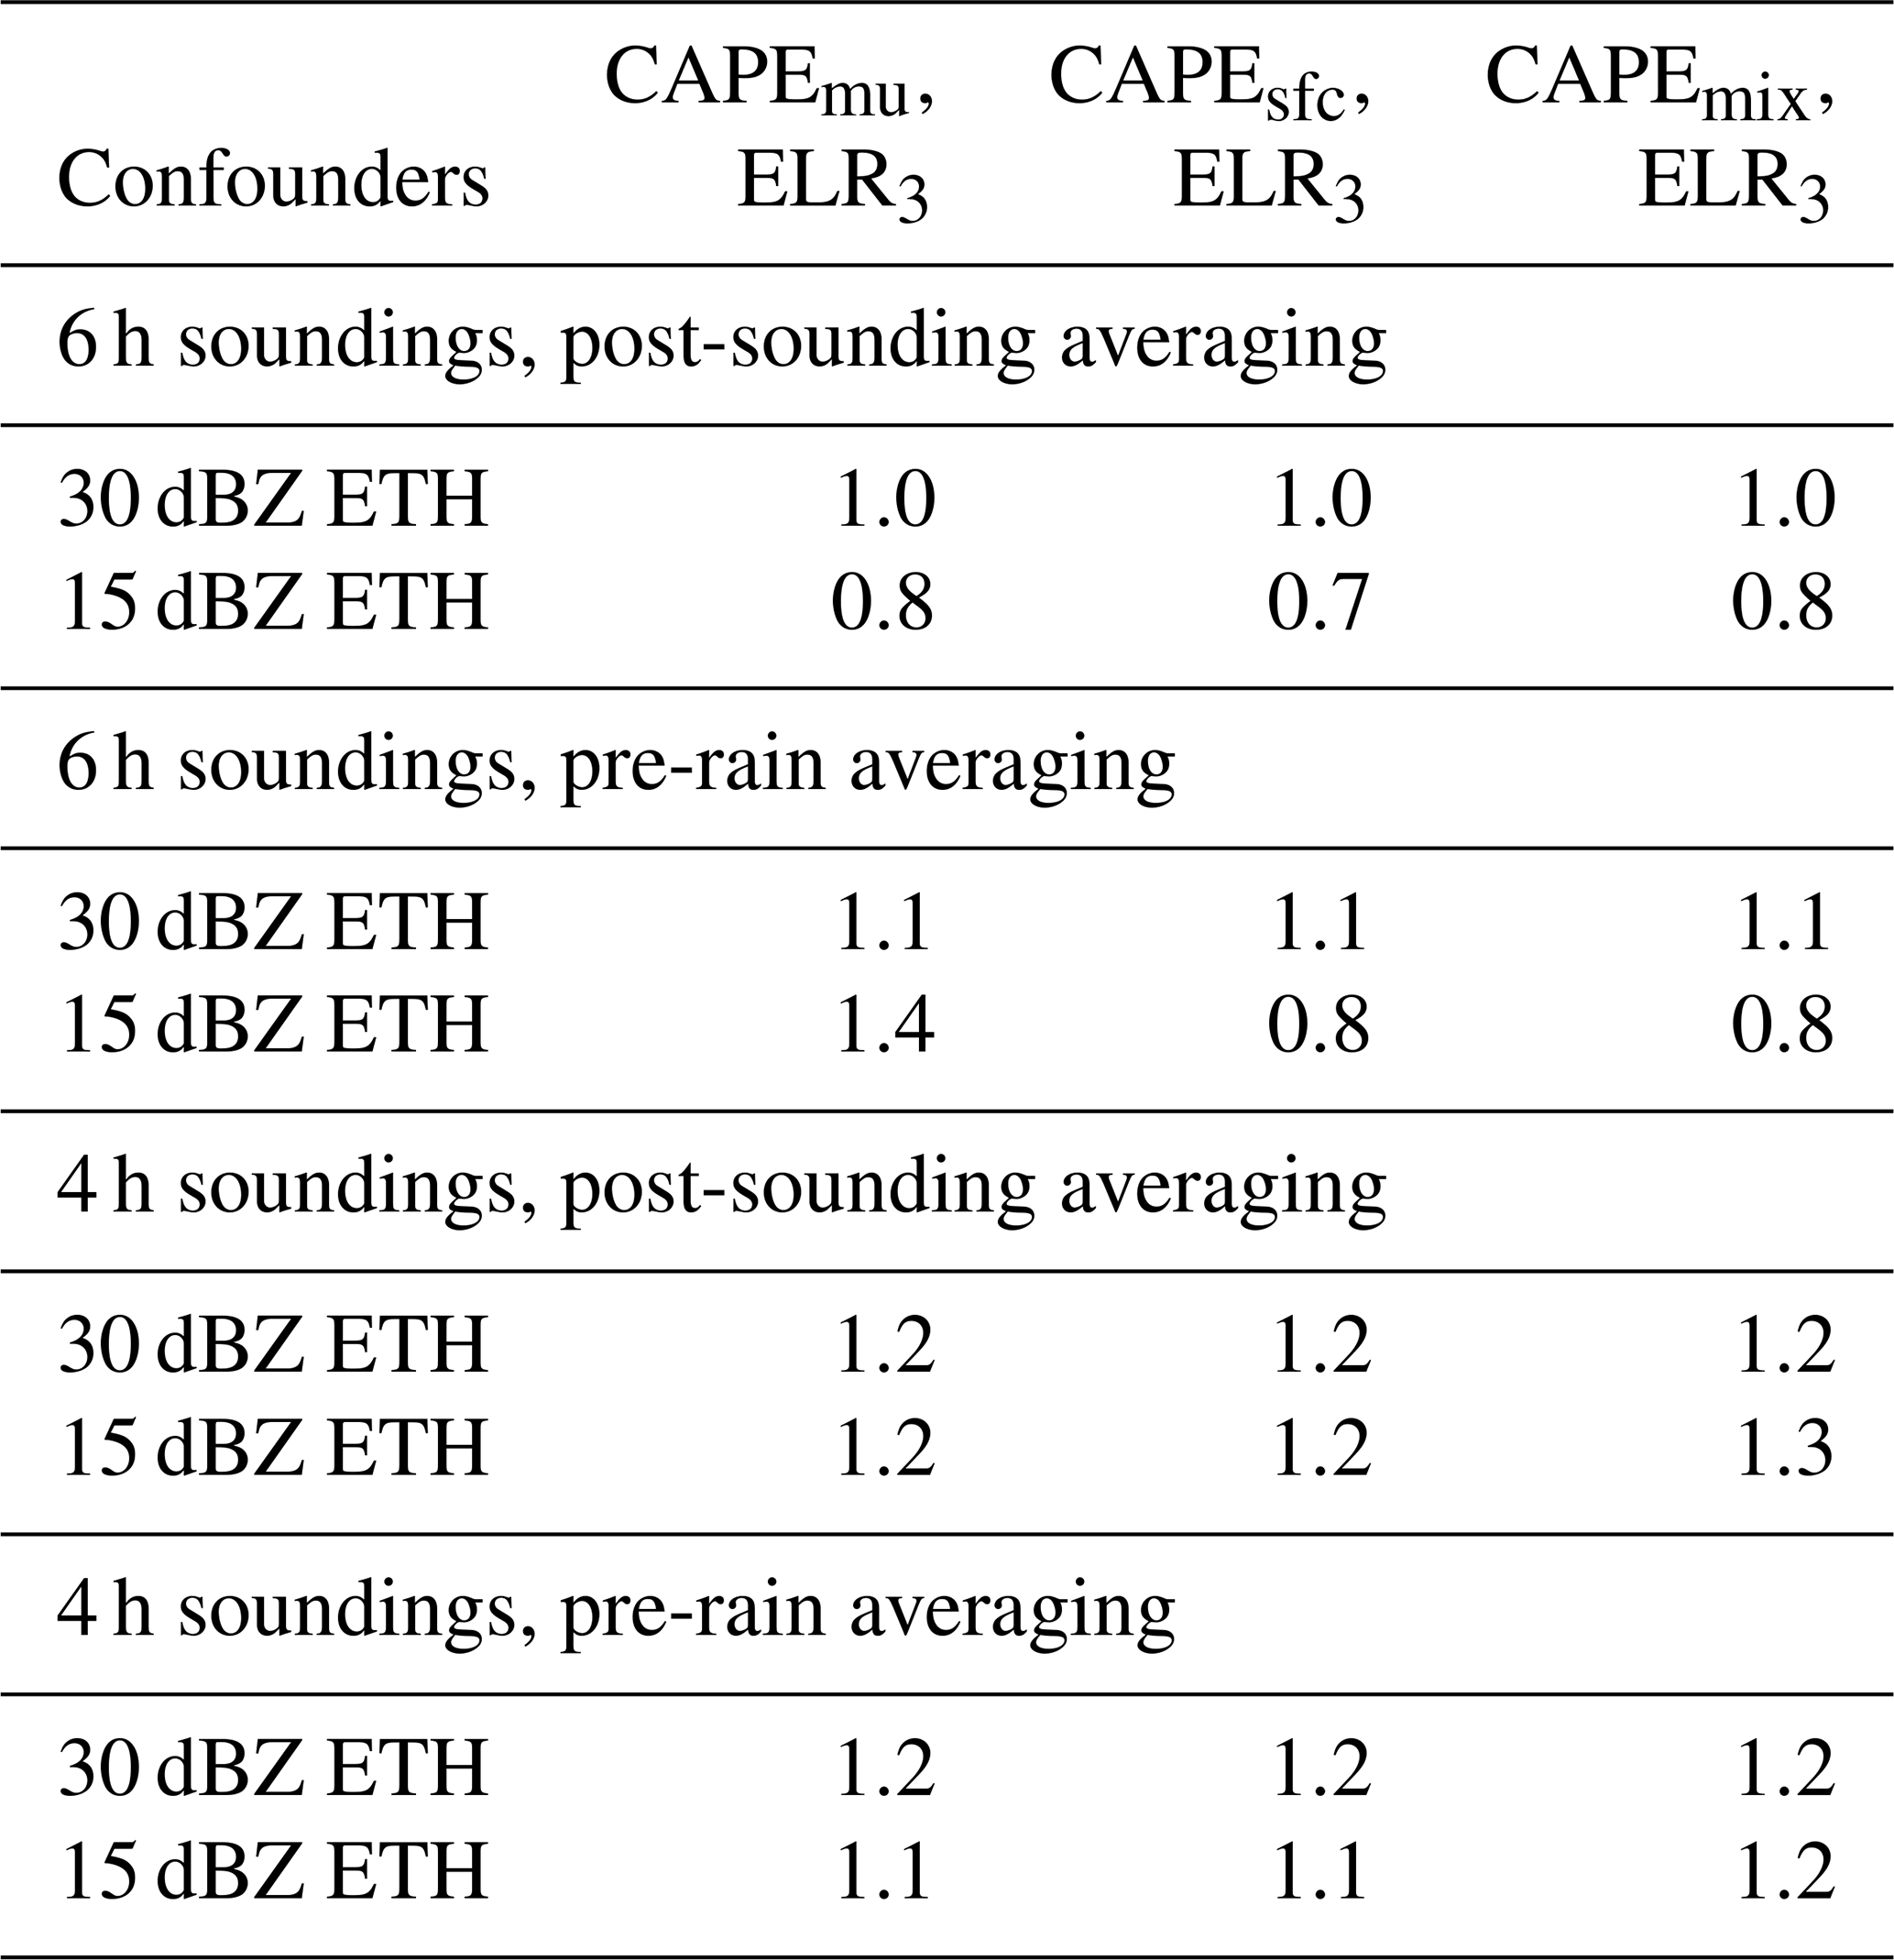
Table 3Average aerosol effects on ETH (km) using different confounders and dependent variables when using Ncn and Nufp as independent variables.
Similarly, the presented aerosol effects do not conclusively confirm or reject the possibility of other hypothesized aerosol invigoration mechanisms (e.g., cold-phase, humidity entrainment invigoration). As shown in Fig. 4b, a substantial portion of the 30 dBZ ETH associated with the studied rainfall cores extends beyond 5 km. Consequently, the observed positive aerosol effects under specific conditions suggest potential evidence of cold-phase invigoration or partitioning between warm- and cold-phase invigoration. However, to fully support these invigoration mechanisms, we need to further assess the relative importance of additional latent heat release and hydrometeor loading (e.g., Igel and van den Heever, 2021). Testing for the presence of these mechanisms requires supporting measurements of hydrometeor and latent heating profiles in the convective updraft region, which were not available during the majority of the TRACER IOP. Moreover, while entrainment is found to alter aerosol–DCC interactions (e.g., Peters et al., 2023), the absence of direct measurements of convective vertical velocity presents a challenge in evaluating the significance of this process.
In summary, we quantify the average aerosol effects on ETH using observational datasets. However, gaining a comprehensive understanding of the plausible pathways driving aerosol-induced effects on ETH necessitates advanced instrumentation and specific field campaign designs, which are capable of capturing SS levels, measuring vertical velocity within updrafts, and understanding the intricate dynamics and microphysical processes occurring within DCCs.
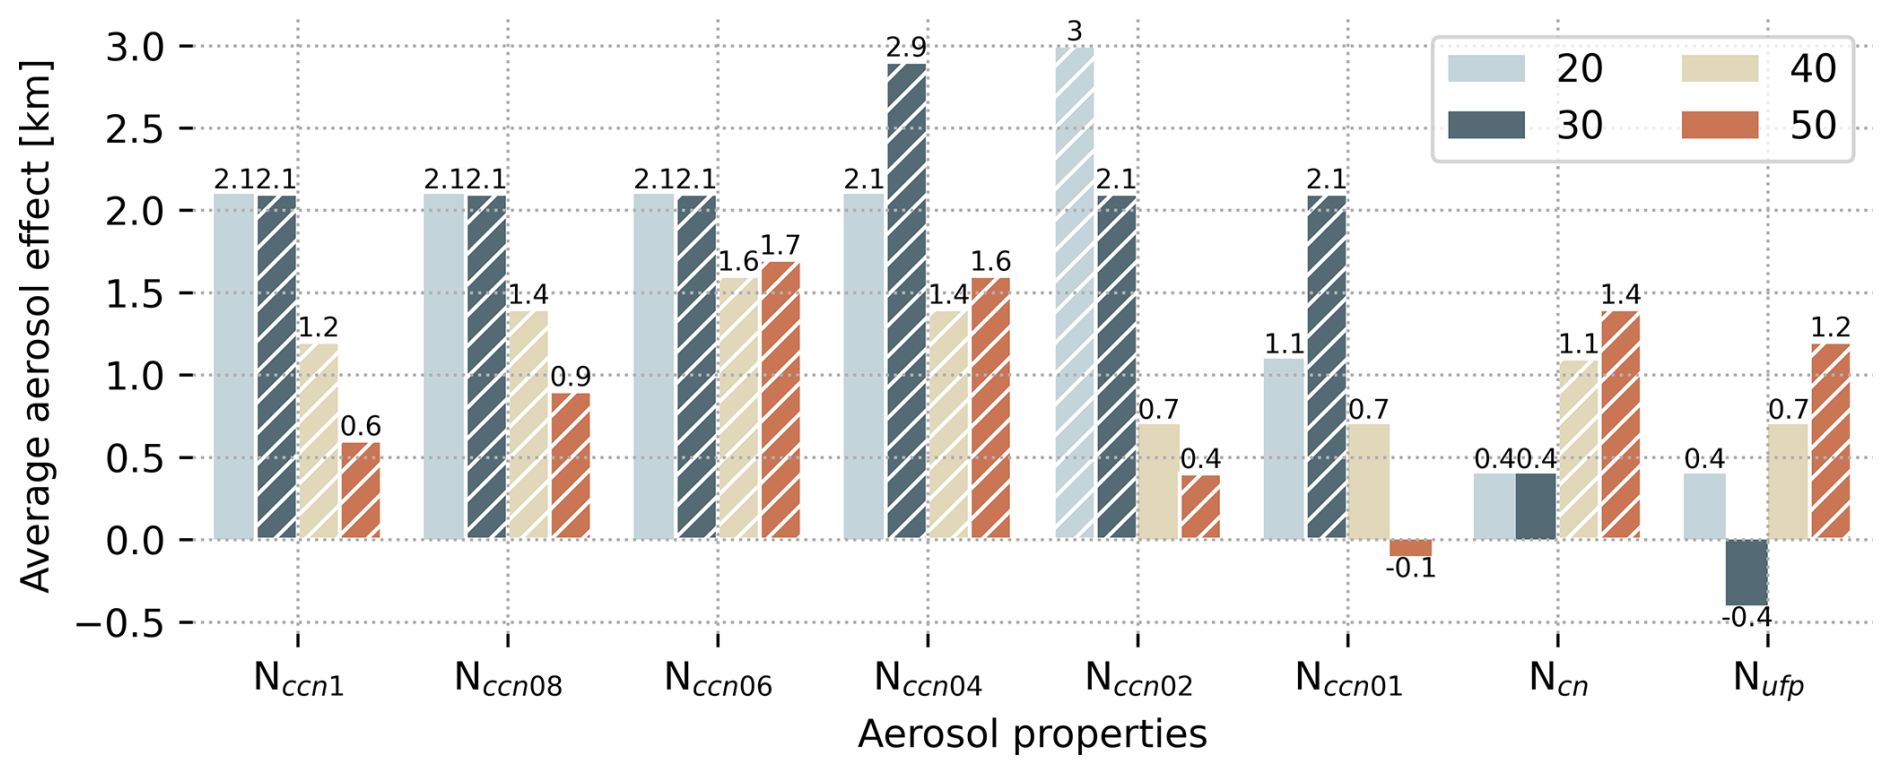
Figure 8Average aerosol effects on 30 dBZ ETH estimated for each potential exposure variable after controlling for confounders (ELR3 and CAPE) for DCCs identified during sea-breeze days only. The post-sounding aerosol averaging period is considered. Different colors represent different maximum distances between measurements of environments and DCCs. The meteorological variables are calculated using ARM soundings (6 h) when assuming that the most unstable parcel would rise to form convection. The white hatch lines indicate “valid” results.
4.3 Impacts of the sea-breeze circulations on aerosol–DCC interaction
The ARM M1 site is located close to Galveston Bay (6 km) and the Gulf of Mexico (50 km), frequently experiencing bay- and gulf-breeze circulations (simplified as sea-breeze circulations in the following text) during the summer months (Wang et al., 2024). Despite focusing on cases within the anticyclonic regime to exclude large-scale ascent contributions to the development of DCCs, sea-breeze fronts can still act as mesoscale forcing mechanisms, inducing upward motions within the boundary layer and influencing aerosol–DCC interactions.
Our recent study (Wang et al., 2024) indicates that at least 44 % of the DCC rainfall cores analyzed here are associated with days on which these circulations and boundaries are observed to cross the ARM M1 site. In that study, we identified sea-breeze circulation days based on observations from NEXRAD, Geostationary Operational Environmental Satellites (GOES), and ARM surface meteorology data (e.g., wind fields, water vapor mixing ratio). Specifically, 64 sea-breeze circulation cases were identified during the TRACER IOP. As shown in Table 1, 38 rainfall cores, with a sounding launch within 6 h prior to rainfall initiation, were tracked during these days within 50 km of the ARM M1 site in this study.
We applied the MLR model to DCCs that are associated with sea-breeze circulations, maintaining the same confounding variables since they showed moderate correlations with both ETH and aerosol variables (R values ranging from 0.4 to 0.5). Figure 8 illustrates the average aerosol effects on 30 dBZ ETH, which is around 1.4 km for these “valid” cases. It is higher than estimates for scenarios including all cases. This enhanced effect could be due to the potential exclusion of confounding variables that are not major contributors to non-sea-breeze cases. One important variable could be boundary layer updrafts, which consistently increase at the leading edge of sea-breeze fronts as observed from the Doppler lidar measurements (Wang et al., 2024). Since this observation is only available at the ARM M1 site and not for each tracked rainfall core, it is challenging to include this confounding variable. The exclusion of this confounding variable may lead to an overestimation of the aerosol effects on ETH as discussed in the previous section.
Interestingly, we found more “valid” models (19) for the sea-breeze cases compared to scenarios including all cases. This suggests that the aerosol influence is a robust signal here, even though the extension of the ETH is not more than 15 %. This robustness may be due to the coherent separation of clean versus polluted cases when using different exposure variables. This is supported by the observations that the DCC environment is much cleaner after the passage of sea-breeze fronts.
4.4 Average aerosol effects on precipitation intensity and area
In this subsection, we extend our investigation to estimate the impacts of aerosols on precipitation intensity and area. Precipitation intensity is assessed using the maximum 2 km radar reflectivity, while precipitation area is evaluated based on the maximum area with 2 km Z > 30 dBZ of the tracked precipitation core throughout the cell life cycle. All steps in our methodology remain the same for these applications, except that the dependent variable is either maximum radar reflectivity or precipitation core area instead of ETH. The confounding variable considered in this analysis is only CAPE, as it is the only one that shows a correlation coefficient higher than 0.3 with both ETH and aerosol properties.
Figure 9 presents the aerosol effects on the core area for different potential exposure variables. Only one model is “valid”, which corresponds to the scenario with DCCs identified within 30 km of the M1 site using Nccn measured at SS of 0.8 %. This finding implies that only on rare occasions does the aerosol number concentration impact the precipitation core area expansion by approximately 39 km2. Given the fact that this area expansion is only observed in limited scenarios, it is less conclusive compared to the effects of aerosols on DCC ETH.
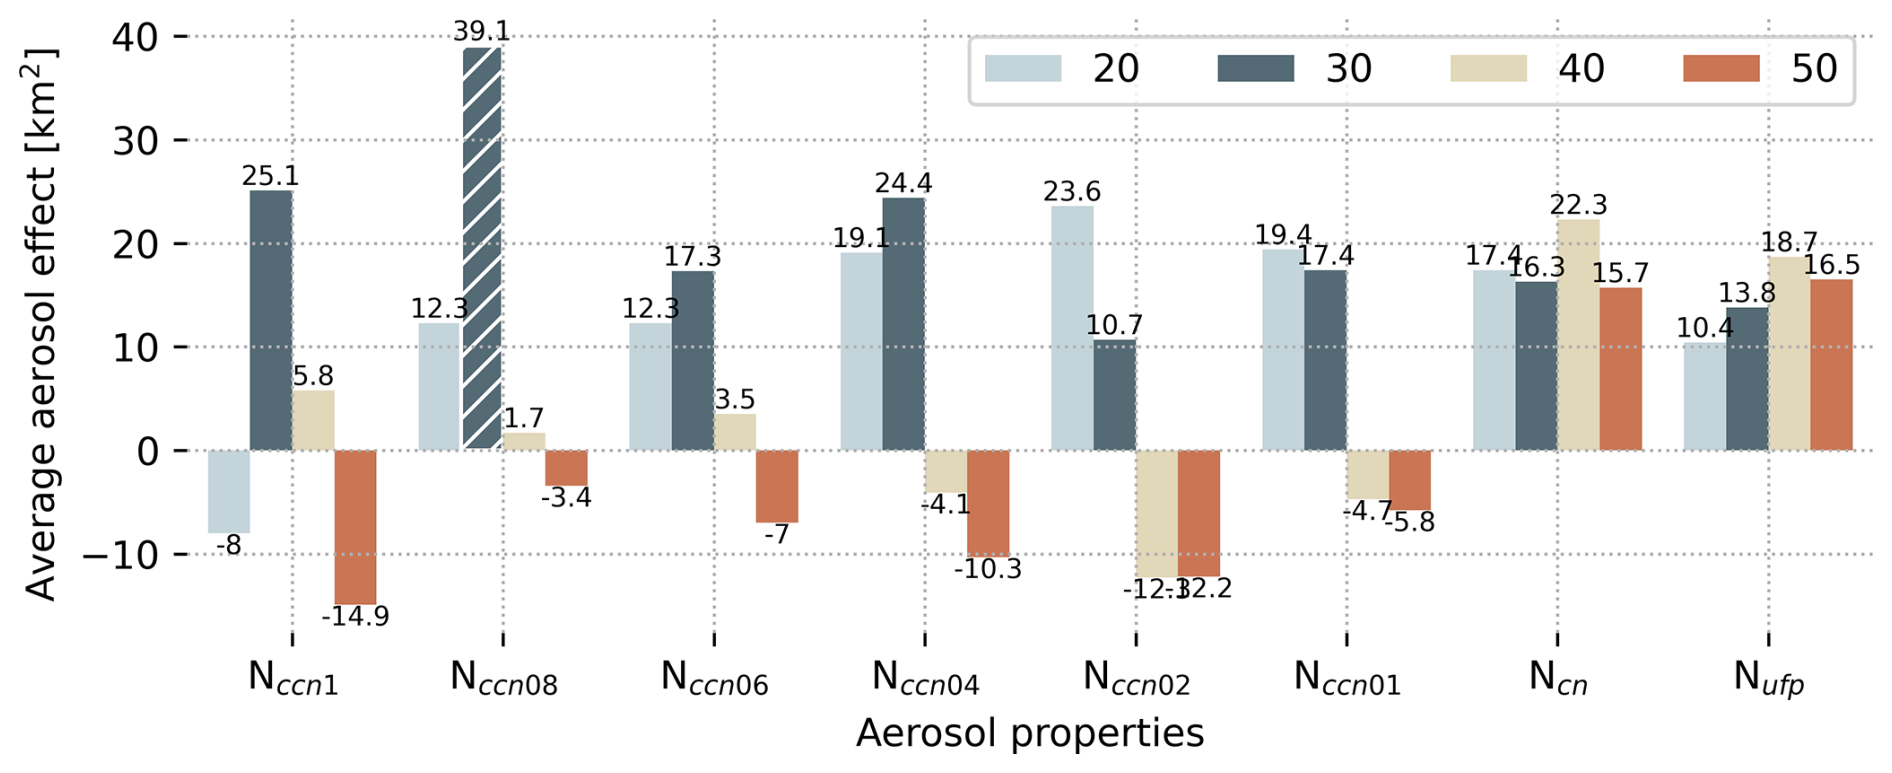
Figure 9Same as Fig. 7a but for cell area as the dependent variable and CAPE as the confounding variable.
Regarding the aerosol effects on precipitation intensity, Fig. 10 shows 10 effective models, significantly more than those considering core area as the dependent variable. Although the mean aerosol effect across all “valid” scenarios is positive, the magnitude is around 2 dBZ, which falls within the uncertainty range of NEXRAD (3 dBZ; Gou, 2003; Ryzhkov et al., 2005). Therefore, we cannot conclusively determine that aerosol loading results in heavier precipitation for the DCC cases evaluated in this study.
4.5 Sensitivity of the aerosol effect estimation
We explore the robustness of aerosol effect estimates by examining various factors that could influence the calculations. These factors include the data averaging period for aerosol measurements and the time gap between environmental measurements and DCC rainfall initiation (e.g., Nelson et al., 2021; Fast et al., 2024).
When using the pre-rain method for the aerosol averaging process, as shown in Fig. 1b and d, we observe that the effective aerosol properties remain consistent with those obtained using the post-sounding method (Fig. 1a, c), involving Ncn and Nufp. The mean positive aerosol effects on 30 and 15 dBZ ETH when using Ncn and Nufp aligns closely with the results obtained using the post-sounding aerosol averaging method (Table 3). These findings suggest that our results have minimal sensitivity to the data averaging period for the measured aerosol properties used in this study.
Regarding the influence of the time gap between measurements of DCC and environmental properties on the estimation of the average aerosol effect, we exclude the cases when the nearest soundings were launched more than 4 h before the initiation of DCC rainfall cores. As shown in Table 3, the mean aerosol effect on 30 dBZ ETH and 15 dBZ ETH across all “valid” scenarios are very similar to results using 6 h soundings.
The shorter the time difference, in theory, the more accurately the sounding measurement should represent the environment in which the DCCs are embedded. Therefore, these results reinforce the conclusion from previous sections, suggesting that aerosol invigoration is, for the most part, constrained and requires all aerosol particles to be activated in convective updrafts if it is to be effective. However, the number of samples is reduced by approximately 20 % when limiting our analysis to 4 h soundings. Additionally, the percentage of cases heavily influenced by sea-breeze circulations also changes. These changes could all potentially impact the estimated aerosol effects.
In summary, the assessment of aerosol effects appears to be independent of the timing of environmental measurements relative to the initiation of DCCs and the accuracy with which these measurements reflect the air ingested into the DCC updraft cores. Nonetheless, the collective findings indicate a restricted impact of aerosols on DCCs across all sensitivity tests conducted.
4.6 Potential uncertainties
In this study, we have accounted for important confounders that could influence the aerosol–DCC interactions according to previous studies and also our evaluations, but there may still be some confounders that we did not observe or discover that could impact our results. For example, Peters et al. (2023) discovered that entrainment rate influences whether aerosols have an impact on DCCs. Additionally, the size of the updraft core in the boundary layer prior to the cloud formation is identified as a significant factor influencing the intensity of the subsequently developed DCCs (e.g., Morrison, 2017; Mulholland et al., 2021; Takahashi et al., 2023). However, direct measurements of these quantities were not available during TRACER and most other field campaigns aimed at observing the characteristics of deep convection. The lack of confounders may possibly cause an overestimation of aerosol effects.
In the absence of in situ observations of cloud microphysical properties, the current analysis cannot account for any “direct” effects of aerosols on ETH or cloud depth through microphysical processes. The study also does not investigate the microphysical pathways through which aerosols may cause the changes in ETH. Such examinations require in situ observations and/or high-resolution model simulations, which forms a key limitation of any study aiming to explore aerosol–DCC interactions using remote sensing retrievals alone.
This study explores the aerosol effects on the rainfall core properties of DCCs, aiming to provide evidence of aerosol invigoration or enervation. Leveraging the extensive observational dataset collected during the TRACER IOP (June–September) in the Houston–Galveston region, characterized by a diverse aerosol environment, we focus on examining isolated DCCs observed during this period in the anticyclonic regime.
To identify suitable DCCs for investigation, we establish a three-step approach.
First, we exclude synoptic-scale-system-driven cases by applying a regime classification of synoptic weather patterns using the SOM method. This step allows us to focus on locally driven cases under anticyclonic regimes, which are found to be more conducive to aerosol interactions in previous studies. The selected period is characterized by low LWS, limited large-scale uplift, and moderate humidity conditions, favoring predominantly isolated DCCs driven by local factors.
Second, we track DCC cases initiated within a certain distance from the M1 site using a Lagrangian framework based on NEXRAD data. This tracking process helps determine the properties of the DCC rainfall cores, which are identified as small in size (74 km2 on average), slow-propagating (5 ms−1 on average), and short-lived (51 min on average), with predominantly afternoon initiation likely influenced by surface heating flux and/or sea-breeze circulations. In particular, 44 % of the DCC cells tracked occurred on sea-breeze days.
Finally, we use MLR to assess the average effect of aerosols on identified DCCs. In the model, we also include convective indices that covary with aerosol and DCC, (CAPE and ELR3 for 30 dBZ ETH, CAPE and LWS for 15 dBZ ETH) to account for confounding effects.
The major findings include the following.
-
We observed a range of average aerosol effects on DCC ETH, spanning from negative to positive values. In a small subset of models where aerosols were more strongly linked to ETH, we detected a positive average aerosol effect. These findings highlight the substantial uncertainty in the sign of aerosol impacts. Only under specific conditions might a more polluted environment lead to stronger convection compared to cleaner conditions, assuming all other factors remain equal. However, the in-cloud SS remains unobserved, and thus the activation of aerosol particles is uncertain.
-
When assessing the impacts of sea-breeze circulations on aerosol–DCC interactions, we found more positive and stronger aerosol effects on 30 dBZ ETH compared to the all-case scenario. This discrepancy could be due to the absence of major confounding variables (e.g., boundary layer dynamics) in the MLR model.
-
We also investigate the impact of aerosol loading on precipitation core area. Most models indicated positive average aerosol effects, suggesting an expansion of cell area in polluted cases. However, as only one model is deemed “valid”, the robustness of this result needs further assessment. Moreover, regarding the influence of aerosols on maximum rainfall intensity, the observed effects fall within the range of radar measurement uncertainty.
-
The sensitivity analysis reveals minimal dependency on the choice of the proxy for updraft intensity, the temporal and spatial gaps between measurements of aerosol and DCC properties, the aerosol averaging period, and the types of originating air parcels used in calculating CAPE. In other words, these tests all show comparable aerosol effects on 30 dBZ ETH.
-
ARM sounding data are available in Keeler et al. (2022) (https://doi.org/10.5439/1595321);
-
ARM CCN data are available in Koontz et al. (2022) (https://doi.org/10.5439/1323892);
-
NEXRAD data (Fulton et al., 1998) are accessible at https://registry.opendata.aws/noaa-nexrad/ (last access: 20 June 2024) (https://doi.org/10.7289/V5W9574V);
-
the TINT package (Raut et al., 2021) is accessible at https://github.com/openradar/TINT(last access: 20 June 2024);
-
post-processed data can be found in Wang (2024) (https://doi.org/10.5281/zenodo.14298966).
The supplement related to this article is available online at https://doi.org/10.5194/acp-25-9295-2025-supplement.
DW and MJ designed the study. DW conducted the analysis and wrote the paper. RK and TZ provided guidance on running the causal model. TS provided the aerosol dataset. SVDH, SG, and MJ reviewed the paper.
The contact author has declared that none of the authors has any competing interests.
Publisher’s note: Copernicus Publications remains neutral with regard to jurisdictional claims made in the text, published maps, institutional affiliations, or any other geographical representation in this paper. While Copernicus Publications makes every effort to include appropriate place names, the final responsibility lies with the authors.
This paper has been authored by employees of Brookhaven Science Associates, LLC, under contract DE-SC0012704 with the U.S. Department of Energy (DOE). We would like to acknowledge the DOE Early Career Research Program for the funding support. We would also like to acknowledge support from the Atmospheric System Research (ASR) program, the Atmospheric Radiation Measurement (ARM) user facility, and the ARM TRACER operation and science teams. Susan van den Heever is supported by the DOE under DE-SC0021160. Siddhant Gupta is supported by Argonne National Laboratory under U.S. DOE contract DE-AC02-06CH11357 and the ARM user facility, funded by the Office of Biological and Environmental Research in the U.S. DOE Office of Science. We thank Maria Zawadowicz at Brookhaven National Lab for providing the calculated CCN number concentrations.
This research has been supported by Biological and Environmental Research (grant no. DE-SC0012704).
This paper was edited by Shaocheng Xie and reviewed by Toshi Matsui and one anonymous referee.
Abbott, T. H. and Cronin, T. W.: Aerosol invigoration of atmospheric convection through increases in humidity, Science, 371, 83–85, https://doi.org/10.1126/science.abc5181, 2021. a, b, c
Anagnostou, E. N.: A convective/stratiform precipitation classification algorithm for volume scanning weather radar observations, Meteorol. Appl., 11, 291–300, https://doi.org/10.1017/S1350482704001409, 2004. a
Andreae, M. O., Rosenfeld, D., Artaxo, P., Costa, A. A., Frank, G., Longo, K. M., and Silva-Dias, M. A. F. d.: Smoking rain clouds over the Amazon, Science, 303, 1337–1342, 2004. a
Baidu, M., Schwendike, J., Marsham, J. H., and Bain, C.: Effects of vertical wind shear on intensities of mesoscale convective systems over West and Central Africa, Atmos. Sci. Lett., 23, e1094, https://doi.org/10.1002/asl.1094, 2022. a, b
Barth, M. C., Cantrell, C. A., Brune, W. H., Rutledge, S. A., Crawford, J. H., Huntrieser, H., Carey, L. D., MacGorman, D., Weisman, M., Pickering, K. E., Bruning, E., Anderson, B., Apel, E., Biggerstaff, M., Campos, T., Campuzano-Jost, P., Cohen, R., Crounse, J., Day, D. A., Diskin, G., Flocke, F., Fried, A., Garland, C., Heikes, B., Honomichl, S., Hornbrook, R., Huey, L. G., Jimenez, J. L., Lang, T., Lichtenstern, M., Mikoviny, T., Nault, B., O’Sullivan, D., Pan, L. L., Peischl, J., Pollack, I., Richter, D., Riemer, D., Ryerson, T., Schlager, H., Clair, J. S., Walega, J., Weibring, P., Weinheimer, A., Wennberg, P., Wisthaler, A., Wooldridge, P. J., and Ziegler, C.: The Deep Convective Clouds and Chemistry (DC3) Field Campaign, B. Am. Meteoro. Soc., 96, 1281–1309, https://doi.org/10.1175/BAMS-D-13-00290.1, 2015. a
Bean, J. K., Faxon, C. B., Leong, Y. J., Wallace, H. W., Cevik, B. K., Ortiz, S., Canagaratna, M. R., Usenko, S., Sheesley, R. J., Griffin, R. J., and Hildebrandt Ruiz, L.: Composition and Sources of Particulate Matter Measured near Houston, TX: Anthropogenic-Biogenic Interactions, Atmosphere, 7, 73, https://doi.org/10.3390/atmos7050073, 2016. a
Bony, S., Stevens, B., Coppin, D., Becker, T., Reed, K. A., Voigt, A., and Medeiros, B.: Thermodynamic control of anvil cloud amount, P. Natl. Acad. Sci. USA, 113, 8927–8932, https://doi.org/10.1073/pnas.1601472113, 2016. a
Chakraborty, S., Fu, R., Massie, S. T., and Stephens, G.: Relative influence of meteorological conditions and aerosols on the lifetime of mesoscale convective systems, P. Natl. Acad. Sci. USA, 113, 7426–7431, https://doi.org/10.1073/pnas.1601935113, 2016. a
Chi, N.-H., Lien, R.-C., D'Asaro, E. A., and Ma, B. B.: The surface mixed layer heat budget from mooring observations in the central Indian Ocean during Madden–Julian Oscillation events, J. Geophys. Res.-Oceans, 119, 4638–4652, https://doi.org/10.1002/2014JC010192, 2014. a
Dagan, G.: Equilibrium climate sensitivity increases with aerosol concentration due to changes in precipitation efficiency, Atmos. Chem. Phys., 22, 15767–15775, https://doi.org/10.5194/acp-22-15767-2022, 2022. a
Dagan, G., Stier, P., Christensen, M., Cioni, G., Klocke, D., and Seifert, A.: Atmospheric energy budget response to idealized aerosol perturbation in tropical cloud systems, Atmos. Chem. Phys., 20, 4523–4544, https://doi.org/10.5194/acp-20-4523-2020, 2020. a, b
Del Genio, A.: Representing the Sensitivity of Convective Cloud Systems to Tropospheric Humidity in General Circulation Models, Surv. Geophys., 33, 637–656, https://doi.org/10.1007/s10712-011-9148-9, 2012. a
Dixon, M. and Wiener, G.: TITAN: Thunderstorm Identification, Tracking, Analysis, and Nowcasting – A Radar-based Methodology, J. Atmos. Ocean. Technol., 10, 785–797, https://doi.org/10.1175/1520-0426(1993)010<0785:TTITAA>2.0.CO;2, 1993. a, b
Dye, J. E., Ridley, B. A., Skamarock, W., Barth, M., Venticinque, M., Defer, E., Blanchet, P., Thery, C., Laroche, P., Baumann, K., Hubler, G., Parrish, D. D., Ryerson, T., Trainer, M., Frost, G., Holloway, J. S., Matejka, T., Bartels, D., Fehsenfeld, F. C., Tuck, A., Rutledge, S. A., Lang, T., Stith, J., and Zerr, R.: An overview of the Stratospheric-Tropospheric Experiment: Radiation, Aerosols, and Ozone (STERAO)-Deep Convection experiment with results for the July 10, 1996 storm, J. Geophys. Res.-Atmos., 105, 10023–10045, https://doi.org/10.1029/1999JD901116, 2000. a
Gourley, J. J., Kaney, B., and Maddox, R. A.: Evaluating the calibrations of radars: A software approach, 31st International Conference on Radar Meteorology, Seattle, Washington, 2003. a
Fan, J., Yuan, T., Comstock, J. M., Ghan, S., Khain, A., Leung, L. R., Li, Z., Martins, V. J., and Ovchinnikov, M.: Dominant role by vertical wind shear in regulating aerosol effects on deep convective clouds, J. Geophys. Res.-Atmos., 114, D22206, https://doi.org/10.1029/2009JD012352, 2009. a, b, c
Fan, J., Rosenfeld, D., Zhang, Y., Giangrande, S. E., Li, Z., Machado, L. A. T., Martin, S. T., Yang, Y., Wang, J., Artaxo, P., Barbosa, H. M. J., Braga, R. C., Comstock, J. M., Feng, Z., Gao, W., Gomes, H. B., Mei, F., Pöhlker, C., Pöhlker, M. L., Pöschl, U., and de Souza, R. A. F.: Substantial convection and precipitation enhancements by ultrafine aerosol particles, Science, 359, 411–418, https://doi.org/10.1126/science.aan8461, 2018. a, b
Fan, J., Zhang, Y., Li, Z., Hu, J., and Rosenfeld, D.: Urbanization-induced land and aerosol impacts on sea-breeze circulation and convective precipitation, Atmos. Chem. Phys., 20, 14163–14182, https://doi.org/10.5194/acp-20-14163-2020, 2020. a
Fast, J. D., Varble, A. C., Mei, F., Pekour, M., Tomlinson, J., Zelenyuk, A., Sedlacek III, A. J., Zawadowicz, M., and Emmons, L. K.: Large Spatiotemporal Variability in Aerosol Properties over Central Argentina during the CACTI Field Campaign, EGUsphere [preprint], https://doi.org/10.5194/egusphere-2024-1349, 2024. a
Feng, Z., Leung, L. R., Hagos, S., Houze, R. A., Burleyson, C. D., and Balaguru, K.: More frequent intense and long-lived storms dominate the springtime trend in central US rainfall, Nat. Commun., 7, 1–8, 2016. a
Fulton, R. A., Breidenbach, J. P., Seo, D., Miller, D. A., and O'Bannon, T.: The WSR-88D Rainfall Algorithm, Weather Forecast., 13, 377–395, https://doi.org/10.1175/1520-0434(1998)013<0377:TWRA>2.0.CO;2, 1998. a
Geerts, B., Parsons, D., Ziegler, C. L., Weckwerth, T. M., Biggerstaff, M. I., Clark, R. D., Coniglio, M. C., Demoz, B. B., Ferrare, R. A., Gallus, W. A., Haghi, K., Hanesiak, J. M., Klein, P. M., Knupp, K. R., Kosiba, K., McFarquhar, G. M., Moore, J. A., Nehrir, A. R., Parker, M. D., Pinto, J. O., Rauber, R. M., Schumacher, R. S., Turner, D. D., Wang, Q., Wang, X., Wang, Z., and Wurman, J.: The 2015 Plains Elevated Convection at Night Field Project, B. Am. Meteorol. Soc., 98, 767–786, https://doi.org/10.1175/BAMS-D-15-00257.1, 2017. a
Giangrande, S. E., Biscaro, T. S., and Peters, J. M.: Seasonal controls on isolated convective storm drafts, precipitation intensity, and life cycle as observed during GoAmazon2014/5, Atmos. Chem. Phys., 23, 5297–5316, https://doi.org/10.5194/acp-23-5297-2023, 2023. a
Grabowski, W. W.: Untangling Microphysical Impacts on Deep Convection Applying a Novel Modeling Methodology, J. Atmos. Sci., 72, 2446–2464, https://doi.org/10.1175/JAS-D-14-0307.1, 2015. a
Grabowski, W. W. and Morrison, H.: Do Ultrafine Cloud Condensation Nuclei Invigorate Deep Convection?, J. Atmos. Sci., 77, 2567–2583, https://doi.org/10.1175/JAS-D-20-0012.1, 2020. a, b
Grant, L. D. and van den Heever, S. C.: Aerosol-cloud-land surface interactions within tropical sea breeze convection, J. Geophys. Res.-Atmos., 119, 8340–8361, https://doi.org/10.1002/2014JD021912, 2014. a
Grant, L. D. and van den Heever, S. C.: Cold Pool and Precipitation Responses to Aerosol Loading: Modulation by Dry Layers, J. Atmos. Sci., 72, 1398–1408, https://doi.org/10.1175/JAS-D-14-0260.1, 2015. a, b
Guo, J., Liu, H., Li, Z., Rosenfeld, D., Jiang, M., Xu, W., Jiang, J. H., He, J., Chen, D., Min, M., and Zhai, P.: Aerosol-induced changes in the vertical structure of precipitation: a perspective of TRMM precipitation radar, Atmos. Chem. Phys., 18, 13329–13343, https://doi.org/10.5194/acp-18-13329-2018, 2018. a, b
Gupta, S., Wang, D., Giangrande, S. E., Biscaro, T. S., and Jensen, M. P.: Lifecycle of updrafts and mass flux in isolated deep convection over the Amazon rainforest: insights from cell tracking, Atmos. Chem. Phys., 24, 4487–4510, https://doi.org/10.5194/acp-24-4487-2024, 2024. a, b
Hahn, T., Wang, D., Chen, J., and Jensen, M.: Convective Cloud Lifecycle and Merging Behavior in Sea-Breeze Environments: Insights from TRACER observations and WRF Simulations, J. Geophys. Res.-Atmos., 130, e2024JD042586, https://doi.org/10.1029/2024JD042586, 2025. a
Hersbach, H., Bell, B., Berrisford, P. et al.: The ERA5 global reanalysis, Q. J. Roy. Meteorol. Soc., 146, 1999–2049, 2020. a
Heymsfield, G. M., Tian, L., Heymsfield, A. J., Li, L., and Guimond, S.: Characteristics of Deep Tropical and Subtropical Convection from Nadir-Viewing High-Altitude Airborne Doppler Radar, J. Atmos. Sci., 67, 285–308, https://doi.org/10.1175/2009JAS3132.1, 2010. a
Hu, J., Rosenfeld, D., Ryzhkov, A., Zrnic, D., Williams, E., Zhang, P., Snyder, J. C., Zhang, R., and Weitz, R.: Polarimetric Radar Convective Cell Tracking Reveals Large Sensitivity of Cloud Precipitation and Electrification Properties to CCN, J. Geophys. Res.-Atmos., 124, 12194–12205, https://doi.org/10.1029/2019JD030857, 2019. a
Igel, A. L. and van den Heever, S. C.: Invigoration or Enervation of Convective Clouds by Aerosols?, Geophys. Res. Lett., 48, e2021GL093804, https://doi.org/10.1029/2021GL093804, 2021. a, b
Jensen, M. P., Petersen, W. A., Bansemer, A., Bharadwaj, N., Carey, L. D., Cecil, D. J., Collis, S. M., Genio, A. D. D., Dolan, B., Gerlach, J., Giangrande, S. E., Heymsfield, A., Heymsfield, G., Kollias, P., Lang, T. J., Nesbitt, S. W., Neumann, A., Poellot, M., Rutledge, S. A., Schwaller, M., Tokay, A., Williams, C. R., Wolff, D. B., Xie, S., and Zipser, E. J.: The Midlatitude Continental Convective Clouds Experiment (MC3E), B. Am. Meteorol. Soc., 97, 1667–1686, https://doi.org/10.1175/BAMS-D-14-00228.1, 2016. a
Jensen, M. P., Flynn, J. H., Judd, L. M., Kollias, P., Kuang, C., Mcfarquhar, G., Nadkarni, R., Powers, H., and Sullivan, J.: A Succession of Cloud, Precipitation, Aerosol, and Air Quality Field Experiments in the Coastal Urban Environment, B. Am. Meteorol. Soc., 103, 103–105, https://doi.org/10.1175/BAMS-D-21-0104.1, 2022. a
Jesson, A., Mindermann, S., Gal, Y., and Shalit, U.: Quantifying Ignorance in Individual-Level Causal-Effect Estimates under Hidden Confounding, in: Proceedings of the 38th International Conference on Machine Learning, edited by Meila, M. and Zhang, T., Vol. 139, Proceedings of Machine Learning Research, pp. 4829–4838, PMLR, https://proceedings.mlr.press/v139/jesson21a.html (last access: 3 July 2024), 2021. a
Johnson, J. S., Cui, Z., Lee, L. A., Gosling, J. P., Blyth, A. M., and Carslaw, K. S.: Evaluating uncertainty in convective cloud microphysics using statistical emulation, J. Adv. Model. Earth Syst., 7, 162–187, https://doi.org/10.1002/2014MS000383, 2015. a
Keeler, E., Burk, K., and Kyrouac, J.: Balloon-Borne Sounding System (SONDEWNPN), 2022-06-01 to 2022-09-30, ARM Mobile Facility (HOU), Houston, TX; AMF1 (main site for TRACER) (M1), https://doi.org/10.5439/1595321, 2022. a
Khain, A., Rosenfeld, D., and Pokrovsky, A.: Aerosol impact on the dynamics and microphysics of deep convective clouds, Quarterly Journal of the Royal Meteorological Society: A journal of the atmospheric sciences, Appl. Meteorol. Phys. Oceanogr., 131, 2639–2663, 2005. a, b
Khain, A. P.: Notes on state-of-the-art investigations of aerosol effects on precipitation: a critical review, Environmen. Res. Lett., 4, 015004, https://doi.org/10.1088/1748-9326/4/1/015004, 2009. a
Khain, A. P., BenMoshe, N., and Pokrovsky, A.: Factors Determining the Impact of Aerosols on Surface Precipitation from Clouds: An Attempt at Classification, J. Atmos. Sci., 65, 1721–1748, https://doi.org/10.1175/2007JAS2515.1, 2008. a
Kirkpatrick, C., McCaul, E. W., and Cohen, C.: Sensitivities of Simulated Convective Storms to Environmental CAPE, Mon. Weather Rev., 139, 3514–3532, https://doi.org/10.1175/2011MWR3631.1, 2011. a
Kohonen, T.: The self-organizing map, P. IEEE, 78, 1464–1480, https://doi.org/10.1109/5.58325, 1990. a
Kollias, P., McFarquhar, G., Oue, M., van den Heever, S., Logan, T., Bruning, E., Lombardo, K., Kumjian, M., Lebo, Z., Shaw, R., Roberts, G., , DeMott, P., McCluskey, C., Patnaude, R., Dzambo, A., Wolde, M., Nguyen, C., Lawson, P., Bruintjes, R., Lamer, K., Luke, E., Treserras, B. P., Chandrasekaran, V., Snyder, J., Bodine, D., Ranjbar, K., Nichman, L., Roux, E., Tsai, P., Wolf, C., Junyent, F., Mages, Z., Barr, J., Zhu, Z., McKeown, K., Brunner, K., Singewald, D., Souza, J., Rosky, E., Allwayin, N., Patil, S., Hu, Y., Xia, Z., Qiao, Y., Huang, Y., Miller, M., Denny, B., Ascher, B., and Weiss, S.: Experiment of Sea Breeze Convection, Aerosols, Precipitation and Environment (ESCAPE), B. Am. Meteorol. Soc., 106, E310–E332, https://doi.org/10.1175/BAMS-D-23-0014.1, 2025. a
Koontz, A., Uin, J., Andrews, E., Enekwizu, O., Hayes, C., and Salwen, C.: Cloud Condensation Nuclei Particle Counter (AOSCCN2COLA), 2022-06-01 to 2022-09-30, ARM Mobile Facility (HOU), Houston, TX; AMF1 (main site for TRACER) (M1), https://doi.org/10.5439/1323892, 2022. a
Korolev, A. V. and Mazin, I. P.: Supersaturation of Water Vapor in Clouds, J. Atmos. Sci., 60, 2957–2974, https://doi.org/10.1175/1520-0469(2003)060<2957:SOWVIC>2.0.CO;2, 2003. a
Kumar, V. V., Protat, A., May, P. T., Jakob, C., Penide, G., Kumar, S., and Davies, L.: On the Effects of Large-Scale Environment and Surface Types on Convective Cloud Characteristics over Darwin, Australia, Mon. Weather Rev., 141, 1358–1374, https://doi.org/10.1175/MWR-D-12-00160.1, 2013. a
Lebo, Z.: A Numerical Investigation of the Potential Effects of Aerosol-Induced Warming and Updraft Width and Slope on Updraft Intensity in Deep Convective Clouds, J. Atmos. Sci., 75, 535–554, https://doi.org/10.1175/JAS-D-16-0368.1, 2018. a, b, c
Lebo, Z. J. and Seinfeld, J. H.: Theoretical basis for convective invigoration due to increased aerosol concentration, Atmos. Chem. Phys., 11, 5407–5429, https://doi.org/10.5194/acp-11-5407-2011, 2011. a
Lee, L. A., Carslaw, K. S., Pringle, K. J., Mann, G. W., and Spracklen, D. V.: Emulation of a complex global aerosol model to quantify sensitivity to uncertain parameters, Atmos. Chem. Phys., 11, 12253–12273, https://doi.org/10.5194/acp-11-12253-2011, 2011. a
Lee, S. S., Donner, L. J., Phillips, V. T. J., and Ming, Y.: The dependence of aerosol effects on clouds and precipitation on cloud-system organization, shear and stability, J. Geophys. Res.-Atmos., 113, D16202, https://doi.org/10.1029/2007JD009224, 2008. a
Li, Z., Niu, F., Fan, J., Liu, Y., Rosenfeld, D., and Ding, Y.: Long-term impacts of aerosols on the vertical development of clouds and precipitation, Nat. Geosci., 4, 888–894, 2011. a, b
Liu, C. and Zipser, E.: Regional variation of morphology of organized convection in the tropics and subtropics, J. Geophys. Res.-Atmos., 118, 453–466, https://doi.org/10.1029/2012JD018409, 2013. a, b
Long, C. N., DelGenio, A., May, P., Gustafson, W., McFarlane, S., Houze, R., Minnis, P., Jakob, C., Schumacher, C., Jensen, M., Vogelmann, A., Klein, S., Wang, Y., Ruby Leung, L., Wu, X., Liu, X., Xie, S., and Luke, E.: AMIE (ARM MJO Investigation Experiment): Observations of the Madden–Julian oscillation for modeling studies science plan, DOE/ARM Tech. Rep. DOE/SC-ARM-10-007, 20, https://www.arm.gov/publications/programdocs/doe-sc-arm-10-007.pdf (last access: 22 April 2024), 2011. a
Marinescu, P. J., van den Heever, S. C., Heikenfeld, M., Barrett, A. I., Barthlott, C., Hoose, C., Fan, J., Fridlind, A. M., Matsui, T., Miltenberger, A. K., Stier, P., Vie, B., White, B. A., and Zhang, Y.: Impacts of Varying Concentrations of Cloud Condensation Nuclei on Deep Convective Cloud Updrafts – A Multimodel Assessment, J. Atmos. Sci., 78, 1147–1172, https://doi.org/10.1175/JAS-D-20-0200.1, 2021. a
Martin, S. T., Artaxo, P., Machado, L., Manzi, A. O., Souza, R. A. F., Schumacher, C., Wang, J., Biscaro, T., Brito, J., Calheiros, A., Jardine, K., Medeiros, A., Portela, B., de Sá, S. S., Adachi, K., Aiken, A. C., Albrecht, R., Alexander, L., Andreae, M. O., Barbosa, H. M. J., Buseck, P., Chand, D., Comstock, J. M., Day, D. A., Dubey, M., Fan, J., Fast, J., Fisch, G., Fortner, E., Giangrande, S., Gilles, M., Goldstein, A. H., Guenther, A., Hubbe, J., Jensen, M., Jimenez, J. L., Keutsch, F. N., Kim, S., Kuang, C., Laskin, A., McKinney, K., Mei, F., Miller, M., Nascimento, R., Pauliquevis, T., Pekour, M., Peres, J., Petäjä, T., Pöhlker, C., Pöschl, U., Rizzo, L., Schmid, B., Shilling, J. E., Dias, M. A. S., Smith, J. N., Tomlinson, J. M., Tóta, J., and Wendisch, M.: The Green Ocean Amazon Experiment (GoAmazon2014/5) Observes Pollution Affecting Gases, Aerosols, Clouds, and Rainfall over the Rain Forest, B. Am. Meteorol. Soc., 98, 981–997, https://doi.org/10.1175/BAMS-D-15-00221.1, 2017. a
Masrour, P. F. and Rezazadeh, M.: Aerosol-cloud-precipitation interaction during some convective events over southwestern Iran using the WRF model, Atmos. Pollut. Res., 14, 101667, https://doi.org/10.1016/j.apr.2023.101667, 2023. a
Mather, J. H. and Voyles, J. W.: The ARM Climate Research Facility: A review of structure and capabilities, B. Am. Meteorol. Soc., 94, 377–392, 2013. a
McCaul, E. W. and Cohen, C.: The Impact on Simulated Storm Structure and Intensity of Variations in the Mixed Layer and Moist Layer Depths, Mon. Weather Rev., 130, 1722–1748, https://doi.org/10.1175/1520-0493(2002)130<1722:TIOSSS>2.0.CO;2, 2002. a
Mejia, J. F., Henao, J. J., and Eslami, E.: Role of Clouds in the Urban Heat Island and Extreme Heat: Houston-Galveston Metropolitan Area Case, J. Geophys. Res.-Atmos., 129, e2024JD041243, https://doi.org/10.1029/2024JD041243, 2024. a
Miller, M. A., Nitschke, K., Ackerman, T. P., Ferrell, W. R., Hickmon, N., and Ivey, M.: The ARM Mobile Facilities, Meteorol. Monogr., 57, 9.1–9.15, https://doi.org/10.1175/AMSMONOGRAPHS-D-15-0051.1, 2016. a
Moncrieff, M. W.: The Multiscale Organization of Moist Convection and the Intersection of Weather and Climate, 3–26 pp., American Geophysical Union (AGU), ISBN 9781118670392, https://doi.org/10.1029/2008GM000838, 2010. a
Moroda, Y., Tsuboki, K., Satoh, S., Nakagawa, K., Ushio, T., and Shimizu, S.: Structure and Evolution of Precipitation Cores in an Isolated Convective Storm Observed by Phased Array Weather Radar, J. Meteorol. Soc. JPN II, 99, 765–784, https://doi.org/10.2151/jmsj.2021-038, 2021. a
Morrison, H.: An Analytic Description of the Structure and Evolution of Growing Deep Cumulus Updrafts, J. Atmos. Sci., 74, 809–834, https://doi.org/10.1175/JAS-D-16-0234.1, 2017. a
Mulholland, J. P., Peters, J. M., and Morrison, H.: How Does LCL Height Influence Deep Convective Updraft Width?, Geophys. Res. Lett., 48, e2021GL093316, https://doi.org/10.1029/2021GL093316, 2021. a, b
Nelson, T. C., Marquis, J., Varble, A., and Friedrich, K.: Radiosonde Observations of Environments Supporting Deep Moist Convection Initiation during RELAMPAGO-CACTI, Mon. Weather Rev., 149, 289–309, https://doi.org/10.1175/MWR-D-20-0148.1, 2021. a
Nishant, N., Sherwood, S., and Geoffroy, O.: Aerosol-induced modification of organised convection and top-of-atmosphere radiation, npj Clim. Atmos. Sci., 2, 33, https://doi.org/10.1038/s41612-019-0089-1, 2019. a, b
NOAA: Doppler radar meteorological observations, Part C, WSR-88D products and algorithms, Tech. Rep. Rep. FCM-H11C-1991, Office of the Federal Coordinator for Meteorological Services and Supporting Research, available from National Climatic Data Center, 1991. a
Park, J. M. and van den Heever, S. C.: Weakening of tropical sea breeze convective systems through interactions of aerosol, radiation, and soil moisture, Atmos. Chem. Phys., 22, 10527–10549, https://doi.org/10.5194/acp-22-10527-2022, 2022. a, b, c
Peters, J. M., Lebo, Z. J., Chavas, D. R., and Su, C.-Y.: Entrainment Makes Pollution More Likely to Weaken Deep Convective Updrafts Than Invigorate Them, Geophys. Res. Lett., 50, e2023GL103314, https://doi.org/10.1029/2023GL103314, 2023. a, b, c, d
Petters, M. D. and Kreidenweis, S. M.: A single parameter representation of hygroscopic growth and cloud condensation nucleus activity, Atmos. Chem. Phys., 7, 1961–1971, https://doi.org/10.5194/acp-7-1961-2007, 2007. a
Pinsky, M. B. and Khain, A. P.: Effects of in-cloud nucleation and turbulence on droplet spectrum formation in cumulus clouds, Q. J. Roy. Meteorol. Soc., 128, 501–533, https://doi.org/10.1256/003590002321042072, 2002. a
Polavarapu, R. and Austin, G.: A review of the GARP Atlantic tropical experiment (gate), Atmos.-Ocean, 17, 1–13, https://doi.org/10.1080/07055900.1979.9649047, 1979. a
Politovich, M. K. and Cooper, W. A.: Variability of the Supersaturation in Cumulus Clouds, J. Atmos. Sci., 45, 1651–1664, https://doi.org/10.1175/1520-0469(1988)045<1651:VOTSIC>2.0.CO;2, 1988. a, b
Prabha, T. V., Khain, A., Maheshkumar, R. S., Pandithurai, G., Kulkarni, J. R., Konwar, M., and Goswami, B. N.: Microphysics of Premonsoon and Monsoon Clouds as Seen from In Situ Measurements during the Cloud Aerosol Interaction and Precipitation Enhancement Experiment (CAIPEEX), J. Atmos. Sci., 68, 1882–1901, https://doi.org/10.1175/2011JAS3707.1, 2011. a
Prein, A. F., Rasmussen, R. M., Wang, D., and Giangrande, S. E.: Sensitivity of organized convective storms to model grid spacing in current and future climates, Philos. T. Roy. Soc. A, 379, 20190546, https://doi.org/10.1098/rsta.2019.0546, 2021. a
Prein, A. F., Ge, M., Valle, A. R., Wang, D., and Giangrande, S. E.: Towards a Unified Setup to Simulate Mid-Latitude and Tropical Mesoscale Convective Systems at Kilometer-Scales, Earth Space Sci., 9, e2022EA002295, https://doi.org/10.1029/2022EA002295, 2022. a
Ramos-Valle, A. N., Prein, A. F., Ge, M., Wang, D., and Giangrande, S. E.: Grid Spacing Sensitivities of Simulated Mid-Latitude and Tropical Mesoscale Convective Systems in the Convective Gray Zone, J. Geophys. Res.-Atmos., 128, e2022JD037043, https://doi.org/10.1029/2022JD037043, 2023. a
Rapp, A. D., Brooks, S. D., Nowotarski, C. J., Sharma, M., Thompson, S. A., Chen, B., Matthews, B. H., Etten-Bohm, M., Nielsen, E. R., and Li, R.: TAMU TRACER: Targeted Mobile Measurements to Isolate the Impacts of Aerosols and Meteorology on Deep Convection, B. Am. Meteorol. Soc., 105, E1685–E1702, https://doi.org/10.1175/BAMS-D-23-0218.1, 2024. a
Raut, B. A., Jackson, R., Picel, M., Collis, S. M., Bergemann, M., and Jakob, C.: An adaptive tracking algorithm for convection in simulated and remote sensing data, J. Appl. Meteorol. Climatol., 60, 513–526, 2021 (data availabl at: https://github.com/openradar/TINT, last access: 1 July 2024). a, b
Reid, J. S., Maring, H. B., Narisma, G. T., van den Heever, S., Girolamo, L. D., Ferrare, R., Lawson, P., Mace, G. G., Simpas, J. B., Tanelli, S., Ziemba, L., van Diedenhoven, B., Bruintjes, R., Bucholtz, A., Cairns, B., Cambaliza, M. O., Chen, G., Diskin, G. S., Flynn, J. H., Hostetler, C. A., Holz, R. E., Lang, T. J., Schmidt, K. S., Smith, G., Sorooshian, A., Thompson, E. J., Thornhill, K. L., Trepte, C., Wang, J., Woods, S., Yoon, S., Alexandrov, M., Alvarez, S., Amiot, C. G., Bennett, J. R., Brooks, M., Burton, S. P., Cayanan, E., Chen, H., Collow, A., Crosbie, E., DaSilva, A., DiGangi, J. P., Flagg, D. D., Freeman, S. W., Fu, D., Fukada, E., Hilario, M. R. A., Hong, Y., Hristova-Veleva, S. M., Kuehn, R., Kowch, R. S., Leung, G. R., Loveridge, J., Meyer, K., Miller, R. M., Montes, M. J., Moum, J. N., Nenes, A., Nesbitt, S. W., Norgren, M., Nowottnick, E. P., Rauber, R. M., Reid, E. A., Rutledge, S., Schlosser, J. S., Sekiyama, T. T., Shook, M. A., Sokolowsky, G. A., Stamnes, S. A., Tanaka, T. Y., Wasilewski, A., Xian, P., Xiao, Q., Xu, Z., and Zavaleta, J.: The Coupling Between Tropical Meteorology, Aerosol Lifecycle, Convection, and Radiation during the Cloud, Aerosol and Monsoon Processes Philippines Experiment (CAMP2Ex), B. Am. Meteorol. Soc., 104, E1179–E1205, https://doi.org/10.1175/BAMS-D-21-0285.1, 2023. a
Rivera, C., Mellqvist, J., Samuelsson, J., Lefer, B., Alvarez, S., and Patel, M. R.: Quantification of NO2 and SO2 emissions from the Houston Ship Channel and Texas City industrial areas during the 2006 Texas Air Quality Study, J. Geophys. Res.-Atmos., 115, D08301, https://doi.org/10.1029/2009JD012675, 2010. a
Romps, D. M., Latimer, K., Zhu, Q., Jurkat-Witschas, T., Mahnke, C., Prabhakaran, T., Weigel, R., and Wendisch, M.: Air Pollution Unable to Intensify Storms via Warm-Phase Invigoration, Geophys. Res. Lett., 50, e2022GL100409, https://doi.org/10.1029/2022GL100409, 2023. a, b, c
Rosenfeld, D., Lohmann, U., Raga, G. B., O'Dowd, C. D., Kulmala, M., Fuzzi, S., Reissell, A., and Andreae, M. O.: Flood or Drought: How Do Aerosols Affect Precipitation?, Science, 321, 1309–1313, https://doi.org/10.1126/science.1160606, 2008. a, b
Ryzhkov, A. V., Giangrande, S. E., Melnikov, V. M., and Schuur, T. J.: Calibration Issues of Dual-Polarization Radar Measurements, J. Atmos. Ocean. Technol., 22, 1138–1155, https://doi.org/10.1175/JTECH1772.1, 2005. a
Sanderson, B., Piani, C., and Ingram, W.: Towards constraining climate sensitivity by linear analysis of feedback patterns in thousands of perturbed-physics GCM simulations, Clim. Dynam., 30, 175–190, https://doi.org/10.1007/s00382-007-0280-7, 2008. a
Singh, A. and Kuang, C.: Condensation Particle Counter (CPC) Instrument Handbook, DOE/SC-ARM-TR-145, https://doi.org/10.2172/1245983, 2024. a
Storer, R. L., Van Den Heever, S. C., and Stephens, G. L.: Modeling aerosol impacts on convective storms in different environments, J. Atmos. Sci., 67, 3904–3915, 2010. a, b, c, d
Storer, R. L., van den Heever, S. C., and L'Ecuyer, T. S.: Observations of aerosol-induced convective invigoration in the tropical east Atlantic, J. Geophys. Res.-Atmos., 119, 3963–3975, https://doi.org/10.1002/2013JD020272, 2014. a, b
Sun, M., Qie, X., Mansell, E. R., Liu, D., Yair, Y., Fierro, A. O., Yuan, S., and Lu, J.: Aerosol Impacts on Storm Electrification and Lightning Discharges Under Different Thermodynamic Environments, J. Geophys. Res.-Atmos., 128, e2022JD037450, https://doi.org/10.1029/2022JD037450, 2023. a
Takahashi, H., Luo, Z. J., Stephens, G., and Mulholland, J. P.: Revisiting the Land-Ocean Contrasts in Deep Convective Cloud Intensity Using Global Satellite Observations, Geophys. Res. Lett., 50, e2022GL102089, https://doi.org/10.1029/2022GL102089, 2023. a
Tan, J., Jakob, C., and Rossow, W.: Increases in tropical rainfall driven by changes in frequency of organized deep convection, Nature, 519, 451–454, https://doi.org/10.1038/nature14339, 2015. a
Tao, W.-K., Lang, S., Zeng, X., Shige, S., and Takayabu, Y.: Relating Convective and Stratiform Rain to Latent Heating, J. Climate, 23, 1874–1893, https://doi.org/10.1175/2009JCLI3278.1, 2010. a
Tao, W.-K., Chen, J.-P., Li, Z., Wang, C., and Zhang, C.: Impact of aerosols on convective clouds and precipitation, Rev. Geophys., 50, RG2001, https://doi.org/10.1029/2011RG000369, 2012. a
Uin, J., Aiken, A. C., Dubey, M. K., Kuang, C., Pekour, M., Salwen, C., Sedlacek, A. J., Senum, G., Smith, S., Wang, J., Watson, T. B., and Springston, S. R.: Atmospheric Radiation Measurement (ARM) Aerosol Observing Systems (AOS) for Surface-Based In Situ Atmospheric Aerosol and Trace Gas Measurements, J. Atmos. Ocean. Technol., 36, 2429–2447, https://doi.org/10.1175/JTECH-D-19-0077.1, 2019. a
van den Heever, S. C. and Cotton, W. R.: Urban Aerosol Impacts on Downwind Convective Storms, J. Appl. Meteorol. Climatol., 46, 828–850, https://doi.org/10.1175/JAM2492.1, 2007. a
van den Heever, S. C., Carrió, G. G., Cotton, W. R., DeMott, P. J., and Prenni, A. J.: Impacts of Nucleating Aerosol on Florida Storms. Part I: Mesoscale Simulations, J. Atmos. Sci., 63, 1752–1775, https://doi.org/10.1175/JAS3713.1, 2006. a, b
van den Heever, S. C., Fridlind, A. M., Marinescu, P. J., Heiken-feld, M., White, B., and Stier, P.: Aerosol-Cloud-Precipitation-Climate (ACPC) initiative: Deep Convective Cloud Grouproadmap, ACPC Rep., p. 13, http://acpcinitiative.org/Docs/ACPC_DCC_Roadmap_171019.pdf (last access: 1 July 2024), 2018. a
van den Heever, S. C., Grant, L. D., Freeman, S. W., Marinescu, P. J., Barnum, J., Bukowski, J., Casas, E., Drager, A. J., Fuchs, B., Herman, G. R., Hitchcock, S. M., Kennedy, P. C., Nielsen, E. R., Park, J. M., Rasmussen, K., Razin, M. N., Riesenberg, R., Dellaripa, E. R., Slocum, C. J., Toms, B. A., and van den Heever, A.: The Colorado State University Convective CLoud Outflows and UpDrafts Experiment (C3LOUD-Ex), B. Am. Meteorol. Soc., 102, E1283 – E1305, https://doi.org/10.1175/BAMS-D-19-0013.1, 2021. a
Varble, A.: Erroneous attribution of deep convective invigoration to aerosol concentration, J. Atmos. Sci., 75, 1351–1368, 2018. a, b
Varble, A. C., Nesbitt, S. W., Salio, P., Hardin, J. C., Bharadwaj, N., Borque, P., DeMott, P. J., Feng, Z., Hill, T. C. J., Marquis, J. N., Matthews, A., Mei, F., Öktem, R., Castro, V., Goldberger, L., Hunzinger, A., Barry, K. R., Kreidenweis, S. M., McFarquhar, G. M., McMurdie, L. A., Pekour, M., Powers, H., Romps, D. M., Saulo, C., Schmid, B., Tomlinson, J. M., van den Heever, S. C., Zelenyuk, A., Zhang, Z., and Zipser, E. J.: Utilizing a Storm-Generating Hotspot to Study Convective Cloud Transitions: The CACTI Experiment, B. Am. Meteorol. Soc., 102, E1597–E1620, https://doi.org/10.1175/BAMS-D-20-0030.1, 2021. a
Varble, A. C., Igel, A. L., Morrison, H., Grabowski, W. W., and Lebo, Z. J.: Opinion: A critical evaluation of the evidence for aerosol invigoration of deep convection, Atmos. Chem. Phys., 23, 13791–13808, https://doi.org/10.5194/acp-23-13791-2023, 2023. a, b, c
Veals, P. G., Varble, A. C., Russell, J. O., Hardin, J. C., and Zipser, E. J.: Indications of a decrease in the depth of deep convective cores with increasing aerosol concentration during the cacti campaign, J. Atmos. Sci., 79, 705–722, 2022. a, b, c, d, e, f, g
Wallace, H. W., Sanchez, N. P., Flynn, J. H., Erickson, M. H., Lefer, B. L., and Griffin, R. J.: Source apportionment of particulate matter and trace gases near a major refinery near the Houston Ship Channel, Atmos. Environ., 173, 16–29, https://doi.org/10.1016/j.atmosenv.2017.10.049, 2018. a
Wang, D.: Post-processed data for Causal Analysis of Aerosol Impacts on Isolated Deep Convection: Findings from TRACER in Houston-Galveston, Zenodo, https://doi.org/10.5281/zenodo.14298966, 2024. a
Wang, D., Giangrande, S. E., Bartholomew, M. J., Hardin, J., Feng, Z., Thalman, R., and Machado, L. A. T.: The Green Ocean: precipitation insights from the GoAmazon2014/5 experiment, Atmos. Chem. Phys., 18, 9121–9145, https://doi.org/10.5194/acp-18-9121-2018, 2018. a
Wang, D., Giangrande, S. E., Schiro, K. A., Jensen, M. P., and Houze Jr, R. A.: The characteristics of tropical and midlatitude mesoscale convective systems as revealed by radar wind profilers, J. Geophys. Res.-Atmos., 124, 4601–4619, 2019. a, b
Wang, D., Giangrande, S. E., Feng, Z., Hardin, J. C., and Prein, A. F.: Updraft and downdraft core size and intensity as revealed by radar wind profilers: MCS observations and idealized model comparisons, J. Geophys. Res.-Atmos., 125, e2019JD031774, https://doi.org/10.1175/MWR-D-23-0292.1, 2020a. a, b
Wang, D., Jensen, M. P., D'Iorio, J. A., Jozef, G., Giangrande, S. E., Johnson, K. L., Luo, Z. J., Starzec, M., and Mullendore, G. L.: An Observational Comparison of Level of Neutral Buoyancy and Level of Maximum Detrainment in Tropical Deep Convective Clouds, J. Geophys. Res.-Atmos., 125, e2020JD032637, https://doi.org/10.1029/2020JD032637, 2020b. a, b, c
Wang, D., Jensen, M. P., Taylor, D., Kowalski, G., Hogan, M., Wittemann, B. M., Rakotoarivony, A., Giangrande, S. E., and Park, J. M.: Linking Synoptic Patterns to Cloud Properties and Local Circulations Over Southeastern Texas, J. Geophys. Res.-Atmos., 127, e2021JD035920, https://doi.org/10.1029/2021JD035920, 2022a. a, b, c, d, e, f
Wang, D., Prein, A. F., Giangrande, S. E., Ramos-Valle, A., Ge, M., and Jensen, M. P.: Convective Updraft and Downdraft Characteristics of Continental Mesoscale Convective Systems in the Model Gray Zone, J. Geophys. Res.-Atmos., 127, e2022JD036746, https://doi.org/10.1029/2022JD036746, 2022b. a
Wang, D., Melvin, E., Smith, N., Jensen, M., Gupta, S., Abdullah-Smoot, A., Pszeniczny, N., and Hahn, T.: TRACER Perspectives on Gulf-Breeze and Bay-Breeze Circulations and Coastal Convection, Mon. Weather Rev., 152, 2207–2228, https://doi.org/10.1175/MWR-D-23-0292.1, 2024. a, b, c, d, e, f, g, h
Weisman, M. L. and Klemp, J. B.: The Structure and Classification of Numerically Simulated Convective Stormsin Directionally Varying Wind Shears, Mon. Weather Rev., 112, 2479–2498, https://doi.org/10.1175/1520-0493(1984)112<2479:TSACON>2.0.CO;2, 1984. a
Welch, B.: The generalization of “Student’s” problem when several different population variances are involved, Biometrika, 34, 28–35, https://doi.org/10.1093/biomet/34.1-2.28, 2005. a
Wellmann, C., Barrett, A. I., Johnson, J. S., Kunz, M., Vogel, B., Carslaw, K. S., and Hoose, C.: Using Emulators to Understand the Sensitivity of Deep Convective Clouds and Hail to Environmental Conditions, J. Adv. Model. Earth Syst., 10, 3103–3122, https://doi.org/10.1029/2018MS001465, 2018. a
Yoon, S., Ortiz, S. M., Clark, A. E., Barrett, T. E., Usenko, S., Duvall, R. M., Ruiz, L. H., Bean, J. K., Faxon, C. B., Flynn, J. H., Lefer, B. L., Leong, Y. J., Griffin, R. J., and Sheesley, R. J.: Apportioned primary and secondary organic aerosol during pollution events of DISCOVER-AQ Houston, Atmos. Environ., 244, 117954, https://doi.org/10.1016/j.atmosenv.2020.117954, 2021. a
Zang, L., Rosenfeld, D., Pan, Z., Mao, F., Zhu, Y., Lu, X., and Gong, W.: Observing Aerosol Primary Convective Invigoration and Its Meteorological Feedback, Geophys. Res. Lett., 50, e2023GL104151, https://doi.org/10.1029/2023GL104151, 2023. a, b
Zhang, Y., Fan, J., Li, Z., and Rosenfeld, D.: Impacts of cloud microphysics parameterizations on simulated aerosol–cloud interactions for deep convective clouds over Houston, Atmos. Chem. Phys., 21, 2363–2381, https://doi.org/10.5194/acp-21-2363-2021, 2021. a
Zipser, E. J. and LeMone, M. A.: Cumulonimbus Vertical Velocity Events in GATE. Part II: Synthesis and Model Core Structure, J. Atmos. Scie., 37, 2458–2469, https://doi.org/10.1175/1520-0469(1980)037<2458:CVVEIG>2.0.CO;2, 1980. a