the Creative Commons Attribution 4.0 License.
the Creative Commons Attribution 4.0 License.
 | 22 Aug 2025
Simulated photochemical response to observational constraints on aerosol vertical distribution over North China
Ting Yang
Xipeng Jin
Lei Chen
Yang Yang
Shuman Zhao
Bin Zhu
Zifa Wang
Hong Liao
The significance of aerosol–photolysis interaction (API) in atmospheric photochemistry has been emphasized by studies utilizing box models and chemical transport models. However, few studies have considered the actual aerosol vertical distribution when evaluating API effects due to the lack of observations and the uncertainties in model simulation. Herein, we integrated lidar and radiosonde observations with the chemical transport model (GEOS-Chem) to quantify the response of photochemistry to observational constraints on aerosol vertical distribution across different seasons in North China. The underestimation of aerosol optical depth (AOD) in lower layers and the overestimation in upper layers in GEOS-Chem model were revised. In response, photolysis rates changed following AOD, showing 33.4 %–73.8 % increases at the surface. Surface ozone increased by an average of 0.9 and 0.5 ppb in winter and summer, and the default API impact on ozone reduced by 36 %–56 %. The weaker response in summer can be related to the compensatory effects of stronger turbulence mixing in the boundary layer. The long-lasting underestimation of ozone levels in winter was also greatly improved. Due to the enhanced photochemistry, PM2.5 increased by 0.8 µg m−3 in winter and 0.2 µg m−3 in summer and increased strongly during pollution events, with a maximum daily change of 16.5 µg m−3 at Beijing station in winter. The weakened API effect in turn enhanced nitric acid formation by increasing atmospheric oxidizing capacity (13.5 % increase for OH radical) in high NOx emission areas, and this helps explain the strong response of PM2.5 in winter.
- Article
(5847 KB) - Full-text XML
-
Supplement
(1723 KB) - BibTeX
- EndNote


China has witnessed a significant reduction in fine particulate matter (PM2.5) concentration over the past decade (Zhang et al., 2019b; Xiao et al., 2022), while ozone levels increased (Lu et al., 2018; Liu et al., 2023). Ozone pollution has emerged as a critical air quality issue in China (Wang et al., 2022), especially in North China (Li et al., 2020), and is now spreading into the colder seasons (Li et al., 2021a). Many studies concluded that the rapid decline in aerosol concentrations is a key factor contributing to the increasing ozone trend (Liu and Wang, 2020; Wang et al., 2020b; Li et al., 2021b; Ma et al., 2021; Shao et al., 2021; Liu et al., 2023), highlighting the urgent need for further investigation on the interactions between aerosols and ozone.
Surface ozone is produced through the photochemical reactions of volatile organic compounds (VOCs) and nitrogen oxides (NOx), in which aerosol can also play an important role. Ozone chemistry can be affected via the heterogeneous uptake of reactive gases on aerosol surfaces (Li et al., 2017, 2018a, 2019b; Ivatt et al., 2022). Furthermore, aerosols can absorb or scatter solar radiation, thereby influencing ozone concentrations by both altering meteorological conditions through aerosol–radiation feedback (ARF) (Xing et al., 2017; Qu et al., 2020; Zhao et al., 2023) and directly changing the photolysis rates that is referred to as the aerosol–photolysis interaction (API). Overall, whether during multi-pollutant air pollution episodes (Yang et al., 2022) or under seasonal mean conditions (Li et al., 2024), the impact of API on surface ozone can overwhelm that of ARF. As such, we will focus on the API process in this study.
Early studies have confirmed the significance of API, employing either observation-based methods or chemical transport models. Dickerson et al. (1997) reported that scattering aerosols can enhance ultraviolet radiation and accelerate photochemical reactions, while absorbing aerosols have the opposite effect. Subsequent studies further investigated the impact of API during different types of pollution around the world, such as biomass burning (Mok et al., 2016; Baylon et al., 2018; Li et al., 2018b), wildfire (Jiang et al., 2012), dust events (Kushta et al., 2014; Li et al., 2017), and anthropogenic pollution (Li et al., 2011, 2018a; Gao et al., 2020; Wu et al., 2020; An et al., 2021; Yang et al., 2022). In the highly polluted areas of China, API can lead to a 5 %–12 % decrease in surface ozone during anthropogenic pollution episodes in warm seasons (Li et al., 2011; Yang et al., 2022) and a 5 %–20 % decrease in cold seasons (Li et al., 2018a; Gao et al., 2020; Wu et al., 2020). The effects of long-term aerosol changes on photolysis have also been estimated in China. Using the Troposphere Ultraviolet and Visible (TUV) radiation model, Zhao et al. (2021) found that the photolysis rate of nitrogen dioxide (J[NO2]) in North China increased by s−1 yr−1 from 2013 to 2019 due to the aerosol declines. Consequently, the ozone concentration in North China increased by approximately 1 ppb during the period of rapid decline in aerosol concentration (2013–2017) due to API, as indicated by WRF-CMAQ simulations (Liu and Wang, 2020). This impact of API on long-term ozone trends was also confirmed using the box model approach (Wang et al., 2020b; Ma et al., 2021).
What's more, API can alter the atmospheric oxidizing capability and suppress secondary aerosol formation, resulting in changes in PM2.5 concentrations. For example, API reduced PM2.5 concentrations by 2.5 % to 10 % in the North China Plain during wintertime pollution events (Wu et al., 2020) and by 2.4 % in Delhi during the crop residue burning period (Chutia et al., 2024). Li et al. (2024) reported that the impact of API could decrease PM2.5 by 5.4 µg m−3 in winter but increase PM2.5 by 2.5 µg m−3 in summer over eastern China. These results indicate that the effect of API on air quality changes should not be overlooked both in short episodes and in the long-term period.
The key challenge in quantifying the impact of API on photochemistry is to reasonably represent the vertical distribution of aerosols since their effects vary across different altitudes (Jacobson, 1998; Liao et al., 1999). Shi et al. (2021) input observed PM2.5 and black carbon profiles into an optical model and a one-dimensional radiative transfer model, demonstrating that scattering aerosols can suppress photochemical reactions in the lower boundary layer but enhance them in the upper boundary layer. However, other observation-based studies using radiative transfer models and box models often rely on empirical vertical distributions of aerosols, which typically follow an exponential profile. Pietruczuk et al. (2022) compared four different aerosol vertical distribution schemes and concluded that the choice of different schemes and the variations of aerosol column depth (AOD) have a comparable impact on photolysis rates. More importantly, the actual vertical distribution of aerosols is often highly heterogeneous and far more complex than an exponential distribution (Hu et al., 2020; Sun et al., 2023).
Previous modelling-based studies on the impact of API primarily compared the simulated surface PM2.5 concentrations and AOD to observations without validating the aerosol vertical profiles. As such, using simulated profiles can introduce great uncertainty in the estimation of API effect as chemical transport models (CTMs) still struggle to reproduce the vertical distribution of aerosols accurately (Kim et al., 2015b; Huszar et al., 2020; Zhai et al., 2021; Lu et al., 2023). Our previous work revealed that the Goddard Earth Observing System Chemical Transport Model (GEOS-Chem) tends to underestimate the aerosol extinction coefficient (AEC) by approximately 30 % in the lower atmosphere during both summer and winter, while overestimating it by 30 % to 60 % at higher altitudes in summer (Chen et al., 2024). Chen et al. (2022) verified the simulated black carbon vertical profile from WRF-Chem and found an overestimation of 87.4 % at the surface level, as well as an underestimation of 14.9 % between 300 and 900 m. Similar bias in PM2.5 profile simulations has also been reported by Liu et al. (2021a). Introducing the urban canopy model (Kim et al., 2015b) or increasing minimum turbulent eddy diffusivity (Liu et al., 2021a) can improve the simulation of surface aerosol concentration, but the overestimation in the upper layer remained. Overall, it is urgent that API effects are better understood by considering the actual aerosol vertical distributions.
In this study, we used continuous aerosol vertical distributions observed by ground-based lidar and radiosonde, along with the GEOS-Chem model, to investigate the response of photochemistry to observed constraints on aerosol vertical distributions. Based on these observations, we modified the vertical distribution of aerosols in the photochemical module of GEOS-Chem over North China. The responses of photolysis rates, ozone, and PM2.5 to observational constraints on aerosol vertical distribution through API across different seasons were quantitatively assessed by comparing control and sensitivity simulations. A description of the observations and model settings is presented in Sect. 2. Section 3 outlines the existing biases in the model and provides a detailed account of how the aerosol vertical distribution was modified. Section 4 discusses the responses of photolysis, ozone, and PM2.5 to this modification and their underlying mechanisms, followed by conclusions in Sect. 5.
2.1 Observations
To constrain the aerosol vertical distribution in the model, we utilized consecutive observations of aerosol extinction coefficient (AEC) from a ground-based Mie-scattering lidar located at the Institute of Atmospheric Physics, Chinese Academy of Sciences (39.982° N, 116.385° E) in Beijing (Fig. 1a). The lidar scans every 15 min, and we employed quality-controlled AEC data at the wavelength of 532 nm with a vertical resolution of 30 m. Further details about the lidar system and data processing can be found in Wang et al. (2020a). Data from January and July 2017 were used to represent winter and summer seasons, respectively.
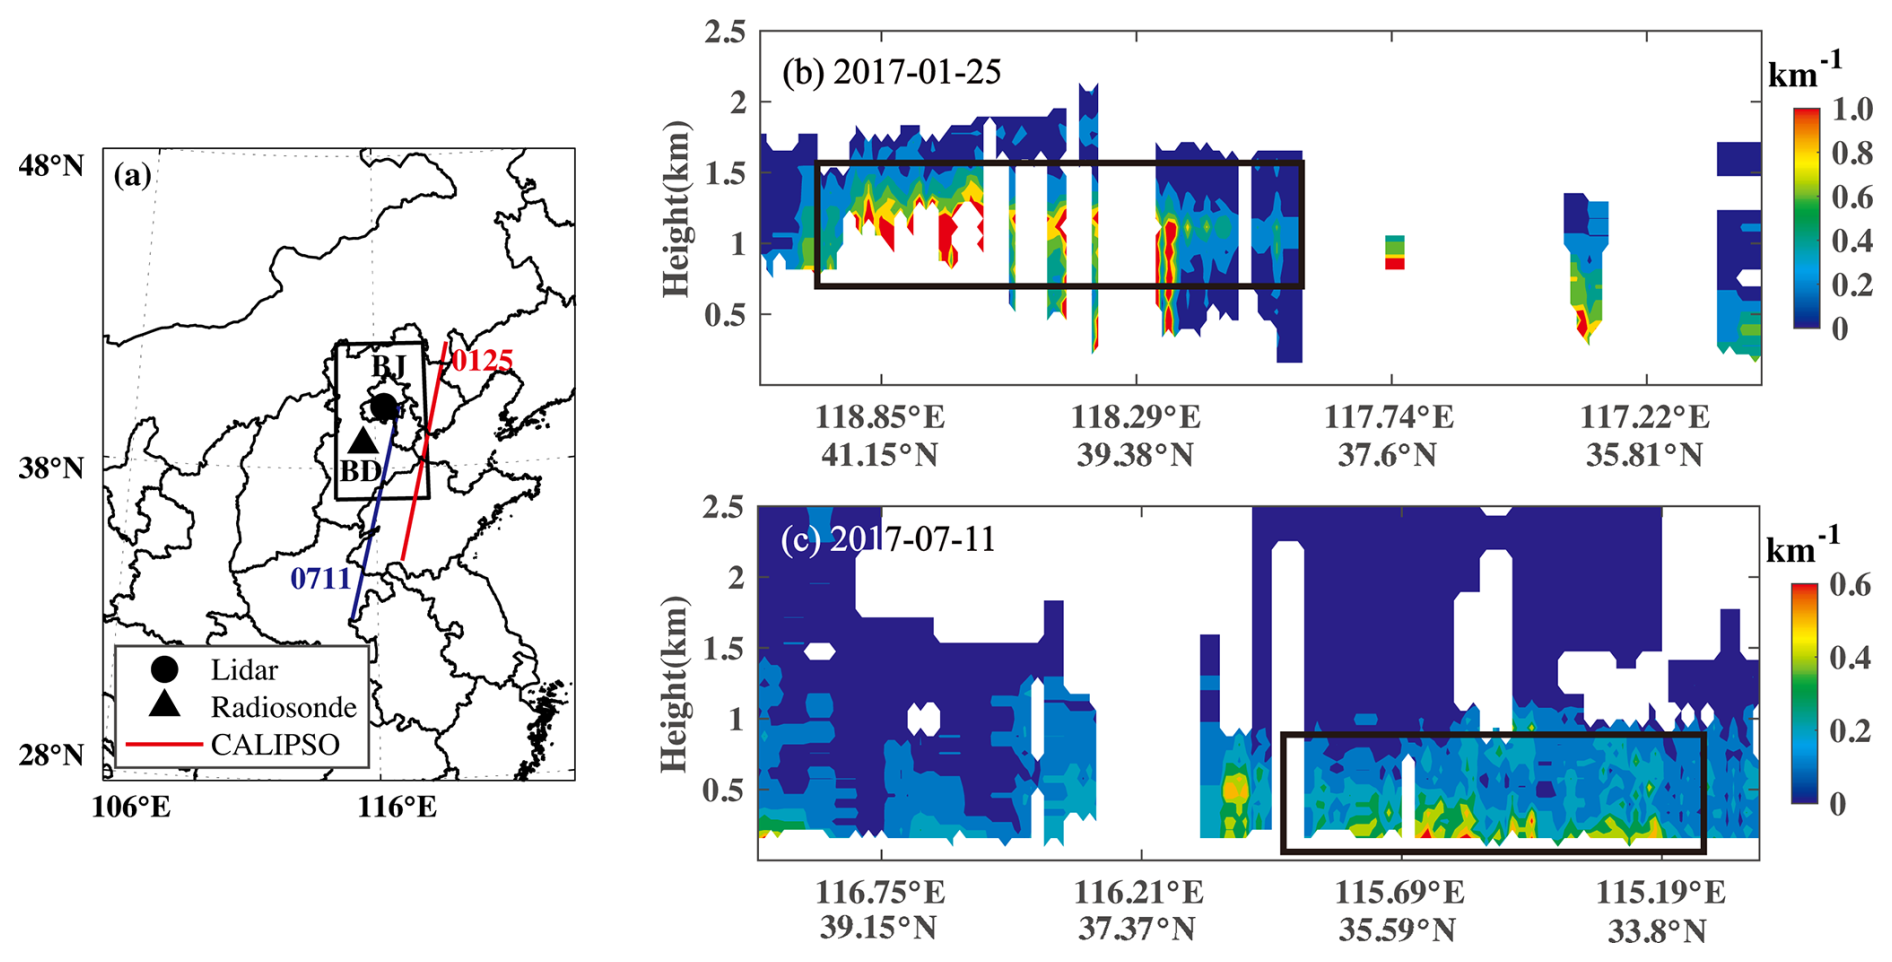
Figure 1(a) Spatial distribution of lidar and radiosonde stations. BJ: Beijing; BD: Baoding. The black rectangle shows the region where vertical distribution modification was performed. Vertical distribution of aerosol extinction coefficient (532 nm) from CALIPSO on (b) 25 January 2017 and (c) 11 July 2017. The corresponding CALIPSO overpassing tracks are marked with red and blue lines in (a).
To verify the results constrained by lidar, we also utilized vertical PM2.5 concentration profiles from radiosonde observations conducted in Baoding (Fig. 1a). The radiosonde data were collected every 3 h from 17 June to 7 July 2019, at Baoding station (38.783° N, 115.5° E) with an altitude of 19 m. This radiosonde measurement provides high-resolution boundary layer profiles containing PM2.5 and PM10 concentrations, temperature, relative humidity (RH), and wind. A detailed description of the design of the radiosonde observations and the instruments used can be found in Li et al. (2023). Surface observations of hourly NO2, ozone, and PM2.5 concentrations from the Ministry of Ecology and Environment (MEE) network were accessed at http://quotsoft.net/air (last access: 31 August 2023; Wang, 2023) for the model evaluation.
2.2 GEOS-Chem simulation
The GEOS-Chem model version 13.3.3 was used in this study, employing a nested-grid simulation with a horizontal resolution of 0.5° × 0.625° over the region of 15–55° N, 70–140° E. Vertically, we selected the scheme with 47 layers, where the first 8 layers are situated below 1 km, and the first 14 layers are below 2 km. MERRA-2 meteorological data from NASA and chemical boundary conditions from a global simulation with a resolution of 2° × 2.5° were used to drive the nested simulations. The boundary layer mixing, dry deposition and wet deposition schemes, and emissions were consistent with those used in our previous work (Chen et al., 2024). The standard chemistry simulation with fully coupled ozone–NOx–hydrocarbon–aerosol chemistry mechanisms was employed in this study. In GEOS-Chem, the photolysis rates are calculated by the updated Fast-JX v7.0 scheme (Eastham et al., 2014), which accounts for the presence of aerosols, clouds, and absorbing gases. Developed from the Fast-J radiative transfer algorithm (Wild et al., 2000), FAST-JX provides a full scattering calculation for 18 wavelength bins covering 177–850 nm. The photolysis rates are determined by the resolved flux and cross sections of different species in each wavelength bin. The impacts of aerosols, including sulfate–nitrate–ammonium (SNA), organic aerosol (OA), black carbon (BC), sea salt, and dust, on photolysis rates are closely related to aerosol optical properties, which are calculated using the Mie code based on the simulated three-dimensional aerosol concentrations. Here, we modified the aerosol vertical distribution with observational constraints after the calculation of AOD, and more details are presented in Sect. 3.
The simulation periods included January and July 2017 for the lidar observation time frame and June–July 2019 for the radiosonde observation time frame. For each period, we performed three sensitivity experiments to examine the impact of revised aerosol vertical distribution on photochemistry, as detailed below:
-
BASE: the baseline simulation, which includes the API with the original aerosol vertical distribution in the model;
-
REGION: same as the BASE simulation but incorporating observational constraints on aerosol vertical distribution over North China (37–42° N, 114.375–118.125° E), wherein only the aerosol vertical distribution below 3 km was modified in the calculation of photochemical rates based on lidar and radiosonde observations;
-
API_OFF: same as the BASE simulation but with the effect of API turned off in the photochemical module.
By comparing the BASE and REGION simulations, we can quantify the photochemical response to observational constraints on aerosol vertical distribution over North China. The role of all aerosols in photolysis can be estimated by examining the differences between BASE and API_OFF simulations.
3.1 Existing biases in model aerosol vertical distribution
The model performance in simulating surface air pollutant concentrations and aerosol vertical distributions was evaluated. Table S1 in the Supplement presents the correlation coefficient and normalized mean bias (NMB) of NO2, ozone, and PM2.5 concentrations in North China. These statistics were calculated based on the average hourly concentrations at 12 observation stations in the region (37–42° N, 114.375–118.125° E) where modification of aerosol vertical distribution was applied. The GEOS-Chem generally reproduced the variation in surface concentrations in winter, achieving correlation coefficients of 0.75, 0.69, and 0.69 for NO2, ozone, and PM2.5, with underestimations of 22.1 %, 24.8 %, and 4.3 % for NO2, ozone, and PM2.5, respectively. The model exhibits higher correlation coefficients (0.80–0.84) with the ozone observations during summer, except for PM2.5 in summer 2017. This seasonality of model performance aligns with validations reported in many previous studies (Kim et al., 2015a; Akimoto et al., 2019; Li et al., 2019a; Huszar et al., 2020; Zhai et al., 2021). The model simulated NO2 and ozone best in the summer of 2019, with an NMB of −2.8 % and −0.9 %, but there was an overestimation of PM2.5. Since we focused on the differences between sensitivity experiments, the model shows an acceptable performance in simulating surface air pollutants.
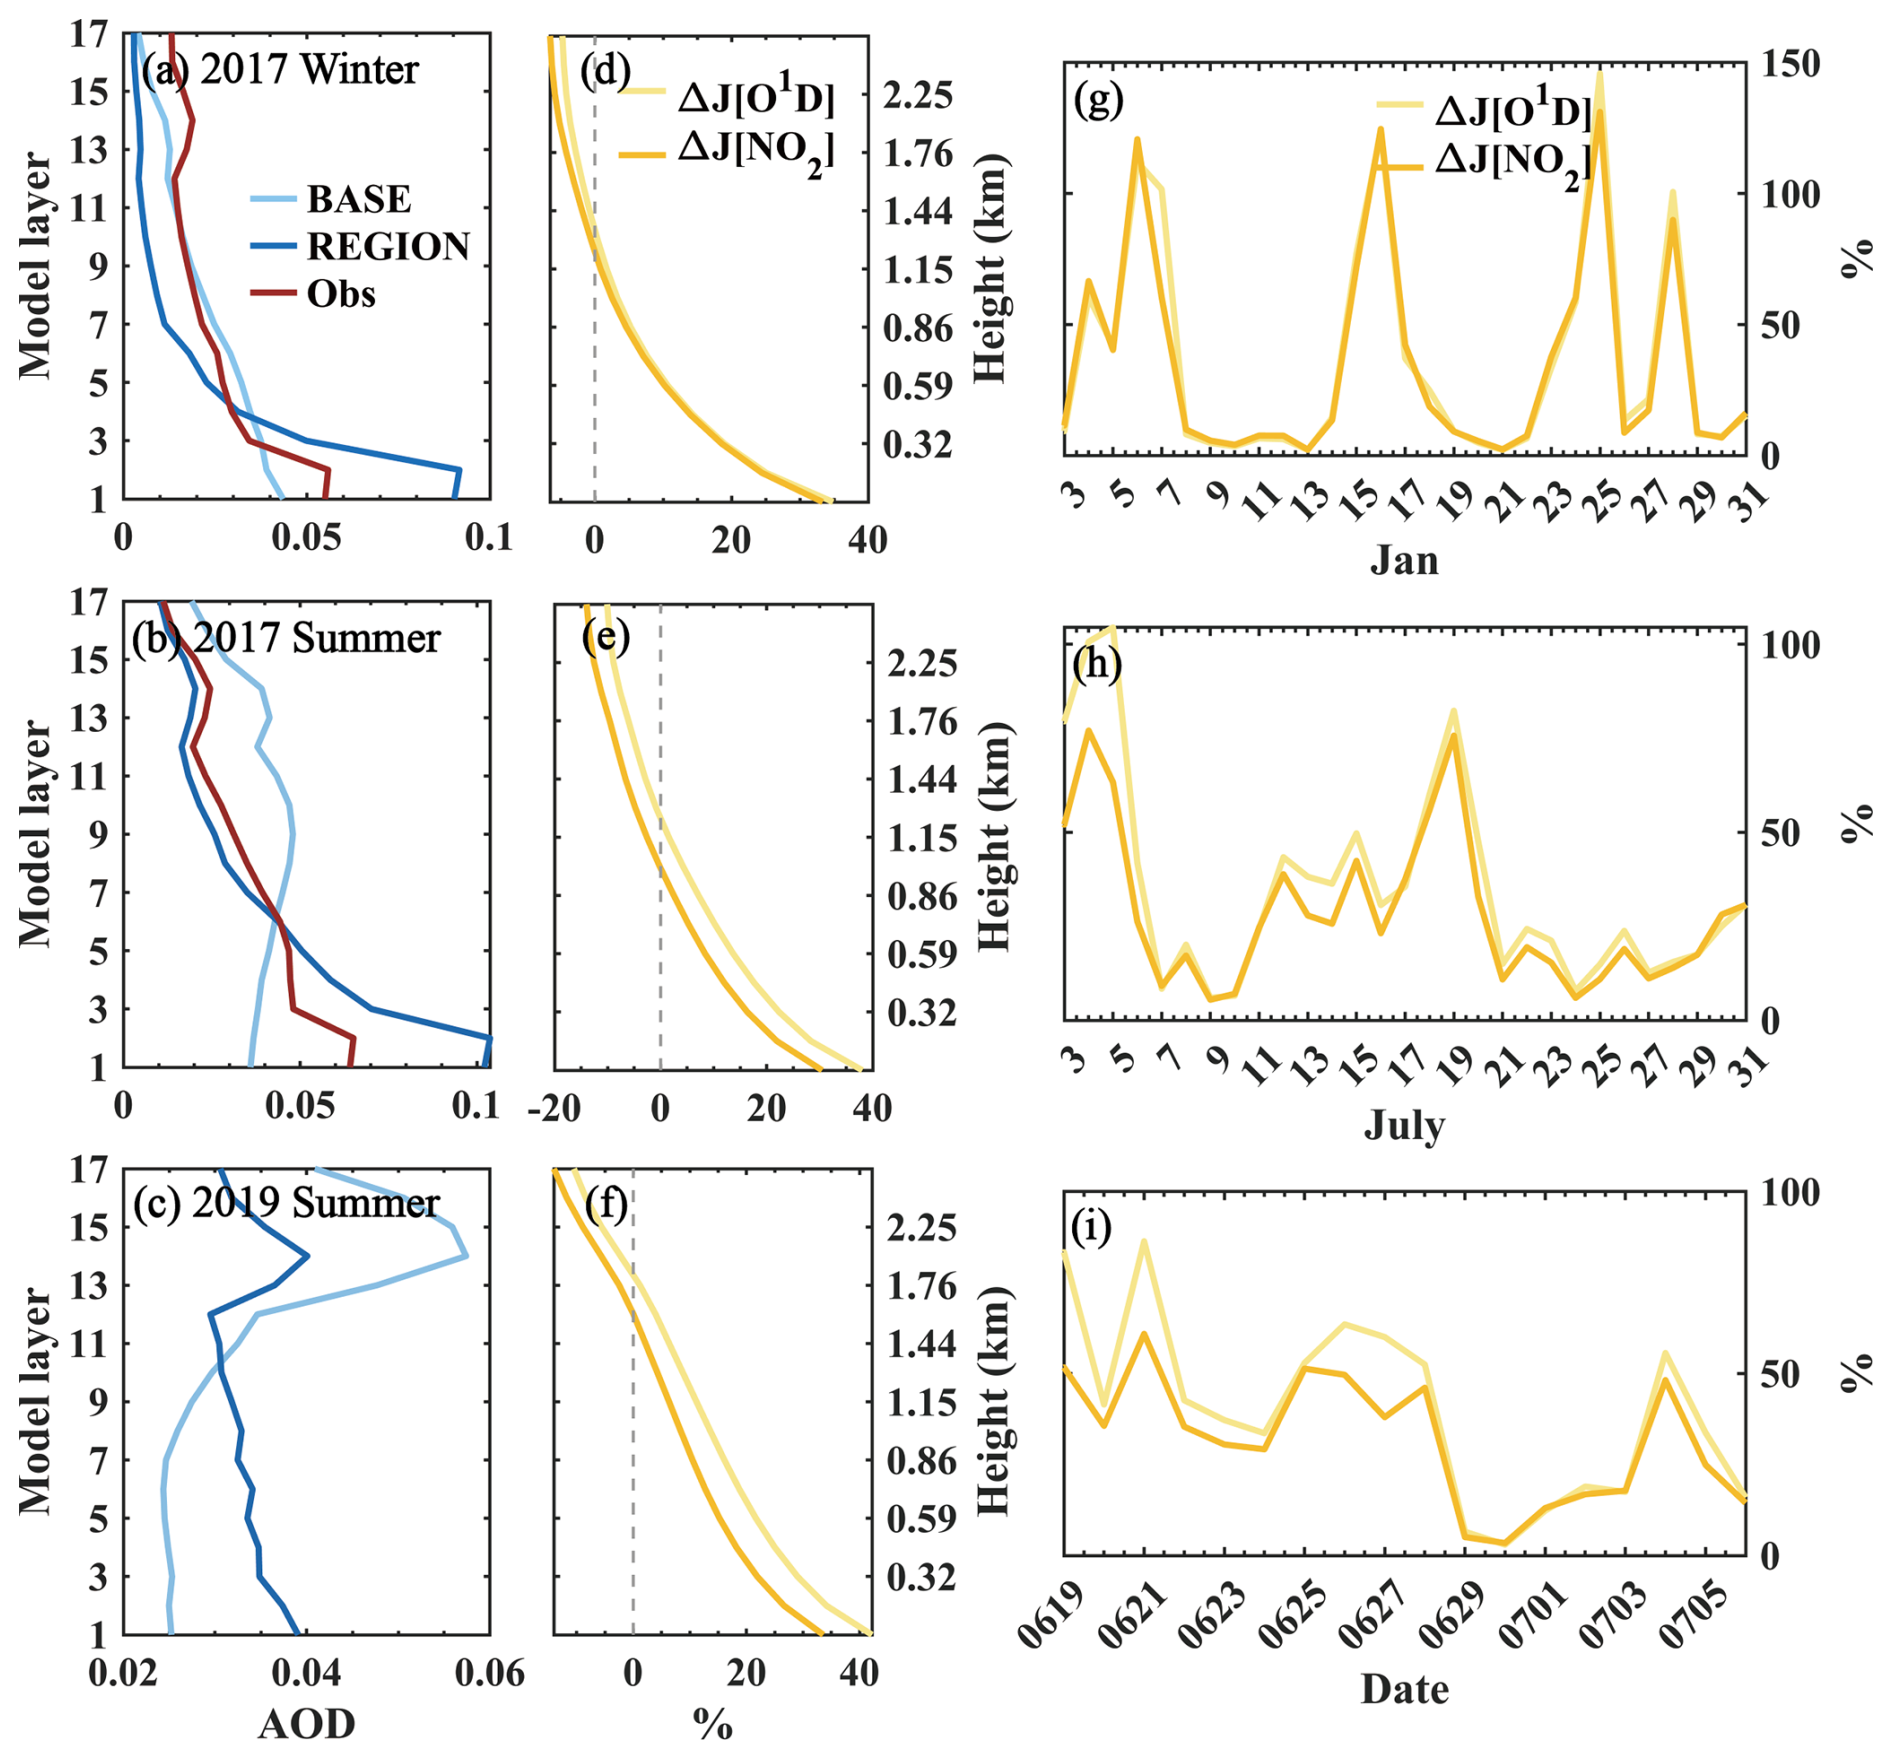
Figure 2Vertical profiles of average (a–c) AOD and (d–f) relative changes of J[NO2], and J[O1D] in model layers at observation stations. The red, light, and dark blue lines represent observed, BASE-simulated, and REGION-simulated AOD, respectively. (g–i) Time series of daily average relative changes of surface J[NO2] and J[O1D] at observation stations. From top to bottom: winter 2017 (a, d, g), summer 2017 (b, e, h), and summer 2019 (c, f, i), respectively. The averages are calculated using data during the daytime when photolysis occurs.
Figure 2 compares the average AOD profiles derived from the lidar observation with the BASE simulation. In winter, the AOD was underestimated by 20.8 % and 30.1 % in model layers 1 and 2, respectively, but it was subsequently overestimated until layer 10 (∼ 1.29 km), with a maximum NMB of 18.9 %. In summer, similarly, the AOD was underestimated by 3.4 %–43.9 % below layer 6 (∼ 0.73 km) and was then overestimated by more than 50 % above layer 9 (∼ 1 km). As reported in our previous work, emission sources, optical properties, size distributions of aerosols, and RH are the key factors contributing to the model bias in AOD (Chen et al., 2024). As photolysis rates can also be affected by the single scattering albedo (SSA), we validated the simulation of SSA at 440 nm with the observation from AERONET in January 2017 (Fig. S1 in the Supplement). It shows that SSA was well reproduced, with an NMB of 3.8 %, so only AOD profiles were revised in this work. We also compared the daily average PM2.5 profiles from radiosonde data and GEOS-Chem (Fig. S2). Consistent with previous studies (Kim et al., 2015b; Liu et al., 2021a; Chen et al., 2022), the model has difficulty in accurately capturing the complex characteristics of aerosol vertical distribution. The comparisons of observed and simulated PM2.5 profiles for three typical cases are presented in Fig. S1. Overestimation of PM2.5 in the upper layer was common, while the model performance varied in the lower layer. The above simulation biases in aerosol vertical distribution underline the importance of observational constraints that will be elaborated in the following.
3.2 Modification of model aerosol vertical distribution
The ground-based lidar provided high-resolution AEC profiles, and we used the hourly average AEC profiles to conduct the modification after interpolating to model layers. The first model layer (approximately 58 m) is in the fade area of the lidar; therefore, we assumed the AEC in layer 1 to be the same as that in layer 2. We tested the impact of this assumption on ozone with the radiosonde data, which has observed data in layer 1 (Fig. S2). The results indicate that when this assumption was adopted, the effect of revised aerosol vertical distribution on ozone barely changed in both spatial distribution and regional averages. Then, AOD for each layer can be obtained by multiplying AEC by the layer height. Subsequently, the observational AOD vertical distributions were incorporated into the model with the following equations:
where ri represents the ratio of AOD in layer i to the total AOD within 3 km (layers 1 to 17 in the model), AODi, obs is the AOD in layer i from observations, AOD1–17, sim refers to the column AOD below 3 km from the BASE simulation, and AODi, new is the AOD in layer i after modification. The AOD in GEOS-Chem model was summed up by sulfate, nitrate, ammonium, OA, BC, sea salt, and dust AOD, and the contribution of each aerosol component remained unchanged in the REGION simulation. This modification of aerosol vertical distribution was applied only within the photochemistry module when calculating photolysis rates.
Unlike lidar, radiosonde observations have no fade area near the surface. Therefore, we used PM2.5 concentration profiles from radiosonde data collected in summer 2019 to validate the reliability of results derived from observational constraints based on lidar. Before constraining the model, we converted the PM2.5 concentration profiles into AEC profiles using the Interagency Monitoring of Protected Visual Environments (IMPROVE) algorithm (Pitchford et al., 2007). This algorithm estimates AEC based on measured species concentrations and has been widely validated in China (Cao et al., 2012; Tao et al., 2014; Xiao et al., 2014; Bai et al., 2020). The PM2.5 and PM10 concentrations and RH profiles from radiosonde data and the simulated proportions of aerosol components were utilized in the IMPROVE algorithm. Afterward, the model's aerosol vertical distribution was revised according to Eqs. (1)–(2), and it was updated every 3 h.
The modification of aerosol vertical distribution was carried out over North China (37–42° N, 114.375–118.125° E) as shown in Fig. 1a. Based on the observed surface pollutant concentrations, we found a strong temporal consistency between hourly concentrations at vertical observation stations and the average hourly concentrations at 12 city stations in the modified region (Table S2). The correlation coefficients of ozone (0.88–0.95) and PM2.5 (0.53–0.86) indicate that air pollution in North China usually occurs regionally. Moreover, we also used observations of AEC profiles from CALIPSO (Level 2, V4.20) to demonstrate that aerosol vertical distributions in North China exhibit regional characteristics. Vertically, aerosols can occasionally be transported in the upper layer, as evidenced by an aerosol layer at approximately 1 km on 25 January 2017, extending for about 200 km across North China (Fig. 1b). Near the surface, as observed on 11 July 2017 (Fig. 1c), high values in the lower layers were also observed over a regional extent of several hundred kilometres. Besides, we analysed the correlation of simulated daily average aerosol vertical distributions at the observed grid point and the other 76 grid points in the modified region, finding that over half of the grid points exhibited significant correlation (Fig. S4). Li et al. (2022) also highlighted the regionality of the upper aerosol layer through joint observations from multiple radiosonde stations. Figure S5 shows the vertical distribution of PM2.5 concentrations in model layers at six radiosonde stations for winter 2019. According to Li et al. (2022), these stations can be spaced up to 150 km apart, and simultaneous observations for a consecutive month show that the timing of occurrence and vertical profiles of PM2.5 concentrations at different stations are very similar. The differences in real aerosol vertical distribution between the observation station and the modified region are inevitable. However, the consistency of pollutant concentrations at surface observation stations (Table S2), the regional characteristic of vertical distributions from satellite observations in Fig. 1, and the similarity of simulated aerosol vertical distributions in the modified region, combined with the PM2.5 profiles at six radiosonde stations, could demonstrate the spatial representativeness of the measurements. As such, we believe that the aerosol vertical distribution in the modified region closely aligns with that observed at the Beijing and Baoding stations. The impact of aerosol vertical distribution modification on photochemistry in North China in this work may represent an upper estimate due to the regionally assumed profiles.
Modifying aerosol vertical distribution can alter photolysis rates and thereby affect photochemical reactions. We evaluated the impact of revised aerosol vertical distribution on photolysis rates (Sect. 4.1), ozone (Sect. 4.2), and PM2.5 (Sect. 4.3) across different seasons and discussed the influencing factors. It is noted that all impacts in this section were only evaluated during the daytime when photochemical reactions occur.
4.1 Impact of revised aerosol vertical distribution on photolysis rates
The photolysis of nitrogen dioxide (NO2) and the photolysis of ozone are two major photolysis reactions in ozone production: (λ<420 nm) and (λ<340 nm). Figure S6 shows the responses of their photolysis rates (J[NO2] and J[O1D]) at the surface layer to the observational constraints over North China. The photolysis rates only increased in the modified region, with a more pronounced increase from north to south. In winter, the regional average ΔJ[NO2] was 63.4 %, and ΔJ[O1D] was higher at 73.8 %. The relative changes of J[NO2] and J[O1D] in North China were 33.4 % and 41.8 % in summer 2017, respectively, and spatial distributions were similar to those in winter. Compared with the results from lidar constraints, similar changes in photolysis rates were also found in radiosonde constraints. The J[NO2] and J[O1D] increased by 34.8 % and 44.7 % in summer 2019, respectively, with the difference in change rates compared to winter primarily attributed to the southern part of North China. In comparison, the impact of aerosol vertical distribution on photolysis rates in both winter and summer was much greater than the impact of absorbing OA (13.5 %–18.1 %) and BC (11.4 %–12.5 %) over North China, as reported by Li and Li (2023). This further confirmed the importance of accurate representation of aerosol vertical distribution in evaluating API impact.
Figure 2 presents the vertical distributions of ΔJ[NO2] and ΔJ[O1D] at observation stations. With the observational constraints employed, the AOD at the lidar station increased below layer 4 in winter and decreased above this layer. Consequently, the photolysis rates increased in the lower layers and decreased in the higher layers, with the transition height approximately 0.5 km higher than AOD. Similarly, the modified AOD increased below layer 6 and layer 10 for the summer of 2017 and 2019 (Fig. 2b–c), which was more aligned with the observed exponential attenuation, and the changes in photolysis rates were consistent with the variations in AOD profiles. Differently, there was roughly a 5 % greater increase in J[O1D] compared to J[NO2] in all layers during summer. In addition, the accuracy of column AOD simulations plays an important role in the impact of revised aerosol vertical distribution. Figure S7 shows the vertical distribution of AOD, ΔJ[NO2], and ΔJ[O1D] under different scenarios of AOD simulation bias. When the column AOD was underestimated, the observationally constrained layer AOD was still lower than the observations. The revised vertical distribution was more consistent with observations when the column AOD was overestimated, but the revised AOD in lower layers was much higher than the observations. Consequently, the relative change of photolysis rates was approximately 3 times higher with overestimated AOD compared to underestimated AOD in winter and 1.5 times higher in summer. In this work, we focused on aerosol vertical distribution, and the improvement of AOD simulation should be promoted in future study.
We also compared the temporal changes in photolysis rates (Fig. 2g). The photolysis rates increased primarily during several pollution periods in winter, with peak values exceeding 100 %. However, during clean days, aerosol vertical distribution had a limited impact on photolysis. The peak of the daily average photolysis rate changes in summer was notably lower than that in winter (Fig. 2h–i), yet the photolysis enhancement during summer was more consistent throughout the period.
To further verify the impacts of aerosol vertical distribution modification, we also compared the simulated surface J[NO2] to data at Xianghe station (39.76° N, 116.96° E) located in North China from Zhao et al. (2021) (Fig. 3). This dataset was reconstructed by observational J[NO2], total ultraviolet radiation, and the Troposphere Ultraviolet and Visible (TUV) radiation model, with an improved R2 value of 0.94 between the observed and reconstructed data. The seasonal average J[NO2] in summer was higher than in winter, and it was greater in summer 2019 than in summer 2017 due to the decline in aerosol concentrations. More importantly, the BASE simulation underestimated observation-based J[NO2] during all simulation periods. In winter, the underestimation was 20.1 %, but after the revision of aerosol vertical distribution, it turned into a 4.8 % overestimation. A similar improvement in the underestimation of photolysis rates was also demonstrated in the summers of 2017 and 2019. These results indicate that revising the aerosol vertical distribution can better simulate photochemical processes.
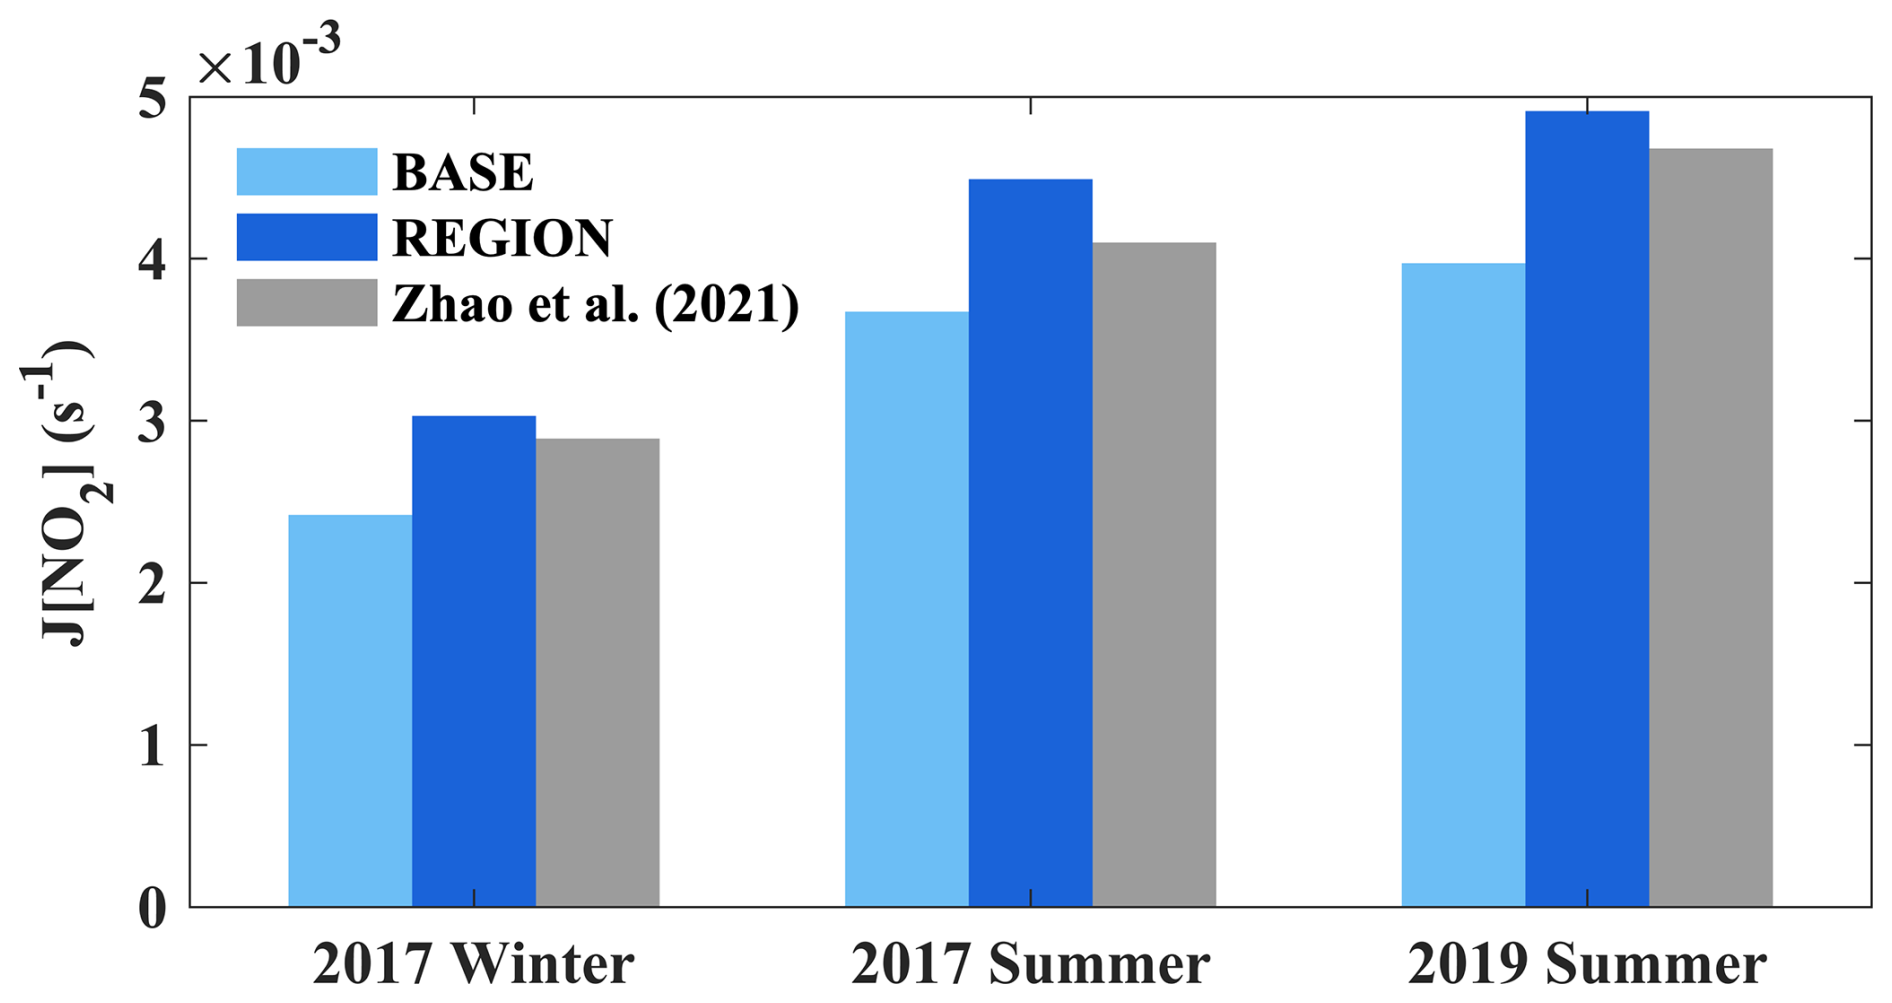
Figure 3Simulated and observed average surface J[NO2] at Xianghe station for winter 2017, summer 2017, and summer 2019. The seasonal average J[NO2] from Zhao et al. (2021) is presented by grey bars.
4.2 Impact of revised aerosol vertical distribution on ozone
4.2.1 Wintertime
Figure 4 shows the spatial distributions of changes in surface ozone and NO2 in response to observational constraints on aerosol vertical distribution. Generally, as the aerosol layer moved from the upper layers to the lower layers, more solar radiation reached the surface and promoted photolysis. Increased photolysis of NO2 accelerated ozone production, leading to a rise in surface ozone levels and a corresponding decrease in NO2. The variations in ozone displayed patterns that closely resembled the spatial distribution of changes in photolysis rates. In winter, ozone increased by an average of 0.9 ppb, with a maximum increase of 2.7 ppb in the modified region (Table 1). Figure 4c illustrates the default effect of API on ozone in winter, with a regional average of −1.6 ppb. The impact of revised aerosol vertical distribution on ozone can reduce the API-induced ozone by 56 %, implying that the vertical distribution is as important as the column AOD intensity in determining API. Moreover, the underestimation of ozone in North China was reduced from −25 % in the BASE simulation to −17 % in the REGION simulation (Table S1). This suggests that improving the accuracy of aerosol vertical distribution representativeness could mitigate the underestimation of ozone levels in winter.
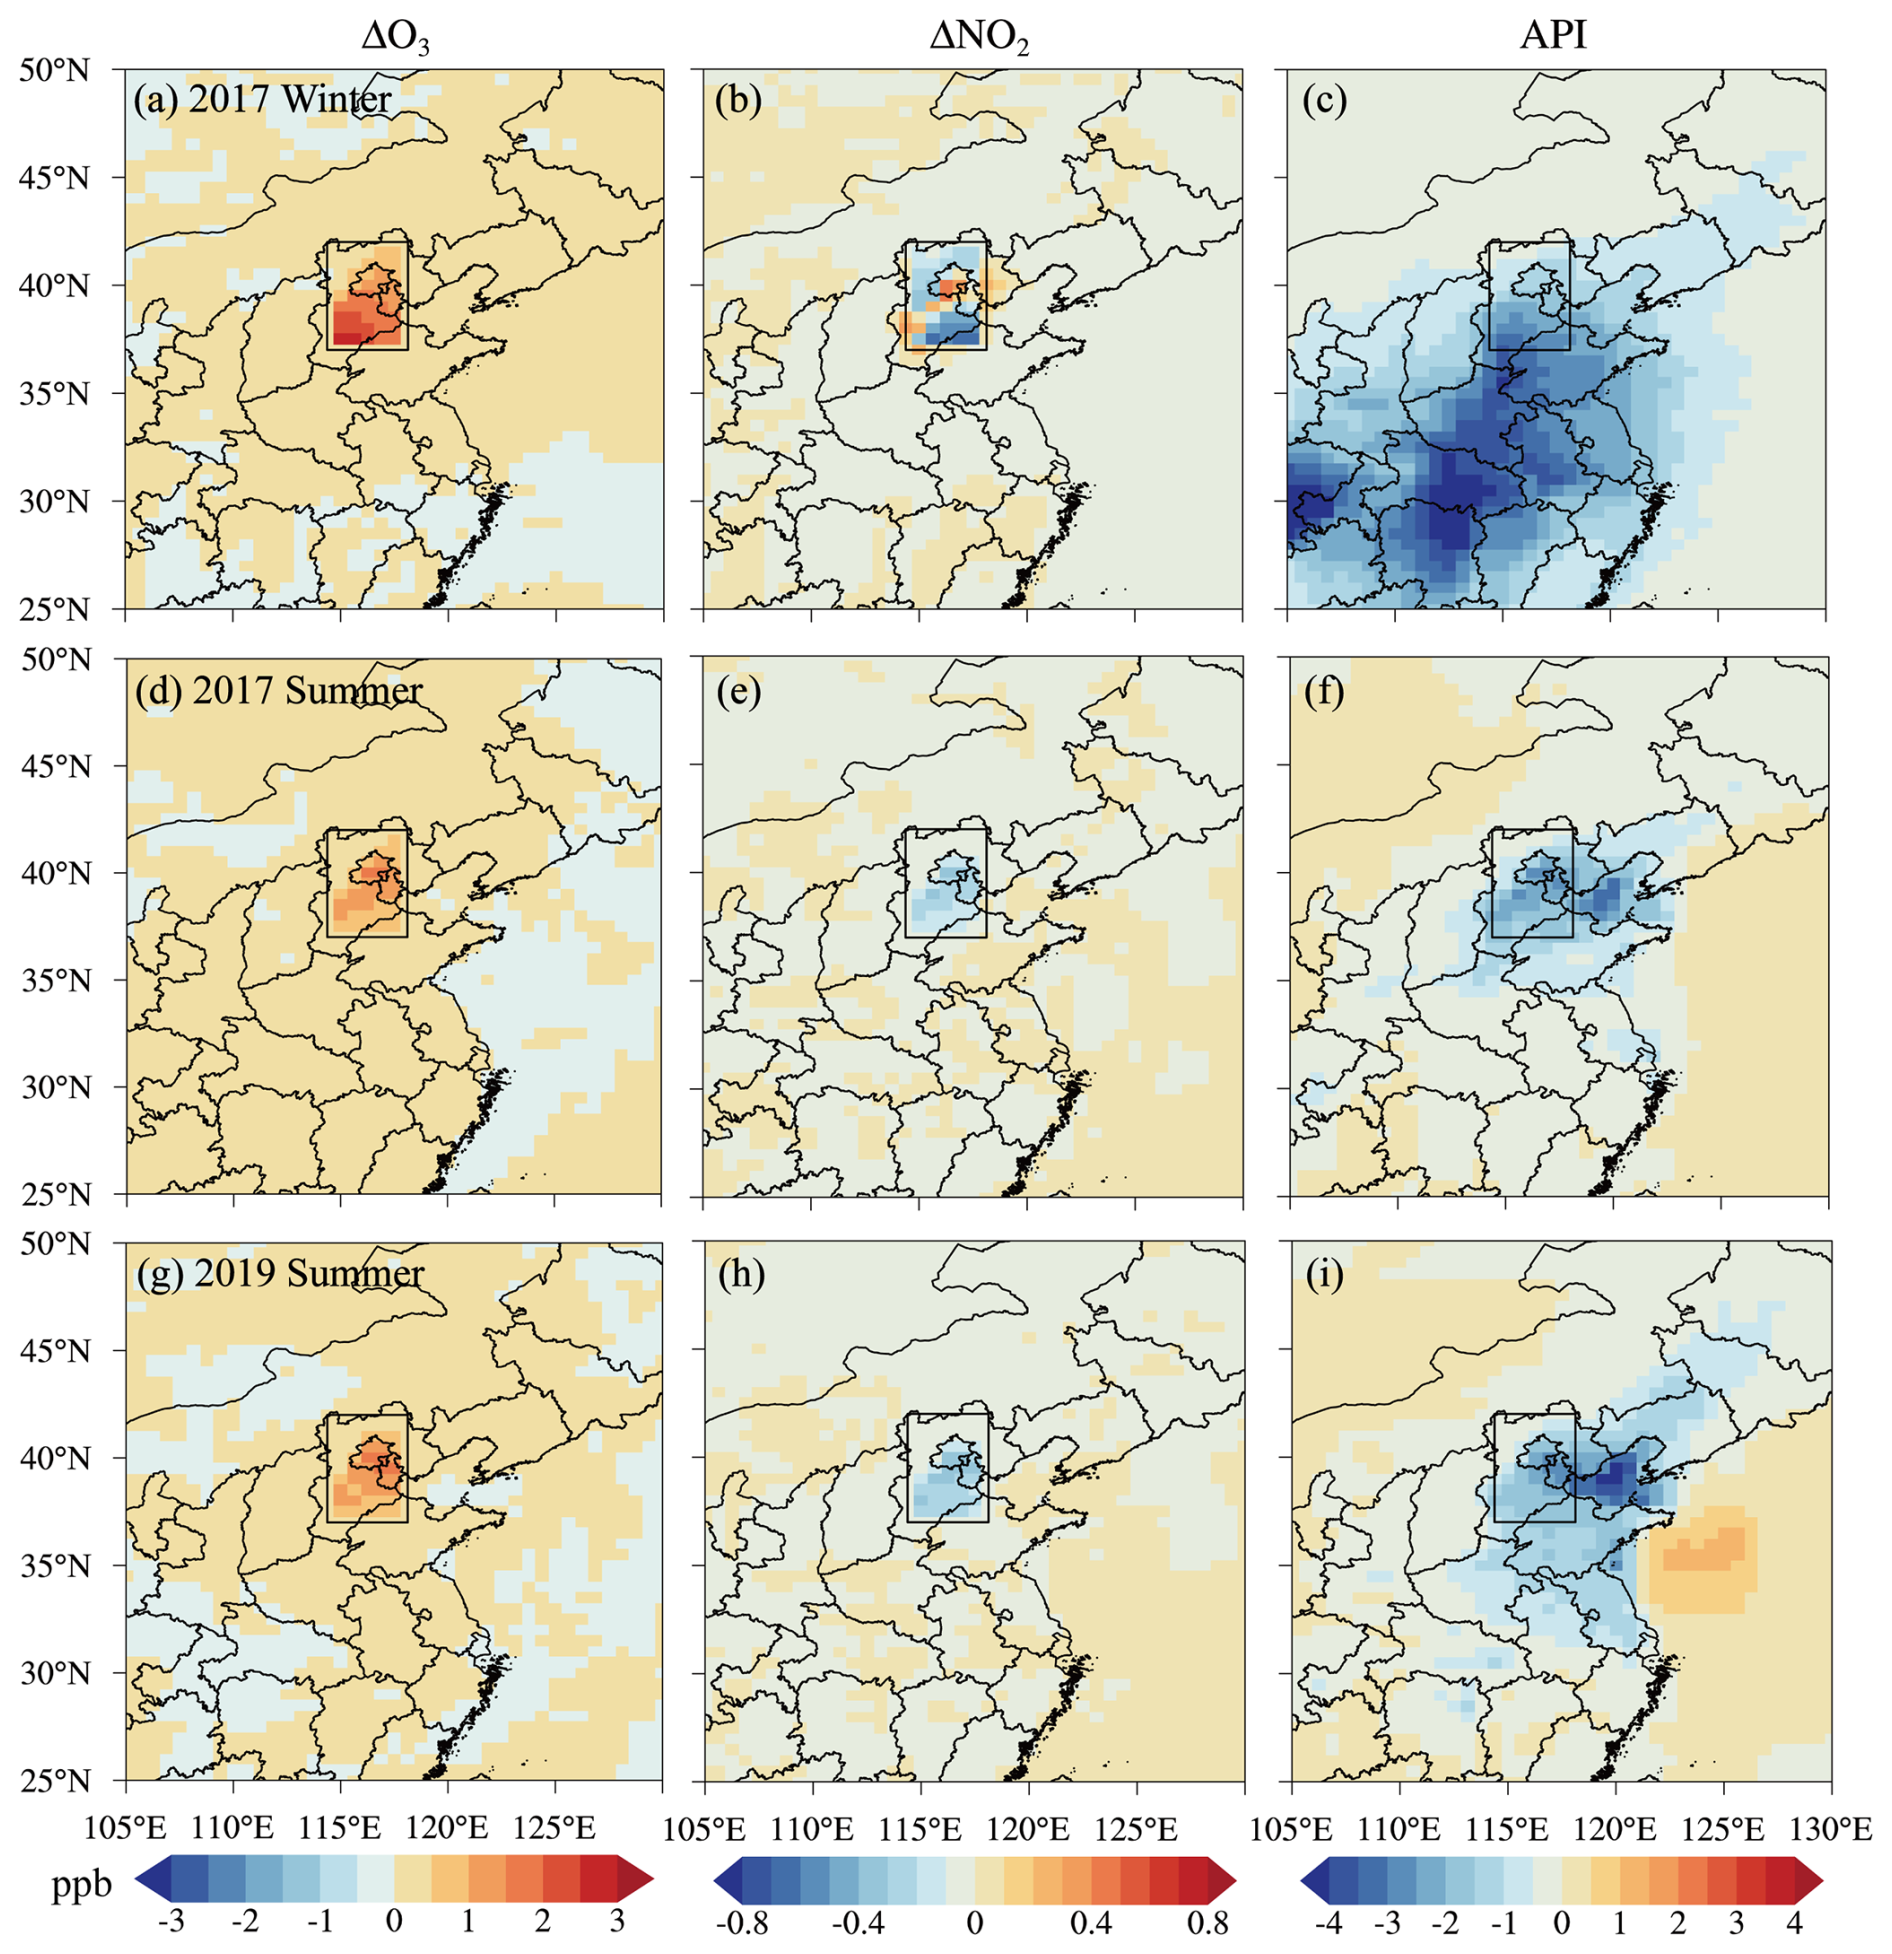
Figure 4Simulated responses of daytime ozone and nitrogen dioxide (NO2) to observational constraints on aerosol vertical distribution over North China (left and middle columns), along with the effect of aerosol–photolysis interaction (API) on daytime ozone (right column). From top to bottom: winter 2017 (a–c), summer 2017 (d–f), and summer 2019 (g–i), respectively. The black rectangle shows the region where vertical distribution modification was applied.
Table 1The regional maximum and average changes in ozone and PM2.5 over North China for seasonal and daily mean. O3_API is the default effect of aerosol–photolysis interaction (API) on ozone. Relative changes are also given in brackets.
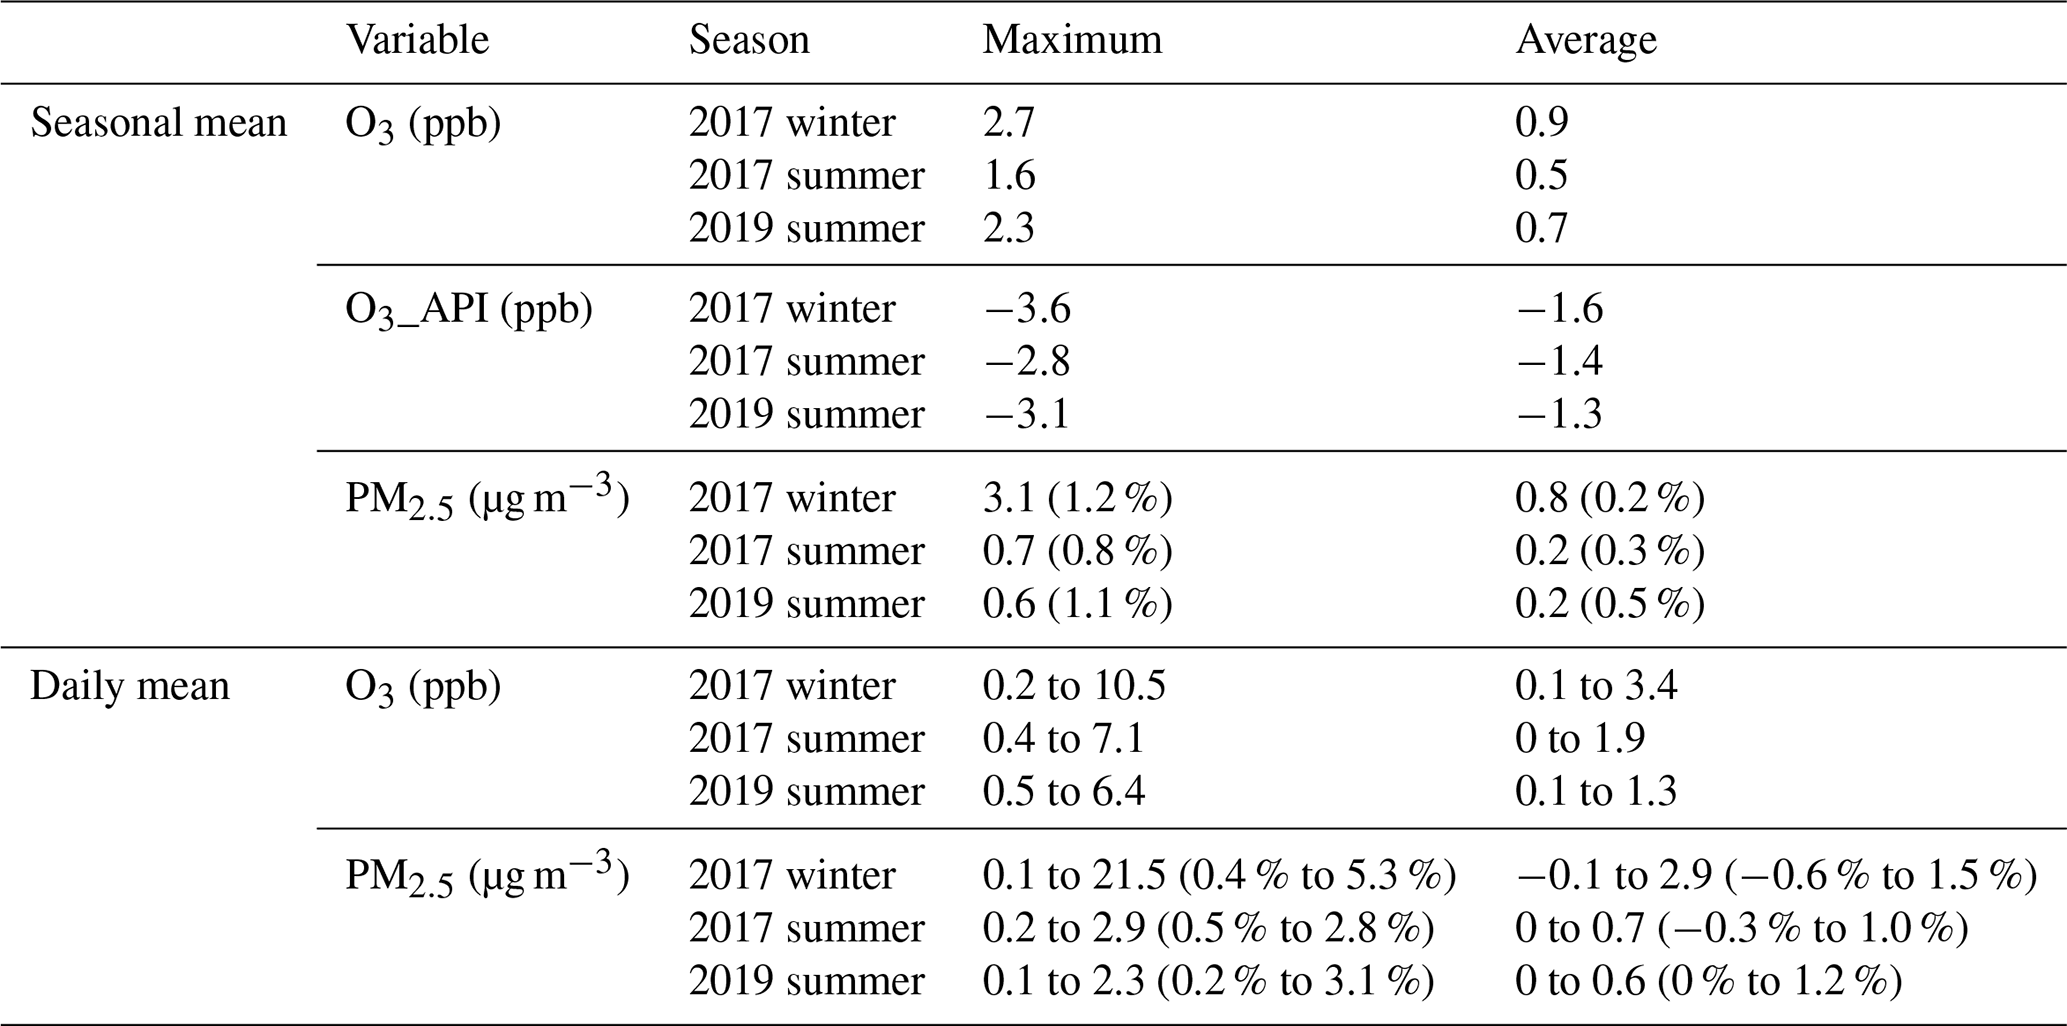
Figure 5a and d further present the changes in daily average NO2 and ozone along the longitude profile of the lidar station in winter. In line with the change in photolysis rates, the changes in NO2 and ozone were also periodic. It is evident that the increase in NO2 shown in Fig. 4b was not contributed by a single event. The surplus of NOx in the winter atmosphere, combined with the increase in ozone concentrations due to enhanced photolysis, led to a greater oxidation of NO. Therefore, NO2 increased in the region with high NOx emission when ozone production was accelerated. For daily average, API led to a reduction of ozone by 0.1–6.2 ppb in North China. For reference, Xing et al. (2017) reported that API reduced daily maxima 1 h ozone by 2–8 ppb in January 2013 over North China Plain. With revised aerosol vertical distribution, ozone was primarily increased during the periods of 3–8, 15–18, and 23–28 January when photolysis was enhanced. The regional average daily ozone was increased by 0.1–3.4 ppb, and the regional maximum daily ozone was increased by 0.2–10.5 ppb (Table 1). Our results indicate that the impact of revised aerosol vertical distribution can greatly weaken the default API effect.
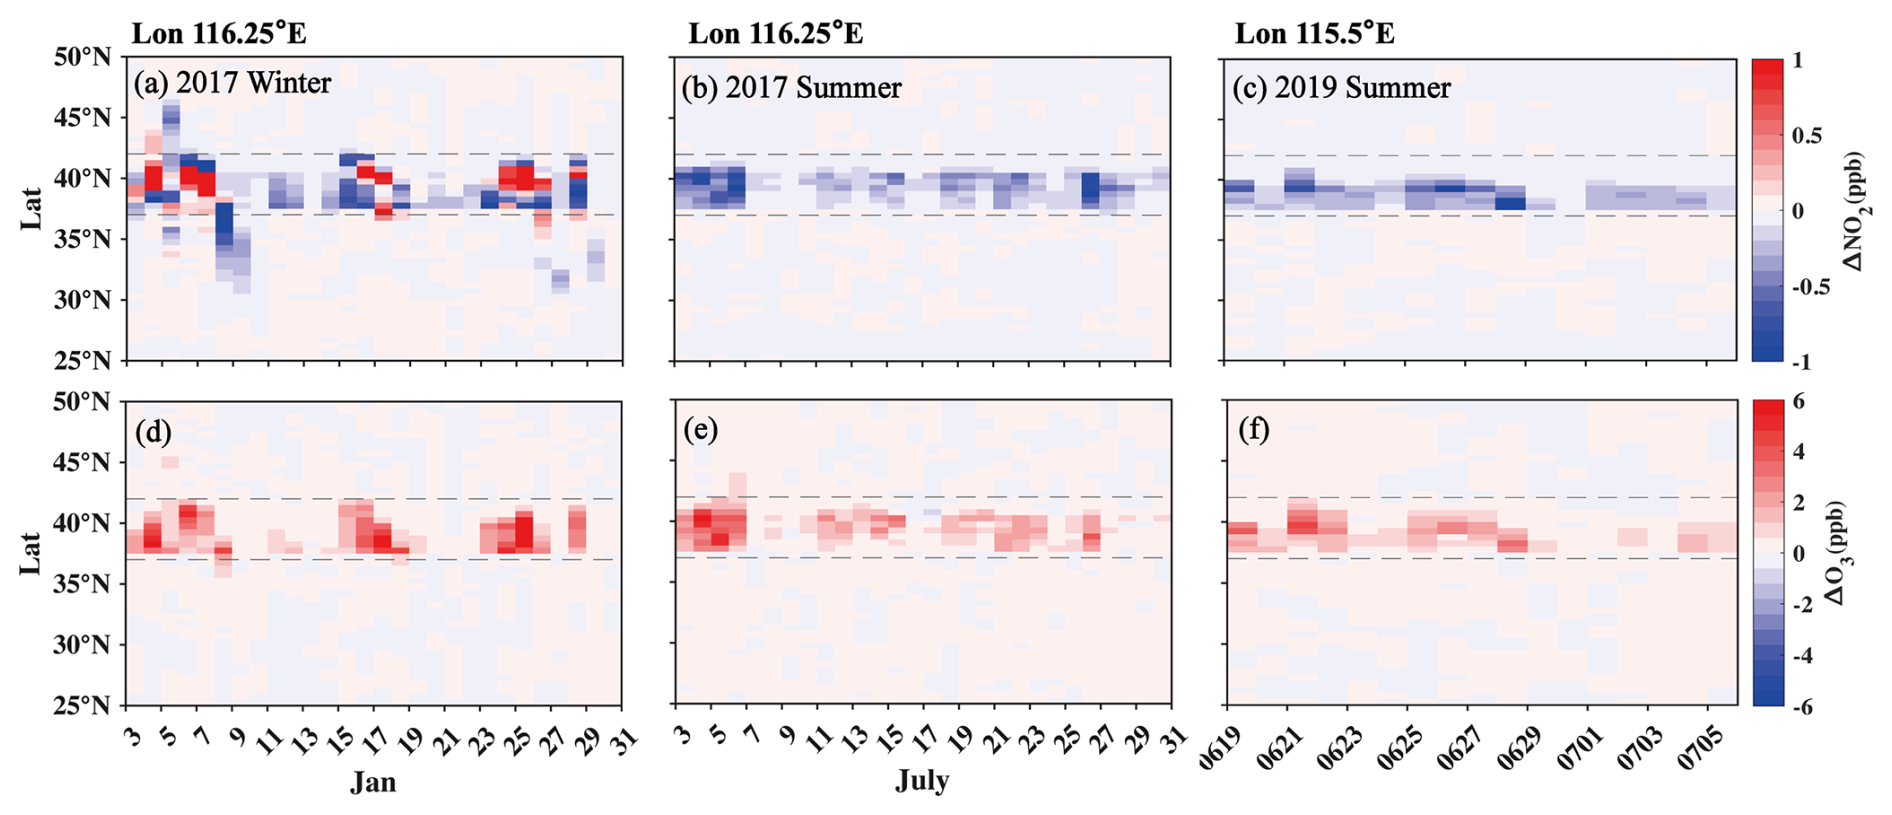
Figure 5Simulated responses of daytime average ozone and nitrogen dioxide (NO2) to observational constraints on aerosol vertical distribution along the longitude profiles of observation stations. From left to right: winter 2017 (a, d), summer 2017 (b, e), and summer 2019 (c, f), respectively. The dotted lines indicate the latitude range of the modified region, and the longitudes of the stations are marked at the top.
4.2.2 Summertime
In summer, areas with increased photolysis rates experienced a decrease in NO2 concentrations and an increase in ozone (Fig. 4d–e). However, the impact of revised aerosol vertical distribution on ozone concentrations was only half that in winter, with an average of 0.5 ppb and a maximum of 1.6 ppb in North China. The default effect of API on regional ozone was −1.4 ppb, which was reduced by 36 % after revising aerosol vertical distribution. Furthermore, ozone statistics in the REGION simulation show little difference from those in the BASE simulation (Table S1). These results indicate that the significance of aerosol vertical distribution on ozone was less pronounced in summer than in winter. The response of ozone to observational constraints based on radiosonde data was similar to that based on lidar data in terms of both the spatial distribution and the regional average. The regional average change in ozone during summer 2019 was 0.7 ppb, with a regional maximum of 2.3 ppb, both smaller than the changes in winter. The similar results constrained by these two sets of different observational data in summer confirm the reliability of this finding.
From the perspective of temporal variation, the increase in ozone and the decrease in NO2 during summer corresponded to the periods of increased photolysis rates shown in Fig. 2. Ozone increased most significantly from 3 to 6 July 2017, when photolysis rates increased most. The regional average daily ozone and the regional maximum daily ozone increased by 0–1.9 and 0.4–7.1 ppb in summer 2017 and 0.1–1.3 and 0.5–6.4 ppb in summer 2019, respectively (Table 1). These results further confirmed that the impact of revised aerosol vertical distribution on ozone in summer is weaker compared to winter.
4.2.3 Role of PBL mixing
As shown in Fig. 2, the modification of aerosol vertical distribution mainly increased the AOD in the lower layers, while AOD was decreased in the upper layers across different seasons. With similar modifications of aerosol vertical distribution, the various responses of surface ozone concentration across different seasons are closely linked to planetary boundary layer (PBL) mixing (Yin et al., 2024). Figures 6 and 7 present the average diurnal variation in the vertical distribution responses for typical modification cases characterized by high planetary boundary layer height (PBLH) and low PBLH. The cases with high PBLH were in summer, while those with low PBLH were in winter (see detailed information in Table S3).
In Fig. 6a, the AOD decreased in the upper PBL and increased in the lower PBL after modification, with the PBLH reaching layer 15 (∼ 2.2 km) at noon. Consequently, the photolysis rates changed following the changes in AOD, as shown in Fig. 6c and d. The changes in photolysis rates resulted in an increase in ozone in the lower PBL, a decrease in ozone production in the upper PBL, and a larger vertical gradient of ozone concentration. Then, the strong PBL mixing led to the high ozone concentrations at the surface being entrained into the upper PBL, partially offsetting the increase in surface ozone and, in some cases, even leading to a decrease in surface ozone. This kind of compensatory effect of PBL mixing on surface ozone in response to API was recently mentioned in previous studies (Gao et al., 2020; Shi et al., 2021; Yan et al., 2023). When the PBLH started to decrease at 10:00 UTC, the photolysis rates increased in the PBL, and the response of surface ozone recovered. In Fig. 7, the reduction of AOD was primarily above the PBL, and the photolysis was promoted throughout the entire PBL, with the maximum PBLH reaching layer 6 (∼ 0.73 km) at noon. As such, ozone increased in all layers in the PBL. After sunset (18:00 UTC), the PBLH suddenly dropped to the lowest layer, and the increased ozone in the residual layer reacted with the surplus NO in the atmosphere, increasing nighttime NO2. Overall, the impact of revised aerosol vertical distribution on surface ozone was larger under conditions with low PBLH. Due to stronger solar radiation and warming, the PBL usually develops higher in summer than in winter. Hence, the weaker impact of revised aerosol vertical distribution on surface ozone in summer could be attributed to the compensatory effect of PBL mixing.
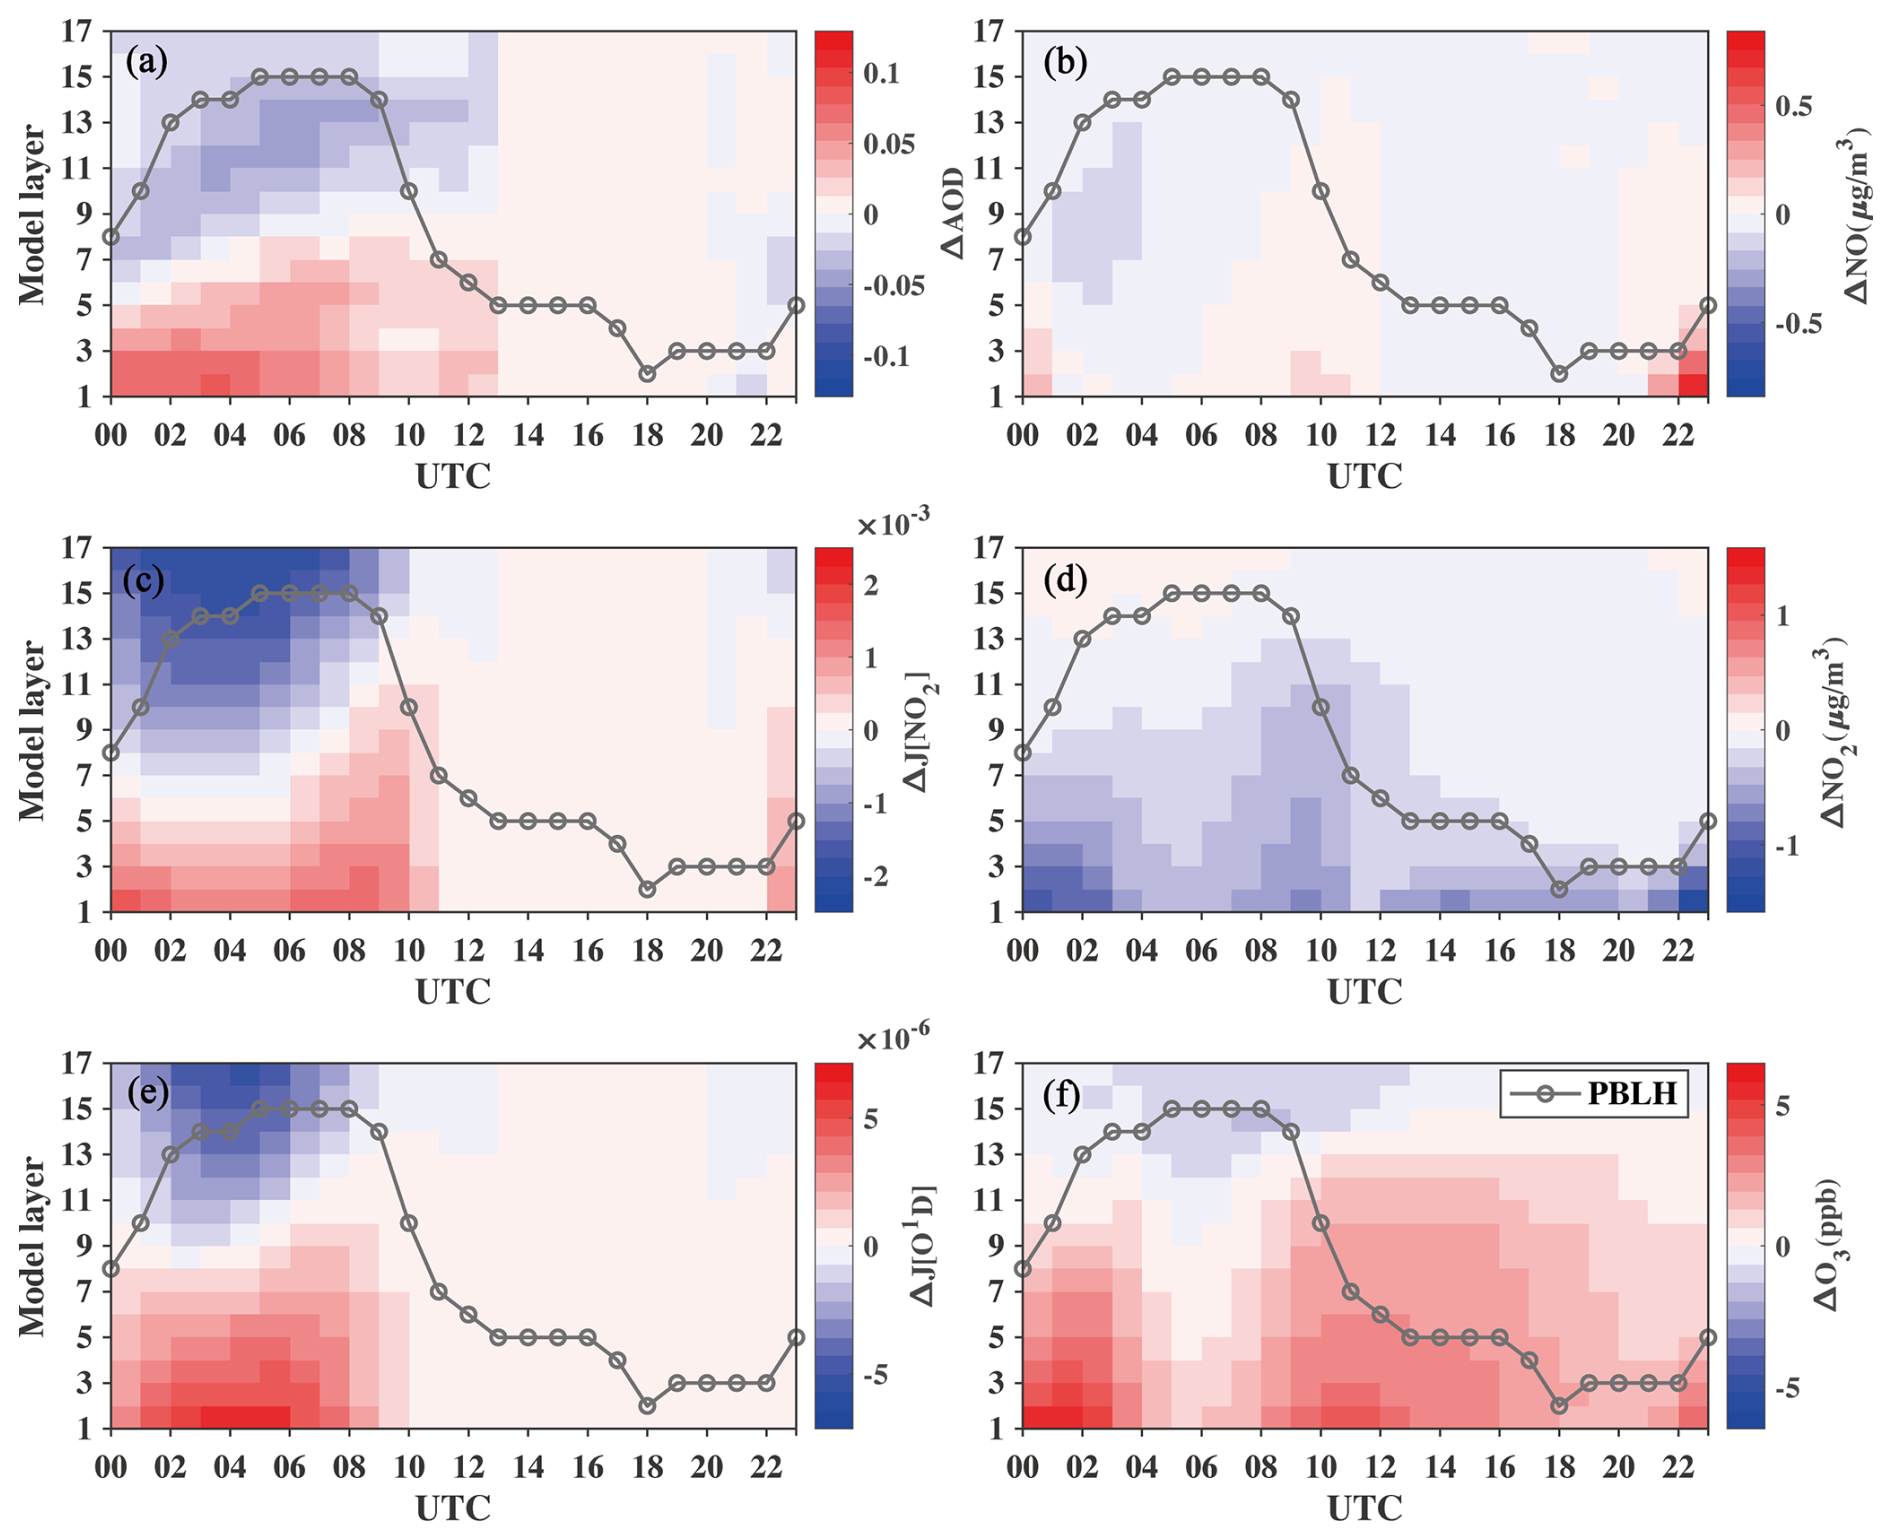
Figure 6Diurnal variation in the vertical distribution responses of (a) AOD, (c) J[NO2], (e) J[O1D], (b) nitric oxide (NO), (d) nitrogen dioxide (NO2), and (f) ozone at the observation stations under conditions with high planetary boundary layer height (PBLH).
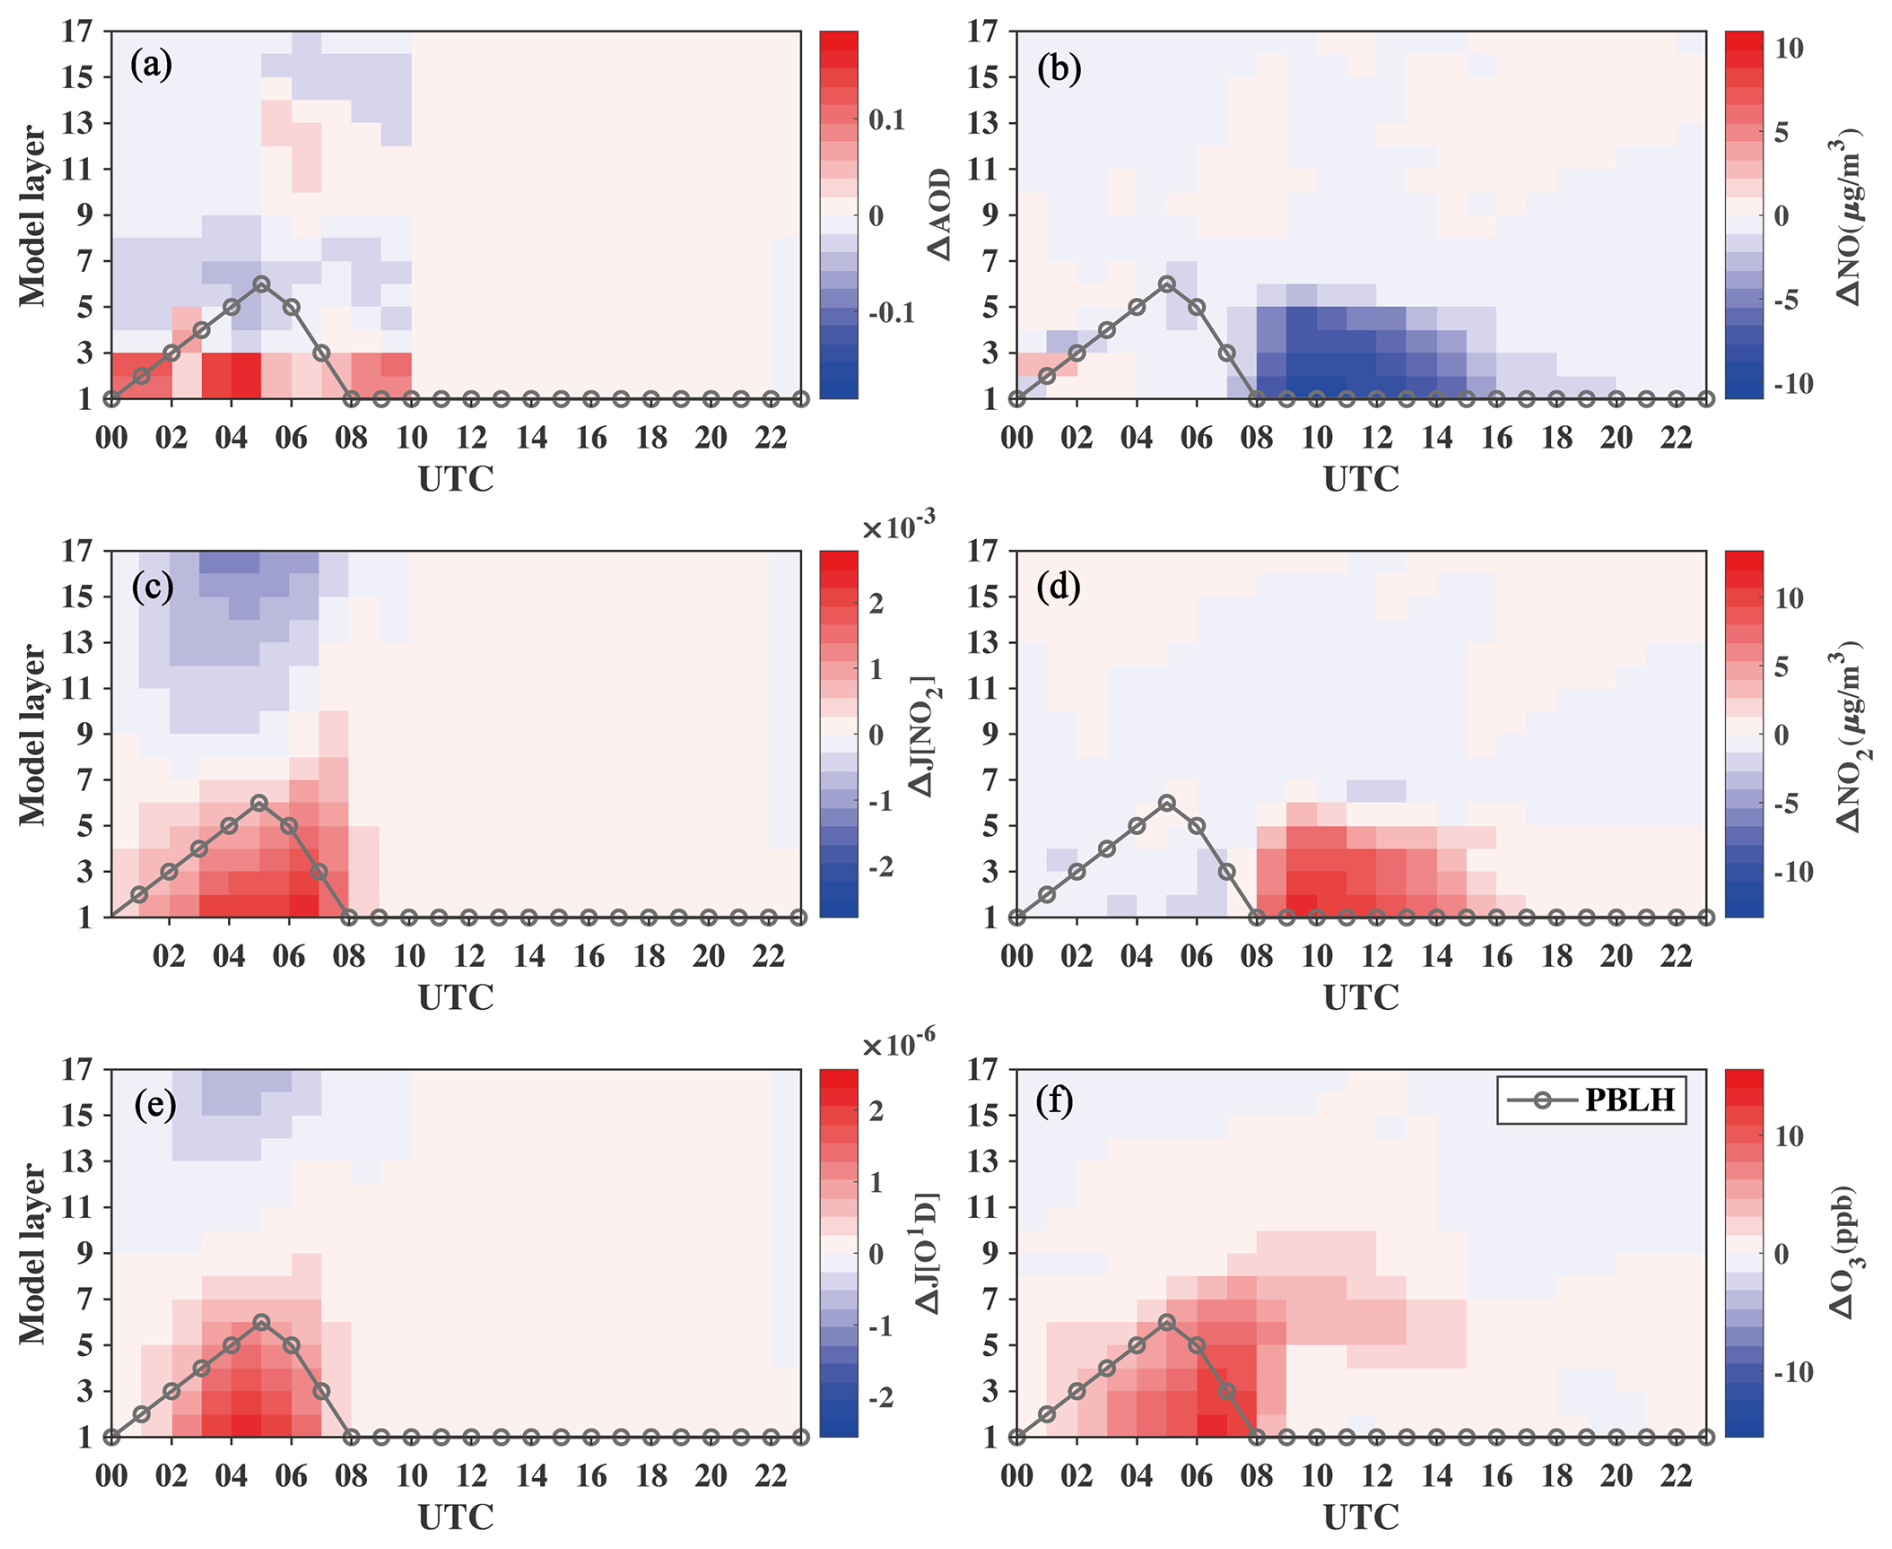
Figure 7Same as Fig. 6 but under conditions with lower planetary boundary layer heights (PBLHs).
4.3 Impact of revised aerosol vertical distribution on PM2.5
Modifying the vertical distribution of aerosols in the model resulted in significant changes in photolysis rates, which subsequently affected the atmospheric oxidizing capacity and, in turn, the chemical rate of secondary aerosol formation. In this section, we will discuss the impact of revised aerosol vertical distribution on atmospheric oxidizing capacity and PM2.5 formation.
4.3.1 Wintertime
Figures 8 and S8 display the spatial distribution of changes in surface PM2.5 concentration and the relative changes, respectively. In winter, the increase in PM2.5 concentration was primarily concentrated in the modified region, with high-value areas corresponding to the regions of NO2 increase (Fig. 8a). PM2.5 concentration was increased by an average of 0.8 µg m−3 (0.2 %), with a maximum increase of 3.1 µg m−3 (1.2 %) in the modified region (Table 1). The underestimation of PM2.5 in winter was slightly improved with observational constraints on vertical distribution (Table S1). The acceleration of photolysis in the surface layer caused by modifications of aerosol vertical distribution enhanced the atmospheric oxidizing capacity and promoted secondary aerosol formation.
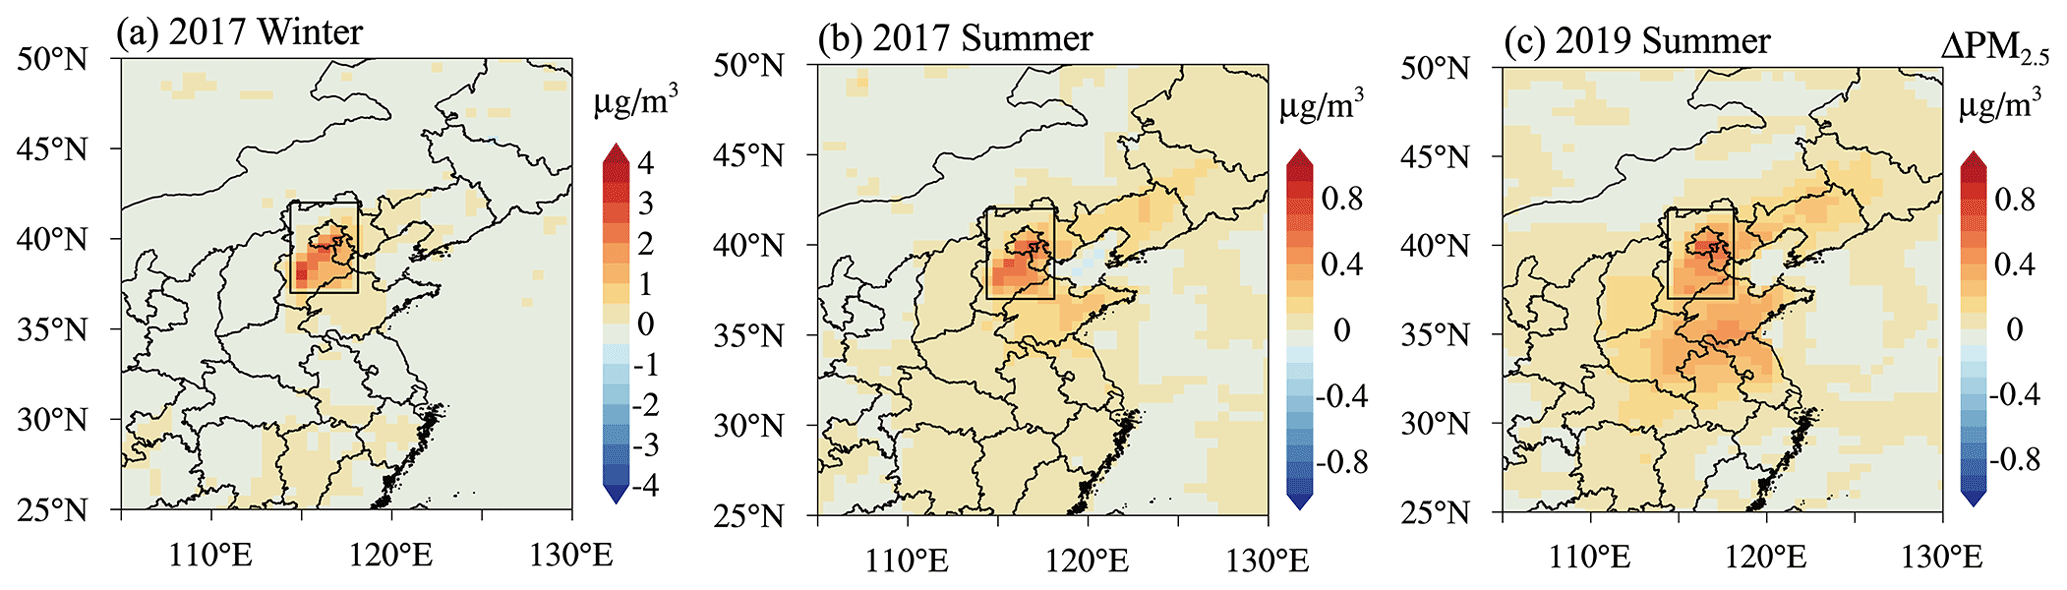
Figure 8Simulated responses of PM2.5 concentration to observational constraints on aerosol vertical distribution over North China. From left to right: winter 2017 (a), summer 2017 (b), and summer 2019 (c), respectively. The black rectangle shows the region where vertical distribution modification was performed.
Figure 9 presents the changes in daily average PM2.5 concentration and the relative changes along the longitude profile of the observation station. The increase in PM2.5 in North China coincided with periods of enhanced photolysis and increased ozone in winter. As illustrated in Table 1, the regional average daily PM2.5 changed by −0.1 to 2.9 µg m−3 (−0.6 % to 1.5 %), and the regional maximum daily PM2.5 changed by 0.1–21.5 µg m−3 (0.4 % to 5.3 %). The regional average API impact on PM2.5 was −0.1 % to −4.4 % in North China, which was reduced by approximately 30 %. Although the impact of revised aerosol vertical distribution on seasonal average PM2.5 was relatively small, its contribution during pollution events was notable. For example, on 25 January, the daily average PM2.5 increased by 16.5, 8.0, 18.8, and 10.3 µg m−3 at Beijing, Tianjin, Baoding, and Langfang stations, respectively.
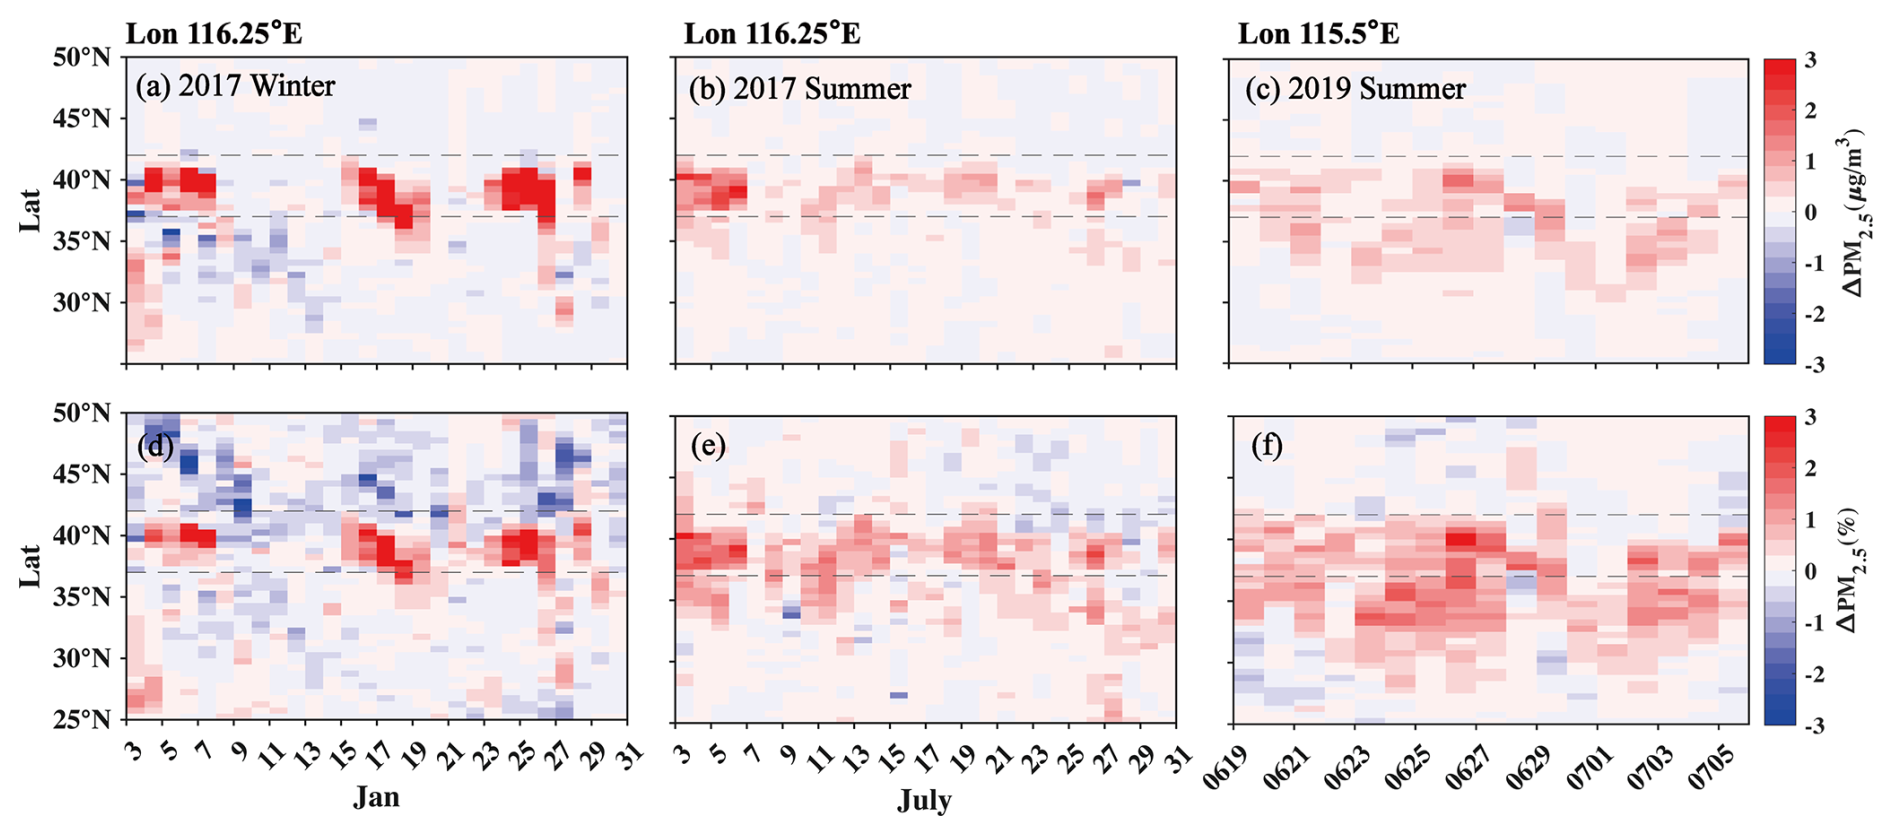
Figure 9Simulated responses of daily average (daytime) PM2.5 to observational constraints on aerosol vertical distribution along the longitude profiles of observation stations. (a–c) Mass concentration (µg m−3) and (d–f) proportion (%). From left to right: for winter 2017 (a, d), summer 2017 (b, e), and summer 2019 (c, f), respectively. The dotted lines indicate the latitude range of the modified region, and the longitudes of the stations are marked at the top.
4.3.2 Summertime
In summer, the impact of aerosol vertical distribution on PM2.5 concentration was a quarter of that in winter, with an average of 0.2 µg m−3 and a maximum of 0.7 µg m−3 in the modified region. However, the relative change in PM2.5 was higher than in winter, with an average of 0.3 %. The results from observational constraints based on radiosonde data also show an average of 0.2 µg m−3 (0.5 %) increase in PM2.5 in summer 2019. Zhao et al. (2023) reported that the emission reduction in the summer of 2019 can cause an increase in PM2.5 by 0.54 µg m−3 in the Beijing–Tianjin–Hebei region through API. This suggests that changes in aerosol vertical distribution are comparable to emission reduction when evaluating the effects of API on PM2.5 in summer. Different from the wintertime, the differences in daily average changes of PM2.5 between each day were relatively small (Fig. 9e–f). In summer 2017, the regional average changes in daily PM2.5 and the regional maximum changes were 0–0.7 µg m−3 (0 %–1.0 %) and 0.2–2.9 µg m−3 (0.5 %–2.8 %). The increase in PM2.5 over North China in summer 2019 closely mirrored the values in 2017.
4.3.3 Role of atmospheric oxidizing capacity
To explore the impact of revised aerosol vertical distribution on PM2.5, we further analysed the major components contributing to the PM2.5 increase. Secondary aerosols can account for nearly all of the PM2.5 increase, and their formation is strongly influenced by the atmospheric oxidizing capacity. We compared the relative changes of hydroxyl radicals (OH) in Fig. S9. It is found that OH increased by 13.5 % in winter and 14.2 % in summer over North China, indicating no significant seasonal differences. As we have mentioned in Sect. 4.1, J[O1D] increased 73.8 % in winter and 41.8 % in summer, which promoted the OH production. In winter, OH formation from the photolysis of HONO is also important (Tan et al., 2018). The revised aerosol vertical distribution accelerated this process, resulting in a regional average reduction of 4.4 % in HONO concentration. Therefore, the atmospheric oxidizing capacity was enhanced by the increase in these OH source reactions. Herein, we added the emission of HONO from transportation by applying a emission ratio (Zhang et al., 2019a), and the heterogeneous reaction of NO2 (Shah et al., 2020) was also included in the GEOS-Chem model, but the other HONO sources like soil emissions (Tan et al., 2023), livestock farming (Zhang et al., 2023), and particulate nitrate photolysis (Andersen et al., 2023) were not included. It should be noted that the enhancement of atmospheric oxidizing capacity may be weakened due to the underestimation of HONO concentrations in the model. Moreover, the acceleration of J[O1D] and the photolysis of HONO were more significant in winter than in summer, with a similar increase in OH concentration, suggesting that the oxidation of NO2 by OH was promoted more in winter.
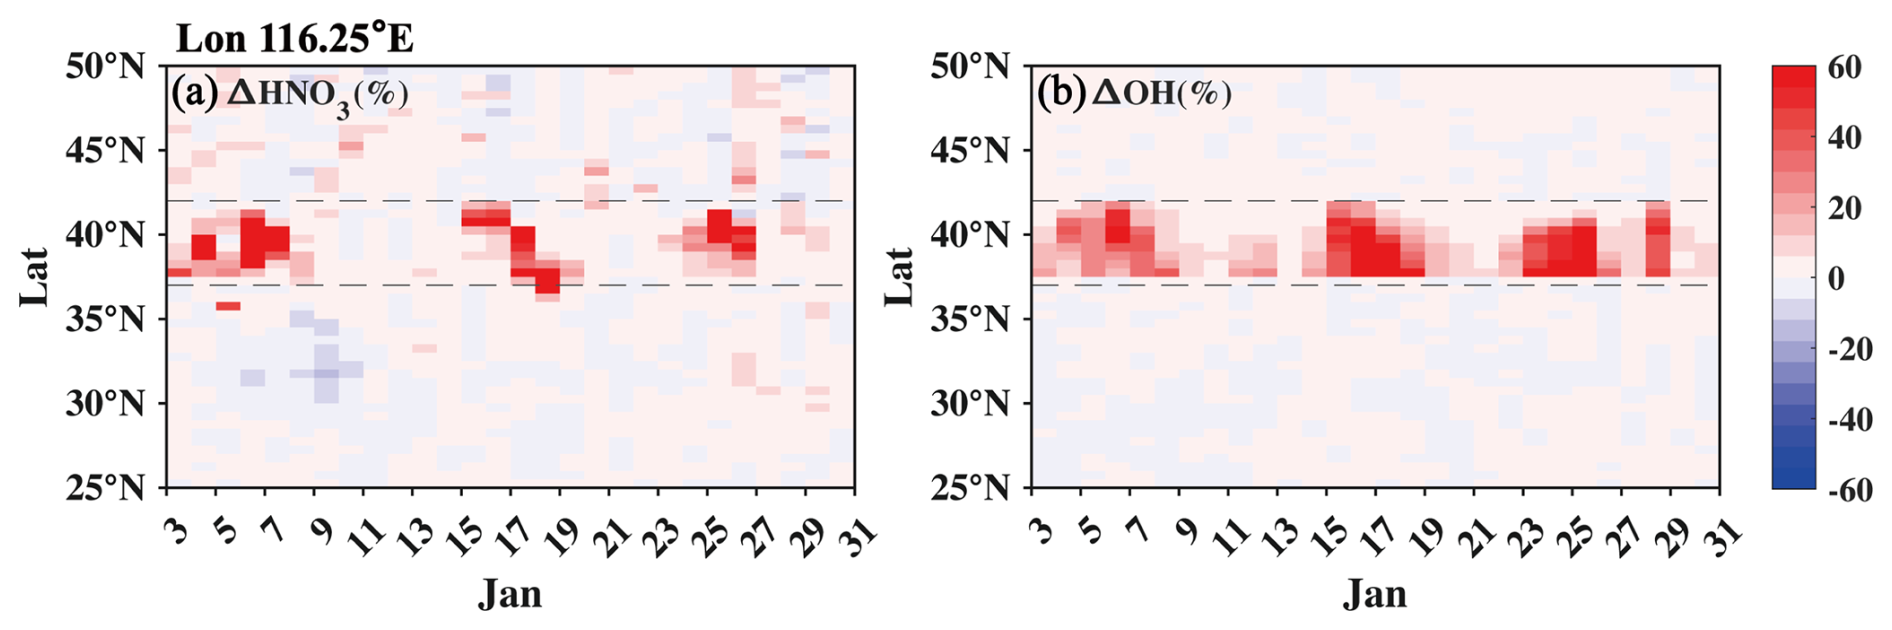
Figure 10Simulated responses of daily average (a) HNO3 and (b) OH to observational constraints on aerosol vertical distribution along the longitude profiles of the lidar station in winter. The dotted lines indicate the latitude range of the modified region, and the longitude of the station is marked at the top.
Among secondary aerosols, nitrate was the major contributor to the increase in PM2.5 in both winter and summer, accounting for approximately 75 %. Next are ammonium and sulfate, contributing approximately 20 % and 8 %, respectively, while secondary organic aerosols (SOAs) can be ignored. The formation of nitrate during the daytime is primarily contributed by the aerosol uptake of nitric acid (HNO3) (Lu et al., 2019), which is mainly from the oxidation of NO2 with OH. The enhancement of photolysis led to an increase in OH during both summer and winter; however, with abundant NOx in the atmosphere during winter, more NOx reacted with OH to form HNO3. Figures 10 and S10 show the changes in HNO3 and OH in winter and summer, respectively. Corresponding to the periods with OH increase, HNO3 concentration increased significantly in winter, reaching up to 60 %. The areas with remarkable relative changes in HNO3 concentration aligned with the increase in NO2 in Fig. 5a and the strong response of PM2.5 in Fig. 9a. In summer, the intensity of atmospheric oxidizing capacity was stronger than in winter (Liu et al., 2021b), and the NOx concentration was lower; as a result, HNO3 increased less than 10 %, even though the increase in OH was similar to winter. In general, the enhancement of atmospheric oxidizing capacity, combined with high NOx emissions, contributed to the strong response of PM2.5 to observational constraints on aerosol vertical distribution during winter pollution events.
In this study, we quantified the response of atmospheric photochemistry to observational constraints on aerosol vertical distribution in different seasons using continuous observations from ground-based lidar and radiosonde. Sensitivity experiments were conducted by modifying the aerosol vertical distribution over North China in the photochemical module of the GEOS-Chem model; the simulations in winter 2017 and summer 2017 were based on lidar data, and the simulations in summer 2019 were based on radiosonde data.
Compared to the observations, the GEOS-Chem model underestimated the AOD by 20.8 %–30.1 % below layer 2 (∼ 0.19 km) in winter and by 3.4 %–43.9 % below layer 6 (∼ 0.73 km) in summer, while overestimating AOD above these layers. After observational constraints, the AOD increased in the lower layers and decreased in the upper layers. The changes of photolysis rates of NO2 and ozone (J[NO2] and J[O1D]) were consistent with the vertical changes in AOD in both seasons. The regional average ΔJ[NO2] and ΔJ[O1D] were 63.4 % and 73.8 % in winter and 33.4 % and 41.8 % in summer. In terms of time series, the photolysis rates primarily increased during pollution events in winter, reaching a maximum increase of over 100 %. In contrast, the daily average photolysis rate changes in summer were more steady, with lower peaks than in winter.
Surface ozone increased due to the enhancement of photolysis rates in the modified region, with an average of 0.9 and 0.5 ppb in winter and summer, respectively, which is about half of the default impact of API on ozone. During pollution episodes, the regional average daily ozone increased by 0.1–3.4 ppb in winter and 0–1.9 ppb in summer following the enhancement of photolysis; the regional maximum daily changes of ozone reached 10.5 and 7.1 ppb in winter and summer, respectively. The compensatory effect of PBL mixing under conditions with high PBLH could weaken the impact of revised aerosol vertical distribution on surface ozone. The results from observational constraints based on radiosonde data in summer 2019 were consistent with those in summer 2017, consolidating the reliability of our work. Additionally, the model underestimation of ozone in North China was also greatly reduced during winter after the modification of aerosol vertical distribution.
Due to the promotion of secondary aerosol formation under more active photochemistry, regional PM2.5 concentration increased by 0.8 µg m−3 (0.2 %) in winter and 0.2 µg m−3 (0.3 %) in summer. The response of PM2.5 was weaker in summer, with an increase in the daily average by 0–0.7 µg m−3, which was close to the results based on radiosonde constraints. However, in winter, the regional average daily PM2.5 changed by −0.1 to 2.9 µg m−3, with a maximum of 8.0 to 18.8 µg m−3 at some city stations, indicating the importance of aerosol vertical distribution during the pollution period. The increase in nitrate concentration resulting from enhanced HNO3 formation was the primary reason for the increase in PM2.5 during winter. The increase in atmospheric oxidizing capacity can account for the strong response of PM2.5 during heavy pollution.
Early studies based on box models have emphasized that API can lead to great reductions in photolysis rates and ozone concentrations (Hollaway et al., 2019; Wang et al., 2020b). They found a greater reduction in the net photochemical production of vertical ozone than surface ozone. Recent three-dimensional chemical transport model studies have highlighted the importance of the overlooked process in box model studies – boundary layer mixing, which can account for this inconsistency (Gao et al., 2020; Yan et al., 2023). Our study, based on observational constraints of aerosol vertical distribution, resolves an underappreciated issue and provides a deeper understanding of the impact of API. When considering observational constraints, the impact of API on surface ozone decreased significantly by 36 %–56 %, suggesting that the impact of API in previous studies would be overstated. Despite the weakening of API, revising aerosol vertical distribution can inspire more accurate predictions of ozone levels and the atmospheric oxidizing capacity in winter, particularly in regions with complex aerosol vertical distributions. The comparison of cases with different boundary layer heights also offered valuable insights into the discrepancies in changes in photolysis rate and surface ozone.
In future studies, more efforts are needed to improve the model performance in aerosol vertical distribution. Although the vertical distribution was constrained, discrepancies still exist between the simulated AOD and the observations. More accurate aerosol optical properties, such as single-scattering albedo (SSA), which can help distinguish between the scattering and absorption of light, are strongly needed in the model simulation. Moreover, the model validation with observed photolysis rates should be involved, as the photolysis rate is one of the most direct variables for verifying the simulation of photochemical reactions. In summary, our results confirmed the importance of reasonable representativeness of aerosol vertical distribution in API effects and provided valuable implications for future studies.
All data in this article are available on request from the first author (chenxi@nuist.edu.cn).
The supplement related to this article is available online at https://doi.org/10.5194/acp-25-9151-2025-supplement.
KL and XC designed the research. XC conducted the analysis with the help from TY, XJ, and LC. SZ was in charge of data curation. XC wrote the draft manuscript. KL, YY, BH, BZ, ZW, and HL reviewed and edited the manuscript.
The contact author has declared that none of the authors has any competing interests.
Publisher's note: Copernicus Publications remains neutral with regard to jurisdictional claims made in the text, published maps, institutional affiliations, or any other geographical representation in this paper. While Copernicus Publications makes every effort to include appropriate place names, the final responsibility lies with the authors.
The author Xi Chen is thankful for the support from the Postdoctoral Fellowship Program of CPSF under grant number GZC20240733 and the Jiangsu Funding Program for Excellent Postdoctoral Talent. We would like to greatly thank Xuhui Cai, Yu Song, and Hongsheng Zhang from Peking University for their efforts in collecting the radiosonde data. We also thank the anonymous reviewers for their constructive suggestions that helped improve the paper.
This research was supported by the National Natural Science Foundation of China (grants 42293323 and 42205114) and the Natural Science Foundation of Jiangsu Province (BK20240035).
This paper was edited by Arthur Chan and reviewed by two anonymous referees.
Akimoto, H., Nagashima, T., Li, J., Fu, J. S., Ji, D., Tan, J., and Wang, Z.: Comparison of surface ozone simulation among selected regional models in MICS-Asia III – effects of chemistry and vertical transport for the causes of difference, Atmos. Chem. Phys., 19, 603–615, https://doi.org/10.5194/acp-19-603-2019, 2019.
An, J., Lv, H., Xue, M., Zhang, Z., Hu, B., Wang, J., and Zhu, B.: Analysis of the Effect of Optical Properties of Black Carbon on Ozone in an Urban Environment at the Yangtze River Delta, China, Adv. Atmos. Sci., 38, 1153–1164, https://doi.org/10.1007/s00376-021-0367-9, 2021.
Andersen, S. T., Carpenter, L. J., Reed, C., Lee, J. D., Chance, R., Sherwen, T., Vaughan, A. R., Stewart, J., Edwards, P. M., Bloss, W. J., Sommariva, R., Crilley, L. R., Nott, G. J., Neves, L., Read, K., Heard, D. E., Seakins, P. W., Whalley, L. K., Boustead, G. A., Fleming, L. T., Stone, D., and Fomba, K. W.: Extensive field evidence for the release of HONO from the photolysis of nitrate aerosols, Sci. Adv., 9, eadd6266, https://doi.org/10.1126/sciadv.add6266, 2023.
Bai, D., Wang, H., Cheng, M., Gao, W., Yang, Y., Huang, W., Ma, K., Zhang, Y., Zhang, R., Zou, J., Wang, J., Liang, Y., Li, N., and Wang, Y.: Source apportionment of PM2.5 and its optical properties during a regional haze episode over north China plain, Atmos. Pollut. Res., 12, 89–99, https://doi.org/10.1016/j.apr.2020.08.023, 2020.
Baylon, P., Jaffe, D. A., Hall, S. R., Ullmann, K., Alvarado, M. J., and Lefer, B. L.: Impact of Biomass Burning Plumes on Photolysis Rates and Ozone Formation at the Mount Bachelor Observatory, J. Geophys. Res.-Atmos., 123, 2272–2284, https://doi.org/10.1002/2017jd027341, 2018.
Cao, J., Wang, Q., Chow, J. C., Watson, J. G., Tie, X., Shen, Z., Wang, P., and An, Z.: Impacts of aerosol compositions on visibility impairment in Xi'an, China, Atmos. Environ., 59, 559–566, https://doi.org/10.1016/j.atmosenv.2012.05.036, 2012.
Chen, D., Liao, H., Yang, Y., Chen, L., Zhao, D., and Ding, D.: Simulated impacts of vertical distributions of black carbon aerosol on meteorology and PM2.5 concentrations in Beijing during severe haze events, Atmos. Chem. Phys., 22, 1825–1844, https://doi.org/10.5194/acp-22-1825-2022, 2022.
Chen, X., Li, K., Yang, T., Yang, Z., Wang, X., Zhu, B., Chen, L., Yang, Y., Wang, Z., and Liao, H.: Trends and drivers of aerosol vertical distribution over China from 2013 to 2020: Insights from integrated observations and modeling, Sci. Total Environ., 917, 170485, https://doi.org/10.1016/j.scitotenv.2024.170485, 2024.
Chutia, L., Wang, J., Zhang, H., Chen, X., Castro Garcia, L., and Janechek, N.: Elucidating the impacts of aerosol radiative effects for mitigating surface O3 and PM2.5 in Delhi, India during crop residue burning period, Atmos. Environ., 339, 120890, https://doi.org/10.1016/j.atmosenv.2024.120890, 2024.
Dickerson, R. R., Kondragunta, S., Stenchikov, G., Civerolo, K. L., Doddridge, B. G., and Holben, B. N.: The Impact of Aerosols on Solar Ultraviolet Radiation and Photochemical Smog, Science, 278, 827–830, https://doi.org/10.1126/science.278.5339.827, 1997.
Eastham, S. D., Weisenstein, D. K., and Barrett, S. R. H.: Development and evaluation of the unified tropospheric–stratospheric chemistry extension (UCX) for the global chemistry-transport model GEOS-Chem, Atmos. Environ., 89, 52–63, https://doi.org/10.1016/j.atmosenv.2014.02.001, 2014.
Gao, J., Li, Y., Zhu, B., Hu, B., Wang, L., and Bao, F.: What have we missed when studying the impact of aerosols on surface ozone via changing photolysis rates?, Atmos. Chem. Phys., 20, 10831–10844, https://doi.org/10.5194/acp-20-10831-2020, 2020.
Hollaway, M., Wild, O., Yang, T., Sun, Y., Xu, W., Xie, C., Whalley, L., Slater, E., Heard, D., and Liu, D.: Photochemical impacts of haze pollution in an urban environment, Atmos. Chem. Phys., 19, 9699–9714, https://doi.org/10.5194/acp-19-9699-2019, 2019.
Hu, K., Zhao, D., Liu, D., Ding, S., Tian, P., Yu, C., Zhou, W., Huang, M., and Ding, D.: Estimating radiative impacts of black carbon associated with mixing state in the lower atmosphere over the northern North China Plain, Chemosphere, 252, 126455, https://doi.org/10.1016/j.chemosphere.2020.126455, 2020.
Huszar, P., Karlický, J., Ďoubalová, J., Šindelářová, K., Nováková, T., Belda, M., Halenka, T., Žák, M., and Pišoft, P.: Urban canopy meteorological forcing and its impact on ozone and PM2.5: role of vertical turbulent transport, Atmos. Chem. Phys., 20, 1977–2016, https://doi.org/10.5194/acp-20-1977-2020, 2020
Ivatt, P. D., Evans, M. J., and Lewis, A. C.: Suppression of surface ozone by an aerosol-inhibited photochemical ozone regime, Nat. Geosci., 15, 536–540, https://doi.org/10.1038/s41561-022-00972-9, 2022.
Jacobson, M. Z.: Studying the effects of aerosols on vertical photolysis rate coefficient and temperature profiles over an urban airshed, J. Geophys. Res.-Atmos., 103, 10593–10604, https://doi.org/10.1029/98jd00287, 1998.
Jiang, X., Wiedinmyer, C., and Carlton, A. G.: Aerosols from Fires: An Examination of the Effects on Ozone Photochemistry in the Western United States, Environ. Sci. Technol., 46, 11878–11886, https://doi.org/10.1021/es301541k, 2012.
Kim, P. S., Jacob, D. J., Fisher, J. A., Travis, K., Yu, K., Zhu, L., Yantosca, R. M., Sulprizio, M. P., Jimenez, J. L., Campuzano-Jost, P., Froyd, K. D., Liao, J., Hair, J. W., Fenn, M. A., Butler, C. F., Wagner, N. L., Gordon, T. D., Welti, A., Wennberg, P. O., Crounse, J. D., St. Clair, J. M., Teng, A. P., Millet, D. B., Schwarz, J. P., Markovic, M. Z., and Perring, A. E.: Sources, seasonality, and trends of southeast US aerosol: an integrated analysis of surface, aircraft, and satellite observations with the GEOS-Chem chemical transport model, Atmos. Chem. Phys., 15, 10411–10433, https://doi.org/10.5194/acp-15-10411-2015, 2015a.
Kim, Y., Sartelet, K., Raut, J.-C., and Chazette, P.: Influence of an urban canopy model and PBL schemes on vertical mixing for air quality modeling over Greater Paris, Atmos. Environ., 107, 289–306, https://doi.org/10.1016/j.atmosenv.2015.02.011, 2015b.
Kushta, J., Kallos, G., Astitha, M., Solomos, S., Spyrou, C., Mitsakou, C., and Lelieveld, J.: Impact of natural aerosols on atmospheric radiation and consequent feedbacks with the meteorological and photochemical state of the atmosphere, J. Geophys. Res.-Atmos., 119, 1463–1491, https://doi.org/10.1002/2013jd020714, 2014.
Li, J. and Li, Y.: Ozone deterioration over North China plain caused by light absorption of black carbon and organic carbon, Atmos. Environ., 313, 120048, https://doi.org/10.1016/j.atmosenv.2023.120048, 2023.
Li, J., Wang, Z., Wang, X., Yamaji, K., Takigawa, M., Kanaya, Y., Pochanart, P., Liu, Y., Irie, H., Hu, B., Tanimoto, H., and Akimoto, H.: Impacts of aerosols on summertime tropospheric photolysis frequencies and photochemistry over Central Eastern China, Atmos. Environ., 45, 1817–1829, https://doi.org/10.1016/j.atmosenv.2011.01.016, 2011.
Li, J., Chen, X., Wang, Z., Du, H., Yang, W., Sun, Y., Hu, B., Li, J., Wang, W., Wang, T., Fu, P., and Huang, H.: Radiative and heterogeneous chemical effects of aerosols on ozone and inorganic aerosols over East Asia, Sci. Total Environ., 622, 1327–1342, https://doi.org/10.1016/j.scitotenv.2017.12.041, 2018a.
Li, J., Nagashima, T., Kong, L., Ge, B., Yamaji, K., Fu, J. S., Wang, X., Fan, Q., Itahashi, S., Lee, H.-J., Kim, C.-H., Lin, C.-Y., Zhang, M., Tao, Z., Kajino, M., Liao, H., Li, M., Woo, J.-H., Kurokawa, J., Wang, Z., Wu, Q., Akimoto, H., Carmichael, G. R., and Wang, Z.: Model evaluation and intercomparison of surface-level ozone and relevant species in East Asia in the context of MICS-Asia Phase III – Part 1: Overview, Atmos. Chem. Phys., 19, 12993–13015, https://doi.org/10.5194/acp-19-12993-2019, 2019a.
Li, K., Jacob, D. J., Liao, H., Qiu, Y., Shen, L., Zhai, S., Bates, K. H., Sulprizio, M. P., Song, S., Lu, X., Zhang, Q., Zheng, B., Zhang, Y., Zhang, J., Lee, H. C., and Kuk, S. K.: Ozone pollution in the North China Plain spreading into the late-winter haze season, P. Natl. Acad. Sci., 118, e2015797118, https://doi.org/10.1073/pnas.2015797118, 2021a.
Li, K., Jacob, D. J., Liao, H., Zhu, J., Shah, V., Shen, L., Bates, K. H., Zhang, Q., and Zhai, S.: A two-pollutant strategy for improving ozone and particulate air quality in China, Nat. Geosci., 12, 906–910, https://doi.org/10.1038/s41561-019-0464-x, 2019b.
Li, K., Jacob, D. J., Shen, L., Lu, X., De Smedt, I., and Liao, H.: Increases in surface ozone pollution in China from 2013 to 2019: anthropogenic and meteorological influences, Atmos. Chem. Phys., 20, 11423–11433, https://doi.org/10.5194/acp-20-11423-2020, 2020.
Li, M., Wang, T., Han, Y., Xie, M., Li, S., Zhuang, B., and Chen, P.: Modeling of a severe dust event and its impacts on ozone photochemistry over the downstream Nanjing megacity of eastern China, Atmos. Environ., 160, 107–123, https://doi.org/10.1016/j.atmosenv.2017.04.010, 2017.
Li, M., Wang, T., Xie, M., Li, S., Zhuang, B., Chen, P., Huang, X., and Han, Y.: Agricultural Fire Impacts on Ozone Photochemistry Over the Yangtze River Delta Region, East China, J. Geophys. Res.-Atmos., 123, 6605–6623, https://doi.org/10.1029/2018jd028582, 2018b.
Li, M., Wang, T., Shu, L., Qu, Y., Xie, M., Liu, J., Wu, H., and Kalsoom, U.: Rising surface ozone in China from 2013 to 2017: A response to the recent atmospheric warming or pollutant controls?, Atmos. Environ., 246, https://doi.org/10.1016/j.atmosenv.2020.118130, 2021b.
Li, Q., Zhang, H., Zhang, X., Cai, X., Jin, X., Zhang, L., Song, Y., Kang, L., Hu, F., and Zhu, T.: COATS: Comprehensive observation on the atmospheric boundary layer three-dimensional structure during haze pollution in the North China Plain, Sci. China Earth Sci., 66, 939–958, https://doi.org/10.1007/s11430-022-1092-y, 2023.
Li, Q. H., Zhang, H. S., Jin, X. P., Cai, X. H., and Song, Y.: Mechanism of haze pollution in summer and its difference with winter in the North China Plain, Sci. Total Environ., 806, 150625, https://doi.org/10.1016/j.scitotenv.2021.150625, 2022.
Li, Y., Wang, T., Wang, Q. G., Li, M., Qu, Y., Wu, H., Fan, J., Shao, M., and Xie, M.: Deciphering the seasonal dynamics of multifaceted aerosol-ozone interplay: Implications for air quality management in Eastern China, Sci. Total Environ., 946, 174327, https://doi.org/10.1016/j.scitotenv.2024.174327, 2024.
Liao, H., Yung, Y. L., and Seinfeld, J. H.: Effects of aerosols on tropospheric photolysis rates in clear and cloudy atmospheres, J. Geophys. Res.-Atmos., 104, 23697–23707, https://doi.org/10.1029/1999jd900409, 1999.
Liu, C., Huang, J., Hu, X.-M., Hu, C., Wang, Y., Fang, X., Luo, L., Xiao, H.-W., and Xiao, H.-Y.: Evaluation of WRF-Chem simulations on vertical profiles of PM2.5 with UAV observations during a haze pollution event, Atmos. Environ., 252, 118332, https://doi.org/10.1016/j.atmosenv.2021.118332, 2021a.
Liu, Y. and Wang, T.: Worsening urban ozone pollution in China from 2013 to 2017 – Part 2: The effects of emission changes and implications for multi-pollutant control, Atmos. Chem. Phys., 20, 6323–6337, https://doi.org/10.5194/acp-20-6323-2020, 2020.
Liu, Y., Geng, G., Cheng, J., Liu, Y., Xiao, Q., Liu, L., Shi, Q., Tong, D., He, K., and Zhang, Q.: Drivers of Increasing Ozone during the Two Phases of Clean Air Actions in China 2013–2020, Environ. Sci. Technol., 57, 8954–8964, https://doi.org/10.1021/acs.est.3c00054, 2023.
Liu, Z., Wang, Y., Hu, B., Lu, K., Tang, G., Ji, D., Yang, X., Gao, W., Xie, Y., Liu, J., Yao, D., Yang, Y., and Zhang, Y.: Elucidating the quantitative characterization of atmospheric oxidation capacity in Beijing, China, Sci. Total Environ., 771, 145306, https://doi.org/10.1016/j.scitotenv.2021.145306, 2021b.
Lu, K., Fuchs, H., Hofzumahaus, A., Tan, Z., Wang, H., Zhang, L., Schmitt, S. H., Rohrer, F., Bohn, B., Broch, S., Dong, H., Gkatzelis, G. I., Hohaus, T., Holland, F., Li, X., Liu, Y., Liu, Y., Ma, X., Novelli, A., Schlag, P., Shao, M., Wu, Y., Wu, Z., Zeng, L., Hu, M., Kiendler-Scharr, A., Wahner, A., and Zhang, Y.: Fast Photochemistry in Wintertime Haze: Consequences for Pollution Mitigation Strategies, Environ. Sci. Technol., 53, 10676–10684, https://doi.org/10.1021/acs.est.9b02422, 2019.
Lu, W., Zhu, B., Liu, X., Dai, M., Shi, S., Gao, J., and Yan, S.: The influence of regional transport on the three-dimensional distributions of black carbon and its sources over eastern China, Atmos. Environ., 297, 119585, https://doi.org/10.1016/j.atmosenv.2023.119585, 2023.
Lu, X., Hong, J., Zhang, L., Cooper, O. R., Schultz, M. G., Xu, X., Wang, T., Gao, M., Zhao, Y., and Zhang, Y.: Severe Surface Ozone Pollution in China: A Global Perspective, Environ. Sci. Tech. Let., 5, 487–494, https://doi.org/10.1021/acs.estlett.8b00366, 2018.
Ma, X., Huang, J., Zhao, T., Liu, C., Zhao, K., Xing, J., and Xiao, W.: Rapid increase in summer surface ozone over the North China Plain during 2013–2019: a side effect of particulate matter reduction control?, Atmos. Chem. Phys., 21, 1–16, https://doi.org/10.5194/acp-21-1-2021, 2021.
Mok, J., Krotkov, N. A., Arola, A., Torres, O., Jethva, H., Andrade, M., Labow, G., Eck, T. F., Li, Z., Dickerson, R. R., Stenchikov, G. L., Osipov, S., and Ren, X.: Impacts of brown carbon from biomass burning on surface UV and ozone photochemistry in the Amazon Basin, Sci. Rep., 6, 36940, https://doi.org/10.1038/srep36940, 2016.
Pietruczuk, A., Fernandes, A., Szkop, A., and Krzyœcin, J.: Impact of Vertical Profiles of Aerosols on the Photolysis Rates in the Lower Troposphere from the Synergy of Photometer and Ceilometer Measurements in Raciborz, Poland, for the Period 2015–2020, Remote Sens., 14, 1057, https://doi.org/10.3390/rs14051057, 2022.
Pitchford, M., Malm, W., Schichtel, B., Kumar, N., Lowenthal, D., and Hand, J.: Revised algorithm for estimating light extinction from IMPROVE particle speciation data, J. Air Waste Manage., 57, 1326–1336, https://doi.org/10.3155/1047-3289.57.11.1326, 2007.
Qu, Y., Wang, T., Wu, H., Shu, L., Li, M., Chen, P., Zhao, M., Li, S., Xie, M., Zhuang, B., Liu, J., and Han, Y.: Vertical structure and interaction of ozone and fine particulate matter in spring at Nanjing, China: The role of aerosol's radiation feedback, Atmos. Environ., 222, 117162, https://doi.org/10.1016/j.atmosenv.2019.117162, 2020.
Shah, V., Jacob, D. J., Li, K., Silvern, R. F., Zhai, S., Liu, M., Lin, J., and Zhang, Q.: Effect of changing NOx lifetime on the seasonality and long-term trends of satellite-observed tropospheric NO2 columns over China, Atmos. Chem. Phys., 20, 1483–1495, https://doi.org/10.5194/acp-20-1483-2020, 2020.
Shao, M., Wang, W., Yuan, B., Parrish, D. D., Li, X., Lu, K., Wu, L., Wang, X., Mo, Z., Yang, S., Peng, Y., Kuang, Y., Chen, W., Hu, M., Zeng, L., Su, H., Cheng, Y., Zheng, J., and Zhang, Y.: Quantifying the role of PM2.5 dropping in variations of ground-level ozone: Inter-comparison between Beijing and Los Angeles, Sci. Total Environ., 788, 147712, https://doi.org/10.1016/j.scitotenv.2021.147712, 2021.
Shi, S., Zhu, B., Lu, W., Yan, S., Fang, C., Liu, X., Liu, D., and Liu, C.: Estimation of radiative forcing and heating rate based on vertical observation of black carbon in Nanjing, China, Sci. Total Environ., 756, 144135, https://doi.org/10.1016/j.scitotenv.2020.144135, 2021.
Sun, X., Zhao, T., Tang, G., Bai, Y., Kong, S., Zhou, Y., Hu, J., Tan, C., Shu, Z., Xu, J., and Ma, X.: Vertical changes of PM2.5 driven by meteorology in the atmospheric boundary layer during a heavy air pollution event in central China, Sci. Total Environ., 858, 159830, https://doi.org/10.1016/j.scitotenv.2022.159830, 2023.
Tan, W. S., Wang, H. L., Su, J. Y., Sun, R. Z., He, C., Lu, X., Lin, J. T., Xue, C. Y., Wang, H. C., Liu, Y. M., Liu, L., Zhang, L., Wu, D. M., Mu, Y. J., and Fan, S. J.: Soil Emissions of Reactive Nitrogen Accelerate Summertime Surface Ozone Increases in the North China Plain, Environ. Sci. Technol., 57, 12782–12793, https://doi.org/10.1021/acs.est.3c01823, 2023.
Tan, Z., Rohrer, F., Lu, K., Ma, X., Bohn, B., Broch, S., Dong, H., Fuchs, H., Gkatzelis, G. I., Hofzumahaus, A., Holland, F., Li, X., Liu, Y., Liu, Y., Novelli, A., Shao, M., Wang, H., Wu, Y., Zeng, L., Hu, M., Kiendler-Scharr, A., Wahner, A., and Zhang, Y.: Wintertime photochemistry in Beijing: observations of ROx radical concentrations in the North China Plain during the BEST-ONE campaign, Atmos. Chem. Phys., 18, 12391–12411, https://doi.org/10.5194/acp-18-12391-2018, 2018.
Tao, J., Zhang, L., Ho, K., Zhang, R., Lin, Z., Zhang, Z., Lin, M., Cao, J., Liu, S., and Wang, G.: Impact of PM2.5 chemical compositions on aerosol light scattering in Guangzhou – the largest megacity in South China, Atmos. Res., 135, 48–58, https://doi.org/10.1016/j.atmosres.2013.08.015, 2014.
Wang, H., Yang, T., and Wang, Z.: Development of a coupled aerosol lidar data quality assurance and control scheme with Monte Carlo analysis and bilateral filtering, Sci. Total Environ., 728, 138844, https://doi.org/10.1016/j.scitotenv.2020.138844, 2020a.
Wang, W., Parrish, D. D., Wang, S., Bao, F., Ni, R., Li, X., Yang, S., Wang, H., Cheng, Y., and Su, H.: Long-term trend of ozone pollution in China during 2014–2020: distinct seasonal and spatial characteristics and ozone sensitivity, Atmos. Chem. Phys., 22, 8935–8949, https://doi.org/10.5194/acp-22-8935-2022, 2022.
Wang, W., Parrish, D. D., Li, X., Shao, M., Liu, Y., Mo, Z., Lu, S., Hu, M., Fang, X., Wu, Y., Zeng, L., and Zhang, Y.: Exploring the drivers of the increased ozone production in Beijing in summertime during 2005–2016, Atmos. Chem. Phys., 20, 15617–15633, https://doi.org/10.5194/acp-20-15617-2020, 2020b.
Wang, X.: Historical air quality data in China, http://quotsoft.net/air, last access: 31 August 2023.
Wild, O., Zhu, X., and Prather, M. J.: Fast-J: Accurate Simulation of In- and Below-Cloud Photolysis in Tropospheric Chemical Models, J. Atmos. Chem., 37, 245–282, https://doi.org/10.1023/A:1006415919030, 2000.
Wu, J., Bei, N., Hu, B., Liu, S., Wang, Y., Shen, Z., Li, X., Liu, L., Wang, R., Liu, Z., Cao, J., Tie, X., Molina, L. T., and Li, G.: Aerosol–photolysis interaction reduces particulate matter during wintertime haze events, P. Natl. Acad. Sci., 117, 9755–9761, https://doi.org/10.1073/pnas.1916775117, 2020.
Xiao, Q., Geng, G., Xue, T., Liu, S., Cai, C., He, K., and Zhang, Q.: Tracking PM2.5 and O3 Pollution and the Related Health Burden in China 2013–2020, Environ. Sci. Technol., 56, 6922–6932, https://doi.org/10.1021/acs.est.1c04548, 2022.
Xiao, S., Wang, Q. Y., Cao, J. J., Huang, R. J., Chen, W. D., Han, Y. M., Xu, H. M., Liu, S. X., Zhou, Y. Q., Wang, P., Zhang, J. Q., and Zhan, C. L.: Long-term trends in visibility and impacts of aerosol composition on visibility impairment in Baoji, China, Atmos. Res., 149, 88–95, https://doi.org/10.1016/j.atmosres.2014.06.006, 2014.
Xing, J., Wang, J., Mathur, R., Wang, S., Sarwar, G., Pleim, J., Hogrefe, C., Zhang, Y., Jiang, J., Wong, D. C., and Hao, J.: Impacts of aerosol direct effects on tropospheric ozone through changes in atmospheric dynamics and photolysis rates, Atmos. Chem. Phys., 17, 9869–9883, https://doi.org/10.5194/acp-17-9869-2017, 2017.
Yan, S., Zhu, B., Shi, S., Lu, W., Gao, J., Kang, H., and Liu, D.: Impact of aerosol optics on vertical distribution of ozone in autumn over Yangtze River Delta, Atmos. Chem. Phys., 23, 5177–5190, https://doi.org/10.5194/acp-23-5177-2023, 2023.
Yang, H., Chen, L., Liao, H., Zhu, J., Wang, W., and Li, X.: Impacts of aerosol–photolysis interaction and aerosol–radiation feedback on surface-layer ozone in North China during multi-pollutant air pollution episodes, Atmos. Chem. Phys., 22, 4101–4116, https://doi.org/10.5194/acp-22-4101-2022, 2022.
Yin, Z. C., Song, X. L., Zhou, B. T., Jiang, W. H., Chen, H. P., and Wang, H. J.: Traditional Meiyu-Baiu has been suspended by global warming, Natl. Sci. Rev., 11, nwae166, https://doi.org/10.1093/nsr/nwae166, 2024.
Zhai, S., Jacob, D. J., Brewer, J. F., Li, K., Moch, J. M., Kim, J., Lee, S., Lim, H., Lee, H. C., Kuk, S. K., Park, R. J., Jeong, J. I., Wang, X., Liu, P., Luo, G., Yu, F., Meng, J., Martin, R. V., Travis, K. R., Hair, J. W., Anderson, B. E., Dibb, J. E., Jimenez, J. L., Campuzano-Jost, P., Nault, B. A., Woo, J.-H., Kim, Y., Zhang, Q., and Liao, H.: Relating geostationary satellite measurements of aerosol optical depth (AOD) over East Asia to fine particulate matter (PM2.5): insights from the KORUS-AQ aircraft campaign and GEOS-Chem model simulations, Atmos. Chem. Phys., 21, 16775–16791, https://doi.org/10.5194/acp-21-16775-2021, 2021.
Zhang, J. W., An, J. L., Qu, Y., Liu, X. G., and Chen, Y.: Impacts of potential HONO sources on the concentrations of oxidants and secondary organic aerosols in the Beijing-Tianjin-Hebei region of China, Sci. Total Environ., 647, 836–852, https://doi.org/10.1016/j.scitotenv.2018.08.030, 2019a.
Zhang, Q., Zheng, Y., Tong, D., Shao, M., Wang, S., Zhang, Y., Xu, X., Wang, J., He, H., Liu, W., Ding, Y., Lei, Y., Li, J., Wang, Z., Zhang, X., Wang, Y., Cheng, J., Liu, Y., Shi, Q., Yan, L., Geng, G., Hong, C., Li, M., Liu, F., Zheng, B., Cao, J., Ding, A., Gao, J., Fu, Q., Huo, J., Liu, B., Liu, Z., Yang, F., He, K., and Hao, J.: Drivers of improved PM2.5 air quality in China from 2013 to 2017, P. Natl. Acad. Sci. USA, 116, 24463–24469, https://doi.org/10.1073/pnas.1907956116, 2019b.
Zhang, Q., Liu, P. F., Wang, Y., George, C., Chen, T. S., Ma, S. Y., Ren, Y. A., Mu, Y. J., Song, M., Herrmann, H., Mellouki, A., Chen, J. M., Yue, Y., Zhao, X. X., Wang, S. G., and Zeng, Y.: Unveiling the underestimated direct emissions of nitrous acid (HONO), P. Natl. Acad. Sci., 120, e2302048120, https://doi.org/10.1073/pnas.2302048120, 2023.
Zhao, S., Hu, B., Du, C., Liu, H., Li, M., Liu, J., Wang, Q., Xia, X., and Wang, Y.: Photolysis rate in the Beijing-Tianjin-Hebei region: Reconstruction and long-term trend, Atmos. Res., 256, 105568, https://doi.org/10.1016/j.atmosres.2021.105568, 2021.
Zhao, X., Zhang, Z., Xu, J., Gao, J., Cheng, S., Zhao, X., Xia, X., and Hu, B.: Impacts of aerosol direct effects on PM2.5 and O3 respond to the reductions of different primary emissions in Beijing-Tianjin-Hebei and surrounding area, Atmos. Environ., 309, 119948, https://doi.org/10.1016/j.atmosenv.2023.119948, 2023.
- Abstract
- Introduction
- Observations and model
- Revisiting model aerosol vertical distribution based on observational constraints
- Impact of revised aerosol vertical distribution
- Conclusions
- Data availability
- Author contributions
- Competing interests
- Disclaimer
- Acknowledgements
- Financial support
- Review statement
- References
- Supplement