the Creative Commons Attribution 4.0 License.
the Creative Commons Attribution 4.0 License.
 | 19 Aug 2025
Significant secondary formation of nitrogenous organic aerosols in an urban atmosphere revealed by bihourly measurements of bulk organic nitrogen and comprehensive molecular markers
Min Zhou
Shuhui Zhu
Liping Qiao
Jinjian Li
Yingge Ma
Zijing Zhang
Kezheng Liao
Hongli Wang
Nitrogenous organic aerosol (OA) has a significant effect on solar radiation, human health, and ecosystems. However, our knowledge of the total budget of aerosol organic nitrogen (ON) and its major sources, particularly the secondary formation processes, remains largely qualitative. In this study, we conducted bihourly measurements of aerosol ON and a comprehensive array of organic and inorganic source markers in urban Shanghai during the fall–winter period of 2021. ON accounted for 6 %–58 % of the total aerosol N, averaging 20 %. Positive factorization matrix source apportionment revealed that both primary emissions (52 %) and secondary formations (48 %) made substantial contributions to the ON mass. Dominant primary ON sources included coal combustion and vehicle emissions, accounting for 21 % each. Five significant secondary formation processes involving ON formation were identified, namely, nitrate formation (14 %), photochemical formation (10 %), nitroaromatics formation (7 %), dicarboxylic acids (DCA) formation (8 %), and oxygenated cooking OA (7 %). DCA formation-related ON probably represented reduced N-containing organic species such as imidazoles and amides. Nitrate formation processes produced OA with a very low organic carbon-to-ON ratio, suggesting a heterogeneous/aqueous formation of organic nitrates. Our fieldwork provides first quantitative source analysis and new insights into the secondary formation processes of ON aerosols in an urban atmosphere.
- Article
(3860 KB) - Full-text XML
-
Supplement
(1884 KB) - BibTeX
- EndNote


- 1.
Various primary and secondary sources of aerosol organic nitrogen (ON) have been quantitatively resolved using a positive matrix factorization (PMF) model based on bihourly measurement data of bulk ON and comprehensive source markers.
- 2.
Observational evidence of the formation of reduced ON species through ammonia chemistry was found.
- 3.
Joint source analyses of ON and organic carbon (OC) facilitated investigating the potentially significant formation pathways of ON aerosols.
Nitrogen (N)-containing organic compounds are significant constituents of ambient organic aerosols (OAs) (Yu et al., 2024), and their environmental effects have been observed in various aspects. For example, nitroaromatic compounds (Laskin et al., 2015; Xie et al., 2017) and imidazole-like species (Bones et al., 2010; Li et al., 2019) are typical brown carbon molecules that absorb solar radiation, leading to a warming effect. Amines are more efficient than ammonia (NH3) in reacting with sulfuric acid to form new particles (Qiu et al., 2011), even in urban regions with high aerosol loading (Yao et al., 2018). Nitro-polycyclic aromatic hydrocarbons (nitro-PAHs) are known toxicants to the human body (Miller-Schulze et al., 2010; Bandowe and Meusel, 2017). Additionally, the atmospheric deposition of organic nitrogen (ON) species serves as a significant source of N nutrient for marine and remote continental regions (Kielland et al., 2006; Andersen et al., 2017; Li et al., 2023). Therefore, detailed investigations are warranted to understand the budgets and sources of ON aerosols considering their multiple important environmental effects.
Several compound categories of ON have been identified, including urea (Mace et al., 2003; Violaki and Mihalopoulos, 2011), amino acids (Zhang et al., 2002; Ren et al., 2018), amines (Ho et al., 2016; Liu et al., 2018a), N-heterocyclics (Samy and Hays, 2013; Rizwan Khan et al., 2017), nitroaromatics (Chow et al., 2016; Xie et al., 2017), nitro-PAHs (Wei et al., 2012), and organic nitrates (Li et al., 2018; Huang et al., 2021b). While urea stands as a single compound, several to dozens of individual compounds have been quantified in each of the other categories. Despite considerable uncertainty of quantification, aerosol mass spectrometry (AMS) has been widely used to estimate the total amount of organic nitrates (Farmer et al., 2010; Huang et al., 2021b; Xu et al., 2021). Overall, the quantifiable individual ON species or a specific ON category commonly constitute only a minor fraction of the total ON aerosol content (Jickells et al., 2013). The comprehensive quantification of every ON molecule to derive the total ON aerosol budget is impractical due to the lack of knowledge of molecular composition of the ON fraction and standards. Alternatively, bulk ON measurement, though lacking detailed compositional data, enables mass closure and aids in exploring major sources of ON aerosol. Traditional methods of aerosol ON quantification have relied on the difference method, where ON is calculated as the difference between total nitrogen (TN) and inorganic nitrogen (IN) (Cape et al., 2011). Limitations with the traditional analytical approach for aerosol ON determination have led to three deficiencies in the current status of aerosol ON data.
First, the assessment of aerosol total ON, including both water-soluble ON (WSON) and water-insoluble ON (WION), has been quite restricted, with most determinations focusing solely on water-soluble TN (WSTN), omitting WION measurements (Cape et al., 2011). This approach produces WSON through taking the difference between WSTN and IN. Some studies have employed elemental analyzers for TN determination, calculating ON as the difference between TN and IN (Duan et al., 2009; Miyazaki et al., 2011; Pavuluri et al., 2015; Matsumoto et al., 2019). However, the elemental analyzers' detection limit of nitrogen is insufficient for accurate measurements of trace-level aerosol nitrogen (Duan et al., 2009), limiting its widespread use in aerosol nitrogen analysis. Despite significant uncertainty, a few studies suggested that WION, deduced by subtracting WSTN from TN, could be more abundant than WSON in coastal or urban areas (Pavuluri et al., 2015; Matsumoto et al., 2019), highlighting the necessity of quantifying total ON to determine the extent of ON aerosol presence. Second, the quantification of both WSON and WION using the difference method introduces considerable uncertainty, especially when ON is a minor fraction of TN (Yu et al., 2021). This approach has led to the reporting of physically implausible negative WSON concentrations in past studies (Mace et al., 2003; Nakamura et al., 2006; Violaki and Mihalopoulos, 2010; Yu et al., 2017). Third, the absence of high-time resolution or online measurement methods for aerosol ON has hampered the investigation of ON aerosol sources and formation processes in previous research.
We have developed an analyzer system that utilizes programmed thermal evolution of carbonaceous and nitrogenous aerosols and chemiluminescence detection coupled with multivariate curve resolution data treatment (Yu et al., 2021). This system enables simultaneous quantification of aerosol IN and ON with high sensitivity and accuracy. Unlike conventional methods, our new approach avoids the occurrence of negative ON concentrations, which are often encountered in difference methods. Furthermore, the method allows for both offline and online measurements of aerosol ON. During the summer of 2021, we conducted a two-month period of online observations of aerosol IN and ON in urban Shanghai (Yu et al., 2023). Our findings revealed significant diurnal variations in ON concentrations, with vehicle emissions and secondary formation processes identified as major drivers of episodic ON enhancements. However, due to the lack of comprehensive organic source markers, we were unable to fully attribute the contributions of certain potentially important sources and/or formation processes to the ON budget.
In this study, we extended our investigation through online measurements of aerosol ON in urban Shanghai during the fall–winter period of 2021. Concurrently, we conducted comprehensive measurements of aerosol major components and source markers on an hourly/bihourly scale. Specifically, we measured a comprehensive array of organic tracers representing distinct primary emission sources and secondary formation processes. These measurements enabled us to quantitatively apportion total ON to different primary and secondary sources using positive matrix factorization (PMF) receptor modeling. Our focus lies in examining the secondary formation sources of ON, as our knowledge regarding the formation mechanisms of ON aerosols remains limited. By combining the high-time resolution measurements of ON and comprehensive organic markers, we demonstrate the successful quantitative source analysis of ON aerosols in an urban atmosphere, revealing significant contributions of secondary formation pathways to ON.
2.1 Sampling site and period
The field measurement was conducted in Shanghai, a megacity located in the Yangtze River Delta (YRD) region of China and with a population of over 24 million. In recent years, the city has experienced frequent episodes of PM2.5 pollution, with nitrogenous components becoming increasingly prominent contributors to PM2.5 mass (Zhou et al., 2022). All measurements were carried out at a monitoring site (31.17° N, 121.43° E) situated on the rooftop of an eight-story building, approximately 30 m above the ground, at the Shanghai Academy of Environmental Sciences (SAES). This site is surrounded by urban roads, commercial activities, and residential dwellings, making it a representative urban location influenced by a diverse range of emission sources (Wang et al., 2018; Zhou et al., 2022). The observations were conducted during the fall–winter period from 6 November to 31 December 2021.
2.2 Online measurement of aerosol ON
Aerosol ON was measured bihourly using our newly developed analytical system, which enables sensitive and simultaneous measurements of aerosol ON and IN. Detailed descriptions of the new method can be found in our previous work (Yu et al., 2021, 2023). In brief, the analyzer system integrates two commercial instruments: an online aerosol carbon (C) analyzer and a chemiluminescence NOx analyzer. Carbonaceous and nitrogenous aerosols collected on quartz filters were thermally evolved under programmed temperatures and then catalytically oxidized to CO2 and nitrogen oxides (NOy), respectively. The C signal was monitored using the non-dispersive infrared (NDIR) method, while the N signal was recorded through chemiluminescence detection after converting NOy to NO. The C signal assists in differentiating IN and ON components since ON aerosols produce both C and N signals, while the IN fraction only gives an N signal. The programmed thermal evolution facilitates the separation of aerosol IN and ON, as they exhibit distinct thermal characteristics. The quantification of IN and ON is achieved through multivariate curve resolution data treatment of C and N thermal fractions (Yu et al., 2021).
The time resolution for ON measurement was 2 h, with each sampling lasting 1 h, followed by an analysis step taking approximately 50 min. Sampling commenced at even hours (e.g., 02:00, 04:00). In total, 598 pairs of available ON and IN data points were collected. 4-methyl-imidazole served as the calibration standard for C and N measurements, with systematic calibrations conducted twice monthly. Example calibration curves could be found in Yu et al. (2023). The detection limit for aerosol N is 0.013 µg N, corresponding to an air concentration of 0.027 µg N m−3. A comparative analysis of aerosol IN concentrations obtained through the new method and those measured by the Monitor for AeRosols and GAses (MARGA) system is presented in Fig. S1 in the Supplement.
2.3 Other online measurements
The measurement methods for PM2.5 mass and major aerosol components at the site have been described in detail elsewhere (Qiao et al., 2014). PM2.5 concentration was measured using a beta attenuation particulate monitor (Thermo Fisher Scientific, FH 62 C14 series). Organic and elemental carbon (OC and EC) were monitored using a semicontinuous OC/EC analyzer (model RT-4, Sunset Laboratory, Tigard, OR, USA). The major water-soluble ionic species (NO, Cl−, SO, Na+, NH, K+, Mg2+, and Ca2+) in PM2.5 were measured using the MARGA (ADI, 2080; Applikon Analytical B.V.). Elements in PM2.5 (e.g., Al, K, Ca, Mn, Fe, Ni, Cu, Zn, As, Se, Cd, Pb) were monitored using an online X-ray fluorescence (XRF) spectrometer (Xact® 625, Cooper Environmental Services, Tigard, OR, USA). All the instruments were equipped with individual sampling inlets with a cyclone to achieve a 2.5 µm cut size. The sampling lines, made of stainless steel, were approximately 2–2.5 m in length.
Quantification of a suite of speciated organic markers was conducted using a thermal desorption Aerosol Ggas chromatography–mass spectrometer (TAG, Aerodyne Research Inc.). The measurement principle and operational procedure of the TAG system have been described in detail in previous studies (Williams et al., 2006; He et al., 2020; Zhu et al., 2021). In brief, the TAG system operated at a time resolution of 2 h. During the first hour, ambient air was drawn through a PM2.5 cyclone at a flow rate of 10 L min−1, passing through a carbon denuder to remove the gas phase, and particles were then collected onto a thermal desorption cell (CTD). In the second hour, the collected particles underwent thermal desorption and gas chromatography–mass spectrometry (GC-MS) analysis. In each analysis, 5 µL of an internal standard mixture was added to the CTD that was loaded with particles collected in the preceding hour. During the thermal desorption step, the polar organic compounds in the PM2.5 were derivatized to their trimethylsilyl derivatives under a helium stream saturated with the derivatization agent N-methyl-N-(trimethylsilyl) trifluoroacetamide (MSTFA). Subsequently, the organic compounds were reconcentrated onto a focusing trap cooled by a fan. Following this, the CTD was purged with pure helium to remove excess MSTFA, and the focusing trap was heated to 330 °C to transfer the organic compounds into the valveless injection system, which utilizes a restrictive capillary tube to connect to the GC inlet. The GC-MS analysis was then initiated. A total of approximately 100 polar and non-polar organic compounds could be identified and quantified with authentic standards (Zhu et al., 2021). The individual TAG-measured source tracers used for PMF receptor modeling are listed in Table S1 in the Supplement.
Gaseous pollutants, including sulfur dioxide (SO2), ozone (O3), nitrogen dioxide (NO2), nitric oxide (NO), and carbon monoxide (CO), along with meteorological parameters such as temperature, relative humidity, atmospheric pressure, visibility, wind speed, and wind direction, were also recorded. The trace gas and meteorological data were averaged to an hourly resolution to match the time resolution of other analyses.
3.1 Abundance and variations of ON aerosol.
The concentration of aerosol ON ranged from 0.15 to 2.35 µg N m−3, with the average being 0.80 ± 0.45 µg N m−3 during the fall–winter period of observation (Fig. 1). IN concentration was on average 3.34 ± 2.16 µg N m−3 and displayed a large variation from 0.34 to 21.05 µg N m−3. ON accounted for 6 %–58 % of the total N in aerosols, with an average of approximately 20 %. This percentage was significantly lower than (p<0.001) the value (25 %) observed at the same location during the summer of 2021 (Yu et al., 2023). The difference was attributed to the higher enhancement of IN (2.2×) compared to ON (1.8×) from summer to winter. During the winter observation, ON exhibited significantly higher concentrations at nighttime (0.85 µg N m−3) compared to daytime (0.75 µg N m−3) (p<0.005) (Fig. 1). This result contradicted the findings from summertime measurements, which showed higher ON concentrations during daytime (Yu et al., 2023). From summer to winter, the daytime and nighttime ON concentrations increased by a factor of 1.56 and 2.13, respectively, suggesting that nocturnal formation of ON aerosols might be more significant in winter. The concentration of aerosol IN was higher during nighttime in both summer and winter periods at the urban site.
The average of OC ON atomic ratio was 8.15, with an interquartile range of 6.92 to 9.34 during the fall–winter observation (Fig. 1). That is, in most cases there was one N atom relative to 7–9 C atoms in the collected OAs. The average of OC ON atomic ratio was significantly lower in winter than in summer (8.15 vs. 11.98) (p<0.001). Since the categories of major primary sources of OC and ON did not change significantly at the urban site over seasons, which is discussed below, the lower OC ON ratio suggested that during wintertime, when air pollution is more severe, more N element was incorporated into organic molecules to form secondary N-containing OA. Therefore, detailed investigations into the sources, particularly the secondary formation processes of nitrogenous OA, are warranted.
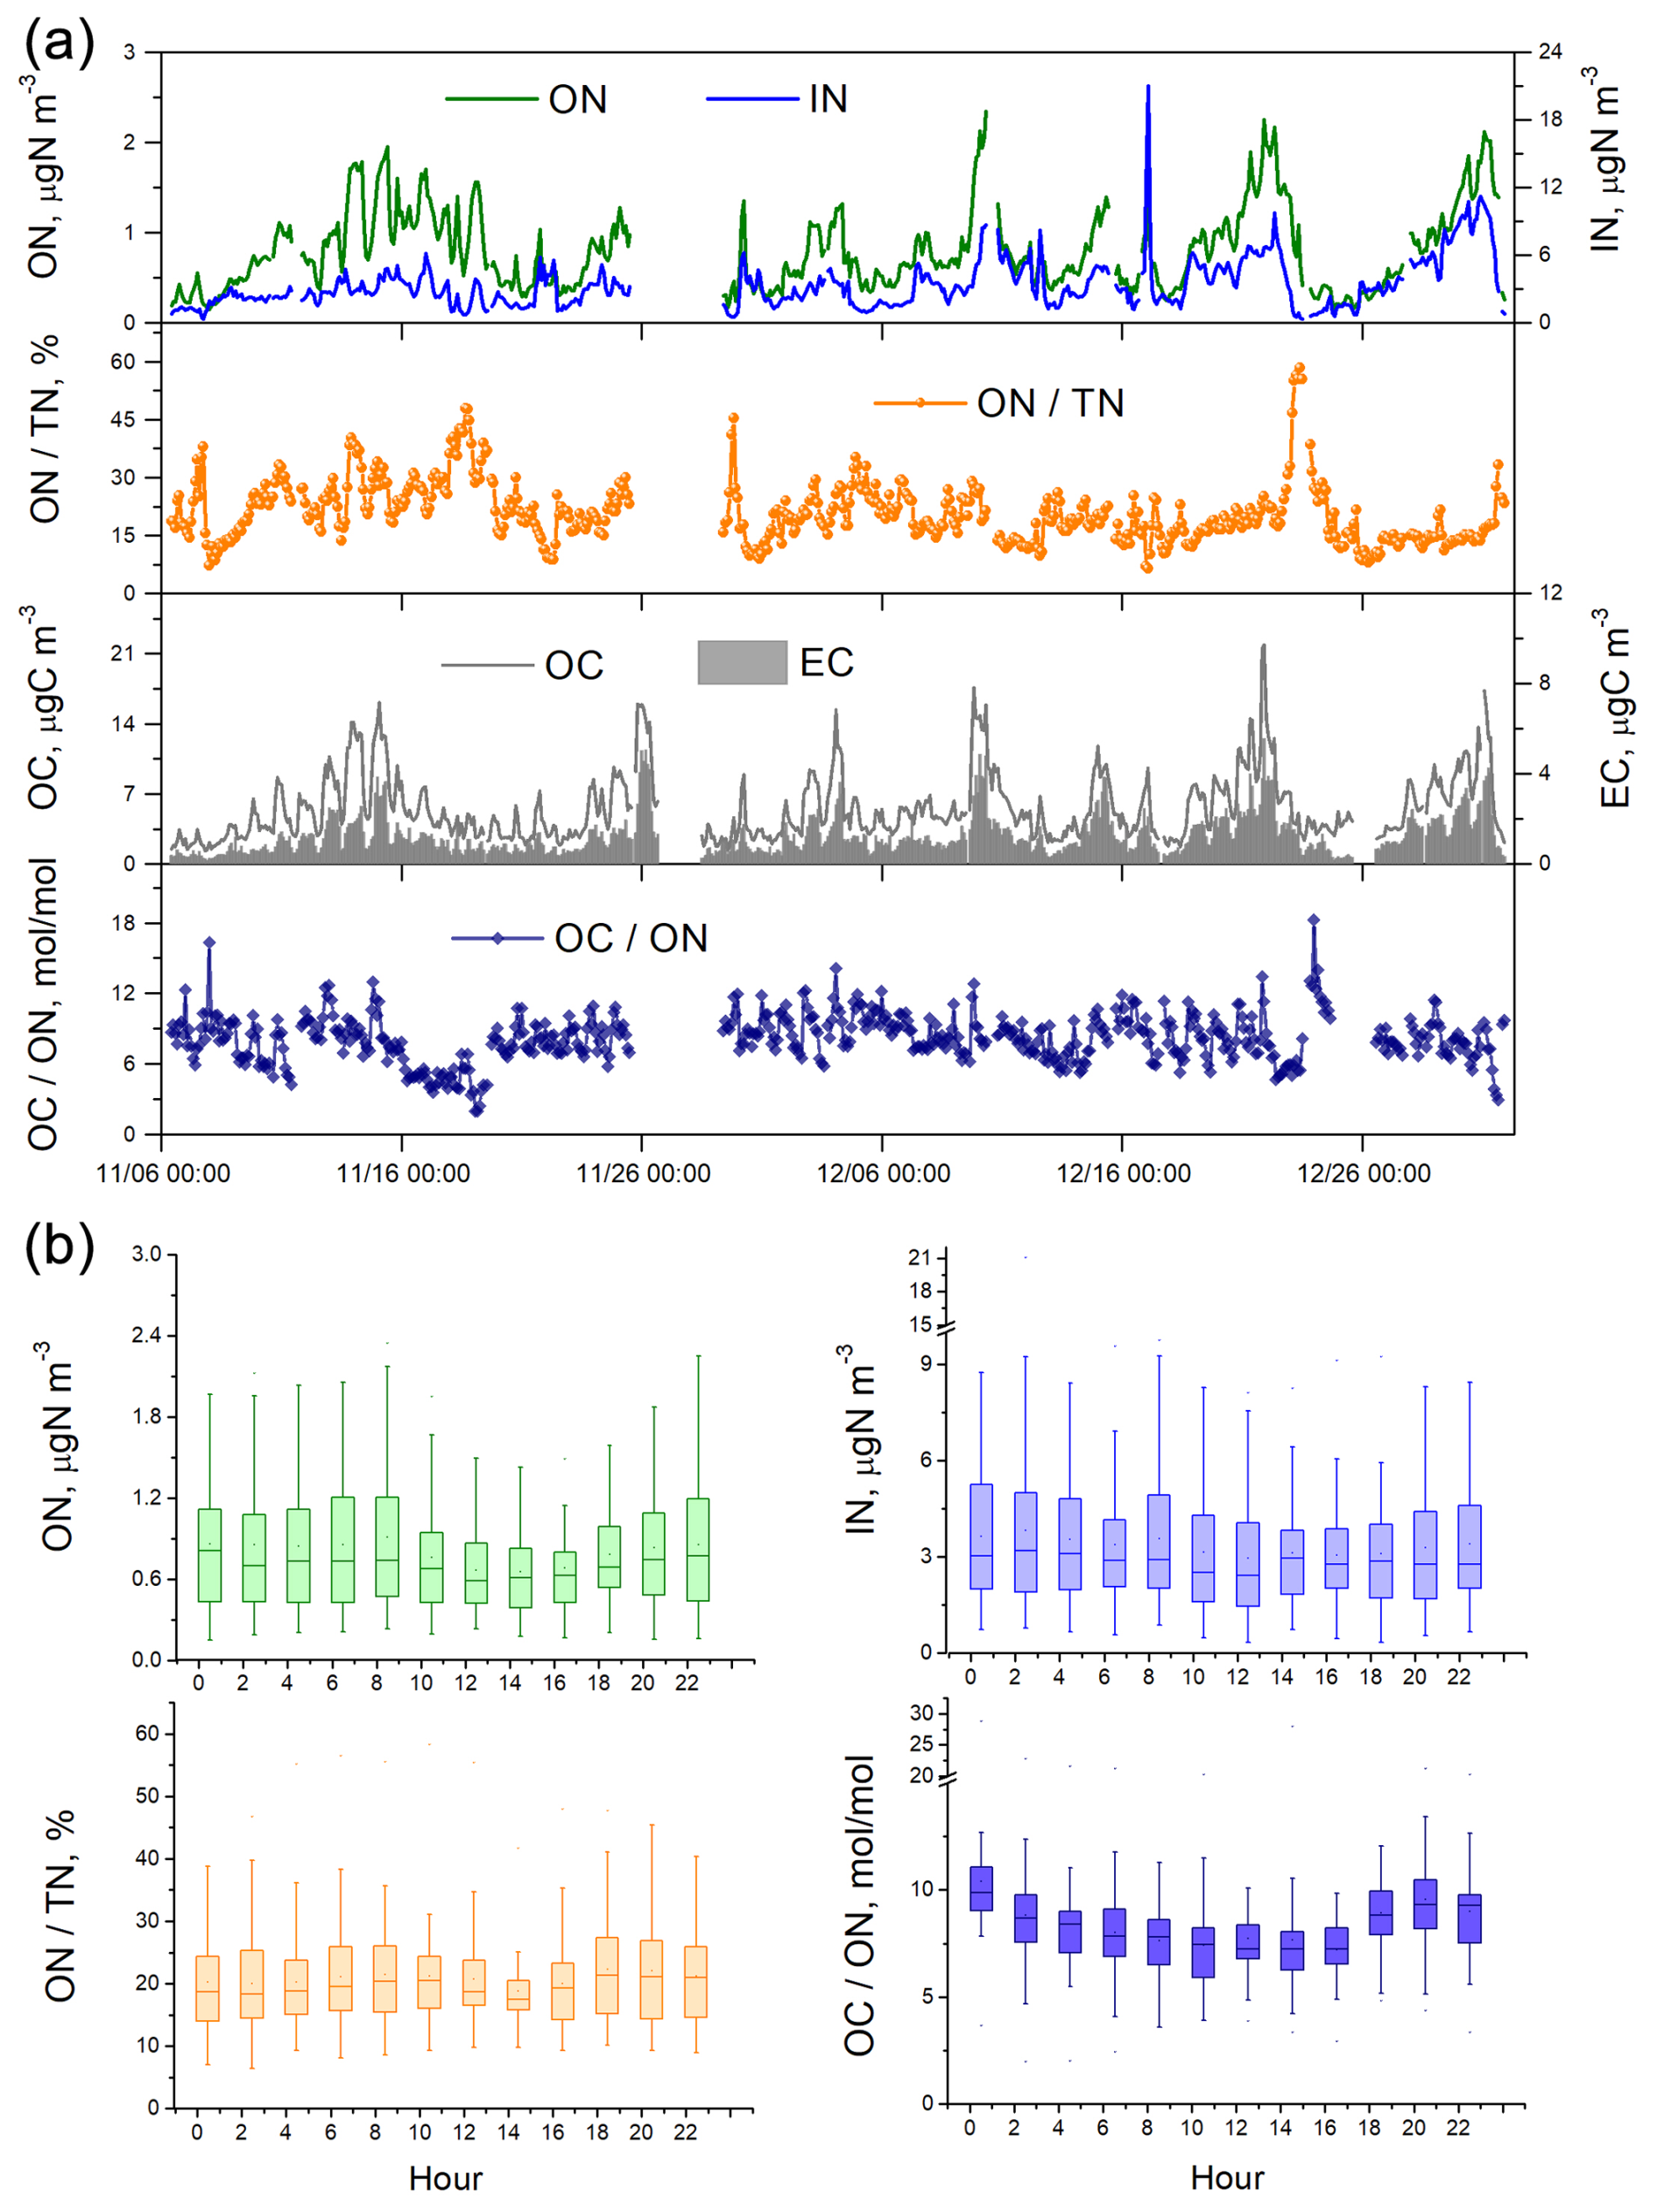
Figure 1(a) Time series of aerosol N and C concentrations as well as ON TN and OC ON ratios during the fall–winter field observations in urban Shanghai from 6 November to 31 December 2021.The OC ON values are atomic ratios, calculated by measured OC ON mass ratios divided by (). (b) Diel variations of ON and IN concentrations as well as ON TN and OC ON ratios.
3.2 Source apportionment for aerosol ON by PMF model with comprehensive source markers
In this study, bihourly measurements of aerosol total ON, together with a comprehensive list of organic and inorganic source markers, were available. These data enabled a quantitative source apportionment of ON using PMF receptor modeling. The PMF results allowed investigation of the diel variations in ON sources. Details regarding the PMF configuration and diagnostics are provided in Text S1 in the Supplement. Benefiting from the comprehensive array of molecular source tracers, the PMF analysis resolved a total of 18 factors, including eight primary emission sources and 10 secondary formation sources. The factor profiles and contributions are displayed in Figs. S3 and S4 in the Supplement, respectively. Source identification was based on established molecular and elemental markers (Qiao et al., 2014; Wang et al., 2015). These factors and their corresponding markers are as follows. (1) Industrial emissions were represented by manganese (Mn), iron (Fe), and zinc (Zn). (2) Coal combustion was identified through selenium (Se) and lead (Pb). (3) Biomass burning was characterized by the presence of levoglucosan, mannosan, and galactosan. (4) Vehicle emissions were indicated by hopanes, nitrogen oxides (NOx), and elemental carbon (EC). (5) Residue oil combustion was marked by high loadings of nickel (Ni). (6) Cooking emissions were indicated by saturated and unsaturated fatty acids. (7) Oxygenated cooking OA formation was characterized by the high loadings of azelaic acid, 9-oxononanoic acid, and nonanoic acid, which are oxidation products of oleic acid or other unsaturated fatty acids with −C = C at the C9 position that are emitted directly from cooking activities (Huang et al., 2021a; Wang and Yu, 2021). This factor reflects secondary oxidation products originating from primary cooking emissions and showed pronounced enhancements during dinner hours, as illustrated in Fig. S4a. (8) Sea salt emissions were distinguished by sodium (Na+) and chloride (Cl−). (9) Soil dust was indicated by silicon (Si) and calcium (Ca). (10) Nitrocatechol formation processes were represented by 4-nitrocatechol, 3-methyl-5-nitrocatechol, and 4-methyl-5-nitrocatechol. These compounds exhibited strong inter-species correlations, with R2 values ranging from 0.4 to 0.8, suggesting a common formation pathway. (11) Nitrophenol formation was identified through 4-nitrophenol. As nitroaromatic compounds are significant components of nitrogen-containing OA, both nitrocatechols and nitrophenol were included in the PMF analysis to resolve ON fractions associated with nitroaromatic species. (12) Nitrate formation processes were indicated by nitrate (NO). (13) Sulfate formation processes were identified through sulfate (SO). (14) Photochemical formation processes were associated with a high loading of ozone (O3). (15) Phthalic acid formation processes were resolved using phthalic acid as a tracer. (16) Dicarboxylic acid (DCA) formation was identified through a suite of dicarboxylic acids. (17) Isoprene- and α-pinene-derived secondary OA (SOA) formation was represented by their respective oxidation products. (18) β-Caryophyllene SOA formation was characterized by β-caryophyllenic acid. The 18-factor solution exhibited excellent agreement with the observed ON and OC masses (Fig. S5). Among theses factors, 12 contributed to ON mass. The remaining six factors–biomass burning, residue oil combustion, sea salt emission, sulfate formation processes, phthalic acid formation, and isoprene and α-pinene SOA formation processes–showed negligible or no contribution to ON.
Overall, 52 % (0.42 µg N m−3) of the ON mass was attributed to primary emissions (Fig. 2). Among the primary sources, coal combustion and vehicle emissions were the most dominant, each contributing 21 % to the aerosol ON. This finding was consistent with the summertime measurements at the same site that vehicle emissions and coal combustion dominated the primary emission sources of ON (Yu et al., 2023). The contribution of coal combustion to ON was higher during nighttime, whereas the contribution of vehicle emissions increased during traffic rush hours (Fig. 2c). In comparison, industrial and dust emissions had relatively lower contributions to ON but showed increased contributions during daytime. Biomass burning has been recognized as an important source of aerosol ON (Mace et al., 2003; Chen and Chen, 2010; Yu et al., 2017). In this study, we found that a negligible fraction of ON was apportioned to the primary biomass burning factor while a notable presence (7.2 %) of ON in the factor of nitrocatechol formation processes (Fig. 2). Nitrocatechols are probably formed through the nitration of catechols emitted from biomass burning. This secondary formation pathway was supported by the good correlation between levoglucosan and nitrocatechols (Fig. S7). The contribution of primary cooking emissions to ON was generally low, averaging 2 % across the observation period. However, this contribution increased to 5 ± 4 % (ranging from 0.8 % to 17 %) during dinner time (Fig. 2).
Secondary formation processes contributed 48 % (0.38 µg N m−3) to ON. Among these, nitrate formation processes contributed the largest fraction, representing 14 % of the ON mass, and exhibited minimal diel variation. Photochemical formation processes contributed 10 % to ON, with a considerable increase observed from noon to the afternoon, consistent with increased photochemical activity during daylight hours. The formation processes of DCAs and nitrocatechols contributed 8 % and 7 %, respectively, to the ON budget. The oxygenated cooking OA factor contributed 7 %, exceeding the contribution from primary cooking emissions (2 %).
ON associated with the factors related to nitrocatechol and nitrophenol formation probably represent the amount of N bound within nitroaromatic compounds, averaging approximately 60 ngN m−3 (Fig. 2). This study quantified four nitroaromatic compounds in aerosols, namely, 4-nitrophenol, 4-nitrocatechol, 3-methyl-5-nitrocatechol, and 4-methyl-5-nitrocatechol, using the TAG system. The combined N content in the four nitroaromatic compounds averaged at 1.14 ngN m−3, accounting for approximately 2 % of the estimated total nitroaromatic-N. In most cases (> 90 %), the speciated nitroaromatic-N represented less than 10 % of total nitroaromatic-N (Fig. S10a). Nitroaromatic compounds are known for their remarkable contributions to aerosol light absorption, and some are recognized as toxicants (Laskin et al., 2015; Zhang et al., 2023). Our findings indicated the substantial presence of the un-speciated mass within this group of N-containing compounds, thus the importance to identify and quantify the unknown nitroaromatics.
The formation of ON compounds associated with oxygenated cooking OA probably involves the reactive uptake of N2O5 NO3 radicals by unsaturated fatty acid particles, leading to the production of organic nitrates (Gross et al., 2009; Zhao et al., 2011). The combined contribution from the two cooking-related factors was particularly pronounced during dinnertime, reaching 17 ± 10 %. It is noted that the study-wide average contributions to ON from cooking emission and their oxidation product factors were much lower at noon compared to evening (Fig. 2). This difference might be attributed to the lower cooking emissions and/or more favorable dispersion conditions during lunchtime. It is also of note that the study-wide average contributions shown in Fig. 2 obscure the diel variation patterns on individual days. To address this, we examined the day-by-day variations of cooking emission-related tracers. On many days, both unsaturated fatty acids (indicative of primary cooking emissions) and azelaic acid (a marker of oxygenated cooking OA) exhibited bimodal peaks during lunchtime and dinnertime. Fig. S8 highlights five representative days in which the concentrations of these tracers, along with their associated-ON contributions, clearly showed maxima at both mealtime periods.
Sulfate formation processes exhibited negligible contributions to ON formation in this study. Note that sulfate and nitrate were fully neutralized by ammonium (Fig. S9), limiting their capability to absorb organic bases such as amines and suppress acid-catalyzed ON formation pathways initiated by sulfuric acid. Furthermore, sulfate and ON displayed distinct temporal variation patterns and were poorly correlated (R2 = 0.05), further indicating a lack of mechanistic linkage between sulfate chemistry and ON formation in the urban atmosphere of Shanghai. These findings collectively suggest that sulfate-driven processes played a minor role in ON formation under the conditions observed.
Insignificant ON was apportioned to the factor representing SOA formation from isoprene and α-pinene oxidation. While it is known that reactions between biogenic volatile organic compounds such as isoprene and α-pinene with NOx or NO3 radicals can yield organic nitrates, such contributions may have been captured within the nitrate formation factor, rather than the biogenic SOA factors, in the PMF analysis. This interpretation is supported by correlation analysis, where ON showed stronger associations with NOx (R2 = 0.45) and nitrate (R2 = 0.39) than with isoprene- and α-pinene-derived SOA tracers (R2 = 0.18–0.19). The apparent allocation of biogenically derived organic nitrates to the nitrate formation factor may reflect differences in the formation mechanisms of organic nitrates versus those of traditional biogenic SOA tracers.
In summary, both primary emissions and secondary formation processes were identified as major contributors to ON in the urban atmosphere of Shanghai. It is also important to note, however, that PMF analysis has inherent limitations in fully separating primary and secondary sources, particularly for compounds such as organic aminiums, which may originate from primary emissions but subsequently undergo gas-particle partitioning.
Finally, we also estimated the amount of oxidized ON by summing the ON apportioned to the factors associated with atmospheric oxidation processes, including the photochemical formation, nitrate formation, and nitroaromatic formation factors. Based on this approach, oxidized ON, mainly organic nitrates and nitroaromatics, had a concentration range of 0.02–0.85 µg N m−3, with an average of 0.25 µg N m−3. This oxidized ON accounted for 4 %–68 % (25 % on average) of the total oxidized N (oxidized ON plus nitrate-N) (Fig. S10b). Both oxidized ON and inorganic nitrate are formed from nitrogen oxides (NOx), indicating shared precursors and partially overlapping formation pathways. Our results suggest that, under urban atmospheric conditions, the conversion ratio of NOx-N to aerosol-phase ON and nitrate-N is approximately 1:3. While this estimate is subject to uncertainties inherent in source apportionment and chemical transformation processes, it provides valuable for evaluating the fate of NOx and its partitioning into organic and inorganic aerosol nitrogen. These findings underscore the importance of quantifying bulk ON to fully characterize the abundance and chemical nature of N-containing OAs.
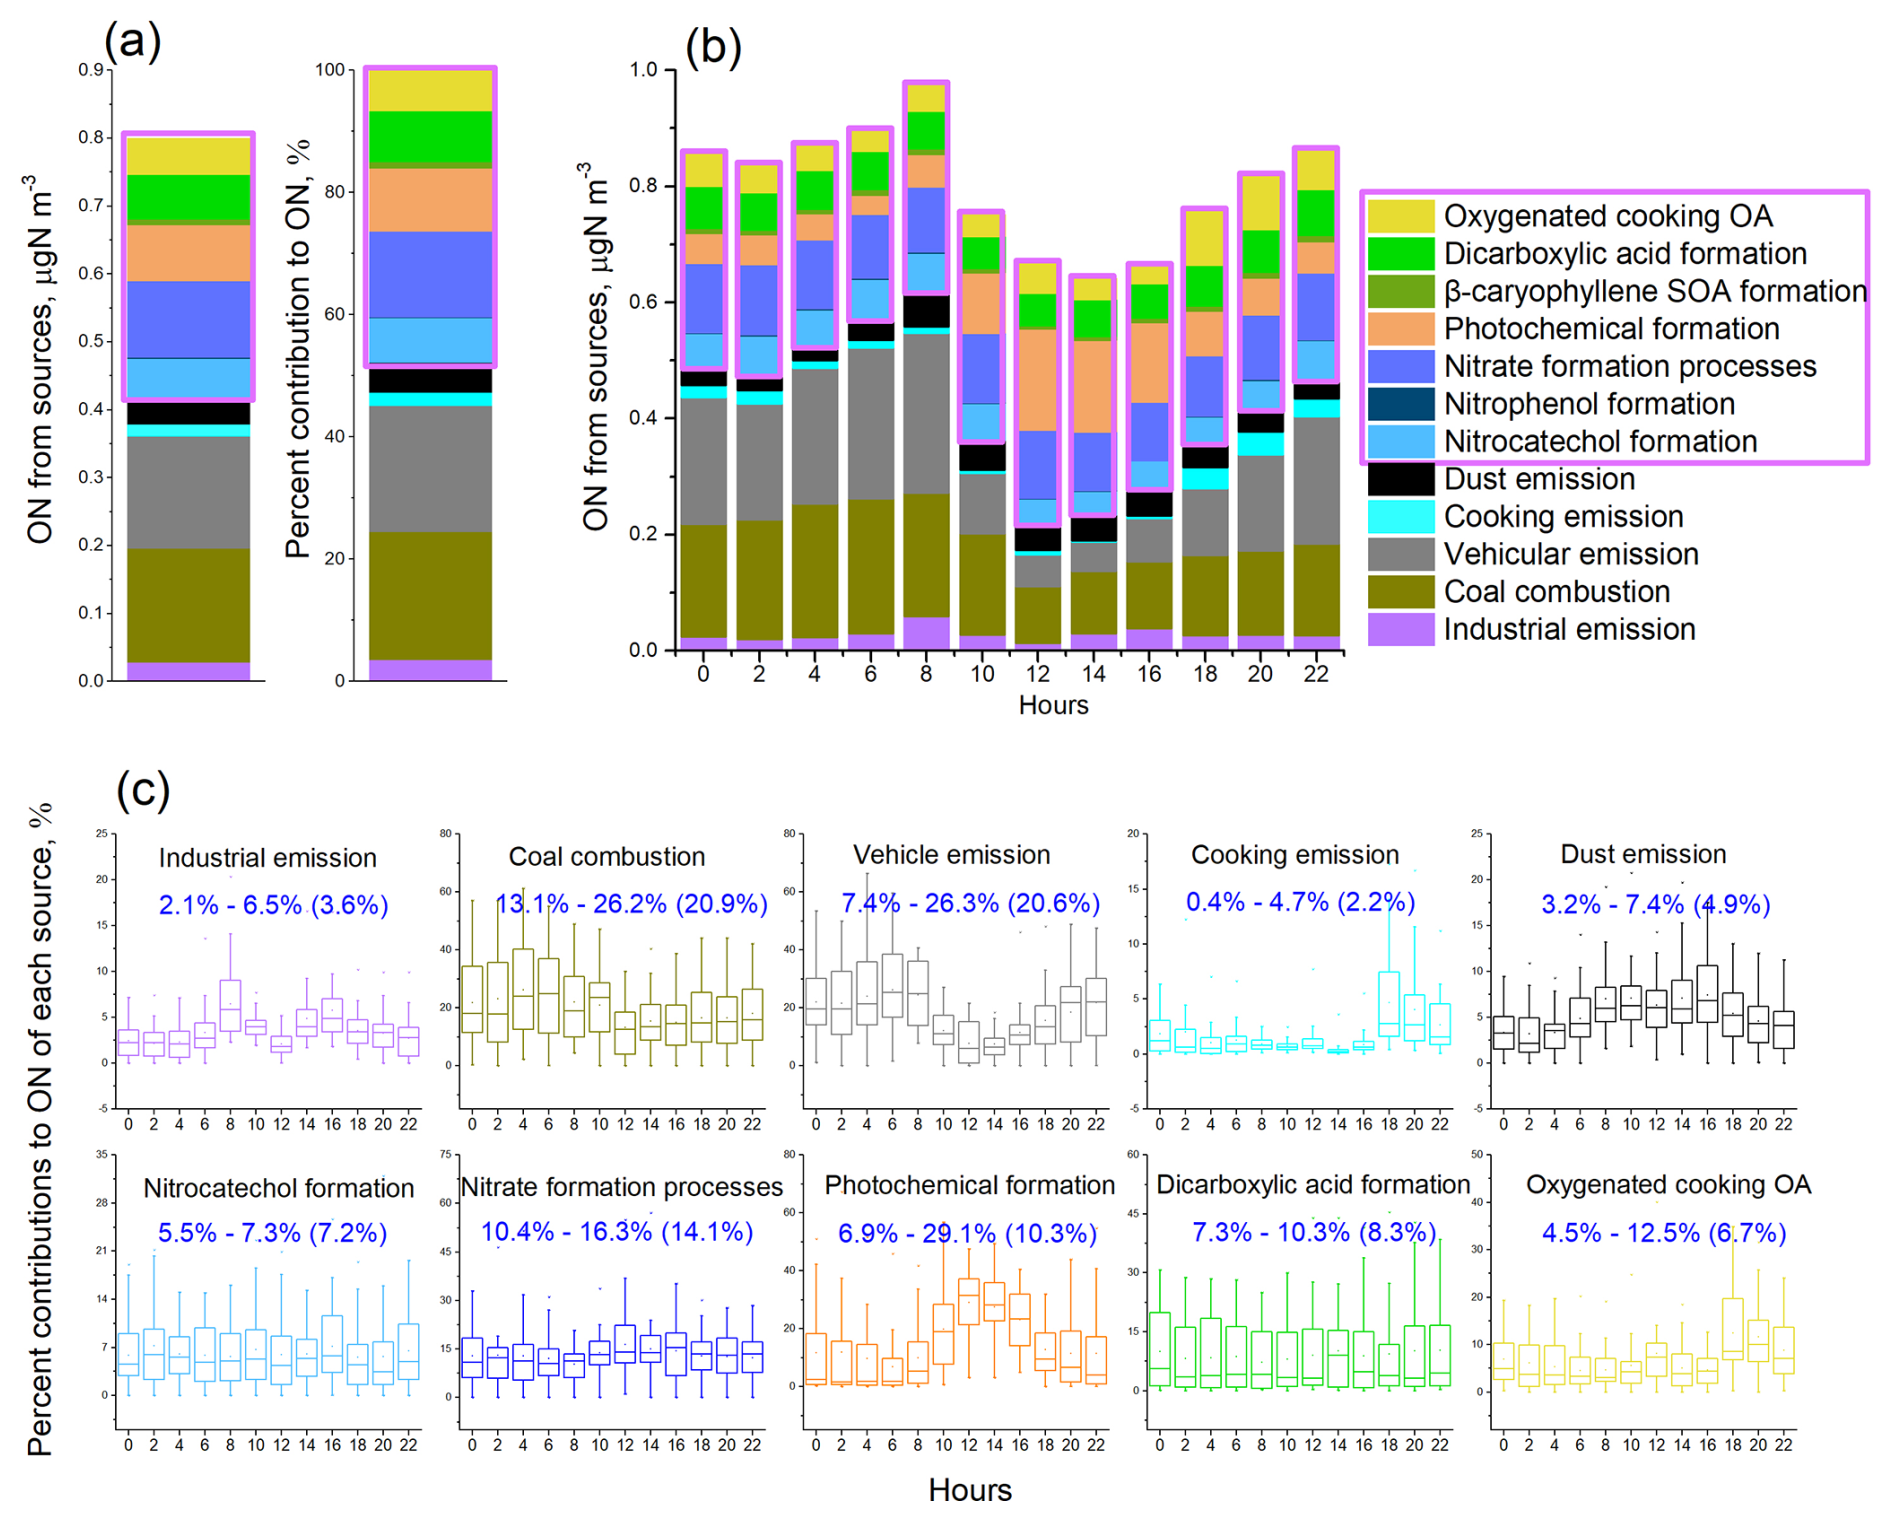
Figure 2PMF source apportionment results for aerosol ON. (a) Overall mass and percent contributions of resolved sources to aerosol ON during the fall–winter observation period. (b) Diel variations of source compositions of ON. (c) Diel variation patterns of each ON source. The numerical ranges show the lowest to highest averages of percent contributions of sources at sampling hours (e.g., 02:00, 04:00). The number in parentheses are overall percent contributions of sources to ON pool during the observation (i.e., results in a). Contributions of nitrophenol formation and β-caryophyllene SOA formation to ON were very minor and not shown for their diel variations in (c). Secondary sources of ON are highlighted with a purple box. The sources of OC can be found in Fig. S5.
3.3 Evidence of formation of reduced ON species
Note that a significant fraction of ON (8 %) was associated with the formation processes of DCAs (Fig. 2). DCAs in ambient aerosols are primarily derived from the oxidation of anthropogenic and biogenic volatile organic compounds. The part of ON related to DCA formation processes (here termed as DCA_ON) may represent the reduced-ON species formed through the heterogeneous aqueous phase reactions between DCAs and NH3 NH, as discussed below. Previous lab studies and field measurements have suggested that the amount of particulate NH, as measured by AMS, exceeded the quantity required to balance anions including nitrate (NO), sulfate (SO), and chloride (Cl−). The excess NH was believed to bind with organic acids such as DCAs to form organic ammonium salts (Schlag et al., 2017; Hao et al., 2020). We note that the measurement of NH by AMS relies on the quantification of NH fragments, which could also originate from the fragmentation of other reduced ON species, such as amines and amides, in addition to NH and organic ammonium salts. Consequently, the specific molecules into which the excess NH-N is incorporated remain unclear due to the lack of molecular information on ON-containing compounds.
We examined the relationship between DCA_ON and NH concentrations during periods of continuous increment in DCA_ON lasting 4 h or longer. We identified 17 such cases during the field observation period. Interestingly, DCA_ON showed a strong correlation with NH in all these cases (Fig. 3a). This result lends support for the hypothesis that DCA_ON may represent reduced ON species formed through the reactions between DCAs and NH3 NH. The slopes of linear regression between DCA_ON and NH varied largely among the cases and could be roughly divided into higher-slope cases and lower-slope cases, with 7 and 10 in these two categories, respectively (Fig. 3a). A higher-slope value indicated a more rapid formation of DCA_ON at a given concentration level of NH. The higher-slope cases were distinctly associated with higher O3 concentration (Fig. 3b), suggesting an elevated oxidation capacity and hence enhanced formation of secondary products such as DCAs, which serve as the precursors of DCA_ON. This argument was supported by the overall higher increment of DCAs concentration in the higher-slope cases (Fig. 3b). Note that the aqueous formation of imines such as imidazoles through the reactions between carbonyls and NH3 NH has been established in laboratory studies (Galloway et al., 2009; Noziere et al., 2009) and confirmed by field observations (Zhang et al., 2020; Lian et al., 2021; Liu et al., 2023). Considering the close relationship between carbonyls and DCAs, the possibility that imines contributed to DCA_ON could not be excluded. Overall, while we acknowledge that a positive correlation with NH is not exclusive to DCA_ON, the combination of observational evidence described above and mechanistic plausibility strengthens our interpretation that the DCA-related ON probably contributes to reduced ON formation.
The concentration of DCA_ON had an interquartile range of 8–111 ng N m−3, with an average ± standard deviation (SD) of 66 ± 81 ng N m−3 over the observation period. Assuming an average molecular formula of C5H7N1.5O1.5 for the reduced-ON species, considering these compounds may contain 3–7 carbon, 1–2 nitrogen, and 1–2 oxygen atoms, the concentration of these ON compounds would be 43–592 ng m−3 with the average ± SD being 352 ± 432 ng m−3. This result provides a rough estimation of the total reduced ON compounds that are formed through NH3 NH reactions in urban Shanghai. In a recent study conducted in rural Shanghai (Liu et al., 2023), eight imidazoles were detected, and the total concentration of these species ranged from 1.3–15.8 ng m−3 (average: 5.5 ± 3.4 ng m−3). Furthermore, significant increases in imidazole concentrations were observed during humid haze periods, suggesting an aqueous phase formation pathway of these species (Liu et al., 2023). The summed concentration level of the eight imidazoles was lower by 1–2 orders of magnitude compared to our estimated bulk concentration, indicating the prevalence of unidentified reduced ON species. Our analyses suggested that ON aerosols originating from NH3 chemistry could be a significant source of nitrogenous SOA. Further investigations are needed to determine their major chemical compositions and formation mechanisms.
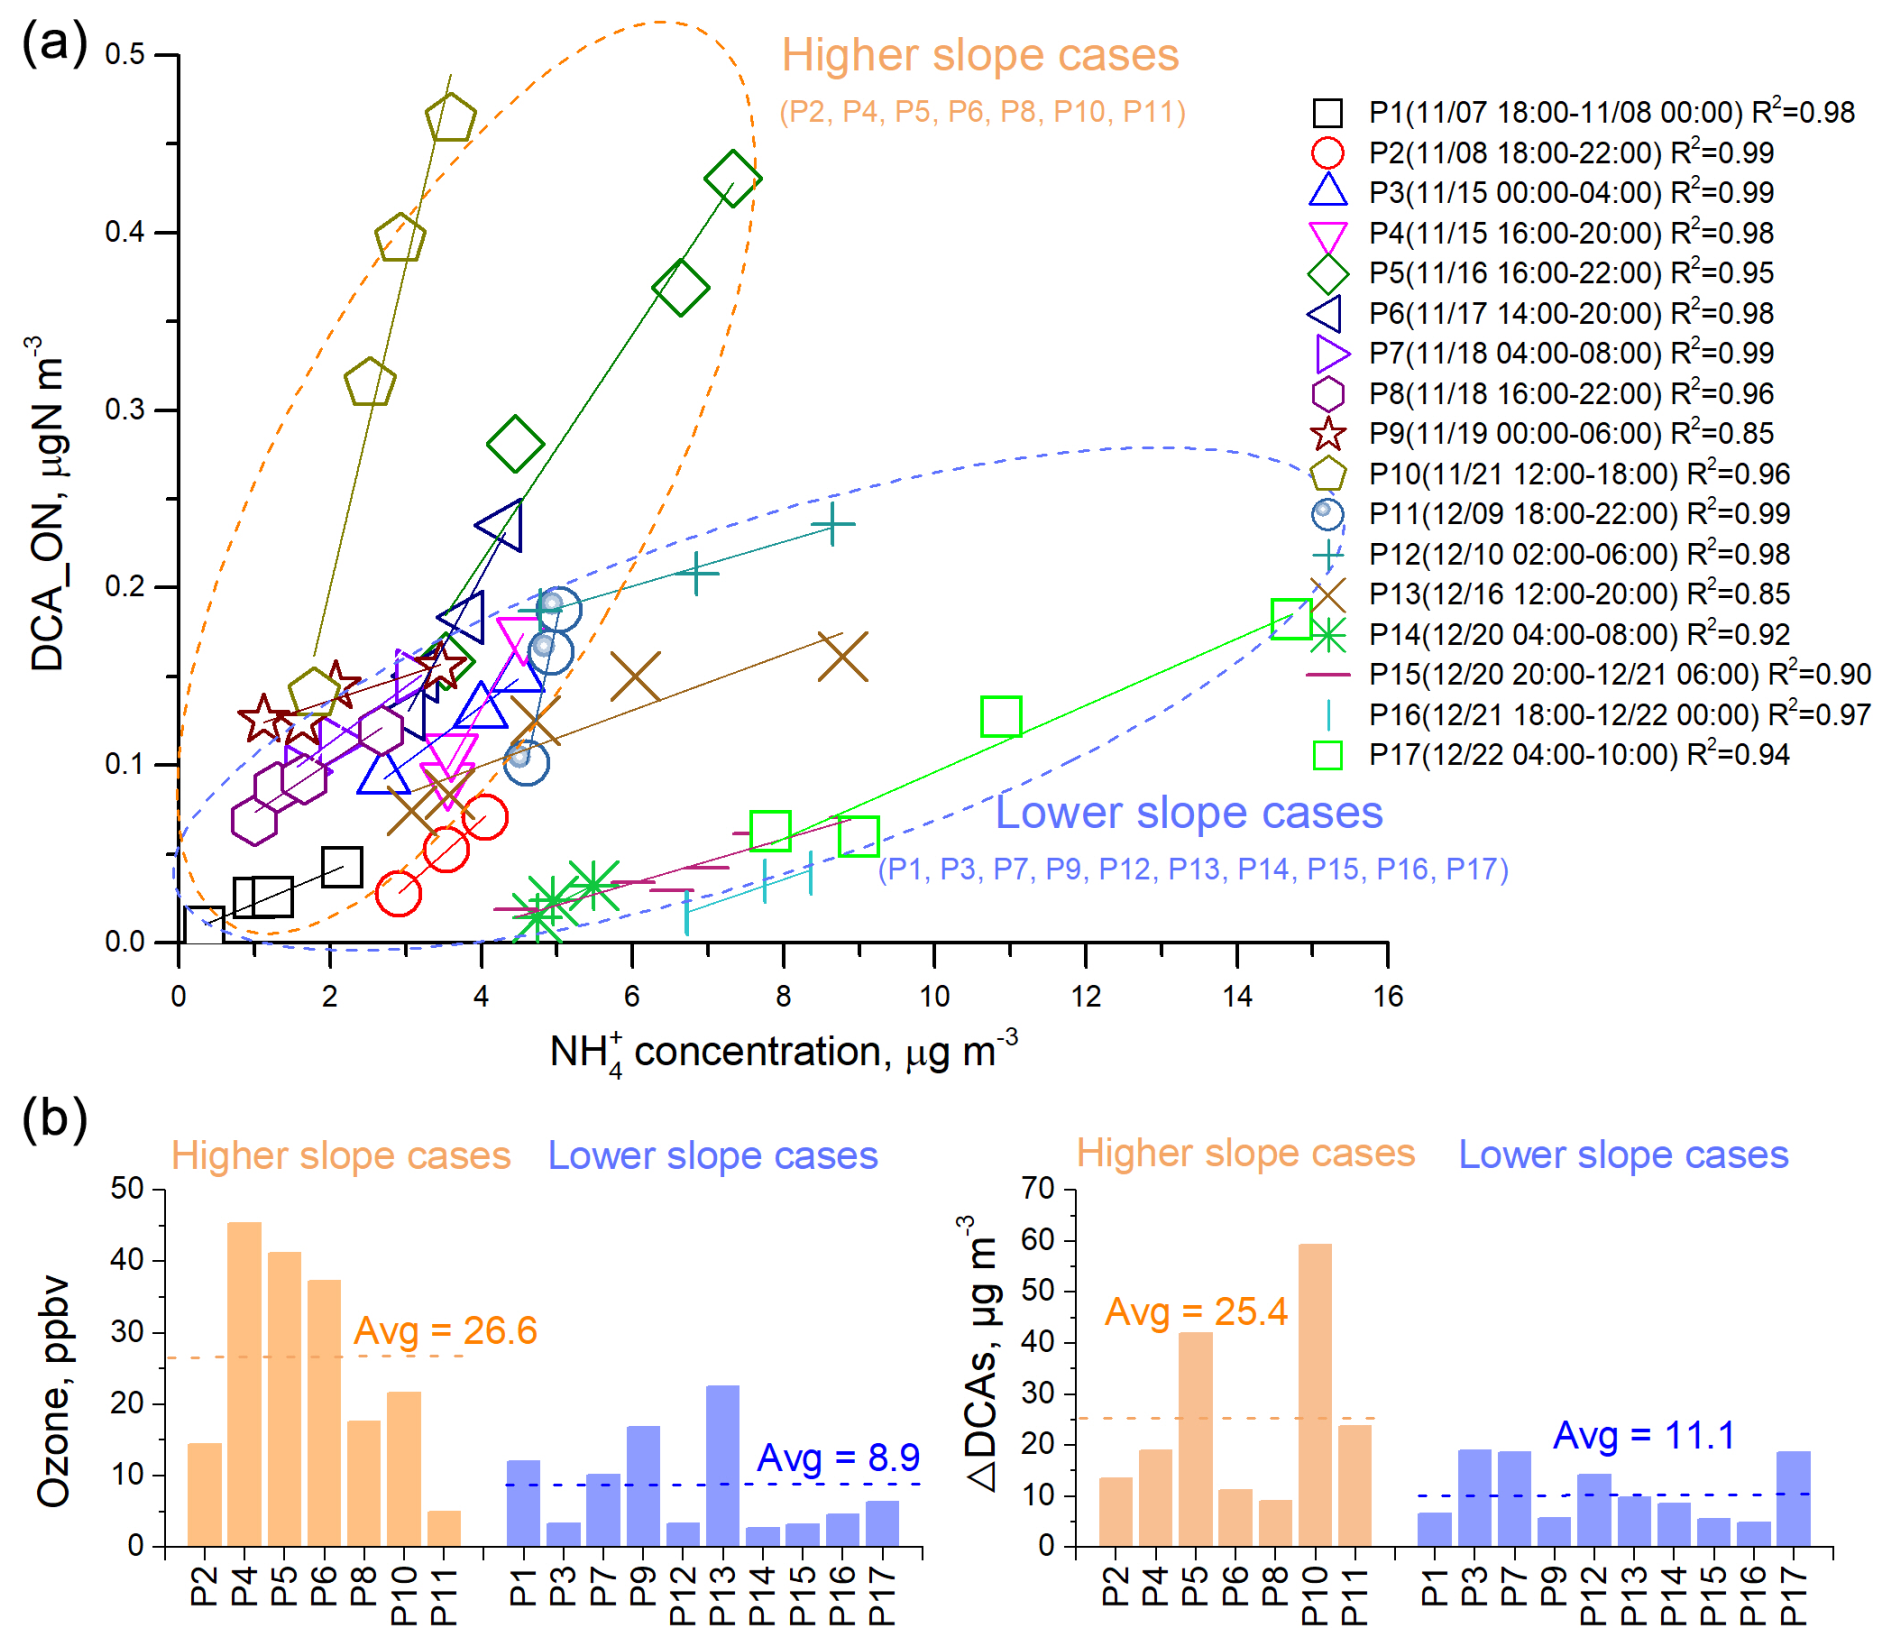
Figure 3The relationship between ON associated with dicarboxylic acids (DCA) formation (DCA_ON) and ammonium (NH) in the cases that DCA_ON showed continuous increments, and the potential influence factors. (a) Correlations between DCA_ON and NH concentrations in each of 17 cases where DCA_ON exhibited a continuous increment. The cases can be separated into two groups based on their linear regression slopes, those with higher slopes, enclosed in yellow dashed circles, and those with lower slopes, enclosed in blue dashed circles. (b) Comparisons of levels of ozone (O3) and ΔDCAs in higher slope cases and lower slope cases. ΔDCAs refers to the differences in DCAs concentrations at the beginning and end of each case.
3.4 Factors driving the increment of secondary ON aerosol.
The PMF source apportionment analysis has provided the total quantity of the secondary ON (SON) and its apportionment to individual formation pathways. This greatly facilitates investigating the largely under-evaluated formation processes of N-containing OA. We next focus on the cases where SON showed continuous increment for a period of 4 h or longer and discuss the driving factors behind these increments; 42 cases were identified throughout the entire observation period. To isolate the local formation of SON from the influence of transported air masses, we extracted cases with wind speeds lower than 3 m s−1 as cases of local SON formation (Zhou et al., 2022). The following discussion will exclusively focus on the local SON formation cases.
A total of 24 local SON formation cases were identified and classified into five types based on the dominant formation pathway of SON, as revealed by the PMF analysis. Figure 4 illustrates the variations in the sources of SON and secondary organic carbon (SOC) for the five types of local SON increment. The ensuing discussion shows our paired measurements of bulk aerosol ON and OC, along with subsequent source analyses, provide unique insights into the formation processes of N-containing OA.
Type 1 cases, totaling three, were characterized by DCA formation processes driving the increment of SON. In one example of Type 1 case shown in Fig. 4, SON increased by 0.33 µg N m−3 from 16:00–22:00 on 16 November. During this period, DCA_ON increased by 0.27 µg N m−3, accounting for 82 % of the variation in SON. Nitrate formation processes also contributed to the SON increment during this period, but to a lesser extent. DCA formation processes were also the dominant source of SOC increase in this case, contributing to the production of 1.05 µg C m−3 of SOC and 80 % of the change in SOC during the period. Note that the atomic ratio of the change in SOC (ΔSOC) to the change in SON (ΔSON) associated with DCA formation processes was 4.5. This ratio indicates that there was approximately 1 nitrogen atom for every 4–5 carbon atoms in the SOA associated with DCA formation processes. The low ΔSOC ΔSON ratio suggested the formation of N-containing OAs with low molecular weight and/or multiple N atoms. Considering that some SOA compounds may not contain N atoms, the SON compounds formed through DCA formation processes may have a ratio lower than 4. Possible candidate species include imines, such as methyl- and ethyl-imidazoles, and C2–C5 amides. This result supports the aforementioned hypothesis that DCA_ON probably constitutes of reduced ON species formed through reactions between acids carbonyls and NH3 NH. All three Type 1 cases occurred during the transition from daytime to nighttime (e.g., from 16:00–22:00). This suggests that acids carbonyls accumulated during the daytime through photochemical processes and then entered the aqueous phase during nighttime, where they reacted with NH3 NH to form reduced ON species under higher air humidity.
Type 2 cases, totaling seven, featured photochemical formation as the dominant source driving SON increment. They mostly occurred during the morning to noon periods, suggesting formation of SON through photochemical processes. In the Type 2 case presented in Fig. 4, ΔSON was 0.18 µg N m−3 and ΔSOC was 0.97 µg C m−3. Photochemical formation contributed 0.1 µg N m−3 of SON and 0.61 µg C m−3 of SOC, yielding a ΔSOC ΔSON atomic ratio of 7.1. This result suggested the potential formation of N-containing organic molecules with a ratio of 6–8. Examples of such species include nitroaromatic compounds and organic nitrates. The frequent occurrence of Type 2 cases suggested an efficient formation of oxidized ON species in urban areas.
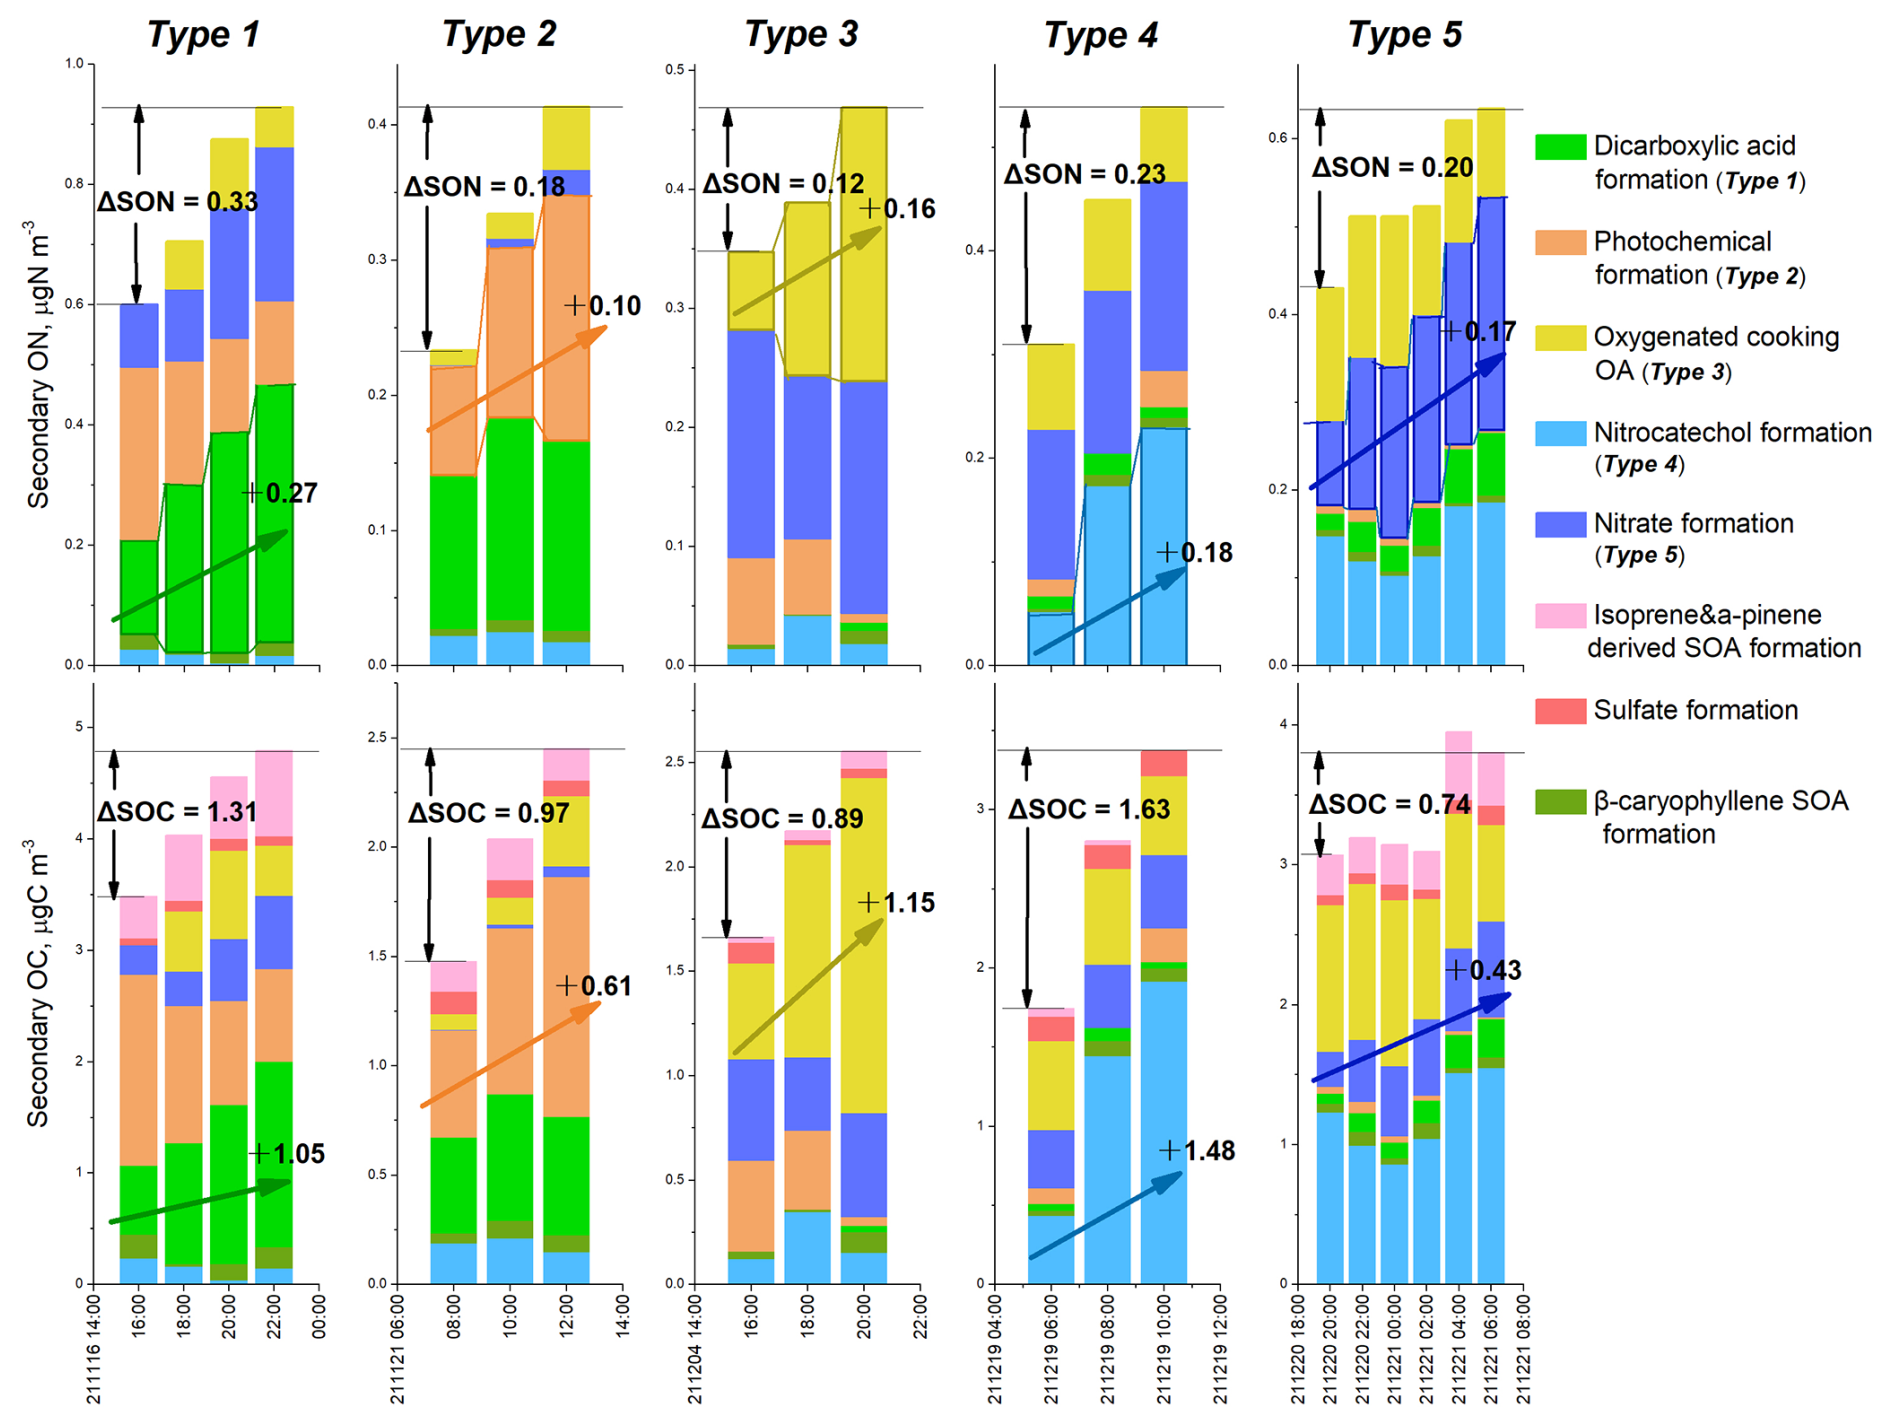
Figure 4Five types of SON increment were driven by different formation processes. The increment amounts of SON (ΔSON) and SOC (ΔSOC) in each type are shown. The dominant formation processes of ON and OC in each type are highlighted with rising arrows.
Type 3 cases, totaling six, exhibit SON increase driven by oxidation of cooking emissions. Their occurrences coincided with lunch and dinner hours. Take the case during 16:00–20:00 of 4 December as an example, 0.16 µg N m−3 of ΔSON and 1.15 µg C m−3 of ΔSOC were formed, resulting in a ratio of 8.4 for the SOA associated with the cooking emission oxidation. Chamber simulations have shown that SOA produced through oxidation of cooking fumes can be more abundant than primary OA species from cooking emissions (Liu et al., 2018b). However, the chemical compositions and underlying formation mechanisms of N-containing OAs remain uncertain. This study, for the first time, reveals the potentially significant contribution of cooking oxidation to N-containing SOA in the real urban atmosphere. Future efforts are recommended to direct towards investigating representative N-containing molecules formed through cooking oxidation and their formation pathways.
Four Type 4 cases were identified, each characterized by the dominant contribution of nitrocatechol formation to ON increase and all occurred during the daytime. Take the case between 06:00 and 10:00 on 19 December as an example, the sum concentration of 4-nitrocatechol, 3-methyl-5-nitrocatechol, and 4-methyl-5-nitrocatechol (Table S1) rose from 9.52 to 24.64 ng m−3. This increase was attributed to secondary formation processes of nitroaromatic compounds, instead of primary emissions, as evidenced by the flat or decreasing trends of elemental carbon (EC) and nitric oxide (NO) during that period (Fig. S11). The increment in SON and SOC associated with the nitrocatechol formation factor was 0.18 µg N m−3 and 1.48 µg C m−3, respectively over the four-hour period (Fig. 4), resulting in a ΔSOC ΔSON atomic ratio of 9.6. This portion of SON may represent the N content in nitroaromatic compounds formed through processes analogous to nitrocatechol formation.
Four Type 5 cases were identified, each characterized with nitrate formation processing as the driving source for the increase in SON. This fraction of SON may indicate the formation of organic nitrates, which share common precursor of NOx with nitrate. Organic nitrates have long been recognized as notable components of secondary OAs in ambient air (Rollins et al., 2012; Perring et al., 2013). Organic nitrate formation encompasses two main pathways: hydroxyl radical (OH)-initiated oxidation of hydrocarbons in the presence of NOx during the day and nitrate radical (NO3)-initiated oxidation of alkenes during the night. Both pathways involve the formation of organic nitrates in the gas phase, followed by partitioning to the particulate phase (Perring et al., 2013). This study, through integrated analyses of SON and SOC, provides evidence suggesting that organic nitrates might also form through heterogeneous or aqueous reactions. As depicted in Fig. 4, the nitrate formation process produced 0.17 µg N m−3 of ΔSON and 0.43 µg C m−3 of ΔSOC from the night of 20 December to the following morning, yielding a ΔSOC ΔSON atomic ratio of only 2.9. Gas-phase formation of organic nitrates followed by gas-to-particle partitioning would not result in such a low ratio. Therefore, a large number of organic nitrates might be formed through heterogeneous or aqueous reactions between organic compounds and HNO3 NO3, enhancing the ON content while not affecting the OC content which is already present in the particle phase. In a previous study, it was suggested that organic nitrates can be produced through non-radical reactions of hydrated glyoxal and nitric acid in the aqueous phase (Lim et al., 2016). Xu et al. (2020) found that aerosol liquid water promotes the formation of water-soluble ON, probably in the form of organic nitrate species. Previous studies have identified an 80 % underestimation of monoterpene hydroxyl nitrate by the GEOS-Chem model, which considers both OH oxidation and NO3 oxidation mechanisms of monoterpene (Li et al., 2018; Zhang et al., 2021), indicating an incomplete understanding of the formation mechanisms of organic nitrates. Our observational results, combined with previous investigations, suggest the need for further exploration of the formation mechanisms of particulate organic nitrates, such as heterogeneous/aqueous phase reaction processes.
At present, the knowledge of total aerosol ON budget is severely limited, with source analysis predominantly qualitative. Building on a methodological breakthrough that allows for the online measurement of bulk aerosol ON and concurrent measurements of a comprehensive array of molecular source tracers, we have identified both primary emissions and secondary formation processes as substantial contributors to PM2.5 ON mass in urban Shanghai during the fall–winter period of 2021. While we acknowledge the inherent uncertainties of PMF modeling in distinguishing certain related sources/processes, this approach remains valuable for identifying major source categories and inferring dominant formation pathways. It provides quantitative insights into the relative contributions of different sources/processes to the overall ON budget.
The observed dominance of primary ON sources such as coal combustion and vehicle emissions, alongside the significant contributions from secondary formation processes like nitrate formation, photochemical processes, and DCA formation, indicates the multi-faceted nature of ON aerosol production in urban environments. The identification of specific secondary formation pathways, including nitroaromatics formation, DCA formation, and oxygenated cooking OA, sheds light on the diverse precursors and chemical processes involved in aerosol formation and evolution. Notably, we have provided valuable observational evidence on secondary ON aerosol formation through NH3 and NOx chemistries, the joint evaluation of which has been under-explored in the past.
The quantification of ON contributions from various sources and the elucidation of secondary formation mechanisms provided a basis for targeted mitigation strategies aimed at reducing ON emissions and improving air quality in urban areas. The insights gained from this study can inform policy decisions and regulatory measures to curb primary emission sources and mitigate the effect of secondary formation processes on ON aerosol levels.
Looking ahead, future research efforts should focus on refining our understanding of the detailed mechanisms driving ON aerosol formation, including the chemical reactions involving major precursors and secondary processes. Furthermore, continued monitoring and analysis of ON aerosol composition in different environmental settings will be crucial for assessing the broader implications of ON aerosols on air quality, climate, and public health. Bulk ON measurements enable mass closure and are advantageous for constraining the major sources and formation processes of ON aerosols. This methodology complements the molecular-level characterization of ON molecules, which provides chemical composition information but falls short of capturing total ON. Future research efforts should emphasize identifying and quantifying ON species that can indicate specific sources and formation processes.
Data used in this study are available upon request from the corresponding author.
The supplement related to this article is available online at https://doi.org/10.5194/acp-25-9061-2025-supplement.
XY and JZY conceived the research, designed the research plan and wrote the manuscript; XY, MZ, SZ, LQ, JL, YM and HW carried out the instrumental measurements; XY, ZZ, and KL carried out data analysis.
The contact author has declared that none of the authors has any competing interests.
Publisher’s note: Copernicus Publications remains neutral with regard to jurisdictional claims made in the text, published maps, institutional affiliations, or any other geographical representation in this paper. While Copernicus Publications makes every effort to include appropriate place names, the final responsibility lies with the authors.
This research has been supported by the Science and Technology Commission of Shanghai Municipality (grant no. 20dz1204000) and the Research Grants Council, University Grants Committee (grant nos. 16213222 and 16304519).
This paper was edited by Quanfu He and reviewed by two anonymous referees.
Andersen, K. M., Mayor, J. R., and Turner, B. L.: Plasticity in N uptake among sympatric species with contrasting nutrient acquisition strategies in a tropical forest, Ecology, 98, 1388–1398, 2017.
Bandowe, B. A. M. and Meusel, H.: Nitrated polycyclic aromatic hydrocarbons (nitro-PAHs) in the environment – A review, Sci. Total Environ., 581/582, 237–257, 2017.
Bones, D. L., Henricksen, D. K., Mang, S. A., Gonsior, M., Bateman, A. P., Nguyen, T. B., Cooper, W. J., and Nizkorodov, S. A.: Appearance of strong absorbers and fluorophores in limonene-O3 secondary organic aerosol due to NH-mediated chemical aging over long time scales, J. Geophys. Res.-Atmos., 115, D05203, https://doi.org/10.1029/2009JD012864, 2010.
Cape, J. N., Cornell, S. E., Jickells, T. D., and Nemitz, E.: Organic nitrogen in the atmosphere – Where does it come from? A review of sources and methods, Atmos. Res., 102, 30–48, 2011.
Chen, H. Y. and Chen, L. D.: Occurrence of water soluble organic nitrogen in aerosols at a coastal area, J. Atmos. Chem., 65, 49–71, 2010.
Chow, K. S., Huang, X. H. H., and Yu, J. Z.: Quantification of nitroaromatic compounds in atmospheric fine particulate matter in Hong Kong over 3 years: field measurement evidence for secondary formation derived from biomass burning emissions, Environ. Chem., 13, 665–673, 2016.
Duan, F. K., Liu, X. D., He, K. B., and Dong, S. P.: Measurements and characteristics of nitrogen-containing compounds in atmospheric particulate matter in Beijing, China, Bull. Environ. Contam. Toxicol., 82, 332–337, 2009.
Farmer, D. K., Matsunaga, A., Docherty, K. S., Surratt, J. D., Seinfeld, J. H., Ziemann, P. J., and Jimenez, J. L.: Response of an aerosol mass spectrometer to organonitrates and organosulfates and implications for atmospheric chemistry, P. Natl. Acad. Sci. USA, 107, 6670–6675, 2010.
Galloway, M. M., Chhabra, P. S., Chan, A. W. H., Surratt, J. D., Flagan, R. C., Seinfeld, J. H., and Keutsch, F. N.: Glyoxal uptake on ammonium sulphate seed aerosol: reaction products and reversibility of uptake under dark and irradiated conditions, Atmos. Chem. Phys., 9, 3331–3345, https://doi.org/10.5194/acp-9-3331-2009, 2009.
Gross, S., Iannone, R., Xiao, S., and Bertram, A. K.: Reactive uptake studies of NO3 and N2O5 on alkenoic acid, alkanoate, and polyalcohol substrates to probe nighttime aerosol chemistry, Phys. Chem. Chem. Phys., 11, 7792–7803, 2009.
Hao, L., Kari, E., Leskinen, A., Worsnop, D. R., and Virtanen, A.: Direct contribution of ammonia to α-pinene secondary organic aerosol formation, Atmos. Chem. Phys., 20, 14393–14405, https://doi.org/10.5194/acp-20-14393-2020, 2020.
He, X., Wang, Q. Q., Huang, X. H. H., Huang, D. D., Zhou, M., Qiao, L. P., Zhu, S. H., Ma, Y. G., Wang, H. L., Li, L., Huang, C., Xu, W., Worsnop, D. R., Goldstein, A. H., and Yu, J. Z.: Hourly measurements of organic molecular markers in urban Shanghai, China: Observation of enhanced formation of secondary organic aerosol during particulate matter episodic periods, Atmos. Environ., 240, 117807, https://doi.org/10.1016/j.atmosenv.2020.117807, 2020.
Ho, K. F., Ho, S. S. H., Huang, R. J., Chuang, H. C., Cao, J. J., Han, Y. M., Lui, K. H., Ning, Z., Chuang, K. J., Cheng, T. J., Lee, S. C., Hu, D., Wang, B., and Zhang, R. J.: Chemical composition and bioreactivity of PM2.5 during 2013 haze events in China, Atmos. Environ., 126, 162–170, 2016.
Huang, D. D., Zhu, S. H., An, J. Y., Wang, Q. Q., Qiao, L. P., Zhou, M., He, X., Ma, Y. G., Sun, Y. L., Huang, C., Yu, J. Z., and Zhang, Q.: Comparative Assessment of Cooking Emission Contributions to Urban Organic Aerosol Using Online Molecular Tracers and Aerosol Mass Spectrometry Measurements, Environ. Sci. Technol., 55, 14526–14535, 2021a.
Huang, W., Yang, Y., Wang, Y. H., Gao, W. K., Li, H. Y., Zhang, Y. Y., Li, J. Y., Zhao, S. M., Yan, Y. C., Ji, D. S., Tang, G. Q., Liu, Z. R., Wang, L. L., Zhang, R. J., and Wang, Y. S.: Exploring the inorganic and organic nitrate aerosol formation regimes at a suburban site on the North China Plain, Sci. Total Environ., 768, 144538, https://doi.org/10.1016/j.scitotenv.2020.144538, 2021b.
Jickells, T., Baker, A. R., Cape, J. N., Cornell, S. E., and Nemitz, E.: The cycling of organic nitrogen through the atmosphere, Philos. T. R. Soc. Lond. B, 368, 20130115, https://doi.org/10.1098/rstb.2013.0115, 2013.
Kielland, K., Mcfarland, J. W., and Olson, K.: Amino acid uptake in deciduous and coniferous taiga ecosystems, Plant Soil, 288, 297–307, 2006.
Laskin, A., Laskin, J., and Nizkorodov, S. A.: Chemistry of Atmospheric Brown Carbon, Chem. Rev., 115, 4335–4382, 2015.
Li, R., Wang, X. F., Gu, R. R., Lu, C. Y., Zhu, F. P., Xue, L. K., Xie, H. J., Du, L., Chen, J. M., and Wang, W. X.: Identification and semi-quantification of biogenic organic nitrates in ambient particulate matters by UHPLC/ESI-MS, Atmos. Environ., 176, 140–147, 2018.
Li, Y. M., Fu, T. M., Yu, J. Z., Yu, X., Chen, Q., Miao, R. Q., Zhou, Y., Zhang, A. X., Ye, J. H., Yang, X., Tao, S., Liu, H. B., and Yao, W. Q.: Dissecting the contributions of organic nitrogen aerosols to global atmospheric nitrogen deposition and implications for ecosystems, Natl. Sci. Rev., 10, nwad244, https://doi.org/10.1093/nsr/nwad244, 2023.
Li, Z., Nizkorodov, S. A., Chen, H., Lu, X., Yang, X., and Chen, J.: Nitrogen-containing secondary organic aerosol formation by acrolein reaction with ammonia/ammonium, Atmos. Chem. Phys., 19, 1343–1356, https://doi.org/10.5194/acp-19-1343-2019, 2019.
Lian, X. F., Zhang, G. H., Yang, Y. X., Lin, Q. H., Fu, Y. Z., Jiang, F., Peng, L., Hu, X. D., Chen, D. H., Wang, X. M., Peng, P. A., Sheng, G. Y., and Bi, X. H.: Evidence for the Formation of Imidazole from Carbonyls and Reduced Nitrogen Species at the Individual Particle Level in the Ambient Atmosphere, Environ. Sci. Technol. Lett., 8, 9–15, 2021.
Lim, Y. B., Kim, H., Kim, J. Y., and Turpin, B. J.: Photochemical organonitrate formation in wet aerosols, Atmos. Chem. Phys., 16, 12631–12647, https://doi.org/10.5194/acp-16-12631-2016, 2016.
Liu, F. X., Bi, X. H., Zhang, G. H., Lian, X. F., Fu, Y. Z., Yang, Y. X., Lin, Q. H., Jiang, F., Wang, X. M., Peng, P. A., and Sheng, G. Y.: Gas-to-particle partitioning of atmospheric amines observed at a mountain site in southern China, Atmos. Environ., 195, 1–11, 2018a.
Liu, T. Y., Wang, Z., Huang, D. D., Wang, X. M., and Chan, C. K.: Significant Production of Secondary Organic Aerosol from Emissions of Heated Cooking Oils, Environ. Sci. Technol. Lett., 5, 32–37, 2018b.
Liu, X. D., Wang, H. Y., Wang, F. L., Lv, S. J., Wu, C., Zhao, Y., Zhang, S., Liu, S. J., Xu, X. B., Lei, Y. L., and Wang, G. H.: Secondary Formation of Atmospheric Brown Carbon in China Haze: Implication for an Enhancing Role of Ammonia, Environ. Sci. Technol., 57, 11163–11172, 2023.
Mace, K. A., Artaxo, P., and Duce, R. A.: Water-soluble organic nitrogen in Amazon Basin aerosols during the dry (biomass burning) and wet seasons, J. Geophys. Res., 108, 4512, https://doi.org/10.1029/2003JD003557, 2003.
Matsumoto, K., Sakata, K., and Watanabe, Y.: Water-soluble and water-insoluble organic nitrogen in the dry and wet deposition, Atmos. Environ., 218, 117022, https://doi.org/10.1016/j.atmosenv.2019.117022, 2019.
Miller-Schulze, J. P., Paulsen, M., Toriba, A., Tang, N., Hayakawa, K., Tamura, K., Dong, L. J., Zhang, X. M., and Simpson, C. D.: Exposures to Particulate Air Pollution and Nitro-Polycyclic Aromatic Hydrocarbons among Taxi Drivers in Shenyang, China, Environ. Sci. Technol., 44, 216–221, 2010.
Miyazaki, Y., Kawamura, K., Jung, J., Furutani, H., and Uematsu, M.: Latitudinal distributions of organic nitrogen and organic carbon in marine aerosols over the western North Pacific, Atmos. Chem. Phys., 11, 3037–3049, https://doi.org/10.5194/acp-11-3037-2011, 2011.
Nakamura, T., Ogawa, H., Maripi, D. K., and Uematsu, M.: Contribution of water soluble organic nitrogen to total nitrogen in marine aerosols over the East China Sea and western North Pacific, Atmos. Environ., 40, 7259–7264, 2006.
Noziere, B., Dziedzic, P., and Cordova, A.: Products and kinetics of the liquid-phase reaction of glyoxal catalyzed by ammonium ions (NH), J. Phys. Chem. A, 113, 231–237, 2009.
Pavuluri, C. M., Kawamura, K., and Fu, P. Q.: Atmospheric chemistry of nitrogenous aerosols in northeastern Asia: biological sources and secondary formation, Atmos. Chem. Phys., 15, 9883–9896, 2015.
Perring, A. E., Pusede, S. E., and Cohen, R. C.: An observational perspective on the atmospheric impacts of alkyl and multifunctional nitrates on ozone and secondary organic aerosol, Chem. Rev., 113, 5848–5870, 2013.
Qiao, L. P., Cai, J., Wang, H. L., Wang, W. B., Zhou, M., Lou, S. R., Chen, R. J., Dai, H. X., Chen, C. H., and Kan, H. D.: PM2.5 constituents and hospital emergency-room visits in Shanghai, China, Environ. Sci. Technol., 48, 10406–10414, 2014.
Qiu, C., Wang, L., Lal, V., Khalizov, A. F., and Zhang, R. Y.: Heterogeneous Reactions of Alkylamines with Ammonium Sulfate and Ammonium Bisulfate, Environ. Sci. Technol., 45, 4748–4755, 2011.
Ren, L. J., Bai, H. H., Yu, X., Wu, F. C., Yue, S. Y., Ren, H., Li, L. J., Lai, S. C., Sun, Y. L., Wang, Z. F., and Fu, P. Q.: Molecular composition and seasonal variation of amino acids in urban aerosols from Beijing, China, Atmos. Res., 203, 28–35, 2018.
Rizwan Khan, M., Naushad, M., and Abdullah Alothman, Z.: Presence of heterocyclic amine carcinogens in home-cooked and fast-food camel meat burgers commonly consumed in Saudi Arabia, Sci. Rep., 7, 1707, https://doi.org/10.1038/s41598-017-01968-x, 2017.
Rollins, A. W., Browne, E. C., Min, K. E., Pusede, S. E., Wooldridge, P. J., Gentner, D. R., Goldstein, A. H., Liu, S., Day, D. A., Russell, L. M., and Cohen, R. C.: Evidence for NOx Control over Nighttime SOA Formation, Science, 337, 1210–1212, 2012.
Samy, S. and Hays, M. D.: Quantitative LC-MS for water-soluble heterocyclic amines in fine aerosols (PM2.5) at Duke Forest, USA, Atmos. Environ., 72, 77–80, 2013.
Schlag, P., Rubach, F., Mentel, T. F., Reimer, D., Canonaco, F., Henzing, J. S., Moerman, M., Otjes, R., Prevot, A. S. H., Rohrer, F., Rosati, B., Tillmann, R., Weingartner, E., and Kiendler-Scharr, A.: Ambient and laboratory observations of organic ammonium salts in PM1, Faraday Discuss., 200, 331–351, 2017.
Violaki, K. and Mihalopoulos, N.: Water-soluble organic nitrogen (WSON) in size-segregated atmospheric particles over the Eastern Mediterranean, Atmos. Environ., 44, 4339–4345, 2010.
Violaki, K. and Mihalopoulos, N.: Urea: An important piece of Water Soluble Organic Nitrogen (WSON) over the Eastern Mediterranean, Sci. Total Environ., 409, 4796–4801, 2011.
Wang, Q. Q. and Yu, J. Z.: Ambient Measurements of Heterogeneous Ozone Oxidation Rates of Oleic, Elaidic, and Linoleic Acid Using a Relative Rate Constant Approach in an Urban Environment, Geophys. Res. Lett., 48, e2021GL095130, https://doi.org/10.1029/2021GL095130, 2021.
Wang, Q. Q., Huang, X. H. H., Zhang, T., Zhang, Q. Y., Feng, Y. M., Yuan, Z. B., Wu, D., Lau, A. K. H., and Yu, J. Z.: Organic tracer-based source analysis of PM2.5 organic and elemental carbon: A case study at Dongguan in the Pearl River Delta, China, Atmos. Environ., 118, 164–175, 2015.
Wang, Q. Q., Qiao, L. P., Zhou, M., Zhu, S. H., Griffith, S., Li, L., and Yu, J. Z.: Source apportionment of PM2.5 using hourly measurements of elemental tracers and major constituents in an urban environment: Investigation of time-resolution influence, J. Geophys. Res.-Atmos., 123, 5284–5300, 2018.
Wei, S. L., Huang, B., Liu, M., Bi, X. H., Ren, Z. F., Sheng, G. Y., and Fu, J. M.: Characterization of PM2.5-bound nitrated and oxygenated PAHs in two industrial sites of South China, Atmos. Res., 109/110, 76–83, 2012.
Williams, B. J., Goldstein, A. H., Kreisberg, N. M., and Hering, S. V.: An in-situ instrument for speciated organic composition of atmospheric aerosols: thermal Desorption Aerosol GC/MS-FID (TAG), Aerosol Sci. Technol., 40, 627–638, 2006.
Xie, M., Chen, X., Hays, M. D., Lewandowski, M., Offenberg, J., Kleindienst, T. E., and Holder, A. L.: Light absorption of secondary organic aerosol: composition and contribution of nitroaromatic compounds, Environ. Sci. Technol., 51, 11607–11616, 2017.
Xu, W., Takeuchi, M., Chen, C., Qiu, Y., Xie, C., Xu, W., Ma, N., Worsnop, D. R., Ng, N. L., and Sun, Y.: Estimation of particulate organic nitrates from thermodenuder–aerosol mass spectrometer measurements in the North China Plain, Atmos. Meas. Tech., 14, 3693–3705, https://doi.org/10.5194/amt-14-3693-2021, 2021.
Xu, Y., Miyazaki, Y., Tachibana, E., Sato, K., Ramasamy, S., Mochizuki, T., Sadanaga, Y., Nakashima, Y., Sakamoto, Y., Matsuda, K., and Kajii, Y.: Aerosol Liquid Water Promotes the Formation of Water-Soluble Organic Nitrogen in Submicrometer Aerosols in a Suburban Forest, Environ. Sci. Technol., 54, 1406–1414, 2020.
Yao, L., Garmash, O., Bianchi, F., Zheng, J., Yan, C., Kontkanen, J., Junninen, H., Mazon, S. B., Ehn, M., Paasonen, P., Sipila, M., Wang, M. Y., Wang, X. K., Xiao, S., Chen, H. F., Lu, Y. Q., Zhang, B. W., Wang, D. F., Fu, Q. Y., Geng, F. H., Li, L., Wang, H. L., Qiao, L. P., Yang, X., Chen, J. M., Kerminen, V., Petäjä, T., Worsnop, D. R., Kulmala, M., and Wang, L.: Atmospheric new particle formation from sulfuric acid and amines in a Chinese megacity, Science, 361, 278–281, 2018.
Yu, X., Yu, Q. Q., Zhu, M., Tang, M. J., Li, S., Yang, W. Q., Zhang, Y. L., Deng, W., Li, G. H., Yu, Y. G., Huang, Z. H., Song, W., Ding, X., Hu, Q. H., Li, J., Bi, X. H., and Wang, X. M.: Water Soluble Organic Nitrogen (WSON) in Ambient Fine Particles Over a Megacity in South China: Spatiotemporal Variations and Source Apportionment, J. Geophys. Res.-Atmos., 122, 13045–13060, 2017.
Yu, X., Li, Q. F., Ge, Y., Li, Y. M., Liao, K. Z., Huang, X. H. H., Li, J. J., and Yu, J. Z.: Simultaneous Determination of Aerosol Inorganic and Organic Nitrogen by Thermal Evolution and Chemiluminescence Detection, Environ. Sci. Technol., 55, 11579–11589, 2021.
Yu, X., Zhou, M., Li, J. J., Qiao, L. P., Lou, S. R., Han, W. Y., Zhang, Z. J., Huang, C., and Yu, J. Z.: First Online Observation of Aerosol Total Organic Nitrogen at an Urban Site: Insights Into the Emission Sources and Formation Pathways of Nitrogenous Organic Aerosols, J. Geophys. Res.-Atmos., 128, e2023JD038921, https://doi.org/10.1029/2023JD038921, 2023.
Yu, X., Li, Q. F., Liao, K. Z., Li, Y. M., Wang, X. M., Zhou, Y., Liang, Y. M., and Yu, J. Z.: New measurements reveal a large contribution of nitrogenous molecules to ambient organic aerosol, npj Clim. Atmos. Sci., 7, 72, https://doi.org/10.1038/s41612-024-00620-6, 2024.
Zhang, G., Lian, X., Fu, Y., Lin, Q., Li, L., Song, W., Wang, Z., Tang, M., Chen, D., Bi, X., Wang, X., and Sheng, G.: High secondary formation of nitrogen-containing organics (NOCs) and its possible link to oxidized organics and ammonium, Atmos. Chem. Phys., 20, 1469–1481, https://doi.org/10.5194/acp-20-1469-2020, 2020.
Zhang, J., Wang, X. F., Li, R., Dong, S. W., Chen, J., Zhang, Y. N., Zheng, P. G., Li, M., Chen, T. S., Liu, Y. H., Xue, L. K., Zhou, X. H., Du, L., Zhang, Q. Z., and Wang, W. X.: Significant impacts of anthropogenic activities on monoterpene and oleic acid-derived particulate organic nitrates in the North China Plain, Atmos. Res., 256, 105585, https://doi.org/10.1016/j.atmosres.2021.105585, 2021.
Zhang, Q., Anastasio, C., and Jimenez-Cruz, M.: Water-soluble organic nitrogen in atmospheric fine particles (PM2.5) from northern California, J. Geophys. Res., 107, D114112, https://doi.org/10.1029/2001JD000870, 2002.
Zhang, Q. Y., Ma, H. M., Li, J., Jiang, H. X., Chen, W. J., Wan, C., Jiang, B., Dong, G. H., Zeng, X. W., Chen, D. H., Lu, S. Y., You, J., Yu, Z. Q., Wang, X. M., and Zhang, G.: Nitroaromatic Compounds from Secondary Nitrate Formation and Biomass Burning Are Major Proinflammatory Components in Organic Aerosols in Guangzhou: A Bioassay Combining High-Resolution Mass Spectrometry Analysis, Environ. Sci. Technol., 57, 21570–21580, 2023.
Zhao, Z. J., Husainy, S., Stoudemayer, C. T., and Smith, G. D.: Reactive uptake of NO3 radicals by unsaturated fatty acid particles, Phys. Chem. Chem. Phys., 13, 17809–17817, 2011.
Zhou, M., Nie, W., Qiao, L. P., Huang, D. D., Zhu, S. H., Lou, S. R., Wang, H. L., Wang, Q., Tao S. K., Sun, P., Liu, Y. W., Xu, Z., An, J. Y., Yan, R. S., Huang, C., Ding, A. J., and Chen, C. H.: Elevated Formation of Particulate Nitrate From N2O5 Hydrolysis in the Yangtze River Delta Region From 2011 to 2019, Geophys. Res. Lett., 49, e2021GL097393, https://doi.org/10.1029/2021GL097393, 2022.
Zhu, S. H., Wang, Q. Q., Qiao, L. P., Zhou, M., Wang, S., Lou, S. R., Huang, D. D., Wang, Q., Jing, S. G., Wang, H. L., Chen, C. H., Huang, C., and Yu, J. Z.: Tracer-based Characterization of Source Variations of PM2.5 and Organic Carbon in Shanghai Influenced by the COVID-19 Lockdown, Faraday Discuss., 226, 112–137, 2021.