the Creative Commons Attribution 4.0 License.
the Creative Commons Attribution 4.0 License.
 | 14 Aug 2025
Ice crystal complexity leads to weaker ice cloud radiative heating in idealized single-column simulations
Edgardo I. Sepulveda Araya
Aiko Voigt
Ice clouds play an important role in the atmospheric radiation budget, both by reflecting shortwave radiation and by absorbing or emitting longwave radiation. These effects can modulate the cloud radiative heating (CRH) rate, which in turn influences circulation and precipitation. Ice cloud radiative properties depend on the size, shape (or habit), and complexity, including surface roughness or hollowness, of in-cloud ice crystals. To better predict ice cloud radiative effects, there has been a continuous effort to account for more ice crystal habits and complexity in current radiative transfer calculations. Here, we conduct a series of idealized single-column radiative transfer calculations to study how ice CRH responds to including ice crystal complexity. We evaluate four ice optical schemes for a range of ice cloud formation temperatures or altitudes, geometrical depths, ice water paths (IWPs), and ice crystal effective radii. In addition, we present a heating rate sensitivity matrix as a condensed visualization of the CRH response across a broad parameter space. We find that including ice complexity in cold thin clouds with high IWPs can diminish the net in-cloud heating and cloud-top cooling by 2.5 and 15 K d−1, respectively. Furthermore, while temperature-based schemes behave similarly to other schemes at warmer temperatures, they predict net CRH at the cloud bottom more than 10 K d−1 higher than size-dependent schemes at the coldest temperatures. Either weakening of CRH by ice complexity or strengthening by temperature-dependent schemes can alter anvil cloud lifetime and evolution, as well as large-scale atmospheric circulation.
- Article
(4433 KB) - Full-text XML
-
Supplement
(2318 KB) - BibTeX
- EndNote


Clouds have a strong influence on Earth's radiative balance, due to their ability to either scatter or absorb the shortwave radiation (SW) coming from the sun and the longwave radiation (LW) coming from the Earth's surface. The resulting radiation balance, not only at the top of the atmosphere (TOA) or the Earth's surface, but also within the atmosphere, determines temperature, pressure gradients, and static stability in the atmosphere and thus affects circulation and precipitation patterns (Voigt et al., 2021; Medeiros et al., 2021; Lin and Mapes, 2004).
Both SW and LW cloud radiative effects (CREs), defined as the difference between all-sky and clear-sky net radiative fluxes (downward minus upward) are most commonly used to quantify the radiative impact of clouds. While many studies have evaluated TOA or surface CRE, less attention has been paid to the vertical distribution of radiative flux divergences in the atmosphere (Luo et al., 2023; Mace and Wrenn, 2013; Yang et al., 2012; Yan et al., 2016). This greater attention to TOA or surface CRE is due in part to more abundant satellite and ground-based measurements for validation; relatively few observational datasets exist for in-atmosphere radiative fluxes (Dolinar et al., 2019; Cesana et al., 2019; Kang et al., 2020). Here, we define the cloud radiative heating rate (CRH) as follows:
where g0 is gravitational acceleration and CP is the specific heat capacity of dry air at constant pressure. In this case, the CRE is evaluated for each atmospheric layer with pressure difference dP.
There are a number of motivations to study CRH besides the CRE. CRH is not close to zero for ice clouds, as the TOA CRE is (Hartmann, 2016). CRH is more directly linked to large-scale circulation, stability, and precipitation, for example through the temperature gradient caused by in-cloud heating and cloud-top cooling in ice clouds (Haslehner et al., 2024; Mather et al., 2007; Tao et al., 1996). A growing body of work highlights the variety of ways in which in-cloud radiative interactions influence circulation features from the jet stream and extratropical baroclinicity to the North Atlantic Oscillation and El Niño–Southern Oscillation (Cesana et al., 2019; Albern et al., 2019, 2021; Li et al., 2015; Papavasileiou et al., 2020; Rädel et al., 2016). At more local scales, these interactions also determine tropical and extratropical cyclone development (Schäfer and Voigt, 2018; Muller and Romps, 2018; Yang and Tan, 2020; Keshtgar et al., 2023; Voigt et al., 2023). Uncertainties in cloud–radiation interactions also propagate to uncertainties in the equilibrium climate sensitivity (Forster et al., 2021; Jahangir et al., 2021; Satoh et al., 2018). Finally, CRH profiles will change under global warming, through shifts in the latitudinal gradient in surface shortwave heating, in the tropopause layer longwave heating, and according to the proportionally higher anvil temperature hypothesis (Voigt et al., 2021; Sokol et al., 2024; Zelinka and Hartmann, 2010).
Ice cloud radiative impacts are particularly difficult to constrain because of ice crystal non-sphericity, non-constant densities, and uncertainties in ice formation processes. In situ data have also revealed that various forms of ice crystal complexity – including surface roughness, aerosol or gas inclusions, and microfacets – are pervasive in atmospheric ice crystals (Schnaiter et al., 2016; Magee et al., 2014; Järvinen et al., 2023). Including a more realistic description of ice crystal complexity and habits in atmospheric simulations affects radiative fluxes, by, for example, inducing SW cooling at the TOA (Järvinen et al., 2018) and decreasing land surface temperature (Yi, 2022).
The majority of global climate models (GCMs) and numerical weather prediction (NWP) models make simplifying assumptions, including spherical ice crystals, in their ice optical schemes. However, other more sophisticated optical schemes have been developed on the basis of either field campaign data or optical particle models. Each of these schemes specifies spectrally resolved cloud optical properties, including the extinction coefficient βe, the single-scattering albedo ω0 (SSA), and the asymmetry parameter g as a function of ice crystal effective radius. Different ice optical schemes may employ field campaign data for which measured sizes and habits are quite different, or they may employ optical particle models with a wide range of size and habit assumptions. Ice optical properties and radiative outputs can therefore vary widely from one scheme to the next. The Fu scheme was one of the earliest of these schemes (Fu, 1996; Fu et al., 1998) and is now widely used (Hogan and Bozzo, 2018; Emde et al., 2016; Morcrette et al., 2008), although it assumes that all ice crystals are hexagonal columns. New attempts to include ice crystal complexity are being proposed, for example taking into account ice crystal surface roughness, which can increase the global SW CRE by 2 W m−2 at TOA (Yi et al., 2013).
Previous work has shown how different ice cloud microphysical schemes and processes in storm-resolving models can strongly alter the CRH profile (Sullivan and Voigt, 2021; Sullivan et al., 2022, 2023). The influence of ice cloud processes – and associated uncertainty – on CRH can also vary across global scale climate models (Voigt et al., 2024). Some studies have also looked at the effect of ice optical schemes. For example, Zhao et al. (2018) showed how the use of different optical schemes resulted in CRH differences of 0.2 K d−1 near the tropical tropopause. Keshtgar et al. (2024) also identify ice optical schemes as a primary source of uncertainty in potential vorticity generation as extratropical cyclones develop.
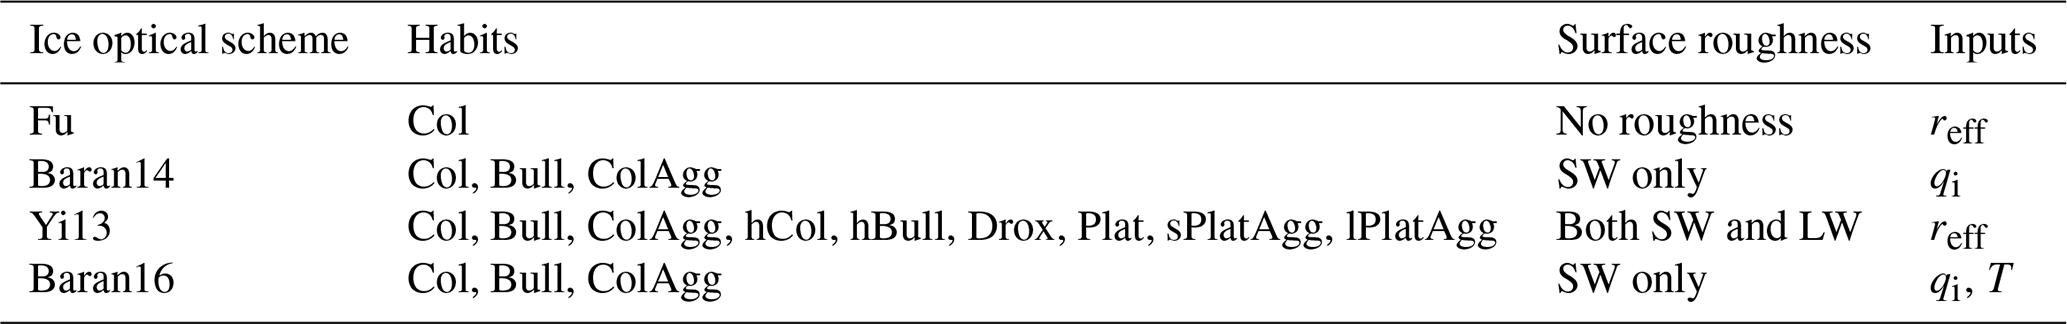
We build upon these results here to understand how ice crystal habits and complexity in different optical schemes can impact simulated CRH. In particular, we run four tests using offline single-column radiative transfer calculations and a variety of idealized input ice cloud profiles. These four tests focus on (1) cloud temperature, (2) cloud geometrical depth, (3) ice water path (IWP), and (4) ice crystal effective radius. They also employ four optical schemes of varying sophistication: the Fu scheme, which assumes hexagonal crystals (Fu96 for SW and Fu98 for LW; Fu, 1996; Fu et al., 1998); the Yi13 scheme, which assumes an array of habits and prescribes surface roughness (Yi et al., 2013); Baran14, which assumes an array of aggregates (Baran et al., 2014b); and Baran16, which assumes an array of aggregates as well as temperature dependence (Baran et al., 2016). Both Baran's schemes prescribe surface roughness influence in the SW component. These schemes are described in more detail in Sect. 2.1. We begin by outlining our model setup and inputs in Sect. 2.2. We then present an inter-scheme comparison for each experiment in Sect. 3, and a discussion and analysis of these results in Sect. 4.
2.1 ecRad radiative transfer scheme and optical schemes
We use the ecRad radiative transfer model (RTM) of Hogan and Bozzo (2018), version 1.5.0, which is the current operational radiation scheme in the European Centre for Medium-Range Weather Forecasts (ECMWF) Integrated Forecasting System and in the German Weather Service (Deutscher Wetterdienst, DWD) ICON model. ecRad is a two-stream RTM using the same 14 SW and 16 LW spectral bands as the Rapid Radiative Transfer Model (RRTM). We use the Triplecloud solver to avoid stochastic noise in heating rates, a common problem in Monte Carlo radiative transfer solvers. Output files from ecRad contain upward and downward fluxes at each vertical level, for both SW and LW components, and clear- and all-sky conditions, allowing the calculation of heating rates according to Eq. (1). The range of settings and parameters within ecRad makes it a highly modular RTM.
ecRad includes four ice optical scheme options that take the ice mass mixing ratio, effective radius, and temperature as inputs. These optical schemes parameterize the mass extinction coefficient Kext, single-scattering albedo ω0, and asymmetry parameter g as a function of the inputs mentioned previously. The mass extinction coefficient Kext is the sum of the mass absorption coefficient Kabs and the mass scattering coefficient Ksca. Kabs is computed as the product of Kext and the co-albedo, or the ratio amount of absorbed to total attenuated radiation (1 − ω0), thus quantifying how much radiation is absorbed and how much is scattered through an ice cloud. Finally, g quantifies the amount of forward- versus backward-scattered radiation by ice crystals.
The default scheme is the Fu scheme, which includes two parameterizations for the SW and LW components as functions of the ice crystal effective radius (Fu, 1996; Fu et al., 1998). The Fu scheme was developed using ray-tracing calculations for the SW component and Mie scattering theory for the LW component and assumes an ensemble of hexagonal ice crystals with sizes based on airborne measurements. Next, the Yi13 scheme evaluates optical properties as a function of the ice crystal effective radius, based on a general mixture scheme of nine ice crystal habits (four different geometries plus two including hollowness and three types of aggregate), together with surface roughness (Yi et al., 2013; Yang et al., 2013; Baum et al., 2011). The inter-scheme difference in the optical properties between Yi13 and Fu is shown in Fig. 1. is 18 % smaller in Yi13 than Fu for the effective radius tested in most of our simulations (30 µm, as described in Sect. 2.2), as a result of smaller and larger . In other words, the differences in optical properties result in weaker absorption in the Yi13 scheme. The dependence of optical properties on the effective radius for each scheme is shown in Figs. S1 and S2 of the Supplement for both SW and LW, respectively.
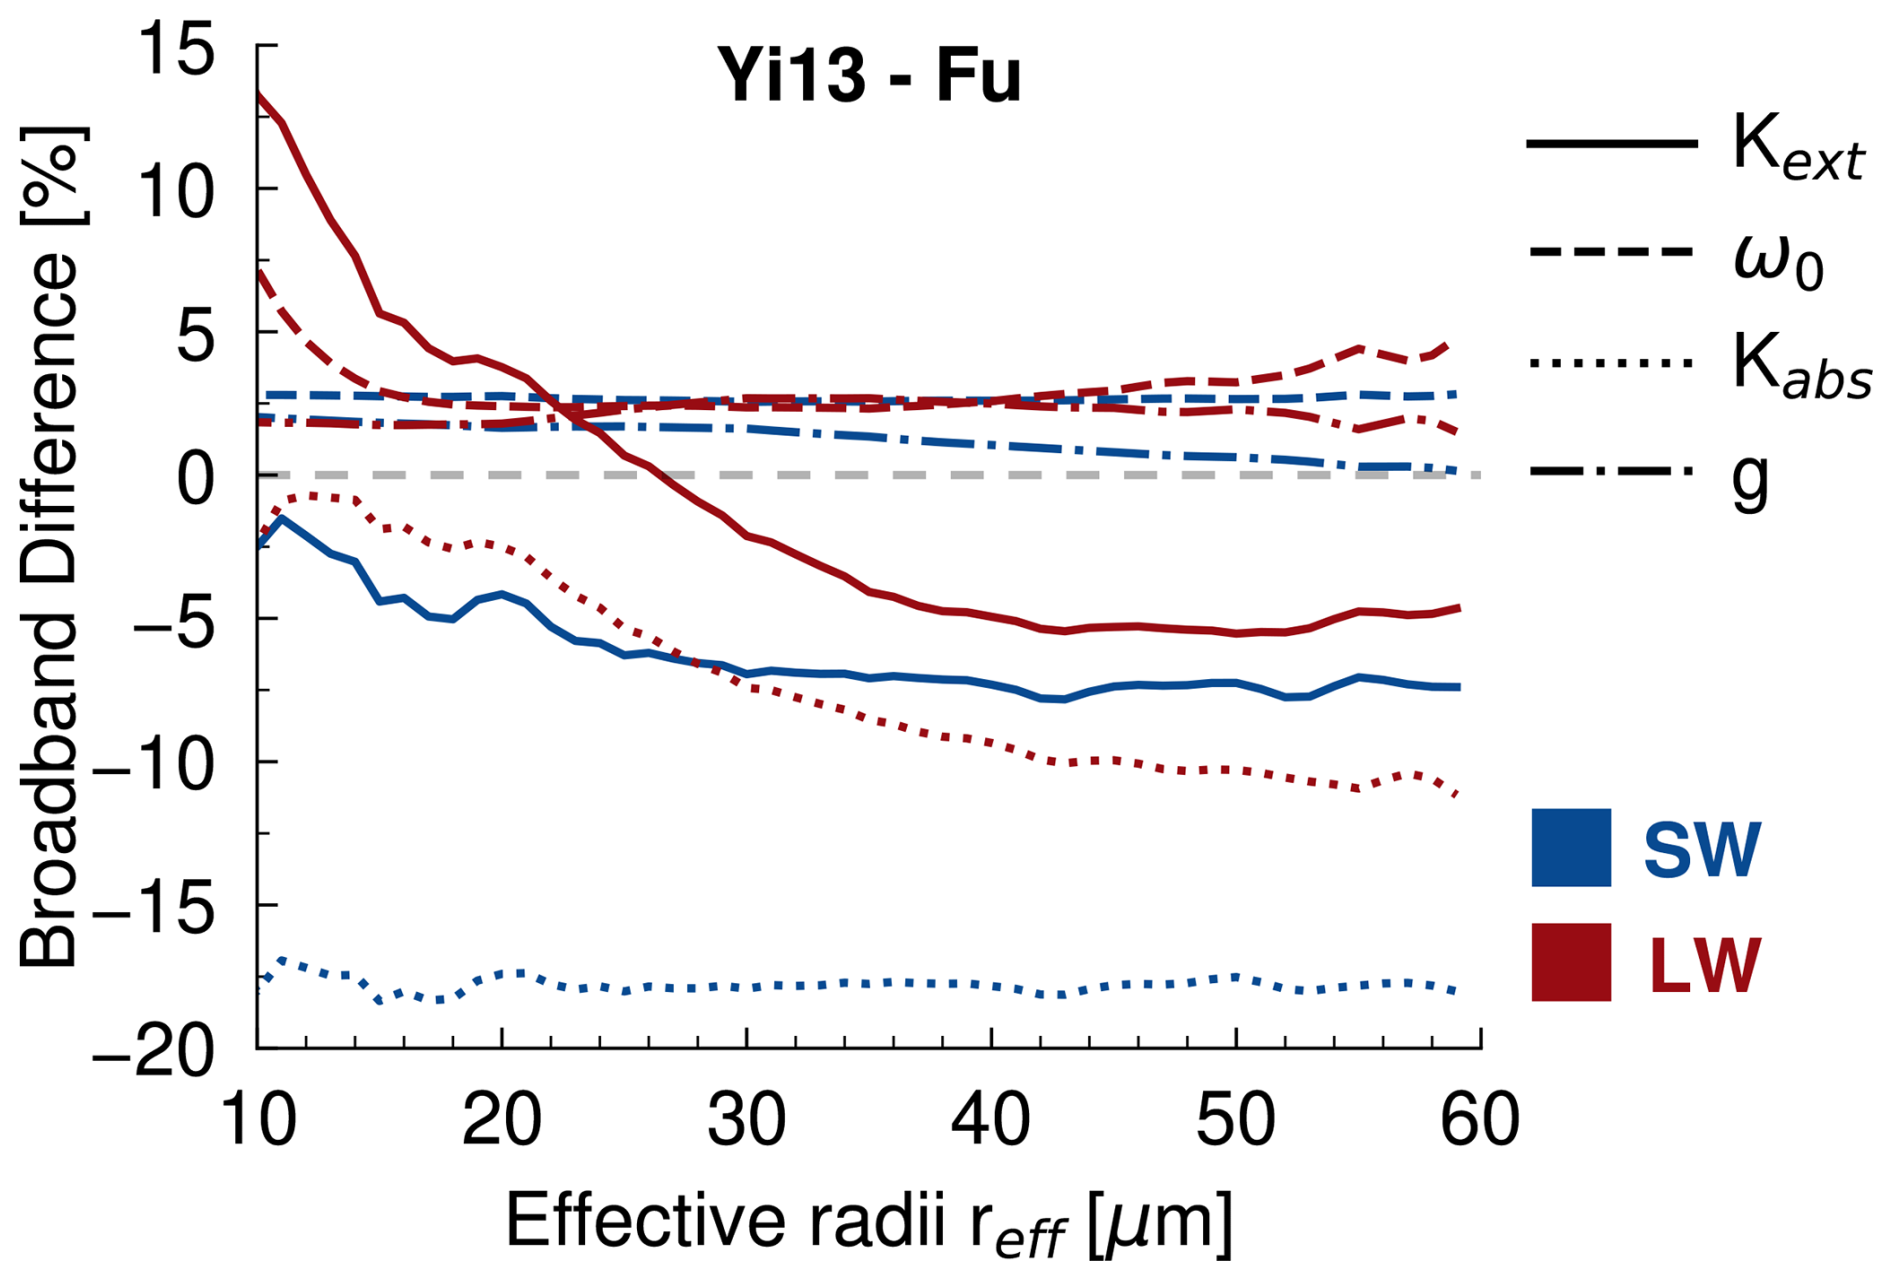
Figure 1Broadband relative difference of mass extinction coefficient Kext (solid lines), single-scattering albedo ω0 (dashed lines), mass absorption coefficient Kabs (dotted line), and asymmetry parameter g (dotted-dashed lines), between Yi13 and Fu optical parameterization, as a function of ice crystal effective radius reff. The radiative components SW and LW are shown in blue and red, respectively. Spectrally resolved and absolute values for each scheme are shown in Figs. S1 and S2.
Finally, the Baran schemes use an ensemble of ice columns, bullet rosettes, and column aggregates (Baran et al., 2014b, 2016; Baran and Labonnote, 2007; Baran et al., 2014a), as a function of ice mass mixing ratio. Surface roughness is included in the SW parameterization. The bulk optical properties are computed for a habit ensemble instead of a particle size distribution. The size of the crystals is represented indirectly through ice complexity, where single columns and bullet rosettes are the smaller crystals, and higher aggregate levels of hexagonal columns are the bigger crystals in the ensemble. In order to correct a temperature and relative humidity bias at the tropical tropopause layer (TTL) from the 2014 scheme when it was used in the U.K. Met Office model, Baran et al. (2016) updated the scheme to include temperature dependence in optical properties. While Baran14 is implemented as an experimental parameterization in ecRad, we include tests with this scheme to study the effect of this temperature dependence. These four schemes constitute a hierarchy, with Fu as the simplest scheme, followed by Baran14, Yi13, and finally Baran16 (see Table 1).
Table 1Main characteristics of each ice optical scheme. Habits include solid hexagonal columns (Col), bullet rosettes (Bull), solid column aggregates (ColAgg), hollow columns (hCol), hollow bullet rosettes (hBull), droxtals (Drox), plates (Plat), and small and large plate aggregates (sPlatAgg, lPlatAgg). reff is the effective radius parameter, qi is the ice mass mixing ratio, and T is temperature. Baran14 has been kept as an experimental, but not officially implemented, scheme in ecRad.
2.2 Input parameters
Climatological profiles of tropical pressure, temperature, and specific humidity are used as inputs to ecRad, along with a skin temperature of 300 K, applicable to tropical oceans (Luo and Minnett, 2020), a SW surface albedo of 0.05 (Hartmann and Berry, 2017), a LW surface emissivity of 0.97, and an effective solar zenith angle (SZA) of θ = 53° (the cosine of SZA, μ, is 0.6). A cloud fraction of 1 is used when the ice cloud layer is present. Climatological values for O2, CO2, CH4, and N2O mass mixing ratios are used. No cloud liquid water or aerosols are included.
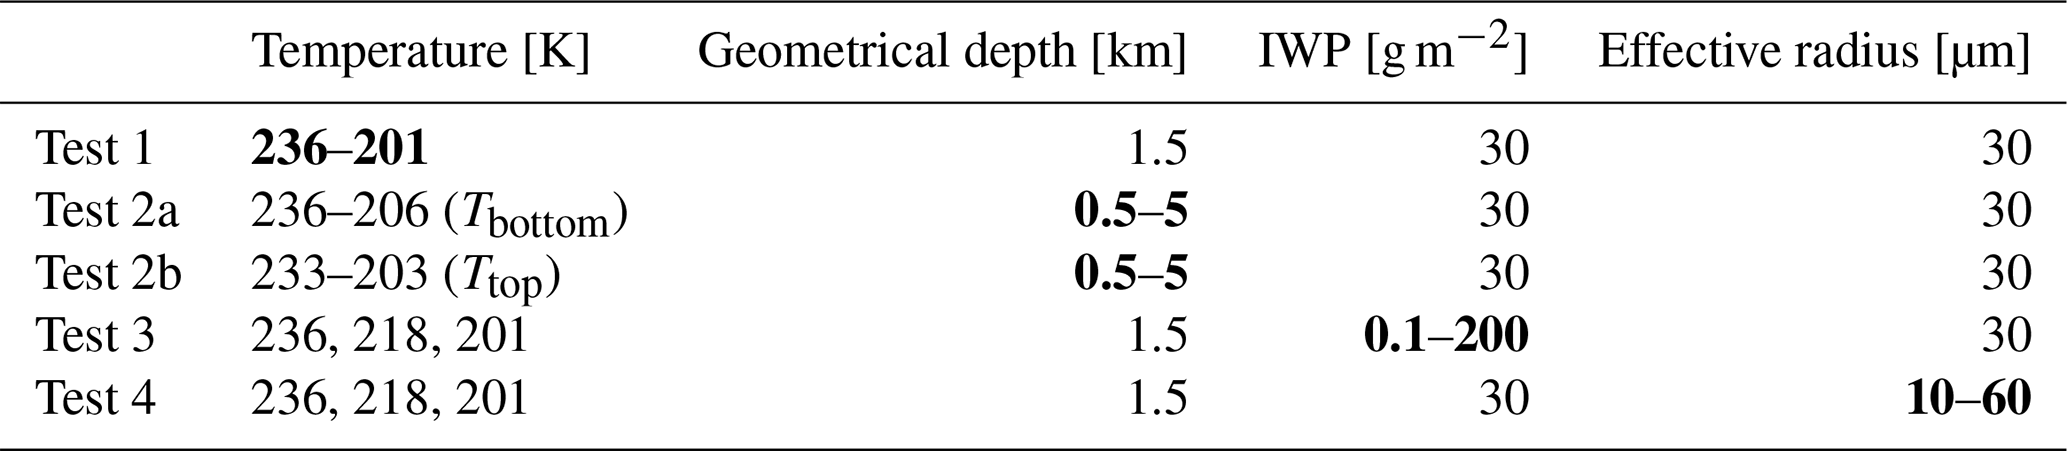
Five series of single-column ice cloud atmospheric profiles are input to ecRad (Table 2). The first set of simulations (Test 1) tests how CRH changes for cloud layers at varying altitudes and corresponding tropical temperatures from 10 km (236 K) up to 15.5 km (201 K). For this test, we fix the cloud depth at 1.5 km and effective radius at 30 µm, following previous simulations (Hartmann and Berry, 2017; van Diedenhoven et al., 2014). The second set of simulations models geometrical depth variations from 0.5 km up to 5 km, by fixing cloud-top temperature at 203 K (Test 2a) and cloud-bottom temperature at 237 K (Test 2b). The geometrical depth range follows similar values found by Sokol and Hartmann (2020). The third set of simulations increases IWP from 0.01 up to 200 g m−2. These numbers follow realistic values for anvil clouds (Houze, 2014; Lawson et al., 2006, 2010; Sokol et al., 2024). Finally, Test 4 alters ice crystal effective radii in the Fu and Yi schemes. The Baran schemes have no direct dependence on ice crystal effective radius and are not included in this test. Additionally, Test 3 and Test 4 evaluate the IWP and effective radius sensitivities at three different cloud altitudes/temperatures. A summary of the inputs used here is shown in Table 2.
Table 2Variable input parameters and settings used in the idealized single-column simulations and ecRad. The temperature values shown in the second column correspond to mid-cloud temperature, except in Test 2a and Test 2b, where the numbers indicate cloud-bottom and cloud-top temperature ranges, respectively. Values in bold indicate the range for the main variable under study in each test.
Profiles of ice mass mixing ratio qi are computed by fixing the IWP and calculating the uniform value of qi over the ice cloud depth that would generate that IWP (Figs. S3–S5). A fixed IWP of 30 g m−2 is used in Tests 1, 2, and 4. The IWP depends on qi, air density ρa, and cloud thickness:
where qiρa is the ice water content (IWC). qi spans an order of magnitude in our tests – from less than 0.01 to ∼0.6 g kg−1.
3.1 How does cloud temperature influence CRH?
The effect of cloud temperature, or equivalently altitude, on CRH can be seen, from Test 1, in the matrix visualizations of Fig. 2. These calculations use the Fu scheme, a fixed geometrical cloud depth of 1.5 km, IWP of 30 g m−2, and ice crystal effective radius of 30 µm. The x axis of each panel in Fig. 2 is the temperature of ice cloud formation, the y axis is the corresponding altitude of the cloud layer, and the color of each “pixel” in the matrix is the CRH, with red indicating heating and blue cooling. Each column in the matrix visualization is the vertical distribution of CRH obtained from one idealized single-column simulation run.
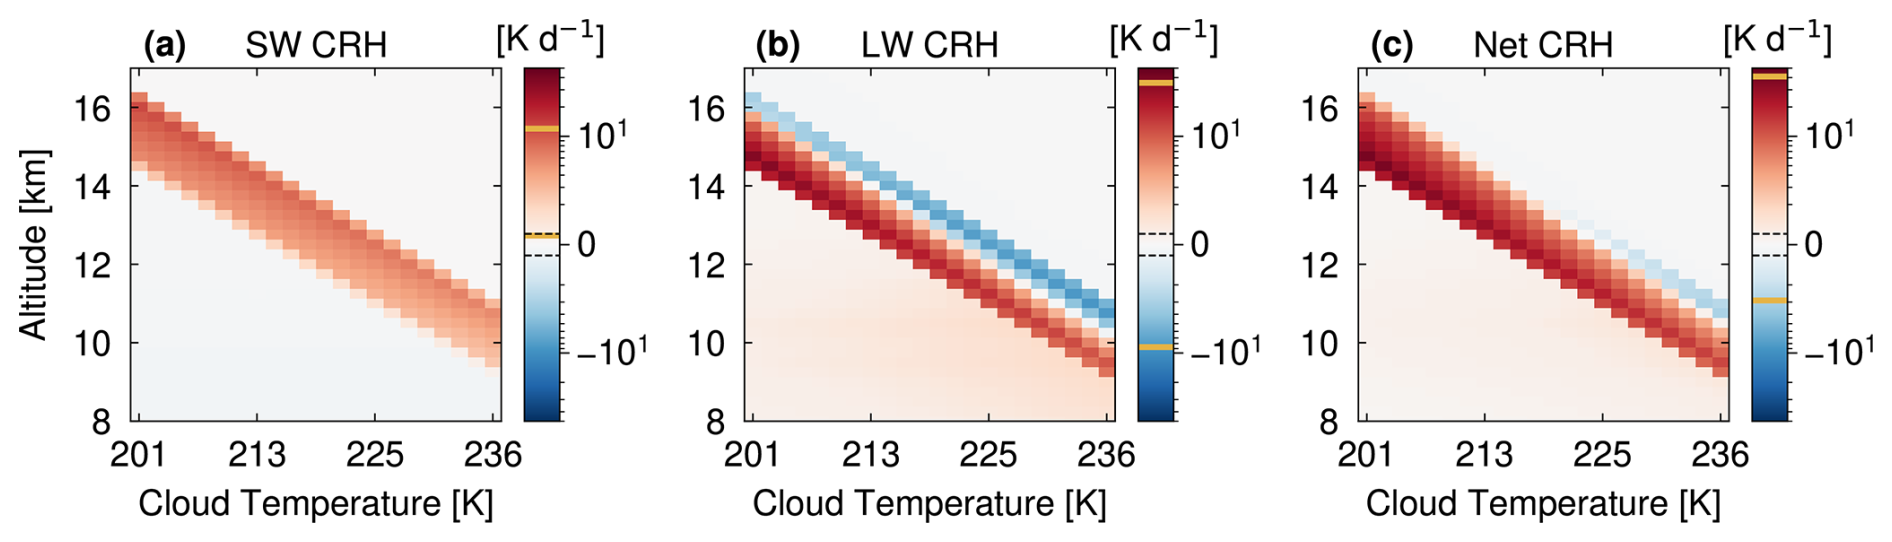
Figure 2The 22 CRH profiles for cloud temperatures from 201 to 236 K computed by using the Fu scheme for (a) SW, (b) LW, and (c) net CRH. The cloud altitude is shown on the y axis, while the heating rate magnitude (K d−1) is represented in the color bars. Yellow lines in the color bars indicate the corresponding CRH range for each panel. Black dashed lines in the color bars mark the limit between the linear and logarithmic scales (1 K d−1).
Figure 2a shows how the SW component of CRH changes for different cloud temperatures. To start, the rightmost column of the matrix shows the CRH profile for a cloud at 236 K or about 10 km. The cloud warms throughout its depth, with stronger heating on top due to stronger incoming SW fluxes. As we “transport” the ice cloud to higher positions in the troposphere (colder temperatures), the SW warming at the top of the cloud increases, reaching a maximum CRH of ≈12 K d−1. This increase is due to the decreasing air density. The LW component of CRH exhibits a well-known “dipole” of in-cloud heating (10 K d−1) and cloud-top cooling (−8.5 K d−1, Fig. 2b). Reading the heating matrix visualization from right to left, we can see again how the heating increases with altitude until it dominates at the coldest cloud temperature of 201 K. While lower air density still explains the increase in CRH, a strong temperature difference between a warm lower-tropospheric emission and cold ice cloud temperature results in maximum LW heating rates of ≈35 K d−1 for this simulation. The LW component dominates net CRH for our chosen SZA (Fig. 2c). The CRH matrix visualizations for the other schemes are shown in Fig. S6.
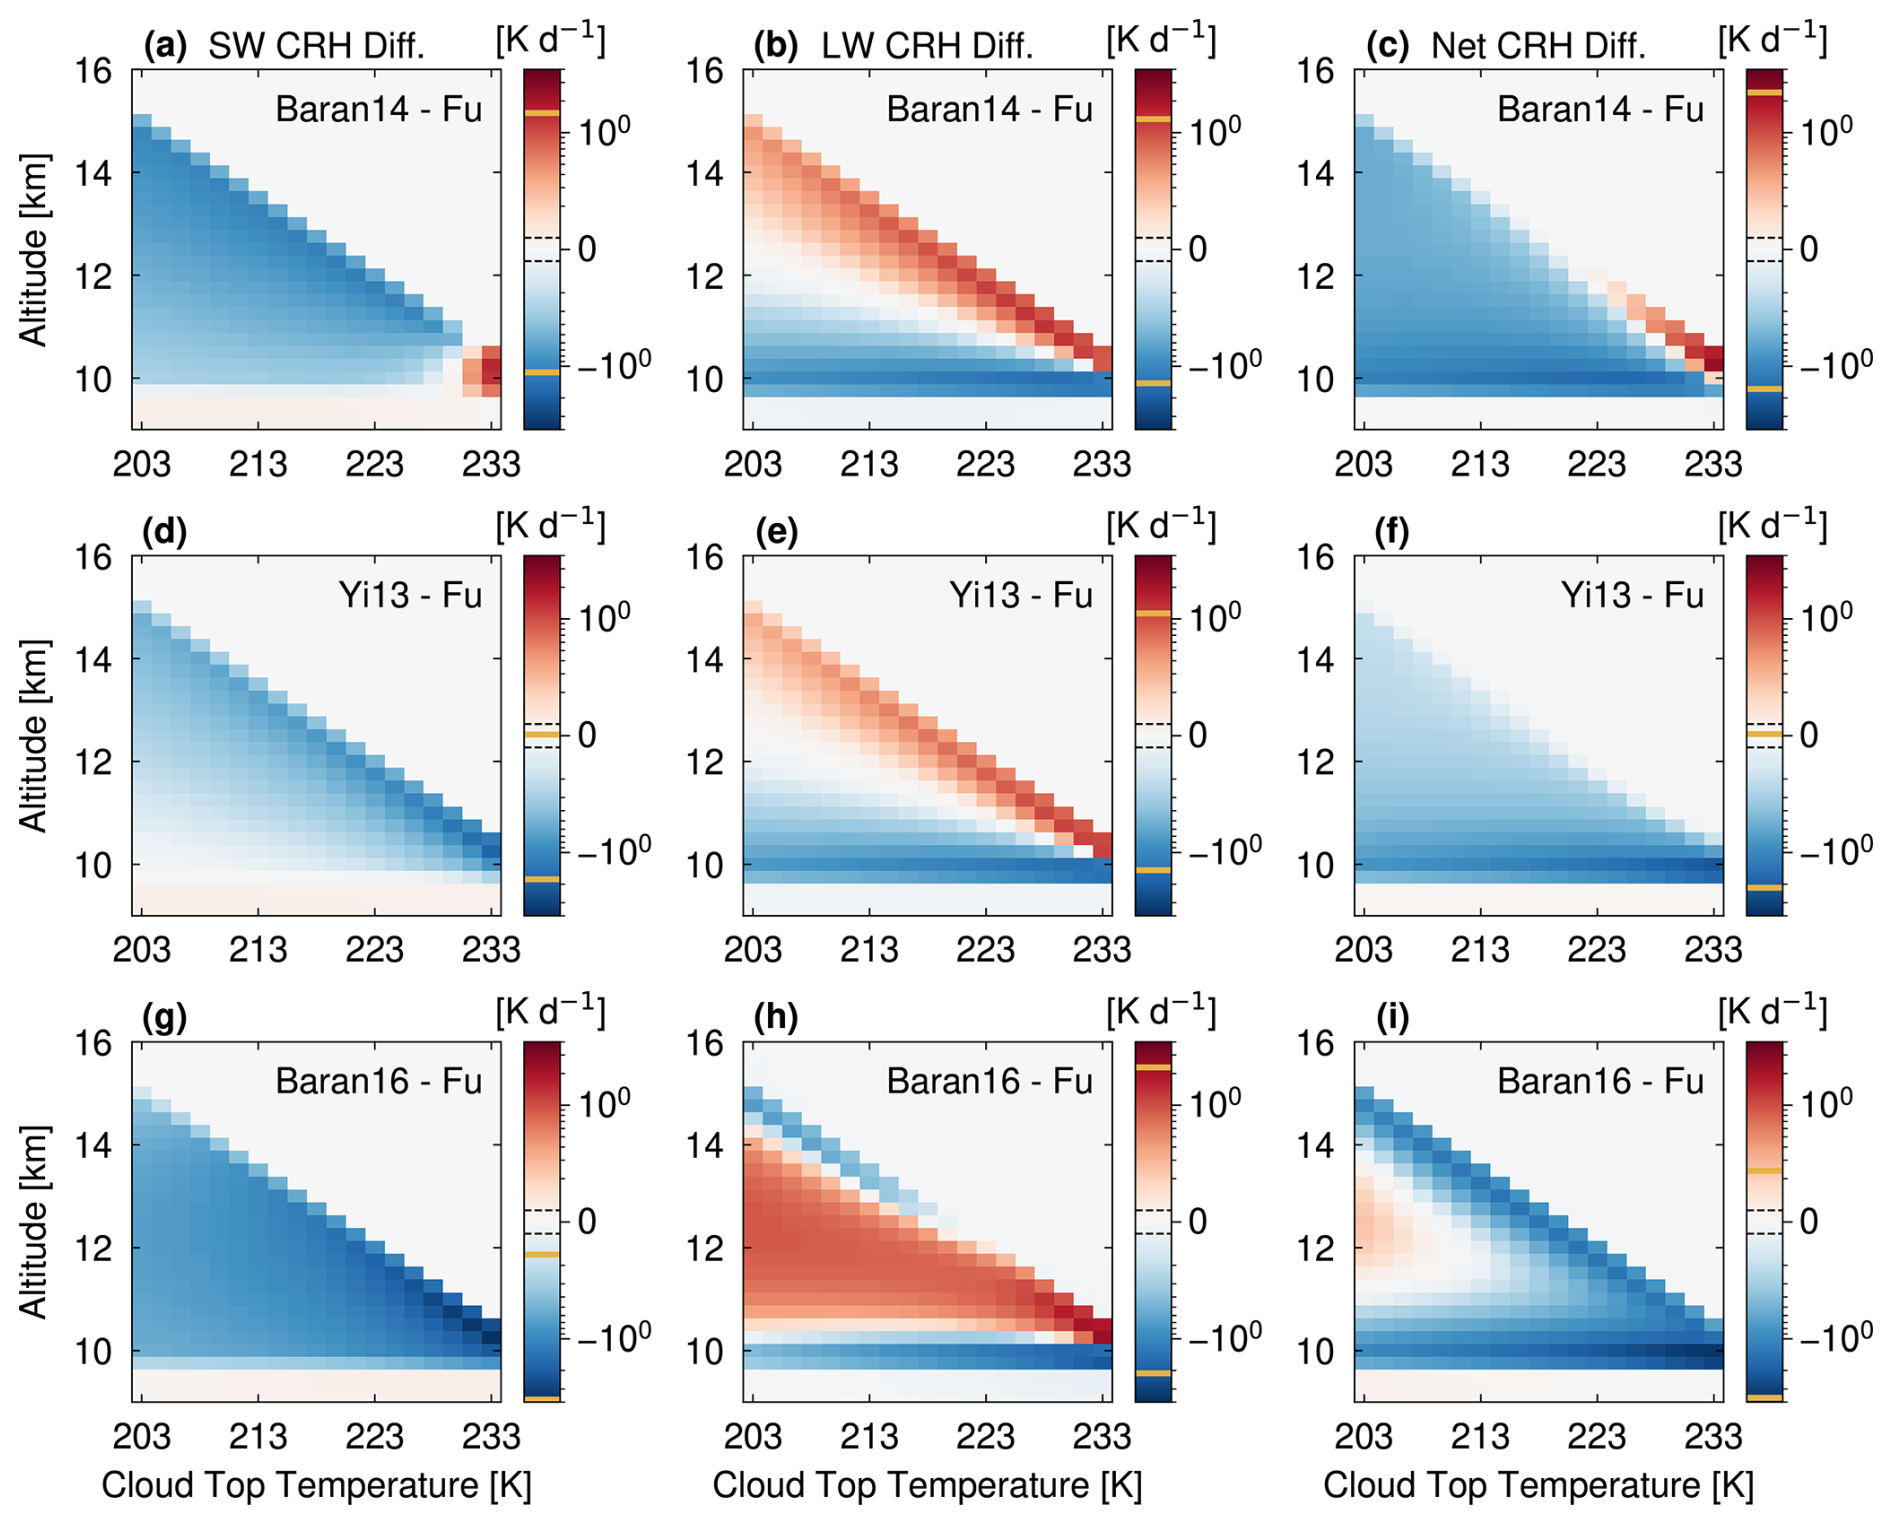
We turn next to how these CRH profiles change with ice optical scheme. While the heating rate matrices of Fig. 2 show absolute CRH, those of Fig. 3 now show inter-scheme CRH differences. The simplest Fu scheme has the strongest SW heating; the more complicated schemes all produce weaker SW heating – and hence a negative difference – relative to the Fu scheme (Fig. 3a, d, and g). The Baran14 scheme has a peak difference from Fu of −1 K d−1 (−18 %) at the warmest subzero temperatures, and the difference weakens with height (Fig. 3a).
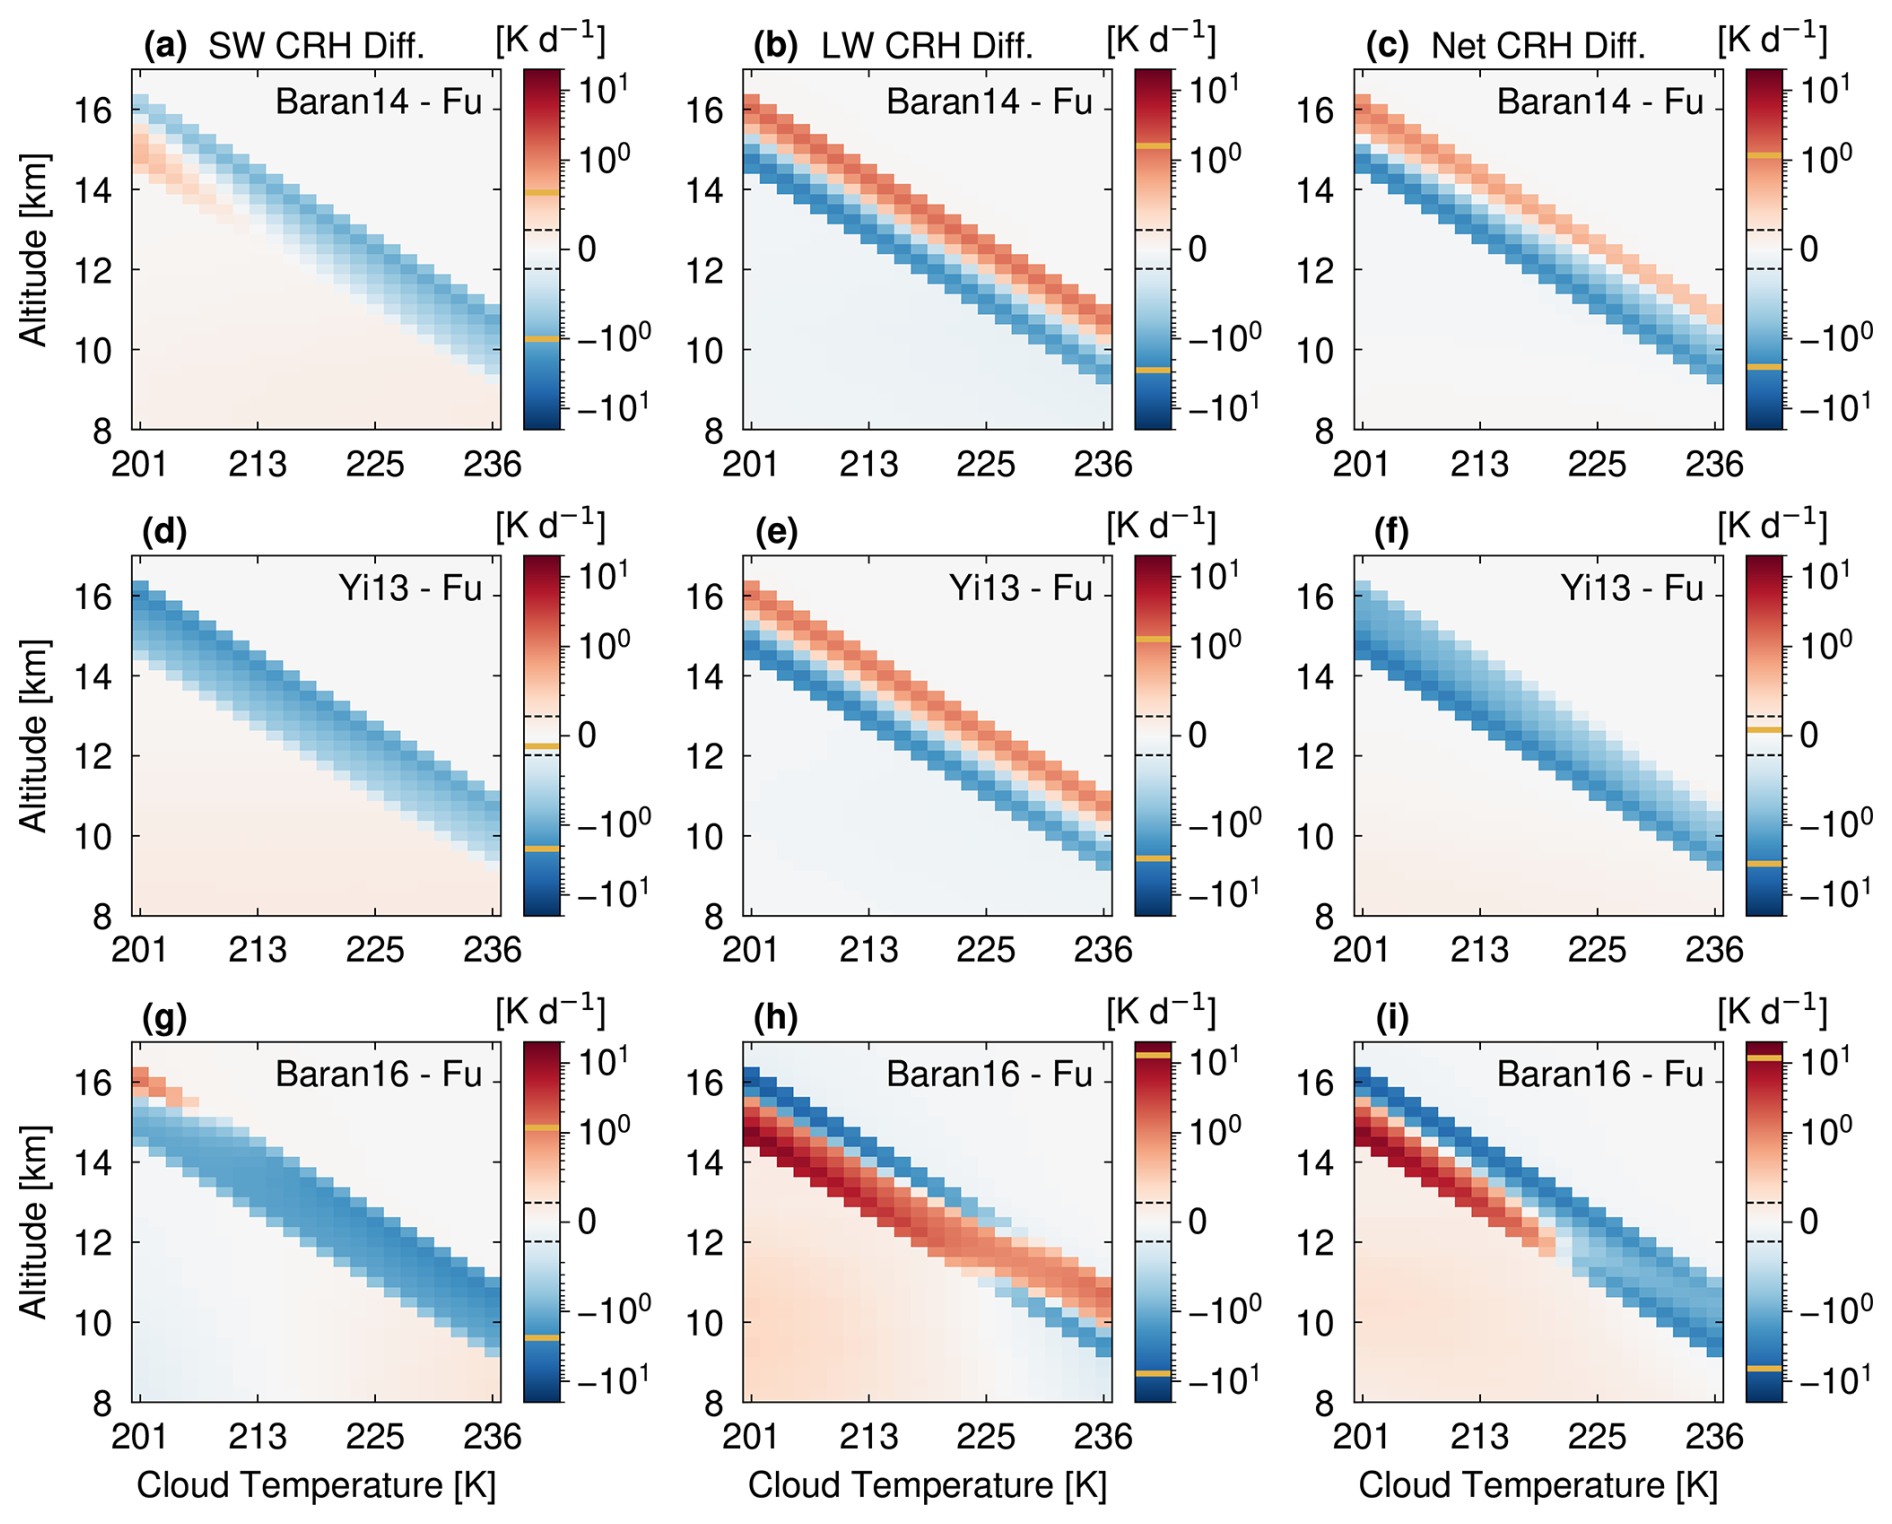
Figure 3Heating rate matrix visualizations, including 22 CRH difference profiles each for cloud temperatures from 201 to 236 K in Test 1. Panels (a), (d), and (g) show SW CRH differences, panels (b), (e), and (h) show LW CRH differences, and panels (c), (f), and (i) show net CRH differences. Rows are organized by scheme from least to most complex, top to bottom: (a–c) Baran14-Fu, (d–f) Yi13-Fu, and (g–i) Baran16-Fu. The cloud altitude is given on the y axis, while the heating rate difference magnitude (ΔCRH in K d−1) is given logarithmically in the color bars. The limit between the linear and logarithmic scale is 0.1 K d−1. As in Fig. 2, yellow lines in the color bars indicate the corresponding ΔCRH range for each panel.
These SW CRH differences can mainly be explained by inter-scheme differences in the shortwave absorption coefficient (Figs. 1 and 4i). The SW CRH in Yi13 is 18 % less than in the Fu scheme at the top layer of the high altitude cloud. At low altitudes, the SW CRH from Baran16 is 42 % less than that from Fu; however, by the highest altitudes, it is 10 % higher. can again explain this trend (Fig. 4k): a gradient exists in , with lower values in Baran16 at low altitudes and higher values in Baran16 at high altitudes.
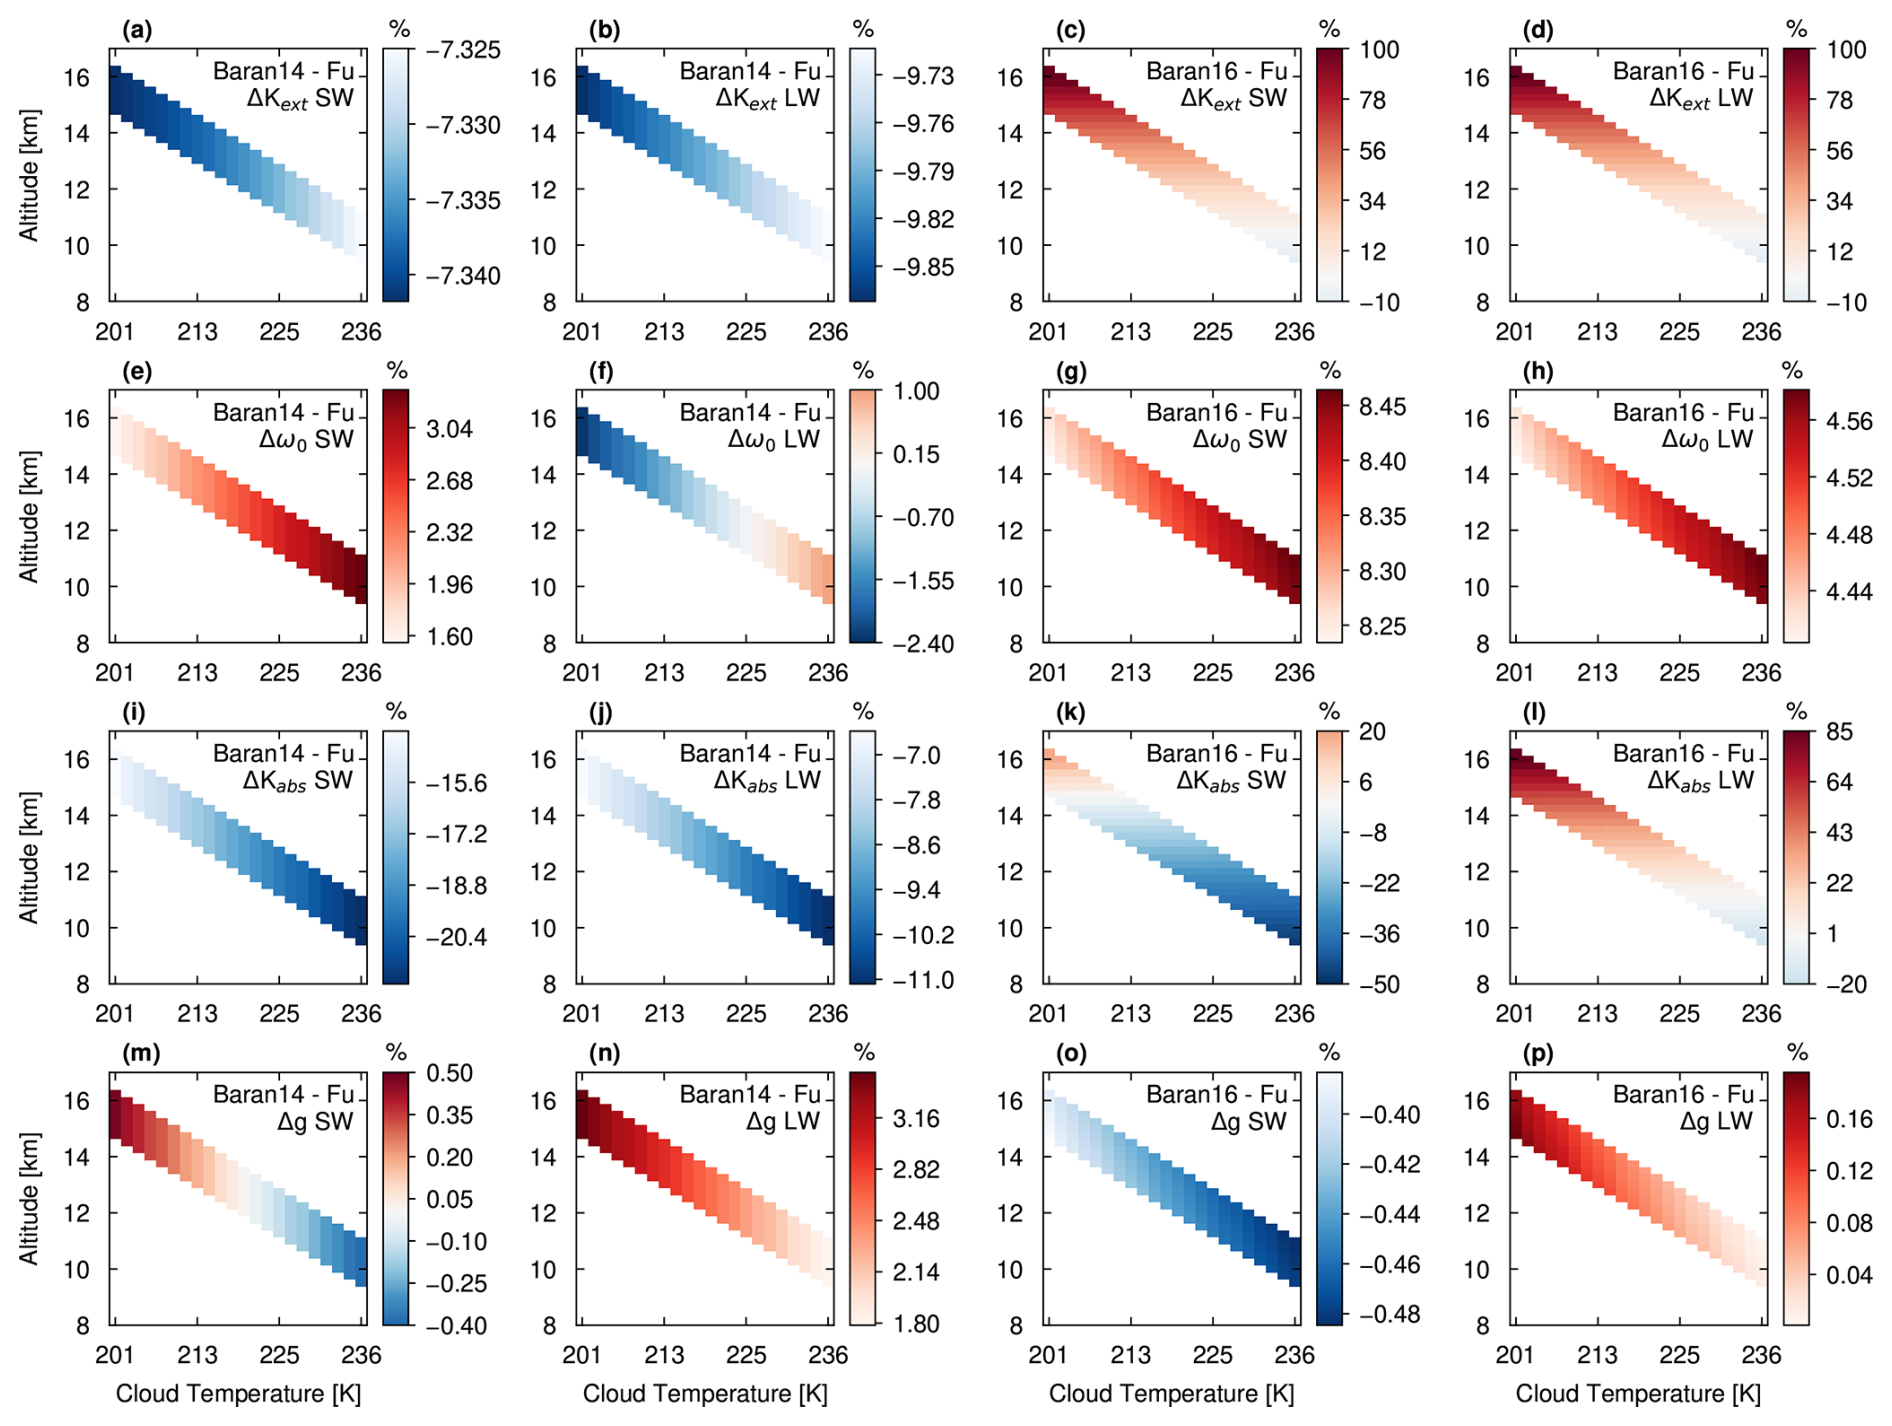
Figure 4Matrix visualizations, including 22 inter-scheme relative difference profiles for Kext, ω0, Kabs, and g (top to bottom rows), each for mid-cloud temperatures from 201 to 236 K (Test 1). The first and second columns show the Baran14 − Fu inter-scheme difference for SW and LW components, respectively. The same components are shown in the third and fourth columns, for the Baran16 − Fu inter-scheme comparison.
For Baran14, we can understand the SW CRH differences in terms of but also gSW (Fig. 4m). As is mentioned in Sect. 2.1, g quantifies the amount of forward- versus backward-scattered radiation by ice crystals. in Baran14 is between 14 % and 22 % smaller than that in the Fu scheme, while gSW changes from 0.4 % smaller to 0.5 % larger with increasing altitude. For our given SZA, a larger g increases the chances of absorption at the bottom of the cloud layer, probably driving the small positive deviation at the uppermost levels.
Larger magnitude differences exist for the LW CRH. Both the Baran14 and Yi13 schemes produce weaker in-cloud heating and cloud-top cooling than the Fu scheme (Fig. 3b and e). These differences in the LW CRH increase with altitude for these schemes. At the highest altitudes, both Baran14 and Yi13 have roughly 10 % less in-cloud heating and 50 % to 60 % less cloud-top cooling than the Fu scheme. As for the SW CRH, these differences can be explained in terms of weaker absorption in these schemes: in Baran14 is roughly 10 % smaller than that in Fu (Fig. 4j) and in Yi13 roughly 7.5 % smaller (Fig. 1).
Finally, an interesting inversion in LW CRH differences exists for the Baran16 scheme (Fig. 3h). At low levels, it follows the behavior of Baran14 and Yi13, with weaker in-cloud heating and cloud-top cooling than the Fu scheme. At upper levels close to the TTL, however, temperature dependence in the Baran16 scheme leads to the opposite behavior, in which in-cloud heating is 36 % larger and cloud-top cooling is almost 3 times larger than in the Fu scheme. A strong gradient in both and with temperature explains this inversion (Figs. 4d and l). In particular, is 85 % higher in Baran16 than in Fu at the coldest temperatures. Differences in gLW are much smaller in this case, indicating that a temperature-dependent has a stronger effect than a non-temperature-dependent ice crystal habit description.
To summarize the overall atmospheric impact of each optical scheme, Fig. 5 shows the cloud-averaged radiative heating rate (), computed as
Optical schemes, such as Baran14 and Yi13, result in weaker SW , relative to Fu, following the trend discussed previously. However, no difference in Baran14 SW is found at cold clouds, showing the limitations when analyzing a not vertically resolved CRH inter-scheme difference. Equally, stronger in-cloud and weaker cloud-top heating results in zero net vertically integrated SW . Both Baran14 and Yi13 show a uniform weakening of 5 % in LW throughout all temperature ranges. However, it is not possible to detect the inversion in Baran16 LW CRH mentioned in the previous paragraph, with Baran16 LW always being higher than the other schemes. In contrast, Baran16 net changes from lower to higher values than the other schemes when the cloud temperature increases, mainly due to the contribution of the SW component. While some features of the CRH inter-scheme difference can be detected in an average number, which in turn can be useful for satellite comparison at the top of the atmosphere (TOA), the vertically resolved CRH difference is a key component when evaluating other atmospheric mechanisms, such as radiatively induced vertical motion. Radiative-related cloud processes cannot be completely understood with only a cloud-average radiative heating rate analysis.
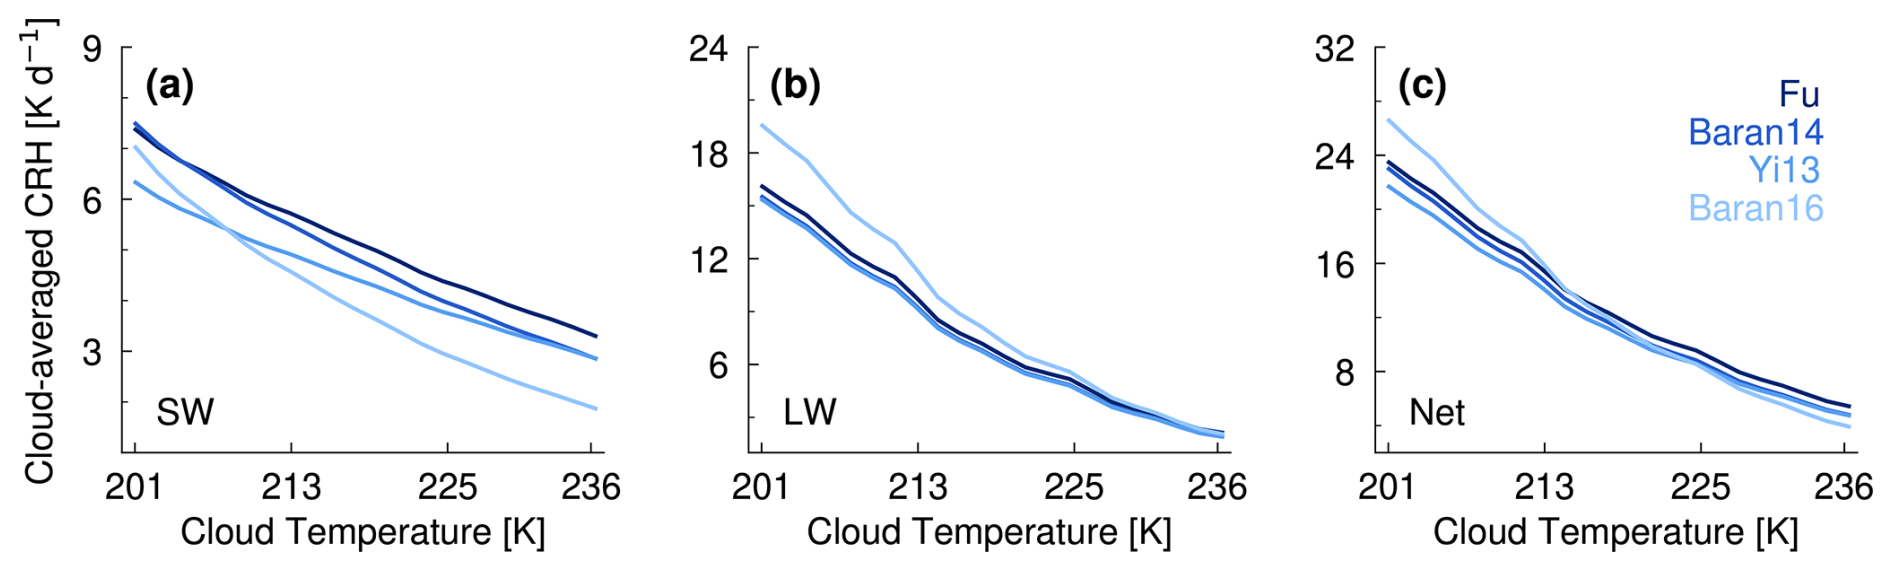
Figure 5(a) SW, (b) LW, and (c) net cloud-averaged CRH (y axis), evaluated for each single-column profile shown in Fig. 2 across cloud temperatures from 201 to 236 K in Test 1 (x axis). All four ice optical schemes under test are shown, with darker blue to light blue indicating low to high ice complexity levels.
3.2 How does cloud depth influence CRH?
We turn next to the results of Test 2, which studies the sensitivity of CRH to cloud geometrical depth across optical schemes (Table 2). First, in Test 2a, increasing cloud depth when keeping the cloud-top temperature fixed weakens the CRH at a given altitude (Fig. S7). Since we fix IWP and infer qi across the cloud depth (see Eq. 2 and Fig. S4a), there is less ice condensate at a given level as the ice cloud deepens. Less condensate then means less SW absorption at a given level. A similar trend is found in the LW CRH matrices from all schemes: as the ice cloud depth increases, less condensate is absorbed and reemitted at a given level, weakening both in-cloud heating and cloud-top cooling.
Inter-scheme differences in Test 2a mirror those of Test 1, with weaker SW and LW absorption from the Yi13 and Baran14 schemes relative to the Fu scheme (Fig. 6). The exception is in thin clouds at high altitudes, where both Baran schemes show stronger SW heating (Fig. 6a and g). In Baran14, is lower than in Fu (Fig. S8i). The stronger SW heating at high levels must then be due to the scattering parameters. is smaller and gSW is larger in Baran14 (Fig. S8e and m), meaning that this scheme predicts relatively more absorption and forward scattering than Fu. Both of these behaviors promote in-cloud absorption and a positive SW CRH anomaly at high altitudes.
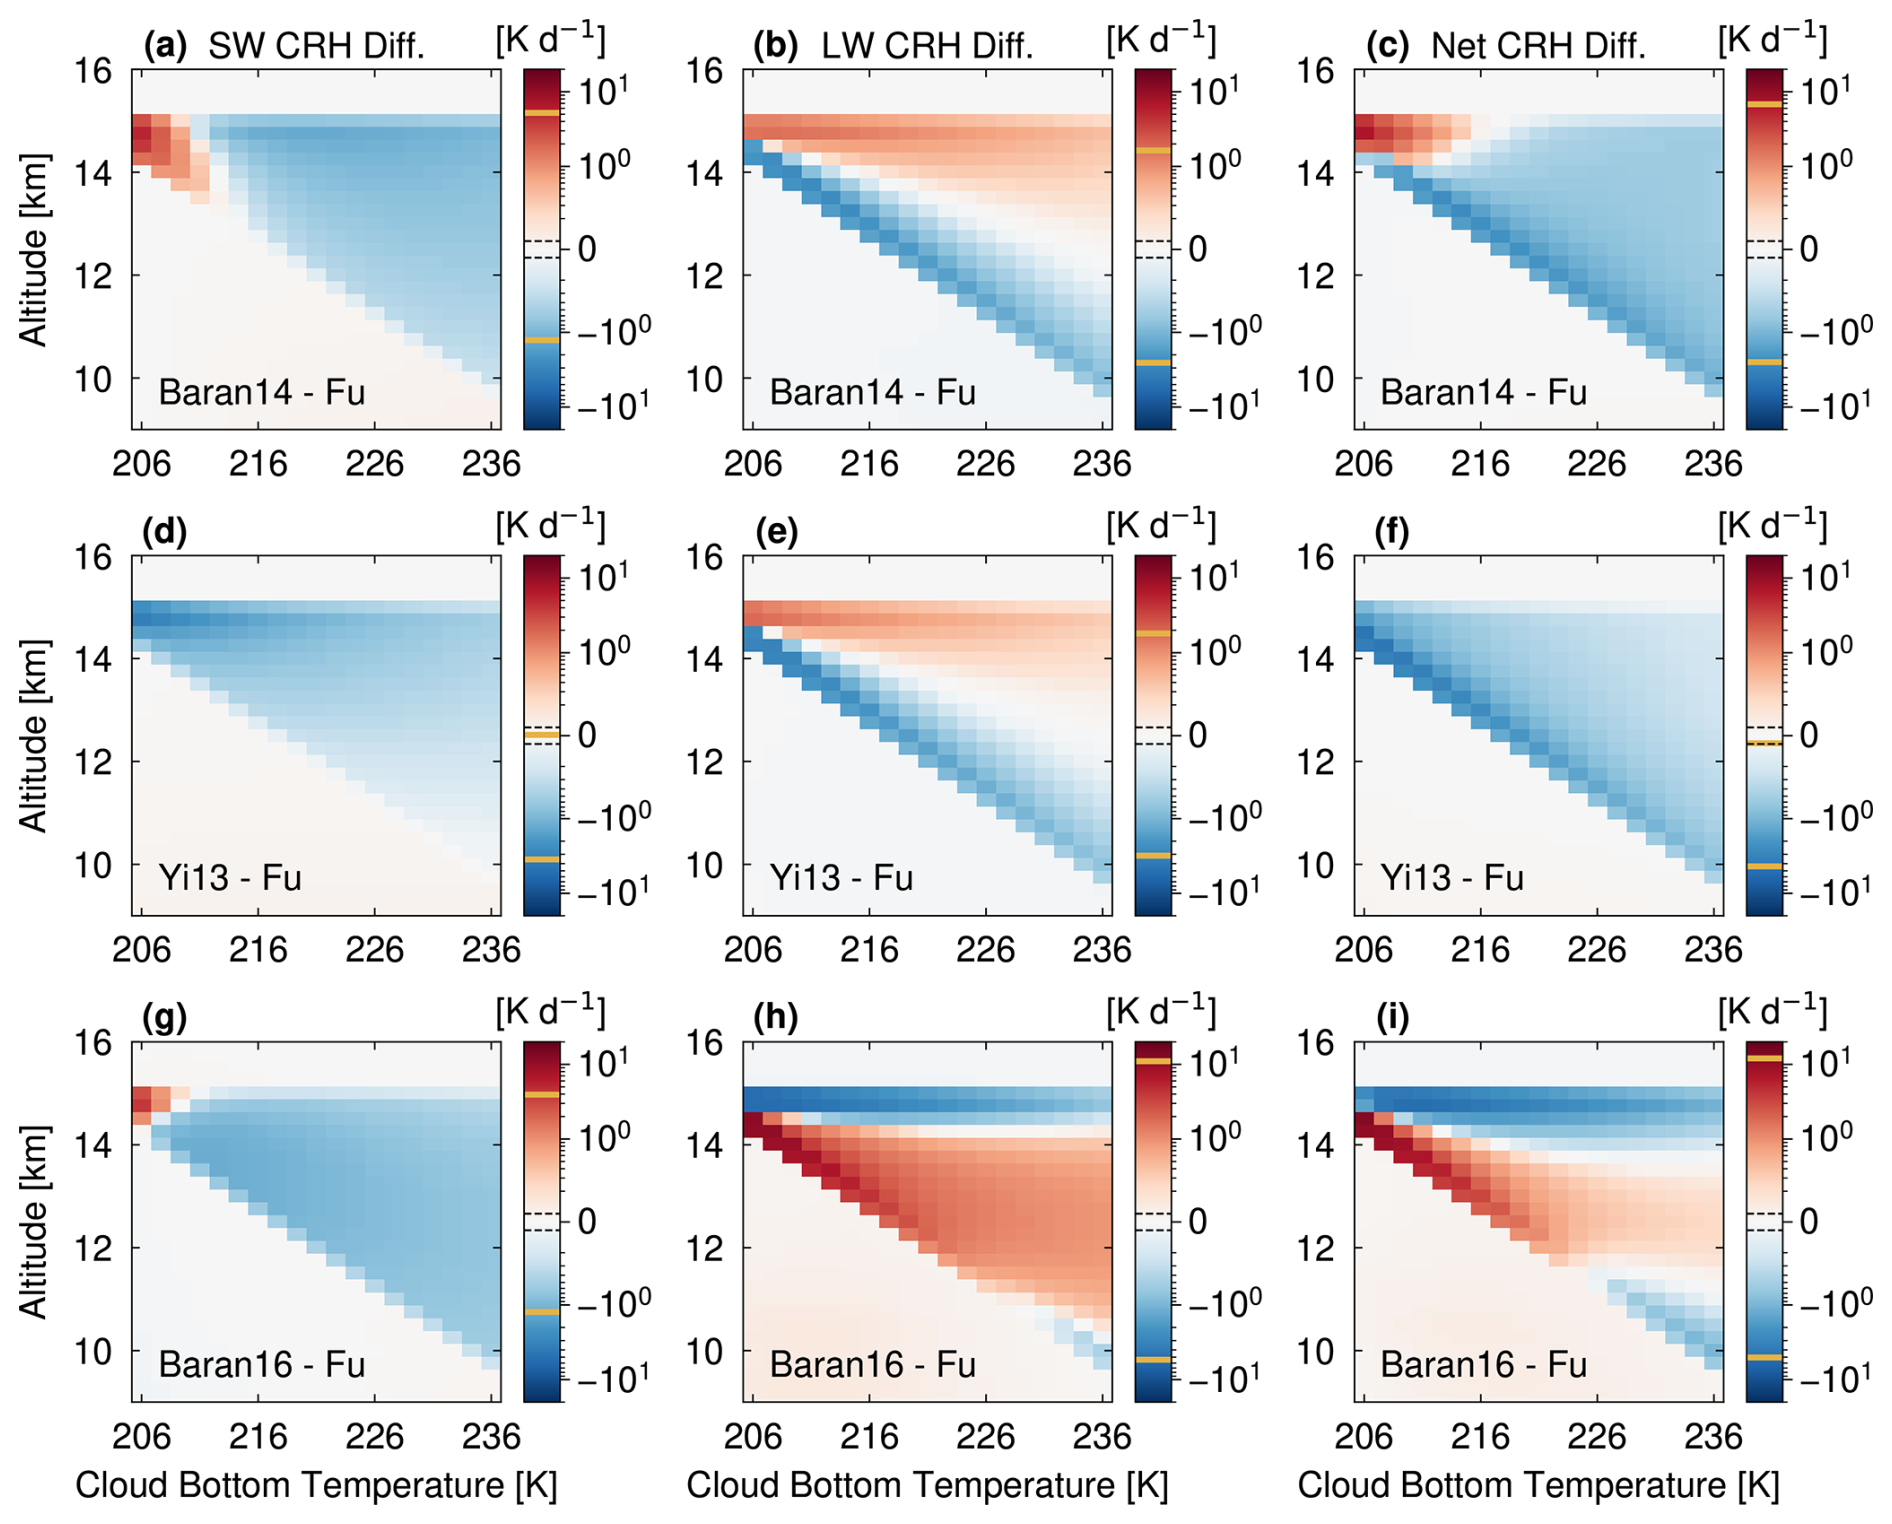
Figure 6Heating rate matrix visualizations, including 19 CRH difference profiles each for cloud depths from 0.5 to 5 km, with a fixed cloud-top temperature of 203 K (Test 2a). Panels, axes, and color bars are as in Fig. 3.
For Baran16, the temperature-dependent causes stronger absorption than in Fu at the top of thin clouds. This property difference is the source of the largest-magnitude SW CRH differences. As in Baran14, there is a gradient of gSW through the geometrical depth range, as a result of the change of qi with depth (Fig. S8o). gSW in Baran16 reaches similar values to Fu for the geometrically thin cloud, meaning that SW absorption is the main driver of the SW CRH anomaly here. However, less forward scattering in geometrically thick clouds leads to weaker SW CRH at the top layers. The SW CRH differences are smallest between Yi13 and Fu, due to a smaller in the Yi13 scheme (Fig. 1).
As for Test 1, larger differences are present in the LW component across the schemes. Baran16 has 20 % more in-cloud heating and 130 % more cloud-top cooling at the uppermost levels, relative to Fu. These CRH differences “dilute” as we deepen the cloud from left to right in the heating rate matrices. In contrast to the SW component, the LW CRH differences in Baran14 do not look like those in Baran16. Baran16 has dramatically more upper-level LW CRH than Fu (+10 K d−1), whereas Baran14 has slightly less. is, again, the property driving these differences. is 70 % larger in Baran16 than in Fu for cloud temperatures colder than 210 K (Fig. S8l); in Baran14, is 7 % smaller at the highest altitudes (Fig. S8j). The LW CRH difference dominates at the cloud bottom, while the SW CRH difference dominates toward the top of cloud for net CRH differences.
In Test 2b, we fix the cloud-bottom temperature and decrease the cloud-top temperature (Fig. 7). These simulations also fix IWP, so that qi at a given level decreases as cloud depth increases (Fig. S4b). Indeed, the absolute heating rate matrix for Test 2b shows enhanced heating in the less deep clouds, where condensate is more concentrated (Fig. S10). However, the difference in CRH across cloud depths is more pronounced in Test 2a than in Test 2b because qi must be greater at high altitudes than at low altitudes to generate a given IWP for a fixed geometric depth. Differences in absorption are therefore larger in Test 2a, with a geometrically thin cloud at high altitudes, than in Test 2b, with a geometrically thin cloud at lower altitudes.
Despite these quantitative differences between Test 2a and Test 2b, we see qualitatively similar behavior in SW and LW CRH across the schemes. Including more ice crystal habits in Baran14 and Yi13 leads to 12 % more and 14 % less SW heating, respectively. As mentioned previously, gSW is larger and is only slightly lower in Baran14 than Fu, so there is a small positive difference at low levels for the most dense clouds (Fig. 7a). The Yi13 scheme has minimal gSW differences for the effective radius used here and its smaller produces only negative SW CRH differences. LW differences between Test 2a and Test 2b are qualitatively the same but of smaller magnitude.
In contrast, inclusion of temperature dependence in Baran16 results in a different trend for Test 2b than for Test 2a. The SW CRH is weaker in Baran16 than in Fu, with about 30 % less heating in the thinnest clouds and 13 % less in the thickest ones, due to a weaker below 210 K in Baran16 (Fig. S11k). LW CRH differences between Baran16 and Fu also show a unique structure (Fig. 7h); across cloud depths, Baran16 predicts less LW absorption at the warmest temperatures. For clouds of greater depth, it also predicts roughly 50 % more in-cloud heating and 10 % more cloud-top cooling than the Fu scheme. The prominent vertical gradient in for Baran16 drives these differences (Fig. S11l): it varies from 10 % smaller at warmer temperatures than in the Fu scheme to 63 % larger at colder temperatures, enhancing the absorption capacity in the upper half of the ice clouds. Again, in contrast to Test 2a, the Baran16-Fu inter-scheme difference in SW CRH dominates the net CRH for thin clouds. Similar to Fig. 5, the for Test 2a and 2b are shown in Figs. S9 and S12, respectively.
3.3 How does IWP influence CRH?
We study the CRH sensitivity to IWP in Test 3. We fix the geometric depth and altitude of the ice cloud and instead vary the amount of condensate within it (Table 2). The highest IWP, of 200 g m−2, corresponds to qi of 0.33 g kg−1 for the lowest cloud altitude and qi of 0.66 g kg−1 for the highest cloud altitude (Fig. S5).
As expected, CRH increases with IWP and, as in Test 1, with altitude (Fig. S13). The SW CRH increases from roughly 0.02 to 20 K d−1 for the lowest cloud altitude. This change is twice as large for the highest cloud altitude. While in-cloud LW heating and the cloud-top LW cooling dipole is always present in Tests 1 and 2, all four schemes show an in-cloud LW heating for IWP from 4 to 20 g m−2. The LW CRH structure dominates the net CRH, but SW cloud-top heating can surpass LW cloud-top cooling in some cases.
We then visualize CRH inter-scheme differences for this test (Fig. 8). In contrast to Test 1, we see larger differences in SW CRH than in LW CRH for Baran14 and Yi13. For both schemes, we see interesting inversions in the SW CRH differences at high IWPs. For example, in Baran14, SW CRH changes from 50 % smaller to 30 % larger at an IWP of roughly 30 g m−2. A similar change occurs in gSW (Fig. S14m). A smaller gSW in Baran14 at low IWPs enhances backward scattering of SW radiation at the cloud top, relative to Fu. Conversely, a slightly higher and larger gSW in Baran14 at large IWPs enhances forward scattering of SW radiation into the cloud, where it can be absorbed. The inversion in Yi13 differences is much more muted (Fig. 8d). As in preceding tests, the weaker in Yi13 relative to Fu drives its weaker SW CRH. The negative difference in (∼−20 %) outweighs the positive difference in gSW (∼2 %) in Yi13, except at IWPs greater than 100 g m−2, where the higher forward scattering relative to Fu enhances the chances of SW radiation being absorbed at the bottom of the cloud layer.
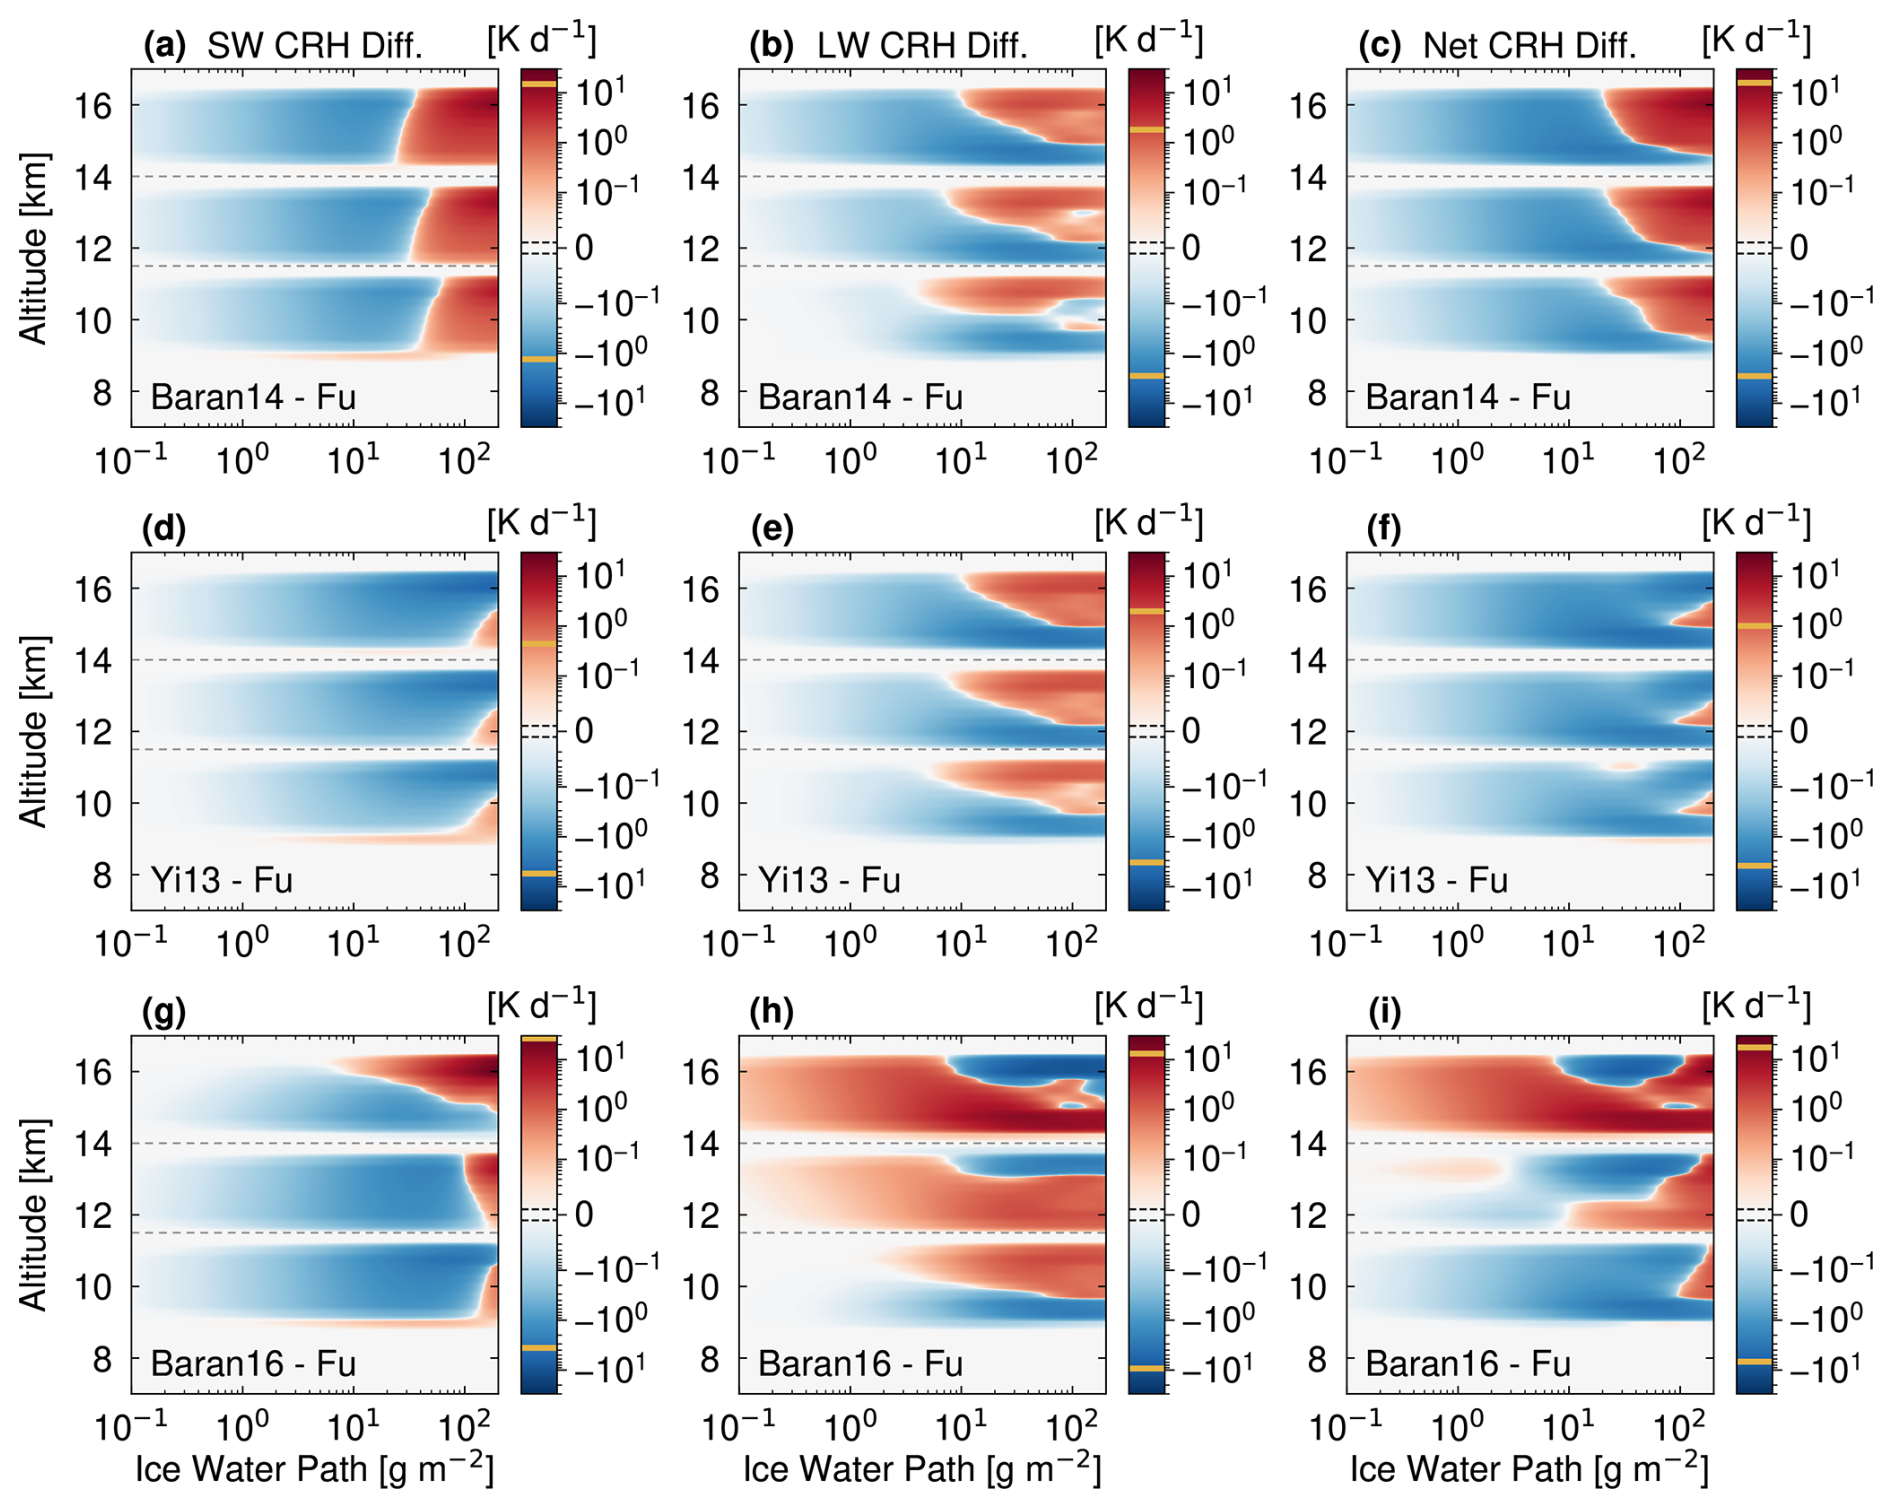
Figure 8Heating rate matrix visualizations, including CRH difference profiles for IWPs from 0.1 to 200 g m−2 in Test 3. Three separate differences are shown, for cloud temperatures of 201, 218, and 236 K, corresponding to high, middle, and low altitudes. Panels, axes, and color bars are as in Fig. 3. The limit between the linear and logarithmic scale is 0.01 K d−1.
Inter-scheme differences in LW CRH are as in Tests 1 and 2, with weaker in-cloud heating and cloud-top cooling in Baran14 and Yi13 than in Fu (Fig. 8b and e). Importantly, this trend is maintained below an IWP of 10 g m−2, although with a different CRH vertical structure. For ice clouds with the lowest amounts of condensate, cloud-top cooling becomes less important, and LW CRH differences are negative throughout the cloud depth. As IWP increases, the difference in ω0 goes from positive to negative between Baran14 and Fu (Fig. S14f), resulting in a slightly higher in Baran14, relative to Fu. This increased absorption relative to scattering drives the positive anomaly in LW CRH at high IWP. The LW CRH inter-scheme difference dominates the net CRH anomalies in the bottom layer of the clouds, while the SW CRH differences is important in the top layers.
As in Test 2, the Baran16 scheme shows contrasting behavior to Baran14 and Yi, with more in-cloud heating and cloud-top cooling than Fu at high altitudes (Fig. 8h). The absolute differences are especially pronounced at high IWP, with 20 % more in-cloud heating and 50 % more cloud-top cooling for the cloud layer at the uppermost altitude. Temperature dependence in is key here, with the absorption coefficient almost twice as large in Baran16 as Fu at the coldest temperatures and across IWP values (Fig. S14l). The ω0 difference does not change from positive to negative in Baran16, indicating that the absorption coefficient trends dominate.
3.4 How does ice crystal effective radius influence CRH?
We finish by examining the sensitivity of CRH to ice crystal effective radius, reff, in Test 4. Only the Fu and Yi13 scheme parameterize ice optical properties as a function of reff (Fig. 1), so the Baran schemes are not included in Test 4. The CRH profiles computed for effective radii ranging from 10 to 60 µm are shown in Fig. S15, with a fixed cloud depth of 1.5 km and a fixed IWP of 30 g m−2. Three independent radiative transfer (RT) calculations are included, for each of three cloud temperatures, similar to Test 3 (Table 2). SW CRH in the Fu scheme reaches 20 K d−1 at the top layers of colder clouds composed of small crystals (Fig. S15a). This SW CRH weakens for warmer clouds, as in previous tests, and for larger reff. Smaller crystals scatter more than larger ones and also favor forward scattering (Fig. S1d); both of these phenomena promote opportunities for SW absorption within the cloud.
A similar trend is found in LW CRH for the Fu scheme (Fig. S15b), with smaller crystals producing higher CRH rates. The in-cloud heating and cloud-top cooling peaks are 60 and 20 K d−1, respectively, for ice crystals of reff less than 20 µm in colder clouds. As reff increases, the LW in-cloud heating decreases to 20 K d−1 and the cloud-top cooling decreases to 4 K d−1 at high altitudes. While the heating–cooling dipole is still present in the net CRH for small crystals (Fig. S15c), net heating dominates for colder clouds with ice crystals of reff larger than 20 µm.
Echoing previous tests, the weaker and slightly higher gSW from more complex crystals in Yi13 cause weaker SW CRH than in Fu across the full range of effective radii. The largest SW CRH differences are in the coldest cloud layer. The SW CRH inter-scheme difference at the top layer of these coldest clouds changes from −3 to −1.5 K d−1 as reff increases (Fig. 9a). For LW CRH, Yi13 predicts weaker in-cloud LW heating and cloud-top LW cooling, relative to Fu, for all effective radii. The LW CRH differences are highest for ice crystal radii between 25 and 40 µm. The lower , together with a larger gLW, explains these LW CRH anomalies (Figs. S2i and S2l). Finally, a weaker net heating dominates in Yi13 at all altitudes and ice crystal effective radii, with a −10 % difference at the bottom of the coldest cloud.
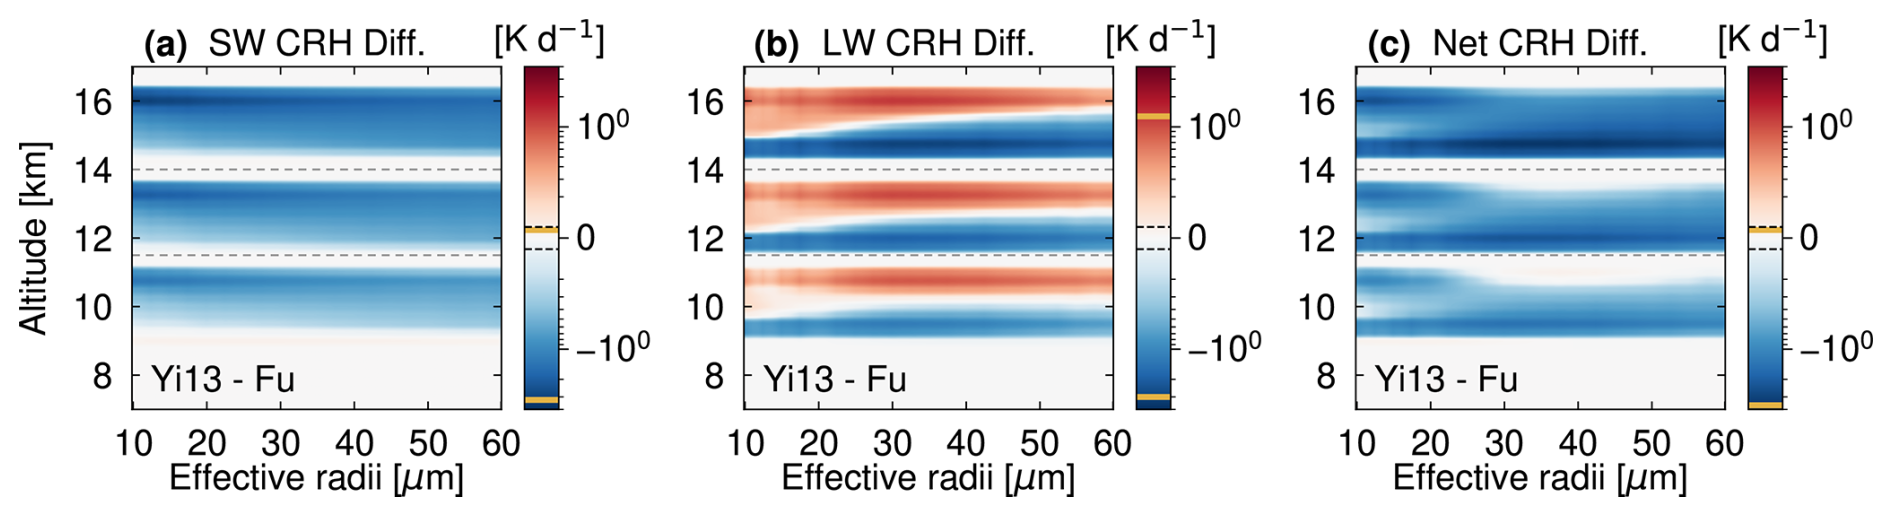
Figure 9Heating rate matrix visualizations, including CRH inter-scheme difference profiles for ice crystal effective radii ranging from 10 to 60 µm (Test 4). Three separate profiles are calculated, for low, middle, and high cloud temperatures of 201, 218, and 236 K. Columns, axes, and color bars are as in Fig. 3.
Ice crystals in high clouds can be found with varying degrees of complexity, impacting the bulk optical properties of an ice cloud. Different ice optical schemes have been proposed, assuming different ice crystal habit distributions, based on either in situ measurements or optical particle model calculations. Here, we run the ecRad radiative transfer scheme with four such ice optical schemes over an atmospherically relevant parameter space for ice clouds to understand their effect on CRH. We propose heating rate matrix visualizations to present our results across the parameter space in a condensed format. We consider two main characteristics that distinguish each scheme: first, the assumed ice crystal habits and complexity and, second, the variables on which the parameterized optical properties depend, including ice crystal size, ice mass mixing ratio, and temperature.
In the current analysis, we consider the Fu scheme as a starting point in terms of ice crystal complexity, as this scheme bases its calculations on smooth hexagonal columns, and depends only on the size of the ice crystals. Such schemes as Baran14, Baran16, and Yi13 enhance the ice crystal habit description. The Baran schemes use a simpler ensemble of ice crystal habits, including surface roughness in the SW calculations, and Yi13 uses a more elaborate one, including hollowness and surface roughness properties in both SW and LW parameterizations. In contrast to the other schemes, Baran16 includes temperature as an input in the parameterization. Inter-scheme differences in CRH then indicate which feature of the schemes is relevant under which atmospheric conditions. Moreover, we find that most of the SW/LW CRH differences can be explained in terms of differences in the absorption coefficient and, secondarily, by those in the asymmetry parameter.
A key result is that ice complexity weakens heating rates for both SW and LW components, especially in geometrically thin clouds at high altitudes. The difference is also particularly pronounced for clouds with high IWPs, resulting in net CRH differences of −2.5 K d−1 at the cloud bottom in reff-dependent schemes and 15 K d−1 at the cloud top in qi-dependent schemes, compared with a less sophisticated scheme. In general, when more ice crystal habits are included, the absorption capacity of ice clouds decreases greatly, while the forward scattering increases to a lesser extent, resulting in weaker SW CRH, LW in-cloud heating, and cloud-top cooling.
The sensitivity test presented here aims to show the impacts of ice optics assumptions under different cloud scenarios, based on realistic ranges. However, existing evaluations result in similar trends to those derived in this test. Previous works show a general trend of decreasing downward SW flux at the surface and increasing upward SW flux at the TOA when using aggregate ice crystals, relative to hexagonal columns (Yang et al., 2012). Higher single-scattering albedos from the aggregate crystals are the primary explanation for these trends. These effects translate to a decrease in SW CRE at the TOA of roughly 1 W m−2 (Järvinen et al., 2018). Our results follow a similar trend, where schemes such as Baran14 and Yi weaken the LW cooling rate at the cloud top, due to less LW emission and as a result of less absorption capacity, generally, by the ice cloud under test. Moreover, previous studies show both weaker SW and LW CRH on switching to a more complex ice scheme, whether studying CRH in an extratropical cyclone (Keshtgar et al., 2024) or in global scale simulations (Zhao et al., 2018).
The inputs used in the optical scheme can have a strong influence on radiative outputs and CRH profiles. For certain ice clouds, temperature dependence has a larger impact on optical property differences than does the inclusion of complex habits or surface roughness. In this case, the Baran16 scheme shows small weaker heating rates for geometrically thin clouds at low altitudes, as a possible consequence of the inclusion of more habits, apart from only hexagonal columns. However, net heating rates at the bottom layer of geometrically thin clouds at high altitudes can be as high as 12 K d−1, relative to a size-dependent and simpler complexity scheme. This is due mainly to the T−4 temperature dependence of the bulk mass absorption coefficient in Baran16, which has a bigger impact than the qi parameter, and allows relatively strong SW and LW cloud-top and cloud-bottom heating, respectively.
These results can be helpful from a practical standpoint, by evaluating the impact of switching ice optical schemes in current RTM and NWP models. Either weaker CRH due to ice complexity or stronger CRH due to temperature-dependent ice optical schemes can have important impacts across scales. When evaluating the evolution of convective systems and individual cloud-scale processes, different magnitudes of calculated net CRH would alter the lifetime of anvil clouds (Sokol and Hartmann, 2020; Hartmann and Berry, 2017; Gallagher et al., 2012). At a larger scale, less heating in the tropical upper troposphere due to the inclusion of more complex ice crystals would weaken tropical overturning by reducing the latitudinal temperature gradient at high altitudes (Gasparini et al., 2023). In similar ways, changes in calculated CRH due to assumptions of ice crystal habits would impact circulation pattern estimation by changing, for example, the magnitude of poleward jet shifting (Voigt and Shaw, 2015).
While the ice optical schemes tested here are based on inputs and ice cloud properties relevant for tropical regions, pre-evaluation is highly recommended, to identify the right scheme to use in current climate and forecast simulation, depending on the region, time, and meteorological context under evaluation (Noel et al., 2006; van Diedenhoven, 2018; Sato and Okamoto, 2023). Considering that ice crystal size can also change in space and time (Pasquier et al., 2023; Llombart et al., 2020), in situ measurements of region-specific behavior in ice complexity and sizes are still necessary. Conversely, when including temperature in the retrieval of optical schemes, we have the advantage of using a prognostic variable that can be retrieved with less uncertainty than ice crystal size. Temperature- and ice-concentration-dependent schemes can behave relatively similarly under certain conditions; however, radiative analysis in specific cases of high IWP in cold temperature environments has to be treated cautiously.
The idealized single-column tests used in this work assume a vertical uniform distribution of qi and reff through the cloud layers, which is not a typical realistic case. However, the perturbation method allows us to focus on independent impacts of qi and reff on the CRH profiles in the tropics. From an atmospheric modeler point of view or for microphysics studies, the sensitivity tests shown here offer a hint as to which parameter evaluated in this work is causing the biggest impact on computed CRH. Cases with a thin high peak of the qi profile located at cold temperatures result in the largest differences of the retrieved CRH for the variety of ice complexity assumptions. Therefore, these cases should be analyzed and processed with caution when they are present in forecast and climate models. Moreover, while we expect SZA to result in a variety of SW CRH vertical distributions, as the chances of radiation being absorbed are changed when SZA is high, other parameters assumed as fixed in this test, such as SW albedo and LW emissivity, would have a systematic impact on CRH profiles and therefore on the inter-scheme difference trend.
As discussed previously, preliminary works, including more realistic contexts, have already shown similar qualitative trends in CRH when ice complexity is included. However, more evaluations, for instance using storm-resolving models, under specific cloud structures and characteristics will help to assess the utility and performance of the sensitivity test presented here. Including remote sensing products in future analysis is also a necessary part of the evaluation workflow, but caution must be considered as even satellite products assume ice crystal characteristics when retrieving CRH, qi, or reff profiles (Wu et al., 2024; Ren et al., 2023; Delanoë and Hogan, 2010).
ecRad radiative transfer model (RTM) version 1.5.0 is available at https://github.com/ecmwf-ifs/ecrad (last access: 2 February 2023; https://doi.org/10.5281/zenodo.15075773, Hogan and European Centre for Medium-Range Weather Forecasts, 2018; Hogan and Bozzo, 2018). CRH calculations and codes for figures are available in the Zenodo online repository https://doi.org/10.5281/zenodo.13932540 (Sepulveda Araya, 2024a) and https://github.com/EdgardoSepulveda/ice-crh-1column (last access: 25 April 2025). Data inputs, configuration files for simulations, simulation outputs, and CRH tables are available in the Zenodo online repository https://doi.org/10.5281/zenodo.13932430 (Sepulveda Araya, 2024b).
The supplement related to this article is available online at https://doi.org/10.5194/acp-25-8943-2025-supplement.
EISA ran the simulations and coding. SCS and AV developed the matrix visualization idea. All authors reviewed the writing.
The contact author has declared that none of the authors has any competing interests.
Publisher's note: Copernicus Publications remains neutral with regard to jurisdictional claims made in the text, published maps, institutional affiliations, or any other geographical representation in this paper. While Copernicus Publications makes every effort to include appropriate place names, the final responsibility lies with the authors.
This research was supported by start-up funds through the University of Arizona (UA), as well as UA Research, Impact, and Innovation International Research grant no. 2100255.
This research has been supported by the University of Arizona (grant no. 2100255).
This paper was edited by Aurélien Podglajen and reviewed by Adam Sokol and one anonymous referee.
Albern, N., Voigt, A., and Pinto, J. G.: Cloud-radiative impact on the regional responses of the midlatitude jet streams and storm tracks to global warming, J. Adv. Model. Earth Sy., 11, 1940–1958, https://doi.org/10.1029/2018MS001592, 2019. a
Albern, N., Voigt, A., and Pinto, J. G.: Tropical cloud-radiative changes contribute to robust climate change-induced jet exit strengthening over Europe during boreal winter, Environ. Res. Lett., 16, 084041, https://doi.org/10.1088/1748-9326/AC13F0, 2021. a
Baran, A. J. and Labonnote, L. C.: A self-consistent scattering model for cirrus. I: The solar region, Q. J. Roy. Meteor. Soc., 133, 1899–1912, https://doi.org/10.1002/QJ.164, 2007. a
Baran, A. J., Cotton, R., Furtado, K., Havemann, S., Labonnote, L. C., Marenco, F., Smith, A., and Thelen, J. C.: A self-consistent scattering model for cirrus. II: The high and low frequencies, Q. J. Roy. Meteor. Soc., 140, 1039–1057, https://doi.org/10.1002/QJ.2193, 2014a. a
Baran, A. J., Hill, P., Furtado, K., Field, P., and Manners, J.: A Coupled Cloud Physics–Radiation Parameterization of the Bulk Optical Properties of Cirrus and Its Impact on the Met Office Unified Model Global Atmosphere 5.0 Configuration, J. Climate, 27, 7725–7752, https://doi.org/10.1175/JCLI-D-13-00700.1, 2014b. a, b
Baran, A. J., Hilla, P., Walters, D., Hardman, S. C., Furtado, K., Field, P. R., and Manners, J.: The Impact of Two Coupled Cirrus Microphysics–Radiation Parameterizations on the Temperature and Specific Humidity Biases in the Tropical Tropopause Layer in a Climate Model, J. Climate, 29, 5299–5316, https://doi.org/10.1175/JCLI-D-15-0821.1, 2016. a, b, c
Baum, B. A., Yang, P., Heymsfield, A. J., Schmitt, C. G., Xie, Y., Bansemer, A., Hu, Y.-X., and Zhang, Z.: Improvements in Shortwave Bulk Scattering and Absorption Models for the Remote Sensing of Ice Clouds, J. Appl. Meteorol. Clim., 50, 1037–1056, https://doi.org/10.1175/2010JAMC2608.1, 2011. a
Cesana, G., Waliser, D. E., Henderson, D., L'Ecuyer, T. S., Jiang, X., and Li, J. L. F.: The vertical structure of radiative heating rates: A multimodel evaluation using A-Train satellite observations, J. Climate, 32, 1573–1590, 2019. a, b
Delanoë, J. and Hogan, R. J.: Combined CloudSat-CALIPSO-MODIS retrievals of the properties of ice clouds, J. Geophys. Res.-Atmos., 115, D00H29, https://doi.org/10.1029/2009JD012346, 2010. a
Dolinar, E. K., Dong, X., Xi, B., Jiang, J. H., Loeb, N. G., Campbell, J. R., and Su, H.: A global record of single-layered ice cloud properties and associated radiative heating rate profiles from an A-Train perspective, Clim. Dynam., 53, 3069–3088, https://doi.org/10.1007/S00382-019-04682-8, 2019. a
Emde, C., Buras-Schnell, R., Kylling, A., Mayer, B., Gasteiger, J., Hamann, U., Kylling, J., Richter, B., Pause, C., Dowling, T., and Bugliaro, L.: The libRadtran software package for radiative transfer calculations (version 2.0.1), Geosci. Model Dev., 9, 1647–1672, https://doi.org/10.5194/gmd-9-1647-2016, 2016. a
Forster, P., Storelvmo, T., Armour, K., Collins, W., Dufresne, J.-L., Frame, D., Lunt, D. J., Mauritsen, T., Palmer, M. D., Watanabe, M., Wild, M., and Zhang, H.: The Earth's Energy Budget, Climate Feedbacks, and Climate Sensitivity. In Climate Change 2021: The Physical Science Basis. Contribution of Working Group I to the Sixth Assessment Report of the Intergovernmental Panel on Climate Chang, edited by: Masson-Delmotte, V., Zhai, P., Pirani, A., Connors, S. L., Péan, C., Berger, S., Caud, N., Chen, Y., Goldfarb, L., Gomis, M. I., Huang, M., Leitzell, K., Lonnoy, E., Matthews, J. B. R., Maycock, T. K., Waterfield, T., Yelekçi, O., Yu, R., and Zhou, B., Cambridge University Press, Cambridge, United Kingdom and New York, NY, USA, 923–1054, https://doi.org/10.1017/9781009157896.009, 2021. a
Fu, Q.: An Accurate Parameterization of the Solar Radiative Properties of Cirrus Clouds for Climate Models, J. Climate, 9, 2058–2082, https://doi.org/10.1175/1520-0442(1996)009<2058:AAPOTS>2.0.CO;2, 1996. a, b, c
Fu, Q., Yang, P., and Sun, W. B.: An Accurate Parameterization of the Infrared Radiative Properties of Cirrus Clouds for Climate Models, J. Climate, 11, 2223–2237, https://doi.org/10.1175/1520-0442(1998)011<2223:AAPOTI>2.0.CO;2, 1998. a, b, c
Gallagher, M. W., Connolly, P. J., Crawford, I., Heymsfield, A., Bower, K. N., Choularton, T. W., Allen, G., Flynn, M. J., Vaughan, G., and Hacker, J.: Observations and modelling of microphysical variability, aggregation and sedimentation in tropical anvil cirrus outflow regions, Atmos. Chem. Phys., 12, 6609–6628, https://doi.org/10.5194/acp-12-6609-2012, 2012. a
Gasparini, B., Sullivan, S. C., Sokol, A. B., Kärcher, B., Jensen, E., and Hartmann, D. L.: Opinion: Tropical cirrus – from micro-scale processes to climate-scale impacts, Atmos. Chem. Phys., 23, 15413–15444, https://doi.org/10.5194/acp-23-15413-2023, 2023. a
Hartmann, D. L.: Tropical anvil clouds and climate sensitivity, P. Natl. Acad. Sci. USA, 113, 8897–8899, https://doi.org/10.1073/pnas.1610455113, 2016. a
Hartmann, D. L. and Berry, S. E.: The balanced radiative effect of tropical anvil clouds, J. Geophys. Res.-Atmos., 122, 5003–5020, https://doi.org/10.1002/2017JD026460, 2017. a, b, c
Haslehner, K., Gasparini, B., and Voigt, A.: Radiative Heating of High-Level Clouds and Its Impacts on Climate, J. Geophys. Res.-Atmos., 129, e2024JD040850, https://doi.org/10.1029/2024JD040850, 2024. a
Hogan, R. and European Centre for Medium-Range Weather Forecasts: ECMWF atmospheric radiation scheme (ecRad) version 1.5.0 (1.5.0), Zenodo [code], https://doi.org/10.5281/zenodo.15075773, 2022. a
Hogan, R. J. and Bozzo, A.: A Flexible and Efficient Radiation Scheme for the ECMWF Model, J. Adv. Model. Earth Sy., 10, 1990–2008, https://doi.org/10.1029/2018MS001364, 2018. a, b, c
Houze, R. A.: Cloud Dynamics, 2nd edn., Vol. 104, Elsevier Science, ISBN 9780123742667, 2014. a
Jahangir, E., Libois, Q., Couvreux, F., Vié, B., and Saint-Martin, D.: Uncertainty of SW Cloud Radiative Effect in Atmospheric Models Due to the Parameterization of Liquid Cloud Optical Properties, J. Adv. Model. Earth Sy., 13, e2021MS002742, https://doi.org/10.1029/2021MS002742, 2021. a
Järvinen, E., van Diedenhoven, B., Magee, N., Neshyba, S., Schnaiter, M., Xu, G., Jourdan, O., Delene, D., Waitz, F., Lolli, S., and Kato, S.: Ice Crystal Complexity and Link to the Cirrus Cloud Radiative Effect, in: Clouds and Their Climatic Impacts, edited by: Sullivan, S. C. and Hoose, C., Wiley – American Geophysical Union, Hoboken, NJ, USA, 47–85, https://doi.org/10.1002/9781119700357.ch3, 2023. a
Järvinen, E., Jourdan, O., Neubauer, D., Yao, B., Liu, C., Andreae, M. O., Lohmann, U., Wendisch, M., McFarquhar, G. M., Leisner, T., and Schnaiter, M.: Additional global climate cooling by clouds due to ice crystal complexity, Atmos. Chem. Phys., 18, 15767–15781, https://doi.org/10.5194/acp-18-15767-2018, 2018. a, b
Kang, H., Choi, Y. S., Hwang, J., and Kim, H. S.: On the cloud radiative effect for tropical high clouds overlying low clouds, Geoscience Letters, 7, 7, https://doi.org/10.1186/s40562-020-00156-6, 2020. a
Keshtgar, B., Voigt, A., Hoose, C., Riemer, M., and Mayer, B.: Cloud-radiative impact on the dynamics and predictability of an idealized extratropical cyclone, Weather Clim. Dynam., 4, 115–132, https://doi.org/10.5194/wcd-4-115-2023, 2023. a
Keshtgar, B., Voigt, A., Mayer, B., and Hoose, C.: Uncertainties in cloud-radiative heating within an idealized extratropical cyclone, Atmos. Chem. Phys., 24, 4751–4769, https://doi.org/10.5194/acp-24-4751-2024, 2024. a, b
Lawson, R. P., Baker, B. A., Pilson, B., and Mo, Q.: In Situ Observations of the Microphysical Properties of Wave, Cirrus, and Anvil Clouds. Part II: Cirrus Clouds, J. Atmos. Sci., 63, 3186–3203, https://doi.org/10.1175/JAS3803.1, 2006. a
Lawson, R. P., Jensen, E., Mitchell, D. L., Baker, B., Mo, Q., and Pilson, B.: Microphysical and radiative properties of tropical clouds investigated in TC4 and NAMMA, J. Geophys. Res.-Atmos., 115, D00J08, https://doi.org/10.1029/2009JD013017, 2010. a
Li, Y., Thompson, D. W. J., and Bony, S.: The influence of atmospheric cloud radiative effects on the large-scale circulation, J. Climate, 28, 7263–7278, https://doi.org/10.1175/JCLI-D-14-00825.1, 2015. a
Lin, J.-L. and Mapes, B. E.: Radiation Budget of the Tropical Intraseasonal Oscillation, J. Atmos. Sci., 61, 2050–2062, https://doi.org/10.1175/1520-0469(2004)061<2050:RBOTTI>2.0.CO;2, 2004. a
Llombart, P., Noya, E. G., and MacDowell, L. G.: Surface phase transitions and crystal habits of ice in the atmosphere, Science Advances, 6, eaay9322, https://doi.org/10.1126/sciadv.aay9322, 2020. a
Luo, B. and Minnett, P. J.: Evaluation of the ERA5 Sea Surface Skin Temperature with Remotely-Sensed Shipborne Marine-Atmospheric Emitted Radiance Interferometer Data, Remote Sensing, 12, 1873, https://doi.org/10.3390/rs12111873, 2020. a
Luo, H., Quaas, J., and Han, Y.: Examining cloud vertical structure and radiative effects from satellite retrievals and evaluation of CMIP6 scenarios, Atmos. Chem. Phys., 23, 8169–8186, https://doi.org/10.5194/acp-23-8169-2023, 2023. a
Mace, G. G. and Wrenn, F. J.: Evaluation of the Hydrometeor Layers in the East and West Pacific within ISCCP Cloud-Top Pressure–Optical Depth Bins Using Merged CloudSat and CALIPSO Data, J. Climate, 26, 9429–9444, https://doi.org/10.1175/JCLI-D-12-00207.1, 2013. a
Magee, N. B., Miller, A., Amaral, M., and Cumiskey, A.: Mesoscopic surface roughness of ice crystals pervasive across a wide range of ice crystal conditions, Atmos. Chem. Phys., 14, 12357–12371, https://doi.org/10.5194/acp-14-12357-2014, 2014. a
Mather, J. H., McFarlane, S. A., Miller, M. A., and Johnson, K. L.: Cloud properties and associated radiative heating rates in the tropical western Pacific, J. Geophys. Res.-Atmos., 112, 5201, https://doi.org/10.1029/2006JD007555, 2007. a
Medeiros, B., Clement, A. C., Benedict, J. J., and Zhang, B.: Investigating the impact of cloud-radiative feedbacks on tropical precipitation extremes, npj Climate and Atmospheric Science, 4, 1–10, https://doi.org/10.1038/s41612-021-00174-x, 2021. a
Morcrette, J.-J., Barker, H. W., Cole, J. N. S., Iacono, M. J., and Pincus, R.: Impact of a New Radiation Package, McRad, in the ECMWF Integrated Forecasting System, Mon. Weather Rev., 136, 4773–4798, https://doi.org/10.1175/2008MWR2363.1, 2008. a
Muller, C. and Romps, D.: Acceleration of tropical cyclogenesis by self-aggregation feedbacks, P. Natl. Acad. Sci. USA, 115, 2930–2935, https://doi.org/10.1073/pnas.1719967115, 2018. a
Noel, V., Chepfer, H., Haeffelin, M., and Morille, Y.: Classification of Ice Crystal Shapes in Midlatitude Ice Clouds from Three Years of Lidar Observations over the SIRTA Observatory, J. Atmos. Sci., 63, 2978–2991, https://doi.org/10.1175/JAS3767.1, 2006. a
Papavasileiou, G., Voigt, A., and Knippertz, P.: The role of observed cloud-radiative anomalies for the dynamics of the North Atlantic Oscillation on synoptic timescales, Q. J. Roy. Meteor. Soc., 146, 1822–1841, 2020. a
Pasquier, J. T., Henneberger, J., Korolev, A., Ramelli, F., Wieder, J., Lauber, A., Li, G., David, R. O., Carlsen, T., Gierens, R., Maturilli, M., and Lohmann, U.: Understanding the History of Two Complex Ice Crystal Habits Deduced From a Holographic Imager, Geophys. Res. Lett., 50, e2022GL100247, https://doi.org/10.1029/2022GL100247, 2023. a
Rädel, G., Mauritsen, T., Stevens, B., Dommenget, D., Matei, D., Bellomo, K., and Clement, A.: Amplification of El Niño by cloud longwave coupling to atmospheric circulation, Nat. Geosci., 9, 106–110, 2016. a
Ren, T., Yang, P., Loeb, N. G., Smith Jr., W. L., and Minnis, P.: On the Consistency of Ice Cloud Optical Models for Spaceborne Remote Sensing Applications and Broadband Radiative Transfer Simulations, J. Geophys. Res.-Atmos., 128, e2023JD038747, https://doi.org/10.1029/2023JD038747, 2023. a
Sato, K. and Okamoto, H.: Global Analysis of Height-Resolved Ice Particle Categories From Spaceborne Lidar, Geophys. Res. Lett., 50, e2023GL105522, https://doi.org/10.1029/2023GL105522, 2023. a
Satoh, M., Noda, A. T., Seiki, T., Chen, Y. W., Kodama, C., Yamada, Y., Kuba, N., and Sato, Y.: Toward reduction of the uncertainties in climate sensitivity due to cloud processes using a global non-hydrostatic atmospheric model, Progress in Earth and Planetary Science, 5, 1–29, https://doi.org/10.1186/S40645-018-0226-1, 2018. a
Schäfer, S. A. K. and Voigt, A.: Radiation weakens idealized midlatitude cyclones, Geophys. Res. Lett., 45, 2833–2841, 2018. a
Schnaiter, M., Järvinen, E., Vochezer, P., Abdelmonem, A., Wagner, R., Jourdan, O., Mioche, G., Shcherbakov, V. N., Schmitt, C. G., Tricoli, U., Ulanowski, Z., and Heymsfield, A. J.: Cloud chamber experiments on the origin of ice crystal complexity in cirrus clouds, Atmos. Chem. Phys., 16, 5091–5110, https://doi.org/10.5194/acp-16-5091-2016, 2016. a
Sepulveda Araya, E. I.: Codes and notebooks for the 1D-analysis of sensitivity of ice cloud radiative heating rate, Version v1, Zenodo [code], https://doi.org/10.5281/zenodo.13932540, 2024a. a
Sepulveda Araya, E. I.: Dataset and dependencies for the 1D-analysis of sensitivity of ice cloud radiative heating rate, Version v1, Zenodo [data set], https://doi.org/10.5281/zenodo.13932430, 2024b. a
Sokol, A. B. and Hartmann, D. L.: Tropical Anvil Clouds: Radiative Driving Toward a Preferred State, J. Geophys. Res.-Atmos., 125, e2020JD033107, https://doi.org/10.1029/2020JD033107, 2020. a, b
Sokol, A. B., Wall, C. J., and Hartmann, D. L.: nature geoscience Greater climate sensitivity implied by anvil cloud thinning, Nat. Geosci., 17, 398–403, https://doi.org/10.1038/s41561-024-01420-6, 2024. a, b
Sullivan, S., Voigt, A., Miltenberger, A., Rolf, C., and Krämer, M.: A Lagrangian Perspective of Microphysical Impact on Ice Cloud Evolution and Radiative Heating, J. Adv. Model. Earth Sy., 14, e2022MS003226, https://doi.org/10.1029/2022MS003226, 2022. a
Sullivan, S., Keshtgar, B., Albern, N., Bala, E., Braun, C., Choudhary, A., Hörner, J., Lentink, H., Papavasileiou, G., and Voigt, A.: How does cloud-radiative heating over the North Atlantic change with grid spacing, convective parameterization, and microphysics scheme in ICON version 2.1.00?, Geosci. Model Dev., 16, 3535–3551, https://doi.org/10.5194/gmd-16-3535-2023, 2023. a
Sullivan, S. C. and Voigt, A.: Ice microphysical processes exert a strong control on the simulated radiative energy budget in the tropics, Communications Earth & Environment, 2, 137, https://doi.org/10.1038/s43247-021-00206-7, 2021. a
Tao, W.-K., Lang, S., Simpson, J., Sui, C.-H., Ferrier, B., and Chou, M.-D.: Mechanisms of Cloud-Radiation Interaction in the Tropics and Midlatitudes, J. Atmos. Sci., 53, 2624–2651, https://doi.org/10.1175/1520-0469(1996)053<2624:MOCRII>2.0.CO;2, 1996. a
van Diedenhoven, B.: Remote Sensing of Crystal Shapes in Ice Clouds, Springer International Publishing, Cham, 197–250, https://doi.org/10.1007/978-3-319-70808-9_5, ISBN 978-3-319-70808-9, 2018. a
van Diedenhoven, B., Fridlind, A. M., Cairns, B., and Ackerman, A. S.: Variation of ice crystal size, shape, and asymmetry parameter in tops of tropical deep convective clouds, J. Geophys. Res.-Atmos., 119, 11809–11825, https://doi.org/10.1002/2014JD022385, 2014. a
Voigt, A. and Shaw, T. A.: Circulation response to warming shaped by radiative changes of clouds and water vapour, Nat. Geosci., 8, 102–106, https://doi.org/10.1038/ngeo2345, 2015. a
Voigt, A., Albern, N., Ceppi, P., Grise, K., Li, Y., and Medeiros, B.: Clouds, radiation, and atmospheric circulation in the present-day climate and under climate change, WIREs Clim. Change, 12, e694, https://doi.org/10.1002/WCC.694, 2021. a, b
Voigt, A., Keshtgar, B., and Butz, K.: Tug-of-war on idealized midlatitude cyclones between radiative heating from low-level and high-level clouds, Geophys. Res. Lett., 50, e2023GL103188, https://doi.org/10.1029/2023GL103188, 2023. a
Voigt, A., North, S., Gasparini, B., and Ham, S.-H.: Atmospheric cloud-radiative heating in CMIP6 and observations and its response to surface warming, Atmos. Chem. Phys., 24, 9749–9775, https://doi.org/10.5194/acp-24-9749-2024, 2024. a
Wu, B., Wang, Y., Fan, X., Liu, S., and Fu, Y.: A mixing scheme of ice particle models for global ice cloud measurements, Remote Sens. Environ., 313, 114356, https://doi.org/10.1016/j.rse.2024.114356, 2024. a
Yan, Y., Liu, Y., and Lu, J.: Cloud vertical structure, precipitation, and cloud radiative effects over Tibetan Plateau and its neighboring regions, J. Geophys. Res.-Atmos., 121, 5864–5877, https://doi.org/10.1002/2015JD024591, 2016. a
Yang, B. and Tan, Z.-M.: Interactive radiation accelerates the intensification of the midlevel vortex for tropical cyclogenesis, J. Atmos. Sci., 77, 4051–4065, https://doi.org/10.1175/JAS-D-20-0094.1, 2020. a
Yang, H., Dobbie, S., Herbert, R., Connolly, P., Gallagher, M., Ghosh, S., Al-Jumur, S. M. R. K., and Clayton, J.: The effect of observed vertical structure, habits, and size distributions on the solar radiative properties and cloud evolution of cirrus clouds, Q. J. Roy. Meteor. Soc., 138, 1221–1232, https://doi.org/10.1002/qj.973, 2012. a, b
Yang, P., Bi, L., Baum, B. A., Liou, K. N., Kattawar, G. W., Mishchenko, M. I., and Cole, B.: Spectrally Consistent Scattering, Absorption, and Polarization Properties of Atmospheric Ice Crystals at Wavelengths from 0.2 to 100 µm, J. Atmos. Sci., 70, 330–347, https://doi.org/10.1175/JAS-D-12-039.1, 2013. a
Yi, B.: Diverse cloud radiative effects and global surface temperature simulations induced by different ice cloud optical property parameterizations, Scientific Reports, 12, 10539, https://doi.org/10.1038/s41598-022-14608-w, 2022. a
Yi, B., Yang, P., Baum, B. A., L'Ecuyer, T., Oreopoulos, L., Mlawer, E. J., Heymsfield, A. J., and Liou, K. N.: Influence of Ice Particle Surface Roughening on the Global Cloud Radiative Effect, J. Atmos. Sci., 70, 2794–2807, https://doi.org/10.1175/JAS-D-13-020.1, 2013. a, b, c
Zelinka, M. D. and Hartmann, D. L.: Why is longwave cloud feedback positive?, J. Geophys. Res.-Atmos., 115, D16117, https://doi.org/10.1029/2010JD013817, 2010. a
Zhao, W., Peng, Y., Wang, B., Yi, B., Lin, Y., and Li, J.: Comparison of three ice cloud optical schemes in climate simulations with community atmospheric model version 5, Atmos. Res., 204, 37–53, https://doi.org/10.1016/J.ATMOSRES.2018.01.004, 2018. a, b