the Creative Commons Attribution 4.0 License.
the Creative Commons Attribution 4.0 License.
 | 14 Aug 2025
Contributions of lightning to long-term trends and inter-annual variability in global atmospheric chemistry constrained by Schumann resonance observations
Xiaobo Wang
Yuzhong Zhang
Tamás Bozóki
Ruosi Liang
Xinchun Xie
Shutao Zhao
Rui Wang
Yujia Zhao
Shuai Sun
Lightning is a significant source of nitrogen oxides () in the free troposphere. Variations in global lightning activity influence long-term trends (LTTs) and inter-annual variability (IAV) in tropospheric NOx, ozone (O3), and hydroxyl radicals (OH). However, accurately quantifying these impacts is hindered by uncertainties in representing year-to-year fluctuations in global lightning activity in models. Here, we apply Schumann resonance (SR) observations, which are sensitive to changes in global lightning activity, to better constrain inter-annual variations in lightning NOx (LNOx) emissions. By integrating this update into an atmospheric chemical transport model, we assess the contributions of lightning to both LTT and IAV in global atmospheric chemistry from 2013–2021. The updated parameterisation predicts an insignificant trend in global LNOx emissions, contrasting with a significant increase of 6.4 % dec−1 (P<0.05) by the original parameterisation, reducing lightning contributions to LTTs in NOx, O3, and OH. The updated simulation better aligns with satellite-observed trends in global and northern hemispheric NO2 but further underestimates tropospheric O3 increases. The updated parameterisation reveals twice the IAV in global LNOx emissions but 20 % smaller IAVs in global O3 and OH because lightning generally counteracts other sources of natural variability. A ∼10 % decline in lightning in 2020 relative to 2019 led to a ∼2 % decrease in global OH, explaining half of observed annual methane growth. These findings highlight the value of Schumann resonance observations in constraining global lightning activity, thereby enhancing our understanding of lightning's role in atmospheric chemistry.
- Article
(6023 KB) - Full-text XML
-
Supplement
(1371 KB) - BibTeX
- EndNote


Lightning generates reactive nitrogen oxides () by breaking down N2 and O2 in the intense heat of its flash channels, making it a primary natural source of NOx in the atmosphere (U. Schumann and Huntrieser, 2007). Although lightning accounts for only approximately 10 % of global NOx emissions, lightning NOx (referred to as LNOx) emissions have a disproportionately large impact on tropospheric ozone (O3) and hydroxyl radicals (OH) because lightning emits NOx directly to the free troposphere, where O3 and OH production is more sensitive to NOx than at the surface (Liaskos et al., 2015; Murray, 2016; Murray et al., 2021; Nussbaumer et al., 2023). For example, although LNOx emissions are of a similar magnitude to those from biomass burning or soils, their contribution to tropospheric O3 is about 3 times larger (Dahlmann et al., 2011). The contribution of LNOx to global atmospheric OH abundances is more than 20 % (Murray et al., 2021).
Tropospheric O3 and OH are important atmospheric species both chemically and environmentally. O3 is a potent greenhouse gas in the upper troposphere (IPCC, 2021), and when transported to the surface, it acts as an air pollutant that adversely affects the health of ecosystems and populations (Fleming et al., 2018; Unger et al., 2020). OH is the main sink for a diverse array of reduced species in the atmosphere, thereby influencing their environmental and climate impacts. For instance, even a small fluctuation in global mean OH concentrations can have a large effect on the budget of methane (CH4), the second-most important greenhouse gas after CO2, at the inter-annual scale (Turner et al., 2017; Rigby et al., 2017). Therefore, through regulating atmospheric chemistry, changes in global lightning activity can carry substantial implications for ecosystems, human health, and the climate.
Most atmospheric chemistry transport models (CTMs) rely on sub-grid parameterisations of lightning flash rates to estimate LNOx emissions, as fine-scale lightning physics cannot be fully captured by coarse-resolution CTMs (Murray et al., 2012). These parameterisations are often based on proxies of deep convection, such as the cloud-top height (Price and Rind, 1992) and the upward cloud ice flux (Finney et al., 2014). Cloud-top height parameterisation and its variants are commonly employed in CTMs. While the parameterised lightning flash rates align with convection patterns in simulations, they may not replicate the global spatial patterns of lightning activity (Tost et al., 2007). This limitation is improved by incorporating lightning observations from satellite-based lightning imaging sensors (LISs) and an optical transient detector (OTD) to constrain the distribution of LNOx emission provided by the parameterisation (Murray et al., 2012).
In addition, there is no assurance that parameterised lightning flash rates can capture year-to-year variations in global lightning activity and LNOx emissions (Clark et al., 2017). Studies have reported substantial disagreement between different parameterisations on the magnitude and even the direction of LTTs. For instance, parameterisation based on cloud-top height tends to predict an increase in global lightning activity in response to climate change, while estimations based on upward cloud ice fluxes predict the opposite outcome (Jacobson and Streets, 2009; Clark et al., 2017; Finney et al., 2018). This drawback impedes the assessment of lightning's impact on the LTTs and IAV of global tropospheric O3 and OH budgets.
Although lightning can be observed from ground- and space-based platforms, these observations may not offer adequate global-scale constraints on changes in lightning activity. The World Wide Lightning Location Network (WWLLN), operational since 2012, is a global ground-based lightning observation network. Despite providing detailed information on individual cloud-to-ground lightning strikes, these measurements lack sensitivity to intra-cloud lightning strikes (Abarca et al., 2010) and exhibit uneven global detection efficiency that varies over years (Hutchins et al., 2012), thereby limiting their utility in long-term global investigations (Bozóki et al., 2023). On the other hand, satellite observations, including the OTD on board OrbView-1 (formerly MicroLab-1) (May 1995–February 2000; coverage between ±70° latitude) and the LISs on board the Tropical Rainfall Measuring Mission (TRMM) satellite (January 1998–March 2015; coverage between ±38° latitude) and the International Space Station (ISS) (March 2017–October 2023; coverage between ±55° latitude), provide more uniform detection. However, these satellite data records are not continuous, and their data coverage and detection efficiency vary with the instrument and observation platform (Blakeslee et al., 2020; Clark et al., 2017).
Alternatively, global lightning activity can be derived from measurements of Schumann resonances (SRs), which are low-frequency electromagnetic waves within the atmosphere, primarily generated by lightning activity and resonating between the surface and the ionosphere (Balser and Wagner, 1960; Schumann, 1952; Nickolaenko and Hayakawa, 2002). Despite offering limited spatial information, the SR signal is sensitive to global lightning activity, in contrast to other observations with restricted coverage and variable detection efficiencies. This global sensitivity can be attributed to the minimal attenuation of lightning-induced radio waves within this specific frequency band (Chapman et al., 1966). Long-term SR measurements are also influenced by the solar cycle, as variations in solar X-ray flux and precipitating energetic particles lead to changes in wave propagation conditions (Bozóki et al., 2021). To effectively characterise global lightning activity using SR data, it is essential to eliminate the influence of solar cycles (Bozóki et al., 2021).
In this study, we apply SR observations to constrain global lightning activity and LNOx emissions. Using model simulations, we quantify the impact of this update on LNOx emissions and subsequently on global atmospheric chemistry. We focus the analysis on the global and hemispheric LTTs and IAV of NOx, O3, and OH. We also explore the implications of lightning variability for the global budgets of tropospheric O3 and CH4.
2.1 Lightning observation data
We use SR measurements at the Eskdalemuir Geomagnetic Observatory (ESK) in the UK, operated by the British Geological Survey (Beggan and Musur, 2018; Musur and Beggan, 2019), between 2013 and 2021. The measurements are performed at a cadence of 100 Hz with two orthogonal horizontal induction coils. Following Bozóki et al. (2021), we apply the weighted average method to obtain the intensities of the first three SR modes and manually exclude the disturbed days from the dataset. Such disturbed days are either of natural (e.g., local lightning activity; see Tatsis et al., 2021) or anthropogenic (e.g., nearby human activity; see Tritakis et al., 2021) origin. The removal of these data is based on the evidence that the diurnal variation in SR intensities is usually very similar within a given month (Bozóki et al., 2021; Sátori, 1996). Therefore, days with unusual diurnal variation are considered to be disturbed and are removed from the dataset during the manual sanitation process. We then derive the SR intensity, as a proxy for monthly global lightning activity, by summing the intensities of the first three resonance modes for both horizontal magnetic field components. We employ a third-order polynomial fit on the full data record to remove the influence of solar cycle variations.
To mitigate the impact of changes in the source–observer distance (Sátori et al., 2009) and day–night asymmetry (Melnikov et al., 2004), we utilise the SR intensity to parameterise the inter-annual variation in global lightning activity for each individual month. The premise is that in a given month the day–night condition does not change substantially and that the source–observer distance is the same year by year (Sátori et al., 2024). As a result, we use this SR dataset to estimate the shift in global lightning activity between, for instance, January 2013–January 2014, while it is not used to discern the changes from January 2013–February 2013. Figure 1 presents the 2013–2021 annual variation in monthly global lightning activity derived from SR observations.

Figure 1The inter-annual variation in global lightning activity based on SR observations in different months during 2013–2021.
We also compare SR-based global lightning activity with other global lightning observation data, including the ISS LIS data for 2018–2021, the TRMM LIS data for 2013–2014, and the WWLLN data (v2022.0.0) for 2013–2021 (Kaplan and Lau, 2021, 2022).
2.2 Lightning NOx emissions
LNOx emissions are computed in GEOS-Chem as the product of the lightning flash rate (F) and NO production per flash (PNO) for each grid-cell column at every model time step. The column total LNOx emissions are then vertically distributed based on Ott et al. (2010). GEOS-Chem estimates the lightning flash rate based on the cloud height parameterisation (Price and Rind, 1992), with its global distribution constrained by the climatology of OTD/LIS observations (Murray et al., 2012). This method is referred to as the original parameterisation (OP) hereafter.
To constrain the IAV of the global lightning flash rate with SR intensity, we apply a global scaling factor (S(m,y)), as a function of month m and year y, to the lightning flash rates computed from the OP method. Here we assume that for each individual month, the global lightning flash rate is proportional to the SR intensity, which is consistent with Boldi et al. (2018), Dyrda et al. (2014), and Heckman et al. (1998). The scaling factor is computed as
where FOP(m,y) is the global lightning flash rate in month m and year y computed by the OP method, is the multi-year (2013–2021) average of FOP(m,y), SR(m,y) is the SR intensity in month m and year y, and is the multi-year average of SR(m,y). Hereafter, this updated parameterisation is referred to as the SR method.
In addition, we also update the value of PNO to be 330 mol NO per flash all over the world (Luhar et al., 2021), consistent with the global average derived from satellite NO2 observations (Miyazaki et al., 2014; Marais et al., 2018). By comparison, the default PNO value in GEOS-Chem is 500 mol NO per flash north of 35° N and 260 mol for the rest of the world (Murray et al., 2012). Such a large enhancement of PNO in the northern midlatitudes relative to the rest of the world is not supported by a recent analysis of observed NO2 vertical profiles (Horner et al., 2024). NO2 satellite observations also indicate little difference in PNO between the midlatitudes and the tropics (Allen et al., 2019; Bucsela et al., 2019).
2.3 Atmospheric chemistry simulations
We use GEOS-Chem v14.0.2 in a global simulation of atmospheric chemistry between 2013 and 2021. The model includes a detailed mechanism for O3–NOx–CO–VOC–aerosol chemistry with recent updates in halogen chemistry, isoprene chemistry, and aerosol and cloud NOx uptake (Wang et al., 2021; Bates and Jacob, 2019; Holmes et al., 2019). The simulation, conducted at a 2°×2.5° horizontal resolution, is driven by reanalysed meteorology from the Modern-Era Retrospective analysis for Research and Applications, version 2 (MERRA-2) (Gelaro et al., 2017).
The simulation uses anthropogenic emissions compiled from multiple global and regional inventories. This includes global emissions from the CEDS emission inventory (Hoesly et al., 2018), which are superseded by the National Emissions Inventory 2011 (NEI-2011) in the US (US EPA, 2013), the Air Pollutant Emission Inventory (APEI) in Canada, MIX-Asia v1.1 in Asia (Li et al., 2017), and DICE-Africa in Africa (Marais and Wiedinmyer, 2016). Aircraft emissions for 2019, as provided by the Aircraft Emissions Inventory Code (AEIC) (Simone et al., 2013), are adjusted annually based on the Global Aviation emissions Inventory (GAIA) (Teoh et al., 2023, 2024) to account for inter-annual changes (Lee et al., 2021).
The simulation also incorporates a variety of natural emissions, including fire emissions from the Global Fire Emissions Database (GFED4; van der Werf et al., 2017), biogenic emissions from the Model of Emissions of Gases and Aerosols from Nature version 2.1 (MEGAN2.1; Guenther et al., 2012), soil NOx emissions from the Berkeley–Dalhousie Soil NOx Parameterization (Hudman et al., 2012), and LNOx emissions from either OP or SR methods.
We compare atmospheric chemistry simulations driven by OP- or SR-based LNOx emissions, with a focus on the LTTs and IAV in NOx, O3, and OH. To isolate the lightning contribution to the LTTs and IAV, we also perform a simulation driven by the multi-year (2013–2021) average LNOx emissions and analyse the difference from simulations with annually varying LNOx emissions. The simulation with 2013–2021 average LNOx emissions also provides information on the contribution of non-lightning factors (e.g., fires, biogenic emissions, and meteorology) to the LTTs and IAV in NO2, O3, and OH, allowing for the decomposition of the LTTs and IAV into contributions of lightning and non-lightning factors.
3.1 LTTs and IAV of global lightning activity and LNOx emissions
Figure 2 presents global lightning activity and LNOx emissions as determined by the SR method, which are compared with results from the OP method and lightning observations from the ground WWLLN and satellite LIS instruments. The SR method indicates an insignificant LTT in global lightning activity and LNOx emissions over the study period, in contrast to the OP method, which predicts an increase by 6.4 % dec−1 (P<0.05) from 2013–2021 (Fig. 2a). As a comparison, the WWLLN also observes insignificant LTTs, although the SR method and WWLLN observations do not always agree on annual anomalies. Indeed, the OP method in GEOS-Chem predicts significant increases in global LNOx emissions over an even longer period (1990–2022; Fig. 3). Although our SR data are unavailable for an earlier period, this result of the OP method is again inconsistent with TRMM LIS observations, which show no trend for 1998–2014 in the tropics (Fig. 3). These results highlight the significant uncertainties in the unconstrained OP method in estimating the LTTs of global lightning activity, demonstrating the value of applying the SR method to long-term atmospheric chemistry simulations.

Figure 2(a) Annual anomalies in global lightning activities and LNOx emissions during 2013–2021 based on the OP method and observations from SR, WWLLN, the TRMM LIS, and the ISS LIS. Grey shading indicates years with large anomalies (>5 %) in global lightning activities and LNOx emissions based on SR observations. LTTs and IAV of the annual anomaly time series are shown to the right. (b) Seasonal LTTs and IAV in global LNOx emissions based on the OP method and observations from SR and WWLLN during 2013–2021. The dashed yellow lines show global mean LNOx emissions in different seasons. LTT values are in units of in (a) and in (b). ** indicates significant trends (P<0.05) and * moderately significant trends (). IAV values represent the standard deviation of annual anomalies after the LTT is removed.
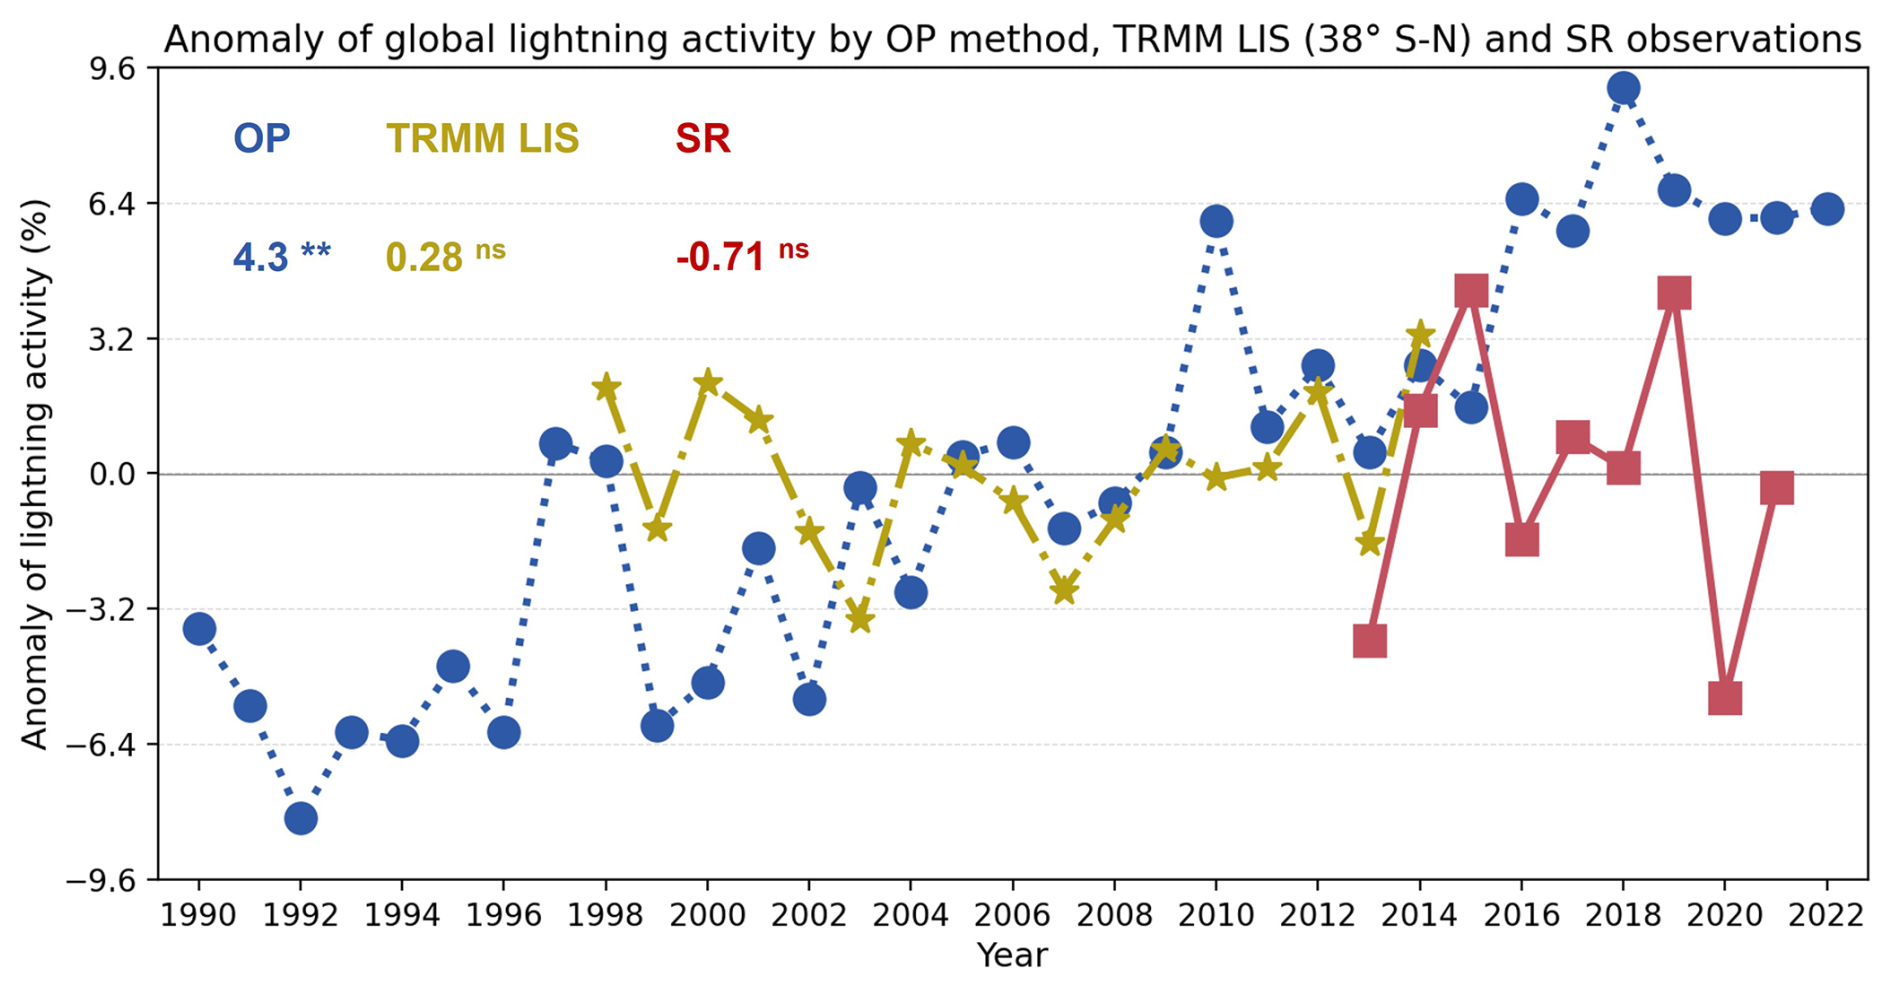
Figure 3Anomaly of global lightning activity based on the OP method, TRMM LIS (38° S–38° N), and SR observations. The linear trends (% dec−1) are shown in the upper-left corner. ** denotes significant trends (P<0.05), * moderately significant trends (), and ns insignificant trends.
We quantify the magnitude of IAV in LNOx emissions by computing the standard deviation of detrended annual anomalies. The results show that the IAV derived from the SR method (0.23 Tg N a−1 or 3.3 %) is twice that derived from the OP method (0.13 Tg N a−1 or 1.8 %) (Fig. 2a), indicating that the IAV in LNOx emissions is underestimated by the OP method. The magnitude of IAV in global lightning activity observed by the WWLLN (0.25 Tg N a−1 or 3.6 %) is close to that observed by the SR observations (Fig. 2a). Consistent with our result, a previous study by Murray et al. (2013) also found that the cloud-top height parameterisation underestimates the IAV in tropical LNOx emissions by a factor of approximately 2 compared to TRMM LIS satellite observations.
Seasonally, the SR method finds that the magnitudes of IAVs in LNOx emissions are 0.028 Tg N month−1 in DJF (austral summer) and 0.013 Tg N month−1 in JJA (boreal summer) (Fig. 2b), which translates to relative IAVs of 6.7 % and 1.8 % for the two seasons, respectively (average LNOx emissions are 0.42 and 0.73 Tg N month−1 in DJF and JJA, respectively) (Fig. 2b). Because of the dominant occurrence of lightning in the summer hemisphere, this result based on the SR method indicates a factor of 3.7 greater relative IAVs in LNOx emissions over the Southern Hemisphere than over the Northern Hemisphere. In contrast, the OP method predicts similar levels of relative IAVs in both hemispheres (Fig. 2b).
In terms of year-to-year anomalies, the SR method shows large increases in global lightning activity and LNOx emissions during 2013–2015, 2018–2019, and 2020–2021 and decreases in 2015–2016 and 2019–2020 (Fig. 2a). These large year-to-year anomalies are not captured by the OP method (Fig. 2a). Although the SR method and WWLLN observations show consistent increases for 2020–2021 and decreases for 2015–2016 and 2019–2020, they disagree on year-to-year changes during 2013–2015, 2017–2018, and 2018–2019, probably because of variable global detection efficiency by the ground WWLLN (Hutchins et al., 2012). The SR results agree well with satellite-based LIS observations for the increase during 2013–2014 and the decrease during 2019–2020, while satellite-based observations are unavailable for 2015–2017. Noteworthily, SR and ISS LIS observations conformably show that global lightning activity decreased by ∼10 % from 2019–2020 (Fig. 2a). Such a large inter-annual deviation is unprecedented in the history of LIS observation records (Fig. 3), which is in accordance with previous finds by Dunn et al. (2022; see Fig. SB2.1b).
3.2 Lightning-driven LTTs of global atmospheric chemistry
Figure 4 shows the contribution of LNOx emissions, as determined by the OP or SR methods, to global LTTs and IAV in key atmospheric chemicals (NOx, O3, and OH) based on GEOS-Chem simulations. The contribution of lightning is further compared to that of other influencing factors. The stable LNOx emissions predicted by the SR method result in insignificant lightning-induced LTTs in NOx, O3, and OH during 2013–2021, both globally and in two hemispheres (Figs. 4a–c, S1a–c, and S2a–c in the Supplement). In contrast, the OP method, with increases in LNOx emissions, leads to substantial lightning-induced LTTs in these species. These trends are statistically significant for NOx (2.1 % dec−1), O3 (1.0 % dec−1), and OH (1.4 % dec−1) in the Northern Hemisphere and for NOx (1.9 % dec−1) globally (Figs. S1a–c and 4a).
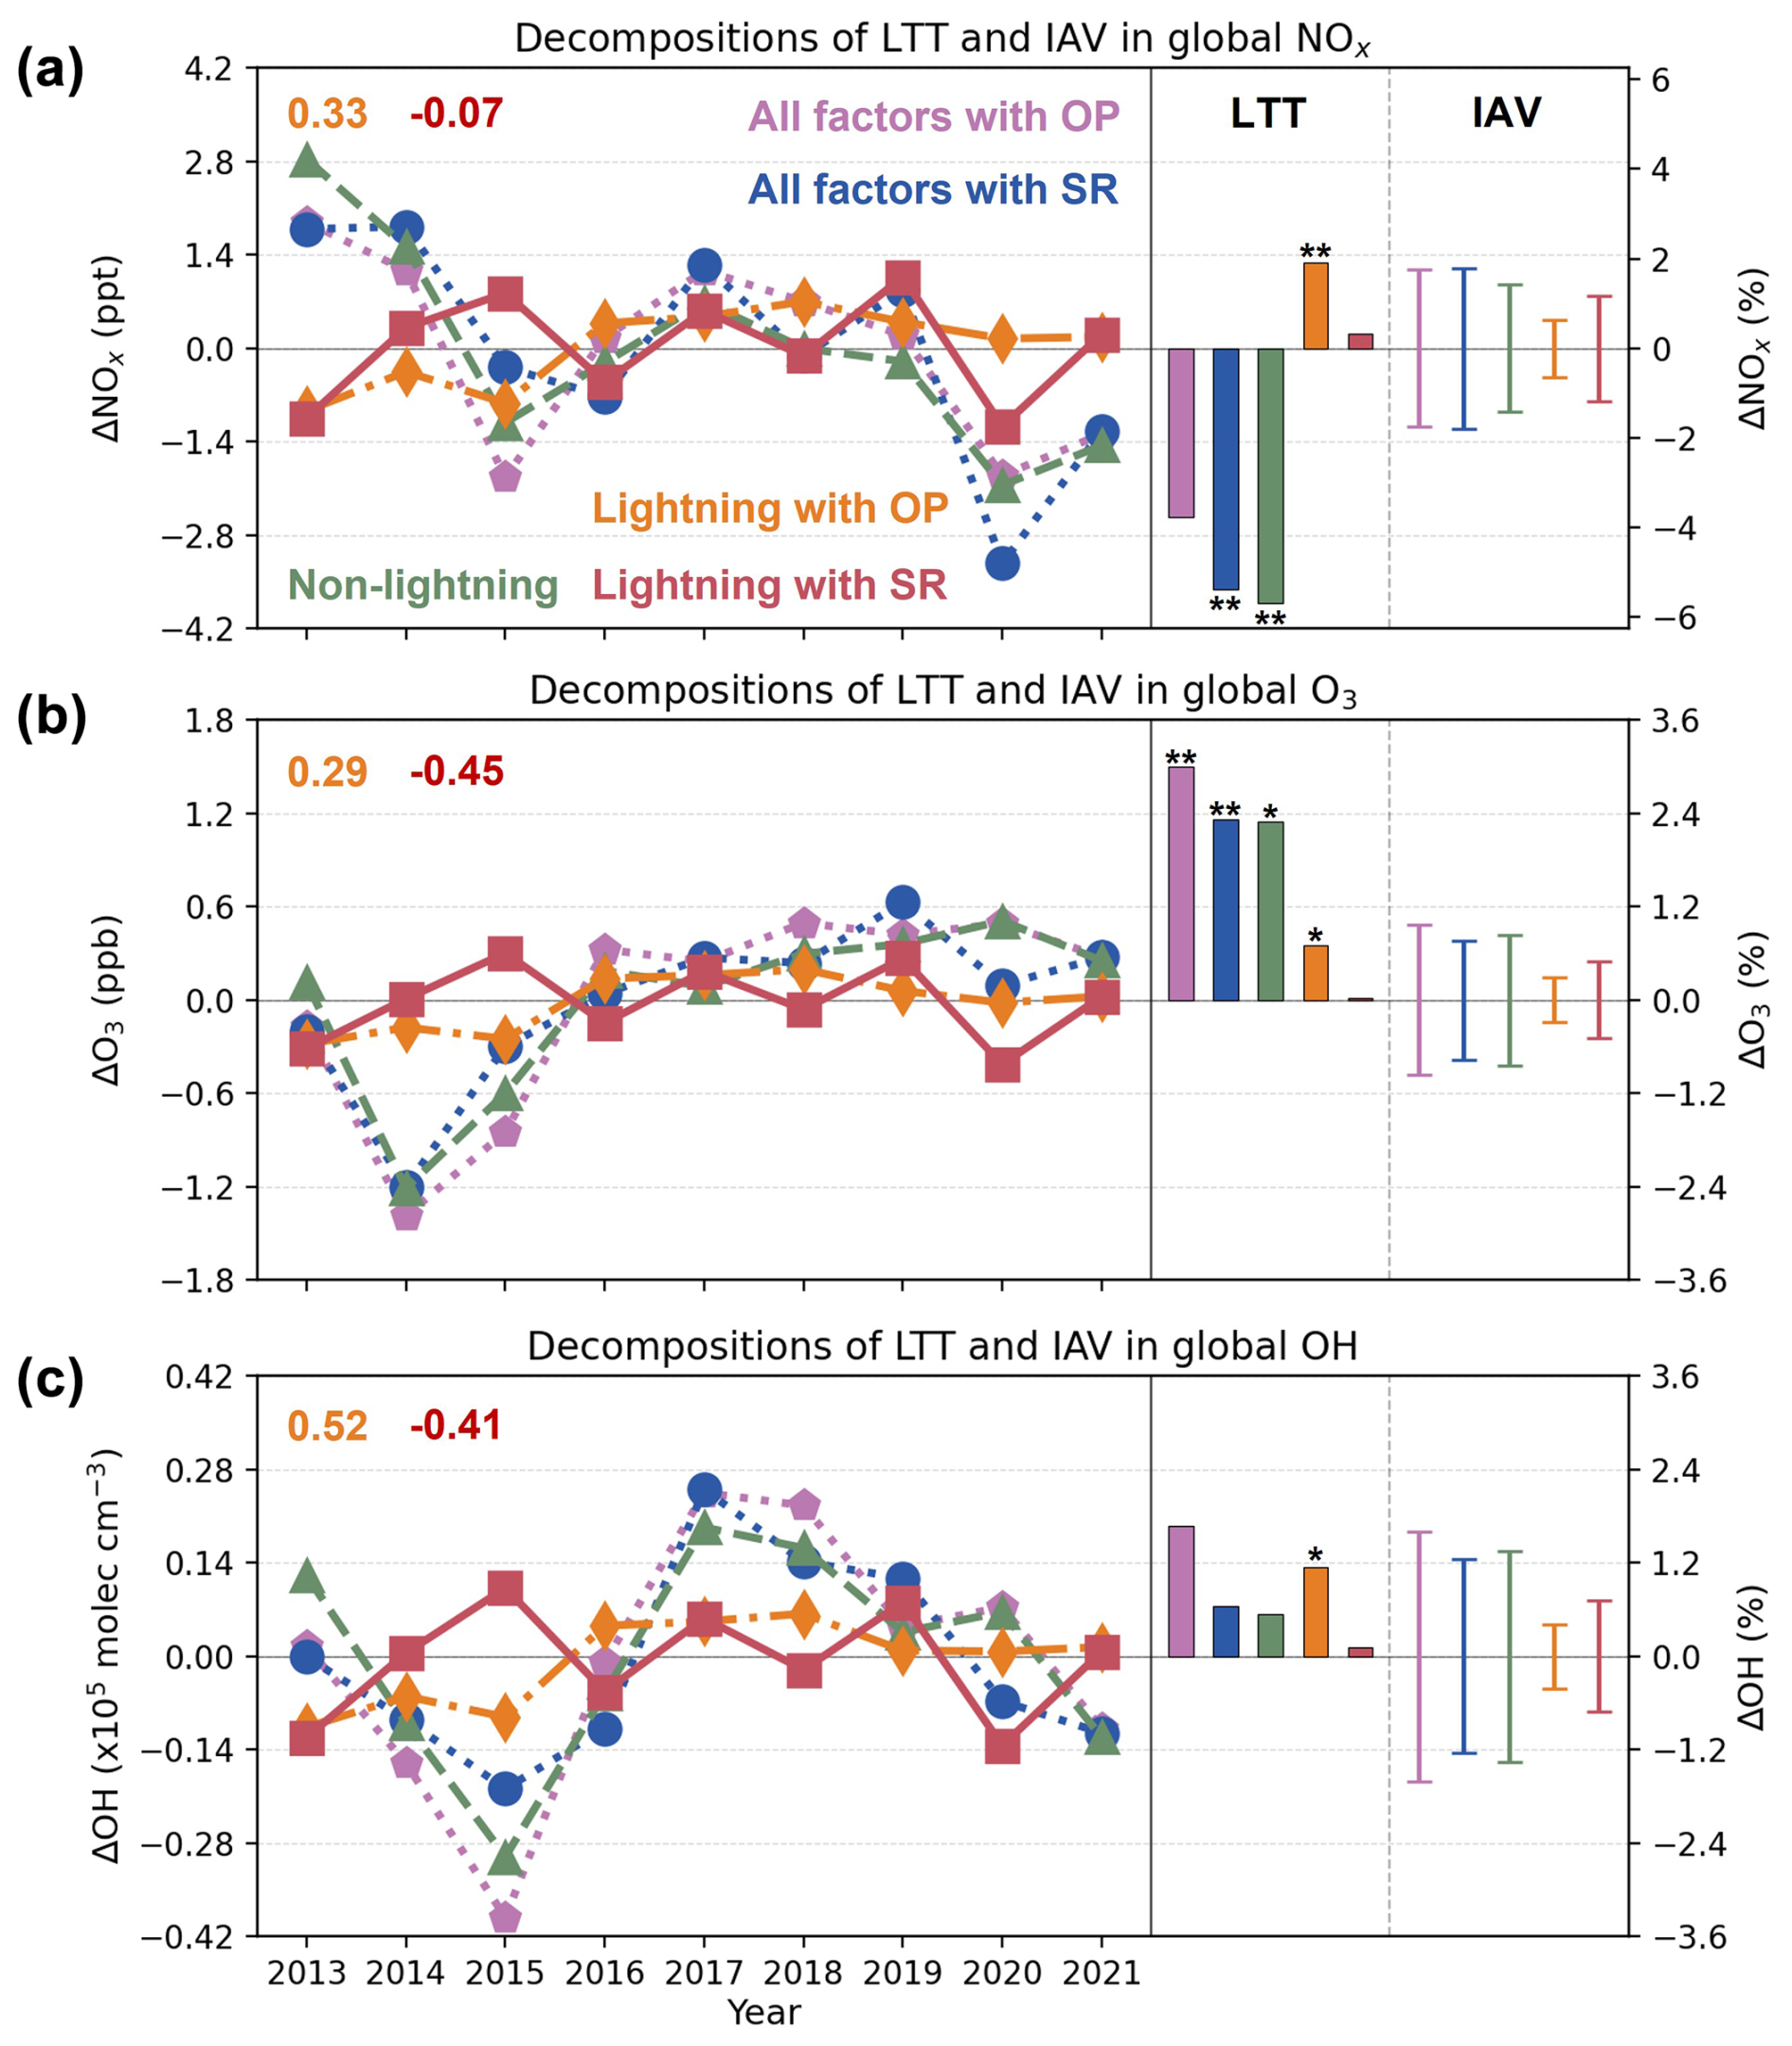
Figure 4Annual anomalies, LTTs, and IAV of global NOx (a), O3 (b), and OH (c) and their decompositions into lightning and non-lightning factors during 2013–2021. LTT values are reported in units of % dec−1. ** denotes significant trends (P<0.05) and * moderately significant trends (). IAV values represent the standard deviation of annual anomalies after LTTs are removed. Shown in the upper-left corner of each panel are correlation coefficients between the annual anomalies (with LTTs removed) of lightning (OP: orange; SR: red) and non-lightning contributions.
When all factors are accounted for, the GEOS-Chem model based on the SR method simulates a strong decrease in global () and northern hemispheric () NOx concentrations during 2013–2021 (Figs. 4a and S1a), driven primarily by a reduction in global anthropogenic emissions, especially from China (Wang et al., 2022). However, if the simulation is based on the OP method, these negative trends are reduced to globally and in the Northern Hemisphere (Figs. 4a and S1a). The sharper decrease predicted by the SR simulation is in better agreement with the trends in tropospheric NO2 columns from satellite observations during the period (Fig. 5a and b), though the simulation still does not fully capture the inter-annual anomalies, possibly due to errors in non-lightning factors. This difference between the OP- and SR-based simulations highlights the critical role of accurately accounting for lightning in better interpreting long-term trends in global background NOx levels and estimating the expected effects of emission reduction policies for improving air quality.
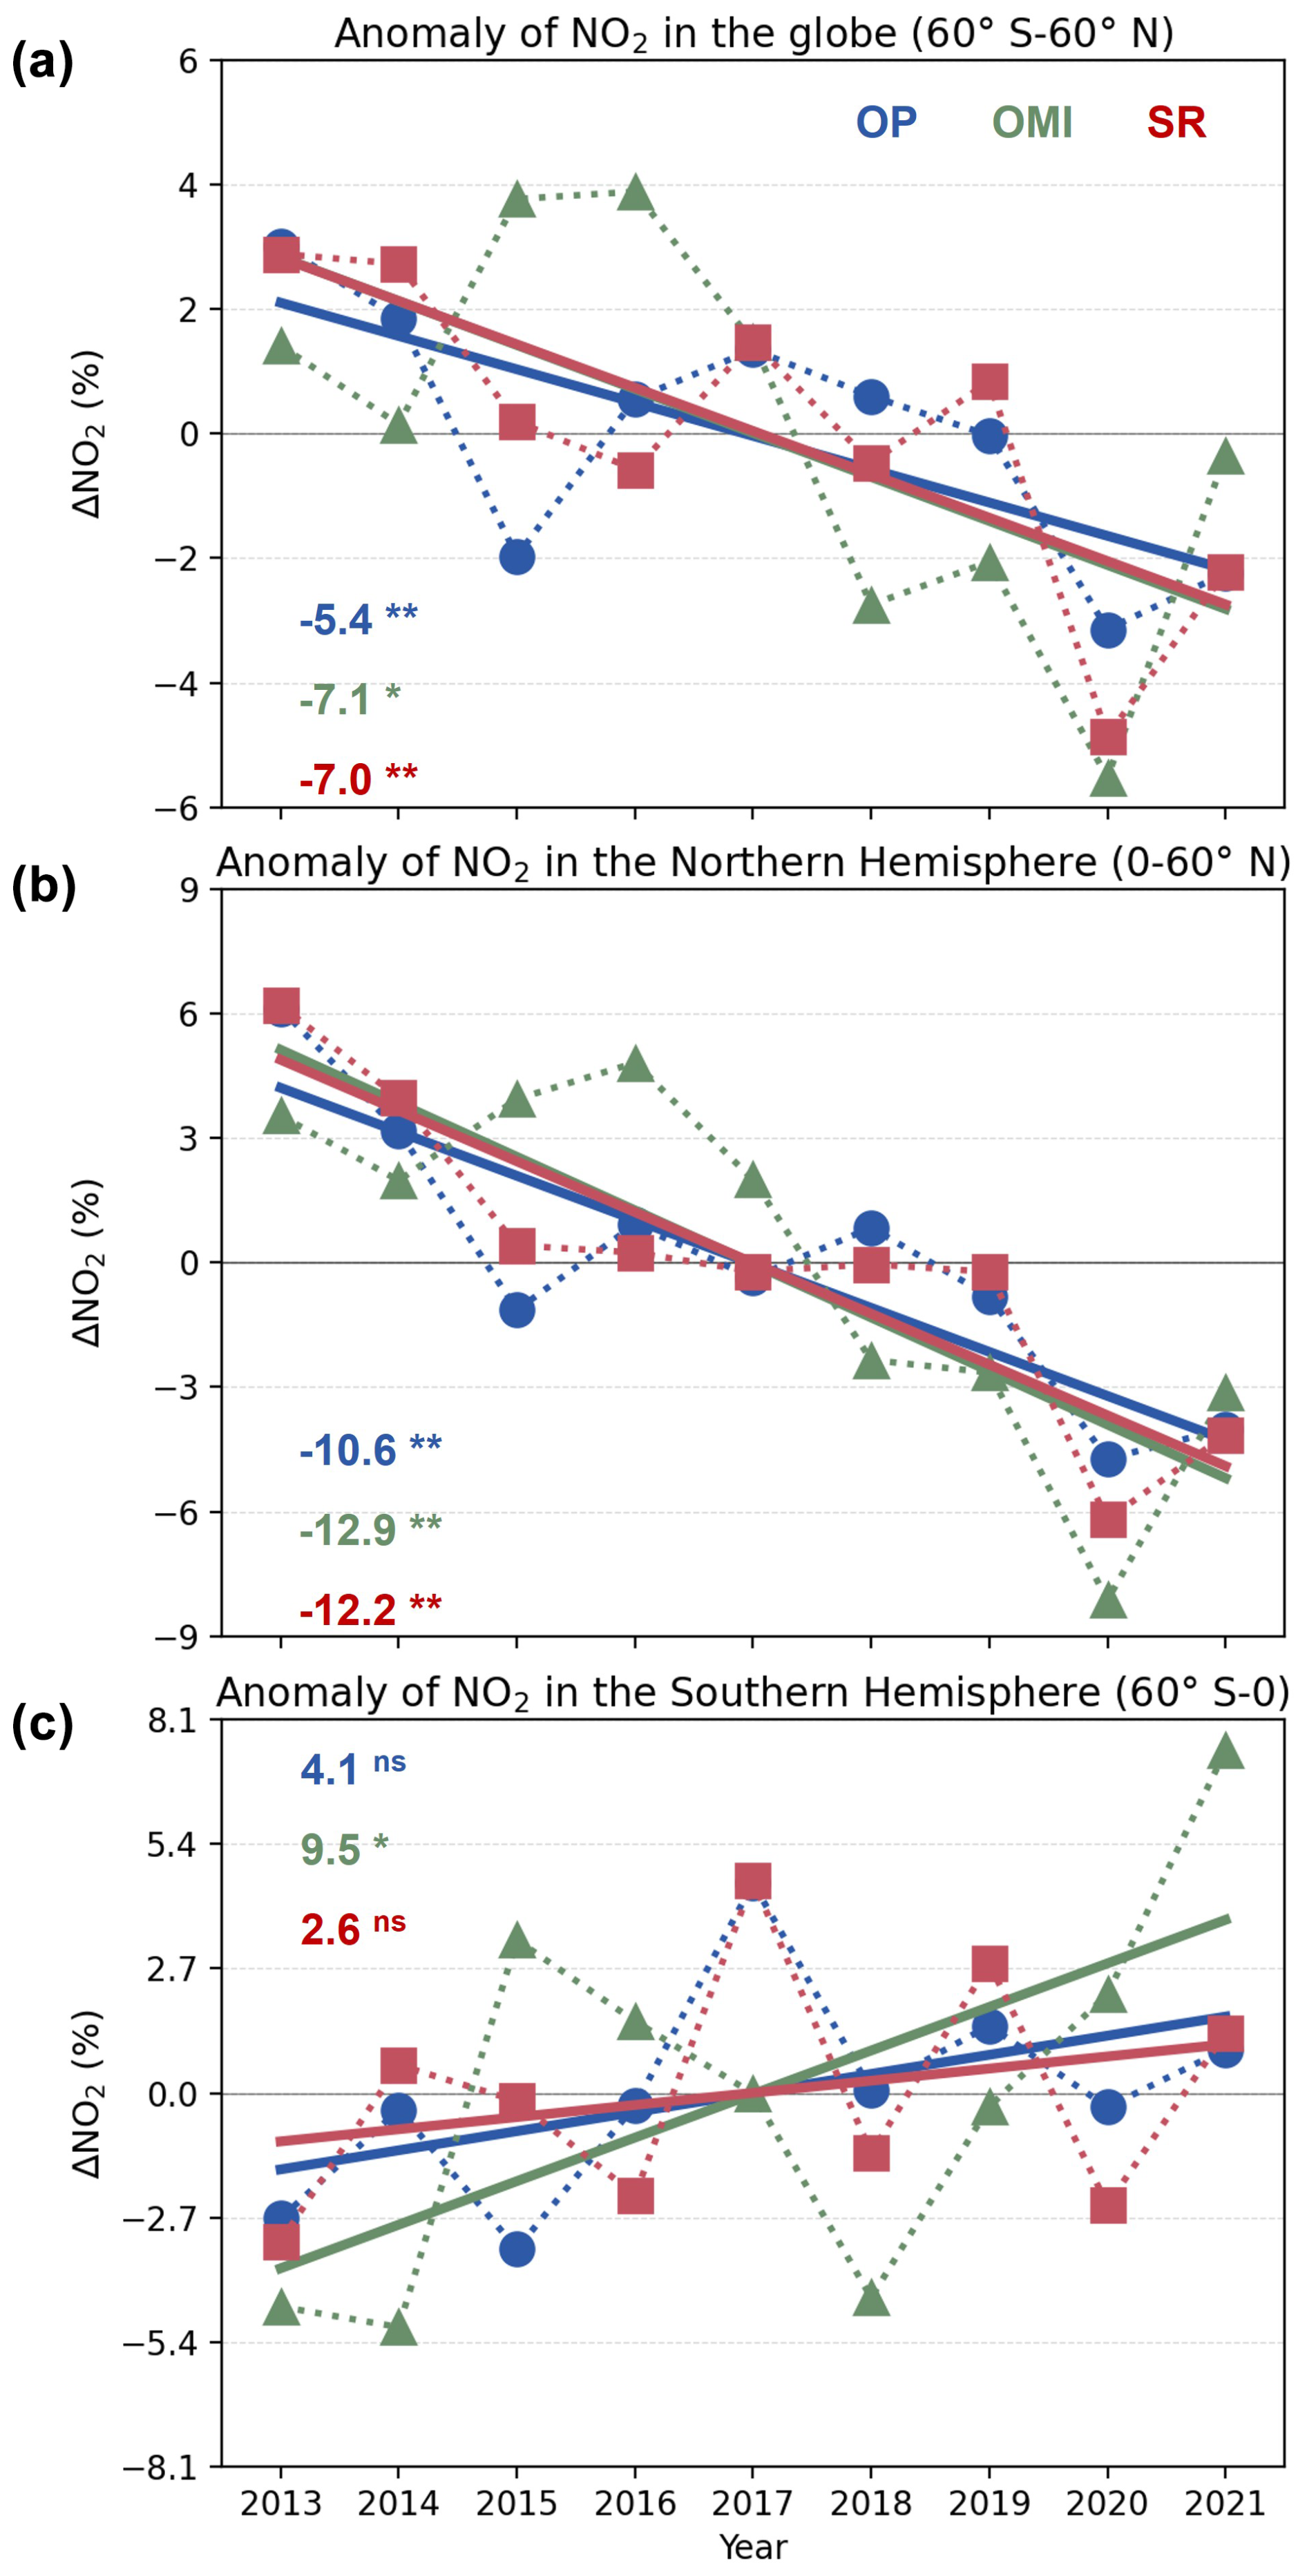
Figure 5The anomaly of tropospheric NO2 vertical column densities averaged over the globe (a), the Northern Hemisphere (b), and the Southern Hemisphere (c) during 2013–2021 for OP and SR simulations and OMI satellite observations. The linear trends (% dec−1) are inset. ** denotes significant trends (P<0.05), * moderately significant trends (), and ns insignificant trends. Following Qu et al. (2021), we filter the data using quality flags reported in the OMI data product. We exclude data affected by the row anomalies and retain those with a cloud fraction<0.2, surface albedo<0.3, solar zenith angle<75°, and view zenith angle<65°.
The GEOS-Chem simulation using SR LNOx emissions estimates increases for global and hemispheric tropospheric O3 (Figs. 4b, S1b, and S2b). These trends are ∼30 % greater when the simulation is based on the OP method. This result suggests that non-lightning factors are major drivers of the simulated increases in tropospheric O3, while lightning is a non-negligible contributor. Previous studies have reported that CTMs tend to underestimate the observed long-term increase in tropospheric O3 (Christiansen et al., 2022; Wang et al., 2022) over a longer time frame (since the 1990s) than the one in our current study. Their results are based on LNOx emissions by the OP method, which predicts accelerated increases in global lightning activity in the last 3 decades (4.3 % dec−1 increase during 1991–2000, 6.9 % dec−1 during 2001–2010, and 7.9 % dec−1 during 2011–2020), inconsistent with the SR intensity in our study and satellite observations for the earlier period (Fig. 3). This result implies that after adjusting the LTTs in LNOx emissions with SR observations, the model underestimation of O3 trends should be even more pronounced, underscoring the gap in our understanding of tropospheric O3 trends.
3.3 Lightning-driven IAV in atmospheric oxidants and implications for the global methane budget
Figures 4b and c show that the simulation using SR LNOx emissions exhibits greater magnitudes of lightning-induced IAVs in global average O3 and OH concentrations compared to the simulation using OP LNOx emissions. This is due to the larger IAV in LNOx emissions predicted by the SR method (Fig. 2a). However, when all factors are accounted for, the IAVs in global O3 and OH are more than 20 % smaller in the SR simulation compared to the OP simulation. The smaller all-factor IAVs in the SR simulation arise from a negative correlation between the lightning and non-lightning contributions (), indicating that lightning serves as a balancing factor that reduces the IAVs of O3 and OH globally. Conversely, in the OP simulation, the lightning contributions positively correlate with the non-lightning contributions (r=0.3 for O3 and 0.5 for OH), thereby amplifying the IAVs of O3 and OH (Fig. 4b and c).
The year-to-year variations in global OH concentrations can impact the annual growth rates of atmospheric methane, as the OH radical is the main sink of methane in the atmosphere. NOAA observations indicate high annual methane growth rates in 2014, 2015, 2020, and 2021 (Fig. 6), although the underlying causes are not yet fully understood (Feng et al., 2023; Stevenson et al., 2022; Yin et al., 2021; Zhang et al., 2021, 2023). Figure 6 quantifies the contribution of lightning-induced OH variations to annual methane growth rates from 2013–2021, based on the simulation using SR LNOx emissions. The influence of other factors, including direct methane emissions and OH variations due to non-lightning drivers, is deduced from the difference between observed growth rates and lightning contributions.

Figure 6Contributions of lightning-driven variations in the methane sink by OH oxidation to the annual atmospheric methane growth rate (MGR) from 2013–2021 based on SR observations. The gap between the observed year-to-year anomalies in MGR and the simulated lightning contribution is attributed to non-lightning factors.
Based on the simulation using SR emissions, lightning-driven OH variations account for 0.7–3.0 ppb a−1 year-to-year anomalies in methane growth rates, with positive contributions in 2015–2016, 2017–2018, and 2019–2020 and negative contributions in other years (Fig. 6). In most cases, the influence of lightning counteracts that of other factors, suppressing changes in methane growth rates, as seen in 2013–2014, 2015–2016, and 2020–2021. However, there are also cases where lightning works in conjunction with other factors. Notably, in 2019–2020, both lightning and other factors contribute to an accelerated methane growth. As mentioned in Sect. 3.1, global lightning declined by ∼10 % from 2019–2020. Our analysis indicates that the reduction in global lightning activity can generate a ∼2 % decrease in OH sinks and explain ∼54 % of the 2020 surge in atmospheric methane. Current theories have not accounted for the impact of abnormal lightning activity on the 2020 methane spike (Feng et al., 2023; Peng et al., 2022; Stevenson et al., 2022; Chen et al., 2025).
3.4 Comparison of year-to-year anomalies to regional observations
The integration of SR observations into the OP parameterisation results in differences of several percent in the annual average global background concentrations of NOx, O3, and OH. While these differences between the SR and OP methods can have substantial implications for the global budgets of these species, systematic assessment using atmospheric chemical observations is challenging due to the impact of other factors across multiple scales. Here, we present two cases characterised by strong lightning-driven year-to-year anomalies, allowing us to compare simulations driven by OP and SR parameterisations to regional atmospheric observations.
In the first case, we analyse the change in high-altitude NO2 concentrations over South America between September–November of 2019 and 2020, comparing the changes simulated with OP and SR LNOx emissions with those observed by the Tropospheric Monitoring Instrument (TROPOMI). The time frame is chosen due to the substantial decrease in global lightning activity detected by SR observations (Fig. S3a in the Supplement). South America is chosen because the continent is a lightning hotspot (Fig. S3b) and, unlike other continental hotspots, experiences lower interference by confounding factors such as fire (e.g., Africa and Indonesia) and anthropogenic (e.g., North America) emissions (see Supplement for detailed discussion).
Using the cloud-slicing technique (Marais et al., 2021; Marais and Roberts, 2020) on TROPOMI observations (version 01-03-02, accessible through the Sentinel-5P Pre-Operations Data Hub), we retrieved mean NO2 concentrations in the upper troposphere (300–100 hPa), where the impact of lightning is greatest (Fig. S3c), at a 2°×2.5° resolution for September–November of 2019 and 2020 (Fig. S4 in the Supplement). The 3-month cloud-sliced satellite observations over South America are averaged and compared to GEOS-Chem simulations. The analysis reveals a change in NO2 concentrations of −3 (−8 to 3) ppb in the upper troposphere over South America, as observed by TROPOMI, which aligns closely with the simulation driven by SR LNOx emissions (−5.5 (−11 to 0) ppb) (Fig. 7a). In contrast, the simulation driven by OP LNOx emissions results in an increase in NO2 concentrations (9 (4–14) ppb) (uncertainties shown in the brackets are estimated with bootstrapping; the same applies hereafter).
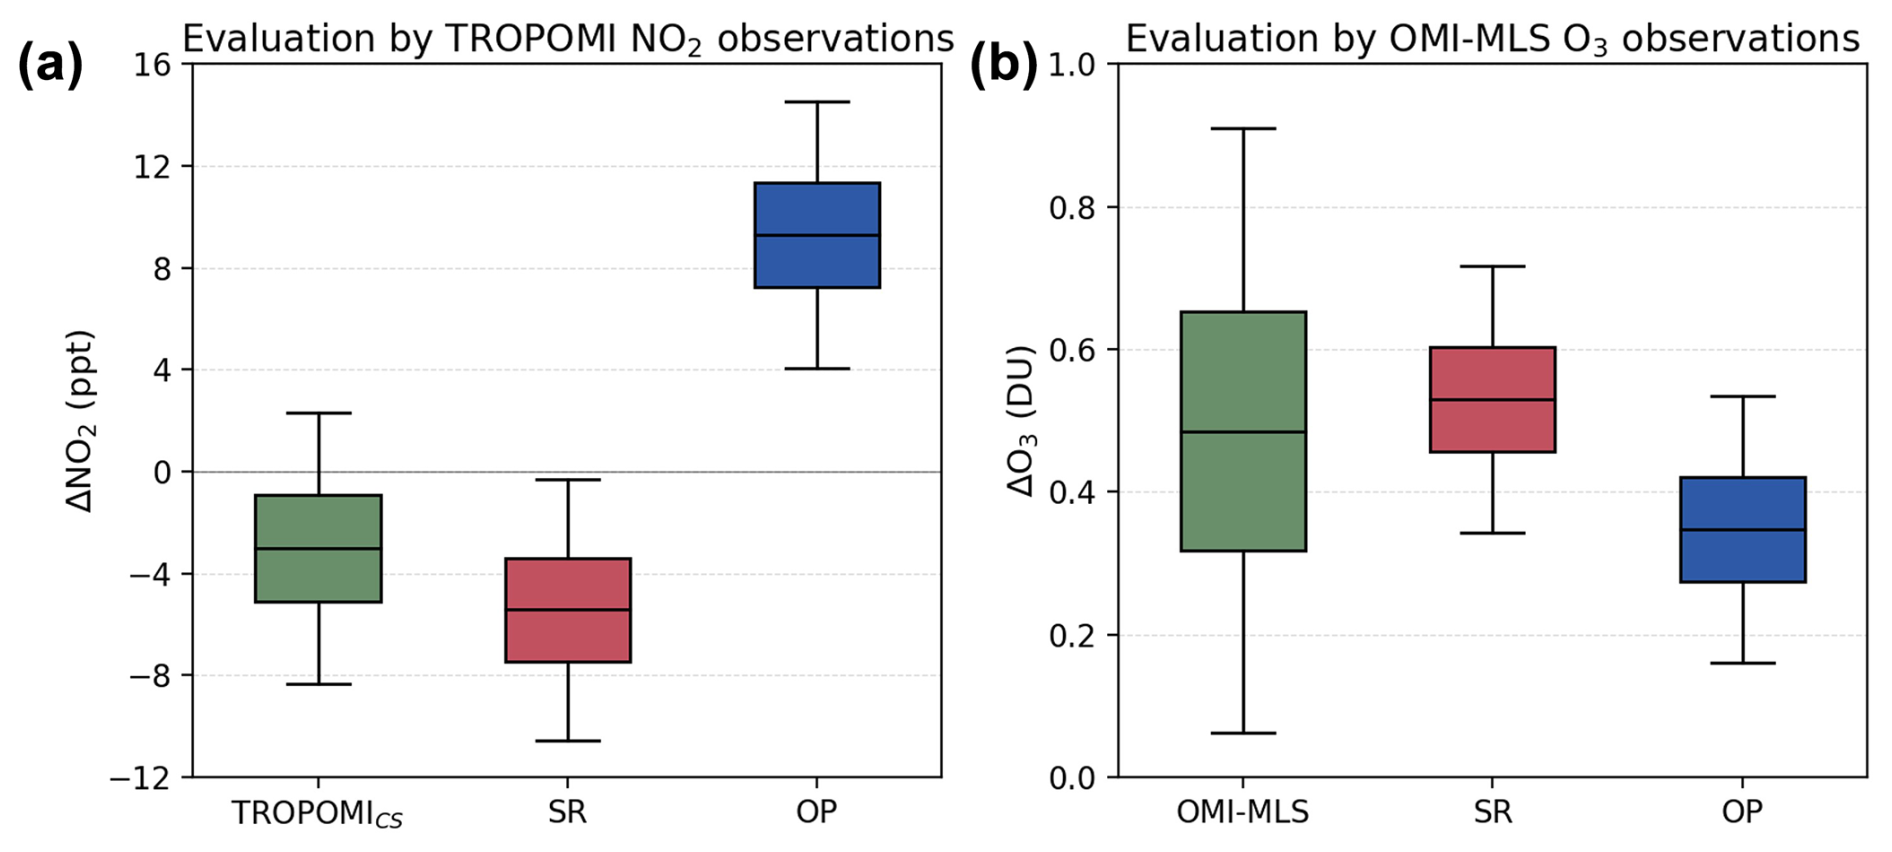
Figure 7(a) Anomalies of NO2 concentrations in the upper troposphere (300–100 hPa) of northern South America (20° S–10° N and 80–40° W) in September–November 2020 relative to 2019 from the TROPOMI NO2 observations by the cloud-slicing technique (green), the GEOS-Chem simulation with the SR method (red), and the GEOS-Chem simulation with the OP method (blue). (b) Anomalies of tropospheric O3 in the North Atlantic (0–60° N and 100° W–30° E) in 2015 relative to 2014 from the OMI-MLS O3 observations (green), the GEOS-Chem simulation with the SR method (red), and the GEOS-Chem simulation with the OP method (blue). Uncertainties are calculated by 1 000 000 Monte Carlo simulations.
In the second case, we examine changes in tropospheric O3 concentrations over the North Atlantic Ocean in 2014–2015. Russo et al. (2023) highlighted that annual anomalies in tropospheric O3 over this region are closely linked to lightning activity, but this variability is not well captured by atmospheric chemical models. One such instance is the substantial increase in tropospheric ozone by 0.49 (0.1–0.9) DU measured by the OMI-MLS satellite product between 2014 and 2015, shown in Fig. S5 in the Supplement (Russo et al., 2023). In comparison, our GEOS-Chem simulation with OP LNOx emissions underestimates this increase (0.35 (0.2–0.5) DU), while the simulation with SR LNOx emissions agrees better with observed ozone changes (0.53 (0.3–0.7) DU) (Fig. 7b). However, we note that the difference between the OP and SR results is not significant if the uncertainties are accounted for (Fig. 7b), indicating that this case represents weak evidence supporting the SR method.
In this study, we updated the parameterisation of LNOx emissions in the GEOS-Chem model by incorporating SR observations, which offer strong global sensitivity to lightning. This update aimed to better constrain the LTTs and IAV in global lightning activity and hence improve the simulation of global atmospheric chemistry.
The updated global LNOx emissions showed insignificant LTTs from 2013–2021, while the original results predicted a significant increase by 6.4 % dec−1 (P<0.05). As a comparison, the WWLLN also observed no significant trend. Indeed, the original method in GEOS-Chem indicated significant increases in global LNOx emissions over an even longer period (1990–2022). Although our SR data were unavailable for an earlier period, this result of the original method was again inconsistent with TRMM LIS observations, which showed no trend for 1998–2014 in the tropics (±38° latitude). Meanwhile, the updated LNOx emissions had an IAV twice as high as that of the original result, which was close to that by WWLLN observations. These results highlighted the significant uncertainties in the unconstrained method in estimating the LTTs and IAV of global lightning, demonstrating the value of applying the SR method to long-term atmospheric chemistry simulations.
Compared to the original simulation, the simulation with updated LNOx emissions found smaller contributions of lightning to the LTTs in NOx, O3, and OH. This led to sharper decreases in simulated global and northern hemispheric NOx concentrations during 2013–2021, in better agreement with the trends in tropospheric NO2 columns from satellite observations. Previous research has reported that CTMs tended to underestimate the observed long-term increase in tropospheric O3 (Christiansen et al., 2022; Wang et al., 2022). Our study showed that the increase in tropospheric O3 from the original simulation was ∼30 % greater than in the updated results, implying that the updated simulation further underestimated tropospheric O3 trends and highlighting the gap in our understanding of tropospheric O3.
Moreover, lightning-induced anomalies in O3 and OH were negatively correlated with those caused by non-lightning factors (e.g., wildfires, biogenic emissions, and meteorology). This suggests that lightning serves as a counterbalancing factor, reducing the IAV of O3 and OH, an opposite feature shown in the original simulation. Our analysis showed that the change in global OH concentration due to IAV in LNOx emissions was a substantial contributor to the inter-annual variations in methane growth rates. Notably, SR and ISS LIS observations consistently found that 2020 global lightning fell by ∼10 % relative to 2019, in line with Dunn et al. (2022), which might be the biggest year-to-year change in nearly 3 decades. It resulted in a ∼2 % drop in OH levels, representing ∼54 % of the growth of atmospheric methane in this year. Therefore, our study also suggests that the variability in lightning activity and LNOx emissions needs to be taken into account when making the global atmospheric methane budget.
We used lightning observation data, including ISS LIS data (https://doi.org/10.5067/LIS/ISSLIS/DATA109, Lang, 2022), TRMM LIS data (https://doi.org/10.5067/LIS/LIS/DATA201, Blakeslee, 1998), WWLLN data (v2022.0.0) (https://doi.org/10.5281/zenodo.6007052, Kaplan and Lau, 2021, 2022), and Schumann-resonance-derived monthly lightning variation data (shown in Fig. 1). The source code of GEOS-Chem (v14.0.2) is freely available through https://doi.org/10.5281/zenodo.7383492 (The International GEOS-Chem User Community, 2022). The tropospheric NO2 observation data are available at https://doi.org/10.5067/Aura/OMI/DATA2017 (Krotkov et al., 2019). The MGR data from NOAA's surface sites can be downloaded from https://doi.org/10.15138/P8XG-AA10 (Lan et al., 2022). We used the cloud-slicing algorithm introduced by Marais et al. (2021) and the corresponding Python code (https://doi.org/10.5281/zenodo.3979211, Marais and Roberts, 2020a) and subsequent improvements in the code (https://doi.org/10.5281/zenodo.4058442, Marais and Roberts, 2020b). The OMI-MLS observation data can be downloaded from https://acd-ext.gsfc.nasa.gov/Data_services/cloud_slice/ (Ziemke et al., 2006).
The supplement related to this article is available online at https://doi.org/10.5194/acp-25-8929-2025-supplement.
YuzZ and XW conceptualised the study. XW led the formal analysis and simulated GEOS-Chem under the supervision of YuzZ. XW, YuzZ, TB, RL, XX, SZ, RW, YujZ, and SS were responsible for the methodology. XW, YuzZ, and TB provided resources. XW visualised the study. XW wrote the original draft, and YuzZ and TB reviewed and edited the paper.
The contact author has declared that none of the authors has any competing interests.
Publisher's note: Copernicus Publications remains neutral with regard to jurisdictional claims made in the text, published maps, institutional affiliations, or any other geographical representation in this paper. While Copernicus Publications makes every effort to include appropriate place names, the final responsibility lies with the authors.
We thank the High-performance Computing Center of Westlake University for the facility support and technical assistance. SR global lightning activity is based on the high-frequency magnetic field induction coil data from the Eskdalemuir Observatory, UK, which are supplied by the Natural Environment Research Council (UK) and are available from the National Geoscience Data Centre (NGDC). We thank Ciarán Beggan (British Geological Survey) for initial processing of the induction coil dataset and valuable suggestions for enhancing the clarity of the text.
This research has been supported by the National Key Research and Development Program of China (grant no. 2022YFE0209100), the National Natural Science Foundation of China (grant no. 42275112), the foundation of Westlake University, the National Research, Development, and Innovation Office, Hungary-NKFIH (project nos. K138824 and PD146019), and the János Bolyai Research Scholarship of the Hungarian Academy of Sciences (grant no. BO/00352/24).
This paper was edited by Christopher Cantrell and reviewed by two anonymous referees.
Abarca, S. F., Corbosiero, K. L., and Galarneau, T. J.: An evaluation of the Worldwide Lightning Location Network (WWLLN) using the National Lightning Detection Network (NLDN) as ground truth, J. Geophys. Res.-Atmos., 115, D18106, https://doi.org/10.1029/2009jd013411, 2010.
Allen, D. J., Pickering, K. E., Bucsela, E., Krotkov, N., and Holzworth, R.: Lightning NOx Production in the Tropics as Determined Using OMI NO2 Retrievals and WWLLN Stroke Data, J. Geophys. Res.-Atmos., 124, 13498–13518, https://doi.org/10.1029/2018jd029824, 2019.
Balser, M. and Wagner, C. A.: Observations of Earth-Ionosphere Cavity Resonances, Nature, 188, 638–641, https://doi.org/10.1038/188638a0, 1960.
Bates, K. H. and Jacob, D. J.: A new model mechanism for atmospheric oxidation of isoprene: global effects on oxidants, nitrogen oxides, organic products, and secondary organic aerosol, Atmos. Chem. Phys., 19, 9613–9640, https://doi.org/10.5194/acp-19-9613-2019, 2019.
Beggan, C. D. and Musur, M.: Observation of Ionospheric Alfvén Resonances at 1–30 Hz and Their Superposition With the Schumann Resonances, J. Geophys. Res.-Space, 123, 4202–4214, https://doi.org/10.1029/2018ja025264, 2018.
Blakeslee, R. J.: Lightning Imaging Sensor (LIS) on TRMM Science Data, NASA EOSDIS Global Hydrology Resource Center Distributed Active Archive Center, Huntsville, Alabama, USA [data set], https://doi.org/10.5067/LIS/LIS/DATA201, 1998.
Blakeslee, R. J., Mach, D. M., Bateman, M. G., and Koshak, W. J.: Three Years of the Lightning Imaging Sensor Onboard the International Space Station: Expanded Global Coverage and Enhanced Applications, J. Geophys. Res.-Atmos., 125, e2020JD032918, https://doi.org/10.1029/2020jd032918, 2020.
Boldi, R., Williams, E., and Guha, A.: Determination of the Global-Average Charge Moment of a Lightning Flash Using Schumann Resonances and the LIS/OTD Lightning Data, J. Geophys. Res.-Atmos., 123, 108–123, https://doi.org/10.1002/2017jd027050, 2018.
Bozóki, T., Sátori, G., Williams, E., and Prácser, E.: Solar Cycle-Modulated Deformation of the Earth-Ionosphere Cavity, Front. Earth Sci., 9, 689127, https://doi.org/10.3389/feart.2021.689127, 2021.
Bozóki, T., Sátori, G., Williams, E., Prácser, E., and Albrecht, R. I.: Day-To-Day Quantification of Changes in Global Lightning Activity Based on Schumann Resonances, J. Geophys. Res.-Atmos., 128, e2023JD038557, https://doi.org/10.1029/2023jd038557, 2023.
Bucsela, E. J., Pickering, K. E., Allen, D. J., Holzworth, R. H., and Krotkov, N. A.: Midlatitude Lightning NOx Production Efficiency Inferred From OMI and WWLLN Data, J. Geophys. Res.-Atmos., 124, 13475–13497, https://doi.org/10.1029/2019jd030561, 2019.
Chapman, F. W., Jones, D. L., Todd, J. D. W., and Challinor, R. A.: Observation on the propagation constant of the Earth-ionosphere waveguide in the frequency band 8 kc/s to 16 kc/s, Radio Sci., 1, 1273–1282, https://doi.org/10.1002/rds19661111273, 1966.
Chen, W., Zhang, Y., and Liang, R.: Converging evidence for reduced global atmospheric oxidation in 2020, Natl. Sci. Rev., 12, nwaf232, https://doi.org/10.1093/nsr/nwaf232, 2025.
Christiansen, A., Mickley, L. J., Liu, J., Oman, L. D., and Hu, L.: Multidecadal increases in global tropospheric ozone derived from ozonesonde and surface site observations: can models reproduce ozone trends?, Atmos. Chem. Phys., 22, 14751–14782, https://doi.org/10.5194/acp-22-14751-2022, 2022.
Clark, S. K., Ward, D. S., and Mahowald, N. M.: Parameterization-based uncertainty in future lightning flash density, Geophys. Res. Lett., 44, 2893–2901, https://doi.org/10.1002/2017gl073017, 2017.
Dahlmann, K., Grewe, V., Ponater, M., and Matthes, S.: Quantifying the contributions of individual NOx sources to the trend in ozone radiative forcing, Atmos. Environ., 45, 2860–2868, https://doi.org/10.1016/j.atmosenv.2011.02.071, 2011.
Dyrda, M., Kulak, A., Mlynarczyk, J., Ostrowski, M., Kubisz, J., Michalec, A., and Nieckarz, Z.: Application of the Schumann resonance spectral decomposition in characterizing the main African thunderstorm center, J. Geophys. Res.-Atmos., 119, 485–13, https://doi.org/10.1002/2014jd022613, 2014.
Dunn, R. J. H., Aldred, F., Gobron, N., Miller, J. B., Willett, K. M., Ades, M., Adler, R., Allan, R. P., Anderson, J., Anneville, O., Aono, Y., Argüez, A., Arosio, C., Augustine, J. A., Azorin-Molina, C., Barichivich, J., Basu, A., Beck, H. E., Bellouin, N., Benedetti, A., Blagrave, K., Blenkinsop, S., Bock, O., Bodin, X., Bosilovich, M. G., Boucher, O., Bove, G., Buechler, D., Buehler, S. A., Carrea, L., Chang, K., Christiansen, H. H., Christy, J. R., Chung, E., Ciasto, L. M., Coldewey-Egbers, M., Cooper, O. R., Cornes, R. C., Covey, C., Cropper, T., Crotwell, M., Cusicanqui, D., Davis, S. M., de Jeu, R. A. M., Degenstein, D., Delaloye, R., Donat, M. G., Dorigo, W. A., Durre, I., Dutton, G. S., Duveiller, G., Elkins, J. W., Estilow, T. W., Fedaeff, N., Fereday, D., Fioletov, V. E., Flemming, J., Foster, M. J., Frith, S. M., Froidevaux, L., Füllekrug, M., Garforth, J., Garg, J. Gentry, M., Goodman, S., Gou, Q., Granin, N., Guglielmin, M., Hahn, S., Haimberger, L., Hall, B. D., Harris, I., Hemming, D. L., Hirschi, M., Ho, S., Holzworth, R., Hrbáček, F., Hubert, D., Hulsman, P., Hurst, D. F., Inness, A., Isaksen, K., John, V. O., Jones, P. D., Junod, R., Kääb, A., Kaiser, J. W., Kaufmann, V., Kellerer-Pirklbauer, A., Kent, E. C., Kidd, R., Kim, H., Kipling, Z., Koppa, A., L’Abée-Lund, J. H., Lan, X., Lantz, K. O., Lavers, D., Loeb, N. G., Loyola, D., Madelon, R., Malmquist, H. J., Marszelewski, W., Mayer, M., McCabe, M. F., McVicar, T. R., Mears, C. A., Menzel, A., Merchant, C. J., Miralles, D. G., Montzka, S. A., Morice, C., Mösinger, L., Mühle, J., Nicolas, J. P., Noetzli, J., Nõges, T., Noll, B., O’Keefe, J., Osborn, T. J., Park, T., Pellet, C., Pelto, M. S., Perkins-Kirkpatrick, S. E., Phillips, C., Po-Chedley, S., Polvani, L., Preimesberger, W., Price, C., Pulkkanen, M., Rains, D. G., Randel, W. J., Rémy, S., Ricciardulli, L., Richardson, A. D., Robinson, D. A., Rodell, M., Rodríguez-Fernández, N. J., Rosenlof, K. H., Roth, C., Rozanov, A., Rutishäuser, T., Sánchez-Lugo, A., Sawaengphokhai, P., Schenzinger, V., Schlegel, R. W., Schneider, U., Sharma, S., Shi, L., Simmons, A. J., Siso, C., Smith, S. L., Soden, B. J., Sofieva, V., Sparks, T. H., Stackhouse, P. W., Stauffer, R., Steinbrecht, W., Steiner, A. K., Stewart, K., Stradiotti, P., Streletskiy, D. A., Telg, H., Thackeray, S. J., Thibert, E., Todt, M., Tokuda, D., Tourpali, K., Tye, M. R., van der A, R., van der Schalie, R., van der Schrier, G., van der Vliet, M., van der Werf, G. R., van Vliet, A., Vernier, J., Vimont, I. J., Virts, K., Vivero, S., Vömel, H., Vose, R. S., Wang, R. H. J., Weber, M., Wiese, D., Wild, J. D., Williams, E., Wong, T., Woolway, R. I., Yin, X., Yuan, Y., Zhao, L., Zhou, X., Ziemke, J. R., Ziese, M., and Zotta, R. M.: Global Climate, B. Am. Meteorol. Soc., 103, S11–S142, https://doi.org/10.1175/bams-d-22-0092.1, 2022.
Feng, L., Palmer, P. I., Parker, R. J., Lunt, M. F., and Bösch, H.: Methane emissions are predominantly responsible for record-breaking atmospheric methane growth rates in 2020 and 2021, Atmos. Chem. Phys., 23, 4863–4880, https://doi.org/10.5194/acp-23-4863-2023, 2023.
Finney, D. L., Doherty, R. M., Wild, O., Huntrieser, H., Pumphrey, H. C., and Blyth, A. M.: Using cloud ice flux to parametrise large-scale lightning, Atmos. Chem. Phys., 14, 12665–12682, https://doi.org/10.5194/acp-14-12665-2014, 2014.
Finney, D. L., Doherty, R. M., Wild, O., Stevenson, D. S., MacKenzie, I. A., and Blyth, A. M.: A projected decrease in lightning under climate change, Nat. Clim. Change, 8, 210–213, https://doi.org/10.1038/s41558-018-0072-6, 2018.
Fleming, Z. L., Doherty, R. M., von Schneidemesser, E., Malley, C. S., Cooper, O. R., Pinto, J. P., Colette, A., Xu, X., Simpson, D., Schultz, M. G., Lefohn, A. S., Hamad, S., Moolla, R., Solberg, S., Feng, Z., Helmig, D., Lewis, A.: Tropospheric Ozone Assessment Report: Present-day ozone distribution and trends relevant to human health, Elem. Sci. Anth., 6, 273, https://doi.org/10.1525/elementa.273, 2018.
Gelaro, R., McCarty, W., Suárez, M. J., Todling, R., Molod, A., Takacs, L., Randles, C. A., Darmenov, A., Bosilovich, M. G., Reichle, R., Wargan, K., Coy, L., Cullather, R., Draper, C., Akella, S., Buchard, V., Conaty, A., da Silva, A. M., Gu, W., Kim, G.-K., Koster, R., Lucchesi, R., Merkova, D., Nielsen, J. E., Partyka, G., Pawson, S., Putman, W., Rienecker, M., Schubert, S. D., Sienkiewicz, M., and Zhao, B.: The Modern-Era Retrospective Analysis for Research and Applications, Version 2 (MERRA-2), J. Climate, 30, 5419–5454, https://doi.org/10.1175/jcli-d-16-0758.1, 2017.
Guenther, A. B., Jiang, X., Heald, C. L., Sakulyanontvittaya, T., Duhl, T., Emmons, L. K., and Wang, X.: The Model of Emissions of Gases and Aerosols from Nature version 2.1 (MEGAN2.1): an extended and updated framework for modeling biogenic emissions, Geosci. Model Dev., 5, 1471–1492, https://doi.org/10.5194/gmd-5-1471-2012, 2012.
Heckman, S. J., Williams, E., and Boldi, B.: Total global lightning inferred from Schumann resonance measurements, J. Geophys. Res.-Atmos., 103, 31775–31779, https://doi.org/10.1029/98jd02648, 1998.
Hoesly, R. M., Smith, S. J., Feng, L., Klimont, Z., Janssens-Maenhout, G., Pitkanen, T., Seibert, J. J., Vu, L., Andres, R. J., Bolt, R. M., Bond, T. C., Dawidowski, L., Kholod, N., Kurokawa, J.-I., Li, M., Liu, L., Lu, Z., Moura, M. C. P., O'Rourke, P. R., and Zhang, Q.: Historical (1750–2014) anthropogenic emissions of reactive gases and aerosols from the Community Emissions Data System (CEDS), Geosci. Model Dev., 11, 369–408, https://doi.org/10.5194/gmd-11-369-2018, 2018.
Holmes, C. D., Bertram, T. H., Confer, K. L., Graham, K. A., Ronan, A. C., Wirks, C. K., and Shah, V.: The Role of Clouds in the Tropospheric NOx Cycle: A New Modeling Approach for Cloud Chemistry and Its Global Implications, Geophys. Res. Lett., 46, 4980–4990, https://doi.org/10.1029/2019gl081990, 2019.
Horner, R. P., Marais, E. A., Wei, N., Ryan, R. G., and Shah, V.: Vertical profiles of global tropospheric nitrogen dioxide (NO2) obtained by cloud slicing the TROPOspheric Monitoring Instrument (TROPOMI), Atmos. Chem. Phys., 24, 13047–13064, https://doi.org/10.5194/acp-24-13047-2024, 2024.
Hudman, R. C., Moore, N. E., Mebust, A. K., Martin, R. V., Russell, A. R., Valin, L. C., and Cohen, R. C.: Steps towards a mechanistic model of global soil nitric oxide emissions: implementation and space based-constraints, Atmos. Chem. Phys., 12, 7779–7795, https://doi.org/10.5194/acp-12-7779-2012, 2012.
Hutchins, M. L., Holzworth, R. H., Brundell, J. B., and Rodger, C. J.: Relative detection efficiency of the World Wide Lightning Location Network, Radio Sci., 47, RS6005, https://doi.org/10.1029/2012rs005049, 2012.
IPCC: Climate Change 2021: The Physical Science Basis, Cambridge University Press, https://www.ipcc.ch/report/ar6/wg1/downloads/report/IPCC_AR6_WGI_FullReport_small.pdf (last access: 22 August 2024), 2021.
Jacobson, M. Z. and Streets, D. G.: Influence of future anthropogenic emissions on climate, natural emissions, and air quality, J. Geophys. Res.-Atmos., 114, D08118, https://doi.org/10.1029/2008jd011476, 2009.
Kaplan, J. O. and Lau, K. H. K.: The WWLLN Global Lightning Climatology and timeseries (WGLC) (v2022.0.0), Zenodo [data set], https://doi.org/10.5281/zenodo.6007052, 2021.
Kaplan, J. O. and Lau, K. H.-K.: World Wide Lightning Location Network (WWLLN) Global Lightning Climatology (WGLC) and time series, 2022 update, Earth Syst. Sci. Data, 14, 5665–5670, https://doi.org/10.5194/essd-14-5665-2022, 2022.
Krotkov, N. A., Lamsal, L. N., Marchenko, S. V., Bucsela, E. J., Swartz, W. H., Joiner, J., and the OMI core team: OMI/Aura Nitrogen Dioxide (NO2) Total and Tropospheric Column 1-orbit L2 Swath 13×24 km V003, Greenbelt, MD, USA, Goddard Earth Sciences Data and Information Services Center (GES DISC) [data set], https://doi.org/10.5067/Aura/OMI/DATA2017, 2019.
Lan, X., Thoning, K. W., and Dlugokencky, E. J.: Trends in globally-averaged CH4, N2O, and SF6, Version 2025-07, NOAA Global Monitoring Laboratory [data set], https://doi.org/10.15138/P8XG-AA10, 2022.
Lang, T.: NRT Lightning Imaging Sensor (LIS) on International Space Station (ISS) Science Data, NASA Global Hydrometeorology Resource Center DAAC, Huntsville, Alabama, USA [data set], https://doi.org/10.5067/LIS/ISSLIS/DATA109, 2022.
Lee, D. S., Fahey, D. W., Skowron, A., Allen, M. R., Burkhardt, U., Chen, Q., Doherty, S. J., Freeman, S., Forster, P. M., Fuglestvedt, J., Gettelman, A., De León, R. R., Lim, L. L., Lund, M. T., Millar, R. J., Owen, B., Penner, J. E., Pitari, G., Prather, M. J., Sausen, R., and Wilcox, L. J.: The contribution of global aviation to anthropogenic climate forcing for 2000 to 2018, Atmos. Environ., 244, 117834, https://doi.org/10.1016/j.atmosenv.2020.117834, 2021.
Li, M., Zhang, Q., Kurokawa, J.-I., Woo, J.-H., He, K., Lu, Z., Ohara, T., Song, Y., Streets, D. G., Carmichael, G. R., Cheng, Y., Hong, C., Huo, H., Jiang, X., Kang, S., Liu, F., Su, H., and Zheng, B.: MIX: a mosaic Asian anthropogenic emission inventory under the international collaboration framework of the MICS-Asia and HTAP, Atmos. Chem. Phys., 17, 935–963, https://doi.org/10.5194/acp-17-935-2017, 2017.
Liaskos, C. E., Allen, D. J., and Pickering, K. E.: Sensitivity of tropical tropospheric composition to lightning NOx production as determined by replay simulations with GEOS-5, J. Geophys. Res.-Atmos., 120, 8512–8534, https://doi.org/10.1002/2014jd022987, 2015.
Luhar, A. K., Galbally, I. E., Woodhouse, M. T., and Abraham, N. L.: Assessing and improving cloud-height-based parameterisations of global lightning flash rate, and their impact on lightning-produced NOx and tropospheric composition in a chemistry–climate model, Atmos. Chem. Phys., 21, 7053–7082, https://doi.org/10.5194/acp-21-7053-2021, 2021.
Marais, E. A. and Roberts, J. F.: eamarais/erc-uptrop: tropomi-ut-no2-1.1.0 (Version 1.0.0), Zenodo [code], https://doi.org/10.5281/zenodo.3979211, 2020a.
Marais, E. A. and Roberts, J. F.: eamarais/erc-uptrop: tropomi-ut-no2-1.1.0 (1.1.0), Zenodo [code], https://doi.org/10.5281/zenodo.4058442, 2020b.
Marais, E. A. and Wiedinmyer, C.: Air Quality Impact of Diffuse and Inefficient Combustion Emissions in Africa (DICE-Africa), Environ. Sci. Technol., 50, 10739–10745, https://doi.org/10.1021/acs.est.6b02602, 2016.
Marais, E. A., Jacob, D. J., Choi, S., Joiner, J., Belmonte-Rivas, M., Cohen, R. C., Beirle, S., Murray, L. T., Schiferl, L. D., Shah, V., and Jaeglé, L.: Nitrogen oxides in the global upper troposphere: interpreting cloud-sliced NO2 observations from the OMI satellite instrument, Atmos. Chem. Phys., 18, 17017–17027, https://doi.org/10.5194/acp-18-17017-2018, 2018.
Marais, E. A., Roberts, J. F., Ryan, R. G., Eskes, H., Boersma, K. F., Choi, S., Joiner, J., Abuhassan, N., Redondas, A., Grutter, M., Cede, A., Gomez, L., and Navarro-Comas, M.: New observations of NO2 in the upper troposphere from TROPOMI, Atmos. Meas. Tech., 14, 2389–2408, https://doi.org/10.5194/amt-14-2389-2021, 2021.
Melnikov, A., Price, C., Sátori, G., and Füllekrug, M.: Influence of solar terminator passages on Schumann resonance parameters, J. Atmos. Sol.-Terr. Phy., 66, 1187–1194, https://doi.org/10.1016/j.jastp.2004.05.014, 2004.
Miyazaki, K., Eskes, H. J., Sudo, K., and Zhang, C.: Global lightning NOx production estimated by an assimilation of multiple satellite data sets, Atmos. Chem. Phys., 14, 3277–3305, https://doi.org/10.5194/acp-14-3277-2014, 2014.
Murray, L. T.: Lightning NOx and Impacts on Air Quality, Curr. Pollut. Rep., 2, 115–133, https://doi.org/10.1007/s40726-016-0031-7, 2016.
Murray, L. T., Logan, J. A., and Jacob, D. J.: Interannual variability in tropical tropospheric ozone and OH: The role of lightning, J. Geophys. Res.-Atmos., 118, 11, 376–11, 388, https://doi.org/10.1002/jgrd.50857, 2013.
Murray, L. T., Jacob, D. J., Logan, J. A., Hudman, R. C., and Koshak, W. J.: Optimized regional and interannual variability of lightning in a global chemical transport model constrained by LIS/OTD satellite data, J. Geophys. Res.-Atmos., 117, D20307, https://doi.org/10.1029/2012jd017934, 2012.
Murray, L. T., Fiore, A. M., Shindell, D. T., Naik, V., and Horowitz, L. W.: Large uncertainties in global hydroxyl projections tied to fate of reactive nitrogen and carbon, P. Natl. Acad. Sci. USA, 118, e2115204118, https://doi.org/10.1073/pnas.2115204118, 2021.
Musur, M. A. and Beggan, C. D.: Seasonal and solar cycle variation of Schumann resonance intensity and frequency at Eskdalemuir observatory, UK, Sun Geosph., 14, 19–27, https://doi.org/10.31401/SunGeo.2019.01.11, 2019.
Nickolaenko, A. P. and Hayakawa, M.: Resonances in the Earth-ionosphere cavity, Kluwer Academic Publishers, Dordrecht, ISBN 9781402007545, 2002.
Nussbaumer, C. M., Fischer, H., Lelieveld, J., and Pozzer, A.: What controls ozone sensitivity in the upper tropical troposphere?, Atmos. Chem. Phys., 23, 12651–12669, https://doi.org/10.5194/acp-23-12651-2023, 2023.
Ott, L. E., Pickering, K. E., Stenchikov, G. L., Allen, D. J., DeCaria, A. J., Ridley, B., Lin, R. F., Lang, S., and Tao, W. K.: Production of lightning NOx and its vertical distribution calculated from three-dimensional cloud-scale chemical transport model simulations, J. Geophys. Res.-Atmos., 115, D04301, https://doi.org/10.1029/2009jd011880, 2010.
Peng, S., Lin, X., Thompson, R. L., Xi, Y., Liu, G., Hauglustaine, D., Lan, X., Poulter, B., Ramonet, M., Saunois, M., Yin, Y., Zhang, Z., Zheng, B., and Ciais, P.: Wetland emission and atmospheric sink changes explain methane growth in 2020, Nature, 612, 477–482, https://doi.org/10.1038/s41586-022-05447-w, 2022.
Price, C. and Rind, D.: A Simple Lightning Parameterization for Calculating Global Lightning Distributions, J. Geophys. Res.-Atmos., 97, 9919–9933, https://doi.org/10.1029/92jd00719, 1992.
Qu, Z., Jacob, D. J., Silvern, R. F., Shah, V., Campbell, P. C., Valin, L. C., and Murray, L. T.: US COVID-19 Shutdown Demonstrates Importance of Background NO2 in Inferring NOx Emissions From Satellite NO2 Observations, Geophys. Res. Lett., 48, e2021GL092783, https://doi.org/10.1029/2021gl092783, 2021.
Rigby, M., Montzka, S. A., Prinn, R. G., White, J. W. C., Young, D., O'Doherty, S., Lunt, M. F., Ganesan, A. L., Manning, A. J., Simmonds, P. G., Salameh, P. K., Harth, C. M., Mühle, J., Weiss, R. F., Fraser, P. J., Steele, L. P., Krummel, P. B., McCulloch, A., and Park, S.: Role of atmospheric oxidation in recent methane growth, P. Natl. Acad. Sci. USA, 114, 5373–5377, https://doi.org/10.1073/pnas.1616426114, 2017.
Russo, M. R., Kerridge, B. J., Abraham, N. L., Keeble, J., Latter, B. G., Siddans, R., Weber, J., Griffiths, P. T., Pyle, J. A., and Archibald, A. T.: Seasonal, interannual and decadal variability of tropospheric ozone in the North Atlantic: comparison of UM-UKCA and remote sensing observations for 2005–2018, Atmos. Chem. Phys., 23, 6169–6196, https://doi.org/10.5194/acp-23-6169-2023, 2023.
Sátori, G.: Monitoring schumann resonances-11, Daily and seasonal frequency variations, J. Atmos. Terr. Phys., 58, 1483–1488, https://doi.org/10.1016/0021-9169(95)00146-8, 1996.
Sátori, G., Mushtak, V., and Williams, E.: Schumann Resonance Signature of Global Lightning Activity, In: Betz HD, Schumann U, Laroche P (szerk.) Lightning: Principles, Instruments and Applications: Review of Modern Lightning Research, Springer – Business Media B. V., Berlin, ISBN 9781402090783, 347–386, 2009.
Sátori, G., Bozóki, T., Williams, E., Prácser, E., Herein, M., Albrecht, R. I., and Beltran, R. P.: How Do Schumann Resonance Frequency Changes in the Vertical Electric Field Component Reflect Global Lightning Dynamics at Different Time Scales?, J. Geophys. Res.-Atmos., 129, e2024JD041455, https://doi.org/10.1029/2024jd041455, 2024.
Schumann, U. and Huntrieser, H.: The global lightning-induced nitrogen oxides source, Atmos. Chem. Phys., 7, 3823–3907, https://doi.org/10.5194/acp-7-3823-2007, 2007.
Schumann, W. O.: Über die strahlungslosen Eigenschwingungen einer leitenden Kugel, die von einer Luftschicht und einer Ionosphärenhülle umgeben ist, Z. Naturforsch. A, 7, 149–154, https://doi.org/10.1515/zna-1952-0202, 1952.
Simone, N. W., Stettler, M. E. J., and Barrett, S. R. H.: Rapid estimation of global civil aviation emissions with uncertainty quantification, Transp. Res. D, 25, 33–41, https://doi.org/10.1016/j.trd.2013.07.001, 2013.
Stevenson, D. S., Derwent, R. G., Wild, O., and Collins, W. J.: COVID-19 lockdown emission reductions have the potential to explain over half of the coincident increase in global atmospheric methane, Atmos. Chem. Phys., 22, 14243–14252, https://doi.org/10.5194/acp-22-14243-2022, 2022.
Tatsis, G., Sakkas, A., Christofilakis, V., Baldoumas, G., Chronopoulos, S. K., Paschalidou, A. K., Kassomenos, P., Petrou, I., Kostarakis, P., Repapis, C., and Tritakis, V.: Correlation of local lightning activity with extra low frequency detector for Schumann Resonance measurements, Sci. Total Environ., 787, 147671, https://doi.org/10.1016/j.scitotenv.2021.147671, 2021.
Teoh, R., Engberg, Z., Shapiro, M., Dray, L., and Stettler, M. E. J.: The high-resolution Global Aviation emissions Inventory based on ADS-B (GAIA) for 2019–2021: Low-resolution gridded outputs for 2019–2021 (1.0.0), Zenodo, https://doi.org/10.5281/zenodo.7969631, 2023.
Teoh, R., Engberg, Z., Shapiro, M., Dray, L., and Stettler, M. E. J.: The high-resolution Global Aviation emissions Inventory based on ADS-B (GAIA) for 2019–2021, Atmos. Chem. Phys., 24, 725–744, https://doi.org/10.5194/acp-24-725-2024, 2024.
The International GEOS-Chem User Community: geoschem/GCClassic: GEOS-Chem Classic 14.0.2 (14.0.2), Zenodo [code], https://doi.org/10.5281/zenodo.7383492, 2022.
Tost, H., Jöckel, P., and Lelieveld, J.: Lightning and convection parameterisations – uncertainties in global modelling, Atmos. Chem. Phys., 7, 4553–4568, https://doi.org/10.5194/acp-7-4553-2007, 2007.
Tritakis, V., Contopoulos, I., Florios, C., Tatsis, G., Christofilakis, V., Baldoumas, G., and Repapis, C.: Anthropogenic Noise and Its Footprint on ELF Schumann Resonance Recordings, Front. Earth Sci., 9, 646277, https://doi.org/10.3389/feart.2021.646277, 2021.
Turner, A. J., Frankenberg, C., Wennberg, P. O., and Jacob, D. J.: Ambiguity in the causes for decadal trends in atmospheric methane and hydroxyl, P. Natl. Acad. Sci. USA, 114, 5367–5372, https://doi.org/10.1073/pnas.1616020114, 2017.
Unger, N., Zheng, Y., Yue, X., and Harper, K. L.: Mitigation of ozone damage to the world's land ecosystems by source sector, Nat. Clim. Change, 10, 134–137, https://doi.org/10.1038/s41558-019-0678-3, 2020.
US EPA: 2011 National Emissions Inventory (NEI) v2, https://www.epa.gov/air-emissions-inventories/2011-national-emissions-inventory-nei-data (last access: 5 August 2025), 2013.
van der Werf, G. R., Randerson, J. T., Giglio, L., van Leeuwen, T. T., Chen, Y., Rogers, B. M., Mu, M., van Marle, M. J. E., Morton, D. C., Collatz, G. J., Yokelson, R. J., and Kasibhatla, P. S.: Global fire emissions estimates during 1997–2016, Earth Syst. Sci. Data, 9, 697–720, https://doi.org/10.5194/essd-9-697-2017, 2017.
Wang, H., Lu, X., Jacob, D. J., Cooper, O. R., Chang, K.-L., Li, K., Gao, M., Liu, Y., Sheng, B., Wu, K., Wu, T., Zhang, J., Sauvage, B., Nédélec, P., Blot, R., and Fan, S.: Global tropospheric ozone trends, attributions, and radiative impacts in 1995–2017: an integrated analysis using aircraft (IAGOS) observations, ozonesonde, and multi-decadal chemical model simulations, Atmos. Chem. Phys., 22, 13753–13782, https://doi.org/10.5194/acp-22-13753-2022, 2022.
Wang, X., Jacob, D. J., Downs, W., Zhai, S., Zhu, L., Shah, V., Holmes, C. D., Sherwen, T., Alexander, B., Evans, M. J., Eastham, S. D., Neuman, J. A., Veres, P. R., Koenig, T. K., Volkamer, R., Huey, L. G., Bannan, T. J., Percival, C. J., Lee, B. H., and Thornton, J. A.: Global tropospheric halogen (Cl, Br, I) chemistry and its impact on oxidants, Atmos. Chem. Phys., 21, 13973–13996, https://doi.org/10.5194/acp-21-13973-2021, 2021.
Yin, Y., Chevallier, F., Ciais, P., Bousquet, P., Saunois, M., Zheng, B., Worden, J., Bloom, A. A., Parker, R. J., Jacob, D. J., Dlugokencky, E. J., and Frankenberg, C.: Accelerating methane growth rate from 2010 to 2017: leading contributions from the tropics and East Asia, Atmos. Chem. Phys., 21, 12631–12647, https://doi.org/10.5194/acp-21-12631-2021, 2021.
Zhang, P., Zhang, Y., Liang, R., Chen, W., and Xie, X.: Evaluation of the Stratospheric Contribution to the Inter-Annual Variabilities of Tropospheric Methane Growth Rates, Geophys. Res. Lett., 50, e2023GL103350, https://doi.org/10.1029/2023gl103350, 2023.
Zhang, Y., Jacob, D. J., Lu, X., Maasakkers, J. D., Scarpelli, T. R., Sheng, J.-X., Shen, L., Qu, Z., Sulprizio, M. P., Chang, J., Bloom, A. A., Ma, S., Worden, J., Parker, R. J., and Boesch, H.: Attribution of the accelerating increase in atmospheric methane during 2010–2018 by inverse analysis of GOSAT observations, Atmos. Chem. Phys., 21, 3643–3666, https://doi.org/10.5194/acp-21-3643-2021, 2021.
Ziemke, J. R., Chandra, S., Duncan, B. N., Froidevaux, L., Bhartia, P. K., Levelt, P. F., and Waters, J. W.: Tropospheric ozone determined from Aura OMI and MLS: Evaluation of measurements and comparison with the Global Modeling Initiative's Chemical Transport Model, J. Geophys. Res.-Atmos., 111, D19303, https://doi.org/10.1029/2006jd007089, 2006 (data available at: https://acd-ext.gsfc.nasa.gov/Data_services/cloud_slice/, last access: 20 September 2024).