the Creative Commons Attribution 4.0 License.
the Creative Commons Attribution 4.0 License.
 | 13 Aug 2025
Climatology of aerosol pH and its controlling factors at the Melpitz continental background site in Central Europe
Vikram Pratap
Christopher J. Hennigan
Bastian Stieger
Andreas Tilgner
Laurent Poulain
Dominik van Pinxteren
Gerald Spindler
Aerosol acidity has importance for the chemical and physical properties of atmospheric aerosol particles and for many processes that affect their transformation and fate. Here, we characterize trends in PM10 pH and its controlling factors during the period of 2010–2019 at the Melpitz research station in eastern Germany, a continental background site in Central Europe. Aerosol liquid water content associated with inorganic species decreased by 3.4 , corresponding to a 50 % decrease during the analysed time period, in response to decreasing sulfate and nitrate. Aerosol pH exhibited an increase of 0.06 units per year, a trend that was distinct from other regions. The factors controlling aerosol pH varied by season. Temperature, the most important factor driving pH variability overall, was most important in summer (responsible for 51 % of pH variability) and less important during spring and fall (22 % and 27 %, respectively). NH3, the second-most important factor contributing to pH variability overall (29 %), was most important during winter (38 %) and far less important during summer (15 %). Aerosol chemistry in Melpitz is influenced by the high buffering capacity contributed by and, to a lesser degree, . Thermodynamic analysis of the aerosol system shows that secondary inorganic aerosol formation is most frequently HNO3-limited, suggesting that factors that control NOx would be more effective than NH3 controls in reducing PM mass concentrations. However, the non-linear response of gas-phase HNO3 and aerosol to NOx emissions in the region, likely due to VOC controls on oxidant formation and subsequent impacts on NOx conversion to HNO3, highlights the challenge associated with the PM reductions needed to attain new air quality standards in this region.
- Article
(10807 KB) - Full-text XML
-
Supplement
(1730 KB) - BibTeX
- EndNote


Aerosol acidity (pH) varies greatly in the atmosphere, from highly acidic submicron particles with pH<0 to nascent sea spray particles with pH∼8 (Pye et al., 2020). pH is tremendously important because it affects so many atmospheric processes, including the gas/particle partitioning of weakly acidic and basic semi-volatile compounds (Ahrens et al., 2012; Nah et al., 2018; Stieger et al., 2021), aqueous-phase reaction rates (including the uptake and formation of secondary organic aerosols) (Tilgner et al., 2021), the solubility of metals in PM (Fang et al., 2017), the optical properties of light-absorbing brown carbon (Phillips et al., 2017), nutrient deposition and bioavailability (Meskhidze et al., 2003; Baker et al., 2021), dry deposition rates, and the atmospheric lifetime of reactive nitrogen species (Nenes et al., 2021). The effects of pH have direct implications for human health through their impacts on PM mass concentrations and toxicity (Song et al., 2024; Dockery et al., 1996). Aerosol pH also has direct implications for Earth's climate through the effects on PM size and number distributions, light-absorbing properties of organics, and the effects on global biogeochemical cycles (Mahowald, 2011; Mahowald et al., 2018).
The pH of atmospheric particles is affected by many factors. Historically, inorganic aerosol composition – focused on the most abundant compounds – was viewed as the driving factor of pH. Sulfate, nitrate, and ammonium are certainly important contributors to aerosol pH (Pye et al., 2020); however, minor contributors to aerosol mass, such as non-volatile cations (NVCs), can also have important influences on pH (Guo et al., 2018a). Organic acids can contribute to particle acidity in clean environments (Trebs et al., 2005), but their effect on pH is likely small under more polluted conditions (Battaglia et al., 2019). The impact of relative humidity (RH) on aerosol pH has been well known because of its direct effect on aerosol liquid water content (ALWC; Guo et al., 2015). More recently, temperature has been identified as a key factor affecting pH due to its effects on acid-base and acid-phase equilibria (Stieger et al., 2021; Battaglia et al., 2017; Tao and Murphy, 2019; Zheng et al., 2020; Campbell et al., 2024). Together, this indicates that a confluence of factors, including regulatory issues, land use, and climate change, can produce changes in regional and local aerosol pH.
To date, few studies have examined aerosol pH in Europe. Cabauw in the Netherlands, a site near the Atlantic coast surrounded by agricultural land, had mean pH values of ∼3.5 across a 14-month study (Guo et al., 2018b). A remote site on the island of Crete, located in the Mediterranean Sea, typically had highly acidic aerosol pH values (∼1–1.5), except when the biomass-burning influence was high and the pH was ∼2.5–3 (Bougiatioti et al., 2016). Several studies have characterized pH at a polluted site in the Po Valley in Italy, where pH is typically ∼2–2.5 in summer and between 3 and 4 (seasonal means) during other times of the year (Squizzato et al., 2013; Paglione et al., 2021).
Compared to the body of studies that have characterized trends in aerosol mass concentration and composition at locations globally, very few studies have characterized trends in aerosol pH through time series measurements. The only locations, to our knowledge, where trends in pH have been examined over extended time periods (>5 years) are the southeastern US (1998–2013) (Weber et al., 2016), the contiguous US (2011–2020) (Pan et al., 2024), continental sites in Canada (2007–2016) (Tao and Murphy, 2019), the Po Valley in Italy (1993–2018) (Paglione et al., 2021), and eastern China (2011–2019) (Zhou et al., 2022). Characterizing trends in aerosol pH is important because many industrialized countries have implemented regulations that have reduced emissions of SO2 and NOx, two key precursors to acidic inorganic aerosol components. Further, aerosol pH may also change in response to warmer temperatures and changing humidity – conditions associated with climate change. Therefore, characterizing temporal trends in pH – and the factors contributing to pH – is required to better understand aerosol chemistry in these locations. Such analyses can also provide guidance for regions that are transitioning to more stringent air pollution controls (e.g. China) and regions projected to implement controls in the future (e.g. India and Pakistan). In the present study, we characterize aerosol pH and its controlling factors over a decade at the continental background site of Melpitz in Central Europe. We focus on the annual trends and seasonal characteristics of gas-phase and particle-phase composition, partitioning, and meteorology and their combined effects on aerosol pH.
2.1 Site description
The data presented in this analysis were collected between January 2010 and August 2019 at Melpitz, Germany (51°32′ N, 12°56′ E; 86 m a.s.l.), a rural background site in Saxony situated ∼50 km northeast of Leipzig (Fig. S1 in the Supplement). The research station at Melpitz is operated by the Leibniz Institute for Tropospheric Research (TROPOS), where aerosol-phase and gas-phase composition measurements have been conducted for more than three decades (Spindler et al., 2004, 2013, 2010). The site is a part of the European Monitoring and Evaluation Programme (EMEP) network and the Aerosol, Clouds and Trace Gases Research Infrastructure (ACTRIS). The sampling site is in a rural area surrounded by flat agricultural land, with no major anthropogenic sources nearby (Atabakhsh et al., 2023). The prevailing wind directions are from the west, southwest, and east (Fig. S2 in the Supplement). The southwesterly wind often has a maritime origin that crosses western Europe before reaching Melpitz, while easterly winds are largely dry continental air masses with a strong anthropogenic influence from emissions in several central and eastern European countries (Spindler et al., 2013; Stieger et al., 2018). Long-term measurements at the site show the highest PM2.5 concentrations in air masses from east-southeast (28 µg m−3) and the lowest concentrations in air masses from the northwest (19 µg m−3) (Spindler et al., 2013).
2.2 Gas and aerosol measurements
A Monitor for AeRosols and Gases in ambient Air (MARGA, Metrohm Applikon, the Netherlands) system was deployed to conduct hourly measurements of water-soluble gases and inorganic ionic components in aerosols (Stieger et al., 2019; Rumsey et al., 2014; ten Brink et al., 2007). The instrument uses a wet-rotating denuder (WRD) and a steam-jet aerosol collector (SJAC) to capture trace gases (HCl, SO2, NH3, HNO3, and HNO2) and water-soluble ions in particles (Cl−, , , , Na+, K+, Mg2+, Ca2+, and organic acid ions), respectively, at a time resolution of 1 h. The sample air passes through a Teflon-coated PM10 inlet (URG Inc., Chapel Hill, US), enters the WRD wetted by deionized water, and captures the water-soluble gases. The sample air then goes to an SJAC where the sample air is mixed with steam, creating a supersaturated environment that causes particles to grow rapidly into droplets, which are subsequently collected into a liquid sample stream. The liquid solutions from the WRD and SJAC are analysed online using a dual anion–cation ion chromatograph. Details of the ion chromatography protocols are provided by Stieger et al. (2018). A detailed performance characterization of the MARGA system has been discussed previously (ten Brink et al., 2007; Stieger et al., 2018).
2.3 Aerosol pH modelling and sensitivity
Aerosol pH was calculated using the MARGA measurements, along with temperature and relative humidity (RH), as inputs to the Extended – Aerosol Inorganics Model (E-AIM) thermodynamic equilibrium model (Clegg et al., 1998; Wexler and Clegg, 2002). E-AIM was run using model IV in batch mode, with solids formation prevented (i.e. “metastable” mode) according to Pye et al. (2020). H+ mole fraction and mole-fraction-based activity coefficient output from E-AIM were used to calculate pH using the conversion described by Pye et al. (2020). Inputs to the model were particulate inorganic ionic compounds (Na+, , Cl−, , and ), temperature, and RH. The Cl− and inputs represented the total gas and aerosol concentrations ( and , respectively), although aerosol and NH3(g) were separate inputs to the model. E-AIM does not include the non-volatile cations (NVCs) K+, Mg2+, and Ca2+. Therefore, K+, Mg2+, and Ca2+ were inputted as Na+ equivalents. The measurement values of NVCs that were below the method detection limit (MDL) were assigned the value of the MDL for model runs. For Na+, Ca2+, Mg2+, and K+, those values were 0.02, 0.01, 0.01, and 0.01 µg m−3, respectively. Guo et al. (2018a) showed that this assumption affects our pH calculations by <0.1 pH units (i.e. compared to simulations using zero for NVC inputs when measurements were below the MDL), in agreement with other studies that have shown a minor effect of NVCs on pH when present in low concentrations (Battaglia et al., 2021; Tao and Murphy, 2021; Zheng et al., 2020). H+ and OH− ions are required inputs to the model and were estimated using the total ion charge balance, fulfilling the requirement of electroneutrality. Thermodynamic calculations of pH are challenged at low RH (Pye et al., 2020). Similarly, the operating temperature range for the E-AIM model IV with NH4 and Cl− or Na+ and other ions is 263.15–330 K (https://www.aim.env.uea.ac.uk/aim/aim.php, last access: 30 October 2024). Therefore, samples with both T<264 K and RH<60 % were excluded from the present analysis (1 % and 16 % of observations, respectively). Further, data with modelled pH outside the range of −0.5 to 6.0 and ALWC outside the range of 0.34–500 µg m−3 were outliers and were also excluded (3 % of observations). Finally, the model was not run if there were any data missing from the aerosol-phase, gas-phase, or meteorology measurements (e.g. for instrument maintenance, calibrations, or QA/QC checks, 20 % of observations). Overall, with these conditions applied, we modelled 54 614 out of a possible 86 185 hourly data points (∼63 %) across the 10-year study, with n=13 130 in spring (March, April, and May), n=11 350 in summer (June, July, and August), n=14 200 in fall (September, October, and November), and n=15 934 in winter (December, January, and February).
The E-AIM model was run without organics as inputs, a good assumption that has a minimal effect on the predicted pH under the imposed RH limitation (Battaglia et al., 2019). Organic aerosol components can take up water and contribute substantially to ALWC, so the results presented herein do not account for the fraction of ALWC associated with those organic species. Based on aerosol mass spectrometer (AMS) measurements of PM1 composition at the Melpitz research station, it is likely that water content associated with organics was ∼20 % of the total ALWC, assuming an average kappa value of 0.15 for the organics (Atabakhsh et al., 2025). Although the model output represents ALWC associated with PM10, Kakavas et al. (2021) showed that ALWC was many times higher in fine particles than in coarse-mode particles across Europe. The approximations and assumptions are evaluated through the measured and predicted NH3 partitioning, a key metric used to assess thermodynamic model calculations of aerosol pH. NH3 (slope=1.006, intercept=0.15, R2=0.99, n=54 617) and (slope=0.933, intercept=0.22, R2=0.928, n=54 617) showed excellent agreement between the predictions and measurements (Fig. S3 in the Supplement), indicating that the model assumptions employed were valid for this dataset.
The approach of Tao and Murphy (2021) was used to investigate the contribution of different factors to pH variability in Melpitz. The method uses pH calculated according to NH3 partitioning theory (Eq. 1) to identify the factors responsible for the difference in pH between two systems, whether that be different locations or different times at the same location. The framework of Tao and Murphy (2021) assesses the following factors for their influence on -phase partitioning and hence pH: (1) temperature, (2) gas-phase NH3 concentration, (3) RH, (4) particle properties, and (5) an error term associated with simplifying assumptions in the derivation. Temperature affects equilibrium constants (KH, Ka, and Kw) that affect -phase partitioning. Duan et al. (2025) demonstrated that the T effects on activity coefficients and semi-volatile vapour pressures also contribute to its overarching influence on pH. The NH3 (g) abundance clearly affects NH3 partitioning, as an system at equilibrium will shift towards the gas phase in response to a reduction in NH3 and towards the particle phase in response to an NH3 increase. RH directly affects ALWC, which impacts the particle-phase activities of aerosol species, including and H+, both of which directly factor into the computation of -phase partitioning. Finally, particle properties account for the particle hygroscopicity, which also influences ALWC, and the ammonium activity coefficient, which affects the ammonium activity.
In the present analysis, we used the average study conditions in Melpitz to calculate the factors responsible for seasonal variability in pH. The approach decomposes the pH difference between two points into the difference between key factors that control or influence pH (Eqs. 2 and 3, taken from Eqs. 8 and 4 in Tao and Murphy, 2021):
where n(NH3) is the gas-phase molar concentration of ammonia (mol m−3), κ is the particle hygroscopicity parameter, is the equivalent molecular weight of ammonium in the aerosol phase (g mol−1), is the density of particulate ammonium salt (kg m−3), is the mole fraction of ammonium, is the mole-fraction-based activity coefficient of ammonium, KH is Henry's constant for salt (see Eq. 4; Tao and Murphy, 2021), RH is the relative humidity, T is the temperature (K), PP represents particle properties (a parameter that combines the influence of particle composition and concentration), and the error term (Δε) accounts for simplifying assumptions used in the calculation of pH (the term increases under low RH conditions (RH<50 %)). The PP term includes the measured ratios of ammonium to sulfate and nitrate, as well as the E-AIM-modelled and κ. The values for the parameters in Eq. (1) were obtained from the results of the E-AIM thermodynamic model. In this case, pH1 is the average pH for the entire 10-year (2010–2019) study in Melpitz, while pH2 is the modelled aerosol pH at a given time. The difference in pH between a single observation and the overall study average can then be attributed to the different factors given in Eq. (3). The error term was low (Δε∼1 %–3 % overall and within each season), suggesting that the simplifying assumptions used in the definition of pH for this analysis were appropriate (Tao and Murphy, 2021). The pH calculated by NH3 partitioning showed excellent agreement with the E-AIM pH (slope=1.02, R2=0.994; Fig. S4 in the Supplement), suggesting that the method provides useful insight into the factors that affect pH in Melpitz.
We also applied the multi-phase buffer theory developed by Zheng et al. (2020) to quantify the buffering capacity in Melpitz, attributed to different compounds. The buffering capacity β represents the ratio between the mass of acid (base) added to a system and the resulting decrease (increase) in aerosol pH. Higher values of β indicate systems that will have relatively smaller changes in pH for a given amount of acid or base added. Multiple compounds present in the atmosphere contribute to the aerosol-buffering capacity, including the pairs NH3-, HNO3-, and -, as well as NVCs and H2O. The concentrations of each buffering species or pair, as well as meteorological conditions, determine the overall β, in addition to the contribution of each acid-base pair to the buffering capacity. The calculation, based on Zheng et al. (2020), is
where nbase is the molal concentration (mol kg−1), pH is the aerosol pH, Kw is the temperature-dependent water dissociation constant, is the effective acid dissociation constant for species i, [H+] is the molality-based aqueous concentration of H+ (mol kg−1), and is the total equivalent molality-based concentration of the conjugate acid-base pair i (e.g. for would include [(aq)], [NH3(aq)], and [NH3(g)], with all concentrations expressed as moles per kilogram of water).
3.1 Annual trends of aerosol pH
There were notable trends in several major species measured at Melpitz (Fig. 1, Table 1). The trend in annual sulfate concentrations was −0.15 , a statistically significant decrease that corresponded to a ∼60 % reduction from 2010 to 2019 (Fig. 1a). The trend in annual Tot-NO3 concentrations was also −0.15 , a statistically significant decrease that corresponded to a ∼50 % reduction from 2010 to 2019 (Fig. 1b). These trends are the result of ongoing reductions in precursor SO2 and NOx emissions across continental Europe (Turnock et al., 2015; Vestreng et al., 2009; Hamed et al., 2010; Jonson et al., 2022). The observed trends in aerosol sulfate are consistent with the broader trends of decreasing sulfate across Central Europe that have occurred since the 1980s (Vestreng et al., 2007). In response to the decreases in and Tot-NO3, aerosol concentrations exhibited a similar decrease of ∼60 % from 2010 to 2019. Sulfate, nitrate, and ammonium (SNA) are the most abundant inorganic aerosol components in Melpitz (Spindler et al., 2013), and thus, they control ALWC abundance. Concentrations of ALWC decreased by 3.4 (Table 1), representing a ∼50 % decrease from 2010 to 2019 (Fig. 1c) because of the 50 %–60 % decreases in SNA.
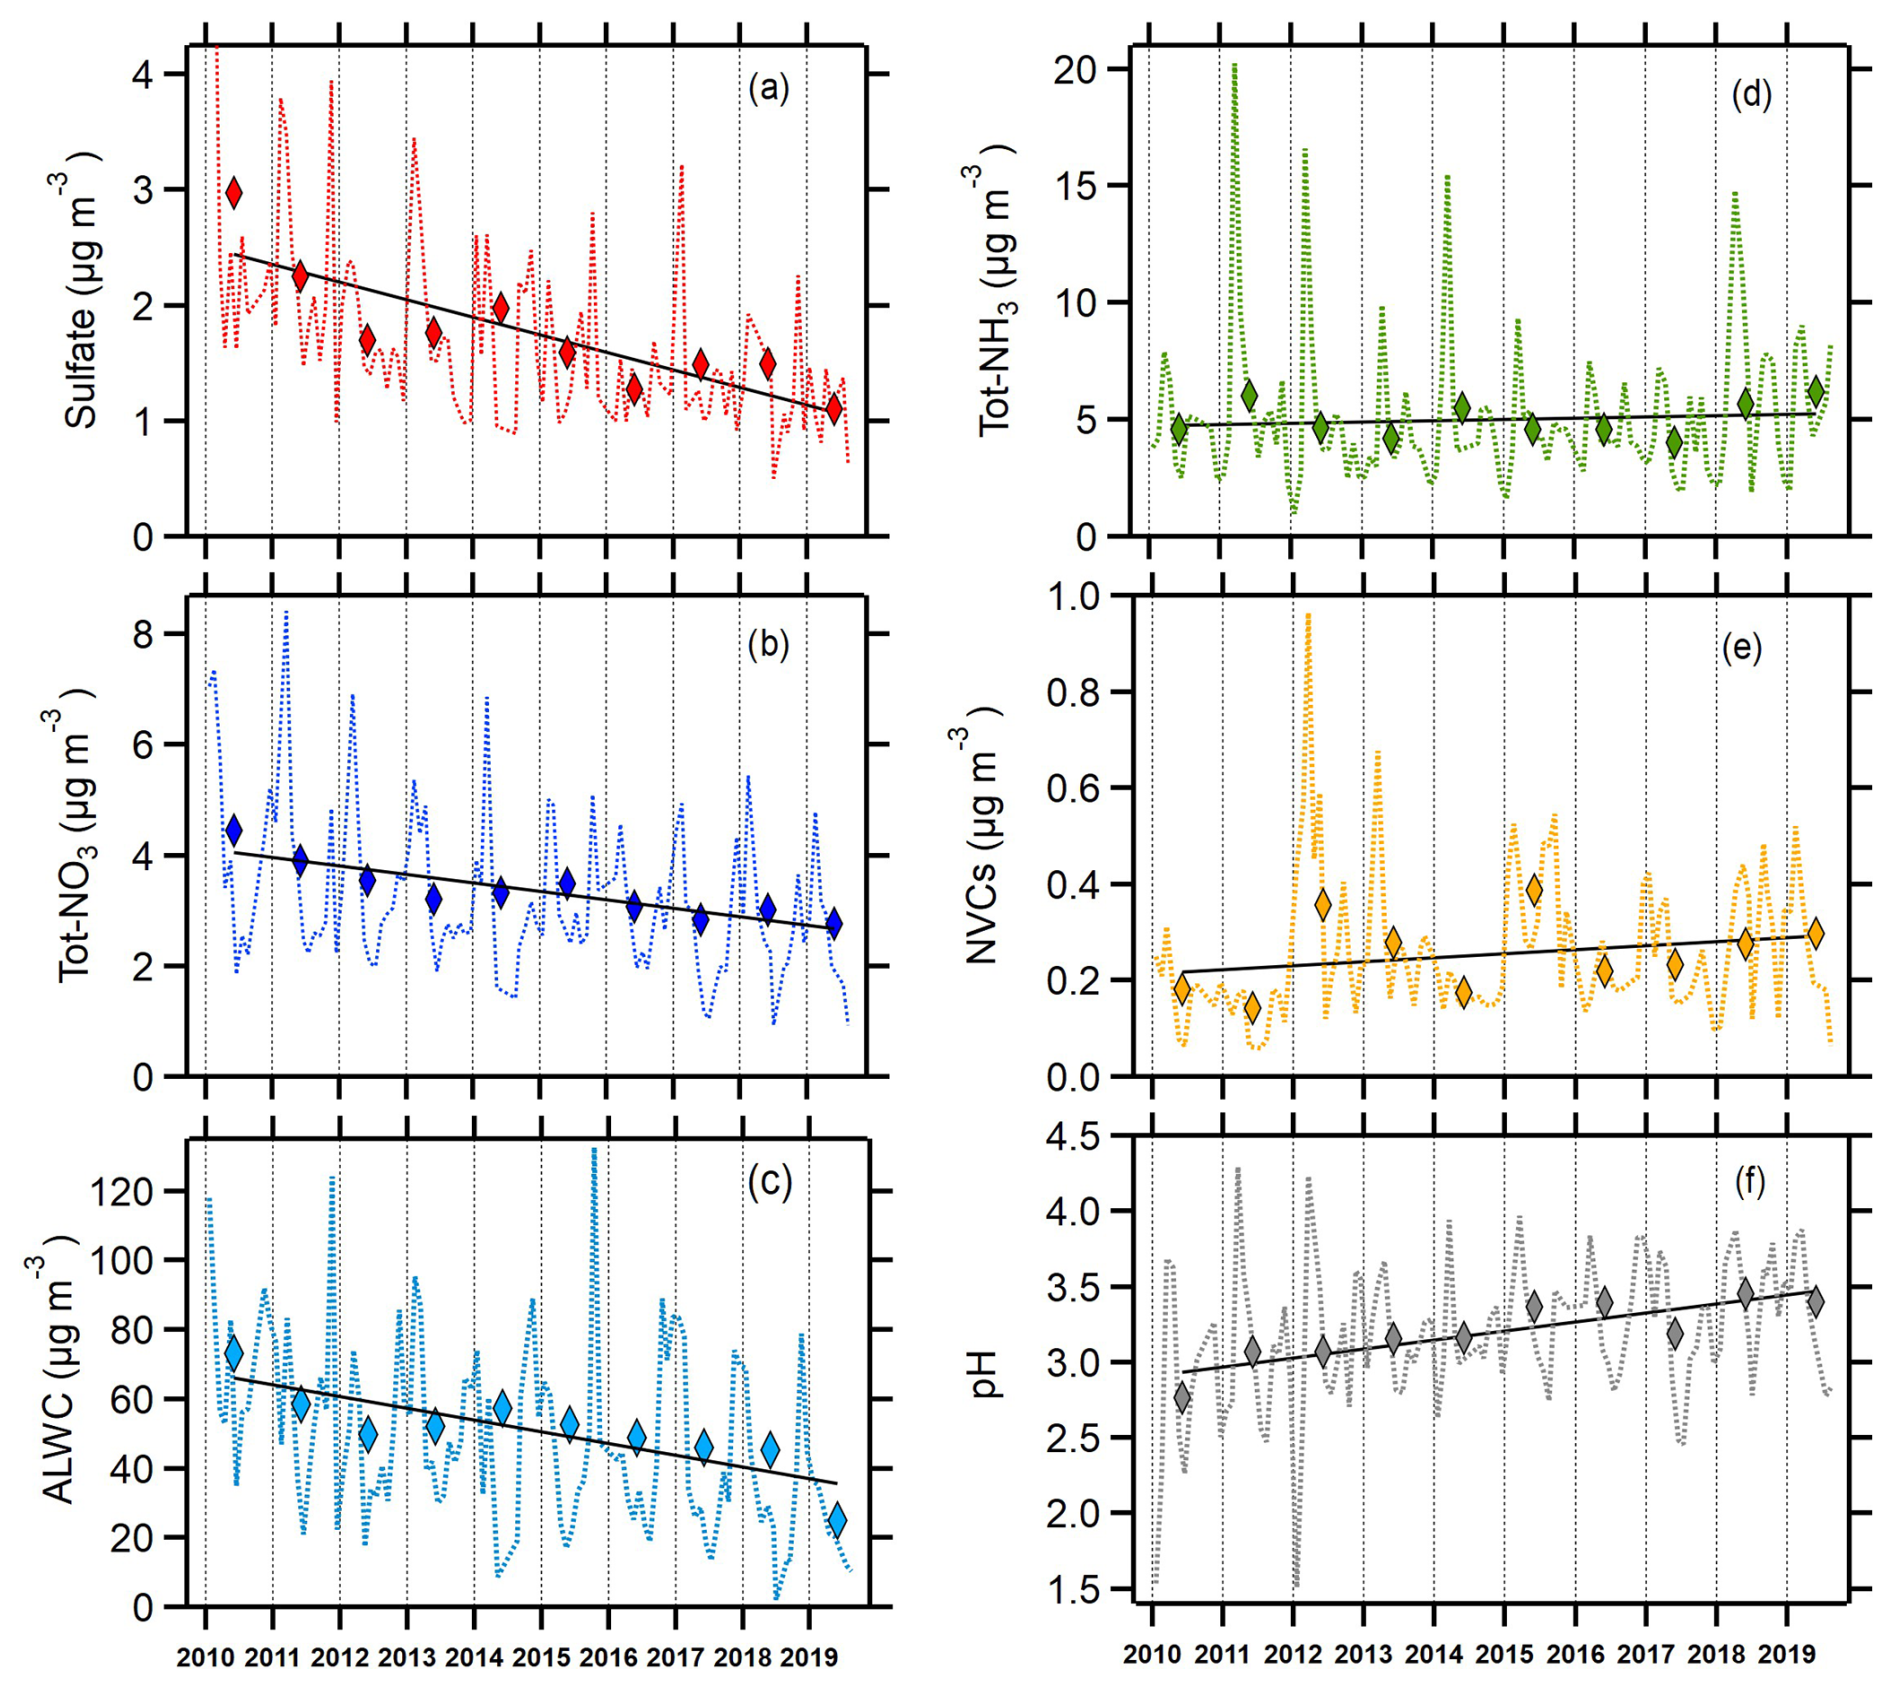
Figure 1Average monthly (dotted line) and annual (diamonds) trends in (a) sulfate, (b) total nitrate (), (c) aerosol liquid water content (ALWC), (d) total NH3 (), (e) non-volatile cations (NVCs), and (f) aerosol pH in Melpitz during 2010–2019. The solid line in each panel is the linear least squares regression fit for the annual averages.
Table 1Summary of the annual trend analysis for the species shown in Fig. 1.
a Linear least squares method; units are , except pH: pH units a−1
b Indicates whether the slope is statistically significant at the 95 % confidence level
c Intercept relative to 2010
d
e Aerosol liquid water content
f
g Non-volatile cations
Although the concentration of decreased, the average Tot-NH3 concentration remained relatively flat from 2010 to 2019 (Fig. 1d), indicating a shift in NH3 partitioning towards the gas phase. The annual trend in the Tot-NH3 concentration was not statistically significant at the 95 % confidence level (Table 1). A moderate increase in total column NH3 was observed over Germany for the period roughly corresponding to the present study, 2008–2018, although most of the observed increase occurred in 2017 and 2018 (Van Damme et al., 2021). NVCs showed a slight positive trend from 2010 to 2019 (Fig. 1e), +0.01 , but the increase was not statistically significant at the 95 % confidence level.
The annual average aerosol pH varied between 2.76 and 3.45 and followed a gradual linear increase of ∼0.06 pH units per year, leading to a 0.6 pH units rise over the past 10 years (Fig. 1f). The increasing trend in pH is statistically significant at the 95 % confidence level (Table 1), demonstrating a decrease in particle acidity in Melpitz. The increasing pH trend in Melpitz is interesting to contrast with trends in other locations because it is the only site where particle acidity has shown a significant decrease (pH increase). Weber et al. (2016) found a slight decrease in pH in the southeastern US during 1998–2013, although the trend appears flat from 2006 to 2013. Tao and Murphy (2019) observed no significant changes in pH in five Canadian cities from 2007 to 2016, although acidity in Ottawa increased (pH decreased). Paglione et al. (2021) used fog water composition measurements to estimate annual trends in aerosol pH in the Po Valley, Italy. While fog water pH has steadily increased since 1993, rising by 0.04 units per year on average as a result of decreasing emissions of SO2 and NOx, calculated aerosol pH declined by ∼1.5 units from 1993 to 2018 (Paglione et al., 2021). Although the trends in aerosol pH in Melpitz appear contrary to those in North America and the Po Valley, the results are highly consistent with the trends in fog water and cloud water pH observed over Central Europe (Pye et al., 2020). Using composite results from dozens of sites across Europe, cloud and fog water pH has increased by 0.56 pH units per decade since 1980 (∼2.2 pH units increase from 1980 to 2020) (Pye et al., 2020). This closely matches the 0.6 pH units increase in Melpitz aerosol for 2010–2019. Further, pH measured in cloud water at Whiteface Mountain, New York, has shown a marked increase over a similar timescale, suggesting key differences in the thermodynamic regime of the aerosol in North America (Lawrence et al., 2023).
3.2 Seasonal trends in aerosol pH, ALWC, and composition
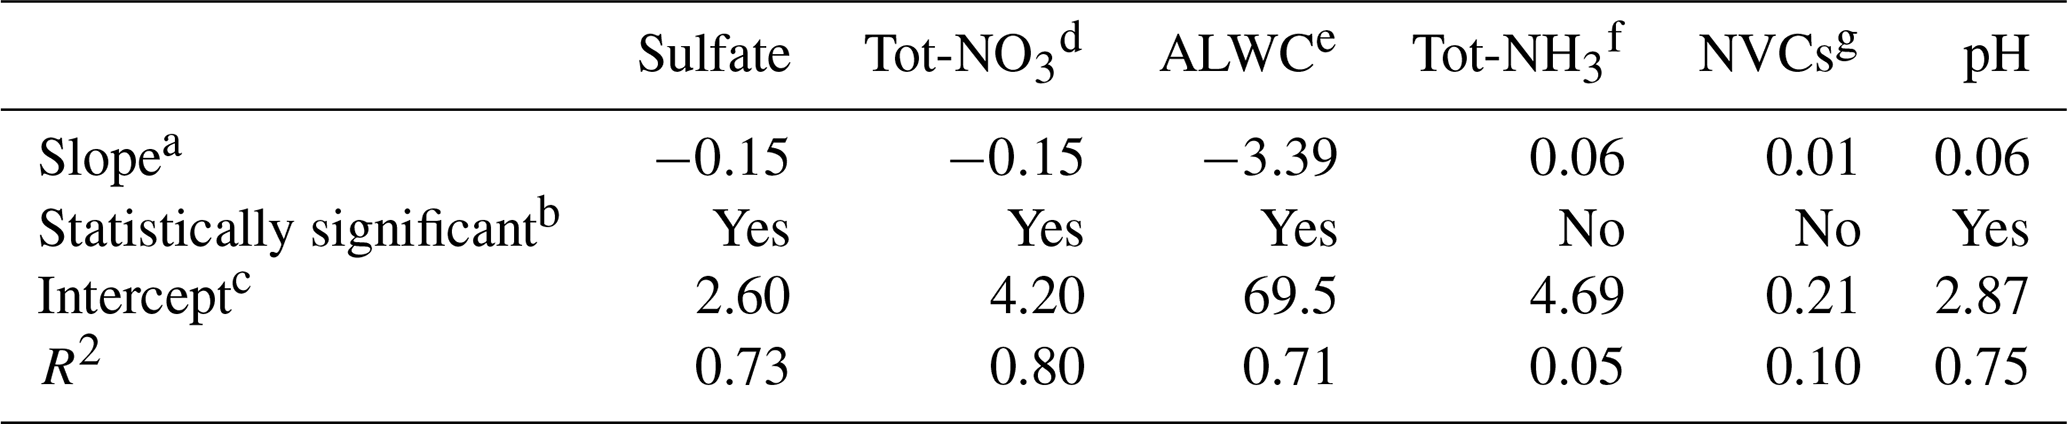
The aerosol composition in Melpitz is characterized by large gradients in the seasonal concentrations of major components. Median concentrations were relatively consistent between seasons, with a range of only 1.14–1.37 µg m−3. However, the quartile and 90th percentile values indicate relatively frequent enhancements in concentrations during winter and similarly infrequent enhancements during summer (Fig. 2a). Under the coldest conditions, Melpitz was under the heavy influence of emissions to the east and southeast (Poland, Czech Republic, and Austria) (Stieger et al., 2018). Sulfate showed an inverse relationship with temperature during winter (Fig. S5 in the Supplement) due to higher energy demand and increased coal combustion in eastern Europe for domestic heating (Atabakhsh et al., 2023; Hamed et al., 2010). Tot-NO3 concentrations exhibited a similar seasonal pattern as , with the highest median concentrations in winter (3.41 µg m−3), followed by spring (2.95 µg m−3), fall (2.53 µg m−3), and then summer (1.84 µg m−3; Fig. 2b). Average Tot-NO3 concentrations in winter and spring were approximately double the summer average, while differences in the upper-quartile and 90th-percentile values were even larger. The seasonal Tot-NO3 pattern is also apparent in Fig. 2b, where maxima in winter and minima in summer occurred almost annually. The seasonal Tot-NO3 results reflect higher energy demand and increased coal combustion under colder conditions in the region, as well as differences in the air mass source regions and boundary layer structure.
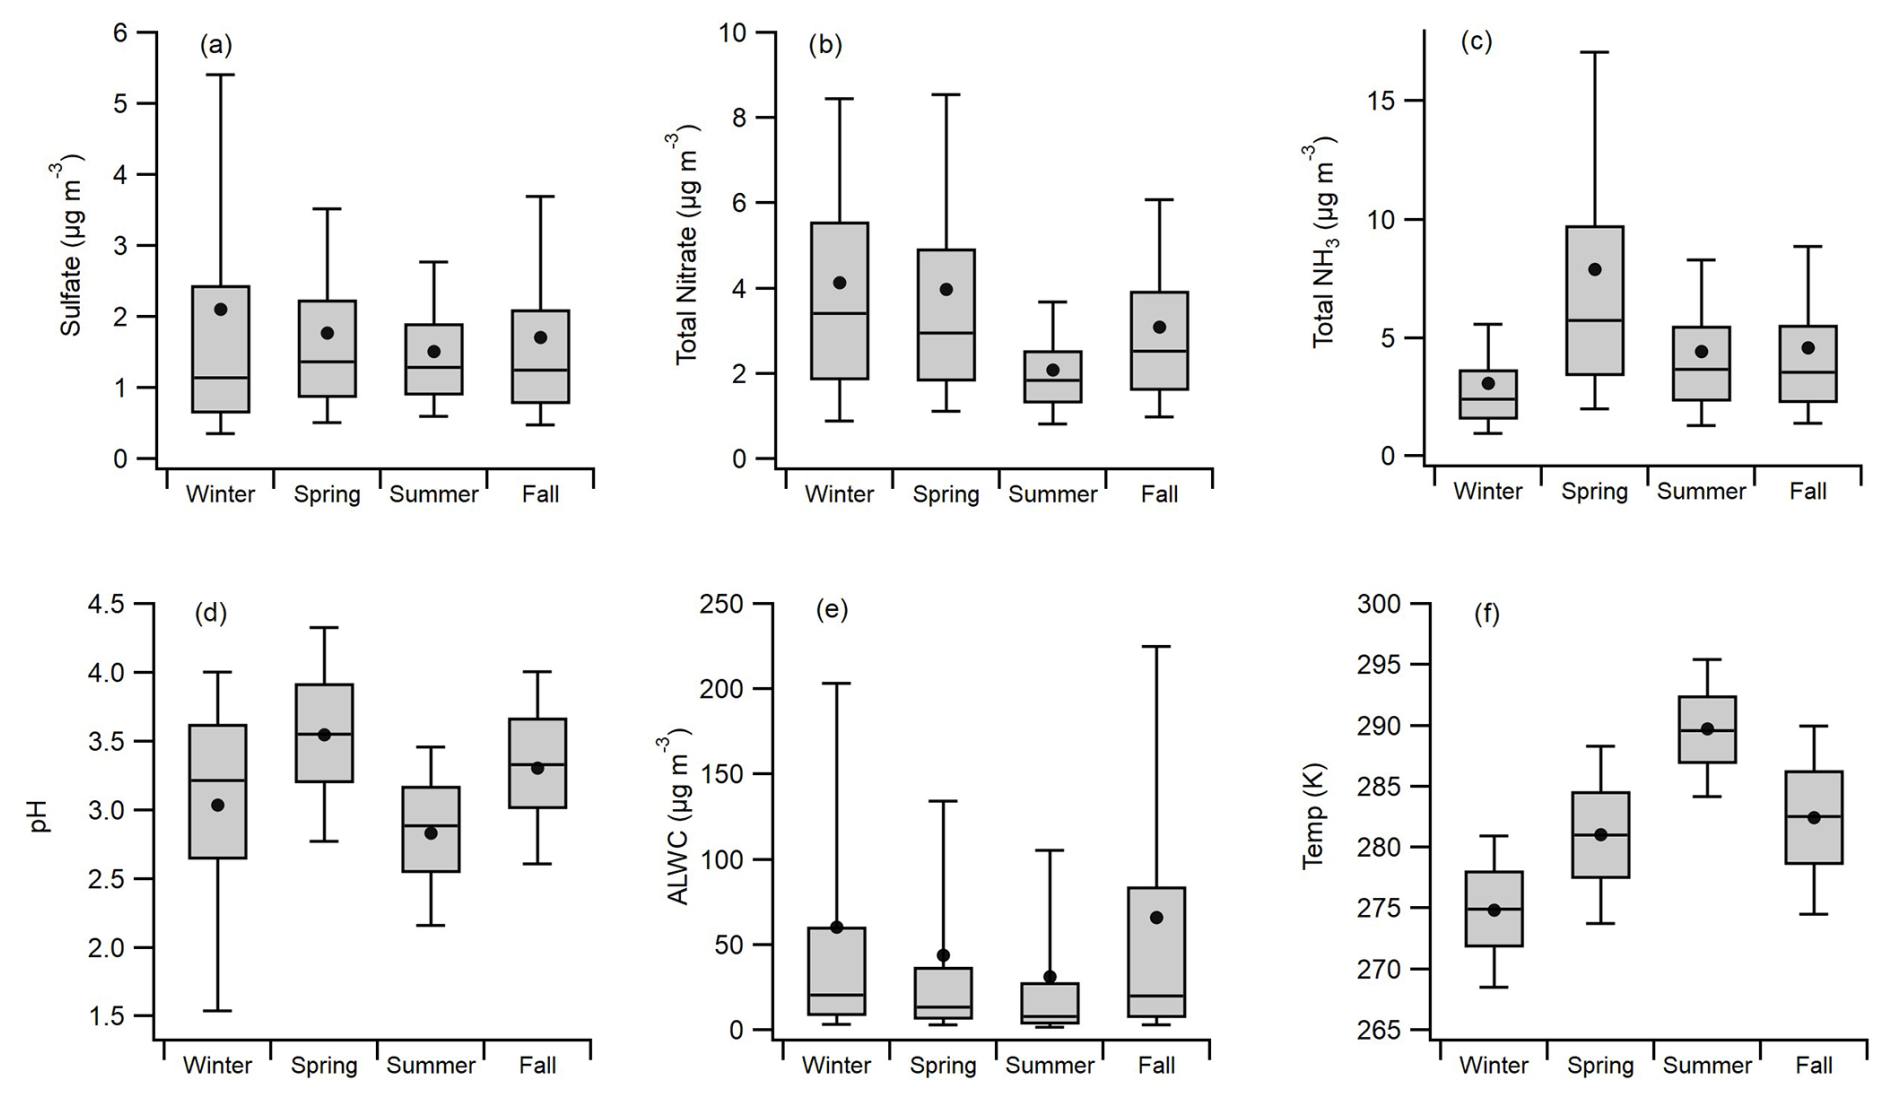
Figure 2Box and whisker plots showing seasonal (a) sulfate concentrations, (b) total nitrate () concentrations, (c) total NH3 () concentrations, (d) aerosol pH, (e) aerosol liquid water content (ALWC), and (f) temperatures. Data shown are the 10th and 90th percentiles (whiskers), quartiles (upper and lower box), median (solid line), and mean values (circles).
In contrast to and Tot-NO3, mean and median concentrations of Tot-NH3 were ∼1.5 times higher in the summer and fall compared to winter and 2.3 times higher in spring (Fig. 2c). Tot-NH3 concentrations in the spring regularly exceeded 10–15 µg m−3, an infrequent occurrence in other seasons (Fig. 2c). Melpitz is located in eastern Saxony, a region dense with farmland. The elevated Tot-NH3 observed in spring is attributed to fertilizer applications at the beginning of the growing season, as this is a major source of NH3 emissions in the region (Viatte et al., 2022). The observations in Melpitz are consistent with those in other parts of Europe, where NH3 emissions peak in March, April, and May due to the spreading of fertilizer (van der Graaf et al., 2022). The region surrounding Melpitz shows large model-measurement differences in NH3 emissions, and predictions are worse during the spring (van der Graaf et al., 2022).
Tot-NH3 concentrations showed a clear relationship with temperature in all seasons except winter (Fig. 3a). Due to the strong effect of temperature on NH3 partitioning (Fig. 3d), mean NH3(g) concentrations increased with temperature in each season (Fig. 3b). Mean gas-phase fraction () values showed highly consistent behaviour with temperature across seasons despite changing aerosol composition. The results in Fig. 3 suggest that agricultural emissions represent the major source of Tot-NH3 during most seasons in Melpitz, consistent with broader studies across Europe (Sutton et al., 2013; Backes et al., 2016a). Very strong correlations (r2∼0.8) between NH3(g) and skin temperature (the physical temperature of the Earth's surface) – both remotely sensed – are observed in this area (Viatte et al., 2022). We observed similar temperature–NH3 relationships within each season, but the annual results showed less consistency. We observed stronger seasonal gradients, especially much higher spring concentrations, than the adjacent area (long [11, 12], lat [50, 52]). However, it should be noted that the IASI satellite results are based on twice-daily total column measurements, at 09:30 and 21:30 LT, and it is not straightforward to convert between total column NH3 and local in situ concentrations: this relationship varies by region (van der Graaf, 2022; Viatte et al., 2022).
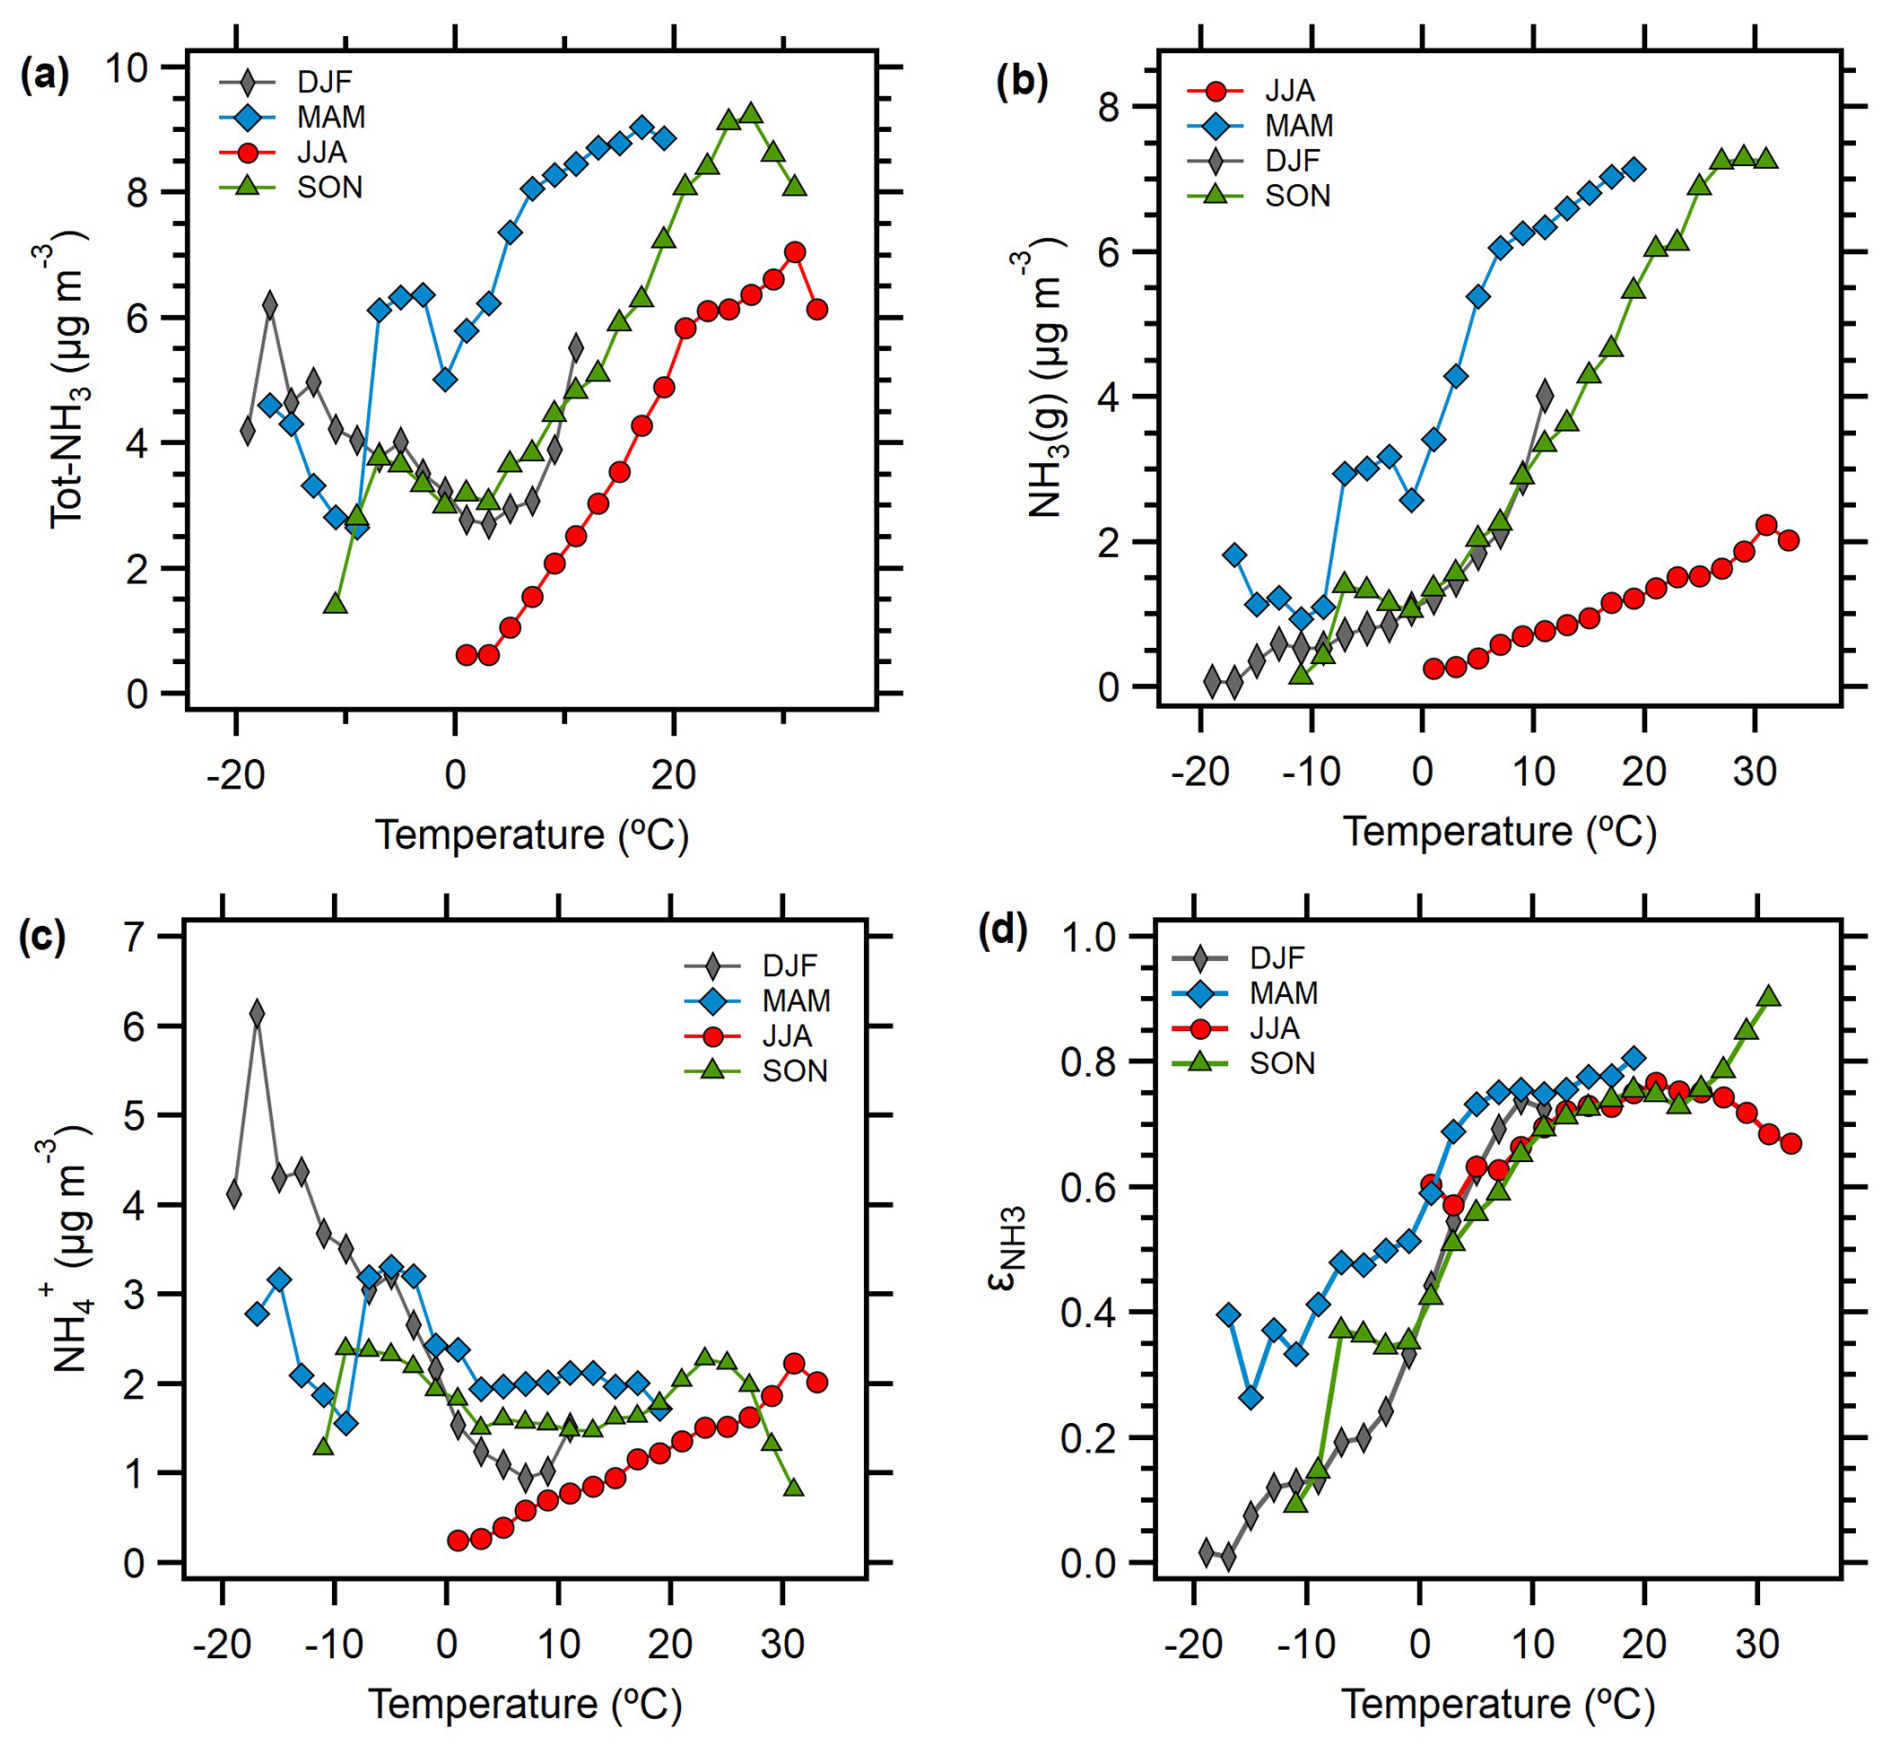
Figure 3Seasonal characteristics of (a) total NH3 concentrations (), (b) NH3(g) concentrations, (c) concentrations, and (d) NH3 partitioning (), all presented as a function of ambient temperature.
The seasonal profile of ALWC was distinct from the other species plotted in Fig. 2. The mean values of ALWC were a factor of 3–4 higher than the median each season, reflecting skewed distributions. The median RH values were 74.7 % (summer), 79.0 % (spring), 89.2 % (fall), and 89.6 % (winter). ALWC increases exponentially with RH, so RH values above 90 %, and especially above 95 %, cause this observation. Approximately 28 % of observations in the winter and 32 % of observations in the fall had an RH>95 % (Fig. S6 in the Supplement), reflecting the humid conditions experienced in Melpitz during this time of year. Conversely, approximately 17 % of observations in summer and 16 % of observations in spring had an RH>95 % (Fig. S6). This explains why the mean, upper-quartile, and 90th-percentile ALWC concentrations were so much higher in winter and fall than in spring and summer. Similar skewed seasonal distributions in ALWC, with mean seasonal values near or exceeding upper-quartile values, were also observed in a decadal study in Shanghai, China (Zhou et al., 2022).
Aerosol pH showed seasonal trends that reflect the combined influence of inorganic composition and meteorology (Fig. 2d). Aerosol pH was highest in spring, with mean and median pH of 3.55, coinciding with the maxima in Tot-NH3. The lowest mean and medial pH values were observed during summer (2.83 and 2.89, respectively), when the highest temperatures and lowest ALWC levels were observed. It is likely that our imposed RH limit (>60 %) for pH calculation removed a subset of the summer data with very low pH values (<2) because of the strong effect of ALWC on pH. Therefore, it is more likely that the summer data exhibit lower quartile and 10th-percentile values than Fig. 2d shows. Winter had mean and median pH values (3.04 and 3.21, respectively) that reflect the high sulfate and low Tot-NH3 concentrations. Aerosol pH in fall exhibited the second-highest seasonal mean and median values (3.30 and 3.33, respectively). The pH in Melpitz showed a very different seasonal pattern from that observed in six Canadian cities, where pH was a minimum in summer and a maximum in winter, with spring and fall in between as the pH transitioned between the extremes (Tao and Murphy, 2019). As discussed in Sect. 3.1, the thermodynamic drivers of pH in Canada and the associated trends in pH appear to be different from those in Melpitz. Detailed analysis and discussion of the factors contributing to pH variability in Melpitz are presented in Sect. 3.4.
3.3 Diurnal trends in aerosol pH
Figure 4 shows the mean diurnal profiles of key species and parameters separated by season. Aerosol pH exhibited a maximum in the early morning hours (04:00–06:00 LT; Fig. 4g) that coincided with the peak ALWC (Fig. 4a). As temperature increased throughout the morning and into the afternoon (Fig. 4b), ALWC and pH decreased. Daily minima in ALWC and pH occurred in the afternoon, coincident with the peak temperature, but rose in the afternoon and evening as temperature decreased. The diurnal profiles of ALWC and pH are qualitatively consistent with those from diverse locations, including the southeastern US (Guo et al., 2015), Baltimore in Maryland (Battaglia et al., 2017), California (Guo et al., 2017), and Beijing (Ding et al., 2019). This reflects the strong response of pH to meteorological inputs, namely temperature and RH (Battaglia et al., 2017; Zheng et al., 2020; Tao and Murphy, 2021). The pH profiles in Fig. 4 are consistent with those in Fig. 3d, which show that the mean pH was lowest in summer, followed by winter, fall, and spring. Likewise, the ALWC profiles in Fig. 4 are consistent with the mean values shown in Fig. 2e, with summer having the lowest ALWC, followed by spring, winter, and fall.
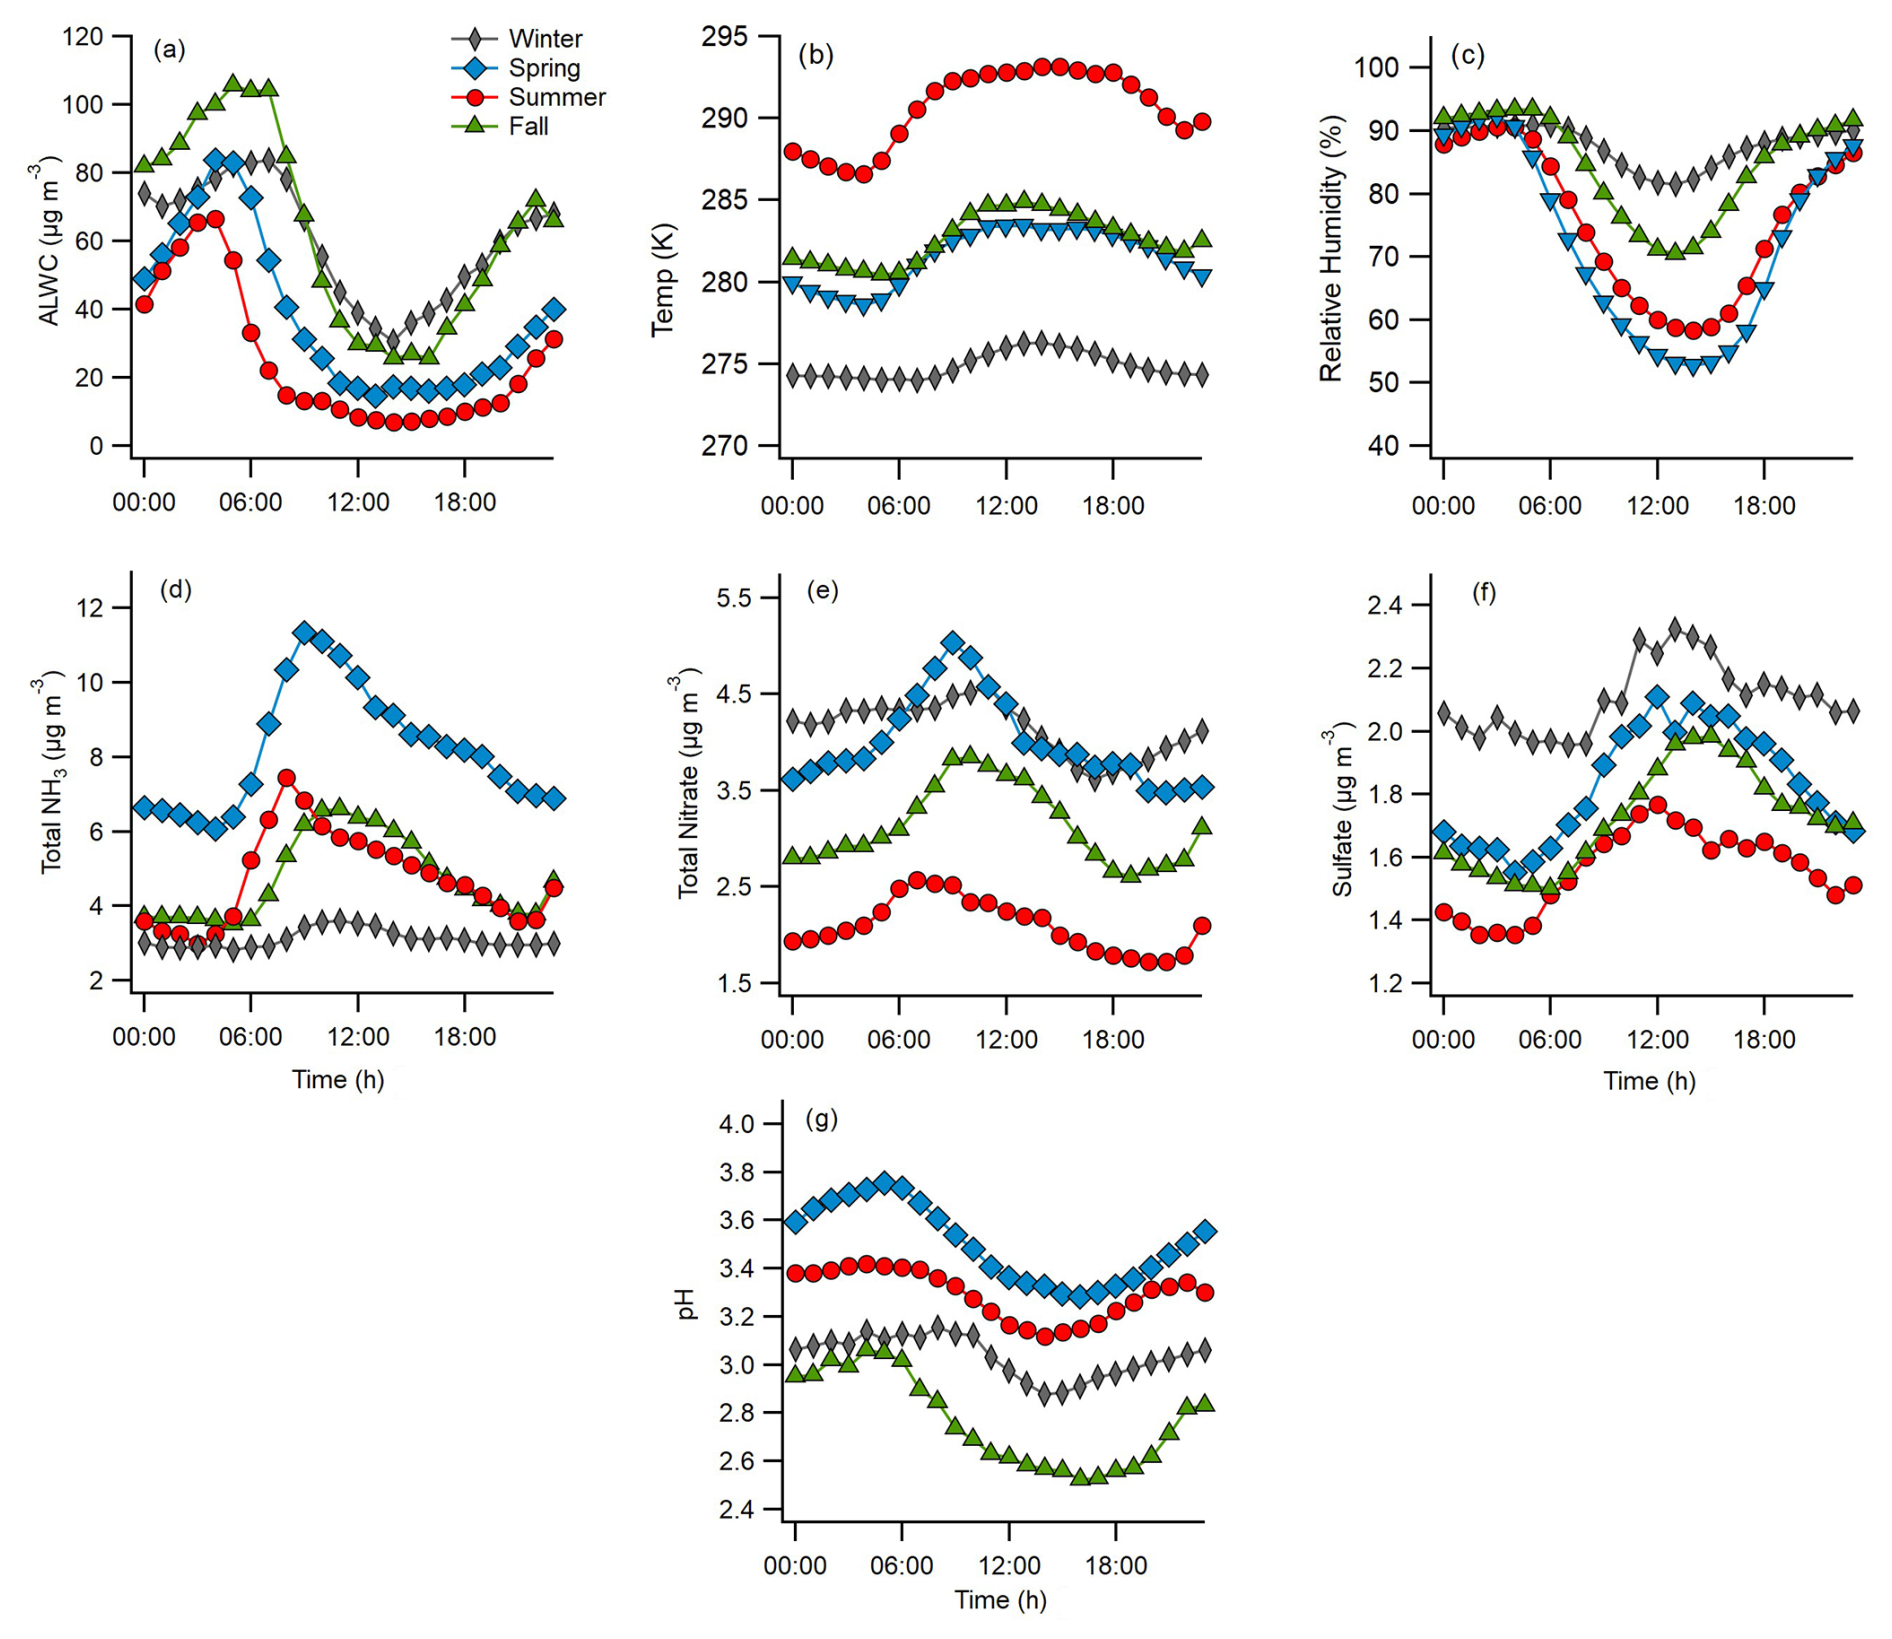
Figure 4Average LT diurnal profiles of (a) aerosol liquid water content (ALWC), (b) temperature, (c) relative humidity, (d) total NH3 (), (e) total nitrate (, (f) sulfate concentrations, and (g) aerosol pH within each season.
The diurnal profiles of Tot-NH3, Tot-NO3, and sulfate show different processes and sources contributing to their seasonal concentrations (Fig. 4d–f, respectively). Sulfate peaked between 12:00 and 15:00 LT daily, with minima at night, reflecting secondary formation processes. The midday peak during winter is weaker than during other seasons, reflecting the increased importance of regional transport during this time (Stieger et al., 2018). Tot-NO3 increased in the morning and peaked between 07:00 and 10:00 LT daily due to photochemical HNO3 formation. The diurnal profiles of Tot-NO3 were qualitatively similar during spring, summer, and fall, although the concentrations were quite different, consistent with Fig. 2b. Tot-NH3 exhibited very different behaviour to sulfate or Tot-NO3. During spring, summer, and fall, Tot-NH3 concentrations strongly increased in the morning with the onset of sunrise and the daily temperature increase, approximately doubling between 04:00 and 09:00 LT each day. Dew is an important night-time sink and morning reservoir for HONO in Melpitz (Ren et al., 2020). Therefore, in addition to fresh emissions, dew evaporation may be an important source of morning NH3 (Wentworth et al., 2016). RH peaks at night and in the early morning, and the frequency of high RH periods suggests that dew regularly forms around Melpitz (Fig. S6). While Tot-NH3 emissions vary considerably by season, Fig. 3d shows that NH3 partitioning is consistent across seasons and is mostly regulated by temperature.
ALWC shows similar diurnal profiles between seasons, with maxima around 04:00–06:00 LT and minima around 14:00–16:00 LT (Fig. 4a). The seasonal ALWC profiles are qualitatively consistent with those observed in other locations, including North America, China, and other locations in Europe (Pye et al., 2020). Aerosol pH profiles are also qualitatively similar each season, with maxima at night and in the early morning and minima in the afternoon, due to the concentrating effects of the reduced ALWC (Fig. 4g). Although the seasonal profiles also follow the general behaviour observed in many other locations, the amplitude was somewhat less, as the range in diurnal profiles was only ∼0.5 pH units in summer and spring and only ∼0.3 units in winter and fall. This suggests a higher aerosol pH buffering capacity. The calculated aerosol pH values are consistent with a modelling study of size-resolved aerosol pH over Europe (Kakavas et al., 2021). In May, aerosol pH predictions around Melpitz were ∼3 for PM1 and ∼4 for PM1–2.5, consistent with our observations. The simulations capture the diurnal trends well; however, they overestimate the range in daily pH, predicting a ∼2–2.5 units change in pH throughout the day (Kakavas et al., 2021).
Figure 5 shows the aerosol buffering capacity calculated according to Zheng et al. (2020). Overall, aerosols in Melpitz have a high buffering capacity compared to other locations like the southeastern US (Zheng et al., 2020). contributes most of the buffering capacity in Melpitz, followed by . The relative order of importance of buffering pairs was generally consistent across seasons as well (Fig. S7 in the Supplement). Other species were relatively minor contributors to the buffering capacity because of the observed aerosol pH range. The high buffering capacity leads to the relatively modest amplitude in diurnal pH values observed in Fig. 6a. By contrast, the eastern US has a much smaller buffering capacity than Central Europe, contributing to the diurnal averages of aerosol pH that vary by 1–2 pH units throughout the day (Nah et al., 2018; Guo et al., 2015). The diurnal profiles of pH in each season in Melpitz showed lower amplitudes in comparison to observations in other environments (Pye et al., 2020) . Overall, the high buffering capacity of aerosols in Melpitz suggests that pH may undergo more modest changes in response to climate change because of the high Tot-NH3 and its contribution to buffering capacity. Further, analysis of pH across diverse regions of the globe revealed that NH3- is the dominant buffering pair in the atmosphere, highlighting the important role of agricultural emissions in affecting aerosol chemistry (Zheng et al., 2020).
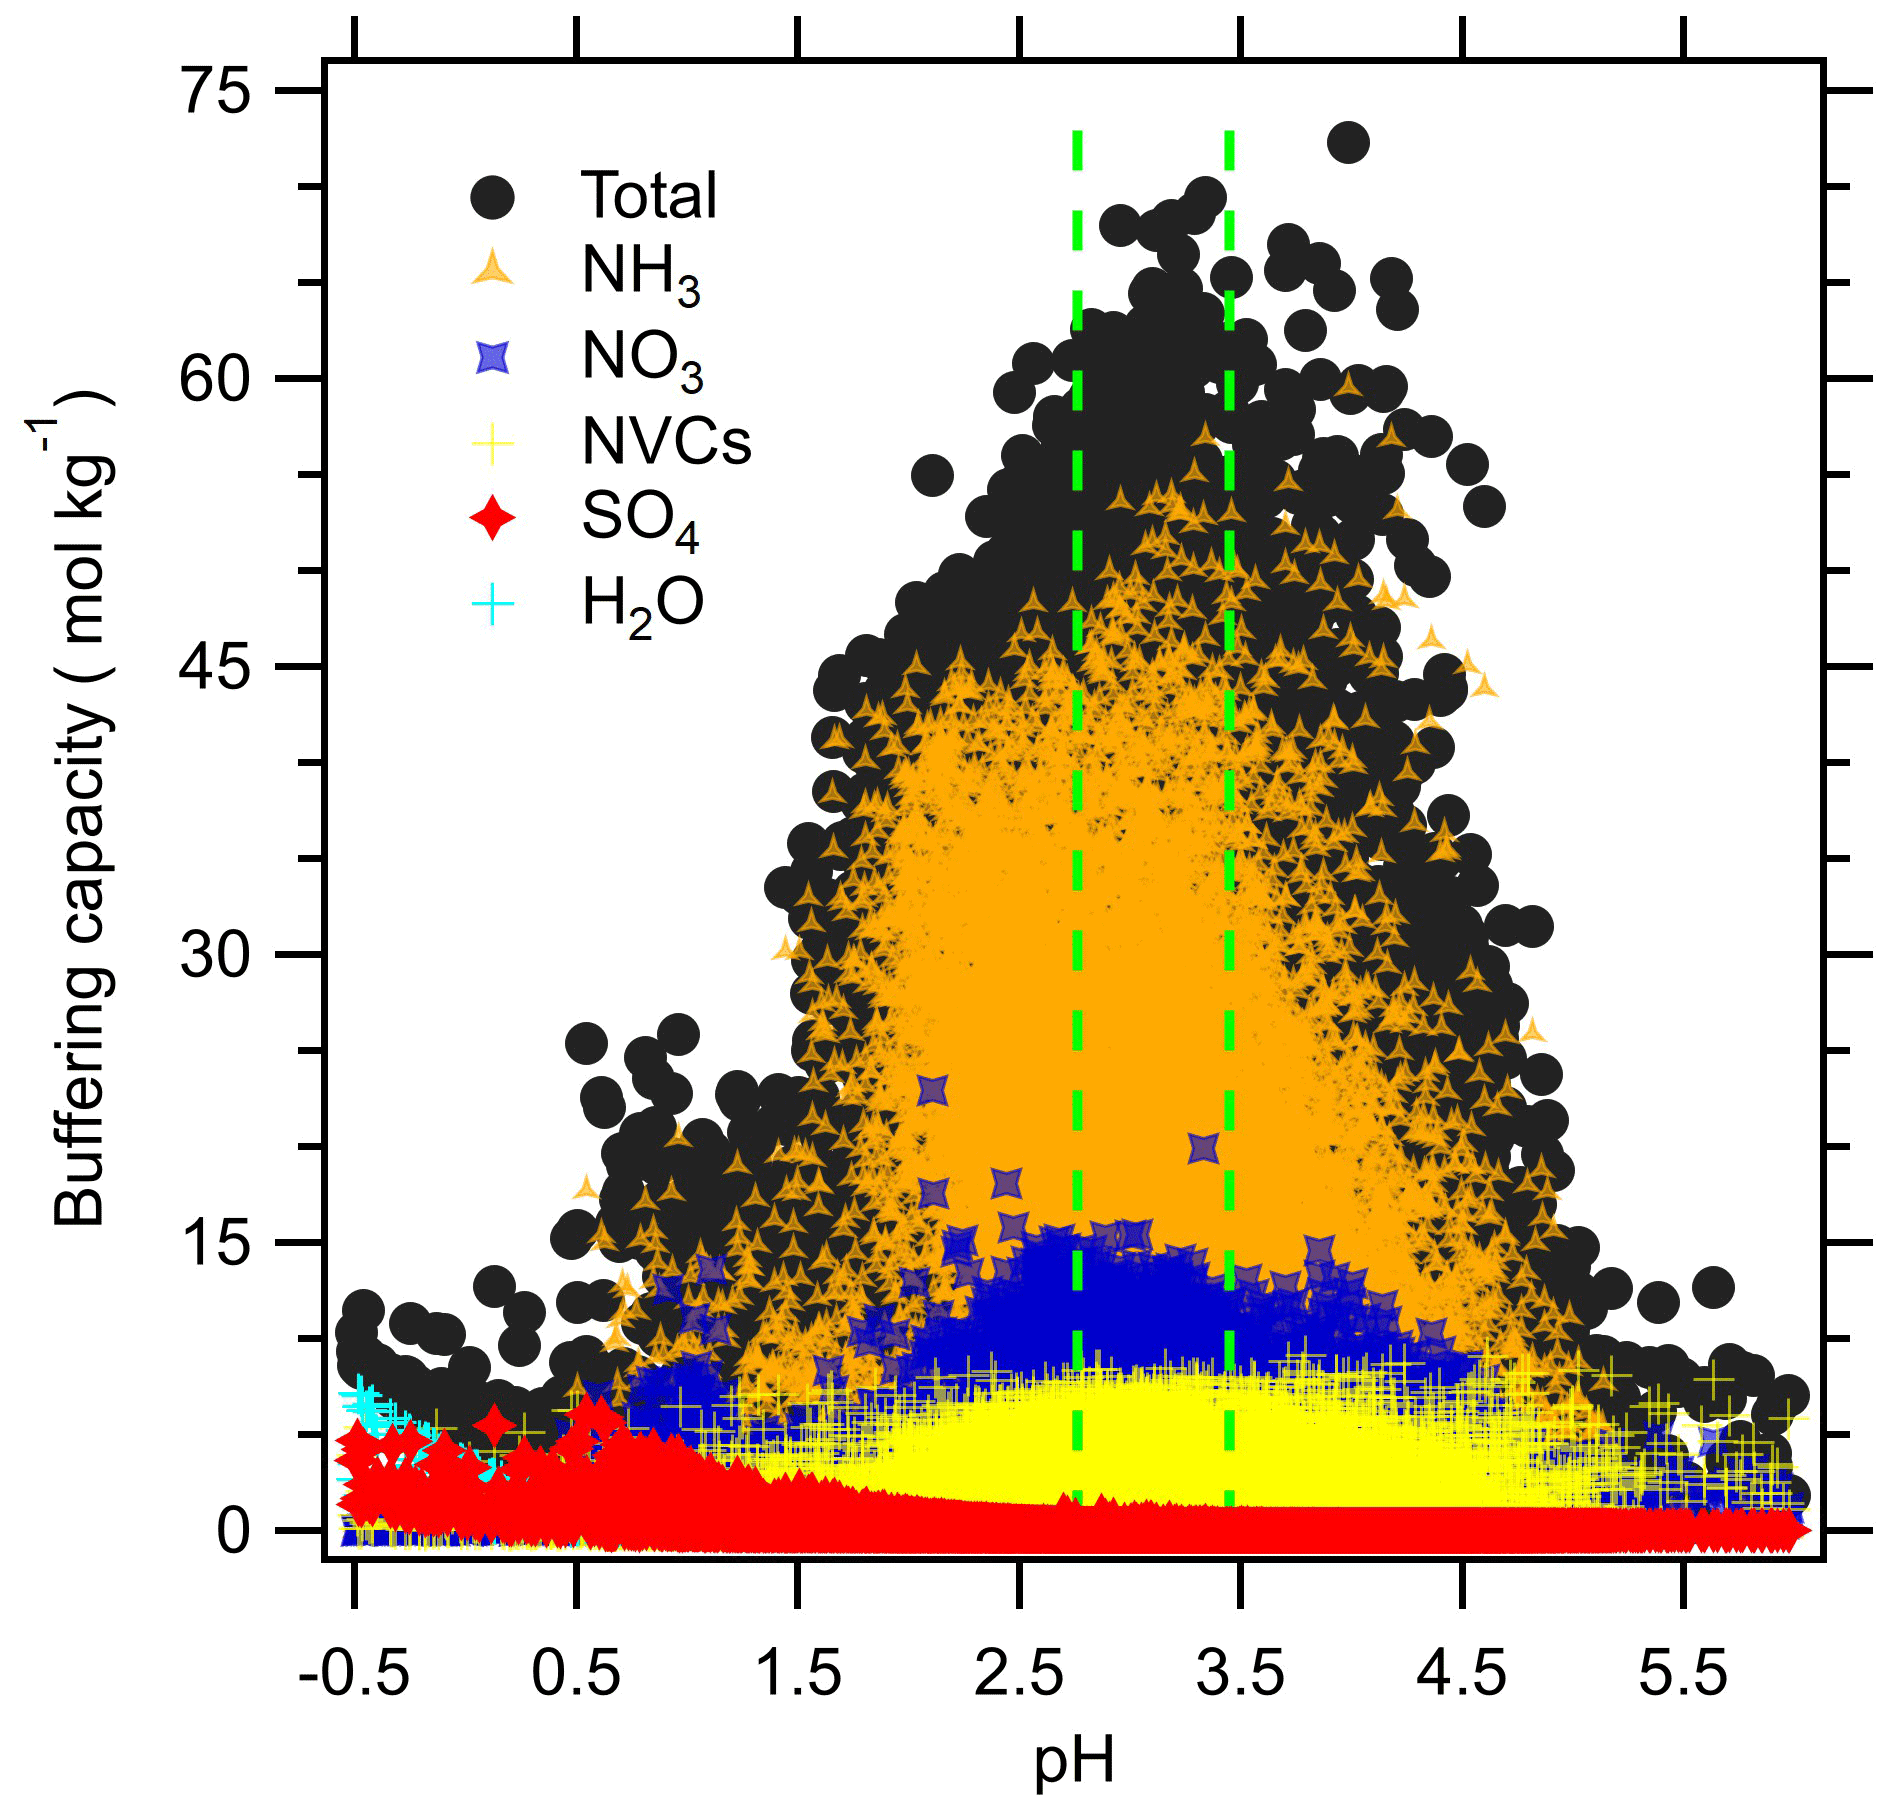
Figure 5Buffering capacity, calculated according to Zheng et al. (2020), evaluated for various species. Vertical green lines represent the region enclosed by the mean annual pH range of this work.
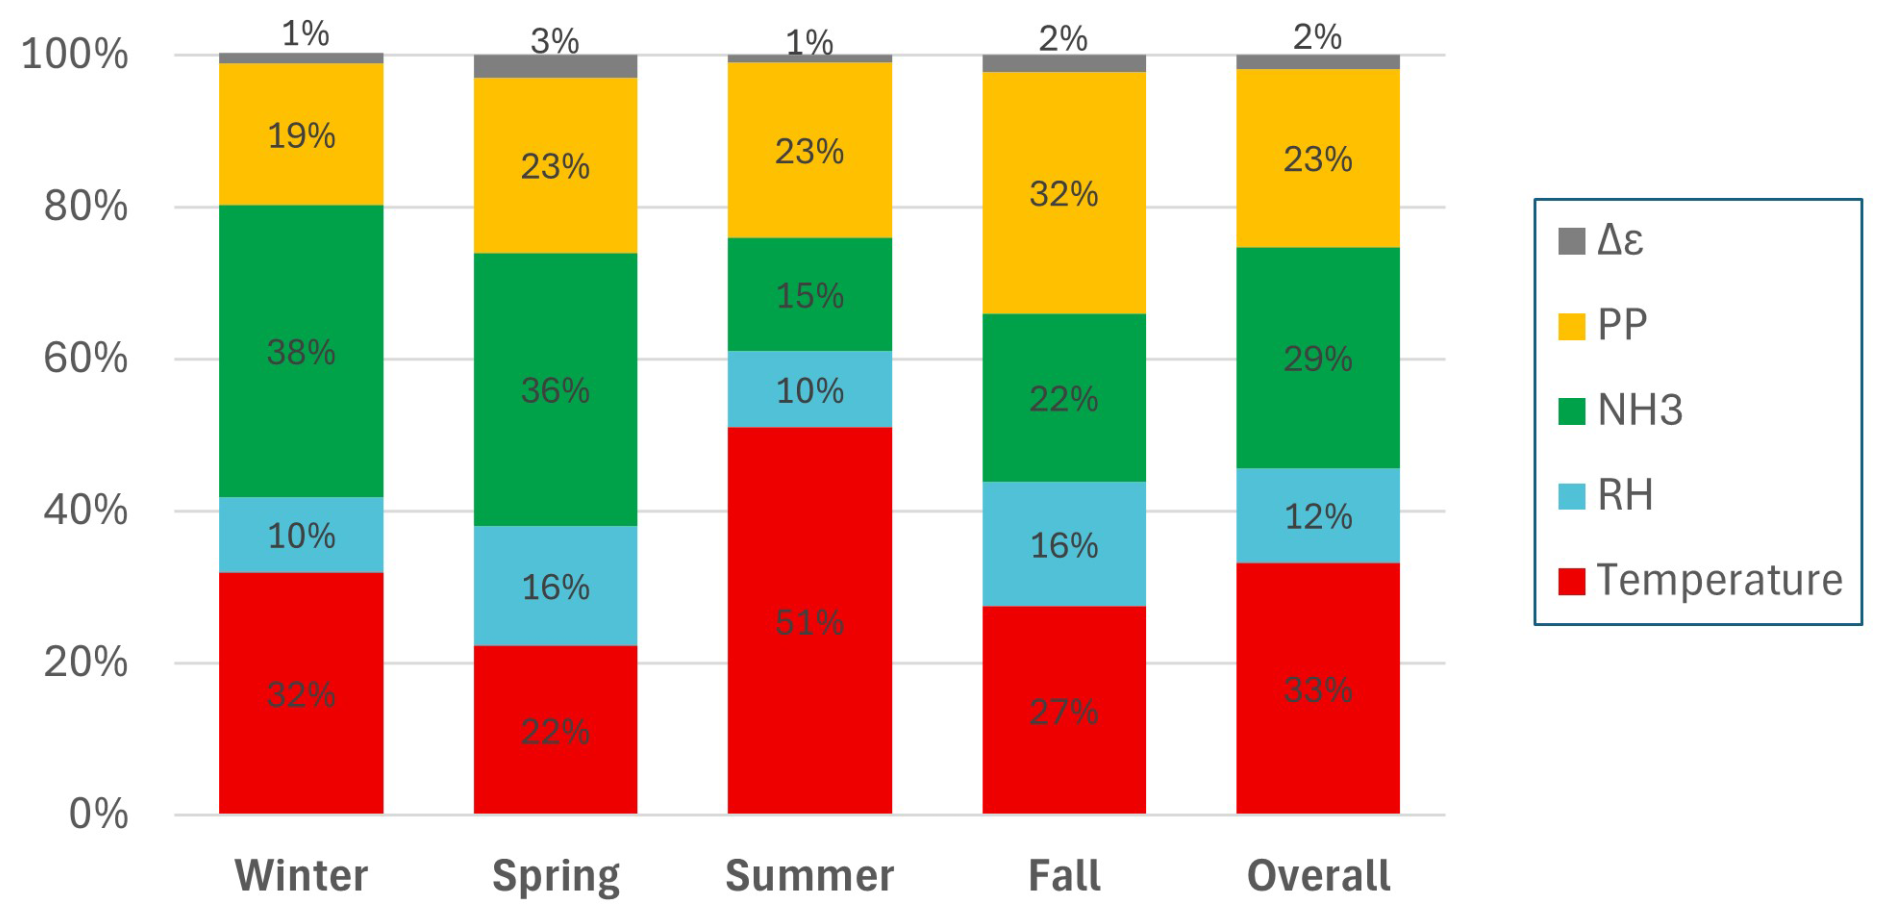
Figure 6Contribution of various factors to changes in aerosol pH at Melpitz in winter, spring, summer, fall, and overall, calculated according to Tao and Murphy (2021).
It should be noted that the present study characterizes the pH of PM10, but small particles are systematically more acidic than large particles. Kakavas et al. (2021) modelled aerosol pH over continental Europe during summer in four-size bins: PM1, PM1–2.5, PM2.5–5, and PM5–10. They found that smaller-size bins are systematically more acidic than larger-size bins due to the higher presence of non-volatile cations from sea salt and dust in larger particles, consistent with prior studies (Keene et al., 2004; Fridlind and Jacobson, 2000; Fang et al., 2017). The average pH of PM1 was 1.3 pH units lower than the largest coarse bin (PM5–10); however, this difference exhibited a strong spatial dependence. Coastal areas with high sea salt influence, such as Denmark and northwestern France, showed the largest pH differences between differently sized fractions. Kakavas et al. (2021) specifically analysed conditions in Melpitz and found the pH differences between size fractions to vary diurnally. Throughout the day, PM5–10 was ∼1 pH unit higher than PM1; however, the differences between PM1 and PM1–2.5 were as large as ∼1 pH unit at night but as small as ∼0.25 pH units in the daytime. Very similar differences and diurnal patterns were found for the PM1 vs. PM2.5–5 fractions. We expect the simulations of Kakavas et al. (2021) to represent an upper boundary on pH differences between fine and coarse fractions in Melpitz because their simulations were specific to summer: Spindler et al. (2013) showed through the analysis of long-term aerosol composition data that dust concentrations in Melpitz are highest during summer. Therefore, we expect the present results to inform the trends of aerosol pH in smaller-size fractions (PM1 and PM2.5), with pH values ∼0.25–1 units lower, depending on the season and time of day.
3.4 Drivers of pH variability
The factors contributing to pH variability in Melpitz are shown in Fig. 6. Overall, temperature and RH together accounted for 45 % of pH variability, relative to the study average. This is qualitatively consistent with prior studies that have identified the important role of meteorology in controlling pH (Battaglia et al., 2017; Zheng et al., 2020; Tao and Murphy, 2021). NH3 was the second-most important factor, responsible for 29 % of pH variability over the entire study, followed by particle properties, which contributed 23 % of the variability in pH. The role of NH3 in Melpitz was similar to its influence on pH variation in Toronto (25 %; Tao and Murphy, 2021). Note that this analysis does not capture the directional change in pH resulting from each factor. In fact, a given factor can cause both positive and negative deviations from the average, depending on conditions. Because the method quantifies changes relative to the mean study conditions, lower temperatures observed in winter contribute to increases in pH, while higher temperatures in summer contribute to decreases in pH. This can be seen in Eqs. (1) and (3), as well as in the effects of temperature on NH3 partitioning (Fig. 3d). In this analysis, these opposing effects do not cancel out in quantifying the factor's contribution to pH variability.
Consistent with the results in Fig. 2, the factors contributing to pH variability also showed distinct seasonal differences (Fig. 6). Temperature was the most significant contributor to pH variability overall, but its influence ranged from 51 % in summer to only 22 % in spring. Likewise, NH3 – the second-most important factor overall – ranged from 38 % in winter to 15 % in summer. It is important to note that the influence of NH3 on pH variability does not correlate with the Tot-NH3 concentration. For example, summer and fall Tot-NH3 concentrations were quite similar (Figs. 2c and 4d), yet NH3 had more influence on pH variability during fall than summer (22 % vs. 15 %, respectively). Particle properties, while the third-most important factor overall, had the most important effect on pH variability in the fall (32 %). RH contributed 10 %–16 % of pH variability in all seasons, far less than temperature during winter and summer but closer to the effect on temperature during spring and fall.
It should be noted that the various factors contributing to pH variability are not completely independent. For example, temperature and NH3 often influence pH in opposite directions, but NH3 emissions and abundance have a clear dependence on temperature (Fig. 3). Similarly, temperature and RH are typically inversely related at ground level. RH affects ALWC, which changes solute concentrations in aqueous particles and the gas-particle partitioning of semi-volatile compounds (Ansari and Pandis, 1999). Temperature is a master variable that affects most processes in the environment – regarding aerosol pH, it affects compound vapour pressures, equilibrium constants, activity coefficients, solubilities (i.e. overall partitioning), and reaction rates (Duan et al., 2025; Pye et al., 2020; Tilgner et al., 2021). Therefore, while their effects on aerosol pH can be separately quantified, these factors can somewhat offset each other in the ambient atmosphere, relative to conditions where one factor changes independently of the others. A similar phenomenon was observed and noted for the Canadian dataset analysed by Tao and Murphy (2021).
The results in Fig. 6 also highlight interesting trends that provide additional context to the seasonal and diurnal data (Figs. 2 and 4). For example, while the pH values in winter and summer were similar (the mean values differ by only 0.2 units), the factors contributing to pH variability were distinctly different. During winter, NH3 was a more important driver of pH variability than temperature (38 % and 32 %, respectively), but temperature was far more important during summer (51 % to 15 %). Conversely, pH values in spring and fall were also similar (the mean values differ by 0.2 units), but the drivers of pH variability were more similar than in summer–winter.
The present results are consistent with a study investigating the drivers of pH variability in Canada, where temperature was the most significant factor, followed by NH3 (Tao and Murphy, 2019, 2021). The observations in Canada also found temperature to be a much more important factor in summer and winter than it was in spring and fall, consistent with the results in Melpitz. However, particle properties had a much greater influence on pH variability in Melpitz (ranging from 19 % in winter to 32 % in fall) than in Canada, where it contributed <10 % to pH variability in each season. Tao and Murphy (2021) showed that and κ were the two most-important individual particle property factors contributing to pH variability. The results in Melpitz and Canada also differ significantly from a study that characterized pH variability at three coastal sites in China, where temperature was only a minor contributor (8 %–12 %) to pH variability (Wang et al., 2022). There, ammonia was a major factor in driving pH variability (23 %–42 %), similar to Melpitz and Canada, but RH exhibited a much stronger influence (25 %–39 %) than it did in Melpitz and Canada. There are several likely reasons for the observed differences between Melpitz and Canada and the Chinese sites. The Chinese measurements spanned only 3–5 weeks at each site, whereas the studies in Melpitz and Canada each included ∼10 years of data. It is likely that similarly brief periods of time in either location would also yield factor contributions that significantly differ from the seasonal and annual averages. The coastal Chinese sites also experienced less daily temperature variation – only ∼2–3 °C in daily temperature range – than either the Canadian or German studies, likely contributing to the much smaller effect of temperature on pH variability (Wang et al., 2022).
3.5 Sensitivity of PM mass to precursor availability
Aerosol concentrations always respond to emissions of non-volatile components and precursors, such as NVCs and sulfate. For semi-volatile components, especially NH3 and HNO3, thermodynamic conditions dictate whether aerosol mass responds to changing concentrations. Following the approach of Nenes et al. (2020), we calculated the sensitivity of PM10 mass concentrations to HNO3 and NH3 availability. The approach defines regimes where the aerosol mass is limited by HNO3 and NH3 availability, mapped in pH and ALWC space. Aerosol mass can be sensitive to NH3, HNO3, both species, or neither: temperature, ALWC, and pH are the key parameters that determine the thermodynamic regime for a given set of conditions (Nenes et al., 2020). Figure 7 shows the different thermodynamic regimes by season, calculated using the mean temperature within each season (275 K in winter, 281 K in spring, 291 K in summer, and 282 K in fall). NH4NO3 concentrations in Melpitz are typically high, accounting for ∼30 % of annual PM2.5 and PM10 mass in the region (Spindler et al., 2013). Therefore, if a sensitivity to NH3 or HNO3 (or both) is identified, this suggests that the aerosol concentration would respond to changes in these semi-volatile precursors. In the present analysis, we only considered ALWC associated with inorganic aerosol components. While water-soluble organic aerosol (OA) likely exerts minor effects on pH (Battaglia et al., 2019), it can contribute to the ALWC. Consideration of the ALWC contributed by inorganic and organic compounds would result in a minor shift of the individual data points in Fig. 7, although the logarithmic scale indicates that very few points would shift to a different thermodynamic regime (e.g. from HNO3-insensitive to HNO3-sensitive).
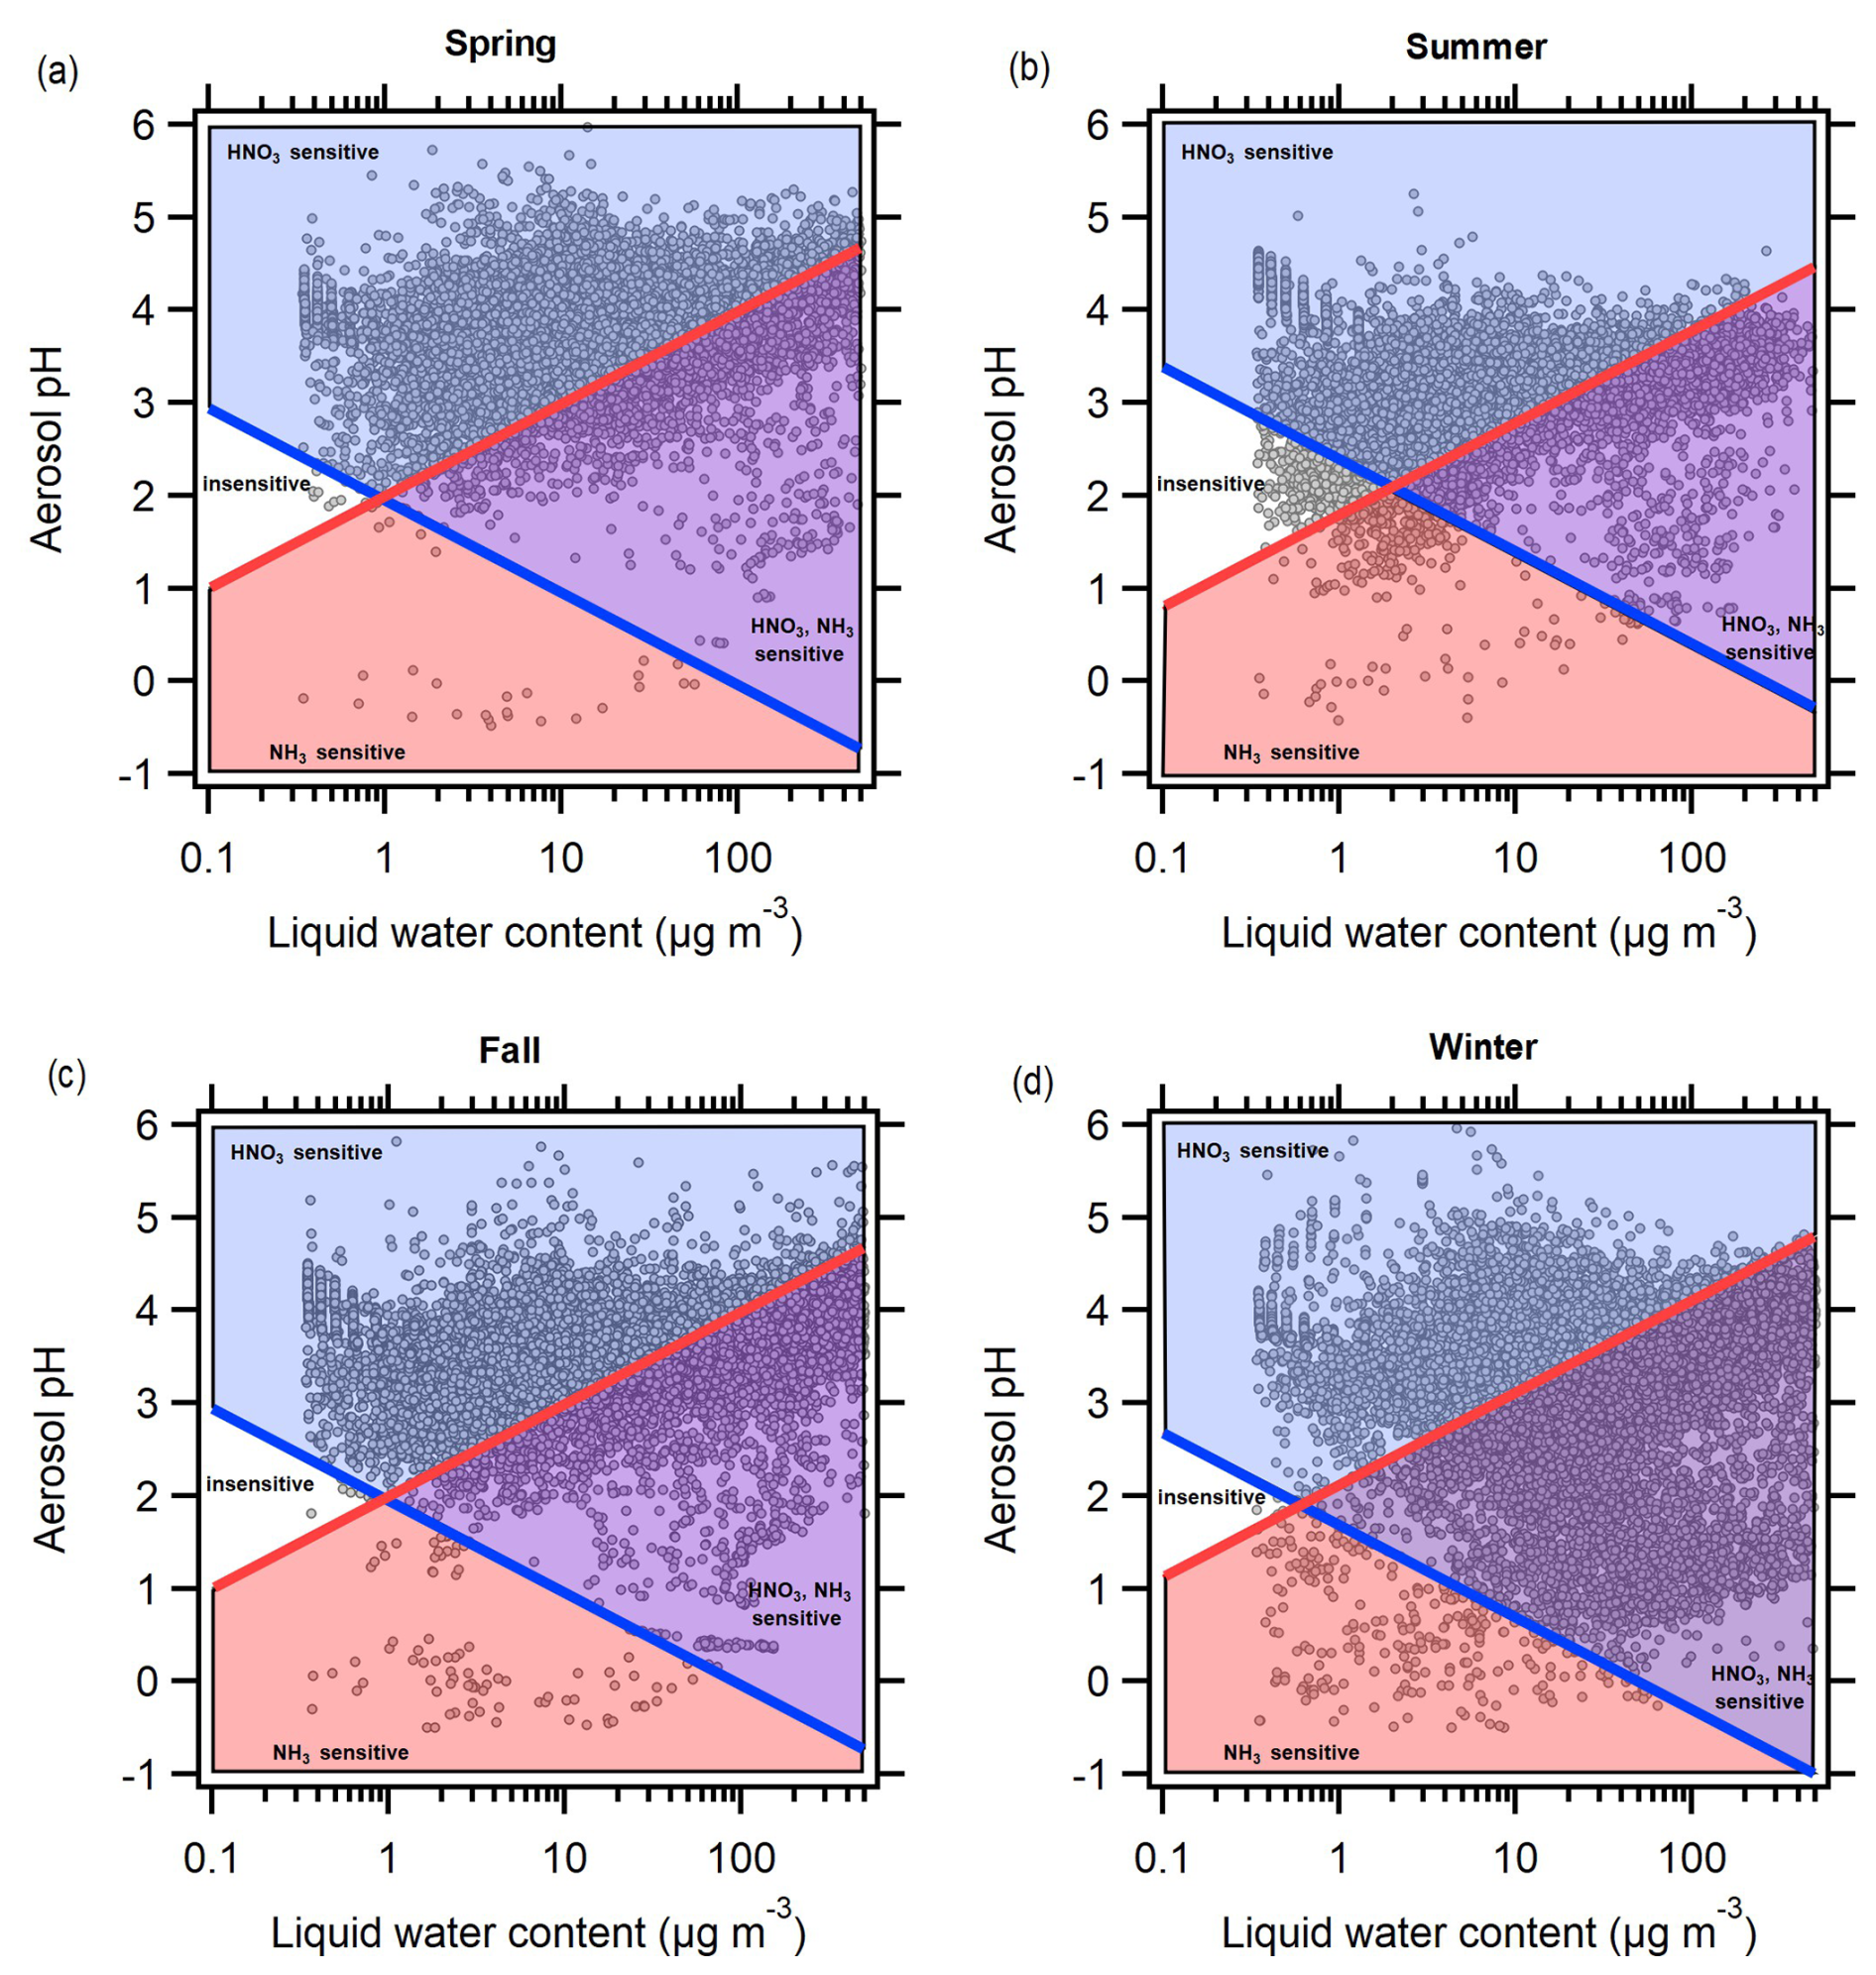
Figure 7Chemical regimes in each season showing when Melpitz aerosol mass concentrations are sensitive to HNO3 availability, NH3 availability, both, or neither, calculated according to Nenes et al. (2020).
Aerosol concentrations in Melpitz were most often sensitive to HNO3, ranging from 47 % in winter to 83 % in spring (Figs. 7 and 8). Very few observations showed sensitivity to NH3 alone, with only 0.2 % at a minimum (spring) and 2.6 % at a maximum (summer). Many observations showed sensitivity to both NH3 and HNO3, from 16 % in spring to 51 % in winter. Therefore, the fraction of observations that were sensitive to HNO3 (either exclusively or with NH3) was 94 % in summer and >99 % in spring and fall. Less than 1 % of observations showed insensitivity to NH3 and HNO3 in winter, spring, and fall, and only 3.3 % of observations in summer showed insensitivity to both species (Figs. 7 and 8). Temperature exerts a controlling effect on the partitioning coefficients of NH3 and HNO3 (affecting the intercept of the red and blue lines in Fig. 7), with higher temperatures increasing the region insensitive to both NH3 and HNO3 (white region in Fig. 7). This explains why the summer had significantly more observations in the insensitive regime than other seasons, although this was still a very minor fraction of the overall observations in this season. For a given combination of temperature and pH, higher ALWC increases the condensed-phase fraction of NH3 and HNO3, leading to conditions where the aerosol is sensitive to one or both of NH3 and HNO3. Lower ALWC leads to the opposite effect, decreasing the sensitivity of aerosol mass to either NH3 or HNO3. Thus, the generally high RH conditions in Melpitz (Fig. S6) and high ALWC levels push a lot of the observations into thermodynamic regimes sensitive to one or both of NH3 and HNO3. This analysis also offers insight into changes that may occur under a changing climate. Higher temperatures will result in more acidic particles and lower ALWC (Battaglia et al., 2017). As shown in Fig. 7, this will make the aerosol mass less sensitive to changes in NH3 and HNO3, offering fewer mitigation options for controlling PM levels.
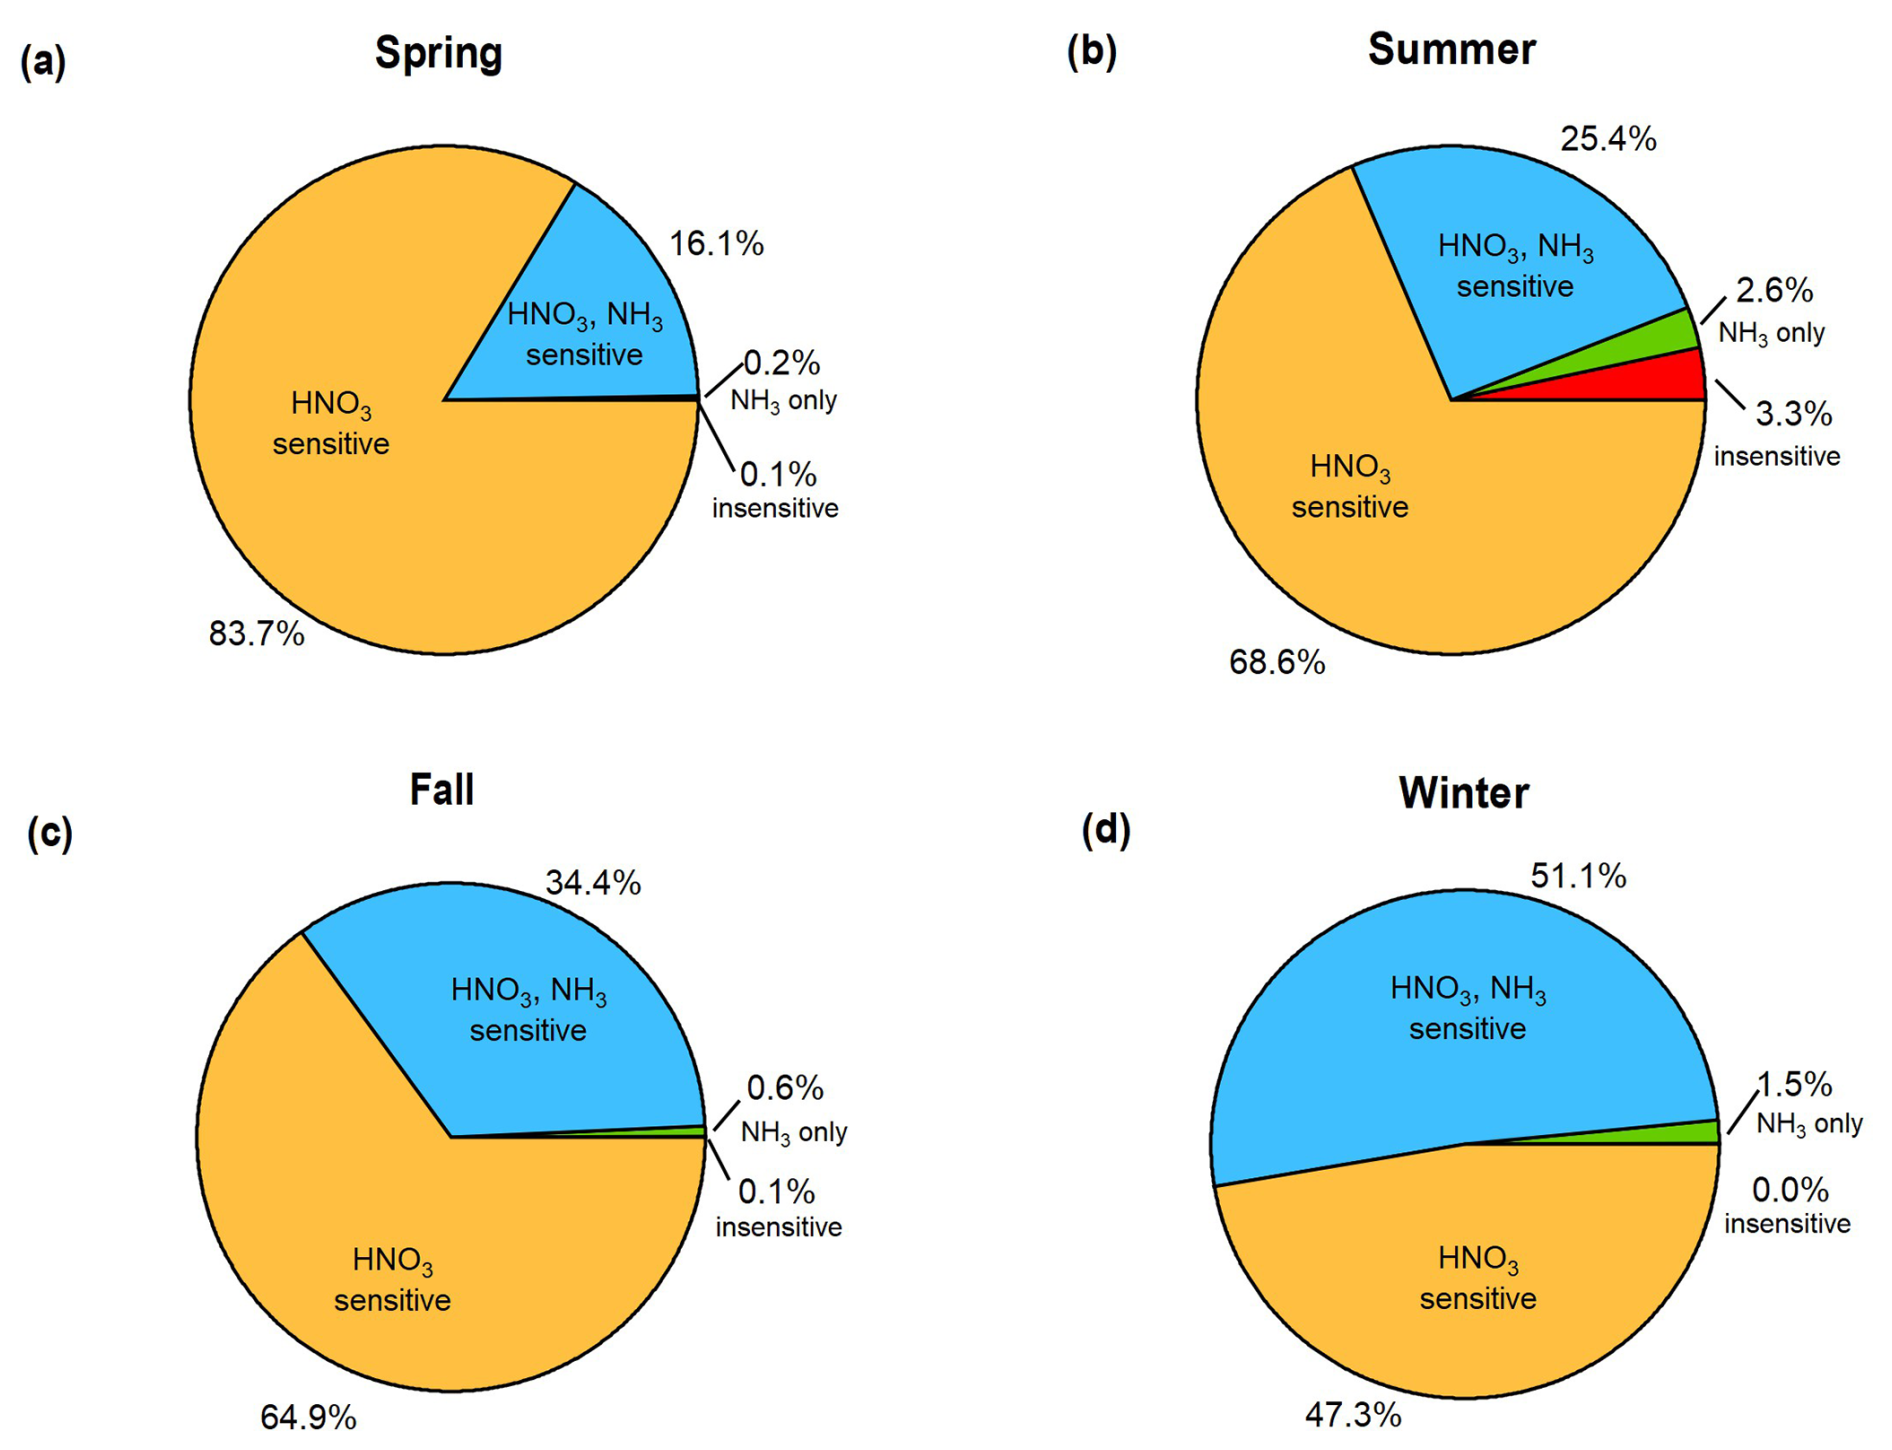
Figure 8Pie charts showing the chemical regimes in Melpitz by season with the fraction of observations in which NH4NO3 aerosol mass concentrations are sensitive to HNO3 availability, NH3 availability, both, or neither, calculated according to Nenes et al. (2020).
The results in Figs. 7 and 8 suggest that strategies to reduce PM10 concentrations in the region should prioritize NOx emission reductions over NH3 controls because it is the key HNO3 precursor. This result is consistent with a 1-year study in Cabauw, the Netherlands, which also found NOx controls more likely to reduce aerosol than NH3 controls (Guo et al., 2018b; Nenes et al., 2020). Pay et al. (2012) conducted a modelling study over Europe and found results consistent with the present analysis: more frequent aerosol regimes limited by HNO3 availability, suggesting that NOx controls may be more effective at reducing PM2.5. Another study modelled inorganic aerosol formation over Germany and found the aerosols insensitive to NH3 reductions, especially during the spring when NH3 emissions peak (Renner and Wolke, 2010). Both studies are consistent with the thermodynamic framework shown in Figs. 7 and 8. Backes et al. (2016b) modelled the response of aerosol concentrations over western Europe to changes in NH3 emissions and found that decreases in NH3 emissions led to decreases in PM2.5 and PM10 mass due to decreases in NH4NO3. In strong agreement with our thermodynamic analysis, aerosol mass showed the largest sensitivities to NH3 reductions in winter (Backes et al., 2016b).
Aerosol formation from NOx is highly non-linear, suggesting limitations to the effectiveness of NOx controls on secondary aerosol formation. For example, if a location falls under the HNO3-limited thermodynamic regime (or both HNO3-limited and NH3-limited), reductions in NOx do not necessarily translate into PM reductions in the way that SO2 reductions lead directly and almost linearly to reductions in aerosol sulfate. In the eastern US, there was a very weak response of aerosol nitrate to NOx reductions due to simultaneous changes in SO2 emissions and changes in aerosol pH, which shifted the partitioning towards the particle phase (Shah et al., 2018). So, although NOx reductions may decrease Tot-NO3, even minor changes in partitioning can keep relatively constant or even lead to an increase (Ansari and Pandis, 1998). A similar phenomenon was also observed in the Salt Lake Valley, Utah, where wintertime ammonium nitrate formation did not respond to NOx controls but was instead sensitive to VOC emissions (Womack et al., 2019). This occurs because NOx conversion to HNO3 is oxidant-limited in some environments. In such cases, the control of VOC emissions, rather than NOx or NH3, can provide the most direct effect on aerosol NH4NO3 (Dang et al., 2023; Womack et al., 2019). Changes in partitioning can also reduce the HNO3 dry deposition sink, increasing the atmospheric lifetime of Tot-NO3 (Zhai et al., 2021). This complex chemistry is consistent with a recent study in Germany which found that a 23 % reduction in NOx emissions during the COVID-19 lockdown period was associated with only a ∼5 % decrease in PM2.5 mass (Balamurugan et al., 2022). Further, actual emissions control measures indicate NH3 controls are 5–10 times more cost-effective than NOx controls at reducing PM in Europe (Liu et al., 2023).
Therefore, although the thermodynamic predictions indicate that the aerosol system in Melpitz is most frequently sensitive to HNO3, VOC controls on the conversion of NOx to HNO3 suggest that NOx reductions may not be as effective in reducing inorganic aerosol concentrations, at least at first. This helps to explain the results of a modelling study of the sulfate–nitrate–ammonium system over Germany which predicted that NH3 reductions will be more effective at reducing PM than NOx reductions due to the non-linear response described above (Banzhaf et al., 2013). Such predictions are difficult to test with observations, especially because the “accidental experiment” offered by the COVID-19 lockdown actually showed higher atmospheric NH3 emissions in northwest Germany, likely due to interannual variability in meteorological parameters (Balamurugan et al., 2022).
Central Europe has seen dramatic changes in secondary aerosol precursor emissions, which have decreased and concentrations (Nec, 2024). NH3 emissions have remained steady, or have increased, over the same time period, potentially changing aerosol pH as well. In Melpitz, the annual average pH has increased by 0.06 units per year over the 10-year period of 2010–2019. This is similar to trends of fog water pH in the Po Valley, Italy, where an annual increase of 0.04 units has been observed since 1993 (Paglione et al., 2021). However, inferred values of aerosol pH in the Po Valley have actually decreased by 0.03 units per year during the same time period due to the combination of changing aerosol composition and changing meteorology (warmer and drier). Similarly, aerosols in the southeastern US and Canada have become more acidic despite dramatic decreases in the acidic aerosol precursors SO2 and NOx (Weber et al., 2016; Tao and Murphy, 2019), contrary to the trends observed in Melpitz. Compared to the large body of studies on aerosol composition and trends, few studies have characterized trends in aerosol pH and its controlling factors. These results underscore the need for more characterizations of aerosol pH trends across Europe and beyond.
The results of the present study highlight the critical factors that contribute to aerosol pH in Central Europe. Similar to other locations, temperature is the most important factor driving pH variability. There is a strong seasonal cycle to the factors affecting pH, with NH3 and particle properties (composition and concentration) also strongly affecting pH variability. The factors contributing to pH variability do not scale with concentration, absolute temperature, or RH level. This analysis suggests that aerosol pH will continue changing in the future with regulations and climate; however, our results suggest that predictions of future changes in aerosol pH require the full treatment of the coupled emissions–chemistry–meteorology system that together determine particle acidity. Although the results were derived from measurements at a background site, similarities in other areas may also be expected. For example, in the megacity of Paris, similarities of NH3 partitioning, strong agricultural influences on secondary aerosol formation, and NH4NO3 formation regime suggest that the observations in Melpitz may translate to urban environments across Europe as well (Petetin et al., 2016).
Although it is widely observed that NH3 emissions in Europe peak during spring due to fertilizer application, variability in farming practices makes this quite challenging to accurately capture in models. For example, the region surrounding Melpitz shows large model-measurement discrepancies in NH3 emissions, and predictions are worse during the spring (van der Graaf et al., 2022). This is problematic because NH3 emissions in Germany contribute significantly to episodic events of elevated PM2.5, especially in spring, which are also challenging to model (Fortems-Cheiney et al., 2016). Although NH3 emissions represent a significant source of uncertainty in model predictions of NH4NO3 formation, errors come from numerous sources, including NOx emissions, dry deposition rates, HNO3 formation from NOx (uncertainty in OH), uncertainty in the thermodynamic partitioning, and the model treatment of bidirectional flux (Petetin et al., 2016). Therefore, the improved understanding of the aforementioned factors is required to advance predictive capabilities for springtime haze-formation events in Europe.
Finally, these results provide additional context to the strategies that may be most effective at reducing PM2.5 mass concentrations. We applied a recently developed framework to identify the thermodynamic regimes of NH4NO3 aerosol formation through aerosol pH and ALWC (Nenes et al., 2020). Very few observations (<1 % total) were insensitive to NH3 or HNO3. Thermodynamic conditions indicate that HNO3 was more often limiting than NH3, suggesting that PM2.5 control strategies in this region should target NOx emission reductions, next to ammonia reductions, especially in winter. However, the NOx reaction to form HNO3, with subsequent partitioning to aerosol , is highly non-linear. Reductions in NOx decrease Tot-NO3, but the system can respond through changes in partitioning, such that aerosol concentrations remain relatively stable (e.g. Womack et al., 2019). Changes in partitioning can change HNO3 dry deposition rates, but partitioning and dry deposition are usually significant sources of model uncertainty (e.g. Zakoura and Pandis, 2019). Therefore, future studies are needed to complement the thermodynamic calculations in order to address such complexities.
All data presented in this work are available upon request.
The supplement related to this article is available online at https://doi.org/10.5194/acp-25-8871-2025-supplement.
VP: formal analysis, investigation, visualization, and writing (reviewing and editing) of the paper. CJH: conceptualization, supervision, formal analysis, funding acquisition, visualization, and writing (reviewing and editing) of the paper. BS: investigation, validation, data curation, and writing (reviewing and editing) of the paper. AT: formal analysis, investigation, data curation, and writing (reviewing and editing) of the paper. LP: formal analysis, investigation, data curation, and writing (reviewing and editing) of the paper. DvP: investigation, data curation, and writing (reviewing and editing) of the paper. GS: investigation, validation, data curation, and writing (reviewing and editing) of the paper. HH: conceptualization, supervision, resources, funding acquisition, and writing (reviewing and editing) of the paper.
The contact author has declared that none of the authors has any competing interests.
Publisher's note: Copernicus Publications remains neutral with regard to jurisdictional claims made in the text, published maps, institutional affiliations, or any other geographical representation in this paper. While Copernicus Publications makes every effort to include appropriate place names, the final responsibility lies with the authors.
The authors acknowledge support in instrument operation in Melpitz by the TROPOS ACD technicians Achim Grüner and René Rabe.
This research has been supported by the National Science Foundation (grant nos. AGS-1719252 and AGS-2430366), the German federal environment protection agency Umweltbundesamt (UBA, grant no. 52436), the European Regional Development Fund of the European Union (grant no. 100188826), the European infrastructure projects ACTRIS (EU FP7; grant no. 262254) and ACTRIS-2 (grant no. 654109), and the RI-URBANS project (grant no. 101036245).
This paper was edited by Alexander Laskin and reviewed by Rodney Weber and one anonymous referee.
Ahrens, L., Harner, T., Shoeib, M., Lane, D. A., and Murphy, J. G.: Improved Characterization of Gas-Particle Partitioning for Per- and Polyfluoroalkyl Substances in the Atmosphere Using Annular Diffusion Denuder Samplers, Environ. Sci. Technol., 46, 7199–7206, https://doi.org/10.1021/es300898s, 2012.
Ansari, A. S. and Pandis, S. N.: Response of Inorganic PM to Precursor Concentrations, Environ. Sci. Technol., 32, 2706–2714, https://doi.org/10.1021/es971130j, 1998.
Ansari, A. S. and Pandis, S. N.: An analysis of four models predicting the partitioning of semivolatile inorganic aerosol components, Aerosol Sci. Tech., 31, 129–153, https://doi.org/10.1080/027868299304200, 1999.
Atabakhsh, S., Poulain, L., Chen, G., Canonaco, F., Prévôt, A. S. H., Pöhlker, M., Wiedensohler, A., and Herrmann, H.: A 1 year aerosol chemical speciation monitor (ACSM) source analysis of organic aerosol particle contributions from anthropogenic sources after long-range transport at the TROPOS research station Melpitz, Atmos. Chem. Phys., 23, 6963–6988, https://doi.org/10.5194/acp-23-6963-2023, 2023.
Atabakhsh, S., Poulain, L., Bigi, A., Coen, M. C., Pöhlker, M., and Herrmann, H.: Trends of PM1 aerosol chemical composition, carbonaceous aerosol, and source over the last 10 years at Melpitz (Germany), Atmos. Environ., 346, 121075, https://doi.org/10.1016/j.atmosenv.2025.121075, 2025.
Backes, A., Aulinger, A., Bieser, J., Matthias, V., and Quante, M.: Ammonia emissions in Europe, part I: Development of a dynamical ammonia emission inventory, Atmos. Environ., 131, 55–66, https://doi.org/10.1016/j.atmosenv.2016.01.041, 2016a.
Backes, A. M., Aulinger, A., Bieser, J., Matthias, V., and Quante, M.: Ammonia emissions in Europe, part II: How ammonia emission abatement strategies affect secondary aerosols, Atmos. Environ., 126, 153–161, https://doi.org/10.1016/j.atmosenv.2015.11.039, 2016b.
Baker, A. R., Kanakidou, M., Nenes, A., Myriokefalitakis, S., Croot, P. L., Duce, R. A., Gao, Y., Guieu, C., Ito, A., Jickells, T. D., Mahowald, N. M., Middag, R., Perron, M. M. G., Sarin, M. M., Shelley, R., and Turner, D. R.: Changing atmospheric acidity as a modulator of nutrient deposition and ocean biogeochemistry, Science Advances, 7, eabd8800, https://doi.org/10.1126/sciadv.abd8800, 2021.
Balamurugan, V., Chen, J., Qu, Z., Bi, X., and Keutsch, F. N.: Secondary PM2.5 decreases significantly less than NO2 emission reductions during COVID lockdown in Germany, Atmos. Chem. Phys., 22, 7105–7129, https://doi.org/10.5194/acp-22-7105-2022, 2022.
Banzhaf, S., Schaap, M., Wichink Kruit, R. J., Denier van der Gon, H. A. C., Stern, R., and Builtjes, P. J. H.: Impact of emission changes on secondary inorganic aerosol episodes across Germany, Atmos. Chem. Phys., 13, 11675–11693, https://doi.org/10.5194/acp-13-11675-2013, 2013.
Battaglia Jr., M. A., Douglas, S., and Hennigan, C. J.: Effect of the Urban Heat Island on Aerosol pH, Environ. Sci. Technol., 51, 13095–13103, https://doi.org/10.1021/acs.est.7b02786, 2017.
Battaglia Jr., M. A., Weber, R. J., Nenes, A., and Hennigan, C. J.: Effects of water-soluble organic carbon on aerosol pH, Atmos. Chem. Phys., 19, 14607–14620, https://doi.org/10.5194/acp-19-14607-2019, 2019.
Battaglia Jr., M. A., Balasus, N., Ball, K., Caicedo, V., Delgado, R., Carlton, A. G., and Hennigan, C. J.: Urban aerosol chemistry at a land–water transition site during summer – Part 2: Aerosol pH and liquid water content, Atmos. Chem. Phys., 21, 18271–18281, https://doi.org/10.5194/acp-21-18271-2021, 2021.
Bougiatioti, A., Nikolaou, P., Stavroulas, I., Kouvarakis, G., Weber, R., Nenes, A., Kanakidou, M., and Mihalopoulos, N.: Particle water and pH in the eastern Mediterranean: source variability and implications for nutrient availability, Atmos. Chem. Phys., 16, 4579–4591, https://doi.org/10.5194/acp-16-4579-2016, 2016.
Campbell, J. R., Battaglia, M., Dingilian, K. K., Cesler-Maloney, M., Simpson, W. R., Robinson, E. S., DeCarlo, P. F., Temime-Roussel, B., D'Anna, B., Holen, A. L., Wu, J., Pratt, K. A., Dibb, J. E., Nenes, A., Weber, R. J., and Mao, J.: Enhanced aqueous formation and neutralization of fine atmospheric particles driven by extreme cold, Science Advances, 10, eado4373, https://doi.org/10.1126/sciadv.ado4373, 2024.
Clegg, S. L., Brimblecombe, P., and Wexler, A. S.: Thermodynamic model of the system H+--–NO3–H2O at tropospheric temperatures, J. Phys. Chem. A, 102, 2137–2154, https://doi.org/10.1021/jp973042r, 1998.
Dang, R., Jacob, D. J., Zhai, S., Coheur, P., Clarisse, L., Van Damme, M., Pendergrass, D. C., Choi, J.-S., Park, J.-S., Liu, Z., and Liao, H.: Diagnosing the Sensitivity of Particulate Nitrate to Precursor Emissions Using Satellite Observations of Ammonia and Nitrogen Dioxide, Geophys. Res. Lett., 50, e2023GL105761, https://doi.org/10.1029/2023GL105761, 2023.
Ding, J., Zhao, P., Su, J., Dong, Q., Du, X., and Zhang, Y.: Aerosol pH and its driving factors in Beijing, Atmos. Chem. Phys., 19, 7939–7954, https://doi.org/10.5194/acp-19-7939-2019, 2019.
Dockery, D. W., Cunningham, J., Damokosh, A. I., Neas, L. M., Spengler, J. D., Koutrakis, P., Ware, J. H., Raizenne, M., and Speizer, F. E.: Health effects of acid aerosols on North American children: respiratory symptoms, Environ. Health Persp., 104, 500–505, https://doi.org/10.1289/ehp.96104500, 1996.
Duan, X., Zheng, G., Chen, C., Zhang, Q., and He, K.: Driving factors of aerosol acidity: a new hierarchical quantitative analysis framework and its application in Changzhou, China, Atmos. Chem. Phys., 25, 3919–3928, https://doi.org/10.5194/acp-25-3919-2025, 2025.
Fang, T., Guo, H. Y., Zeng, L. H., Verma, V., Nenes, A., and Weber, R. J.: Highly Acidic Ambient Particles, Soluble Metals, and Oxidative Potential: A Link between Sulfate and Aerosol Toxicity, Environ. Sci. Technol., 51, 2611–2620, https://doi.org/10.1021/acs.est.6b06151, 2017.
Fortems-Cheiney, A., Dufour, G., Hamaoui-Laguel, L., Foret, G., Siour, G., Van Damme, M., Meleux, F., Coheur, P.-F., Clerbaux, C., Clarisse, L., Favez, O., Wallasch, M., and Beekmann, M.: Unaccounted variability in NH3 agricultural sources detected by IASI contributing to European spring haze episode, Geophys. Res. Lett., 43, 5475–5482, https://doi.org/10.1002/2016GL069361, 2016.
Fridlind, A. M. and Jacobson, M. Z.: A study of gas-aerosol equilibrium and aerosol pH in the remote marine boundary layer during the First Aerosol Characterization Experiment (ACE 1), J. Geophys. Res.-Atmos., 105, 17325–17340, https://doi.org/10.1029/2000JD900209, 2000.
Guo, H., Xu, L., Bougiatioti, A., Cerully, K. M., Capps, S. L., Hite Jr., J. R., Carlton, A. G., Lee, S.-H., Bergin, M. H., Ng, N. L., Nenes, A., and Weber, R. J.: Fine-particle water and pH in the southeastern United States, Atmos. Chem. Phys., 15, 5211–5228, https://doi.org/10.5194/acp-15-5211-2015, 2015.
Guo, H., Liu, J., Froyd, K. D., Roberts, J. M., Veres, P. R., Hayes, P. L., Jimenez, J. L., Nenes, A., and Weber, R. J.: Fine particle pH and gas–particle phase partitioning of inorganic species in Pasadena, California, during the 2010 CalNex campaign, Atmos. Chem. Phys., 17, 5703–5719, https://doi.org/10.5194/acp-17-5703-2017, 2017.
Guo, H., Nenes, A., and Weber, R. J.: The underappreciated role of nonvolatile cations in aerosol ammonium-sulfate molar ratios, Atmos. Chem. Phys., 18, 17307–17323, https://doi.org/10.5194/acp-18-17307-2018, 2018a.
Guo, H., Otjes, R., Schlag, P., Kiendler-Scharr, A., Nenes, A., and Weber, R. J.: Effectiveness of ammonia reduction on control of fine particle nitrate, Atmos. Chem. Phys., 18, 12241–12256, https://doi.org/10.5194/acp-18-12241-2018, 2018b.
Hamed, A., Birmili, W., Joutsensaari, J., Mikkonen, S., Asmi, A., Wehner, B., Spindler, G., Jaatinen, A., Wiedensohler, A., Korhonen, H., Lehtinen, K. E. J., and Laaksonen, A.: Changes in the production rate of secondary aerosol particles in Central Europe in view of decreasing SO2 emissions between 1996 and 2006, Atmos. Chem. Phys., 10, 1071–1091, https://doi.org/10.5194/acp-10-1071-2010, 2010.
Jonson, J. E., Fagerli, H., Scheuschner, T., and Tsyro, S.: Modelling changes in secondary inorganic aerosol formation and nitrogen deposition in Europe from 2005 to 2030, Atmos. Chem. Phys., 22, 1311–1331, https://doi.org/10.5194/acp-22-1311-2022, 2022.
Kakavas, S., Patoulias, D., Zakoura, M., Nenes, A., and Pandis, S. N.: Size-resolved aerosol pH over Europe during summer, Atmos. Chem. Phys., 21, 799–811, https://doi.org/10.5194/acp-21-799-2021, 2021.
Keene, W. C., Pszenny, A. A. P., Maben, J. R., Stevenson, E., and Wall, A.: Closure evaluation of size-resolved aerosol pH in the New England coastal atmosphere during summer, J. Geophys. Res.-Atmos., 109, D23307, https://doi.org/10.1029/2004JD004801, 2004.
Lawrence, C. E., Casson, P., Brandt, R., Schwab, J. J., Dukett, J. E., Snyder, P., Yerger, E., Kelting, D., VandenBoer, T. C., and Lance, S.: Long-term monitoring of cloud water chemistry at Whiteface Mountain: the emergence of a new chemical regime, Atmos. Chem. Phys., 23, 1619–1639, https://doi.org/10.5194/acp-23-1619-2023, 2023.
Liu, Z., Rieder, H. E., Schmidt, C., Mayer, M., Guo, Y., Winiwarter, W., and Zhang, L.: Optimal reactive nitrogen control pathways identified for cost-effective PM2.5 mitigation in Europe, Nat. Commun., 14, 4246, https://doi.org/10.1038/s41467-023-39900-9, 2023.
Mahowald, N.: Aerosol Indirect Effect on Biogeochemical Cycles and Climate, Science, 334, 794–796, https://doi.org/10.1126/science.1207374, 2011.
Mahowald, N. M., Hamilton, D. S., Mackey, K. R. M., Moore, J. K., Baker, A. R., Scanza, R. A., and Zhang, Y.: Aerosol trace metal leaching and impacts on marine microorganisms, Nat. Commun., 9, 2614, https://doi.org/10.1038/s41467-018-04970-7, 2018.
Meskhidze, N., Chameides, W. L., Nenes, A., and Chen, G.: Iron mobilization in mineral dust: Can anthropogenic SO2 emissions affect ocean productivity?, Geophys. Res. Lett., 30, 2085, https://doi.org/10.1029/2003gl018035, 2003.
Nah, T., Guo, H., Sullivan, A. P., Chen, Y., Tanner, D. J., Nenes, A., Russell, A., Ng, N. L., Huey, L. G., and Weber, R. J.: Characterization of aerosol composition, aerosol acidity, and organic acid partitioning at an agriculturally intensive rural southeastern US site, Atmos. Chem. Phys., 18, 11471–11491, https://doi.org/10.5194/acp-18-11471-2018, 2018.
NEC: Air pollution in Europe: 2024 reporting status under the National Emission reduction Commitments Directive, https://doi.org/10.2800/977119, 2024.
Nenes, A., Pandis, S. N., Weber, R. J., and Russell, A.: Aerosol pH and liquid water content determine when particulate matter is sensitive to ammonia and nitrate availability, Atmos. Chem. Phys., 20, 3249–3258, https://doi.org/10.5194/acp-20-3249-2020, 2020.
Nenes, A., Pandis, S. N., Kanakidou, M., Russell, A. G., Song, S., Vasilakos, P., and Weber, R. J.: Aerosol acidity and liquid water content regulate the dry deposition of inorganic reactive nitrogen, Atmos. Chem. Phys., 21, 6023–6033, https://doi.org/10.5194/acp-21-6023-2021, 2021.
Paglione, M., Decesari, S., Rinaldi, M., Tarozzi, L., Manarini, F., Gilardoni, S., Facchini, M. C., Fuzzi, S., Bacco, D., Trentini, A., Pandis, S. N., and Nenes, A.: Historical Changes in Seasonal Aerosol Acidity in the Po Valley (Italy) as Inferred from Fog Water and Aerosol Measurements, Environ. Sci. Technol., 55, 7307–7315, https://doi.org/10.1021/acs.est.1c00651, 2021.
Pan, D., Mauzerall, D. L., Wang, R., Guo, X., Puchalski, M., Guo, Y., Song, S., Tong, D., Sullivan, A. P., Schichtel, B. A., Collett, J. L., and Zondlo, M. A.: Regime shift in secondary inorganic aerosol formation and nitrogen deposition in the rural United States, Nat. Geosci., 17, 617–623, https://doi.org/10.1038/s41561-024-01455-9, 2024.
Pay, M. T., Jiménez-Guerrero, P., and Baldasano, J. M.: Assessing sensitivity regimes of secondary inorganic aerosol formation in Europe with the CALIOPE-EU modeling system, Atmos. Environ., 51, 146–164, https://doi.org/10.1016/j.atmosenv.2012.01.027, 2012.
Petetin, H., Sciare, J., Bressi, M., Gros, V., Rosso, A., Sanchez, O., Sarda-Estève, R., Petit, J.-E., and Beekmann, M.: Assessing the ammonium nitrate formation regime in the Paris megacity and its representation in the CHIMERE model, Atmos. Chem. Phys., 16, 10419–10440, https://doi.org/10.5194/acp-16-10419-2016, 2016.
Phillips, S. M., Bellcross, A. D., and Smith, G. D.: Light Absorption by Brown Carbon in the Southeastern United States is pH-dependent, Environ. Sci. Technol., 51, 6782–6790, https://doi.org/10.1021/acs.est.7b01116, 2017.
Pye, H. O. T., Nenes, A., Alexander, B., Ault, A. P., Barth, M. C., Clegg, S. L., Collett Jr., J. L., Fahey, K. M., Hennigan, C. J., Herrmann, H., Kanakidou, M., Kelly, J. T., Ku, I.-T., McNeill, V. F., Riemer, N., Schaefer, T., Shi, G., Tilgner, A., Walker, J. T., Wang, T., Weber, R., Xing, J., Zaveri, R. A., and Zuend, A.: The acidity of atmospheric particles and clouds, Atmos. Chem. Phys., 20, 4809–4888, https://doi.org/10.5194/acp-20-4809-2020, 2020.
Ren, Y., Stieger, B., Spindler, G., Grosselin, B., Mellouki, A., Tuch, T., Wiedensohler, A., and Herrmann, H.: Role of the dew water on the ground surface in HONO distribution: a case measurement in Melpitz, Atmos. Chem. Phys., 20, 13069–13089, https://doi.org/10.5194/acp-20-13069-2020, 2020.
Renner, E. and Wolke, R.: Modelling the formation and atmospheric transport of secondary inorganic aerosols with special attention to regions with high ammonia emissions, Atmos. Environ., 44, 1904–1912, https://doi.org/10.1016/j.atmosenv.2010.02.018, 2010.
Rumsey, I. C., Cowen, K. A., Walker, J. T., Kelly, T. J., Hanft, E. A., Mishoe, K., Rogers, C., Proost, R., Beachley, G. M., Lear, G., Frelink, T., and Otjes, R. P.: An assessment of the performance of the Monitor for AeRosols and GAses in ambient air (MARGA): a semi-continuous method for soluble compounds, Atmos. Chem. Phys., 14, 5639–5658, https://doi.org/10.5194/acp-14-5639-2014, 2014.
Shah, V., Jaeglé, L., Thornton, J. A., Lopez-Hilfiker, F. D., Lee, B. H., Schroder, J. C., Campuzano-Jost, P., Jimenez, J. L., Guo, H., Sullivan, A. P., Weber, R. J., Green, J. R., Fiddler, M. N., Bililign, S., Campos, T. L., Stell, M., Weinheimer, A. J., Montzka, D. D., and Brown, S. S.: Chemical feedbacks weaken the wintertime response of particulate sulfate and nitrate to emissions reductions over the eastern United States, P. Natl. Acad. Sci. USA, 115, 8110–8115, https://doi.org/10.1073/pnas.1803295115, 2018.
Song, X., Wu, D., Su, Y., Li, Y., and Li, Q.: Review of health effects driven by aerosol acidity: Occurrence and implications for air pollution control, Sci. Total Environ., 955, 176839, https://doi.org/10.1016/j.scitotenv.2024.176839, 2024.
Spindler, G., Müller, K., Brüggemann, E., Gnauk, T., and Herrmann, H.: Long-term size-segregated characterization of PM10, PM2.5, and PM1 at the IfT research station Melpitz downwind of Leipzig (Germany) using high and low-volume filter samplers, Atmos. Environ., 38, 5333–5347, https://doi.org/10.1016/j.atmosenv.2003.12.047, 2004.
Spindler, G., Brüggemann, E., Gnauk, T., Grüner, A., Müller, K., and Herrmann, H.: A four-year size-segregated characterization study of particles PM10, PM2.5 and PM1 depending on air mass origin at Melpitz, Atmos. Environ., 44, 164–173, https://doi.org/10.1016/j.atmosenv.2009.10.015, 2010.
Spindler, G., Grüner, A., Müller, K., Schlimper, S., and Herrmann, H.: Long-term size-segregated particle (PM10, PM2.5, PM1) characterization study at Melpitz – influence of air mass inflow, weather conditions and season, J. Atmos. Chem., 70, 165–195, https://doi.org/10.1007/s10874-013-9263-8, 2013.
Squizzato, S., Masiol, M., Brunelli, A., Pistollato, S., Tarabotti, E., Rampazzo, G., and Pavoni, B.: Factors determining the formation of secondary inorganic aerosol: a case study in the Po Valley (Italy), Atmos. Chem. Phys., 13, 1927–1939, https://doi.org/10.5194/acp-13-1927-2013, 2013.
Stieger, B., Spindler, G., Fahlbusch, B., Müller, K., Grüner, A., Poulain, L., Thöni, L., Seitler, E., Wallasch, M., and Herrmann, H.: Measurements of PM10 ions and trace gases with the online system MARGA at the research station Melpitz in Germany – A five-year study, J. Atmos. Chem., 75, 33–70, https://doi.org/10.1007/s10874-017-9361-0, 2018.
Stieger, B., Spindler, G., van Pinxteren, D., Grüner, A., Wallasch, M., and Herrmann, H.: Development of an online-coupled MARGA upgrade for the 2 h interval quantification of low-molecular-weight organic acids in the gas and particle phases, Atmos. Meas. Tech., 12, 281–298, https://doi.org/10.5194/amt-12-281-2019, 2019.
Stieger, B., van Pinxteren, D., Tilgner, A., Spindler, G., Poulain, L., Grüner, A., Wallasch, M., and Herrmann, H.: Strong Deviations from Thermodynamically Expected Phase Partitioning of Low-Molecular-Weight Organic Acids during One Year of Rural Measurements, ACS Earth and Space Chemistry, 5, 500–515, https://doi.org/10.1021/acsearthspacechem.0c00297, 2021.
Sutton, M. A., Reis, S., Riddick, S. N., Dragosits, U., Nemitz, E., Theobald, M. R., Tang, Y. S., Braban, C. F., Vieno, M., Dore, A. J., Mitchell, R. F., Wanless, S., Daunt, F., Fowler, D., Blackall, T. D., Milford, C., Flechard, C. R., Loubet, B., Massad, R., Cellier, P., Personne, E., Coheur, P. F., Clarisse, L., Van Damme, M., Ngadi, Y., Clerbaux, C., Skjoth, C. A., Geels, C., Hertel, O., Kruit, R. J. W., Pinder, R. W., Bash, J. O., Walker, J. T., Simpson, D., Horváth, L., Misselbrook, T. H., Bleeker, A., Dentener, F., and de Vries, W.: Towards a climate-dependent paradigm of ammonia emission and deposition, Philos. T. R. Soc. B, 368, 20130166, https://doi.org/10.1098/rstb.2013.0166, 2013.
Tao, Y. and Murphy, J. G.: The sensitivity of PM2.5 acidity to meteorological parameters and chemical composition changes: 10 year records from six Canadian monitoring sites, Atmos. Chem. Phys., 19, 9309–9320, https://doi.org/10.5194/acp-19-9309-2019, 2019.
Tao, Y. and Murphy, J. G.: Simple Framework to Quantify the Contributions from Different Factors Influencing Aerosol pH Based on NHx Phase-Partitioning Equilibrium, Environ. Sci. Technol., 55, 10310–10319, https://doi.org/10.1021/acs.est.1c03103, 2021.
ten Brink, H., Otjes, R., Jongejan, P., and Slanina, S.: An instrument for semi-continuous monitoring of the size-distribution of nitrate, ammonium, sulphate and chloride in aerosol, Atmos. Environ., 41, 2768–2779, https://doi.org/10.1016/j.atmosenv.2006.11.041, 2007.
Tilgner, A., Schaefer, T., Alexander, B., Barth, M., Collett Jr., J. L., Fahey, K. M., Nenes, A., Pye, H. O. T., Herrmann, H., and McNeill, V. F.: Acidity and the multiphase chemistry of atmospheric aqueous particles and clouds, Atmos. Chem. Phys., 21, 13483–13536, https://doi.org/10.5194/acp-21-13483-2021, 2021.
Trebs, I., Metzger, S., Meixner, F. X., Helas, G. N., Hoffer, A., Rudich, Y., Falkovich, A. H., Moura, M. A. L., da Silva, R. S., Artaxo, P., Slanina, J., and Andreae, M. O.: The --Cl−--H2O aerosol system and its gas phase precursors at a pasture site in the Amazon Basin: How relevant are mineral cations and soluble organic acids?, J. Geophys. Res.-Atmos., 110, D07303, https://doi.org/10.1029/2004jd005478, 2005.
Turnock, S. T., Spracklen, D. V., Carslaw, K. S., Mann, G. W., Woodhouse, M. T., Forster, P. M., Haywood, J., Johnson, C. E., Dalvi, M., Bellouin, N., and Sanchez-Lorenzo, A.: Modelled and observed changes in aerosols and surface solar radiation over Europe between 1960 and 2009, Atmos. Chem. Phys., 15, 9477–9500, https://doi.org/10.5194/acp-15-9477-2015, 2015.
Van Damme, M., Clarisse, L., Franco, B., Sutton, M. A., Erisman, J. W., Kruit, R. W., van Zanten, M., Whitburn, S., Hadji-Lazaro, J., Hurtmans, D., Clerbaux, C., and Coheur, P. F.: Global, regional and national trends of atmospheric ammonia derived from a decadal (2008–2018) satellite record, Environ. Res. Lett., 16, 055017, https://doi.org/10.1088/1748-9326/abd5e0, 2021.
van der Graaf, S., Dammers, E., Segers, A., Kranenburg, R., Schaap, M., Shephard, M. W., and Erisman, J. W.: Data assimilation of CrIS NH3 satellite observations for improving spatiotemporal NH3 distributions in LOTOS-EUROS, Atmos. Chem. Phys., 22, 951–972, https://doi.org/10.5194/acp-22-951-2022, 2022.
Vestreng, V., Myhre, G., Fagerli, H., Reis, S., and Tarrasón, L.: Twenty-five years of continuous sulphur dioxide emission reduction in Europe, Atmos. Chem. Phys., 7, 3663–3681, https://doi.org/10.5194/acp-7-3663-2007, 2007.
Vestreng, V., Ntziachristos, L., Semb, A., Reis, S., Isaksen, I. S. A., and Tarrasón, L.: Evolution of NOx emissions in Europe with focus on road transport control measures, Atmos. Chem. Phys., 9, 1503–1520, https://doi.org/10.5194/acp-9-1503-2009, 2009.
Viatte, C., Abeed, R., Yamanouchi, S., Porter, W. C., Safieddine, S., Van Damme, M., Clarisse, L., Herrera, B., Grutter, M., Coheur, P.-F., Strong, K., and Clerbaux, C.: NH3 spatiotemporal variability over Paris, Mexico City, and Toronto, and its link to PM2.5 during pollution events, Atmos. Chem. Phys., 22, 12907–12922, https://doi.org/10.5194/acp-22-12907-2022, 2022.
Wang, G., Tao, Y., Chen, J., Liu, C., Qin, X., Li, H., Yun, L., Zhang, M., Zheng, H., Gui, H., Liu, J., Huo, J., Fu, Q., Deng, C., and Huang, K.: Quantitative Decomposition of Influencing Factors to Aerosol pH Variation over the Coasts of the South China Sea, East China Sea, and Bohai Sea, Environ. Sci. Tech. Let., 9, 815–821, https://doi.org/10.1021/acs.estlett.2c00527, 2022.
Weber, R. J., Guo, H. Y., Russell, A. G., and Nenes, A.: High aerosol acidity despite declining atmospheric sulfate concentrations over the past 15 years, Nat. Geosci., 9, 282–285, https://doi.org/10.1038/ngeo2665, 2016.
Wentworth, G. R., Murphy, J. G., Benedict, K. B., Bangs, E. J., and Collett Jr., J. L.: The role of dew as a night-time reservoir and morning source for atmospheric ammonia, Atmos. Chem. Phys., 16, 7435–7449, https://doi.org/10.5194/acp-16-7435-2016, 2016.
Wexler, A. S. and Clegg, S. L.: Atmospheric aerosol models for systems including the ions H+, , Na+, , , Cl−, Br−, and H2O, J. Geophys. Res.-Atmos., 107, ACH 14-1–ACH 14-14, https://doi.org/10.1029/2001jd000451, 2002.
Womack, C. C., McDuffie, E. E., Edwards, P. M., Bares, R., de Gouw, J. A., Docherty, K. S., Dubé, W. P., Fibiger, D. L., Franchin, A., Gilman, J. B., Goldberger, L., Lee, B. H., Lin, J. C., Long, R., Middlebrook, A. M., Millet, D. B., Moravek, A., Murphy, J. G., Quinn, P. K., Riedel, T. P., Roberts, J. M., Thornton, J. A., Valin, L. C., Veres, P. R., Whitehill, A. R., Wild, R. J., Warneke, C., Yuan, B., Baasandorj, M., and Brown, S. S.: An Odd Oxygen Framework for Wintertime Ammonium Nitrate Aerosol Pollution in Urban Areas: NOx and VOC Control as Mitigation Strategies, Geophys. Res. Lett., 46, 4971–4979, https://doi.org/10.1029/2019GL082028, 2019.
Zakoura, M. and Pandis, S. N.: Improving fine aerosol nitrate predictions using a Plume-in-Grid modeling approach, Atmos. Environ., 215, 116887, https://doi.org/10.1016/j.atmosenv.2019.116887, 2019.
Zhai, S., Jacob, D. J., Wang, X., Liu, Z., Wen, T., Shah, V., Li, K., Moch, J. M., Bates, K. H., Song, S., Shen, L., Zhang, Y., Luo, G., Yu, F., Sun, Y., Wang, L., Qi, M., Tao, J., Gui, K., Xu, H., Zhang, Q., Zhao, T., Wang, Y., Lee, H. C., Choi, H., and Liao, H.: Control of particulate nitrate air pollution in China, Nat. Geosci., 14, 389–395, https://doi.org/10.1038/s41561-021-00726-z, 2021.
Zheng, G. J., Su, H., Wang, S. W., Andreae, M. O., Poschl, U., and Cheng, Y. F.: Multiphase buffer theory explains contrasts in atmospheric aerosol acidity, Science, 369, 1374–1377, https://doi.org/10.1126/science.aba3719, 2020.
Zhou, M., Zheng, G., Wang, H., Qiao, L., Zhu, S., Huang, D., An, J., Lou, S., Tao, S., Wang, Q., Yan, R., Ma, Y., Chen, C., Cheng, Y., Su, H., and Huang, C.: Long-term trends and drivers of aerosol pH in eastern China, Atmos. Chem. Phys., 22, 13833–13844, https://doi.org/10.5194/acp-22-13833-2022, 2022.