the Creative Commons Attribution 4.0 License.
the Creative Commons Attribution 4.0 License.
 | 13 Aug 2025
Climate-driven biogenic emissions alleviate the impact of human-made emission reductions on O3 control in the Pearl River Delta region, southern China
Song Liu
Jiawei Xu
Yanyu Wang
Chun Li
Yuning Xie
Hua Lu
Fumo Yang
Ozone (O3) concentrations in the Pearl River Delta (PRD) during summer are typically low and often overlooked. However, integrated observational data indicate a consistent increase in summer O3 levels over recent decades (+0.96 ppb yr−1), contradicting China's efforts to reduce anthropogenic emissions. Our dynamically calculated natural emissions show that biogenic volatile organic compound (BVOC) emissions in the region significantly increased between 2001 and 2020, primarily due to climate change and alterations in vegetation cover, with climate-driven BVOC emissions accounting for approximately 80 % of the increase. Furthermore, parallel simulations using the Weather Research and Forecasting–Community Multiscale Air Quality (WRF–CMAQ) model indicate that climate-driven BVOC emissions, by enhancing atmospheric oxidative capacity and accelerating O3 formation, have weakened or even offset the benefits of anthropogenic emission reductions, contributing 6.2 ppb to O3 formation and leading to an unexpected rise in O3 levels. This study enhances our understanding of the mechanisms behind natural emissions in urban O3 formation under climate change and provides insights for future O3 pollution control strategies.
- Article
(2311 KB) - Full-text XML
-
Supplement
(768 KB) - BibTeX
- EndNote


-
Summer O3 concentrations in the Pearl River Delta region have increased over the past 2 decades.
-
Climate-driven biogenic volatile organic compound (BVOC) emissions account for ∼ 80 % of the total increase in BVOC emissions from 2001 to 2020.
-
The rising BVOC emissions serve as a key factor in the unexpected rise in O3 levels.
Tropospheric ozone (O3) is formed through photochemical reactions involving its precursors, volatile organic compounds (VOCs), carbon monoxide (CO), and nitrogen oxides (NOx), under ultraviolet light. High concentrations of tropospheric O3 not only pose a threat to human health but also harm agricultural crops and other aspects of the ecosystem (Lippmann, 1989; West et al., 2006; Xiao et al., 2021; Feng et al., 2022). Despite the strict emission reduction measures implemented since the so-called “National Ten Measures” (State Council of China, 2013) and the “Blue Sky Protection Campaign” (State Council of China, 2018) in China, O3 pollution has been rapidly increasing and spreading across larger areas, becoming the primary pollutant in many regions of China (Wang et al., 2017; Lu et al., 2018; Wang et al., 2019; Lyu et al., 2023).
Current research on O3 pollution in China primarily focuses on anthropogenic emissions, with limited attention given to natural sources, such as biogenic volatile organic compounds (BVOCs). BVOCs are highly reactive and, once released, rapidly interact with atmospheric oxidants such as hydroxyl radicals (OH), leading to increased concentrations of O3 and other oxidative products (Jenkin and Clemitshaw, 2000; Fry et al., 2014; Cao et al., 2022; Gao et al., 2022; Wang et al., 2022b). In urban environments with high nitrogen oxide levels, O3 formation is particularly sensitive to VOCs, meaning that even low concentrations of BVOCs can significantly impact O3 levels. For instance, BVOC emissions from urban greening spaces, in combination with anthropogenic emissions, can contribute to an additional increase of approximately 5 ppb in O3 concentrations in Beijing (Ma et al., 2019). Likewise, the intermediate oxidation products of BVOCs, such as methyl vinyl ketone (MVK) and methacrolein (MAC) from South China's forests, can interact with anthropogenic emissions from the Yangtze River Delta (YRD) and Pearl River Delta (PRD) urban clusters through regional transport, leading to elevated O3 levels in downstream cities (Wang et al., 2022b).
It is important to note that BVOC emissions, particularly isoprene emissions, are closely related to meteorological conditions. Typically, isoprene emissions increase with rising temperatures (or solar radiation); however, when temperatures become too high, vegetation growth is inhibited, and isoprene emissions may decrease due to stomata closing (Seco et al., 2022). Recent research has found that under mild to moderate heat stress, reduced stomatal conductance in vegetation leads to increased leaf temperatures, which can indirectly enhance isoprene emissions from plants (Wang et al., 2022a). Numerous studies have found that synoptic weather systems with high temperatures significantly exacerbate BVOC emissions from vegetation. For instance, several studies have reported that the rare heatwave during the summer of 2022 exacerbated O3 pollution by intensifying BVOC emissions in the YRD, PRD, and Sichuan Basin regions (Li et al., 2024; Wang et al., 2024b; Wang et al., 2024a).
The PRD is a typical developed urban cluster located in southern China. This region is characterized by distinct geographical features: urban areas are characterized by high levels of anthropogenic emissions, while the surrounding areas are densely vegetated. Due to climate change and ongoing greening efforts, vegetation in this region has significantly increased, particularly the evergreen broadleaf forests, which are known for their high BVOC emissions (Guenther et al., 2006; Guenther et al., 2012; Wang et al., 2023a). Currently, air quality issues in the PRD have shifted from PM2.5-dominated haze pollution to O3-dominated photochemical pollution. A substantial amount of research has been conducted on the characteristics of O3 pollution. For example, Yin et al. (2019) found that summer O3 concentrations in the region are relatively low due to monsoon influence, with higher values observed in autumn. Jin and Holloway (2015) discovered seasonal variations in the sensitivity of O3 to its precursors, indicating that the cold season is VOC-limited, while summer often exhibits a NOx-limited or synergistic control regime. However, past studies have primarily focused on the impact of anthropogenic emissions, with limited attention given to the effects of natural sources. The impact of increased natural emissions from vegetation and climate warming on local O3 levels remains unclear.
In this study, we combined comprehensive observations to analyze the summer O3 and vegetation trends in the PRD region. Using the dynamic Model of Emissions of Gases and Aerosols from Nature (MEGAN) for biogenic emissions, we quantified the changes in BVOC emissions caused by vegetation and climate change, and the meteorological factors driving these BVOC changes were also identified. Finally, we assessed the impact of BVOC variations and anthropogenic emission reductions on O3 levels. This study aims to provide scientific insights into the mechanisms of O3 pollution and emphasize the importance of control strategies that account for the synergistic effects of both anthropogenic and natural emissions in the context of climate warming.
2.1 Data
We integrated surface O3 observations with O3 sounding data to investigate the spatiotemporal variations of O3 in the Pearl River Delta (PRD) region. The surface O3 data were sourced from the monitoring network established by China's Ministry of Ecology and Environment (MEE), comprising 89 operational stations across the PRD (Fig. 1). These networks provide in situ observations of ambient hourly O3, CO, SO2, NO2, PM2.5, and PM10 concentrations after 2013. In addition, complementary O3 sounding data were sampled at King's Park, Hong Kong (114.17° N, 22.31° E), where operational O3 sounding has been conducted since 1993. Soundings are performed weekly at 14:00 LT using balloons, providing vertical profiles with a resolution of approximately 10 m, reaching altitudes of up to ∼ 30 km. In this study, we collected O3 soundings from the surface up to 900 hPa (within the boundary layer) to represent the background O3 levels in the PRD region.
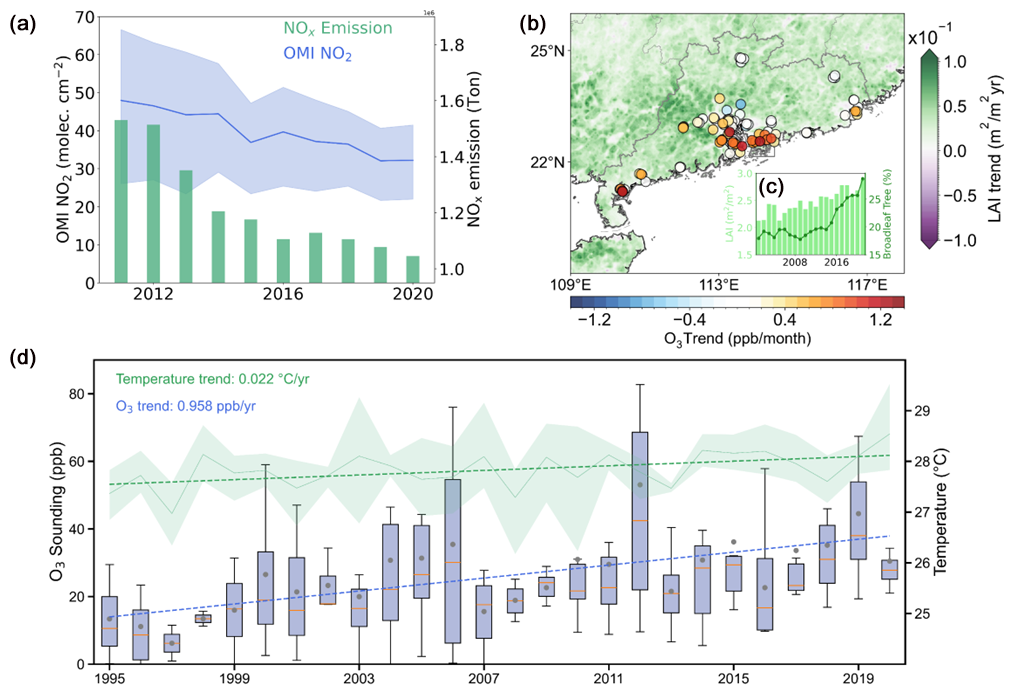
Figure 1(a) Changes in tropospheric NO2 column concentrations and anthropogenic NOx emissions in the PRD from 2011 to 2020. (b) PRD map showing surface-observed summer O3 trends (2013–2020) and leaf area index trends (LAI, 2001–2020). (c) Changes in LAI and proportion of broadleaf trees in the PRD between 2001 and 2020. (d) Variation of summer O3 soundings and temperature, with the dashed lines showing the linear plot.
In order to understand the nitrogen oxides (NOx), a precursor of O3, satellite observations and emission inventory data were analyzed. Monthly tropospheric NOx column data (Level 3) were obtained from the Ozone Monitoring Instrument (OMI) (data accessed via: https://avdc.gsfc.nasa.gov/pub/data/satellite/Aura/OMI, last access: 20 August 2024). Anthropogenic NOx emissions were derived from the Multi-resolution Emission Inventory for China (MEIC), developed by Tsinghua University (http://meicmodel.org.cn/, last access: 20 August 2024).
2.2 MEGAN
Biogenic emissions were computed offline using the Model of Emissions of Gases and Aerosols from Nature (MEGAN) version 2.1, developed by Guenther et al. (2012). MEGAN is capable of estimating the emissions of over a hundred biogenic volatile organic compounds (BVOCs), with a horizontal resolution that can range from ∼ 500 m to hundreds of kilometers. The theoretical calculations are based on the following concept:
where Fi, εi,j, and χj are emission amounts, the standard emission factor, and the fractional coverage of each plant functional type (PFT) j of chemical species i. γi is the emission activity factor, which is calculated based on the canopy environment coefficient (CCE), leaf area index (LAI), light (γL), temperature (γT), leaf age (γLAI), soil moisture (γSM), and CO2 uptake (γCI).
In China, most researchers using MEGAN rely on the model's default surface data. However, these default data are based on conditions from the year 2000, with no annual variation. Considering the significant changes in land cover due to China's reforestation policies and climate change, the outdated land surface data fail to capture current conditions accurately. Therefore, this study employs satellite-derived, high-resolution land data with monthly dynamic updates to achieve more representative and accurate estimates of BVOC emissions. In detail, the LAI data are sourced from the MODIS MCD15A2H product covering the period from 2001 to 2020, with a temporal resolution of 8 d. The land cover type data are derived from the MODIS MCD12Q1 product, which uses an LAI-based classification scheme and includes eight vegetation types. These were further mapped to the 16 plant functional types (PFTs) used in MEGANv2.1, considering the methodology outlined by Bonan et al. (2002). The detailed mapping scheme is provided in the Supplement (Table S1). Meteorological conditions were provided by Weather Research and Forecasting (WRF) simulations.
Using this method, we were able to separately quantify the impact of vegetation emissions driven by changes in vegetation distribution and those driven by climate change. For instance, by fixing the meteorological conditions while allowing the vegetation data to change annually, we could isolate the contribution of vegetation distribution variations to emissions (land impact). Similarly, by holding the vegetation data constant and allowing meteorological conditions to vary year by year, the emissions attributable to climate change could be quantified (climate impact).
2.3 Random forest (RF) model
To investigate the relationship between BVOC emissions and meteorological factors, we employed an RF machine learning model. Since BVOC emissions were calculated based on the MEGAN-calculation framework, emissions are driven by inputs such as temperature, humidity, solar radiation, and other factors. This context makes the RF model particularly suitable, as it is adept at handling non-linear relationships and interactions among variables, making it effective for complex environmental data sets. We trained the RF model using the WRF-simulated meteorological variables alongside corresponding BVOC emissions. To interpret the results and gain insights into the contribution of each meteorological factor to BVOC emissions, we utilized SHapley Additive exPlanations (SHAP) values. SHAP values provide a robust framework for understanding the impact of individual features on model predictions by attributing the contribution of each factor to the overall output. This approach not only enhances the interpretability of the RF model but also facilitates a deeper understanding of how different meteorological conditions influence BVOC emissions, thereby informing future research and environmental management strategies.
We employed the Weather Research and Forecasting–Community Multiscale Air Quality (WRF–CMAQ) chemical transport model to assess the effects of climate and land-change-induced BVOC emissions, alongside anthropogenic emission reductions, on O3 concentrations. The WRF model (version 3.9.1) is a mesoscale numerical weather prediction system designed for both operational forecasting and atmospheric research. Atmospheric chemistry was simulated using CMAQ (version 5.3), with the Carbon Bond version 06 (CB06) and Aerosol Module version 6 (AERO6) mechanisms. In this study, we utilized a single domain with a horizontal resolution of 25 km, covering the entirety of China and its surrounding regions, centered at 30° N, 106.8° E. The model includes 31 vertical layers with a top pressure boundary of 100 hPa. The WRF model was driven by ERA5 reanalysis data, providing meteorological inputs for the simulation. The chemical boundary conditions for the CMAQ domain were sourced from the Community Earth System Model (CESM).
The key WRF–CMAQ configurations include the Rapid Radiative Transfer Model (RRTM) for longwave and shortwave radiation, the Noah Land Surface Model for land–atmosphere interactions, the Kain–Fritsch scheme for cumulus parameterization, the Lin microphysics scheme, and the YSU boundary layer scheme. Anthropogenic emissions for China were obtained from the MEIC, and biogenic emissions were calculated by an improved version of MEGAN (described in Sect. 2.2). The performance of the model was validated by comparing it with observations. Generally, the statistical comparisons showed that the model-simulated results matched those observed well, indicating reliable model performance, as summarized in Table S2.
Using the WRF–CMAQ model, we conducted parallel comparison experiments to address the importance of BVOC emissions: for example, scenarios that consider only anthropogenic volatile organic compounds (AVOCs) (AVOC_Only) versus those that include both anthropogenic and vegetation emissions (Add_BVOC). To explore the complex non-linear relationships between O3 and its precursors, we employed the high-order decoupled direct method (HDDM). In the HDDM, sensitivity coefficients (Sj) represent the response of a chemical concentration to perturbations in a sensitivity parameter, such as emissions, initial conditions, boundary conditions, or reaction rates (Simon et al., 2013; Itahashi et al., 2015). The semi-normalized first- and second-order sensitivity coefficients, and , are defined as follows:
where represents the first-order sensitivity to changes in parameter j. refers to the second-order sensitivity to simultaneous changes in parameters j and k. When j=k, represents the sensitivity to an individual parameter, and when j≠k, it refers to a cross-sensitivity coefficient. The equation for approximating O3 concentrations under the perturbations of parameters j and k through a Taylor-series expansion of the sensitivity coefficients is as follows:
where C0 refers to the chemical concentration in the base scenario.
In addition, the O3 formation budget, based on the perspectives of anthropogenic emission reductions and changes in vegetation emissions, was quantified over the last 2 decades (2001–2020). This algorithm maximally accounts for the influences of anthropogenic and biogenic sources to highlight their respective contributions on a climatic scale. For instance, anthropogenic NOx emissions peaked in 2012 and have continuously declined over the past decade. Therefore, we assessed the impact of human emission reductions by comparing O3 simulations driven by emissions from 2012 and 2020. Similarly, considering the continuous increase in surface vegetation data, we utilized surface vegetation data from 2001 and 2020 to drive the vegetation emissions, aiming to maximize the differences in O3 simulations resulting from changes in vegetation. To account for the impact of climate-change-driven vegetation emissions, we calculated BVOC emissions using both current and historical meteorological data. We then examined the differences in O3 simulations driven by current and past meteorological data. The impact of climate-driven meteorology on chemical O3 formation was also assessed using similar methods (see details in Table S3). Although this algorithm does not operate within a unified time frame, it emphasizes the contributions of both anthropogenic and vegetation emissions, aiding in the assessment of their combined effects.
4.1 Rising summer O3 concentrations and vegetation in the PRD
Since China implemented the National Ten Measures in 2012, aimed at controlling PM2.5 pollution, NOx emissions have shown significant improvement in the PRD, as evidenced by the substantial annual decline in NOx column density and emissions from 2011 to 2020 (Fig. 1a). However, surface monitoring of summer O3 concentrations in the PRD region has exhibited an upward trend with an increasing rate of 0.51 ppb/month (Fig. 1b). We also examined background O3 sounding data within the boundary layer (between the surface and 900 hPa); the results revealed an increasing rate of 0.96 ppb yr−1 between 1995 and 2020, consistent with the surface network observation (Fig. 1c). It has been widely acknowledged that summer O3 levels in the PRD are generally low due to the monsoon-prevailing southerly winds, which bring relatively clean air from the South China Sea. However, the rising O3 concentrations in recent summers suggest that photochemical O3 pollution is becoming increasingly severe in the PRD.
Driven by the government's reforestation policies and the impact of climate change, we also observed an increasing trend in vegetation coverage in the PRD, as indicated by the broad positive LAI trend over the last 2 decades (Fig. 1b). Additionally, through the analysis of changes in vegetation types, it was found that there was a significant increase in the proportion of evergreen broadleaf forests, a tree type known for high BVOC emissions, rising from 17.9 % to 28.6 % between 2010 and 2020 in the PRD (Fig. 1d). The increase in vegetation coverage implies a potential rise in BVOC emissions, which appears to be a possible contributor to the observed O3 increment. Additionally, against the backdrop of global climate warming, the PRD has experienced a temperature increase of +0.02 °C yr−1 over the past decade (Fig. 1c), which would further enhance BVOC emissions due to elevated temperatures.
4.2 Significant BVOC emissions increment due to climate change
As detailed in the “Materials and methods” section, we updated MEGAN by incorporating dynamically varying satellite-derived vegetation data. To assess the model's reliability, we calculated the BVOC emissions for the entire year of 2020 in China, utilizing 2020-based meteorology and land data, and compared the findings with results from previously published studies (Table 1). The BVOC inventory established in this study indicates that total isoprene emissions in China reached 17.5 Tg, falling within mid-range estimates from previous studies (Table 1), suggesting overall consistency with earlier findings. Notably, isoprene accounts for 53.9 % of all BVOC emissions, a proportion that also aligns well with earlier findings. This not only supports the validity of our calculations but also underscores the significance of isoprene across all BVOC species.
Table 1Comparisons of isoprene emissions and their proportion of total BVOCs.
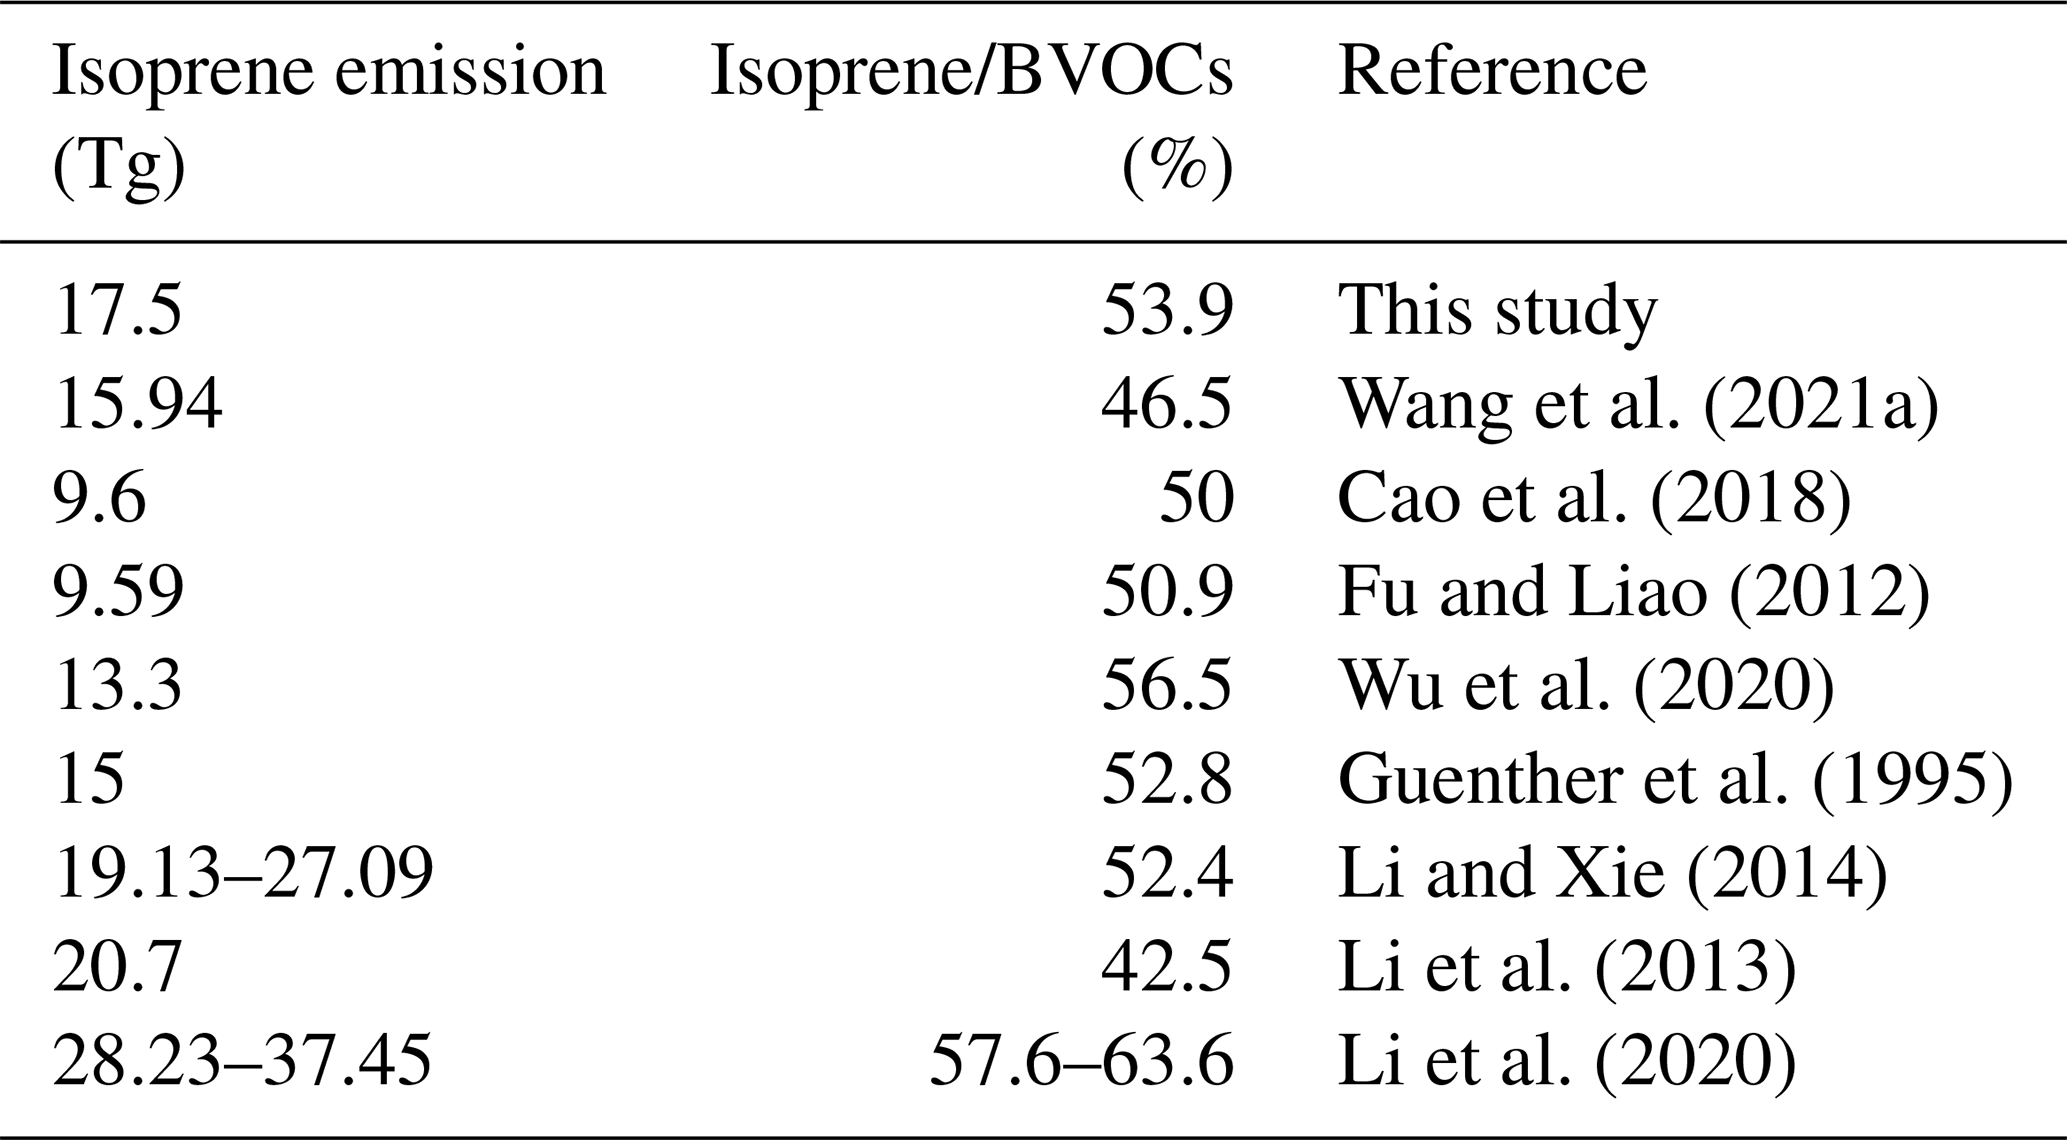
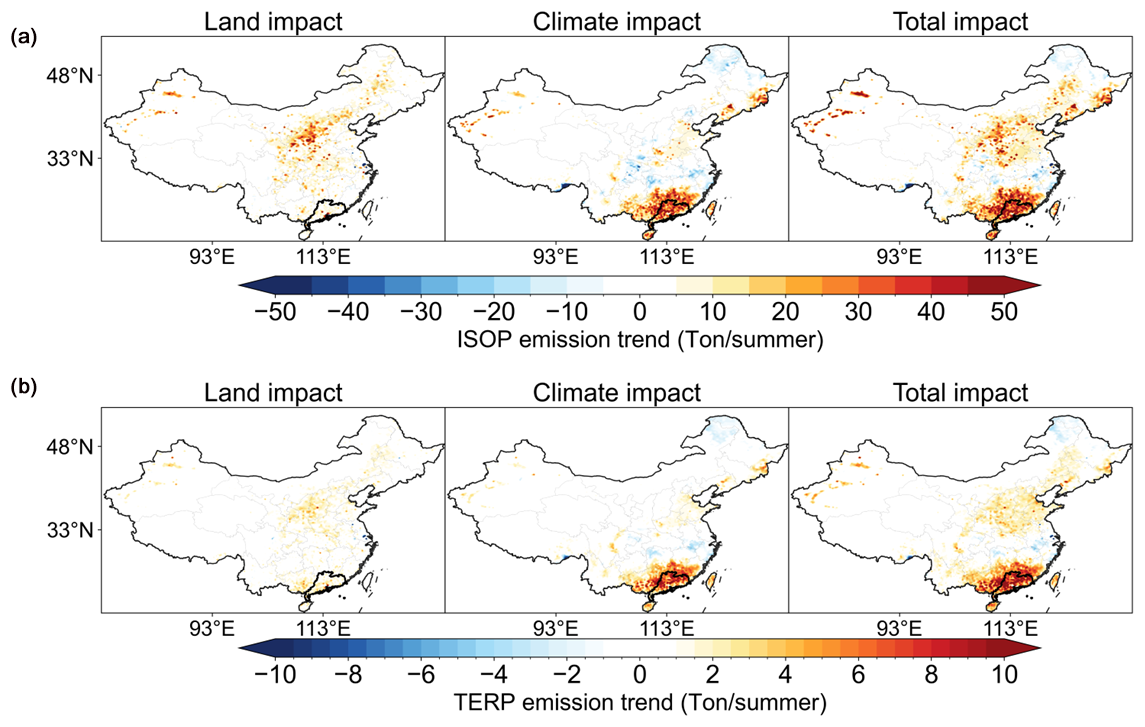
Figure 2Summer isoprene (a) and terpene (b) emission trends in mainland China between 2001 and 2020. The land impact refers to BVOC emissions (ISOP for isoprene, TERP for terpene) from vegetation cover change, while the climate impact refers to BVOC emissions due to climate change. The black line in the map highlights the administrative boundary of the PRD region.
By using different combinations of meteorological conditions and land cover data (including LAI and PFT), we employed MEGAN to quantify the impact of land use and climate changes on the BVOC emissions trend from 2001 to 2020, respectively. The two major components of BVOCs, isoprene and terpenes, were both quantified in response to changes in vegetation cover and climate (Fig. 2). Our findings indicate a significant upward trend in both isoprene and terpene emissions in southern China (including the PRD) and northern China, which stand in stark spatial contrast to the emissions patterns observed in western and central China. By attributing the emission changes to vegetation and climate shifts, we found that, unlike northern regions of China, such as the Loess Plateau, where increased BVOC emissions are primarily attributed to afforestation efforts (Zhang et al., 2016), the rise in BVOC emissions in southern China is mainly influenced by climate change. For example, the isoprene emission trend was 30.0 t per summer over 2001–2020 in the PRD, making up ∼ 80 % of the total isoprene variations. The significant increase attributed to climate change suggests that BVOC emissions in this area are highly sensitive to climatic variations.
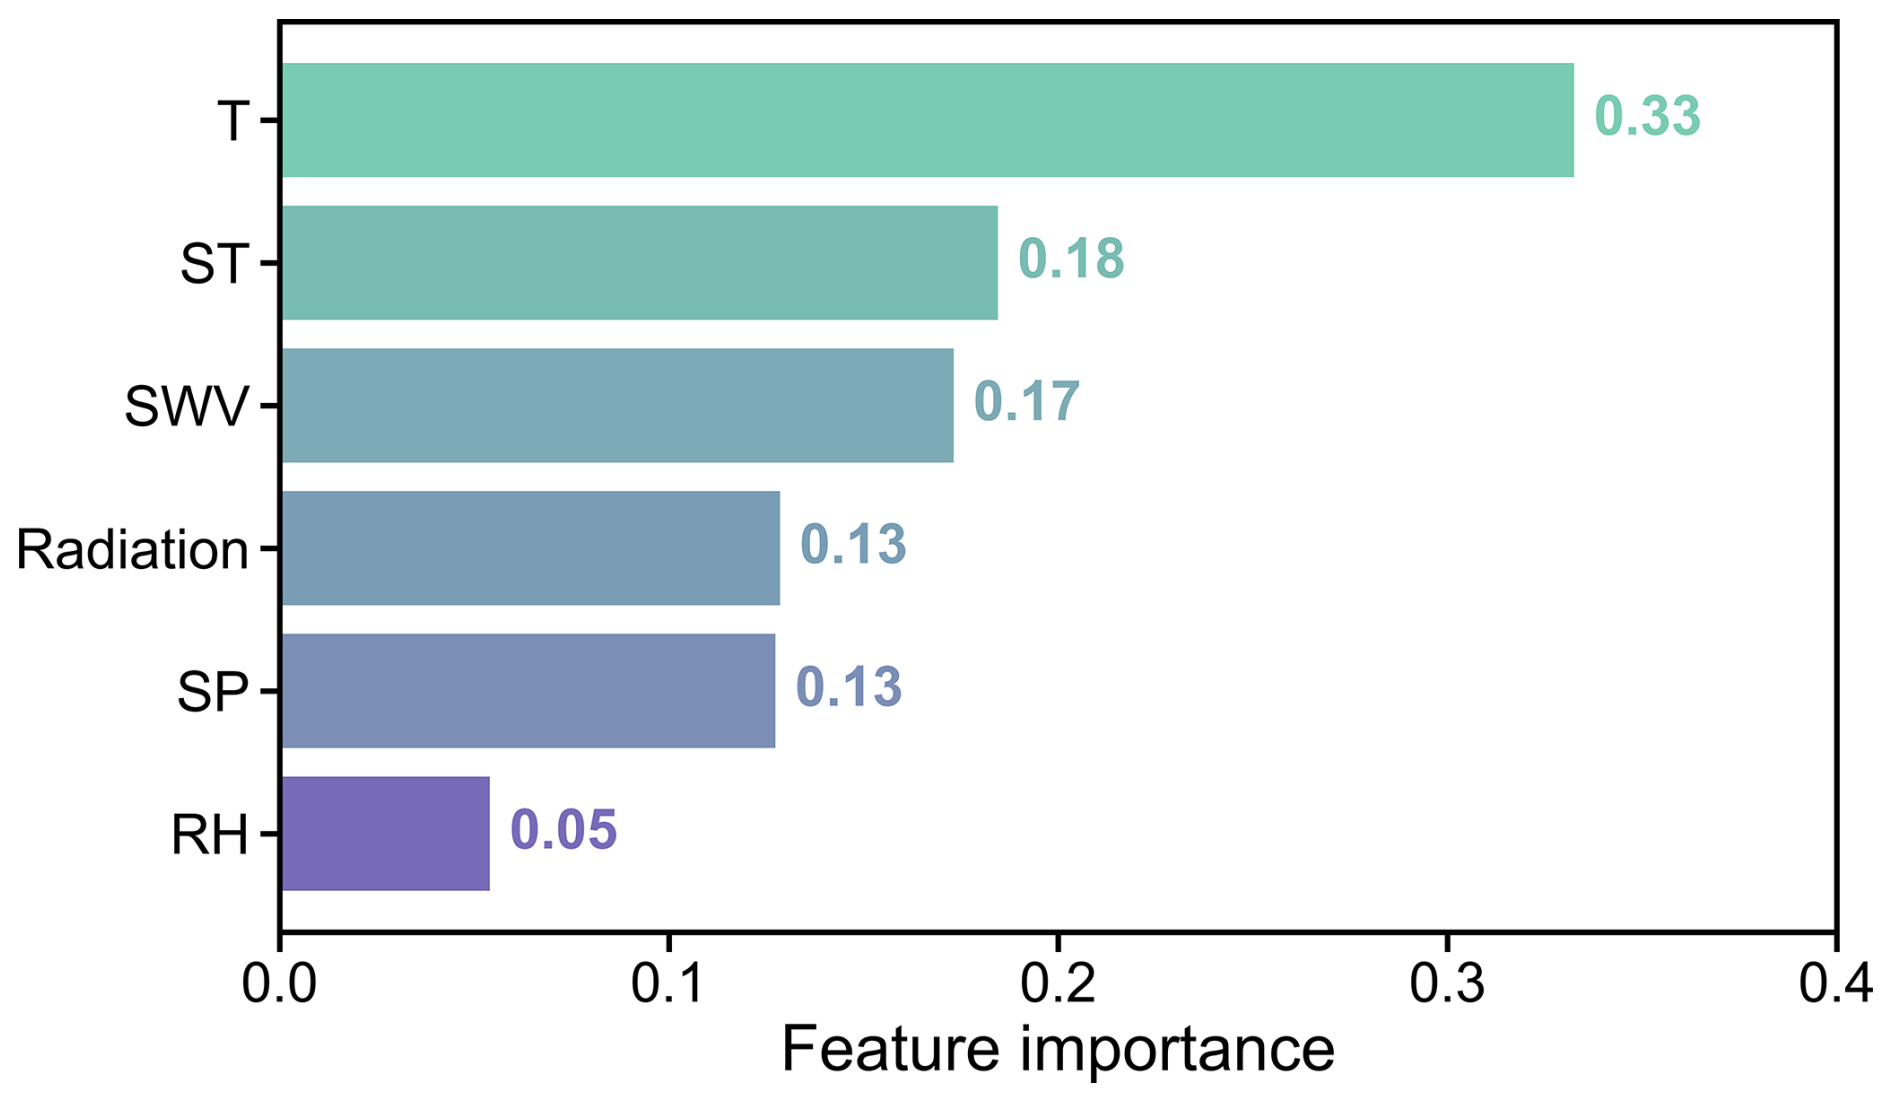
The climate impact could be simply attributed to the combined effects of multiple meteorological parameters, such as ambient temperature, soil temperature, relative humidity, and other factors. It is crucial to identify the dominant meteorological factors in the context of climate warming. To this end, we established a diagnostic method that coupled a numerical model with machine learning. Specifically, we utilized meteorological parameters simulated by the WRF model to drive an RF model for predicting BVOC emissions. To ensure the robustness of the results, we performed a 10-fold cross-validation, achieving an R2 (coefficient of determination) of 0.78 and an MAE (mean absolute error) of 0.73 (Supplement Fig. S1). These metrics indicate that the machine learning model effectively reproduces BVOC emissions. To assess the significance of each meteorological parameter, we employed the SHAP method (see details in the “Materials and methods” section). The results indicate that ambient temperature, soil temperature, soil water vapor, radiation, surface pressure, and relative humidity are the dominant meteorological parameters, with temperature being the most influential (Fig. 3). This finding is further supported by the observed upward trend in these parameters over the past 20 years (Fig. S2). Our investigation reveals that BVOC emissions in the PRD are highly sensitive to climate, and the rising temperature has become the dominant factor driving the increase in BVOC emissions. Noting that the PRD is a developed city cluster with high anthropogenic emissions, the annual rise in BVOC emissions is likely to exacerbate the interactions between natural and human-made emissions. Therefore, the impact of BVOC emissions warrants further exploration in addressing the issue of increasing summer O3 levels in the region.
4.3 Climate-induced BVOCs alleviate O3 control
To quantify the influence of BVOCs on O3 concentrations, the CMAQ–HDDM model was employed to assess the sensitivity of O3 to its precursors during the summer of 2020 in southern China. The response of atmospheric oxidation capacity to BVOC emissions was evaluated under two scenarios: one considering only the impact of anthropogenic VOCs (AVOC_ONLY scenario) and the other accounting for both anthropogenic and biogenic emissions (ADD_BVOC scenario). It should be noted that the AVOC_ONLY scenario is an unrealistic scenario, and removing BVOC emissions from the real world may result in uncertainties due to the non-linear relationship between O3 and its precursors. However, studying and comparing the parallel numerical experiments (AVOC_ONLY and ADD_BVOC scenarios) could greatly help us understand the mechanisms and significance of BVOC emissions for O3 formation. In each scenario, we primarily focused on the responses of O3 to NOx emission reductions, aligning with China's emission control strategy that predominantly targets NOx emissions.
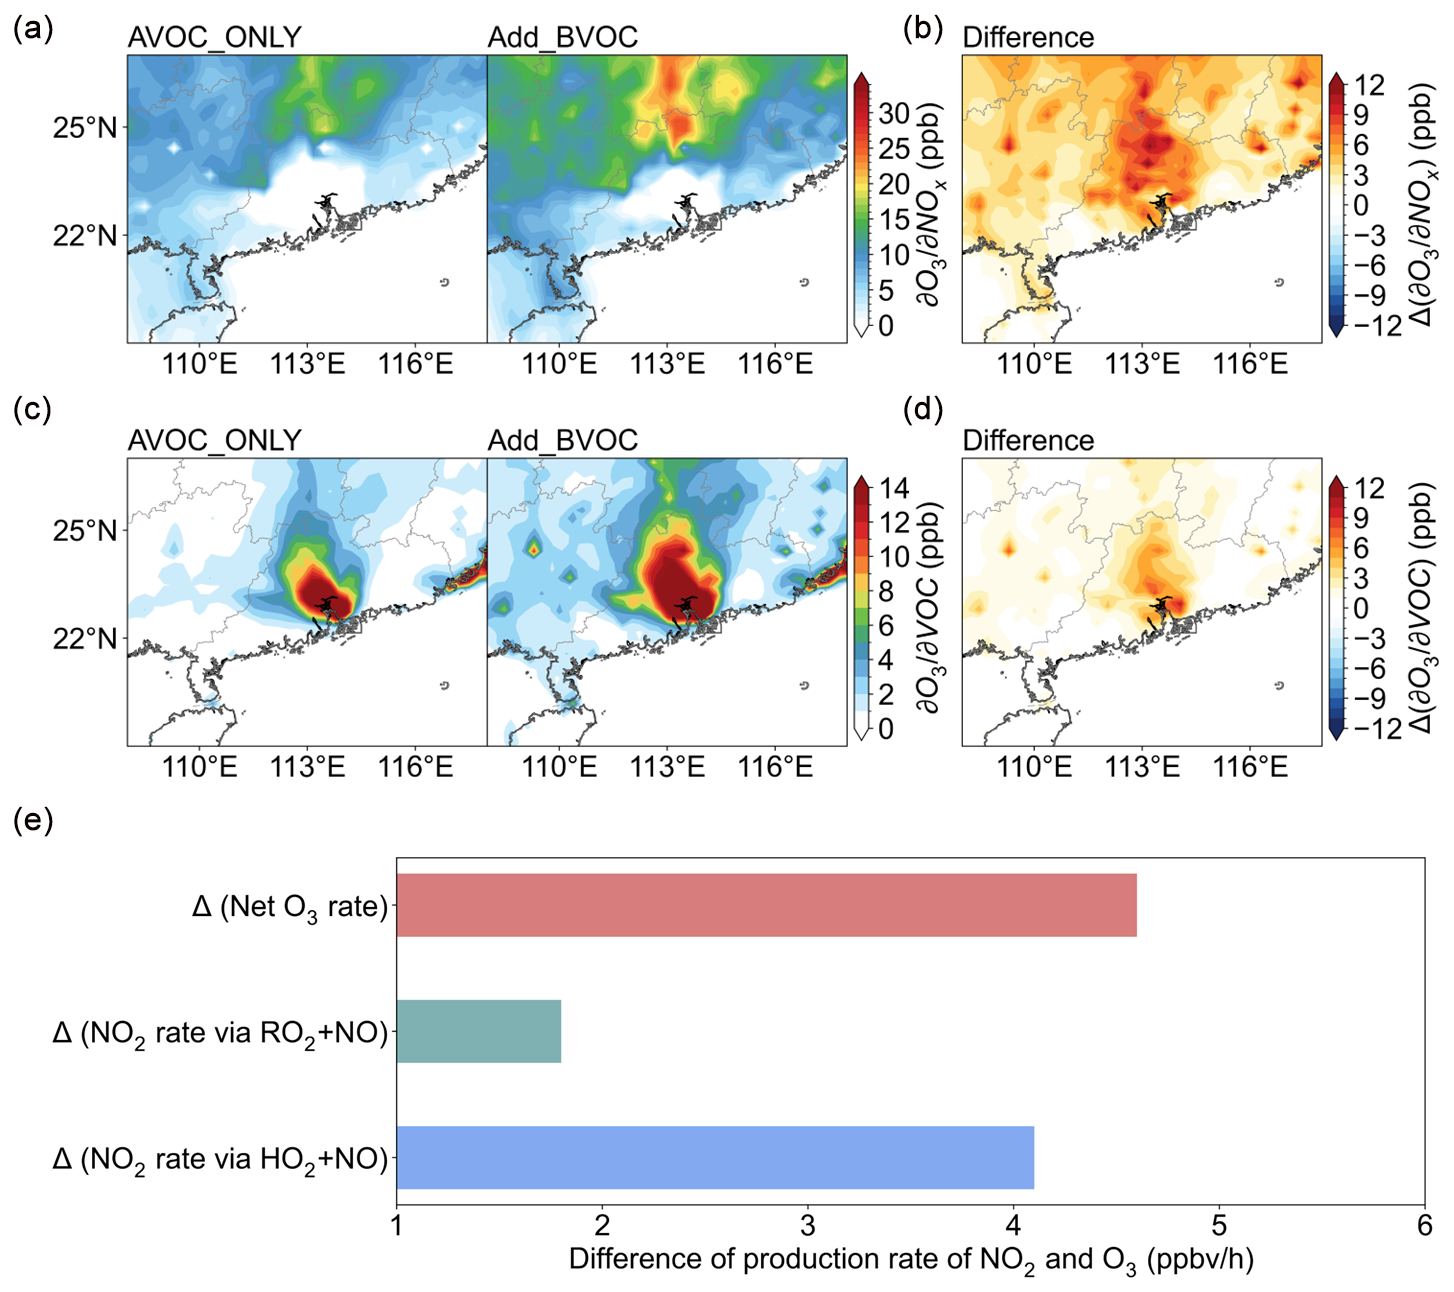
Figure 4(a) Spatial distribution of O3 sensitivity coefficients for NOx emissions under the AVOC_ONLY and Add_BVOC scenario. (b) Difference in O3 sensitivity coefficients for NOx emissions between Add_BVOC and AVOC_ONLY scenarios. (c) Same as panel (a) but for sensitivity coefficients of VOC emissions. (d) Same as panel (b) but for O3 sensitivity coefficients for VOC emissions. (e) Difference in the production rate of NO2 (via chemical pathway of RO2 + NO and HO2 + NO) and net production rate of O3 at 14:00 LT between Add_BVOC and AVOC_ONLY scenarios.
Taking the 2020-based simulation as an example, we analyzed the spatial distribution of the first-order sensitivity coefficient of O3 to its precursors (Fig. 4). Under the AVOC_ONLY scenario, the central region of the PRD exhibited significant sensitivity to volatile organic compound (VOC) emissions (i.e., high sensitivity coefficients greater than 15 ppb), while the surrounding areas were more NOx-sensitive (Fig. 4a and c). When BVOC emissions were included, the VOC-sensitive region expanded beyond the core of the PRD to its surrounding areas, with an increase in the sensitivity coefficient value. This implies that there are more favorable conditions for O3 production. Additionally, in remote areas that belong to NOx-sensitive regions, for instance, the northern PRD, a notable increase in the sensitivity coefficient value was found, meaning the sensitivity of O3 to NOx emissions also became more pronounced (Fig. 4b and d). This suggests that even in NOx-limited regions, BVOCs could significantly enhance atmospheric reactivity, facilitating easier O3 formation. The underlying mechanism by which BVOC emissions influence ozone formation can be attributed to their impact on NO2 production levels (Fig. 4e). By comparing the reaction rates of RO2 + NO and HO2 + NO, both key pathways determining O3 formation, we found that the addition of BVOCs increased these reaction rates by 4.1 and 1.8 ppb h−1, respectively. In other words, the presence of BVOCs enhanced atmospheric oxidizing capacity, leading to an additional O3 production rate of approximately 4.7 ppb h−1. Further, we simulated O3 responses to NOx emission perturbations under both scenarios (Fig. S3). The results showed that O3 levels initially rose and then fell as NOx reductions increased, with a turning point around a 10 % emission reduction. Compared to our previous study conducted in winter, which identified the O3 formation regime as transition-limited, with a turning point at approximately 35 % NOx emission reduction (Wang et al., 2021b), it is believed that O3 formation sensitivity in the PRD during summer is more closely aligned with a NOx-limited regime. However, after considering the influence of BVOC emissions, the benefits of NOx reduction were offset by the influence of BVOC emissions, which contributed an additional ∼ 5 ppb of O3 formation.
Next, leveraging scenario simulations with the CMAQ model, we quantified the O3 formation budget from the perspectives of anthropogenic emission reductions and changes in vegetation emissions over the past 2 decades (Fig. 5). Despite the implementation of China's “Ten Measures” (State Council of China, 2013) and the “Blue Sky Protection Campaign” (State Council of China, 2018) pollution control strategies, observational data have shown a rise in O3 levels, which contradicts expectations and has puzzled policymakers in formulating effective O3 control strategies. These contrasting effects largely stem from shifts in O3–NOx–VOC sensitivity. Past studies have suggested that O3 levels would temporarily increase in the short term following NOx emission controls (Wang et al., 2019; Huang et al., 2021). However, after long-term (nearly a decade) emission reductions, our findings reveal that, when considering only anthropogenic emissions (AVOC_ONLY scenario), emission reductions could lead to varying degrees of O3 decline in southern China. For example, the average O3 concentrations in Guangzhou could potentially decrease by 9.8 ppb due to human-made emission control (Fig. 5a). This result is consistent with a recent study by Wang et al. (2023b). However, the benefit has been overshadowed by the increase in BVOC emissions (ADD_BVOC scenario). Our research indicates that the key driver of rising summer O3 levels was the significant impact of BVOC emissions. Specifically, BVOC emissions driven by climate warming significantly impacted O3 concentrations, showing a pronounced positive effect in the core of the PRD urban areas (Fig. 5b). In Guangzhou, climate-driven BVOC emissions have contributed to an increase in O3 levels of as much as 6.2 ppb. In comparison, BVOC emissions resulting from vegetation distribution variations (vegetation-change BVOCs) contributed less to O3 formation but still had a positive impact, with a contribution ranging from 0.8 to 1.5 ppb. It is noteworthy that the contribution of climate impact on O3 chemistry (climate-driven chemistry) varied significantly, with values ranging from −19.3 to 16.2 ppb. This substantial difference might be attributed to perturbations caused by extreme weather events. For instance, extreme stable weather conditions, such as heatwaves, are conducive to O3 pollution, while intense heavy rainfall facilitates O3 removal. By analyzing historical monthly average temperature and precipitation in the PRD from 2000 to 2020, we found that both summer temperature and precipitation exceed the climatic monthly average, ranking the highest among the four seasons (Fig. S4). This result aligns with our description. On one hand, hot days (i.e., the periphery of typhoons and heatwaves) enhance photochemical O3 formation, while on the other, extreme precipitation (i.e., squall lines) suppresses O3 concentration. As an overall effect, BVOC emissions have undermined or offset the progress achieved through anthropogenic emission controls, leading to only marginal reductions or, in some cases, even increases in O3 concentrations (Fig. 5e).
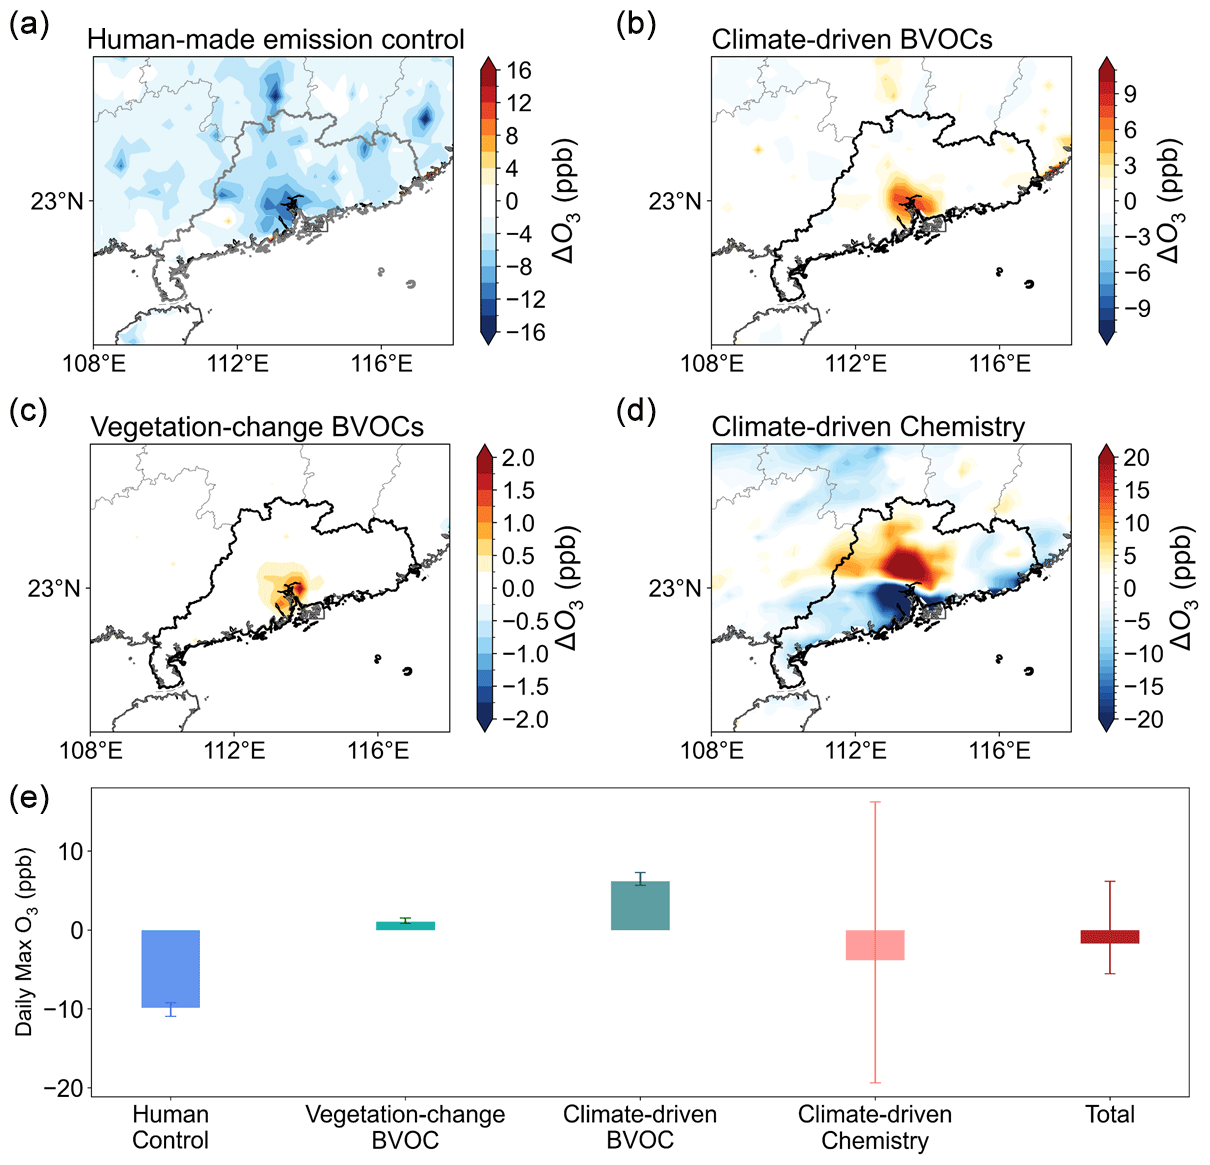
Figure 5Impact of O3 formation based on a maximal account for the influence of (a) human-made emission control, (b) climate-driven BVOC emissions, (c) vegetation-change BVOCs, and (d) climate-driven meteorology on chemistry in the PRD region. (e) Daily max O3 budget in Guangzhou.
Due to the influence of the summer monsoon, O3 concentrations in the PRD during summer are typically low and often overlooked. However, observational data indicate a rising trend in summer O3 levels over the past 2 decades, with an increase of approximately 1 ppb per summer. Based on the current understanding of O3 formation sensitivity, it is widely acknowledged that the O3 formation regime in the PRD tends to exhibit either a transitional or NOx-limited regime during summer (Jin and Holloway, 2015; Wang et al., 2019). China's emphasis on reducing nitrogen oxide emissions over the past decade was expected to have contributed to lower summer O3 levels. In response to the unexpected rise in summer O3, our dynamically calculated natural emissions reveal a significant increase in BVOC emissions in the region between 2001 and 2020. This increase was primarily driven by climate change and changes in vegetation cover, with climate-driven BVOC emissions accounting for approximately 80 % of the rise. The concurrent increase in atmospheric and soil temperatures emerged as the key factors driving this increase in BVOC emissions. Based on parallel numerical simulations using the WRF–CMAQ model, we found that vegetation emissions driven by climate warming have mitigated and, in some cases, even offset the effects of anthropogenic emission reductions, serving as a key factor in the unexpected rise in O3 levels in the PRD (Fig. 6). It should be noted that recent studies have demonstrated that certain anthropogenic VOCs, like emissions from gasoline use and volatile chemical products, show temperature-dependent increases in their emission rates (Pfannerstill et al., 2024; Wu et al., 2024). These enhancements are particularly pronounced during high-temperature and heatwave conditions and could also contribute to elevated O3 levels (Qin et al., 2025). Therefore, the observed fluctuations in summertime O3 concentrations may also result from sources other than BVOCs. Though the present study did not consider these temperature-responsive anthropogenic emission mechanisms, the conclusion that temperature-induced increases in biogenic emissions amplify O3 pollution remains valid, as it is supported by rigorous computational analysis conducted in this study.
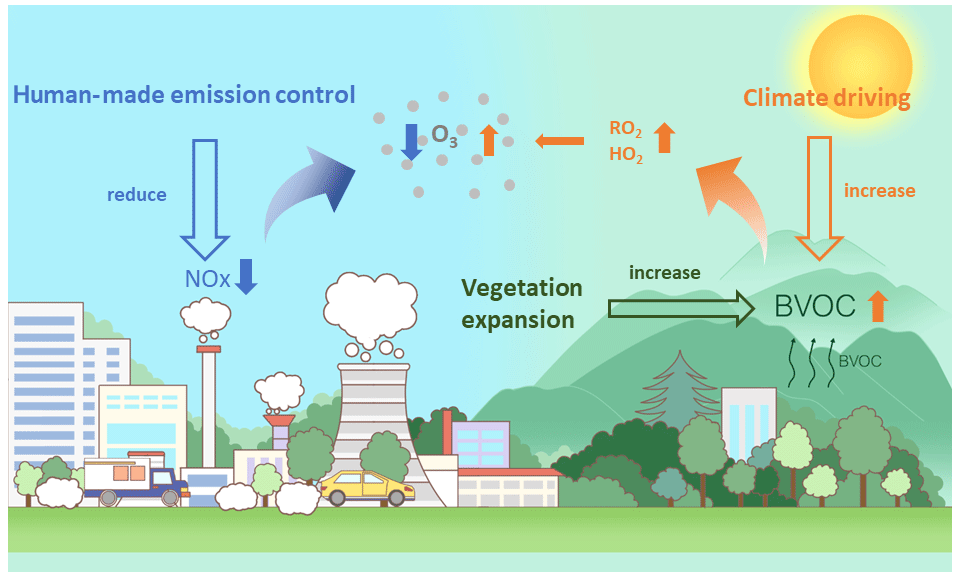
Figure 6The conceptual scheme illustrates how climate-driven BVOC emissions alleviate or offset human-made emission control measures against O3.
China has proposed its ambitious strategies for carbon peaking and carbon neutrality and will continue to enhance its efforts to reduce anthropogenic emissions. In the context of global warming, rising temperatures and carbon-neutrality-induced greening are likely to enhance biogenic emissions, underscoring the increasing importance of natural sources in urban areas. Our findings highlight the significant role of climate-induced natural sources in tropospheric O3 formation, even in regions with high anthropogenic activity, and emphasize the importance of mitigating climate warming. Lastly, it is recommended that future pollution control strategies take into account the synergistic effects of both anthropogenic and natural sources.
Air pollutant data were collected through dynamic web scraping from the Environmental Monitoring Station of China: https://air.cnemc.cn:18007/ (Environmental Monitoring Station of China, 2023). The O3 sounding data at Hong Kong can be downloaded from https://woudc.org/data/explore.php (WOUDC, 2023). Meteorological data from ERA5 are available at https://doi.org/10.24381/cds.adbb2d47 (Hersbach et al., 2023). The MODIS land data are from https://e4ftl01.cr.usgs.gov/MOTA/ (LP DAAC, 2023). The numerical simulation results were stored on the Tianhe-2 supercomputer, and results can be acquired from Nan Wang (nan.wang@scu.edu.cn).
The supplement related to this article is available online at https://doi.org/10.5194/acp-25-8859-2025-supplement.
NW and HL designed the research. NW conducted the simulation and wrote the paper. NW, HL, JX, and SL contributed to the interpretation of the results. JX, YW, CL, YX, and FY provided critical feedback and helped to improve the paper.
The contact author has declared that none of the authors has any competing interests.
Publisher’s note: Copernicus Publications remains neutral with regard to jurisdictional claims made in the text, published maps, institutional affiliations, or any other geographical representation in this paper. While Copernicus Publications makes every effort to include appropriate place names, the final responsibility lies with the authors.
This research is supported by the National Key Research and Development Program (grant no. 2023YFC3709304), the National Natural Science Foundation Major Project (grant no. 42293322), the Youth Fund Project of the Sichuan Provincial Natural Science Foundation (grant no. 24NSFSC2988), the special fund of the State Environmental Protection Key Laboratory of Formation and Prevention of Urban Air Pollution Complex (SEPAir-2024080211), the Guangdong Basic and Applied Basic Research Foundation (grant no. 2022A1515011753), the Fundamental Research Funds for the Central Universities (grant no. YJ202313), and the Guangxi Science and Technology Program (grant no. AB24010074). The authors also thank Tsinghua University for developing and sharing the MEIC.
This research has been supported by the Key Technologies Research and Development Program (grant no. 2023YFC3709304), the National Natural Science Foundation of China (grant no. 42293322), the Natural Science Foundation of Sichuan Province (grant no. 24NSFSC2988), and the special fund of the State Environmental Protection Key Laboratory of Formation and Prevention of Urban Air Pollution Complex (SEPAir-2024080211).
This paper was edited by Minghuai Wang and reviewed by two anonymous referees.
Bonan, G. B., Levis, S., Kergoat, L., and Oleson, K. W.: Landscapes as patches of plant functional types: An integrating concept for climate and ecosystem models, Global Biogeochem. Cy., 16, 5-1–5-23, 2002.
Cao, H., Fu, T.-M., Zhang, L., Henze, D. K., Miller, C. C., Lerot, C., Abad, G. G., De Smedt, I., Zhang, Q., van Roozendael, M., Hendrick, F., Chance, K., Li, J., Zheng, J., and Zhao, Y.: Adjoint inversion of Chinese non-methane volatile organic compound emissions using space-based observations of formaldehyde and glyoxal, Atmos. Chem. Phys., 18, 15017–15046, https://doi.org/10.5194/acp-18-15017-2018, 2018.
Cao, J., Situ, S., Hao, Y., Xie, S., and Li, L.: Enhanced summertime ozone and SOA from biogenic volatile organic compound (BVOC) emissions due to vegetation biomass variability during 1981–2018 in China, Atmos. Chem. Phys., 22, 2351–2364, https://doi.org/10.5194/acp-22-2351-2022, 2022.
Environmental Monitoring Station of China: Real-time air quality monitoring data, China National Environmental Monitoring Centre [data set], https://air.cnemc.cn:18007/ (last access: 1 August 2025), 2023.
Feng, Z., Xu, Y., Kobayashi, K., Dai, L., Zhang, T., Agathokleous, E., Calatayud, V., Paoletti, E., Mukherjee, A., and Agrawal, M.: Ozone pollution threatens the production of major staple crops in East Asia, Nature Food, 3, 47–56, 2022.
Fry, J. L., Draper, D. C., Barsanti, K. C., Smith, J. N., Ortega, J., Winkler, P. M., Lawler, M. J., Brown, S. S., Edwards, P. M., and Cohen, R. C.: Secondary organic aerosol formation and organic nitrate yield from NO3 oxidation of biogenic hydrocarbons, Environ. Sci. Technol., 48, 11944–11953, 2014.
Fu, Y. and Liao, H.: Simulation of the interannual variations of biogenic emissions of volatile organic compounds in China: Impacts on tropospheric ozone and secondary organic aerosol, Atmos. Environ., 59, 170–185, 2012.
Gao, Y., Ma, M., Yan, F., Su, H., Wang, S., Liao, H., Zhao, B., Wang, X., Sun, Y., and Hopkins, J. R.: Impacts of biogenic emissions from urban landscapes on summer ozone and secondary organic aerosol formation in megacities, Sci. Total Environ., 814, 152654, https://doi.org/10.1016/j.scitotenv.2021.152654, 2022.
Guenther, A., Hewitt, C. N., Erickson, D., Fall, R., Geron, C., Graedel, T., Harley, P., Klinger, L., Lerdau, M., McKay, W. A., Pierce, T., Scholes, B., Steinbrecher, R., Tallamraju, R., Taylor, J., and Zimmerman, P.: A global model of natural volatile organic compound emissions, J. Geophys. Res.-Atmos., 100, 8873–8892, https://doi.org/10.1029/94JD02950, 1995.
Guenther, A., Karl, T., Harley, P., Wiedinmyer, C., Palmer, P. I., and Geron, C.: Estimates of global terrestrial isoprene emissions using MEGAN (Model of Emissions of Gases and Aerosols from Nature), Atmos. Chem. Phys., 6, 3181–3210, https://doi.org/10.5194/acp-6-3181-2006, 2006.
Guenther, A. B., Jiang, X., Heald, C. L., Sakulyanontvittaya, T., Duhl, T., Emmons, L. K., and Wang, X.: The Model of Emissions of Gases and Aerosols from Nature version 2.1 (MEGAN2.1): an extended and updated framework for modeling biogenic emissions, Geosci. Model Dev., 5, 1471–1492, https://doi.org/10.5194/gmd-5-1471-2012, 2012.
Hersbach, H., Bell, B., Berrisford, P., Biavati, G., Horányi, A., Muñoz Sabater, J., Nicolas, J., Peubey, C., Radu, R., Rozum, I., and Schepers, D.: ERA5 hourly data on single levels from 1940 to present, European Centre for Medium-Range Weather Forecasts (ECMWF) [data set], https://doi.org/10.24381/cds.adbb2d47, 2023.
Huang, X., Ding, A., Gao, J., Zheng, B., Zhou, D., Qi, X., Tang, R., Wang, J., Ren, C., and Nie, W.: Enhanced secondary pollution offset reduction of primary emissions during COVID-19 lockdown in China, Natl. Sci. Rev., 8, nwaa137, https://doi.org/10.1093/nsr/nwaa137, 2021.
Itahashi, S., Hayami, H., and Uno, I.: Comprehensive study of emission source contributions for tropospheric ozone formation over East Asia, J. Geophys. Res.-Atmos., 120, 331–358, 2015.
Jenkin, M. E. and Clemitshaw, K. C.: Ozone and other secondary photochemical pollutants: chemical processes governing their formation in the planetary boundary layer, Atmos. Environ., 34, 2499–2527, 2000.
Jin, X. and Holloway, T.: Spatial and temporal variability of ozone sensitivity over China observed from the Ozone Monitoring Instrument, J. Geophys. Res.-Atmos., 120, 7229–7246, 2015.
Li, L. and Xie, S.: Historical variations of biogenic volatile organic compound emission inventories in China, 1981–2003, Atmos. Environ., 95, 185–196, 2014.
Li, L., Chen, Y., and Xie, S.: Spatio-temporal variation of biogenic volatile organic compounds emissions in China, Environ. Pollut., 182, 157–168, 2013.
Li, L., Yang, W., Xie, S., and Wu, Y.: Estimations and uncertainty of biogenic volatile organic compound emission inventory in China for 2008–2018, Sci. Total Environ., 733, 139301, https://doi.org/10.1016/j.scitotenv.2020.139301, 2020.
Li, M., Huang, X., Yan, D., Lai, S., Zhang, Z., Zhu, L., Lu, Y., Jiang, X., Wang, N., and Wang, T.: Coping with the concurrent heatwaves and ozone extremes in China under a warming climate, Sci. Bull., 69, 2938–2947, https://doi.org/10.1016/j.scib.2024.05.034, 2024.
Lippmann, M.: Health effects of ozone a critical review, JAPCA J. Air. Waste. Ma., 39, 672–695, 1989.
Lu, X., Hong, J., Zhang, L., Cooper, O. R., Schultz, M. G., Xu, X., Wang, T., Gao, M., Zhao, Y., and Zhang, Y.: Severe surface ozone pollution in China: a global perspective, Environ. Sci. Tech. Lett., 5, 487–494, 2018.
Lyu, X., Li, K., Guo, H., Morawska, L., Zhou, B., Zeren, Y., Jiang, F., Chen, C., Goldstein, A. H., and Xu, X.: A synergistic ozone-climate control to address emerging ozone pollution challenges, One Earth, 6, 964–977, 2023.
Ma, M., Gao, Y., Wang, Y., Zhang, S., Leung, L. R., Liu, C., Wang, S., Zhao, B., Chang, X., Su, H., Zhang, T., Sheng, L., Yao, X., and Gao, H.: Substantial ozone enhancement over the North China Plain from increased biogenic emissions due to heat waves and land cover in summer 2017, Atmos. Chem. Phys., 19, 12195–12207, https://doi.org/10.5194/acp-19-12195-2019, 2019.
NASA Land Processes Distributed Active Archive Center (LP DAAC): MODIS Terra/Aqua land products, USGS Earth Resources Observation and Science (EROS) Center [data set], https://e4ftl01.cr.usgs.gov/MOTA/ (last access: 1 August 2025), 2023.
Pfannerstill, E. Y., Arata, C., Zhu, Q., Schulze, B. C., Ward, R., Woods, R., Harkins, C., Schwantes, R. H., Seinfeld, J. H., and Bucholtz, A.: Temperature-dependent emissions dominate aerosol and ozone formation in Los Angeles, Science, 384, 1324–1329, 2024.
Qin, M., She, Y., Wang, M., Wang, H., Chang, Y., Tan, Z., An, J., Huang, J., Yuan, Z., and Lu, J.: Increased urban ozone in heatwaves due to temperature-induced emissions of anthropogenic volatile organic compounds, Nat. Geosci.,18, 50–56, https://doi.org/10.1038/s41561-024-01608-w, 2025.
Seco, R., Holst, T., Davie-Martin, C. L., Simin, T., Guenther, A., Pirk, N., Rinne, J., and Rinnan, R.: Strong isoprene emission response to temperature in tundra vegetation, P. Natl. Acad. Sci. USA, 119, e2118014119, https://doi.org/10.1073/pnas.2118014119, 2022.
Simon, H., Baker, K. R., Akhtar, F., Napelenok, S. L., Possiel, N., Wells, B., and Timin, B.: A direct sensitivity approach to predict hourly ozone resulting from compliance with the National Ambient Air Quality Standard, Environ. Sci. Technol., 47, 2304–2313, 2013.
State Council of China: Air Pollution Prevention and Control Action Plan, State Council Document No. 37 [2013], http://www.gov.cn/zwgk/2013-09/12/content_2486773.htm (last access: 1 August 2025), 2013.
State Council of China: Blue Sky Protection Campaign, State Council Document No. 22 [2018], http://www.gov.cn/zhengce/content/2018-07/03/content_5303158.htm (last access: 1 August 2025), 2018.
Wang, H., Lu, X., Seco, R., Stavrakou, T., Karl, T., Jiang, X., Gu, L., and Guenther, A. B.: Modeling isoprene emission response to drought and heatwaves within MEGAN using evapotranspiration data and by coupling with the community land model, J. Adv. Model. Earth Sy., 14, e2022MS003174, https://doi.org/10.1029/2022MS003174, 2022a.
Wang, H., Wu, Q., Guenther, A. B., Yang, X., Wang, L., Xiao, T., Li, J., Feng, J., Xu, Q., and Cheng, H.: A long-term estimation of biogenic volatile organic compound (BVOC) emission in China from 2001–2016: the roles of land cover change and climate variability, Atmos. Chem. Phys., 21, 4825–4848, https://doi.org/10.5194/acp-21-4825-2021, 2021a.
Wang, N., Huang, X., Xu, J., Wang, T., Tan, Z.-M., and Ding, A.: Typhoon-boosted biogenic emission aggravates cross-regional ozone pollution in China, Science Advances, 8, eabl6166, https://doi.org/10.1126/sciadv.abl6166, 2022b.
Wang, N., Lyu, X., Deng, X., Huang, X., Jiang, F., and Ding, A.: Aggravating O3 pollution due to NOx emission control in eastern China, Sci. Total Environ., 677, 732-744, 2019.
Wang, N., Wang, H., Huang, X., Chen, X., Zou, Y., Deng, T., Li, T., Lyu, X., and Yang, F.: Extreme weather exacerbates ozone pollution in the Pearl River Delta, China: role of natural processes, Atmos. Chem. Phys., 24, 1559–1570, https://doi.org/10.5194/acp-24-1559-2024, 2024a.
Wang, N., Du, Y., Chen, D., Meng, H., Chen, X., Zhou, L., Shi, G., Zhan, Y., Feng, M., Li, W., Chen, M., Li, Z., and Yang, F.: Spatial disparities of ozone pollution in the Sichuan Basin spurred by extreme, hot weather, Atmos. Chem. Phys., 24, 3029–3042, https://doi.org/10.5194/acp-24-3029-2024, 2024b.
Wang, N., Xu, J., Pei, C., Tang, R., Zhou, D., Chen, Y., Li, M., Deng, X., Deng, T., Huang, X., and Ding, A.: Air Quality During COVID-19 Lockdown in the Yangtze River Delta and the Pearl River Delta: Two Different Responsive Mechanisms to Emission Reductions in China, Environ. Sci. Technol., 55, 5721–5730, https://doi.org/10.1021/acs.est.0c08383, 2021b.
Wang, P., Zhang, Y., Gong, H., Zhang, H., Guenther, A., Zeng, J., Wang, T., and Wang, X.: Updating biogenic volatile organic compound (BVOC) emissions with locally measured emission factors in south China and the effect on modeled ozone and secondary organic aerosol production, J. Geophys. Res.-Atmos., 128, e2023JD039928, https://doi.org/10.1029/2023JD039928, 2023a.
Wang, T., Xue, L., Brimblecombe, P., Lam, Y. F., Li, L., and Zhang, L.: Ozone pollution in China: A review of concentrations, meteorological influences, chemical precursors, and effects, Sci. Total Environ., 575, 1582–1596, 2017.
Wang, Y., Zhao, Y., Liu, Y., Jiang, Y., Zheng, B., Xing, J., Liu, Y., Wang, S., and Nielsen, C. P.: Sustained emission reductions have restrained the ozone pollution over China, Nat. Geosci., 16, 967-974, 2023b.
West, J. J., Fiore, A. M., Horowitz, L. W., and Mauzerall, D. L.: Global health benefits of mitigating ozone pollution with methane emission controls, P. Natl. Acad. Sci. USA, 103, 3988–3993, 2006.
World Ozone and Ultraviolet Radiation Data Centre (WOUDC): Ozone sounding data for Hong Kong, Environment and Climate Change Canada [data set], https://woudc.org/data/explore.php (last access: 1 August 2025), 2023.
Wu, K., Yang, X., Chen, D., Gu, S., Lu, Y., Jiang, Q., Wang, K., Ou, Y., Qian, Y., Shao, P., and Lu, S.: Estimation of biogenic VOC emissions and their corresponding impact on ozone and secondary organic aerosol formation in China, Atmos. Res., 231, 104656, https://doi.org/10.1016/j.atmosres.2019.104656, 2020.
Wu, W., Fu, T.-M., Arnold, S. R., Spracklen, D. V., Zhang, A., Tao, W., Wang, X., Hou, Y., Mo, J., and Chen, J.: Temperature-dependent evaporative anthropogenic VOC emissions significantly exacerbate regional ozone pollution, Environ. Sci. Technol., 58, 5430–5441, 2024.
Xiao, Q., Geng, G., Xue, T., Liu, S., Cai, C., He, K., and Zhang, Q.: Tracking PM2. 5 and O3 pollution and the related health burden in China 2013–2020, Environ. Sci. Technol., 56, 6922–6932, 2021.
Yin, C., Solmon, F., Deng, X., Zou, Y., Deng, T., Wang, N., Li, F., Mai, B., and Liu, L.: Geographical distribution of ozone seasonality over China, Sci. Total Environ., 689, 625–633, 2019.
Zhang, X., Huang, T., Zhang, L., Shen, Y., Zhao, Y., Gao, H., Mao, X., Jia, C., and Ma, J.: Three-North Shelter Forest Program contribution to long-term increasing trends of biogenic isoprene emissions in northern China, Atmos. Chem. Phys., 16, 6949–6960, https://doi.org/10.5194/acp-16-6949-2016, 2016.