the Creative Commons Attribution 4.0 License.
the Creative Commons Attribution 4.0 License.
 | 12 Aug 2025
Regional transport of aerosols from northern India and its impact on boundary layer height and air quality over Chennai, a coastal megacity in southern India
Saleem Ali
Chandan Sarangi
Sanjay Kumar Mehta
Anticyclonic wind circulation is prevalent over India during the winter season, causing advection of air masses from northern India towards southeastern coastal Indian and the adjoining Bay of Bengal (BoB) regions. In this study, we use a synergy of satellite, radiosonde, and ground-based measurements to characterize the phenomenon of regional transport episodes (RTEs) and their impact on the boundary layer height and air quality over Chennai, a tropical South Asian megacity. The long-term satellite data and back-trajectory analysis enable us to detect the occurrence of RTE over Chennai, which persists for a duration of 2–4 d. The transported aerosol is generally located at altitudes of ∼ 1–3 km along the eastern coast of India. The duration of these RTEs in the winter season over Chennai accounts for ∼ 10 %–15 % of the days, which demonstrates an increasing trend over the last decade. Radiosonde analysis over the five sites located en route to the transport pathway illustrates distinct aerosol-associated warming (1–1.5 K) at altitudes corresponding to these elevated layers and hence a strong enhancement in lower-tropospheric stability during the RTE. In agreement, the regional aerosol/haze transport significantly reduces the boundary layer height to less than 1 km compared to haze-free (clear) days (∼ 2–2.5 km), mainly during the ensuing period of boundary layer evolution over the eastern coast. Consequently, an increase in PM2.5 concentration over Chennai is observed (∼ 50 %–60 %) during RTE compared to background days. This study provides robust observational evidence of the importance of regional transport of aerosols for the air quality of downwind megacities and warrants more observational and modeling studies in the future.
- Article
(1605 KB) - Full-text XML
-
Supplement
(1409 KB) - BibTeX
- EndNote


Atmospheric aerosols are pivotal in regulating Earth's climate systems by influencing the radiation budget, cloud properties, and biochemical cycles. Direct and indirect effects of aerosols on the radiation balance of the Earth–Atmosphere system are evident (Comstock and Sassen, 2001; Haywood and Boucher, 2000; Lohmann and Feichter, 2005; Satheesh and Krishnamoorthy, 2005; Yu et al., 2006), and they are believed to generate climate perturbations on a regional and global scale. Apart from the local generation, the long-range transport of aerosols from their sources can severely pollute a large area far from the source, and it is mainly influenced by the atmospheric circulation and aerosol lifetime. Although local emissions contribute mainly to hazy episodes in megacities, they can also be influenced by regional pollutant transports (Ma et al., 2020; Mhawish et al., 2022). Such hazy events can cause severe air pollution, adversely affecting public health. Prolonged haze events and associated high PM2.5 loading have frequently been reported over South Asia and China during recent autumn and winter seasons (Qin et al., 2016; Yang et al., 2020; Zhang et al., 2021a). The significant factors influencing such hazy events are attributed to stable synoptic conditions with weak surface winds and low atmospheric boundary layer height (ABLH) (Wang et al., 2014), along with the regional aerosol transport and atmospheric boundary layer (ABL) interaction (Zhang et al., 2015).
Such transported aerosol layers, stratified above the ABL, can significantly affect the surface energy balance and ABL dynamics, owing to their interaction with incoming solar radiation (Ding et al., 2016; Ma et al., 2020). Depending on the dominant aerosol species, the net impact of these layers could be the absorption or scattering of incoming solar radiation. In either case, the presence of this transported aerosol layer can induce cooling at altitudes below the layer and warming around and above the altitudes where it is located. Simultaneously, near-surface accumulation of absorbing aerosol concentration (under a shallower boundary layer) can lead to lower atmosphere warming and surface cooling. Thus, a series of thermodynamic effects can ensue, disrupting stability and enhancing the upward transport of heat and aerosol through turbulent motion (Barbaro et al., 2014; Huang et al., 2018). Additionally, previous studies found the role of aerosols in the suppression of ABL development through their relative heating and cooling in the upper atmosphere and surface, respectively (Liu et al., 2019; Petäjä et al., 2016; Wang et al., 2019b, 2020, 2018; Wilcox et al., 2016; Zhao et al., 2019; Zou et al., 2017).
Hence, understanding and characterizing the effects of the regional transport of aerosols on the ABL structure and air quality is complex. There are studies signifying the role of aerosols in the boundary layer dynamics (Aruna et al., 2013; Huang et al., 2018; Ma et al., 2022; Miao and Liu, 2019; Raatikainen et al., 2014); however, most of them are based on the modeling framework, and observational evidence is scarce. This study aims to delineate, for the first time, the effects of transported aerosols from northern India towards the southern part of the Indian peninsula on the boundary layer dynamics and hence the pollution dispersion using collocated high-resolution lidar, radiosondes, and surface weather observations, along with space-based observatories.
The Indo-Gangetic Plain (IGP), as the most densely populated and growing economy of the Indian subcontinent, experiences high aerosol loading both around the surface and in the vertical column during the winter season, attributed to the wide range of anthropogenic activities ranging from biomass and fossil fuel burning to agricultural activities (Prasad et al., 2006; Ramanathan and Ramana, 2005; Tripathi et al., 2006). The prevalence of a high-pressure system over the central Indian landmass, especially during the winter seasons (December–March), generates a persistent northeasterly offshore flow (Krishnamurti et al., 1998). It provides a pathway for transporting aerosols from continental areas into the otherwise pristine ocean, covering thousands of kilometers in less than 10 d (Krishnamurti et al., 1998; Rajeev et al., 2000). As such, pollutants from northern India can get transported to the Bay of Bengal (BoB) and then towards southern India under the influence of prevalent strong convection and anticyclonic circulation formation over the northwest of the Bay of Bengal (Kuttippurath et al., 2023; Prijith et al., 2016; Rajeevan and Srinivasan, 2000). Such transboundary transport of pollutants is evident in widespread pollution over the southern Indian peninsula (Ananthavel et al., 2021b; Kant et al., 2023; Kuttippurath et al., 2023; Mehta et al., 2023; Mhawish et al., 2022; Ratnam et al., 2018; Thomas et al., 2021). There was a campaign-based investigation held over the Indian Ocean, e.g., the Indian Ocean Experiment (INDOEX) (Ramanathan et al., 2001), to investigate the characteristics of transported aerosols towards the Indian Ocean and the Arabian Sea (Chester et al., 1991; Prodi et al., 1983; Savoie et al., 1989). The studies revealed that the transported aerosol predominantly consists of black carbon, organics, sulfate, nitrate, ammonia, sea salt, and mineral dust (Ramanathan et al., 2001). An increase in the aerosol loading in the free troposphere reduces the amount of incoming solar radiation reaching the surface, thus causing dimming, while warming the mid-troposphere and upper troposphere and cooling the surface (Dipu et al., 2013; Sarangi et al., 2018). On the other hand, these significantly alter the atmosphere's underlying thermodynamics, leading to modifications of the boundary layer structure. Hence, it is essential to characterize such transports, especially their occurrence characteristics and the nature of the aerosols present. However, observational evidence of such transboundary aerosol transports, their frequency of occurrence, their impact on the ABL development, and the regional pollution maintenance has not been found yet. This study primarily focuses on unraveling such aspects.
Here, long-term satellite observations from the Moderate Resolution Spectroradiometer (MODIS), Cloud–Aerosol Lidar and Infrared Pathfinder Satellite Observatory (CALIPSO), and back-trajectory analysis are used to better understand and characterize the spatiotemporal variability in long-range regional transport of aerosols from northern India to central-southern India during the winter season. Further, we have also used ground-based observations of a micro pulse lidar, radiosonde, surface weather, and surface PM2.5 measurements to (i) investigate and characterize these regional aerosol transport episodes over the eastern coast of India; (ii) quantify the associated changes in the air temperature profiles, lower-tropospheric stability, and ABLH over the eastern coast region; and (iii) quantify the associated changes in the surface PM2.5 distributions due to ABLH reduction over Chennai. Section 2 describes the datasets used, followed by the methodology for composite analysis of aerosols during days with regional transport episodes (RTEs) and clear days. Further, results and discussion are provided in Sect. 4, and the conclusion is provided in Sect. 5.
2.1 Space-based observations
MODIS on board the polar-orbiting sun-synchronous satellites (Terra and Aqua) is utilized to estimate the aerosol optical depth (AOD) information at 550 nm. MODIS measures radiance at 36 spectral bands in the visible to thermal IR spectral range of 0.41–14 µm (Kaufman et al., 1997). Within the spectral range, 7 spectral bands are dedicated to aerosol measurement, having a spatial resolution of 250 m500 m. Owing to its large spatial swath (2330 km), MODIS is capable of observing the entire globe in a single day during two different times, i.e., at 01:30 am/pm (Aqua) and 10:30 am/pm (Terra) local time, which cross the Equator. We used the current version of the Multiangle Implementation of Atmospheric Correction (MAIAC), which retrieved the AOD over land and ocean at 1 km resolution (Lyapustin et al., 2011b, a) between December and March 2015–2024 as used in this work.
In addition, the space-based lidar observation, Cloud–Aerosol Lidar with Orthogonal Polarization (CALIOP; Winker et al., 2009; Young et al., 2013) on board CALIPSO is utilized to understand the vertical variation of aerosol extinction profiles. The level 2, 5 km (horizontally averaged) standard aerosol profile (AProf) version 4.51 at 532 nm during December–March between 2015 and 2023, segregated during the RTE days and clear days, is used. CALIPSO crosses the Equator at ∼ 01:30 am/pm; we used both the day and night passes, around ±5° over the eastern coast box (as shown in Fig. 1a), for the present study.
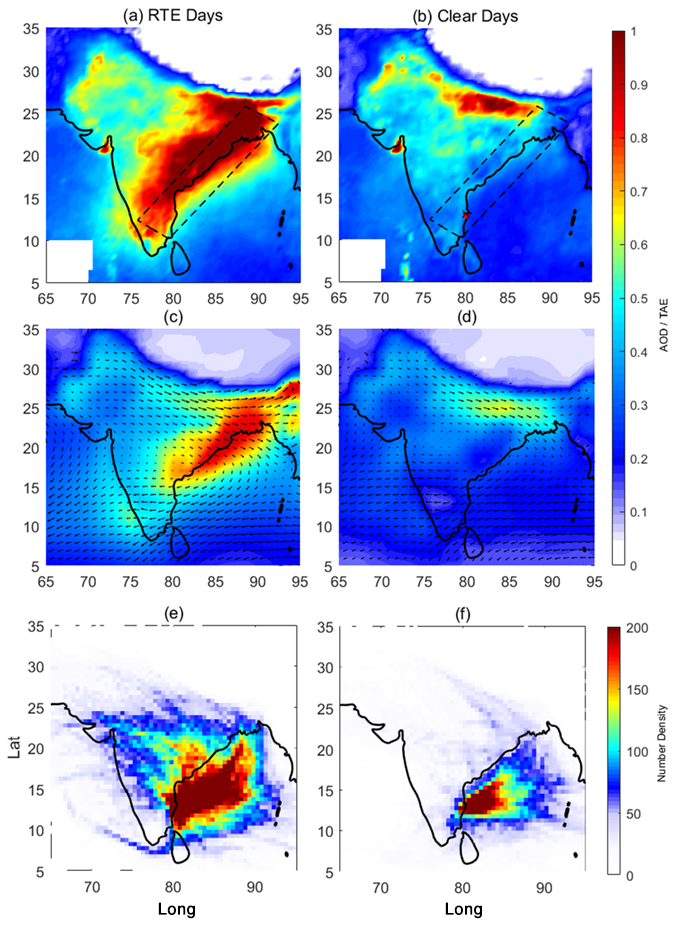
Figure 1Composite of the spatial distribution of AOD obtained from MODIS during (a) RTE days and (b) clear days between December and March during 2015–2024 and total aerosol extinction (TAE) from the MERRA-2 reanalysis dataset observed for the composite of (c) RTE days and (d) clear days. Number density of 5 d backward air mass trajectories to Chennai between the surface and 4 km during (e) RTE days and (f) clear days.
2.2 In situ observations
The micro pulse lidar (MPL), an elastic backscatter dual-polarization lidar from Droplet Measurement Techniques (DMT, USA), is located at the premises of SRM IST, Kattankulathur (12.80° N, 80.0° E, 45 m above mean sea level, a.m.s.l.). The instrument is set up at the Atmospheric Observation and Modelling Laboratory (AOML, 40 m above the ground level) at a total height of 85 m a.m.s.l. The normalized relative backscatter (NRB) between January and February during 2018 and 2023 is primarily utilized to retrieve total attenuated aerosol extinction and determine ABLH. Details on the site description and technical specifications about the MPL (Ali et al., 2022), retrieval of the extinction coefficient and AOD (Ananthavel et al., 2021a, b), and ABLH estimation (Kakkanattu et al., 2023; Reddy et al., 2021a) are provided in the references.
The diurnal variability of ABLH from the MPL is estimated using the wavelet covariance transformation (WCT) method (Baars et al., 2008; Davis et al., 2000; Pal et al., 2010; Reddy et al., 2021a), which estimates the ABLH from lidar profiles by step changes in signals using the Haar function. We have also identified the top of the transported aerosol layer (TAL) using the differential zero-crossing method (Ali et al., 2022; Mehta et al., 2023), similar to the methodology followed by Mehta et al. (2023), to identify the elevated aerosol layer. In general, the extinction coefficient gradually decreases above the ABL. However, the presence of TAL can increase the extinction values, similar to those observed within the ABL. The differential zero-crossing method identifies the top of the TAL using the gradient of extinction coefficient profiles. Note that this method of TAL detection is used only when a valid ABL is identified.
Upper air and surface weather information used in this study was obtained from the India Meteorological Department (IMD) using the sounding over Kolkata (22.65° N, 88.45° E, 6 m a.m.s.l.), Bhubaneswar (20.25° N, 85.83° E, 45.0 m a.m.s.l.), Vizag (17.68° N, 83.33° E, 69.9 m a.m.s.l.), Chennai (Meenambakkam) (13.0° N, 80.06° E, 16 m a.m.s.l.), about 20.13 km northeast of SRM IST, Kattankulathur, and Karaikal (10.9° N, 79.8° E, 6.9 m a.m.s.l.). The radiosonde data archived at 05:30 LT between December–January 2015 and 2024 were used to interpret the meteorological conditions during the aerosol transport periods and ABLH determination. The ABLH is estimated from the potential temperature profiles obtained from the radiosonde. The ABLH is the altitude at which the maximum potential temperature gradient is observed in the lower troposphere (Mehta et al., 2017a, b).
Hourly PM2.5 measurements are routinely made at the US Embassy and Consulate, Chennai (13.05° N, 80.25° E), using a beta attenuation monitor (San Martini et al., 2015). The dataset within the study period (December – January 2015 and 2024) was obtained from AirNow (http://www.airnow.gov, last access: 3 August 2025). The PM2.5 observations from the US Embassy are validated and in good agreement with other observations (Jiang et al., 2015; Mukherjee and Toohey, 2016). The datasets are used to investigate the distribution of surface pollution during the haze transport from the IGP to Chennai.
2.3 Reanalysis datasets and back-trajectory analysis
The Modern-Era Retrospective Analysis for Research and Applications, version 2 (MERRA-2) is employed to understand the spatial variation of total aerosol extinction (TAE), radiation flux, and wind parameters (U, V, and resultant wind speed ). The MERRA-2 reanalysis product provided by NASA's Global Modeling and Assimilation Office (GMAO) is available at 0.5°×0.625° spatial resolution (Gelaro et al., 2017). MERRA-2 simulates five aerosol species, including sulfate, black carbon, dust, organic carbon, and sea salt, with the Goddard Chemistry, Aerosol, Radiation, and Transport (GOCART) model, and their simulated properties are found to be robust (Randles et al., 2017). We used datasets between December and March from 2015–2024 for the present study.
The aerosol direct radiative forcing (ADRF) at the surface is estimated from the radiative fluxes, provided in the MERRA-2 product “M2T1NXRAD”, by taking the fluxes with aerosols and without aerosols under clear-sky conditions. The variables SWGNTCLR (surface net downward shortwave flux assuming clear sky), SWGNTCLRCLN (surface net downward shortwave flux assuming clear sky and no aerosol), LWGNTCLR (surface net downward longwave flux assuming clear sky), and LWGNTCLRCLN (surface net downward longwave flux assuming clear sky and no aerosol) are used to calculate ADRF at the surface (Thomas et al., 2019, 2021).
The Hybrid Single Particle Lagrangian Integrated Trajectory (HYSPLIT) model is used to compute the air mass backward trajectories (Rolph et al., 2017; Stein et al., 2015). We used the web-based HYSPLIT model (https://www.ready.noaa.gov/HYSPLIT.php, last access: 3 August 2025) to estimate the 5 d backward trajectories reaching Chennai to understand the pathways of aerosol transport from northern India. The Global Data Assimilation System (GDAS) meteorological datasets at a spatial grid of 1.0° were used as input to simulate the air mass backward trajectory. The trajectory height was set at every 0.5 km between the surface (50 m) and 4.0 km, with backward trajectories calculated at 6 h intervals for the aerosol transport days and clear days. The trajectory density was determined by counting the number of trajectories crossing each grid cell separately.
Composite analysis of RTE days and clear days
The RTE days are, by definition, the days with significant aerosol transport from northern India to southern coastal India, inducing a widespread haziness over the eastern coast box. Hence, the daily AOD values over the eastern coast and nearby Bay of Bengal (black box in Fig. 1a) are expected to have extreme values during RTE days. The variability in MODIS-observed daily AOD values within the eastern coast box was analyzed, and it was found that AOD values equal to 0.7 and 0.3 represent the 70th and 30th percentile values, respectively. Accordingly, RTE days are the extreme event days when the domain mean AOD is greater than 0.7. Conversely, the days when mean AOD values averaged within the eastern coast region are less than 0.3 are classified as background clear days (hereafter referred to as clear days). Manual inspection of all the identified days (RTE and clear) was done for a confirmatory check that visible long-range aerosol transport from the IGP towards the southern Indian peninsula was observed (similar to the case shown in Fig. S1 in the Supplement). Many days in both composites have cloud contamination present. Hence, the cloudy days over the eastern coast box (i.e., days with mean cloud fraction>0.1) are excluded from the composites of both RTE days and clear days. Based on both these criteria, we have 119 d RTE days and 71 d clear days for analysis. We used these segregated days to perform composite analysis to understand the RTE-associated perturbations in aerosol vertical distribution (CALIPSO and MPL observations), temperature profiles and ABLH (IMD radiosondes), and MERRA-2 simulated total aerosol extinction (TAE), surface net radiation fluxes, and aerosol radiative forcing over the eastern coast of India (compared to background clear days). CALIPSO swaths available around the eastern coast box (as shown in Fig. 1a) are grouped according to RTE days and clear days to study the three-dimensional variation of extinction profiles associated with the RTE phenomena. Moreover, MPL (vertical profiles of extinction coefficient) and PM2.5 measurements available during RTE days and clear days over Chennai are also segregated into these composite days to infer the ABLH variability and pollution concentration. Details of the sample available for the analysis are presented in Table S1 in the Supplement.
4.1 Occurrence of RTE days and clear days
The mean spatial distribution of columnar AOD over the Indian subcontinent for RTE day and clear day composites is compared in Fig. 1a and b. The significance of regional aerosol transport from northern India to southern India is evident, as a majority of grids in the eastern coast region and a considerable portion of the Bay of Bengal have very heavy aerosol loading (AOD > 1). In contrast, the composite mean of AOD during clear days (Fig. 1b) is substantially lower (0.23 ± 0.06) over the eastern coast box, as portrayed in Fig. 1b. The spatial distribution of aerosols during the RTE days and clear days is further confirmed using the MERRA-2 reanalysis products. The average of the MERRA-2 simulated columnar AOD at 550 nm, superimposed with the wind vectors at 850 hPa, for the same composite of RTE days and clear days is compared (Fig. 1c and d). The analysis shows a similar pattern as observed from the AOD distribution from MODIS data. However, variation in the magnitudes is present. Notably, the MERRA-2 simulated columnar AOD values span 0.6–0.9 on RTE days across the eastern coast and are largely 50 %–60 % greater compared to clear days.
The composites also show that the aerosol transport from the IGP to the southern Peninsula via the Bay of Bengal is predominantly by the divergence associated with the anticyclonic circulations prevalent during the winter season. The MERRA-2 simulated wind circulation flow manifests into a northerly wind as it enters the Bay of Bengal and eventually merges into the easterly circulation (prevalent around the tropics) as the wind enters back into the southern Peninsula, south of 20° N. During the winter and pre-monsoon season, the westerly wind system is prominent over northern India, and the IGP in the lower troposphere is subject to the high-pressure systems over central India (Krishnamurti et al., 1998). It is worth noting that the easterly wind speed across the southern Bay of Bengal is stronger during clear days than on RTE days. As such, the difference between the RTE day and clear day wind speed composites is that the wind speed during RTE days across the entire eastern half of the Indian subcontinent is weaker than during the clear days (Fig. S4). The reduced wind speed is expected to promote the endurance of aerosols over the eastern coast column and induce greater AOD over the southeastern coast and the southern Indian peninsula.
We further checked the wind back trajectory model to better understand the pathway characteristics. Figure 1e and f show the number density of the HYSPLIT trajectory analysis for the RTE day and clear day, respectively, between the surface (50 m) and 4 km, illustrating the 5 d backward trajectories reaching Chennai, computed for every 6 h interval. It also indicates that pollutants are predominantly transported from the northern parts of India and from the IGP outflow region over the northern BoB during RTE days. In addition, there is also observed transport from inland areas of the eastern coasts along the anticyclonic circulation pathway of the aerosol flow from northern India. On the other hand, the transport is predominantly from the nearby oceanic region during clear days. Thus, these 5 d back trajectories also confirm the fidelity of the RTE day composites and that they are indeed characteristically different from the composite of background days.
We also checked for a diurnal pattern in the MERRA-2 simulated TAE values. However, such variations are negligible, pointing to the longer duration of such events. Hence, we further examined the endurance of RTE days. Normally, the RTE episodes last for days; persistence of such events for more than a day is observed to be ∼ 53 % of the total observations, while 21 % of occurrences have RTE episode durations of more than 4 d. The duration of RTE episodes, in general, can vary from 1 d to 4–6 d. Overall, we have categorized RTEs as episodes of varying duration, i.e., 1 d, 2 d, and so on, up to 5 d, and the occurrence of RTEs within each category on a yearly basis is recorded. Figure S3 provides an overview of the occurrence of RTEs under each category between 2015 and 2024. On average, the RTEs that occurred over the southeastern coast box for consecutive 2–4 d were the most frequent (as shown in Fig. S3), and such events show an increasing pattern. Notably, the year 2022 experienced a 12 d consecutive haziness between 20 and 31 March. Figure S3 also suggests an increasing trend in the overall occurrence of RTE days. The endurance of such hazy periods can result in significant consequences for air quality and boundary layer dynamics.
4.2 Vertical aerosol structure during RTE days and clear days
The CALIOP-observed mean vertical distribution of the aerosol extinction over the southeastern coastal region during the RTE days and clear days is shown in Fig. 2a and b, respectively. As expected, there is a distinct decreasing gradient in aerosol extinction values between the surface and 2 km altitude as we move from the IGP in the northern to southern peninsular coastal India during both RTE days and clear days. More interestingly, high values of aerosol extinction (>0.2) are discernible up to 5 km during RTE days over the region south of 20° N, while the same is confined to altitudes less than 1.5 km during clear days. Also, over the region north of 20° N, a relative increase in the extinction within ∼ 1–4 km can be observed on RTE days relative to clear days. Note that the averaged profiles cover both the land and ocean parts, and there can be differences in the extinction coefficient due to the contrast between the land and ocean swaths of CALIPSO. To understand the variations in the vertical distribution of aerosols between the RTE day and clear day composites, we analyzed the CALIPSO profiles over the land and sea pixels of the eastern coast box separately (Figs. S8–S10). The mean extinction during the RTE days is observed to be greater than 0.2 over the land. However, it is observed between 0.1 and 0.2 over the ocean region. While the land regions have high aerosol concentration near the surface, the same is not seen over the ocean, as there are no active surface emission sources over the ocean. However, the transported elevated aerosol layers are present at altitudes 1–3 km over both the land and the ocean regions.
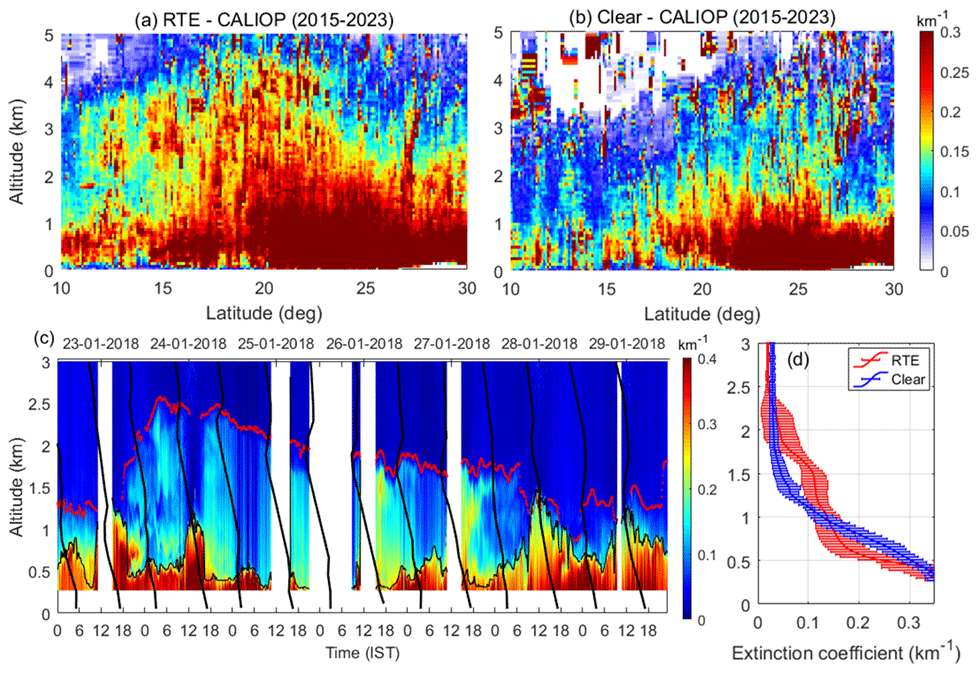
Figure 2The vertical distribution of the aerosol extinction coefficient from CALIOP during (a) RTE days and (b) clear days within ±5° longitude over the eastern coast of India between December and March (2015–2023). (c) Time–altitude cross section of the total attenuated extinction coefficient obtained from micro pulse lidar (MPL) observations over Chennai (SRM IST) between 23 and 29 January 2018. The black lines correspond to the temperature profiles from the radiosonde over IMD, Chennai (Meenambakkam). The dotted black lines correspond to the derived ABLH, and the dotted red lines are the top of the TAL. (d) Mean extinction coefficient observed during a typical RTE day (24–27 January 2018) and clear day (23, 28, 29 January 2018) estimated from MPL observation.
Further, ground-based MPL observations over Chennai are used to study the RTE-associated diurnal and daily-scale perturbations in the vertical distribution of aerosols over this region. We show the temporal changes in the vertical characteristics of aerosol extinction and TAL during a 1-week RTE episode between 23 and 29 January 2018 over Chennai (as shown in Figs. S1 and S2), as observed by MPL in Fig. 2c. The temporal variations of background surface meteorology, including surface T, wind speed (WS), PM2.5, and the AOD, are provided in Fig. S5. A significant increase in the columnar AOD between ∼ 0.4 and 0.8 is observed during the hazy events. However, it is maintained at ∼ 0.2–0.3 during the clear days. It is also worth noting that the AOD above the ABL (integrated extinction within the free troposphere) is observed to be close to the AOD values during the RTE period, suggesting a dominant presence of TAL above the ABL. The occurrence of the TAL can be seen above the ABL during the RTE period and persists for ∼ 3–4 d. The top of the TAL was observed initially at ∼ 2.5 km at ∼ 06:00 LT (or IST) on 24 January 2018, which gradually reduced to ∼ 1.5 km and merged with the ABL at 09:00 LT on 28 January 2018. Thus, the vertical distribution of total attenuated aerosol extinction between 24 and 27 January 2018 is representative of RTE conditions and the background clear days (23, 28, and 29 January).
The study further extends to the variations in the aerosol extinction during RTE days and clear days. Figure 2d shows the day-averaged profiles of RTE days (24–27 January 2018) and clear days (23, 28, and 29 January 2018) observed during the typical case from MPL observations, as shown in Fig. 2c. Although the extinction values are observed to be similar near the surface, they rapidly decrease until ∼ 0.8 km during the RTE days. Further, they peak within the altitude range ∼ 1–2.5 km. Overall, the aerosol extinction during the RTE days is observed to be 50 %–60 % higher than that on clear days between 1 and 2.5 km, suggesting the presence of TAL. Figure 2c is also superimposed with the ABLH determined from MPL observations and temperature profiles obtained from radiosonde observations from Chennai (Meenambakkam). The observed temperature profiles indicate the top of the TAL. Interestingly, the ABLH also decreased from ∼ 1.4 to ∼ 0.3 km (∼ 78 % reduction) between 24 and 25 January 2018. The mean ABLH is observed to be 1.3±0.8 and 1.8±0.8 km during the RTE days and clear days, respectively, exhibiting an overall reduction of ∼ 40 %. Temperature inversions are also observed near the top of the TAL during the RTE days, which may also be attributed to the aerosol-induced warming of the atmosphere and large-scale circulation (Ganguly and Jayaraman, 2006; Sinha et al., 2013). However, such aspects are not addressed here due to the limited datasets.
4.3 RTE-associated atmospheric warming, lower-tropospheric stability, and ABLH suppression
To understand the effect of the transported aerosols and their vertical extent on the background thermal conditions, we also analyzed the vertical temperature (T) profiles obtained from radiosonde observations: Kolkata, Bhubaneswar, Vizag, Chennai, and Karaikal, located along the eastern coast of the Indian peninsula, as depicted in Fig. 3a. The average T profiles with standard error obtained for the RTE day (red) and clear day (blue) categories are shown separately for different stations in Fig. 3b–f. The relative difference (in percent) between the temperature profiles of RTE days and clear days, from the RTE days , is shown on the top axis as dashed lines.
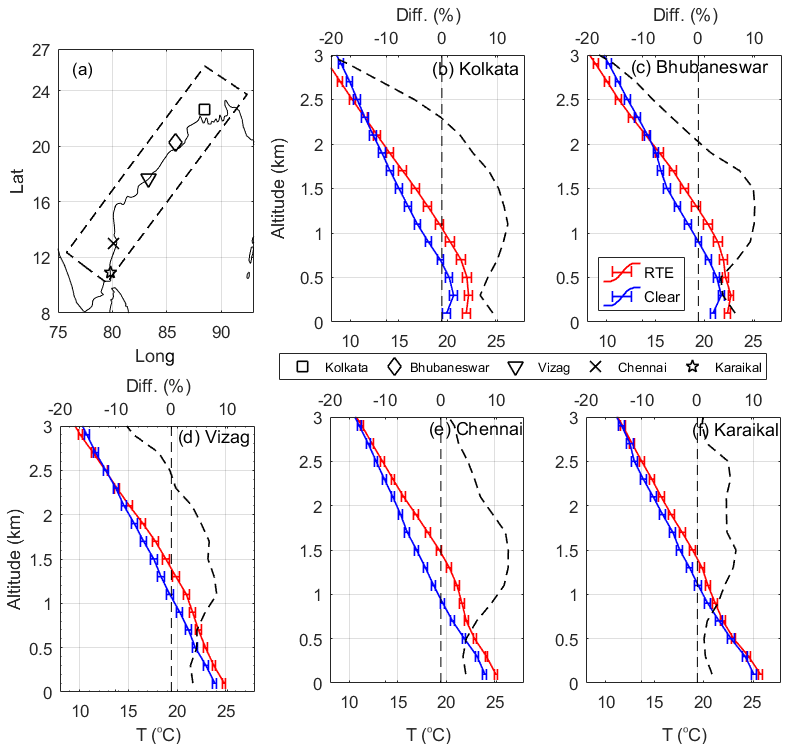
Figure 3Vertical profiles of temperature during RTE days (red) and clear days (blue) obtained over the different stations along the eastern coast. (a) Locations of the radiosonde observations. (b–f) Mean temperature profiles with standard errors over the stations of Kolkata, Bhubaneswar, Vizag, Chennai, and Karaikal during RTE days and clear days and the difference between the RTE days and clear days in percent (axis on the top). The vertical dashed lines correspond to 0 %.
Over Kolkata, which lies in the northernmost region, the relative enhancement in the temperature during RTE days forms a parabolic structure that is located between 0.3 and 2 km, has its center around 1 km, and sharply decreases afterwards. Over Vizag and Bhubaneswar, the intermittent stations, a similar parabolic shape in relative differences is observed, spread between 0.5 and 2.5 km with a center between 1 and 1.5 km. Interestingly, Chennai and Karaikal, the southernmost stations, also show the observed parabolic shape, where heating started from 0.5 km, but the upper stretch was extended up to 3 km, with the center located between 1.5 and 2 km. This phenomenon also suggests that aerosol-induced warming in the lower troposphere not only enhances the temperature at the altitude where aerosols occur but also modifies the overall temperature profiles of the lower atmosphere. Moreover, the observed phenomena of enhancement in altitude of RTE-associated warming as we move southward from the IGP are also consistent with the fact that the long-range-transported aerosol plumes get elevated at downwind locations (Stohl, 2006; Yu et al., 2012). Over Chennai, the altitude of the observed peak warming coincides with the peak occurrence of the TAL, as observed in Fig. 2c, suggesting the aerosol-induced radiative effects of the TAL on temperature profiles. Also, the observed warming occurs throughout the column to ∼ 3 km over both Chennai and Karaikal. This phenomenon also suggests that aerosol-induced warming in the lower troposphere not only enhances the temperature at the altitude where aerosols occur but also modifies the air temperature near the surface. Similar to the observation over Chennai, the observed heating during the RTE days at the other stations can also be attributed to the presence of the TAL. However, the observed latitudinal differences in the magnitudes of warming can be due to the spatial inhomogeneity of the aerosol concentrations, mainly attributed to the transport strength. Interestingly, the intensity of RTE-associated warming over megacities like Kolkata, Bhubaneswar, and Chennai is greater than that of Vizag and Karaikal, suggesting a role of local emissions.
Figure 4a examines the relative differences in lower-tropospheric stability (LTS, i.e., gradient in the temperature between 1.5 km and the surface (ΔT)) during the RTE days and clear days across the different stations over the eastern coast. During the background clear days, the LTS is largely ∼ 7 K, but during the RTE days, it is skewed toward ∼ 4 K, indicating reduced LTS and, hence, increased atmospheric stratification. The variations in the LTS can have a stronger impact on the ABLH, and the relative suppression of the ABL under the influence of the TAL is addressed in Fig. 4b and c.
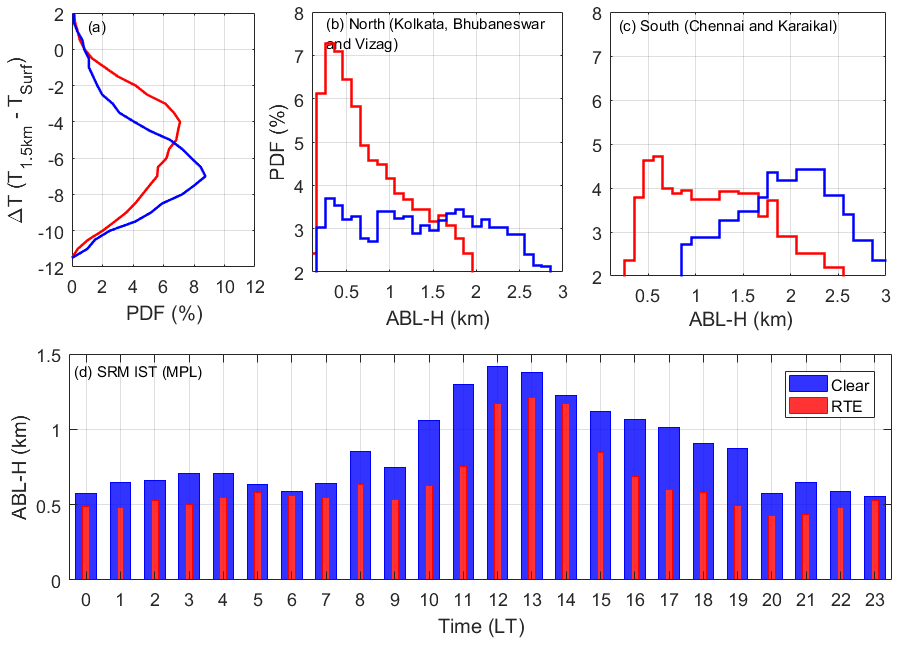
Figure 4(a) The probability distribution of the difference in temperature between 1.5 km and the surface during RTE days (red) and clear days (blue), obtained across the stations (Kolkata, Bhubaneswar, Vizag, Chennai, and Karaikal) over the eastern coast. Probability distribution of ABLH across (b) the northern stations (Kolkata, Bhubaneswar, and Vizag), (c) Chennai and Karaikal, obtained during RTE days (red) and clear days (blue). (d) Diurnal variation of the mean ABLH observed over SRM IST from the MPL observation during RTE days and clear days.
For ease of comparison and to increase the sample size, we grouped the radiosonde-estimated ABLH data over Kolkata, Bhubaneswar, and Vizag (representing the northern region of the eastern coast box) into one comparison plot (Fig. 4b) and the observed ABLH over Chennai and Karaikal into the other plot (Fig. 4c, representative of the transported plume to the southern region of the eastern coast box). It is also interesting to observe latitudinal heterogeneity in the peak occurrence of ABLH over the eastern coast. The mode of distribution of ABLH during the clear day composite varies between 1.5 and 2 km over the northern region and the same is 2–2.5 km over the southern region. During RTE days, the distribution of ABLH shifts drastically to lower values, and the mode of distribution decreases significantly to ∼ 0.3–0.4 km over the northern region and 0.5–1 km over the southern sites, suggesting the strong influence of TAL-associated LTS on the suppression of ABL across the eastern coast. As a result, the accumulated aerosol concentration above the ABL heats the thermal inversion layer and strongly suppresses ABL development (dome effect) (Ma et al., 2020). The shallow ABL further promotes severe hazy episodes (Quan et al., 2014; Ye et al., 2016).
Figure 4d shows the mean ABLH observed over SRM IST (Chennai) during the RTE days (red, 10 d) and clear days (blue, 6 d). Overall, the mean ABLH observed during clear days and RTE days is observed to be ∼ 0.9 ± 0.3 and ∼ 0.6 ± 0.2 km, respectively, accounting for a relative suppression of ABLH by ∼ 33 %–35 % during RTE days. Notably, such a decrease in ABLH was dominant during the afternoon hours (15:00–19:00 LT), where it shows a decline from clear days (1.0 ± 0.1 km) to RTE days (0.6 ± 0.1 km) by ∼ 67 %–70 %. Such dominant suppression was also observable during the forenoon hours (08:00–12:00 LT), accounting for a reduction of ∼ 45 %. Moreover, the ABLH evolution is also considerably different between the two composites. While the evolution of ABLH with time during the daytime is gradual during the clear days, the transition of ABLH between midday and afternoon is much steeper during RTE days. Also, the time to reach the maximum ABLH is delayed by ∼ 1–2 h during RTE days compared to background clear days. The suppression of the ABL followed by the accumulation of absorbing aerosol in the upper ABL has been investigated earlier, especially through numerical simulations (Ding et al., 2013, 2016; Zhao et al., 2019); however, observational evidence is scarce. Barbaro et al. (2014) suggest that a drop in the ABL from 1.4–0.9 km (∼ 35 % reduction) was observed through sensitivity experiments. Similarly, Wang et al. (2015) suggest that the stable stratification of the atmosphere above the ABL through the significant warming by absorbing aerosols contributed to a decrease of ABLH by 33 %. A significant reduction of ABLH with an increase in AOD in the free troposphere is also portrayed in Fig. S6. Observational studies over China suggest that the occurrence of elevated aerosol layers has induced suppression of ABLH from 1.27–0.78 km (∼ 38 % reduction), thus lifting the surface pollution level to 118 % (Wang et al., 2018). Zhang et al. (2021b) report a reduction in the ABLH from 1.09 to 0.48 km (∼ 60 % reduction) during intense haze episodes over China.
Figure S7 shows the aerosol direct radiative forcing (ADRF) observed during the RTE days and clear days, estimated from MERRA-2 radiative flux observations at the surface (Thomas et al., 2019, 2021). Overall, the ADRF has a net cooling at the surface both during the RTE days and clear days. However, RTE events enhance the cooling of the surface to ∼ −20 to 40 W m−2. Such strong cooling is observed around the eastern coast regions where the aerosol transports generally occur. Specifically, the ADRF is reduced to less than −40 W m−2 over the eastern coast box where the TAL is present. During clear days (Fig. S7b), the strong cooling is confined over the IGP alone (∼ −25 to 30 W m−2). The difference in the ADRF during the RTE day and clear day composite is shown in Fig. S7c, evidencing a cooling of ∼ −15 to 20 W m−2 by RTE days. It also suggests that aerosol transport from northern India has a profound effect on the radiation and eventually on the ABLH. The solar dimming due to the presence of TAL can block the solar radiation reaching the surface, resulting in the overall dimming of the ground surface, weakening the surface flux, perturbing the convective process, and suppressing ABL development. The development of ABL during the day is mainly dominated by convective processes (Garratt, 1994; Stull, 1988); however, the formation of TAL suppresses such development via reduction in the incoming solar radiation, especially the surface dimming and inducement of the “dome effect” (Guo et al., 2017; Petäjä et al., 2016). The enhancement in the suppression of ABLH distribution during the afternoon hours can also be attributed to the thermal internal boundary layer formation, where the transport of pollutants towards the land from BoB occurs under the influence of sea breeze (Reddy et al., 2021b). However, this contention requires further investigation with a large sample.
4.4 Impact of transported aerosols on the air quality of downwind megacities
The association of ABLH and PM2.5 is delineated using collocated observations of the MPL and PM2.5 measurements over Chennai, using the measurements across SRM IST and the US Consulate, Chennai, respectively. Figure 5a shows the scatter of normalized anomalies between PM2.5 and ABLH during RTE days, showing data grouped by every 2 percentile bin. Note that the first and last 4 percentiles of the observations are excluded from the analysis to remove outliers. The normalized anomalies are obtained by subtracting the parameters from the long-term average (during the winter season) and then further divided by the same (, where X = PM2.5, ABLH). Note that the average ABLH during the winter season is estimated with the NRB during 2018 and 2023 alone. However, it matches the climatological ABLH reported by Reddy et al. (2021a) over Chennai. As expected, the normalized anomalies between PM2.5 and ABLH are negatively related, with a statistically significant (> 95 % confidence) correlation of −0.6. It portrays that, overall, a 30 % reduction in the ABLH can contribute to a ∼ 130 %–150 % increase in the surface PM2.5 concentrations. Observational studies by Su et al. (2020) show a nearly similar relationship during COVID-19 in China but with a different correlation value over Beijing and northern China, attributed to the inhomogeneity in the spatial distribution of pollution.
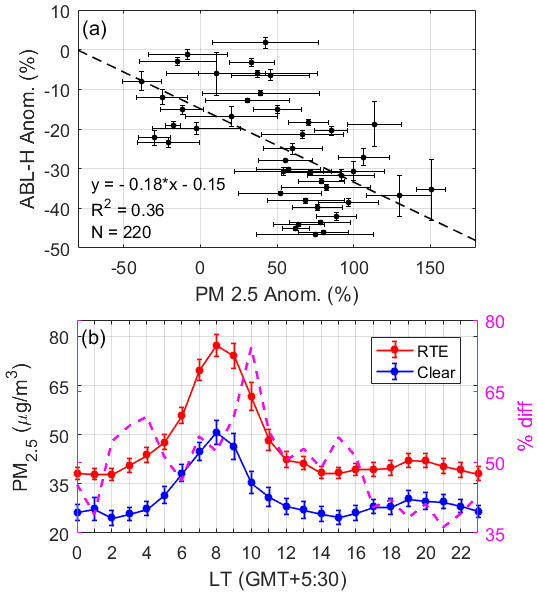
Figure 5(a) Scatter plot showing the normalized anomaly of PM2.5 and ABLH (obtained from MPL, in percent) during RTE days as observed by MPL. The linear fit, R2, and number of samples (N) are also provided. (b) Diurnal variation of PM2.5 over Chennai (US Consulate, Chennai) during RTE days and clear days. The percentage difference in the PM2.5 (% diff, magenta) is shown on the right axis.
Finally, the overall diurnal changes in PM2.5 during the RTE and clear day composites are portrayed in Fig. 5b. As expected, the RTE days experience ∼ 50 %–60 % enhancement in PM2.5 compared to clear days. During the clear days, the PM2.5 increases steeply during the early morning hours and reaches a maximum at 50 µg m−3 at 08:00 LT. This is followed by a gradual decrease to the daily minimum value of ∼ 20–25 µg m−3 from 08:00 to 15:00 LT, before increasing slightly in the evening and night to 30 µg m−3. In comparison, the RTE composite mean shows similar diurnal variability in the PM2.5 values but the magnitudes are greater. The maximum value at 08:00 LT is ∼ 80 µg m−3, and the daily minimum value is ∼ 35 µg m−3 at 15:00 LT, followed by a slight increase in the evening to ∼ 40 µg m−3. As such, the percentage increase in PM2.5 during the RTE composite is more than 50 %, with the maximum being around morning at 09:00–11:00 LT of ∼ 65 %–80 %. This is probably due to a shallower ABLH over the megacity of Chennai during winter. Note that Fig. 4c illustrates that the decrease in ABLH is at its maximum during morning and evening times and its minimum during midday. The clear days, characterized by elevated ABLH, often promote enhanced wind speed and vertical mass movement (Xiang et al., 2019) and can result in a reduction in surface pollution. On the other hand, a suppressed ABLH, as observed during the RTE days, significantly affects the vertical dispersion, leading to higher concentrations of pollutants near the surface (Wang et al., 2019a). It is also to be noted that the surface pollution aggravation becomes complicated in the presence of a stable boundary layer, such that it hinders the exchange of pollutants and energy between the surface and free troposphere and potentially leads to higher concentrations of pollutants in the atmosphere if they are not cleared otherwise (Shi et al., 2020).
This paper presents the first observational evidence of the effect of long-range-transported aerosols on boundary layer dynamics and PM2.5 enhancement over the eastern coast regions of peninsular India. The aerosol transport from the IGP towards southern India (referred to as RTE) occurs mainly under the anticyclonic circulation prevalent over the eastern coast of India and near the BoB regions. The RTE events typically span 2–4 d and are characterized by widespread haziness across the eastern coast. While the pollutant concentrations during RTE are highest among the northern latitudes, they gradually decrease over the south. Such aerosol transport has induced the occurrence of an aerosol layer, referred to as the TAL, having a thickness of ∼ 1–2 km, detached from the ABL. While the TAL has relatively lower vertical extension over the northern latitudes (∼ 2 km), it eventually broadens over the southern latitudes (∼ 3 km). Moreover, the occurrence of the TAL causes atmospheric warming of up to ∼ 1–1.5 °C where it is present. The RTEs, in general, enhance lower-tropospheric stability and hence suppress the growth of the ABL. Such inhibition of ABL growth has latitudinal heterogeneity. Overall, the occurrence of RTE and TAL has suppressed the ABLH by ∼ 40 %, and such suppression is dominant during the afternoon hours. The ABLH and PM2.5 are strongly negatively correlated. For instance, a 30 % reduction in the ABLH can contribute to a ∼ 130 %–150 % increase in surface-level PM2.5 concentrations. The diurnal variation of the PM2.5 suggests an overall enhancement of ∼ 55 % during RTE compared to clear days; however, such enhancements are dominant between 09:00 and 11:00 LT. This study elucidates the first qualitative investigation of the transboundary transport of aerosols over the Indian peninsula and serves as a reference for emission policies, especially over megacities across the eastern coasts and the surrounding area. The analysis of the TAL is carried out by removing the cases of shallow clouds occurring frequently during the study period, which we would like to pursue in a future study.
MODIS and MERRA-2 data can be obtained from the NASA Goddard Earth Sciences Data and Information Services Center (GES DISC). CALIPSO data are available from the Atmospheric Science Data Center at NASA LaRC (https://asdc.larc.nasa.gov/project/CALIPSO, NASA, 2025). Radiosonde and surface data can be obtained from https://weather.uwyo.edu/upperair/sounding.shtml (University of Wyoming, 2025). The MPL data used in this study are not publicly available; however, the data can be provided by the corresponding author upon request.
The supplement related to this article is available online at https://doi.org/10.5194/acp-25-8769-2025-supplement.
SA was responsible for carrying out the investigation, writing, reviewing, data curation, and preparing the original draft of the paper. CS was responsible for conceptualizing, methodology, supervising, carrying out the investigation, writing, reviewing, and editing the paper. SKM was responsible for MPL data curation, reviewing, and editing the paper.
The contact author has declared that none of the authors has any competing interests.
Publisher's note: Copernicus Publications remains neutral with regard to jurisdictional claims made in the text, published maps, institutional affiliations, or any other geographical representation in this paper. While Copernicus Publications makes every effort to include appropriate place names, the final responsibility lies with the authors.
Saleem Ali is grateful to the ISRO (Government of India) and Space Physics Laboratory (Thiruvananthapuram) under the Aerosol Radiative Forcing over India (ARFI) program for partial funding support. We also acknowledge the MoES (Government of India) under Deep Ocean Mission program for partial funding support. Chandan Sarangi acknowledges research funding from the Research Council of Finland project CO-ENHANCIN (no. 360113) and NFSG grant from IIT Madras. Sanjay Kumar Mehta thanks the MoES (Government of India) for supporting the MPL operations under the Satellite Meteorology Cell project. The authors also thank the handling editor Jayanarayanan Kuttippurath and the anonymous reviewers for their constructive comments.
This paper was edited by Jayanarayanan Kuttippurath and reviewed by two anonymous referees.
Ali, S., Mehta, S. K., Ananthavel, A., and Reddy, T. V. R.: Temporal and vertical distributions of the occurrence of cirrus clouds over a coastal station in the Indian monsoon region, Atmos. Chem. Phys., 22, 8321–8342, https://doi.org/10.5194/acp-22-8321-2022, 2022.
Ananthavel, A., Mehta, S. K., Ali, S., Reddy, T. V. R., Annamalai, V., and Rao, D. N.: Micro Pulse Lidar measurements in coincidence with CALIPSO overpasses: Comparison of tropospheric aerosols over Kattankulathur (12.82° N, 80.04° E), Atmos. Pollut. Res., 12, 101082, https://doi.org/10.1016/j.apr.2021.101082, 2021a.
Ananthavel, A., Mehta, S. K., Reddy, T. V. R., Ali, S., and Rao, D. N.: Vertical distributions and columnar properties of the aerosols during different seasons over Kattankulathur (12.82° N, 80.04° E): A semi-urban tropical coastal station, Atmos. Environ., 256, 118457, https://doi.org/10.1016/j.atmosenv.2021.118457, 2021b.
Aruna, K., Kumar, T. V. L., Rao, D. N., Murthy, B. V. K., Babu, S. S., and Moorthy, K. K.: Black carbon aerosols in a tropical semi-urban coastal environment: Effects of boundary layer dynamics and long range transport, J. Atmos. Sol.-Terr. Phy., 104, 116–125, https://doi.org/10.1016/j.jastp.2013.08.020, 2013.
Baars, H., Ansmann, A., Engelmann, R., and Althausen, D.: Continuous monitoring of the boundary-layer top with lidar, Atmos. Chem. Phys., 8, 7281–7296, https://doi.org/10.5194/acp-8-7281-2008, 2008.
Barbaro, E., de Arellano, J. V., Ouwersloot, H. G., Schröter, J. S., Donovan, D. P., and Krol, M. C.: Aerosols in the convective boundary layer: Shortwave radiation effects on the coupled land–atmosphere system, J. Geophys. Res.-Atmos., 119, 5845–5863, https://doi.org/10.1002/2013JD021237, 2014.
Chester, R., Berry, A. S., and Murphy, K. J. T.: The distributions of particulate atmospheric trace metals and mineral aerosols over the Indian Ocean, Mar. Chem., 34, 261–290, https://doi.org/10.1016/0304-4203(91)90007-J, 1991.
Comstock, J. M. and Sassen, K.: Retrieval of cirrus cloud radiative and backscattering properties using combined lidar and infrared radiometer (LIRAD) measurements, J. Atmos. Ocean. Tech., 18, 1658–1673, https://doi.org/10.1175/1520-0426(2001)018<1658:ROCCRA>2.0.CO;2, 2001.
Davis, K. J., Gamage, N., Hagelberg, C. R., Kiemle, C., Lenschow, D. H., and Sullivan, P. P.: An Objective Method for Deriving Atmospheric Structure from Airborne Lidar Observations, J. Atmos. Ocean. Tech., 17, 1455–1468, https://doi.org/10.1175/1520-0426(2000)017<1455:AOMFDA>2.0.CO;2, 2000.
Ding, A. J., Fu, C. B., Yang, X. Q., Sun, J. N., Petäjä, T., Kerminen, V.-M., Wang, T., Xie, Y., Herrmann, E., Zheng, L. F., Nie, W., Liu, Q., Wei, X. L., and Kulmala, M.: Intense atmospheric pollution modifies weather: a case of mixed biomass burning with fossil fuel combustion pollution in eastern China, Atmos. Chem. Phys., 13, 10545–10554, https://doi.org/10.5194/acp-13-10545-2013, 2013.
Ding, A. J., Huang, X., Nie, W., Sun, J. N., Kerminen, V.-M., Petäjä, T., Su, H., Cheng, Y. F., Yang, X.-Q., Wang, M. H., Chi, X. G., Wang, J. P., Virkkula, A., Guo, W. D., Yuan, J., Wang, S. Y., Zhang, R. J., Wu, Y. F., Song, Y., Zhu, T., Zilitinkevich, S., Kulmala, M., and Fu, C. B.: Enhanced haze pollution by black carbon in megacities in China, Geophys. Res. Lett., 43, 2873–2879, https://doi.org/10.1002/2016GL067745, 2016.
Dipu, S., Prabha, T. V., Pandithurai, G., Dudhia, J., Pfister, G., Rajesh, K., and Goswami, B. N.: Impact of elevated aerosol layer on the cloud macrophysical properties prior to monsoon onset, Atmos. Environ., 70, 454–467, https://doi.org/10.1016/j.atmosenv.2012.12.036, 2013.
Ganguly, D. and Jayaraman, A.: Physical and optical properties of aerosols over an urban location in western India: Implications for shortwave radiative forcing, J. Geophys. Res.-Atmos., 111, D24207, https://doi.org/10.1029/2006JD007393, 2006.
Garratt, J.: Review: the atmospheric boundary layer, Earth-Sci. Rev., 37, 89–134, https://doi.org/10.1016/0012-8252(94)90026-4, 1994.
Gelaro, R., McCarty, W., Suárez, M. J., Todling, R., Molod, A., Takacs, L., Randles, C. A., Darmenov, A., Bosilovich, M. G., Reichle, R., Wargan, K., Coy, L., Cullather, R., Draper, C., Akella, S., Buchard, V., Conaty, A., da Silva, A. M., Gu, W., Kim, G.-K., Koster, R., Lucchesi, R., Merkova, D., Nielsen, J. E., Partyka, G., Pawson, S., Putman, W., Rienecker, M., Schubert, S. D., Sienkiewicz, M., and Zhao, B.: The Modern-Era Retrospective Analysis for Research and Applications, Version 2 (MERRA-2), J. Climate, 30, 5419–5454, https://doi.org/10.1175/JCLI-D-16-0758.1, 2017.
Guo, J., Xia, F., Zhang, Y., Liu, H., Li, J., Lou, M., He, J., Yan, Y., Wang, F., Min, M., and Zhai, P.: Impact of diurnal variability and meteorological factors on the PM2.5–AOD relationship: Implications for PM2.5 remote sensing, Environ. Pollut., 221, 94–104, https://doi.org/10.1016/j.envpol.2016.11.043, 2017.
Haywood, J. and Boucher, O.: Estimates of the direct and indirect radiative forcing due to tropospheric aerosols: A review, Rev. Geophys., 38, 513–543, https://doi.org/10.1029/1999RG000078, 2000.
Huang, X., Wang, Z., and Ding, A.: Impact of Aerosol-PBL Interaction on Haze Pollution: Multiyear Observational Evidences in North China, Geophys. Res. Lett., 45, 8596–8603, https://doi.org/10.1029/2018GL079239, 2018.
Jiang, J., Zhou, W., Cheng, Z., Wang, S., He, K., and Hao, J.: Particulate Matter Distributions in China during a Winter Period with Frequent Pollution Episodes (January 2013), Aerosol Air Qual. Res., 15, 494–503, https://doi.org/10.4209/aaqr.2014.04.0070, 2015.
Kakkanattu, S. P., Mehta, S. K., Purushotham, P., Betsy, K. B., Seetha, C. J., and Musaid, P. P.: Continuous monitoring of the atmospheric boundary layer (ABL) height from micro pulse lidar over a tropical coastal station, Kattankulathur (12.82° N, 80.04° E), Meteorol. Atmos. Phys., 135, 2, https://doi.org/10.1007/s00703-022-00938-x, 2023.
Kant, S., Sarangi, C., and Wilcox, E. M.: Aerosol processes perturb cloud trends over Bay of Bengal: observational evidence, npj Clim. Atmos. Sci., 6, 132, https://doi.org/10.1038/s41612-023-00443-x, 2023.
Kaufman, Y. J., Wald, A. E., Remer, L. A., Bo-Cai Gao, Rong-Rong Li and Flynn, L.: The MODIS 2.1-µm channel-correlation with visible reflectance for use in remote sensing of aerosol, IEEE T. Geosci. Remote, 35, 1286–1298, https://doi.org/10.1109/36.628795, 1997.
Krishnamurti, T. N., Jha, B., Prospero, J., Jayaraman, A., and Ramanathan, V.: Aerosol and pollutant transport and their impact on radiative forcing over the tropical Indian Ocean during the January–February 1996 pre-INDOEX cruise, Tellus B, 50, 521, https://doi.org/10.3402/tellusb.v50i5.16235, 1998.
Kuttippurath, J., Maishal, S., Anjaneyan, P., Sunanda, N., and Chakraborty, K.: Recent changes in atmospheric input and primary productivity in the north Indian Ocean, Heliyon, 9, e17940, https://doi.org/10.1016/j.heliyon.2023.e17940, 2023.
Liu, G., Xin, J., Wang, X., Si, R., Ma, Y., Wen, T., Zhao, L., Zhao, D., Wang, Y., and Gao, W.: Impact of the coal banning zone on visibility in the Beijing-Tianjin-Hebei region, Sci. Total Environ., 692, 402–410, https://doi.org/10.1016/j.scitotenv.2019.07.006, 2019.
Lohmann, U. and Feichter, J.: Global indirect aerosol effects: a review, Atmos. Chem. Phys., 5, 715–737, https://doi.org/10.5194/acp-5-715-2005, 2005.
Lyapustin, A., Wang, Y., Laszlo, I., Kahn, R., Korkin, S., Remer, L., Levy, R., and Reid, J. S.: Multiangle implementation of atmospheric correction (MAIAC): 2. Aerosol algorithm, J. Geophys. Res., 116, D03211, https://doi.org/10.1029/2010JD014986, 2011a.
Lyapustin, A., Smirnov, A., Holben, B., Chin, M., Streets, D. G., Lu, Z., Kahn, R., Slutsker, I., Laszlo, I., Kondragunta, S., Tanré, D., Dubovik, O., Goloub, P., Chen, H.-B., Sinyuk, A., Wang, Y., and Korkin, S.: Reduction of aerosol absorption in Beijing since 2007 from MODIS and AERONET, Geophys. Res. Lett., 38, L10803, https://doi.org/10.1029/2011GL047306, 2011b.
Ma, Y., Ye, J., Xin, J., Zhang, W., Vilà-Guerau de Arellano, J., Wang, S., Zhao, D., Dai, L., Ma, Y., Wu, X., Xia, X., Tang, G., Wang, Y., Shen, P., Lei, Y., and Martin, S. T.: The Stove, Dome, and Umbrella Effects of Atmospheric Aerosol on the Development of the Planetary Boundary Layer in Hazy Regions, Geophys. Res. Lett., 47, e2020GL087373, https://doi.org/10.1029/2020GL087373, 2020.
Ma, Y., Xin, J., Wang, Z., Tian, Y., Wu, L., Tang, G., Zhang, W., de Arellano, J. V.-G., Zhao, D., Jia, D., Ren, Y., Gao, Z., Shen, P., Ye, J., and Martin, S. T.: How do aerosols above the residual layer affect the planetary boundary layer height?, Sci. Total Environ., 814, 151953, https://doi.org/10.1016/j.scitotenv.2021.151953, 2022.
Mehta, S. K., Ojha, D., Mehta, S., Anand, D., Rao, D. N., Annamalai, V., Ananthavel, A., and Ali, S.: Thermodynamic structure of the convective boundary layer (CBL) over the Indian monsoon region during CAIPEEX campaigns, Ann. Geophys., 35, 1361–1379, https://doi.org/10.5194/angeo-35-1361-2017, 2017.
Mehta, S. K., Ananthavel, A., Velu, V., Prabhakaran, T., Pandithurai, G., and Rao, D. N.: Characteristics of elevated aerosol layer over the Indian east coast, Kattankulathur (12.82° N, 80.04° E): A northeast monsoon region, Sci. Total Environ., 886, 163917, https://doi.org/10.1016/j.scitotenv.2023.163917, 2023.
Mhawish, A., Sarangi, C., Babu, P., Kumar, M., Bilal, M., and Qiu, Z.: Observational evidence of elevated smoke layers during crop residue burning season over Delhi: Potential implications on associated heterogeneous PM2.5 enhancements, Remote Sens. Environ., 280, 113167, https://doi.org/10.1016/j.rse.2022.113167, 2022.
Miao, Y. and Liu, S.: Linkages between aerosol pollution and planetary boundary layer structure in China, Sci. Total Environ., 650, 288–296, https://doi.org/10.1016/j.scitotenv.2018.09.032, 2019.
Mukherjee, A. and Toohey, D. W.: A study of aerosol properties based on observations of particulate matter from the U. S. Embassy in Beijing, China, Earth's Futur., 4, 381–395, https://doi.org/10.1002/2016EF000367, 2016.
NASA: Cloud-Aerosol Lidar and Infrared Pathfinder Satellite Observations, NASA [data set], https://asdc.larc.nasa.gov/project/CALIPSO (last access: 11 August 2025), 2025.
Pal, S., Behrendt, A., and Wulfmeyer, V.: Elastic-backscatter-lidar-based characterization of the convective boundary layer and investigation of related statistics, Ann. Geophys., 28, 825–847, https://doi.org/10.5194/angeo-28-825-2010, 2010.
Petäjä, T., Järvi, L., Kerminen, V.-M., Ding, A. J., Sun, J. N., Nie, W., Kujansuu, J., Virkkula, A., Yang, X., Fu, C. B., Zilitinkevich, S., and Kulmala, M.: Enhanced air pollution via aerosol-boundary layer feedback in China, Sci. Rep., 6, 18998, https://doi.org/10.1038/srep18998, 2016.
Prasad, A. K., Singh, R. P., and Kafatos, M.: Influence of coal based thermal power plants on aerosol optical properties in the Indo-Gangetic basin, Geophys. Res. Lett., 33, L05805, https://doi.org/10.1029/2005GL023801, 2006.
Prijith, S. S., Rao, P. V. N., and Mohan, M.: Genesis of elevated aerosol loading over the Indian region, in: Proc. SPIE 9882, Remote Sensing and Modeling of the Atmosphere, Oceans, and Interactions VI, New Delhi, India, 988208, https://doi.org/10.1117/12.2223480, 2016.
Prodi, F., Santachiara, G., and Oliosi, F.: Characterization of aerosols in marine environments (Mediterranean, Red Sea, and Indian Ocean), J. Geophys. Res.-Oceans, 88, 10957–10968, https://doi.org/10.1029/JC088iC15p10957, 1983.
Qin, K., Wu, L., Wong, M. S., Letu, H., Hu, M., Lang, H., Sheng, S., Teng, J., Xiao, X., and Yuan, L.: Trans-boundary aerosol transport during a winter haze episode in China revealed by ground-based Lidar and CALIPSO satellite, Atmos. Environ., 141, 20–29, https://doi.org/10.1016/j.atmosenv.2016.06.042, 2016.
Quan, J., Tie, X., Zhang, Q., Liu, Q., Li, X., Gao, Y., and Zhao, D.: Characteristics of heavy aerosol pollution during the 2012–2013 winter in Beijing, China, Atmos. Environ., 88, 83–89, https://doi.org/10.1016/j.atmosenv.2014.01.058, 2014.
Raatikainen, T., Hyvärinen, A.-P., Hatakka, J., Panwar, T. S., Hooda, R. K., Sharma, V. P., and Lihavainen, H.: The effect of boundary layer dynamics on aerosol properties at the Indo-Gangetic plains and at the foothills of the Himalayas, Atmos. Environ., 89, 548–555, https://doi.org/10.1016/j.atmosenv.2014.02.058, 2014.
Rajeev, K., Ramanathan, V., and Meywerk, J.: Regional aerosol distribution and its long-range transport over the Indian Ocean, J. Geophys. Res.-Atmos., 105, 2029–2043, https://doi.org/10.1029/1999JD900414, 2000.
Rajeevan, M. and Srinivasan, J.: Net Cloud Radiative Forcing at the Top of the Atmosphere in the Asian Monsoon Region, J. Climate, 13, 650–657, https://doi.org/10.1175/1520-0442(2000)013<0650:NCRFAT>2.0.CO;2, 2000.
Ramanathan, V., Crutzen, P. J., Lelieveld, J., Mitra, A. P., Althausen, D., Anderson, J., Andreae, M. O., Cantrell, W., Cass, G. R., Chung, C. E., Clarke, A. D., Coakley, J. A., Collins, W. D., Conant, W. C., Dulac, F., Heintzenberg, J., Heymsfield, A. J., Holben, B., Howell, S. J., and Valero, F. P.: Indian Ocean Experiment: An integrated analysis of the climate forcing and effects of the great Indo-Asian haze, J. Geophys. Res.-Atmos., 106, 28371–28398, https://doi.org/10.1029/2001JD900133, 2001.
Ramanathan, V. and Ramana, M. V.: Persistent, Widespread, and Strongly Absorbing Haze Over the Himalayan Foothills and the Indo-Gangetic Plains, Pure Appl. Geophys., 162, 1609–1626, https://doi.org/10.1007/s00024-005-2685-8, 2005.
Ramanathan, V., Crutzen, P. J., Kiehl, J. T., and Rosenfeld, D.: Aerosols, Climate, and the Hydrological Cycle, Science, 294, 2119–2124, https://doi.org/10.1126/science.1064034, 2001.
Randles, C. A., da Silva, A. M., Buchard, V., Colarco, P. R., Darmenov, A., Govindaraju, R., Smirnov, A., Holben, B., Ferrare, R., Hair, J., Shinozuka, Y., and Flynn, C. J.: The MERRA-2 Aerosol Reanalysis, 1980 Onward. Part I: System Description and Data Assimilation Evaluation, J. Climate, 30, 6823–6850, https://doi.org/10.1175/JCLI-D-16-0609.1, 2017.
Ratnam, M. V., Prasad, P., Roja Raman, M., Ravikiran, V., Bhaskara Rao, S. V., Krishna Murthy, B. V., and Jayaraman, A.: Role of dynamics on the formation and maintenance of the elevated aerosol layer during monsoon season over south-east peninsular India, Atmos. Environ., 188, 43–49, https://doi.org/10.1016/j.atmosenv.2018.06.023, 2018.
Reddy, T. V. R., Mehta, S. K., Ananthavel, A., Ali, S., and Rao, D. N.: Evolution of the planetary boundary layer and its simulation over a tropical coastal station Kattankulathur (12.83° N, 80.04° E), Theor. Appl. Climatol., 146, 1043–1060, https://doi.org/10.1007/s00704-021-03770-2, 2021a.
Reddy, T. V. R., Mehta, S. K., Ananthavel, A., Ali, S., Annamalai, V., and Rao, D. N.: Seasonal characteristics of sea breeze and thermal internal boundary layer over Indian east coast region, Meteorol. Atmos. Phys., 133, 217–232, https://doi.org/10.1007/s00703-020-00746-1, 2021b.
Rolph, G., Stein, A., and Stunder, B.: Real-time Environmental Applications and Display sYstem: READY, Environ. Modell. Softw., 95, 210–228, https://doi.org/10.1016/j.envsoft.2017.06.025, 2017.
San Martini, F. M., Hasenkopf, C. A. and Roberts, D. C.: Statistical analysis of PM2.5 observations from diplomatic facilities in China, Atmos. Environ., 110, 174–185, https://doi.org/10.1016/j.atmosenv.2015.03.060, 2015.
Sarangi, C., Kanawade, V. P., Tripathi, S. N., Thomas, A., and Ganguly, D.: Aerosol-induced intensification of cooling effect of clouds during Indian summer monsoon, Nat. Commun., 9, 3754, https://doi.org/10.1038/s41467-018-06015-5, 2018.
Satheesh, S. and Krishnamoorthy, K.: Radiative effects of natural aerosols: A review, Atmos. Environ., 39, 2089–2110, https://doi.org/10.1016/j.atmosenv.2004.12.029, 2005.
Savoie, D. L., Prospero, J. M., and Saltzman, E. S.: Non-sea-salt sulfate and nitrate in trade wind aerosols at Barbados: Evidence for long-range transport, J. Geophys. Res.-Atmos., 94, 5069–5080, https://doi.org/10.1029/JD094iD04p05069, 1989.
Shi, Y., Liu, B., Chen, S., Gong, W., Ma, Y., Zhang, M., Jin, S., and Jin, Y.: Characteristics of aerosol within the nocturnal residual layer and its effects on surface PM2.5 over China, Atmos. Environ., 241, 117841, https://doi.org/10.1016/j.atmosenv.2020.117841, 2020.
Sinha, P. R., Dumka, U. C., Manchanda, R. K., Kaskaoutis, D. G., Sreenivasan, S., Krishna Moorthy, K., and Suresh Babu, S.: Contrasting aerosol characteristics and radiative forcing over Hyderabad, India due to seasonal mesoscale and synoptic-scale processes, Q. J. Roy. Meteor. Soc., 139, 434–450, https://doi.org/10.1002/qj.1963, 2013.
Stein, A. F., Draxler, R. R., Rolph, G. D., Stunder, B. J. B., Cohen, M. D., and Ngan, F.: NOAA's HYSPLIT Atmospheric Transport and Dispersion Modeling System, B. Am. Meteorol. Soc., 96, 2059–2077, https://doi.org/10.1175/BAMS-D-14-00110.1, 2015.
Stohl, A.: Characteristics of atmospheric transport into the Arctic troposphere, J. Geophys. Res.-Atmos., 111, D11306, https://doi.org/10.1029/2005JD006888, 2006.
Stull, R. B. (Ed.): An Introduction to Boundary Layer Meteorology, Springer Netherlands, Dordrecht, https://doi.org/10.1007/978-94-009-3027-8, 1988.
Su, T., Li, Z., Zheng, Y., Luan, Q., and Guo, J.: Abnormally Shallow Boundary Layer Associated With Severe Air Pollution During the COVID-19 Lockdown in China, Geophys. Res. Lett., 47, e2020GL090041, https://doi.org/10.1029/2020GL090041, 2020.
Thomas, A., Sarangi, C., and Kanawade, V. P.: Recent Increase in Winter Hazy Days over Central India and the Arabian Sea, Sci. Rep., 9, 17406, https://doi.org/10.1038/s41598-019-53630-3, 2019.
Thomas, A., Kanawade, V. P., Sarangi, C., and Srivastava, A. K.: Effect of COVID-19 shutdown on aerosol direct radiative forcing over the Indo-Gangetic Plain outflow region of the Bay of Bengal, Sci. Total Environ., 782, 146918, https://doi.org/10.1016/j.scitotenv.2021.146918, 2021.
Tripathi, S. N., Tare, V., Chinnam, N., Srivastava, A. K., Dey, S., Agarwal, A., Kishore, S., Lal, R. B., Manar, M., Kanawade, V. P., Chauhan, S. S. S., Sharma, M., Reddy, R. R., Gopal, K. R., Narasimhulu, K., Reddy, L. S. S., Gupta, S., and Lal, S.: Measurements of atmospheric parameters during Indian Space Research Organization Geosphere Biosphere Programme Land Campaign II at a typical location in the Ganga basin: 1. Physical and optical properties, J. Geophys. Res.-Atmos., 111, D23209, https://doi.org/10.1029/2006JD007278, 2006.
University of Wyoming: University of Wyoming Atmospheric Science Radiosonde Archive, University of Wyoming [data set], https://weather.uwyo.edu/upperair/sounding.shtml (last access: 3 August 2025), 2025.
Wang, H., Shi, G. Y., Zhang, X. Y., Gong, S. L., Tan, S. C., Chen, B., Che, H. Z., and Li, T.: Mesoscale modelling study of the interactions between aerosols and PBL meteorology during a haze episode in China Jing–Jin–Ji and its near surrounding region – Part 2: Aerosols' radiative feedback effects, Atmos. Chem. Phys., 15, 3277–3287, https://doi.org/10.5194/acp-15-3277-2015, 2015.
Wang, H., Li, Z., Lv, Y., Xu, H., Li, K., Li, D., Hou, W., Zheng, F., Wei, Y., and Ge, B.: Observational study of aerosol-induced impact on planetary boundary layer based on lidar and sunphotometer in Beijing, Environ. Pollut., 252, 897–906, https://doi.org/10.1016/j.envpol.2019.05.070, 2019a.
Wang, Y., Yao, L., Wang, L., Liu, Z., Ji, D., Tang, G., Zhang, J., Sun, Y., Hu, B., and Xin, J.: Mechanism for the formation of the January 2013 heavy haze pollution episode over central and eastern China, Sci. China Earth Sci., 57, 14–25, https://doi.org/10.1007/s11430-013-4773-4, 2014.
Wang, Y., Wang, Y., Wang, L., Petäjä, T., Zha, Q., Gong, C., Li, S., Pan, Y., Hu, B., Xin, J., and Kulmala, M.: Increased inorganic aerosol fraction contributes to air pollution and haze in China, Atmos. Chem. Phys., 19, 5881–5888, https://doi.org/10.5194/acp-19-5881-2019, 2019b.
Wang, Y., Yu, M., Wang, Y., Tang, G., Song, T., Zhou, P., Liu, Z., Hu, B., Ji, D., Wang, L., Zhu, X., Yan, C., Ehn, M., Gao, W., Pan, Y., Xin, J., Sun, Y., Kerminen, V.-M., Kulmala, M., and Petäjä, T.: Rapid formation of intense haze episodes via aerosol–boundary layer feedback in Beijing, Atmos. Chem. Phys., 20, 45–53, https://doi.org/10.5194/acp-20-45-2020, 2020.
Wang, Z., Huang, X., and Ding, A.: Dome effect of black carbon and its key influencing factors: a one-dimensional modelling study, Atmos. Chem. Phys., 18, 2821–2834, https://doi.org/10.5194/acp-18-2821-2018, 2018.
Wilcox, E. M., Thomas, R. M., Praveen, P. S., Pistone, K., Bender, F. A.-M., and Ramanathan, V.: Black carbon solar absorption suppresses turbulence in the atmospheric boundary layer, P. Natl. Acad. Sci. USA, 113, 11794–11799, https://doi.org/10.1073/pnas.1525746113, 2016.
Winker, D. M., Vaughan, M. A., Omar, A., Hu, Y., Powell, K. A., Liu, Z., Hunt, W. H., and Young, S. A.: Overview of the CALIPSO Mission and CALIOP Data Processing Algorithms, J. Atmos. Ocean. Tech., 26, 2310–2323, https://doi.org/10.1175/2009JTECHA1281.1, 2009.
Xiang, Y., Zhang, T., Liu, J., Lv, L., Dong, Y., and Chen, Z.: Atmosphere boundary layer height and its effect on air pollutants in Beijing during winter heavy pollution, Atmos. Res., 215, 305–316, https://doi.org/10.1016/j.atmosres.2018.09.014, 2019.
Yang, Y., Zheng, Z., Yim, S. Y. L., Roth, M., Ren, G., Gao, Z., Wang, T., Li, Q., Shi, C., Ning, G., and Li, Y.: PM2.5 Pollution Modulates Wintertime Urban Heat Island Intensity in the Beijing–Tianjin–Hebei Megalopolis, China, Geophys. Res. Lett., 47, e2019GL084288, https://doi.org/10.1029/2019GL084288, 2020.
Ye, X., Song, Y., Cai, X., and Zhang, H.: Study on the synoptic flow patterns and boundary layer process of the severe haze events over the North China Plain in January 2013, Atmos. Environ., 124, 129–145, https://doi.org/10.1016/j.atmosenv.2015.06.011, 2016.
Young, S. A., Vaughan, M. A., Kuehn, R. E., and Winker, D. M.: The retrieval of profiles of particulate extinction from Cloud-Aerosol Lidar and Infrared Pathfinder Satellite Observations (CALIPSO) data: Uncertainty and error sensitivity analyses, J. Atmos. Ocean. Tech., 30, 395–428, https://doi.org/10.1175/JTECH-D-12-00046.1, 2013.
Yu, H., Kaufman, Y. J., Chin, M., Feingold, G., Remer, L. A., Anderson, T. L., Balkanski, Y., Bellouin, N., Boucher, O., Christopher, S., DeCola, P., Kahn, R., Koch, D., Loeb, N., Reddy, M. S., Schulz, M., Takemura, T., and Zhou, M.: A review of measurement-based assessments of the aerosol direct radiative effect and forcing, Atmos. Chem. Phys., 6, 613–666, https://doi.org/10.5194/acp-6-613-2006, 2006.
Yu, H., Remer, L. A., Chin, M., Bian, H., Tan, Q., Yuan, T., and Zhang, Y.: Aerosols from Overseas Rival Domestic Emissions over North America, Science, 337, 566–569, https://doi.org/10.1126/science.1217576, 2012.
Zhang, H., Wang, Y., Hu, J., Ying, Q., and Hu, X.-M.: Relationships between meteorological parameters and criteria air pollutants in three megacities in China, Environ. Res., 140, 242–254, https://doi.org/10.1016/j.envres.2015.04.004, 2015.
Zhang, M., Tian, P., Zeng, H., Wang, L., Liang, J., Cao, X., and Zhang, L.: A Comparison of Wintertime Atmospheric Boundary Layer Heights Determined by Tethered Balloon Soundings and Lidar at the Site of SACOL, Remote Sens., 13, 1781, https://doi.org/10.3390/rs13091781, 2021a.
Zhang, Y., Zhang, Y., Yu, C., and Yi, F.: Evolution of Aerosols in the Atmospheric Boundary Layer and Elevated Layers during a Severe, Persistent Haze Episode in a Central China Megacity, Atmosphere (Basel), 12, 152, https://doi.org/10.3390/atmos12020152, 2021b.
Zhao, D., Xin, J., Gong, C., Quan, J., Liu, G., Zhao, W., Wang, Y., Liu, Z., and Song, T.: The formation mechanism of air pollution episodes in Beijing city: Insights into the measured feedback between aerosol radiative forcing and the atmospheric boundary layer stability, Sci. Total Environ., 692, 371–381, https://doi.org/10.1016/j.scitotenv.2019.07.255, 2019.
Zou, J., Sun, J., Ding, A., Wang, M., Guo, W., and Fu, C.: Observation-based estimation of aerosol-induced reduction of planetary boundary layer height, Adv. Atmos. Sci., 34, 1057–1068, https://doi.org/10.1007/s00376-016-6259-8, 2017.