the Creative Commons Attribution 4.0 License.
the Creative Commons Attribution 4.0 License.
 | 07 Aug 2025
Microphysical properties of refractory black carbon aerosols for different air masses at a central European background site
Thomas Müller
Laurent Poulain
Samira Atabakhsh
Bruna A. Holanda
Jens Voigtländer
Shubhi Arora
Mira L. Pöhlker
Uncertainties persist in estimating the radiative forcing of black carbon (BC) due to an incomplete understanding of its microphysical properties. This study investigated the physical properties of refractory black carbon (rBC) at the central European background site Melpitz during summer and winter, using a single-particle soot photometer coupled with a thermodenuder. Different air masses associated with distinct rBC properties were identified in both seasons. In summer, rBC exhibited a similar mass concentration (∼0.16 µg m−3) among different air masses, with the smallest mass median diameter (MMD) of rBC observed in the long transportation from the northwest (140 nm), while in winter, the highest concentration (1.23 µg m−3) and largest MMD (216 nm) were both observed in the air mass influenced by the easterly winds. Thickly coated rBC fractions increased during the daytime in summer, indicating that the photochemical processes significantly influence the rBC mixing state. In winter, a higher fraction (27 %) of rBC, with thick coatings in the cold air mass compared to the warm air mass (14 %), suggests the contribution of residential heating emissions to the mixing state. Most rBC retained a low-volatility coating in the thermodenuder samples (63 % mass fraction). In summer, photochemical processes also contribute to coating volatility, showing a higher fraction of rBC particles containing low-volatility coatings during the daytime. In winter, low-volatility coatings showed no significant diurnal variation and were more dependent on ambient temperature. Therefore, rBC coating volatility in winter is more influenced by emission sources, particularly residential heating, rather than atmospheric processes.
- Article
(9968 KB) - Full-text XML
-
Supplement
(3066 KB) - BibTeX
- EndNote


Large amounts of black carbon (BC) are emitted into the atmosphere from the incomplete combustion of fossil fuels and biomass burning (Bond et al., 2013; Liu et al., 2020). BC is the most absorbing atmospheric aerosol and therefore affects the earth's climate system (Bond et al., 2006; Bond and Bergstrom, 2007). Compared to greenhouse gases such as carbon dioxide and methane, the atmospheric lifetime of BC is relatively shorter – in the range of hours to days (Bond et al., 2013). According to the sixth Intergovernmental Panel on Climate Change (IPCC, 2021) report, BC light absorption has significant regional effects. Furthermore, BC can also be transported worldwide and can contribute to global climate forcing (Hodnebrog et al., 2014). However, the estimation of BC direct radiative forcing ranged from +0.1 to +1.0 W m−2, leading to challenges in accurately assessing radiation absorption by aerosols in climate models (Wang et al., 2016).
The uncertainties in the estimation of BC climate forcing can be attributed to a limited understanding of its size distribution, mixing state, morphology, spatiotemporal distribution, lifetime, and absorption properties, all of which require more representative and long-term measurements (Cappa et al., 2012; Bond et al., 2013; Liu et al., 2017; Romshoo et al., 2021). The size distribution of BC is mainly related to different sources; for example, BC from biomass burning was found to have a larger peak volume equivalent diameter (VED) of approximately 200 nm, compared to urban emissions with a peak in VED of around 140 nm in Texas, US (Schwarz et al., 2008a). Zhang et al. (2020) also observed that the mass median diameter (MMD) of BC from diesel vehicles is smaller (∼155 nm) than that of residential crop residue burning (∼250 nm) and residential firewood burning (∼273 nm) in the North China Plain. In general, freshly emitted BC exhibits low hygroscopicity and less mixing with other atmospheric materials (Schwarz et al., 2008b; Liu et al., 2013). After emission, BC is coated by other atmospheric components through condensation and coagulation (Liu et al., 2019; Sedlacek et al., 2022). Photochemical reactions were found to be important for the coating of BC, and the thickly coated BC particles tend to be internally mixed with secondary inorganic and organic components (Wang et al., 2017, 2019; Collier et al., 2018). Internally mixed BC becomes hygroscopic and can act as cloud condensation nuclei (CCN) depending on its size and the relative amount of water-soluble coatings (Rose et al., 2011). Laborde et al. (2013) observed that freshly emitted BC aerosols from traffic and biomass-burning emissions were mostly non-hygroscopic, and BC from aged air masses was more hygroscopic. Liu et al. (2013) observed pronounced hygroscopicity in BC-containing particles with ammonium nitrate in industrial areas of the UK.
Coating materials do not affect only the hygroscopicity of the BC particles. When non-absorbing materials coat BC, they can focus the incoming light onto the center of the particle, increasing the efficiency of BC core absorption. This coating-induced absorption enhancement, commonly referred to as the “lensing effect”, has been reported in many field measurements and laboratory studies, and the reported absorption enhancement due to the lensing effect can range from a factor of 1 (no lensing effect) to a factor of around 3 (Schwarz et al., 2008b; Cappa et al., 2012; Liu et al., 2015, 2017; Zhang et al., 2018). The variation of the lensing effect may be influenced by factors such as coating thickness (Shiraiwa et al., 2010), coating composition (Saleh et al., 2014), and the BC core position within the particle (Wang et al., 2021b).
The thermodenuder or catalytic stripper can heat the sample air from 100 to 400 °C; thus they are conventionally used in conjunction with instruments measuring particle light absorption to investigate the lensing effect (Nakayama et al., 2014; Ueda et al., 2016; Yuan et al., 2021). These studies assume that the coating of BC is completely removed after passing through the thermodenuder, or they only consider the effect of non-refractory coatings on absorption. However, some low-volatility (LV) coatings remain on BC after heating (Poulain et al., 2014). These components can lead to inaccurate estimates of the lensing effect (Shetty et al., 2021). On the one hand, the thermodenuder-based method would underestimate the lensing effect, because the absorption enhancement induced by these remaining LV coatings was considered as the absorption of the BC core. By accounting for the LV coating, Zhang et al. (2023) found that in both the field observation and model calculation, the real absorption enhancement can be as high as a factor of 2. On the other hand, if this LV coating contains some absorbing components (e.g., brown carbon), in contrast, these coatings may not increase and may even reduce the BC absorption in the ultraviolet spectral region (Feng et al., 2021; Luo et al., 2018). To facilitate the evaluation of climate change, additional research is required to gain a comprehensive understanding of the relationship between the mixing state and the optical properties of BC.
Although numerous field studies exploring the mixing state of BC have been conducted in Europe, the majority of this research has focused on short polluted periods or single seasons. To investigate the long-term variation of the physical properties of BC, continuous measurements have been taken at the central European background site Melpitz (Germany) since the end of July 2021. The mass concentration, size distribution, and mixing state of BC were measured by a Single Particle Soot Photometer (SP2, Droplet Measurement Technologies, Longmont, CO, US). A thermodenuder (300 °C) was connected upstream of the SP2 to remove the volatile coating of BC. In this study, we focused on August and December, the 2 months with the most contrasting rBC properties, which coincidentally correspond to summer and winter. As shown in Figs. S1 and S2 in the Supplement, these months exhibited the highest and lowest BC mass concentrations, the smallest and largest refractory black carbon (rBC) core sizes, and distinct diurnal variations in coating thickness. The present study aimed to analyze the differences in the physical properties of BC in relation to the different air masses and atmospheric processes observed during distinct seasons.
2.1 Melpitz site
Figure 1 shows the measurements of the Melpitz site (51°32′ N, 12°56′ E; 86 m a.s.l.) of the Leibniz Institute for Tropospheric Research (TROPOS), 50 km to the northeast of Leipzig, Germany. The research site belongs to several observation networks such as GUAN (German Ultrafine Aerosol Network), ACTRIS (Aerosols, Clouds, and Trace gases Research Infrastructure), EMEP (European Monitoring and Evaluation Programme), and GAW (Global Atmosphere Watch). The measurements at Melpitz are regarded as representative of the rural background conditions in Europe (Spindler et al., 2013; Atabakhsh et al., 2023). The meteorological parameters (wind speed, wind direction, temperature, and relative humidity) and aerosol parameters (mass and number concentrations, size distributions, optical properties, and chemical composition) were continuously measured. All online instruments are housed in the same laboratory container and share a common aerosol inlet. This inlet line includes a PM10 Andersen impactor positioned about 6 m above ground level, followed by an automatic aerosol diffusion dryer, which actively maintains the relative humidity in the sampling line below 40 % (Tuch et al., 2009). More detailed descriptions of the Melpitz site can be found, for example, in Spindler et al. (2012), Poulain et al. (2020), and Atabakhsh et al. (2023).
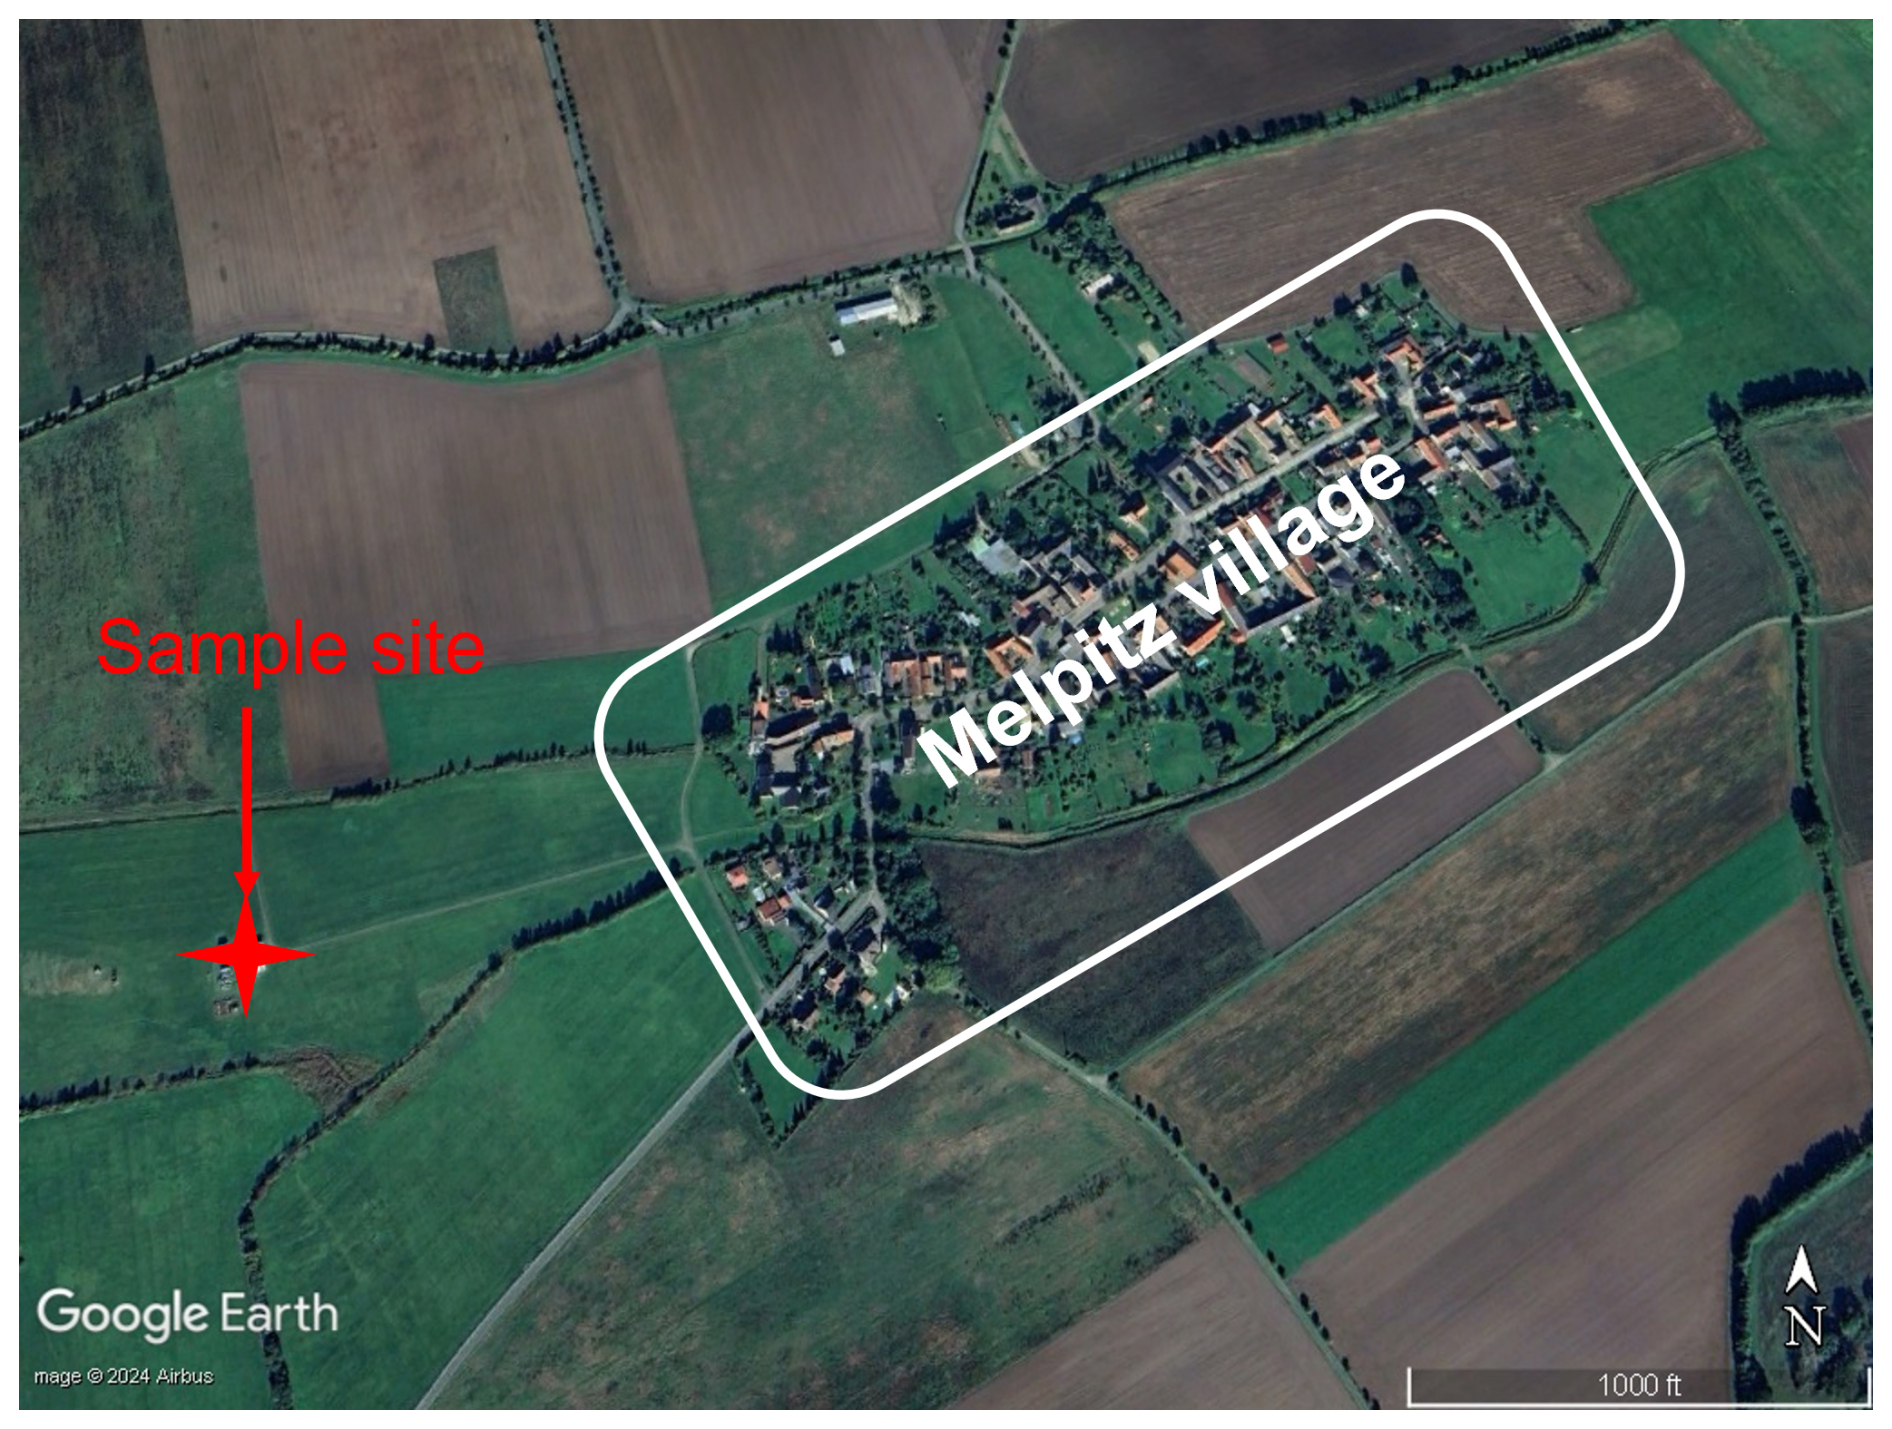
Figure 1Site plan of the Melpitz location. The background map is provided by © Google Earth 2024.
2.2 Instruments
2.2.1 Single Particle Soot Photometer (SP2)
The physical properties of individual BC particles were characterized by SP2. The principle of SP2 can be found elsewhere (Schwarz et al., 2006; McMeeking et al., 2010). Here, briefly, SP2 is based on the laser-induced incandescence (LII) technique. In the SP2 measuring chamber, an intense continuous intracavity Nd:YAG laser beam is generated (at 1064 nm). When a sampled particle passes through the laser beam, its optical diameter can be obtained by the scattering light. If the particle contains absorbing compounds, it will absorb the laser radiation, be heated to its boiling point, and emit incandescent radiation. The refractory mass of individual particles is proportional to the incandescence signal. The dominant absorbing component at this wavelength in the atmosphere is BC (Liu et al., 2014), and BC measured based on this LII technique is referred to as refractory black carbon (rBC). The mass concentration of rBC (MrBC) is the sum of all single-particle masses passing the chamber within a given time and flow rate. The mass equivalent diameter of rBC (as core diameter Dc) can be obtained by assuming the density of rBC of 1.8 g cm−3 (Bond and Bergstrom, 2007). If an rBC particle with a small mass passes through the laser beam or if the laser intensity is low, the conductive cooling to the surrounding air dominates over the BC absorption. As a result, individual rBC particles cannot reach the temperature needed for emitting incandescent light. Besides, the incandescence signal of the large rBC particles can lead to the saturation of the detector. These detection limits of SP2 may cause an underestimation of rBC mass concentration (Schwarz et al., 2010). A commonly used method to eliminate the influence of the detection limit, the potential missing mass fraction of rBC below and above the SP2 detection limit, can be inferred from the extrapolation of a lognormal fit of the measured rBC mass size distribution (Schwarz et al., 2006; Laborde et al., 2013; Pileci et al., 2021). In this study, the detection range of this SP2 is 80–500 nm. The missing ratio due to the SP2 detection limit in summer and winter was 17 ± 7 % and 5 ± 4 %, respectively. After correction, the average rBC mass concentration increased from 0.13 ± 0.11 µg m−3 to 0.16 ± 0.12 µg m−3 in summer and from 0.59 ± 0.55 µg m−3 to 0.61 ± 0.56 µg m−3 in winter.
An rBC-containing particle can be heated up to 4000 K when it crosses the laser beam. The scattering signal of the rBC-containing particle will be distorted due to the evaporation of the volatile coating during the heating of the core. The leading-edge-only (LEO) fit method, which uses a Gaussian fit of the scattering profile before coating evaporation to reconstruct the scattering signal, was applied in this study. Technical details about the LEO-fit approach can be found in Gao et al. (2007). The LEO-fitted scattering signal and rBC core size were used to derive the optical diameter of the BC-containing particle (Dp) by Mie calculations, with a core rBC refractive index of 2.26 – 1.26i (Moteki et al., 2010) and a coating refractive index of 1.5 + 0i (Liu et al., 2014). The mixing state of the rBC-containing particle can be quantified by the relative coating thickness or the absolute coating thickness (CT) . The LEO-fit-derived coating thickness can lead to non-physical negative values. These negative coatings can be attributed to the uncertainties of LEO fit, which resulted from several factors such as the noise of both scattering and incandescent signals, the calibration of SP2, and the core position of the particle (Laborde et al., 2013; Taylor et al., 2015; Krasowsky et al., 2018; Ko et al., 2020). When considering a large number of particles, Taylor et al. (2015) found that the systemic uncertainty of the averaged particle population is primarily influenced by the assumption of the rBC core refractive index and density. These systemic errors do not affect comparisons within measurements using the same set of parameters assumed for the rBC (Ko et al., 2020). Laborde et al. (2013) also noted that these systemic errors are less concerning when averaging over a large particle population. These considerations justify the inclusion of negative CT values in the calculation of the mean.
Before field measurement, the scattering channel of SP2 was calibrated by spherical polystyrene latex (PSL) of known sizes, and the incandescence channel was calibrated using Aquadag®. Monodisperse Aquadag particles were selected using a centrifugal particle mass analyzer (CPMA). A differential mobility analyzer (DMA) was connected after the CPMA to remove multiple charged particles. Moreover, the detection efficiency of SP2 was derived by comparing it to a condensation particle counter (CPC). For an Aquadag particle of ∼0.34 fg, corresponding to ∼85 nm mobility diameter, the SP2 detection efficiency was ∼90 %. The SP2 exhibits a higher sensitivity to Aquadag particles compared to ambient soot. For the same mass, Aquadag generates a stronger incandescent signal. Therefore, a correction factor of 0.75, as suggested by Baumgardner et al. (2012) and Laborde et al. (2012), was applied to the incandescent signal during calibration.
2.2.2 Thermodenuder
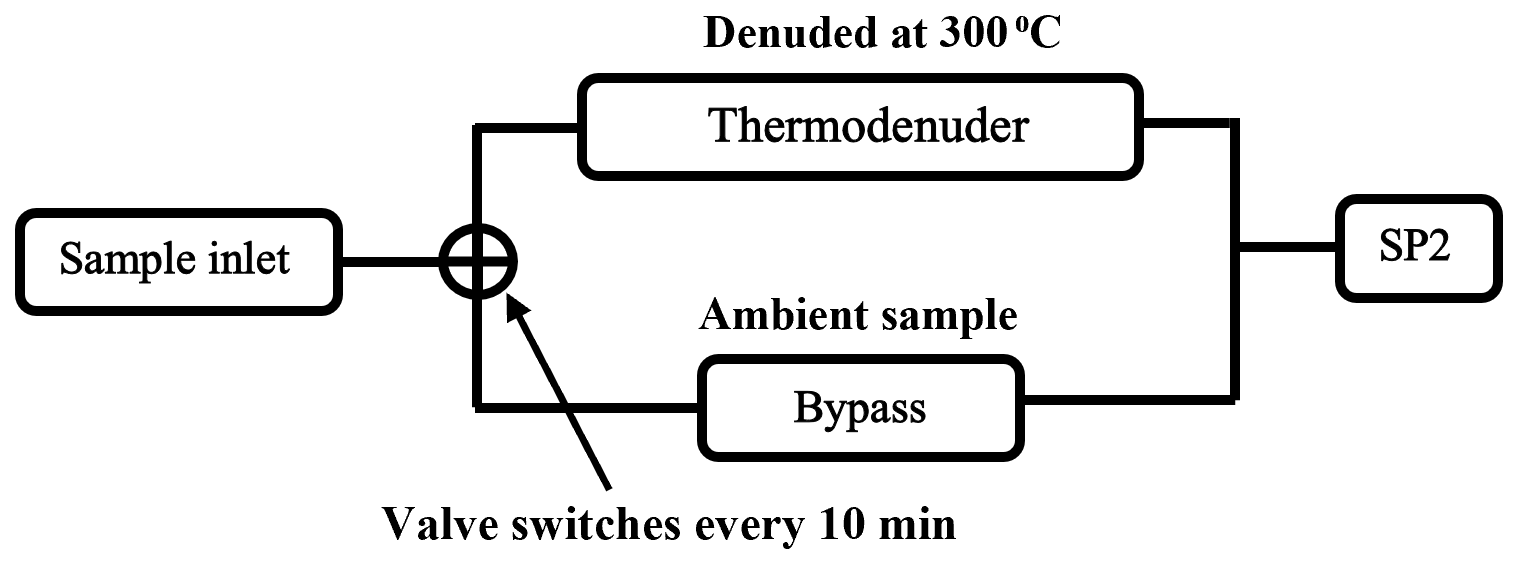
The SP2 was connected to a thermodenuder (TD) system, allowing the measurement of the volatility of rBC-containing particles, as shown in Fig. 2. A detailed description of the TD design can be found in Wehner et al. (2002). A valve controlled the sample air passing through the TD or a bypass line (ambient line). The valve automatically switched every 10 min, alternatively delivering the TD sample or the ambient sample to SP2. The TD sample was heated to 300 °C. This temperature, on the one hand, is high enough to remove inorganic compounds (e.g., ammonium nitrate and ammonium sulfate) and most of the volatile organic components; on the other hand, this temperature is low enough to prevent the charring of organic compounds (Poulain et al., 2014). Thus, the majority of materials left in the TD sample were BC and a fraction of low-volatility oxygenated organic aerosol (LV-OOA) remained in the particle phase (Poulain et al., 2014).
rBC mass losses in the thermodenuder can be derived from the ratio of rBC mass concentrations from the ambient sample and TD sample, which accounts for ∼20 % and ∼11 % in summer and winter, respectively, as shown in Fig. S3. The denuder process did not obviously change the shape of rBC mass size distribution as shown in Fig. S4; only a slight tendency to shift ∼9 nm towards the smaller sizes was observed during the summer. The shape shifts of the rBC size distribution in TD samples did not influence our result significantly; thus we assume that the size distributions for the ambient and TD samples are the same.
2.2.3 ACSM and AMS
An aerosol chemical speciation monitor (ACSM, Aerodyne Research, MA, US; Ng et al., 2011) and an Aerodyne high-resolution time-of-flight aerosol mass spectrometer (HR-ToF-AMS, hereafter referred to as AMS; DeCarlo et al., 2006) were used to measure the bulk chemical composition of non-refractory PM1 aerosol species, including organic aerosols (OAs), nitrate, sulfate, ammonium, and chloride. The ACSM has been set at the Melpitz site since June 2012 and has been measuring up until the present day, with just a few data missing (Poulain et al., 2020; Atabakhsh et al., 2023). During summer, the chemical composition measured by AMS was used instead of that measured by ACSM, due to the higher time resolution obtained. More information about the Melpitz ACSM and AMS can be found in Poulain et al. (2014, 2020) and Atabakhsh et al. (2023).
2.3 Non-parametric wind regression and backward trajectory analysis
To investigate both the local and predominant wind sector associated with transported emission sources and rBC properties, we performed a non-parametric wind regression (NWR) analysis using ZeFir, an Igor-based tool developed by Petit et al. (2017). NWR smooths data over a fine grid, allowing the estimation of weighted concentrations for any wind direction (φ) and wind speed (v) pair, with weighting coefficients determined via Gaussian-like functions (Henry et al., 2009). Additionally, we employed the NOAA HYbrid Single-Particle Lagrangian Integrated Trajectory (HYSPLIT-4) model to generate 72 h backward trajectories at 1 h resolution at 100 m above the sampling site's ground level. These trajectories trace air parcel origins and transport pathways, providing insights into potential pollutant source regions (Cohen et al., 2015). The resulting backward trajectories are presented in Fig. S5. Furthermore, to identify periods with similar geographical source regions and rBC physical properties, the cluster analysis was subsequently applied to the backward trajectories using ZeFir. The optimal number of clusters was determined based on the total spatial variance (TSV) (Syakur et al., 2018), and three different clusters were identified in each season.
3.1 Overview of measurement
The time series of meteorological parameters, physical properties of rBC, and chemical compositions with a time resolution of 1 h during summer and winter are shown in Fig. 3. All times reported in this study are in coordinated universal time (UTC), unless otherwise stated. Aerosol components exhibited clear seasonal variations. In summer, organic aerosols (OAs) dominated, with a mean mass fraction of 55 ± 13 % (± standard deviation, applicable throughout the text). In contrast, during winter, the OA fraction decreased to 29 ± 14 %, while the nitrate fraction significantly increased to 29 ± 15 %, compared to 8 ± 5 % in summer. Furthermore, the mass fraction of sulfate was 24 ± 10 % in summer and 13 ± 8 % in winter. As shown in Table 1, a much higher MrBC of 0.61 ± 0.56 µg m−3 was observed in winter than 0.16 ± 0.12 µg m−3 in summer. The mean mass fraction of rBC is less than 5 % in both seasons. The MMD can be obtained from the lognormal fit of the measured rBC mass size distribution, which can be considered to represent the overall size of the rBC population for the given time window. The MMD shown in Fig. 3b was derived from 1 h average size distributions. In winter, the MMD (192 ± 2 nm) is significantly larger than in summer (148 ± 24 nm), which is related to the different emission sources and air masses, as discussed in later sections.
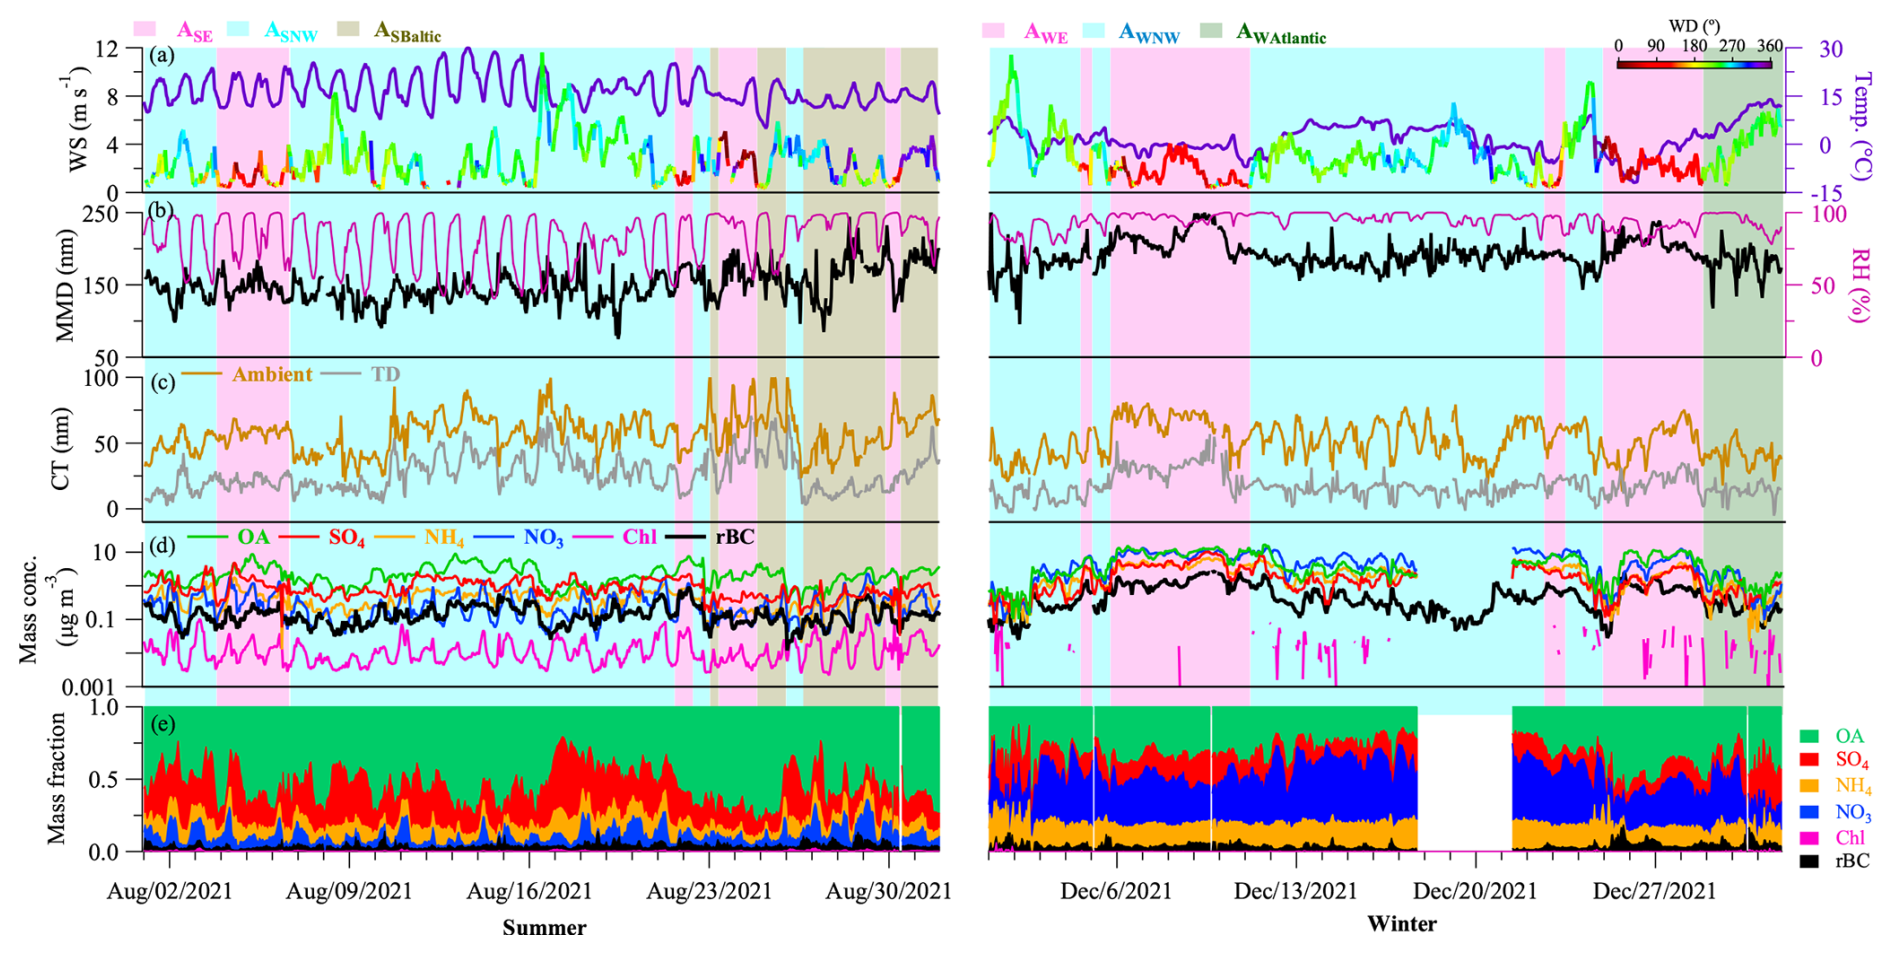
Figure 3Time series of all measurements in summer and winter: (a) wind speed (WS), wind direction (WD), and temperature; (b) mass median diameter (MMD) of rBC size distribution and relative humidity (RH); (c) coating thickness (CT) of coated rBC in ambient and TD sample; (d) mass concentration; and (e) mass fractions of aerosol-phase chemical components and rBC. The shaded areas indicate different air masses.
Table 1Seasonal range of variation and mean values of meteorological parameters and physical properties of rBC in Fig. 3.
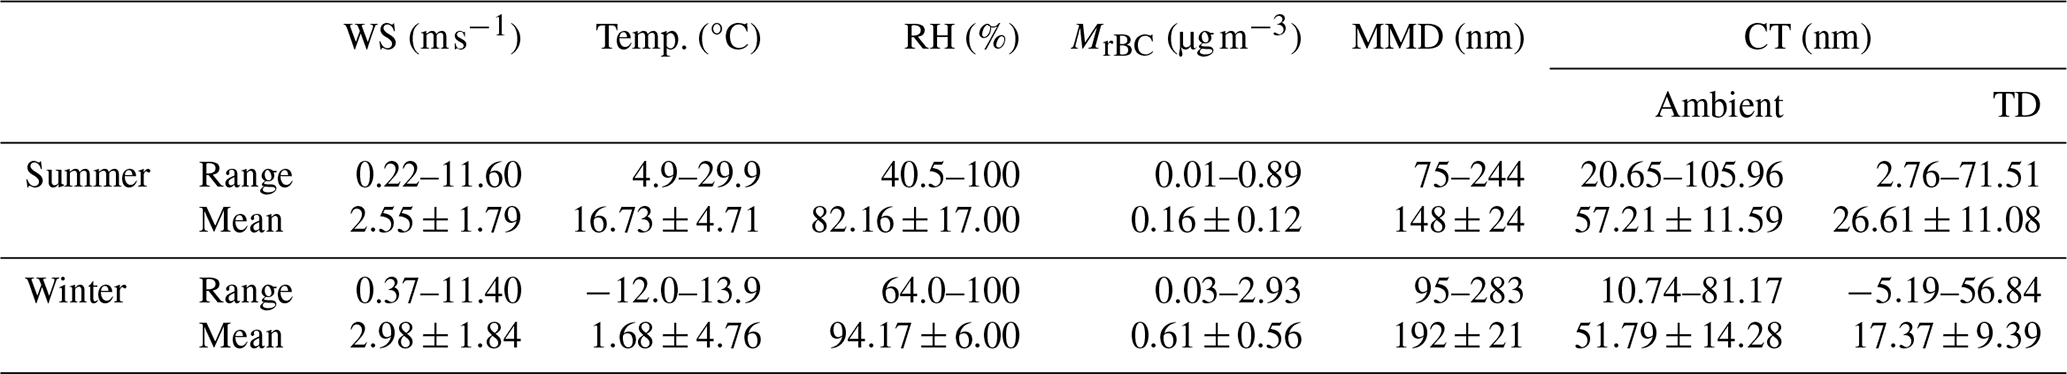
The coating thickness (CT) for rBC-containing particles in the SP2 detection range is exhibited in Fig. 3c. In the ambient sample, CT did not show an evident difference between the two seasons, which is contrary to previous research that usually observed more thickly coated rBC in winter (Yang et al., 2019; Liu et al., 2019; Kompalli et al., 2020). TD can remove most of the volatile coating of rBC, but the remaining coatings were still found on rBC particles in the TD sample. On average, 63 % of rBC masses are still coated after being heated up to 300 °C in both seasons; these remaining coatings are referred to as low-volatility (LV) coatings. The variation of CT can be explained by the size range selected to quantify the mixing state and the atmospheric processes (e.g., photochemical process, hygroscopic growth), and a detailed discussion will be presented later.
Figure 4 shows clusters of back trajectories and an NWR analysis of rBC properties. The wind speed (WS) and wind direction (WD) were measured 6 m above the ground. Three different air masses, associated with distinct rBC properties, were categorized based on the trajectory clusters and wind analysis for both seasons, as summarized in Table 2. As shown in Fig. 4a and b, three different clusters of back trajectories were classified, corresponding to ASNW and ASBaltic in summer and AWNW and AWAtlantic in winter. ASE and AWE will be defined in the following paragraph. During summer, two trajectory clusters from the northwest direction can be found: Cluster1 of summer (Cs1), passing the North Sea, the Netherlands, and northwest Germany; and Cluster2 of summer (Cs2), passing northern France and western Germany. The rBC properties of Cs1 showed no significant differences from those of Cs2. Consequently, ASNW was used to represent the air masses including these two clusters arriving from the northwest in summer. Moreover, ASBaltic is indicated by Cluster3 of summer (Cs3), originating from Finland and passing the Baltic Sea in a southwesterly direction. In winter, Cluster1 and Cluster2 of winter (Cw1 and Cw2) followed paths similar to Cs1 and Cs2, thus being identified as air masses from the northwest in winter (AWNW). Furthermore, Cluster3 of winter (Cw3) was classified as AWAtlantic, crossing northern France from the Atlantic Ocean and then following the same path as Cw2 in Germany.
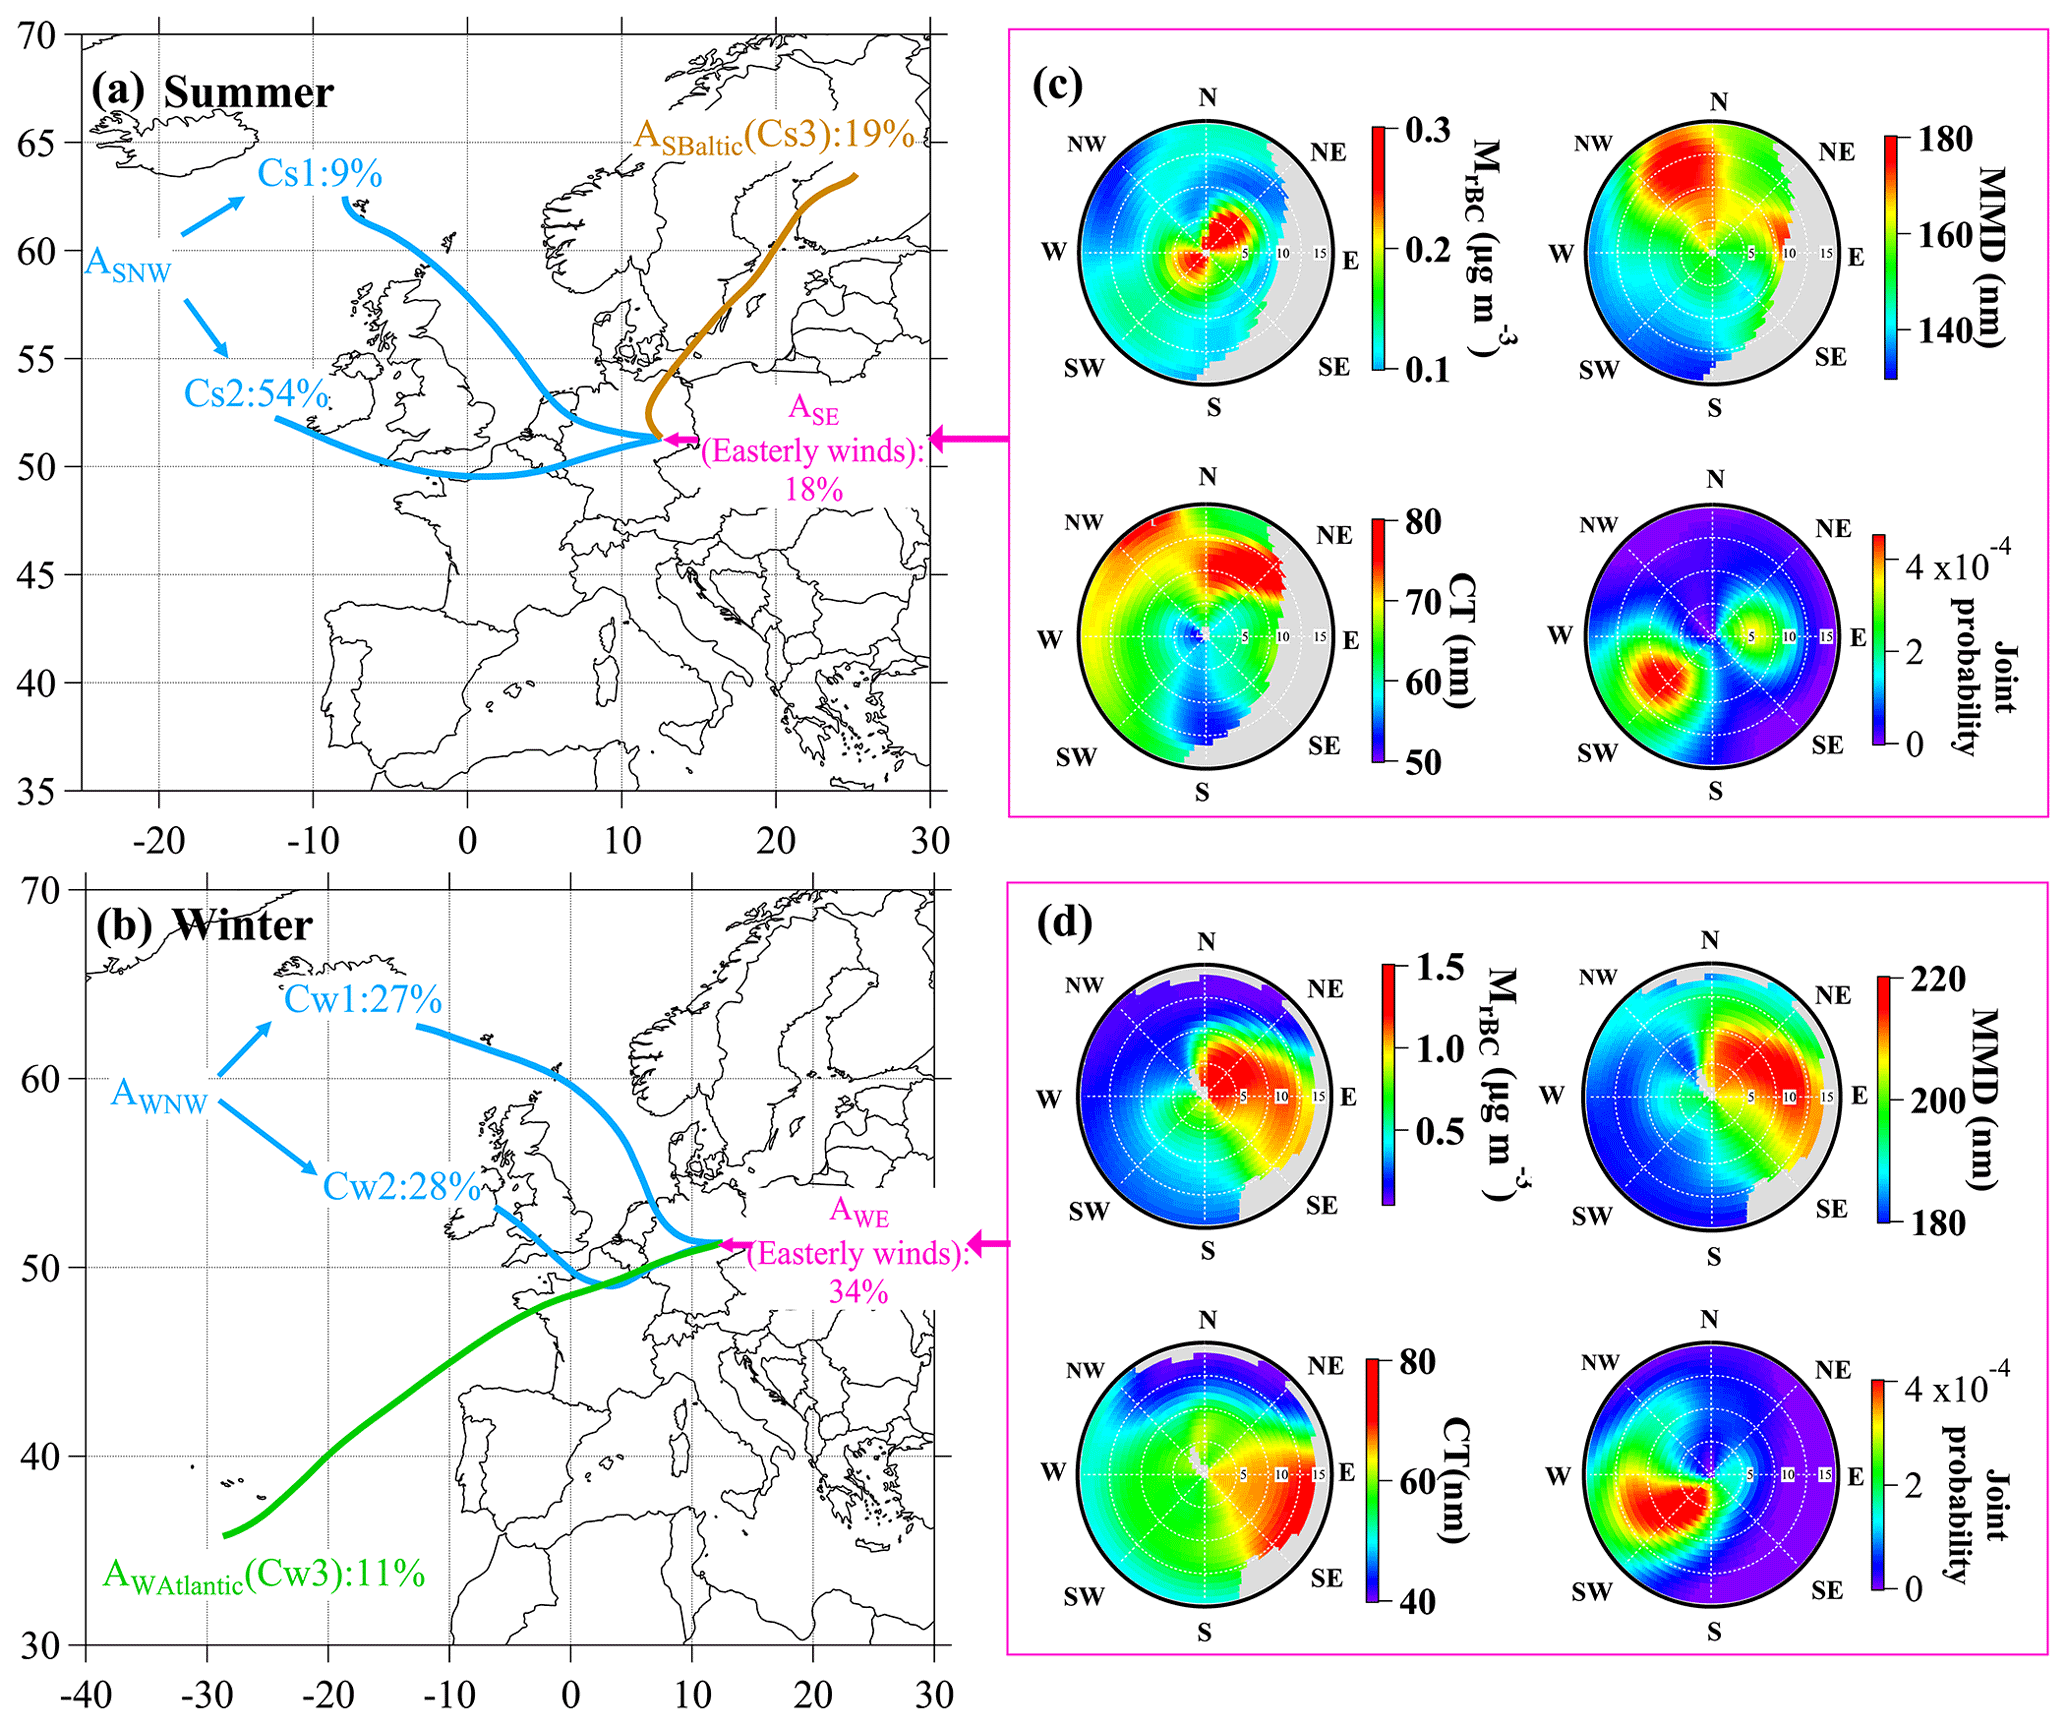
Figure 4The air masses identified from clustered backward trajectories (a, b) and the wind analysis on mass concentrations, MMD, and CT of rBC and joint probability distribution of wind speed and wind direction (c, d) in summer and winter. The radius and angle of wind analysis refer to wind speed (m s−1) and wind direction.
Table 2Classification of air masses based on the clustered backward trajectories and wind analysis.
All trajectory clusters arrived in the northwestern or southwestern sections of Melpitz. In addition, as shown in Fig. 4c and d, the dominating WD sector for the Melpitz site is southwest, with a WS higher than 5 m s−1 in both seasons, as shown in the joint probability distribution of WS and WD. However, the high MrBC can be observed in the east section of NWR for both seasons. During summer, a high concentration of rBC can be observed in the northeast, particularly when wind speeds are below 5 m s−1, indicating local emissions from the village of Melpitz or the city of Torgau (5 km), and these rBC particles exhibited a smaller size (small MMD) and thin coating (small CT). Additionally, another high concentration of rBC from the southwest may relate to the emission from the village of Klitzschen (3 km). The presence of a thick coating and a large MMD of rBC observed from the northwest section, accompanied by high wind speeds, may relate to ASBaltic. In winter, high rBC concentration was principally observed from the northeast but also with a significant contribution from the southeast, occurring under both low (<5 m s−1) and high (>5 m s−1) wind speeds, suggesting both local emission and transportation from the east. Concurrently, rBC of larger size (large MMD) and with thicker coatings (high CT) was also observed from similar directions. Therefore, the eastern section shown in the NWR analysis was defined as the air mass related to the easterly winds, with ASE representing this in summer and ASW representing this in winter.
3.2 Mass concentration and size distribution of rBC
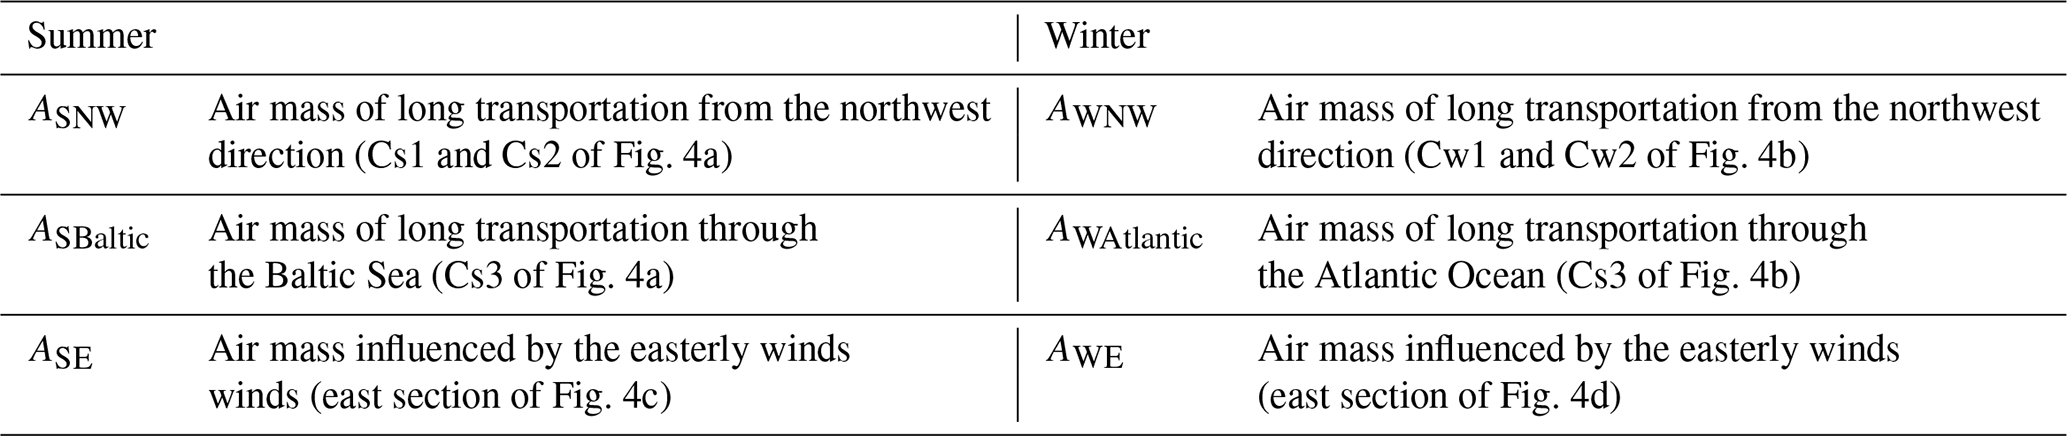
Figure 5a and b exhibit the MrBC for different summer and winter air masses, respectively. In summer, relatively similar MrBC levels were found, with ASE (mean MrBC of 0.18 ± 0.17 µg m−3) being only slightly higher than ASNW and ASBaltic (both with a mean MrBC of around 0.16 µg m−3). In winter, rBC exhibited distinct different MrBC values among AWE (1.23 ± 0.60 µg m−3), AWNW (0.36 ± 0.32 µg m−3), and AWAtlantic (0.23 ± 0.12 µg m−3). For all air masses during summer, diurnal cycles of MrBC exhibited low concentrations during the daytime and higher concentrations at night. This diurnal cycle is mainly related to planetary boundary layer development. Besides, the traffic emissions during rush hours from Bundesstrasse B87, located approximately 1 km north of the station, may also contribute to the peak concentration. In winter, AWE displayed the most evident concentration peak at around 20:00, while the peak of the other air masses was observed around 18:00. Similar diurnal variations in both seasons have been reported in other studies in Germany, for example, Sun et al. (2019) and Atabakhsh et al. (2023).
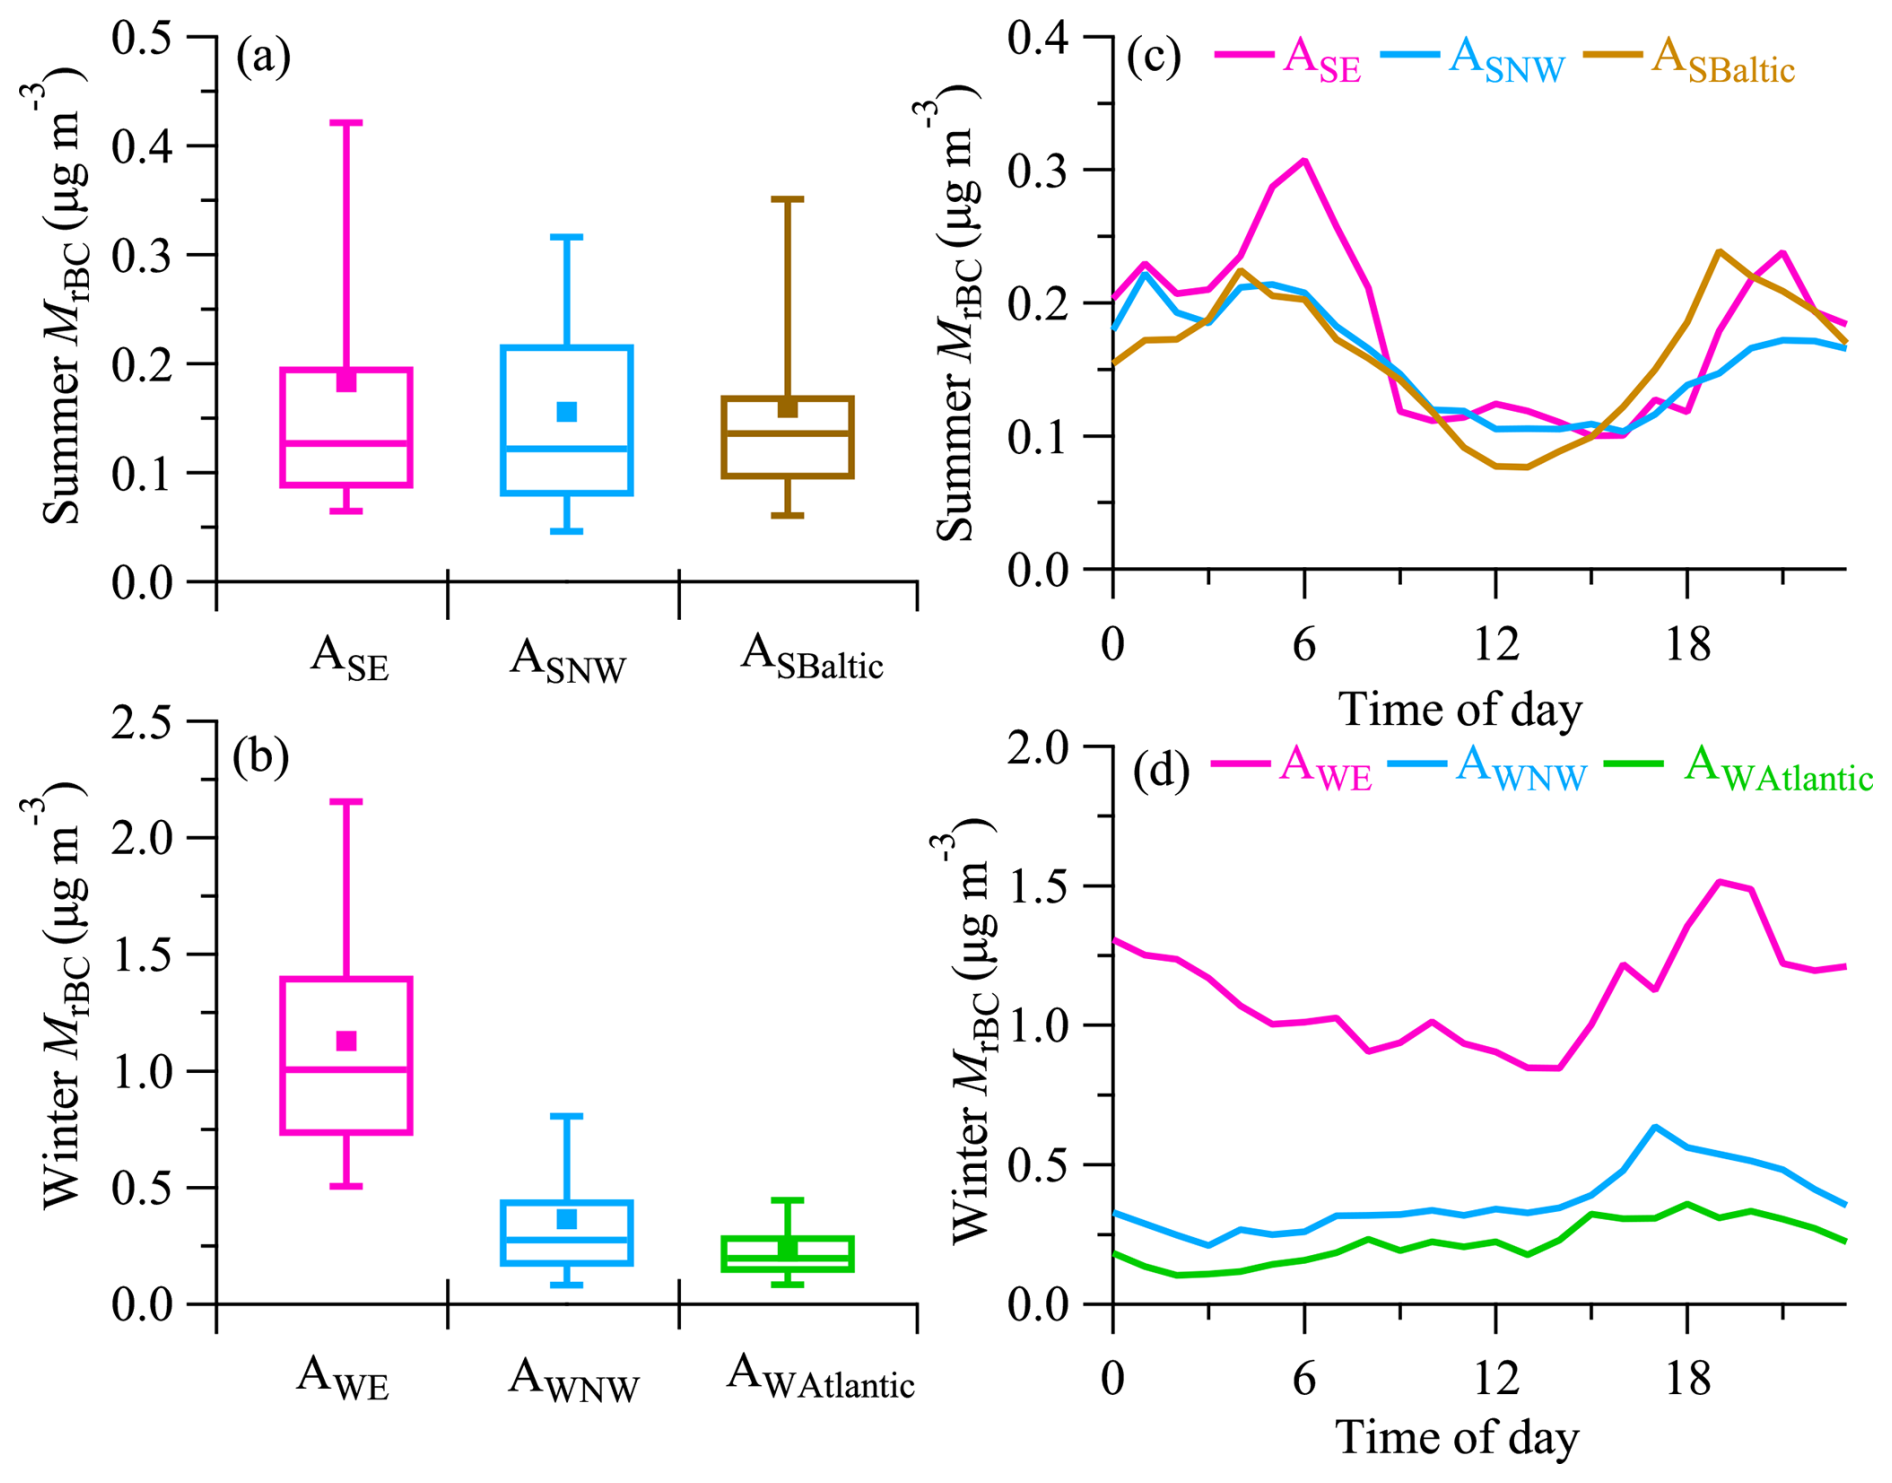
Figure 5Statistical analysis and diurnal variation of rBC mass concentration for each air mass in winter and summer. The upper and lower edges of the box denote the 25 % and 75 % percentiles, respectively. The middle line and square markers indicate the median and average values, with error bars indicating the 10 % and 90 % percentiles.
The rBC mass size distributions for summer, shown in Fig. 6, with an MMD of ASE (164 nm) and ASNW (140 nm), are consistent with the rBC size ranges from 135 to 167 nm, derived from mixing sources of solid fuel (wood and coal burning) and liquid fuel (traffic emission) by Liu et al. (2014). According to van Pinxteren et al. (2024), 40 % of the continuously running central heating systems in Melpitz village are fueled by solid fuel (wood and coal) and 46 % by liquid fuel (oil and liquid petroleum gas), which was considered as representative of the domestic heating system for the region. Furthermore, Atabakhsh et al. (2023) found biomass-burning organic aerosol (BBOA) to have a relatively good correlation with BC. BBOA in summer was linked to water heating systems using wood briquettes and logs, recreational open fires, or barbecue activities at Melpitz (van Pinxteren et al., 2020). The traffic emission from nearby roads and the city of Torgau (with approx. 20 000 inhabitants, in the northeast direction at a 7 km distance) could be one of the potential emission sources of rBC as well. In addition, as shown in Fig. S5, a higher fraction of ASNW trajectory traces originated from high altitudes and arrived at Melpitz at lower latitudes. This suggests that the smaller MMD of ASNW may be related to relevant cloud processing during transport and could remove particles containing larger rBC cores (Moteki et al., 2012; Che et al., 2022). The largest MMD (176 nm) in summer was observed during ASBaltic, which may be associated with most of the trajectory traces traveling at low altitudes (Fig. S5). Certain air masses originating from the Baltic region and passing through Poland may transport aerosols from coal combustion (Atabakhsh et al., 2023). These emission sources are known to contain rBC of large sizes (Liu et al., 2014; Zhang et al., 2020).
Figure 6Mass size distribution of rBC for each air mass in (a) summer and (b) winter. The circles show measurements, and the solid line represents the lognormal fit.
In winter, AWE demonstrated a distinctly larger MMD (216 nm) compared to AWNW (187 nm) and AWAtlantic (185 nm), respectively. Similar MMDs of rBC were observed in Brazil biomass-burning plumes ranging from 180 to 226 nm (Holanda et al., 2023). Zhang et al. (2020) showed that rBC from residential firewood (MMD of 273 nm) is much larger than that from diesel vehicle emissions (MMD of 155 nm). Liu et al. (2014) also observed that rBC from residential solid fuel burning for space heating purposes (such as coal or wood burning) is larger than traffic-emitting rBC. In addition, van Pinxteren et al. (2024) observed that the fraction of biomass and coal combustion emissions at Melpitz was highest during winter. Similarly, Atabakhsh et al. (2023) also found that 85 % of BC at Melpitz is emitted through biomass and coal combustion during winter. Therefore, residential heating could be an important emission source correlated to the large rBC core at Melpitz during this season. The lowest temperature (−2.14 ± 3.34 °C) during AWE (Fig. S6) could contribute to the largest MMD, as the decrease in ambient temperature would increase the proportion of rBC emitted from residential heating sources, as well as increasing the size of the rBC. The relatively high wind speed, with a high concentration of large rBC particles, can be found in Fig. 4, which suggests transportation from the Czech Republic and Poland. This observation corresponds with the findings of Atabakhsh et al. (2023), who found that high concentrations of coal combustion organic aerosol (CCOA) and BBOA were transported from the eastern direction during winter, which were strongly correlated with BC.
3.3 Mixing state of rBC-containing particles
Most rBC particles larger than 80 nm observed in this study were coated, with significantly varying CT for different conditions. However, as noted in Sect. 2.2.1, negative CT was observed for some particles. In the ambient sample, the mass fraction of rBC with negative coating accounts for only 14 % of all measured rBC particles in summer and 19 % in winter. This ratio increased up to 24 % and 30 % for the TD sample. The increasing ratio of rBC with negative coating is associated with the removal of volatile coating in the denuder process. In this section, we focus on the mixing state of rBC in the ambient sample. The analysis of the TD sample will be presented in the next section.
3.3.1 Size-resolved coating thickness
Figure 7 shows the size-resolved CT of rBC during summer and winter. The color indicates the total volume of rBC-containing particles of each grid point with
where Dp is the diameter of the rBC-containing particle, N is the total number of rBC particles, and i and j represent the ith bin of core diameter (x axis) and the jth bin of CT (y axis), respectively.
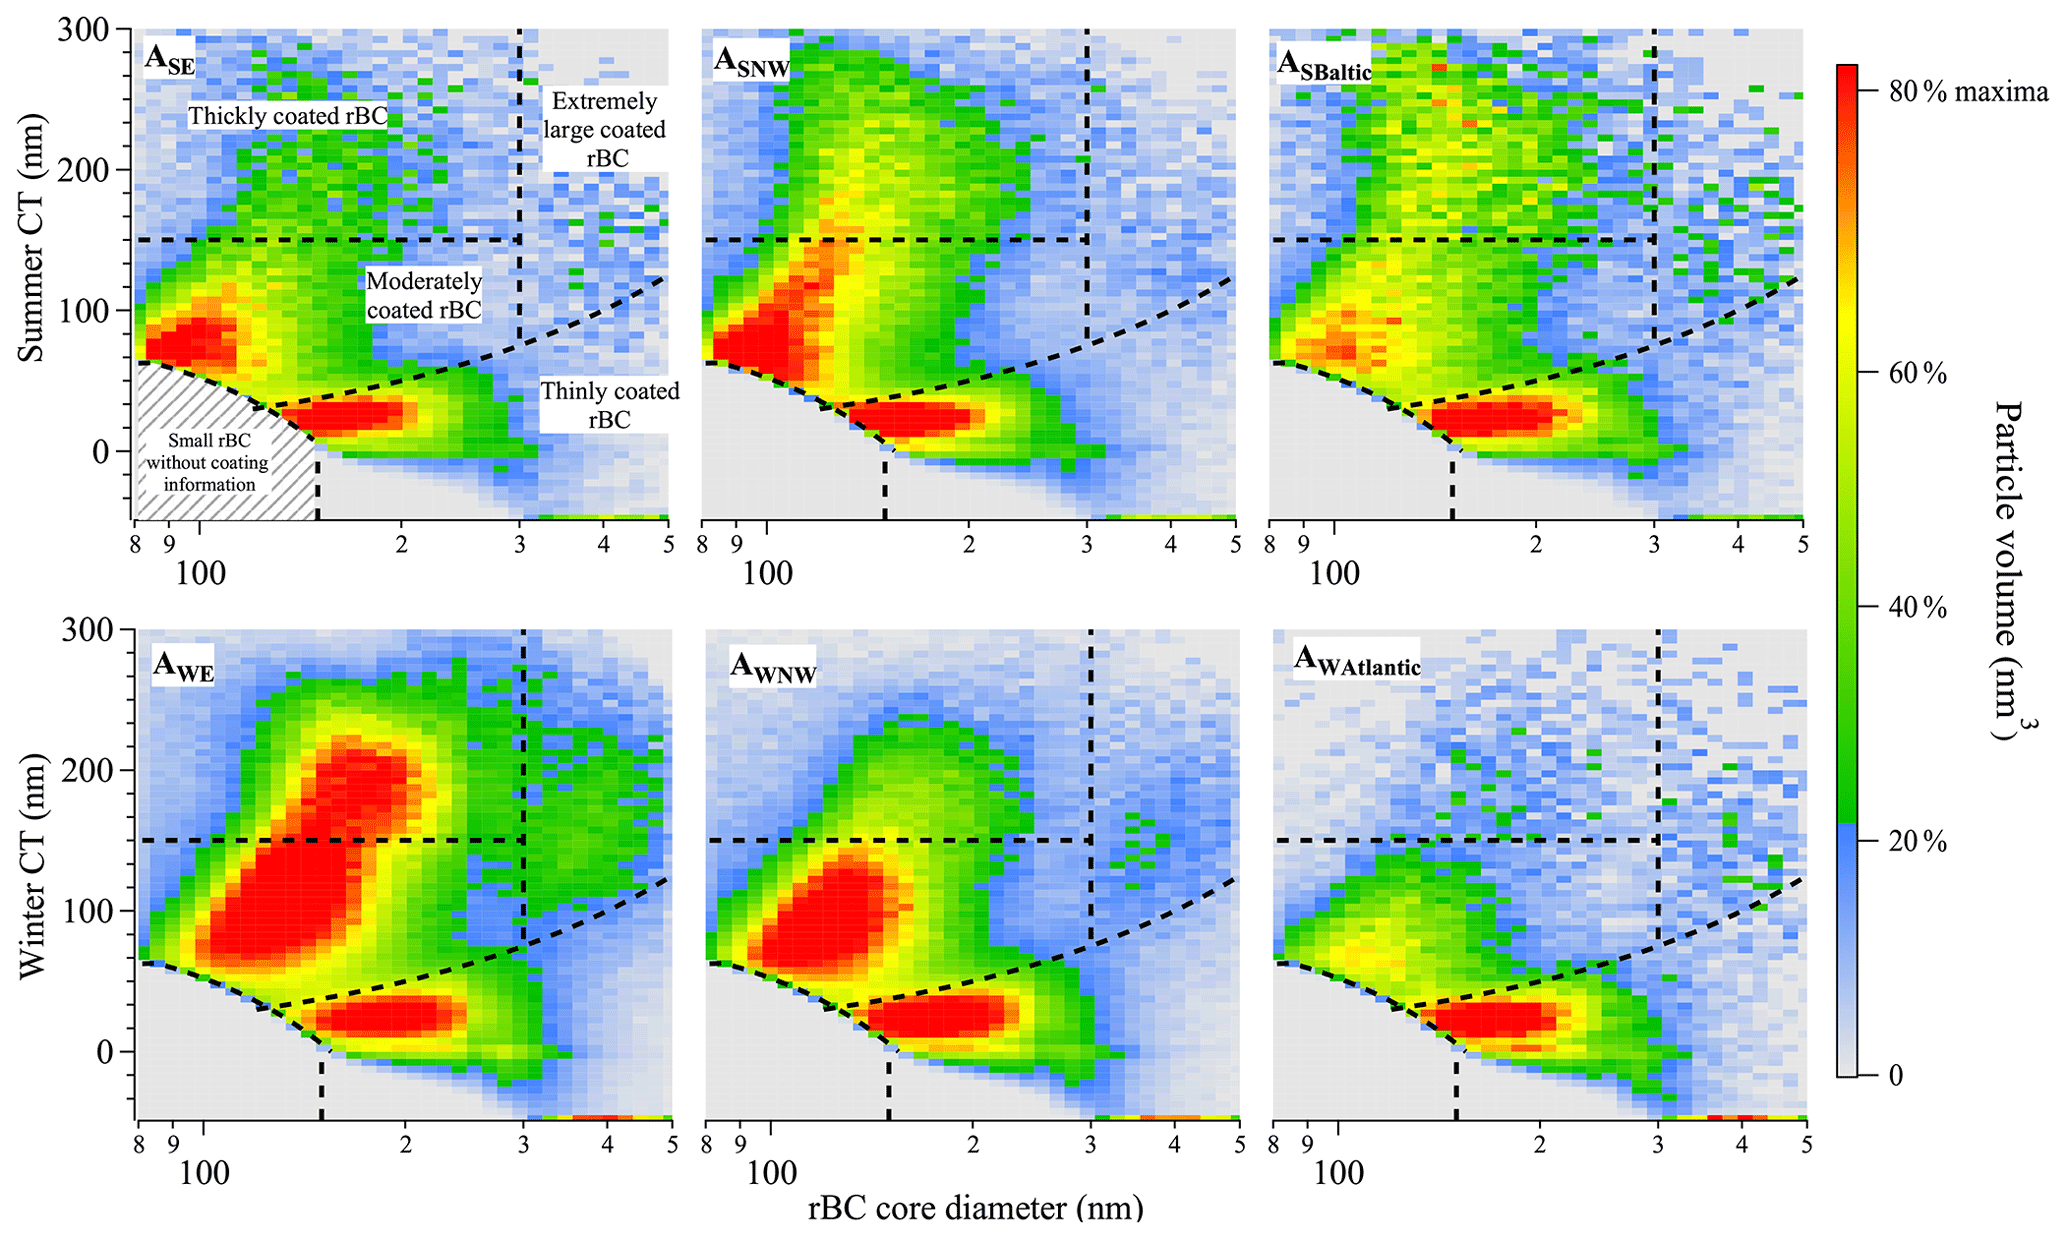
Figure 7Coating thickness as a function of rBC core size for each air mass of the ambient sample in summer and winter. Each plot is colored by the rBC-containing particle volume. (Note that the color scale changes between the subplots. The color scale was set to be red when the volume is above 80 % of the maxima for each air mass.) The dashed vertical lines (x=150 and x=300) correspond to selected rBC core diameter thresholds. The dashed horizontal lines (y=150, y=0.25x, and ) represent coating thickness classification boundaries.
Different types of rBC were categorized based on their core size and CT. The area labeled “Small rBC without coating information (rBCsmall)”, as shown in the bottom-left slashed region of each panel of Fig. 7, indicates rBC particles that exhibited neither a positive CT nor a negative CT. Moreover, in both seasons, two distinct regions associated with a high volume of coated rBC (highlighted in red) are evident in all air masses except AWAtlantic. The bottom-right region consists of rBC with a relatively thin coating thickness, where the relative coating thickness (, dashed line y=0.25x in the plot) is smaller than 1.5, defined as “Thinly coated rBC” (rBCthin). In the upper red region, where the rBC particles contain thicker coatings, “Moderately coated rBC” (rBCmoderate) refers to the particles with CT less than 150 nm, while the “Thickly coated rBC” (rBCthick)' denotes those with a CT greater than 150 nm. For rBC cores larger than 300 nm, most particles exhibited negative or thin coatings (rBCthin), although some were observed with relatively thick coatings. These thickly coated particles were classified as “Extremely large coated rBC” (rBCex-large).
The rBCsmall is mainly due to the detection limit of the SP2 scattering detector. The detector can only discern the scattering signal from rBC-containing particles when the diameter of the rBC core is considerably large or when the coating on the rBC is thick enough. This detection limitation hinders the ability to derive coating information from scattering light for smaller rBC particles. Consequently, the mixing state of a large fraction of small rBC remains unaccounted for. As shown in Fig. 8, the core mass fraction of rBCsmall during summer (25 %–33 %) is higher compared to winter (14 %–24 %). This observation is associated with the size distribution shifted towards smaller sizes of the rBC core during summer. The missing CT information of rBCsmall would bias the average CT calculation. In the case of coated rBC smaller than 150 nm, only the relatively thick coating was counted; therefore average CT would be overestimated due to the thin coating values being missing. Ko et al. (2020) also discussed the bias of average CT induced by the scattering detection.
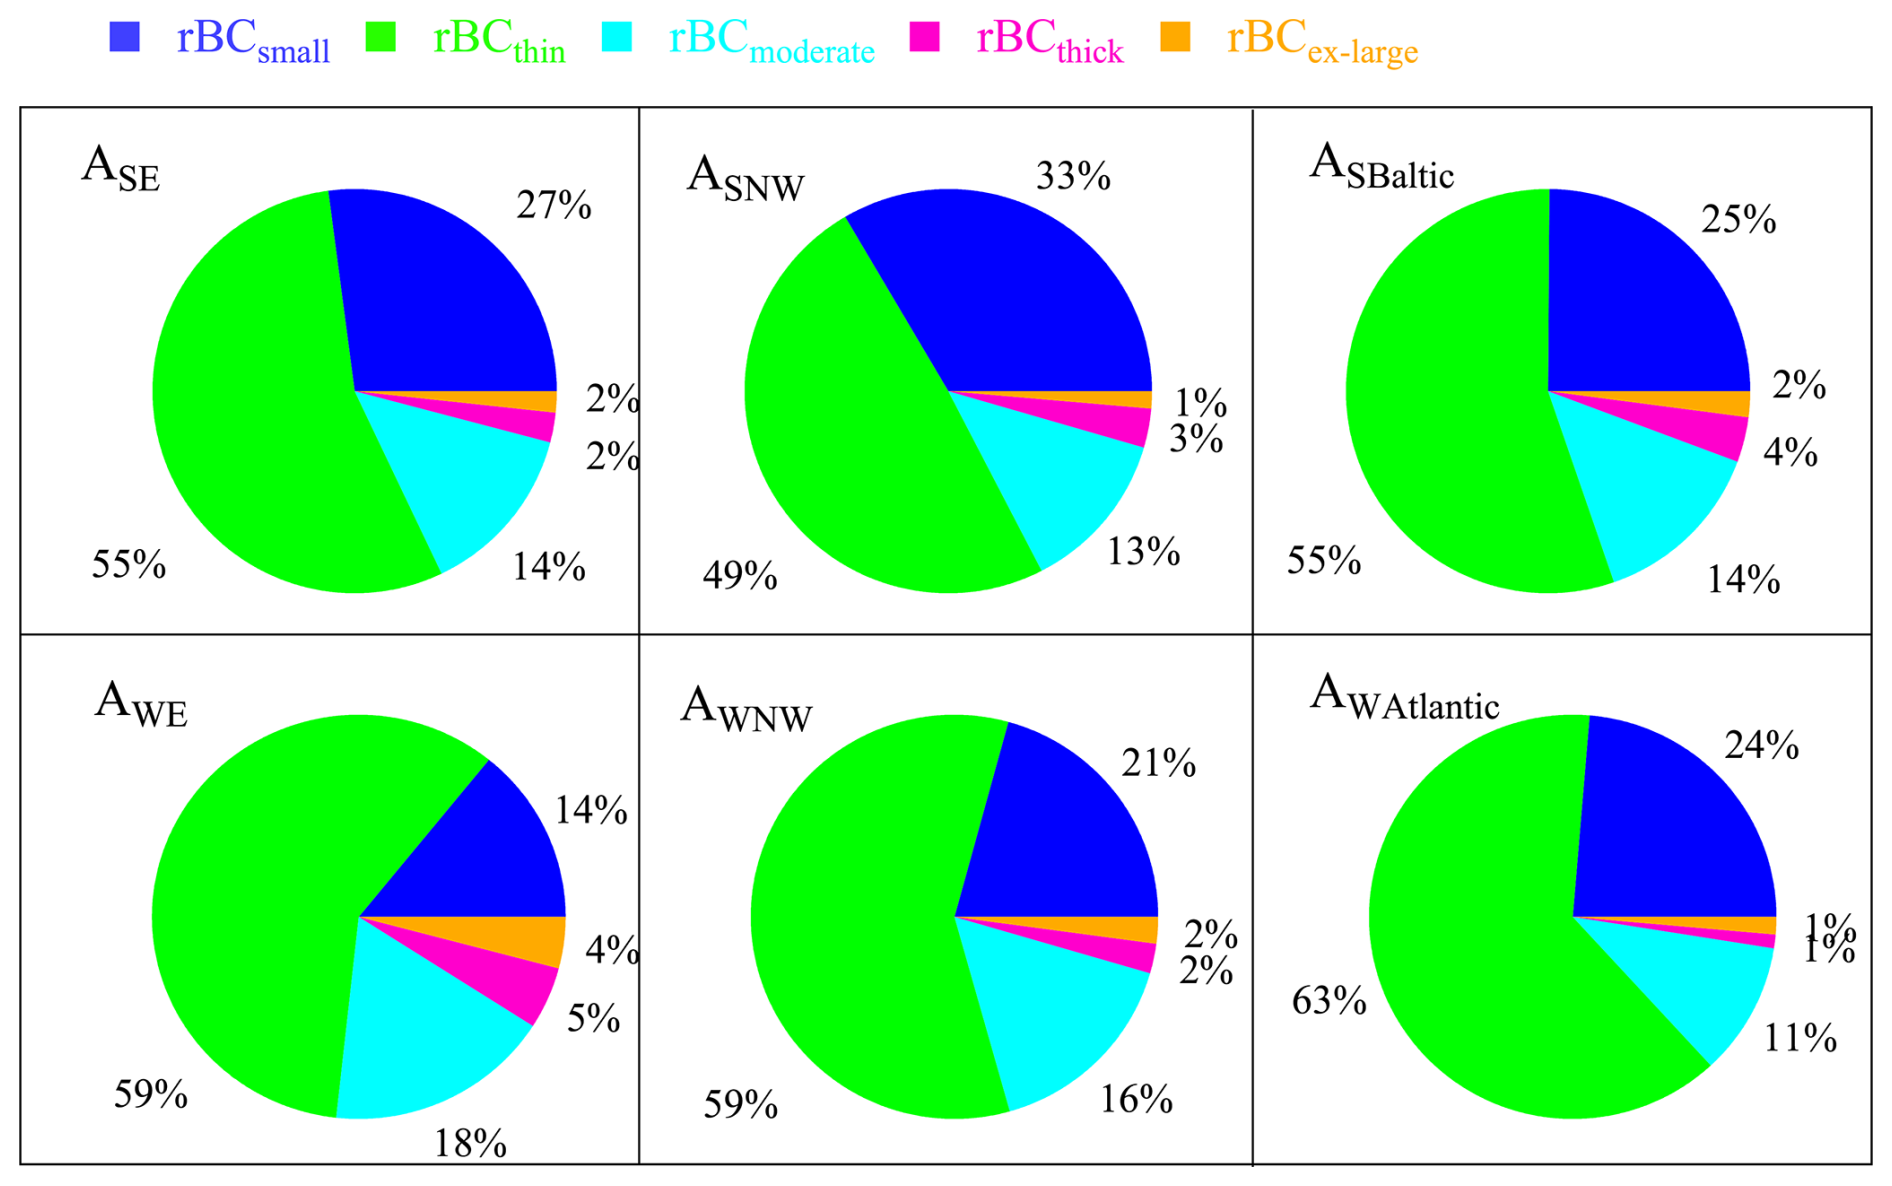
Figure 8The rBC core mass fraction of different types of rBC of different air masses in Fig. 7.
The rBCthin may be associated with the liquid fuel combustion according to similar patterns of size-resolved coating thickness of rBC, quantified by different quantities (scattering enhancement, particle numbers) in some other studies (Liu et al., 2014, 2019; Brooks et al., 2019; Zhang et al., 2020). Laborde et al. (2013) also observed that the rBC from traffic emissions exhibits very thin coatings (<30 nm) and a high fraction of LEO-fit-derived negative coating compared to biomass-burning emissions. The liquid fuel combustion is associated with the central heating system (house warming and water heating) of Melpitz and with traffic emissions (Atabakhsh et al., 2023; Van Pinxteren et al., 2024). As shown in Fig. 8, rBCthin accounts for the highest mass fraction for all air masses in both seasons, which implies that liquid fuel combustion is one of the primary emission sources of rBC at Melpitz.
rBCmoderate, rBCthick, and rBCex-large can be linked to the aged rBC or other emission sources such as biomass burning and coal combustion (Liu et al., 2014; Zhang et al., 2020). The core mass fractions of rBCmoderate during summer (13 %–14 %) were slightly lower than AWE (18 %) and AWNW (16 %) during winter. However, the core mass fraction of rBCmoderate during summer correlated to the small size distribution of rBC, as some of the coated rBC is under the detection limit of SP2, resulting in the higher core mass fraction of rBCsmall and the reduction in the core mass fraction of rBCmoderate. As for the rBCthick region, a higher volume of rBC with thicker CT can be observed in ASNW and ASBaltic compared to ASE. During winter, the high volume of rBCthick is exclusively observed in AWE, with the highest core mass fraction of rBCthick (5 %) and rBCex-large (4 %). These observations correlate with the lowest temperature of −2.14 ± 3.34 °C (Fig. S6) and possibly increased residential heating emissions. In contrast, only the high volume of rBCthin was observed in AWAtlantic, associated with the highest temperature of 8.50 ± 4.00 °C and fewer heating emissions.
The size-resolved CT revealed the bias in average CT caused by the detection limit of SP2, offering a more direct observation of the mixing state of rBC compared to average CT. For example, in summer, a high volume of rBCmoderate was observed only at smaller rBC core sizes (below approximately 150 nm). For rBC core sizes larger than 150 nm, thick coatings were observed less, particularly in ASE. In winter, however, a high volume of rBC containing thick coatings (greater than 150 nm) was observed for core sizes between approximately 120 and 220 nm in AWE. This distribution of non-BC material across the BC-containing particle population of different core sizes could be referred to as mixing state heterogeneity, as reported in some studies (Zhao et al., 2019; Zhai et al., 2022). Such heterogeneity plays an important role in investigating the absorption enhancement of coated rBC (Fierce et al., 2016; Fierce et al., 2020; Zeng et al., 2024). Moreover, size-resolved CT could also provide insights into the source apportionment of rBC, which requires further investigation.
3.3.2 Diurnal variation of size-resolved coating thickness
Figure 9 displays the diurnal variation of size-resolved coating thickness of the overall data in both seasons. The different masses exhibited similar diurnal patterns within each season, as shown in Fig. S7. During summer, a high volume (red) of rBCthin can be observed for most of the day. This observation is associated with the liquid fuel combustion of the continuously running heating system of the village of Melpitz (van Pinxteren et al., 2024). Throughout the daytime, from 09:00 to 18:00, a continuous increase in particle volume in the rBCmoderate and rBCthick region is observed, with the highest total mass fraction of rBCmoderate and rBCthick reaching a maximum of ∼22 % between 12:00 and 15:00. This observed transition to the thicker coating region can be regarded as evidence of coating growth of rBC-containing particles, implying a significant role of photochemical reactions in the aging process of rBC, which has been reported in other studies (Liu et al., 2014; Yang et al., 2019). Later in the evening rush hours, after 18:00, an increase in the volume of rBCthin regions and in the core mass fraction of rBCthin were observed. This is inconsistent with the mass concentration peak of rBC shown in Fig. 5, which correlated to the traffic emissions.
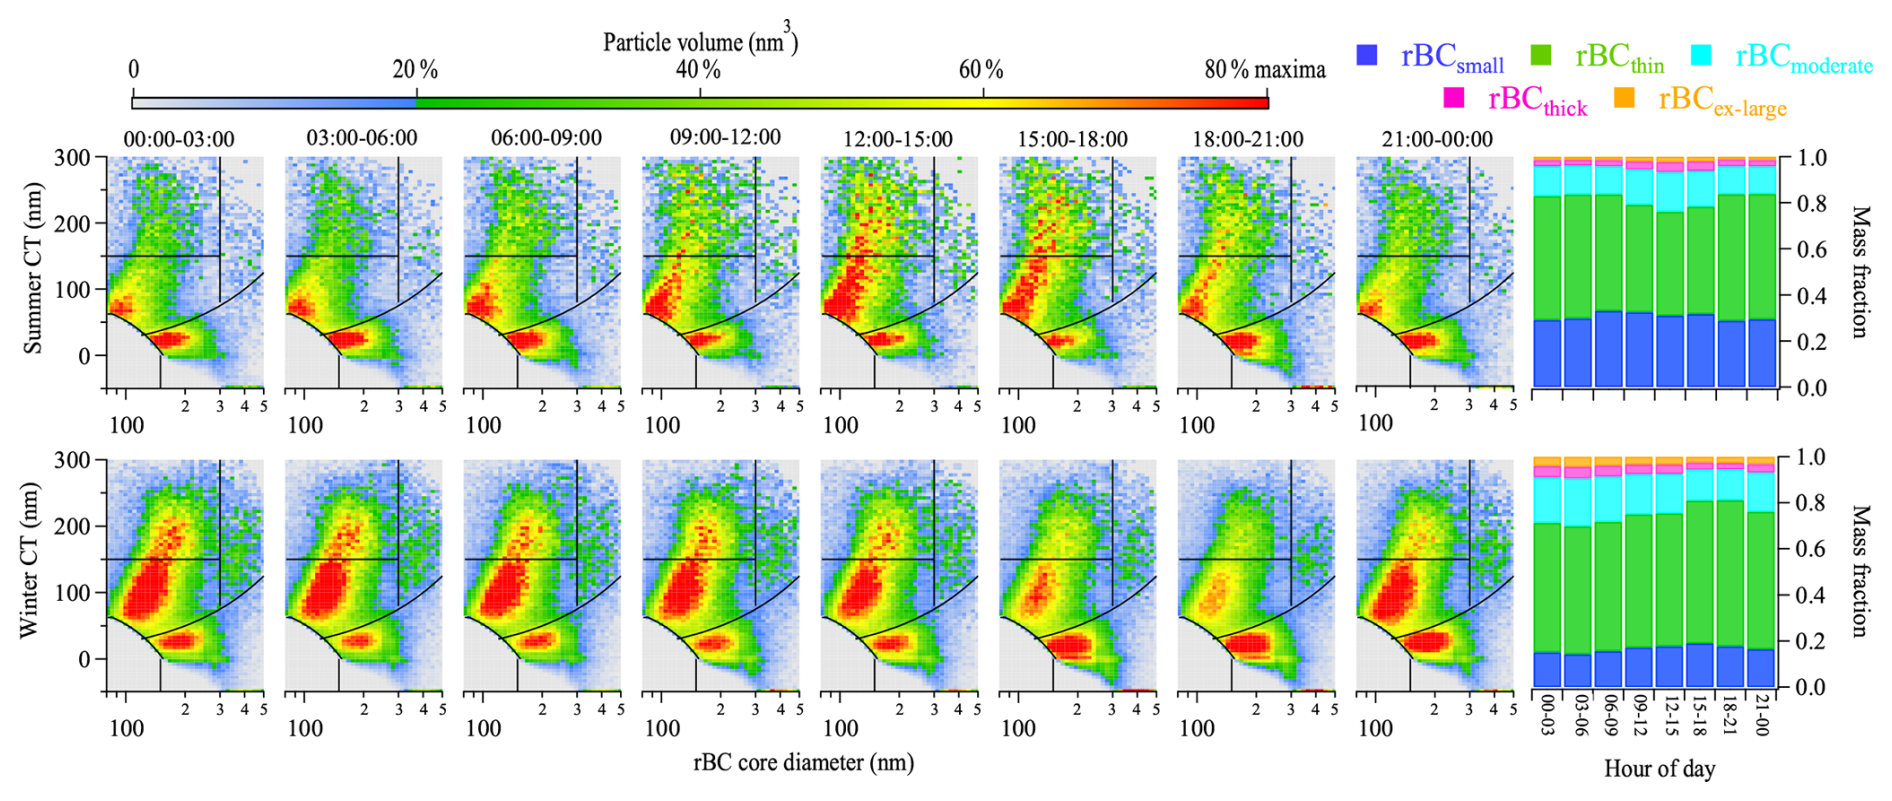
Figure 9Diurnal variation of size-resolved coating thickness and mass fraction of each type of rBC in the ambient sample. The panels for each season, from left to right, represent time intervals of 00:00–03:00, 03:00–06:00, 06:00–09:00, 09:00–12:00, 12:00–15:00, 15:00–18:00, 18:00–21:00, and 21:00–00:00. The color scale represents the total particle volume, with red set at 80 % of the maximum value.
The temperature can be considered a crucial factor influencing the mixing state of rBC at Melpitz in winter, giving the impact on the residential heating emissions. In contrast to summer, the high volumes of rBCmoderate and rBCthick were observed throughout the day during winter, except between 15:00 and 21:00, when their core mass fraction decreased to a minimum of 16 %. This reduction correlated to the reduced residential emissions due to the higher temperature in the daytime and the increased traffic-related rBCthin during rush hour. Between 00:00 and 06:00, the relatively higher (maximum of 26 %) core mass fraction of rBCmoderate and rBCthick was observed, coinciding with the lowest temperatures of the day (Fig. S8), with increased residential heating emissions.
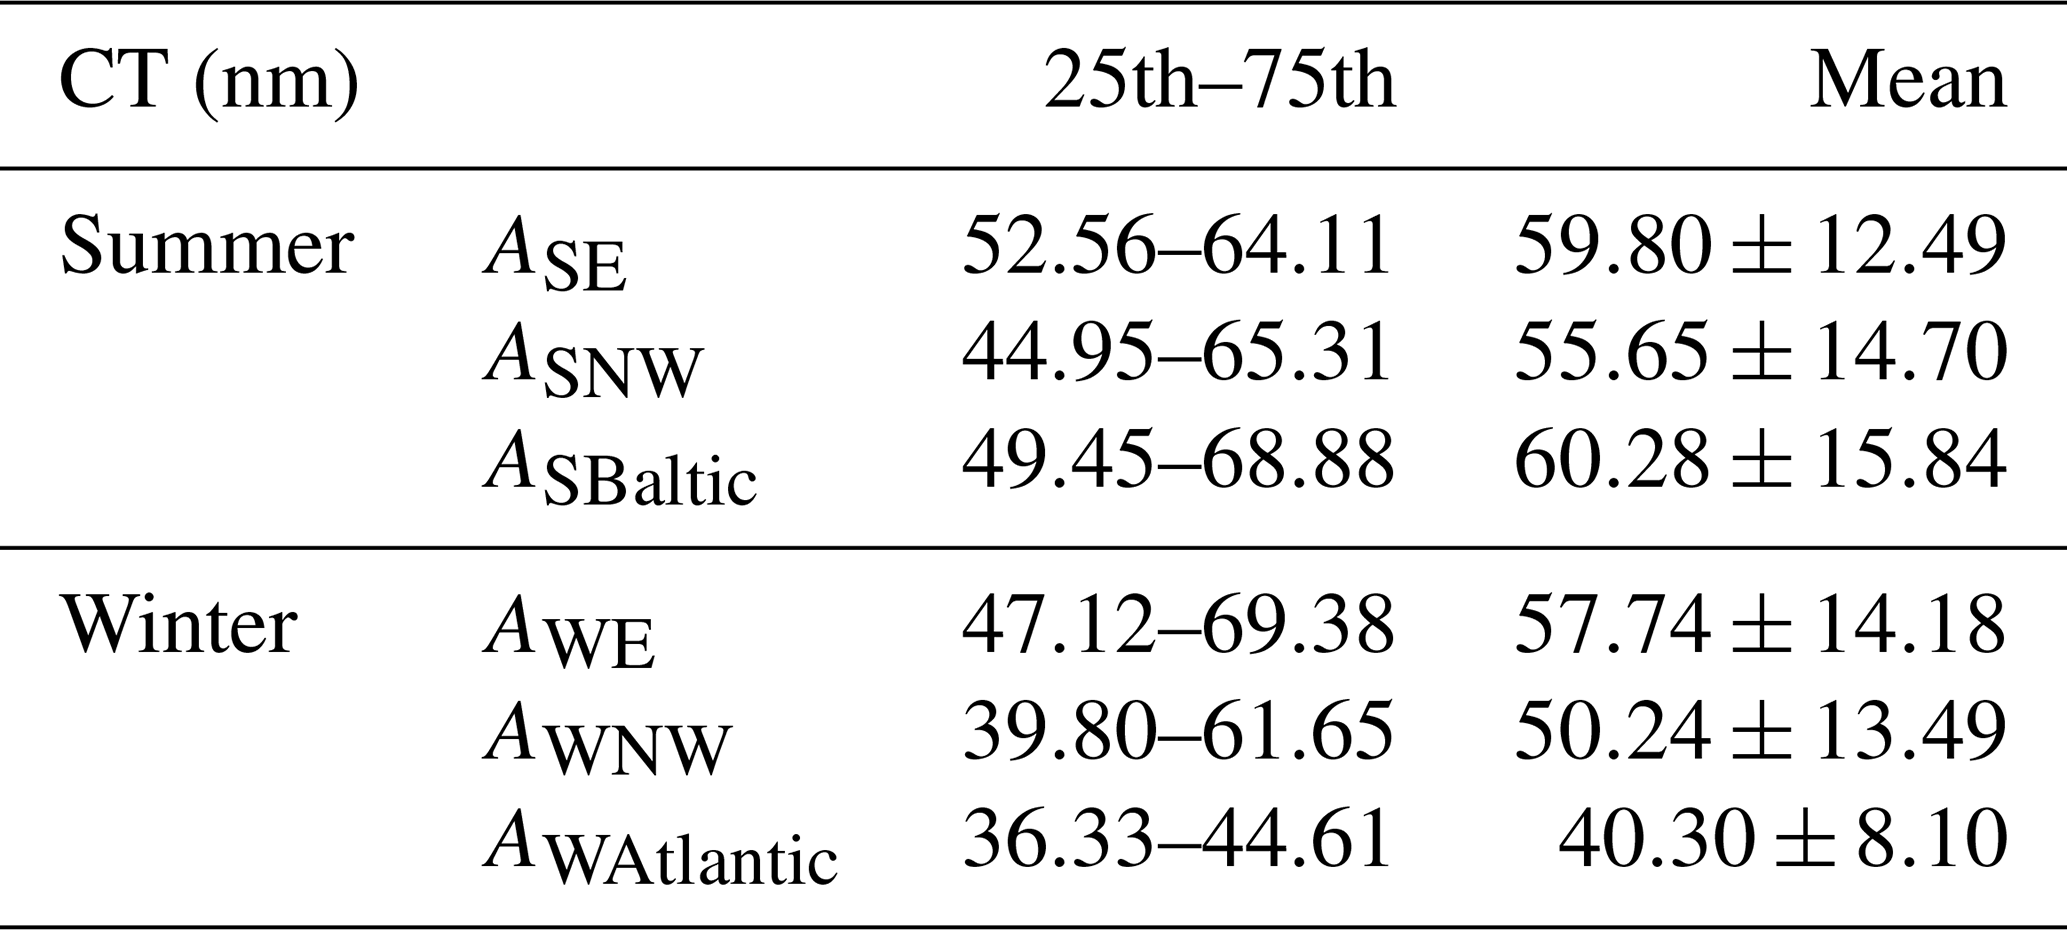
To better quantify the mixing state of bulk rBC populations, analysis of average CT (1 h time resolution) with the core size range selected between 80 and 500 nm is shown in Fig. 10 and Table 3. In summer, ASNW exhibited a smaller mean CT (55.65 ± 14.70 nm) compared to ASE and ASBaltic (approximately 60 nm). In winter, the average CT agreed with the observation of the size-resolved CT, and the highest average CT of 57.74 ± 14.18 nm was observed during AWE, whereas the smallest value was 40.30 ± 8.10 nm AWAtlantic. As shown in Fig. 10b, the peak of CT was found during the daytime in summer, whereas it occurred at night in winter. Specifically, in summer, the CT peak of ASE was observed in the afternoon, while the peak of ASBaltic was found in the morning. As for ASNW, a relatively stable high value was observed throughout the day. In contrast to summer, CT exhibited similar diurnal cycles among different air masses in winter. Therefore, average CT can effectively capture the varying tendency of the mixing state of rBC displayed in Fig. 9, although the absolute value was influenced by the absence of coating information for rBC below the detection limit.
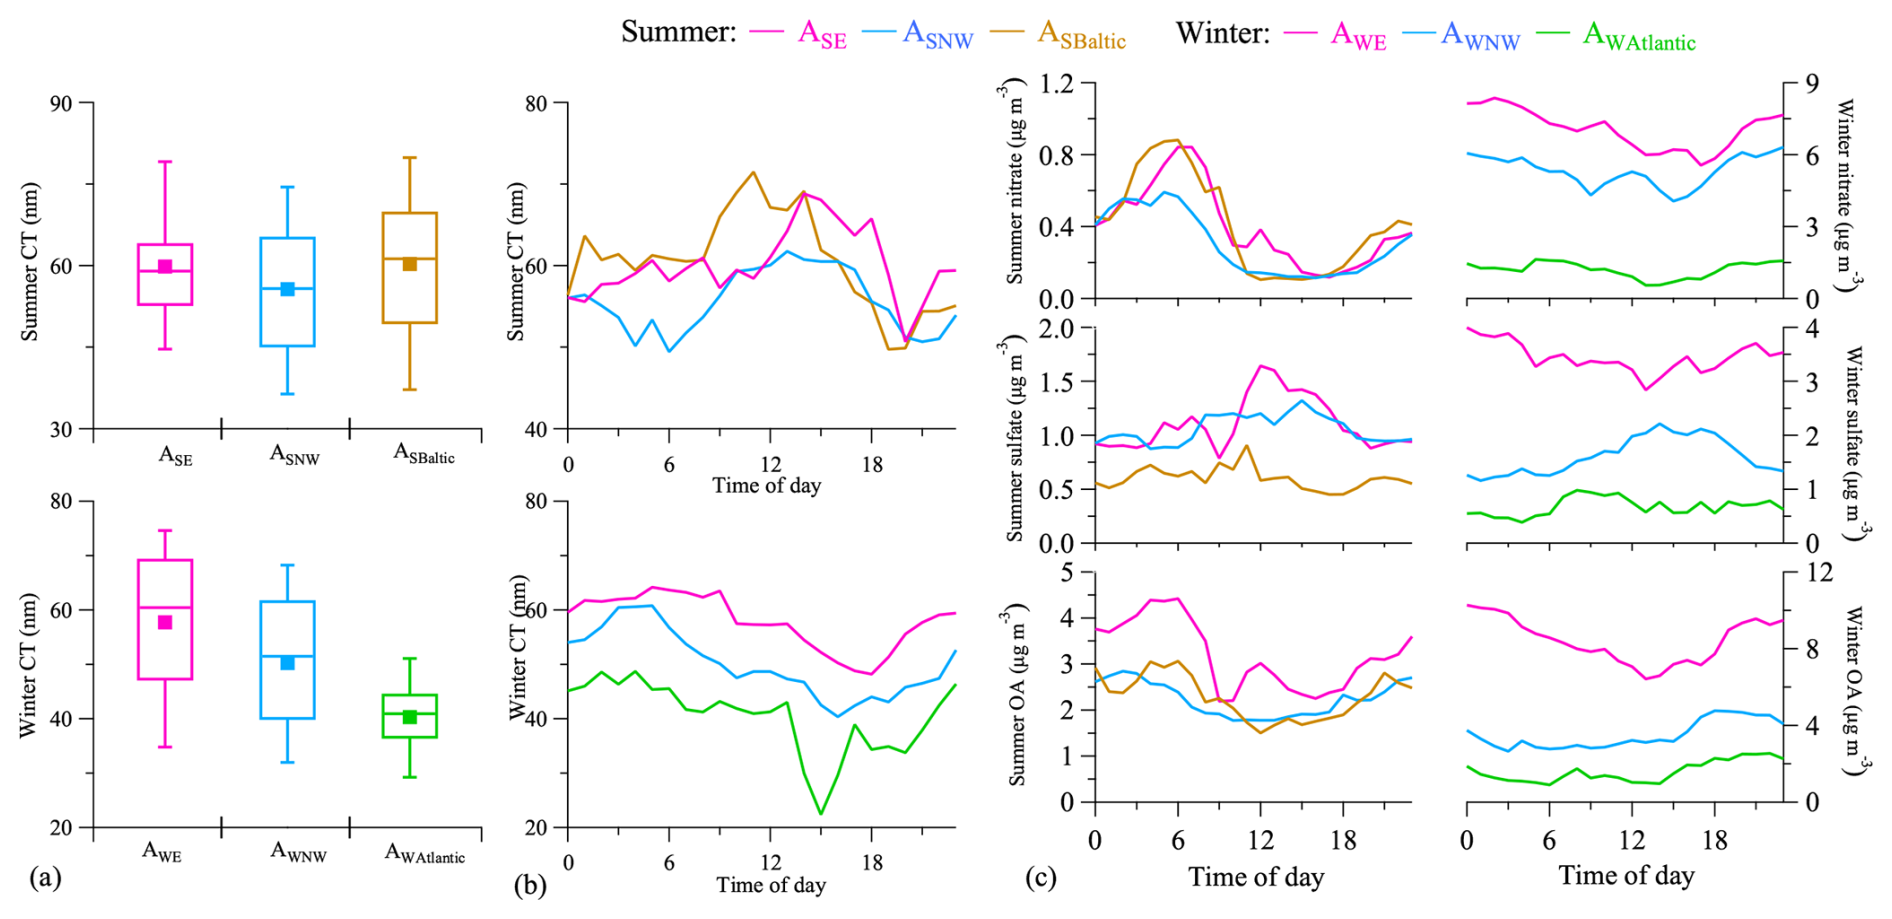
Figure 10(a) Statistical analysis and (b) diurnal variation of average CT of rBC in the ambient sample. (c) Diurnal variation of chemical composition mass concentration.
Table 325th percentile, 75th percentile, and mean values of CT in Fig. 9a.
The diurnal variations of sulfate, nitrate, and OA mass concentrations are shown in Fig. 10c. In summer, sulfate exhibited similar variations to CT. The sulfate mainly resulted from the condensation of H2SO4 produced by the gas-phase photo-oxidation of SO2 (Poulain et al., 2011; Zhang et al., 2015). On the one hand, the increasing H2SO4 could serve as an indicator of the photochemical processes in the atmosphere. On the other hand, in addition to organic materials, sulfate may have an impact on the coating of rBC at Melpitz. The contribution of the sulfate to rBC mixing state can also be found in other studies (Xu et al., 2018; Wang et al., 2021a). In addition, during winter, an increasing concentration of sulfate can be also observed during the daytime in AWNW and AWAtlantic, giving evidence of the aforementioned photochemical process in winter. This increasing mass concentration of sulfate is consistent with the observation of the slight increase in the mass fraction of rBCmoderate and rBCthick in Fig. S7. Furthermore, the impact of heterogeneous reactions on the mixing state of rBC should be noticed in winter, such as the formation of nitrate and OA at night (Pathak et al., 2009; Zhao et al., 2017). Besides, hygroscopic growth may also contribute to the coating process of rBC, as higher RH and aerosol hygroscopicity were observed at Melpitz in winter (Wang et al., 2022).
3.4 The coating volatility of rBC-containing particles
Analyzing the mixing state on the TD sample was performed to investigate the coating volatility of rBC. As shown in Fig. 11, the thickly coated rBC was rarely observed after passing through the thermodenuder, and the core mass fraction of rBCthick is less than or around 1 % for all air masses, as indicated in Fig. 12. This observation implied that the dominant components of thick coating are volatile. Due to the loss of volatile coating during the denuder process, some particles shrunk in size, falling under the detection limit, while some other particles either lacked or contained minimal LV coating. Consequently, compared to the ambient sample, the core mass fraction of rBCsmall increased in the TD sample. The majority of rBC-containing particles observed in Fig. 11 were rBCthin, and the mass fraction of rBCthin in the TD sample increased by 4–10 % compared to the ambient sample. During summer, the lowest fraction rBCthin (53 %) was observed in ASNW, related to the smaller size distribution. However, a relatively high volume (green color) of rBCmoderate can be observed in ASNW. During winter, AWE exhibited distinct size-resolved CT differing from AWE and AWAtlantic, with a relatively high volume observed in the rBCmoderate region, with a highest core mass fraction of 8 %.
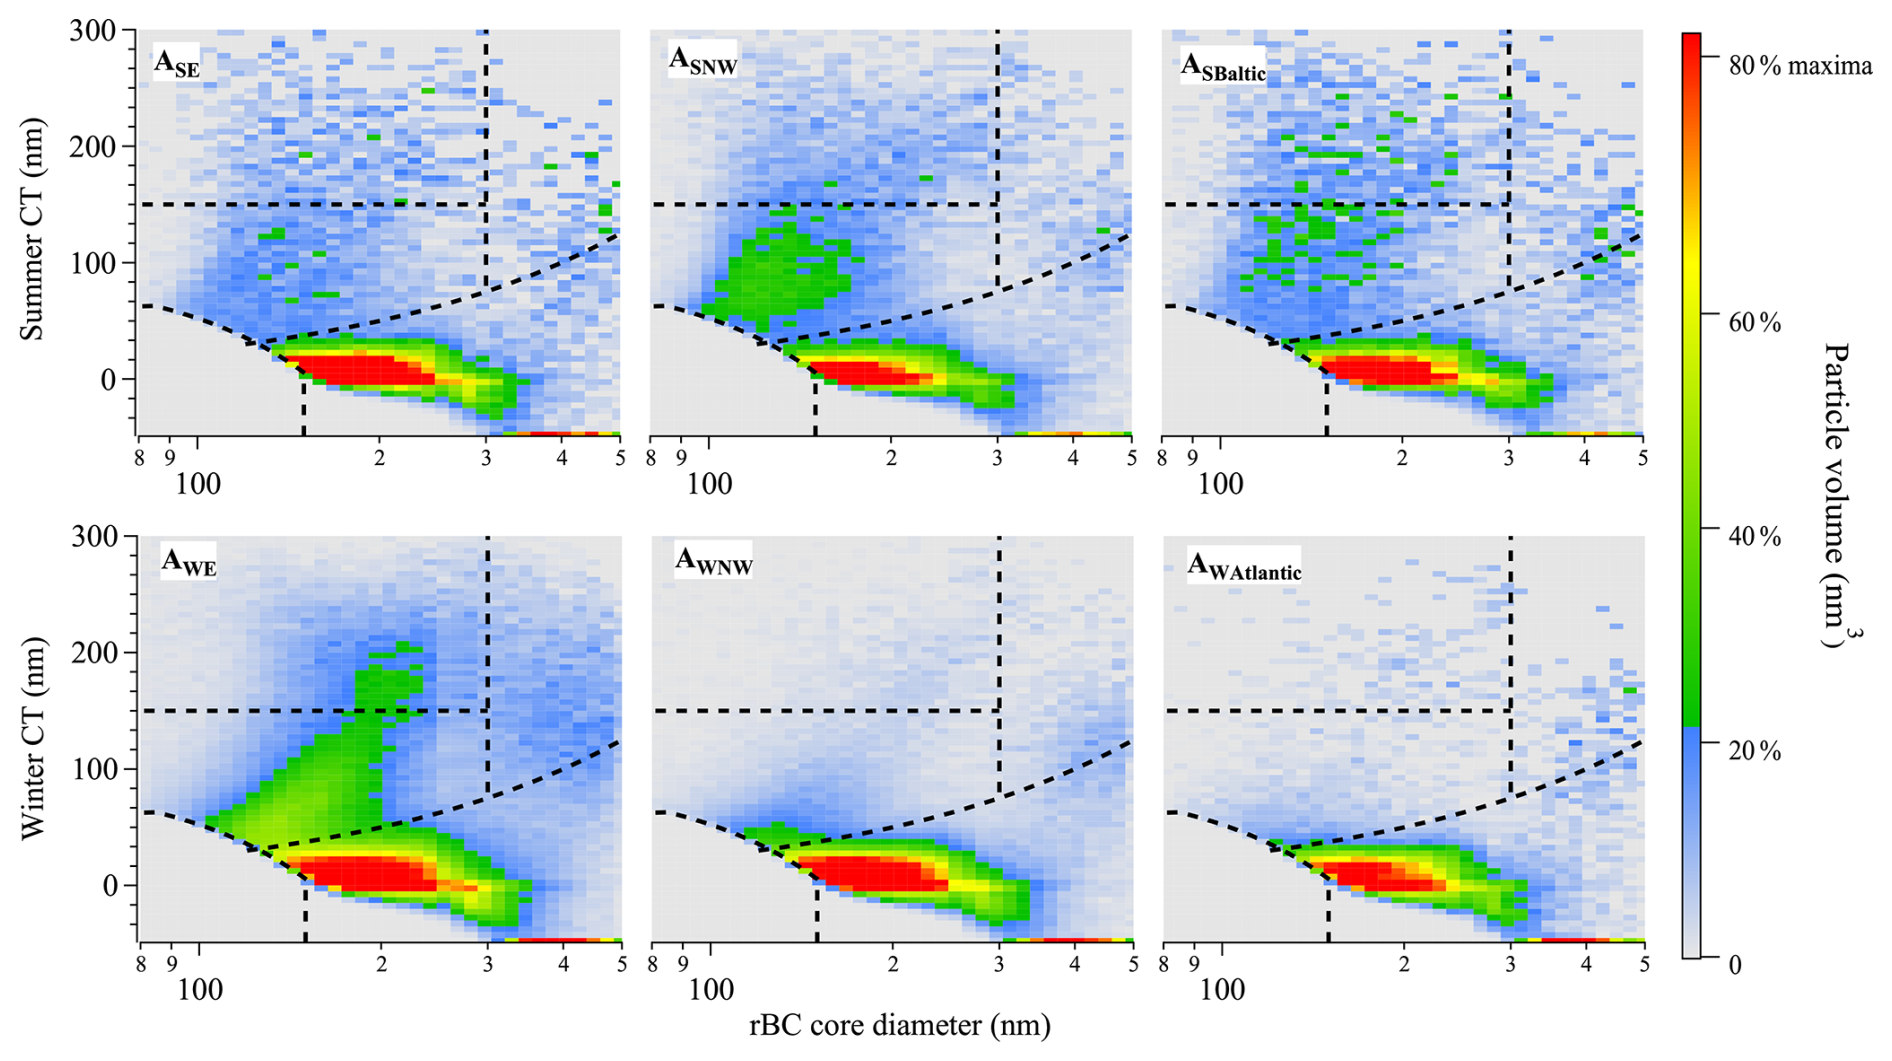
Figure 11Coating thickness as a function of rBC core size for each air mass of the TD sample in summer and winter. The color bars and dashed black lines are the same as for Fig. 7.
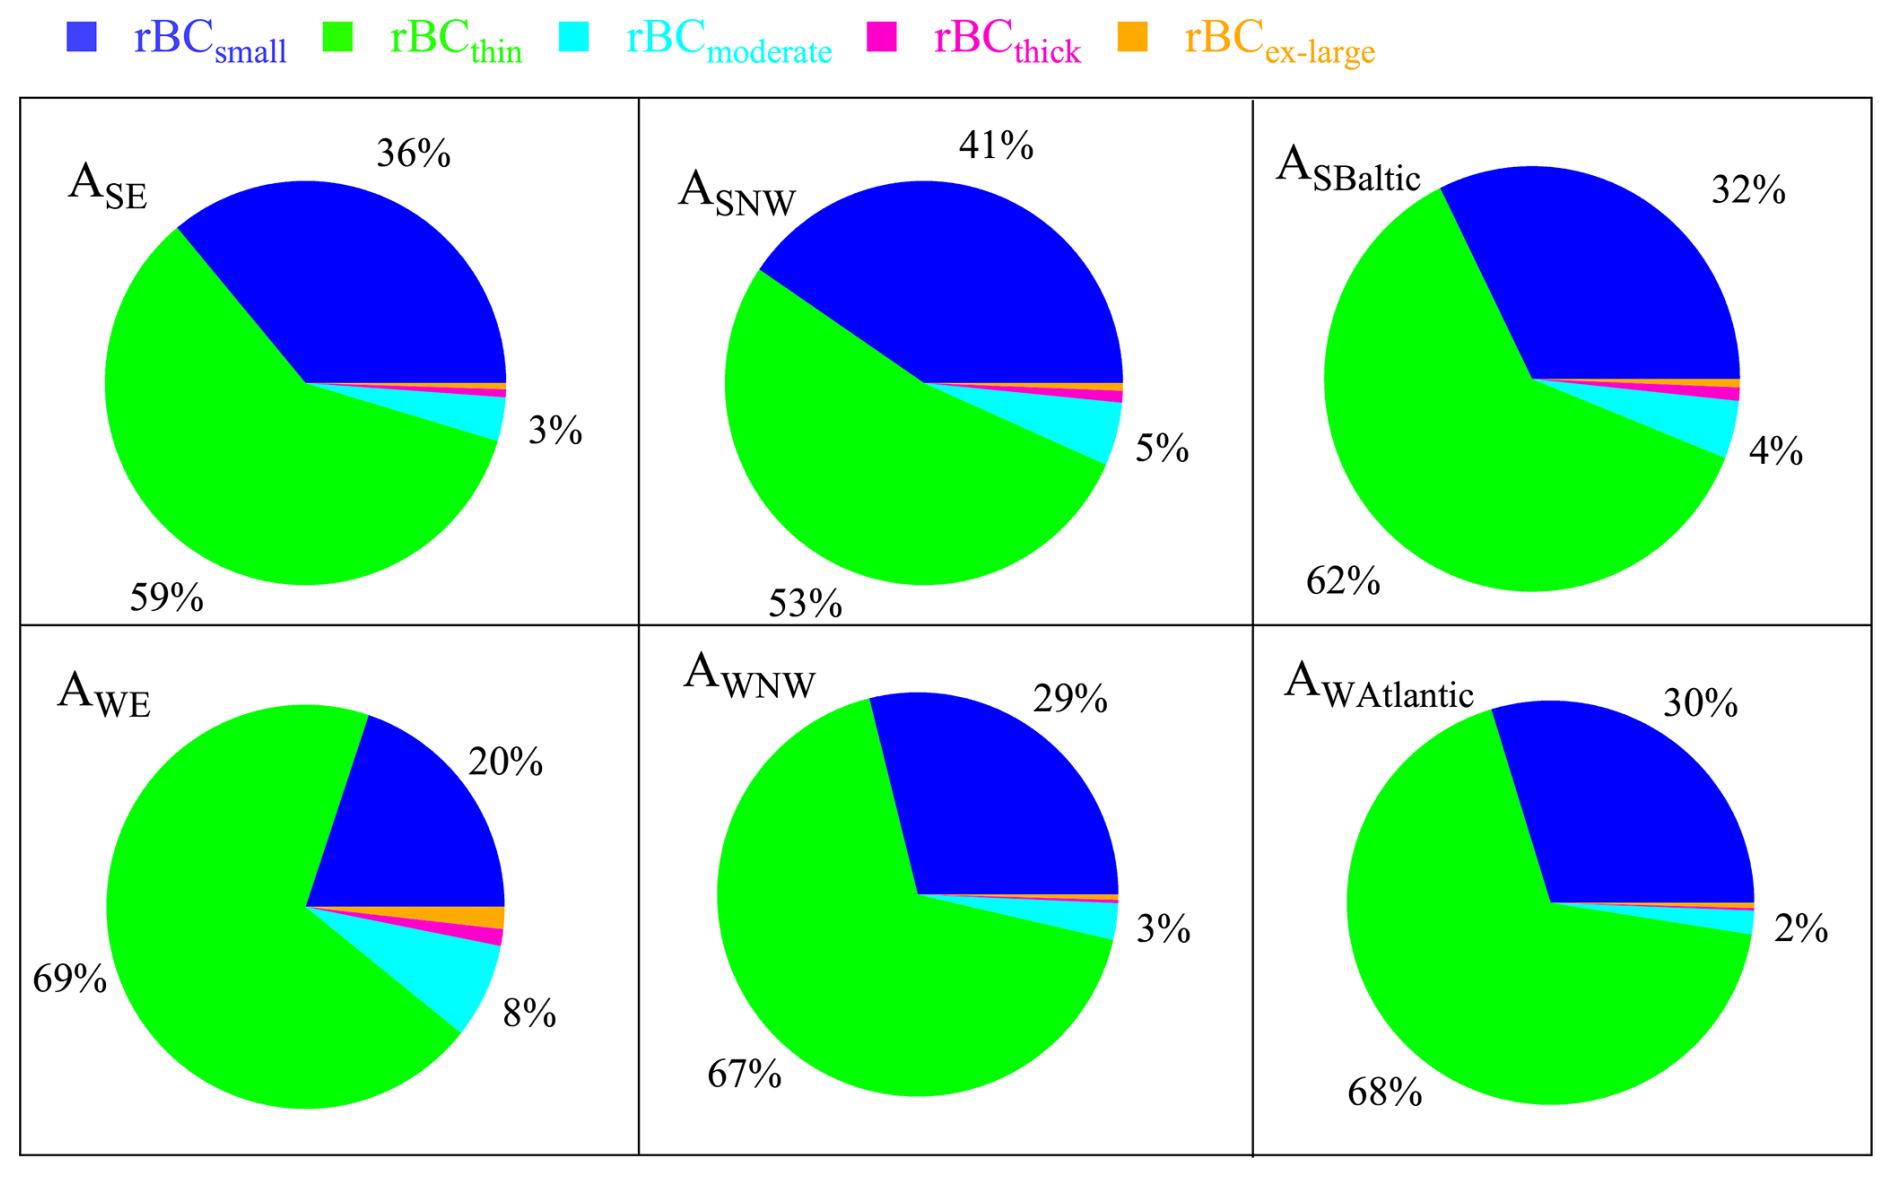
Figure 12The rBC core mass fraction of different types of rBC of different air masses in Fig. 10.
The mechanism of LV coating formation can be inferred from the diurnal variation of the mixing state of rBC-containing particles in the TD sample. In summer, photochemistry significantly influences the LV coating as well. As shown in Fig. 13, similar to the ambient sample, an increasing volume in the rBCmoderate and rBCthick region can be observed during the daytime in summer. The LV coating is primarily associated with the more oxygenated oxidized organic aerosol (MO-OOA), as it exhibited a similar diurnal variation pattern to that shown in Atabakhsh et al. (2023). Combined with more rBCmoderate observed in ASNW and ASBaltic, as shown in Figs. 12 and S9, it appears that a thick LV coating is more related to the aged rBC than the freshly emitted rBC. Furthermore, the diurnal pattern of mean CT of ASNW and ASBaltic exhibited similar variations to the size-resolved CT (Fig. S9), with peak values occurring at noon. However, in ASE, the consistent increase in CT during the daytime, particularly accelerating in the afternoon, implies the contribution of the stronger solar radiation to further growth in LV coating.
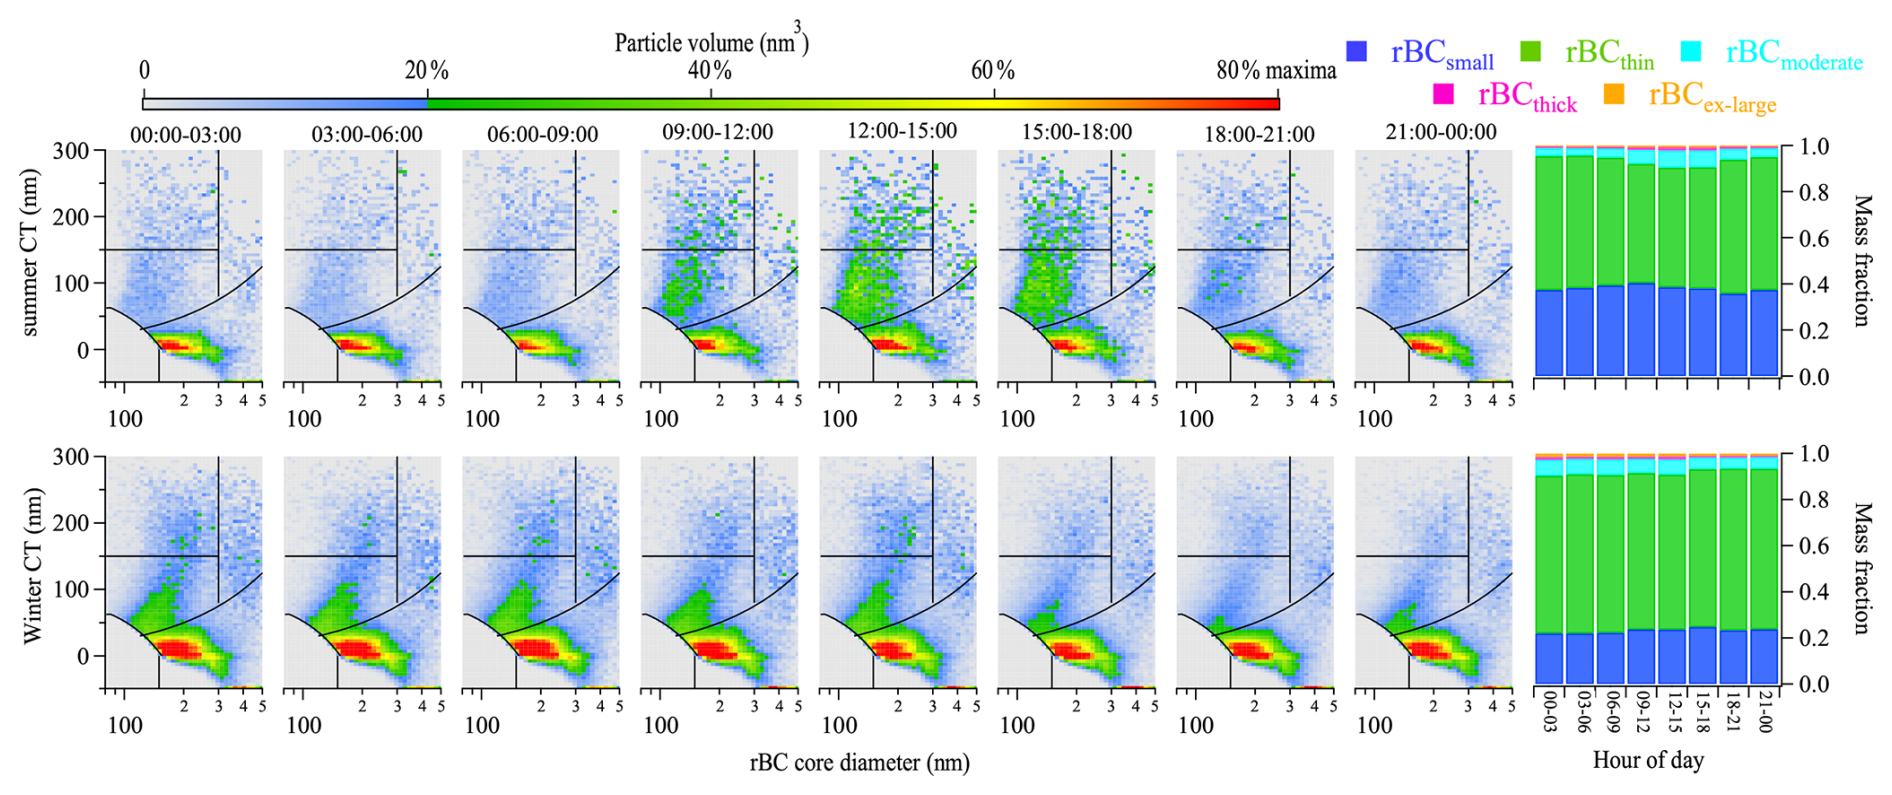
Figure 13Diurnal variation of size-resolved coating thickness and mass fraction of each type of rBC in the TD sample.
In contrast to summer, the size-resolved CT of rBC in the TD sample did not exhibit evident diurnal variations in winter. As shown in Fig. 13a, for AWE, only the decrease in volume within the rBCmoderate and rBCthick region can be observed during rush hours after 15:00. In addition, MO-OOA, associated with residential heating emissions, also exhibited similar variation, as described in Atabakhsh et al. (2023). Furthermore, the statistical properties of mean CT showed a decreasing trend from AWE to AWAtlantic, which is contrary to the temperature variation across the different air masses. In particular, as shown in Table 4, the mean CT (24.43 ± 10.27 nm) of ASE is significantly higher than that of AWNW (13.80 ± 6.42 nm) and AWAtlantic (13.12 ± 5.55 nm). The mean CT did not show an evident diurnal variation either. However, AWNW and AWAtlantic exhibited a slightly more pronounced decreasing trend from midnight to daytime compared to AWE, which may also be influenced by the ambient temperature of different air masses. In warm periods, heating is only required on cold nights, while in colder periods, biomass or coal is burned more continuously. These observations suggested that LV coating during winter is more related to the emission sources, particularly the residential heating, than the atmospheric process.
Table 425th percentile, 75th percentile, and mean values of CT in Fig. 14a.
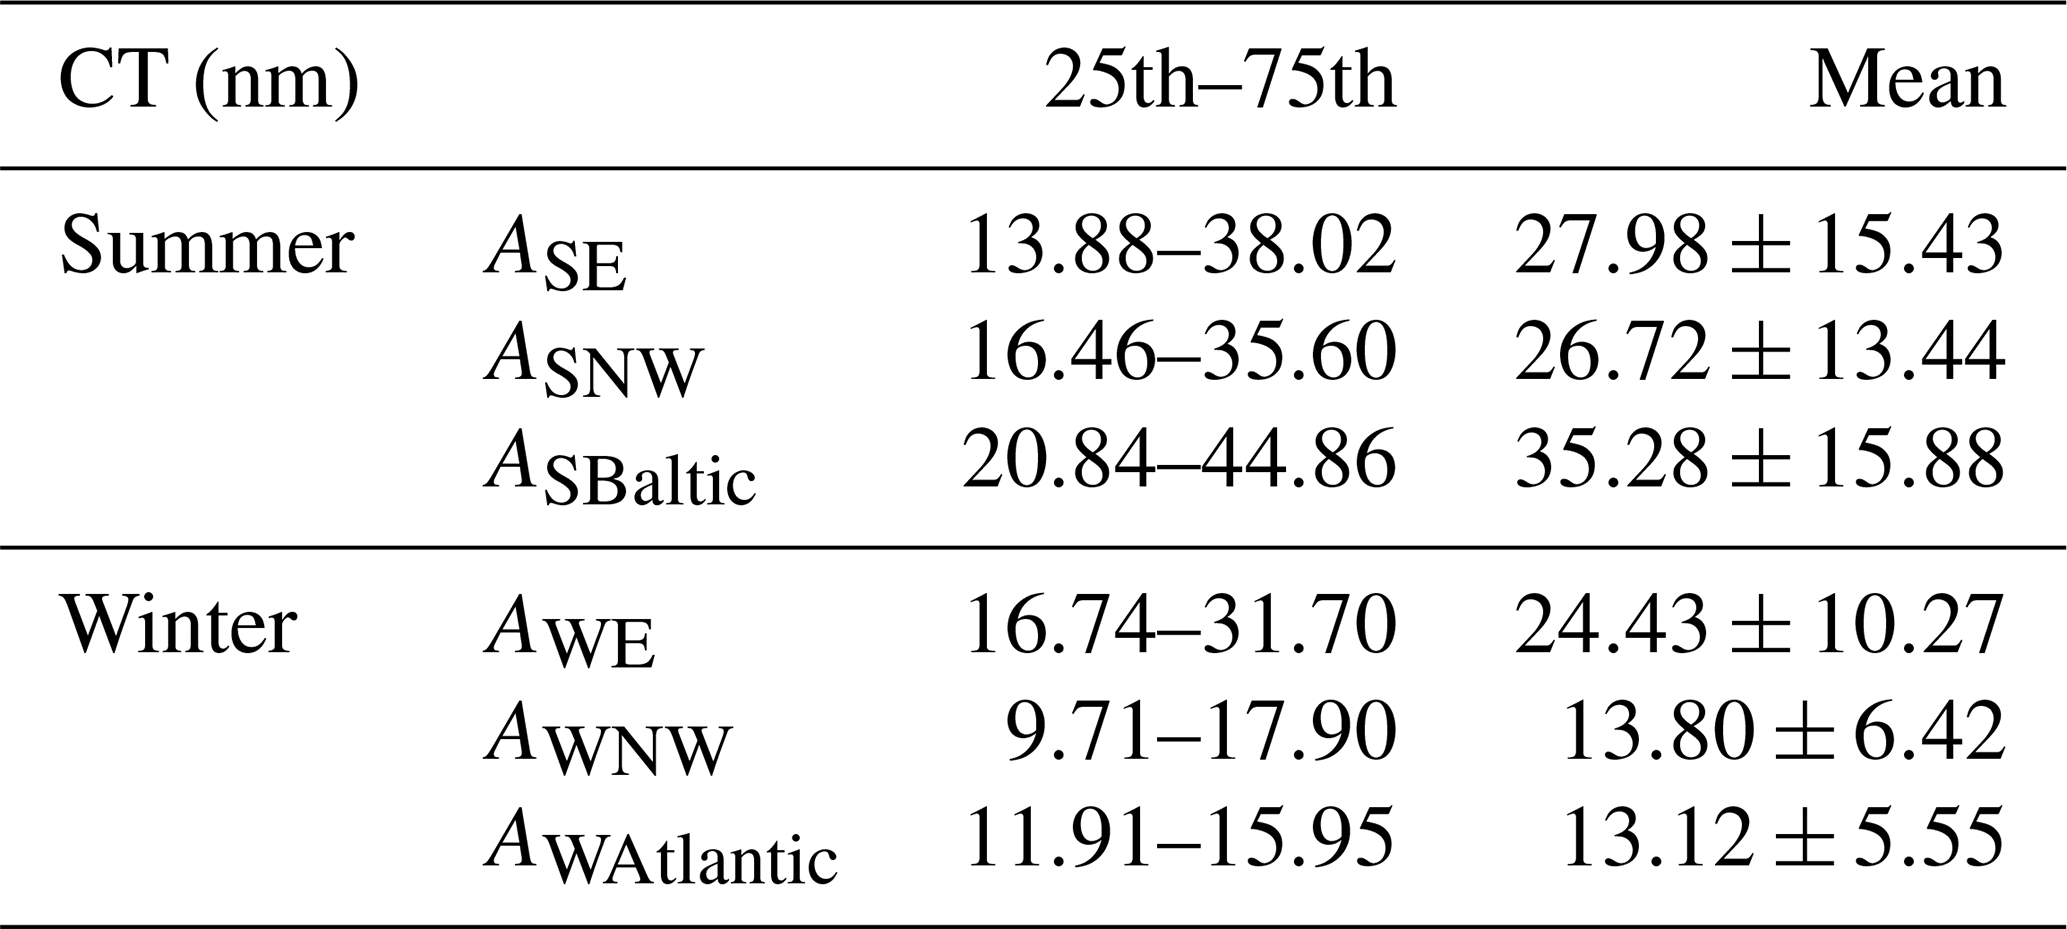

Figure 14Statistical analysis and diurnal variation of CT for each air mass in winter and summer.
To investigate the microphysical properties of atmospheric black carbon aerosols, measurements were performed at the central background site Melpitz, Germany, in the summer (August 2021) and winter (December 2021) using an SP2. The core size and coating thickness were examined using the single-particle data, and the coating volatility of rBC was investigated by the sample air passing through a TD with a temperature of 300 °C upstream of the SP2.
Backward trajectory analysis and wind direction patterns identified one air mass influenced by the easterly winds and two air masses associated with long-range transport arriving from the west of Melpitz during both seasons. In summer, the air mass corresponding to the easterly winds was more linked to the local emissions from Melpitz village. The smaller rBC sizes (MMD of 164 nm), combined with the detection limit of the SP2, introduced an overestimation of average CT. Higher fractions of thickly coated rBC ( nm) and an increased fraction of rBC with LV coating were both observed in the afternoon, suggesting the contribution of photochemical processes to the mixing state of rBC. In winter, the easterly winds were associated with both local emissions and transportation from Eastern Europe. The residential heating with biomass burning during winter contributed to the observed largest MMD (216 nm) and thick CT (57.74 ± 14.18 nm) in this air mass.
For the long-transported air masses during summer, the smallest MMD (140 nm) was observed. The highest fraction of thickly coated rBC was found at noon for these long-transported air masses, differing from the local emissions related to the aged rBC that already acquired coatings during transportation. In winter, the ambient temperature of long-transported air masses from the west was higher than the air mass influenced by the easterly winds, potentially leading to less residential heating emissions. As a result, smaller core sizes and thinner CT were observed in these long-transported air masses. The LV coating did not exhibit evident diurnal variation for all air masses during winter. However, the cold air masses exhibited a thicker LV coating compared to the warm air masses, suggesting that the emission sources play a more important role in the coating volatility than the atmospheric processes during winter.
The TD–SP2 system provides a valuable tool for determining the composition of coatings, including the volatile coating (comprised of secondary inorganic components and volatile organic components) and the low-volatility coating (consisting of low-volatility organic components). This study found that at Melpitz, LV coatings in summer were largely associated with secondary organic formation through photochemical processes, while in winter, they were more related to residential heating emissions. The results obtained from this study will provide insights into aerosol dynamical processes associated with coating formation and allow the attribution of certain aerosol species that influence the radiative properties of BC.
Data are available upon request from the corresponding authors (yang@tropos.de, muellert@tropos.de).
The supplement related to this article is available online at https://doi.org/10.5194/acp-25-8637-2025-supplement.
TM and YY designed the research. YY, LP, and JV collected the data at Melpitz. YY, BAH, LP, and JV performed the data analysis. YY wrote the first draft of the paper. All co-authors contributed to the interpretation of the results as well as paper review and editing.
The contact author has declared that none of the authors has any competing interests.
Publisher's note: Copernicus Publications remains neutral with regard to jurisdictional claims made in the text, published maps, institutional affiliations, or any other geographical representation in this paper. While Copernicus Publications makes every effort to include appropriate place names, the final responsibility lies with the authors.
We thank Christopher Pöhlker for the helpful suggestions and comments on improving this paper.
This research has been supported by the China Scholarship Council (grant no. 201908320539), the European Commission H2020 (ACTRIS-2 (grant no. 654109)), and the TRACE project funded by the Czech Science Foundation (CSF) (grant no. 20-08304J) and by the German Research Foundation (DFG) (grant no. 431895563).
This paper was edited by Holger Tost and reviewed by two anonymous referees.
Atabakhsh, S., Poulain, L., Chen, G., Canonaco, F., Prévôt, A. S. H., Pöhlker, M., Wiedensohler, A., and Herrmann, H.: A 1 year aerosol chemical speciation monitor (ACSM) source analysis of organic aerosol particle contributions from anthropogenic sources after long-range transport at the TROPOS research station Melpitz, Atmos. Chem. Phys., 23, 6963–6988, https://doi.org/10.5194/acp-23-6963-2023, 2023.
Baumgardner, D., Popovicheva, O., Allan, J., Bernardoni, V., Cao, J., Cavalli, F., Cozic, J., Diapouli, E., Eleftheriadis, K., Genberg, P. J., Gonzalez, C., Gysel, M., John, A., Kirchstetter, T. W., Kuhlbusch, T. A. J., Laborde, M., Lack, D., Müller, T., Niessner, R., Petzold, A., Piazzalunga, A., Putaud, J. P., Schwarz, J., Sheridan, P., Subramanian, R., Swietlicki, E., Valli, G., Vecchi, R., and Viana, M.: Soot reference materials for instrument calibration and intercomparisons: a workshop summary with recommendations, Atmos. Meas. Tech., 5, 1869–1887, https://doi.org/10.5194/amt-5-1869-2012, 2012.
Bond, T. C. and Bergstrom, R. W.: Light Absorption by Carbonaceous Particles: An Investigative Review, Aerosol Sci. Tech., 40, 27–67, https://doi.org/10.1080/02786820500421521, 2007.
Bond, T. C., Habib, G., and Bergstrom, R. W.: Limitations in the enhancement of visible light absorption due to mixing state, J. Geophys. Res., 111, D20211, https://doi.org/10.1029/2006jd007315, 2006.
Bond, T. C., Doherty, S. J., Fahey, D. W., Forster, P. M., Berntsen, T., DeAngelo, B. J., Flanner, M. G., Ghan, S., Kärcher, B., Koch, D., Kinne, S., Kondo, Y., Quinn, P. K., Sarofim, M. C., Schultz, M. G., Schulz, M., Venkataraman, C., Zhang, H., Zhang, S., Bellouin, N., Guttikunda, S. K., Hopke, P. K., Jacobson, M. Z., Kaiser, J. W., Klimont, Z., Lohmann, U., Schwarz, J. P., Shindell, D., Storelvmo, T., Warren, S. G., and Zender, C. S.: Bounding the role of black carbon in the climate system: A scientific assessment, J. Geophys. Res.-Atmos., 118, 5380–5552, https://doi.org/10.1002/jgrd.50171, 2013.
Brooks, J., Allan, J. D., Williams, P. I., Liu, D., Fox, C., Haywood, J., Langridge, J. M., Highwood, E. J., Kompalli, S. K., O'Sullivan, D., Babu, S. S., Satheesh, S. K., Turner, A. G., and Coe, H.: Vertical and horizontal distribution of submicron aerosol chemical composition and physical characteristics across northern India during pre-monsoon and monsoon seasons, Atmos. Chem. Phys., 19, 5615–5634, https://doi.org/10.5194/acp-19-5615-2019, 2019.
Cappa, C. D., Onasch, T. B., Massoli, P., Worsnop, D. R., Bates, T. S., Cross, E. S., Davidovits, P., Hakala, J., Hayden, K. L., Jobson, B. T., Kolesar, K. R., Lack, D. A., Lerner, B. M., Li, S. M., Mellon, D., Nuaaman, I., Olfert, J. S., Petaja, T., Quinn, P. K., Song, C., Subramanian, R., Williams, E. J., and Zaveri, R. A.: Radiative absorption enhancements due to the mixing state of atmospheric black carbon, Science, 337, 1078–1081, https://doi.org/10.1126/science.1223447, 2012.
Che, H., Segal-Rozenhaimer, M., Zhang, L., Dang, C., Zuidema, P., Dobracki, A., Sedlacek, A. J., Coe, H., Wu, H., Taylor, J., Zhang, X., Redemann, J., and Haywood, J.: Cloud processing and weeklong ageing affect biomass burning aerosol properties over the south-eastern Atlantic, Communications Earth & Environment, 3, 182, https://doi.org/10.1038/s43247-022-00517-3, 2022.
Cohen, M. D., Stunder, B. J. B., Rolph, G. D., Draxler, R. R., Stein, A. F., and Ngan, F.: NOAA's HYSPLIT Atmospheric Transport and Dispersion Modeling System, B. Am. Meteorol. Soc., 96, 2059–2077, https://doi.org/10.1175/bams-d-14-00110.1, 2015.
Collier, S., Williams, L. R., Onasch, T. B., Cappa, C. D., Zhang, X., Russell, L. M., Chen, C. L., Sanchez, K. J., Worsnop, D. R., and Zhang, Q.: Influence of Emissions and Aqueous Processing on Particles Containing Black Carbon in a Polluted Urban Environment: Insights From a Soot Particle-Aerosol Mass Spectrometer, J. Geophys. Res.-Atmos., 123, 6648–6666, https://doi.org/10.1002/2017jd027851, 2018.
DeCarlo, P. F., Kimmel, J. R., Trimborn, A., Northway, M. J., Jayne, J. T., Aiken, A. C., Gonin, M., Fuhrer, K., Horvath, T., Docherty, K. S., Worsnop, D. R., and Jimenez, J. L.: Field-Deployable, High-Resolution, Time-of-Flight Aerosol Mass Spectrometer, Anal. Chem., 78, 8281–8289, https://doi.org/10.1021/ac061249n, 2006.
Feng, X., Wang, J., Teng, S., Xu, X., Zhu, B., Wang, J., Zhu, X., Yurkin, M. A., and Liu, C.: Can light absorption of black carbon still be enhanced by mixing with absorbing materials?, Atmos. Environ., 253, 118358, https://doi.org/10.1016/j.atmosenv.2021.118358, 2021.
Fierce, L., Bond, T. C., Bauer, S. E., Mena, F., and Riemer, N.: Black carbon absorption at the global scale is affected by particle-scale diversity in composition, Nat. Commun., 7, 12361, https://doi.org/10.1038/ncomms12361, 2016.
Fierce, L., Onasch, T. B., Cappa, C. D., Mazzoleni, C., China, S., Bhandari, J., Davidovits, P., Fischer, D. A., Helgestad, T., Lambe, A. T., Sedlacek 3rd, A. J., Smith, G. D., and Wolff, L.: Radiative absorption enhancements by black carbon controlled by particle-to-particle heterogeneity in composition, P. Natl. Acad. Sci. USA, 117, 5196–5203, https://doi.org/10.1073/pnas.1919723117, 2020.
Gao, R. S., Schwarz, J. P., Kelly, K. K., Fahey, D. W., Watts, L. A., Thompson, T. L., Spackman, J. R., Slowik, J. G., Cross, E. S., Han, J. H., Davidovits, P., Onasch, T. B., and Worsnop, D. R.: A Novel Method for Estimating Light-Scattering Properties of Soot Aerosols Using a Modified Single-Particle Soot Photometer, Aerosol Sci. Tech., 41, 125–135, https://doi.org/10.1080/02786820601118398, 2007.
Henry, R., Norris, G. A., Vedantham, R., and Turner, J. R.: Source Region Identification Using Kernel Smoothing, Environ. Sci. Technol., 43, 4090–4097, https://doi.org/10.1021/es8011723, 2009.
Hodnebrog, O., Myhre, G., and Samset, B. H.: How shorter black carbon lifetime alters its climate effect, Nat. Commun., 5, 5065, https://doi.org/10.1038/ncomms6065, 2014.
Holanda, B. A., Franco, M. A., Walter, D., Artaxo, P., Carbone, S., Cheng, Y., Chowdhury, S., Ditas, F., Gysel-Beer, M., Klimach, T., Kremper, L. A., Krüger, O. O., Lavric, J. V., Lelieveld, J., Ma, C., Machado, L. A. T., Modini, R. L., Morais, F. G., Pozzer, A., Saturno, J., Su, H., Wendisch, M., Wolff, S., Pöhlker, M. L., Andreae, M. O., Pöschl, U., and Pöhlker, C.: African biomass burning affects aerosol cycling over the Amazon, Communications Earth & Environment, 4, 154, https://doi.org/10.1038/s43247-023-00795-5, 2023.
IPCC: Climate Change 2021: The Physical Science Basis. Contribution of Working Group I to the Sixth Assessment Report of the Intergovernmental Panel on Climate Change, edited by: Masson-Delmotte, V., Zhai, P., Pirani, A., Connors, S. L., Péan, C., Berger, S., Caud, N., Chen, Y., Goldfarb, L., Gomis, M. I., Huang, M., Leitzell, K., Lonnoy, E., Matthews, J. B. R., Maycock, T. K., Waterfield, T., Yelekçi, O., Yu, R., and Zhou, B., Cambridge University Press, Cambridge, United Kingdom and New York, NY, USA, 2391 pp., https://doi.org/10.1017/9781009157896, 2021.
Ko, J., Krasowsky, T., and Ban-Weiss, G.: Measurements to determine the mixing state of black carbon emitted from the 2017–2018 California wildfires and urban Los Angeles, Atmos. Chem. Phys., 20, 15635–15664, https://doi.org/10.5194/acp-20-15635-2020, 2020.
Kompalli, S. K., Suresh Babu, S. N., Satheesh, S. K., Krishna Moorthy, K., Das, T., Boopathy, R., Liu, D., Darbyshire, E., Allan, J. D., Brooks, J., Flynn, M. J., and Coe, H.: Seasonal contrast in size distributions and mixing state of black carbon and its association with PM1.0 chemical composition from the eastern coast of India, Atmos. Chem. Phys., 20, 3965–3985, https://doi.org/10.5194/acp-20-3965-2020, 2020.
Krasowsky, T. S., McMeeking, G. R., Sioutas, C., and Ban-Weiss, G.: Characterizing the evolution of physical properties and mixing state of black carbon particles: from near a major highway to the broader urban plume in Los Angeles, Atmos. Chem. Phys., 18, 11991–12010, https://doi.org/10.5194/acp-18-11991-2018, 2018.
Laborde, M., Schnaiter, M., Linke, C., Saathoff, H., Naumann, K.-H., Möhler, O., Berlenz, S., Wagner, U., Taylor, J. W., Liu, D., Flynn, M., Allan, J. D., Coe, H., Heimerl, K., Dahlkötter, F., Weinzierl, B., Wollny, A. G., Zanatta, M., Cozic, J., Laj, P., Hitzenberger, R., Schwarz, J. P., and Gysel, M.: Single Particle Soot Photometer intercomparison at the AIDA chamber, Atmos. Meas. Tech., 5, 3077–3097, https://doi.org/10.5194/amt-5-3077-2012, 2012.
Laborde, M., Crippa, M., Tritscher, T., Jurányi, Z., Decarlo, P. F., Temime-Roussel, B., Marchand, N., Eckhardt, S., Stohl, A., Baltensperger, U., Prévôt, A. S. H., Weingartner, E., and Gysel, M.: Black carbon physical properties and mixing state in the European megacity Paris, Atmos. Chem. Phys., 13, 5831–5856, https://doi.org/10.5194/acp-13-5831-2013, 2013.
Liu, D., Allan, J., Whitehead, J., Young, D., Flynn, M., Coe, H., McFiggans, G., Fleming, Z. L., and Bandy, B.: Ambient black carbon particle hygroscopic properties controlled by mixing state and composition, Atmos. Chem. Phys., 13, 2015–2029, https://doi.org/10.5194/acp-13-2015-2013, 2013.
Liu, D., Allan, J. D., Young, D. E., Coe, H., Beddows, D., Fleming, Z. L., Flynn, M. J., Gallagher, M. W., Harrison, R. M., Lee, J., Prevot, A. S. H., Taylor, J. W., Yin, J., Williams, P. I., and Zotter, P.: Size distribution, mixing state and source apportionment of black carbon aerosol in London during wintertime, Atmos. Chem. Phys., 14, 10061–10084, https://doi.org/10.5194/acp-14-10061-2014, 2014.
Liu, D., Whitehead, J., Alfarra, M. R., Reyes-Villegas, E., Spracklen, D. V., Reddington, C. L., Kong, S., Williams, P. I., Ting, Y.-C., Haslett, S., Taylor, J. W., Flynn, M. J., Morgan, W. T., McFiggans, G., Coe, H., and Allan, J. D.: Black-carbon absorption enhancement in the atmosphere determined by particle mixing state, Nat. Geosci., 10, 184–188, https://doi.org/10.1038/ngeo2901, 2017.
Liu, D., Joshi, R., Wang, J., Yu, C., Allan, J. D., Coe, H., Flynn, M. J., Xie, C., Lee, J., Squires, F., Kotthaus, S., Grimmond, S., Ge, X., Sun, Y., and Fu, P.: Contrasting physical properties of black carbon in urban Beijing between winter and summer, Atmos. Chem. Phys., 19, 6749–6769, https://doi.org/10.5194/acp-19-6749-2019, 2019.
Liu, D., He, C., Schwarz, J. P., and Wang, X.: Lifecycle of light-absorbing carbonaceous aerosols in the atmosphere, npj Climate and Atmospheric Science, 3, 40, https://doi.org/10.1038/s41612-020-00145-8, 2020.
Liu, S., Aiken, A. C., Gorkowski, K., Dubey, M. K., Cappa, C. D., Williams, L. R., Herndon, S. C., Massoli, P., Fortner, E. C., Chhabra, P. S., Brooks, W. A., Onasch, T. B., Jayne, J. T., Worsnop, D. R., China, S., Sharma, N., Mazzoleni, C., Xu, L., Ng, N. L., Liu, D., Allan, J. D., Lee, J. D., Fleming, Z. L., Mohr, C., Zotter, P., Szidat, S., and Prevot, A. S. H.: Enhanced light absorption by mixed source black and brown carbon particles in UK winter, Nat. Commun., 6, 8435, https://doi.org/10.1038/ncomms9435, 2015.
Luo, J., Zhang, Y., Wang, F., and Zhang, Q.: Effects of brown coatings on the absorption enhancement of black carbon: a numerical investigation, Atmos. Chem. Phys., 18, 16897–16914, https://doi.org/10.5194/acp-18-16897-2018, 2018.
McMeeking, G. R., Hamburger, T., Liu, D., Flynn, M., Morgan, W. T., Northway, M., Highwood, E. J., Krejci, R., Allan, J. D., Minikin, A., and Coe, H.: Black carbon measurements in the boundary layer over western and northern Europe, Atmos. Chem. Phys., 10, 9393–9414, https://doi.org/10.5194/acp-10-9393-2010, 2010.
Moteki, N., Kondo, Y., and Nakamura, S.-I.: Method to measure refractive indices of small nonspherical particles: Application to black carbon particles, J. Aerosol Sci., 41, 513–521, https://doi.org/10.1016/j.jaerosci.2010.02.013, 2010.
Moteki, N., Kondo, Y., Oshima, N., Takegawa, N., Koike, M., Kita, K., Matsui, H., and Kajino, M.: Size dependence of wet removal of black carbon aerosols during transport from the boundary layer to the free troposphere, Geophys. Res. Lett., 39, L13802, https://doi.org/10.1029/2012gl052034, 2012.
Nakayama, T., Ikeda, Y., Sawada, Y., Setoguchi, Y., Ogawa, S., Kawana, K., Mochida, M., Ikemori, F., Matsumoto, K., and Matsumi, Y.: Properties of light-absorbing aerosols in the Nagoya urban area, Japan, in August 2011 and January 2012: Contributions of brown carbon and lensing effect, J. Geophys. Res.-Atmos., 119, 12721–12739, https://doi.org/10.1002/2014jd021744, 2014.
Ng, N. L., Herndon, S. C., Trimborn, A., Canagaratna, M. R., Croteau, P. L., Onasch, T. B., Sueper, D., Worsnop, D. R., Zhang, Q., Sun, Y. L., and Jayne, J. T.: An Aerosol Chemical Speciation Monitor (ACSM) for Routine Monitoring of the Composition and Mass Concentrations of Ambient Aerosol, Aerosol Sci. Tech., 45, 780–794, https://doi.org/10.1080/02786826.2011.560211, 2011.
Pathak, R. K., Wu, W. S., and Wang, T.: Summertime PM2.5 ionic species in four major cities of China: nitrate formation in an ammonia-deficient atmosphere, Atmos. Chem. Phys., 9, 1711–1722, https://doi.org/10.5194/acp-9-1711-2009, 2009.
Petit, J. E., Favez, O., Albinet, A., and Canonaco, F.: A user-friendly tool for comprehensive evaluation of the geographical origins of atmospheric pollution: Wind and trajectory analyses, Environ. Modell. Softw., 88, 183–187, https://doi.org/10.1016/j.envsoft.2016.11.022, 2017.
Pileci, R. E., Modini, R. L., Bertò, M., Yuan, J., Corbin, J. C., Marinoni, A., Henzing, B., Moerman, M. M., Putaud, J. P., Spindler, G., Wehner, B., Müller, T., Tuch, T., Trentini, A., Zanatta, M., Baltensperger, U., and Gysel-Beer, M.: Comparison of co-located refractory black carbon (rBC) and elemental carbon (EC) mass concentration measurements during field campaigns at several European sites, Atmos. Meas. Tech., 14, 1379–1403, https://doi.org/10.5194/amt-14-1379-2021, 2021.
Poulain, L., Spindler, G., Birmili, W., Plass-Dülmer, C., Wiedensohler, A., and Herrmann, H.: Seasonal and diurnal variations of particulate nitrate and organic matter at the IfT research station Melpitz, Atmos. Chem. Phys., 11, 12579–12599, https://doi.org/10.5194/acp-11-12579-2011, 2011.
Poulain, L., Birmili, W., Canonaco, F., Crippa, M., Wu, Z. J., Nordmann, S., Spindler, G., Prévôt, A. S. H., Wiedensohler, A., and Herrmann, H.: Chemical mass balance of 300 °C non-volatile particles at the tropospheric research site Melpitz, Germany, Atmos. Chem. Phys., 14, 10145–10162, https://doi.org/10.5194/acp-14-10145-2014, 2014.
Poulain, L., Spindler, G., Grüner, A., Tuch, T., Stieger, B., van Pinxteren, D., Petit, J.-E., Favez, O., Herrmann, H., and Wiedensohler, A.: Multi-year ACSM measurements at the central European research station Melpitz (Germany) – Part 1: Instrument robustness, quality assurance, and impact of upper size cutoff diameter, Atmos. Meas. Tech., 13, 4973–4994, https://doi.org/10.5194/amt-13-4973-2020, 2020.
Romshoo, B., Müller, T., Pfeifer, S., Saturno, J., Nowak, A., Ciupek, K., Quincey, P., and Wiedensohler, A.: Optical properties of coated black carbon aggregates: numerical simulations, radiative forcing estimates, and size-resolved parameterization scheme, Atmos. Chem. Phys., 21, 12989–13010, https://doi.org/10.5194/acp-21-12989-2021, 2021.
Rose, D., Gunthe, S. S., Su, H., Garland, R. M., Yang, H., Berghof, M., Cheng, Y. F., Wehner, B., Achtert, P., Nowak, A., Wiedensohler, A., Takegawa, N., Kondo, Y., Hu, M., Zhang, Y., Andreae, M. O., and Pöschl, U.: Cloud condensation nuclei in polluted air and biomass burning smoke near the mega-city Guangzhou, China – Part 2: Size-resolved aerosol chemical composition, diurnal cycles, and externally mixed weakly CCN-active soot particles, Atmos. Chem. Phys., 11, 2817–2836, https://doi.org/10.5194/acp-11-2817-2011, 2011.
Saleh, R., Robinson, E. S., Tkacik, D. S., Ahern, A. T., Liu, S., Aiken, A. C., Sullivan, R. C., Presto, A. A., Dubey, M. K., Yokelson, R. J., Donahue, N. M., and Robinson, A. L.: Brownness of organics in aerosols from biomass burning linked to their black carbon content, Nat. Geosci., 7, 647–650, https://doi.org/10.1038/ngeo2220, 2014.
Schwarz, J. P., Gao, R. S., Fahey, D. W., Thomson, D. S., Watts, L. A., Wilson, J. C., Reeves, J. M., Darbeheshti, M., Baumgardner, D. G., Kok, G. L., Chung, S. H., Schulz, M., Hendricks, J., Lauer, A., Kärcher, B., Slowik, J. G., Rosenlof, K. H., Thompson, T. L., Langford, A. O., Loewenstein, M., and Aikin, K. C.: Single-particle measurements of midlatitude black carbon and light-scattering aerosols from the boundary layer to the lower stratosphere, J. Geophys. Res., 111, D16207, https://doi.org/10.1029/2006jd007076, 2006.
Schwarz, J. P., Gao, R. S., Spackman, J. R., Watts, L. A., Thomson, D. S., Fahey, D. W., Ryerson, T. B., Peischl, J., Holloway, J. S., Trainer, M., Frost, G. J., Baynard, T., Lack, D. A., de Gouw, J. A., Warneke, C., and Del Negro, L. A.: Measurement of the mixing state, mass, and optical size of individual black carbon particles in urban and biomass burning emissions, Geophys. Res. Lett., 35, L13810, https://doi.org/10.1029/2008gl033968, 2008a.
Schwarz, J. P., Spackman, J. R., Fahey, D. W., Gao, R. S., Lohmann, U., Stier, P., Watts, L. A., Thomson, D. S., Lack, D. A., Pfister, L., Mahoney, M. J., Baumgardner, D., Wilson, J. C., and Reeves, J. M.: Coatings and their enhancement of black carbon light absorption in the tropical atmosphere, J. Geophys. Res., 113, D03203, https://doi.org/10.1029/2007jd009042, 2008b.
Schwarz, J. P., Spackman, J. R., Gao, R. S., Perring, A. E., Cross, E., Onasch, T. B., Ahern, A., Wrobel, W., Davidovits, P., Olfert, J., Dubey, M. K., Mazzoleni, C., and Fahey, D. W.: The Detection Efficiency of the Single Particle Soot Photometer, Aerosol Sci. Tech., 44, 612–628, https://doi.org/10.1080/02786826.2010.481298, 2010.
Sedlacek III, A. J., Lewis, E. R., Onasch, T. B., Zuidema, P., Redemann, J., Jaffe, D., and Kleinman, L. I.: Using the Black Carbon Particle Mixing State to Characterize the Lifecycle of Biomass Burning Aerosols, Environ. Sci. Technol., 56, 14315–14325, https://doi.org/10.1021/acs.est.2c03851, 2022.
Shetty, N., Beeler, P., Paik, T., Brechtel, F. J., and Chakrabarty, R. K.: Bias in quantification of light absorption enhancement of black carbon aerosol coated with low-volatility brown carbon, Aerosol Sci. Tech., 55, 539–551, https://doi.org/10.1080/02786826.2021.1873909, 2021.
Shiraiwa, M., Kondo, Y., Iwamoto, T., and Kita, K.: Amplification of Light Absorption of Black Carbon by Organic Coating, Aerosol Sci. Tech., 44, 46–54, https://doi.org/10.1080/02786820903357686, 2010.
Spindler, G., Gnauk, T., Grüner, A., Iinuma, Y., Müller, K., Scheinhardt, S., and Herrmann, H.: Size-segregated characterization of PM10 at the EMEP site Melpitz (Germany) using a five-stage impactor: a six year study, J. Atmos. Chem., 69, 127–157, https://doi.org/10.1007/s10874-012-9233-6, 2012.
Spindler, G., Grüner, A., Müller, K., Schlimper, S., and Herrmann, H.: Long-term size-segregated particle (PM10, PM2.5, PM1) characterization study at Melpitz – influence of air mass inflow, weather conditions and season, J. Atmos. Chem., 70, 165–195, https://doi.org/10.1007/s10874-013-9263-8, 2013.
Sun, J., Birmili, W., Hermann, M., Tuch, T., Weinhold, K., Spindler, G., Schladitz, A., Bastian, S., Löschau, G., Cyrys, J., Gu, J., Flentje, H., Briel, B., Asbach, C., Kaminski, H., Ries, L., Sohmer, R., Gerwig, H., Wirtz, K., Meinhardt, F., Schwerin, A., Bath, O., Ma, N., and Wiedensohler, A.: Variability of black carbon mass concentrations, sub-micrometer particle number concentrations and size distributions: results of the German Ultrafine Aerosol Network ranging from city street to High Alpine locations, Atmos. Environ., 202, 256–268, https://doi.org/10.1016/j.atmosenv.2018.12.029, 2019.
Syakur, M. A., Khotimah, B. K., Rochman, E. M. S., and Satoto, B. D.: Integration K-Means Clustering Method and Elbow Method For Identification of The Best Customer Profile Cluster, IOP Conf. Ser.-Mat. Sci., 336, 012017, https://doi.org/10.1088/1757-899X/336/1/012017, 2018.
Taylor, J. W., Allan, J. D., Liu, D., Flynn, M., Weber, R., Zhang, X., Lefer, B. L., Grossberg, N., Flynn, J., and Coe, H.: Assessment of the sensitivity of core / shell parameters derived using the single-particle soot photometer to density and refractive index, Atmos. Meas. Tech., 8, 1701–1718, https://doi.org/10.5194/amt-8-1701-2015, 2015.
Tuch, T. M., Haudek, A., Müller, T., Nowak, A., Wex, H., and Wiedensohler, A.: Design and performance of an automatic regenerating adsorption aerosol dryer for continuous operation at monitoring sites, Atmos. Meas. Tech., 2, 417–422, https://doi.org/10.5194/amt-2-417-2009, 2009.
Ueda, S., Nakayama, T., Taketani, F., Adachi, K., Matsuki, A., Iwamoto, Y., Sadanaga, Y., and Matsumi, Y.: Light absorption and morphological properties of soot-containing aerosols observed at an East Asian outflow site, Noto Peninsula, Japan, Atmos. Chem. Phys., 16, 2525–2541, https://doi.org/10.5194/acp-16-2525-2016, 2016.
van Pinxteren, D., Mothes, F., Spindler, G., Fomba, K. W., Cuesta, A., Tuch, T., Müller, T., Wiedensohler, A., and Herrmann, H.: Zusatzbelastung aus Holzheizung, Sächsisches Landesamt für Umwelt, Landwirtschaft und Geologie (LfULG), Dresden, https://publikationen.sachsen.de/bdb/artikel/36106 (last access: 12 December 2021), 2020.
van Pinxteren, D., Engelhardt, V., Mothes, F., Poulain, L., Fomba, K. W., Spindler, G., Cuesta-Mosquera, A., Tuch, T., Muller, T., Wiedensohler, A., Loschau, G., Bastian, S., and Herrmann, H.: Residential Wood Combustion in Germany: A Twin-Site Study of Local Village Contributions to Particulate Pollutants and Their Potential Health Effects, ACS Environ. Au, 4, 12–30, https://doi.org/10.1021/acsenvironau.3c00035, 2024.
Wang, J., Zhang, Q., Chen, M., Collier, S., Zhou, S., Ge, X., Xu, J., Shi, J., Xie, C., Hu, J., Ge, S., Sun, Y., and Coe, H.: First Chemical Characterization of Refractory Black Carbon Aerosols and Associated Coatings over the Tibetan Plateau (4730 m a.s.l.), Environ. Sci. Technol., 51, 14072–14082, https://doi.org/10.1021/acs.est.7b03973, 2017.
Wang, J., Liu, D., Ge, X., Wu, Y., Shen, F., Chen, M., Zhao, J., Xie, C., Wang, Q., Xu, W., Zhang, J., Hu, J., Allan, J., Joshi, R., Fu, P., Coe, H., and Sun, Y.: Characterization of black carbon-containing fine particles in Beijing during wintertime, Atmos. Chem. Phys., 19, 447–458, https://doi.org/10.5194/acp-19-447-2019, 2019.
Wang, R., Balkanski, Y., Boucher, O., Ciais, P., Schuster, G. L., Chevallier, F., Samset, B. H., Liu, J., Piao, S., Valari, M., and Tao, S.: Estimation of global black carbon direct radiative forcing and its uncertainty constrained by observations, J. Geophys. Res.-Atmos., 121, 5948–5971, https://doi.org/10.1002/2015jd024326, 2016.
Wang, T., Zhao, G., Tan, T., Yu, Y., Tang, R., Dong, H., Chen, S., Li, X., Lu, K., Zeng, L., Gao, Y., Wang, H., Lou, S., Liu, D., Hu, M., Zhao, C., and Guo, S.: Effects of biomass burning and photochemical oxidation on the black carbon mixing state and light absorption in summer season, Atmos. Environ., 248, 118230, https://doi.org/10.1016/j.atmosenv.2021.118230, 2021a.
Wang, Y., Li, W., Huang, J., Liu, L., Pang, Y., He, C., Liu, F., Liu, D., Bi, L., Zhang, X., and Shi, Z.: Nonlinear Enhancement of Radiative Absorption by Black Carbon in Response to Particle Mixing Structure, Geophys. Res. Lett., 48, e2021GL096437, https://doi.org/10.1029/2021gl096437, 2021b.
Wang, Y., Henning, S., Poulain, L., Lu, C., Stratmann, F., Wang, Y., Niu, S., Pöhlker, M. L., Herrmann, H., and Wiedensohler, A.: Aerosol activation characteristics and prediction at the central European ACTRIS research station of Melpitz, Germany, Atmos. Chem. Phys., 22, 15943–15962, https://doi.org/10.5194/acp-22-15943-2022, 2022.
Wehner, B., Philippin, S., and Wiedensohler, A.: Design and calibration of a thermodenuder with an improved heating unit to measure the size-dependent volatile fraction of aerosol particles, J. Aerosol Sci., 33, 1087–1093, https://doi.org/10.1016/S0021-8502(02)00056-3, 2002.
Xu, X., Zhao, W., Qian, X., Wang, S., Fang, B., Zhang, Q., Zhang, W., Venables, D. S., Chen, W., Huang, Y., Deng, X., Wu, B., Lin, X., Zhao, S., and Tong, Y.: The influence of photochemical aging on light absorption of atmospheric black carbon and aerosol single-scattering albedo, Atmos. Chem. Phys., 18, 16829–16844, https://doi.org/10.5194/acp-18-16829-2018, 2018.
Yang, Y., Xu, X., Zhang, Y., Zheng, S., Wang, L., Liu, D., Gustave, W., Jiang, L., Hua, Y., Du, S., and Tang, L.: Seasonal size distribution and mixing state of black carbon aerosols in a polluted urban environment of the Yangtze River Delta region, China, Sci. Total Environ., 654, 300–310, https://doi.org/10.1016/j.scitotenv.2018.11.087, 2019.
Yuan, J., Modini, R. L., Zanatta, M., Herber, A. B., Müller, T., Wehner, B., Poulain, L., Tuch, T., Baltensperger, U., and Gysel-Beer, M.: Variability in the mass absorption cross section of black carbon (BC) aerosols is driven by BC internal mixing state at a central European background site (Melpitz, Germany) in winter, Atmos. Chem. Phys., 21, 635–655, https://doi.org/10.5194/acp-21-635-2021, 2021.
Zeng, L., Tan, T., Zhao, G., Du, Z., Hu, S., Shang, D., and Hu, M.: Overestimation of black carbon light absorption due to mixing state heterogeneity, npj Climate and Atmospheric Science, 7, 2, https://doi.org/10.1038/s41612-023-00535-8, 2024.
Zhai, J., Yang, X., Li, L., Bai, B., Liu, P., Huang, Y., Fu, T. M., Zhu, L., Zeng, Z., Tao, S., Lu, X., Ye, X., Wang, X., Wang, L., and Chen, J.: Absorption Enhancement of Black Carbon Aerosols Constrained by Mixing-State Heterogeneity, Environ. Sci. Technol., 56, 1586–1593, https://doi.org/10.1021/acs.est.1c06180, 2022.
Zhang, Y., Tang, L., Yu, H., Wang, Z., Sun, Y., Qin, W., Chen, W., Chen, C., Ding, A., Wu, J., Ge, S., Chen, C., and Zhou, H.-C.: Chemical composition, sources and evolution processes of aerosol at an urban site in Yangtze River Delta, China during wintertime, Atmos. Environ., 123, 339–349, https://doi.org/10.1016/j.atmosenv.2015.08.017, 2015.
Zhang, Y., Favez, O., Canonaco, F., Liu, D., Močnik, G., Amodeo, T., Sciare, J., Prévôt, A. S. H., Gros, V., and Albinet, A.: Evidence of major secondary organic aerosol contribution to lensing effect black carbon absorption enhancement, npj Climate and Atmospheric Science, 1, 47, https://doi.org/10.1038/s41612-018-0056-2, 2018.
Zhang, Y., Zhang, Q., Yao, Z., and Li, H.: Particle Size and Mixing State of Freshly Emitted Black Carbon from Different Combustion Sources in China, Environ. Sci. Technol., 54, 7766–7774, https://doi.org/10.1021/acs.est.9b07373, 2020.
Zhang, Y., Su, H., Kecorius, S., Ma, N., Wang, Z., Sun, Y., Zhang, Q., Pöschl, U., Wiedensohler, A., Andreae, M. O., and Cheng, Y.: Extremely low-volatility organic coating leads to underestimation of black carbon climate impact, One Earth, 6, 158–166, https://doi.org/10.1016/j.oneear.2023.01.009, 2023.
Zhao, G., Zhao, W., and Zhao, C.: Method to measure the size-resolved real part of aerosol refractive index using differential mobility analyzer in tandem with single-particle soot photometer, Atmos. Meas. Tech., 12, 3541–3550, https://doi.org/10.5194/amt-12-3541-2019, 2019.
Zhao, X., Gao, T., and Zhang, J.: Heterogeneous reaction of peroxyacetyl nitrate (PAN) on soot, Chemosphere, 177, 339–346, https://doi.org/10.1016/j.chemosphere.2017.03.001, 2017.