the Creative Commons Attribution 4.0 License.
the Creative Commons Attribution 4.0 License.
 | 07 Aug 2025
Natural surface emissions dominate anthropogenic emissions contributions to total gaseous mercury at Canadian rural sites
Irene Cheng
Amanda Cole
Leiming Zhang
Alexandra Steffen
The Canadian Air and Precipitation Monitoring Network (CAPMoN) measures total gaseous mercury (TGM) at three rural–remote sites. Long-term TGM measurements, ancillary measurements, and the positive matrix factorization (PMF) model were used to assess temporal changes in anthropogenic and natural surface emission (wildfires plus re-emitted Hg) contributions to TGM and examine the emission drivers of the observed TGM trends between 2005 and 2018. TGM showed decreasing trends at all sites; the magnitudes (ng m−3 yr−1) were −0.050 at Saturna for 2010–2015, −0.026 at Egbert for 2005–2018, and −0.014 at Kejimkujik for 2005–2016. The increasing contributions from natural surface Hg emissions at Saturna (1.8 % yr−1) and Kejimkujik (0.3 % yr−1) resulted from declining anthropogenic Hg emissions and increasing oceanic re-emissions. The mean relative contributions of natural surface emissions to annual TGM were 71 %, 77.5 %, and 64 % at Saturna, Egbert, and Kejimkujik. TGM at Saturna was mainly from the Hg pool (50 %), terrestrial re-emissions (26 %), and shipping (10 %); at Egbert, from the Hg pool (66 %), terrestrial re-emissions (24 %), and crustal/soil dust (5 %); and at Kejimkujik, from the Hg pool (81 %), regional Hg emissions (11 %), and oceanic re-emissions (8 %). Local combustion contributed a few percent of the annual TGM, while the oceanic re-emission contribution was 6 %–8 % for the two coastal sites. Wildfire impacts on annual TGM were 3.7 % for Saturna and 1.6 % for Egbert. The Hg pool contributions to TGM were greater in the cold season, whereas wildfire and surface re-emission contributions can be significant in the warm season.
- Article
(7916 KB) - Full-text XML
-
Supplement
(1932 KB) - BibTeX
- EndNote


The works published in this journal are distributed under the Creative Commons Attribution 4.0 License. This license does not affect the Crown copyright work, which is re-usable under the Open Government Licence (OGL). The Creative Commons Attribution 4.0 License and the OGL are interoperable and do not conflict with, reduce or limit each other.
© Crown copyright 2025
Mercury (Hg) is a global pollutant that is toxic to biota and human health. Atmospheric Hg comprises three dominant inorganic fractions including gaseous elemental Hg (GEM), gaseous oxidized Hg or reactive gaseous Hg (GOM or RGM), and particle-bound Hg (PBM). GEM is the predominant form capable of long-range transport and chemical transformation to divalent Hg(II) compounds, such as GOM and PBM. Hg(II) has an atmospheric lifetime of several days to weeks and therefore tends to deposit locally or regionally. Through dry and wet deposition, atmospheric Hg enters terrestrial and aquatic environments, where it undergoes conversion to methylmercury (MeHg) compounds. The bioaccumulation of MeHg is known to cause severe neurological and reproductive effects (Hong et al., 2012; Driscoll et al., 2013; Obrist et al., 2018).
Emissions drive atmospheric Hg transport, chemical processing, deposition, and subsequent ecosystem impacts. Hg sources to the atmosphere consist of natural emissions (e.g., biomass burning, volcanic and geothermal releases), anthropogenic emissions (e.g., coal combustion, metal smelting, cement production), and re-emissions from terrestrial and aquatic surfaces. Globally, primary anthropogenic Hg emissions account for approximately 30 % of the total atmospheric Hg emissions, with the remainder from natural emissions and surface re-emissions. The latest global inventories indicate that anthropogenic sources emit 2200–2500 Mg Hg yr−1 (Dastoor et al., 2025, and references therein). 200–500 Mg yr−1 is emitted from geothermal and volcanic releases and 300–680 Mg yr−1 from wildfires. Terrestrial and aquatic surface re-emissions account for 1000–1700 and 2800–8300 Mg yr−1, respectively (Pirrone et al., 2010; Outridge et al., 2018; Streets et al., 2019; Li et al., 2020; Shah et al., 2021; Feinberg et al., 2022; Sonke et al., 2023; Tang et al., 2025). After accounting for atmospheric deposition, the global atmospheric Hg budget is in the range of 3800–4500 Mg. Natural emissions and surface re-emissions of Hg have large uncertainties because of limited spatial and temporal measurements for constraining emission factors. There are also uncertainties with Hg air–surface exchange models and quantifying the proportion of re-emitted Hg originating from natural and anthropogenic sources (Dastoor et al., 2025).
Source attribution analyses, which study the linkages between emission sources and environmental concentrations, have been conducted using receptor methods and chemical transport models (CTMs). Receptor methods, such as the positive matrix factorization (PMF) model, principal component analysis (PCA), and back-trajectory analysis, are applied to ambient air measurements at a particular location (Cheng et al., 2015, and references therein), whereas CTMs integrate detailed information on Hg emissions, meteorology, chemistry, and deposition to predict ambient Hg concentrations typically over a broader region (Horowitz et al., 2017; Shah et al., 2021; Zhang et al., 2023). Receptor methods have been used to identify sources contributing to GEM, GOM, PBM, total gaseous mercury (TGM) (Mazur et al., 2009; Huang et al., 2010; Eckley et al., 2013; Wang et al., 2013; Cheng et al., 2017; Qin et al., 2020; Custodio et al., 2020), and Hg wet deposition (Keeler et al., 2006; Michael et al., 2016). There are numerous modelling studies on atmospheric Hg, with some focusing on an improved Hg emissions budget (Fisher et al., 2012; Zhang et al., 2016, 2023), chemical mechanisms (Shah et al., 2016), vegetation uptake (Zhou et al., 2021), and source apportionment estimates (ECCC, 2016; Fraser et al., 2018; Dastoor et al., 2021, 2022).
Anthropogenic Hg emission sources inferred from receptor methods include coal, wood and oil combustion, cement production, iron and steel production, and vehicular traffic. Receptor methods have also been used to assess the effectiveness of emissions control on ambient Hg concentrations. PMF modelling showed that the closure of coal-fired power plants resulted in significant reductions in Hg source contributions to a nearby monitoring site (Wang et al., 2013). Concentration-weighted trajectory analysis revealed steep declines in Hg source contributions over southeastern Canada and the northeastern United States, which were driven by Hg emission reductions from power plants (Cheng et al., 2017). PCA also showed the diminished point source impact on TGM following the closure of a local base metal smelter in Canada (Eckley et al., 2013). Aside from anthropogenic Hg sources, source attribution studies have revealed the growing importance of natural Hg emissions (e.g., wildfires, oceanic evasion), chemical processing, and long-range transport.
The objective of this study is to determine the source contributions to TGM at three Canadian Air and Precipitation Monitoring Network (CAPMoN) sites using the PMF model and assess their long-term changes. Sources identified from the PMF model are aggregated into anthropogenic and natural surface emission contributions to examine the changes in their relative proportions over time. The long-term CAPMoN TGM measurements are also used to conduct statistical trend analysis and assess the emission drivers of the long-term trends.
2.1 TGM measurements and ancillary data
The CAPMoN TGM sites are located in Saturna, British Columbia; Egbert, Ontario; and Kejimkujik National Park, Nova Scotia. Saturna (SAT) is a coastal site in western Canada close to the Pacific Ocean. Egbert (EGB) is an inland site in southeastern Canada. Kejimkujik National Park (KEJ) is a coastal site in eastern Canada close to the Atlantic Ocean. The three sites are in rural–remote locations with minimal influence from large emission sources; thus, TGM concentrations at the sites are regionally representative. Refer to Table 1 for additional site information. TGM at other Canadian sites has been analyzed in previous publications (Temme et al., 2007; Cole et al., 2014; MacSween et al., 2022). The CAPMoN TGM sites were selected for this study to provide an update on current concentrations and patterns. The same set of ancillary measurements is also available at the sites to conduct PMF analysis.
TGM is measured using a Model 2537 Hg vapour analyzer (Tekran Instruments Corporation, Toronto, Ontario, Canada), which employs cold vapour atomic fluorescence spectrometry (CVAFS) to quantify TGM. The analyzer is housed in a shelter at each location, with the sampling line extending through the rooftop to the outdoor environment. The approximate height of the air inlet above ground is 6 m. Ambient air is sampled at 1.5 L min−1 through a heated PFA line maintained at temperatures at least 10 °C above ambient temperature. A Teflon filter at the air inlet and back of the analyzer removes particulate matter from the air stream. TGM, including GEM and GOM, is adsorbed onto dual gold cartridges, which alternate between sampling and desorption every 5 min. TGM concentrations are reported in units of ng m−3 referenced to STP (0 °C, 1 atm). Automated calibrations are performed every 25 h using the analyzer's Hg permeation source, verified annually by manual injections of a known amount of Hg0 to zero air using the Tekran Model 2505 Calibration Unit. The permeation rate derived from manual calibrations is expected to be ±5 % of the analyzer's perm rate. Every 35 samples, the permeation source releases Hg0 into the sampled air to assess recovery.
Site operators and field staff perform instrument checks and maintenance activities including sample filter replacement, lamp voltage adjustments, and argon tank replacement. Site audits are conducted annually, including verification of the Hg permeation rate and sample flow rate; leak and sample line checks; and gold cartridge, heater, and UV lamp replacement. The 5 min TGM data are quality-controlled by flagging instrument parameters (baseline voltage mean and standard deviation, cartridge difference, sample volume, etc.) that are outside the normal range of operations. The data reviewer checks field notes, site audit reports, and wildfire maps; verifies quality control flags; investigates anomalies and outliers; and computes hourly averages for final reporting.
Ancillary measurements of particulate inorganic ions, SO2, CO, total carbon, and air temperature were obtained from CAPMoN and other monitoring networks (Table S1 in the Supplement). Inorganic ions, SO2, and temperature were measured at the sites, whereas regionally representative CO and total carbon measurements were within 40 km of the sites. All data have been quality-controlled by their respective networks and are publicly accessible. Hourly data were converted to 24 h averages for input into the PMF model.
2.2 PMF model
The US EPA PMF model is a multivariate model for the source apportionment of air pollutants, such as speciated particulate matter, volatile organic compounds (VOCs), trace elements, and speciated atmospheric Hg. The principles behind the PMF model are detailed in previous studies and the user's guide (Norris et al., 2014; Brown et al., 2015). The PMF dataset consisted of 12 variables including 24 h chemical species concentrations and mean air temperature (Table S1). Each site has 8–14 years of measurements. The long-term data coverage and high-temporal data resolution are sufficient for PMF modelling to capture variations in local and regional sources. Uncertainties were calculated using the equation provided in the user's guide, which is a function of the detection limit (DL) and error fraction (Norris et al., 2014). Based on pollutant tracers, factor profiles were assigned to mercury sources using known source profiles or emissions information from literature. Temperature was included in the model because it is an important driver of wildfire emissions and terrestrial Hg re-emissions (Zhu et al., 2016). The main assumption of the PMF model is that no chemical transformation takes place during atmospheric transport. Thus, we limited the input of reactive or secondary species into PMF. The input of TGM is advantageous over speciated Hg because TGM is the sum of GEM and GOM (oxidized Hg), which tends to be less impacted by chemical reactions.
PMF model runs were performed for each site separately. We ran the model using 6 factors and attempted additional runs with 5 and 7 factors (sensitivity runs in Supplement Sect. S1). The regression fit between modelled and observed TGM and the interpretability of the factors were assessed to determine the optimal number of factors. For the final 6-factor solution, the model-observed R2 values for 24 h TGM were between 0.43 and 0.75 (Supplement Fig. S1). The plots illustrate the modelled TGM reproduced the time series of the observed TGM quite well for SAT and KEJ except for a few elevated TGM concentrations at KEJ in early 2005 (residuals analysis in Sect. S2), which suggests that the final 6-factor PMF solution was a good fit to the observations.
There was one factor in the PMF solution that could represent both surface re-emissions and wildfires. To distinguish between the sources, we examined the covariance in the source contributions and regional fire radiative power (FRP) from MODIS data (NASA, 2023). We identified a FRP threshold for screening wildfire-influenced daily source contributions. Source contributions below the FRP threshold were assumed to be from surface re-emissions.
Anthropogenic and natural surface emission contributions were derived from source contributions. Factors representing local or regional combustion and secondary sulfate were classified as anthropogenic. Natural surface emissions include factors representing wildfires, terrestrial surface re-emissions (GEM re-emissions, dust resuspension), and oceanic evasion. The definition of natural surface emissions discussed in this paper does not necessarily refer to the natural origin of the emissions. Hg re-emissions from land and water surfaces originate from both natural and anthropogenic sources; however, their relative contributions remain uncertain. The Hg pool encompasses both natural surface and anthropogenic Hg emissions, mostly from the Northern Hemisphere, which is subject to long-range transport. We assumed the natural surface/anthropogenic contribution was proportional to that of global Hg emissions reported in Pirrone et al. (2010) and Streets et al. (2019), which was estimated to be 68.5 %31.5 %.
2.3 Long-term trend analysis
Long-term trend analyses were performed using the Theil–Sen slope estimator. The analysis was applied to observed daily TGM concentrations and TGM source contributions (absolute and relative), and the annual rate of change was calculated. The TGM analysis period is indicated in Table 1; however, some years of data were unavailable for statistical trend analysis. At SAT, the 2016 data did not meet the data completeness threshold (50 % of data available for each season) for trend analysis. TGM concentrations were not measured in 2017 at SAT; thus, the trend analysis was not extended to 2018. KEJ was relocated 3 km south of the original site in February 2017, and the TGM analyzer was changed from the Tekran 2537B to 2537X model. Concurrent TGM measurements at KEJ and the new site (KEB) indicate TGM was significantly higher at KEB. The monthly mean hourly TGM absolute and relative differences were 0.2–0.29 ng m−3 and 16.6 %–21.5 %. The cause of the difference may have been the change in instrument model but this is inconclusive, and therefore, the 2017–2018 data at the new site were excluded from the long-term trend analysis. Details on the model B and X measurement intercomparison are discussed in Sect. S3.
3.1 Saturna
3.1.1 Overview of TGM concentrations
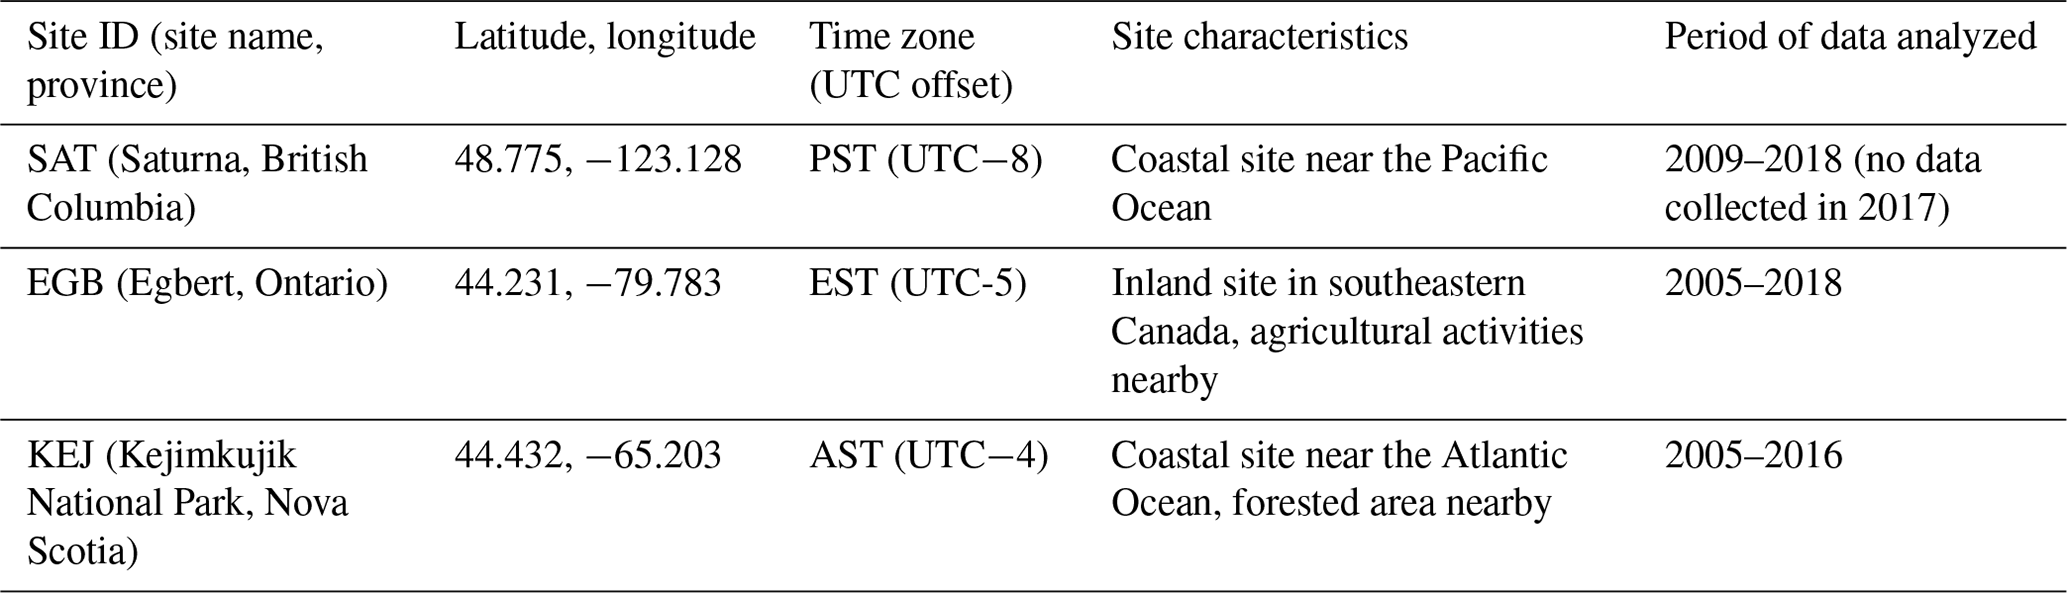
The range in annual mean TGM concentrations were 1.14–1.49 ng m−3 at Saturna (SAT) during 2009–2018. Annual descriptive statistics are summarized in Table S2. The variability in 24 h TGM was assessed using relative standard deviation (RSD). The RSD was 9.7 % and decreased over time. The 75th percentile concentrations varied between 1.22 and 1.61 ng m−3 depending on the year (Fig. 1). Mean TGM was highest in the spring (March–May) and lowest in the fall (September–November); the means were comparable for the winter (December–February) and summer (June–August). The seasonal pattern at SAT was consistent with the patterns reported for other Canadian and Northern Hemisphere rural–remote sites (Cole et al., 2014; ECCC, 2016). Diel patterns in TGM differed between seasons. The diel amplitude was 4 % for winter, 6 % for spring, 14 % for summer, and 4 % for fall. In addition to the strong diel cycle in the summer, TGM also peaked earlier (07:00–08:00 PST) than in other seasons. Spring and fall peaks in hourly TGM were broader typically occurring during 08:00–11:00 PST, whereas the hourly TGM peak occurred during 12:00–13:00 LST in the winter. Lower TGM was typically observed during the evening and nighttime. During the 2009–2018 period, the highest and lowest annual mean TGM was observed in 2010 (1.49 ng m−3) and 2015 (1.14 ng m−3), respectively (Fig. 1). Annual mean TGM decreased from 2009 to 2015 and then returned to higher concentrations in 2016 and 2018.
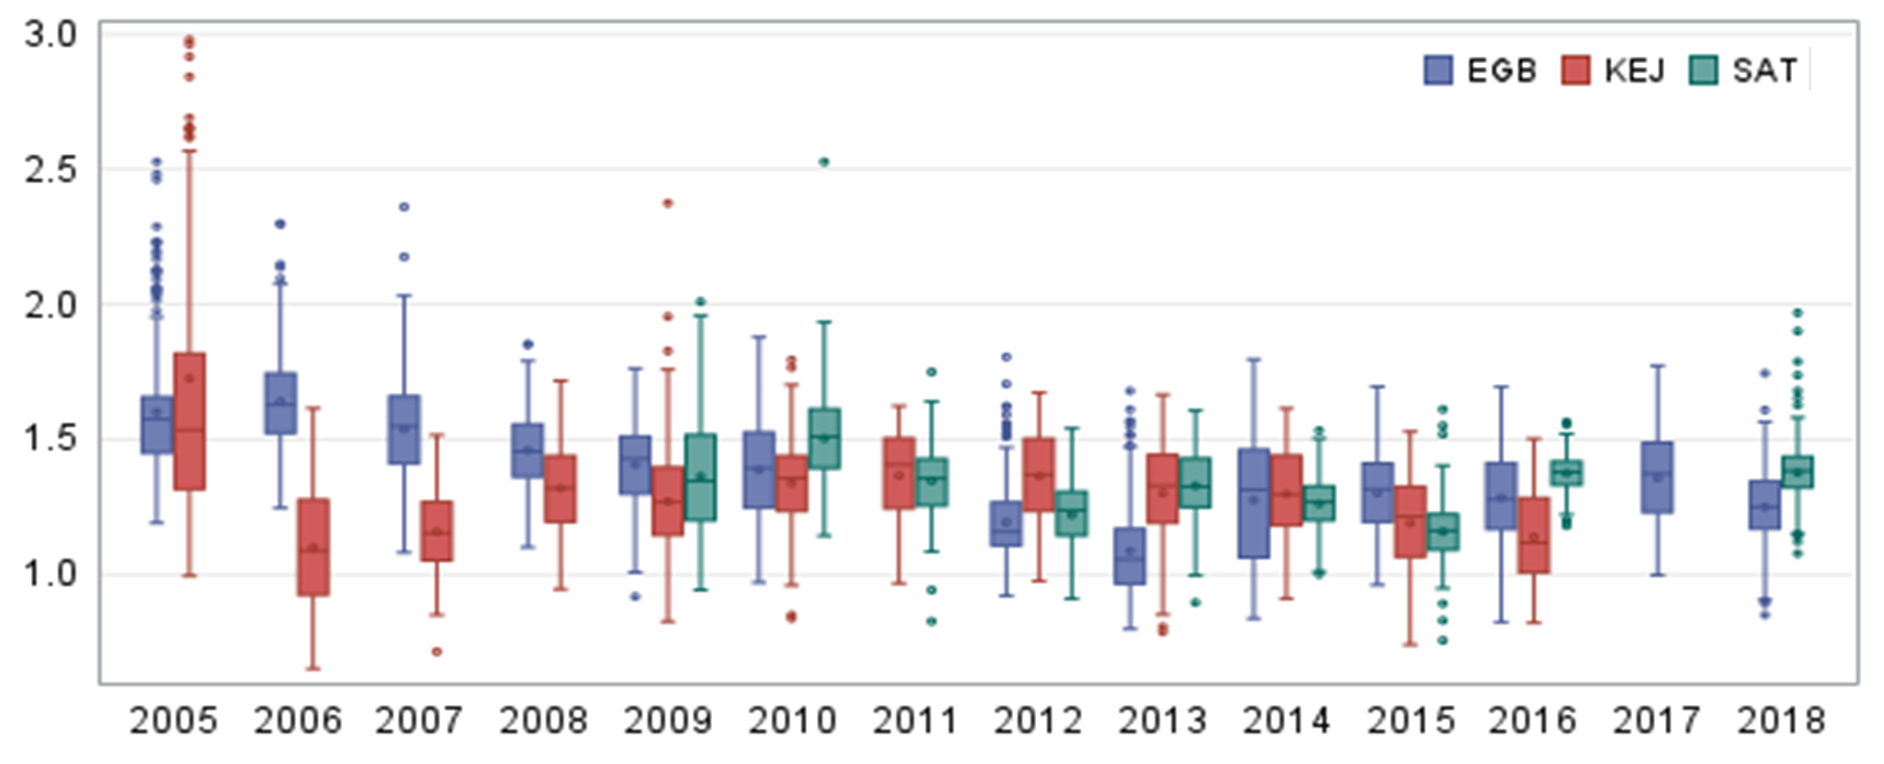
Figure 1Box-and-whisker plots of annual summary statistics of 24 h average TGM concentrations (ng m−3) at Egbert (EGB), Kejimkujik National Park (KEJ), and Saturna (SAT).
3.1.2 PMF factor profiles
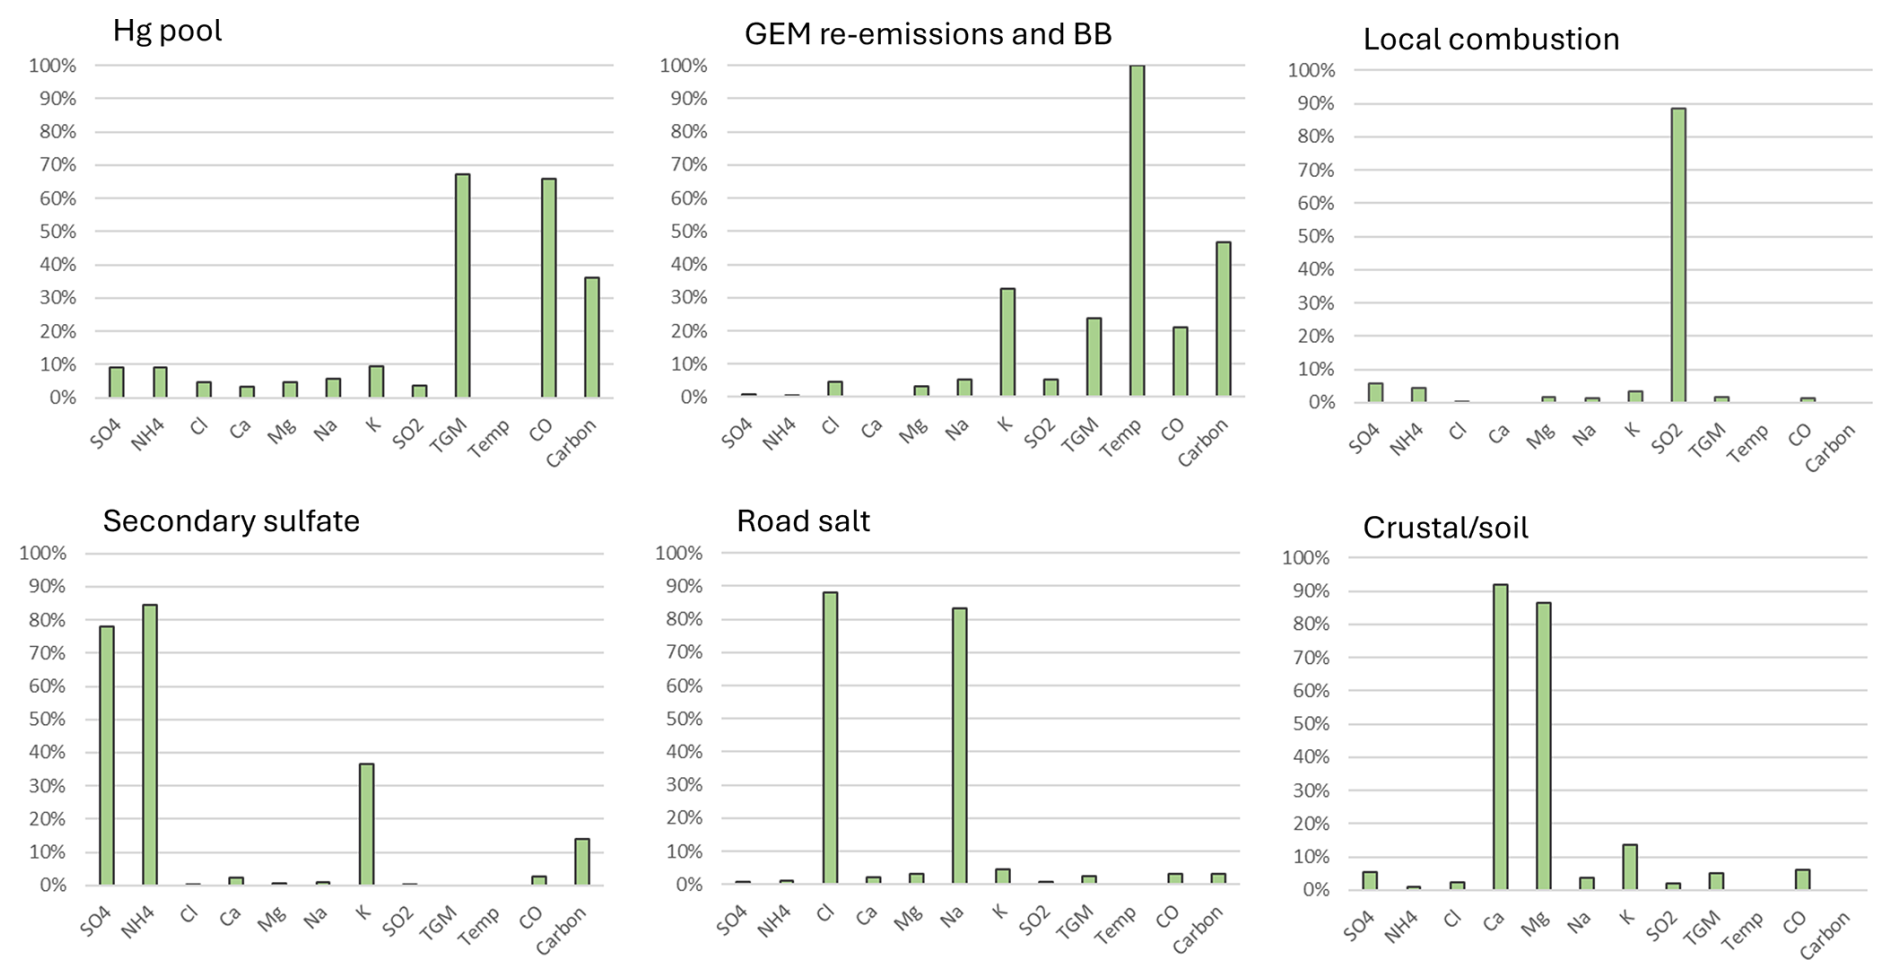
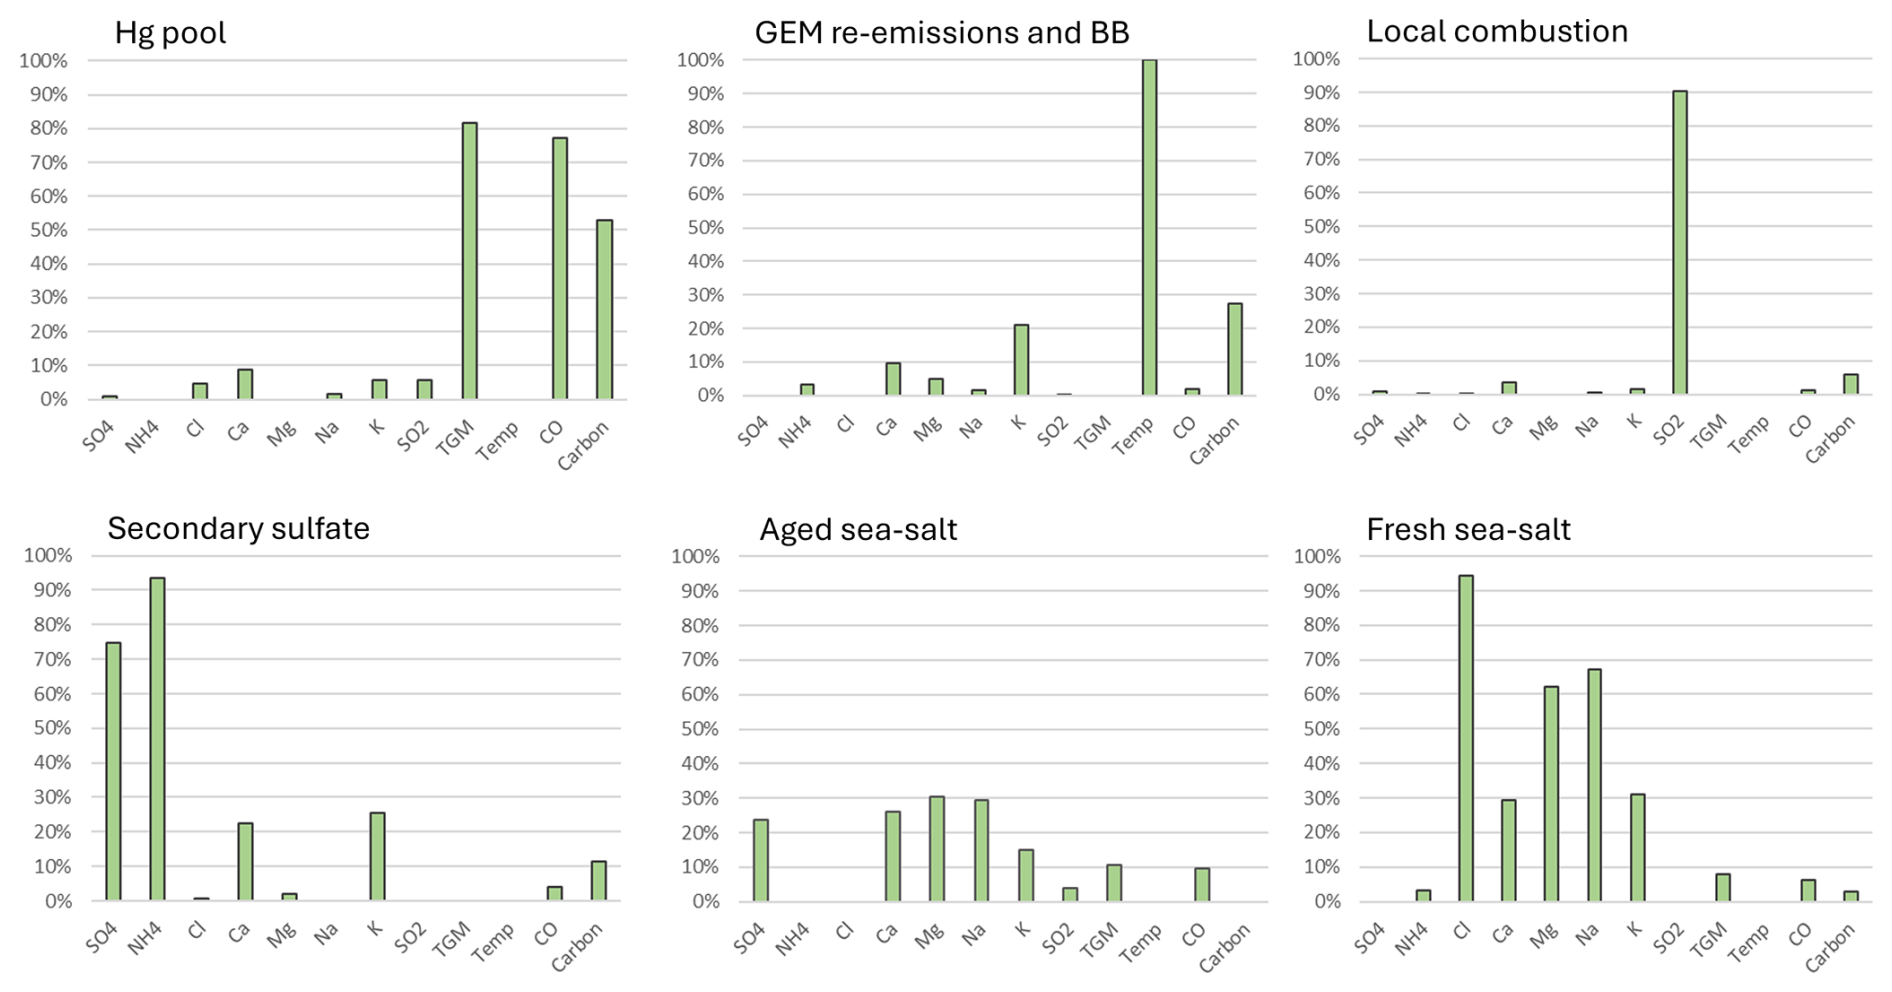
PMF model runs were undertaken for the 2010–2018 period, and six factors were generated. Based on the analysis of key variables, the factors represented aged sea-salt aerosols (SSAs), fresh SSA, local combustion, the Hg pool, secondary sulfate, and terrestrial GEM re-emissions/biomass burning (BB). The aged SSA factor was characterized by moderate abundance of Ca2+, Mg2+, and Na+; elevated SO; and negligible Cl− (Fig. 2), which is a result of the chemical reaction between fresh SSA and acidic compounds. In contrast, the fresh SSA factor had high abundance of Na+ and Cl− and an absence of SO. The TGM percentage in the aged and fresh SSA factors was 10 % and 6 %, respectively. Na+ and Cl− represent a potential marine source of Hg, such as oceanic Hg evasion or shipping emissions. The local combustion factor was characterized by high abundance of SO2 (88 %). SO2 is a short-lived pollutant (lifetime of a few days) and is emitted in large quantities from combustion sources, especially coal combustion and metal smelting, which are also important anthropogenic Hg sources. The TGM percentage in the combustion factor was only 3 %. The Hg pool was identified based on the high abundance of CO (55 %). The Hg pool consists of natural, anthropogenic, and re-emitted Hg mostly from the Northern Hemisphere that is subject to long range transport (Selin and Jacob, 2008). CO is emitted from fossil fuel combustion and wildfires. It has a longer lifetime in the order of a few months compared with SO2, which allows for it to be transported long distances by advection (Jeffery et al., 2024) and accumulate in the hemispheric background. This characteristic is similar to that of GEM and TGM. The TGM abundance was the highest in this factor (50 %). The secondary sulfate factor had moderate abundance of SO and high abundance of NH; these chemical species were likely produced via the reaction between gaseous ammonia and acidic gases. TGM was not present in this factor. The last factor was representative of GEM re-emissions/BB, identified by temperature (100 %), total carbon (53 %), and K+ (14 %). The TGM percentage in this factor was 30 %. Warm temperatures are conducive to the production of wildfires and GEM volatilization from land and water surfaces. Total carbon and K+ are also typically emitted from wildfires. The K+ percentage for the re-emissions/BB factor was not greater than that of other factors because this factor is only partially related to wildfires. GEM re-emissions would not be associated with K+. As well, K+ can also be released from the continental crust, soil, and vegetation (Zhang et al., 2008) and is very common in pollen (Lee et al., 1996). Since SAT is a coastal site, the source of K+ may include SSA. Potassium is also associated with coal combustion (Yu et al., 2018), although this is less likely the case for the rural–remote sites in this study.
3.1.3 Overview of TGM source contributions
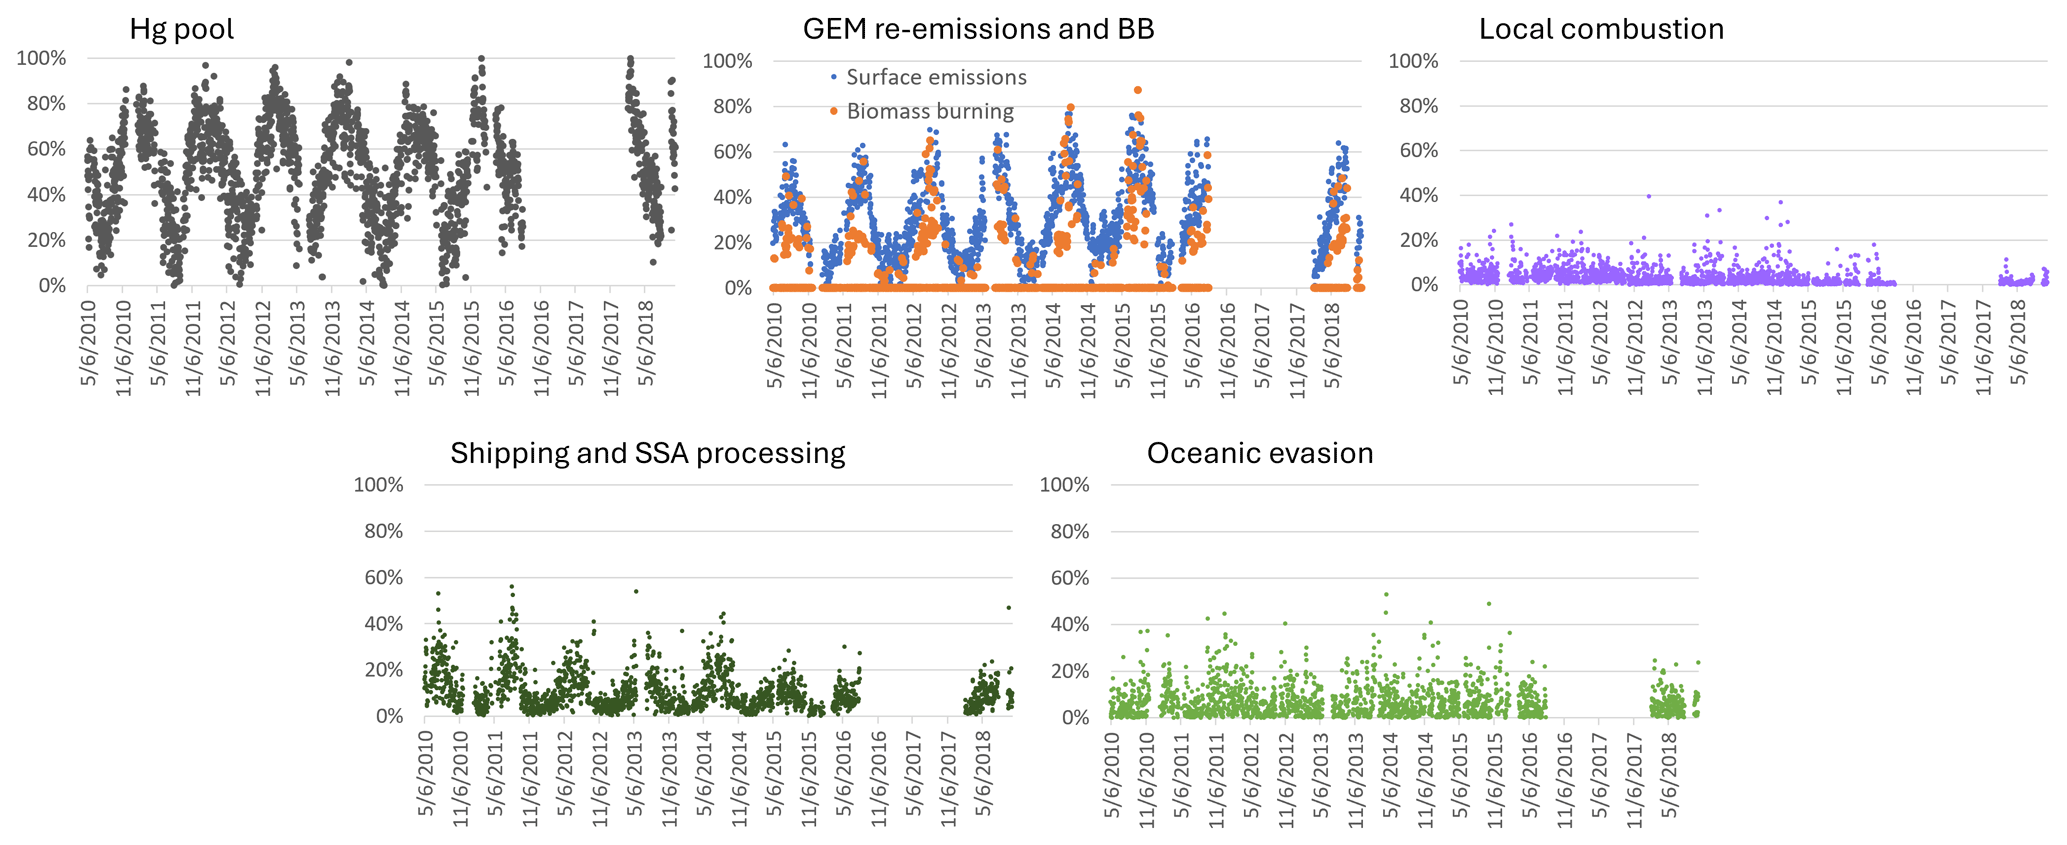
The mean relative contribution to annual TGM for the 2010–2018 period at SAT was 70.7 % from natural surfaces, with the remainder from anthropogenic emissions. This corresponds to mean annual TGM contributions of 0.92 and 0.38 ng m−3, respectively. The breakdown of TGM source contributions (concentrations and percentage basis) is shown in Fig. 3. TGM was apportioned to the Hg pool (50 %), terrestrial GEM re-emissions (26 %), shipping emissions and SSA processing (10 %), and oceanic evasion (6.3 %). Wildfires (3.7 %) and local combustion (3.1 %) contributed a small fraction of the annual TGM. Shipping emissions in the ports of Vancouver and Victoria and along the Strait of Georgia had been a significant source of SO2 and PM2.5 because of the high sulfur content in marine fuels prior to regulations taking into effect in 2012 (Anastasopolos et al., 2021). Marine fuels also contain heavy metals, such as V, Ni and Hg. As SO2 is transported downwind and undergoes chemical transformation, acidic gases react with fresh SSA in the marine boundary layer (MBL), resulting in the formation of aged or processed SSA. Oceanic evasion of GEM was inferred from the fresh SSA factor, since both GEM and SSA are emitted from the ocean surface. The Hg pool contributed a larger TGM percentage in the cold season than the warm season (67 % vs. 36 %). In contrast, GEM re-emissions, wildfires, and shipping emissions and SSA processing contributed larger TGM fractions in the warm season than in the cold season. The TGM wildfire contribution for the warm season was 6.6 %. For terrestrial GEM re-emissions, the TGM contribution in the warm season was more than double that of the cold season.
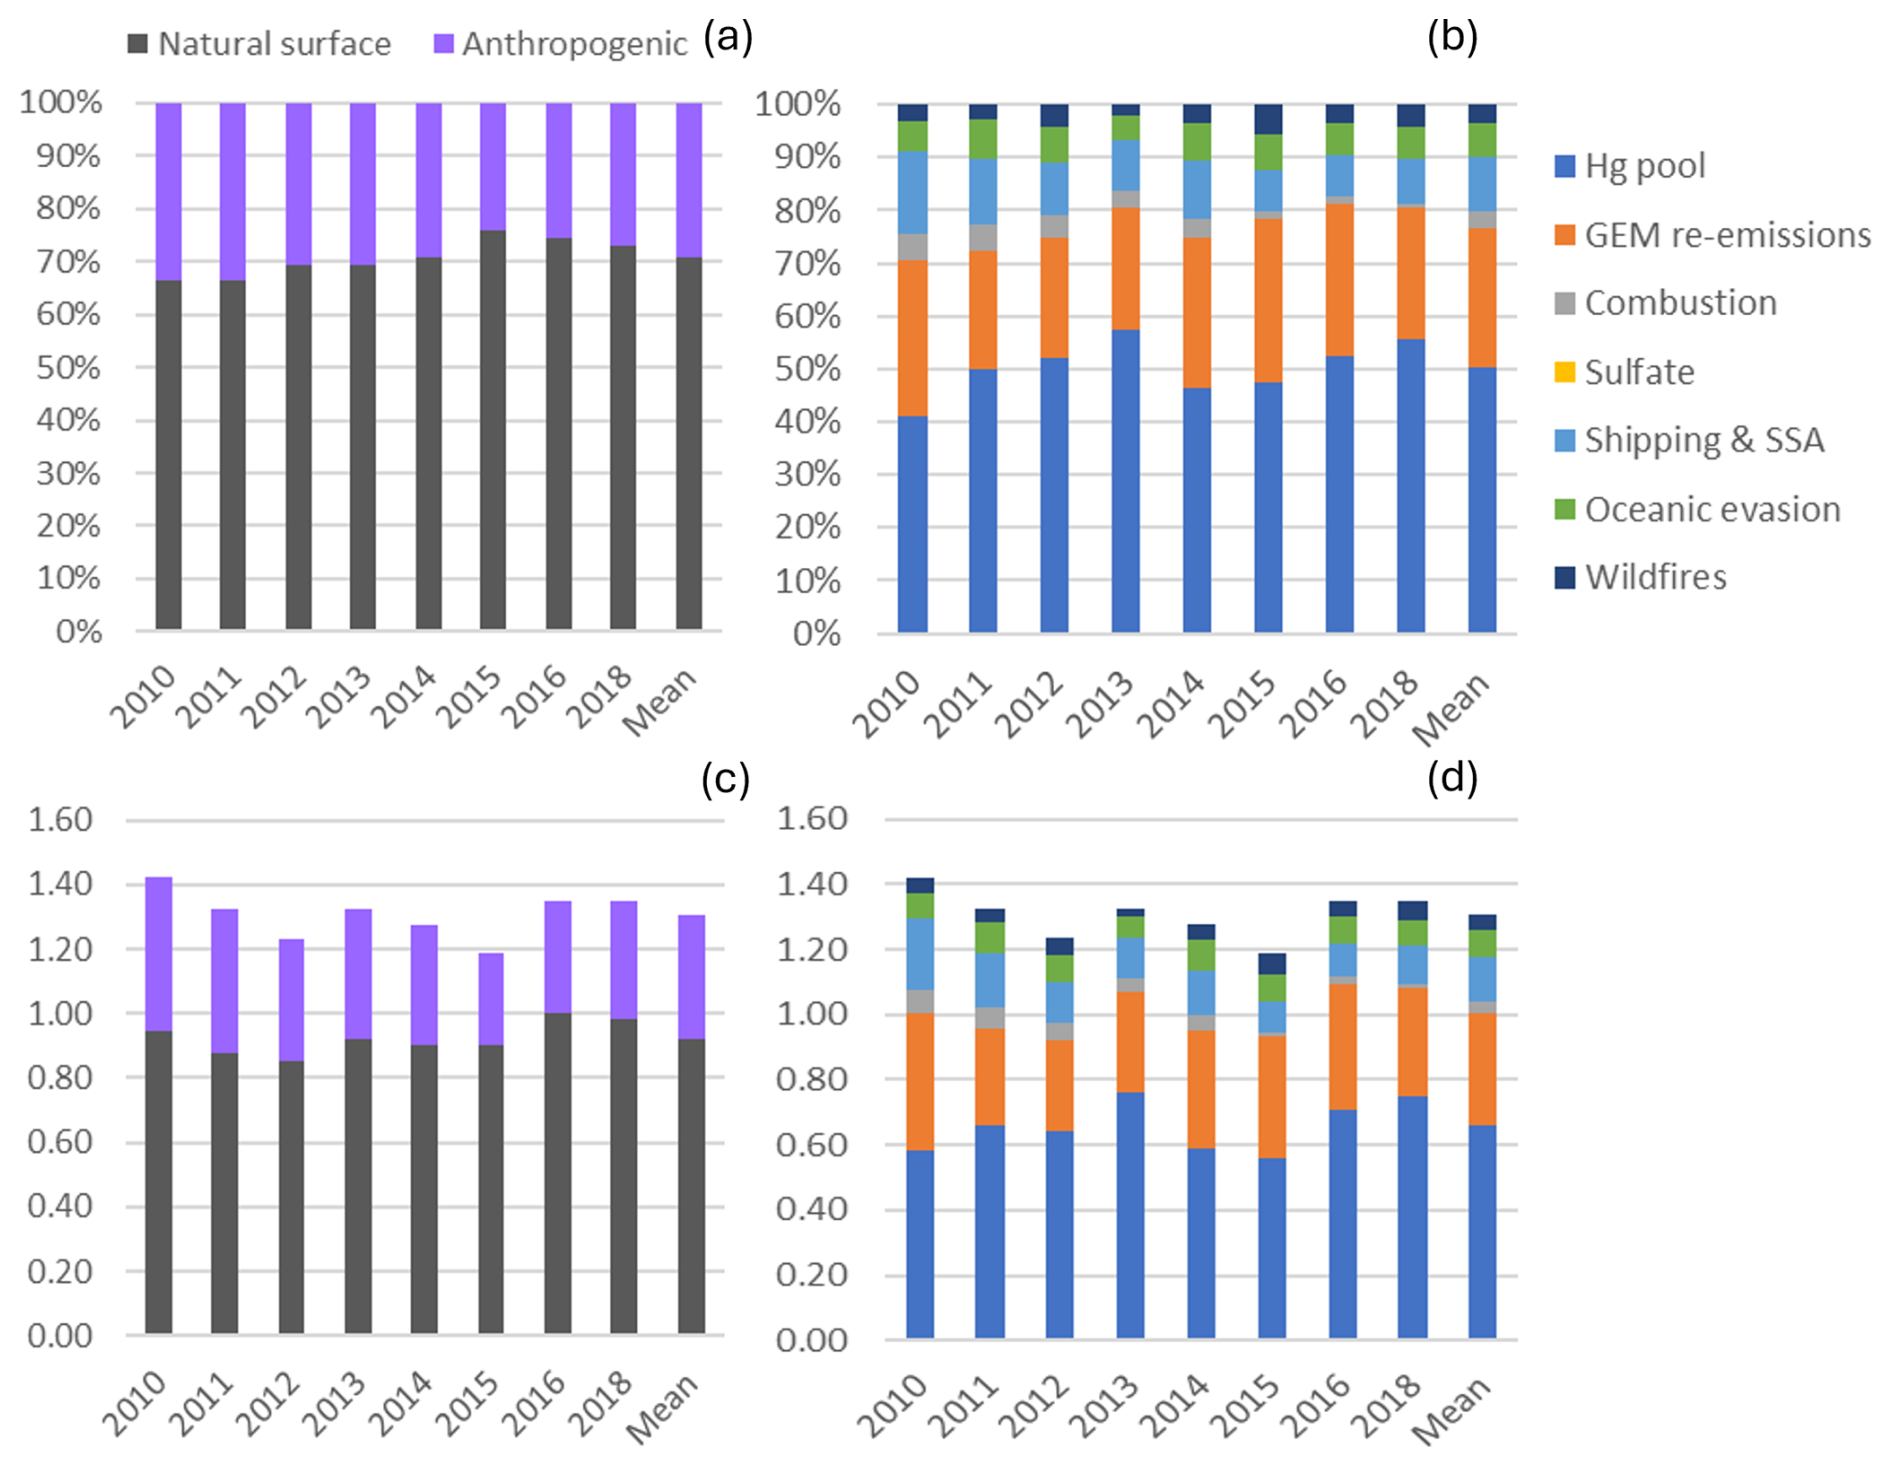
Figure 3Impact of natural surface emissions, anthropogenic emissions, and individual emission sources on annual TGM at Saturna (SAT). Panels (a) and (b) plots are relative contributions, and panels (c) and (d) are contributions expressed in concentrations (ng m−3). Mean applies to the 2010–2018 period except 2017. Natural surface emissions comprise wildfires, GEM re-emissions, oceanic evasion, and natural surface emissions contributing to the Hg pool. Anthropogenic emissions comprise local combustion, sulfate, shipping and sea-salt processing, and anthropogenic emissions contributing to the Hg pool.
3.1.4 Interannual and daily variability
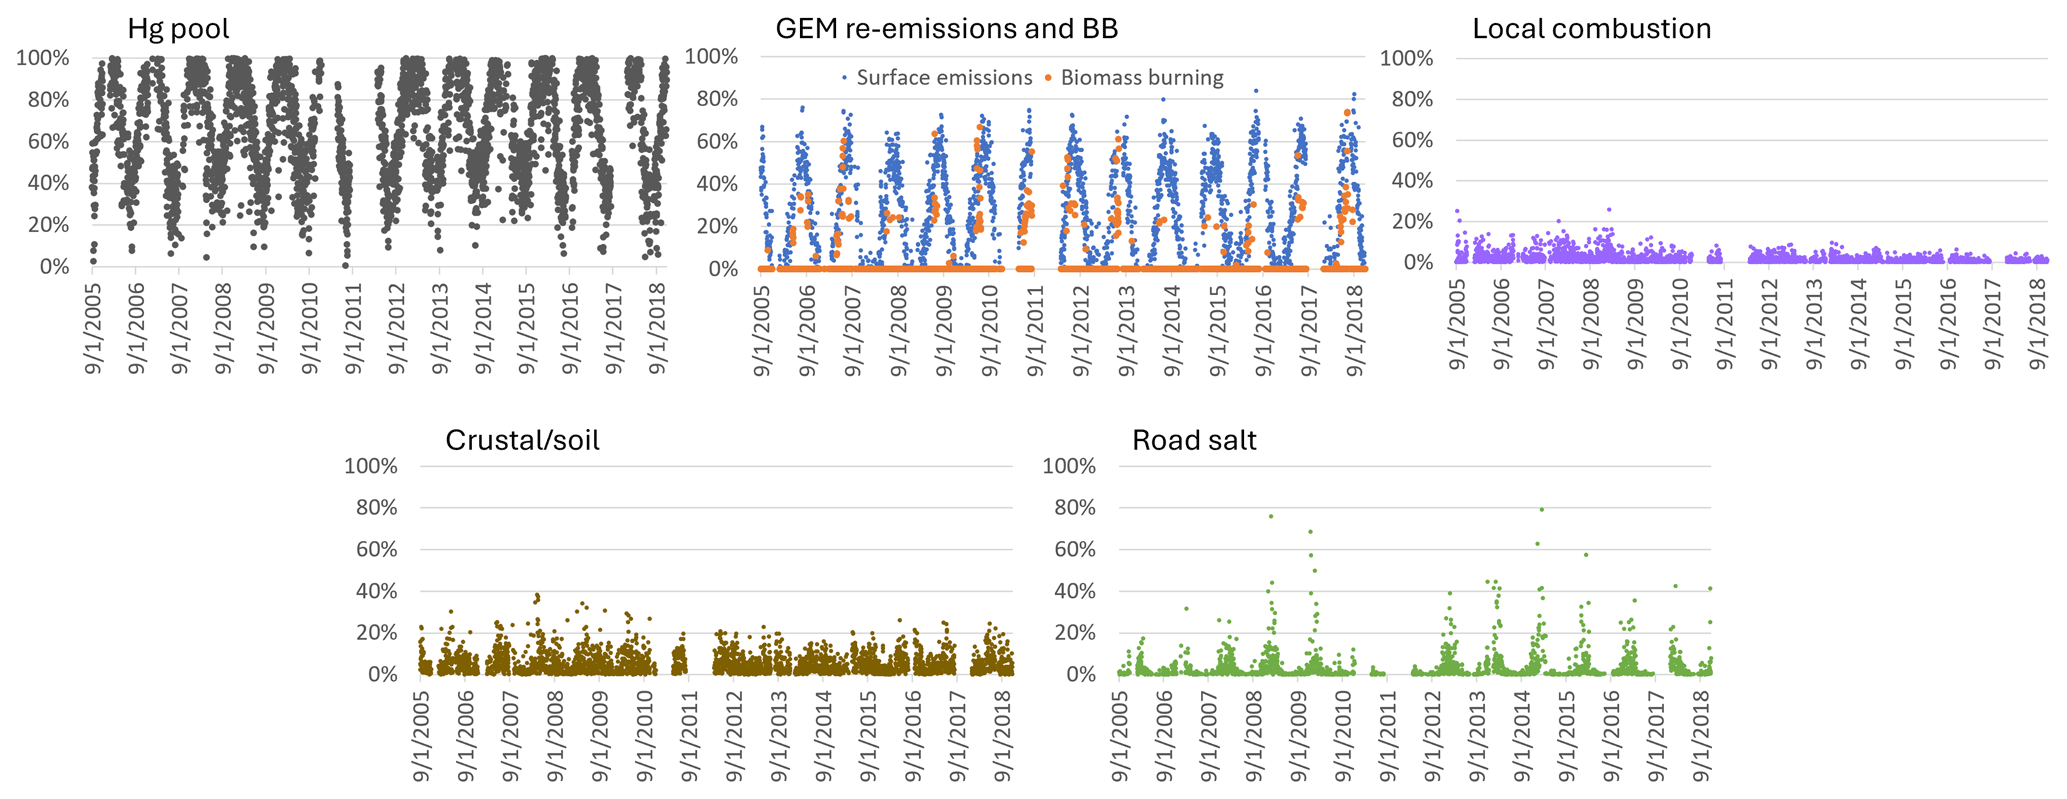
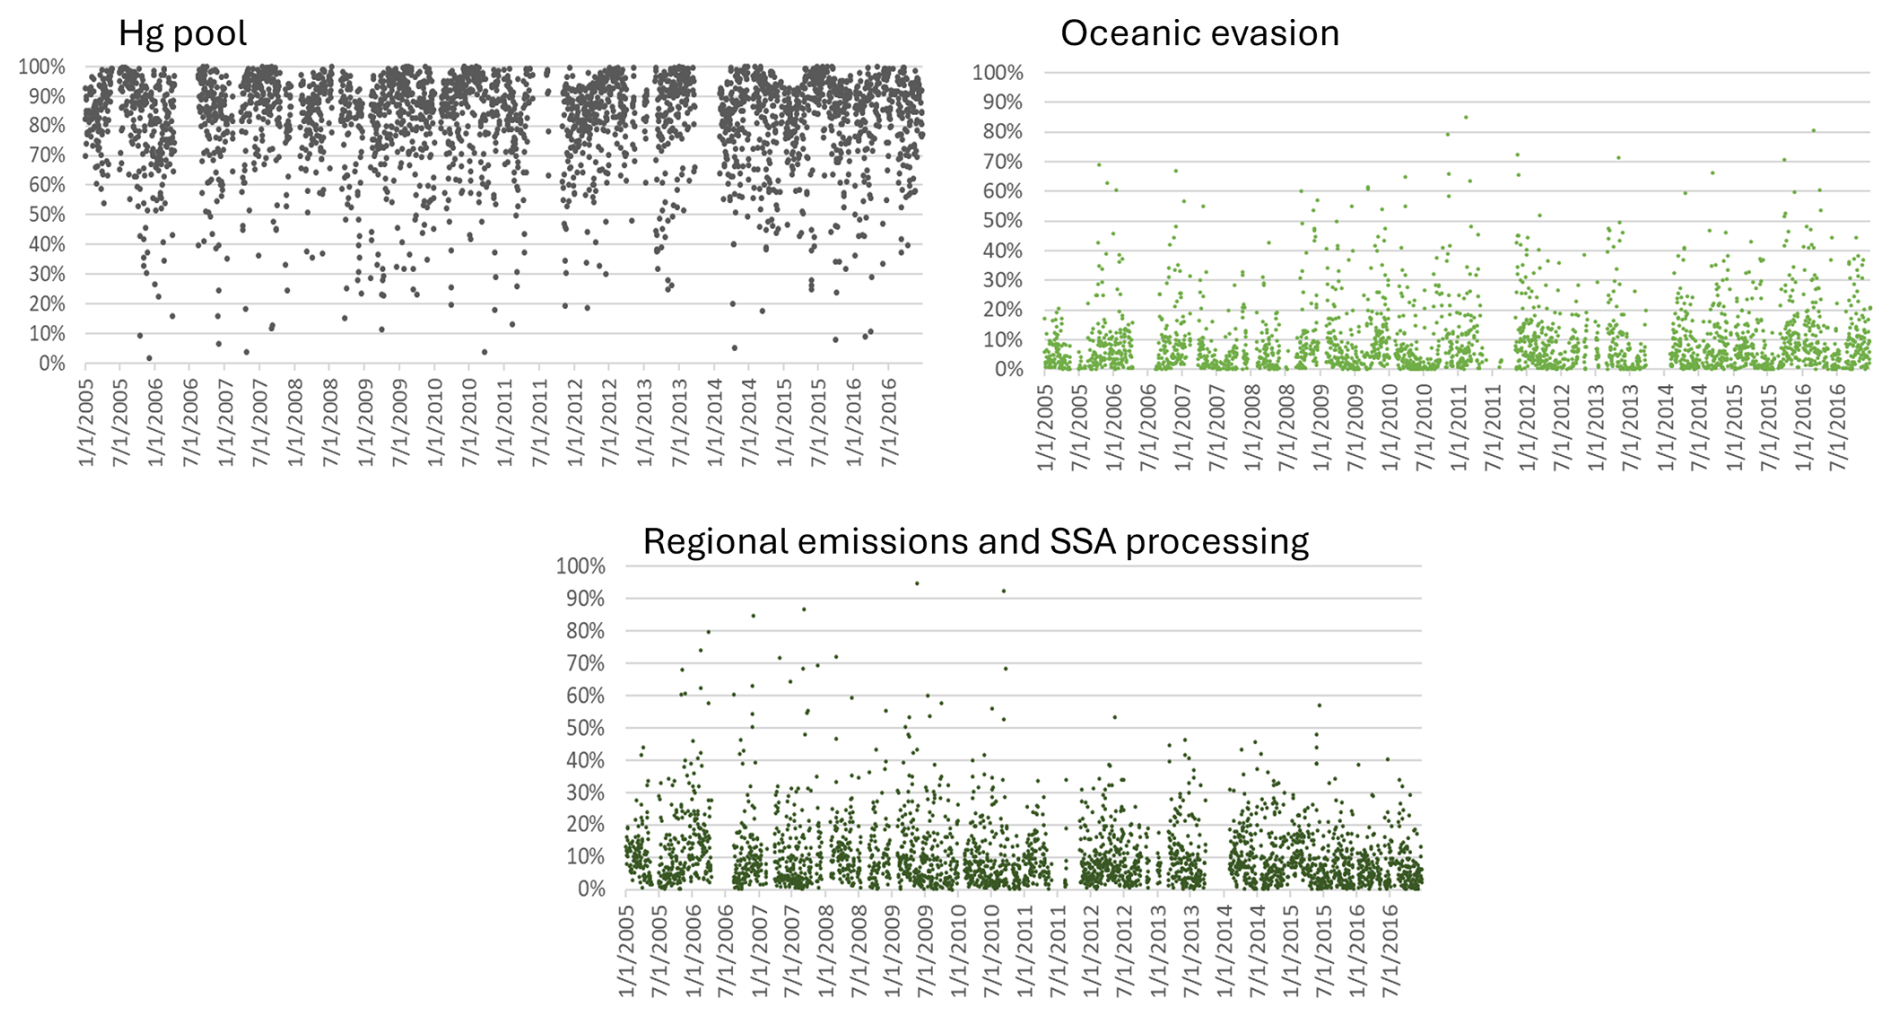
Interannual variability in the relative contribution of anthropogenic TGM was in the range of 24 %–34 % (Fig. 3). Anthropogenic contributions from local combustion and shipping emissions and SSA processing were more important during 2010–2014. Natural surface contributions of TGM include those from terrestrial and marine re-emissions, which varied interannually by 22 %–31 % and 4.7 %–7.4 %. There were also enhanced TGM contributions from wildfires in 2012, 2015, and 2018 (7 %–10 % in the warm season). In 2018, for example, the total number of fires and the area burned in British Columbia were 39 % and 3 times, respectively, above the 2010–2018 average (Government of British Columbia, 2025). Wildfire characteristics, such as location, area burned, and type of biomass burned, can change year to year and lead to variability in the wildfire Hg emissions. The impact of wildfires and oceanic evasion on SAT also depends on transport patterns and meteorology, which vary interannually. Figure 4 shows the variation in the daily percentage TGM contributions from natural surface and anthropogenic emissions for SAT and other sites. Relative contributions from natural surface emissions exceeded anthropogenic emissions except on a few occasions. Natural surface emissions contributed 60 %–90 % to daily TGM on most days and were greater during summertime. The corresponding plots for individual source contributions at SAT are shown in Fig. 5. There were pronounced seasonal patterns for the TGM contributions from the Hg pool, terrestrial GEM flux, wildfire, and shipping and SSA processing. Relative TGM contributions exceeded 90 % during winter and fell below 30 % during summer (Fig. 5). Daily TGM contributions from the Hg pool exceeded 1 ng m−3 on a regular basis across the time series. Those from GEM re-emissions and wildfires were rarely above 1 ng m−3. Relative TGM contributions from shipping and SSA processing followed a seasonal pattern with peaks during the warm months. Local combustion and oceanic evasion contributions to daily TGM were episodic, occasionally exceeding 30 %.
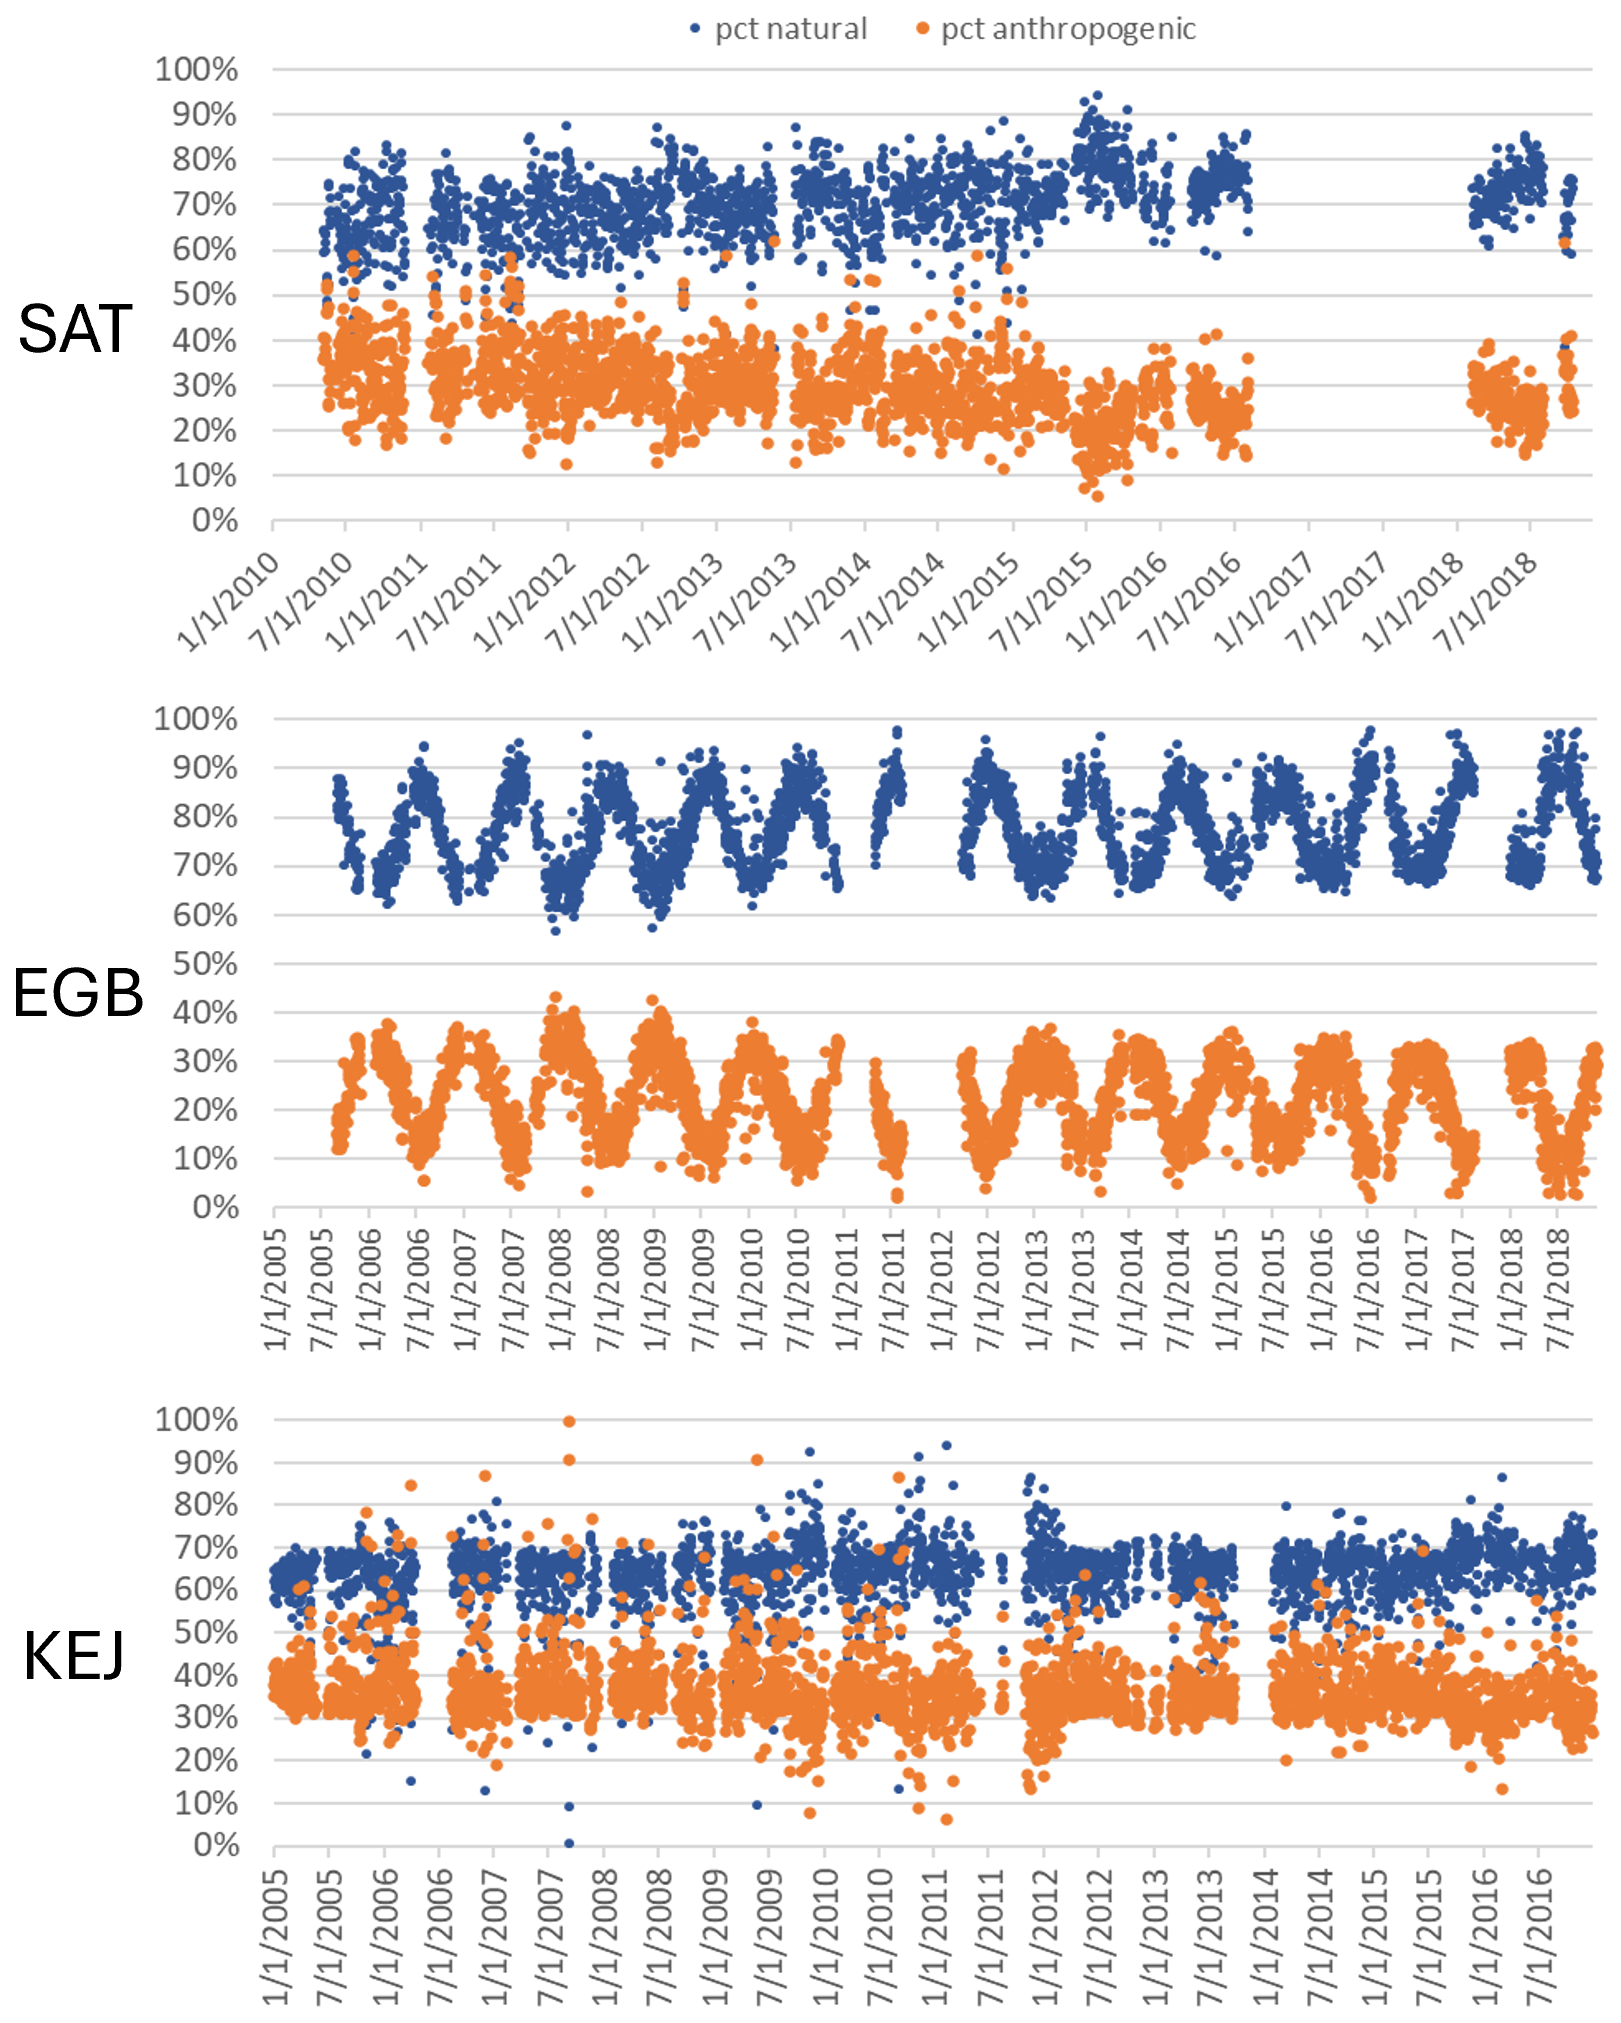
Figure 4Relative contributions of natural surface (wildfires plus re-emissions) and anthropogenic emissions to daily TGM at SAT, EGB, and KEJ.
3.1.5 Long-term trends
Statistical trend analysis was performed on long-term TGM measurements and PMF-modelled TGM source contributions to assess potential causes of TGM trends. Both the observed and PMF-modelled TGM showed decreasing trends at SAT for the 2010–2015 period with magnitudes of −0.0497 ng m−3 yr−1 and −0.033 ng m−3 yr−1 (p < 0.05) (Fig. 6). TGM contributions from shipping and SSA processing and local combustion showed statistically significant decreasing trends (Table 2). The magnitudes of the trends were −0.021 and −0.011 ng m−3 yr−1, respectively. Long-term trends in TGM contributions from the Hg pool, terrestrial re-emissions, oceanic re-emissions, and wildfires were not statistically significant. Shipping emissions and SSA processing contributions were noticeably greater during 2010–2012. The stronger signature in the earlier period was likely due to higher SO2 concentrations from shipping, resulting in enhancements of acidic compounds in the air to react with fresh SSA. After regulations to limit sulfur content in marine fuels were implemented in 2012, there were substantial decreases in both SO2 and PM2.5 concentrations near Canadian port cities (Anastasopolos et al., 2021). According to the Canadian emissions inventory, in addition to SO2 emissions, Hg emissions from marine transportation also decreased from 2010 to 2015 (Fig. S2). This was likely a co-benefit of reducing sulfur in marine fuels. SO2 and Hg emissions in 2015 were 3.6 % and 5.4 %, respectively, of the 2010 levels. Furthermore, the decreasing trend in TGM from local combustion was consistent with the trend in Hg combustion emissions within 150 km of SAT (Fig. S3). There was a ∼22 % reduction in Hg emissions from primary metal production and cement/non-metallic mineral production in the local area during 2011–2015 (Fig. S3).
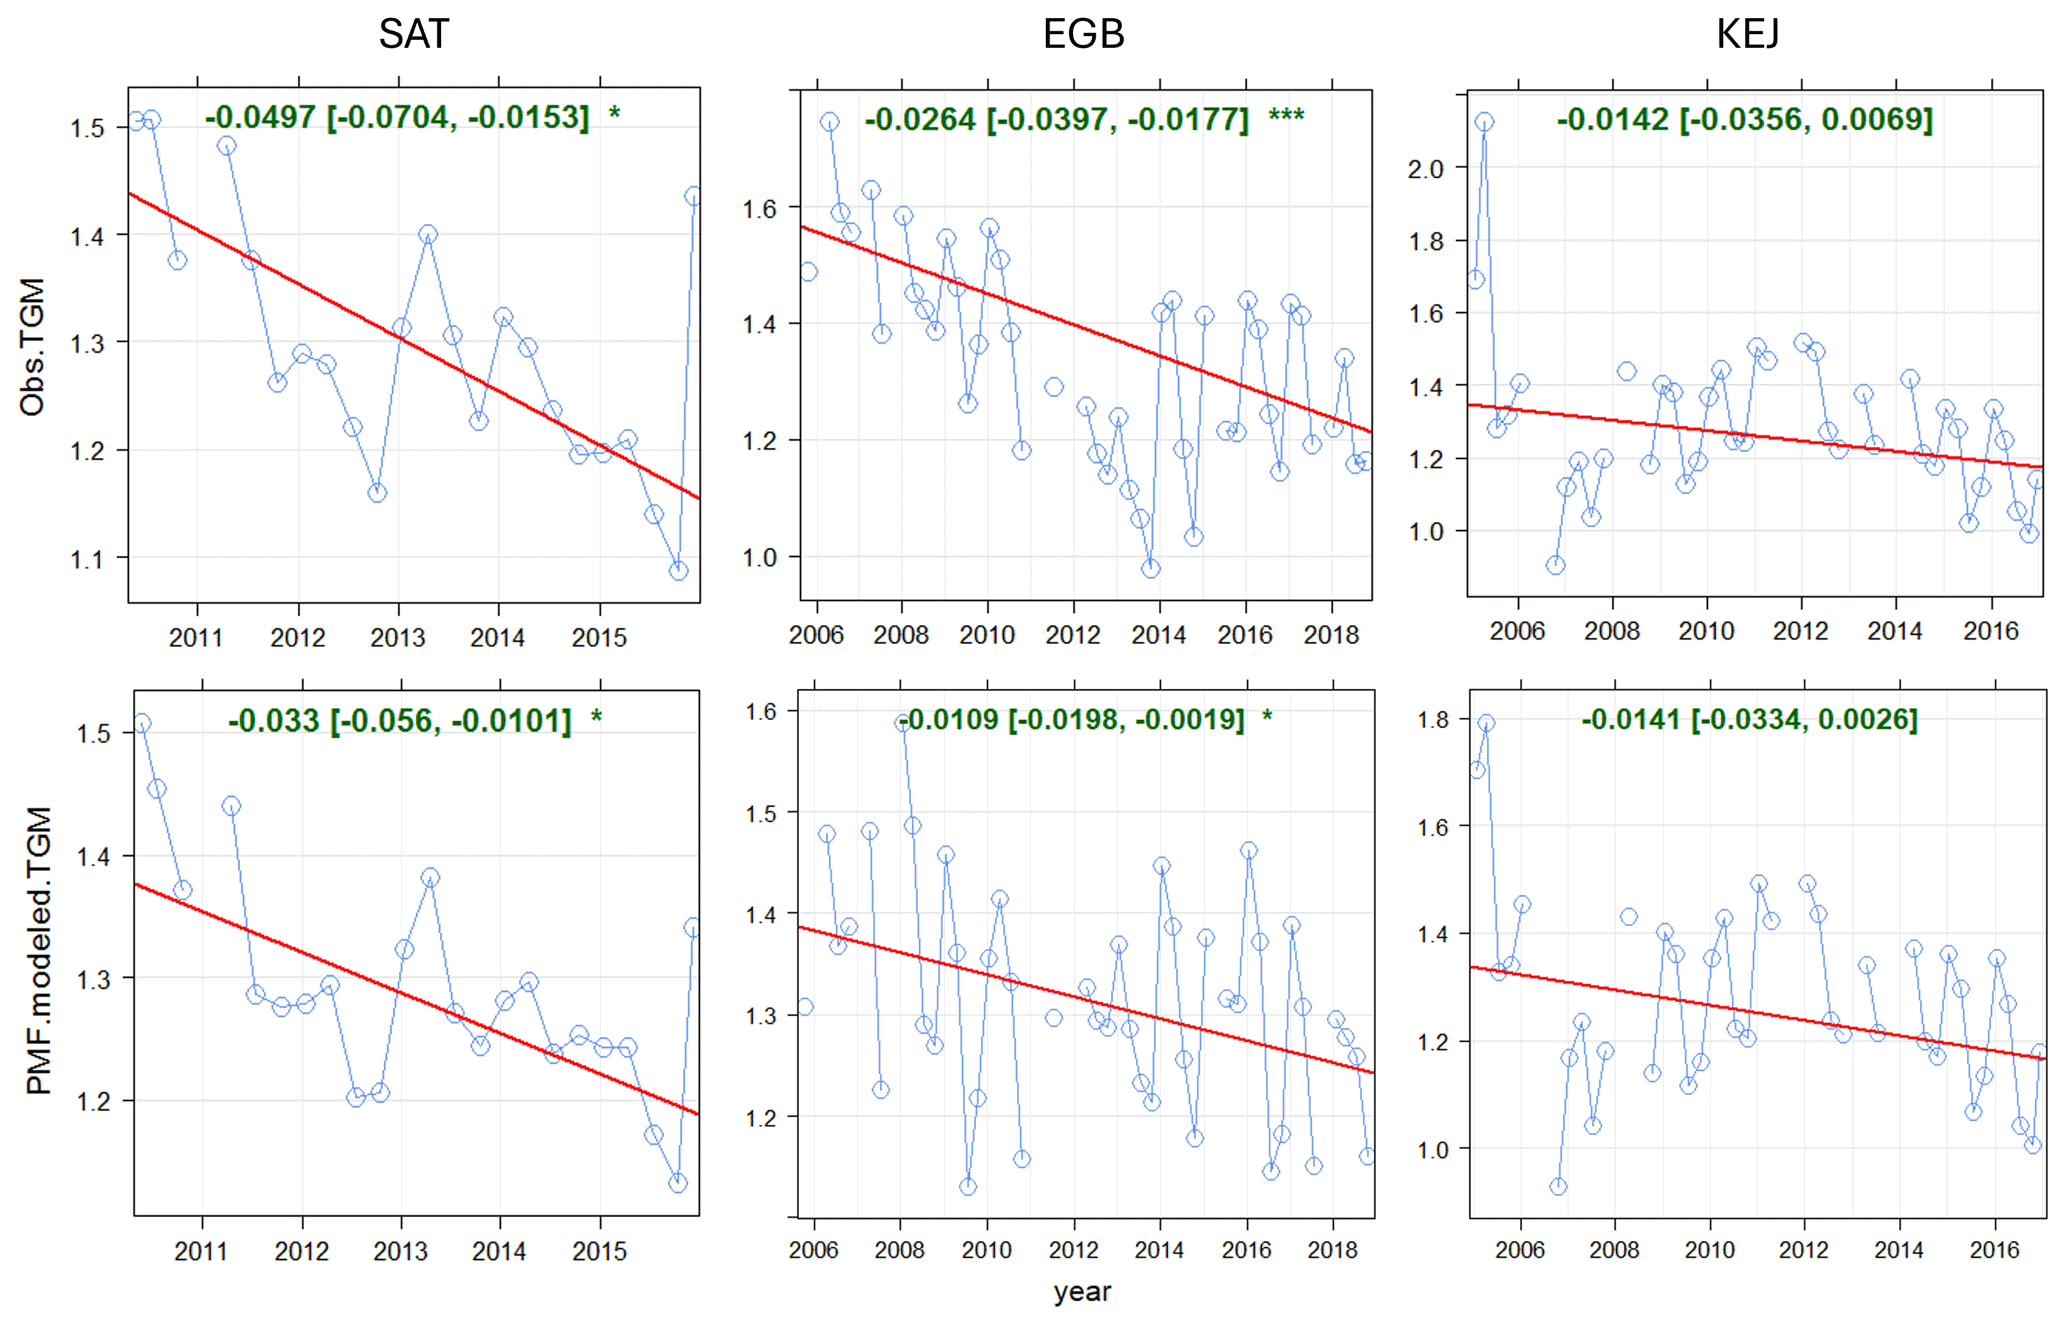
Figure 6Long-term trends in observed and PMF-modelled TGM concentrations at SAT, EGB, and KEJ. Blue line: observed or modelled TGM; red line: trend line; green text: slope of the trend line (ng m−3 yr−1).
Table 2Long-term trends in TGM concentrations and source contributions from the PMF model. SAT: 2010–2015, EGB: 2005–2018, KEJ: 2005–2016. Statistically significant (p<0.1) trends are shown in bold. Note that NA represents not available.
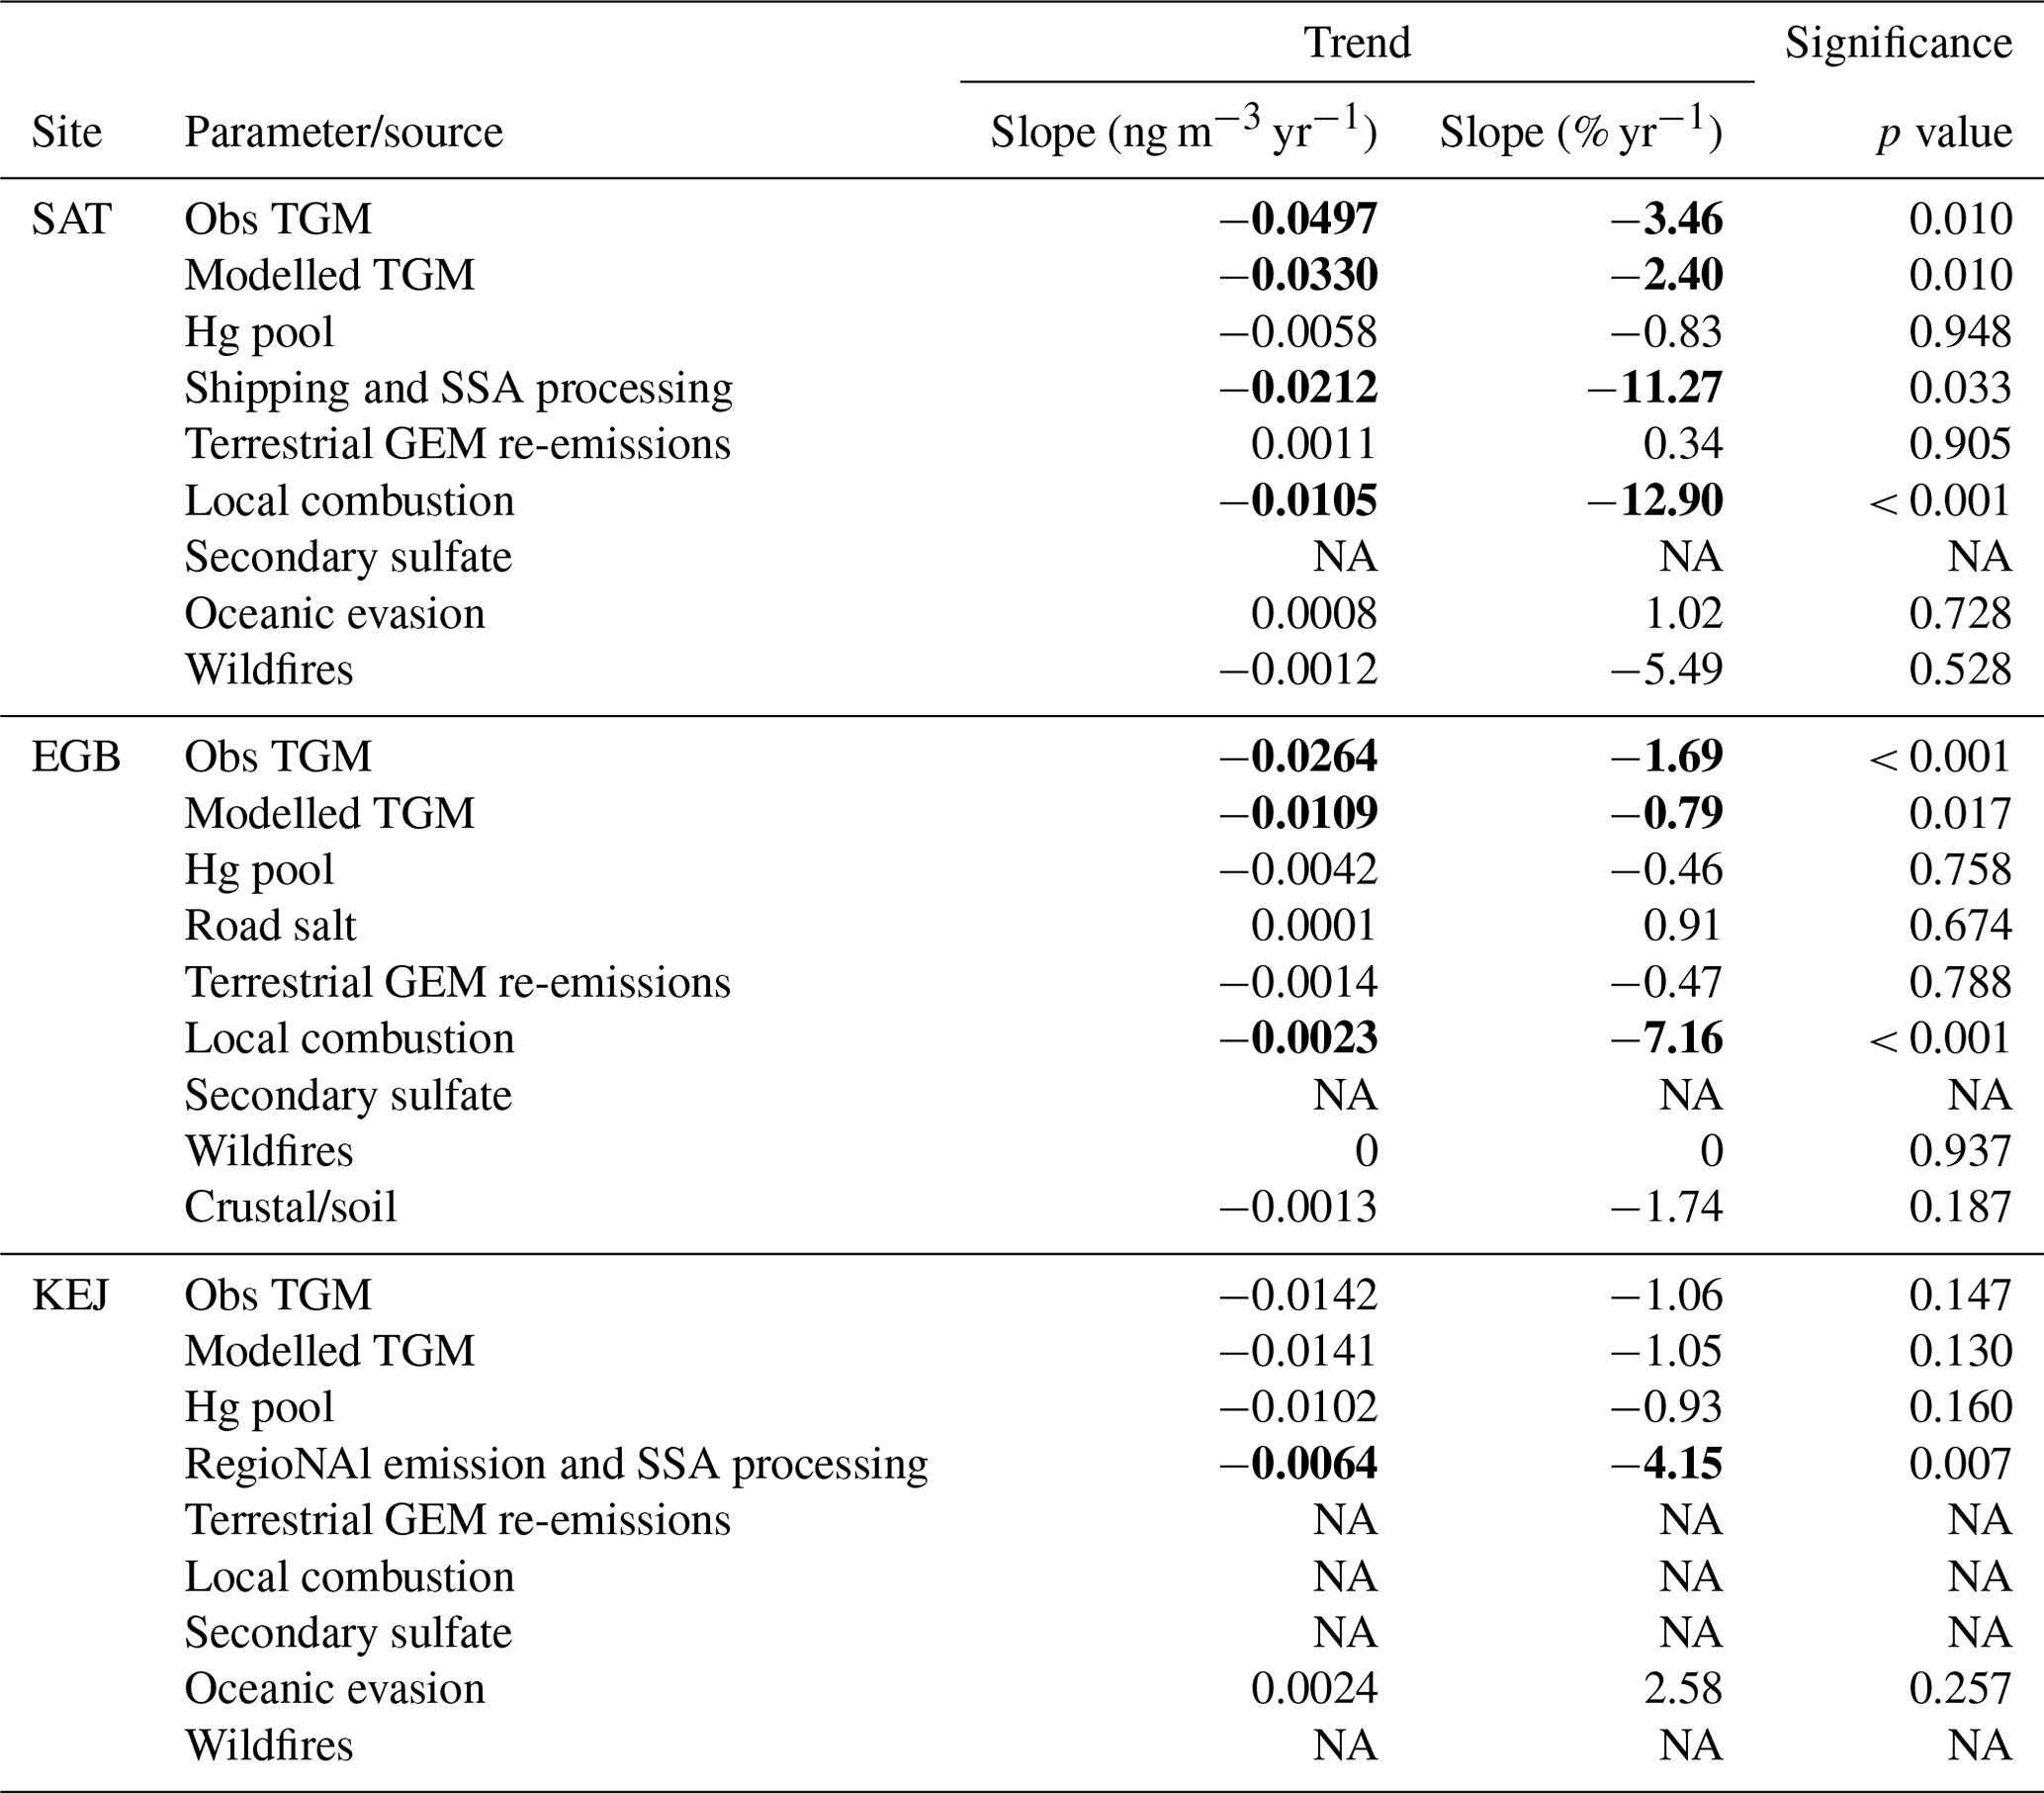
Figure 7 shows the trend analysis results for the relative source contributions to annual TGM. The percentage contribution from anthropogenic Hg emissions decreased by 1.82 % yr−1 (p < 0.001) during 2010–2015. The decline was driven by the reduction in the percentage contribution from shipping emissions and SSA processing (−1.45 % yr−1, p < 0.1) and that from local combustion (0.75 % yr−1, p < 0.001). Relative contributions from other sources did not show significant trends over time. Overall, natural surface emissions contributions are increasing at SAT because of declining anthropogenic Hg emissions.
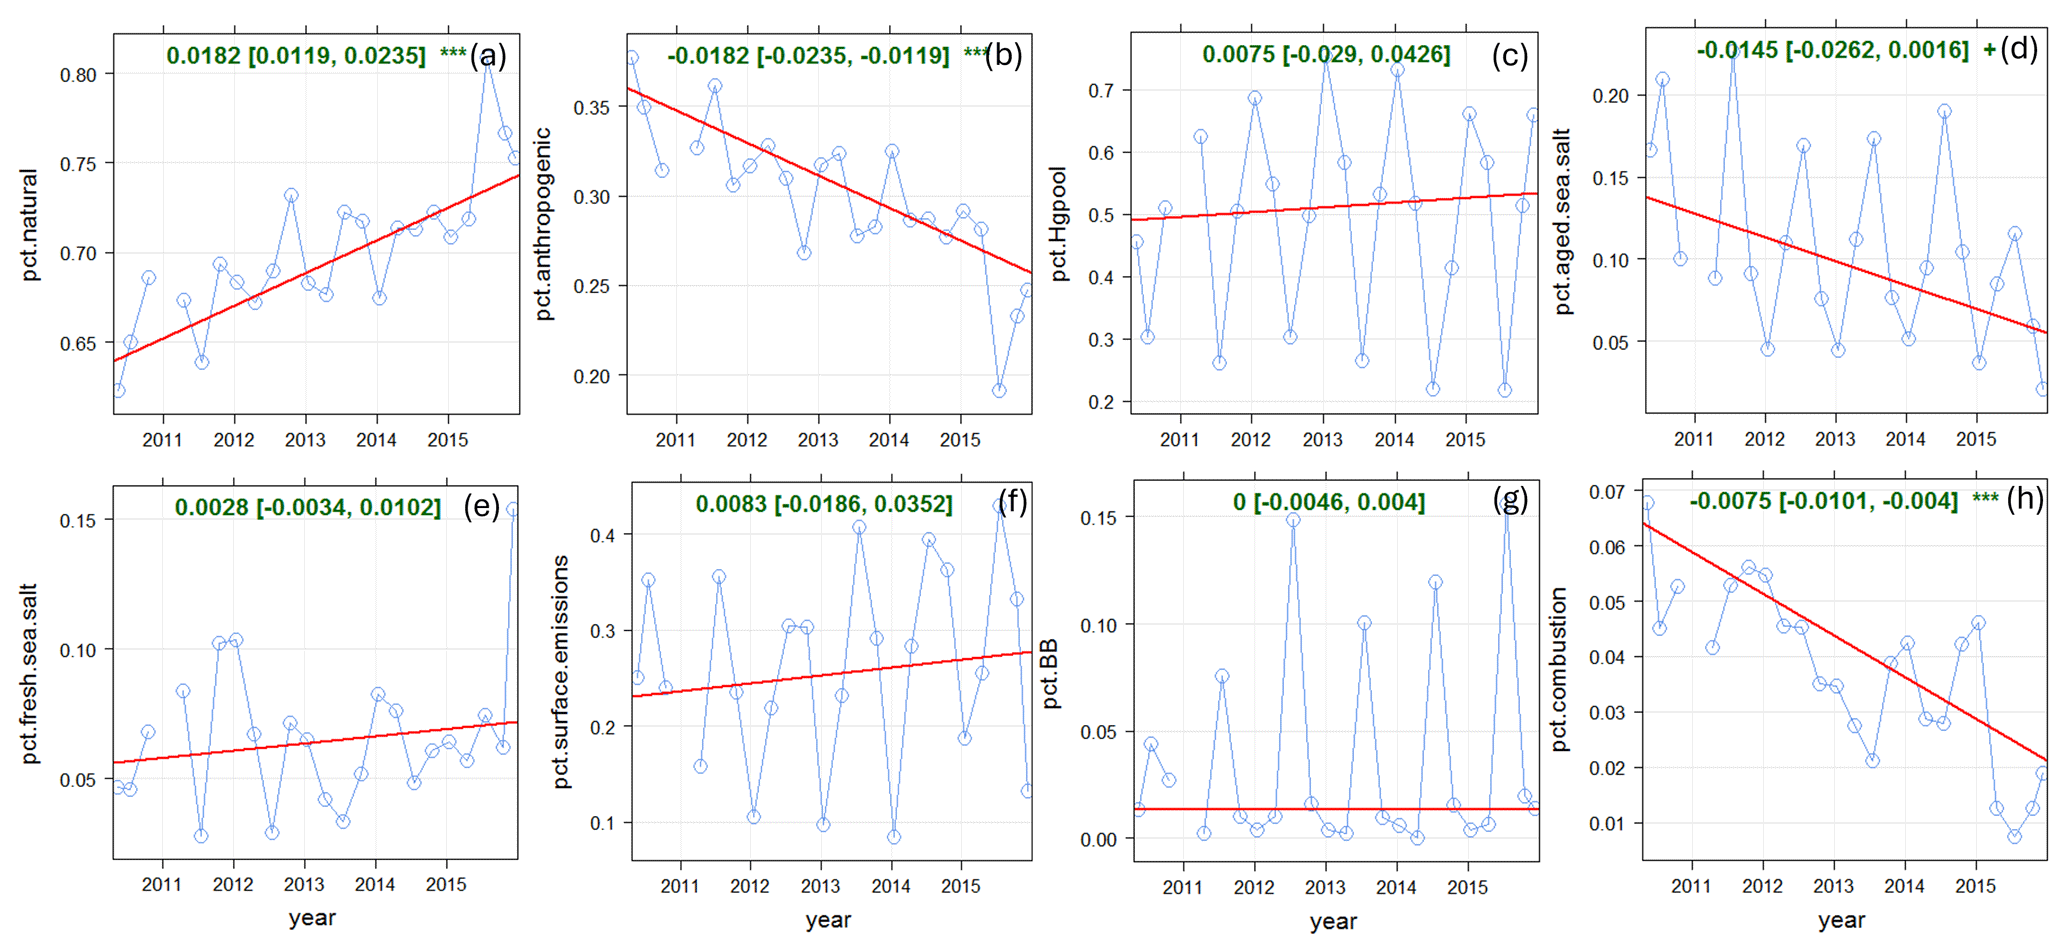
Figure 7Long-term trends in relative source contributions at SAT. (a) Natural surface emissions (wildfires plus re-emitted Hg), (b) anthropogenic emissions, (c) Hg pool, (d) shipping and SSA processing, (e) oceanic evasion, (f) GEM re-emissions, (g) biomass burning, and (h) local combustion. Blue line: relative contributions; red line: trend line; green text: slope of the trend line (× 100 % yr−1).
3.2 Egbert
3.2.1 Overview of TGM concentrations
The range in annual mean TGM concentrations was 1.08–1.64 ng m−3 at Egbert (EGB) during 2005–2018 (Fig. 1; Table S2). The RSD of 24 h mean TGM was 13.3 % and varied from year to year. The 75th percentile concentration ranged between 1.17 and 1.75 ng m−3 at EGB depending on the year (Fig. 1). The mean TGM was highest in the winter followed by spring, summer, and fall, respectively. The TGM diel amplitude was 4 %–5 % for winter to summer and 7 % in the fall. All seasons showed a broad daytime TGM peak, in which the maximum occurred during 11:00–13:00 LST in winter, summer, and fall and during 08:00–10:00 LST in spring. Lower TGM was observed in the evening and nighttime during winter and spring, whereas it was observed at 06:00 LST during summer and fall. For the 2005–2018 period, annual mean TGM was highest in 2006 and lowest in 2013. There was a sharp decrease in annual mean TGM from 2005 to 2013 followed by a rebound in 2014, with concentrations remaining stable during 2014–2018 (Fig. 1).
3.2.2 PMF factor profiles
Six factors were selected for EGB in the final PMF solution. The factors were assigned to the Hg pool, terrestrial GEM re-emissions and biomass burning (BB), local combustion, secondary sulfate, SSA, and crustal/soil dust (Fig. 8). The Hg pool had the highest abundance of TGM (67 %) and CO (66 %). Terrestrial GEM re-emissions/BB was characterized by the strong presence of temperature (100 %), K+ (33 %) and total carbon (47 %); the TGM abundance was 24 %. The proportions of SO2 and TGM in the local combustion factor were 88 % and 2 %, respectively. Secondary sulfate was dominated by the presence of sulfate (72 %) and ammonium (78 %); however, TGM was absent from this factor. The secondary sulfate factor is indicative of regional Hg emissions and chemical transformation including oxidation and gas–particle partitioning. This is because the strong sulfate presence has been associated with regional emissions and oxidation of SO2 from previous source apportionment studies (Liu et al., 2003; Keeler et al., 2006; Gratz and Keeler, 2011; Pancras et al., 2013). Previous back-trajectory analyses showed the EGB site was frequently impacted by regional transport (ECCC, 2004; Zhang et al., 2008). A factor was assigned to road salt because of the high abundance of Na+ (83 %) and Cl− (88 %) and the relatively greater contributions during the cold season than the warm season. The TGM abundance in the road salt factor was 2.4 %. Crustal/soil dust was characterized by the high abundance of Ca2+ (92 %) and Mg2+ (86 %); the TGM percentage from crustal/soil was 4.9 %. In terrestrial ecosystems, Hg is derived either geologically or via atmospheric wet and dry (including litterfall) deposition and is mainly bound to soil organic matter as oxidized Hg or Hg(II) (Eckley et al., 2016). Hg(II) also has a strong affinity for NaCl particles (Rutter and Schauer, 2007), which may explain the presence of TGM in the road salt factor. Subsequent Hg re-emissions can occur by wind erosion or land disturbance. Soil dust emissions are common around the EGB site because of agricultural areas nearby. Contributions of Ca2+ and Mg2+ peaked in May and September, which coincide with periods of increased agricultural activity.
3.2.3 Overview of TGM source contributions
The mean relative contribution of anthropogenic emissions to annual TGM was 22.4 % at EGB. Natural surface and anthropogenic emissions contributed 1.03 and 0.30 ng m−3 to the annual mean TGM concentration. The Hg pool (66 %) contributed the most to annual TGM at EGB followed by terrestrial GEM re-emissions (24 %), crustal/soil dust (5.0 %), road salt (2.2 %), local combustion (1.6 %), and wildfires (1.6 %), respectively (Fig. 9). Crustal/soil dust and road salt were grouped with GEM re-emissions as they are also re-emitted from the land surface. In this case, the combined contributions from terrestrial surface re-emissions comprised 31 % of the annual TGM.
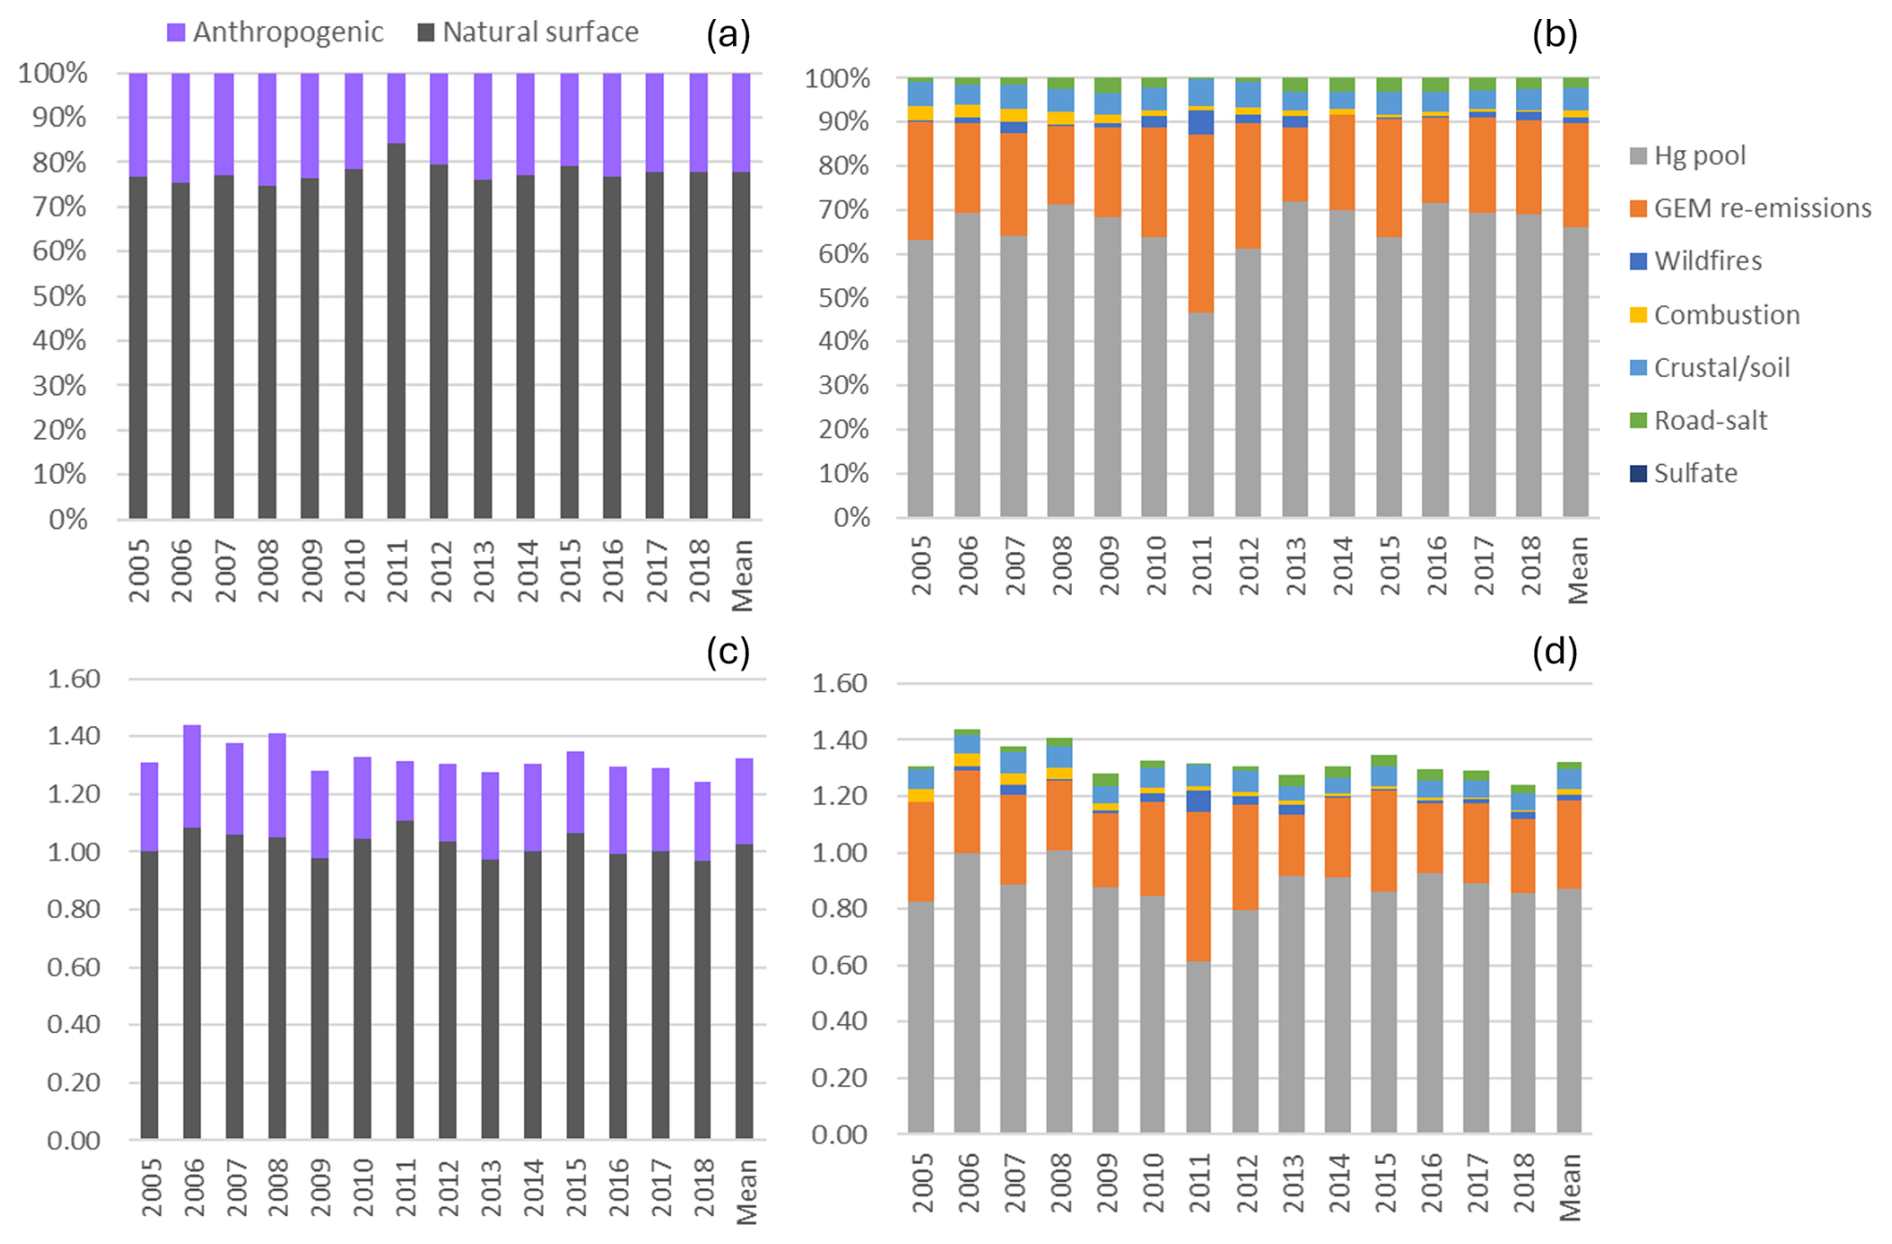
Figure 9Impact of natural surface emissions, anthropogenic emissions, and individual emission sources on annual TGM at Egbert (EGB). Panels (a) and (b) are relative contributions, and panels (c) and (d) are contributions expressed in concentrations (ng m−3). Mean applies to the 2005–2018 period. Natural surface emissions comprise wildfires, GEM re-emissions, crustal/soil dust, road salt, and natural surface emissions contributing to the Hg pool. Anthropogenic emissions comprise local combustion, sulfate, and anthropogenic emissions contributing to the Hg pool.
The ratios of natural surface to anthropogenic contributions to TGM were 71 %29 % in the cold season and 83 %17 % in the warm season. GEM re-emission contributions comprised 41 % of TGM in the warm season compared to only 4.7 % in the cold season. Crustal/soil TGM contribution in the warm season was twice that of the cold season. In contrast, relative contributions from the Hg pool and road salt were greater in the cold season than the warm season.
3.2.4 Interannual and daily variability
During the 2005–2018 period, the annual relative contributions to TGM varied between 16 % and 25 % for anthropogenic emissions (Fig. 9). Anthropogenic contributions to TGM were slightly greater during 2005–2008 because of the higher relative contributions from local combustion. The average local combustion contribution was 3.1 % during 2005–2008 and only 1.1 % during 2009–2018. The annual percentage contribution to TGM during 2005–2018 reached as high as 72 % for the Hg pool, 40 % for GEM re-emissions, 3.5 % for local combustion, 6 % for crustal/soil dust, 3.6 % for road salt, and 3 % for wildfire emissions. Wildfire impacts on TGM in the warm season varied interannually between 0.2 % and 5.8 %, which could be due to the year-to-year variability in wildfire emissions and meteorology. For GEM re-emissions, the interannual variability was 36 %–49 %. This process also depends on meteorology, soil temperature and moisture, land disturbance, canopy shading, etc., which can lead to interannual variability in the re-emissions. For local combustion, crustal/soil emissions, and road salt, the interannual variability was up to a few percent.
Overall, natural surface contributions dominated anthropogenic contributions to TGM on a daily basis. A pronounced seasonal cycle was observed; natural surface contributions were elevated in the warm season, whereas anthropogenic contributions were elevated in the cold season (Fig. 4). This is because of the significant impacts of the Hg pool and GEM re-emissions over other sources and the strong seasonal patterns in the Hg pool and GEM re-emission contributions (Fig. 10). Daily TGM contributions from GEM re-emissions normally accounted for more than 50 % in the warm season. Daily TGM contributions from local combustion typically comprised less than 10 %, though it can occasionally exceed 20 % in the earlier years. TGM contributions were significant from crustal/soil emissions (up to 40 %) and road salt (30 %–80 %) on selected days.
3.2.5 Long-term trends
Annual observed TGM at EGB decreased at a rate of −0.026 ng m−3 yr−1 (p < 0.001) during 2005–2018, while that of the PMF-modelled TGM was −0.011 ng m−3 yr−1 (p < 0.05; Fig. 6). The observed TGM trend for 2005–2018 was slightly greater than that of 1996–2010 from the previous update (−0.02 ng m−3 yr−1; Cole et al., 2014). On a long-term scale, there was a statistically significant trend for the TGM contributions from local combustion, but the magnitude of the change was minimal (−0.002 ng m−3 yr−1; Table 2). Likewise, there was no clear trend in Hg emissions from combustion sources (notably iron and steel manufacturing, cement production, and electric utilities) within 150 km of EGB (Fig. S4). Hg emissions from combustion decreased during 2005–2009; however, the trend is offset by increased emissions beginning in 2010. The trends in relative contributions to TGM from natural surface and anthropogenic emissions were both non-significant (Fig. 11). This is expected considering the relative contribution trends for other sources (Hg pool, GEM re-emissions, crustal/soil, road salt, etc.) were not statistically significant or the slope was very small in the case of local combustion (−0.1 % yr−1). Overall, there was no source that significantly impacted the TGM trend at EGB.
Figure 11Long-term trends in relative source contributions at EGB. (a) Natural surface emissions (wildfires plus re-emitted Hg), (b) anthropogenic emissions, (c) Hg pool, (d) GEM re-emissions, (e) crustal/soil, (f) local combustion, (g) road salt, and (h) wildfires. Blue line: relative contributions; red line: trend line; green text: slope of the trend line (× 100 % yr−1).
3.3 Kejimkujik National Park
3.3.1 Overview of TGM concentrations
The range in annual mean TGM concentrations was 1.1–1.71 ng m−3 at Kejimkujik National Park (KEJ) during 2005–2016 (Fig. 1; Table S2). The RSD of 24 h mean TGM was 12.6 % and increased year over year. The 75th percentile concentrations were 1.28–1.82 ng m−3 depending on the year. Comparing the statistics over the same period (2009–2016), the mean TGM concentrations among SAT, EGB, and KEJ were comparable, with no statistically significant differences. The annual TGM across the three CAPMoN sites differed between 3 % (in 2014) and 19 % (in 2013). The 75th percentile was highest at SAT during 2009–2010, KEJ during 2011–2013, and EGB during 2014–2016, which shows there was no particular site experiencing higher TGM over this period. The seasonal pattern in TGM at KEJ was similar to the patterns of SAT and EGB. Mean TGM was highest during winter and spring and lowest during summer and fall. The diel amplitudes in summer (22 %) and fall (14 %) were greater than those in winter (5 %) and spring (8 %). Hourly TGM peaked during 14:00–15:00 LST in the summer and 12:00–14:00 LST in the fall. In the winter and spring, the maximum TGM was typically observed during 11:00–13:00 LST. The TGM minimum occurred during 05:00–06:00 LST in all seasons. For the 2005–2016 period, the highest mean TGM was observed in 2005 and the lowest in 2006 and 2016. Annual mean TGM decreased significantly from 2005 to 2006. A parabolic pattern was observed thereafter, with concentrations increasing during 2006–2011 and then decreasing during 2012–2016 (Fig. 1).
3.3.2 PMF factor profiles
For the KEJ site, the PMF model resolved six factors. The factors represented the Hg pool, terrestrial GEM re-emissions/biomass burning (BB), local combustion, secondary sulfate, aged SSA, and fresh SSA (Fig. 12). TGM (82 %) and CO (77 %) were the most abundant in the Hg pool factor. The GEM re-emissions/BB factor showed a strong presence in temperature (100 %). Local combustion was characterized by the SO2 abundance (90 %). Secondary sulfate showed high abundances for sulfate (75 %) and ammonium (94 %). TGM was absent from the GEM re-emissions/BB, local combustion, and secondary sulfate factors. Aged SSA was characterized by moderate abundances of Ca2+, Mg2+, Na+, and SO (24 %–31 % for these ions) and absence of Cl−. Fresh SSA mostly comprised Cl− (94 %), Na+ (67 %), and Mg2+ (62 %). The TGM abundances were 11 % in aged SSA and 8 % in fresh SSA, which were comparable to the SAT coastal site.
3.3.3 Overview of TGM source contributions
The mean relative contribution to annual TGM was 64 % from natural surface emissions during the 2005–2016 period with the remainder from anthropogenic emissions (Fig. 13). This corresponds to average TGM contributions of 0.82 and 0.47 ng m−3, respectively. Annual TGM was strongly attributed to the Hg pool (81 %), followed by regional emission and SSA processing (11 %) and oceanic evasion (8.0 %) (Fig. 13). GEM re-emissions and wildfire emissions did not contribute to TGM at KEJ. The regional emission and SSA processing factor is considered to be of anthropogenic origin because aged sea salt is formed from the reaction of sea salt and acidic gases (H2SO4 and HNO3), whose precursors are anthropogenic SO2 and NOx. One of the major sources of SO2 and NOx is fuel combustion from electric utilities, which are also significant sources of atmospheric Hg. There have been no electric utilities within 200 km of KEJ since 2007; however, the site is frequently impacted by air masses from the northeastern US region where there is a high density of electric utilities. Thus, this factor represents both the regional emission contributions of acidic gases and Hg and subsequent chemical processing of fresh SSA as regional air masses are transported across the MBL. On the other hand, fresh SSA is directly emitted from the ocean and has not been subject to chemical processing. Hg contributions from marine air are mainly from evasion of GEM from the ocean or partitioning of GEM or GOM from sea-salt aerosols. Emissions from natural surfaces contributed equally to the warm- and cold-season TGM. While the relative contributions from regional emission and SSA processing were comparable between seasons, the TGM contribution from oceanic evasion was greater in the cold season by a factor of 2.
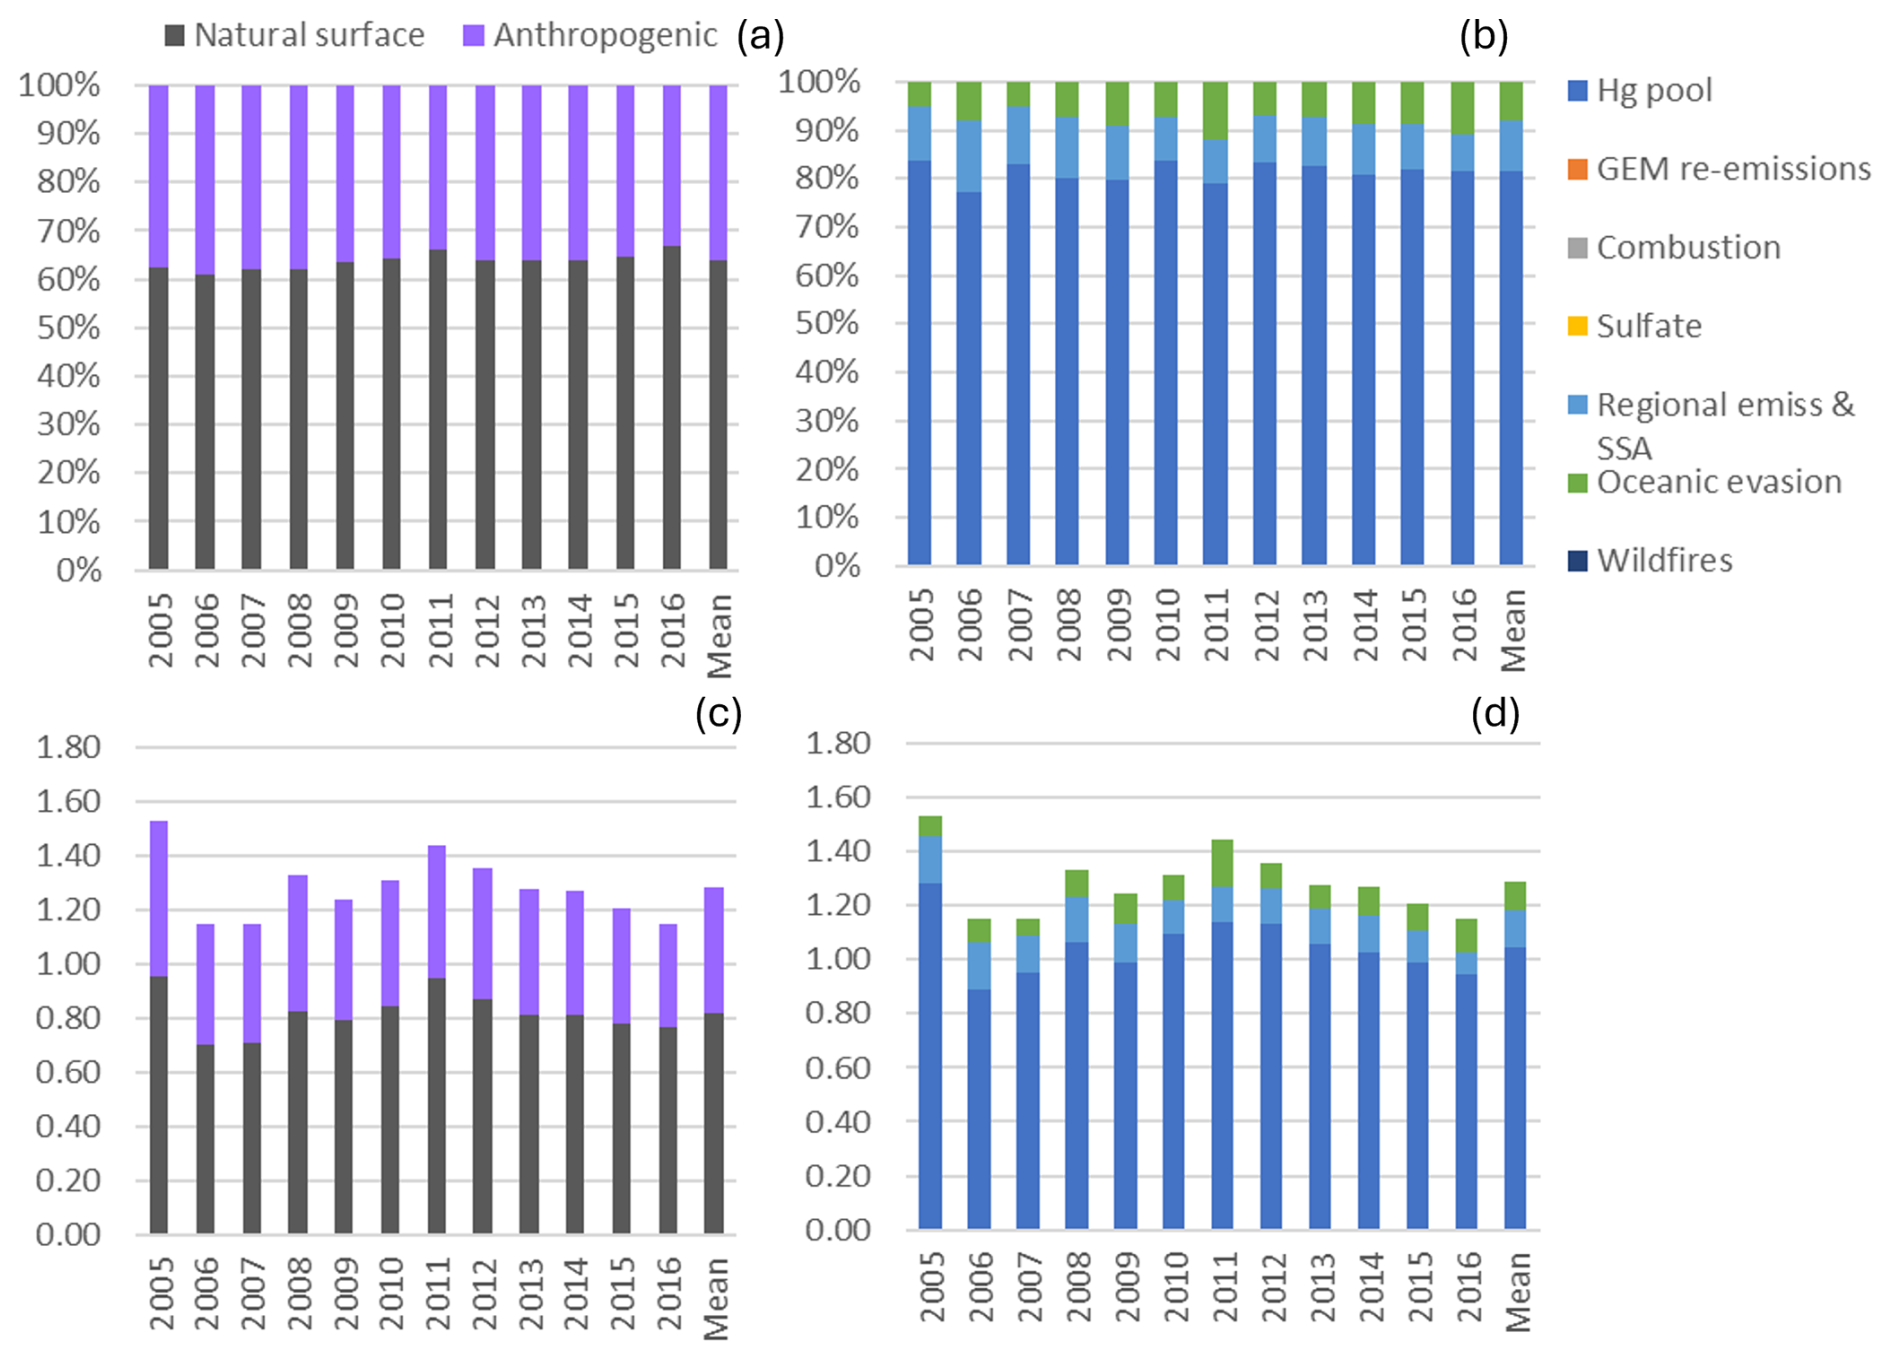
Figure 13Impact of natural surface emissions, anthropogenic emissions, and individual emission sources on annual TGM at Kejimkujik (KEJ). Panels (a) and (b) are relative contributions, and panels (c) and (d) are contributions expressed in concentrations (ng m−3). Mean applies to the 2005–2016 period. Natural surface emissions comprise wildfires, GEM re-emissions, oceanic evasion, and natural surface emissions contributing to the Hg pool. Anthropogenic emissions comprise local combustion, sulfate, regional emissions and sea-salt processing, and anthropogenic emissions contributing to the Hg pool.
3.3.4 Interannual and daily variability
For the 2005–2016 period, relative contributions to annual TGM from natural surface emissions ranged between 61 % and 67 % (Fig. 13). Annual relative contributions from the Hg pool were in the range of 77 %–84 %, while those of regional emission and SSA processing and oceanic evasion were 7.4 %–15 % and 5.1 %–12 %, respectively. The impact of regional emission and SSA processing on TGM was greater in the earlier period of 2005–2009 compared with the latter period of 2010–2016, which explains the greater anthropogenic contributions to TGM in the earlier period.
Natural surface contributions typically exceeded anthropogenic contributions to daily TGM; however, there were also many days when the latter was equivalent or greater (Fig. 4). 20 % to 50 % of the daily TGM was attributed to anthropogenic sources, though the percentage occasionally increased above 70 %. The elevated episodes, particularly before 2011, were mainly from regional emission and SSA processing (Fig. 14). Daily TGM contributions from the Hg pool showed large fluctuations, with percentages ranging from 0 % to 100 %, though they were mostly above 50 %. Daily TGM contributions from oceanic evasion were typically below 40 % and occasionally reached as high as 70 %.
3.3.5 Long-term trends
Over the 2005–2016 period, the magnitudes of the annual TGM trend were −0.014 ng m−3 yr−1 (−1.05 % yr−1) for both the observed and PMF-modelled TGM (Fig. 6). Neither trend was statistically significant. The similarity in the trends indicates that the PMF model reproduced the variability in observed TGM. The observed TGM trend for 2005–2016 was the same as that of 1996–2010 from the previous update (Cole et al., 2014). Long-term trends in TGM were driven primarily by contributions from the Hg pool and regional emission and SSA processing. The Hg pool contributions decreased by −0.010 ng m−3 yr−1, while those of regional emission and SSA processing decreased by −0.006 ng m−3 yr−1 (Table 2). The decreasing trend in the TGM contribution from regional emission and SSA processing was attributed to decreasing Hg and SO2 emissions. On a regional scale, Hg emissions fell from 23.2 Mg yr−1 in 2005 to 5.3 Mg yr−1 in 2016, corresponding to a 77 % reduction (Fig. S5g). In addition, there was also a decrease in ambient SO2 at KEJ (−0.037 µg m−3 yr−1, p < 0.001), which was driven by significant SO2 emissions reductions, both locally and regionally (Fig. S6). Consequently, SSA processing also decreased with time.
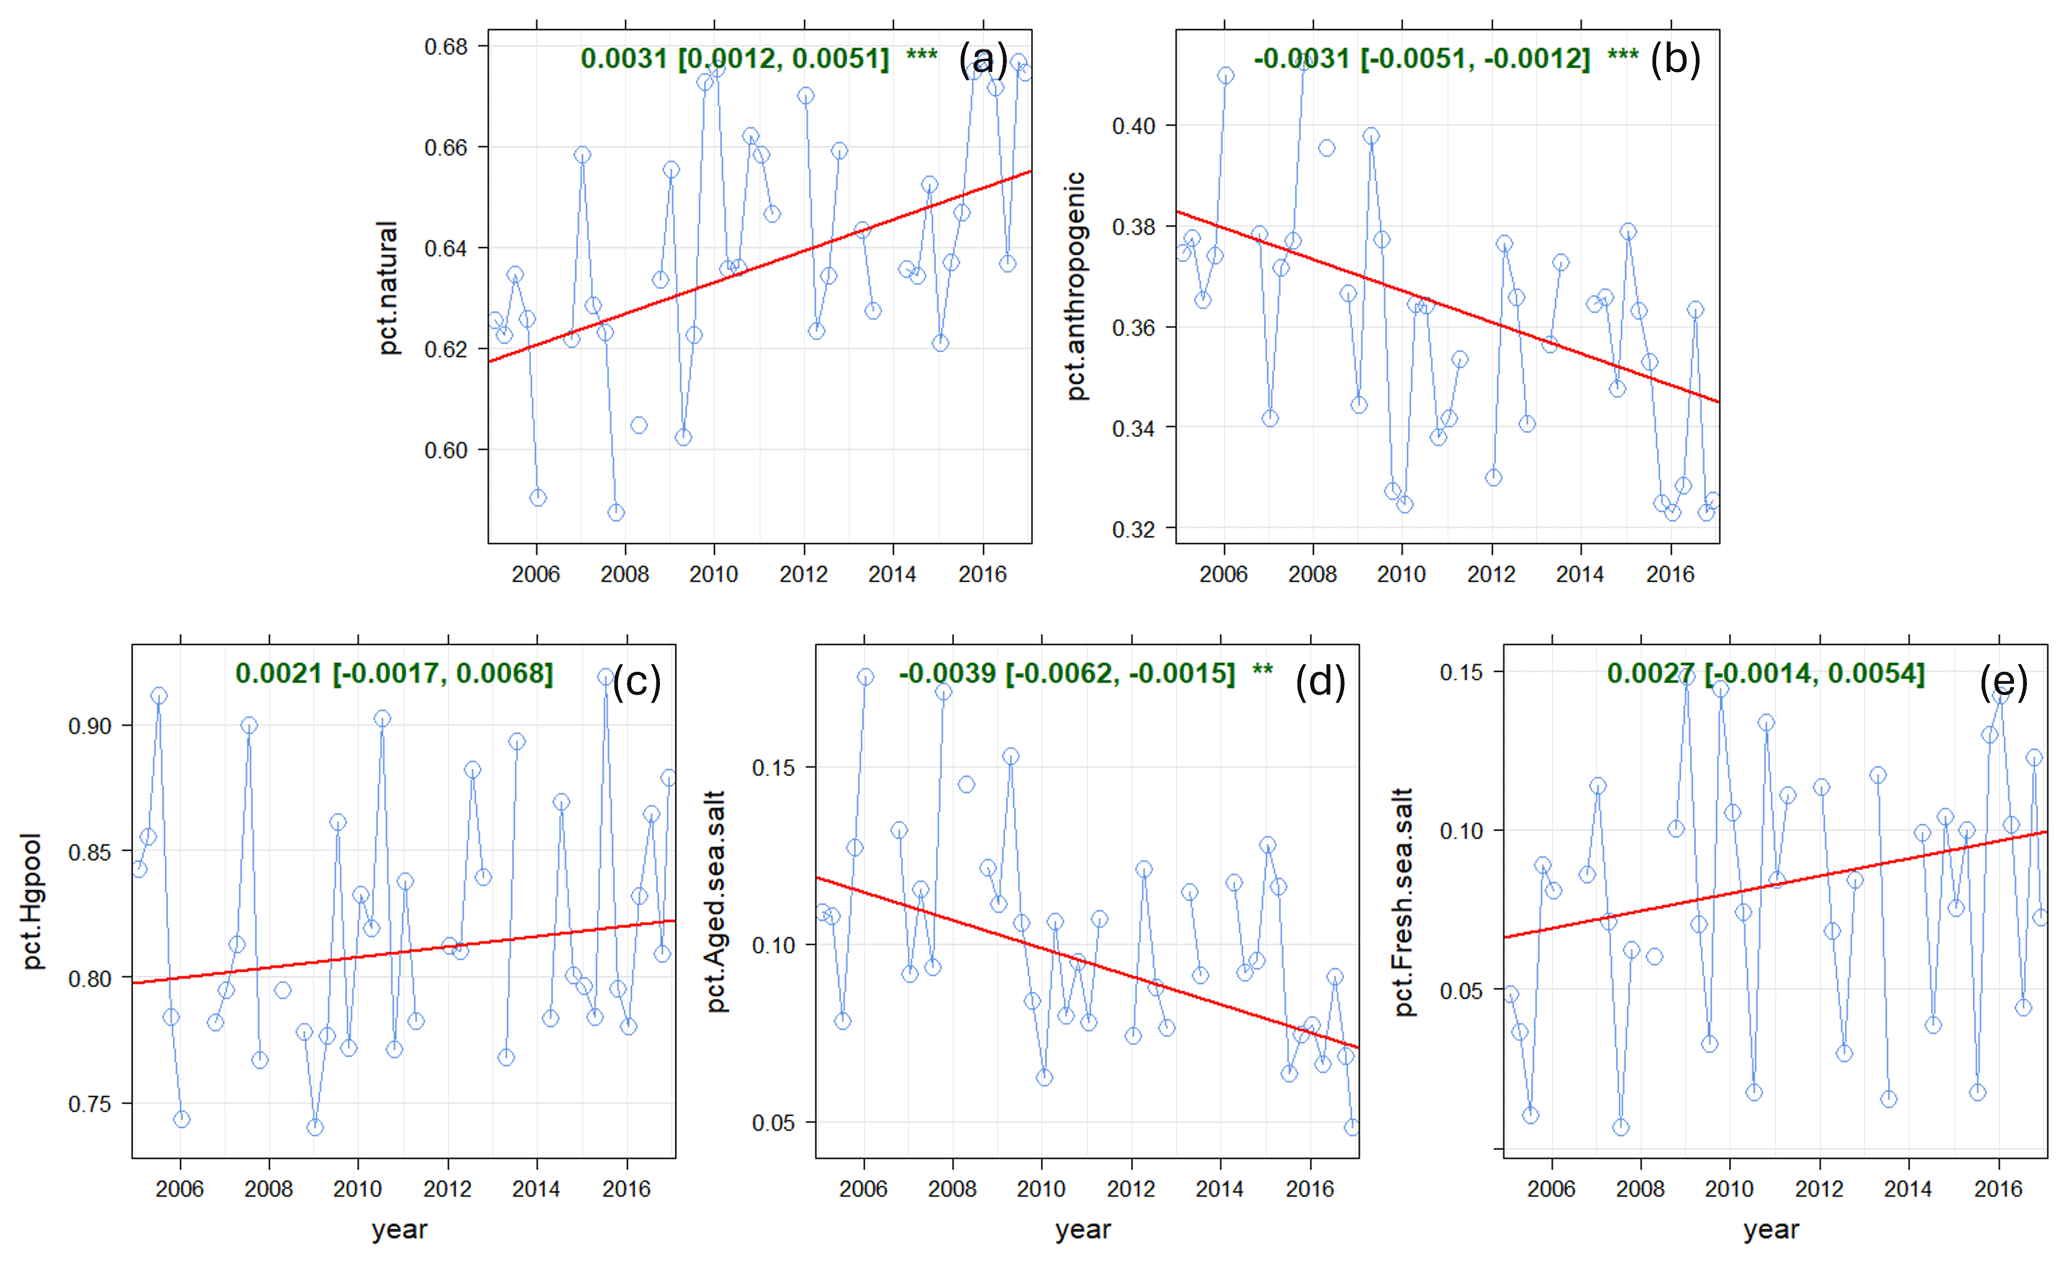
Figure 15Long-term trends in relative source contributions at KEJ. (a) Natural surface emissions (wildfires plus re-emitted Hg), (b) anthropogenic emissions, (c) Hg pool, (d) regional emission and SSA processing, and (e) oceanic evasion. Blue line: relative contributions; red line: trend line; green text: slope of the trend line (× 100 % yr−1).
The trend in relative contribution from natural surface emissions showed a slight increase of 0.3 % yr−1 (p < 0.001) for the 2005–2016 period (Fig. 15). This trend is partly attributable to the decline in the percentage contributions from regional emissions and SSA processing (−0.04 % yr−1), which is anthropogenic. Trends in the relative contributions from the Hg pool and oceanic evasion were not statistically significant, though they showed an upward trend of 0.2 % yr−1. While long-term TGM concentrations at KEJ are trending downwards, there are shorter-term variations that are not captured in the trend analysis. TGM decreased sharply from 2005 to 2006 (Fig. 1), which was consistent with the significant decrease in local Hg emissions from electric utilities (Fig. S7). There was a period of increasing TGM from 2006 to 2011 followed by decreasing TGM from 2011 to 2016. This pattern was consistent with local Hg emissions from oil and gas pipelines and storage emissions. These emissions began to decline in 2011. In fact, no Hg emissions within 150 km of KEJ were reported from 2014 onwards.
4.1 PMF yearly runs vs. single-time-series run
Additional PMF runs were conducted separately for each year, and the TGM source contributions for the six factors were compared with those of the single-time-series run. While the results between the two sets of runs were comparable for SAT and KEJ, pronounced differences were found for EGB. The PMF-modelled TGM concentrations derived from the yearly runs were better correlated with the observed TGM (R2= 0.70; Fig. S8) than that from the single run (R2= 0.43; Fig. S1). Furthermore, the yearly runs produced a better fit of the interannual variability and long-term trends in TGM. In the yearly runs, the mean relative contribution of anthropogenic emissions to annual TGM was 27.5 % at EGB, which was greater than the single-run scenario. The Hg pool (63 %) contributed the most to annual TGM, followed by terrestrial GEM re-emissions (15.4 %), crustal/soil dust (8.7 %), local combustion (5.9 %), road salt (4.1 %), secondary sulfate (1.8 %), and wildfires (1.3 %), respectively. These percentages are lower for the Hg pool and GEM re-emissions but are higher for crustal/soil dust, local combustion, road salt, and secondary sulfate compared to those of the single run. In the yearly runs, the TGM contribution from the Hg pool was the main driver of the observed TGM trend, whereas there was no dominant driver of the TGM trend from the single run.
Figure S9a illustrates the model–observation discrepancies that occurred in 2005–2009 and 2012–2013 in the single run. During 2005–2009, TGM contributions from the Hg pool, local combustion, crustal/soil, and road salt for the single run were smaller compared to those of the yearly runs (Fig. S9b). In 2012–2013, TGM contributions from the Hg pool and GEM re-emissions for the single run were greater than those of the yearly runs. The differences between the single and yearly runs may be for various reasons. The underestimation of the Hg pool and local combustion contributions suggests that a constant factor profile assumption in the single run may not be valid over the long term because of changes in the emissions control technology, affecting the speciation profiles as discussed in Zhang et al. (2016). Perhaps the estimated TGM abundance in the Hg pool factor and local combustion factor should be higher in the earlier period. For crustal/soil, road salt, and GEM re-emission contributions, dust emissions and GEM flux are highly variable. These processes could depend on land disturbance from agricultural activities at EGB, road salt applied, and meteorology. For GEM flux, it is also affected by soil temperature and its Hg content, moisture level, organic matter content, vegetation and litterfall cover, Hg uptake, and ambient Hg concentration. The TGM content in dust is affected by gas–particle partitioning. These complex processes are perhaps not well captured in the factor profiles and contributions for terrestrial re-emissions in the single run but are better modelled in the yearly runs. It is recommended that short-term runs be performed across the time series to confirm that the single-run PMF results are robust.
4.2 Spatial differences in source contributions to TGM
Comparing TGM source apportionment results among the sites, natural surface emissions exceeded anthropogenic emission contributions to TGM at all three. Mean relative contributions from anthropogenic emissions were 30 % at SAT and 36 % at KEJ and lower at EGB. There was a clear long-term increase in the relative importance of natural surface emissions to TGM at SAT and KEJ, which resulted from decreased anthropogenic Hg emissions.
The Hg pool and the subsequent long-range transport were a major source of TGM at all sites. Average relative contributions to annual TGM were 50 %–81 % among the sites, with higher contributions from November to April. Previous source attribution analysis performed using the Global/Regional Atmospheric Heavy Metals (GRAHM) model showed that the sources of GEM in Canada mostly originated in Europe and East Asia. European sources contributed 3 % of GEM at SAT, < 3 % at EGB, and 3.5 % at KEJ via long-range transport across the Arctic. Long-range transport from East Asia had the greatest impact on GEM across Canada, contributing 16 % at SAT, 14 %–15 % at EGB, and 15 % at KEJ (ECCC, 2016). The anthropogenic to natural surface emissions proportion for the Hg pool was estimated based on the global Hg emissions inventory. While the percentages used in this study were consistent with some emissions inventories, i.e., ∼30 % for anthropogenic Hg emissions (Pirrone et al., 2010; Outridge et al., 2018; Streets et al., 2019; UNEP, 2019), this percentage is 4 %–6 % lower in other global budgets (Shah et al., 2021; Sonke et al., 2023; Zhang et al., 2023). It is expected that the ratio of global anthropogenic to natural contributions will change in the future as primary anthropogenic emissions decrease and Hg re-emissions increase.
The second-most-important Hg source at EGB (31 %) and SAT (26 %) was terrestrial surface re-emissions. Relative contributions from GEM re-emissions were greatest from May to October. TGM at KEJ was not impacted by GEM re-emissions, likely because the site is in a forested area which is a net sink for GEM. The variability between sites reflects the nature of GEM surface–air exchange, which is spatially variable and dependent on factors such as solar radiation intensity; canopy shading and wetness; air and soil temperature; soil Hg content; soil moisture; soil organic matter content; vegetation and litterfall covering the soil; ambient Hg concentration; and forest uptake, which is a key driver of GEM dry deposition (Zhang et al., 2009; Ottesen et al., 2013; Agnan et al., 2016; Eckley et al., 2016; Wang et al., 2016; Sommar et al., 2020). Some areas of British Columbia and Ontario have soils that are naturally enriched in Hg, which have led to higher fluxes (ECCC, 2016). Hg emissions from agricultural soils (e.g., at EGB) are greater than that from natural soils because of more frequent land disturbance, which increases volatilization and soil dust resuspension (Cobbett and Van Heyst, 2007; Zhu et al., 2016). Surface re-emission is one of the least constrained processes in the Hg cycle. It can be influenced by a multitude of environmental factors, which are currently not well represented in CTMs (Zhu et al., 2016; Obrist et al., 2018). There are also limited Hg flux measurements for characterizing both spatial and temporal variations.
TGM contributions from local combustion were 3 % at SAT, 2 % at EGB, and absent at KEJ. These results were similar to previous GRAHM model simulations, which found Canadian sources accounted for only 3 %–5 % of GEM near EGB, 1 % near SAT, and 0.5 %–1 % near KEJ (ECCC, 2016). Overall, the contribution by Canadian sources is typically < 1 % in areas outside the vicinity of major Hg point sources according to models (ECCC, 2016).
Oceanic evasion contributed similar percentages of the TGM at SAT and KEJ (6 %–8 %). As reported in global Hg budgets, oceanic Hg re-emissions are poorly constrained (Dastoor et al., 2025). A recent model simulation suggests that Hg re-emission from oceans is underestimated by 40 % (Zhang et al., 2023), whereas another study provided more modest re-emission estimates (Tang et al., 2025).
At the coastal sites, we found evidence of anthropogenic emission contributions and SSA processing. Marine transportation and shipping ports were sources of TGM at SAT, while regional Hg emissions notably from US electric utilities (fossil fuel combustion) had impacted TGM at KEJ. Because these sources also emit SO2, the acidic gases formed further reacted with SSA in the MBL, resulting in the formation of aged SSA. Significant reductions in both Hg and SO2 emissions led to diminished impacts from anthropogenic emissions and SSA processing over time.
Wildfires affected TGM at SAT (western Canada) more than KEJ and EGB (eastern Canada). Wildfires in western Canada and the western United States have led to elevated PM2.5, O3, atmospheric nitrogen, and total carbon in downwind regions (Lu et al., 2016; McClure and Jaffe, 2018; Chen et al., 2019; Campbell et al., 2022; Yao and Zhang, 2024). Wildfire Hg emissions in western Canada are greater than those in eastern Canada, comprising approximately 65 % of the national total wildfire Hg emissions. For the 2010–2015 period, wildfires contributed 0.2 %–0.4 % of the daily mean GEM near SAT according to the GEM-MACH-Hg model (Fraser et al., 2018). In this study, we estimated the PMF-derived daily mean TGM contribution from wildfires to be 3.7 % over the same period. For EGB, the percentage wildfire contributions to daily mean GEM/TGM were 0.4 %–0.8 % based on the GEM-MACH-Hg model and 1.6 % based on the PMF model. The corresponding percentages for KEJ were 0.3 %–0.5 % and 0 % of the daily mean GEM/TGM. Note that on a daily basis there can be large variability in the GEM-MACH-Hg estimated wildfire contributions, with percentages up to 30 % for SAT, 23 % for EGB, and 10 % for KEJ. This variability was also seen in the PMF modelling results (Figs. 5 and 10). Differences in the wildfire source contributions between GEM-MACH-Hg (Fraser et al., 2018) and PMF (this study) could be due to underestimated wildfire Hg emissions in CTMs, other model parameterization uncertainties, measurement uncertainties affecting the PMF model results, FRP approach for screening wildfire TGM contributions, etc. While model intercomparisons are common for CTMs, more comparisons conducted between CTMs and receptor models like PMF will ultimately improve source apportionment estimates for both types of air quality models. We examined wildfire impacts on gaseous Hg in this study; however, wildfires also contribute significantly to particulate Hg depending on the fuel moisture and combustion type (Obrist et al., 2008; McLagan et al., 2021). To capture the full impact of wildfires on atmospheric Hg, future source contribution analysis should include particulate Hg measurements if possible.
Source contributions to three rural–remote TGM sites were estimated using the PMF model. We examined long-term trends in TGM source contributions to understand the major drivers of the observed TGM trends, as well as analyzing the variability in interannual, seasonal, and daily TGM contributions. Anthropogenic sources that were inferred from PMF include local combustion and the anthropogenic portion of the Hg pool (∼31 %). Additionally, shipping emissions were identified at SAT, and regional emissions from the northeast United States were identified at KEJ. Natural surface emission contributions comprised terrestrial GEM re-emissions, oceanic Hg evasion, wildfires, and the proportion of the Hg pool from natural surface emissions (∼69 %). Additional TGM contributions from crustal/soil dust and road salt were found at EGB. At SAT, the decreasing TGM trend was attributed to decreasing shipping and local combustion emissions. No dominant source contributed to the TGM trend at EGB; however, alternative runs conducted using yearly data suggest a long-term decrease in Hg pool contributions. The long-term TGM trend at KEJ was driven by the Hg pool and regional emissions. When analyzing on a shorter timescale, Hg emissions from electric utilities and oil and gas pipelines and storage had a strong influence on TGM. Overall, emission contributions from natural surfaces (wildfires plus re-emitted Hg) were greater than anthropogenic contributions to annual TGM at all sites.
In the last decade, the downward trend in anthropogenic emission contributions led to increasing Hg contributions from natural surfaces. The latter can potentially be accelerated by global warming as this can drive up terrestrial and oceanic Hg re-emissions and wildfire Hg emissions. These emissions contribute not only to downwind areas but also to the global Hg pool, which in the case of GEM impacts other regions through long-range transport. Hg emissions from natural surfaces are overall less constrained compared with combustion sources, and they make up the bulk of global Hg emissions. It is important to increase monitoring of terrestrial and oceanic surface re-emissions, track their long-term trends, and examine how climate perturbations are affecting the emissions and Hg cycling in the environment.
All datasets used in this study are publicly available (see Table S1 for details).
The supplement related to this article is available online at https://doi.org/10.5194/acp-25-8591-2025-supplement.
IC: conceptualization, methodology, formal analysis, validation, writing (original draft, review, and editing). AC: supervision, validation, writing (review and editing). LZ: conceptualization, methodology, writing (review and editing). AS: validation, writing (review and editing).
At least one of the (co-)authors is a member of the editorial board of Atmospheric Chemistry and Physics. The peer-review process was guided by an independent editor, and the authors also have no other competing interests to declare.
Publisher's note: Copernicus Publications remains neutral with regard to jurisdictional claims made in the text, published maps, institutional affiliations, or any other geographical representation in this paper. While Copernicus Publications makes every effort to include appropriate place names, the final responsibility lies with the authors.
We acknowledge the ECCC Canadian Air and Precipitation Monitoring Network (CAPMoN), the National Air Pollution Surveillance (NAPS) program, the Canadian Greenhouse Gas Measurement program, and Climate Data Services; the US EPA Air Quality System; the Interagency Monitoring of Protected Visual Environments (IMPROVE); and NASA/MODIS for the provision of datasets used in this publication. Special thanks are given to the CAPMoN and National Atmospheric Chemistry (NAtChem) teams; Amy Hou for data extraction/processing; Doug Worthy for Egbert CO data; and Anne Marie Macdonald, James Kuchta, and Kenny Yan for internal review.
This paper was edited by Aurélien Dommergue and reviewed by Ðanilo Custódio and one anonymous referee.
Agnan, Y., Le Dantec, T., Moore, C. W., Edwards, G. C., and Obrist, D.: New constraints on terrestrial surface–atmosphere fluxes of gaseous elemental mercury using a global database, Environ. Sci. Technol., 50, 507–524, 2016.
Anastasopolos, A. T., Sofowote, U. M., Hopke, P. K., Rouleau, M., Shin, T., Dheri, A., Peng, H., Kulka, R., Gibson, M. D., Farah, P. M., and Sundar, N.: Air quality in Canadian port cities after regulation of low-sulphur marine fuel in the North American Emissions Control Area, Sci. Total Environ., 791, 147949, https://doi.org/10.1016/j.scitotenv.2021.147949, 2021.
Brown, S. G., Eberly, S., Paatero, P., and Norris, G. A.: Methods for Estimating Uncertainty in PMF Solutions: Examples with Ambient Air and Water Quality Data and Guidance on Reporting PMF Results, Sci. Total Environ., 518, 626–635, 2015.
Campbell, P. C., Tong, D., Saylor, R., Li, Y., Ma, S., Zhang, X., Kondragunta, S., and Li, F.: Pronounced increases in nitrogen emissions and deposition due to the historic 2020 wildfires in the western US, Sci. Total Environ., 839, 156130, https://doi.org/10.1016/j.scitotenv.2022.156130, 2022.
Chen, J., Anderson, K., Pavlovic, R., Moran, M. D., Englefield, P., Thompson, D. K., Munoz-Alpizar, R., and Landry, H.: The FireWork v2.0 air quality forecast system with biomass burning emissions from the Canadian Forest Fire Emissions Prediction System v2.03, Geosci. Model Dev., 12, 3283–3310, https://doi.org/10.5194/gmd-12-3283-2019, 2019.
Cheng, I., Xu, X., and Zhang, L.: Overview of receptor-based source apportionment studies for speciated atmospheric mercury, Atmos. Chem. Phys., 15, 7877–7895, https://doi.org/10.5194/acp-15-7877-2015, 2015.
Cheng, I., Zhang, L., Castro, M., and Mao, H.: Identifying Changes in Source Regions Impacting Speciated Atmospheric Mercury at a Rural Site in the Eastern United States, J. Atmos. Sci., 74, 2937–2947, 2017.
Cobbett, F. D. and Van Heyst, B. J.: Measurements of GEM fluxes and atmospheric mercury concentrations (GEM, RGM and Hgp) from an agricultural field amended with biosolids in Southern Ont., Canada (October 2004–November 2004), Atmos. Environ., 41, 2270–2282, 2007.
Cole, A. S., Steffen, A., Eckley, C. S., Narayan, J., Pilote, M., Tordon, R., Graydon, J. A., St. Louis, V.L., Xu, X., and Branfireun, B. A.: A survey of mercury in air and precipitation across Canada: patterns and trends, Atmosphere, 5, 635–668, 2014.
Custodio, D., Ebinghaus, R., Spain, T. G., and Bieser, J.: Source apportionment of atmospheric mercury in the remote marine atmosphere: Mace Head GAW station, Irish western coast, Atmos. Chem. Phys., 20, 7929–7939, https://doi.org/10.5194/acp-20-7929-2020, 2020.
Dastoor, A., Ryjkov, A., Kos, G., Zhang, J., Kirk, J., Parsons, M., and Steffen, A.: Impact of Athabasca oil sands operations on mercury levels in air and deposition, Atmos. Chem. Phys., 21, 12783–12807, https://doi.org/10.5194/acp-21-12783-2021, 2021.
Dastoor, A., Wilson, S. J., Travnikov, O., Ryjkov, A., Angot, H., Christensen, J. H., Steenhuisen, F., and Muntean, M.: Arctic atmospheric mercury: Sources and changes, Sci. Total Environ., 839, 156213, https://doi.org/10.1016/j.scitotenv.2022.156213, 2022.
Dastoor, A., Angot, H., Bieser, J., Brocza, F., Edwards, B., Feinberg, A., Feng, X., Geyman, B., Gournia, C., He, Y., Hedgecock, I. M., Ilyin, I., Kirk, J., Lin, C.-J., Lehnherr, I., Mason, R., McLagan, D., Muntean, M., Rafaj, P., Roy, E. M., Ryjkov, A., Selin, N. E., De Simone, F., Soerensen, A. L., Steenhuisen, F., Travnikov, O., Wang, S., Wang, X., Wilson, S., Wu, R., Wu, Q., Zhang, Y., Zhou, J., Zhu, W., and Zolkos, S.: The Multi-Compartment Hg Modeling and Analysis Project (MCHgMAP): mercury modeling to support international environmental policy, Geosci. Model Dev., 18, 2747–2860, https://doi.org/10.5194/gmd-18-2747-2025, 2025.
Driscoll, C. T., Mason, R. P., Chan, H. M., Jacob, D. J., and Pirrone, N.: Mercury as a Global Pollutant: Sources, Pathways, and Effects, Environ. Sci. Technol., 47, 4967–4983, 2013.
Eckley, C. S., Parsons, M. T., Mintz, R., Lapalme, M., Mazur, M., Tordon, R., Elleman, R., Graydon, J. A., Blanchard, P., and St. Louis, V.: Impact of closing Canada's largest point-source of mercury emissions on local atmospheric mercury concentrations, Environ. Sci. Technol., 47, 10339–10348, 2013.
Eckley, C. S., Tate, M. T., Lin, C. J., Gustin, M., Dent, S., Eagles-Smith, C., Lutz, M. A., Wickland, K. P., Wang, B., Gray, J. E., Edwards, G. C., Krabbenhoft, D. P., and Smith, D. B.: Surface-air mercury fluxes across Western North America: A synthesis of spatial trends and controlling variables, Sci. Total Environ., 568, 651–665, 2016.
Environment and Climate Change Canada (ECCC): 2004 Canadian Acid Deposition Science Assessment, Meteorological Services of Canada, http://www.publications.gc.ca/pub?id=9.688243&sl=0 (last access: 14 July 2025), 2004.
Environment and Climate Change Canada (ECCC):, Canadian mercury science assessment: report. Gatineau, Quebec, ISBN 978-0-660-04499-6, http://www.publications.gc.ca/pub?id=9.810484&sl=0 (last access: 14 July 2025), 2016.
Feinberg, A., Dlamini, T., Jiskra, M., Shah, V., and Selin, N. E.: Evaluating atmospheric mercury (Hg) uptake by vegetation in a chemistry-transport model, Environ. Sci. Process. Impacts, 24, 1303–1318, 2022.
Fisher, J. A., Jacob, D. J., Soerensen, A. L., Amos, H. M., Steffen, A., and Sunderland, E. M.: Riverine source of Arctic Ocean mercury inferred from atmospheric observations, Nat. Geosci., 5, 499–504, 2012.
Fraser, A., Dastoor, A., and Ryjkov, A.: How important is biomass burning in Canada to mercury contamination?, Atmos. Chem. Phys., 18, 7263–7286, https://doi.org/10.5194/acp-18-7263-2018, 2018.
Gratz, L. E. and Keeler, G. J.: Sources of mercury in precipitation to Underhill, VT, Atmos. Environ., 45, 5440–5449, 2011.
Government of British Columbia (B.C.): Statistics & Geospatial Data, Wildfire Averages, https://www2.gov.bc.ca/gov/content/safety/wildfire-status/about-bcws/wildfire-statistics/wildfire-averages (last access: 3 March 2024), 2025.
Holmes, C. D., Jacob, D. J., Mason, R. P., and Jaffe, D. A.: Sources and deposition of reactive gaseous mercury in the marine atmosphere, Atmos. Environ., 43, 2278–2285, 2009.
Hong, Y. S., Kim, Y. M., and Lee, K. E.: Methylmercury exposure and health effects, Journal of preventive medicine and public health, 45, 353–363, 2012.
Horowitz, H. M., Jacob, D. J., Zhang, Y., Dibble, T. S., Slemr, F., Amos, H. M., Schmidt, J. A., Corbitt, E. S., Marais, E. A., and Sunderland, E. M.: A new mechanism for atmospheric mercury redox chemistry: implications for the global mercury budget, Atmos. Chem. Phys., 17, 6353–6371, https://doi.org/10.5194/acp-17-6353-2017, 2017.
Huang, J., Choi, H. D., Hopke, P. K., and Holsen, T. M.: Ambient mercury sources in Rochester, NY: results from principle components analysis (PCA) of mercury monitoring network data, Environ. Sci. Technol., 44, 8441–8445, 2010.
Jeffery, P. S., Drummond, J. R., Zou, J., and Walker, K. A.: Identifying episodic carbon monoxide emission events in the MOPITT measurement dataset, Atmos. Chem. Phys., 24, 4253–4263, https://doi.org/10.5194/acp-24-4253-2024, 2024.
Keeler, G. J., Landis, M. S., Norris, G. A., Christianson, E. M., and Dvonch, J. T.: Sources of mercury wet deposition in eastern Ohio, USA, Environ. Sci. Technol., 40, 5874–5881, 2006.
Lee, E. J., Kenkel, N., and Booth, T.: Atmospheric deposition of macronutrients by pollen in the boreal forest, Ecoscience, 3, 304–309, 1996.
Li, C., Sonke, J. E., Le Roux, G., Piotrowska, N., Van der Putten, N., Roberts, S. J., Daley, T., Rice, E., Gehrels, R., Enrico, M., Mauquoy, D., Roland, T. P., and De Vleeschouwer, F.: Unequal anthropogenic enrichment of mercury in earth's northern and southern hemispheres, ACS Earth Space Chem., 4, 2073–2081, 2020.
Liu, W., Hopke, P. K., Han, Y. J., Yi, S. M., Holsen, T. M., Cybart, S., Kozlowski, K., and Milligan, M.: Application of receptor modeling to atmospheric constituents at Potsdam and Stockton, NY, Atmos. Environ., 37, 4997–5007, 2003.
Lu, X., Zhang, L., Yue, X., Zhang, J., Jaffe, D. A., Stohl, A., Zhao, Y., and Shao, J.: Wildfire influences on the variability and trend of summer surface ozone in the mountainous western United States, Atmos. Chem. Phys., 16, 14687–14702, https://doi.org/10.5194/acp-16-14687-2016, 2016.
MacSween, K., Stupple, G., Aas, W., Kyllönen, K., Pfaffhuber, K.A., Skov, H., Steffen, A., Berg, T., and Mastromonaco, M.N.: Updated trends for atmospheric mercury in the Arctic: 1995–2018, Sci. Total Environ., 837, 155802, https://doi.org/10.1016/j.scitotenv.2022.155802, 2022.
Mazur, M., Mintz, R., Lapalme, M., and Wiens, B.: Ambient air total gaseous mercury concentrations in the vicinity of coal-fired power plants in Alberta, Canada, Sci. Total Environ., 408, 373–381, 2009.
McClure, C. D. and Jaffe, D. A.: US particulate matter air quality improves except in wildfire-prone areas, P. Natl. Acad. Sci. USA, 115, 7901–7906, 2018.
McLagan, D. S., Stupple, G. W., Darlington, A., Hayden, K., and Steffen, A.: Where there is smoke there is mercury: Assessing boreal forest fire mercury emissions using aircraft and highlighting uncertainties associated with upscaling emissions estimates, Atmos. Chem. Phys., 21, 5635–5653, https://doi.org/10.5194/acp-21-5635-2021, 2021.
Michael, R., Stuart, A. L., Trotz, M. A., and Akiwumi, F.: Source apportionment of wet-deposited atmospheric mercury in Tampa, Florida, Atmos. Res., 170, 168–175, 2016.
NASA: Near Real-Time and MODIS Active Fire Detections (TXT/CSV format), Fire Information Resource Management System (FIRMS), https://firms.modaps.eosdis.nasa.gov/, last access: 1 October 2023.
Norris, G., Duvall, R., Brown, S., and Bai, S.: EPA Positive Matrix Factorization (PMF) 5.0 Fundamentals and User Guide. Office of Research and Development, Washington, DC 20460, https://www.epa.gov/air-research/epa-positive-matrix-factorization-50-fundamentals-and-user-guide (last access: 6 July 2022), 2014.
Obrist, D., Kirk, J. L., Zhang, L., Sunderland, E. M., Jiskra, M., and Selin, N. E.: A review of global environmental mercury processes in response to human and natural perturbations: Changes of emissions, climate, and land use, Ambio, 47, 116–140, 2018.
Obrist, D., Moosmüller, H., Schürmann, R., Chen, L. W. A., and Kreidenweis, S. M.: Particulate-phase and gaseous elemental mercury emissions during biomass combustion: controlling factors and correlation with particulate matter emissions, Environ. Sci. Technol., 42, 721–727, 2008.
Ottesen, R.T., Birke, M., Finne, T.E., Gosar, M., Locutura, J., Reimann, C., Tarvainen, T., and GEMAS Project Team: Mercury in European agricultural and grazing land soils, Appl. Geochem., 33, 1–12, 2013.
Outridge, P. M., Mason, R. P., Wang, F., Guerrero, S., and Heimburger-Boavida, L. E.: Updated global and oceanic mercury budgets for the United Nations Global Mercury Assessment 2018, Environ. Sci. Technol., 52, 11466–11477, 2018.
Pancras, J. P., Landis, M. S., Norris, G. A., Vedantham, R., and Dvonch, J. T.: Source apportionment of ambient fine particulate matter in Dearborn, Michigan, using hourly resolved PM chemical composition data, Sci. Total Environ., 448, 2–13, 2013.
Pirrone, N., Cinnirella, S., Feng, X., Finkelman, R. B., Friedli, H. R., Leaner, J., Mason, R., Mukherjee, A. B., Stracher, G. B., Streets, D. G., and Telmer, K.: Global mercury emissions to the atmosphere from anthropogenic and natural sources, Atmos. Chem. Phys., 10, 5951–5964, https://doi.org/10.5194/acp-10-5951-2010, 2010.
Qin, X., Zhang, L., Wang, G., Wang, X., Fu, Q., Xu, J., Li, H., Chen, J., Zhao, Q., Lin, Y., Huo, J., Wang, F., Huang, K., and Deng, C.: Assessing contributions of natural surface and anthropogenic emissions to atmospheric mercury in a fast-developing region of eastern China from 2015 to 2018, Atmos. Chem. Phys., 20, 10985–10996, https://doi.org/10.5194/acp-20-10985-2020, 2020.
Rutter, A. P. and Schauer, J. J.: The impact of aerosol composition on the particle to gas partitioning of reactive mercury, Environ. Sci. Technol., 41, 3934–3939, 2007.
Selin, N. E. and Jacob, D. J.: Seasonal and spatial patterns of mercury wet deposition in the United States: Constraints on the contribution from North American anthropogenic sources, Atmos. Environ., 42, 5193–5204, 2008.
Shah, V., Jacob, D. J., Thackray, C. P., Wang, X., Sunderland, E. M., Dibble, T. S., Saiz-Lopez, A., Černušák, I., Kello?, V., Castro, P. J., Wu, R., and Wang, C.: Improved mechanistic model of the atmospheric redox chemistry of mercury, Environ. Sci. Technol., 55, 14445–14456, 2021.
Shah, V., Jaeglé, L., Gratz, L. E., Ambrose, J. L., Jaffe, D. A., Selin, N. E., Song, S., Campos, T. L., Flocke, F. M., Reeves, M., Stechman, D., Stell, M., Festa, J., Stutz, J., Weinheimer, A. J., Knapp, D. J., Montzka, D. D., Tyndall, G. S., Apel, E. C., Hornbrook, R. S., Hills, A. J., Riemer, D. D., Blake, N. J., Cantrell, C. A., and Mauldin III, R. L.: Origin of oxidized mercury in the summertime free troposphere over the southeastern US, Atmos. Chem. Phys., 16, 1511–1530, https://doi.org/10.5194/acp-16-1511-2016, 2016.
Sommar, J., Osterwalder, S., and Zhu, W.: Recent advances in understanding and measurement of Hg in the environment: Surface-atmosphere exchange of gaseous elemental mercury (Hg0), Sci. Total Environ., 721, 137648, https://doi.org/10.1016/j.scitotenv.2020.137648, 2020.
Sonke, J. E., Angot, H., Zhang, Y., Poulain, A., Björn, E., and Schartup, A.: Global change effects on biogeochemical mercury cycling, Ambio, 52, 853–876, 2023.
Streets, D. G., Horowitz, H. M., Lu, Z., Levin, L., Thackray, C. P., and Sunderland, E. M.: Global and regional trends in mercury emissions and concentrations, 2010–2015, Atmos. Environ., 201, 417–427, 2019.
Tang, K., Song, Z., Fu, X., Zhang, Y., Zhang, H., Sun, Y., Zhang, H., Wu, X., Deng, Q., Zhang, L., Suratman, S., Seng, T. H., and Feng, X.: An Interhemispheric Difference in Atmospheric Gaseous Elemental Mercury Isotopes Reveals a New Insight in Oceanic Mercury Emissions, J. Geophys. Res., 130, e2024JD042178, https://doi.org/10.1029/2024JD042178, 2025.
Temme, C., Blanchard, P., Steffen, A., Banic, C., Beauchamp, S., Poissant, L., Tordon, R., and Wiens, B.: Trend, seasonal and multivariate analysis study of total gaseous mercury data from the Canadian atmospheric mercury measurement network (CAMNet), Atmos. Environ., 41, 5423–5441, 2007.
UN Environment (UNEP): Global Mercury Assessment 2018. UN Environment Programme, Chemicals and Health Branch Geneva, Switzerland, https://www.unep.org/resources/publication/global-mercury-assessment-2018 (last access: 3 March 2024), 2019.
Wang, X., Lin, C.-J., Yuan, W., Sommar, J., Zhu, W., and Feng, X.: Emission-dominated gas exchange of elemental mercury vapor over natural surfaces in China, Atmos. Chem. Phys., 16, 11125–11143, https://doi.org/10.5194/acp-16-11125-2016, 2016.
Wang, Y., Huang, J., Hopke, P. K., Rattigan, O. V., Chalupa, D. C., Utell, M. J., and Holsen, T. M.: Effect of the shutdown of a large coal-fired power plant on ambient mercury species, Chemosphere, 92, 360–367, 2013.
Yao, X. and Zhang, L.: Identifying decadal trends in deweathered concentrations of criteria air pollutants in Canadian urban atmospheres with machine learning approaches, Atmos. Chem. Phys., 24, 7773–7791, https://doi.org/10.5194/acp-24-7773-2024, 2024.
Yu, J., Yan, C., Liu, Y., Li, X., Zhou, T., and Zheng, M.: Potassium: a tracer for biomass burning in Beijing?, Aerosol Air Qual. Res., 18, 2447–2459, 2018.
Zhang, L., Vet, R., Wiebe, A., Mihele, C., Sukloff, B., Chan, E., Moran, M. D., and Iqbal, S.: Characterization of the size-segregated water-soluble inorganic ions at eight Canadian rural sites, Atmos. Chem. Phys., 8, 7133–7151, https://doi.org/10.5194/acp-8-7133-2008, 2008.
Zhang, L., Wright, L. P., and Blanchard, P.: A review of current knowledge concerning dry deposition of atmospheric mercury, Atmos. Environ., 43, 5853–5864, 2009.
Zhang, Y., Jacob, D. J., Horowitz, H. M., Chen, L., Amos, H. M., Krabbenhoft, D. P., Slemr, F., St. Louis, V. L., and Sunderland, E. M.: Observed decrease in atmospheric mercury explained by global decline in anthropogenic emissions, P. Natl. Acad. Sci. USA, 113, 526–531, 2016.
Zhang, Y., Zhang, P., Song, Z., Huang, S., Yuan, T., Wu, P., Shah, V., Liu, M., Chen, L., Wang, X., Zhou, J., and Agnan, Y.: An updated global mercury budget from a coupled atmosphere-land-ocean model: 40 % more re-emissions buffer the effect of primary emission reductions, One Earth, 6, 316–325, 2023.
Zhou, J., Obrist, D., Dastoor, A., Jiskra, M., and Ryjkov, A.: Vegetation uptake of mercury and impacts on global cycling, Nature Reviews Earth and Environ., 2, 269–284, 2021.
Zhu, W., Lin, C.-J., Wang, X., Sommar, J., Fu, X., and Feng, X.: Global observations and modeling of atmosphere–surface exchange of elemental mercury: a critical review, Atmos. Chem. Phys., 16, 4451–4480, https://doi.org/10.5194/acp-16-4451-2016, 2016.