the Creative Commons Attribution 4.0 License.
the Creative Commons Attribution 4.0 License.
Measurement report: A comparative analysis of an intensive incursion of fluorescing African dust particles over Puerto Rico and another over Spain
Bighnaraj Sarangi
Darrel Baumgardner
Ana Isabel Calvo
Benjamin Bolaños-Rosero
Roberto Fraile
Alberto Rodríguez-Fernández
Delia Fernández-González
Carlos Blanco-Alegre
Cátia Gonçalves
Estela D. Vicente
Olga L. Mayol-Bracero
Measurements during episodes of African dust, made with two wideband integrated bioaerosol spectrometers (WIBSs), one on the northeastern coast of Puerto Rico and the other in the city of León, Spain, show unmistakable, bioaerosol-like fluorescing aerosol particles (FAPs) that can be associated with these dust episodes. The Puerto Rico event occurred during a major incursion of African dust during June 2020. The León event occurred in the late winter and spring of 2022, when widespread, elevated layers of dust inundated the Iberian Peninsula. Satellite and back-trajectory analyses confirm that dust from northern Africa was the source of the particles during both events. The WIBSs measure the size of individual particles in the range from 0.5 to 30 µm, derive a shape factor, and classify seven types of fluorescence from the FAPs. In general, it is not possible to directly determine the specific biological identity from fluorescence signatures; however, measurements of these types of bioaerosols in laboratory studies allow us to compare ambient fluorescence patterns with whole microbial cells measured under controlled conditions. Here we introduce some new metrics that offer a more quantitative approach for comparing FAP characteristics derived from particles measured under different environmental conditions. The analysis highlights the similarities and differences at the two locations and reveals differences that can be attributed to the age and history of the dust plumes, e.g., the amount of time that the air masses were in the mixed layer and the frequency of precipitation along the air mass trajectory.
- Article
(11310 KB) - Full-text XML
-
Supplement
(3099 KB) - BibTeX
- EndNote
Fungal spores, spread by air currents, are some of the most abundant components of the bioaerosol population (Després et al., 2012). Their presence in the atmosphere has been linked to the formation of cloud condensation nuclei (CCN) and ice nuclei (IN), thus playing a key role in the hydrological cycle (Huffman et al., 2013; Woo et al., 2018; Lawler et al., 2020). However, they may also have a negative environmental impact as many of them are described as important phytopathogens and constitute a hazard to animal and human health (Fröhlich-Nowoisky et al., 2016). Although there is large fungal biodiversity, the most abundant taxa are Ascomycota and Basidiomycota (Fröhlich-Nowoisky et al., 2009; Dietzel et al., 2019). The airborne spore load varies depending on the location and the season since such loading is closely linked to vegetation and meteorological conditions (Kasprzyk et al., 2015; Grinn-Gofroń et al., 2019; Anees-Hill et al., 2022; Rodríguez-Fernández et al., 2023). Nevertheless, the annual airborne dynamics can be altered by extreme weather phenomena such as thunderstorms, frontal systems, or dust intrusions (Wu et al., 2004; Pulimood et al., 2007).
Dust intrusions are especially important because these long-distance spore transport events allow spores to colonize new environments (Rodríguez-Arias et al., 2023). In fact, some of these African dust (AD) events have been related to important environmental hazards such as the decline in Caribbean coral reefs (Shinn et al., 2000; Hallegraeff et al., 2014). Agglomeration processes may also occur during these dust events, facilitating the adhesion of particulates with small diameters (40–90 nm) onto the surfaces of the pollen grains and spores. Gravitational coagulation has been identified as the most likely mechanism of deposition on particle surfaces of about 20 µm (pollen grains) during long-distance transport (Choël et al., 2022); however, other mechanisms of particle scavenging should not be underestimated. Fungal spores typically carry an electrostatic charge due to the complex chemical composition of their cell walls (Hannan, 1961; Leach, 1976; Feofilova, 2010; Wargenau et al., 2011). The differences in electrostatic charges can cause other particles to bind to the spore surface (Visez et al., 2020). The agglomeration process may increase the allergenic potential of airborne spores and pollen due to chemical reactions, increasing the health risk for allergy sufferers (Sénéchal et al., 2015).
The arid regions of northern Africa are some of the largest sources of desert dust in the world. These regions emit about 800 Tg yr−1, corresponding to approximately 70 % of the annual, global dust loading (Prospero et al., 2014; Ryder et al., 2019). A large fraction (∼ 182×106 t yr−1) of these emissions move westward, ∼ 2500 km across the Atlantic Ocean, extending in a continuous AD plume over the Caribbean basin (Yu et al., 2015, 2021). Similarly, the transport of AD over Europe demonstrates clear seasonality whereby such events are more frequent from late autumn to early winter (February to June) (Escudero et al., 2005; García Valero et al., 2022). With climate change contributing to further desertification, not only on the Africa continent, but also in Asia and other parts of the world, dust incursion events will likely increase in intensity and duration in the coming decades.
Fluorescence from dust particles has also been detected with lidar, such as the in measurements reported by Sugimoto et al. (2012) and Wang et al. (2023), who report relatively strong, broad fluorescence from Asian dust and air-pollution aerosols transported from urban and industrial areas at wavelengths between 343 and 526 nm.
The majority of studies that have evaluated the transport of bioaerosols by AD have used samplers that capture the particles on substrates that are subsequently analyzed in the laboratory under a microscope or using deoxyribonucleic acid (DNA) analysis. These analysis methodologies are the most robust for identifying specific taxa of biological spores; however, online techniques offer the advantage of larger sample sets that can be evaluated at much higher temporal resolution. Techniques that use ultraviolet laser-induced fluorescence (UV-LIF), such as that using wideband integrated bioaerosol spectrometers (WIBSs), provide detailed information on the size, shape, and fluorescence intensity of individual particles in real time (Kaye et al., 2005). A recent investigation by Morrison et al. (2020) employed a WIBS that was situated at the São Vicente Cape Verde Atmospheric Observatory, off the west coast of central Africa, measuring continuously from September 2015 to August 2016. Their measurements found strong seasonal changes in absolute concentrations of fluorescing aerosol particles (FAPs), with significant enhancements during winter due to the strong island inflow of air masses originating from the African continent. The authors' results indicate that the relative contribution of bioaerosol material in dust transported across the tropical Atlantic throughout the year is relatively uniform, consisting mainly of mixtures of dust and bacteria and/or bacterial fragments. The authors support their conclusions by comparing the WIBS measurements with those from a laser ablation aerosol particle time-of-flight mass spectrometer (LAAP-ToF). The latter measurements show a high correlation between particles with mixed bio-silicate mass spectral signatures and UV-LIF bio-fluorescent signatures, leading to the conclusion that the FAP concentrations are dominated by these mixtures.
The measurements reported here, in our current study, complement those of Morrison et al. (2020), with results from locations farther downwind than their study site in Cabo Verde. Our objectives are to
-
expand the database of real-time measurements related to long-range-transported African dust and the FAPs associated with these events;
-
evaluate the relative changes in the multi-faceted patterns of fluorescing particles, measured with the UV-LIF technique, as they relate to the air mass sources and ages;
-
introduce new metrics, unique to the UV-LIF technique, that provide additional quantification of the FAP properties; and
-
compare the real-time fluorescence signatures to those bioaerosols measured with off-line techniques.
2.1 Study zones
The Caribbean measurement site is the Cape San Juan (CSJ) atmospheric observatory (18°22.85′ N, 65°37.07′ W; 60 m a.s.l.) located on the most northeastern point on the coast of Puerto Rico (PR). The European measurements were made at the University of León, León, Spain, located in the northwest region of the Iberian Peninsula (42°36′ N, 05°35′ W; 838 m a.s.l.). Cape San Juan is a remote, coastal research site managed by the Atmospheric Chemistry and Aerosols Research (ACAR) group at the University of Puerto Rico – Rio Piedras Campus (UPR-RP). This measurement site has been frequently used for sampling aerosols of non-anthropogenic origin (Novakov et al., 1997; Mayol-Bracero et al., 2001; Allan et al., 2008) because the predominate airflow is from the northeast and the particles are typically those generated from the ocean. i.e., sea salt, non-sea-salt sulfates, and organic carbon (Allan et al., 2008). Furthermore, CSJ is also a recognized site for the World Meteorological Organization's Global Atmosphere Watch (WMO GAW) (Andrews et al., 2019) and the National Aeronautics and Space Administration (NASA) network for the Aerosol Robotic NETwork (AERONET), PANDORA, and MPLNET.
As previously stated, the city of León is located in the northwest of the Iberian Peninsula. The climate has Mediterranean maritime as well as continental features (Calvo et al., 2018). The sampling site is on the roof of the Faculty of Veterinary Medicine, 15 m above ground level, at the León University campus. The university is located in the northeast suburban region of the city, which is largely devoid of local industrial emissions, although there are daily anthropogenic emissions from vehicular traffic whose organic compounds, like polyaromatic hydrocarbons (PAHs), will fluoresce and need to be removed from the evaluation as non-bioaerosols, a procedure discussed below.
2.2 Data sets and sources
The data used in the present study come from several sources of in situ and remote sensor measurements, as well as from air mass back trajectories derived from archived meteorological data. Table 1 lists the data sets that have been evaluated, their sources, and the parameters that were extracted. The primary source of particle information comes from the wideband integrated bioaerosol spectrometers (WIBSs) since the main focus of our study is on the FAPs that are being transported by AD. Ancillary information about the origins of the air masses and complementary measurements of the particle optical properties and the state of the local environments, e.g., meteorology, are included in order to better understand the impact of the AD intrusions.
Table 1Data sets used in the analysis.
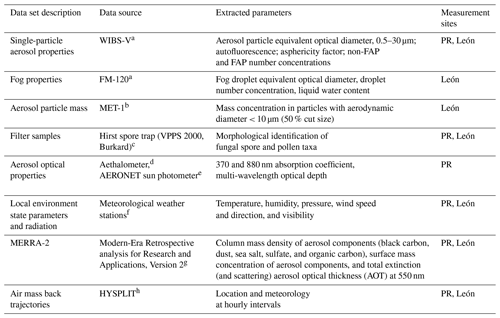
a Manufactured by Droplet Measurement Technologies, LLC, Longmont, CO, USA. b Manufactured by Met One Instruments, Grants Pass, OR, USA. c Manufactured by Lanzoni, Bologna, Italy, and Burkard Scientific Ltd., Uxbridge, UK. d Manufactured by Aerosol Magee Scientific Inc., Berkeley, CA, USA. e Manufactured by CIMEL Electronique, Paris, France. f Manufactured by Vaisala and Davis Instruments, Hayward, CA, USA. g https://disc.gsfc.nasa.gov/datasets/M2T1NXAER_5.12.4/summary, last access: 25 January 2023. h https://www.ready.noaa.gov/index.php, last access: 11 September 2024.
Given the importance of the WIBS measurements, the following section focuses on the WIBS measurement principles, its limitations and uncertainties, the filtering necessary to minimize artifacts in the data, the corrections applied for dead-time losses, and the parameters that are derived that provide tracking of the unique patterns that are found in the particle properties.
2.3 Wideband integrated bioaerosol spectrometer (WIBS)
2.3.1 Principles of operation and uncertainties and limitations
The WIBS measurement principles are based on ultraviolet light-induced fluorescence (UV-LIF) (Kaye et al., 2005; Stanley et al., 2011). The current instrument model, the WIBS-V, differs from earlier models only in how the data are formatted and how dead-time losses are taken into account. The Supplement describes the WIBS in greater detail, along with the specific algorithms used to filter and correct the measurements prior to analysis and interpretation. All WIBS models bring individual particles into the instrument with an internal pump and direct them through a collimated laser beam using aerodynamic focusing. The light scattered from each particle is used as a signal to trigger two xenon flash lamps, which activate sequentially, illuminating the particle as it leaves the laser beam, with light filtered at 280 and 370 nm, respectively. Two detectors, one with a bandpass filter at 310–400 nm and the other with a 420–650 nm filter, receive light emitted by autofluorescence if there is material in the particle that is excited to fluoresce at one or both excitation wavelengths. The equivalent optical diameter (EOD) is derived from the light scattered by the particle as it transits the laser beam, and an “asphericity/asymmetry factor” (AF) is derived from a quadrant detector that is illuminated by the forward-scattered light from this same particle.
A number of naming conventions have been introduced in the literature over the years for labeling the fluorescence combinations that are possible with the WIBS measurements; however, they all agree on using FL1 (Channel A) and FL2 (Channel B) to denote signals from the excitation at 280 nm and emissions at 310–400 and 420–650 nm, respectively, and FL3 (Channel C) to indicate signals from excitation at 370 nm and emissions at 420–650 nm. As is often the case, the fluorescence from a single particle may be a combination of any two or three of these excitation–emission pairs, leading to as many as seven possible fluorescent types. Following the convention first proposed by Perring et al. (2015), we will label these seven types A, B, C, AB, AC, BC, and ABC throughout the remainder of this paper.
The two major sources of uncertainty are fluorescence artifacts and missed fluorescence signals due to electronic dead time. Both of these uncertainties and steps taken to minimize or to correct for them are discussed in greater detail in the Supplement, as well as in previous publications (Calvo et al., 2018; Sarangi et al., 2022). In short, there are two types of fluorescence artifacts: (1) light detected by the fluorescence detectors that is not fluorescence from ambient particles and (2) light detected by the fluorescence detectors that is produced by non-biological materials.
If the chamber where particles are illuminated by the flash lamps is not cleaned after regular use, material may accumulate that will fluoresce, albeit at a fairly low level. Nevertheless, this fluorescence represents a source of background noise that needs to be quantified and removed from the signal produced by legitimate FAPs. A second source of fluorescence artifacts is the light from the xenon lamps themselves, a small fraction of which can leak through the filters in front of the fluorescence detectors since these filters are not 100 % efficient at removing light at wavelengths outside their wave band. Non-biological materials, such as polycyclic aromatic hydrocarbons (PAHs) or black carbon, which can also fluoresce when illuminated, are here considered artifacts with respect to differentiating them from fluorescing bioaerosols (Gabey et al., 2013; Perring et al., 2015; Pöhlker et al., 2012; Toprak and Schnaiter, 2013). These artifacts cannot be completely removed from the analysis but can be minimized by removing from the processing any particles whose fluorescence falls below a preset threshold. As described in the Supplement, we follow the methodology of Perring et al. (2015) and Morrison et al. (2020) by creating daily frequency histograms of the FL1-, FL2-, and FL3-type FAPs and use a threshold that is the mode of the frequency distribution plus 9 standard deviations (9σ) as the minimum threshold that has to be exceeded before a fluorescing event is accepted as valid.
The aforementioned uncertainty due to electronic dead time is associated with the 8 ms that is required to recharge after each xenon lamp flash. During this period, if the lamps receive a trigger signal, they will not discharge, so if the particle that is passing through the chamber is a FAP, it will not be identified as such since it will not be excited by the lamps. The WIBS registers the particle's size, but a statistical correction is needed to account for the fraction of particles each second that might have been FAPs but passed through the xenon chamber during “dead time”. The Supplement includes a discussion of how this correction is derived.
2.3.2 FAP features extracted from laboratory bioaerosol studies
The FAPs that were measured for the current study are assumed to be bioaerosols since we have taken care to minimize artifacts; however, we are unable to use a priori the FAP properties to label the particle as a specific taxon of bioaerosol, i.e., bacteria, fungal spores, or pollen, to name the three bioaerosol types most commonly found in the ambient environment (henceforth, we will group these three types of bioaerosols and refer to them as BSP). We will take, instead, the same approach as in Calvo et al. (2018) and refer to a specific FAP as, for example, “bacteria-like” or “fungi-like” when a specific set of FAP metrics in the environmental measurements match the same metrics derived from laboratory measurements. Here we are making the assumption that ambient conditions like temperature and humidity do not change the fluorescence properties of a particular taxon from those measured in the laboratory for the same taxon.
We have reprocessed the data set that was used in the Hernandez et al. (2016) laboratory studies: these include 15 types of bacteria, 29 types of common fungal spores, and 13 varieties of pollen, all typically found in the natural environment. Figure 1a shows a composite of the fluorescence type and EOD of the 57 different varieties of BSP. Figure 1b shows an example of these same varieties superimposed on a composite of measured FAPs for a non-dust day in PR. This illustrates how the environmental data cluster by FAP type and EOD in patterns that are very similar to those formed from the laboratory measurements. The color scale in Fig. 1b denotes how frequently during the 2 d period the FAP types and EODs fell within the different FAP type vs. EOD regions. In this example, although the environmental FAPs fall in regions where the lab data show bacteria, fungal spores, and pollen, quite a few of the FAPs were in the regions of FAP types C and AB, where very few of the lab results were found.
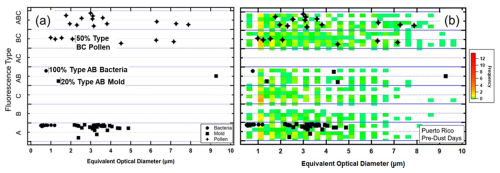
Figure 1(a) A BSP map showing how 15 bacteria, 29 mold, and 13 pollen taxa were measured in the laboratory by a WIBS, as a function of FAP type and EOD and (b) the same BSP map with FAP measurements from a non-dust day in Puerto Rico plotted using the same definitions for FAP type and EOD. The color scale denotes how frequently during the 2 d period the FAP types and EODs fell within the different regions. In this example, although the environmental FAPs fall in regions where the lab data show bacteria, mold, and pollen, quite a few of the FAPs were in the region of FAP types C and AB, where very few of the lab results were found.
Although this method of comparing lab BSP patterns with environmental FAPs cannot be construed as a quantitative way to relate the WIBS measurements directly to BSP taxa, the laboratory data provide a reference data set to which we can compare the measured BSP maps and evaluate relative changes in patterns related to the AD intrusions.
2.3.3 Working hypotheses and analysis metrics
From our work and from the work of others, we have sufficient measurements to conclude that fluorescence intensity, regardless of the BSP taxa, is too variable to be used as a FAP property that can be unequivocally or unambiguously related to a bioaerosol type. Likewise, the asymmetry factor can be used as a rough indicator of asphericity but cannot provide finer structural details. The fluorescence emission intensity is a complex interaction between the uniformity of the excitation radiation over the surface of the FAPs, the orientation of the particle as it is exposed to the incident light, the non-isotropic nature of the fluorescence emissions, and fluorescence quenching by material mixed with the FAPs (Lakowicz, 2006). The observation from microscopic analysis that a significant fraction of bioaerosols in the natural environment are not intact – i.e., they are fractured pieces that can still fluoresce but with less intensity and with shapes unrepresentative of a whole particle – adds to these uncertainties.
The specific pairs of excitation–emission wavelengths employed in the WIBS were originally selected by Kaye et al. (2005) due to their responsiveness to tryptophan (280 nm–310 to 400 nm) and nicotinamide adenine dinucleotide (NAD; 370 nm–420 to 650 nm). Given that these two fluorophores are omnipresent in plant tissues and microbiological cells, they are good fluorescent markers for bioaerosols. Nevertheless, the aforementioned uncertainties prevent more definitive speciation of the FAPs without complementary analysis using samples captured on filters or substrates that can undergo microscopic analysis and classification by human observers or more intensive DNA analysis.
The advantage and power of the WIBS lie in the high-resolution information that it extracts from individual particles, information that provides a statistically large sample that describes the sizes, shapes, and fluorescence patterns of an ensemble of particles in air masses whose properties can change over relatively short time periods. Hence, even though there are large variations in these properties, particle by particle, over periods as short as 5 to 10 min, tens of thousands of particles in the size range of 0.5 to 30 µm can be analyzed. Not only are the average properties important, but also their variances contain valuable information about the composition and potential sources of these particles.
The analysis methodology that is selected to evaluate the WIBS data needs to be tailored to the specific questions that are being addressed. Much progress has been made in the past 10 years in the use of cluster analysis to identify features of the FAPs, which are indirectly related to the type of bioaerosol (Robinson et al., 2013; Crawford et al., 2015; Morrison et al., 2020). In our study, however, we are asking a different set of questions, where knowing the type of bioaerosol is not as important as understanding how the FAPs are transported and their properties transformed while in AD plumes. Hence, we take a more heuristic approach whereby we concentrate on evaluating the nine parameters (size, shape, and seven FAP types) that can be extracted from individual particles, and we use this evaluation to address the following questions:
- 1.
Are the FAPs that are found within the AD plumes, which inundate the Caribbean and the Iberian Peninsula, internally or externally mixed with the dust particles?
- 2.
What features of the FAPs change between normal background conditions and periods when the AD is present?
- 3.
Can the observed changes in the FAP properties be physically linked to the air mass histories?
Starting with the assumption that the properties of aerosols in dust plumes will differ significantly from those of aerosols in the local environments of PR and León, we hypothesize that
-
the bioaerosols that are in the dust plumes will be a mixture of bioaerosol types that differ from those found in the PR or León ambient environments and
-
the majority of FAPs in the AD plumes will be attached or internally mixed with dust particles.
To provide answers to these questions and to test our working hypotheses, we focus on how the size distributions of number concentration, fluorescence intensity, and shape factor differ within the populations of non-FAPs and FAPs. These differences – between the PR and León sites, before and during AD events – can be quantified using comparisons of the size distribution metrics. These metrics can be visualized by referring to Fig. 2, which shows example size distributions of the FAP type ABC fluorescence intensity (Fig. 2a), number concentration (Fig. 2b), and shape factor (Fig. 2c), before (green curve) and during (brown curve) a dust intrusion. An EOD of 5 µm has been arbitrarily selected as the threshold between “small” and “large” particles.

Figure 2Examples of size distributions of type ABC fluorescing aerosol particles before (green curve) and during (brown curve) a dust intrusion, highlighting the features that are used as metrics in the analysis methodology. (a) Average fluorescence intensity as a function of EOD. The vertical and horizontal blue arrows highlight increases in intensity and size, respectively, with the incursion of AD. The size distributions have been divided into “small particle” (shaded) and “large particle” sections. (b) Average number concentration as a function of size. (c) Average asphericity as a function of size.
The metrics that are derived from these size distributions and that we will use in our comparative analyses are
- 1.
the change in fluorescence intensity, number concentration, and shape factor of small particles;
- 2.
the change in fluorescence intensity, number concentration, and shape factor of large particles;
- 3.
the change in the ratio of the concentration of small to concentration of large particles;
- 4.
the change in median diameter.
From the examples shown in Fig. 2, for the FAP type ABC, there is a significant increase in the average fluorescence intensity and number concentration of small and large EOD particles with the intrusion of AD; however, the shape factor size distributions are similar. As will be highlighted below, these differences can be interpreted in the context of the relative mixture of FAP types and also of how these FAPs are physically mixed with non-FAPs.
2.4 Complementary measurements
Meteorological data, including temperature (°C), relative humidity (RH, %), rain (mm), pressure (mbar), wind speed (WS, m s−1), and wind direction (°), were accessed from the weather station (Vaisala, WXT530) mounted on the top (30 ft, approx. 9.1 m, from the ground) railing of an aluminum tower at the Puerto Rico measurement site (CSJ).
The optical properties of the particles in PR were measured in situ with an Aethalometer (Aerosol Magee Scientific) and remotely with a sun photometer. The Aethalometer derived the absorption coefficients from measurements of attenuations at 370 and 880 nm. The spectral aerosol optical depth (AOD), Ångström exponent, and volume size distributions were accessed from the sun–sky CIMEL CE318 sun photometer that measures direct solar irradiances with a field of view of approximately 1.2° and sky radiances at spectral wavelengths of 340, 380, 440, 500, 675, 870, 1020, and 1640 nm. The CIMEL sun photometer at CSJ is a component of the NASA Aerosol Robotic NETwork (AERONET) and has provided long-term records of columnar aerosol optical characteristics (Holben et al., 1998) since 2004.
In addition to the particle mass (PM) measurements made with the Beta PM monitor at the Junta de Castilla y León air quality stations, an FM-120 fog monitor was operated in parallel with the WIBS in León. The FM-120, developed by Droplet Measurement Technologies, LLC, measures the EOD of individual environmental particles from 2–50 µm. The FM-120 was originally developed to measure fog droplet properties; however, the measurements are not specific to fog, and in the presence of dust particles, the instrument will measure their size distributions but with a larger uncertainty because these particles will not be spherical or have a refractive index of water (1.33). The estimated uncertainty due to shape and the refractive index is approximately ±30 %.
Fungal spores and pollen were collected with Hirst samplers (Hirst, 1952) in PR and León, where they were subsequently analyzed and classified by inspection under a microscope.
Prior to delving into the details of the in situ WIBS measurements, we use remote sensing data to provide complementary evidence for the large dust incursions on those days where the WIBS measured particle properties that were anomalous when compared to those normally encountered during the respective summer and spring seasons in PR and León.
3.1 Remote sensing observations
Satellite images from the Suomi National Polar-orbiting Partnership (Suomi NPP; https://ncc.nesdis.noaa.gov/VIIRS/, last access: 25 January 2025) show a high frequency of dust intrusions over the North Atlantic during the spring and summer of 2020. One of these events was an intense, widespread dust plume that was observed over the eastern North Atlantic, clearly originating from the African Sahara region. The 23 June 2020 satellite image, shown in Fig. S1 in the Supplement, reveals a large region of dust over the Caribbean, with another extensive layer of dust leaving northern Africa. This dust plume, which at some point had a size equivalent to the area of the continental USA (around 8×10⁶ km2), impacted the Caribbean region and parts of South America, Central America, the Gulf of Mexico, and the southern USA from 21 June to 1 July. On 20 June, when the first dust layer began to affect the Caribbean, a second layer was clearly seen leaving Africa (Fig. S1a), but it was smaller in extent than the first one (Yu et al., 2021). This second dust layer impacted the same area as the first plume from 26 June to 1 July. On 22–23 June, PR received the leading edge of the dust plume; this was followed by a second dust incursion on 28–29 June (Fig. S1a). This event has been reported by a number of research groups (Francis et al., 2020; Pu and Jin, 2021; Yu et al., 2021; Asutosh et al., 2022). According to Pu and Jin (2021), the meteorology behind this dust plume was unprecedented: the surface wind speed (the strongest of the previous 42 years up until that point) increased the dust emissions in Africa, and this was followed by an intensified African easterly jet (AEZ) moving the dust plume westward. Francis et al. (2020) posit that the extreme dust event was caused by the development of a subtropical high-pressure system over northwest Africa that led to the strong northeasterlies that were sustained over the Sahara, generating 4 d of continuous dust emissions. This dust event is also clearly seen from the Modern-Era Retrospective analysis for Research and Applications, Version 2 (MERRA-2), shown in Fig. 3a for 23 June 2020, which shows clearly the same patterns as those that were derived from the Suomi NPP satellite products (Fig. S1a).
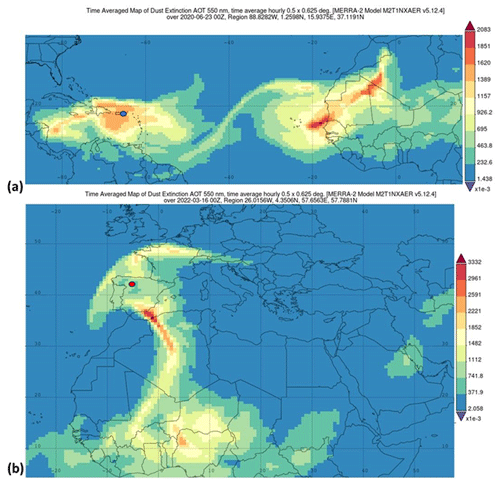
Figure 3The aerosol optical thickness (AOT) at 500 nm, derived from MERRA-2, showing (a) the air masses carrying dust from the African continent over Puerto Rico on 23 June 2020 and then (b) another plume traveling over the Iberian Peninsula and southern Europe on 16 March 2022. The blue and red markers indicate the locations of the PR and León measurement sites, respectively.
The Iberian Peninsula is also frequently inundated by Saharan dust outbreaks due to its proximity to large dust-emitting areas of the Sahara and Sahel and to atmospheric dynamics and meteorological conditions (Alastuey et al., 2016; Escudero et al., 2007; Querol et al., 2014; Rodríguez et al., 2001). Previous studies have reported that most of the outbreaks occur between spring and summer when the dust transportation is regulated by the anticyclonic activities over the east or southeast of the Iberian Peninsula (Lyamani et al., 2015; Rodríguez et al., 2001; Salvador et al., 2013). In winter, Saharan dust intrusions are scarce and are usually dominated by cyclonic activities over the west or south of Portugal (Díaz et al., 2017; Rodríguez et al., 2001). However, in late winter 2022, an unprecedented dust storm impacted the Iberian Peninsula. The dust layer traveled over a large portion of Europe, initially on 16–17 March 2022, and was followed by a secondary dust plume that covered an extended region on 27–30 March 2022. The satellite imagery obtained with Suomi NPP clearly shows the dust layer over the Iberian Peninsula on 16 and 17 March 2022 (Fig. S1b and c), and the dust layer is also seen in the images derived from the MERRA-2 data (Fig. 3b).
3.2 WIBS observations
The arrival of the AD over PR and León is reflected in large increases in the number concentration, as seen in the time series of the FAP size distributions shown in Fig. 4a and b, respectively. In PR, the first dust intrusion is seen on 21 June (day of the year, DOY, 172), and then approximately 6.5 d later, the second AD layer arrives on 27 June (DOY 179). Likewise, in León, the first AD incursion is detected by the WIBS on 16 March (DOY 74) and lasts for more than 5 d. This event is followed 10 d later by the second inundation on 26 March (DOY 84), lasting another 5 d.
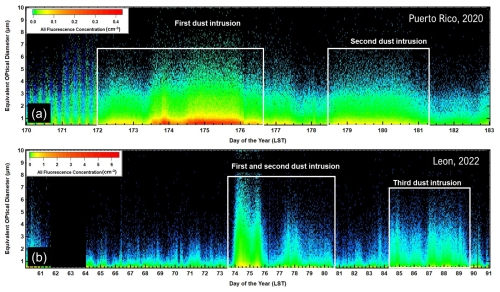
Figure 4(a) Time series of the size distributions of FAP number concentrations measured at PR, Puerto Rico. The white boxes delineate the periods when the satellite and back-trajectory analyses indicate that AD has arrived over the island; panel (b) is similar to panel (a) but for FAP concentrations measured in León, Spain. LST denotes local standard time.
The influence of these dust incursions on the general aerosol population can be observed by the changes in particle asphericity, shown in the size distributions of the shape factor (percent asphericity) depicted in Fig. 5. These size distributions are of the non-FAP aerosols and show that the shape factor increases from quasi-spherical, i.e., shape factor < 10 %, to > 30 % during the periods of AD in PR and León.
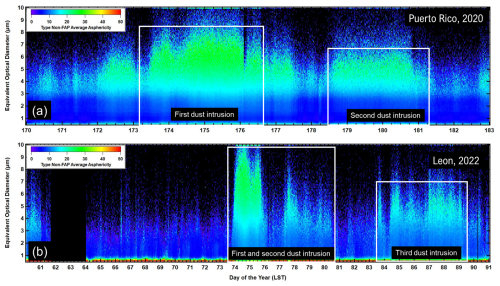
Figure 5(a) Time series of the size distributions of non-FAP asphericity measured at PR, Puerto Rico. The white boxes delineate the periods when the satellite and back-trajectory analyses indicate that AD has arrived over the island; panel (b) is similar to panel (a) but for non-FAP asphericity measured in León, Spain.
The size distributions shown in Fig. 6 highlight the similarities and differences between the PR and León aerosol populations and illustrate how the arrival of the AD significantly changes how the non-FAP and FAP number concentrations vary with size. The PR and León distributions are depicted in black and green, respectively, with solid lines for pre-dust events and dashed lines for dust intrusions. The pre-dust size distributions of all aerosol particles, non-FAPs and FAPs (Fig. 6a), are almost identical at both sites, with a small fraction of the León particle population larger than those particles in PR. The arrival of dust leads to an increase of almost 2 orders of magnitude in both the PR and the León concentrations, over all sizes, and brings significant numbers of particles larger than 10 µm. For the non-FAP aerosols, the relationship between concentration and size during the AD event is nearly the same for PR and León.
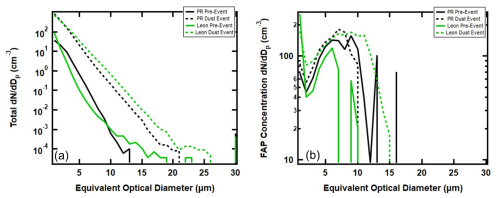
Figure 6Average size distributions in PR and León, before and during AD events for the (a) number concentrations of the non-FAP aerosol population in the size range of the WIBS and (b) number concentrations of the FAPs.
A comparison of the FAP size distributions (Fig. 6b) tells a very different story. Below 2 µm, the León FAP concentrations exceed those in PR by about a factor of 4; however, the PR FAP pre-dust size distribution is much broader than the FAPs in León, extending beyond 10 µm, while the FAP size distribution in León ends at around 7 µm. The arrival of the dust does little to change the general shape of the PR size distribution, other than slightly narrowing it. In contrast, the León size distribution broadens out significantly to 15 µm. This difference between PR and León offers the first clue that there is a difference between PR and León with respect to how FAPs are mixed with non-FAPs in the AD plumes that inundate these two sites.
The average number concentration of non-FAPs and FAPs, the ratio of FAP to non-FAP concentrations, and the median equivalent optical diameters (MEODs) of non-FAPs and FAPs are bulk parameters that are extracted from the size distributions, and they are shown in Fig. 7 for periods with no influence from AD and for those in the presence of dust. Whereas Fig. 6a and b only show one period with no dust and one period with AD for PR and León, Fig. 7 includes the second periods of dust, for the two locations, accompanied by periods before and after the dust intrusion. This more comprehensive data set demonstrates that for both PR and León, there are clear differences in the bulk parameters under no-dust and dust conditions. The total and FAP number concentrations increase by an order of magnitude in PR and León when the AD arrives as compared to the no-dust periods (Fig. 7a and b). The ratios of FAPs to all particles (Fig. 7c) increase by a factor of 2 in PR and León under AD conditions; however, the León FAP ratios are 3 times larger than those of PR in the presence of AD. Likewise, although the arrival of dust in PR and León leads to increases in the average MEOD of all particles and FAPs (Fig. 7c and d), the increase in León is much more than in PR, 200 %–300 % vs. 30 %, respectively.
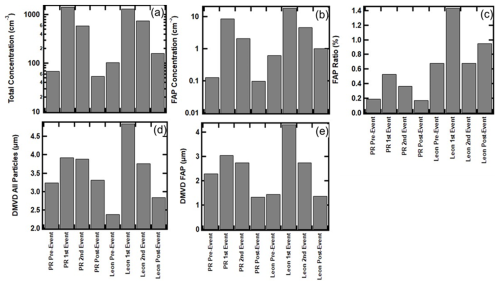
Figure 7Average values of derived parameters from WIBS measurements before, during, and after AD events: (a) total number concentration, (b) number concentration for all FAPs, (c) ratio of all FAPs to all particles, (d) median volume diameter (DMVD) of all particles between 0.5 and 30 µm, and (e) DMVD of all FAPs between 0.5 and 30 µm.
Figure 8 takes a closer look at the FAPs, stratifying them by fluorescing type. The pre-dust event aerosols in PR and León contain all seven types of FAPs. Those measured in PR extend out to 10 µm, regardless of type. In León, at EODs < 2 µm, the number concentrations are always higher than those in PR, but they never exceed 7 µm in size. The arrival of the AD significantly changes the shapes of the size distributions, especially those in León, by bringing FAPs that extend out to > 10 µm. The primary impact on the PR aerosols is to increase their number concentrations across all sizes and FAP types while making small changes to the maximum EOD, except for the FAP type B, whose maximum EOD increases from 8 to 10 µm. The change in the size distributions of type AC (Fig. 8e) with the arrival of the dust is particularly noticeable in PR and León. During non-AD periods, the concentrations of type AC FAPs are quite low at both measurement sites, and then the arrival of AD increases the concentrations by several orders of magnitude, suggesting that the dust FAPs deviate from the normal background FAPs in concentration, size, and type.
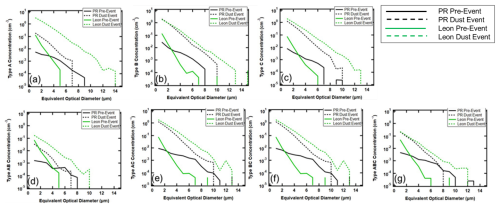
Figure 8Average number concentration size distributions of FAPs in PR (black) and León (green), before (solid) and during (dashed) AD events for (a) type A, (b) type B, (c) type C, (d) type AB, (e) type AC, (f) type BC, and (g) type ABC.
Similarly to Fig. 8, Fig. 9 illustrates the average fluorescence intensity as a function of size for the seven FAP types. Keeping in mind that the average fluorescence intensity is unrelated to the average number concentration, we observe that the average fluorescence intensity of the León pre-dust aerosols is greater than that in PR in the size range of less than 2 µm; i.e., the difference in fluorescence intensity below 2 µm is not a result of higher concentrations in León but possibly of a different type of FAP. Similarly to the comparison of the number concentrations, the PR FAPs extend out beyond 8 µm for all types. The size distributions of type B and C aerosols measured in PR and León, pre-dust, are quite similar in shape, whereas the León size distributions are quite different from those in PR for the other types, suggesting a dissimilar population of bioaerosol taxa at the two locations. The arrival of the dust leads to shifts in the size distributions that are similar for the PR and León types B and C; however, the León fluorescence intensity increases by more than 2 orders of magnitudes, while the PR intensities are higher in magnitude by about a factor of 10. Whereas the León intensities of all FAP types broaden out from a maximum of 6 µm to more than 10 µm, the PR distributions show little broadening, except for types B and C. The primary difference between the pre-dust and dust events in PR is an increase in intensity of FAPs < 5 µm as compared to the increase in intensity over all sizes with the León distributions. The difference between the PR and León changes in size distributions with the arrival of the AD is particularly striking for the type ABC aerosol. The León distributions broaden from a maximum of 6 to 12 µm, the PR distributions narrow from 10 to 8 µm, and the average fluorescence intensity decreases over this size range by more than a factor of 10. These contrasts between the PR intensity size distributions and those of León provide an additional piece to the puzzle associated with how FAPs are mixed with AD when the plumes reach the respective locations.
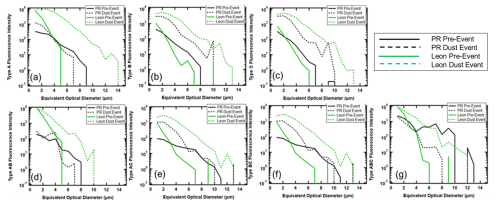
Figure 9Average fluorescence intensity of size distributions in PR (black) and León (green), before (solid) and during (dashed) AD events for (a) type A, (b) type B, (c) type C, (d) type AB, (e) type AC, (f) type BC, and (g) type ABC.
A comparison of the shape factor size distributions, shown in Fig. S4, informs us that FAP types A and AB are quasi-spherical (AF < 15 %), while the other FAP types are more aspherical (> 15 %) at EODs between 6 and 10 µm. There is not a significant difference between PR and León FAPs, either pre-dust or during the AD events.
Figure 10 highlights the transitions in the size distribution shapes, for all FAP types, by comparing the MEOD metric derived for all dust and no-dust periods, similarly to what is shown in Fig. 7d and e. In this case, however, the MEODs were extracted from the size distributions of FAP number concentration (Fig. 10a) and fluorescence intensity (Fig. 10b). There is a stark difference seen between the background MEODs of number concentration and fluorescence intensity when comparing the background (no-dust) values from PR and León. The MEODs range between 5 and 8 µm in PR, while the León MEODs are much smaller, between 2 and 5 µm. The second major difference between the PR and León MEODs is that the PR MEODs decrease with the intrusion of dust, with all FAP types except B and C, while the MEODs increase over all the FAP types. These differences are reflected in the size distributions, where we see significant increases in the number concentration and fluorescence intensity of the FAPs < 5 µm in PR, whereas it is the concentrations and intensities of FAPs > 5 µm that increase in León.
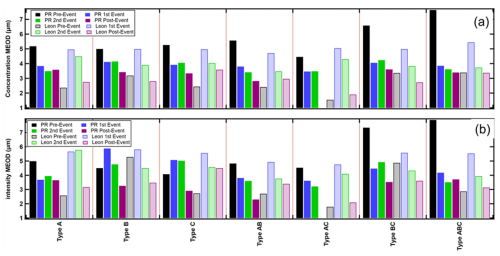
Figure 10(a) Average median equivalent optical diameters (MEODs) of the size distributions of the number concentrations for the seven FAP types. The color coding delineates the locations (PR and León) and dust event conditions (before, during, and after). (b) Same as panel (a) except the MEODs are from the size distributions of the average fluorescence intensity.
3.3 Complementary meteorological and aerosol observations
An evaluation of the meteorological state parameters and winds saw no indication of the dust arrival in PR or León; i.e., we observe no significant difference in temperature, relative humidity, wind speed, or wind direction. Hence, the meteorological properties of the dust layer do not appear to have a noticeable impact on the local meteorology in PR or León (Figs. S5 and S6).
Figure 11 illustrates the impact of the AD on the aerosol optical properties in PR, where the shaded regions delineate the time periods with AD. In PR the trends in the absorption coefficients (Fig. 11b, blue and orange curves) suggest that the leading edge of the AD layer might have already arrived at the measurement site a day earlier than indicated by the measurements from the WIBS (Figs. 4a and 5a). The 370 nm absorption coefficient shows an increase on DOY 171, reaching a peak in the middle of the day before decreasing in the evening. The 880 nm absorption coefficient does not show the same trend because dust is absorbent at 370 nm and absorbs very little at 880 nm. There were no increases in wind speed or shifts in wind direction (Fig. S1) that could indicate that these particles might be anthropogenic in origin or might be local dust. This pattern is also reflected by a small increase in the aerosol optical depth (Fig. 11a, AOD, black markers), which follows the same trend. The AOD, measured with a sun photometer, cannot discern the actual altitude where these new particles might be located; hence, these could be dust particles that had been transported into the boundary layer, where they would be measured by a Met One optical particle counter (OPC). The main body of the AD layer, identified from the WIBS measurements (Figs. 4a and 5a), arrived on DOY 172, when it is also seen clearly in the 370 nm absorption measurements (Fig. 11b) and the AOD (Fig. 11a). Note that the AOD and 370 nm absorption coefficients, although roughly correlated in time, will not follow the same trends if dust in the boundary layer and free troposphere is arriving with a different periodicity than the dust that is sedimenting or being transported downward by larger-scale eddies. The other aerosol parameter plotted in Fig. 11a is the Ångström exponent derived from the 500 and 870 nm AODs. This parameter is roughly inversely related to the average, median size of the aerosol particles. We observe in Fig. 11a (green markers) that during periods with no-dust, the exponent is larger than during periods of dust, an expected result given the significant increase in average EOD that was observed from the WIBS measurements.
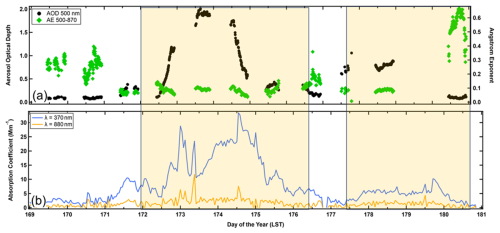
Figure 11Time series in Puerto Rico of (a) the aerosol optical depth (AOD) at 500 nm wavelength (black markers) and Ångström exponent derived from the 500 and 870 nm AODs (green markers) and (b) absorption coefficients at wavelengths of 370 nm (blue) and 880 nm (orange). The shaded areas demarcate the time periods when AD was in the region.
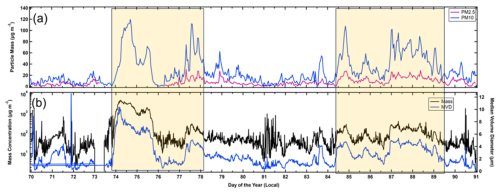
The AD incursion over León is reflected in the PM2.5 and PM10 measurements shown in Fig. 12a (magenta and blue curves, respectively). Unlike the trends in the PM measured in PR, there is clear periodicity in León, where daily peaks are observed on most days, regardless of whether the AD is present; however, during the AD, the maximum PM is 4 to 10 times larger than when the AD is not present. Given that there does not appear to be any correlation with meteorological parameters, the trends are likely the result of changes in the depth of the boundary layer. As this layer grows during the day, due to radiative heating, the AD that is aloft in the free troposphere mixes downward and increases the PM near the surface. Figure 12b shows the mass concentrations derived from the FM-120 size distributions (black curve) and the median volume diameter (blue curve). This complementary set of measurements, independent of the WIBS or air quality PM measurements, is highly correlated with the results from both instruments and shows that the MEOD increases from < 3 to > 5 µm when the AD arrives. The very large mass concentrations are a result of the particles > 10 µm, as can be observed in the time series of the FM-120 size distributions (Fig. S7). Between DOY 74 and DOY 75 the size distribution is clearly bimodal, with one peak at 5 µm and the other between 20 and 30 µm. These large particles are what drive the very high PM values seen in Fig. 12b, which are much larger than registered by the PM10 sensors at the air quality station.
3.4 Hirst sampler observations
The time series of micro- and macroconidia fungal spore concentrations, collected in PR and sorted by size range, are depicted in Fig. 13. The microconidia < 3 µm (black bars) are always the highest in concentration, followed by the microconidia > 3 µm and microconidia < 10 µm (blue) and the macroconidia > 10 µm (green). The shaded regions highlight the periods of AD. There are differences in the concentrations of these fungal spores when comparing periods with and without AD, but they are subtle. Given that the dust plume mixes with the ambient aerosols a priori, we have no reason to expect the spore concentrations to increase or decrease. More significant is the appearance of spore types that were not identified during the no-dust periods. Table 2 provides more explicit detail regarding the redistribution of spore types. More important than the total number concentrations are the appearance of new spore types and disappearance of others during the AD episodes. These are highlighted in the table in italics when periods of AD lack spores that were there during no-dust periods and in bold italics when spore types appear that were not in the no-dust periods. In addition, values in the table highlighted in bold are when a spore type increases by > 100 % from no dust to dust.
Table 2Number concentration (m−3) of fungal spores in Puerto Rico (maximum daily values). Values in italics denote periods of AD lacking spores that were present during no-dust periods, values in bold italics denote spore types appearing in AD periods that were not present in the no-dust periods, and values in bold are when a spore type increases by > 100 % from no-dust to dust. This formatting applies to the numerical values only, whereas the use of italics for the microconidia names corresponds to standard taxonomy formatting conventions.
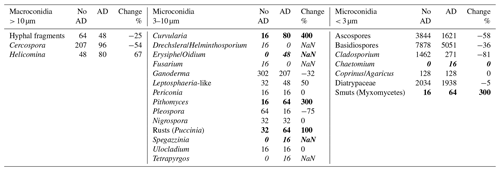
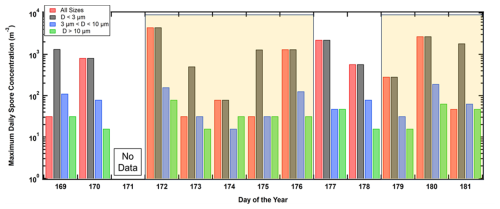
Figure 13Time series of spore concentrations, stratified by size, in Puerto Rico. The shaded regions are periods of AD inundation.
There are two spore types, Drechslera/Helminthosporium and Fusarium, that were measured on the no-dust days but were no longer identified during AD. Likewise, with the arrival of the dust, five new spores appeared that were not previously seen in the background environment: Erysiphe/Oidium, Periconia, Spegazzinia, Tetrapyrgos, and Chaetomium. Of these, the Erysiphe/Oidium had the highest concentration, 4 times higher than the others.
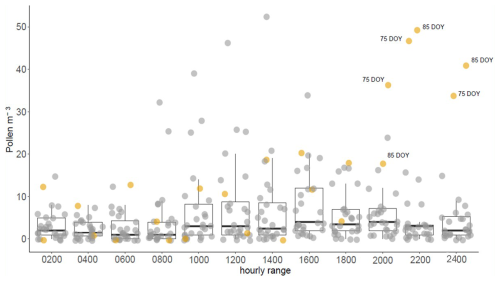
In León during March 2022, a total of nine pollen types were identified. Cupressaceae and Populus, both in their main pollen season (MPS), were the most abundant types (relative abundances of 43 % and 40 %, respectively). The other pollen types presented relative abundance values lower than 5 %. Some pollen types such as Alnus, Corylus, Fraxinus, and Ulmus were finishing their MPS, whereas Platanus, Poaceae, and Pinus were starting it. Salix was in the MPS during this period, although it is not an abundant pollen in the ambient atmosphere. During the two AD intrusions, an increase in pollen concentration compared to the previous day was registered (DOY 75: > 1000 %; DOY 85: 300 %; Fig. 14). During the first AD intrusion, most of the counted pollen belonged to Cupressaceae. Nevertheless, during the second AD inundation, the predominant pollen was Populus. Days with AD inundation did not show differences in airborne pollen diversity compared to days without AD intrusion.
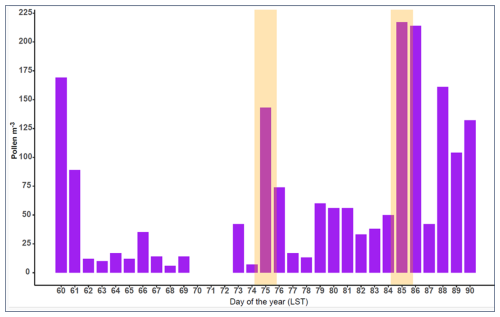
Figure 14Time series of daily average pollen concentrations in León during the selected period. The orange-shaded regions indicate the AD inundation.
Regarding the analysis of bi-hourly pollen concentration (Fig. 15), it can be observed that times with AD presented the highest pollen concentrations were from 20:00 to 24:00 UTC, which suggests pollen transport from emission sources far away from the monitoring station. In addition, airborne fungal spore taxa did not show significant concentrations during these days. The spore taxa identified during the selected period were Cladosporium, Alternaria, Pleospora, Tilletia, and Leptosphaeria.
3.5 Back-trajectory analysis
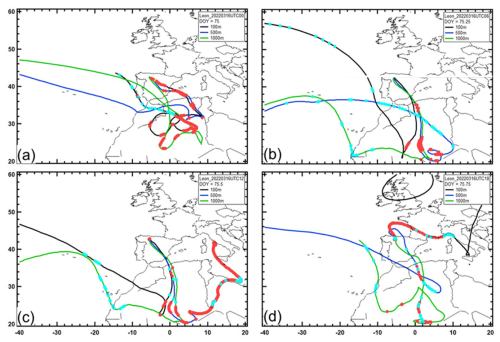
The origins and histories of the air masses were evaluated using the National Oceanic and Atmospheric Administration (NOAA) HYSPLIT back-trajectory model, incorporating the Global Data Assimilation System (GDAS) with 1° resolution (Stein et al., 2015; Rolph et al., 2017). The model was run for 13 and 5 d for PR and León, respectively, time periods commensurate with the number of days between when dust was seen in the satellite data to originate over northern Africa and to arrive at the two destinations, respectively. The ending altitudes (Fig. S8) were chosen to be 100, 500, and 1000 m based on previous studies that have shown that the AD layers can range in thickness between 100 and 1000 m (Ramírez-Romero et al., 2021). Figure 16 shows representative back trajectories for PR on 22 June 2020, color-coded by altitude and with markers (red) that indicate when and where the air was within the mixed layer and when the air mass encountered precipitation (light-blue markers). These mixed-layer parameters were selected to show where the originating air might have first picked up the dust and then later where the air might have interacted with other sources of aerosols, e.g., marine aerosols when passing over the Atlantic Ocean. The precipitation is added because it can contribute to the cloud processing of aerosols and potential removal of particles before the air arrives at its destination.
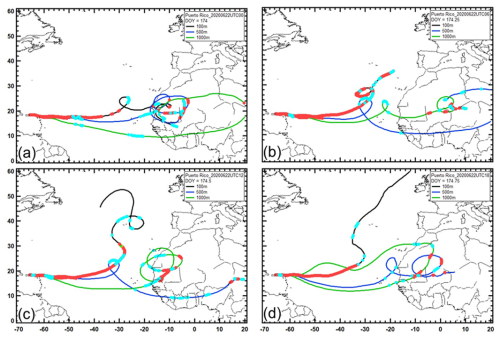
Figure 16The 13 d back trajectories of air masses arriving at 100 m (black curve), 500 m (blue curve), and 1000 m (green curve) over Puerto Rico. The red markers show every hour the air was in the mixed layer, and the light-blue markers denote each hour when rain was encountered. These images are from 22 June 2020 at (a) 00:00 UTC, (b) 06:00 UTC, (c) 12:00 UTC, and (d) 18:00 UTC.
During the 24 h period when AD was arriving on 22 June, at 00:00, 06:00, 12:00, and 18:00 UTC (Fig. 16a–d) the air can be seen originating from over the African Sahara and Sahel. At 00:00 UTC, all three trajectories had been over this region, and the red markers also show that they had been there in the mixed layer at different times, confirming that particles indigenous to that region would have originated there. At 06:00, 12:00, and 18:00 UTC, the 100, 500, and 1000 m trajectories did not always indicate being in the mixed layer, but at least one of them does; hence, the AD continued to be transported to PR over these time periods. It is also important to note that the 100 m trajectory, as well as sometimes the 500 m trajectory, arrived over PR after traveling several hundred kilometers (> 24 h) in the mixed layer. With respect to cloud processing, the HYSPLIT model indicates that throughout the day the air had encountered precipitation first over Africa and then on its travel over the Atlantic Ocean before arriving in PR.
Figure 17 provides the same information for León over four 5 h time periods on 16 March 2022. Similarly to what was observed with the air masses that brought AD to PR, the air masses that arrived over León at 100, 500, and 1000 m had all been in the mixed layer in northern Africa for varying lengths of time. Whereas most of the AD that arrived over PR originated in western Africa, those air masses over León brought particles from regions in northern and northeastern Africa. Much of the air, particularly that which arrived at 500 m over León, had also encountered frequent periods of precipitation, as indicated by the model.
In Sect. 2.3.3 we posed questions related to how the WIBS measurements could be used to distinguish differences in bioaerosol taxa in the background FAPs of PR and León and between background and dust events. Although the size distributions of the number concentrations and intensities of the FAP types in PR and León cannot be used to speciate bioaerosols, the distinct differences in the relative fraction of total FAPs in smaller and larger particles indicate that the mixtures of BSP types, i.e., bacteria, mold, or pollen, are clearly dissimilar. This is observed when comparing the two regional background aerosols and when comparing the changes when AD arrives.
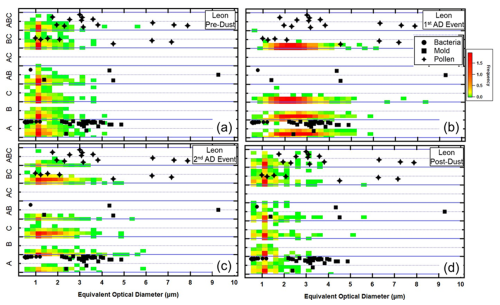
The contrasts in FAP properties are highlighted by placing their physical and fluorescing properties in the context of these same properties generated using laboratory studies, as was demonstrated in Fig. 2. Figures 18 and 19 summarize the FAP properties for the PR and León regions, before, during, and after dust events as they compare to the FAP properties of bacteria, mold, and pollen measured in the laboratory. A cursory examination of these two figures confirms that the FAP properties are significantly different between PR and León, without and with dust. While this result should not be considered surprising, displaying the FAP properties as illustrated in these figures offers a way to indirectly compare the ambient FAP properties with those of actual BSP bioaerosols. The distribution of FAPs in the PR background aerosol (Fig. 18a and d) corresponds mostly to the laboratory mold and pollen, with only a small fraction falling into the bacteria type and size. The PR FAPs that fall in the pollen region are mostly with EODs < 5 µm. There is a population of FAP types B, C, and AB that is found in the ambient environment but has no corresponding laboratory BSP types that it can be associated with. With the arrival of the dust, the FAP maps shift significantly, with the largest majority of the fluorescing particles appearing in the type B, C, and BC categories and at EODs < 5 µm. This is a distinct shift in FAP types caused by the arrival of dust.
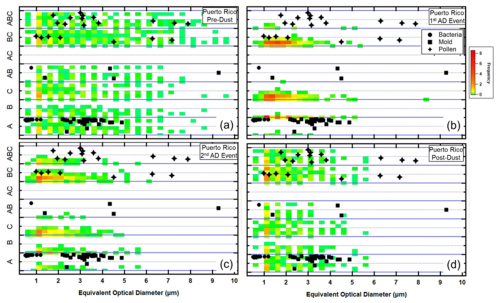
Figure 18Similar to Fig. 2, except the laboratory BSP maps are combined with the frequency of occurrence (color-coded) of FAP types. The color scale denotes how frequently during the 2 d periods the FAP types and EODs fell within the different regions. (a) Puerto Rico 2 d before the AD event. (b, c) Puerto Rico during the first and second AD events. (d) Puerto Rico after the AD event.
The FAP patterns in the León aerosols are shown in Fig. 19 and suggest that the largest number of background aerosols should be considered bacteria-like and small and pollen-like as compared to the laboratory BSP bioaerosols. The highest frequencies are found at EODs < 2 µm, evenly distributed over all FAP types except type AC. This suggests that many of the FAPs measured in León are different from the laboratory BSP taxa. The arrival of the dust dramatically shifts the pattern of the FAPs – the highest frequencies are now for types A, B, C, and AC, and the EODs are now centered between 4 and 6 µm during the first AD event. These sizes decrease during the second AD event before returning to mostly < 2 µm in the post-dust time period. These results suggest that the background FAPs are mostly bacteria and pollen, with some fraction of FAP types that do not correspond to the taxa of the BSP bioaerosols tested in the one laboratory study. The dust brings in bioaerosols whose FAP properties include those that are similar to bacteria, mold, and pollen but now with larger EODs.
The results shown in Figs. 18 and 19 offer compelling evidence that the WIBS measurements distinguish between types and compositions of bioaerosols and that the no-dust and dust cases can be clearly separated, as can the background populations of PR and León. What can we say about information on how FAPs are physically mixed with non-FAP aerosol, in particular with dust? To address this question, we remind the reader of the differences between internally and externally mixed aerosol ensembles. In short, we do not expect to have only one or the other type of situation, given that turbulent mixing will lead to the eventual combination of the two. Nevertheless, there are several reasons to expect that one or the other might dominate, depending upon the age of the air masses and the types of physical processes that can occur between the origin of the dust plume and when it arrives several hours or days later in PR and León.
Referring back to Fig. 10a, we observe a clear difference between PR and León when comparing the changes in the MEODs, over all FAP types, when dust arrives. The MEODs decrease by 20 %–30 % in PR and increase by 30 %–50 % in León. These opposing changes are also seen in the size distributions shown in Figs. 8 and 9; i.e., in general, FAP concentrations of particle sizes < 5 µm increased in PR and decreased in León. These differences can be explained, to some degree, by differences in the mixing state of FAPs and dust during AD events. The large decrease in the FAP MEOD in PR suggests that the dust brings many more small FAPs than are found in the background; however, the increase in the larger FAPs indicates that some of these FAPs are also internally mixed with the larger dust particles. Hence, the PR dust may be more externally than internally mixed. On the other hand, the AD event in León increased the MEODs over all the sizes; however, the larger particles (> 5 µm) increased proportionately more than those < 5 µm. This leads to the conclusion that the FAPs in the León AD event are more internally mixed, i.e., that a large fraction of the AD FAPs are attached to or mixed with the AD.
If we assume that the AD that arrived in PR and that which arrived in León originated through similar processes over northern Africa, whereby dust and FAPs were lofted from the surface, then the differences that were observed in the FAP properties when the FAPs arrived in León and PR are likely a result of the transformations that occurred during their transport. The three primary processes that lead to these transformations are coagulation, sedimentation, and precipitation. The AD had traveled over much longer distances and for a much longer period of time before reaching PR than when arriving over León. The back-trajectory analyses showed that these air masses had also traveled many hours in the boundary layer prior to reaching PR. Some of the FAPs are likely attached to dust particles when they are lifted from the surface at their origin, while others will collide with the dust during transport as a result of small-scale turbulent eddies and sedimentation of the larger dust particles falling through the smaller FAPs. Electrical charging of the particles, leading to further coagulation, cannot be discounted. Particles with an aerodynamic diameter of 1 µm and a density of 2 g cm−3 fall at a speed of 6 m d−1, while a 10 µm particle falls at 500 m d−1; hence, the particles > 0 µm will fall 2.5 and 6.5 km during their 5 and 13 d travel from Africa to León and PR, respectively. This type of removal of the larger particles, while smaller particles remain aloft, can explain the difference between PR and León mixtures of FAPs and dust. Not only did the particles in the AD air masses that arrived in PR have 3 times longer to fall than those in León, but also the back-trajectory analysis revealed that the air arriving in PR had been in the mixed layer for many more hours than the air masses reaching León. Traveling in this layer would place the particles much closer to the surface and they would have a shorter distance to sediment and be removed.
Two major African dust events, one over the island of Puerto Rico and the other over the city of León, Spain, have been analyzed, the former in June 2020 and the latter in March 2022. From measurements with two wideband integrated bioaerosol spectrometers (WIBSs) and complementary aerosol data, we make the following observations and conclusions:
- 1.
The intrusion of dust over the Caribbean and Iberian Peninsula leads to a significant impact on the size distributions and composition of the local populations of aerosols.
- 2.
Differences in the FAP sizes and fluorescing properties, prior to the AD events, are clearly seen in comparisons between the background aerosol populations in PR and León.
- 3.
The arrival of AD over the two regions significantly alters the properties of the local aerosol populations as observed in the WIBS and PM measurements. The magnitudes of these altered properties are different at the two locations, a difference attributed to the age of the AD air masses, 5 and 13 d old, when arriving in León and PR, respectively.
- 4.
As deduced from changes in the shapes of the FAP size distributions, with the intrusion of the AD, the FAPs are both internally and externally mixed with other non-FAP particles in the dust plume; however, the AD that arrives in PR appears to have a much higher proportion of externally mixed FAPs than that in León.
- 5.
The comparison of the maps of relative frequency of FAP types and their average EOD, juxtaposed with laboratory bacteria, mold, and pollen, indicates that the mixtures of FAPs and dust in PR are significantly different from those in León. The AD dust over PR clustered most in FAP types C and BC, while in León the primary AD types were A, B, C, and AC. When compared with the laboratory FAPs, type A is related to bacteria and BC to pollen. Types B and C were not common in the laboratory measurements used in this study (Hernandez et al., 2016), nor did other similar laboratory studies, e.g., Savage et al. (2017), have these types of FAPs.
The analysis approach that has been introduced in this study highlights the importance of using metrics that focus on relative changes in the number concentration and fluorescence intensity size distributions of the seven types of FAPs. The median equivalent optical diameter (MEOD) is a sensitive metric that can quantitatively document these changes along with maps of the frequency of FAP type versus EOD that highlight how the FAP types in AD are significantly different from background FAPs in PR or León.
These two data sets will form a useful contribution to the larger databases of African and Asian dust aerosols that have been transported large distances and that may be carrying bioaerosols, some of which may be similar to those found in the local regions inundated by this dust, while others might be more damaging to the environments where they are eventually deposited or inhaled.
The WIBS data and complementary aerosol measurements described in this paper can be accessed at a Zenodo repository under https://doi.org/10.5281/zenodo.10680977 (Baumgardner, 2024).
The supplement related to this article is available online at: https://doi.org/10.5194/acp-25-843-2025-supplement.
BS and BBR provided all the data from the Puerto Rico site. AIC and RF provided the WIBS and FM-120 measurements from the León, Spain, measurement site. DB assisted in the processing of WIBS measurements from PR and León. ARF and DFG provided the Hirst sampler data from León. CBA, CG, and EDV operated the WIBS and FM-120 during the León project. OLMB helped to edit the manuscript.
The contact author has declared that none of the authors has any competing interests.
Publisher’s note: Copernicus Publications remains neutral with regard to jurisdictional claims made in the text, published maps, institutional affiliations, or any other geographical representation in this paper. While Copernicus Publications makes every effort to include appropriate place names, the final responsibility lies with the authors.
The authors gratefully acknowledge the NOAA Air Resources Laboratory (ARL) for the provision of the HYSPLIT transport and dispersion model and READY website (https://www.ready.noaa.gov, last access: 11 September 2024) used in this publication. This work was partially supported by the Junta de Castilla y León, co-financed with European FEDER funds (grant no. LE025P20); by the aeroHEALTH project (Ministry of Science and Innovation), co-financed with European FEDER funds (grant no. PID2019-106164RBI00); and by a National Science Foundation MRI grant (grant no. 1829297). Furthermore, it is part of the project TED2021-132292B-I00, funded by MCIN/AEI/10.13039/501100011033 and by the European Union NextGenerationEU and PRTR.
This research has been supported by the National Science Foundation (NSF-MRI) (grant no. 1829297), partially supported by the Junta de Castilla y León, and co-financed with European FEDER funds (grant nos. LE025P20 and PID2019-106164RBI00).
This paper was edited by Jianping Huang and reviewed by two anonymous referees.
Alastuey, A., Querol, X., Aas, W., Lucarelli, F., Pérez, N., Moreno, T., Cavalli, F., Areskoug, H., Balan, V., Catrambone, M., Ceburnis, D., Cerro, J. C., Conil, S., Gevorgyan, L., Hueglin, C., Imre, K., Jaffrezo, J.-L., Leeson, S. R., Mihalopoulos, N., Mitosinkova, M., O'Dowd, C. D., Pey, J., Putaud, J.-P., Riffault, V., Ripoll, A., Sciare, J., Sellegri, K., Spindler, G., and Yttri, K. E.: Geochemistry of PM10 over Europe during the EMEP intensive measurement periods in summer 2012 and winter 2013, Atmos. Chem. Phys., 16, 6107–6129, https://doi.org/10.5194/acp-16-6107-2016, 2016.
Allan, J. D., Baumgardner, D., Raga, G. B., Mayol-Bracero, O. L., Morales-García, F., García-García, F., Montero-Martínez, G., Borrmann, S., Schneider, J., Mertes, S., Walter, S., Gysel, M., Dusek, U., Frank, G. P., and Krämer, M.: Clouds and aerosols in Puerto Rico – a new evaluation, Atmos. Chem. Phys., 8, 1293–1309, https://doi.org/10.5194/acp-8-1293-2008, 2008.
Andrews, E., Sheridan, P. J., Ogren, J. A., Hageman, D., Jefferson, A., Wendell, J., Alástuey, A., Alados-Arboledas, L., Bergin, M., Ealo, M., Gannet Hallar, A., Hoffer, A., Kalapov, I., Keywood, M., Kim, J., Kim, S. W., Kolonjari, F., Labuschagne, C., Lin, N. H., Macdonald, A., Mayol-Bracero, O. L., McCubbin, I. B., Pandolfi, M., Reisen, F., Sharma, S., Sherman, J. P., Sorribas, M., and Sun, J.: Overview of the NOAA/ESRL federated aerosol network, B. Am. Meteorol. Soc., 100, 123–135, https://doi.org/10.1175/BAMS-D-17-0175.1, 2019.
Anees-Hill, S., Douglas, P., Pashley, C. H., Hansell, A., and Marczylo, E. L.: A systematic review of outdoor airborne fungal spore seasonality across Europe and the implications for health, Sci. Total Environ., 818, 151716, https://doi.org/10.1016/j.scitotenv.2021.151716, 2022.
Asutosh, A., Vinoj, V., Murukesh, N., Ramisetty, R., and Mittal, N.: Investigation of June 2020 giant Saharan dust storm using remote sensing observations and model reanalysis, Sci. Rep., 12, 6114, https://doi.org/10.1038/s41598-022-10017-1, 2022.
Baumgardner, D.: African dust with bioaerosols, Version v1, Zenodo [data set], https://doi.org/10.5281/zenodo.10680977, 2024.
Calvo, A. I., Baumgardner, D., Castro, A., Fernández-González, D., Vega-Maray, A. M., Valencia-Barrera, R. M., Oduber, F., Blanco-Alegre, C., and Fraile, R.: Daily behavior of urban Fluorescing Aerosol Particles in northwest Spain, Atmos. Environ., 184, 262–277, https://doi.org/10.1016/j.atmosenv.2018.04.027, 2018.
Choël, M., Ivanovsky, A., Roose, A., Hamzé, M., Blanchenet, A. M., and Visez, N.: Quantitative assessment of coagulation of atmospheric particles onto airborne birch pollen grains, J. Aerosol. Sci., 161, 105944, https://doi.org/10.1016/j.jaerosci.2021.105944, 2022.
Crawford, I., Ruske, S., Topping, D. O., and Gallagher, M. W.: Evaluation of hierarchical agglomerative cluster analysis methods for discrimination of primary biological aerosol, Atmos. Meas. Tech., 8, 4979–4991, https://doi.org/10.5194/amt-8-4979-2015, 2015.
Després, V. R., Alex Huffman, J., Burrows, S. M., Hoose, C., Safatov, A. S., Buryak, G., Fröhlich-Nowoisky, J., Elbert, W., Andreae, M. O., Pöschl, U., and Jaenicke, R.: Primary biological aerosol particles in the atmosphere: A review, Tellus B, 64, 15598, https://doi.org/10.3402/tellusb.v64i0.15598, 2012.
Díaz, J., Linares, C., Carmona, R., Russo, A., Ortiz, C., Salvador, P., and Trigo, R. M.: Saharan dust intrusions in Spain: Health impacts and associated synoptic conditions, Environ. Res., 156, 455–467, https://doi.org/10.1016/j.envres.2017.03.047, 2017.
Dietzel, K., Valle, D., Fierer, N., U'ren, J. M., and Barberán, A.: Geographical distribution of fungal plant pathogens in dust across the United States, Frontiers in Ecology and Evolution, 7, 304, https://doi.org/10.3389/fevo.2019.00304, 2019.
Escudero, M., Castillo, S., Querol, X., Avila, A., Alarcón, M., Viana, M. M., Alastuey, A., Cuevas, E., and Rodríguez, S.: Wet and dry African dust episodes over Eastern Spain, J. Geophys. Res., 110, D18S08, https://doi.org/10.1029/2004JD004731, 2005.
Escudero, M., Querol, X., Ávila, A., and Cuevas, E.: Origin of the exceedances of the European daily PM limit value in regional background areas of Spain, Atmos. Environ., 41, 730–744, https://doi.org/10.1016/j.atmosenv.2006.09.014, 2007.
Feofilova, E. P.: The fungal cell wall: Modern concepts of its composition and biological function, Microbiology, 79, 711–720, https://doi.org/10.1134/S0026261710060019, 2010.
Francis, D., Fonseca, R., Nelli, N., Cuesta, J., Weston, M., Evan, A., and Temimi, M.: The Atmospheric Drivers of the Major Saharan Dust Storm in June 2020, Geophys. Res. Lett., 47, e2020GL090102, https://doi.org/10.1029/2020GL090102, 2020.
Fröhlich-Nowoisky, J., Pickersgill, D. A., Després, V. R., and Pöschl, U.: High diversity of fungi in air particulate matter, P. Natl. Acad. Sci. USA, 106, 12814–12819, https://doi.org/10.1073/pnas.0811003106, 2009.
Fröhlich-Nowoisky, J., Kampf, C. J., Weber, B., Huffman, J. A., Pöhlker, C., Andreae, M. O., Lang-Yona, N., Burrows, S. M., Gunthe, S. S., Elbert, W., Su, H., Hoor, P., Thines, E., Hoffmann, T., Després, V. R., and Pöschl, U.: Bioaerosols in the Earth system: Climate, health, and ecosystem interactions, Atmos. Res., 182, 346–376, https://doi.org/10.1016/j.atmosres.2016.07.018, 2016.
Gabey, A. M., Vaitilingom, M., Freney, E., Boulon, J., Sellegri, K., Gallagher, M. W., Crawford, I. P., Robinson, N. H., Stanley, W. R., and Kaye, P. H.: Observations of fluorescent and biological aerosol at a high-altitude site in central France, Atmos. Chem. Phys., 13, 7415–7428, https://doi.org/10.5194/acp-13-7415-2013, 2013.
García Valero, J. A.: Report on the intrusion of dust of Saharan origin over the Spanish peninsular territory between March 14 and 16, 2022, 2022, http://hdl.handle.net/20.500.11765/13571 (last access: 11 September 2024), 2022.
Grinn-Gofroń, A., Nowosad, J., Bosiacka, B., Camacho, I., Pashley, C., Belmonte, J., De Linares, C., Ianovici, N., Manzano, J. M. M., Sadyś, M., Skjøth, C., Rodinkova, V., Tormo-Molina, R., Vokou, D., Fernández-Rodríguez, S., and Damialis, A.: Airborne Alternaria and Cladosporium fungal spores in Europe: Forecasting possibilities and relationships with meteorological parameters, Sci. Total Environ., 653, 938–946, https://doi.org/10.1016/j.scitotenv.2018.10.419, 2019.
Hallegraeff, G., Coman, F., Davies, C., Hayashi, A., McLeod, D., Slotwinski, A., Whittock, L., and Richardson, A. J.: Australian dust storm associated with extensive Aspergillus sydowii fungal “bloom” in coastal waters, Appl. Environ. Microb., 80, 3315–3320, https://doi.org/10.1128/AEM.04118-13 2014.
Hannan, P. J.: Electrophoretic properties of spores of Aspergillus niger, Appl. Environ. Microb., 9, 113–117, https://doi.org/10.1128/aem.9.2.113-117.1961, 1961.
Hernandez, M., Perring, A. E., McCabe, K., Kok, G., Granger, G., and Baumgardner, D.: Chamber catalogues of optical and fluorescent signatures distinguish bioaerosol classes, Atmos. Meas. Tech., 9, 3283–3292, https://doi.org/10.5194/amt-9-3283-2016, 2016.
Hirst, J. M.: An automatic volumetric spore trap, Ann. Appl. Biol., 39, 257–265, https://doi.org/10.1111/j.1744-7348.1952.tb00904.x, 1952.
Holben, B. N., Eck, T. F., Slutsker, I., Tanré, D., Buis, J. P., Setzer, A., Vermote, E., Reagan, J. A., Kaufman, Y. J., Nakajima, T., Lavenu, F., Jankowiak, I., and Smirnov, A.: AERONET – A Federated Instrument Network and Data Archive for Aerosol Characterization, Remote Sens. Environ., 66, 1–16, https://doi.org/10.1016/S0034-4257(98)00031-5, 1998.
Huffman, J. A., Prenni, A. J., DeMott, P. J., Pöhlker, C., Mason, R. H., Robinson, N. H., Fröhlich-Nowoisky, J., Tobo, Y., Després, V. R., Garcia, E., Gochis, D. J., Harris, E., Müller-Germann, I., Ruzene, C., Schmer, B., Sinha, B., Day, D. A., Andreae, M. O., Jimenez, J. L., Gallagher, M., Kreidenweis, S. M., Bertram, A. K., and Pöschl, U.: High concentrations of biological aerosol particles and ice nuclei during and after rain, Atmos. Chem. Phys., 13, 6151–6164, https://doi.org/10.5194/acp-13-6151-2013, 2013.
Kasprzyk, I., Rodinkova, V., Šaulienė, I., Ritenberga, O., Grinn-Gofron, A., Nowak, M., Sulborska, A., Kaczmarek, J., Weryszko-Chmielewska, E., Bilous, E., and Jedryczka, M.: Air pollution by allergenic spores of the genus Alternaria in the air of central and eastern Europe, Environ. Sci. Pollut. R., 22, 9260–9274, https://doi.org/10.1007/s11356-014-4070-6, 2015.
Kaye, P. H., Stanley, W. R., Hirst, E., Foot, E. V., Baxter, K. L., and Barrington, S. J.: Single particle multichannel bio-aerosol fluorescence sensor, Opt. Express, 13, 3583–3593, https://doi.org/10.1364/opex.13.003583, 2005.
Lakowicz, J. R. (Ed.): Principles of fluorescence spectroscopy, Springer Nature, https://doi.org/10.1007/978-0-387-46312-4, 2006.
Lawler, M. J., Draper, D. C., and Smith, J. N.: Atmospheric fungal nanoparticle bursts, Sci. Adv., 6, eaax9051, https://doi.org/10.1126/sciadv.aax9051, 2020.
Leach, C. M.: An electrostatic theory to explain violent spore liberation by Drechslera Turcica and other fungi, Mycologia, 68, 63–86, https://doi.org/10.2307/3758898, 1976.
Lyamani, H., Valenzuela, A., Perez-Ramirez, D., Toledano, C., Granados-Muñoz, M. J., Olmo, F. J., and Alados-Arboledas, L.: Aerosol properties over the western Mediterranean basin: temporal and spatial variability, Atmos. Chem. Phys., 15, 2473–2486, https://doi.org/10.5194/acp-15-2473-2015, 2015.
Mayol-Bracero, O. L., Rosario, O., Corrigan, C. E., Morales, R., Torres, I., and Pérez, V.: Chemical characterization of submicron organic aerosols in the tropical trade winds of the caribbean using gas chromatography/mass spectrometry, Atmos. Environ., 35, 1735–1745, https://doi.org/10.1016/S1352-2310(00)00524-0, 2001.
Morrison, D., Crawford, I., Marsden, N., Flynn, M., Read, K., Neves, L., Foot, V., Kaye, P., Stanley, W., Coe, H., Topping, D., and Gallagher, M.: Quantifying bioaerosol concentrations in dust clouds through online UV-LIF and mass spectrometry measurements at the Cape Verde Atmospheric Observatory, Atmos. Chem. Phys., 20, 14473–14490, https://doi.org/10.5194/acp-20-14473-2020, 2020.
Novakov, T., Corrigan, C. E., Penner, J. E., Chuang, C. C., Rosario, O., and Mayol Bracero, O. L.: Organic aerosols in the Caribbean trade winds: A natural source?, J. Geophys. Res.-Atmos., 102, 21307–21313, https://doi.org/10.1029/97JD01487, 1997.
Perring, A. E., Schwarz, J. P., Baumgardner, D., Hernandez, M. T., Spracklen, D. V., Heald, C. L., Gao, R. S., Kok, G., McMeeking, G. R., McQuaid, J. B., and Fahey, D. W.: Airborne observations of regional variation in fluorescent aerosol across the United States, J. Geophys. Res.-Atmos., 120, 1153–1170, https://doi.org/10.1002/2014JD022495, 2015.
Pöhlker, C., Huffman, J. A., and Pöschl, U.: Autofluorescence of atmospheric bioaerosols – fluorescent biomolecules and potential interferences, Atmos. Meas. Tech., 5, 37–71, https://doi.org/10.5194/amt-5-37-2012, 2012.
Prospero, J. M., Collard, F. X., Molinié, J., and Jeannot, A.: Characterizing the annual cycle of African dust transport to the Caribbean Basin and South America and its impact on the environment and air quality, Global Biogeochem. Cy., 28, 757–773, https://doi.org/10.1002/2013GB004802, 2014.
Pu, B. and Jin, Q.: A record-breaking trans-Atlantic African dust plume associated with atmospheric circulation extremes in June 2020, B. Am. Meteorol. Soc., 102, E1340–E1356, https://doi.org/10.1175/BAMS-D-21-0014.1, 2021.
Pulimood, T. B., Corden, J. M., Bryden, C., Sharples, L., and Nasser, S. M.: Epidemic asthma and the role of the fungal mold Alternaria alternata, J. Allergy Clin. Immun., 120, 610–617, https://doi.org/10.1016/j.jaci.2007.04.045, 2007.
Querol, X., Alastuey, A., Pandolfi, M., Reche, C., Pérez, N., Minguillón, M. C., Moreno, T., Viana, M., Escudero, M., Orio, A., Pallarés, M., and Reina, F.: 2001–2012 trends on air quality in Spain, Sci. Total Environ., 490, 957–969, https://doi.org/10.1016/j.scitotenv.2014.05.074, 2014.
Ramírez-Romero, C., Jaramillo, A., Córdoba, M. F., Raga, G. B., Miranda, J., Alvarez-Ospina, H., Rosas, D., Amador, T., Kim, J. S., Yakobi-Hancock, J., Baumgardner, D., and Ladino, L. A.: African dust particles over the western Caribbean – Part I: Impact on air quality over the Yucatán Peninsula, Atmos. Chem. Phys., 21, 239–253, https://doi.org/10.5194/acp-21-239-2021, 2021.
Robinson, N. H., Allan, J. D., Huffman, J. A., Kaye, P. H., Foot, V. E., and Gallagher, M.: Cluster analysis of WIBS single-particle bioaerosol data, Atmos. Meas. Tech., 6, 337–347, https://doi.org/10.5194/amt-6-337-2013, 2013.
Rodríguez, S., Querol, X., Alastuey, A., Kallos, G., and Kakaliagou, O.: Saharan dust contributions to PM10 and TSP levels in Southern and Eastern Spain, Atmos. Environ., 35, 2433–2447, https://doi.org/10.1016/S1352-2310(00)00496-9, 2001.
Rodríguez-Arias, R. M., Rojo, J., Fernández-González, F., and Pérez-Badia, R.: Desert dust intrusions and their incidence on airborne biological content. Review and case study in the Iberian Peninsula, Environ. Pollut., 316, 120464, https://doi.org/10.1016/j.envpol.2022.120464, 2023.
Rodríguez-Fernández, A., Blanco-Alegre, C., Vega-Maray, A. M., Valencia-Barrera, R. M., Molnár, T., and Fernández-González, D.: Effect of prevailing winds and land use on Alternaria airborne spore load, J. Environ. Manage., 332, 117414, https://doi.org/10.1016/j.jenvman.2023.117414, 2023.
Rolph, G., Stein, A., and Stunder, B.: Real-time Environmental Applications and Display sYstem: READY, Environ. Modell. Softw., 95, 210–228, https://doi.org/10.1016/j.envsoft.2017.06.025, 2017.
Ryder, C. L., Highwood, E. J., Walser, A., Seibert, P., Philipp, A., and Weinzierl, B.: Coarse and giant particles are ubiquitous in Saharan dust export regions and are radiatively significant over the Sahara, Atmos. Chem. Phys., 19, 15353–15376, https://doi.org/10.5194/acp-19-15353-2019, 2019.
Salvador, P., Artíñano, B., Molero, M., Viana, M., Pey, J., Alastuey, A., and Querol, X.: African dust contribution to ambient aerosol levels across central Spain: Characterization of long-range transport episodes of desert dust, Atmos. Res., 127, 117–129, https://doi.org/10.1016/j.atmosres.2011.12.011, 2013.
Sarangi, B., Baumgardner, D., Bolaños-Rosero, B., and Mayol-Bracero, O. L.: Measurement report: An exploratory study of fluorescence and cloud condensation nuclei activity of urban aerosols in San Juan, Puerto Rico, Atmos. Chem. Phys., 22, 9647–9661, https://doi.org/10.5194/acp-22-9647-2022, 2022.
Savage, N. J., Krentz, C. E., Könemann, T., Han, T. T., Mainelis, G., Pöhlker, C., and Huffman, J. A.: Systematic characterization and fluorescence threshold strategies for the wideband integrated bioaerosol sensor (WIBS) using size-resolved biological and interfering particles, Atmos. Meas. Tech., 10, 4279–4302, https://doi.org/10.5194/amt-10-4279-2017, 2017.
Sénéchal, H., Visez, N., Charpin, D., Shahali, Y., Peltre, G., Biolley, J. P., Lhuissier, F., Couderc, R., Yamada, O., Malrat-Domenge, A., Pham-Thi, N., Poncet, P., and Sutra, J. P.: A review of the effects of major atmospheric pollutants on pollen grains, pollen content, and allergenicity, The Scientific World Journal, 2015, 940243, https://doi.org/10.1155/2015/940243, 2015.
Shinn, E. A., Smith, G. W., Prospero, J. M., Betzer, P., Hayes, M. L., Garrison, V., and Barber, R. T.: African dust and the demise of Caribbean coral reefs, Geophys. Res. Lett., 27, 3029–3032, https://doi.org/10.1029/2000GL011599, 2000.
Stanley, W. R., Kaye, P. H., Foot, V. E., Barrington, S. J., Gallagher, M., and Gabey, A.: Continuous bioaerosol monitoring in a tropical environment using a UV fluorescence particle spectrometer, Atmos. Sci. Lett., 12, 195–199, https://doi.org/10.1002/asl.310, 2011.
Stein, A. F., Draxler, R. R., Rolph, G. D., Stunder, B. J. B., Cohen, M. D., and Ngan, F.: Noaa's HYSPLIT atmospheric transport and dispersion modeling system, B. Am. Meteorol. Soc., 96, 2059–2077, https://doi.org/10.1175/BAMS-D-14-00110.1, 2015.
Sugimoto, N., Huang, Z., Nishizawa, T., Matsui, I., and Tatarov, B.: Fluorescence from atmospheric aerosols observed with a multi-channel lidar spectrometer, Opt. Express, 20, 20800–20807, 2012.
Toprak, E. and Schnaiter, M.: Fluorescent biological aerosol particles measured with the Waveband Integrated Bioaerosol Sensor WIBS-4: laboratory tests combined with a one year field study, Atmos. Chem. Phys., 13, 225–243, https://doi.org/10.5194/acp-13-225-2013, 2013.
Visez, N., Ivanovsky, A., Roose, A., Gosselin, S., Sénéchal, H., Poncet, P., and Choël, M.: Atmospheric particulate matter adhesion onto pollen: a review, Aerobiologia, 36, 49–62, https://doi.org/10.1007/s10453-019-09616-9, 2020.
Wang, Y., Huang, Z., Zhou, T., Bi, J., and Shi, J.: Identification of fluorescent aerosol observed by a spectroscopic lidar over northwest China, Opt. Express, 31, 22157–22169, 2023.
Wargenau, A., Fleißner, A., Bolten, C. J., Rohde, M., Kampen, I., and Kwade, A.: On the origin of the electrostatic surface potential of Aspergillus niger spores in acidic environments, Res. Microbiol., 162, 1011–1017, https://doi.org/10.1016/j.resmic.2011.07.006, 2011.
Woo, C., An, C., Xu, S., Yi, S. M., and Yamamoto, N.: Taxonomic diversity of fungi deposited from the atmosphere, ISME J., 12, 2051–2060, https://doi.org/10.1038/s41396-018-0160-7, 2018.
Wu, P. C., Tsai, J. C., Li, F. C., Lung, S. C., and Su, H. J.: Increased levels of ambient fungal spores in Taiwan are associated with dust events from China, Atmos. Environ., 38, 4879–4886, https://doi.org/10.1016/j.atmosenv.2004.05.039, 2004.
Yu, H., Chin, M., Bian, H., Yuan, T., Prospero, J. M., Omar, A. H., Remer, L. A., Winker, D. M., Yang, Y., and Zhang, Z.: Quantification of trans-Atlantic dust transport from seven-year (2007–2013) record of CALIPSO lidar measurements, Remote Sens. Environ., 159, 232–249, https://doi.org/10.1016/j.rse.2014.12.010, 2015.
Yu, H., Tan, Q., Zhou, L., Zhou, Y., Bian, H., Chin, M., Ryder, C. L., Levy, R. C., Pradhan, Y., Shi, Y., Song, Q., Zhang, Z., Colarco, P. R., Kim, D., Remer, L. A., Yuan, T., Mayol-Bracero, O., and Holben, B. N.: Observation and modeling of the historic “Godzilla” African dust intrusion into the Caribbean Basin and the southern US in June 2020, Atmos. Chem. Phys., 21, 12359–12383, https://doi.org/10.5194/acp-21-12359-2021, 2021.


