the Creative Commons Attribution 4.0 License.
the Creative Commons Attribution 4.0 License.
 | 01 Aug 2025
Modelling Arctic lower-tropospheric ozone: processes controlling seasonal variations
Stephen R. Beagley
Kenjiro Toyota
Henrik Skov
Jesper Heile Christensen
Alex Lupu
Diane Pendlebury
Junhua Zhang
Yugo Kanaya
Alfonso Saiz-Lopez
Roberto Sommariva
Peter Effertz
John W. Halfacre
Nis Jepsen
Rigel Kivi
Theodore K. Koenig
Katrin Müller
Claus Nordstrøm
Irina Petropavlovskikh
Paul B. Shepson
William R. Simpson
Sverre Solberg
Ralf M. Staebler
David W. Tarasick
Roeland Van Malderen
Mika Vestenius
Previous assessments on modelling Arctic tropospheric ozone (O3) have shown that most atmospheric models continue to experience difficulties in simulating tropospheric O3 in the Arctic, particularly in capturing the seasonal variations at coastal sites, primarily attributed to the lack of representation of surface bromine chemistry in the Arctic. In this study, two independent chemical transport models (CTMs), DEHM (Danish Eulerian Hemispheric Model) and GEM-MACH (Global Environmental Multi-scale – Modelling Air quality and Chemistry), were used to simulate Arctic lower-tropospheric O3 for the year 2015 at considerably higher horizontal resolutions (25 and 15 km, respectively) than the large-scale models in the previous assessments. Both models include bromine chemistry but with different mechanistic representations of bromine sources from snow- and ice-covered polar regions: a blowing-snow bromine source mechanism in DEHM and a snowpack bromine source mechanism in GEM-MACH. Model results were compared with a suite of observations in the Arctic, including hourly observations from surface sites and mobile platforms (buoys and ships) and ozonesonde profiles, to evaluate models' ability to simulate Arctic lower-tropospheric O3, particularly in capturing the seasonal variations and the key processes controlling these variations.
Both models are found to behave quite similarly outside the spring period and are able to capture the observed overall surface O3 seasonal cycle and synoptic-scale variabilities, as well as the O3 vertical profiles in the Arctic. GEM-MACH (with the snowpack bromine source mechanism) was able to simulate most of the observed springtime ozone depletion events (ODEs) at the coastal and buoy sites well, while DEHM (with the blowing-snow bromine source mechanism) simulated much fewer ODEs. The present study demonstrates that the springtime O3 depletion process plays a central role in driving the surface O3 seasonal cycle in central Arctic, and that the bromine-mediated ODEs, while occurring most notably within the lowest few hundred metres of air above the Arctic Ocean, can induce a 5 %–7 % of loss in the total pan-Arctic tropospheric O3 burden during springtime. The model simulations also showed an overall enhancement in the pan-Arctic O3 concentration due to northern boreal wildfire emissions in summer 2015; the enhancement is more significant at higher altitudes. Higher O3 excess ratios (ΔOCO) found aloft compared to near the surface indicate greater photochemical O3 production efficiency at higher altitudes in fire-impacted air masses. The model simulations further indicated an enhancement in NOy in the Arctic due to wildfires; a large portion of NOy produced from the wildfire emissions is found in the form of PAN that is transported to the Arctic, particularly at higher altitudes, potentially contributing to O3 production there.
- Article
(20003 KB) - Full-text XML
-
Supplement
(5004 KB) - BibTeX
- EndNote


Tropospheric ozone (O3) is a greenhouse gas (GHG) and, near the surface, an air pollutant harmful for human health (Fleming et al., 2018; US Environmental Protection Agency, 2013; World Health Organization, 2013) as well as affecting crop and ecosystem productivity (Ainsworth et al., 2012; Mills et al., 2011, 2018). It also plays a central role in tropospheric chemistry, owing to its role in the initiation of photochemical oxidation processes via direct reaction, photolysis, and the subsequent reactions of the photoproducts to form the hydroxyl (OH) radical (Monks et al., 2015a). The Arctic is an area currently undergoing warming 4 times faster than the rest of the world (Rantanen et al., 2022), and, as a result, changes in local anthropogenic and natural sources of O3 precursors and in the patterns of transport of O3 and its precursors from lower latitudes as well as increased vertical mixing are to be expected. For increasing confidence in the projection of future Arctic tropospheric O3 from different anthropogenic and/or natural perturbations, it is important to have a modelling capability for simulating the observed present-day Arctic tropospheric O3, including its spatial–temporal variability and its sources, sinks, and the associated atmospheric processes.
The tropospheric O3 budget in the Arctic has contributions from long-range transport from mid-latitudes, photochemical production from anthropogenic and natural precursors either locally (within the Arctic) or transported to the Arctic, and transport from the stratosphere (Hirdman et al., 2010; Law et al., 2014). In turn, the transport of Arctic ozone-poor and halogen-rich air masses through polar front intrusions toward lower latitudes reduce ozone in the northern mid-latitudes (Fernandez et al., 2024). Processes contributing to tropospheric O3 loss or removal from the Arctic atmosphere include photochemical destruction via HOx chemistry involving hydroperoxyl (HO2) and OH radicals (Arnold et al., 2015; Wang et al., 2003), reactions with halogen species (e.g., Barrie et al., 1988; Simpson et al., 2007; Skov et al., 2004; Wang et al., 2019), direct reaction with biogenic volatile organic compounds (BVOCs; primarily isoprene) under low-NOx conditions, and surface removal through dry deposition (Clifton et al., 2020; Helmig et al., 2007; Van Dam et al., 2016). These processes vary with geographical locations and have distinct seasonal patterns, which give rise to the seasonal variations in Arctic tropospheric O3. Long-term ground-based observations in the Arctic show distinctively different surface O3 seasonal cycles depending on whether the sites are located near the coast, inland, or at high elevation (Whaley et al., 2023). For example, Whaley et al. (2023) showed that coastal sites have springtime minima due to halogen chemistry causing O3 depletion events (ODEs) and maxima during the winter, while inland sites near the Arctic Circle in the European subarctic boreal region have seasonal cycles, with maxima in spring (April) and minima in summer (August), resembling the seasonal cycles at remote European locations. At the high-elevation Summit site (located in Greenland at ∼ 3000 m a.s.l.), the observed O3 seasonal cycle has a late spring (May) maximum and an early fall (September) minimum, which is consistent with the seasonal cycle of free-tropospheric O3 based on long-term ozonesonde observations in the Arctic (Christiansen et al., 2017).
The ability of models to simulate Arctic tropospheric O3 has been evaluated in several previous and recent studies (e.g., Monks et al., 2015b; Shindell et al., 2008; Whaley et al., 2023) involving largely global models. These studies have found that there were large variabilities amongst the model simulations and that the models performed particularly poorly in capturing the observed surface O3 seasonal cycles at coastal sites. In a recent assessment on Arctic tropospheric O3, Whaley et al. (2023) suggested that, despite the model development and updates over the past decade or so, model results are still highly variable and have not increased in accuracy for representing Arctic tropospheric O3. The poor model performance during spring found in these studies has been linked to the missing representation of halogen chemistry in the models. A recent study using a global chemistry–climate model has highlighted the need to add halogens in a global model to reproduce Arctic ozone seasonality (Fernandez et al., 2024). Springtime ODEs have been primarily attributed to catalytic destruction of O3 by reactive bromine (Barrie et al., 1988; Hausmann and Platt, 1994; Simpson et al., 2007; Skov et al., 2004; Wang et al., 2019) released from snowpacks (Custard et al., 2017; Pratt et al., 2013) and blowing snow (Jones et al., 2009; Yang et al., 2008) over sea ice via photochemical reactions in/on snow particles and cycled through heterogeneous reactions on aerosol surfaces (Fan and Jacob, 1992; Michalowski et al., 2000; Peterson et al., 2017; Toyota et al., 2014). Mechanisms to represent polar springtime bromine explosions and ODEs have been developed and tested in various atmospheric models, by considering both blowing snow (e.g., Yang et al., 2008, 2010, 2020; Huang and Jaeglé, 2017; Huang et al., 2020; Marelle et al., 2021; Swanson et al., 2022) and snowpacks (e.g., Toyota et al., 2011; .Falk and Sinnhuber, 2018; Marelle et al., 2021; Swanson et al., 2022), with varying degrees of success when compared with observations of reactive bromine and O3 in the Arctic (and Antarctic). In addition, Fernandez et al. (2019) implemented a different parameterization for the source terms of inorganic gaseous halogens (chlorine, bromine, and iodine) on polar sea ice in their global chemistry–climate model. Clearly, our understanding of the mechanisms and dynamics controlling the ODEs in the Arctic springtime is still evolving, as a recent study suggested that iodine radical chemistry may also contribute significantly to Arctic O3 destruction during the extended sunlit period, not only in summer but also substantially during ODEs in spring (Benavent et al., 2022; Raso et al., 2017), with effects far south of the Arctic area (Fernandez et al., 2024).
Aside from locations where air masses are persistently in contact with sea ice (e.g., Bottenheim et al., 2009; Bottenheim and Chan, 2006; Van Dam et al., 2013), Arctic surface O3 concentrations are often lowest during summer (Whaley et al., 2023), which can be associated with reduced transport from lower latitudes, photochemical degradation, and increased surface removal (Barrie, 1986; Law et al., 2014). However, spatiotemporal variabilities in the biogenic emissions of volatile organic compounds (VOCs) (e.g., Aaltonen et al., 2011; Angot et al., 2020; Junninen et al., 2022; Pernov et al., 2021) and the dry deposition of O3 (e.g., Helmig et al., 2007, 2009; Van Dam et al., 2016) are still insufficiently studied for the quantification of their impacts on the summertime Arctic surface O3. On the other hand, there is increasing evidence that biomass burning (boreal wildfires) is an important source of pollutants in the Arctic during late spring to fall (Law et al., 2014). The estimate of their impact on Arctic ozone is challenged by uncertainties in characterizing the net effects of simultaneously emitted aerosols, nitrogen oxides (NOx), and VOCs in the perturbations of photochemical and heterogeneous surface reactions within fire plumes (Jaffe and Wigder, 2012). While the ARCTAS-B aircraft campaign found that boreal fire emissions only had negligible impact on tropospheric ozone profiles in summer 2008 over Alaska and Canada (Alvarado et al., 2010; Moeini et al., 2020; Singh et al., 2010), a multi-model study by Arnold et al. (2015) suggests that emissions from biomass burning lead to large-scale enhancement in high-latitude NOy and tropospheric O3 during summer.
In this study, model simulations for the year 2015 from two different models, GEM-MACH (Global Environmental Multi-scale – Modelling Air quality and Chemistry) and DEHM (Danish Eulerian Hemispheric Model), were conducted over the Arctic, at relatively high resolution (15 and 25 km, respectively). Both models include atmospheric reactive bromine chemistry, but the two models employ different bromine source mechanisms over sea ice in the Arctic, namely a snowpack-sourced mechanism (in GEM-MACH) and a blowing-snow-sourced mechanism (in DEHM). The model results are compared with a range of observations in the Arctic, including surface sites, mobile platforms (buoys, ship, and airborne), and ozonesondes, to evaluate the models' ability to simulate the Arctic lower-tropospheric O3, particularly in capturing the seasonal cycles of surface and lower-tropospheric O3 in the Arctic. Sensitivity simulations turning off bromine chemistry were conducted by both models, allowing an in-depth examination of the representation of bromine sources and reactions on modelled ODEs in the Arctic. Additional sensitivity simulations turning off wildfire emissions were also undertaken (using GEM-MACH) to assess the impact of boreal fire emission on Arctic O3. To our knowledge, this study is a first attempt in simulating Arctic lower-tropospheric O3 seasonal variability using regional models at much higher spatial resolution (∼ 20 km) than global models. The study aims to address the following questions:
-
How well can current state-of-the-art regional models simulate the observed Arctic surface O3 seasonal cycle?
-
What are the key processes driving the Arctic surface O3 seasonal cycle, and how well are these processes represented in the models?
-
How do the different processes contribute to the Arctic lower-tropospheric O3 budget, and in particular, what is the impact of spring ODEs on Arctic lower-tropospheric O3, locally and Arctic-wide?
In what follows, we will first provide a brief description of the study methodology including model configuration and simulation setup as well as measurement data used (Sect. 2). We will then discuss model simulations and comparison with observations (Sect. 3), including an examination of modelled seasonal distributions of lower-tropospheric O3 in the Arctic and an evaluation against surface and ozonesonde observations. In Sect. 4, we will examine the model simulation of the Arctic springtime ODEs in detail, including the roles of different bromine sources in ODEs, uncertainty in the parameterization of snowpack bromine source mechanism, and comparative roles of snowpack bromine emission and atmospheric bromine production through heterogeneous cycling on aerosol surfaces. We will also examine the impact of boreal wildfires on summertime Arctic O3, as well as how different processes contribute to the pan-Arctic lower-tropospheric O3 budget. The findings from this study are summarized in Sect. 5, with outlooks on modelling the Arctic lower-tropospheric O3.
2.1 Models and simulation setup
Two chemical transport models were used in this study, DEHM (the Danish Eulerian Hemispheric Model) and GEM-MACH (Global Environmental Multiscale model – Modelling Air quality and Chemistry). Brief descriptions of the two models and their setup for the year 2015 simulations are provided in this section. Key model features and configurations are summarized in Appendix A (Table A1). The year 2015 was selected on the basis that it was one of the years featured in the recent AMAP (Arctic Monitoring and Assessment Program) assessment of short-lived climate forcers (AMAP, 2021) and a reference year for the ECLIPSE (Evaluating the Climate and Air Quality Impacts of Short-Lived Pollutants) v6b emission dataset, which was used by all the models that participated in the AMAP assessment (Whaley et al., 2022) as well as by the two models in this study.
2.1.1 DEHM
DEHM is a three-dimensional atmospheric chemistry transport model used to study the long-range transport of air pollution in the Northern Hemisphere to the Arctic originated from anthropogenic and natural sources outside the Arctic (Brandt et al., 2012; Christensen, 1997; Eckhardt et al., 2015; Heidam et al., 2004; Massling et al., 2015; Skov et al., 2020). DEHM has been used for many years to study the transport of air pollution from the mid-latitudes, presented in many articles (e.g., Barrie et al., 2001; .Christensen et al., 2004; Hansen et al., 2008; Hole et al., 2009; Thomas et al., 2022), and has contributed to many of the assessments in the Arctic Monitoring and Assessment Program (AMAP) since its first assessment in 1998 (Kämäri et al., 1998).
In this study the model was set up with two nested model domains: an outer domain of 300×300 grid points with a horizontal resolution of 75 km × 75 km (polar stereographic projection, true at 60° N) covering the whole Northern Hemisphere and a nested domain covering the whole Arctic down to approximately 50° N at a higher resolution of 25 km × 25 km; both model domains have the North Pole at the centre of the grid (the core high-resolution domain is shown in Fig. 1a). In the vertical, there are 29 unevenly distributed layers that extend up to 100 hPa, approximately 15 km above sea level (a.s.l.), with the finest resolution in the atmospheric boundary layer (lowest model layer of ∼ 20 m, 3–4 model layers below the lowest 100 m). DEHM is driven by meteorological fields from the numerical weather prediction model WRF v4.1 (Skamarock et al., 2008), where the model grid setup is identical to that of the DEHM system both horizontally and vertically, so that the 2 and 3 d WRF data can be directly mapped onto the DEHM grids without needing interpolation. The WRF model is driven by global data from the ERA5 reanalysis from ECMWF (Hersbach et al., 2020). The WRF data were archived with 1 h resolution and interpolated in time within DEHM.
The basic chemical scheme in DEHM includes 89 different species and is based on the scheme by Strand and Hov (1994), with modifications based on the chemical scheme in the EMEP model (Simpson et al., 2012) and ACDEP model (Hertel et al., 1995). The chemical scheme has been extended with a detailed description of the inorganic heterogeneous ammonia chemistry and a Volatility Basis Set (VBS)-based scheme to describe the formation of secondary organic aerosols (SOAs) (Bergström et al., 2012). Furthermore, reactions concerning the wet-phase production of sulfate have been included, based on Jonson and Isaksen (1993). The basic chemistry module is extended with bromine chemistry based on the work by Yang et al. (2010) with bromine emissions from blowing snow, sea salt, and CHBr3 and CH2Br2 from open oceans (see Sect. 2.1.3). The model setup used describes concentration fields of 75 photo-chemical compounds (including NOx, SOx, VOC, NHx, CO, and O3), 12 species for the SOA part, and several classes of particulate matter as EC, primary OM, primary ash/dust and sea salt. All aerosol components are modelled with a single bulk representation with a particle diameter of 0.33 µm for the fine fraction and 4.8 µm for the coarse fraction. The anthropogenic emissions from the ECLIPSE v6b dataset at 0.5° × 0.5° resolution (Klimont et al., 2017) are used for the portion of the model domain outside Europe, while for the areas over Europe the emissions from the European Monitoring and Evaluation Programme (EMEP) expert database with 0.1° × 0.1° resolution are used (see https://www.ceip.at/, last access: 9 May 2025). Furthermore, the biomass burning emissions are obtained from the Global Fire Assimilation System (GFAS) from ECMWF (Kaiser et al., 2012); they have a horizontal resolution of a 0.1° × 0.1° on a daily time basis. The calculation of the dry deposition velocity is based on the resistance method; for land surface and sea ice it is based on Simpson et al. (2012), while for open ocean it is based on Hertel et al. (1995), where the surface resistance takes into account the solubility and reactivity in the water. The parameterization of wet deposition is based on a simple scavenging ratio formulation with in-cloud and below-cloud scavenging coefficients for both gas and particulate phases (see Simpson et al., 2012, and Huang et al., 2010).
2.1.2 GEM-MACH
GEM-MACH is the Environment and Climate Change Canada (ECCC) air quality prediction model. It consists of an online tropospheric chemistry module embedded within ECCC's GEM numerical weather forecast model (Charron et al., 2012; Côté et al., 1998a, b). The chemistry module includes a comprehensive representation of air quality processes, such as gas-phase chemistry, aqueous-phase chemistry, and aerosol chemical thermodynamics and microphysical processes (e.g., Gong et al., 2015; Makar et al., 2015b, a; Moran et al., 2018). Specifically, gas-phase chemistry is represented by a modified ADOM-II mechanism with 47 species and 114 reactions (Lurmann et al., 1986); inorganic aerosol thermodynamics is parameterized by a modified version of the ISORROPIA algorithm of Nenes et al. (1999), as described in detail in Makar et al. (2003); SOA formation is parameterized using a two-product, overall, or instantaneous aerosol yield formation (Odum et al., 1996; Jiang, 2003; Stroud et al., 2018); aerosol microphysical processes, including nucleation and condensation (sulfate and SOA), hygroscopic growth, coagulation, and dry deposition and sedimentation, are parameterized as in Gong et al. (2003); and the representation of cloud processing of gases and aerosols includes uptake and activation, aqueous-phase chemistry, and wet removal (Gong et al., 2006, 2015). Aerosol chemical composition is represented by eight components: sulfate, nitrate, ammonium, elemental carbon (EC), primary organic aerosol (POA), secondary organic aerosol (SOA), crustal material (CM), and sea salt; aerosol particles are assumed to be internally mixed. A sectional approach is used for representing aerosol size distribution. For the current 2015 pan-Arctic simulations, a 12-bin (between 0.01 and 40.96 µm in diameter, logarithmically spaced: 0.01–0.02, 0.02–0.04, 0.04–0.08, 0.08–0.16, 0.16–0.32, 0.32–0.64, 0.64–1.28, 1.28–2.56, 2.56–5.12, 5.12–10.24, 10.24–20.48, and 20.48–40.96 µm) configuration is used.
The Arctic implementation of GEM-MACH includes several upgrades: the inclusion of dimethyl sulfide (DMS) from oceanic sources and its oxidations in the atmosphere as described in Ghahreman et al. (2019), updated ozone dry deposition velocity over ice and snow (Gong et al., 2018; Helmig et al., 2007), a parameterized representation of iodide-mediated ozone deposition on seawater based on Sarwar et al. (2015), an updated particle dry deposition scheme based on Emerson et al. (2020) from the original Zhang et al. (2001) scheme, and updated particle wet removal parameterization with consideration for the Wegener–Bergeron–Findeisen (WBF) process in mixed-phase clouds (Gong et al., 2025).
For this study, the model's ADOM-II gas-phase chemical mechanism was extended to include bromine chemistry and a snowpack bromine source mechanism, based on Toyota et al. (2011), and was also adapted in the representation of odd nitrogen chemistry. The bromine chemistry extension constitutes additional 26 reactions, including the heterogeneous aerosol surface reactions involving HOBr, BrONO2, and HBr, for 7 inorganic bromine species (Br, BrO, Br2, BrNO2, and the three aforementioned species). One difference from the earlier study is the inclusion of the gas-phase association of Br and NO2 to form BrNO2 and its loss via photolysis and the reaction with Br (Burkholder et al., 2019; Orlando and Burkholder, 2000). In addition, the uptake coefficients on aerosol surfaces are revised for each of HOBr (Wachsmuth et al., 2002), BrONO2 (Hanson et al., 1996), and HBr (Schweitzer et al., 2000). The model representations of bromine source mechanisms in the Arctic will be described in the next section (Sect. 2.1.3). The adaptation of odd nitrogen chemistry contains the following changes in the ADOM-II mechanism: (1) introducing the photolytic decomposition of peroxyacetyl nitrate (PAN) and N2O5 neglected previously and (2) replacing the kinetic representation for the hydrolysis of N2O5 into HNO3 and of NO2 into HONO and HNO3 from binary gas-phase reactions with water vapour to heterogenous surface reactions on size-resolved aerosols simulated online in GEM-MACH using uptake coefficients for N2O5 and NO2 from McDuffie et al. (2018) and Jaeglé et al. (2018), respectively. Version 2.2.3 of the Kinetic PreProcessor (Sandu and Sander, 2006) was used to generate the Fontran90 source code from our revised set of chemical species and reactions to carry out the numerical integration of photochemical tendencies for the concentrations of chemical species. Actinic fluxes and photolysis rates are calculated online by the photolysis module JVAL (Sander et al., 2014) implemented in GEM-MACH.
The GEM-MACH pan-Arctic limited-area model (LAM) domain is set on a rotated latitude–longitude grid, at 0.1375° × 0.1375° (or ∼ 15 km) horizontal resolution, covering the Arctic (> 60° N) and extending to the southern US–Canadian border (see Fig. 1). Anthropogenic emissions used are based on a combination of North American emission inventories, specifically, the 2016 US National Emission Inventories (EPA, 2025), 2015 Canadian National Air Pollutant Emission Inventories (Environment and Climate Change Canada, 2025), and 2015 MEIT Canadian marine shipping emission inventories (Environment and Climate Change Canada, 2015), and global ECLIPSE v6b 2015 baseline emissions. North American wildfire emissions were processed using the Canadian Forest Fire Emission Prediction System (CFFEPS) from satellite-detected fire hotspot data (MODIS, AVHRR, and VIIRS). CFFEPS consists of a fire growth model, a fire emissions model, and a thermodynamic-based model to predict the vertical penetration height of a smoke plume from fire energy (see Chen et al., 2019, for details). For wildfires outside North America, Fire INventory from NCAR (FINN; Wiedinmyer et al., 2011) v1.5 data were used, in which case the plume heights were estimated based on the global satellite retrieval statistics from Val Martin et al. (2018). Biogenic emissions were calculated online in GEM-MACH based on the algorithm from BEIS version 3.7 with BELD4-format vegetation land cover for North America and GLC2000 global land cover for elsewhere. Modelled sea salt emissions were based on Gong et al. (2003). The 6-hourly chemical lateral boundary conditions were from the ECMWF Atmospheric Composition Reanalysis 4 (EAC4) (https://ads.atmosphere.copernicus.eu/datasets/cams-global-atmospheric-composition-forecasts?tab=overview, last access: 9 May 2025; Inness et al., 2019). The meteorology was initialized daily (at 00:00 UTC) using the Canadian Meteorological Centre's global objective analyses, while the chemistry is continuous (i.e., the chemistry fields are cycled from the previous day integration).
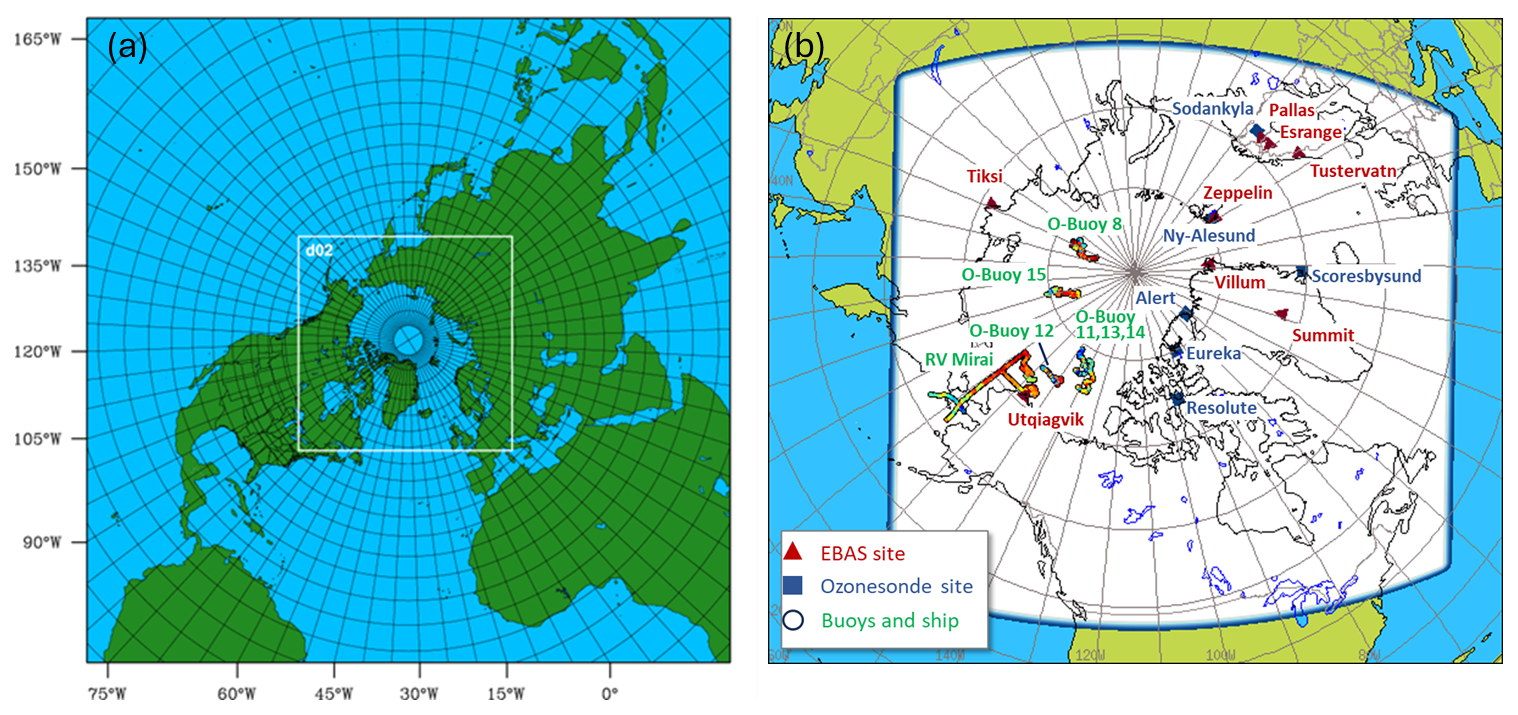
Figure 1Model domain: (a) DEHM – northern hemispheric (75 × 75 km) and nested Arctic (25 × 25 km) domains. (b) GEM-MACH-Arctic domain (at 15 km resolution), along with surface and ozonesonde sites, as well as locations of buoys and ship observations used in this study.
2.1.3 Model representations of bromine source mechanisms in the Arctic
In the Arctic, the snowpack over sea ice and terrestrial surfaces near the coast serves as an extensive reservoir of bromide anions of seawater origin (Krnavek et al., 2012; Peterson et al., 2019; Simpson et al., 2005). Its exposure to gaseous oxidants and actinic radiation coming through the atmosphere is a main driver for the oxidation of bromide to photoactive volatile forms such as Br2 and BrCl (Oum et al., 1998; Foster et al., 2001; Adams et al., 2002; Pratt et al., 2013; Custard et al., 2017). While molecular diffusion perpetually mediates the mass transfer of gaseous reactants and products between porous snowpacks and ambient air, the rate of mass exchange is enhanced under windy conditions due to the reduced aerodynamic resistance in the surface boundary layer (Toyota et al., 2014), the pumping of air within the pore space of snowpacks (Albert and Shultz, 2002), and the lofting of bromide-containing ice grains detached from the surface of snowpacks into the ambient air (i.e., blowing snow) and aerosol particles formed as residues from the sublimation of the blowing snow (Jones et al., 2009; Yang et al., 2010).
For simulating springtime ODEs in the polar regions, the following two approaches have been adopted most commonly among chemical transport models (CTMs) so far: a snowpack-sourced mechanism, based on Toyota et al. (2011), and a blowing-snow-sourced mechanism, based on Yang et al. (2010). Toyota et al. (2011) developed a semi-empirical parameterization to represent Br2 emission from the surface snowpacks via autocatalytic bromine explosion arising from the dry deposition of HOBr and BrONO2 produced in the ambient air (Lehrer et al., 2004) as well as via the net outcome of multiphase reactions within bromide-containing porous ice substrates exposed to O3 and actinic radiation (e.g., Pratt et al., 2013). The bromine source strength modelled with this scheme is also influenced by the effectiveness of heterogeneous cycling of bromine species on atmospheric aerosols (Michalowski et al., 2000). This snowpack-sourced mechanism has been adopted and tested in several CTMs (e.g., Falk and Sinnhuber, 2018; Marelle et al., 2021; Herrmann et al., 2021; Swanson et al., 2022; Zhai et al., 2023) with reasonable success in simulating springtime bromine explosion and ODEs in the Arctic and Antarctic boundary layer. Yang et al. (2008, 2010) proposed that salty snow lying on sea ice can be an important source for sea salt aerosols in the polar boundary layer during blowing-snow events, which can subsequently release bromine contributing to the spring bromine explosion and ODEs. Using a physical parameterization for the sublimation of blowing snow combined with assumed snow salinity levels based on available field data, this scheme estimates sea salt aerosol production and bromine release during blowing-snow events. It was shown that by including bromine release from the sea salt aerosols during blowing-snow events, the model was able to simulate some of the bromine explosion events in polar regions during spring (Yang et al., 2010). This approach has also been incorporated and tested in a number of modelling studies (e.g., Huang and Jaeglé, 2017; Huang et al., 2020; Marelle et al., 2021; Swanson et al., 2022; Yang et al., 2020). Finally, we should add that Fernandez et al. (2019) conceived a more empirical approach than the approaches of Toyota et al. (2011) and Yang et al. (2008, 2010) for modelling the source terms of inorganic gaseous halogens on sea ice in their global chemistry–climate model. Unlike the Toyota et al. (2011) and Yang et al. (2010) models, this approach included the chemistry of chlorine and iodine along with that of bromine where the emissions of gaseous chlorine (BrCl and Cl2) and iodine (I2) species from sea ice were also parameterized.
Representation of bromine source in GEM-MACH
In this study, GEM-MACH employs the snowpack-sourced bromine mechanism following Toyota et al. (2011) with a few minor adaptations. The production of reactive bromine Br2 from snowpacks consists of two components: the production of Br2 from deposited HOBr and BrONO2 on snowpacks reacting with bromide (Br−) present and the production of Br2 from O3-mediated bromide oxidation in snow grains under sunlight (Pratt et al., 2013). The calculation of bromine flux upon the dry deposition of HOBr and BrONO2 on first-year (FY), multi-year (MY) sea ice and terrestrial surfaces (including over inland water surfaces) follows exactly as in Toyota et al. (2011). As for the O3-mediated Br2 production from snowpacks, given the inadequate process-level understanding, Toyota et al. (2011) adopted a heuristic approach, where a fraction of the dry deposition flux of O3 was converted to the emission flux of Br2 on the model snowpacks (or a molar yield Φ1). The molar yield (Φ1) was adjusted until a reasonable agreement was reached between the model and observations for the timing and magnitude of surface O3 depletions and enhanced BrO vertical column densities (VCDs) across the high Arctic. In that study, Toyota et al. (2011) selected Br2 yields of 7.5 % and 0.1 % from the O3 loss via dry deposition for solar zenith angles not greater than 85° (sunlit condition) and greater than 85° (dark condition) over snowpacks on FY sea ice only. In the current study, greater Br2 yields from O3 deposition on sea ice were selected, namely, 15.0 % and 1.0 % for sunlit and dark conditions, respectively, over FY sea ice. The higher yields were selected primarily to compensate for the potential underrepresentation of heterogeneous cycling of bromine on aerosol surfaces due to the model underprediction of Arctic haze aerosols (see Gong et al., 2024). In addition, non-zero Br2 yields from O3 deposition over MY sea ice (half of the yields over FY sea ice) were used in this study. Krnavek et al. (2012) found bromide presence in snow samples collected from both FY and MY sea ice over the Arctic Ocean off Alaska (albeit with large variability in bromide content). Peterson et al. (2019) measured concentrations of chloride, bromide, and sodium in snow samples collected during polar spring over MY and FY sea ice north of Greenland and Alaska, as well as over the central Arctic Ocean, and found that surface snow over MY sea ice regions was more often depleted of bromide, indicating that it may have served as a source of bromine to the atmosphere. Swanson et al. (2022) further made an assumption that all snow has a uniform ability to produce molecular bromine, effectively assuming an infinite bromide reservoir with Br2 production limited only by the deposition flux in the implementation of the snowpack bromine source mechanism of Toyota et al. (2011). The uncertainty in the parameter selections for the snowpack bromine source mechanism will be discussed later in Sect. 4.1.
Other adaptations from Toyota et al. (2011) in the parameterization of the snowpack Br2 production for this study include (1) raising the temperature threshold to permit the snowpack Br2 production to 272.15 K (Oum et al., 1998), (2) assuming the deactivation (without possibility for reactivation afterwards) of the snowpack's ability to form Br2 after a snowmelt event diagnosed by the continuous occurrence over 6 h of surface air temperature at 273.15 K or higher (Burd et al., 2017; Jeong et al., 2022), and (3) setting the minimum snow depth at 5 cm to permit the Br2 production from snowpacks (e.g., Swanson et al., 2022).
For discriminating the age of sea ice between FY and MY, the EASE-Grid Sea Ice Age Version 4 dataset (https://nsidc.org/data/nsidc-0611/versions/4, last access: 9 May 2025), available from the National Snow and Ice Data Center at a weekly temporal resolution and a spatial resolution of 12.5 km × 12.5 km (Tschudi et al., 2020), was used. Daily total (FY + MY) sea ice concentrations are obtained from the Canadian Global Ice Ocean Prediction System data (Smith et al., 2016), which are used also as surface boundary conditions for our host meteorological model simulation. Since the EASE-Grid Sea Ice Age data do not cover areas near the coastlines and within narrow channels of the sea, we fill in the data gaps using a monthly climatology of sea ice thickness, taken again from the surface boundary condition data for the host meteorological model simulation, as a proxy for the age of sea ice. Here, MY sea ice is assumed where the climatological sea ice thickness for the meteorological model input is greater than 3.5 m. The spatial distributions of sea ice age from the data used by the GEM-MACH simulation are shown as monthly mean for each month of March to May 2015 in the Supplement (Fig. S1)
Representation of bromine sources in DEHM
DEHM includes the representation of bromine release from open-ocean sea salt and the blowing-snow sea salt following Yang et al. (2008, 2010, 2020). The release of bromine from sea salt aerosols is thought to involve the heterogeneous uptake of gaseous inorganic bromine on sea salt aerosols and subsequent reaction with bromide (Fan and Jacob, 1992; Yang et al., 2005). Given that the details of the bromine release mechanisms are not completely known, Yang et al. (2005, 2008, 2010) proposed a parameterization to estimate bromine release flux from sea salt aerosols, based on sea salt flux, which can be from either open-ocean (OO) or blowing-snow (BLSN) production, the Br NaCl mass ratio (Ra), and a bromine depletion factor (DFs):
For open-ocean sea salt production, two different source functions are used: for the sea salt aerosols with dry diameters less than 1.25 µm, a source function based on Mårtensson et al. (2003) is used, while for those with sizes greater than 1.25 µm, the source function of Monahan et al. (1986) is applied (see Soares et al., 2016, for details).
For blowing-snow production of sea salt, Yang et al. (2008, 2010) made use of a blowing-snow sublimation rate, which is a complex function of wind speed (at 10 m), air temperature, relative humidity, snow age, etc. For the implementation in DEHM, the formulations of the temperature-dependent wind speed threshold for lifting snow and the attenuation factor, which reduces the lifting of snow as a function of the age of snow, are the same as described in Yang et al. (2008). Similar to the implementation in Yang et al. (2010), the age of the snow is estimated as the number of hours since the last snowfall events in the WRF model output of hourly accumulated snow fields. It does not consider horizontally transported snow from one grid cell to another, which could change the age of the surface snow. For this study, the size-dependent salinity of snow in Yang et al. (2008) was scaled to a mean salinity for the Arctic of 0.93 psu for snow on FY sea ice, which is 3 times the Antarctic mean salinity of 0.31 psu as given in Frey et al. (2020), and the salinity of the snow on MY sea ice was assumed to be half of that on FY sea ice. It was assumed that a single sea salt particle is produced per snowflake as in Yang et al. (2008, 2010). Monthly bromine depletion factors (DFs) for the Northern Hemisphere following Yang et al. (2020) were used to estimate the bromine release from blowing-snow sea salt.
2.2 Observations used in this study
Ozone observations from multiple platforms were used for comparison with model simulations in this study, including surface O3 observations from 8 Arctic ground sites, 7 buoys, and a research vessel over the Arctic Ocean, as well as O3 vertical profile observations from ozonesondes and research aircraft. In addition, observations of bromine monoxide (BrO) vertical column density (VCD) obtained from multiple axis differential optical absorption spectroscopy (MAX-DOAS) measurements were also used to compare with model results. Table 1 lists all the sites and observational data used in this study.
Table 1Sites and types of observational data used in this study (latitudes are given in degrees north; longitudes are in degrees east (E) or west (W); elevations are given in metres above mean sea level, m a.s.l.).
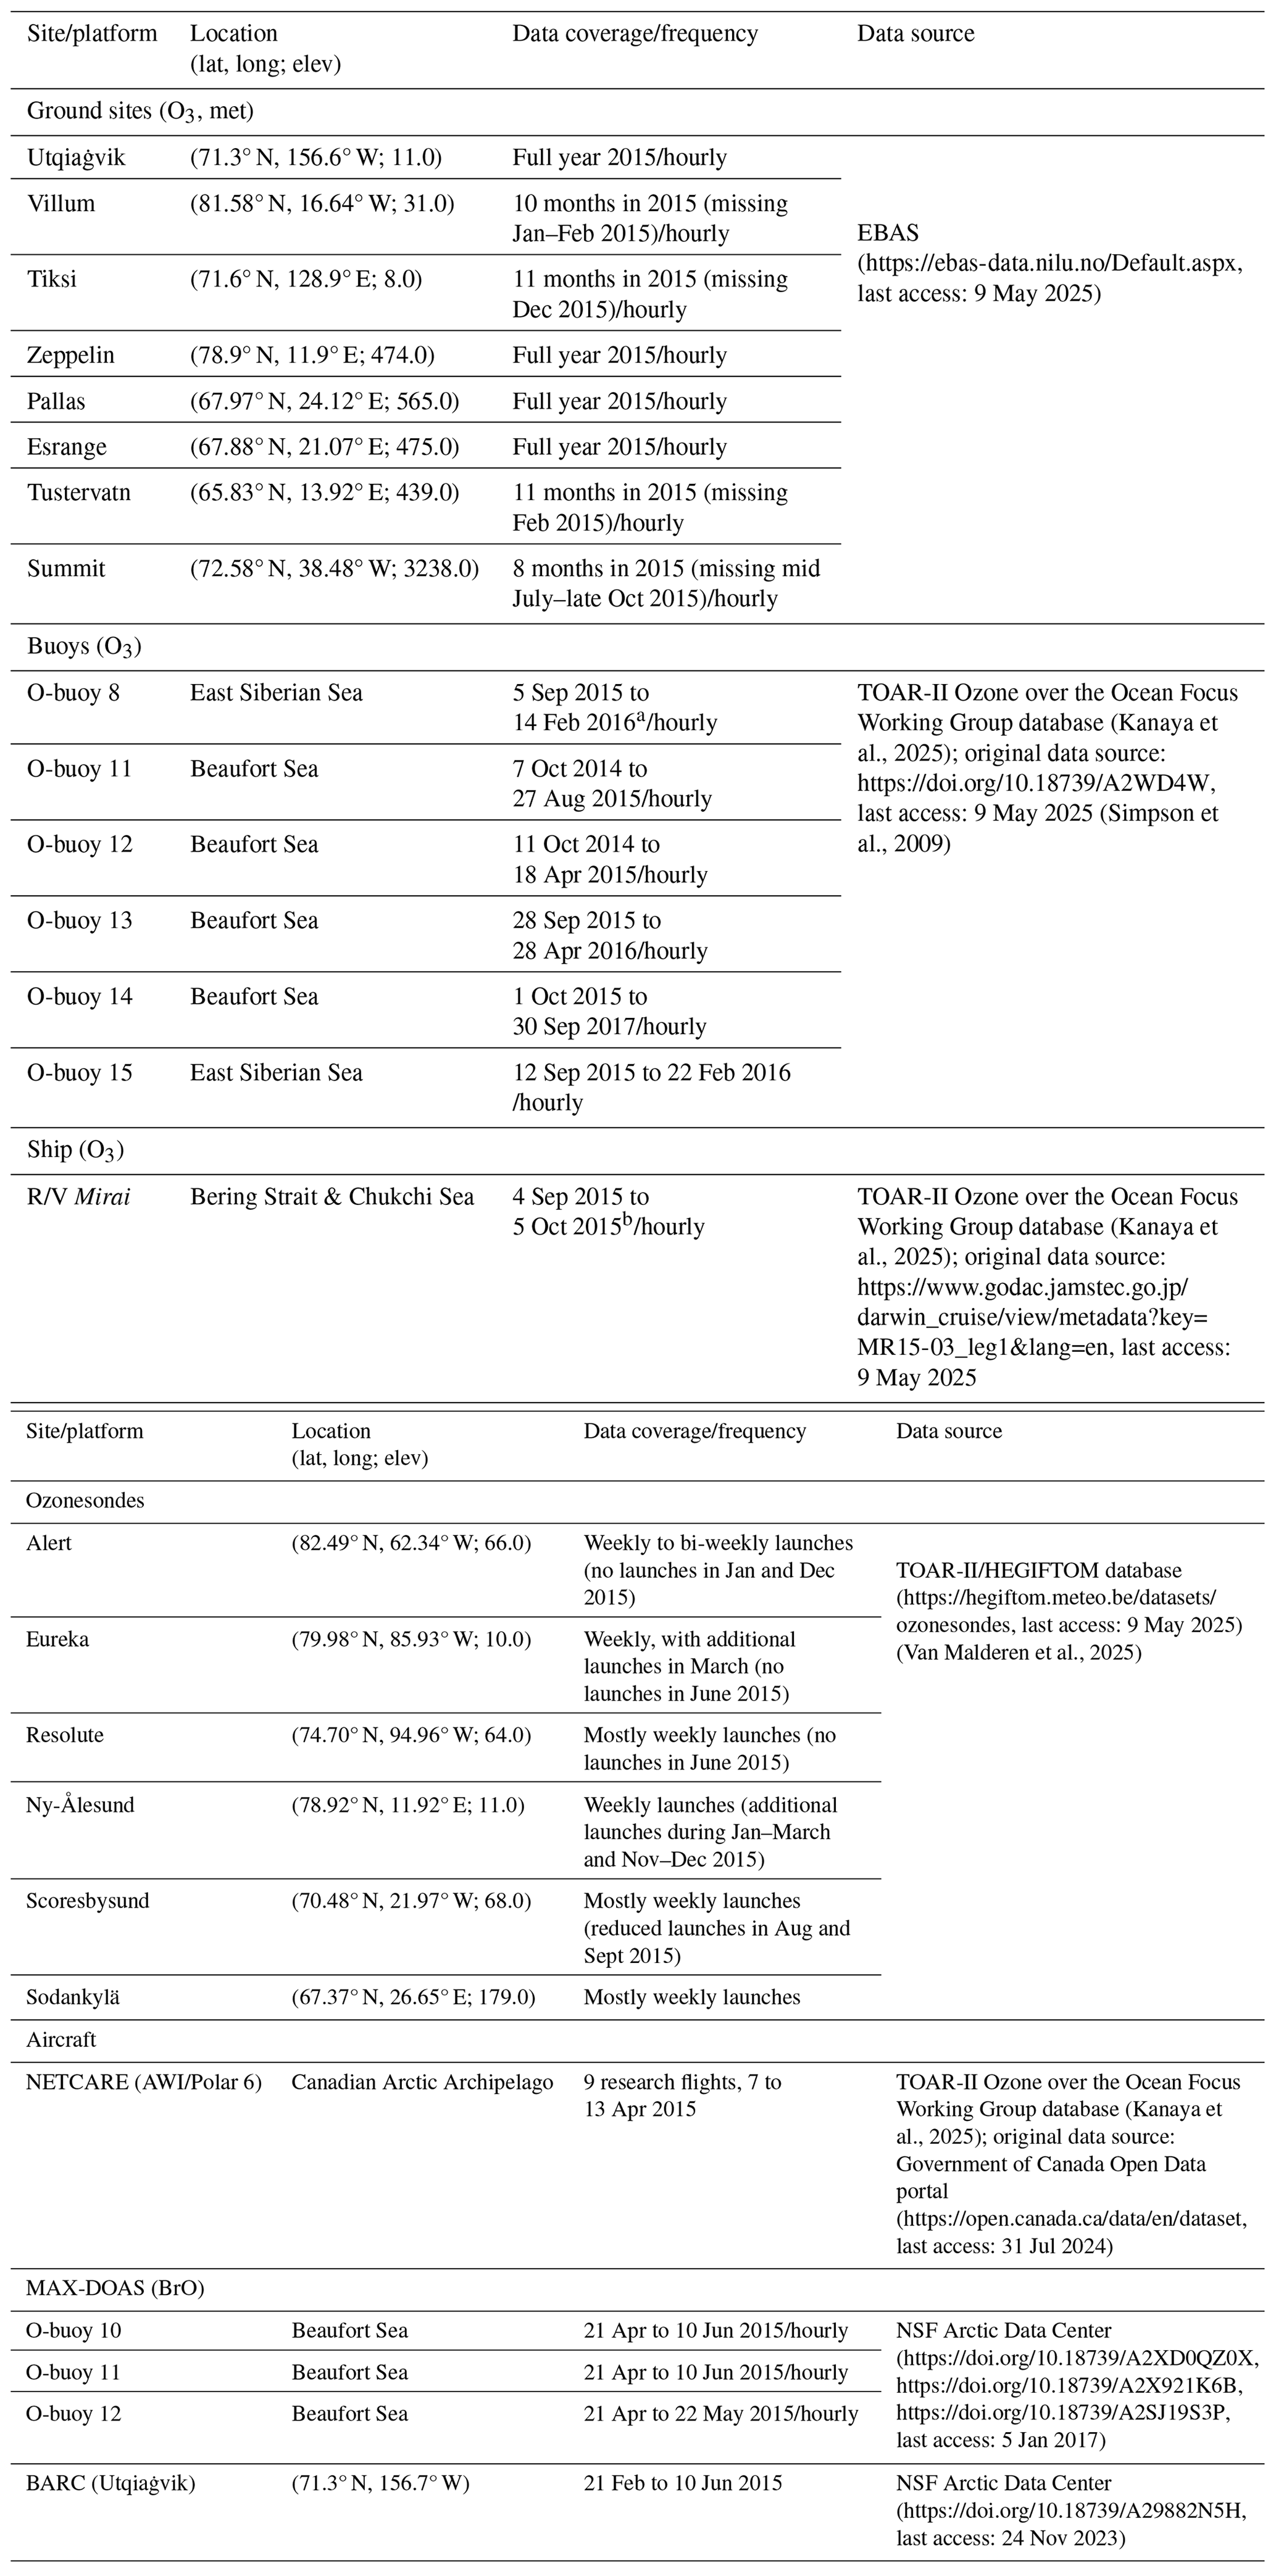
a Dates shown are the start and end date of deployment for each of the O-buoys. Note, however, O3 measurements were not always available for the full deployment period, and only the data within 2015 were used in this study. Also note that the end date of the deployment for O-buoy 14 was not available, but the buoy was active beyond the end of 2015. b This is the period when R/V Mirai was north of 60° N.
2.2.1 Arctic ground sites
Hourly O3 mixing ratio data for the year 2015 from 8 long-term ground-based monitoring sites in the Arctic were obtained from the EBAS database infrastructure (https://ebas.nilu.no, last access: 9 May 2025) hosted by NILU, which handles data submitted to AMAP (Arctic Monitoring Assessment Programme), EMEP (European Monitoring Evaluation Programme), and GAW-WDCRG (Global Atmosphere Watch – World Data Centre for Reactive Gases). These are the only ground sites with available O3 observations in 2015. The 8 sites (marked on Fig. 1) include 3 coastal sites (Utqiaġvik, Villum, Tiksi), a coastal mountain site (Zeppelin), 3 inland sites (Pallas, Esrange, and Tustervatn), and a high-elevation site (Summit) on the Greenland plateau. Surface O3 measurements at these monitoring stations are all undertaken using UV-absorption-based instrumentation.
The Utqiaġvik site (71.3° N, 156.6° W; 11.0 m a.s.l.), the NOAA Global Monitoring Laboratory's Barrow Atmospheric Baseline Observatory, is located on the northernmost shore of Alaska, about 8 km northeast of the community of Utqiaġvik (formerly Barrow) and 3 km away from the Arctic Ocean. The site, with its east-northeasterly prevailing winds off the Beaufort Sea, is characterized as having an Arctic maritime climate affected by variations of weather and sea ice conditions in the central Arctic. Villum Research Station (Villum) is in northeast Greenland (81.58° N, 16.64° W; 31.0 m a.s.l.) on a small peninsula of 20 × 15 km on lowland plain and 750 m from the coast, at the military outpost Station Nord. The sea around the peninsula is frozen about 11 months of the year. Tiksi (Tiksi International Hydrometeorological Observatory) is located in northern Siberia (71.6° N, 128.9° E; 8.0 m a.s.l.) on the shore of Laptev Sea (Uttal et al., 2013, 2016). The Zeppelin station is located on the top of Zeppelin Mountain (78.9° N, 11.9° E; 474.0 m a.s.l.) on Spitsbergen in the Svalbard archipelago, surrounded by glaciers, mountains, and the sea. Due to its location, for most of the time the station is above the local inversion layer and hence not impacted by local emissions (Platt et al., 2022).
The 3 inland sites are all located in the European subarctic boreal forest region close to the Arctic circle. The Pallas site (67.97° N, 24.12° E; 565.0 m a.s.l.) is located in the Pallas-Yllästunturi National Park on top of a fjeld. The site is part of the Pallas Global Atmospheric Watch (GAW) station operated by the Finnish Meteorological Institute (Hatakka et al., 2003). The Esrange site (67.88° N, 21.07° E; 475.0 m a.s.l.), at a similar latitude to the Pallas site but on the Swedish side, is part of the EMEP monitoring network. Tustervatn (65.83° N, 13.92° E; 439 m a.s.l.), located in northern Norway just south of the Arctic circle, is also an EMEP regional monitoring site. The high-elevation site Summit (72.58° N, 38.48° W; 3238.0 m a.s.l.), operated by the National Science Foundation (NSF) and the NOAA Global Monitoring Laboratory, is located at the top of the Greenland Ice Sheet. Given its geographical location and high elevation, measurements at this site are particularly influenced by free-troposphere long-range transport to the Arctic.
2.2.2 Surface mobile platforms (ship and buoys)
Surface O3 observations from mobile platforms were used to compare with model simulations. Hourly data were obtained from the Tropospheric Ozone Assessment Report – Phase Two (TOAR-II) Ozone Over the Ocean Focus Working Group database (Kanaya et al., 2025), including from the O-Buoy Project (Simpson et al., 2009; https://arcticdata.io/catalog/view/doi:10.18739/A2WD4W, last access: 22 July 2025) and the R/V Mirai cruise (Kanaya et al., 2019).
As part of the Arctic Observing Network program, a series of autonomous ice-tethered buoy systems (O-buoys) capable of year-round measurement of O3, CO2, and BrO were deployed over the Arctic Ocean during 2011–2016 (Knepp et al., 2010; Halfacre et al., 2014; Burd et al., 2017). O3 measurements were available from 6 O-buoys during 2015; they are listed in Table 1 with their deployment dates and the areas of deployment (also see Fig. 1 for their tracks). The time and duration of the O3 measurement varied between these buoys; e.g., O-buoy 11 and 12 covered the first half of 2015, while O-buoy 8, 13, 14, and 15 covered the latter half (starting in September). In all, the O-buoy O3 measurement coverage extends nearly the full year of 2015 (with a gap in August), although measurements over the winter months (January, February, November, and December) were sparse.
In addition to buoy measurements, O3 measurement (using a UV-absorption instrument) on board the R/V Mirai of the Japan Agency for Marine–Earth Science and Technology (JAMSTEC) was available from its Arctic cruise in 2015 (MR15-03; Kanaya et al., 2019). MR15-03 took place in the fall of 2015. The cruise started from Mutsu, Japan, in late August and sailed through the North Pacific, the Bering Strait, and the Chukchi Sea; around the northern coast of Alaska to Utqiaġvik; and then back through the Bering Strait, ending at Dutch Harbour, Alaska, in early October. During the month of September 2015, the R/V Mirai was north of 60° N in Arctic waters (see Fig. 1 for R/V Mirai's track in the Arctic).
2.2.3 Ozonesondes
Ozonesonde data from six Arctic sites (Alert, Eureka, Resolute, Ny Ålesund, Scoresbysund, and Sodankylä) were used to evaluate the modelled seasonal variations of O3 between 0 and 5 km a.s.l. (Fig. 1 and Table 1). Alert (82.49° N, 62.34° W) is located on the northeastern shore of Ellesmere Island, the northernmost island of the Canadian Arctic Archipelago (CAA), facing the vast area of perennial sea ice on the Arctic Ocean. Eureka (79.98° N, 85.93° W) is located on the coast of an inlet of the Arctic Ocean along Nansen and Eureka Sounds, penetrating over 200 km from the northwestern coast of Ellesmere Island. Resolute (74.70° N, 94.96° W) is located on the southern shore of Cornwallis Island in the central part of the CAA. Alert, Eureka, and Resolute are located where arriving air masses may have experienced prolonged contact with sea ice on the Arctic Ocean and within the CAA. Ny Ålesund (78.92° N, 11.92° E) is located on the northwestern shore of the bay of Kongsfjord on Spitsbergen, Svalbard, a Norwegian archipelago in the marginal ice zone of the Arctic Ocean. The launch site is situated at the foot of the Zeppelin Mountain, the site of the Zeppelin station. Scoresbysund (70.48° N, 21.95° W) is located on the eastern shore of Greenland along a deep inlet of the Greenland Sea. Sodankylä (67.36° N, 26.62° E) is in the boreal forest region of northern Finland and is the only site located inland amongst the six ozonesonde sites selected for this study. The ozonesondes were launched mostly on a weekly schedule at these sites with some variations as noted in Table 1. The homogenized ozonesonde time series dataset was obtained from the TOAR-II Harmonization and Evaluation of Ground Based Instruments for Free Tropospheric Ozone Measurements (HEGIFTOM) project (Van Malderen et al., 2025; https://hegiftom.meteo.be/datasets/ozonesondes, last access: 9 May 2025). The vertical resolution of the ozonesonde data varies between a few metres and a few tens of metres (< 50 m) over the lowest 5 km of the atmosphere.
2.2.4 Aircraft data (2015 NETCARE-Polar6)
During the 2015 spring field campaign of the NETCARE project (Network on Climate and Aerosols: Addressing Key Uncertainties in Remote Canadian Environments; Abbatt et al., 2019), airborne measurements were conducted with the Polar 6 aircraft, a Basler BT-67 (converted DC-3) owned and operated by the Alfred Wegener Institute (Aliabadi et al., 2016; Leaitch et al., 2016). O3 mixing ratios were measured through UV photometry with a Thermo Scientific 49i analyzer (time resolution 10 s, ± 0.2 ppbv). Supporting meteorological parameters were provided by an AIMMS-20 package (Aventech Research Inc., Canada). All data from NETCARE are available on the Government of Canada Open Data Portal (https://open.canada.ca/data/en/dataset, last access: 31 July 2024). Nine research flights were conducted around Ellesmere Island in the Canadian Arctic Archipelago between 7 and 13 April 2015, including profiling through the lowest 6 km of the atmosphere (Bozem et al., 2019). As shown later in Sect. 4.1, many of these profiling flights captured ODEs prevalent at the time in the area.
2.2.5 MAX-DOAS BrO VCD data
To evaluate modelled bromine chemistry in the Arctic, measurements of bromine monoxide (BrO) vertical column densities (VCDs) using multiple-axis differential optical absorption spectroscopy (MAX-DOAS) from several platforms were obtained from a repository at the NSF Arctic Data Center (https://arcticdata.io/; see Table 1). MAX-DOAS instruments were mounted on the aforementioned O-buoys deployed in the Arctic Ocean (Swanson et al., 2020). The MAX-DOAS BrO measurements on O-buoys were only available during spring after polar sunrise and when enough O-buoy solar power was gained to defrost the MAX-DOAS view port (usually some time in April), until summer when most of the O-buoys were destroyed by being crushed between ice fragments on the Arctic Ocean (Swanson et al., 2022). During 2015, BrO measurements were available from O-buoy 11 and 12, as well as O-buoy 10 (Table 1). BrO measurements were also available from a MAX-DOAS instrument of the same type (as those installed on O-buoys) deployed at the Barrow Arctic Research Center (BARC, Utqiaġvik) (Simpson, 2018; Simpson et al., 2017). The MAX-DOAS at BARC was able to operate much earlier in the year than those MAX-DOAS instruments on the O-buoys, as it was powered by local utilities and was able to defrost the MAX-DOAS viewport much earlier (Table 1).
3.1 Seasonal distribution of lower-tropospheric O3 in the Arctic
Arctic lower-tropospheric O3 is influenced by transport from lower latitudes, photochemical production from anthropogenic and biogenic ozone precursors of both local and distant origins and atmospheric removal processes (such as dry deposition and (photo-)chemical loss through reactions with biogenic VOCs and surface sourced reactive halogens), as well as stratospheric–tropospheric exchange. All of these sources and processes, which are represented in the models in this study at varying degrees of complexity (see Sect. 2 above), vary seasonally, which gives rise to the seasonal variations of Arctic O3. Figure 2 shows the model-simulated monthly mean O3 concentrations over the Arctic for January, April, July, and October (representative of each of the four seasons) at three model levels, the lowest (surface level), near 900 hPa, and near 700 hPa (GEM-MACH simulation shown in Fig. 2a and DEHM simulation in Fig. 2b). The GEM-MACH-model-simulated O3 over the Arctic shows distinctively different seasonal patterns near the surface and aloft and between the central Arctic Ocean and subarctic regions. Over the central and western Arctic Ocean (Eurasian and North American side) close to the surface, this model computes the lowest O3 in spring as a result of the O3 depletion events (ODEs) from the prevalence of bromine explosions during this period, in broad agreement with an earlier report of a full-year of surface ozone measurements over the central Arctic Ocean (Bottenheim et al., 2009). The highest ozone from the GEM-MACH simulation is found in fall (October). In contrast, at higher altitudes, O3 is highest in springtime. The same is also true for the inland subarctic regions. The springtime ozone maximum is thought to be driven by transport from the stratosphere, since intrusion events are more frequent during this season, and by photochemical production from the NOx released from thermal decomposition of PAN (Walker et al., 2012). The model-simulated O3 over subarctic boreal regions also displays a spring maximum. The model-simulated low O3 over summer in these regions can be attributed to both the loss through O3 reactions with biogenic VOCs (e.g., isoprene) under low-NOx conditions and enhanced dry deposition. The DEHM-simulated O3 over the Arctic does not show a clear springtime minimum at the lowest model level. The model simulation shows a general spring maximum over the Arctic throughout the lower troposphere, except for over the very centre of the Arctic Ocean (> 80° N) where the modelled (April) monthly mean O3 concentration is slightly lower than surrounding areas at the lowest model level. The DEHM-simulated monthly mean O3 for July shows clear enhancement at elevated levels (particularly at the near 900 hPa level) over northern Alaska and Chukchi Sea, extending into central Arctic Ocean, which is likely contributed by boreal wildfires (see discussions later in Sect. 4.2). Except near the surface and during spring, the two models are quite consistent with each other in simulating O3 over the Arctic particularly during winter (January) and fall (October). The two models also behaved similarly in simulating O3 at higher altitude (e.g., near the 700 mb level). Both models simulated low surface O3 concentrations over northern Eurasia and northern Europe during winter. The low ozone can be argued to be attributable to reduced photo-chemical production and enhanced titration by NO emissions from local sources within the darker and shallower boundary layer during winter, as well as dry deposition. Both model simulations also show low O3 over subarctic boreal regions in summer, but the low O3 simulated in GEM-MACH extends to a deeper layer compared to the DEHM simulation. On the other hand, the DEHM-simulated surface O3 concentrations over the Arctic Ocean during summer are higher than those in the GEM-MACH simulation, which is also the case at higher altitudes (i.e., near the 900 and 700 mb levels).
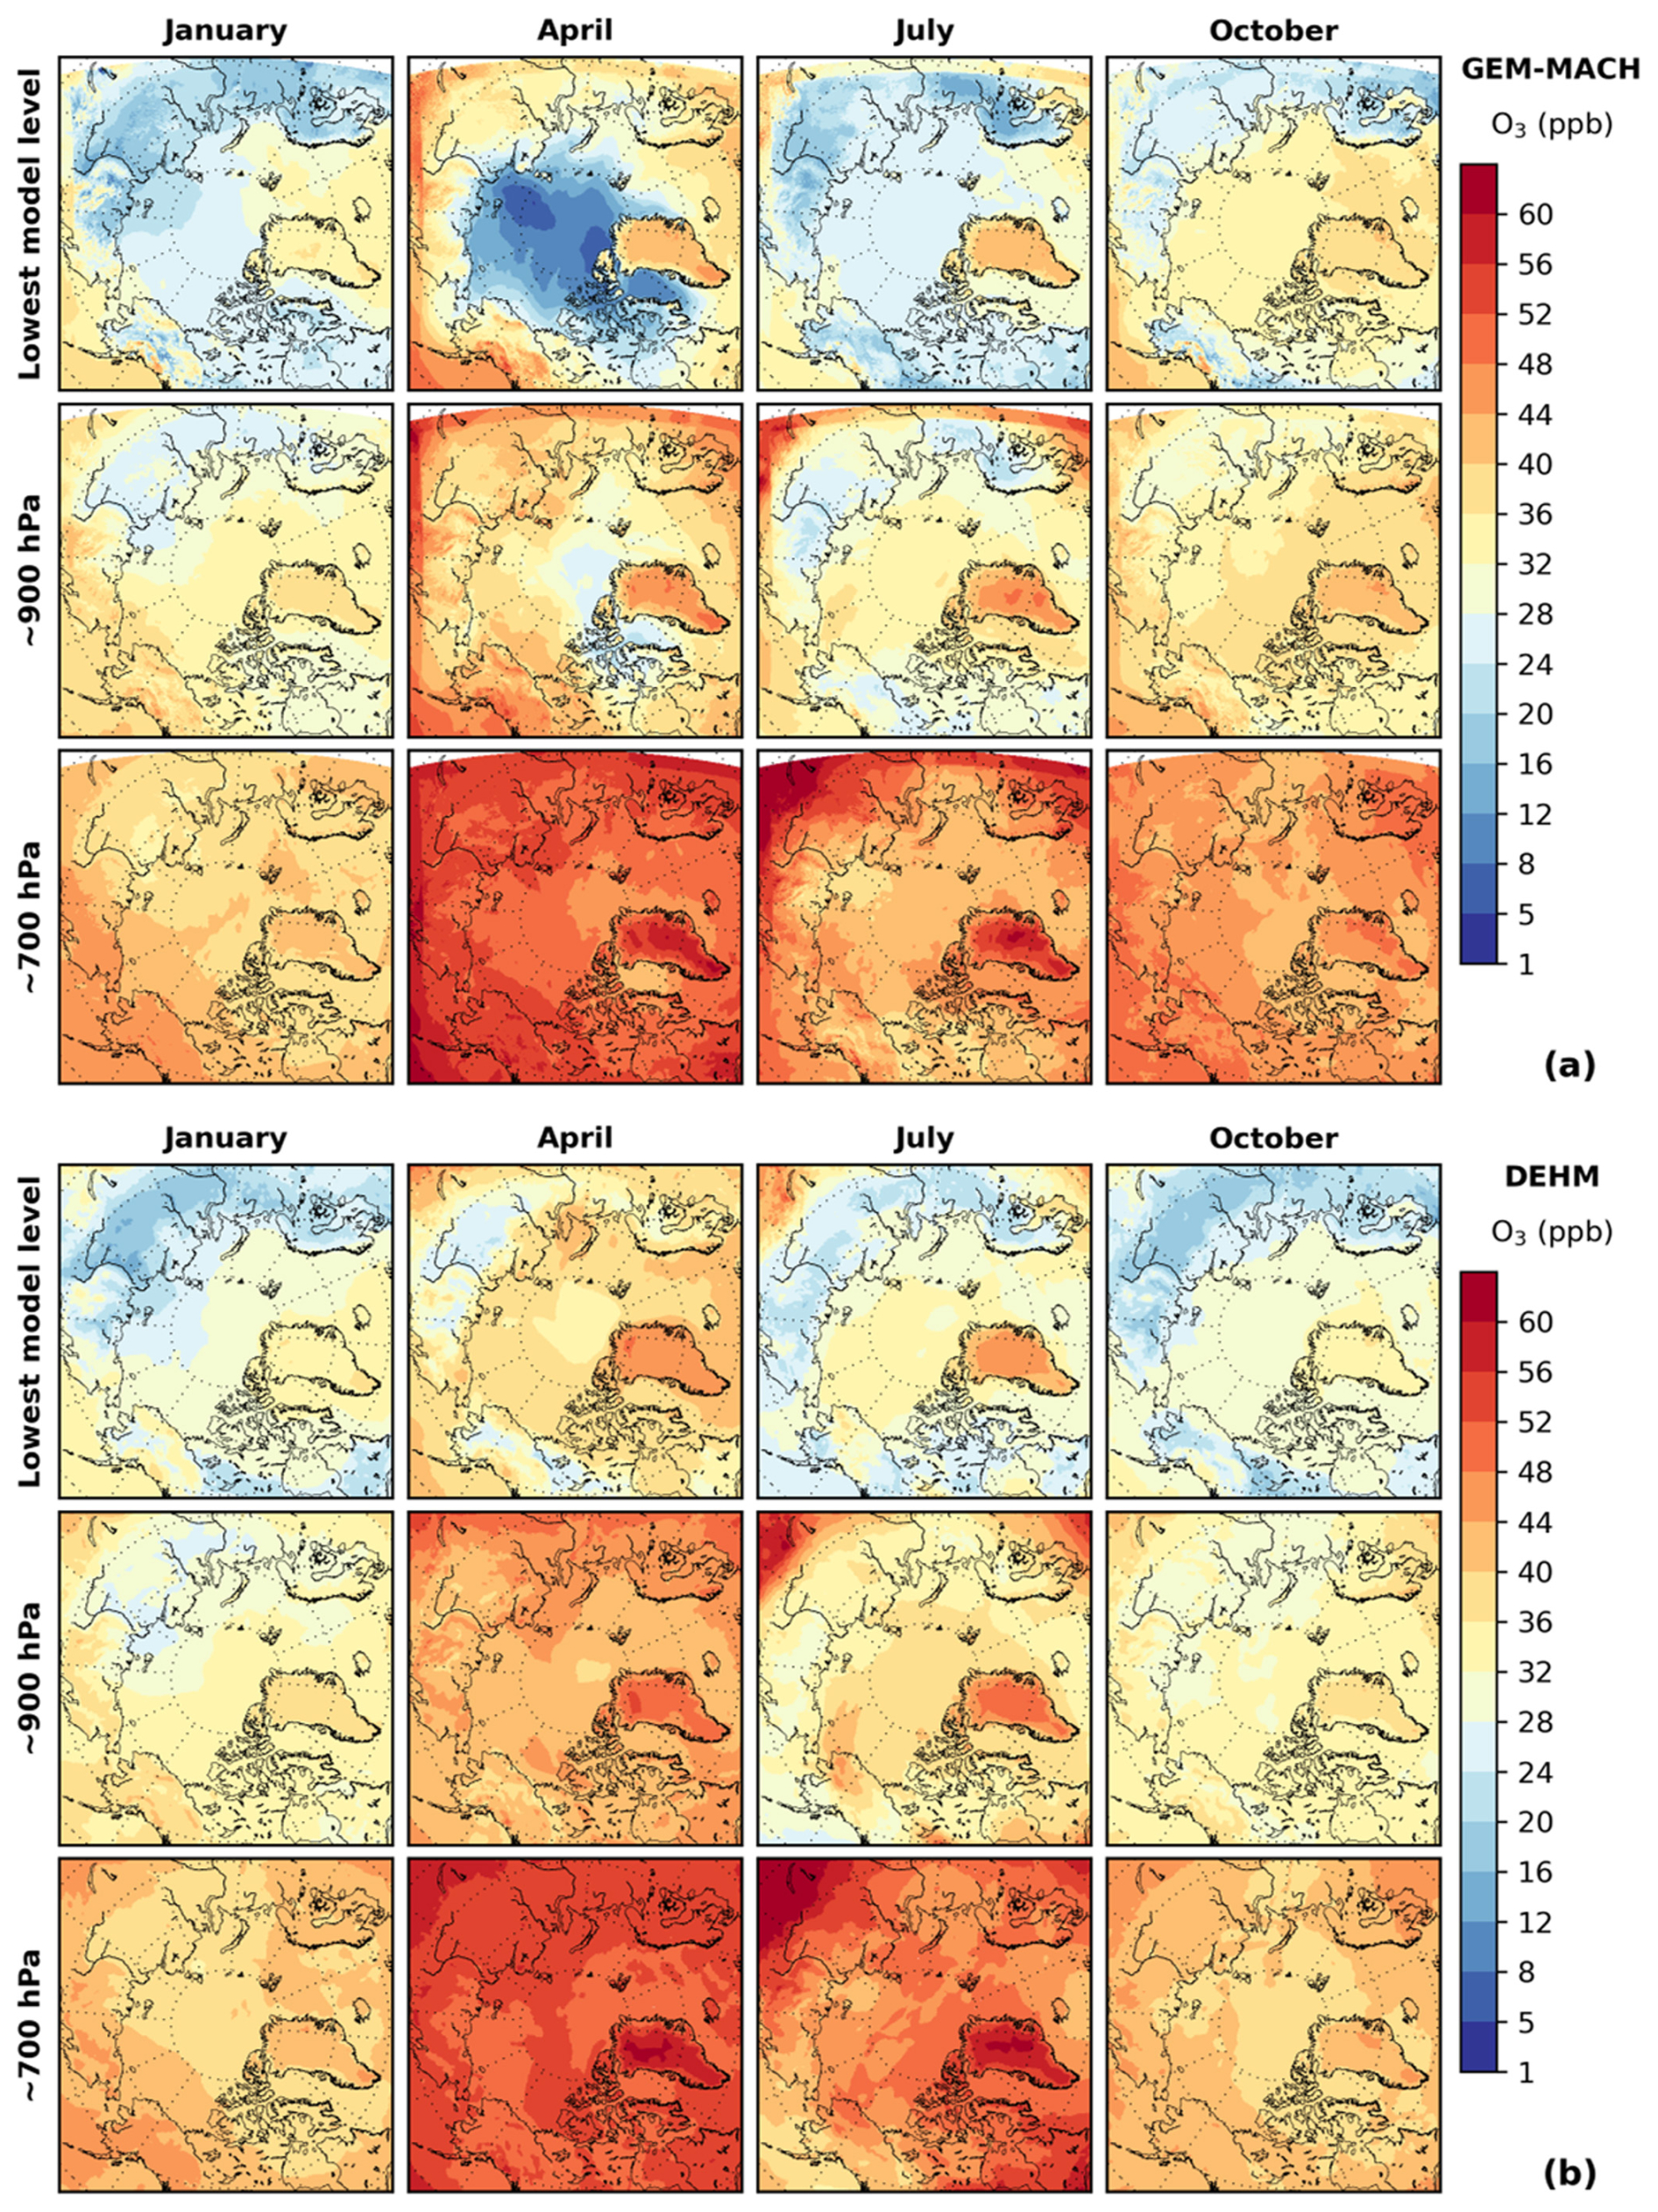
Figure 2Modelled monthly mean O3 concentration (from left to right) for the month of January, April, July, and October, at the lowest model level (top row), model level near 900 hPa (middle row), and model level close to 700 hPa (bottom row): (a) GEM-MACH and (b) DEHM.
Figure 3 shows the spatial distributions of the times when the annual maximum and minimum monthly mean O3 concentrations occur at the three model levels seen in Fig. 2 (left panels from the GEM-MACH simulation; right panels from the DEHM simulation). At the 700 hPa level, the two models are consistent with each other in showing that the annual O3 maximum occurs in spring months (April and May) over the Arctic, while the annual O3 minimum occurs in winter (December and January) and late fall (November), with the exception over the Beaufort Sea and the Canadian Northwest Territories where the GEM-MACH-simulated annual O3 minimum occurs in late summer months (July and August). Near the surface, the two models differ over the Arctic Ocean stemming from the model's differing ability to simulate the springtime ODEs which are prevalent over the Arctic Ocean sea ice (Bottenheim et al., 2009). The GEM-MACH simulation shows annual minimum monthly O3 in spring months (April and May), due to modelled strong ODEs (see discussion later in Sects. 3.2 and 4.1), and maximum in fall (October), while DEHM simulates annual maximum monthly O3 in spring over the Arctic (much like the upper levels) due to considerably fewer ODEs simulated by the model (see Sects. 3.2 and 4.1). It is evident that the springtime O3 depletion process plays a central role in driving the O3 seasonal cycle at low altitude levels over the high Arctic in the GEM-MACH simulation. Away from the Arctic Ocean and the Canadian Archipelago overland, the two models are again consistent in producing an annual maximum O3 in spring and minimum O3 in late summer and early fall over Alaska, Northwest Territories, and the eastern Russian Arctic.
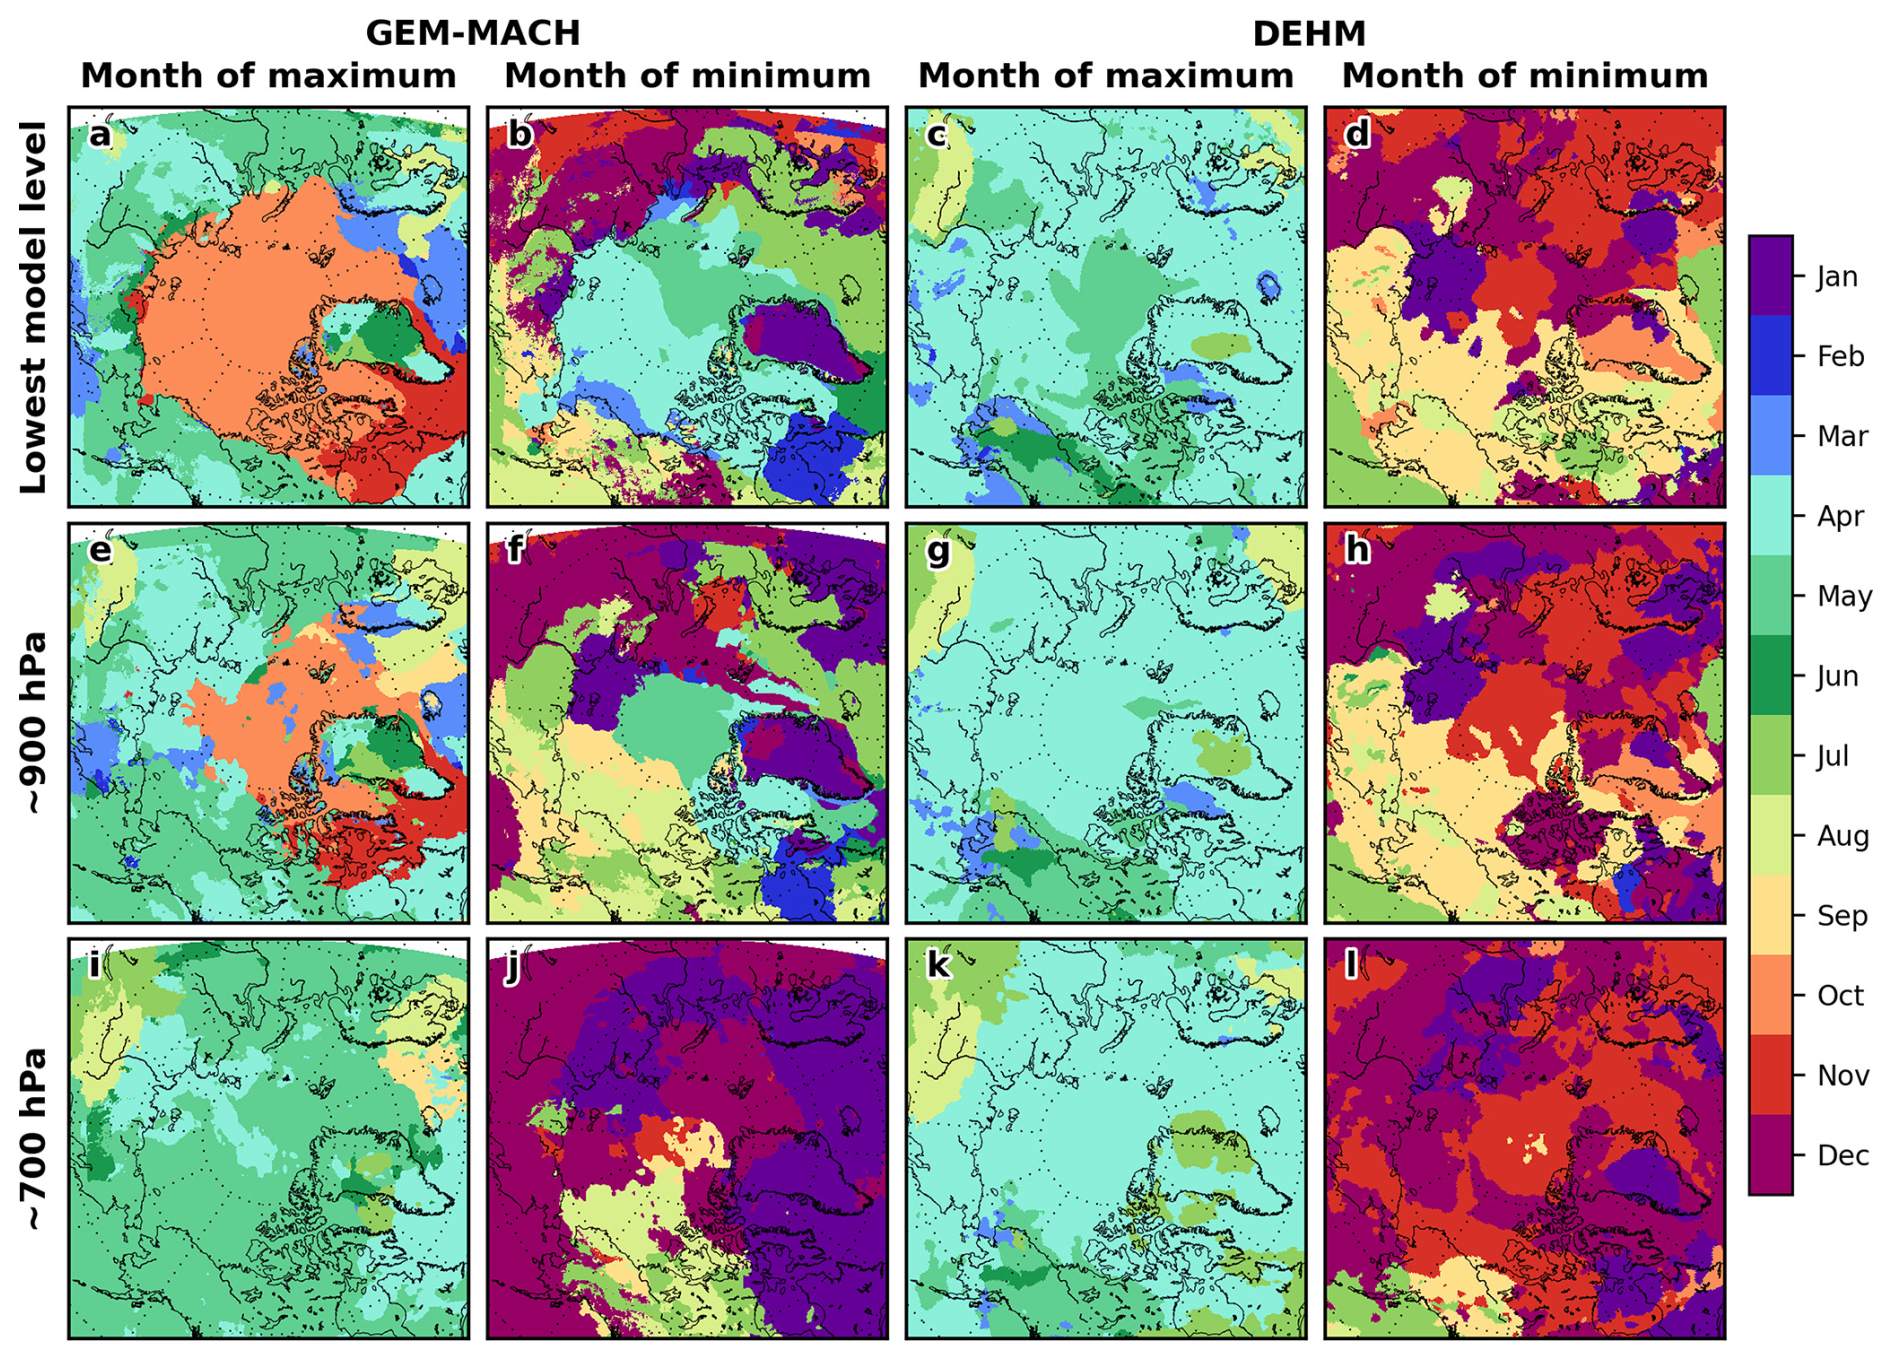
Figure 3Timing of modelled annual maximum and minimum monthly mean O3 concentration at the three model levels as in Fig. 2: GEM-MACH – left panels (a, b, e, f, i, j); DEHM – right panels (c, d, g, h, k, l).
3.2 Annual O3 time series comparison with observations
To evaluate the models' ability to simulate Arctic boundary layer O3, the modelled surface (or lowest model level) O3 concentrations are compared with observations from ground-based monitoring sites and surface mobile platforms (O-buoys and Mirai cruise). To do this, the modelled O3 concentrations are extracted at the ground-based sites and following buoy tracks and ship paths from the nearest model grid cells and hours and compared with hourly observations. Existing model evaluations related to tropospheric ozone assessment (e.g., Monks et al., 2015b; Whaley et al., 2023; Young et al., 2018) have been mostly performed on long-term annual and monthly averages. With the two regional models used in this study run at much higher spatial resolutions, as compared to the global models employed in the previous assessment studies, we can examine model simulations and compare with observations at much finer temporal resolutions (e.g., hourly) here.
Figure 4 shows the O3 time series comparisons at the eight Arctic monitoring sites described in Sect. 2.2.1. Overall, both DEHM and GEM-MACH simulations captured the observed O3 seasonal as well as synoptic-scale variations at these Arctic ground sites. The three Arctic coastal sites, Utqiaġvik, Villum, and Tiksi, are strongly influenced by the spring ODEs, which are captured reasonably well by the GEM-MACH simulation. DEHM was less successful in capturing the springtime ODEs at these sites. The modelling of ODEs will be examined in more detail later in Sect. 4.1. The seasonal variation in the observed O3 at the subarctic inland sites (Tustervatn, Pallas, and Esrange) follows the typical pattern of a maximum in spring and minimum in summer, with greater variability in summer and fall. The model simulations from both DEHM and GEM-MACH follow the observed O3 variations closely throughout the year. The GEM-MACH simulation shows a larger low bias at the two northern European boreal sites (Pallas and Esrange) particularly during the spring and summer seasons, while the DEHM performed better (particularly at Esrange); this will be discussed further in the statistical model evaluation below.
The two high-elevation sites (Zeppelin and Summit) exhibit somewhat different O3 seasonal patterns. The Zeppelin site, situated at 474 m above the Arctic Ocean, is situated approximately half of the time above the top of the atmospheric boundary layer (Dekhtyareva et al., 2018). The observed O3 time series in 2015 displays an overall maximum in April and a minimum in July, in contrast to the Arctic coastal sites. This is consistent with the seasonal patterns based on longer-term (multi-year) observations (e.g., Whaley et al., 2023). However, it is evident from the time series in Fig. 4 that the site is sporadically impacted by springtime ODEs during April and May in 2015. Previous observations of ODEs at this site have been reported by others (e.g., Berg et al., 2003; Eneroth et al., 2007; Lehrer et al., 1997; Solberg et al., 1996). The O3 observation at Summit has a gap between the end of July and the end of October in 2015. The incomplete observed O3 time series shows no clear trend over the first 5 months (January–May) of 2015 before increasing over June to reach a maximum in July. This is a departure from the seasonal trend shown in Whaley et al. (2023) based on multi-year data (2003–2018), which showed a maximum in May. Both Zeppelin and Summit surface observations display high O3 events in July 2015. As will be discussed later in Sect. 4.2, there is an indication that these events may be associated with transport of wildfire plumes in the free troposphere. Again, model simulations from both DEHM and GEM-MACH compare well with the observations at these sites, capturing the observed seasonal and synoptic-scale variations (also evident from the statistical evaluation shown in Table 2), though neither model simulation was able to fully capture the July high O3 events observed at Summit.
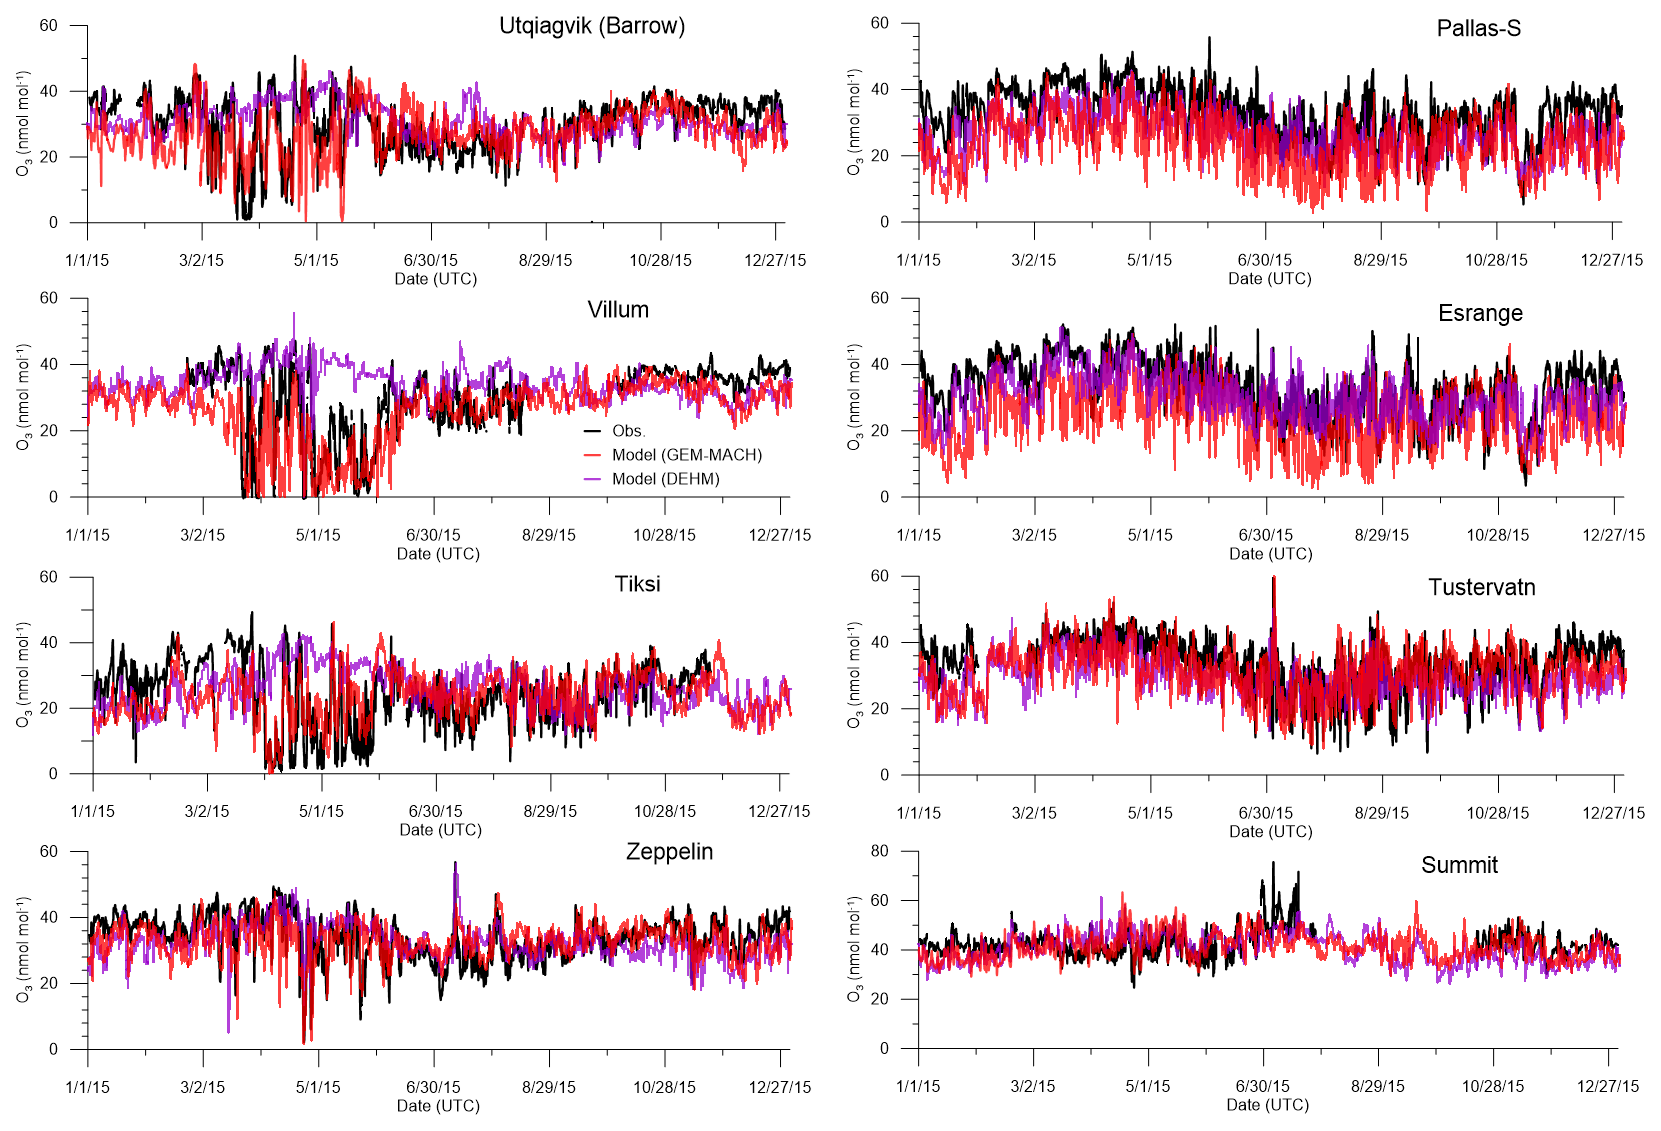
Figure 4Observed and modelled 2015 annual surface ozone time series at selected Arctic sites: observation – black line, DEHM – magenta line, GEM-MACH – red line.
Statistical evaluations of model performance were conducted on the hourly time series. Table 2 shows selected seasonal and annual model performance scores at the 8 Arctic ground sites, including normalized mean bias (NMB), Pearson correlation coefficient (r), and unbiased root-mean-square-error (URMSE), while the corresponding monthly scores are shown in the Supplement (Fig. S2). The seasonal scatter plots (colour-coded for each month separately) of model versus observations at the 8 surface sites are shown in Fig. S3. The evaluation (Table 2) shows that both models underpredict wintertime Arctic surface ozone at all sites, with GEM-MACH having a greater negative bias at Utqiaġvik, Villum, Pallas, and Esrange. At coastal sites, DEHM has significant positive bias during the spring months due to its under-representation of the springtime ODEs, while the GEM-MACH model has considerably better performance scores. It is interesting to note the significant positive bias in both models during the summer months at the coastal sites, except for a small negative bias in GEM-MACH at Villum, which is largely driven by the month of June values; see Fig. S3b. Neither DEHM nor GEM-MACH currently includes iodine chemistry, which can play a prominent role in ozone destruction over polar oceans during (as well as after) the time of springtime bromine explosions (Benavent et al., 2022; Fernandez et al., 2024; Mahajan et al., 2010; Raso et al., 2017; Wittrock et al., 2000).
At the two northern European boreal sites, Pallas and Esrange, the models are generally biased low throughout the year. GEM-MACH has the greatest difficulty in simulating surface ozone accurately at these two sites, particularly during summer, as evident by the relatively poor performance scores shown in Table 2 (and Fig. S3) compared to other sites, while DEHM performed considerably better at these sites. This may be partly attributable to the difference in modelled O3 dry deposition velocities over the boreal land cover between GEM-MACH and DEHM. Clifton et al. (2023) examined O3 dry deposition velocity formulations across contemporary regional chemical transport models, including the formulations used in GEM-MACH (based on Wesely, 1989) and DEHM (as in Simpson et al., 2012). They showed that the formulation used in GEM-MACH (“GEM-MACH Wesely”) significantly overestimated O3 dry deposition velocities over the European boreal forest during summer compared to an estimate based on ozone flux measurements. In contrast, the formulation used in DEHM (“DO3SE”) was shown to produce O3 dry deposition velocities in much closer agreement with those derived from observations over the summertime European boreal forest.
Overall, the two regional models seem to demonstrate better skill in capturing the observed seasonal variations in the Arctic surface ozone, compared to the large-scale global atmospheric chemistry models reported in previous assessments (e.g., Law et al., 2023; Whaley et al., 2023; Young et al., 2018) where the models showed a large spread in simulated surface O3 concentrations and inability to reproduce the observed seasonal cycles at some of the Arctic sites. Besides the implementation of the processes involved in springtime ODEs in the Arctic, the better performance from the two independent regional models in this study can be attributed, at least in part, to better resolved atmospheric dynamics and boundary layer processes modelled at finer spatial and temporal scales.
Table 2Selected seasonal and annual model performance scores (NMB, r, and URMSE) based on hourly time series at the 8 Arctic ground sites.
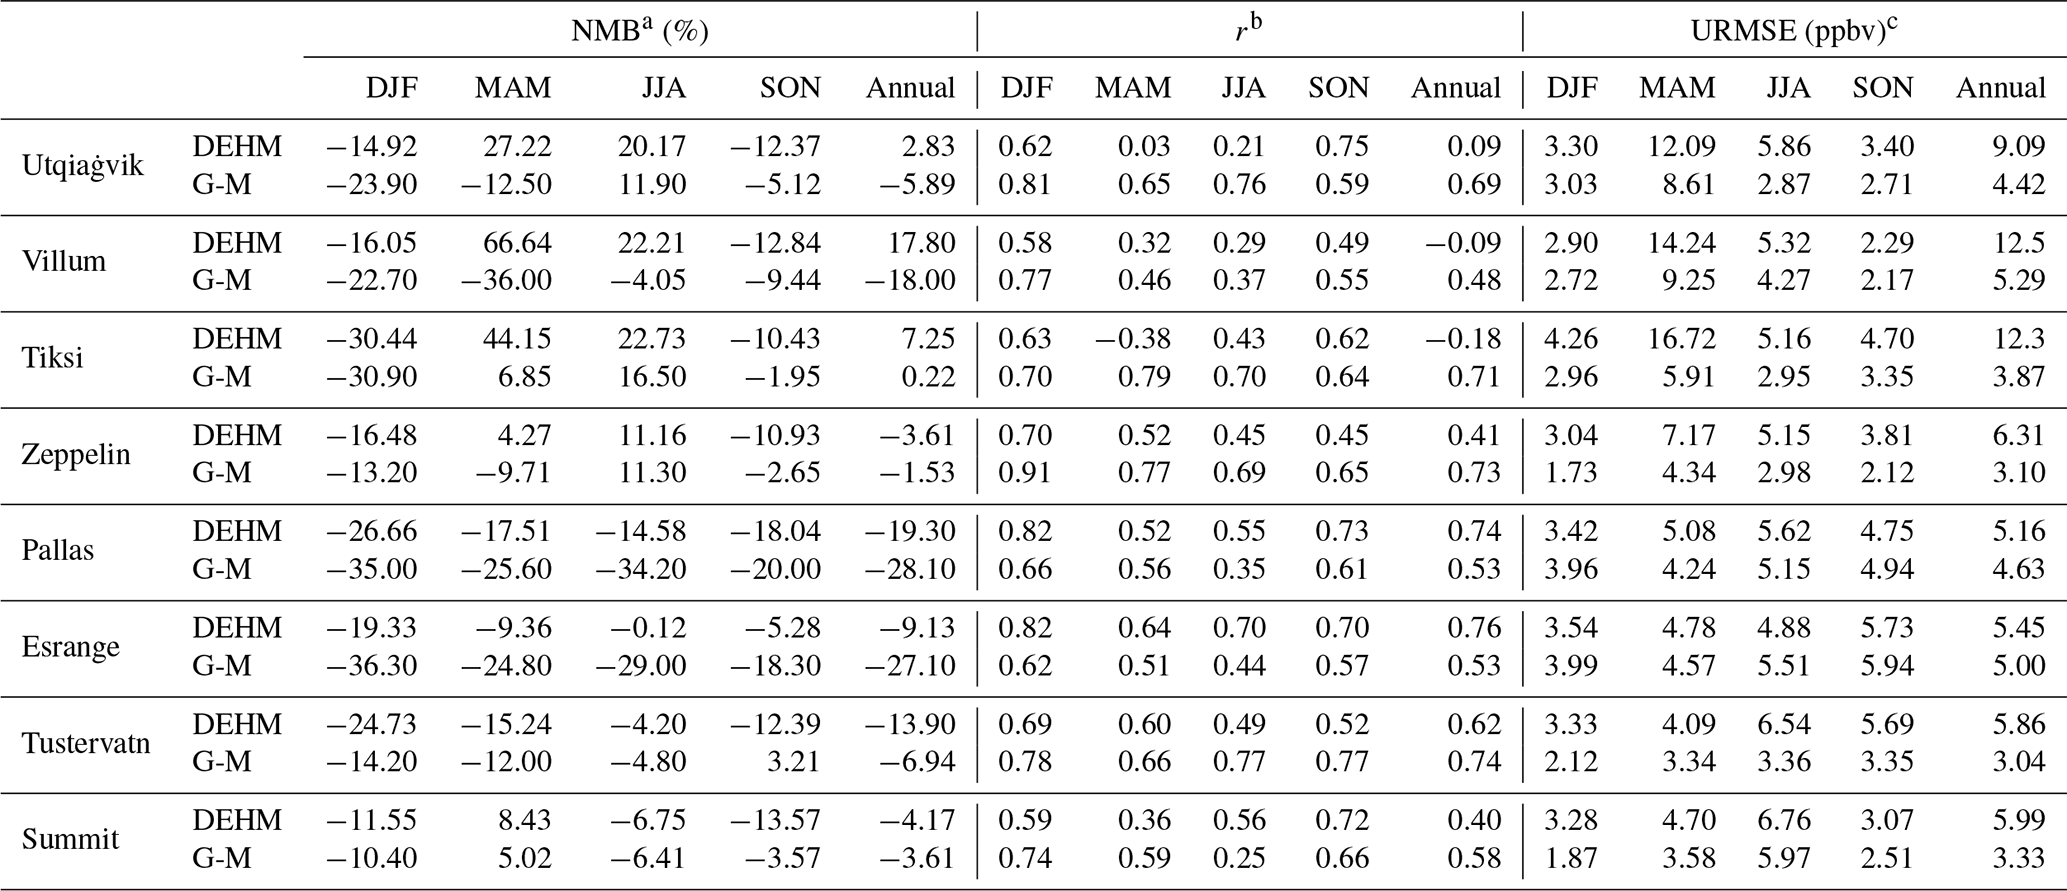
a Normalized mean bias (NMB): NMB . b Pearson correlation coefficient (r): , where and . c Un-biased root-mean-square-error (URMSE): URMSE .
The model simulations are also compared with buoy and ship observations in Fig. 5. As described in Sect. 2.2.2, the O3 observations were available from the six O-buoys (8, 11, 12, 13, 14, and 15) and the Japanese research vessel Mirai for different time periods in 2015 with their tracks over various parts of the Arctic Ocean (Fig. 1). In Fig. 5, the time series of O3 from different platforms are collated into single plots for observations and two model results, respectively, to illustrate that the composite O3 seasonal patterns shown in the observations over the Arctic Ocean are virtually consistent with those observed at the Arctic coastal sites; i.e., the spring period is dominated by ODEs followed by a brief rebound before decreasing to its summer minimum and then recovery in the fall. Like the observations, the modelled O3 time series along the buoys and ship tracks are also consistent with those modelled at the Arctic coastal site (Utqiaġvik shown, as an example, in Fig. 5). The similarity between O3 observations over the Arctic Ocean and the coastal sites was also found in other studies (e.g., He et al., 2016; Sommar et al., 2010; Bottenheim et al., 2009) with the exception of springtime. The model–observation comparisons for individual buoys and ships, including time series, scatter plots, and statistical scores (i.e., normalized mean bias, NMB; Pearson correlation coefficient, r; and unbiased root-mean-square error, URMSE), are provided in the Supplement (Fig. S4). The two models generally track the buoys and ship observations well, particularly for the latter half of the year. The GEM-MACH model was able to simulate the observed ODEs (O-buoy 11 and 12) during spring. Outside the spring period, the two models exhibit a similar performance in simulating surface O3 over the Arctic Ocean compared against observations on the buoys (O-buoy 8, 13, 14, and 15) and the ship (R/V Mirai), as indicated in the statistical evaluation (Fig. S4). Similar to the comparisons at the coastal sites in Fig. 4, the model-simulated surface O3 is biased low over the winter season along the buoy tracks (e.g., O-buoy 11 and 12 over January and February, O-buoy 8, 13, 14, and 15 over November and December; Fig. S4). It is notable that both models simulated the O3 observations on the R/V Mirai cruise (September 2015) very well (Fig. S4), which is in contrast to a previously identified challenge in simulating the O3 observations from the multi-year (2013–2018) Mirai cruises in the Arctic (all during September) where global models significantly underpredicted the surface O3 concentrations (Kanaya et al., 2019). Kanaya et al. (2019) suggested that the dry deposition of O3 over the ocean may be overrepresented in their model (a dry deposition velocity of ∼ 0.04 cm s−1 over open ocean was used in their case), which may be responsible for the model under-prediction of O3. As mentioned earlier, GEM-MACH in this study uses a parameterization representing iodide-mediated O3 deposition over the open ocean (Sarwar et al., 2015) for the Arctic simulation, which can result in a dry deposition velocity smaller than the original GEM-MACH's fixed value of 0.03 cm s−1 over high-latitude open oceans, while the O3 dry deposition velocity of ∼ 0.05 cm s−1 over open ocean is used in DEHM (see Appendix 1). This suggests that the model representation of O3 dry deposition may only be partially responsible for the global model underprediction of O3 over the Arctic Ocean in the earlier study.
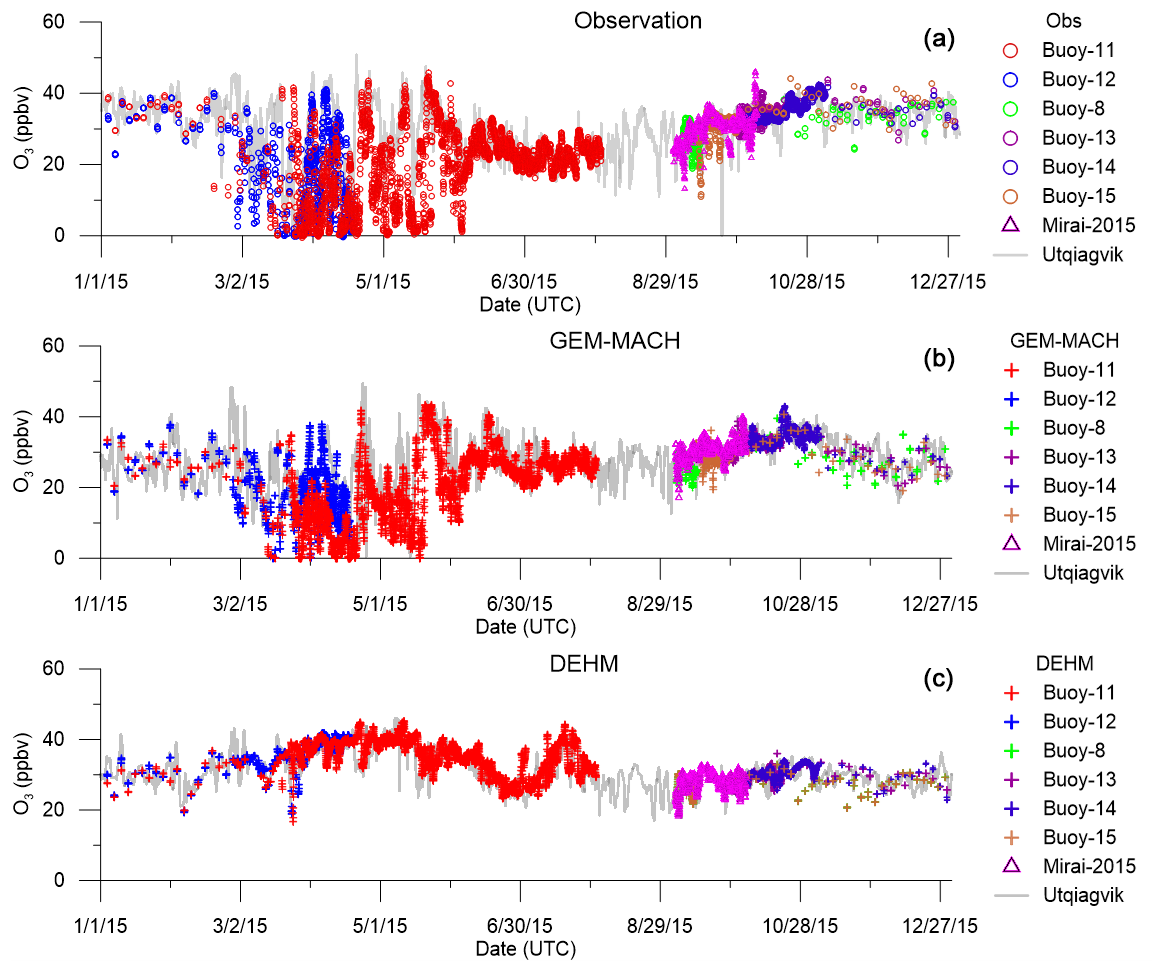
Figure 5Observed (a) and modelled (GEM-MACH – b, DEHM – c) surface ozone time series along the O-buoy and Mirai 2015 cruise paths. Also plotted (in grey lines) are the observed (in the top panel) and modelled (GEM-MACH and DEHM, respectively; in the lower two panels) surface O3 at Utqiaġvik site, to illustrate the similarity in seasonal patterns at the buoy and ship locations (over the Arctic Ocean) and coastal sites (e.g., Utqiaġvik) shown in both observations and the two models.
3.3 Ozone vertical profiles comparison with ozonesondes
To evaluate the models' abilities to simulate the vertical distribution of O3 over the Arctic, the modelled vertical O3 profiles at the Arctic ozonesonde sites (see Sect. 2.2.3) are compared with the ozonesonde observations. For the comparison, both modelled and observed (ozonesondes) profiles were interpolated at 10 m resolution and binned to 100 m intervals. The vertical profiles of model data were extracted over the grid cells nearest to the ozonesonde launching sites and at the hours closest to the launch times. We focus on the lowest 5 km a.s.l. altitude range in this study. Figure 6 includes the seasonal comparisons at the six Arctic sites: Alert, Eureka, Resolute, Ny Ålesund, Scoresbysund, and Sodankylä (observations in black, GEM-MACH in red, and DEHM in purple). For the lowest 5 km, the model simulations and observations are in overall good agreement. The spring (MAM) ozonesonde profiles at Alert, Eureka, and Resolute over the Canadian Archipelago are strongly influenced by the ODEs below 1 to 1.5 km a.s.l. The GEM-MACH model was more successful in capturing the ODEs at these sites, though the modelled ODEs were not as strong as the observations close to the surface. The vertical depths of the ODEs, mostly limited to the lowest 1 km, were simulated well. The DEHM simulation did not capture the observed ozone depletion close to the surface. However, above the boundary layer (∼ 1.5 km), the modelled O3 profiles from the two models do agree well and are in good agreement with observations. The model-simulated ozone profiles (from both models) are biased low compared to the ozonesonde measurements over the winter months (DJF) at most of the sites, consistent with the model low bias shown at the surface sites. In the case of GEM-MACH, the overall model low bias in winter could, at least in part, be attributable to the chemical lateral boundary condition from the ECMWF-CAMS reanalysis. Both Inness et al. (2019) and Wagner et al. (2021) have found that the CAMS reanalysis (for the period of 2003 to 2018) tends to have a negative bias in surface and tropospheric ozone over the winter season at high latitudes, particularly after 2012/2013, which was linked to a switch in data assimilation procedure. At the Sodankylä site, located in the European boreal region (in close proximity with two of the surface observation sites, Pallas and Esrange), the GEM-MACH-simulated ozone has a significant negative bias throughout the lowest 5 km during summer (JJA). The DEHM simulation also shows a similar negative bias above 1.5 km but recovers in the lowest 1.5 km layer, where the modelled O3 concentrations are much closer to those observed. The modelled ozone profiles at Ny Ålesund and Scoresbysund also show similar negative biases at altitudes above 2–3 km during JJA months. This may be indicative of insufficient transport in the free troposphere in both models, but the GEM-MACH model's underprediction of ozone close to the surface at the Sodankylä site could be attributed to the model's over-representation of the O3 dry deposition over the European boreal region, as discussed earlier in Sect. 3.2, and possibly to an over-predicted emissions (and hence concentrations) of biogenic olefins such as isoprene reacting rapidly with O3 (e.g., Gong et al., 2022).
Whaley et al. (2023) compared model-simulated vertical profiles (using monthly mean model output) from 12 different large-scale models to the ozonesonde measurements at the same group of sites as we examined here (see their Figs. 8 and S1). We have plotted the profiles of seasonal relative difference between model simulations and observations (or NMB) in Fig. S5, which can be compared with the results shown in Whaley et al. (2023). Again, the two regional models here show better skills in simulating the observed O3 vertical profiles over the lowest 5 km of the atmosphere examined (having considerably smaller biases, generally well within ± 25 %, compared to the large spread of relative difference, ± 50 %, in the same altitude range amongst the large-scale global models).
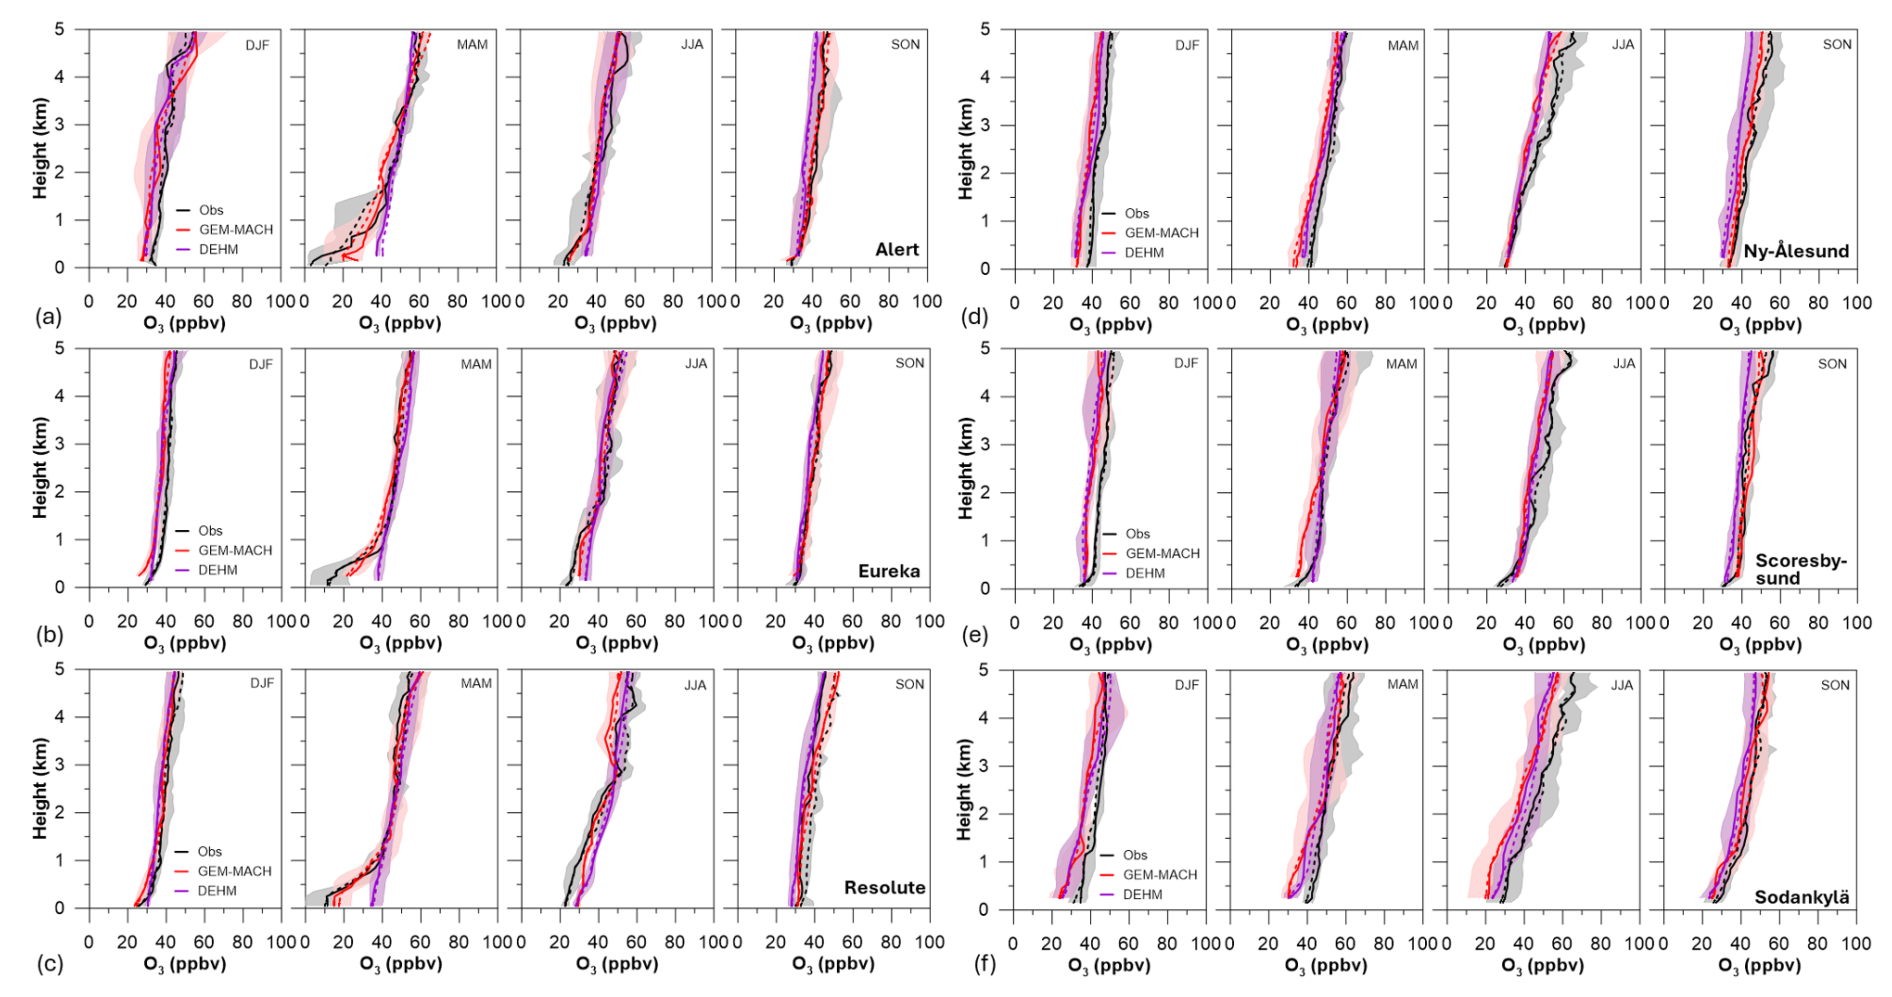
Figure 6Comparisons between modelled and observed ozone vertical profiles at Arctic ozonesonde sites: Alert (a), Eureka (b), Resolute (c), Ny Ålesund (d), Scoresbysund (e), and Sodankylä (f); solid and dashed lines denote median and mean, respectively, and shade denotes inter-quartile range (IQR). Observations are shown in black, GEM-MACH in red, and DEHM in purple. “DJF” denotes December–January–February, “MAM” denotes March–April–May, “JJA” denotes June–July–August, and “SON” denotes September–October–November.
Monthly statistical evaluations for three altitude ranges, 0–1, 1–2, and 2–5 km, are presented in Fig. 7, comparing monthly mean, maximum, minimum, and interquartile range between model and ozonesondes at the six Arctic ozonesonde sites. Note that there were no ozonesonde launches in January and December 2015 at Alert and in June 2015 at Resolute and Eureka. Here, again, the distinctively different ozone seasonal patterns between the lowest altitude range (0–1 km) and the higher altitude range in the free troposphere (2–5 km) are evident at all three ozonesonde sites in the Canadian archipelago (Alert, Eureka, and Resolute). The springtime ozone minimum, occurring in May at Alert and in April at Resolute and Eureka, is prominently seen in the lowest 1 km range, driven by the ODEs. The influence of ODEs can be seen in the 1–2 km altitude range also at these sites. In contrast, ozone in the 2–5 km altitude range exhibits a maximum in late spring (in the month of May) at all sites. The ozonesonde observations in the lowest 1 km altitude range also indicate a maximum in October at the three ozonesonde sites over the Canadian Archipelago, consistent with the GEM-MACH model results shown in Figs. 2 and 3. It is also interesting to notice that the usual summer O3 minimum observed at the surface sites (see Fig. 4) is evident at lower altitudes (below 2 km) but less evident in higher altitudes (e.g., 2–5 km) from the ozonesonde observations at these Arctic sites. The statistical evaluation shows generally good agreement between the models and the ozonesonde observations for the three selected altitude ranges at most of the sites. Larger discrepancies between the GEM-MACH model and observations are seen in June and July at the Sodankylä site, consistent with the model's underprediction of summertime O3 at the surface sites in the European boreal region (as discussed above). Again, overall, the two models are seen to have good skills in reproducing the observed O3 vertical distribution and seasonal cycles over the Arctic (except for the coastal sites where DEHM was unable to reproduce the observed O3 influenced by ODEs in spring).
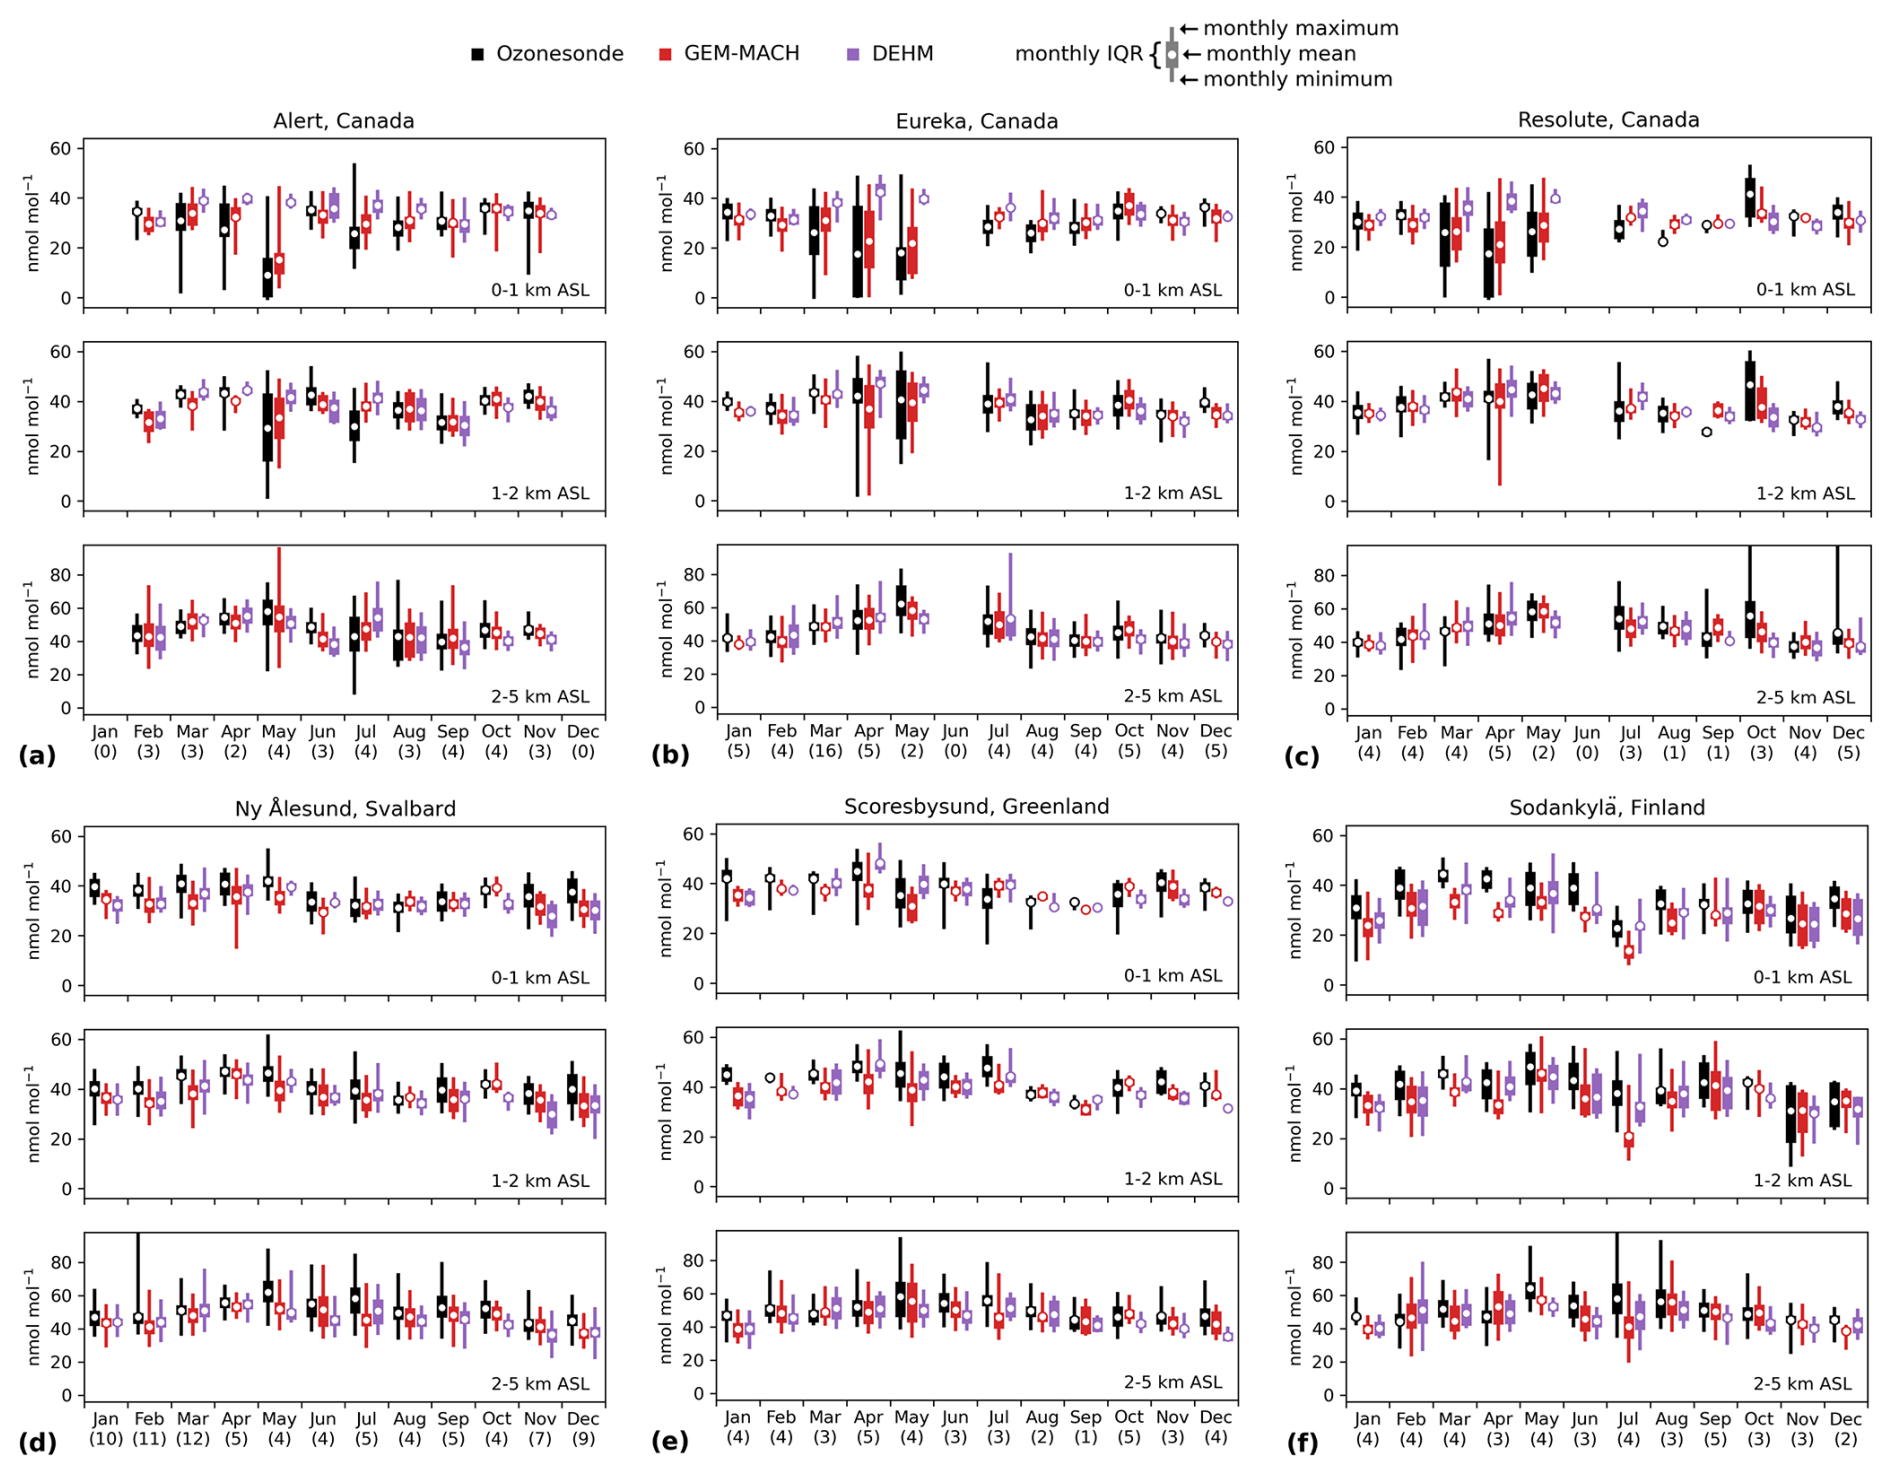
Figure 7Statistical evaluation of modelled O3 profiles against ozonesonde observations at Alert (a), Eureka (b), Resolute (c), Ny-Ålesund (d), Scoresbysund (e), and Sodankylä (f), for three altitude ranges (top: 0–1 km a.s.l., middle: 1–2 km a.s.l., and bottom: 2–5 km a.s.l.). Monthly mean, interquartile range (IQR), and full data range from minimum to maximum for each month are denoted by open circles, thick bars, and thin bars, respectively (observation in black; GEM-MACH in red; DEHM in purple). The number of observed ozone profiles available in each month of the year 2015 at each site is indicated in parentheses (underneath each month).
4.1 Modelling springtime ODEs: sensitivities to process representations and their uncertainty
As shown from the observations and model results presented in Sect. 3, the springtime ODEs play an important role in driving the Arctic surface O3 seasonal cycles. The main uncertainty in modelling the springtime ODEs is in quantifying the sources for reactive bromine in the Arctic boundary layer. As described in Sect. 2.1.3, the two models included in this study, DEHM and GEM-MACH, consider different sources of reactive bromine: GEM-MACH adopted a representation of a snowpack bromine source mechanism following Toyota et al. (2011), while DEHM implemented a representation of sea-salt-aerosol-sourced bromine from blowing-snow and open-ocean sea spray following Yang et al. (2010).
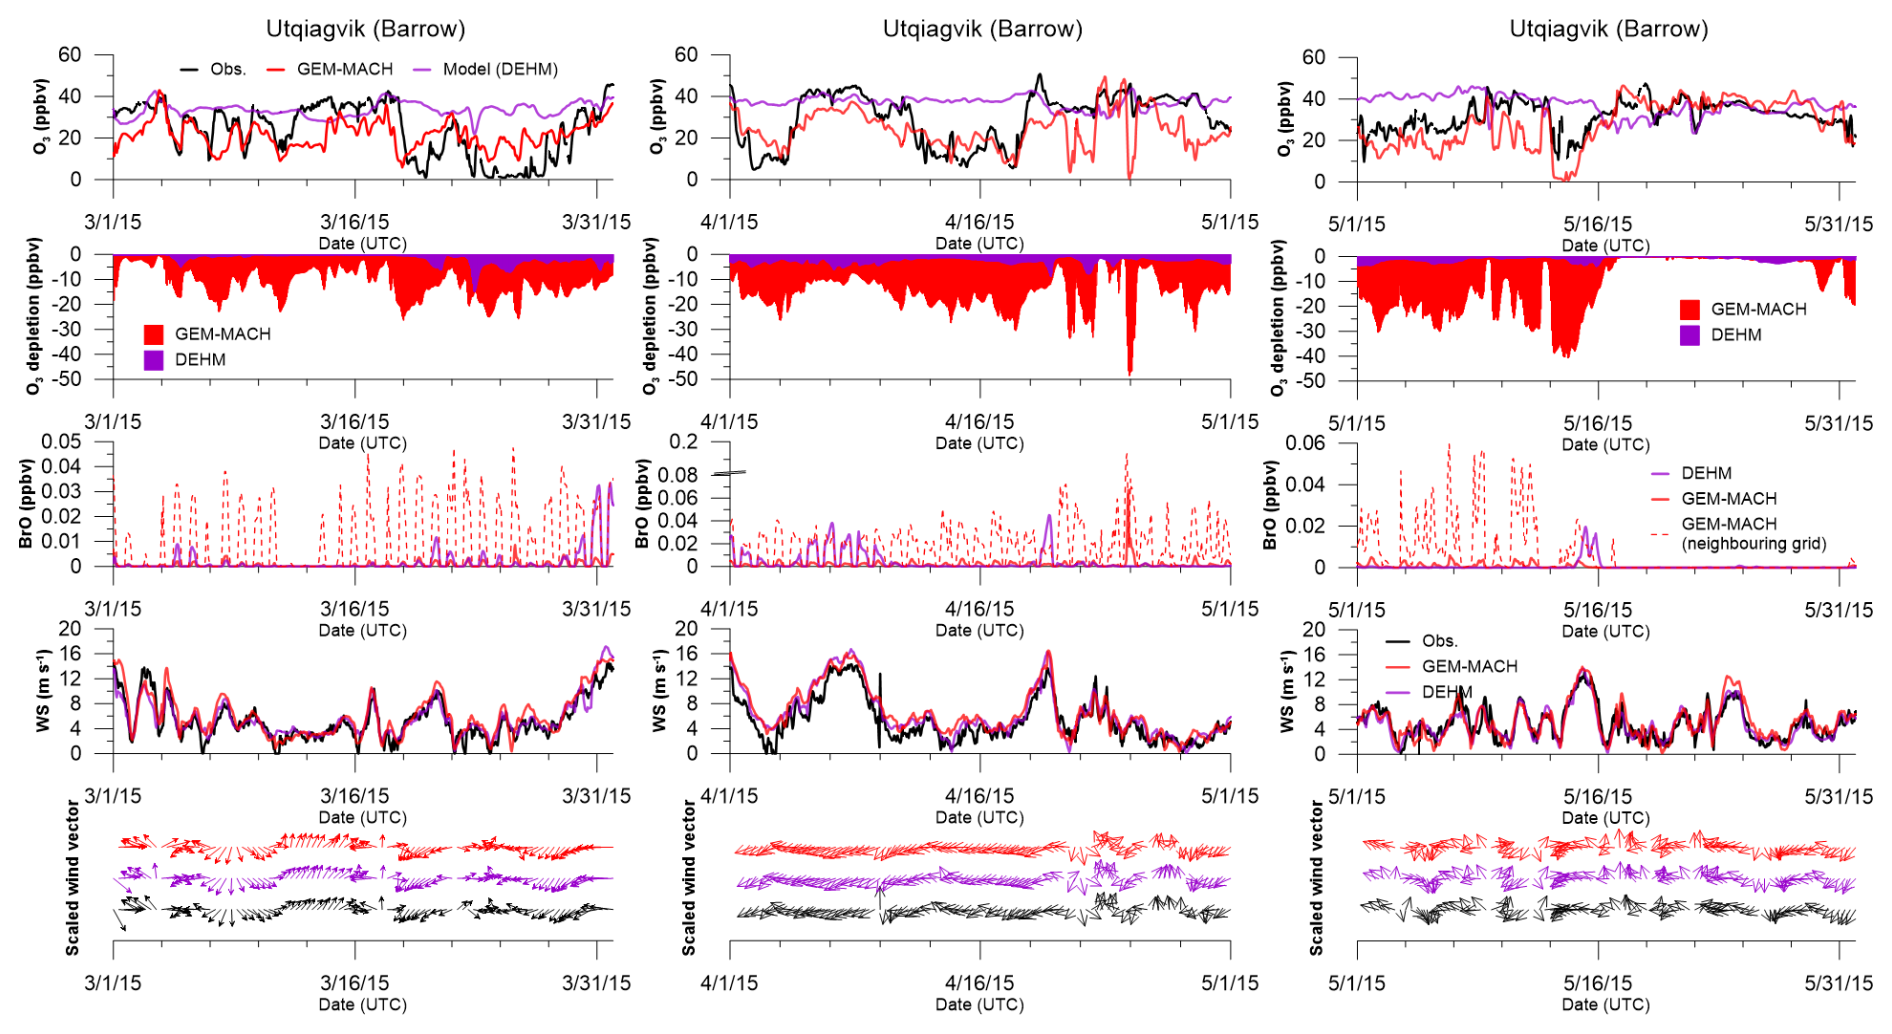
Figure 8Model simulated spring ODEs at the Utqiaġvik site for March (left panel), April (middle panel), and May (right panel). In each panel: top row – time series of modelled surface O3 (GEM-MACH in red and DEHM in purple) compared with observation (in black); second row: time series of modelled O3 deficit (depletion) due to bromine, or the difference between model-simulated surface O3 with snow-sourced bromine (i.e., snowpack-sourced bromine in the case of GEM-MACH, and blowing-snow-sourced bromine in the case of DEHM) and the model simulation without the snow-sourced bromine (red shade – GEM-MACH; purple shade – DEHM); third row: time series of the modelled surface BrO concentrations (red – GEM-MACH, purple – DEHM); fourth row: time series of the modelled and observed wind speed (black – observation, red – GEM-MACH, purple – DEHM); fifth (bottom) row: comparison of modelled and observed wind direction (shown as scaled vectors) (black – observation, red – GEM-MACH, purple – DEHM). The meteorological observation data at the Utqiaġvik site were collected by NOAA Global Monitoring Laboratory (GML) and obtained from https://gml.noaa.gov/data/data.php?site=brw (last access: 27 November 2024).
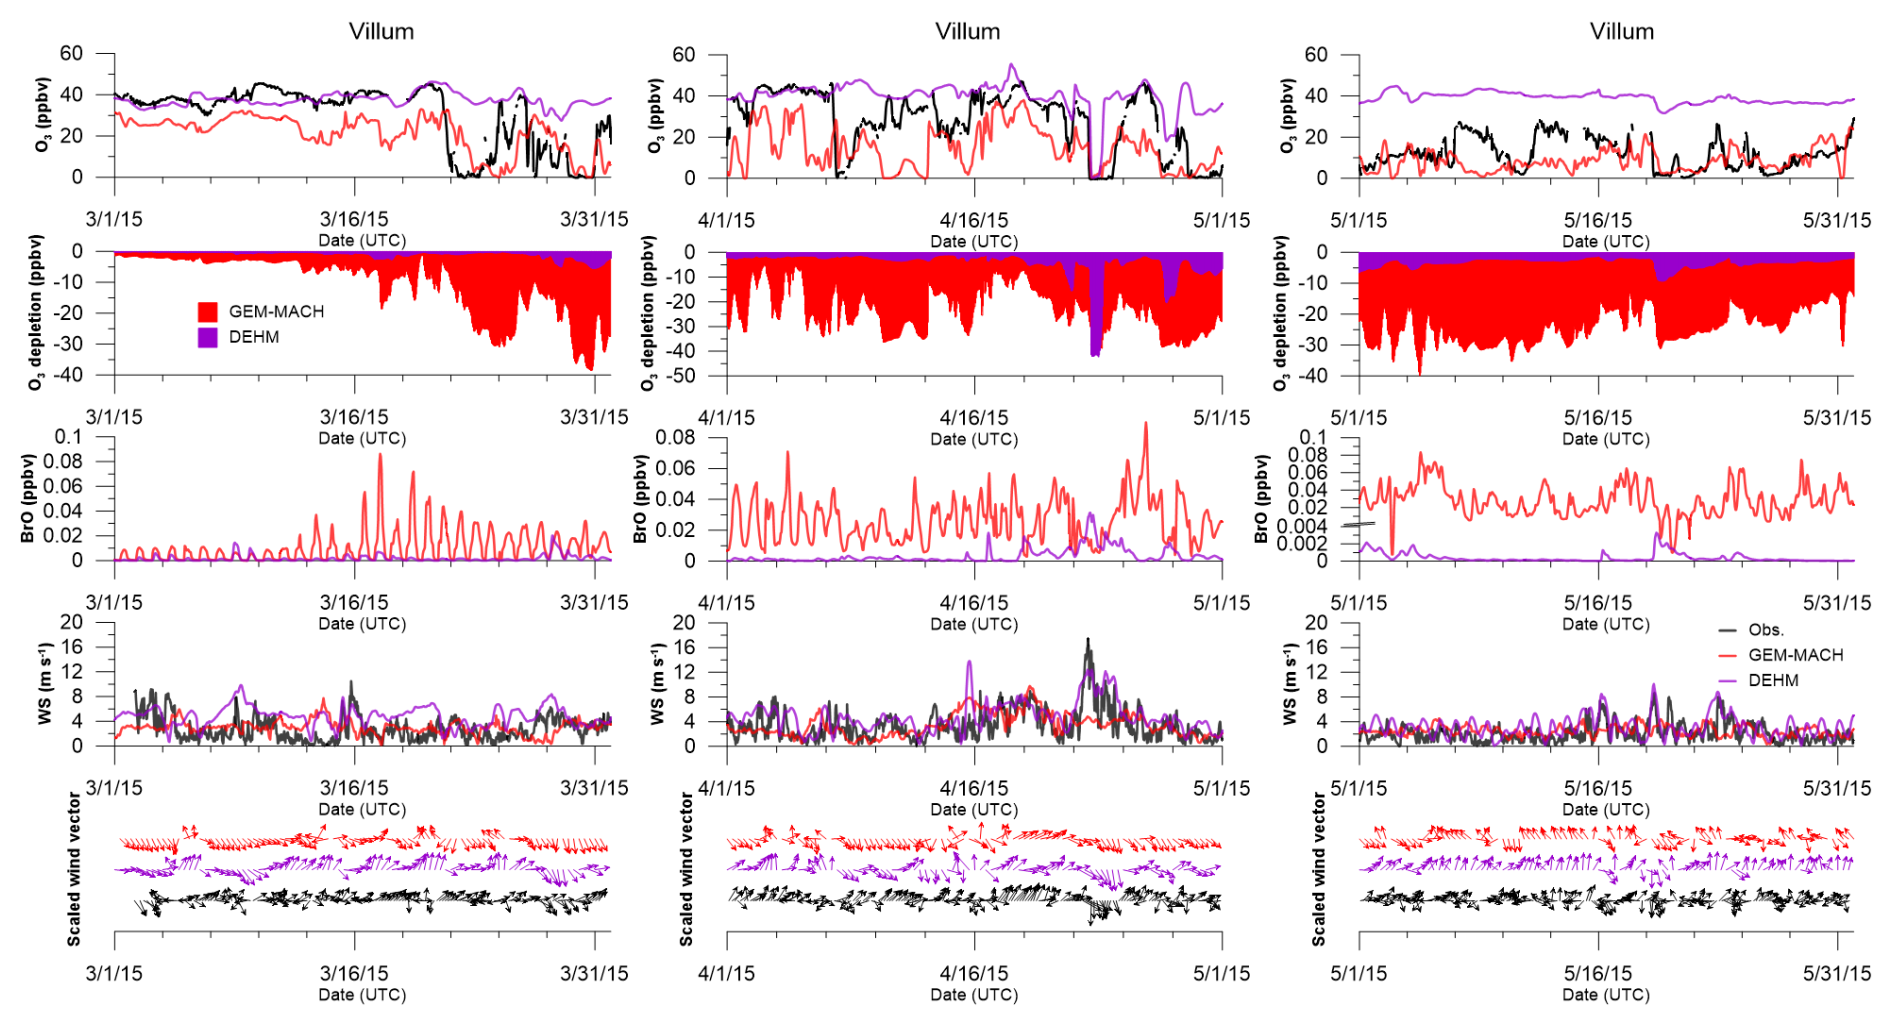
In Figs. 8 to 11, we examine model simulations of ODEs at the 4 coastal sites (Utqiaġvik, Villum, Tiksi, and Zeppelin) in more detail; these are the only Arctic coastal sites under the strong influence of ODEs with surface O3 data available for 2015. Included in Figs. 8 to 11 are the time series of observed and modelled (DEHM and GEM-MACH) surface O3 for March, April, and May. Along with the O3 time series are the modelled O3 deficit (or depletion) due to bromine chemistry (computed from the difference between the modelled surface O3 concentration with and without the snow-sourced bromine1), modelled surface BrO, and modelled and observed wind speed and direction at these sites. Note that the modelled O3 deficit (or depletion) due to bromine chemistry shown in Figs. 8–11 can be a result of the photochemical O3 loss having occurred either locally or regionally, i.e., transport of ozone-depleted air mass from elsewhere, and their combination. Similar to those reported previously, the observed ODEs at these coastal sites are highly variable with time and dependent on local and synoptic meteorological conditions that can promote or diminish the accumulation of O3-destroying bromine species sourced from the surface and can also facilitate the concentration recovery of O3 via vertical and horizontal air mass exchanges (Halfacre et al., 2014; Jacobi et al., 2010; Moore et al., 2014; Oltmans et al., 2012; Pernov et al., 2024; Simpson et al., 2007). Most of the ODEs observed at these Arctic sites occurred between mid-March and early June. There were a few brief episodes of depletion in early March observed at Utqiaġvik (Fig. 8) when surface O3 concentrations decreased by about 20 ppbv from the background level of 30–40 ppbv to about 10 ppbv, which may well be associated with bromine chemistry given its relatively southern location (71.32° N, hence having more than 10 h daylight by early March) (Frieß et al., 2011) and its proximity to FY sea ice. The release of reactive bromine from snowpacks at this location during early spring is supported by observations (e.g., Custard et al., 2017; Simpson et al., 2018). The GEM-MACH simulation was able to reproduce these episodes, while the DEHM simulation produced a minor depletion of an order of 5 ppbv (Fig. 8). Both model simulations showed the notable presence of BrO during this period, an indication of active bromine chemistry. Note that in Fig. 8 the GEM-MACH-simulated surface BrO from both the grid nearest to the Utqiaġvik site and a neighbouring grid (red dashed line) is plotted (third row). The lower BrO simulated at the Utqiaġvik grid (compared to the neighbouring grid) is due to the higher NO2 from local sources, which depletes BrO (to form BrONO2) efficiently. In contrast, Tiksi (Fig. 10) did not experience any significant depletion events until late March and into April (except for one event at the beginning of March that is captured by the GEM-MACH simulation), despite its relatively southern location (71.59° N). It is worth noting that the local winds at this site were predominantly south-westerly, i.e., from the land, over most of March, while during the months of April and May, the winds were relatively light and variable with a large onshore component (from the Arctic Ocean), coinciding with the observation of more frequent ODEs (Fig. 10). The close association between ODEs and onshore winds is evident at all three coastal sites shown in Figs. 8, 9, and 10, which is consistent with the finding from a recent observation-based analysis (Pernov et al., 2024). The Zeppelin site on Svalbard is at 474 m above sea level, and the observations at this site are less influenced by the surface and often representative of the air above the stable polar boundary layer above the ice-covered ocean (Dekhtyareva et al., 2018). Compared to other coastal surface sites, ODEs were observed less frequently during the spring O3 depletion season at this site (Fig. 11). The GEM-MACH model with a representation of snowpack bromine source mechanism (as described in Sect. 2.1.3) was able to simulate the observed ODEs reasonably well at each of the sites shown in Figs. 8 to 11. In comparison, DEHM with a representation of the blowing-snow sea salt bromine source mechanism (see Sect. 2.1.3) captured fewer ODEs and generally produced weaker ozone depletions, though it sometimes reproduced the ODEs reasonably well, such as at the Zeppelin site in April (Fig. 11). The DEHM-simulated ODEs (and the accompanied enhancements in surface BrO) are more episodic (short duration) and are often associated with high wind periods consistent with possible blowing-snow events. This is particularly evident at the Utqiaġvik and Villum sites (Figs. 8 and 9). On the other hand, while GEM-MACH generally simulated the observed ODEs at the Villum site well, reproducing the multiple ODEs over late March and April and the extended low O3 period (well below the background level) during the entire month of May, the modelled ODEs do not always temporally coincide with the observed ODEs. This can be linked to the poor agreement between the modelled and the observed wind at this site, which is particularly evident during the first half of April when the modelled and observed O3 time series are out of phase during the periods when the modelled wind directions are also out of phase with the observations, switching between onshore and offshore. The discrepancy between modelled and observed winds at this site appears to be largely due to the poor model representation of the local topography that is dominated by the Flade Isblink ice sheet south of Villum Research Station. It is worth noting that DEHM did capture a deep ODE at Villum on 23 April, though the duration of this modelled ODE is much shorter than the observed ODE. DEHM also captured a few ODEs observed at Zeppelin in late April. Overall, it seems that the inclusion of the snowpack-sourced bromine is more successful in simulating the spring Arctic ODEs, while the blowing-snow-sourced bromine alone is insufficient in reproducing the observed springtime ODEs in the Arctic. This is in line with the findings from recent studies (Huang et al., 2020; Marelle et al., 2021; Swanson et al., 2022). Swanson et al. (2022) compared their model simulations with only the snowpack bromine source mechanism and with both snowpack and blowing-snow bromine sources and found that, while both sources are needed for simulating the springtime ODEs in their study, the snowpack-sourced bromine plays a major role. This is perhaps understandable, as the snowpack bromine source mechanism triggered by the dry deposition of O3, HOBr, and BrONO2 can be sustained continually under a variety of meteorological conditions, while the blowing-snow bromine source mechanism triggered by high wind conditions tends to be more episodic. Indeed, both Halfacre et al. (2014) and Pernov et al. (2024) have found that the ODEs observed in the Arctic tend to be more associated with calm wind conditions and a stable boundary layer.
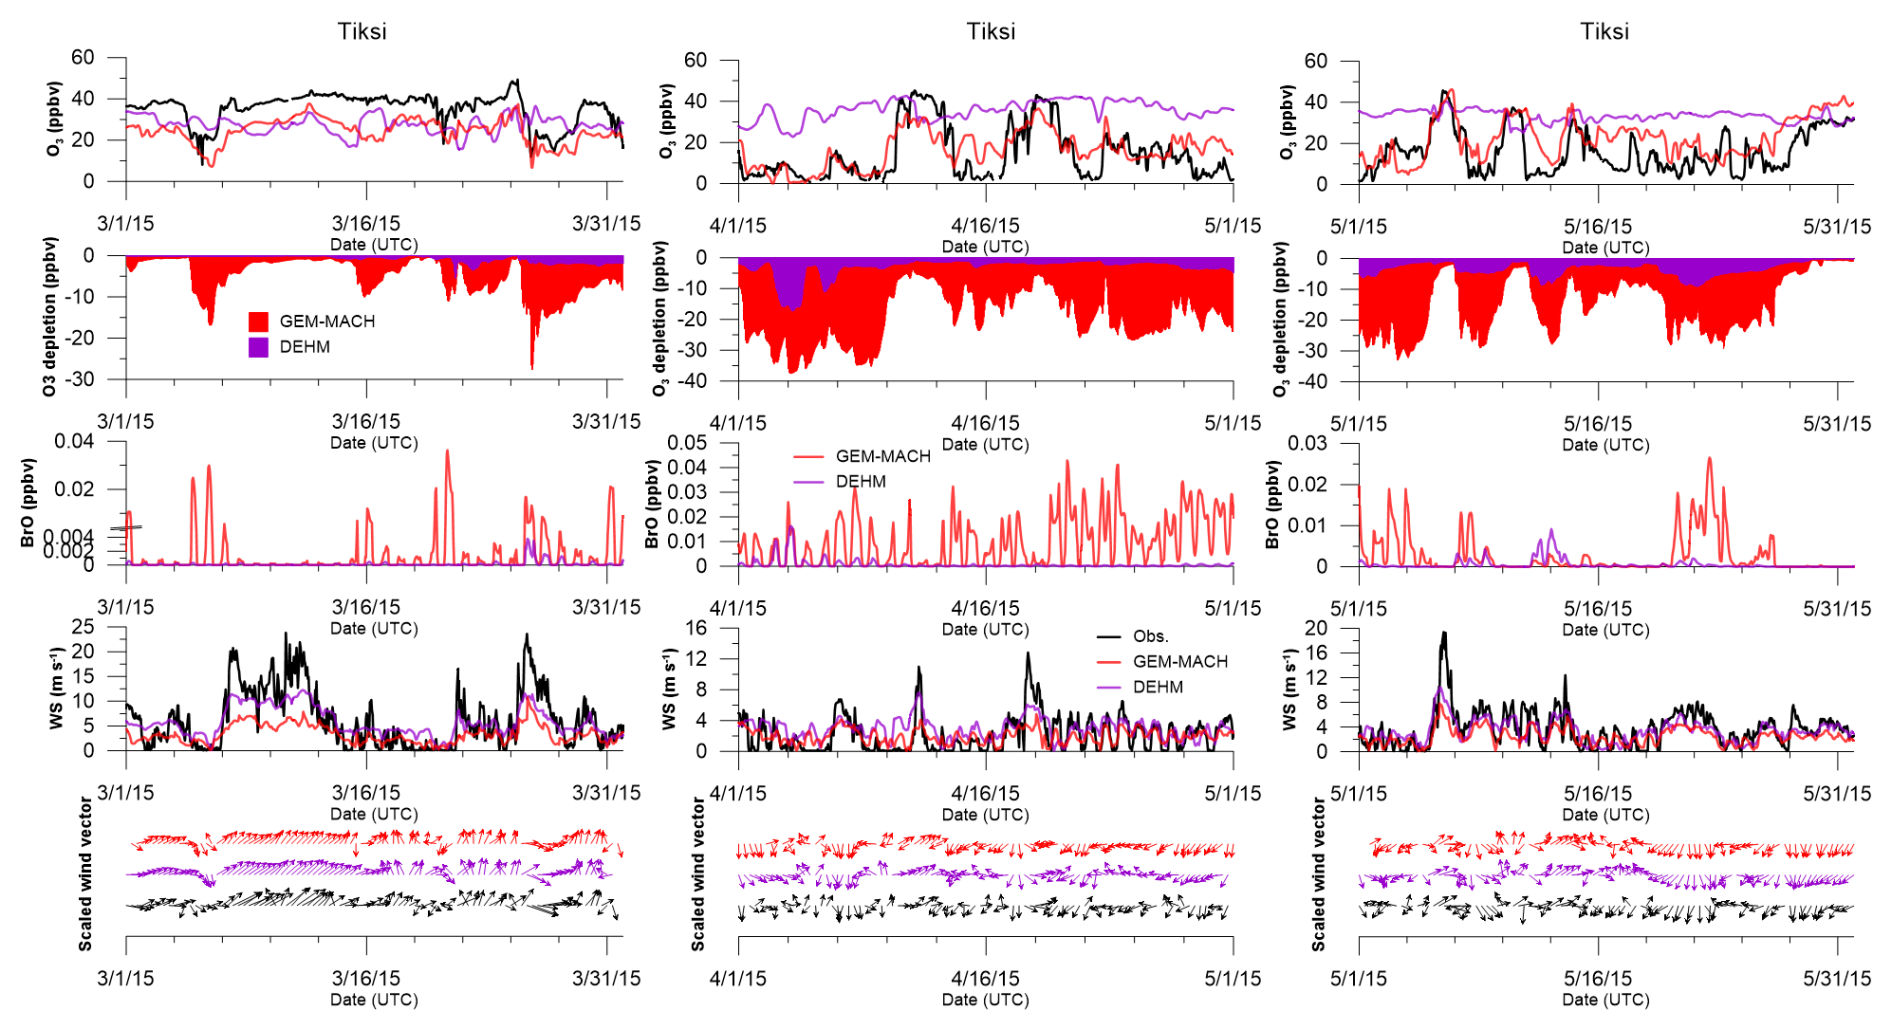
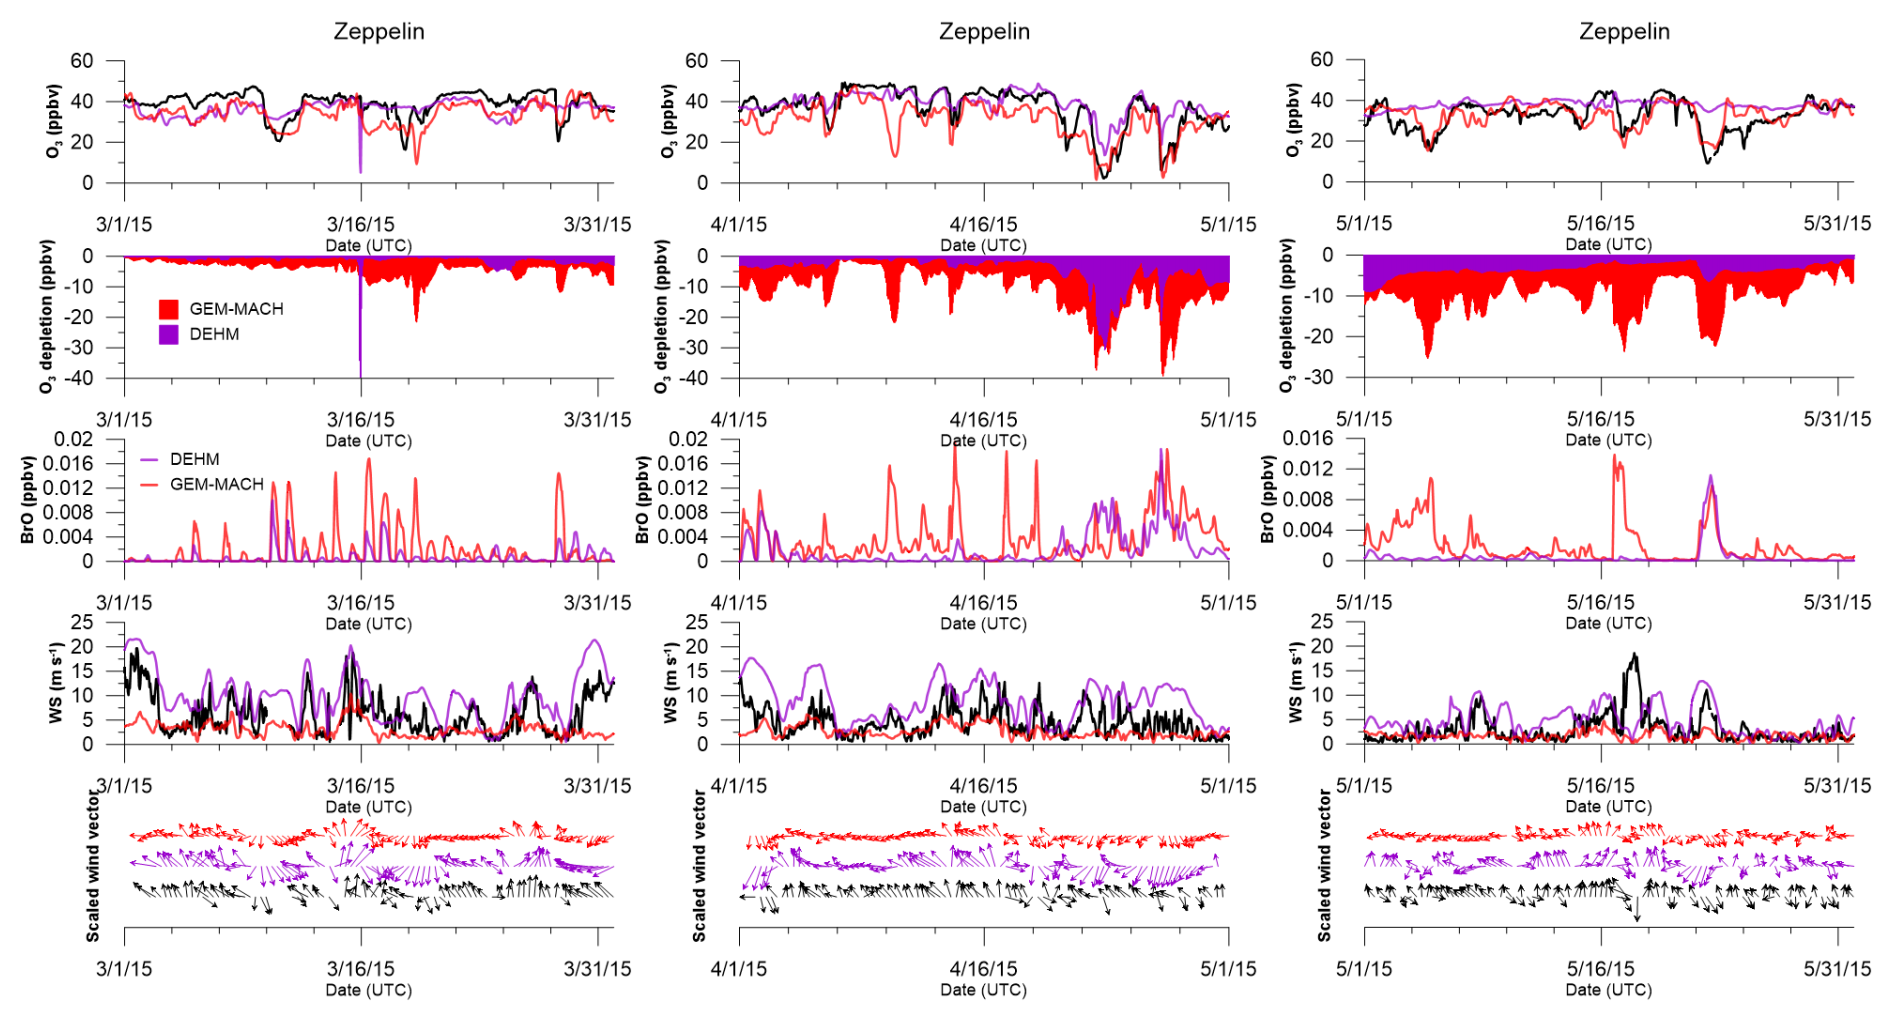
While there are relatively abundant surface observations of the Arctic springtime ODEs from the ground-based monitoring sites and mobile platforms (e.g., buoys and research vessels) in the Arctic Ocean (Bottenheim et al., 2009), observations on the vertical structure of ODEs are relatively scarce. Using a differential absorption lidar, Seabrook et al. (2011) observed the vertical structure of springtime ODEs over the Arctic Ocean off the south coast of Banks Island. They found that the observed ODEs were largely confined within the lowest 200–600 m of the atmosphere and were associated with air masses being in contact with sea ice for an extended period of time. Oltmans et al. (2012) analyzed the vertical profiles from the near-daily ozonesonde measurements conducted during 2008 and 2009 spring periods at Barrow (Utqiaġvik) and found that the depletion was confined to approximately the lowest 1000 m, with an average height of the top of the layer at ∼ 500 m.
During the 2015 NETCARE spring field campaign, O3 measurements were made on board the Alfred Wegener Institute Polar-6 aircraft. Figure 12 shows the ozone vertical profiles taken by the aircraft during the 2015 NETCARE field campaign over the Canadian archipelago (around Ellesmere Island over an ice-covered sea surface) along with the modelled profiles (from GEM-MACH and DEHM) extracted at the flight profiling location and time. Also included are the modelled profiles from the runs with the snow-sourced bromine emissions turned off. The segments of the flight tracks during profiling are shown in the inserted map. A shallow ozone depletion layer, with depth ranging between about 500 m and about 1 km can be seen from the profiles taken over the Arctic Ocean off the west side of Ellesmere Island (2015-04-07, 2015-04-08_2, 2015-04-11_2, and 2015-04-13_2). The profiles taken over the Nares Strait (2015-04-08_1 and 2015-04-09) and over Ellesmere Island (2015-04-10 and 2015-04-11_1) all show a deeper layer, ∼ 2 km, of depleted O3, likely due to transport and vertical mixing of the near-surface bromine-mediated O3 depletion. In particular, over the interior of Ellesmere Island, a much deeper layer, up to 4 km, can be impacted by the ODEs due to enhanced mixing (comparing between the model-simulated O3 profiles with and without bromine corresponding to the flight on 10 April). As shown, the GEM-MACH simulation with snowpack-sourced bromine was able to simulate the vertical structure of the depletion layer reasonably well. There are cases where the model was not able to fully simulate the observed depletion close to the surface (e.g., 2015-04-07, 2015-04-08_2, and 2015-04-10), which may be attributable, at least in part, to model resolution (15 km) and the very shallow mixing height of the Arctic atmosphere (e.g., Gryning et al., 2023). Brockway et al. (2024) describe that BrO (and thus reactive bromine that depleted O3) over the Alaska North Slope region and over the Beaufort Sea snow-covered sea ice occurred in a shallow, very stable boundary layer up to just a few hundred metres. Occasionally they observed some lofted bromine, but mostly that was below 300 m. The DEHM simulation with the blowing-snow-sourced bromine was not able to reproduce the observed near-surface depletion, although for several flights (e.g., 2015-04-10, 2015-04-11_1, 2015-04-11_2, and 2015-04-13_2), the DEHM simulations do show some modest ozone loss from the blowing-snow-sourced bromine (comparing the two DEHM runs with and without the blowing-snow bromine). It is interesting to notice that the DEHM-simulated vertical O3 profiles are in close agreement with the GEM-MACH-simulated O3 vertical profiles without bromine, and all the modelled profiles are in reasonably good agreement with the observed profiles above the atmospheric boundary layer, within the lowest 5 km.
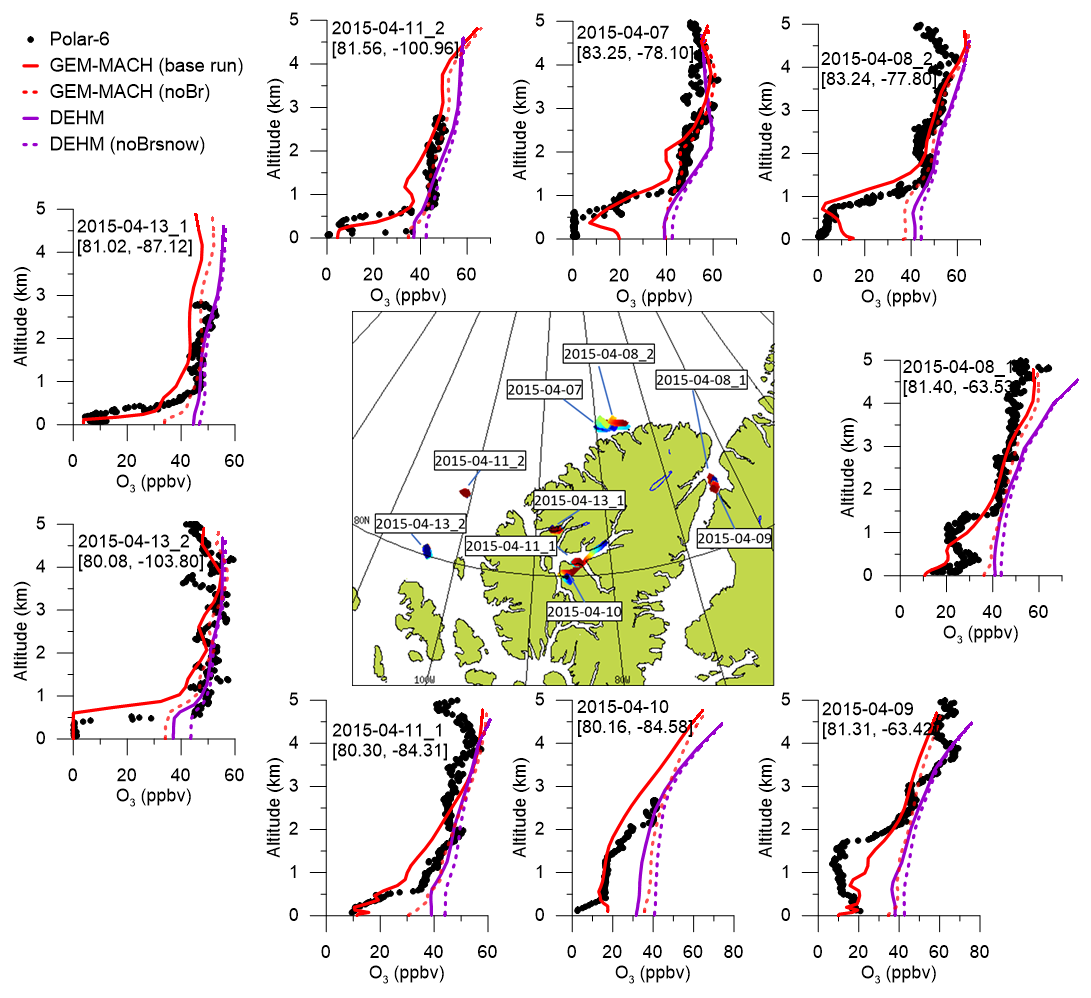
Figure 12Modelled ozone profiles compared to observations from the Polar-6 flights conducted during the 2015 NETCARE spring campaign around Ellesmere Island, Canada, in April 2015: observations (black dots), GEM-MACH in red, DEHM in purple. Also plotted are modelled profiles from the no-bromine GEM-MACH run (red dashed lines) and from the DEHM run with blowing-snow bromine turned off (dashed purple lines). Model profiles were extracted from the grid containing the average lat–long locations of the aircraft profiling flight segment.
To evaluate the modelled bromine levels, the modelled bromine monoxide vertical column densities (BrO VCDs) are compared to the MAX-DOAS measurements available at the Utqiaġvik site and on O-buoy 10, 11, and 12 during spring 2015. Figure 13 shows the comparison in terms of monthly statistics while the hourly time series comparisons are shown in the Supplement (Fig. S6). The monthly stats for both measured and modelled BrO VCDs were calculated based on the data entries with available measurement. The difference between the two modelled BrO fields is largely due to the bromine sources considered in each model, i.e., snowpack-sourced bromine (based on Toyota et al., 2011) in GEM-MACH and open-ocean- and blowing-snow-sourced bromine (based on Yang et al., 2010) in DEHM. At the Utqiaġvik site, the monthly BrO VCDs simulated with the snowpack-sourced bromine (GEM-MACH) tracked the MAX-DOAS measurement well over the period when the measurement was available (21 February to 10 June 2015). The modelled monthly BrO VCDs with open-ocean- and blowing-snow-sourced bromine (DEHM) were considerably lower than the measurements for the month of March and April. The MAX-DOAS measurements on O-buoys were available for much shorter periods in 2015, 21–10 June for O-buoy 10 and 11 and 21 April–22 May for O-buoy 12. The GEM-MACH-simulated monthly BrO VCDs with the snowpack-sourced bromine were considerably higher than the measured BrO VCDs on Buoy 10 in April, mostly driven by an event at the beginning of the measurement period (Fig. S6). On the other hand, the DEHM-simulated BrO VCDs with open-ocean- and blowing-snow-sourced bromine were significantly lower than the measurements on the buoys. These findings are consistent with the results from Swanson et al. (2022) where simulations using the GEOS-Chem model were conducted for a 10-month period (March–November) in 2015 with different snow-sourced bromine mechanisms (i.e., snowpack and/or blowing snow). The DEHM-simulated BrO VCDs are comparable to those from the Swanson et al. simulation with the blowing-snow bromine mechanism alone (their “BLOW” run). Their study also showed much higher BrO VCDs obtained from the simulations with the snowpack bromine mechanism alone (their “PACK” and “PHOTOPACK” runs, the latter considering an enhanced bromine molar yield from snowpack upon O3 deposition under sunlit conditions as in Toyota et al., 2011) compared to that with the blowing-snow mechanism alone. The comparison between the GEM-MACH-simulated BrO VCDs from this study with those from Swanson et al. (2022) snowpack-only simulations varies. For example, the GEM-MACH-simulated BrO VCDs compared well with the MAX-DOAS measurement at Utqiaġvik, while both simulations with snowpack-sourced mechanism (“PACK” and “PHOTOPACK”) from Swanson et al. (2022) produced much higher BrO VCDs than the measurement, particularly from the run with enhanced bromine molar yield for sunlit conditions (“PHOTOPACK”). On the other hand, the GEM-MACH-simulated BrO VCDs at the buoy locations are more comparable to those from the two snowpack runs in Swanson et al. (2022). This is partly due to the parameters selected (e.g., the bromine molar yields; see Sect. 2.1.3) for the snowpack bromine source mechanism in the different studies. Also worth mentioning is the dependency of bromine production on O3 deposition in the snowpack bromine source mechanism of Toyota et al. (2011). GEM-MACH employs a reduced O3 dry deposition velocity over ice and snow surfaces, 0.01 cm s−1 (following Helmig et al., 2007), while a much higher O3 dry deposition velocity over the Arctic sea ice, between 0.02 and 0.1 cm s−1, was used in Swanson et al. (2022). The uncertainty in the parameterization of the snowpack bromine source mechanism is examined next.
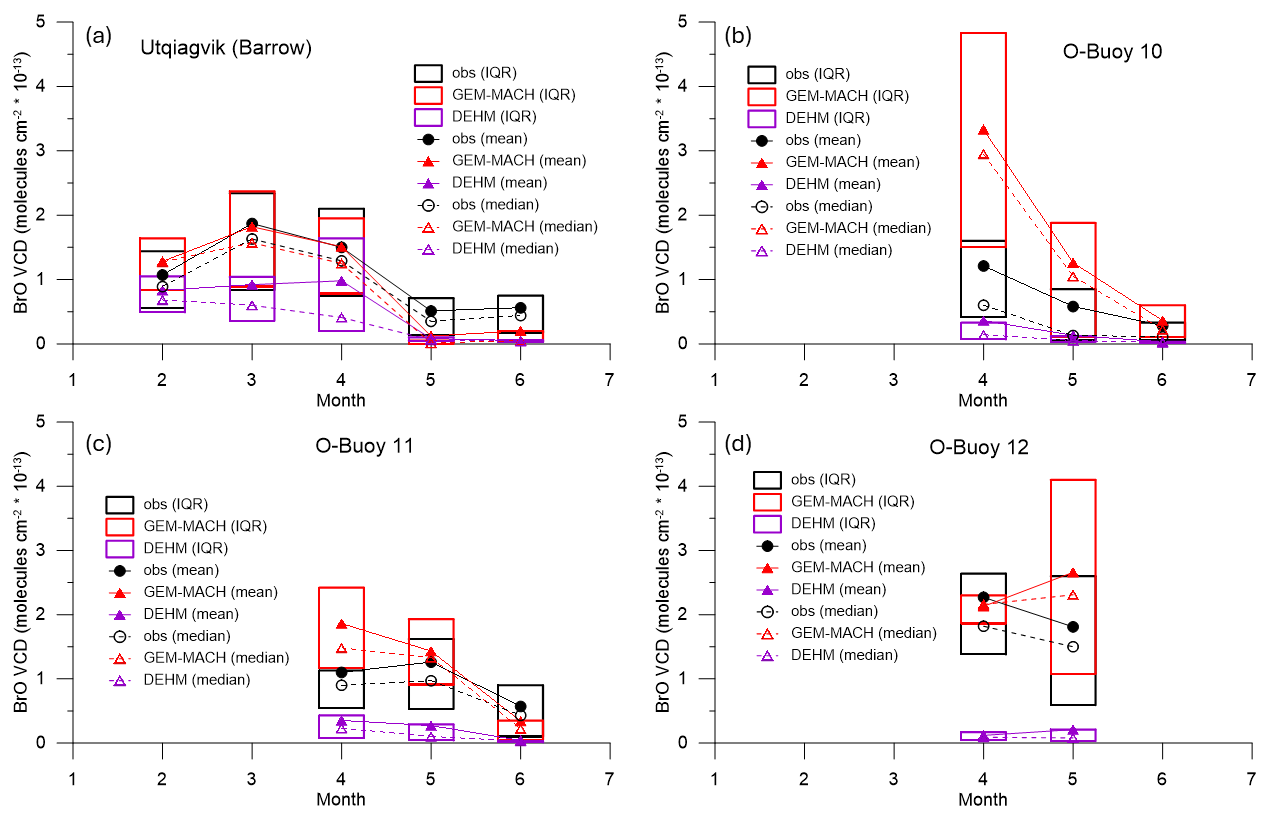
Figure 13Comparison of modelled and measured (MAX-DOAS) monthly BrO VCDs (molecules cm−2) at Utqiaġvik (a) and O-buoy locations (b, c, d); observations in black, GEM-MACH (from snowpack-sourced bromine) in red, and DEHM (from open-ocean and blowing-snow sea-salt-sourced bromine) in purple; boxes are inter-quartile range (IQR).
The current model representations of bromine source mechanisms are highly parameterized, and there are large uncertainties in some of the parameters employed by these parameterizations due to a lack of constraints by available lab or field experiments. Some of the studies adopting the approach of Toyota et al. (2011) for the snowpack bromine source mechanism have chosen parameters in variation to those recommended by Toyota et al. (2011). For example, Swanson et al. (2022) chose to make no distinction between FY and MY sea ice in treating snowpack Br2 production. Herrmann et al. (2021) considered an enhancement factor β (≥ 1.0), to account for non-flat surfaces such as ice or snow and frost flowers, in computing fluxes from Br2 surface production. As mentioned in Sect. 2.1.3, in this study, the molar yields for Br2 production from snowpacks over FY and MY sea ice upon dry deposition of O3 (Φ1) were set at 0.15 and 0.075, respectively, under sunlit conditions, and at 0.01 and 0.005, respectively, under dark conditions in the GEM-MACH simulation presented so far. These are larger than the original values used in Toyota et al. (2011). They were chosen to partly compensate for the possible under-representation of the Br2 production from reactive bromine cycling via aerosol heterogeneous chemistry due to under-predicted Arctic haze aerosols in the model (see Gong et al., 2024). To explore the sensitivity to the Br2 molar yields associated with O3 dry deposition on snowpacks (Φ1) and the role of reactive bromine cycling through aerosol heterogeneous chemistry, two additional sensitivity runs with GEM-MACH were conducted for the spring period (February to May, where February was a spin-up period). The parameter settings for various GEM-MACH runs are specified in Table 3.
Table 3Parameter settings for the GEM-MACH simulations related to Br2 production (FYI → first-year ice; MYI → multi-year ice).
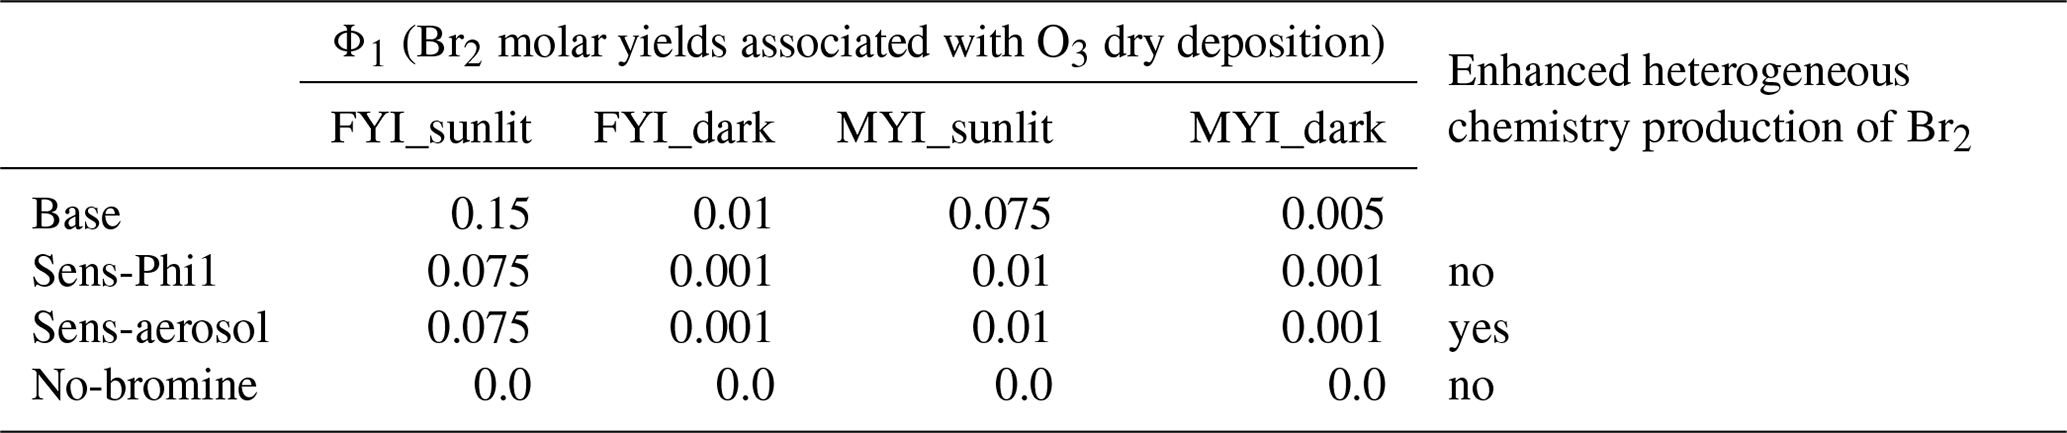
Figure 14 shows the modelled O3 time series from the various GEM-MACH simulations compared to observations at three coastal sites that were most impacted by ODEs (Utqiaġvik, Villum, and Tiksi) as well at O-buoy 11 (the only buoy with observations during the entire spring O3 depletion season); plots for additional sites are included in the Supplement (Fig. S7). The Sens-Phi1 run used the molar yields Φ1 close to the values recommended by Toyota et al. (2011), i.e., 0.075 and 0.001 for FYI, under sunlit and dark conditions, respectively. For MYI the molar yields Φ1 were set at 0.01 and 0.001, respectively for sunlit and dark conditions, as opposed to zero in Toyota et al. (2011). As shown in Fig. 14, the model-simulated ODEs are weaker in this case than those simulated from the base run, most significantly during March, the early stage of the O3 depletion period (e.g., O-buoy 11, Utqiaġvik, and Tiksi in Fig. 11; O-buoy 12, Alert, and Eureka in Fig. S7). In the Sens-aerosol run, the molar yields (Φ1) were kept the same as in Sens-Phi1, but the aerosol heterogeneous reaction rates were enhanced by doubling the total aerosol surface area (considering the model under-prediction of Arctic haze aerosols, as mentioned above) to illustrate the role of reactive bromine cycling through heterogeneous chemistry on aerosol surfaces. The enhanced aerosol heterogeneous chemistry (via the artificially increased aerosol loading) resulted in generally stronger model-simulated ODEs than those from the Sens-Phi1 run shown in Figs. 14 and S7, with somewhat more significant enhancements in the modelled ODEs mostly during mid-April to mid-May (though at Tiksi, the most significant impact from aerosol heterogeneous chemistry is seen during an extended depletion event in the beginning of April). However, the impact of the enhanced aerosol heterogeneous reaction on surface ODEs seems to be rather limited during the initial stages of the depletion season (March).
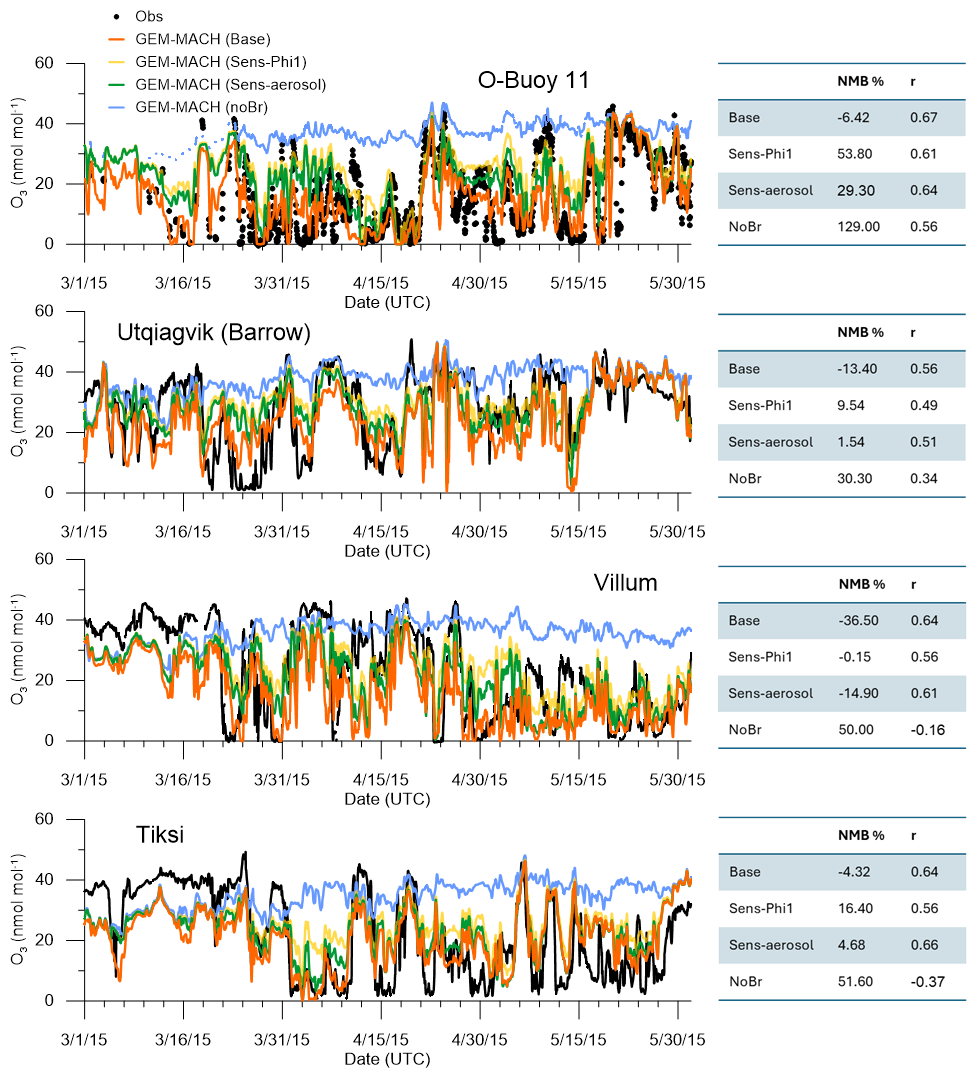
Figure 14GEM-MACH-simulated O3 time series from the base (orange) and sensitivity runs, Sens-Phi1 (yellow) and Sens-aerosol (green), compared with observations (black) over Beaufort Sea (O-buoy 11) and at coastal sites: Utqiaġvik, Villum, and Tiksi. Also plotted are the modelled O3 time series from the No-bromine run (blue).
The comparative roles of snowpack Br2 emission and the Br2 production through aerosol heterogeneous chemistry on ODEs are examined here. Figure 15 compares the modelled monthly averaged daily snowpack Br2 flux and the daily Br2 production from aerosol heterogeneous chemistry, both in moles per m2 (per day), in the lowest 200, 500, and 1000 m of air from the three GEM-MACH runs (Base, Sens-Phi1, and Sens-aerosol) for March 2015. The same plots for April and May are included in the Supplement (Figs. S8 and S9). For the Base run, the March-averaged daily snowpack Br2 flux is mostly distributed along the coastlines over FY sea ice. Comparing the Br2 productions from snowpacks and through heterogeneous chemistry on aerosol surfaces, the former (snowpack production) is greater than the latter (aerosol surface chemistry) over the lowest 200 m of the atmospheric column, while for the increased column extent of over the lowest 500 m and 1 km layers, the latter becomes greater. It is particularly noticeable that the atmospheric Br2 production through the heterogeneous reaction spreads much more widely over the Arctic compared to the snowpack fluxes of Br2. With the reduced molar yields associated with O3 dry deposition (Φ1) in Sens-Phi1, the Br2 production from the snowpacks is reduced significantly; the production through aerosol heterogeneous reaction is also reduced as a result of reduced bromine oxidation products (HBr, HOBr, and BrONO2) in the air. The snowpack Br2 flux is further reduced in the Sens-aerosol run, compared to the Sens-Phi1 run, due to reduced O3 deposition (resulting from enhanced ODEs), while the production of Br2 in the atmosphere is increased from the enhanced heterogeneous reaction rate (through the doubling of aerosol surface area). By May, the atmospheric Br2 production through heterogeneous reactions from the Sens-aerosol run exceeds that from the Base run (see Fig. S9). Figure 16 shows the time series of the pan-Arctic (> 66.5° N) integrated daily snowpack Br2 production and the Br2 production through aerosol heterogeneous reactions from the three GEM-MACH runs (top two panels in Fig. 16). The reduction in snowpack production of Br2 from the lower Φ1 values in Sens-Phi1 is largest at the beginning of March, and the difference between the Sens-Phi1 and Base runs in snowpack Br2 production reduces gradually over time (particularly after April). In contrast, the increase in the atmospheric production of Br2 due to enhanced heterogeneous reactions in the Sens-aerosol run (as compared to the Sens-Phi1 run) starts small at the beginning of March but gradually increases with time to exceed the atmospheric production in the Base run by mid-April. This contrast is better illustrated from the bottom panel of Fig. 16, showing the difference in snowpack Br2 production in response to the change in snowpack bromine yield from O3 dry deposition (Φ1; Base − Sens-Phi1) and the difference in atmospheric Br2 production (via aerosol heterogeneous reactions) in response to the change in aerosol surface area (Sens-aerosol − Sens-Phi1). The gradual increase in atmospheric production of Br2 (via aerosol heterogeneous reactions) over March and April may reflect the gradual increase in photolysis and photochemical reactivity over the central Arctic during this time (polar sunrise).
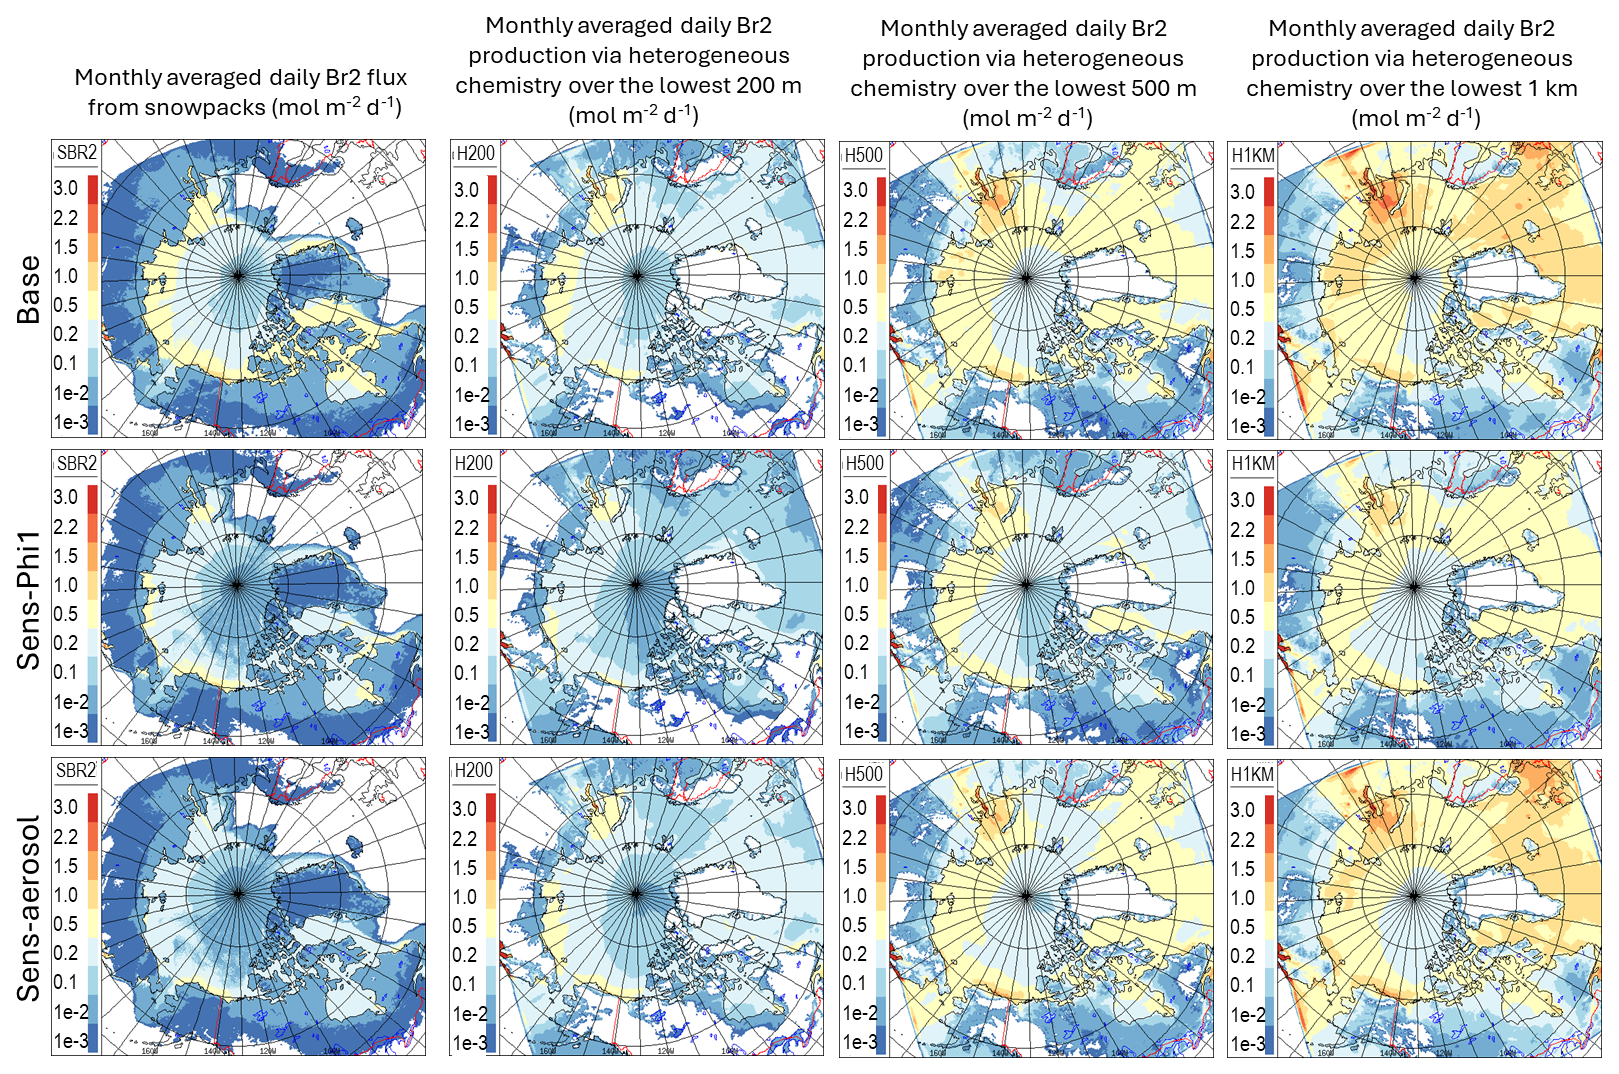
Figure 15GEM-MACH-modelled monthly mean (March 2015) Br2 daily flux from snowpacks (leftmost column; SBR2) and Br2 daily production from aerosol heterogeneous reaction over the lowest 200 m (second column from left; H200), the lowest 500 m (third column from left; H500), and the lowest 1 km (rightmost column; H1KM), all in moles m−2 d−1, from the base (top), Sens-Phi1 (middle), and Sens-aerosol runs (bottom).
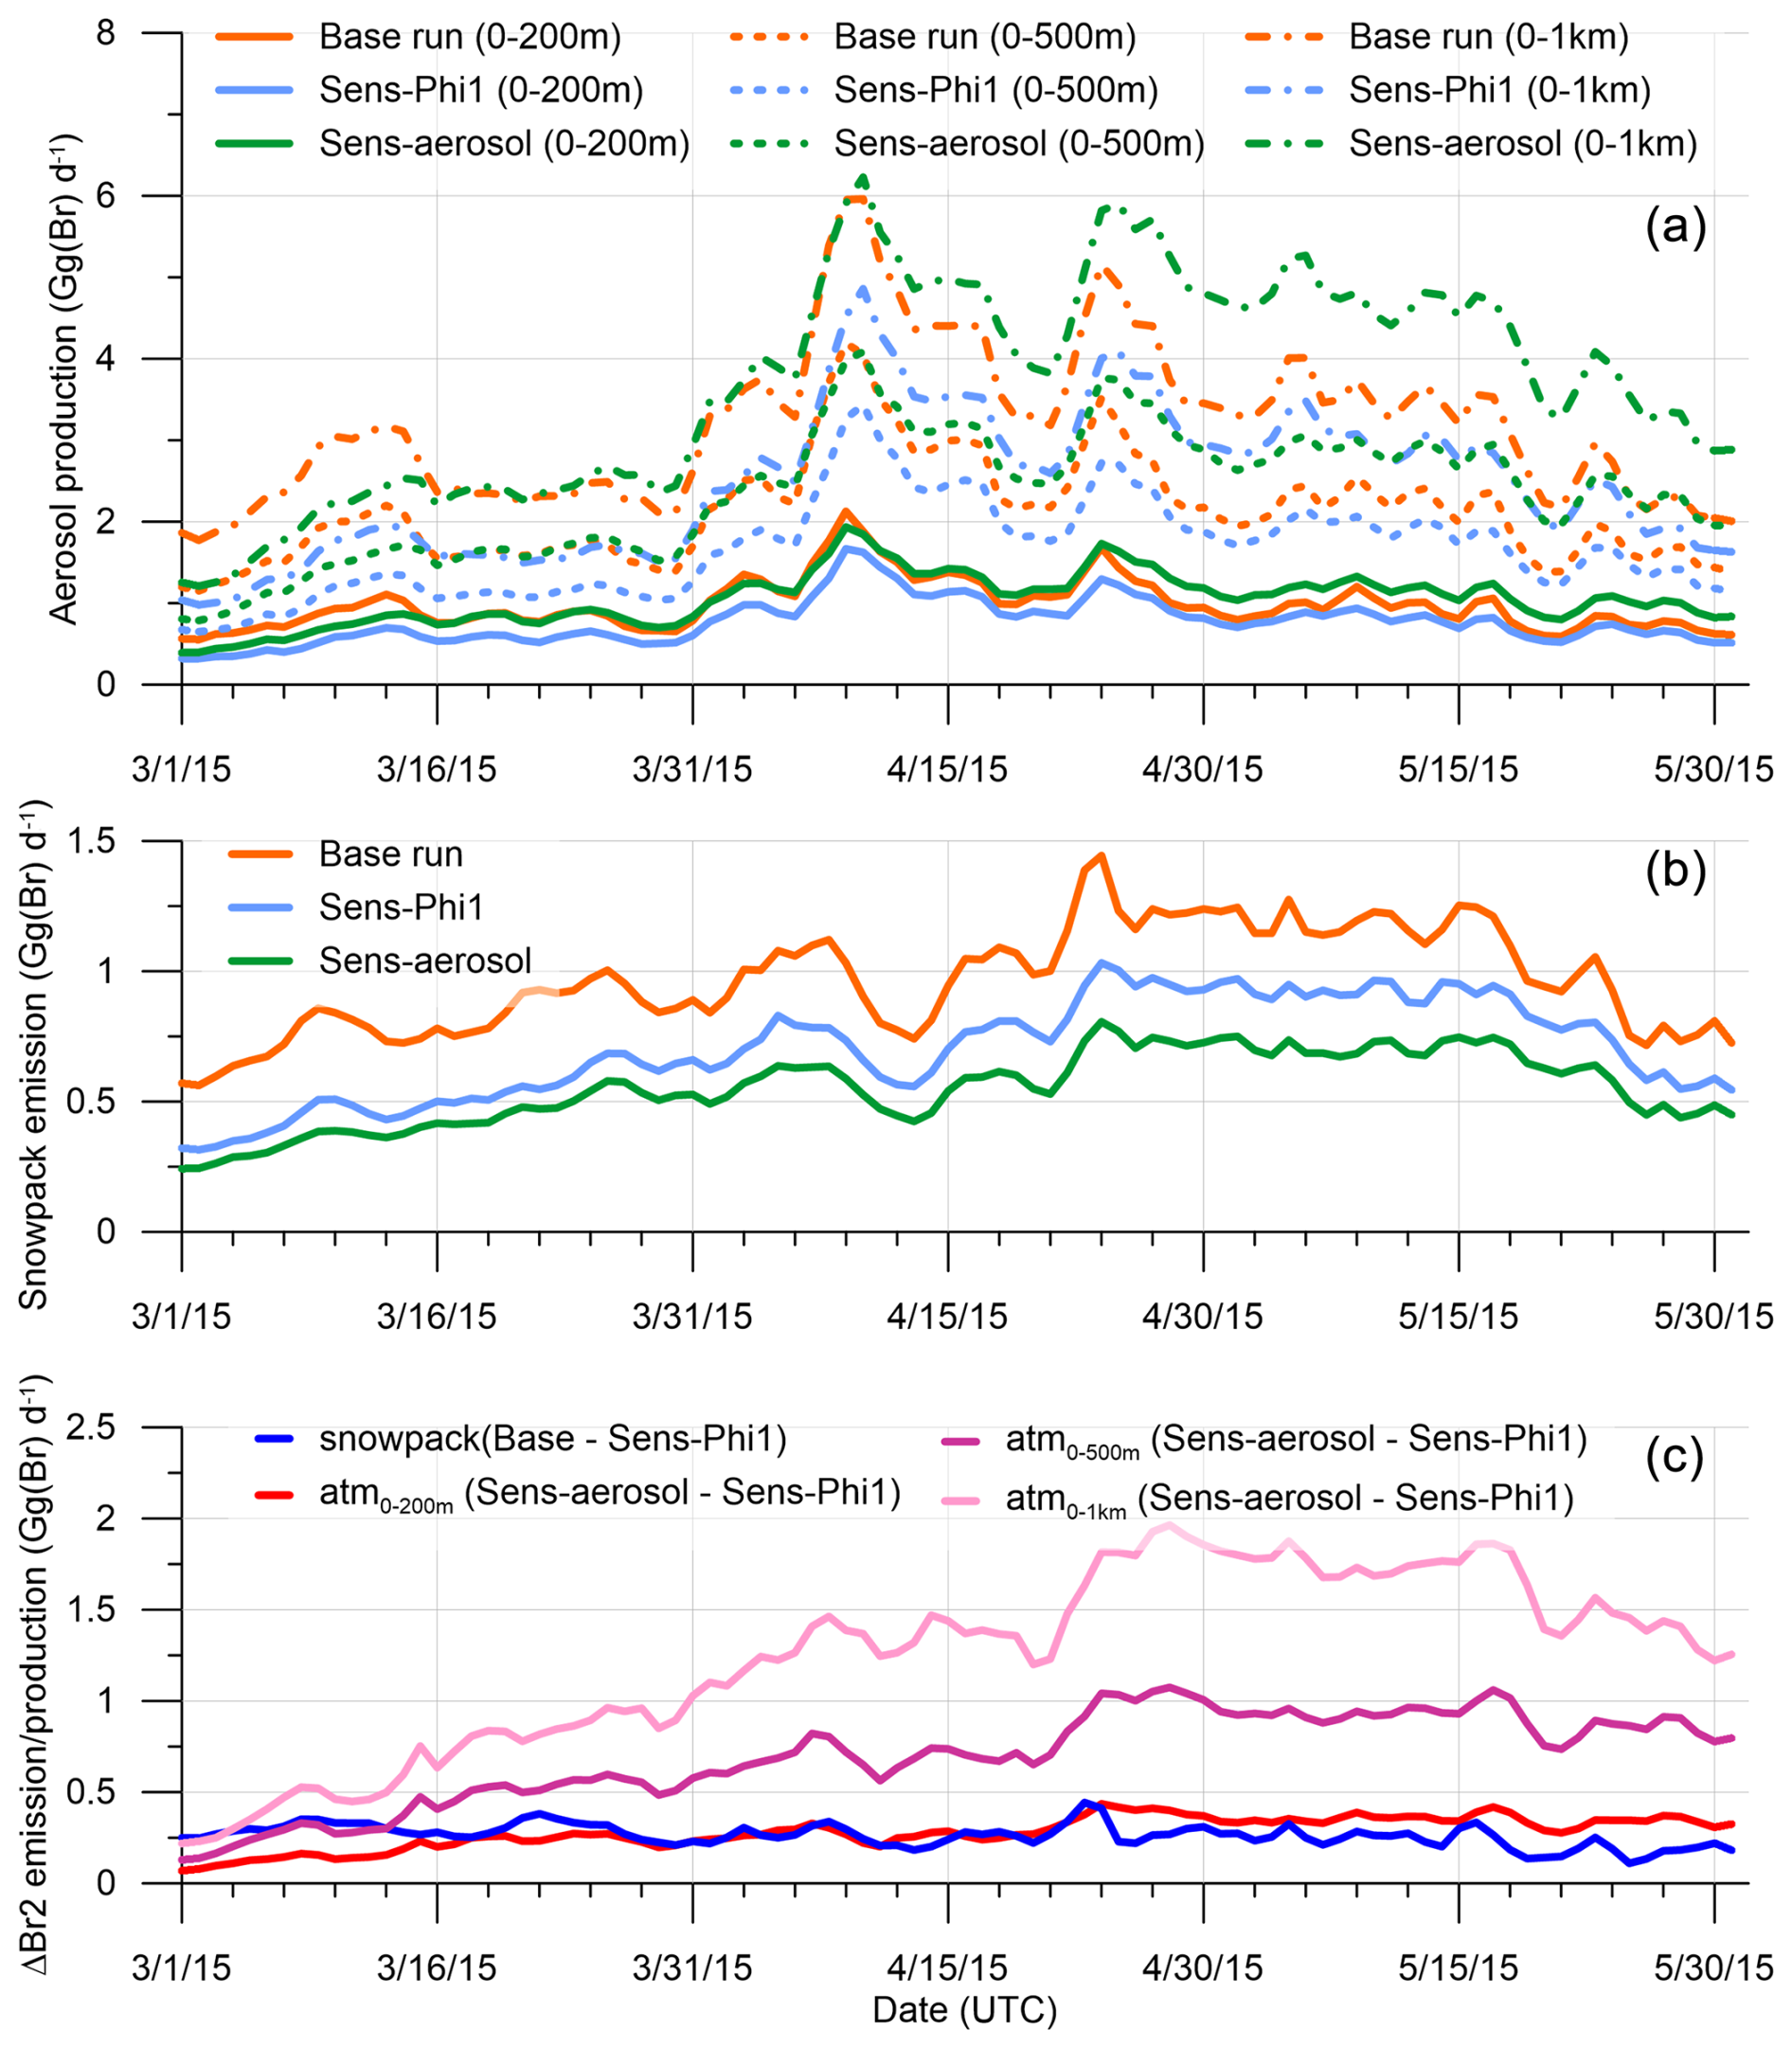
Figure 16Pan-Arctic (> 66.5° N) integrated Br2 production from aerosol heterogeneous reactions (a) and from snowpacks (b) from GEM-MACH runs (Base, Sens-Phi1, and Sens-aerosol) during spring (March to May). Panel (c) shows the sensitivity of Br2 productions to snowpack bromine yield upon O3 dry deposition (Φ1: Base – Sens-Phi1) and to atmospheric reactive bromine cycling via aerosol heterogeneous reactions (Sens-aerosol – Sens-Phi1).
We examine the pan-Arctic O3 loss from bromine chemistry and its sensitivity to the snowpack and atmospheric production of Br2 in Fig. 17. The bromine-induced O3 loss (negative) is derived by subtracting the net O3 production in the No-bromine run from those in the three runs with bromine, i.e., Base, Sens-Phi1, and Sens-aerosol runs, respectively. Figure 17a shows that the largest O3 loss (or O3 depletion) from bromine explosions happens within the lowest 200 m layer, followed by the 200–500 m layer. The O3 loss associated with bromine above 1 km contributes insignificantly to Arctic ODEs. Figure 17b further illustrates the comparative impact of snowpack production of Br2 and the atmospheric production of Br2 from reactive bromine cycling through heterogeneous reactions on aerosol surfaces. The reduced O3 loss (or increase in O3) from the lower molar yields associated with O3 dry deposition on snowpacks in Sens-Phi1 is also most significant within the lowest 200 m of the air; its impact decreases with height. In contrast, the enhanced heterogeneous chemistry reactions (via doubling the aerosol surface area) in Sens-aerosol only have a relatively modest impact on the O3 loss in the lower atmosphere and are comparable initially at 0–200 and 200–500 m. The impact increases with time, and, by April, the most significant impact on O3 loss due to enhanced heterogeneous reactions is found in the 200–500 m layer followed by the 500 m–1 km layer. Overall, the bromine-induced O3 loss seems to be more sensitive to the snowpack production of Br2 than its atmospheric production via heterogeneous chemistry on aerosols. It is worth pointing out that the Br2 produced through the heterogeneous reactions on aerosol surfaces is originally from the surface-sourced Br2 (in GEM-MACH), which then undergoes gas-phase photochemical processing to form compounds like HBr, HOBr, and BrONO2 which, in turn, can reform Br2 through heterogeneous reactions on acidic aerosol surfaces (Fan and Jacob, 1992; Michalowski et al., 2000; Saiz-Lopez and von Glasow, 2012). Hence the production of Br2 through this reactive bromine cycling process and its subsequent impact on ODEs will ultimately depend on the bromine release from the snowpacks (or other sources, e.g., blowing snow and sea spray sea salt) and atmospheric oxidation processes that facilitate the formation of HOBr and BrONO2. On the other hand, the heterogeneous cycling process allows the atmospheric production of Br2 to take place at distances far away from the original source locations (snowpacks in this case) through atmospheric transport as seen from Fig. 12 (and Figs. S8 and S9), which is consistent with the findings from the airborne field study of Peterson et al. (2017).
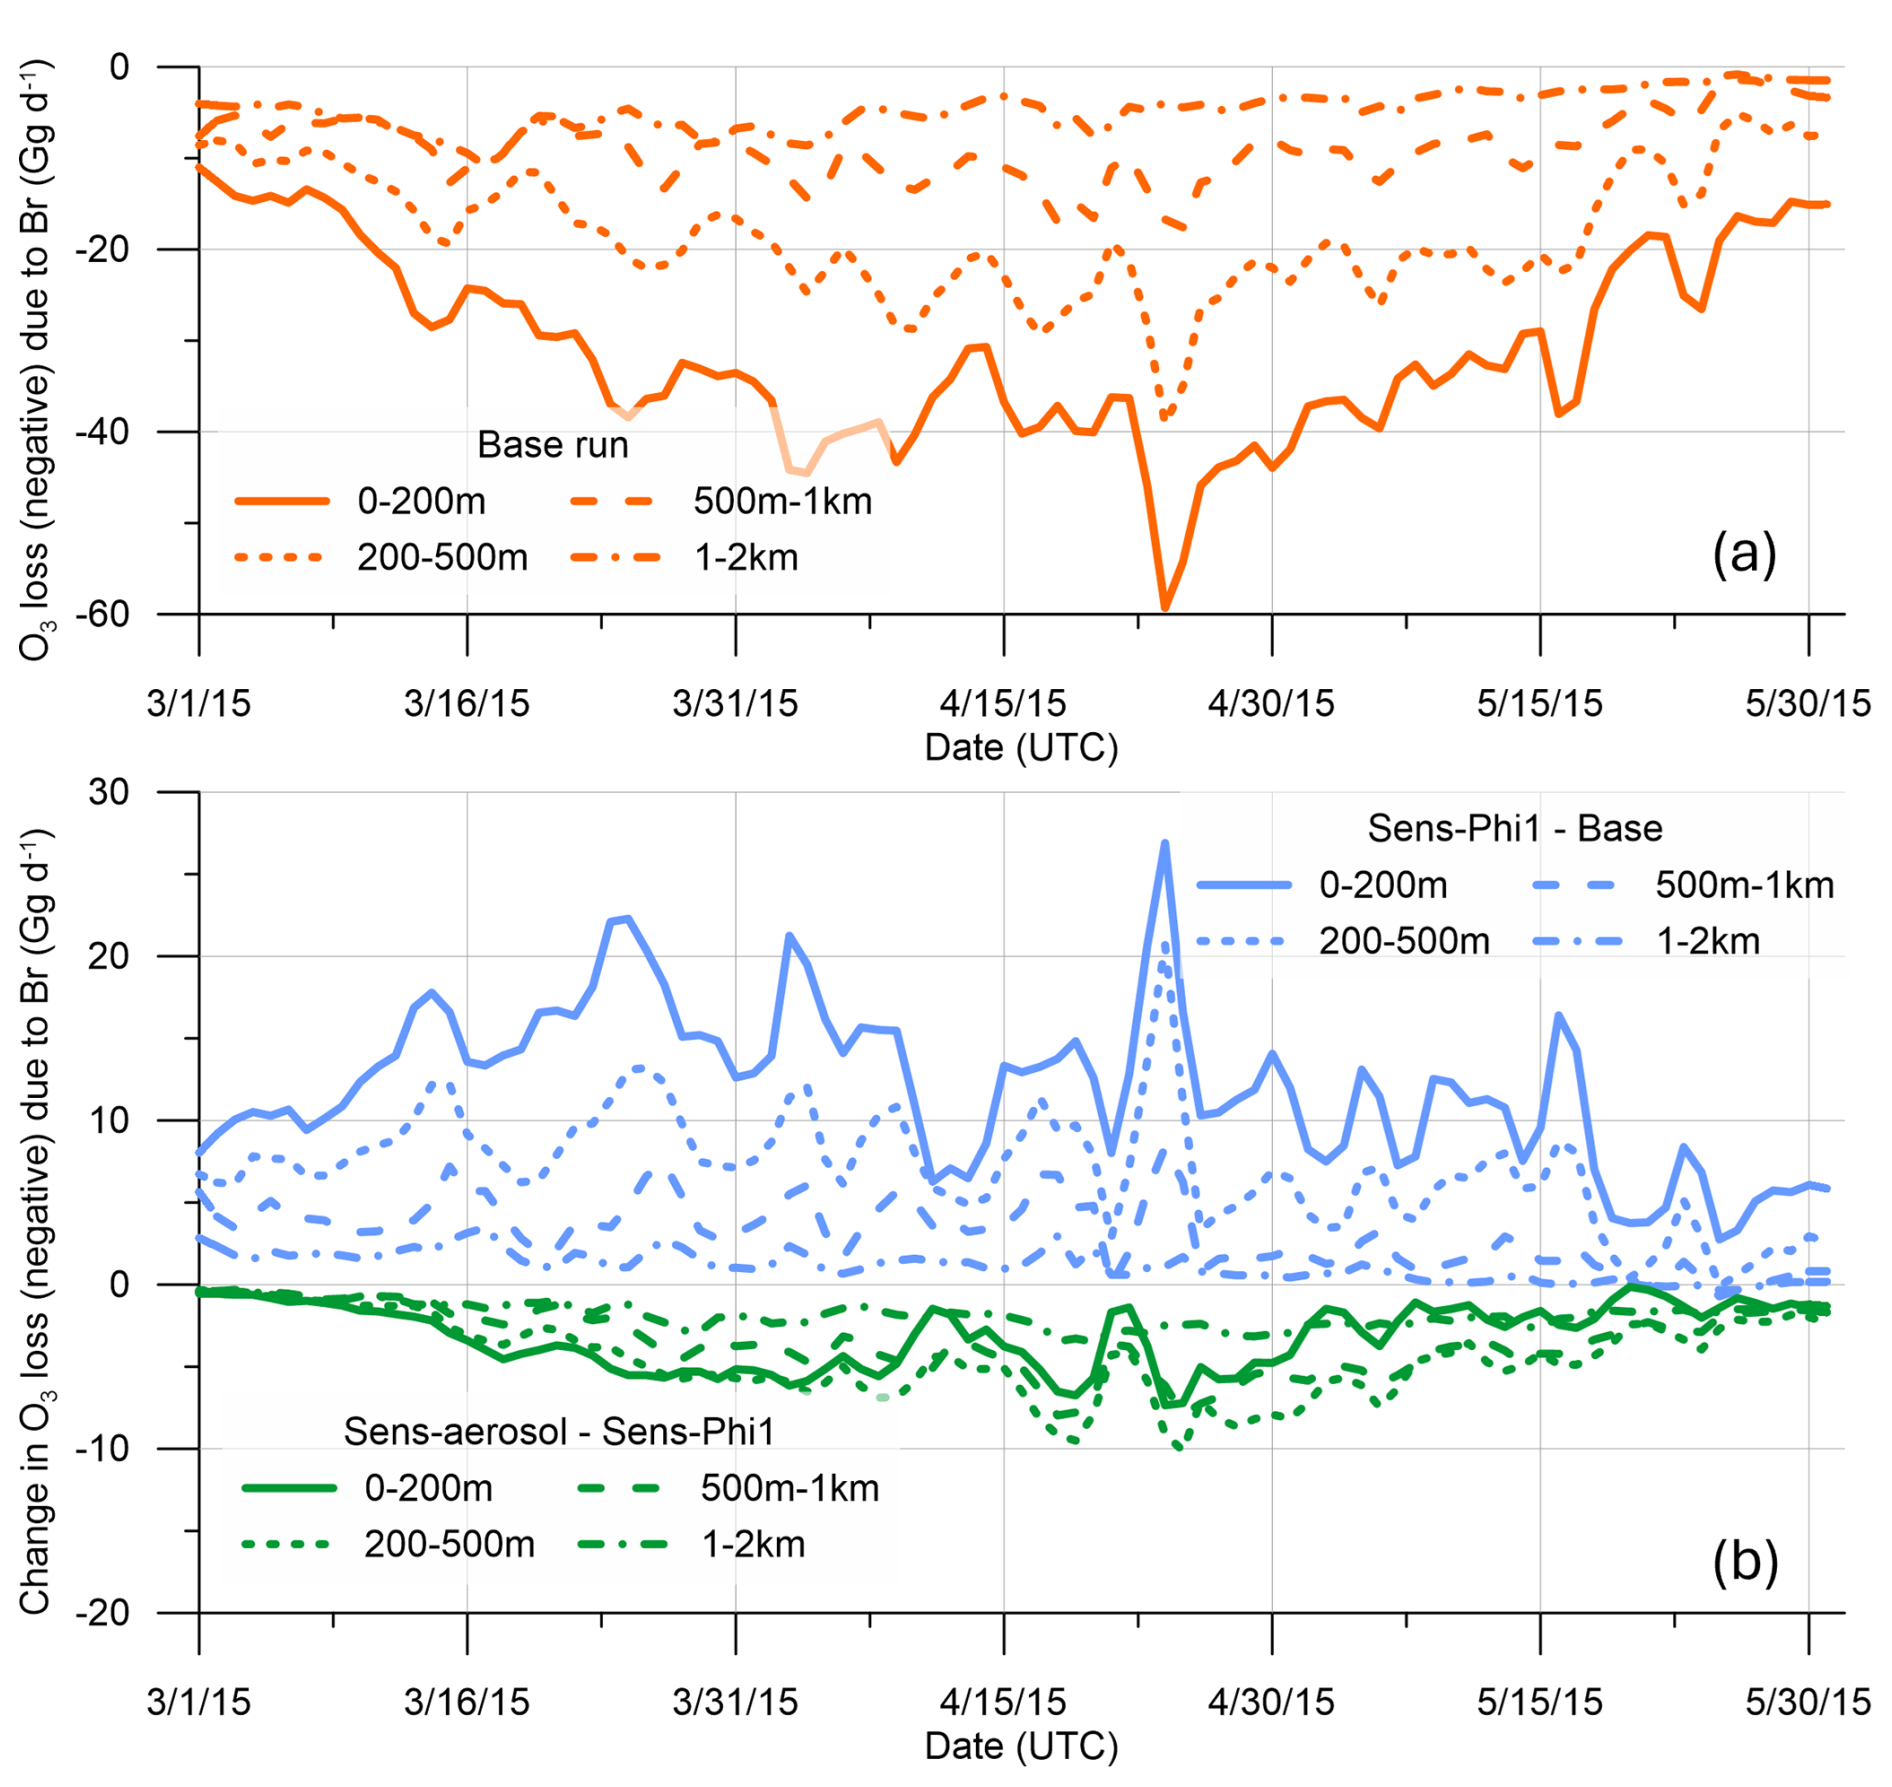
Figure 17(a) Pan-Arctic (> 66.5° N) integrated daily net O3 loss (negative) due to bromine chemistry over the lowest 2 km from the GEM-MACH base case run and (b) change in the pan-Arctic integrated daily net bromine-related O3 loss due to reduction in Φ1 (i.e., Sens-Phi1 vs. Base; positive for reduced O3 loss or increase in O3) and aerosol heterogeneous chemistry enhancement (Sens-aerosol vs. Sens-Phi1; negative for increased O3 loss or decrease in O3).
4.2 Impact of boreal wildfires on summertime Arctic O3
To investigate the impact of northern boreal wildfire emissions on tropospheric ozone in the Arctic, the GEM-MACH base case simulation was repeated with the wildfire emissions turned off within its pan-Arctic limited-area grid. Figure 18 compares the model-simulated July mean ozone concentrations over the Arctic, with and without the wildfire emissions, at three model levels. The impact of wildfires is expected to have a large inter-annual variability due to the differences in characteristics of fire seasons and meteorological conditions each year (e.g., Magnussen and Taylor, 2012). In 2015 the Arctic was mostly impacted by the wildfires in Alaska and northern Canada. Particularly, Alaska had a historically high number of fire events and acreage burnt for that fire season, with most of the fire activity concentrated in the late June to July period (Alaska Interagency Coordination Center, 2016). The model simulations show that the northern boreal wildfire emissions had a modest impact on tropospheric ozone concentration in 2015, most significantly in July. The monthly mean O3 concentrations over the central Arctic are enhanced by 1–2 ppbv at the surface due to northern boreal wildfires, while the enhancement is higher at elevations (e.g., ∼ 900 and 850 hPa levels) by 3–4 ppbv, representing a 5 %–10 % increase at the surface level and up to 10 %–20 % increase at the elevated levels. However, it is worth noting that the DEHM simulation showed more elevated O3 levels in the same area over northern Alaska extending into the Chukchi Sea and further into the central Arctic Ocean (See Fig. 2b for July at ∼ 900 and ∼ 700 hPa levels). This is consistent with the area impacted by the wildfires in Alaska.
Also shown in Fig. 18 is the excess (or enhancement) ratio ΔOCO, defined as the excess O3 mixing ratio due to a particular source (wildfire, in this case) to the increased CO from the same source, which is often used to characterize ozone production in smoke plumes (Jaffe and Wigder, 2012). Here ΔO3 and ΔCO were evaluated from the modelled O3 and CO concentrations with and without the wildfire emissions. A similar approach was used in Pfister et al. (2006) and Thomas et al. (2013). As expected, ΔOCO values are small, ∼ 0.02 ppbv ppbv−1 (surface) and ∼ 0.04 ppbv ppbv−1 (elevated levels), over the fire regions in Alaska and the Canadian Northwest Territories, due to limited excess O3 from photochemical production and large excess CO from fire emissions in fresh plumes. The ΔOCO values are considerably larger over the central Arctic, ∼ 0.1 ppbv ppbv−1 (surface) and ∼ 0.14 ppbv ppbv−1 (elevated levels), due to much lower ΔCO resulting from dilution during long-range transport, as well as continued O3 production in ageing plumes. The higher O3 excess ratio at elevated levels compared to the surface (lowest model) level is consistent with the higher O3 enhancement found at elevated levels in the Arctic due to the northern boreal wildfires. These regional enhancement ratio values may be compared with the wide range of ΔOCO values reported from existing studies for high-latitude boreal biomass burning plumes. For example, Jaffe and Wigder (2012) provided a summary of ΔOCO estimated from observations by biome and plume age. For boreal and temperate regions, they reported ΔOCO values ranging between 0.005 and 0.08 (average of 0.018 ppbv ppbv−1) in fresh plumes (≤ 1–2 d), between 0.11 and 0.18 (average of 0.15 ppbv ppbv−1) in plumes of age 2–5 d, and between 0.035 and 0.59 (average of 0.22 ppbv ppbv−1) in older plumes (age > 5 d). Thomas et al. (2013) found mean ΔOCO values of 0.08 and 0.49 in fresh and aged biomass burning plumes (from Canadian boreal forest fires), respectively, based on WRF-CHEM model simulations of the ARCTAS-B field campaign. Arnold et al. (2015) also found similar ΔOCO values from the POLMIP model simulations, in the range of 0.039–0.196 ppbv ppbv−1 for fresh fire plumes and 0.14–0.261 ppbv ppbv−1 for aged fire plumes. The July monthly ΔOCO values found in this study over the North American boreal fire regions, 0.02–0.04 ppbv ppbv−1, are consistent with the range of values found in previous studies for fresh boreal fire plumes, while the values over the central Arctic, 0.1–0.14 ppbv ppbv−1, are within the range, albeit towards the lower end, of the previously reported values for aged boreal fire plumes. The large variability in estimated wildfire-impacted ΔOCO enhancement ratios from various studies can arise from the different approaches used in evaluating the enhancement ratios. By comparing between a scatter technique (based on a linear fit to the O3-CO concentration scatterplot) and an enhancement technique (based on the evaluation of O3 and CO excess mixing ratios due to wildfire emissions), Pfister et al. (2006) showed that the ΔOCO ratios evaluated using the scatter technique were affected by the selection of biomass-burning-impacted air masses and the degree of mixing in the considered air masses. Much higher enhancement ratios were found in anthropogenic-combustion-impacted air masses than in the boreal-wildfire-impacted air masses, due to the difference in NOx CO emissions ratios between these source types. Pfister et al. (2006) also showed that when the variability in the background concentration levels was well characterized (which is not a trivial task for the analysis of observational data while being quite straightforward for the analysis of model results through sensitivity runs like ours), the enhancement technique would be more robust and accurate in evaluating the fire-influenced ΔOCO enhancement ratios.
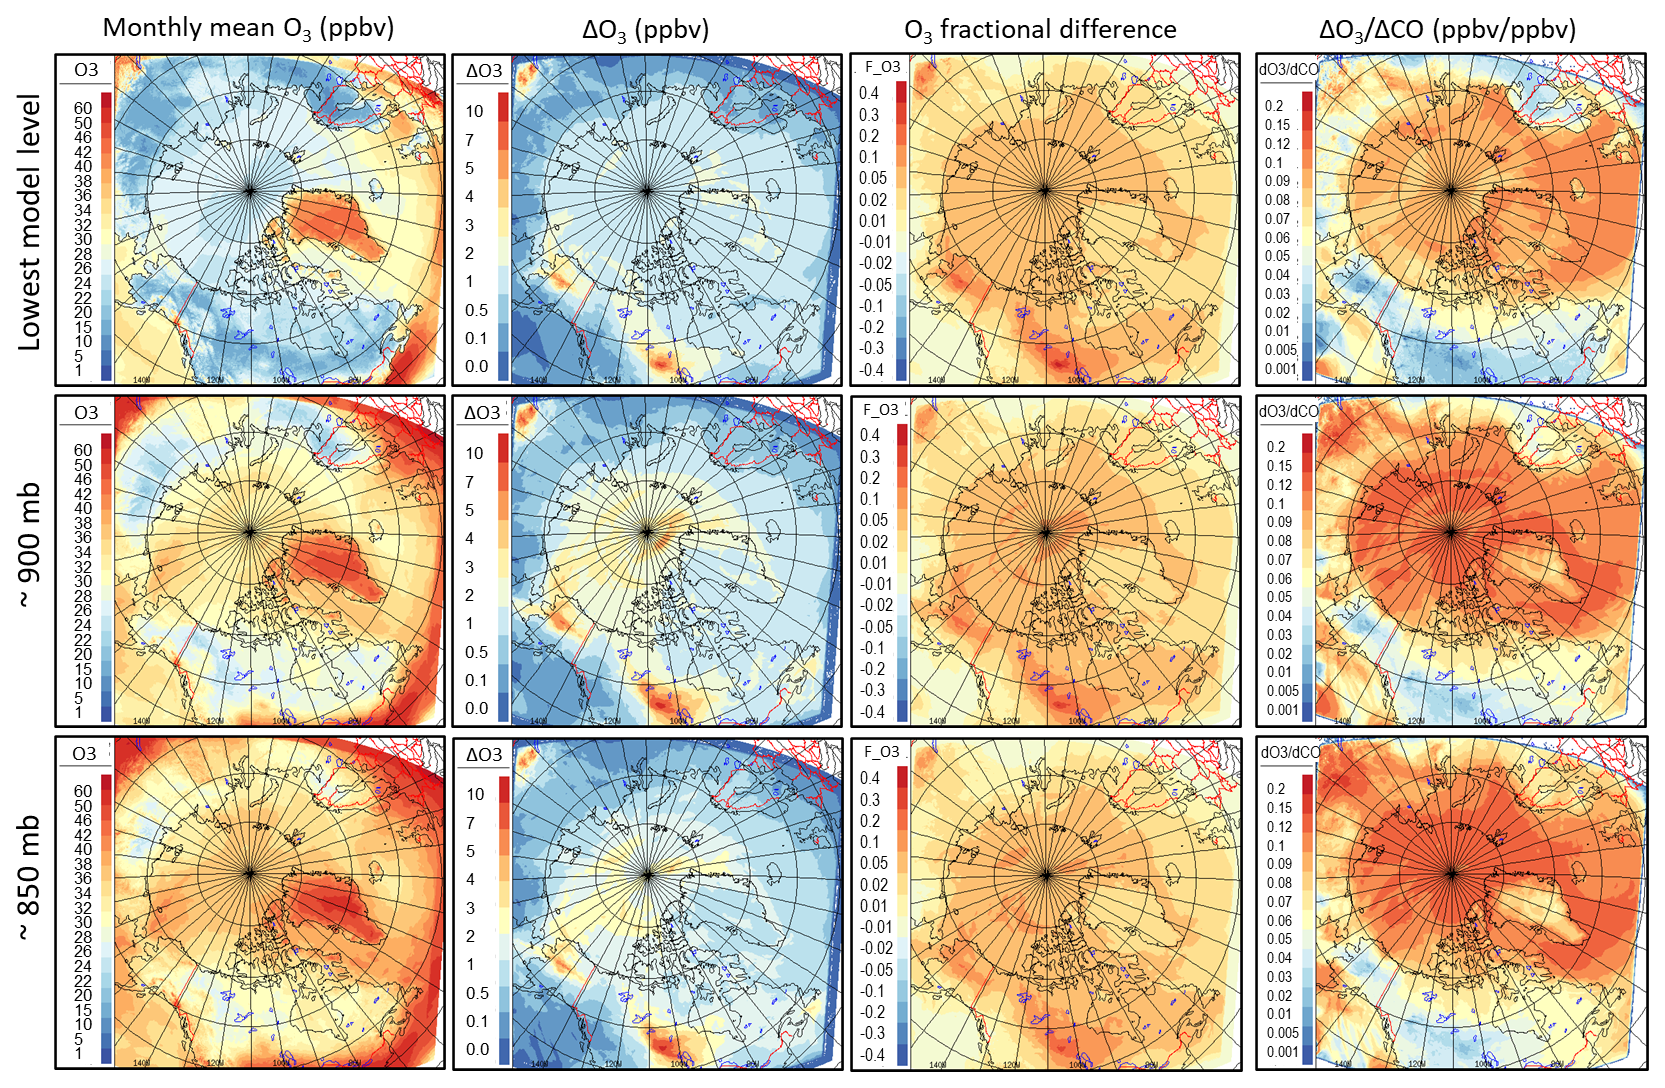
Figure 18Impact of northern boreal wildfire emissions on Arctic lower-tropospheric ozone (at 3 model levels: lowest – top, ∼ 900 hPa – middle, and ∼ 850 hPa – bottom); leftmost column – 2015 July monthly mean ozone concentration simulated by GEM-MACH; second left column – difference in simulated ozone concentration (with wildfire – without wildfire); second right column – fractional difference (computed as (A − B) 0.5(A + B)); rightmost column – ΔOCO enhancement ratio (see text).
Emissions from biomass burning can also lead to large-scale enhancement in high-latitude NOy (e.g., Arnold et al., 2015). Figure 19 shows the enhancement ratios (July monthly mean), ΔNOCO and ΔPAN ΔCO, evaluated from the GEM-MACH simulations at three model levels (lowest and levels nearest to pressure levels of 900 and 700 hPa). At the lowest model level, higher ΔNOCO values are found over the fire regions, while much lower ΔNOCO values are found over the central Arctic due to the efficient removal of NOy species due to dry deposition. Higher NOy enhancement ratios over the central Arctic are found at elevated levels, highest (∼ 8 pptv ppbv−1) at the model level close to 700 hPa. Note that higher ΔNOCO values are found over the Russian fire region compared to the North American fire region, indicating a more efficient NOy production in Russian fire plumes. This is likely due to the difference in fire emissions (e.g., NOx emission factors used by the model) between the two regions. As mentioned in Sect. 2.1.2, the GEM-MACH simulation used different data source for wildfire emissions over North America (CEFFPS) and outside North America (FINN v1.5). PAN, a component of NOy, is of particular interest as it serves as a reservoir for NOx and can potentially contribute to O3 formation in the Arctic from its thermal decomposition (Walker et al., 2012). The modelled PAN enhancement ratios (ΔPAN/ΔCO) due to boreal wildfires are simulated to be ∼ 3–4 pptv ppbv−1 over the North American boreal fire regions at the lowest model level, increasing with height to 6–7 pptv ppbv−1 near 700 hPa, comparable with the ΔPAN ΔCO ratios reported by Arnold et al. (2015) from the group of models driven by the ECMWF meteorological reanalysis. These values are comparable to those deduced from aircraft measurements in boreal fire plumes during the ARCTAS-B campaign (Alvarado et al., 2010). Over the central Arctic, the PAN enhancement ratio has lower values at low altitudes compared to over the fire regions. In contrast, the ΔPAN ΔCO values are significantly higher at more elevated levels (e.g. 700 hPa), similarly to the case of NOy. Also included in Fig. 19 is the evaluated PAN-to-NOy enhancement ratio (ΔPAN ΔNOy) from model simulations. As shown, ΔPAN ΔNOy ranges from 40 % close to the surface to greater than 70 % at 700 hPa level in the North American boreal fire region and downwind, indicating a significant portion of NOy produced from the photochemical processing in the boreal fire plumes being in the form of PAN. Over the Arctic, ΔPAN ΔNOy ranges from 20 % near the surface to greater than 50 % at higher levels in the lower troposphere. The smaller fraction of PAN at lower levels could be a result of PAN decomposition leading to releasing NOx and O3 formation over the Arctic (referring to the increased O3 enhancement ratio over the Arctic from the source region; see Fig. 18, rightmost column).
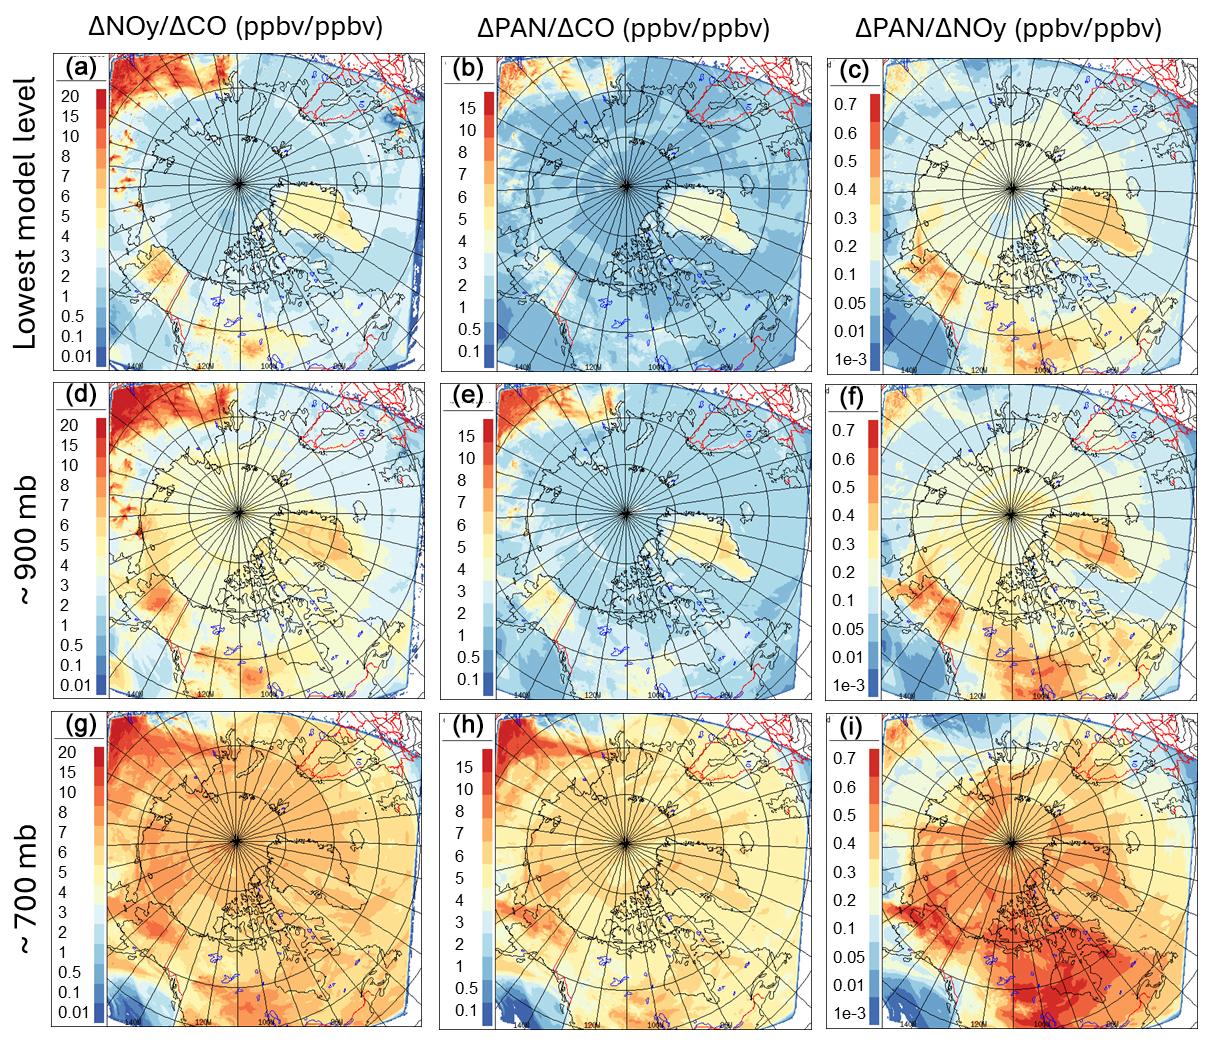
Figure 19Modelled NOy and PAN excess ratio, ΔNOCO (a, d, g) and ΔPAN ΔCO (b, e, h), as well as excess PAN-to-NOy ratio, ΔPAN ΔNOy (c, f, i), for July 2015 (monthly mean), at 3 model levels: lowest (surface; a–c), ∼ 900 hPa (d–f), and ∼ 700 hPa (g–i).
Figure 20 shows the modelled O3 time series at Zeppelin and Summit sites for 2015 summer period, with and without the wildfire emissions. Also included are the corresponding modelled PM2.5 time series as along with the aerosol absorption measurements available at these two sites. The time series show the main events of northern boreal wildfire plumes affecting the Arctic during July 2015, which are coincident with the high aerosol events indicated by the aerosol absorption measurements. The enhancements in ground-level PM2.5 from the fires are much more pronounced than in O3. The enhancement in PM2.5 is largely driven by primary particulate matters (e.g., primary organic matters, crustal materials) directly emitted from the fires. O3 is a secondary pollutant, and its formation depends upon the mix of its precursors in the fire plumes and photochemical processing during their transport. The model results indicate that northern boreal wildfires may raise the summertime background O3 concentrations in the Arctic. However, our model simulations did not fully reproduce the observed episodic peaks in O3 concentration time series at Zeppelin and Summit during summer 2015, which could be associated with the transport of biomass burning plumes (Fig. 18). This could be an indication of the model underprediction of O3 production in boreal fire plumes or that the long-range transport from lower latitudes is not being fully captured by the model's lateral boundary conditions. However, there is also a possibility that the measured O3 may be biased high at Summit under wildfire-influenced conditions due to an instrument's VOC interference issue (Bernays et al., 2022; Long et al., 2021).
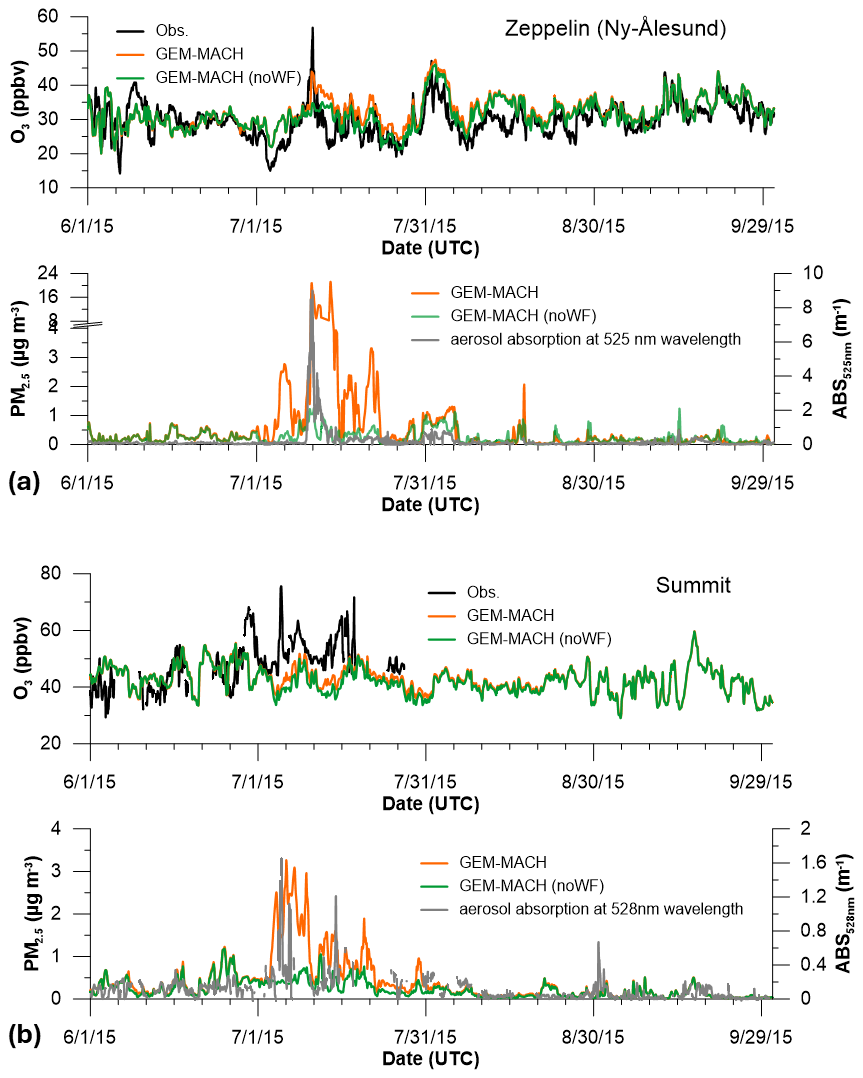
Figure 20GEM-MACH-modelled O3 and PM2.5 time series (with and without wildfire emissions) at Zeppelin (a) and Summit (b) sites. Surface O3 observations at the two sites are plotted in black. Also plotted along with modelled PM2.5 is the observed aerosol absorption coefficient at the Zeppelin (525 nm) and Summit (528 nm) sites, obtained from an Aethalometer and a multi-angle absorption photometer (MAAP), respectively (accessed from EBAS (https://ebas.nilu.no, last access: 9 May 2025) hosted by NILU; specifically, the use included data affiliated with the frameworks GAW-WDCA and NOAA-ESRL).
Overall, the model simulations suggest that northern boreal wildfires do exert a modest impact on the Arctic tropospheric ozone by influencing the summertime background concentrations. The enhancement of O3 concentration over the Arctic appears to be greater in the free troposphere than in the boundary layer. Boreal wildfire plumes can often penetrate above the boundary layer where O3 produced in fire plumes is less subjected to surface removal (dry deposition). Northern boreal wildfires also lead to the enhancement of NOy in the Arctic. A significant portion of the NOy in fire plumes is in the form of PAN, particularly at more elevated levels, which can play a role in O3 production in the Arctic. It should be noted, however, due to the nature of the limited area model (LAM) configuration used in this study, that the model simulations discussed here (with vs. without wildfire emissions) cannot capture the full impact of Eurasian boreal wildfires as most of the Eurasian boreal fires in 2015 were located outside the GEM-MACH LAM domain.
4.3 Ozone tendency and budget analysis
The GEM-MACH simulations incorporated diagnostics for ozone tendencies from each of the processes, (3-D) advection, vertical diffusion (including deposition at the lowest model layer), and chemistry. This was done to help understand how each of the processes influences the O3 seasonal patterns in the Arctic. Figure 21 includes plots of the monthly averaged O3 tendencies from each of the process operators in the GEM-MACH 2015 annual simulation for April and July at two model levels, the lowest and near 850 hPa. In April (spring), the O3 in the Arctic lower atmosphere near the surface is strongly influenced by chemical loss driven by bromine explosions and ODEs, which is compensated by vertical diffusion (primarily) and advection, driven by the strong O3 gradients (both vertical and horizontal) created by the chemical loss near the surface. In contrast, O3 in the central Arctic at the elevated level (∼ 850 hPa) is more strongly influenced by advection in spring with chemistry and vertical diffusion playing smaller roles. In July (summer), the net O3 chemical tendency over the Arctic varies significantly spatially, from negative over large areas in the high Arctic (perhaps driven by loss through reactions mainly with HO2, e.g Wang et al., 2003) to positive (net production) at more polluted southerly locations, e.g., over northern Europe and northern Eurasia. There is an indication of net photochemical production of O3 over the shipping channels along the southwestern coast of Greenland and the Canadian Atlantic coast. There is also considerable net O3 chemical production over the central and northern coast of Alaska extending over the Beaufort Sea. Figure S10 in the Supplement shows the July monthly net O3 chemical tendency at various model levels from closest to the surface to near 700 hPa from both the GEM-MACH base annual simulation (with wildfires) and the GEM-MACH simulation without the wildfire emissions in the model LAM domain. The impact of boreal wildfires over central Alaska and northern Canada's Northwest Territories on O3 production is evident. It is particularly interesting to note the potential interaction between the biomass burning plume and anthropogenic emissions of ozone precursors from Alaskan oil fields (Prudhoe Bay). The net O3 chemical production extends further into the Arctic with the wildfires than without. The O3 production in wildfire plumes also reaches higher altitudes than those from anthropogenic sources.
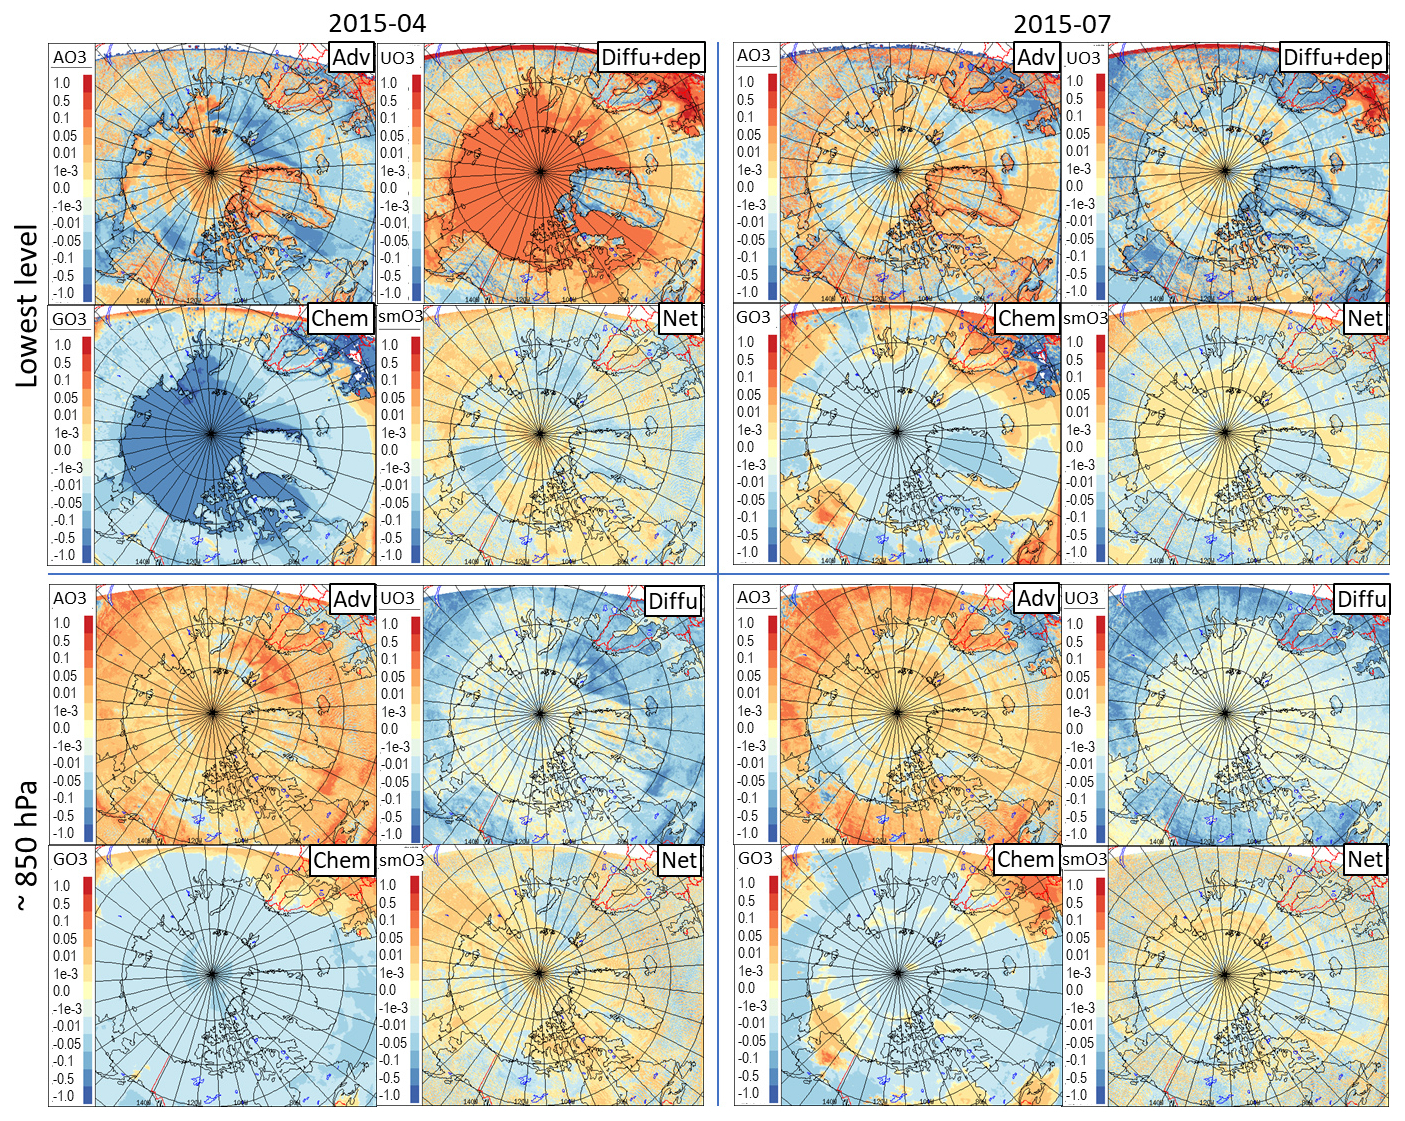
Figure 21Monthly averaged O3 tendencies (ΔO, or µg kg−1 per 900 s) from each of the process operators in GEM-MACH, 3-D advection (AO3), vertical diffusion (UO3), and chemistry (GO3), as well as the net tendency (smO3) for the month of April (left panels) and July (right panels) in 2015, at two model levels: lowest (top panels) and near 850 hPa (bottom); at the lowest model level, the vertical diffusion term UO3 also includes a contribution from dry deposition (as flux boundary condition).
The pan-Arctic O3 budget for each month of 2015 is presented in Fig. 22. It was computed by vertical integration of the daily tendencies through specific depths of the atmospheric columns (from the surface) and then horizontal integration over the area north of 66.5° N (Arctic Circle), given in gigagrams of O3 per day, and averaged for each month. The budgets for the lowest 200 m above ground level (a.g.l.), 1 km a.g.l., and 4 km a.s.l. are shown. Within the lowest 200 m of air across the Arctic Circle, the O3 budget is largely balanced between dry deposition (maximum in summer) and vertical diffusion outside the spring ODE season. During the ODE season, the budget is balanced between the combined loss through dry deposition and atmospheric chemistry and the gain from vertical diffusion. Within the lowest 1 km of air, the O3 budget is largely balanced between the loss from dry deposition (throughout the year) and chemistry (over spring) and O3 gains from advection (primarily) and vertical diffusion (much reduced compared to over the lowest 200 m). Over a deeper layer (4 km a.s.l.), the O3 budget is not always balanced, i.e., with non-zero O3 net gain/loss. The processes contributing to the Arctic O3 budget over the lowest 4 km (a.s.l.) are dry deposition and chemistry (both contributing to O3 loss) and advection (contributing to O3 gain). Also included in Fig. 19 are the O3 budgets computed from the GEM-MACH no-bromine (NoBr) run (shown for March to June) and the no-wildfire (NoWF) run (shown for July). It is evident that the O3 chemical loss in the lowest 200m and up to 1 km is almost entirely due to bromine chemistry, with a minimal contribution from non-bromine chemistry (emerging during May–July). The non-bromine chemical loss of O3 occurs mainly above 1 km a.g.l. and mainly from May to August in terms of timing. The impact of North American boreal wildfire on the Arctic O3 budget is reflected in the reduced O3 loss through chemistry (i.e., offset by the O3 chemical production in wildfire plumes), most noticeable in the budget over the 4 km layer, indicating that most O3 production from the North American wildfires is happening at higher altitudes.
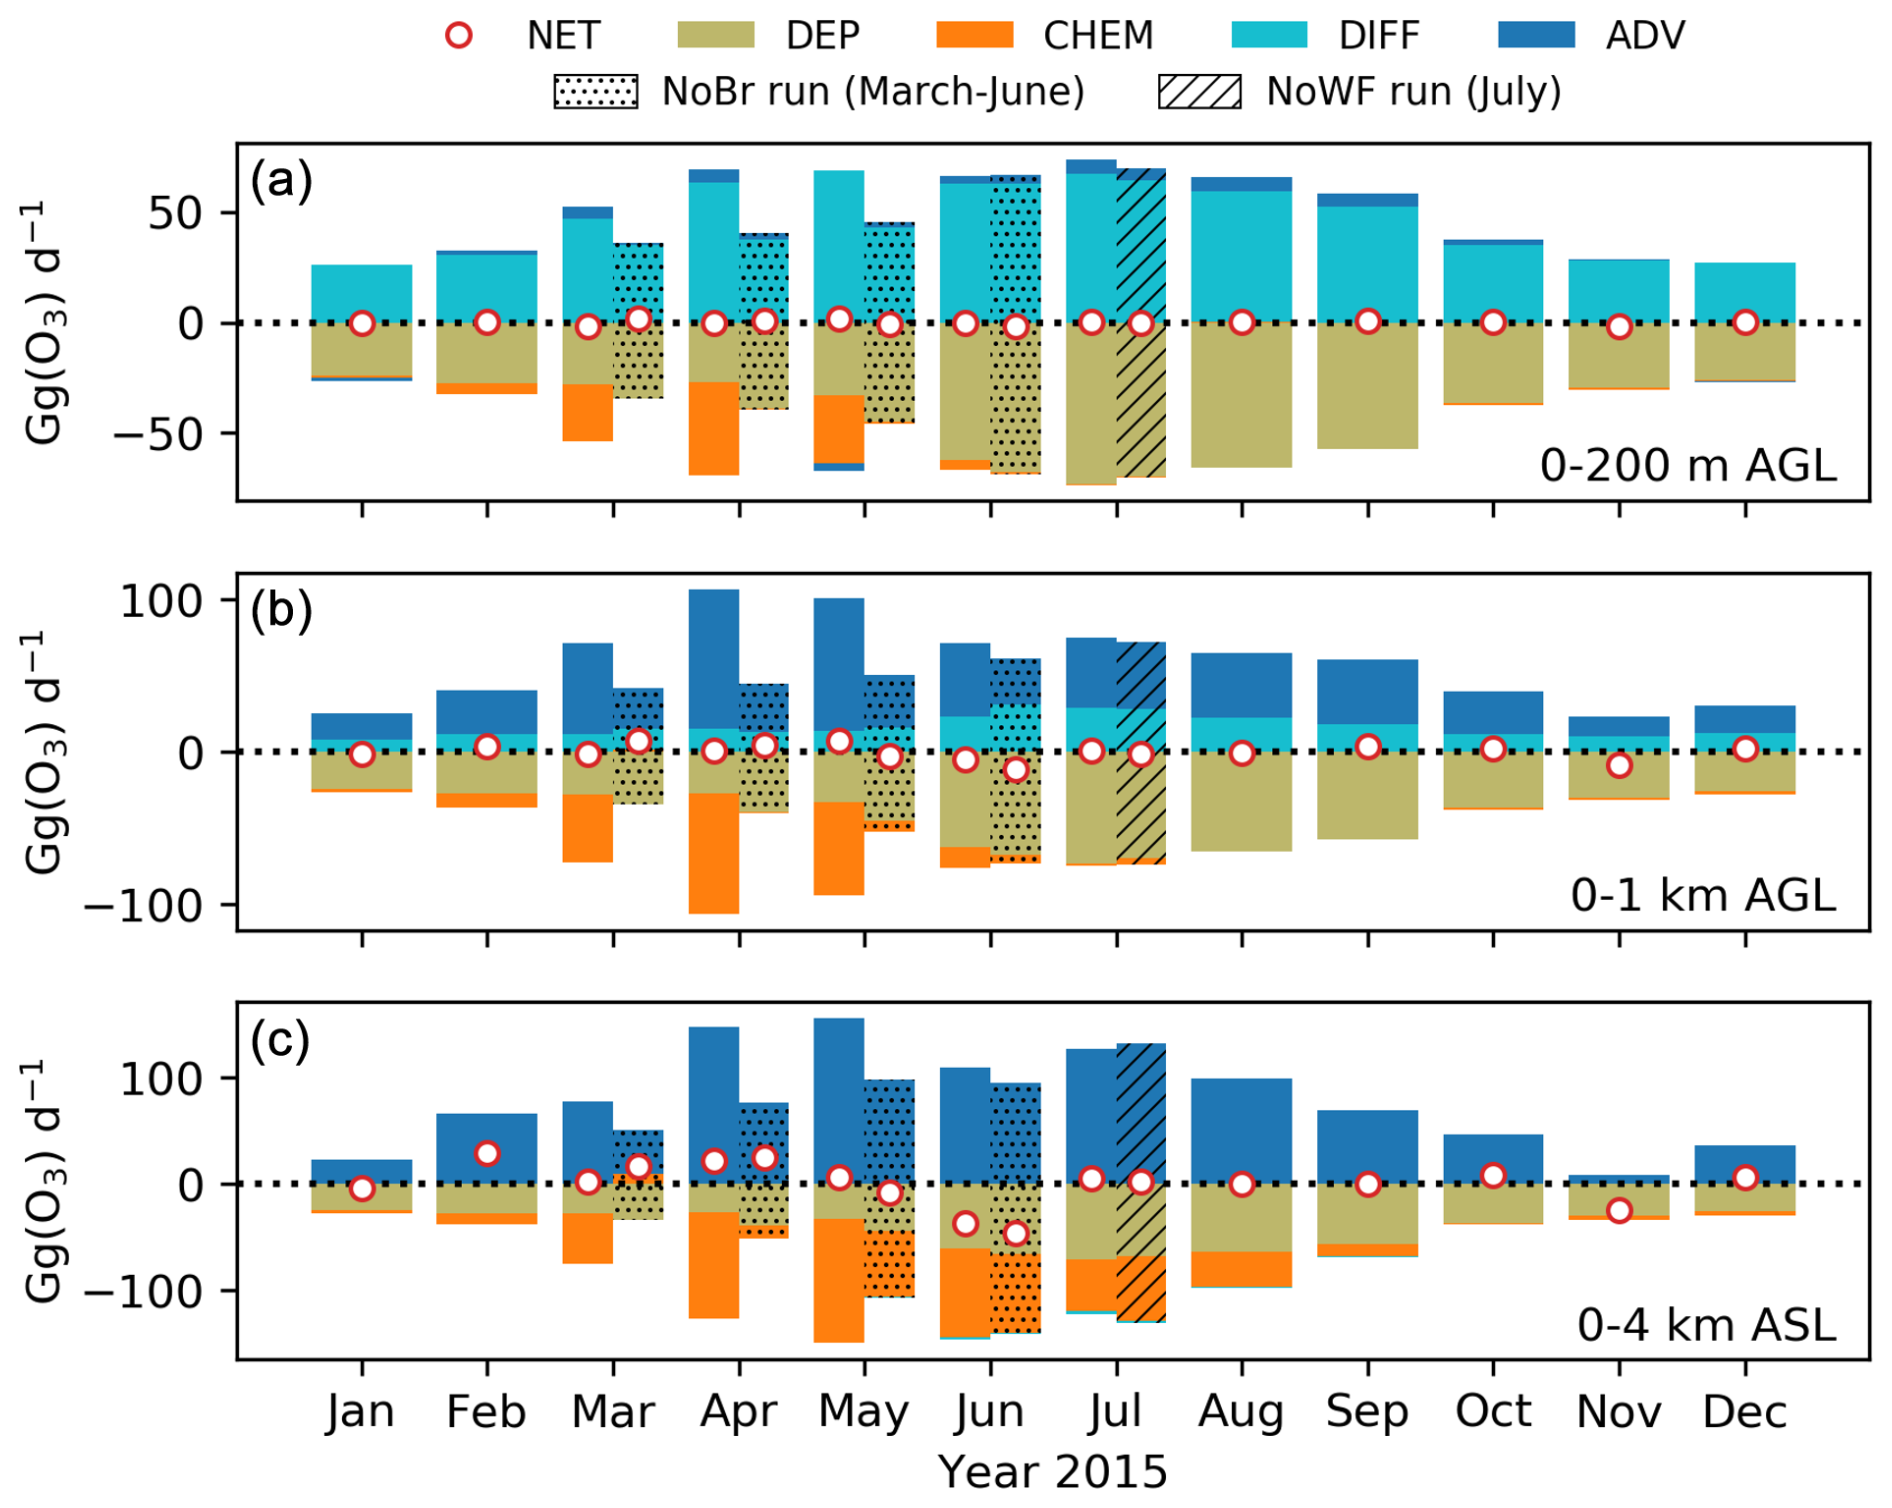
Figure 22Pan-Arctic (> 66.5° N) integrated O3 monthly budget for 2015, calculated for (a) the lowest 200 m a.g.l., (b) the lowest 1 km a.g.l., and (c) the lowest 4 km a.s.l.. The net gain (NET, red circles) of O3 over the domain of integration is determined by the balance between horizontal and vertical advection (ADV, blue bars), vertical diffusion (DIFF, light-blue bars), photochemical reactions (CHEM, orange bars), and dry deposition (DEP, dark-yellow bars). The O3 budget from sensitivity runs is also shown by dotted (NoBr run between March and June) and hatched (NoWF run for July) bars again with red circles to denote the net gain of O3.
While the springtime-bromine-explosion-induced O3 loss mainly occurs within the lowest 1 km of air in the Arctic, it represents a considerable loss in O3 tropospheric burden over the Arctic. The reductions in monthly mean partial O3 columns due to snowpack bromine simulated by GEM-MACH are shown in Fig. S11 for the 3 spring months of 2015, by changes in the tropospheric column (surface to 400 hPa) and the lowest 4 km column (surface to 4 km a.s.l.). The modelled snowpack bromine results in up to 15 % reductions in O3 tropospheric column loading over the central Arctic (up to 30 % reduction in the lowest 4 km O3 column). These reductions amount to a 5 %–7 % loss of pan-Arctic (> 66.5° N) tropospheric O3 burden (8 %–12 % loss of the O3 burden over the lowest 4 km a.s.l. of air).
In this study, we examine model simulations of Arctic lower-tropospheric O3 over the full year of 2015, conducted using two independent models, GEM-MACH and DEHM, configured at 15 and 25 km resolution, respectively, over the Arctic. Both models consider bromine chemistry with different process representations for the source term of bromine from snow in the Arctic: a snowpack-sourced mechanism in GEM-MACH (following Toyota et al., 2011) and a blowing-snow-sourced mechanism in DEHM (following Yang et al., 2010). The annual model simulation results were compared with a suite of observations in the Arctic, including hourly observations from surface sites and mobile platforms (buoys and ships) and weekly (with some variability depending on the sites and the seasons) ozonesonde profiles, to evaluate the models' ability to simulate Arctic lower-tropospheric O3, particularly in capturing the seasonal variations and the key processes controlling these variations.
The model–observation comparisons show that both models are able to simulate Arctic lower-tropospheric O3 well, in capturing the overall surface O3 seasonal cycle and synoptic-scale variabilities, as well as the O3 vertical profiles. Outside the spring O3 depletion period, the behaviour of the two models is remarkably similar to each other. The model-simulated O3 from the two models differs mostly during spring near the surface when GEM-MACH (with a representation of snowpack-sourced bromine) was able to capture most of the observed ODEs while DEHM (with a representation of blowing-snow soured bromine) simulated much fewer ODEs and of shorter duration and depth. As a result, GEM-MACH-simulated O3 showed distinctively different seasonal cycles between near the surface and aloft over the central Arctic driven by the springtime ODEs, i.e., the O3 spring minimum near the surface as opposed to the O3 spring maximum aloft and at subarctic locations. The differing O3 seasonal cycles between lower and upper levels simulated in GEM-MACH agree with the ozonesonde observations near the Arctic Ocean.
This study demonstrates that the springtime O3 depletion process plays a central role in driving the O3 seasonal cycle close to the surface in the central Arctic and that the ODEs are reproduced reasonably well with the representation of a snowpack bromine source mechanism (in the case of GEM-MACH), while bromine release from sea salt in the blowing-snow mechanism alone (in the case of DEHM) does not produce sustained ODEs. The stronger impact of the snowpack-sourced bromine on modelled ODEs was also reported in recent studies (Marelle et al., 2021; Swanson et al., 2022). The snowpack-sourced mechanism seems to be essential in sustaining the continued bromine production under a variety of meteorological conditions, while the blowing-snow bromine source mechanism triggered by high wind conditions tends to be more episodic. This is consistent with observational evidence that the ODEs observed in the Arctic tend to occur during calm wind conditions favouring the snowpack bromine source mechanism to take effect in the surface air. The study also demonstrates that atmospheric aerosols play an integral role in the Arctic springtime bromine explosions and ODEs through heterogeneous cycling of reactive bromine, particularly over a deeper vertical layer and at distance from the snowpack bromine source area. Simpson et al. (2017) also found that higher aerosol extinction (> 0.1 km−1) appeared to be necessary for maintaining the notable presence of BrO aloft, though they suggest that chemical composition of aerosols may play a role as well in the cycling of reactive bromine. This has implications for the potential role of Arctic haze aerosols that may play in the springtime ODEs, as indicated in previous studies (e.g., .Fan and Jacob, 1992).
Although GEM-MACH with the snowpack bromine source mechanism is able to simulate the observed ODEs reasonably well in this study, there is a large uncertainty in the parameters employed by the parameterization due to the lack of constraints by available laboratory or field experiments and the nature of the heuristic representation of highly complex multiphase processes in snowpacks and in the atmosphere. This is demonstrated in this study through the sensitivity of modelled ODEs to the snowpack bromine yield on FY sea ice (upon O3 deposition) and the efficiency of heterogeneous cycling of reactive bromine on atmospheric aerosol surfaces. Nevertheless, in all the cases, the model simulates direct photochemical production of molecular halogens in the snowpack in a manner broadly consistent with what is believed to occur (Custard et al., 2017; Halfacre et al., 2019; Pratt et al., 2013). Further investigation is needed to better constrain these parameters (and to better understand the multi-phase processes controlling bromine cycle at the cryosphere–atmosphere interface).
The present modelling study indicates that northern boreal wildfires can have an impact on the summertime Arctic tropospheric O3. The model simulations show an overall enhancement in the pan-Arctic O3 concentration due to northern boreal wildfire emissions during 2015; the enhancement is more significant at higher altitudes, consistent with higher O3 excess ratio (ΔO3/ΔCO) found there compared to near the surface. Wildfires also lead to an enhancement in NOy in the Arctic, again more significant at higher altitudes. A large portion of NOy produced from the wildfire emissions is in the form of PAN, which is transported to the Arctic, particularly at higher altitudes, potentially contributing to O3 production there. It should be noted that wildfire activities are highly variable from year to year. With the current warming trend and increased northern boreal wildfire activities, the impact of wildfires upon the Arctic tropospheric O3 is expected to increase.
The O3 budget analysis carried out in this study shows that the pan-Arctic lower-tropospheric O3 budget is largely balanced off between poleward transport (advection), dry deposition, and chemistry (dominated by bromine chemistry during the spring period close to the surface and by HOx chemistry at higher altitudes). The springtime-bromine-mediated ODEs contribute to 5 %–7 % of loss in the pan-Arctic tropospheric O3 burden (and 8 %–12 % loss of the pan-Arctic O3 burden in the lowest 4 km of the troposphere). While chemistry generally leads to an overall O3 loss in the Arctic, net production of O3 is found to occur locally in ship plumes, downwind of oil and gas facilities in the Arctic, and in northern boreal wildfire plumes. Interestingly, recent studies have highlighted the important role of anthropogenic NOx emissions from existing Arctic oil and gas infrastructures in perturbing O3 and bromine chemistry, influencing the Arctic surface O3 seasonal cycles at local and regional scales (Peterson et al., 2025; Widmaier et al., 2025). Although results from the present study do reflect the individual effects of NOx emissions from local anthropogenic sources in both production and titration of O3 as well as in atmospheric cycling of bromine through reactions with Br and BrO, we did not explore the role of NOx emissions from local combustion sources in the Arctic surface O3 seasonal cycles systematically. This is an important aspect to further investigate, particularly in light of the anticipated increase in the resource exploration in the Arctic under warming climate.
Overall, this study found that two independent chemical transport models, DEHM and GEM-MACH, configured at considerably higher resolution over the Arctic show better skills in capturing seasonal variation of surface and lower-tropospheric O3 in the Arctic in comparison to the global models used in previous assessment studies. This may largely be owing to their better skills in simulating synoptic systems at higher resolutions, implying the important influence of synoptic systems on poleward transport of pollutants. The important role of atmospheric transport in influencing the Arctic lower-tropospheric O3 is also strongly evident from our O3 budget analysis.
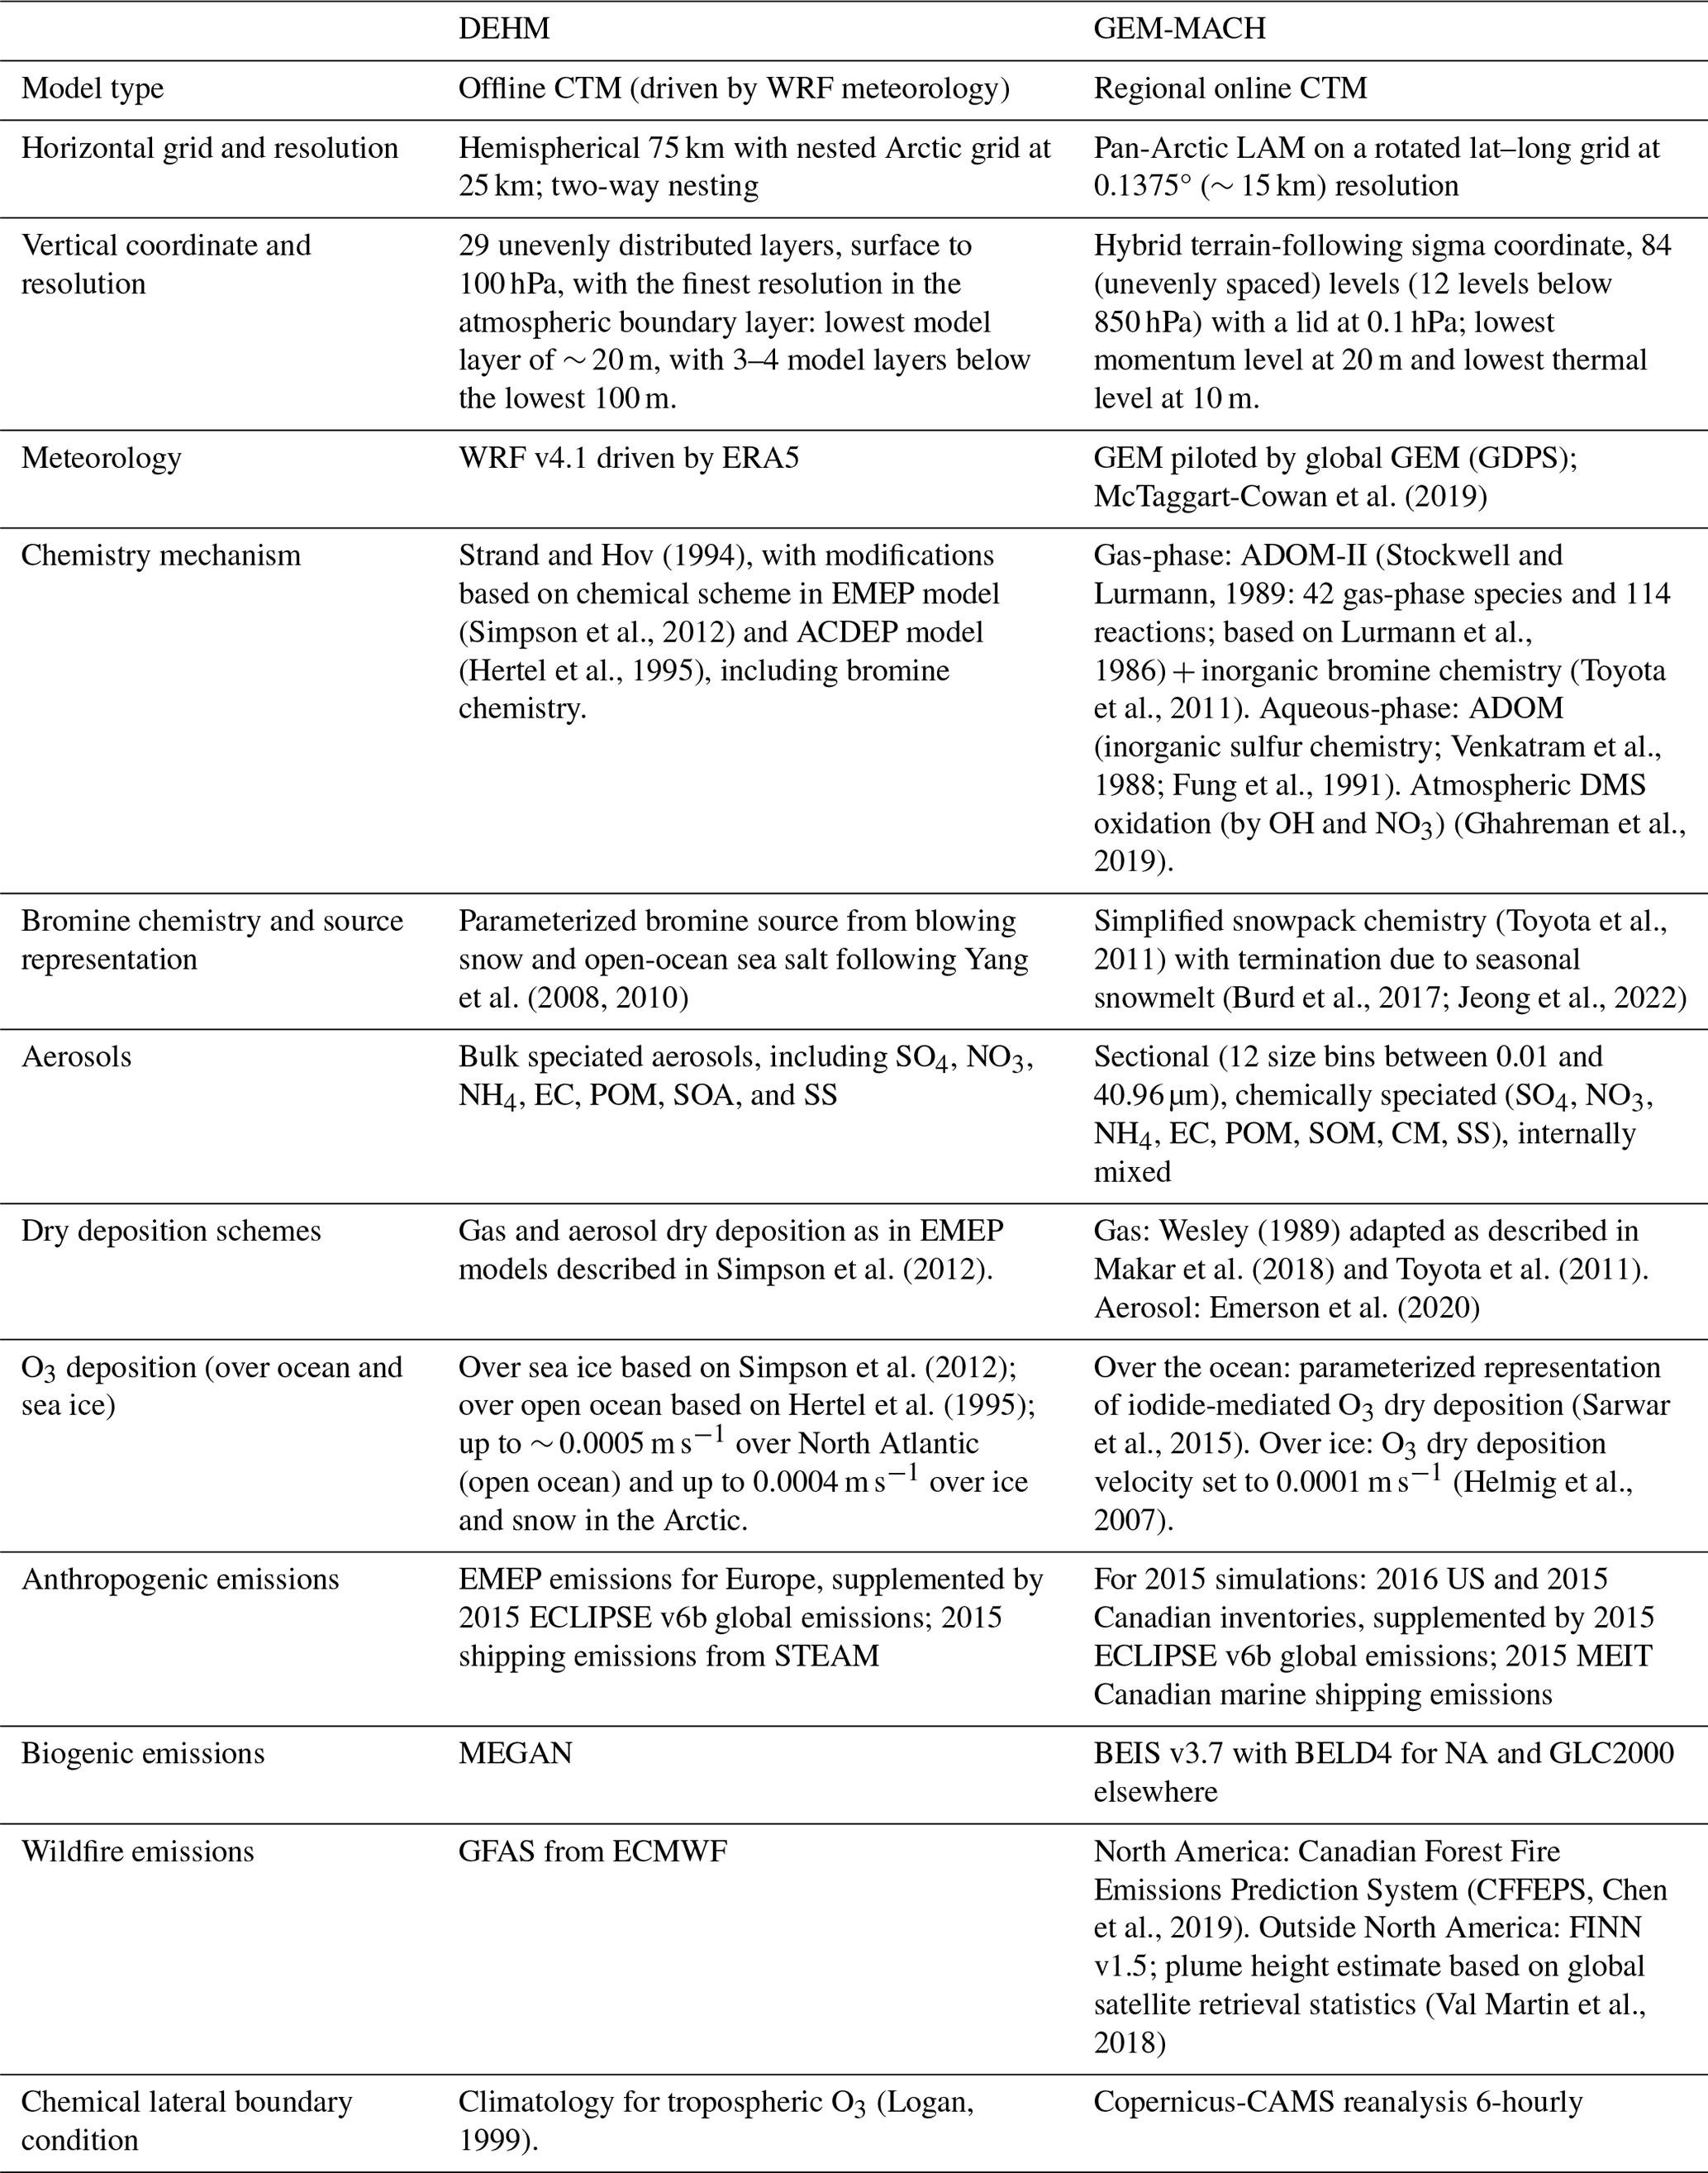
All the observational data used in this study are available online (see Table 1). The surface O3 monitoring data from the Arctic surface sites are available via the EBAS site (https://ebas-data.nilu.no/Default.aspx, last access: 13 November 2024; Norwegian Institute for Air Research, 2024) hosted by NILU; both the O-buoy O3 data and MAX-DOAS BrO data are available for download from the NSF Arctic Data Center (https://arcticdata.io/catalog, last access: 23 November 2024; NSF Arctic Data Center, 2024). Ozonesonde data can be downloaded from the World Ozone and Ultraviolet Radiation Data Centre (WOUDC) hosted by Environment and Climate Change Canada (ECCC) (https://www.woudc.org/en/data/data-access, last access: 24 July 2025; ECCC, 2025) and the NASA Network for Detection of Atmospheric Composition Change (NDACC) site (https://www-air.larc.nasa.gov/missions/ndacc/, last access: 23 July 2025; NDACC, 2025). The NETCARE AWI/Polar-6 aircraft data are available from the Government of Canada Open Data portal (https://search.open.canada.ca/opendata/, last access: 23 November 2024; Government of Canada, 2024). The GEM-MACH model data (monthly mean O3 at three model levels, lowest, nearest to 900 and 700 hPa) in NetCDF are available to download from Zenodo at https://zenodo.org/records/14237307 (Beagley et al., 2025a); other GEM-MACH model data are available upon request from the corresponding author Wanmin Gong (wanmin.gong@ec.gc.ca). The GEM-MACH-Arctic chemistry module code can be downloaded from Zenodo at https://zenodo.org/records/14217327 (Beagley et al., 2025b). DEHM code and data can be made available by contacting Jesper Heile Christensen (jc@envs.au.dk).
The supplement related to this article is available online at https://doi.org/10.5194/acp-25-8355-2025-supplement.
WG designed the study with input from KT, SRB, UI, HS, JHC, ASL, RS, and YK. KT developed the bromine code employed in GEM-MACH-Arctic; KT and SRB implemented the code. DP provided the code for the Sarwar parameterization of iodine-mediated O3 dry deposition over the ocean implemented in GEM-MACH-Arctic for this study. JZ and AL generated GEM-MACH anthropogenic emissions and meteorological piloting files for the study, respectively. GEM-MACH simulations were performed by SRB and WG. JHC was responsible for DEHM and provided DEHM simulation results. SRB, KT, and WG carried out the analysis. Observational data curation was provided by PE and IP (surface O3 at Utqiaġvik, Summit, and Tiksi); SS (surface O3 at Zeppelin and Tustervatn); MV (surface O3 at Pallas); CN and HS (surface O3 at Villum); JWH, PBS, and TKK (O3 from O-buoys); YK (O3 from R/V Mirai); WRS (BrO from O-buoys and BARC); DWT (ozonesondes at Alert, Eureka, and Resolute); NJ (Scoresbysund ozonesonde); RK (Sodankylä ozonesonde); KM (Ny-Ålesund ozonesonde); RVM (homogenized ozonesonde data); and RMS (NETCARE Polar-6 O3). WG wrote the manuscript with contributions from KT, HS, and JHC. All authors reviewed and edited the manuscript.
At least one of the (co-)authors is a member of the editorial board of Atmospheric Chemistry and Physics. The peer-review process was guided by an independent editor, and the authors also have no other competing interests to declare.
Publisher's note: Copernicus Publications remains neutral with regard to jurisdictional claims made in the text, published maps, institutional affiliations, or any other geographical representation in this paper. While Copernicus Publications makes every effort to include appropriate place names, the final responsibility lies with the authors.
This article is part of the special issue “Tropospheric Ozone Assessment Report Phase II (TOAR-II) Community Special Issue (ACP/AMT/BG/GMD inter-journal SI)”. It is not associated with a conference.
The authors would like to acknowledge the various data centres (NILU/EBAS, NSF/Arctic Data Center, NASA/NDACC, ECCC/WOUDC) for access to the observational data used in this study. Peter von der Gathen is acknowledged for his long-term effort in creating and maintaining the Ny-Ålesund ozonesonde dataset. We acknowledge Patrick Sheridan and Peter Tunved for making the aerosol absorption measurements at Summit and Zeppelin, respectively, available. We are grateful to the managers, staff, and technicians at the various sites for their work in making the measurement data available, particularly Karin Söderlund for Esrange surface O3 data and Rune Keller and Bjørn Aaholm for Villum surface O3 data. Gratitude is due to the Royal Danish Air Force and the Arctic Command for providing logistic support to Villum Research Station, and Christel Christoffersen, Bjarne Jensen, and Martin Ole Bjært Sørensen are gratefully acknowledged for their technical support. Wanmin Gong, Stephen R. Beagley, and Kenjiro Toyota would like to express their gratitude to the GEM-MACH development team at ECCC for technical support.
Yugo Kanaya was supported by the KAKENHI grant no. 21H04933 and by the ArCS (Arctic Challenge for Sustainability; grant no. JPMXD1300000000) and ArCS II (Grant Number JPMXD1420318865) of the Ministry of Education, Culture, Sports, Science, and Technology of Japan. The research of Peter Effertz and Irina Petropavlovskikh was supported by a NOAA Cooperative Agreement with CIRES, NA17OAR4320101. Villum Foundation financed the establishment of Villum Research Station (grant no. VKR023001). The Danish EPA has continuously funded the ozone measurements at Villum Research Station over the years by means of Environmental Support to the Arctic.
This paper was edited by Steven Brown and reviewed by two anonymous referees.
Aaltonen, H., Pumpanen, J., Pihlatie, M., Hakola, H., Hellén, H., Kulmala, L., Vesala, T., and Bäck, J.: Boreal pine forest floor biogenic volatile organic compound emissions peak in early summer and autumn, Spec. Issue Atmospheric Transp. Chem. For. Ecosyst., 151, 682–691, https://doi.org/10.1016/j.agrformet.2010.12.010, 2011.
Abbatt, J. P. D., Leaitch, W. R., Aliabadi, A. A., Bertram, A. K., Blanchet, J.-P., Boivin-Rioux, A., Bozem, H., Burkart, J., Chang, R. Y. W., Charette, J., Chaubey, J. P., Christensen, R. J., Cirisan, A., Collins, D. B., Croft, B., Dionne, J., Evans, G. J., Fletcher, C. G., Galí, M., Ghahreman, R., Girard, E., Gong, W., Gosselin, M., Gourdal, M., Hanna, S. J., Hayashida, H., Herber, A. B., Hesaraki, S., Hoor, P., Huang, L., Hussherr, R., Irish, V. E., Keita, S. A., Kodros, J. K., Köllner, F., Kolonjari, F., Kunkel, D., Ladino, L. A., Law, K., Levasseur, M., Libois, Q., Liggio, J., Lizotte, M., Macdonald, K. M., Mahmood, R., Martin, R. V., Mason, R. H., Miller, L. A., Moravek, A., Mortenson, E., Mungall, E. L., Murphy, J. G., Namazi, M., Norman, A.-L., O'Neill, N. T., Pierce, J. R., Russell, L. M., Schneider, J., Schulz, H., Sharma, S., Si, M., Staebler, R. M., Steiner, N. S., Thomas, J. L., von Salzen, K., Wentzell, J. J. B., Willis, M. D., Wentworth, G. R., Xu, J.-W., and Yakobi-Hancock, J. D.: Overview paper: New insights into aerosol and climate in the Arctic, Atmos. Chem. Phys., 19, 2527–2560, https://doi.org/10.5194/acp-19-2527-2019, 2019.
Adams, J. W., Holmes, N. S., and Crowley, J. N.: Uptake and reaction of HOBr on frozen and dry NaCl/NaBr surfaces between 253 and 233 K, Atmos. Chem. Phys., 2, 79–91, https://doi.org/10.5194/acp-2-79-2002, 2002.
Ainsworth, E. A., Yendrek, C. R., Sitch, S., Collins, W. J., and Emberson, L. D.: The Effects of Tropospheric Ozone on Net Primary Productivity and Implications for Climate Change, Annu. Rev. Plant Biol., 63, 637–661, https://doi.org/10.1146/annurev-arplant-042110-103829, 2012.
Alaska Interagency Coordination Center: 2015 Fire Season Weather Summary, Alaska Interagency Coordination Center, Alaska, https://fire.ak.blm.gov/content/Weather Folder/Fire Season Summaries/2015 Fire Season.pdf (last access: 24 July 2025), 2016.
Albert, M. R. and Shultz, E. F.: Snow and firn properties and air–snow transport processes at Summit, Greenland, AirSnowIce Interact. Arct. Results ALERT 2000 SUMMIT 2000, 36, 2789–2797, https://doi.org/10.1016/S1352-2310(02)00119-X, 2002.
Aliabadi, A. A., Thomas, J. L., Herber, A. B., Staebler, R. M., Leaitch, W. R., Schulz, H., Law, K. S., Marelle, L., Burkart, J., Willis, M. D., Bozem, H., Hoor, P. M., Köllner, F., Schneider, J., Levasseur, M., and Abbatt, J. P. D.: Ship emissions measurement in the Arctic by plume intercepts of the Canadian Coast Guard icebreaker Amundsen from the Polar 6 aircraft platform, Atmos. Chem. Phys., 16, 7899–7916, https://doi.org/10.5194/acp-16-7899-2016, 2016.
Alvarado, M. J., Logan, J. A., Mao, J., Apel, E., Riemer, D., Blake, D., Cohen, R. C., Min, K.-E., Perring, A. E., Browne, E. C., Wooldridge, P. J., Diskin, G. S., Sachse, G. W., Fuelberg, H., Sessions, W. R., Harrigan, D. L., Huey, G., Liao, J., Case-Hanks, A., Jimenez, J. L., Cubison, M. J., Vay, S. A., Weinheimer, A. J., Knapp, D. J., Montzka, D. D., Flocke, F. M., Pollack, I. B., Wennberg, P. O., Kurten, A., Crounse, J., Clair, J. M. St., Wisthaler, A., Mikoviny, T., Yantosca, R. M., Carouge, C. C., and Le Sager, P.: Nitrogen oxides and PAN in plumes from boreal fires during ARCTAS-B and their impact on ozone: an integrated analysis of aircraft and satellite observations, Atmos. Chem. Phys., 10, 9739–9760, https://doi.org/10.5194/acp-10-9739-2010, 2010.
AMAP: AMAP Assessment 2021: Impacts of Short-lived Climate Forcers on Arctic Climate, Air Quality, and Human Health, Arctic Monitoring and Assessment Programme (AMAP), Tromsø, Norway, ISBN: 978-82-7971-202-2, 2021.
Angot, H., McErlean, K., Hu, L., Millet, D. B., Hueber, J., Cui, K., Moss, J., Wielgasz, C., Milligan, T., Ketcherside, D., Bret-Harte, M. S., and Helmig, D.: Biogenic volatile organic compound ambient mixing ratios and emission rates in the Alaskan Arctic tundra, Biogeosciences, 17, 6219–6236, https://doi.org/10.5194/bg-17-6219-2020, 2020.
Arnold, S. R., Emmons, L. K., Monks, S. A., Law, K. S., Ridley, D. A., Turquety, S., Tilmes, S., Thomas, J. L., Bouarar, I., Flemming, J., Huijnen, V., Mao, J., Duncan, B. N., Steenrod, S., Yoshida, Y., Langner, J., and Long, Y.: Biomass burning influence on high-latitude tropospheric ozone and reactive nitrogen in summer 2008: a multi-model analysis based on POLMIP simulations, Atmos. Chem. Phys., 15, 6047–6068, https://doi.org/10.5194/acp-15-6047-2015, 2015.
Barrie, L. A.: Arctic air pollution: An overview of current knowledge, Atmos. Environ., 20, 643–663, https://doi.org/10.1016/0004-6981(86)90180-0, 1986.
Barrie, L. A., Bottenheim, J. W., Schnell, R. C., Crutzen, P. J., and Rasmussen, R. A.: Ozone destruction and photochemical reactions at polar sunrise in the lower Arctic atmosphere, Nature, 334, 138–141, https://doi.org/10.1038/334138a0, 1988.
Barrie, L. A., Yi, Y., Leaitch, W. R., Lohmann, U., Kasibhatla, P., Roelofs, G.-J., Wilson, J., Mcgovern, F., Benkovitz, C., Méliéres, M. A., Law, K., Prospero, J., Kritz, M., Bergmann, D., Bridgeman, C., Chin, M., Christensen, J., Easter, R., Feichter, J., Land, C., Jeuken, A., Kjellström, E., Koch, D., and Rasch, P.: A comparison of large-scale atmospheric sulphate aerosol models (COSAM): overview and highlights, Tellus B, 53, 615–645, https://doi.org/10.3402/tellusb.v53i5.16642, 2001.
Beagley, S., Gong, W., and Toyota, K.: GEM-MACH data for TOARII paper analysis for year 2015 v1.0.0 [data set], https://doi.org/10.5281/zenodo.14237307, 2025a.
Beagley, S., Gong, W., and Toyota, K.: Arctic-GEMMACH-Bromine24: v1.0.0 [code], https://doi.org/10.5281/zenodo.14217327, 2025b.
Benavent, N., Mahajan, A. S., Li, Q., Cuevas, C. A., Schmale, J., Angot, H., Jokinen, T., Quéléver, L. L. J., Blechschmidt, A.-M., Zilker, B., Richter, A., Serna, J. A., Garcia-Nieto, D., Fernandez, R. P., Skov, H., Dumitrascu, A., Simões Pereira, P., Abrahamsson, K., Bucci, S., Duetsch, M., Stohl, A., Beck, I., Laurila, T., Blomquist, B., Howard, D., Archer, S. D., Bariteau, L., Helmig, D., Hueber, J., Jacobi, H.-W., Posman, K., Dada, L., Daellenbach, K. R., and Saiz-Lopez, A.: Substantial contribution of iodine to Arctic ozone destruction, Nat. Geosci., 15, 770–773, https://doi.org/10.1038/s41561-022-01018-w, 2022.
Berg, T., Sekkesæter, S., Steinnes, E., Valdal, A.-K., and Wibetoe, G.: Springtime depletion of mercury in the European Arctic as observed at Svalbard, Pathw. Process. Mercury Environ. Sel. Pap. Present. Sixth Int. Conf. Mercury Glob. Pollut. Minamata Jpn., 15–19 Oct 2001, 304, 43–51, https://doi.org/10.1016/S0048-9697(02)00555-7, 2003.
Bergström, R., Denier van der Gon, H. A. C., Prévôt, A. S. H., Yttri, K. E., and Simpson, D.: Modelling of organic aerosols over Europe (2002–2007) using a volatility basis set (VBS) framework: application of different assumptions regarding the formation of secondary organic aerosol, Atmos. Chem. Phys., 12, 8499–8527, https://doi.org/10.5194/acp-12-8499-2012, 2012.
Bernays, N., Jaffe, D. A., Petropavlovskikh, I., and Effertz, P.: Comment on “Comparison of ozone measurement methods in biomass burning smoke: an evaluation under field and laboratory conditions” by Long et al. (2021), Atmos. Meas. Tech., 15, 3189–3192, https://doi.org/10.5194/amt-15-3189-2022, 2022.
Bottenheim, J. W. and Chan, E.: A trajectory study into the origin of spring time Arctic boundary layer ozone depletion, J. Geophys. Res.-Atmos., 111, D19301, https://doi.org/10.1029/2006JD007055, 2006.
Bottenheim, J. W., Netcheva, S., Morin, S., and Nghiem, S. V.: Ozone in the boundary layer air over the Arctic Ocean: measurements during the TARA transpolar drift 2006–2008, Atmos. Chem. Phys., 9, 4545–4557, https://doi.org/10.5194/acp-9-4545-2009, 2009.
Bozem, H., Hoor, P., Kunkel, D., Köllner, F., Schneider, J., Herber, A., Schulz, H., Leaitch, W. R., Aliabadi, A. A., Willis, M. D., Burkart, J., and Abbatt, J. P. D.: Characterization of transport regimes and the polar dome during Arctic spring and summer using in situ aircraft measurements, Atmos. Chem. Phys., 19, 15049–15071, https://doi.org/10.5194/acp-19-15049-2019, 2019.
Brandt, J., Silver, J. D., Frohn, L. M., Geels, C., Gross, A., Hansen, A. B., Hansen, K. M., Hedegaard, G. B., Skjøth, C. A., Villadsen, H., Zare, A., and Christensen, J. H.: An integrated model study for Europe and North America using the Danish Eulerian Hemispheric Model with focus on intercontinental transport of air pollution, AQMEII Int. Initiat. Eval. Reg. 53, 156–176, https://doi.org/10.1016/j.atmosenv.2012.01.011, 2012.
Brockway, N., Peterson, P. K., Bigge, K., Hajny, K. D., Shepson, P. B., Pratt, K. A., Fuentes, J. D., Starn, T., Kaeser, R., Stirm, B. H., and Simpson, W. R.: Tropospheric bromine monoxide vertical profiles retrieved across the Alaskan Arctic in springtime, Atmos. Chem. Phys., 24, 23–40, https://doi.org/10.5194/acp-24-23-2024, 2024.
Burd, J. A., Peterson, P. K., Nghiem, S. V., Perovich, D. K., and Simpson, W. R.: Snowmelt onset hinders bromine monoxide heterogeneous recycling in the Arctic, J. Geophys. Res.-Atmos., 122, 8297–8309, https://doi.org/10.1002/2017JD026906, 2017.
Burkholder, J. B., Sander, S. P., Abbatt, J., Barker, J. R., Cappa, C., Crounse, J. D., Dibble, T. S., Huie, R. E., Kolb, C. E., Kurylo, M. J., Orkin, V. L., Percival, C. J., Wilmouth, D. M., and Wine, P. H.: Chemical Kinetics and Photochemical Data for Use in Atmospheric Studies, Evaluation No. 19, JPL Publication 19-5, Jet Propulsion Laboratory, Pasadena, 2019.
Charron, M., Polavarapu, S., Buehner, M., Vaillancourt, P. A., Charette, C., Roch, M., Morneau, J., Garand, L., Aparicio, J. M., MacPherson, S., Pellerin, S., St-James, J., and Heilliette, S.: The Stratospheric Extension of the Canadian Global Deterministic Medium-Range Weather Forecasting System and Its Impact on Tropospheric Forecasts, Mon. Weather Rev., 140, 1924–1944, https://doi.org/10.1175/MWR-D-11-00097.1, 2012.
Chen, J., Anderson, K., Pavlovic, R., Moran, M. D., Englefield, P., Thompson, D. K., Munoz-Alpizar, R., and Landry, H.: The FireWork v2.0 air quality forecast system with biomass burning emissions from the Canadian Forest Fire Emissions Prediction System v2.03, Geosci. Model Dev., 12, 3283–3310, https://doi.org/10.5194/gmd-12-3283-2019, 2019.
Christensen, J. H.: The Danish eulerian hemispheric model – a three-dimensional air pollution model used for the arctic, Atmos. Environ., 31, 4169–4191, https://doi.org/10.1016/S1352-2310(97)00264-1, 1997.
Christensen, J. H., Brandt, J., Frohn, L. M., and Skov, H.: Modelling of Mercury in the Arctic with the Danish Eulerian Hemispheric Model, Atmos. Chem. Phys., 4, 2251–2257, https://doi.org/10.5194/acp-4-2251-2004, 2004.
Christiansen, B., Jepsen, N., Kivi, R., Hansen, G., Larsen, N., and Korsholm, U. S.: Trends and annual cycles in soundings of Arctic tropospheric ozone, Atmos. Chem. Phys., 17, 9347–9364, https://doi.org/10.5194/acp-17-9347-2017, 2017.
Clifton, O. E., Fiore, A. M., Massman, W. J., Baublitz, C. B., Coyle, M., Emberson, L., Fares, S., Farmer, D. K., Gentine, P., Gerosa, G., Guenther, A. B., Helmig, D., Lombardozzi, D. L., Munger, J. W., Patton, E. G., Pusede, S. E., Schwede, D. B., Silva, S. J., Sörgel, M., Steiner, A. L., and Tai, A. P. K.: Dry Deposition of Ozone Over Land: Processes, Measurement, and Modeling, Rev. Geophys., 58, e2019RG000670, https://doi.org/10.1029/2019RG000670, 2020.
Clifton, O. E., Schwede, D., Hogrefe, C., Bash, J. O., Bland, S., Cheung, P., Coyle, M., Emberson, L., Flemming, J., Fredj, E., Galmarini, S., Ganzeveld, L., Gazetas, O., Goded, I., Holmes, C. D., Horváth, L., Huijnen, V., Li, Q., Makar, P. A., Mammarella, I., Manca, G., Munger, J. W., Pérez-Camanyo, J. L., Pleim, J., Ran, L., San Jose, R., Silva, S. J., Staebler, R., Sun, S., Tai, A. P. K., Tas, E., Vesala, T., Weidinger, T., Wu, Z., and Zhang, L.: A single-point modeling approach for the intercomparison and evaluation of ozone dry deposition across chemical transport models (Activity 2 of AQMEII4), Atmos. Chem. Phys., 23, 9911–9961, https://doi.org/10.5194/acp-23-9911-2023, 2023
Côté, J., Gravel, S., Méthot, A., Patoine, A., Roch, M., and Staniforth, A.: The Operational CMC–MRB Global Environmental Multiscale (GEM) Model. Part I: Design Considerations and Formulation, Mon. Weather Rev., 126, 1373–1395, https://doi.org/10.1175/1520-0493(1998)126<1373:TOCMGE>2.0.CO;2, 1998a.
Côté, J., Desmarais, J.-G., Gravel, S., Méthot, A., Patoine, A., Roch, M., and Staniforth, A.: The Operational CMC–MRB Global Environmental Multiscale (GEM) Model. Part II: Results, Mon. Weather Rev., 126, 1397–1418, https://doi.org/10.1175/1520-0493(1998)126<1397:TOCMGE>2.0.CO;2, 1998b.
Custard, K. D., Raso, A. R. W., Shepson, P. B., Staebler, R. M., and Pratt, K. A.: Production and Release of Molecular Bromine and Chlorine from the Arctic Coastal Snowpack, ACS Earth Space Chem., 1, 142–151, https://doi.org/10.1021/acsearthspacechem.7b00014, 2017.
Dekhtyareva, A., Holmén, K., Maturilli, M., Hermansen, O., and Graversen, R.: Effect of seasonal mesoscale and microscale meteorological conditions in Ny-Ålesund on results of monitoring of long-range transported pollution, Polar Res., 37, 1508196, https://doi.org/10.1080/17518369.2018.1508196, 2018.
ECCC (Environment and Climate Change Canada): WOUDC (World Ozone and Ultraviolet Radiation Data Centre), ECCC [data set], https://www.woudc.org/en/data/data-access, last access: 24 July 2025.
Eckhardt, S., Quennehen, B., Olivié, D. J. L., Berntsen, T. K., Cherian, R., Christensen, J. H., Collins, W., Crepinsek, S., Daskalakis, N., Flanner, M., Herber, A., Heyes, C., Hodnebrog, Ø., Huang, L., Kanakidou, M., Klimont, Z., Langner, J., Law, K. S., Lund, M. T., Mahmood, R., Massling, A., Myriokefalitakis, S., Nielsen, I. E., Nøjgaard, J. K., Quaas, J., Quinn, P. K., Raut, J.-C., Rumbold, S. T., Schulz, M., Sharma, S., Skeie, R. B., Skov, H., Uttal, T., von Salzen, K., and Stohl, A.: Current model capabilities for simulating black carbon and sulfate concentrations in the Arctic atmosphere: a multi-model evaluation using a comprehensive measurement data set, Atmos. Chem. Phys., 15, 9413–9433, https://doi.org/10.5194/acp-15-9413-2015, 2015.
Emerson, E. W., Hodshire, A. L., DeBolt, H. M., Bilsback, K. R., Pierce, J. R., McMeeking, G. R., and Farmer, D. K.: Revisiting particle dry deposition and its role in radiative effect estimates, P. Natl. Acad. Sci. USA, 117, 26076–26082, https://doi.org/10.1073/pnas.2014761117, 2020.
Eneroth, K., Holmén, K., Berg, T., Schmidbauer, N., and Solberg, S.: Springtime depletion of tropospheric ozone, gaseous elemental mercury and non-methane hydrocarbons in the European Arctic, and its relation to atmospheric transport, Atmos. Environ., 41, 8511–8526, https://doi.org/10.1016/j.atmosenv.2007.07.008, 2007.
Environment and Climate Change Canada (ECCC): Marine Emission Inventory Tool (MEIT) version 4.3.1, 2015. https://www.canada.ca/en/environment-climate-change/ (last access: 25 July 2025), 2015.
Environment and Climate Change Canada: Canadian Air Pollutant Emission Inventory, https://www.canada.ca/en/environment-climate-change/, last access: 25 July 2025.
EPA (US Environmental Protection Agency): US National Emission Inventories, https://www.epa.gov/air-emissions-inventories, last access: 25 July 2025.
Falk, S. and Sinnhuber, B.-M.: Polar boundary layer bromine explosion and ozone depletion events in the chemistry–climate model EMAC v2.52: implementation and evaluation of AirSnow algorithm, Geosci. Model. Dev., 11, 1115–1131, https://doi.org/10.5194/gmd-11-1115-2018, 2018.
Fan, S.-M. and Jacob, D. J.: Surface ozone depletion in Arctic spring sustained by bromine reactions on aerosols, Nature, 359, 522–524, https://doi.org/10.1038/359522a0, 1992.
Fernandez, R. P., Carmona-Balea, A., Cuevas, C. A., Barrera, J. A., Kinnison, D. E., Lamarque, J.-F., Blaszczak-Boxe, C., Kim, K., Choi, W., Hay, T., Blechschmidt, A.-M., Schönhardt, A., Burrows, J. P., and Saiz-Lopez, A.: Modeling the Sources and Chemistry of Polar Tropospheric Halogens (Cl, Br, and I) Using the CAM-Chem Global chemistry-climate Model, J. Adv. Model. Earth Syst., 11, 2259–2289, https://doi.org/10.1029/2019MS001655, 2019.
Fernandez, R. P., Berná, L., Tomazzeli, O. G., Mahajan, A. S., Li, Q., Kinnison, D. E., Wang, S., Lamarque, J.-F., Tilmes, S., Skov, H., Cuevas, C. A., and Saiz-Lopez, A.: Arctic halogens reduce ozone in the northern mid-latitudes, P. Natl. Acad. Sci. USA, 121, e2401975121, https://doi.org/10.1073/pnas.2401975121, 2024.
Fleming, Z. L., Doherty, R. M., von Schneidemesser, E., Malley, C. S., Cooper, O. R., Pinto, J. P., Colette, A., Xu, X., Simpson, D., Schultz, M. G., Lefohn, A. S., Hamad, S., Moolla, R., Solberg, S., and Feng, Z.: Tropospheric Ozone Assessment Report: Present-day ozone distribution and trends relevant to human health, Elem. Sci. Anthr., 6, 12, https://doi.org/10.1525/elementa.273, 2018.
Foster, K. L., Plastridge, R. A., Bottenheim, J. W., Shepson, P. B., Finlayson-Pitts, B. J., and Spicer, C. W.: The Role of Br2 and BrCl in Surface Ozone Destruction at Polar Sunrise, Science, 291, 471–474, https://doi.org/10.1126/science.291.5503.471, 2001.
Frey, M. M., Norris, S. J., Brooks, I. M., Anderson, P. S., Nishimura, K., Yang, X., Jones, A. E., Nerentorp Mastromonaco, M. G., Jones, D. H., and Wolff, E. W.: First direct observation of sea salt aerosol production from blowing snow above sea ice, Atmos. Chem. Phys., 20, 2549–2578, https://doi.org/10.5194/acp-20-2549-2020, 2020.
Frieß, U., Sihler, H., Sander, R., Pöhler, D., Yilmaz, S., and Platt, U.: The vertical distribution of BrO and aerosols in the Arctic: Measurements by active and passive differential optical absorption spectroscopy, J. Geophys. Res.-Atmos., 116, D00R04, https://doi.org/10.1029/2011JD015938, 2011.
Fung, C., Misra, P., Bloxam, R., and Wong, S.: A numerical experiment on the relative importance of H2O2 O3 in aqueous conversion of SO2 to SO, Atmospheric Environ. Pt. Gen. Top., 25, 411–423, 1991.
Ghahreman, R., Gong, W., Galí, M., Norman, A.-L., Beagley, S. R., Akingunola, A., Zheng, Q., Lupu, A., Lizotte, M., Levasseur, M., and Leaitch, W. R.: Dimethyl sulfide and its role in aerosol formation and growth in the Arctic summer – a modelling study, Atmos. Chem. Phys., 19, 14455–14476, https://doi.org/10.5194/acp-19-14455-2019, 2019.
Gong, S. L., Barrie, L. A., Blanchet, J.-P., von Salzen, K., Lohmann, U., Lesins, G., Spacek, L., Zhang, L. M., Girard, E., Lin, H., Leaitch, R., Leighton, H., Chylek, P., and Huang, P.: Canadian Aerosol Module: A size-segregated simulation of atmospheric aerosol processes for climate and air quality models 1. Module development, J. Geophys. Res.-Atmos., 108, AAC 3-1–AAC 3-16, https://doi.org/10.1029/2001JD002002, 2003.
Gong, W., Dastoor, A. P., Bouchet, V. S., Gong, S., Makar, P. A., Moran, M. D., Pabla, B., Ménard, S., Crevier, L.-P., Cousineau, S., and Venkatesh, S.: Cloud processing of gases and aerosols in a regional air quality model (AURAMS), Atmos. Res., 82, 248–275, https://doi.org/10.1016/j.atmosres.2005.10.012, 2006.
Gong, W., Makar, P. A., Zhang, J., Milbrandt, J., Gravel, S., Hayden, K. L., Macdonald, A. M., and Leaitch, W. R.: Modelling aerosol–cloud–meteorology interaction: A case study with a fully coupled air quality model (GEM-MACH), Atmos. Environ., 115, 695–715, https://doi.org/10.1016/j.atmosenv.2015.05.062, 2015.
Gong, W., Beagley, S. R., Cousineau, S., Sassi, M., Munoz-Alpizar, R., Ménard, S., Racine, J., Zhang, J., Chen, J., Morrison, H., Sharma, S., Huang, L., Bellavance, P., Ly, J., Izdebski, P., Lyons, L., and Holt, R.: Assessing the impact of shipping emissions on air pollution in the Canadian Arctic and northern regions: current and future modelled scenarios, Atmos. Chem. Phys., 18, 16653–16687, https://doi.org/10.5194/acp-18-16653-2018, 2018.
Gong, W., Beagley, S., and Ghahreman, R.: Sources and Processes Affecting Air Pollution in the Arctic and Northern High Latitudes – A Modelling Study, in: Air Pollution Modeling and its Application XXVIII, Cham, 97–105, https://doi.org/10.1007/978-3-031-12786-1_13, 2022.
Gong, W., Beagley, S., Ghahreman, R., Sharma, S., Huang, L., Quinn, P. K., Massling, A., Pernov, J. B., Skov, H., Calzolai, G., Traversi, R., Aas, W., Yttri, K. E., Vestenius, M., Makkonen, U., Kivekäs, N., Kulmala, M., Aalto, P., and Fiebig, M.: Modelling Arctic Atmospheric Aerosols: Representation of Aerosol Processing by Ice and Mixed-Phase Clouds, in: Air Pollution Modeling and Its Application XXIX, Cham, 299–310, https://doi.org/10.1007/978-3-031-70424-6_36, 2025.
Government of Canada: Open Data Portal, Government of Canada [data set], https://search.open.canada.ca/opendata/, last access: 23 November 2024.
Gryning, S.-E., Batchvarova, E., Floors, R., Münkel, C., Sørensen, L. L., and Skov, H.: Observed aerosol-layer depth at Station Nord in the high Arctic, Int. J. Climatol., 43, 3247–3263, https://doi.org/10.1002/joc.8027, 2023.
Halfacre, J. W., Knepp, T. N., Shepson, P. B., Thompson, C. R., Pratt, K. A., Li, B., Peterson, P. K., Walsh, S. J., Simpson, W. R., Matrai, P. A., Bottenheim, J. W., Netcheva, S., Perovich, D. K., and Richter, A.: Temporal and spatial characteristics of ozone depletion events from measurements in the Arctic, Atmos. Chem. Phys., 14, 4875–4894, https://doi.org/10.5194/acp-14-4875-2014, 2014.
Halfacre, J. W., Shepson, P. B., and Pratt, K. A.: pH-dependent production of molecular chlorine, bromine, and iodine from frozen saline surfaces, Atmos. Chem. Phys., 19, 4917–4931, https://doi.org/10.5194/acp-19-4917-2019, 2019.
Hansen, K. M., Christensen, J. H., Brandt, J., Frohn, L. M., Geels, C., Skjøth, C. A., and Li, Y.-F.: Modeling short-term variability of α-hexachlorocyclohexane in Northern Hemispheric air, J. Geophys. Res.-Atmos., 113, D02310, https://doi.org/10.1029/2007JD008492, 2008.
Hanson, D. R., Ravishankara, A. R., and Lovejoy, E. R.: Reaction of BrONO2 with H2O on submicron sulfuric acid aerosol and the implications for the lower stratosphere, J. Geophys. Res.-Atmos., 101, 9063–9069, https://doi.org/10.1029/96JD00347, 1996.
Hatakka, J., Aalto, T., Aaltonen, V., Aurela, M., Hakola, H., Komppula, M., T. Laurila, Lihavainen, H., Paatero, J., Salminen, K., and Viisanen, Y.: Overview of the atmospheric research activities and results at Pallas GAW station, Boreal Environ. Res., 8, 365–383, 2003.
Hausmann, M. and Platt, U.: Spectroscopic measurement of bromine oxide and ozone in the high Arctic during Polar Sunrise Experiment 1992, J. Geophys. Res.-Atmos., 99, 25399–25413, https://doi.org/10.1029/94JD01314, 1994.
He, P., Bian, L., Zheng, X., Yu, J., Sun, C., Ye, P., and Xie, Z.: Observation of surface ozone in the marine boundary layer along a cruise through the Arctic Ocean: From offshore to remote, Atmos. Res., 169, 191–198, https://doi.org/10.1016/j.atmosres.2015.10.009, 2016.
Heidam, N. Z., Christensen, J., Wåhlin, P., and Skov, H.: Arctic atmospheric contaminants in NE Greenland: levels, variations, origins, transport, transformations and trends 1990–2001, Contam. Greenl. Environ. Update, 331, 5–28, https://doi.org/10.1016/j.scitotenv.2004.03.033, 2004.
Helmig, D., Ganzeveld, L., Butler, T., and Oltmans, S. J.: The role of ozone atmosphere-snow gas exchange on polar, boundary-layer tropospheric ozone – a review and sensitivity analysis, Atmos. Chem. Phys., 7, 15–30, https://doi.org/10.5194/acp-7-15-2007, 2007.
Helmig, D., Cohen, L. D., Bocquet, F., Oltmans, S., Grachev, A., and Neff, W.: Spring and summertime diurnal surface ozone fluxes over the polar snow at Summit, Greenland, Geophys. Res. Lett., 36, L08809, https://doi.org/10.1029/2008GL036549, 2009.
Herrmann, M., Sihler, H., Frieß, U., Wagner, T., Platt, U., and Gutheil, E.: Time-dependent 3D simulations of tropospheric ozone depletion events in the Arctic spring using the Weather Research and Forecasting model coupled with Chemistry (WRF-Chem), Atmos. Chem. Phys., 21, 7611–7638, https://doi.org/10.5194/acp-21-7611-2021, 2021.
Hersbach, H., Bell, B., Berrisford, P., Hirahara, S., Horányi, A., Muñoz-Sabater, J., Nicolas, J., Peubey, C., Radu, R., Schepers, D., Simmons, A., Soci, C., Abdalla, S., Abellan, X., Balsamo, G., Bechtold, P., Biavati, G., Bidlot, J., Bonavita, M., De Chiara, G., Dahlgren, P., Dee, D., Diamantakis, M., Dragani, R., Flemming, J., Forbes, R., Fuentes, M., Geer, A., Haimberger, L., Healy, S., Hogan, R. J., Hólm, E., Janisková, M., Keeley, S., Laloyaux, P., Lopez, P., Lupu, C., Radnoti, G., de Rosnay, P., Rozum, I., Vamborg, F., Villaume, S., and Thépaut, J.-N.: The ERA5 global reanalysis, Q. J. R. Meteorol. Soc., 146, 1999–2049, https://doi.org/10.1002/qj.3803, 2020.
Hertel, O., Christensen, J., Runge, E. H., Asman, W. A. H., Berkowicz, R., Hovmand, M. F., and Hov, Ø.: Development and testing of a new variable scale air pollution model – ACDEP, Atmos. Environ., 29, 1267–1290, https://doi.org/10.1016/1352-2310(95)00067-9, 1995.
Hirdman, D., Sodemann, H., Eckhardt, S., Burkhart, J. F., Jefferson, A., Mefford, T., Quinn, P. K., Sharma, S., Ström, J., and Stohl, A.: Source identification of short-lived air pollutants in the Arctic using statistical analysis of measurement data and particle dispersion model output, Atmos. Chem. Phys., 10, 669–693, https://doi.org/10.5194/acp-10-669-2010, 2010.
Hole, L. R., Christensen, J. H., Ruoho-Airola, T., Tørseth, K., Ginzburg, V., and Glowacki, P.: Past and future trends in concentrations of sulphur and nitrogen compounds in the Arctic, Atmos. Environ., 43, 928–939, https://doi.org/10.1016/j.atmosenv.2008.10.043, 2009.
Huang, J. and Jaeglé, L.: Wintertime enhancements of sea salt aerosol in polar regions consistent with a sea ice source from blowing snow, Atmos. Chem. Phys., 17, 3699–3712, https://doi.org/10.5194/acp-17-3699-2017, 2017.
Huang, J., Jaeglé, L., Chen, Q., Alexander, B., Sherwen, T., Evans, M. J., Theys, N., and Choi, S.: Evaluating the impact of blowing-snow sea salt aerosol on springtime BrO and O3 in the Arctic, Atmos. Chem. Phys., 20, 7335–7358, https://doi.org/10.5194/acp-20-7335-2020, 2020.
Huang, L., Gong, S. L., Jia, C. Q., and Lavoué, D.: Relative contributions of anthropogenic emissions to black carbon aerosol in the Arctic, J. Geophys. Res.-Atmos., 115, D19208, https://doi.org/10.1029/2009JD013592, 2010.
Inness, A., Ades, M., Agustí-Panareda, A., Barré, J., Benedictow, A., Blechschmidt, A.-M., Dominguez, J. J., Engelen, R., Eskes, H., Flemming, J., Huijnen, V., Jones, L., Kipling, Z., Massart, S., Parrington, M., Peuch, V.-H., Razinger, M., Remy, S., Schulz, M., and Suttie, M.: The CAMS reanalysis of atmospheric composition, Atmos. Chem. Phys., 19, 3515–3556, https://doi.org/10.5194/acp-19-3515-2019, 2019.
Jacobi, H.-W., Morin, S., and Bottenheim, J. W.: Observation of widespread depletion of ozone in the springtime boundary layer of the central Arctic linked to mesoscale synoptic conditions, J. Geophys. Res.-Atmos., 115, D17302, https://doi.org/10.1029/2010JD013940, 2010.
Jaeglé, L., Shah, V., Thornton, J. A., Lopez-Hilfiker, F. D., Lee, B. H., McDuffie, E. E., Fibiger, D., Brown, S. S., Veres, P., Sparks, T. L., Ebben, C. J., Wooldridge, P. J., Kenagy, H. S., Cohen, R. C., Weinheimer, A. J., Campos, T. L., Montzka, D. D., Digangi, J. P., Wolfe, G. M., Hanisco, T., Schroder, J. C., Campuzano-Jost, P., Day, D. A., Jimenez, J. L., Sullivan, A. P., Guo, H., and Weber, R. J.: Nitrogen Oxides Emissions, Chemistry, Deposition, and Export Over the Northeast United States During the WINTER Aircraft Campaign, J. Geophys. Res.-Atmos., 123, 12368–12393, https://doi.org/10.1029/2018JD029133, 2018.
Jaffe, D. A. and Wigder, N. L.: Ozone production from wildfires: A critical review, Atmos. Environ., 51, 1–10, https://doi.org/10.1016/j.atmosenv.2011.11.063, 2012.
Jeong, D., McNamara, S. M., Barget, A. J., Raso, A. R. W., Upchurch, L. M., Thanekar, S., Quinn, P. K., Simpson, W. R., Fuentes, J. D., Shepson, P. B., and Pratt, K. A.: Multiphase Reactive Bromine Chemistry during Late Spring in the Arctic: Measurements of Gases, Particles, and Snow, ACS Earth Space Chem., 6, 2877–2887, https://doi.org/10.1021/acsearthspacechem.2c00189, 2022.
Jiang, W.: Instantaneous secondary organic aerosol yields and their comparison with overall aerosol yields for aromatic and biogenic hydrocarbons, Atmos. Environ., 37, 5439–5444, https://doi.org/10.1016/j.atmosenv.2003.09.018, 2003.
Jones, A. E., Anderson, P. S., Begoin, M., Brough, N., Hutterli, M. A., Marshall, G. J., Richter, A., Roscoe, H. K., and Wolff, E. W.: BrO, blizzards, and drivers of polar tropospheric ozone depletion events, Atmos. Chem. Phys., 9, 4639–4652, https://doi.org/10.5194/acp-9-4639-2009, 2009.
Jonson, J. E. and Isaksen, I. S. A.: Tropospheric ozone chemistry. The impact of cloud chemistry, J. Atmos. Chem., 16, 99–122, https://doi.org/10.1007/BF00702781, 1993.
Junninen, H., Ahonen, L., Bianchi, F., Quéléver, L., Schallhart, S., Dada, L., Manninen, H. E., Leino, K., Lampilahti, J., Buenrostro Mazon, S., Rantala, P., Räty, M., Kontkanen, J., Negri, S., Aliaga, D., Garmash, O., Alekseychik, P., Lipp, H., Tamme, K., Levula, J., Sipilä, M., Ehn, M., Worsnop, D., Zilitinkevich, S., Mammarella, I., Rinne, J., Vesala, T., Petäjä, T., Kerminen, V.-M., and Kulmala, M.: Terpene emissions from boreal wetlands can initiate stronger atmospheric new particle formation than boreal forests, Commun. Earth Environ., 3, 93, https://doi.org/10.1038/s43247-022-00406-9, 2022.
Kaiser, J. W., Heil, A., Andreae, M. O., Benedetti, A., Chubarova, N., Jones, L., Morcrette, J.-J., Razinger, M., Schultz, M. G., Suttie, M., and van der Werf, G. R.: Biomass burning emissions estimated with a global fire assimilation system based on observed fire radiative power, Biogeosciences, 9, 527–554, https://doi.org/10.5194/bg-9-527-2012, 2012.
Kämäri, J., Joki-Heiskala, P., Christensen, J., Degermann, E., Derome, J., Hoff, R., and Kahkonen, A. M.: Acidifying pollutants, Arctic haze, and acidifications in the Arctic, in: AMAP Assessment Report: Arctic Pollution Issues. Arctic Monitoring and Assessment Programme (AMAP), Arctic Monitoring and Assessment Programme, Oslo, Norway, 859, ISBN: 82-7655-061-4, 1998.
Kanaya, Y., Miyazaki, K., Taketani, F., Miyakawa, T., Takashima, H., Komazaki, Y., Pan, X., Kato, S., Sudo, K., Sekiya, T., Inoue, J., Sato, K., and Oshima, K.: Ozone and carbon monoxide observations over open oceans on R/V Mirai from 67° S to 75° N during 2012 to 2017: testing global chemical reanalysis in terms of Arctic processes, low ozone levels at low latitudes, and pollution transport, Atmos. Chem. Phys., 19, 7233–7254, https://doi.org/10.5194/acp-19-7233-2019, 2019.
Kanaya, Y., Sommariva, R., Saiz-Lopez, A., Mazzeo, A., Koenig, T. K., Kawana, K., Johnson, J. E., Colomb, A., Tulet, P., Molloy, S., Galbally, I. E., Volkamer, R., Mahajan, A., Halfacre, J. W., Shepson, P. B., Schmale, J., Angot, H., Blomquist, B., Shupe, M. D., Helmig, D., Gil, J., Lee, M., Coburn, S. C., Ortega, I., Chen, G., Lee, J., Aikin, K. C., Parrish, D. D., Holloway, J. S., Ryerson, T. B., Pollack, I. B., Williams, E. J., Lerner, B. M., Weinheimer, A. J., Campos, T., Flocke, F. M., Spackman, J. R., Bourgeois, I., Peischl, J., Thompson, C. R., Staebler, R. M., Aliabadi, A. A., Gong, W., Van Malderen, R., Thompson, A. M., Stauffer, R. M., Kollonige, D. E., Gómez Martin, J. C., Fujiwara, M., Read, K., Rowlinson, M., Sato, K., Kurokawa, J., Iwamoto, Y., Taketani, F., Takashima, H., Navarro Comas, M., Panagi, M., and Schultz, M. G.: Observational ozone data over the global oceans and polar regions: The TOAR-II Oceans data set version 2024, Earth Syst. Sci. Data Discuss. [preprint], https://doi.org/10.5194/essd-2024-566, in review, 2025.
Klimont, Z., Kupiainen, K., Heyes, C., Purohit, P., Cofala, J., Rafaj, P., Borken-Kleefeld, J., and Schöpp, W.: Global anthropogenic emissions of particulate matter including black carbon, Atmos Chem Phys, 17, 8681–8723, https://doi.org/10.5194/acp-17-8681-2017, 2017.
Knepp, T. N., Bottenheim, J., Carlsen, M., Carlson, D., Donohoue, D., Friederich, G., Matrai, P. A., Netcheva, S., Perovich, D. K., Santini, R., Shepson, P. B., Simpson, W., Valentic, T., Williams, C., and Wyss, P. J.: Development of an autonomous sea ice tethered buoy for the study of ocean-atmosphere-sea ice-snow pack interactions: the O-buoy, Atmos Meas Tech, 3, 249–261, https://doi.org/10.5194/amt-3-249-2010, 2010.
Krnavek, L., Simpson, W. R., Carlson, D., Domine, F., Douglas, T. A., and Sturm, M.: The chemical composition of surface snow in the Arctic: Examining marine, terrestrial, and atmospheric influences, Atmos. Environ., 50, 349–359, https://doi.org/10.1016/j.atmosenv.2011.11.033, 2012.
Law, K. S., Stohl, A., Quinn, P. K., Brock, C. A., Burkhart, J. F., Paris, J.-D., Ancellet, G., Singh, H. B., Roiger, A., Schlager, H., Dibb, J., Jacob, D. J., Arnold, S. R., Pelon, J., and Thomas, J. L.: Arctic Air Pollution: New Insights from POLARCAT-IPY, Bull. Am. Meteorol. Soc., 95, 1873–1895, https://doi.org/10.1175/BAMS-D-13-00017.1, 2014.
Law, K. S., Hjorth, J. L., Pernov, J. B., Whaley, C. H., Skov, H., Collaud Coen, M., Langner, J., Arnold, S. R., Tarasick, D., Christensen, J., Deushi, M., Effertz, P., Faluvegi, G., Gauss, M., Im, U., Oshima, N., Petropavlovskikh, I., Plummer, D., Tsigaridis, K., Tsyro, S., Solberg, S., and Turnock, S. T.: Arctic Tropospheric Ozone Trends, Geophys. Res. Lett., 50, e2023GL103096, https://doi.org/10.1029/2023GL103096, 2023.
Leaitch, W. R., Korolev, A., Aliabadi, A. A., Burkart, J., Willis, M. D., Abbatt, J. P. D., Bozem, H., Hoor, P., Köllner, F., Schneider, J., Herber, A., Konrad, C., and Brauner, R.: Effects of 20–100 nm particles on liquid clouds in the clean summertime Arctic, Atmos. Chem. Phys., 16, 11107–11124, https://doi.org/10.5194/acp-16-11107-2016, 2016.
Lehrer, E., Wagenbach, D., and Platt, U.: Aerosol chemical composition during tropospheric ozone depletion at Ny Ålesund/Svalbard, Tellus B, 49, 486–495, https://doi.org/10.3402/tellusb.v49i5.15987, 1997.
Lehrer, E., Hönninger, G., and Platt, U.: A one dimensional model study of the mechanism of halogen liberation and vertical transport in the polar troposphere, Atmos. Chem. Phys., 4, 2427–2440, https://doi.org/10.5194/acp-4-2427-2004, 2004.
Logan, J. A.: An analysis of ozonesonde data for the troposphere: Recommendations for testing 3-D models and development of a gridded climatology for tropospheric ozone, J. Geophys. Res.-Atmos., 104, 16115–16149, https://doi.org/10.1029/1998JD100096, 1999.
Long, R. W., Whitehill, A., Habel, A., Urbanski, S., Halliday, H., Colón, M., Kaushik, S., and Landis, M. S.: Comparison of ozone measurement methods in biomass burning smoke: an evaluation under field and laboratory conditions, Atmos. Meas. Tech., 14, 1783–1800, https://doi.org/10.5194/amt-14-1783-2021, 2021.
Lurmann, F. W., Lloyd, A. C., and Atkinson, R.: A chemical mechanism for use in long-range transport/acid deposition computer modeling, J. Geophys. Res.-Atmos., 91, 10905–10936, https://doi.org/10.1029/JD091iD10p10905, 1986.
Magnussen, S. and Taylor, S. W.: Inter- and intra-annual profiles of fire regimes in the managed forests of Canada and implications for resource sharing, Int. J. Wildland Fire, 21, 328–341, 2012.
Mahajan, A. S., Shaw, M., Oetjen, H., Hornsby, K. E., Carpenter, L. J., Kaleschke, L., Tian-Kunze, X., Lee, J. D., Moller, S. J., Edwards, P., Commane, R., Ingham, T., Heard, D. E., and Plane, J. M. C.: Evidence of reactive iodine chemistry in the Arctic boundary layer, J. Geophys. Res.-Atmos., 115, D20303, https://doi.org/10.1029/2009JD013665, 2010.
Makar, P. A., Bouchet, V. S., and Nenes, A.: Inorganic chemistry calculations using HETV – a vectorized solver for the SO–NO3–NH system based on the ISORROPIA algorithms, Atmos. Environ., 37, 2279–2294, https://doi.org/10.1016/S1352-2310(03)00074-8, 2003.
Makar, P. A., Gong, W., Milbrandt, J., Hogrefe, C., Zhang, Y., Curci, G., Žabkar, R., Im, U., Balzarini, A., Baró, R., Bianconi, R., Cheung, P., Forkel, R., Gravel, S., Hirtl, M., Honzak, L., Hou, A., Jiménez-Guerrero, P., Langer, M., Moran, M. D., Pabla, B., Pérez, J. L., Pirovano, G., San José, R., Tuccella, P., Werhahn, J., Zhang, J., and Galmarini, S.: Feedbacks between air pollution and weather, Part 1: Effects on weather, Atmos. Environ., 115, 442–469, https://doi.org/10.1016/j.atmosenv.2014.12.003, 2015a.
Makar, P. A., Gong, W., Hogrefe, C., Zhang, Y., Curci, G., Žabkar, R., Milbrandt, J., Im, U., Balzarini, A., Baró, R., Bianconi, R., Cheung, P., Forkel, R., Gravel, S., Hirtl, M., Honzak, L., Hou, A., Jiménez-Guerrero, P., Langer, M., Moran, M. D., Pabla, B., Pérez, J. L., Pirovano, G., San José, R., Tuccella, P., Werhahn, J., Zhang, J., and Galmarini, S.: Feedbacks between air pollution and weather, Part 2: Effects on chemistry, Atmos. Environ., 115, 499–526, https://doi.org/10.1016/j.atmosenv.2014.10.021, 2015b.
Makar, P. A., Akingunola, A., Aherne, J., Cole, A. S., Aklilu, Y.-A., Zhang, J., Wong, I., Hayden, K., Li, S.-M., Kirk, J., Scott, K., Moran, M. D., Robichaud, A., Cathcart, H., Baratzedah, P., Pabla, B., Cheung, P., Zheng, Q., and Jeffries, D. S.: Estimates of exceedances of critical loads for acidifying deposition in Alberta and Saskatchewan, Atmos. Chem. Phys., 18, 9897–9927, https://doi.org/10.5194/acp-18-9897-2018, 2018.
Marelle, L., Thomas, J. L., Ahmed, S., Tuite, K., Stutz, J., Dommergue, A., Simpson, W. R., Frey, M. M., and Baladima, F.: Implementation and Impacts of Surface and Blowing Snow Sources of Arctic Bromine Activation Within WRF-Chem 4.1.1, J. Adv. Model. Earth Syst., 13, e2020MS002391, https://doi.org/10.1029/2020MS002391, 2021.
Mårtensson, E. M., Nilsson, E. D., de Leeuw, G., Cohen, L. H., and Hansson, H.-C.: Laboratory simulations and parameterization of the primary marine aerosol production, J. Geophys. Res.-Atmos., 108, 4297, https://doi.org/10.1029/2002JD002263, 2003.
Massling, A., Nielsen, I. E., Kristensen, D., Christensen, J. H., Sørensen, L. L., Jensen, B., Nguyen, Q. T., Nøjgaard, J. K., Glasius, M., and Skov, H.: Atmospheric black carbon and sulfate concentrations in Northeast Greenland, Atmos. Chem. Phys., 15, 9681–9692, https://doi.org/10.5194/acp-15-9681-2015, 2015.
McDuffie, E. E., Fibiger, D. L., Dubé, W. P., Lopez-Hilfiker, F., Lee, B. H., Thornton, J. A., Shah, V., Jaeglé, L., Guo, H., Weber, R. J., Michael Reeves, J., Weinheimer, A. J., Schroder, J. C., Campuzano-Jost, P., Jimenez, J. L., Dibb, J. E., Veres, P., Ebben, C., Sparks, T. L., Wooldridge, P. J., Cohen, R. C., Hornbrook, R. S., Apel, E. C., Campos, T., Hall, S. R., Ullmann, K., and Brown, S. S.: Heterogeneous N2O5 Uptake During Winter: Aircraft Measurements During the 2015 WINTER Campaign and Critical Evaluation of Current Parameterizations, J. Geophys. Res.-Atmos., 123, 4345–4372, https://doi.org/10.1002/2018JD028336, 2018.
McTaggart-Cowan, R., Vaillancourt, P. A., Zadra, A., Chamberland, S., Charron, M., Corvec, S., Milbrandt, J. A., Paquin-Ricard, D., Patoine, A., Roch, M., Separovic, L., and Yang, J.: Modernization of Atmospheric Physics Parameterization in Canadian NWP, J. Adv. Model. Earth Syst., 11, 3593–3635, https://doi.org/10.1029/2019MS001781, 2019.
Michalowski, B. A., Francisco, J. S., Li, S.-M., Barrie, L. A., Bottenheim, J. W., and Shepson, P. B.: A computer model study of multiphase chemistry in the Arctic boundary layer during polar sunrise, J. Geophys. Res.-Atmos., 105, 15131–15145, https://doi.org/10.1029/2000JD900004, 2000.
Mills, G., HAYES, F., SIMPSON, D., EMBERSON, L., NORRIS, D., HARMENS, H., and BÜKER, P.: Evidence of widespread effects of ozone on crops and (semi-)natural vegetation in Europe (1990–2006) in relation to AOT40- and flux-based risk maps, Glob. Change Biol., 17, 592–613, https://doi.org/10.1111/j.1365-2486.2010.02217.x, 2011.
Mills, G., Pleijel, H., Malley, C. S., Sinha, B., Cooper, O. R., Schultz, M. G., Neufeld, H. S., Simpson, D., Sharps, K., Feng, Z., Gerosa, G., Harmens, H., Kobayashi, K., Saxena, P., Paoletti, E., Sinha, V., and Xu, X.: Tropospheric Ozone Assessment Report: Present-day tropospheric ozone distribution and trends relevant to vegetation, Elem. Sci. Anthr., 6, 47, https://doi.org/10.1525/elementa.302, 2018.
Moeini, O., Tarasick, D. W., McElroy, C. T., Liu, J., Osman, M. K., Thompson, A. M., Parrington, M., Palmer, P. I., Johnson, B., Oltmans, S. J., and Merrill, J.: Estimating wildfire-generated ozone over North America using ozonesonde profiles and a differential back trajectory technique, Atmos. Environ. X, 7, 100078, https://doi.org/10.1016/j.aeaoa.2020.100078, 2020.
Monahan, E. C., Spiel, D. E., and Davidson, K. L.: A Model of Marine Aerosol Generation Via Whitecaps and Wave Disruption, in: Oceanic Whitecaps: And Their Role in Air-Sea Exchange Processes, edited by: Monahan, E. C. and Niocaill, G. M., Springer Netherlands, Dordrecht, 167–174, https://doi.org/10.1007/978-94-009-4668-2_16, 1986.
Monks, P. S., Archibald, A. T., Colette, A., Cooper, O., Coyle, M., Derwent, R., Fowler, D., Granier, C., Law, K. S., Mills, G. E., Stevenson, D. S., Tarasova, O., Thouret, V., von Schneidemesser, E., Sommariva, R., Wild, O., and Williams, M. L.: Tropospheric ozone and its precursors from the urban to the global scale from air quality to short-lived climate forcer, Atmos. Chem. Phys., 15, 8889–8973, https://doi.org/10.5194/acp-15-8889-2015, 2015a.
Monks, S. A., Arnold, S. R., Emmons, L. K., Law, K. S., Turquety, S., Duncan, B. N., Flemming, J., Huijnen, V., Tilmes, S., Langner, J., Mao, J., Long, Y., Thomas, J. L., Steenrod, S. D., Raut, J. C., Wilson, C., Chipperfield, M. P., Diskin, G. S., Weinheimer, A., Schlager, H., and Ancellet, G.: Multi-model study of chemical and physical controls on transport of anthropogenic and biomass burning pollution to the Arctic, Atmos. Chem. Phys., 15, 3575–3603, https://doi.org/10.5194/acp-15-3575-2015, 2015b.
Moore, C. W., Obrist, D., Steffen, A., Staebler, R. M., Douglas, T. A., Richter, A., and Nghiem, S. V.: Convective forcing of mercury and ozone in the Arctic boundary layer induced by leads in sea ice, Nature, 506, 81–84, https://doi.org/10.1038/nature12924, 2014.
Moran, M. D., Pavlovic, R., and Anselmo, D.: Regional Air Quality Deterministic Prediction System (RAQDPS): Update from version 019 to version 020, Canadian Meteorological Centre Technical Note, 43 pp., Environment and Climate Change Canada, https://collaboration.cmc.ec.gc.ca/ (last access: 24 July 2025), 2018.
NDACC (Network for Detection of Atmospheric Composition Change): Ozonesonde data, NDACC [data set], https://ndacc.larc.nasa.gov/, last access: 23 July 2025.
Nenes, A., Pandis, S. N., and Pilinis, C.: Continued development and testing of a new thermodynamic aerosol module for urban and regional air quality models, Atmos. Environ., 33, 1553–1560, https://doi.org/10.1016/S1352-2310(98)00352-5, 1999.
Norwegian Institute for Air Research (NILU): EBAS database, NILU [data set], https://ebas.nilu.no/, last access: 13 November 2024.
NSF Arctic Data Center: Data repository, NSF Arctic Data Center [data set], https://arcticdata.io/, last access: 23 November 2024.
Odum, J. R., Hoffmann, T., Bowman, F., Collins, D., Flagan, R. C., and Seinfeld, J. H.: Gas/Particle Partitioning and Secondary Organic Aerosol Yields, Environ. Sci. Technol., 30, 2580–2585, https://doi.org/10.1021/es950943+, 1996.
Oltmans, S. J., Johnson, B. J., and Harris, J. M.: Springtime boundary layer ozone depletion at Barrow, Alaska: Meteorological influence, year-to-year variation, and long-term change, J. Geophys. Res.-Atmos., 117, D00R18, https://doi.org/10.1029/2011JD016889, 2012.
Orlando, J. J. and Burkholder, J. B.: Identification of BrONO as the Major Product in the Gas-Phase Reaction of Br with NO2, J. Phys. Chem. A, 104, 2048–2053, https://doi.org/10.1021/jp993713g, 2000.
Oum, K. W., Lakin, M. J., and Finlayson-Pitts, B. J.: Bromine activation in the troposphere by the dark reaction of O3 with seawater ice, Geophys. Res. Lett., 25, 3923–3926, https://doi.org/10.1029/1998GL900078, 1998.
Pernov, J. B., Bossi, R., Lebourgeois, T., Nøjgaard, J. K., Holzinger, R., Hjorth, J. L., and Skov, H.: Atmospheric VOC measurements at a High Arctic site: characteristics and source apportionment, Atmos. Chem. Phys., 21, 2895–2916, https://doi.org/10.5194/acp-21-2895-2021, 2021.
Pernov, J. B., Hjorth, J. L., Sørensen, L. L., and Skov, H.: On the dynamics of ozone depletion events at Villum Research Station in the High Arctic, EGUsphere [preprint], https://doi.org/10.5194/egusphere-2024-1676, 2024.
Peterson, P. K., Pöhler, D., Sihler, H., Zielcke, J., General, S., Frieß, U., Platt, U., Simpson, W. R., Nghiem, S. V., Shepson, P. B., Stirm, B. H., Dhaniyala, S., Wagner, T., Caulton, D. R., Fuentes, J. D., and Pratt, K. A.: Observations of bromine monoxide transport in the Arctic sustained on aerosol particles, Atmos. Chem. Phys., 17, 7567–7579, https://doi.org/10.5194/acp-17-7567-2017, 2017.
Peterson, P. K., Hartwig, M., May, N. W., Schwartz, E., Rigor, I., Ermold, W., Steele, M., Morison, J. H., Nghiem, S. V., and Pratt, K. A.: Snowpack measurements suggest role for multi-year sea ice regions in Arctic atmospheric bromine and chlorine chemistry, Elem. Sci. Anthr., 7, 14, https://doi.org/10.1525/elementa.352, 2019.
Peterson, P. K., Pratt, K. A., Shepson, P. B., and Simpson, W. R.: Impacts of Arctic oil field NOx emissions on downwind bromine chemistry: insights from 5 years of MAX-DOAS observations, Faraday Discuss., 258, 293–306, https://doi.org/10.1039/D4FD00164, 2025.
Pfister, G. G., Emmons, L. K., Hess, P. G., Honrath, R., Lamarque, J.-F., Val Martin, M., Owen, R. C., Avery, M. A., Browell, E. V., Holloway, J. S., Nedelec, P., Purvis, R., Ryerson, T. B., Sachse, G. W., and Schlager, H.: Ozone production from the 2004 North American boreal fires, J. Geophys. Res.-Atmos., 111, D24S07, https://doi.org/10.1029/2006JD007695, 2006.
Platt, S. M., Hov, Ø., Berg, T., Breivik, K., Eckhardt, S., Eleftheriadis, K., Evangeliou, N., Fiebig, M., Fisher, R., Hansen, G., Hansson, H.-C., Heintzenberg, J., Hermansen, O., Heslin-Rees, D., Holmén, K., Hudson, S., Kallenborn, R., Krejci, R., Krognes, T., Larssen, S., Lowry, D., Lund Myhre, C., Lunder, C., Nisbet, E., Nizzetto, P. B., Park, K.-T., Pedersen, C. A., Aspmo Pfaffhuber, K., Röckmann, T., Schmidbauer, N., Solberg, S., Stohl, A., Ström, J., Svendby, T., Tunved, P., Tørnkvist, K., van der Veen, C., Vratolis, S., Yoon, Y. J., Yttri, K. E., Zieger, P., Aas, W., and Tørseth, K.: Atmospheric composition in the European Arctic and 30 years of the Zeppelin Observatory, Ny-Ålesund, Atmos. Chem. Phys., 22, 3321–3369, https://doi.org/10.5194/acp-22-3321-2022, 2022.
Pratt, K. A., Custard, K. D., Shepson, P. B., Douglas, T. A., Pöhler, D., General, S., Zielcke, J., Simpson, W. R., Platt, U., Tanner, D. J., Gregory Huey, L., Carlsen, M., and Stirm, B. H.: Photochemical production of molecular bromine in Arctic surface snowpacks, Nat. Geosci., 6, 351–356, https://doi.org/10.1038/ngeo1779, 2013.
Rantanen, M., Karpechko, A. Yu., Lipponen, A., Nordling, K., Hyvärinen, O., Ruosteenoja, K., Vihma, T., and Laaksonen, A.: The Arctic has warmed nearly four times faster than the globe since 1979, Commun. Earth Environ., 3, 168, https://doi.org/10.1038/s43247-022-00498-3, 2022.
Raso, A. R. W., Custard, K. D., May, N. W., Tanner, D., Newburn, M. K., Walker, L., Moore, R. J., Huey, L. G., Alexander, L., Shepson, P. B., and Pratt, K. A.: Active molecular iodine photochemistry in the Arctic, P. Natl. Acad. Sci. USA, 114, 10053–10058, https://doi.org/10.1073/pnas.1702803114, 2017.
Saiz-Lopez, A. and von Glasow, R.: Reactive halogen chemistry in the troposphere, Chem. Soc. Rev., 41, 6448–6472, https://doi.org/10.1039/C2CS35208G, 2012.
Sander, R., Jöckel, P., Kirner, O., Kunert, A. T., Landgraf, J., and Pozzer, A.: The photolysis module JVAL-14, compatible with the MESSy standard, and the JVal PreProcessor (JVPP), Geosci. Model Dev., 7, 2653–2662, https://doi.org/10.5194/gmd-7-2653-2014, 2014.
Sandu, A. and Sander, R.: Technical note: Simulating chemical systems in Fortran90 and Matlab with the Kinetic PreProcessor KPP-2.1, Atmos. Chem. Phys., 6, 187–195, https://doi.org/10.5194/acp-6-187-2006, 2006.
Sarwar, G., Gantt, B., Schwede, D., Foley, K., Mathur, R., and Saiz-Lopez, A.: Impact of Enhanced Ozone Deposition and Halogen Chemistry on Tropospheric Ozone over the Northern Hemisphere, Environ. Sci. Technol., 49, 9203–9211, https://doi.org/10.1021/acs.est.5b01657, 2015.
Schweitzer, F., Mirabel, P., and George, C.: Uptake of Hydrogen Halides by Water Droplets, J. Phys. Chem. A, 104, 72–76, https://doi.org/10.1021/jp992621o, 2000.
Seabrook, J. A., Whiteway, J., Staebler, R. M., Bottenheim, J. W., Komguem, L., Gray, L. H., Barber, D., and Asplin, M.: LIDAR measurements of Arctic boundary layer ozone depletion events over the frozen Arctic Ocean, J. Geophys. Res.-Atmos., 116, D00S02, https://doi.org/10.1029/2011JD016335, 2011.
Shindell, D. T., Chin, M., Dentener, F., Doherty, R. M., Faluvegi, G., Fiore, A. M., Hess, P., Koch, D. M., MacKenzie, I. A., Sanderson, M. G., Schultz, M. G., Schulz, M., Stevenson, D. S., Teich, H., Textor, C., Wild, O., Bergmann, D. J., Bey, I., Bian, H., Cuvelier, C., Duncan, B. N., Folberth, G., Horowitz, L. W., Jonson, J., Kaminski, J. W., Marmer, E., Park, R., Pringle, K. J., Schroeder, S., Szopa, S., Takemura, T., Zeng, G., Keating, T. J., and Zuber, A.: A multi-model assessment of pollution transport to the Arctic, Atmos. Chem. Phys., 8, 5353–5372, https://doi.org/10.5194/acp-8-5353-2008, 2008.
Simpson, D., Benedictow, A., Berge, H., Bergström, R., Emberson, L. D., Fagerli, H., Flechard, C. R., Hayman, G. D., Gauss, M., Jonson, J. E., Jenkin, M. E., Nyíri, A., Richter, C., Semeena, V. S., Tsyro, S., Tuovinen, J.-P., Valdebenito, Á., and Wind, P.: The EMEP MSC-W chemical transport model – technical description, Atmos. Chem. Phys., 12, 7825–7865, https://doi.org/10.5194/acp-12-7825-2012, 2012.
Simpson, W.: Atmospheric measurements via Multiple Axis Differential Optical Absorption Spectroscopy (MAXDOAS), Utqiagvik (Barrow), Alaska 2012–2018, Arctic Data Center, https://doi.org/10.18739/A2222R550, 2018.
Simpson, W., Perovich, Donald, Matrai, P., Shepson, P., and Chavez, F.: The Collaborative O-Buoy Project: Deployment of a Network of Arctic Ocean Chemical Sensors for the IPY and beyond, Arctic Data Center, https://doi.org/10.18739/A2WD4W, 2009.
Simpson, W. R., Alvarez-Aviles, L., Douglas, T. A., Sturm, M., and Domine, F.: Halogens in the coastal snow pack near Barrow, Alaska: Evidence for active bromine air-snow chemistry during springtime, Geophys. Res. Lett., 32, L04811, https://doi.org/10.1029/2004GL021748, 2005.
Simpson, W. R., von Glasow, R., Riedel, K., Anderson, P., Ariya, P., Bottenheim, J., Burrows, J., Carpenter, L. J., Frieß, U., Goodsite, M. E., Heard, D., Hutterli, M., Jacobi, H.-W., Kaleschke, L., Neff, B., Plane, J., Platt, U., Richter, A., Roscoe, H., Sander, R., Shepson, P., Sodeau, J., Steffen, A., Wagner, T., and Wolff, E.: Halogens and their role in polar boundary-layer ozone depletion, Atmos. Chem. Phys., 7, 4375–4418, https://doi.org/10.5194/acp-7-4375-2007, 2007.
Simpson, W. R., Peterson, P. K., Frieß, U., Sihler, H., Lampel, J., Platt, U., Moore, C., Pratt, K., Shepson, P., Halfacre, J., and Nghiem, S. V.: Horizontal and vertical structure of reactive bromine events probed by bromine monoxide MAX-DOAS, Atmos. Chem. Phys., 17, 9291–9309, https://doi.org/10.5194/acp-17-9291-2017, 2017.
Simpson, W. R., Frieß, U., Thomas, J. L., Lampel, J., and Platt, U.: Polar Nighttime Chemistry Produces Intense Reactive Bromine Events, Geophys. Res. Lett., 45, 9987–9994, https://doi.org/10.1029/2018GL079444, 2018.
Singh, H. B., Anderson, B. E., Brune, W. H., Cai, C., Cohen, R. C., Crawford, J. H., Cubison, M. J., Czech, E. P., Emmons, L., Fuelberg, H. E., Huey, G., Jacob, D. J., Jimenez, J. L., Kaduwela, A., Kondo, Y., Mao, J., Olson, J. R., Sachse, G. W., Vay, S. A., Weinheimer, A., Wennberg, P. O., and Wisthaler, A.: Pollution influences on atmospheric composition and chemistry at high northern latitudes: Boreal and California forest fire emissions, Atmos. Environ., 44, 4553–4564, https://doi.org/10.1016/j.atmosenv.2010.08.026, 2010.
Skamarock, W. C., Klemp, J. B., Dudhia, J., Gill, D. O., Barker, D., Wang, W., and Powers, J. G.: A Description of the Advanced Research WRF Model Version 3, NCAR Technical Note, NCAR/TN-475+STR, 27 pp., https://opensky.ucar.edu/islandora/object/%3A3814 (last access: 24 July 2025), 2008.
Skov, H., Christensen, J. H., Goodsite, M. E., Heidam, N. Z., Jensen, B., Wåhlin, P., and Geernaert, G.: Fate of Elemental Mercury in the Arctic during Atmospheric Mercury Depletion Episodes and the Load of Atmospheric Mercury to the Arctic, Environ. Sci. Technol., 38, 2373–2382, https://doi.org/10.1021/es030080h, 2004.
Skov, H., Hjorth, J., Nordstrøm, C., Jensen, B., Christoffersen, C., Bech Poulsen, M., Baldtzer Liisberg, J., Beddows, D., Dall'Osto, M., and Christensen, J. H.: Variability in gaseous elemental mercury at Villum Research Station, Station Nord, in North Greenland from 1999 to 2017, Atmos. Chem. Phys., 20, 13253–13265, https://doi.org/10.5194/acp-20-13253-2020, 2020.
Smith, G. C., Roy, F., Reszka, M., Surcel Colan, D., He, Z., Deacu, D., Belanger, J.-M., Skachko, S., Liu, Y., Dupont, F., Lemieux, J.-F., Beaudoin, C., Tranchant, B., Drévillon, M., Garric, G., Testut, C.-E., Lellouche, J.-M., Pellerin, P., Ritchie, H., Lu, Y., Davidson, F., Buehner, M., Caya, A., and Lajoie, M.: Sea ice forecast verification in the Canadian Global Ice Ocean Prediction System, Q. J. R. Meteorol. Soc., 142, 659–671, https://doi.org/10.1002/qj.2555, 2016.
Soares, J., Sofiev, M., Geels, C., Christensen, J. H., Andersson, C., Tsyro, S., and Langner, J.: Impact of climate change on the production and transport of sea salt aerosol on European seas, Atmos. Chem. Phys., 16, 13081–13104, https://doi.org/10.5194/acp-16-13081-2016, 2016.
Solberg, S., Schmidbauer, N., Semb, A., Stordal, F., and Hov, Ø.: Boundary-layer ozone depletion as seen in the Norwegian Arctic in spring, J. Atmos. Chem., 23, 301–332, https://doi.org/10.1007/BF00055158, 1996.
Sommar, J., Andersson, M. E., and Jacobi, H.-W.: Circumpolar measurements of speciated mercury, ozone and carbon monoxide in the boundary layer of the Arctic Ocean, Atmos. Chem. Phys., 10, 5031–5045, https://doi.org/10.5194/acp-10-5031-2010, 2010.
Stockwell, W. and Lurmann, F.: Intercomparison of the ADOM and RADM gas-phase chemical mechanisms, Electr. Power Res. Inst. Top. Rep. EPRI, 3412, 1989.
Strand, A. and Hov, Ø.: A two-dimensional global study of tropospheric ozone production, J. Geophys. Res.-Atmos., 99, 22877–22895, https://doi.org/10.1029/94JD01945, 1994.
Stroud, C. A., Makar, P. A., Zhang, J., Moran, M. D., Akingunola, A., Li, S.-M., Leithead, A., Hayden, K., and Siu, M.: Improving air quality model predictions of organic species using measurement-derived organic gaseous and particle emissions in a petrochemical-dominated region, Atmos. Chem. Phys., 18, 13531–13545, https://doi.org/10.5194/acp-18-13531-2018, 2018.
Swanson, W. F., Graham, K. A., Halfacre, J. W., Holmes, C. D., Shepson, P. B., and Simpson, W. R.: Arctic Reactive Bromine Events Occur in Two Distinct Sets of Environmental Conditions: A Statistical Analysis of 6 Years of Observations, J. Geophys. Res.-Atmos., 125, e2019JD032139, https://doi.org/10.1029/2019JD032139, 2020.
Swanson, W. F., Holmes, C. D., Simpson, W. R., Confer, K., Marelle, L., Thomas, J. L., Jaeglé, L., Alexander, B., Zhai, S., Chen, Q., Wang, X., and Sherwen, T.: Comparison of model and ground observations finds snowpack and blowing snow aerosols both contribute to Arctic tropospheric reactive bromine, Atmos. Chem. Phys., 22, 14467–14488, https://doi.org/10.5194/acp-22-14467-2022, 2022.
Thomas, D. C., Christensen, J. H., Massling, A., Pernov, J. B., and Skov, H.: The effect of the 2020 COVID-19 lockdown on atmospheric black carbon levels in northeastern Greenland, Atmos. Environ., 269, 118853, https://doi.org/10.1016/j.atmosenv.2021.118853, 2022.
Thomas, J. L., Raut, J.-C., Law, K. S., Marelle, L., Ancellet, G., Ravetta, F., Fast, J. D., Pfister, G., Emmons, L. K., Diskin, G. S., Weinheimer, A., Roiger, A., and Schlager, H.: Pollution transport from North America to Greenland during summer 2008, Atmos. Chem. Phys., 13, 3825–3848, https://doi.org/10.5194/acp-13-3825-2013, 2013.
Toyota, K., McConnell, J. C., Lupu, A., Neary, L., McLinden, C. A., Richter, A., Kwok, R., Semeniuk, K., Kaminski, J. W., Gong, S.-L., Jarosz, J., Chipperfield, M. P., and Sioris, C. E.: Analysis of reactive bromine production and ozone depletion in the Arctic boundary layer using 3-D simulations with GEM-AQ: inference from synoptic-scale patterns, Atmos. Chem. Phys., 11, 3949–3979, https://doi.org/10.5194/acp-11-3949-2011, 2011.
Toyota, K., McConnell, J. C., Staebler, R. M., and Dastoor, A. P.: Air–snowpack exchange of bromine, ozone and mercury in the springtime Arctic simulated by the 1-D model PHANTAS – Part 1: In-snow bromine activation and its impact on ozone, Atmospheric Chem. Phys., 14, 4101–4133, https://doi.org/10.5194/acp-14-4101-2014, 2014.
Tschudi, M. A., Meier, W. N., and Stewart, J. S.: An enhancement to sea ice motion and age products at the National Snow and Ice Data Center (NSIDC), The Cryosphere, 14, 1519–1536, https://doi.org/10.5194/tc-14-1519-2020, 2020.
US Environmental Protection Agency: Integrated Science Assessment (ISA) for Ozone and Related Photochemical Oxidants (Final Report, Feb 2013), U.S. Environmental Protection Agency, Washington, DC, EPA/600/R-10/076F, https://assessments.epa.gov/isa/document/&deid=247492 (last access: 24 July 2025), 2013.
Uttal, T., Makshtas, A., and Laurila, T.: The Tiksi International Hydrometeorological Observatory - An Arctic members Partnership, Bull. World Meteorol. Organ., 62, 22–26, 2013.
Uttal, T., Starkweather, S., Drummond, J. R., Vihma, T., Makshtas, A. P., Darby, L. S., Burkhart, J. F., Cox, C. J., Schmeisser, L. N., Haiden, T., Maturilli, M., Shupe, M. D., De Boer, G., Saha, A., Grachev, A. A., Crepinsek, S. M., Bruhwiler, L., Goodison, B., McArthur, B., Walden, V. P., Dlugokencky, E. J., Persson, P. O. G., Lesins, G., Laurila, T., Ogren, J. A., Stone, R., Long, C. N., Sharma, S., Massling, A., Turner, D. D., Stanitski, D. M., Asmi, E., Aurela, M., Skov, H., Eleftheriadis, K., Virkkula, A., Platt, A., Førland, E. J., Iijima, Y., Nielsen, I. E., Bergin, M. H., Candlish, L., Zimov, N. S., Zimov, S. A., O'Neill, N. T., Fogal, P. F., Kivi, R., Konopleva-Akish, E. A., Verlinde, J., Kustov, V. Y., Vasel, B., Ivakhov, V. M., Viisanen, Y., and Intrieri, J. M.: International Arctic Systems for Observing the Atmosphere: An International Polar Year Legacy Consortium, Bull. Am. Meteorol. Soc., 97, 1033–1056, https://doi.org/10.1175/BAMS-D-14-00145.1, 2016.
Val Martin, M., Kahn, R. A., and Tosca, M. G.: A Global Analysis of Wildfire Smoke Injection Heights Derived from Space-Based Multi-Angle Imaging, Remote Sens., 10, https://doi.org/10.3390/rs10101609, 2018.
Van Dam, B., Helmig, D., Burkhart, J. F., Obrist, D., and Oltmans, S. J.: Springtime boundary layer O3 and GEM depletion at Toolik Lake, Alaska, J. Geophys. Res.-Atmos., 118, 3382–3391, https://doi.org/10.1002/jgrd.50213, 2013.
Van Dam, B., Helmig, D., Doskey, P. V., and Oltmans, S. J.: Summertime surface O3 behavior and deposition to tundra in the Alaskan Arctic, J. Geophys. Res.-Atmos., 121, 8055–8066, https://doi.org/10.1002/2015JD023914, 2016.
Van Malderen, R., Thompson, A. M., Kollonige, D. E., Stauffer, R. M., Smit, H. G. J., Maillard Barras, E., Vigouroux, C., Petropavlovskikh, I., Leblanc, T., Thouret, V., Wolff, P., Effertz, P., Tarasick, D. W., Poyraz, D., Ancellet, G., De Backer, M.-R., Evan, S., Flood, V., Frey, M. M., Hannigan, J. W., Hernandez, J. L., Iarlori, M., Johnson, B. J., Jones, N., Kivi, R., Mahieu, E., McConville, G., Müller, K., Nagahama, T., Notholt, J., Piters, A., Prats, N., Querel, R., Smale, D., Steinbrecht, W., Strong, K., and Sussmann, R.: Global Ground-based Tropospheric Ozone Measurements: Reference Data and Individual Site Trends (2000–2022) from the TOAR-II/HEGIFTOM Project, EGUsphere [preprint], https://doi.org/10.5194/egusphere-2024-3736, 2025.
Venkatram, A., Karamchandani, P., and Misra, P.: Testing a comprehensive acid deposition model, Atmos. Environ., 22, 737–747, 1988.
Wachsmuth, M., Gäggeler, H. W., von Glasow, R., and Ammann, M.: Accommodation coefficient of HOBr on deliquescent sodium bromide aerosol particles, Atmos. Chem. Phys., 2, 121–131, https://doi.org/10.5194/acp-2-121-2002, 2002.
Wagner, A., Bennouna, Y., Blechschmidt, A.-M., Brasseur, G., Chabrillat, S., Christophe, Y., Errera, Q., Eskes, H., Flemming, J., Hansen, K. M., Inness, A., Kapsomenakis, J., Langerock, B., Richter, A., Sudarchikova, N., Thouret, V., and Zerefos, C.: Comprehensive evaluation of the Copernicus Atmosphere Monitoring Service (CAMS) reanalysis against independent observations: Reactive gases, Elem. Sci. Anthr., 9, 00171, https://doi.org/10.1525/elementa.2020.00171, 2021.
Walker, T. W., Jones, D. B. A., Parrington, M., Henze, D. K., Murray, L. T., Bottenheim, J. W., Anlauf, K., Worden, J. R., Bowman, K. W., Shim, C., Singh, K., Kopacz, M., Tarasick, D. W., Davies, J., von der Gathen, P., Thompson, A. M., and Carouge, C. C.: Impacts of midlatitude precursor emissions and local photochemistry on ozone abundances in the Arctic, J. Geophys. Res.-Atmos., 117, D01305, https://doi.org/10.1029/2011JD016370, 2012.
Wang, S., McNamara, S. M., Moore, C. W., Obrist, D., Steffen, A., Shepson, P. B., Staebler, R. M., Raso, A. R. W., and Pratt, K. A.: Direct detection of atmospheric atomic bromine leading to mercury and ozone depletion, P. Natl. Acad. Sci. USA, 116, 14479–14484, https://doi.org/10.1073/pnas.1900613116, 2019.
Wang, Y., Ridley, B., Fried, A., Cantrell, C., Davis, D., Chen, G., Snow, J., Heikes, B., Talbot, R., Dibb, J., Flocke, F., Weinheimer, A., Blake, N., Blake, D., Shetter, R., Lefer, B., Atlas, E., Coffey, M., Walega, J., and Wert, B.: Springtime photochemistry at northern mid and high latitudes, J. Geophys. Res.-Atmos., 108, 8358, https://doi.org/10.1029/2002JD002227, 2003.
Wesely, M. L.: Parameterization of surface resistances to gaseous dry deposition in regional-scale numerical models, Atmos. Environ.. 23, 1293–1304, https://doi.org/10.1016/0004-6981(89)90153-4, 1989.
Whaley, C. H., Mahmood, R., von Salzen, K., Winter, B., Eckhardt, S., Arnold, S., Beagley, S., Becagli, S., Chien, R.-Y., Christensen, J., Damani, S. M., Dong, X., Eleftheriadis, K., Evangeliou, N., Faluvegi, G., Flanner, M., Fu, J. S., Gauss, M., Giardi, F., Gong, W., Hjorth, J. L., Huang, L., Im, U., Kanaya, Y., Krishnan, S., Klimont, Z., Kühn, T., Langner, J., Law, K. S., Marelle, L., Massling, A., Olivié, D., Onishi, T., Oshima, N., Peng, Y., Plummer, D. A., Popovicheva, O., Pozzoli, L., Raut, J.-C., Sand, M., Saunders, L. N., Schmale, J., Sharma, S., Skeie, R. B., Skov, H., Taketani, F., Thomas, M. A., Traversi, R., Tsigaridis, K., Tsyro, S., Turnock, S., Vitale, V., Walker, K. A., Wang, M., Watson-Parris, D., and Weiss-Gibbons, T.: Model evaluation of short-lived climate forcers for the Arctic Monitoring and Assessment Programme: a multi-species, multi-model study, Atmos. Chem. Phys., 22, 5775–5828, https://doi.org/10.5194/acp-22-5775-2022, 2022.
Whaley, C. H., Law, K. S., Hjorth, J. L., Skov, H., Arnold, S. R., Langner, J., Pernov, J. B., Bergeron, G., Bourgeois, I., Christensen, J. H., Chien, R.-Y., Deushi, M., Dong, X., Effertz, P., Faluvegi, G., Flanner, M., Fu, J. S., Gauss, M., Huey, G., Im, U., Kivi, R., Marelle, L., Onishi, T., Oshima, N., Petropavlovskikh, I., Peischl, J., Plummer, D. A., Pozzoli, L., Raut, J.-C., Ryerson, T., Skeie, R., Solberg, S., Thomas, M. A., Thompson, C., Tsigaridis, K., Tsyro, S., Turnock, S. T., von Salzen, K., and Tarasick, D. W.: Arctic tropospheric ozone: assessment of current knowledge and model performance, Atmos. Chem. Phys., 23, 637–661, https://doi.org/10.5194/acp-23-637-2023, 2023.
Widmaier, E. M., Jensen, A. R., and Pratt, K. A.: Arctic tropospheric ozone seasonality, depletion, and oil field influence, Faraday Discuss., 258, 265–292, https://doi.org/10.1039/D4FD00166D, 2025.
Wiedinmyer, C., Akagi, S. K., Yokelson, R. J., Emmons, L. K., Al-Saadi, J. A., Orlando, J. J., and Soja, A. J.: The Fire INventory from NCAR (FINN): a high resolution global model to estimate the emissions from open burning, Geosci. Model Dev., 4, 625–641, https://doi.org/10.5194/gmd-4-625-2011, 2011.
Wittrock, F., Müller, R., Richter, A., Bovensmann, H., and Burrows, J. P.: Measurements of iodine monoxide (IO) above Spitsbergen, Geophys. Res. Lett., 27, 1471–1474, https://doi.org/10.1029/1999GL011146, 2000.
World Health organization: Review of evidence on health aspects of air pollution – REVIHAAP final technical report, World Health Organization, Regional Office for Europe, Copenhagen, Denmark, https://iris.who.int/bitstream/handle/10665/341712/WHO-EURO-2013-4101-43860-61757-eng.pdf (last access: 24 July 2025), 2013.
Yang, X., Cox, R. A., Warwick, N. J., Pyle, J. A., Carver, G. D., O'Connor, F. M., and Savage, N. H.: Tropospheric bromine chemistry and its impacts on ozone: A model study, J. Geophys. Res.-Atmos., 110, D23311, https://doi.org/10.1029/2005JD006244, 2005.
Yang, X., Pyle, J. A., and Cox, R. A.: Sea salt aerosol production and bromine release: Role of snow on sea ice, Geophys. Res. Lett., 35, L16815, https://doi.org/10.1029/2008GL034536, 2008.
Yang, X., Pyle, J. A., Cox, R. A., Theys, N., and Van Roozendael, M.: Snow-sourced bromine and its implications for polar tropospheric ozone, Atmos. Chem. Phys., 10, 7763–7773, https://doi.org/10.5194/acp-10-7763-2010, 2010.
Yang, X., Blechschmidt, A.-M., Bognar, K., McClure-Begley, A., Morris, S., Petropavlovskikh, I., Richter, A., Skov, H., Strong, K., Tarasick, D. W., Uttal, T., Vestenius, M., and Zhao, X.: Pan-Arctic surface ozone: modelling vs. measurements, Atmos. Chem. Phys., 20, 15937–15967, https://doi.org/10.5194/acp-20-15937-2020, 2020.
Young, P. J., Naik, V., Fiore, A. M., Gaudel, A., Guo, J., Lin, M. Y., Neu, J. L., Parrish, D. D., Rieder, H. E., Schnell, J. L., Tilmes, S., Wild, O., Zhang, L., Ziemke, J., Brandt, J., Delcloo, A., Doherty, R. M., Geels, C., Hegglin, M. I., Hu, L., Im, U., Kumar, R., Luhar, A., Murray, L., Plummer, D., Rodriguez, J., Saiz-Lopez, A., Schultz, M. G., Woodhouse, M. T., and Zeng, G.: Tropospheric Ozone Assessment Report: Assessment of global-scale model performance for global and regional ozone distributions, variability, and trends, Elem. Sci. Anthr., 6, 10, https://doi.org/10.1525/elementa.265, 2018.
Zhai, S., Swanson, W., McConnell, J. R., Chellman, N., Opel, T., Sigl, M., Meyer, H., Wang, X., Jaeglé, L., Stutz, J., Dibb, J. E., Fujita, K., and Alexander, B.: Implications of Snowpack Reactive Bromine Production for Arctic Ice Core Bromine Preservation, J. Geophys. Res.-Atmos., 128, e2023JD039257, https://doi.org/10.1029/2023JD039257, 2023.
Zhang, L., Gong, S., Padro, J., and Barrie, L.: A size-segregated particle dry deposition scheme for an atmospheric aerosol module, Atmos. Environ., 35, 549–560, https://doi.org/10.1016/S1352-2310(00)00326-5, 2001.
In the case of GEM-MACH, a sensitivity run was conducted with the snowpack bromine flux turned off, which effectively turned off the bromine chemistry in the simulation. In the case of DEHM, a sensitivity run was conducted by turning off the blowing-snow-sourced bromine, while the bromine sourced from open-ocean sea spray remained active.