the Creative Commons Attribution 4.0 License.
the Creative Commons Attribution 4.0 License.
Does total column ozone change during a solar eclipse?
Germar H. Bernhard
George T. Janson
Scott Simpson
Raúl R. Cordero
Edgardo I. Sepúlveda Araya
Jose Jorquera
Juan A. Rayas
Randall N. Lind
Several publications have reported that total column ozone (TCO) may oscillate with an amplitude of up to 10 DU (Dobson units) during a solar eclipse, whereas other researchers have not seen evidence that an eclipse leads to variations in TCO beyond the typical natural variability. Here, we try to resolve these contradictions by measuring short-term variations (of seconds to minutes) in TCO using “global” (Sun and sky) and direct-Sun observations in the ultraviolet (UV) range with filter radiometers (GUVis-3511 and Microtops II®). Measurements were performed during three solar eclipses: the “Great American Eclipse” of 2024, which was observed in Mazatlán, Mexico, on 8 April 2024; a partial solar eclipse that took place in the United States on 14 October 2023 and was observed at Fort Collins, Colorado (40.57° N, 105.10° W); and a total solar eclipse that occurred in Antarctica on 4 December 2021 and was observed at Union Glacier (79.76° S, 82.84° W). The upper limits of the amplitude of oscillations in TCO observed at Mazatlán, Fort Collins, and Antarctica were 0.4 %, 0.3 %, and 0.03 %, respectively. The variability at all sites was within that observed during times not affected by an eclipse. The slightly larger variability at Mazatlán is due to cirrus clouds occurring throughout the day of the eclipse and the difficulty of separating changes in the ozone layer from cloud effects. These results support the conclusion that a solar eclipse does not lead to variations in TCO of more than ± 1.2 DU and that these variations are likely much lower, drawing into question reports of much larger oscillations. In addition to calculating TCO, we also present changes in the spectral irradiance and aerosol optical depth during eclipses and compare radiation levels observed during totality. The new results augment our understanding of the effect of a solar eclipse on the Earth's upper atmosphere.
- Article
(10630 KB) - Full-text XML
- BibTeX
- EndNote
Solar eclipses present a rare and unique opportunity to study the solar corona and changes in the atmosphere prompted by the sudden decrease in the solar flux. Other lesser-known, and sometimes curious, phenomena include the dissipation of cumulus clouds (Trees et al., 2024), changes in the surface tension of water (Fuchs et al., 2019), spiders taking down their webs at the onset of totality (Uetz et al., 2010), and many others. Here, we investigate the potential effect of solar eclipses on the ozone layer. After reviewing observations of changes in total column ozone (TCO) performed during the last century and appraising their potential causes, we present new results based on our own observations during two total solar eclipse in Mexico and Antarctica and one partial eclipse in Colorado. The main objective of the paper is to assess whether the strong effects of a solar eclipse on the stratospheric ozone layer reported in the past could be real or are spurious results arising from measurement artifacts. We also compare spectral irradiances observed during totality of the 2017, 2021, and 2024 total solar eclipses.
1.1 Reported changes in total column ozone during solar eclipses
Variations in TCO during a solar eclipse were observed as early as 1937 (Kawabata, 1937). Since this time, many authors have reported short-term and longer-lasting fluctuations in TCO during solar eclipses (e.g., Kazadzis et al., 2007; Mateos et al., 2014; Mims and Mims, 1993; Zerefos et al., 2000, 2001, 2007; Antón et al., 2010; Kazantzidis et al., 2007). Additional observations before the 1970s were summarized by Fuchs et al. (2019). Results from these studies often indicate either variations in TCO that are symmetrical relative to the time of totality or sporadic short-term fluctuations in TCO before and after totality. Variations range from unrealistic decreases of more than 100 DU (Dobson units) over the course of an eclipse (Jerlov et al., 1954) or equally improbable increases of 70 DU within 15 min following totality (Chakrabarty et al., 1997).
Several authors acknowledge that changes in TCO are artifacts of their measurements. Zerefos et al. (2000) report unrealistic decreases in TCO measurements during an eclipse and attribute those to diffuse sky radiance entering the field of view of Dobson and Brewer spectrophotometers observing the Sun's direct component. Furthermore, Kazadzis et al. (2007) ascribe an approximate 75 DU drop in TCO measured during the eclipse of 29 March 2006 with a Brewer spectrophotometer to this effect. We find this conclusion unconvincing because the direct-to-diffuse ratio does not change appreciatively during an eclipse (Emde and Mayer, 2007; Bernhard and Petkov, 2019), except for a short (< 4 min) period before and after totality. Conversely, Bojkov (1968) finds that ozone increases by 25–30 DU during the maximum phase of the eclipse and attributes this increase partly to the wavelength dependence of the solar limb darkening (LD) effect (Sect. 1.2). By applying a correction for this effect, the increase is reduced to 14 DU. Antón et al. (2010) find the opposite behavior in the evolution of TCO during the solar eclipse of 3 October 2005 derived from a Brewer spectrophotometer and a NILU (Norwegian Institute for Air Research) multi-band instrument: while Brewer TCO values increased by about 15 DU, the NILU measurements decreased by about 11 DU. The discrepancy is attributed to measurement artifacts. Mateos et al. (2014) observed TCO during the partial eclipse of 3 November 2013 in Badajoz, Spain, with a handheld Microtops II® sunphotometer from Solar Light (Sect. 3.2) and found a 7 DU decrease in TCO during the eclipse maximum. Reasons for this decrease were not provided.
Mims and Mims (1993), Zerefos et al. (2000), Zerefos et al. (2001), and Zerefos et al. (2007) reported short-term fluctuations in TCO during an eclipse, which they attributed to gravity waves. As discussed in Sect. 1.3 in more detail, gravity waves result from the reduction in the solar flux caused by the Moon's shadow during solar eclipses. The sudden drop in atmospheric energy input may induce perturbations in the ionosphere (Zhang et al., 2017) and stratosphere (Colligan et al., 2020). For example, TCO measurements taken during the total solar eclipse of 11 July 1991 “reveal a sequence of 4 and possibly 5 nearly uniformly spaced fluctuations” after totality (Mims and Mims, 1993). The principle fluctuation, which began 700 s after totality, had a peak-to-peak amplitude of 5 DU (1.7 %). This fluctuation was preceded by one and followed by two fluctuations with reduced amplitude. However, these observations were also likely affected by incomplete LD correction, resulting in TCO changes of 26 DU (about 9 %) over the course of the eclipse. Winkler et al. (2001) concluded that it is “very difficult to quantify these instrumentally based effects and to separate them from naturally produced ozone fluctuations”.
Kazantzidis et al. (2007) discuss TCO measurements performed with NILU-UV filter radiometers at several locations in Greece during the total solar eclipse of 29 March 2006. They did not observe any periodic fluctuations in TCO and only report a small increase in TCO of about 5 DU as the visible fraction of the Sun decreases from ∼ 60 % to ∼ 20 %, followed by a pronounced decrease in measured TCO closer to totality, which they attribute to artifacts in the irradiance measurements.
The clearest evidence to date that a solar eclipse may lead to fluctuation in TCO was presented by Zerefos et al. (2007), who correlated ground-based measurements of TCO and ultraviolet radiation (photolysis rate of the reaction of O3 to O(1D) or JO1D) near the Greek town of Kastellorizo (36° N) with ionosonde total electron content (TEC) measurements during the solar eclipse of 29 March 2006. The TCO was measured with a Brewer spectrophotometer, and it dipped by 75 DU (or 25 %) near the time of totality, allegedly due to contamination by diffuse sky radiance in the instrument's field of view (as mentioned above). To remove this artifact, two second-order polynomials were fitted to the data points, and residuals to this fit were then calculated. Residuals had an amplitude of about 5–10 DU (1.7 %–3.5 %). Spectral Fourier analysis revealed oscillations in TCO with a dominant period in the range of 28–38 min and a secondary oscillation with a period of 12–13 min. Cross-spectrum analysis of JO1D against ionospheric TEC revealed a distinct covariance between the frequency components of both parameters, suggesting that oscillations in TEC and TCO were driven by gravity waves initiated in the stratosphere.
Bernhard and Petkov (2019) (hereinafter B&P19) reported ∼ 8 % increases in TCO during the “Great American Eclipse” of 21 August 2017, which were symmetrical about totality. However, these increases disappeared after correcting for the LD effect (Sect. 1.2), suggesting that they were not caused by changes in TCO. Furthermore, oscillations in TCO before and after totality were not observed.
Lastly, variations in ozone concentrations during the annular solar eclipse of 21 June 2020 have recently been reported in the upper stratosphere and mesosphere based on observations by the Microwave Limb Sounder (MLS) on NASA's Aura satellite (Li et al., 2023). Accordingly, ozone concentrations decreased slightly near 40 km between 24 and 36° N near 90° E, whereas they increased conspicuously above 45 km, particularly between 60 and 65 km. These changes are comparable in magnitude with the effect of the day–night cycle on ozone concentrations at these altitudes (discussed in Sect. 1.4). However, as approximately 99 % of ozone is at altitudes below 45 km, the effect on TCO is expected to be small. We also note that the MLS dataset is not well suited for observing short-term phenomena, such as a solar eclipse, as the instrument only provides a few measurements during the period and over the geographic region of interest. Therefore, it is difficult to separate dynamic and naturally occurring effects from those caused by an eclipse. This challenge with respect to distinguishing between dynamic and eclipse-related processes was also emphasized by Akhil Raj and Ratnam (2021), who discussed changes in the vertical distribution of ozone that they observed during the annular eclipse of 26 December 2019 over India.
As several authors attribute the observed changes to the solar LD effect and gravity waves, we assess both phenomena in the following.
1.2 Solar limb darkening
The TCO is typically derived from measurements at one or two wavelengths affected by ozone (e.g., 305 nm) and one reference wavelength not affected by ozone (e.g., 340 nm). Standard ozone retrieval algorithms assume that the Sun's spectrum outside the Earth's atmosphere is constant at these wavelengths. This assumption breaks down during a solar eclipse because the disk of the Sun is not uniformly bright. The temperature of the Sun's photosphere decreases with increasing distance from the Sun's center, and photons emanating near the solar limb originate from a shallower (and cooler) layer of the photosphere compared with photons from the center of the solar disk. As a result, the solar limb appears darker than the Sun's center. This effect is known as solar limb darkening (LD). Shorter wavelengths are more strongly affected than longer wavelengths. Hence, the ratio of solar spectral irradiances at 305 and 340 nm outside the Earth's atmosphere is smaller during a solar eclipse, when the center of Sun is concealed, compared with a “normal” day, when the Sun is unobstructed. If the ozone retrieval algorithm does not consider a LD correction, the smaller spectral irradiance at 305 nm is incorrectly interpreted as a larger ozone column.
Figure 1 shows an example of the LD correction for measurements of TCO during the total solar eclipse of 21 August 2017 (B&P19). For the uncorrected dataset, TCO exhibits an unrealistic increase of about 23 DU or 8 %. The LD correction by Waldmeier (1941) decreases this peak only marginally. When corrected for the LD effect using either the parameterizations by Pierce and Slaughter (1977) or Neckel (2005), the artifact is reduced to ± 2.6 DU (± 0.9 %). Some of the remaining variation (e.g., the gradual increase before totality) could be caused by actual changes in TCO. Between 17:36 and 18:36 UTC, LD-corrected TCO data decreased by 1 DU (0.33 %) with no obvious oscillations. Between 18:38 UTC and the end of the measurements at 19:32 UTC, TCO remained constant to within 0.3 DU (0.10 %).
Several recent papers (e.g., Blumthaler et al., 2006; Emde and Mayer, 2007; Kazadzis et al., 2007; Kazantzidis et al., 2007) have used the LD parameterization by Waldmeier (1941), which does not capture the full magnitude of the LD effect. This would explain why peaks in TCO near totality are still apparent in these publications after LD correction. We suspect that the LD correction applied by Bojkov (1968) (discussed above) was also too low.
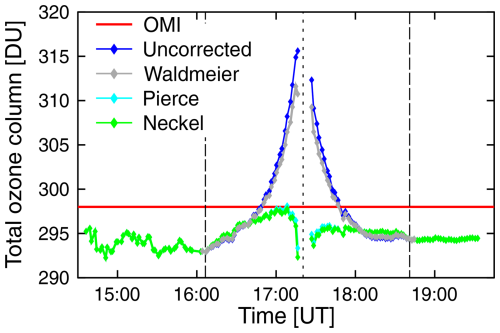
Figure 1Total column ozone measured by a GUVis-3511 multi-filter radiometer during the total solar eclipse of 21 August 2017. Uncorrected measurements are compared with datasets corrected using the LD parameterizations by Waldmeier (1941), Neckel (2005), and Pierce and Slaughter (1977). Dashed and broken lines indicate the period and time of maximum eclipse, respectively. Reproduced from B&P19, which was published under a Creative Commons Attribution 4.0 License.
1.3 Potential effects of gravity waves on total column ozone
During a solar eclipse, the Moon's shadow (umbra and penumbra) moves at supersonic speed over the Earth's atmosphere. Based on modeling, Chimonas (1970), Chimonas and Hines (1970, 1971), and Chimonas (1973) hypothesized that the resulting cooling of the atmosphere of up to a few degrees Celsius will generate atmospheric gravity waves, which may either originate in the troposphere, via cooling of water vapor; in the stratosphere, by the cooling of the ozone layer; or in the thermosphere, where variations in temperature are most pronounced. The gravity waves are generated as an adjustment after a sudden change in forcing has caused the atmosphere to depart from its large-scale balanced state (Williams et al., 2003; Marlton et al., 2016). Because the shadow of the Moon is moving faster than the characteristic speed of waves in air, gravity waves manifest themselves as three-dimensional (3-D) bow waves that are analogous to surface waves that form in the wake of a ship. Bow waves may propagate vertically and horizontally, and they may be detectable as a ground-level atmospheric pressure variation or a traveling ionospheric disturbance (Seykora et al., 1985).
A number of investigators have found evidence of eclipse-driven pressure changes at the surface using sensitive microbarometers, which can resolve pressure variations at the 1 Pa (0.01 mbar) level, as summarized by Farges et al. (2003), Marty et al. (2013) and Marlton et al. (2016), and references therein. Observed pressure perturbations were generally between 0.1 Pa (Goodwin and Hobson, 1978) and 25 Pa (Anderson et al., 1972) and had periods ranging between 15 min and 4 h. One conclusion from these studies is that perturbations can only be reliably attributed to gravity waves if weather conditions at the time of these observations were stable. In many studies, large pressure fluctuations associated with local changes in weather prevented the detection of eclipse-induced pressure perturbations (e.g., Anderson and Keefer, 1975). Furthermore, the magnitude and period of pressure perturbations cannot be clearly linked to the modeling proposed in theoretical studies (Chimonas, 1970; Fritts and Luo, 1993; Eckermann et al., 2007). We operated a microradiometer at Mazatlán (Sect. 3.4) in an attempt to find evidence of bow waves at the surface that could explain potential variations in TCO.
Because most observations during solar eclipses are hampered by less-than-ideal observing conditions, solid proof of eclipse-generated gravity waves was still lacking as of 2017, more than 45 years after the effect was first proposed by Chimonas (1970). This changed in late 2017 when Zhang et al. (2017) reported high-fidelity, wide-coverage ionospheric observations that were taken during the Great American Eclipse of 21 August 2017 using data from Global Navigation Satellite System (GNSS) receivers at ∼ 2000 sites distributed across North America. Because of the high density of receiver stations, maps of the ionospheric TEC could be produced during the progression of the eclipse. The results indicated that the wave's ripples were indeed bow shaped, traveling at ∼ 280 m s−1 with a directional azimuth of ∼ 120°. These results were in excellent agreement with the theoretical predictions of Chimonas (1970) and provided compelling observational evidence to support the general mechanism of bow wave excitation by the supersonic shadow of the Moon.
Following these encouraging results, Colligan et al. (2020) confirmed, using radiosonde data collected in the course of a field campaign in Chile during the total solar eclipse of 2 July 2019, that eclipse-induced bow waves also exist in the stratosphere. According to theory, a radiosonde subjected to the influence of a gravity wave will experience an elliptical motion. Such motion was indeed observed on three instances. Colligan et al. (2020) concluded that these measurements represent the first unambiguous detection of eclipse-induced gravity waves in the middle atmosphere at about 25 km.
1.4 Day–night differences in total column ozone
Day–night differences in TCO have recently been quantified at Bern (47.0° N) and Payerne (46.8° N), Switzerland, using ground-based ozone microwave radiometers and several model-based datasets (Sauvageat et al., 2023). For June (Fig. 3c in Sauvageat et al., 2023), all datasets show a consistent day–night cycle with virtually no difference below 20 km; higher ozone concentrations during the day compared with nighttime between 20 and 45 km, with a peak difference of 4 % at ∼ 40 km; and a large daytime ozone depletion at altitudes larger than 45 km, with maximum differences ranging between −62 % and −76 % at ∼ 72 km. The large decline in the ozone concentrations in the mesosphere during daytime is caused by photochemical reactions initiated by sunlight (Dikty et al., 2010). Considering that about 90 % of ozone is at altitudes below 35 km, the day–night cycle should have little effect on TCO. Furthermore, positive differences in the upper stratosphere partially cancel mesospheric declines. These data are qualitatively consistent with similar measurements collected by Parrish et al. (2014) at the Mauna Loa Observatory (19.5° S), although the maximum enhancement in the upper stratosphere at this location is only ∼ 2 % and the mesospheric daytime depletion is also somewhat smaller than that over Switzerland. Using the Air Force Geophysical Laboratory (AFGL) atmospheric constituent profile for midlatitude summer (Anderson et al., 1986) and the work by Sauvageat et al. (2023), we calculated that the TCO is 0.6 % higher during the day. Therefore, it can be expected that TCO variations during the relatively short period of a solar eclipse remain below 0.6 %. However, Sauvageat et al. (2023) show that the transition from the nighttime to the daytime regime, and vice versa, occurs within a short period, which is comparable to the duration of a solar eclipse. Our estimate of day–night TCO variations is consistent with the conclusion of Chakrabarty et al. (1997) that “short-term fluctuations in TCO during a solar eclipse are not expected due to the long lifetime of ozone in the stratosphere”. However, momentum from gravity waves; the rapid cooling of the atmosphere during a solar eclipse, which is considerably faster than the day–night cycle; and a change in tropopause height (Dutta et al., 2011), which could affect the ozone profile, could potentially lead to a somewhat larger effect on the TCO. Discussions of the reasons for the day–night cycle in stratospheric and mesospheric ozone are beyond the scope of this paper, but they are provided in the work of Natarajan et al. (2023).
Table 1 compares the basic eclipse parameters for the eclipses at Mazatlán, Fort Collins, and Union Glacier provided by the Astronomical Applications Department of the US Naval Observatory (USNO) at https://aa.usno.navy.mil/data/SolarEclipses, last access: 31 July 2024. Our calculations (Sect. 4.2) of the times of first and fourth contact and eclipse maximum are also indicated. These times agree within a few seconds with USNO data. All times in the table and the remainder of the paper refer to coordinated universal time (UTC). To convert from UTC to local time, subtract 7, 6, and 3 h from the time at Mazatlán, Fort Collins, and Union Glacier, respectively.
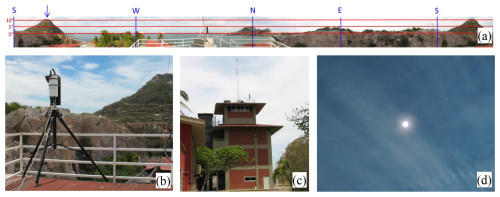
Figure 2Measurement site at Mazatlán. (a) Panorama as seen from the instrument's location. The highest point, indicated by an arrow in the south-southwest, is the lighthouse of Mazatlán (“Faro Mazatlán”), which is a distance of 681 m from the instrument and extends 11.5° above the horizon. In an approximately northwestern direction is a radio tower, which is about 6.5 m higher than the instrument's collector and located a distance of 2.75 m away, resulting in an angular height of 67°. Other obstructions are less than 5° above the horizon. (b) The GUVis-3511 instrument setup on the roof of the institute. (c) View towards north with the GUVis-3511 on the right-hand side of the radio tower on the institute's roof. (d) Thin cirrus clouds during totality. The Sun's corona is overexposed to emphasize the sky condition.
Table 1Comparison of eclipse calculations from this study and from USNO.
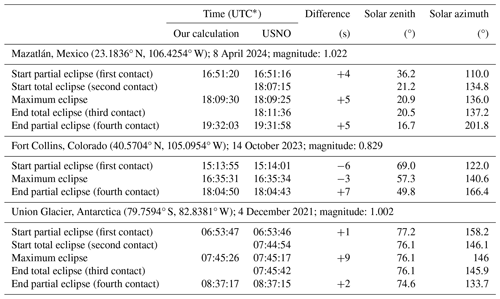
* To convert from UTC to local time, subtract 7, 6, and 3 h from the time at Mazatlán, Fort Collins, and Union Glacier, respectively.
2.1 Mazatlán, Mexico
Observations at Mazatlán were performed during the total solar eclipse on 8 April 2024 at the Institute of Marine Sciences and Limnology (Instituto de Ciencias del Mar y Limnología) of the National Autonomous University of Mexico (Universidad Nacional Autónoma de México – UNAM). A GUVis-3511 radiometer (serial no. 361) was set up on the tallest building of the institute (Fig. 2) at a latitude of 23.18360° N, a longitude of 106.42543° W, and an altitude of 19 ± 2 m a.s.l. (above sea level). Approximately 2.75 m northwest of the instrument is a radio tower that is about 6.5 m higher than the instrument's collector, resulting in an angular height of 67°. The azimuthal angular extent is 5.8°. However, the tower only obstructs about 20 % of this angular range because of its lattice structure (Fig. 2c). Assuming isotropic sky light, we determined that the restriction of the horizon by mountains and other landscape features reduces the horizontal irradiance by 0.23 %. Shading of the sky by the tower leads to an additional 0.27 % reduction. Hence, the total irradiance reduction due to features above the horizon is 0.50 %, which is well below the uncertainty in the measurements. Measurements were also performed on 7 and 9 April 2024 for comparison with data collected on the eclipse day. Thin cirrus clouds were present on the day before the eclipse and on the day of the eclipse (Fig. 2d), which affected the measurements (as explained in Sect. 5.2). The sky on the day after the eclipse was free of clouds, and this day serves as a reference day against which measurements on eclipse day are compared.
2.2 Fort Collins, Colorado
Observations at Fort Collins were performed at the headquarters of the USDA UV-B Monitoring and Research Program, at a latitude of 40.5704° N, a longitude of 105.0954° W, and an altitude of 1536 m a.s.l., with the same GUVis-3511 radiometer (serial no. 361) that was used in Mazatlán. The site is adjacent to the Fort Collins campus of the Colorado State University. Measurements were taken during the annular solar eclipse of 14 October 2023. However, Fort Collins was not under the path of annularity; hence, only a partial eclipse was observed. The irradiance at the time of maximum eclipse was reduced to 21.3 % of the uneclipsed Sun. As the instrument was set up near ground level, measurements were affected by obstructions from nearby buildings and trees; however, the Sun was not obstructed during the observation period. The sky was free of clouds until 17:15, with thin cirrus clouds appearing thereafter. Thus, measurements were not affected by clouds between the first contact nor at the time of maximum solar obscuration at 16:35:34.
2.3 Union Glacier, Antarctica
Observations at Union Glacier were performed at the Union Glacier Joint Scientific Polar Station (Estación Polar Científica Conjunta Glaciar Unión), which is operated in partnership by the Chilean Antarctic Institute (INACH) and the Chilean armed forces, at a latitude of 79.7594° S, a longitude of 82.8381° W, and an altitude of 765 m a.s.l., using a GUVis-3511 radiometer (serial no. 401). Additional ground-based spectral instruments included a sunphotometer affiliated with NASA's Aerosol Robotic Network (AERONET) (Sect. 3.3). Measurements from this instrument showed that the aerosol optical depth (AOD) was generally below 0.025 at Union Glacier during the eclipse, confirming the pristine conditions at deep-field locations in Antarctica. There were ideal, cloudless observation conditions throughout the day of the eclipse and on the following day. However, the solar elevation at totality was only 14°. This low elevation makes the interpretation of data more challenging compared with the conditions at the other sites, as observations of TCO become more sensitive to the vertical distribution of ozone in the atmosphere (Ockenfuß et al., 2020). Furthermore, the high surface albedo of 0.95 at this site (Cordero et al., 2014) greatly enhances multiple scattering between the surface and the overlying atmosphere, thereby further complicating the radiative transfer.
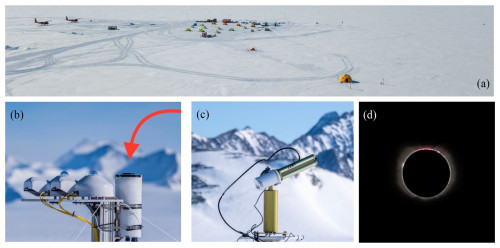
Figure 3Measurement site at Union Glacier. (a) Union Glacier Joint Scientific Polar Station. The GUVis-3511 radiometer was set up close to the yellow tent in the foreground. (b) The GUVis-3511 radiometer (red arrow) with pyranometers in the foreground. (c) The CE-318 sunphotometer at Union Glacier, which is part of NASA's AERONET network. (d) View of the Sun during totality. Several prominences, Baily's beads, and the Sun's chromosphere and inner corona are also visible.
3.1 GUVis-3511 radiometers
Measurements at Mazatlán and Fort Collins were performed with the same GUVis-3511 (hereinafter GUV) multi-channel filter radiometer from Biospherical Instruments, Inc. (BSI) that was used to observe the 2017 total solar eclipse in Oregon (as described by B&P19). In brief, the instrument is equipped with 18 channels with spectral bandwidths of approximately 10 nm and the following nominal wavelengths: 305, 305, 313, 320, 340, 340, 380, 395, 412, 443, 490, 532, 555, 555, 665, 875, 940, and 1020 nm. Data from a 19th channel measuring photosynthetic active radiation (PAR) were not used in this study. Note that the instrument has duplicate channels at 305, 340, and 555 nm, which are equipped with either a standard production photodiode or an alternative photodiode. As measurements of the two types proved to be very consistent (B&P19), we only use measurements from the standard photodiodes here.
The radiometer was equipped with a computer-controlled shadow band known as BioSHADE to provide measurements of direct and global (Sun and sky) spectral irradiance (Hooker et al., 2012; Witthuhn et al., 2017). The AOD was derived from observations of direct spectral irradiance. These data are useful for characterizing atmospheric conditions, identifying contamination by clouds, validating the LD correction, and providing input parameters for the radiative transfer calculations that complement the measurements. At Mazatlán, the band executed a shadow band “sweep” every 3 min. Each 3 min period resulted in about 90 s of global spectral irradiance measurements (with the shadow band stowed while sampling at 1 Hz) and 66 s of data sampled at 15 Hz, during which the band rotated by 180°. At Fort Collins, the BioSHADE was programmed to perform a sweep every 2 min, resulting in 30 s of global spectral irradiance measurements at 1 Hz, followed by 70 s long sweeps while sampling at 15 Hz to adequately resolve the short period during which the band's shadow moves over the instrument's diffuser. Because there were some problems with the band's operation, shadow band sweeps were not available before 15:35, and sweeps after 17:51 occurred at somewhat irregular intervals, ranging between 90 and 160 s. These irregularities have little effect on the results described below. A detailed description of the instrument's optical and electrical specifications, spectral response functions, and cosine error can also be found in the work by B&P19.
Channels between 305 and 380 nm of the GUV used in Mazatlán and Fort Collins were vicariously calibrated against “Version 2” (Bernhard et al., 2004) measurements of the SUV-100 spectroradiometer located on the roof platform of BSI using data collected on the cloudless day of 16 April 2024. Version 2 data have a spectral resolution of 1 nm full width at half maximum (FWHM). All other channels were calibrated against a lamp traceable to NIST standard F-616, which was calibrated by the US National Institute of Standards and Technology (NIST) against the scale of spectral irradiance established by NIST in 2000 (Yoon et al., 2002). The methods of the vicarious and lamp-based calibration transfers are described in more detail in the supplement of B&P19.
The instrument used at Union Glacier was also a GUVis-3511, but it did not have a shadow band. It was equipped with channels at the following wavelengths: 305, 313, 340, 380, 412, 555, 670, 875, 1020, 1245, and 1640 nm. All channels were calibrated at BSI with a NIST-traceable standard in September 2015, and channels between 305 and 380 nm were also vicariously calibrated against SUV-100 Version 2 data using measurements collected between 26 August and 2 September 2015. The instrument was recalibrated at the University of Santiago, Chile, on 18 March 2022 using a Bentham Instruments CL6 spectral irradiance standard traceable to the Physikalisch-Technische Bundesanstalt (PTB) in Germany. The two lamp-based calibrations agreed to within 3.5 % at all wavelengths, but the 2022 calibration was considered more reliable because of the closer proximity in time to the measurements at Union Glacier. The calibration used for processing solar data at wavelengths between 305 and 380 nm was the vicarious calibration of 2015 scaled by the ratio of the lamp-based calibrations of these channels in 2022 and 2015, while the 2022 lamp calibration was used for all other channels. The spectral and angular response functions were not characterized. Therefore, we used generic response functions of this instrument model. To assess whether the use of generic spectral response functions is appropriate, we weighted the SUV-100 Version 2 spectra used for the instrument's calibration in 2015 with these generic functions and compared the weighted irradiances with the contemporaneous measurements of the GUV instrument. If generic and actual functions deviate, the ratio of GUV and SUV-100 measurements would become dependent on the solar zenith angle (SZA), as described in Sect. 4.1. The actual SZA dependence was similar to that calculated for the GUV radiometer used at Mazatlán and Fort Collins (for which the response functions were measured), suggesting that the use of generic spectral response functions does not appreciably increase the uncertainty in the ozone data derived from measurements at Union Glacier. However, the missing angular response data led to increased uncertainty in the cosine error correction and some artifacts in the data (as discussed in Sect. 5.4.1).
3.2 Microtops II ozonometer
A Model 521 Microtops II ozonometer from Solar Light was used at Mazatlán to provide measurements of TCO that were independent of the GUV instrument. The former instrument is a sunphotometer and derives TCO from measurements of direct solar irradiance at 305, 312, and 320 nm. The bandwidth of each filter is 2.4 nm. Data processing is described by Morys et al. (2001). The instrument was purchased shortly before the eclipse and had a current factory calibration from Solar Light. Measurements of TCO by the instrument were consistently ∼ 6.5 % higher relative to observations from the GUV and the Ozone Monitoring Instrument (OMI) on NASA's Aura satellite, which were downloaded from NASA's Giovanni data server at https://giovanni.gsfc.nasa.gov, last access: 8 May 2024. We scaled measurements down by this amount to better facilitate comparisons with GUV data. The instrument is manually pointed at the Sun; therefore, measurements are sensitive to pointing errors. To reduce the associated uncertainty, three to five measurements were taken consecutively and their average was calculated. Averages were only used if the standard deviation calculated from the individual measurements was less than 3 DU.
3.3 AERONET sunphotometer
The GUVis-3511 at Union Glacier was co-located with a CE-318 sunphotometer from CIMEL Electronique, which is part of NASA's AERONET (Holben et al., 1998). The instrument measures AOD at 340, 380, 440, 500, 675, 870, 1020, and 1640 nm. Version 3 (Sinyuk et al., 2020), Level 1.0 AOD data were downloaded from the AERONET website at https://aeronet.gsfc.nasa.gov/. These data are not screened for clouds, but AOD values measured before the first and after the fourth contact are identical to Level 1.5 data, which are screened for clouds and quality controlled. (We used Level 1.0 data because the period of the eclipse is excluded from the Level 1.5 dataset.) Both Level 1.0 and Level 1.5 data may not have the final calibration applied, as the instrument has not yet been returned from Antarctica for post-deployment calibration. The uncertainty in the AERONET field data is in the range of 0.01–0.021 (Sinyuk et al., 2020; Eck et al., 1999).
3.4 Microbarometer
We operated a microbarometer (PTB210 BAROCAP digital barometer from Vaisala) at Mazatlán in an attempt to observe gravity waves that may lead to small changes in pressure at the surface. It has a resolution of 0.01 hPa and was operated at 1 Hz and equipped with a SPH10 static pressure head from Vaisala, which reduces the effect of wind on pressure measurements. The instrument was purchased shortly before the eclipse and had a factory calibration from Vaisala.
Measurements at Mazatlán and Fort Collins were processed using the “GUVis-3511 Data Processor” software package (hereinafter GUVDP), which was developed in 2020 and is based on the methods described in the supplement of B&P19. The software and its theoretical background are described in a manual (see the “Code and data availability” section and Bernhard et al., 2024). In brief, GUVDP ingests uncalibrated raw data from the GUV radiometer and applies calibration functions that depend on the SZA and TCO occurring at the time of the measurement. If the GUV radiometer is equipped with a BioSHADE, GUVDP also produces several secondary data products including (but not limited to) the TCO, the cosine-error-corrected global irradiance, the ratio of direct to global irradiance, and the AOD. Furthermore, GUVDP performs Langley analyses, which can be used for the calibration of AOD measurements. Calibrated measurements report the solar spectral irradiance at a spectral resolution of 1 nm. More specifically, calibrated measurements resemble measurements of a hypothetical spectroradiometer with a slit function s(λ), where s(λ) is a triangular function with a bandwidth of 1 nm FWHM. Version 2 SUV-100 data are also normalized to this slit function.
GUVDP software does not currently support the processing of data where the vicarious calibration was executed at a location with low albedo (e.g., San Diego) and field measurements are performed at a location with high albedo (e.g., Union Glacier). The software also does not apply a cosine error correction if shadow band data are not available. For these reasons, measurements of the GUV deployed at Union Glacier were processed manually but using the same methods as implemented in GUVDP software. The ratio of direct to global irradiance, which is required for the cosine error correction, was calculated with the UVSPEC radiative transfer model (Mayer and Kylling, 2005) in lieu of deriving this ratio from shadow band data.
4.1 Calculation of total column ozone
Total column ozone was calculated with GUVDP software from GUV measurements of global irradiance with lookup tables based on a method proposed by Stamnes et al. (1991). These lookup tables are derived from spectra calculated with UVSPEC, which are convolved with a triangular function of 1 nm FWHM. To derive TCO for the 340–305 nm wavelength pair, ratios named of spectral irradiance at 340 nm (a wavelength weakly absorbed by ozone) and at 305 nm (a wavelength strongly absorbed by ozone) are calculated as a function of the SZA (symbol θ) in steps of 1° and the TCO (symbol Ω) in steps of 20 DU. The resulting lookup table undergoes spline interpolation to SZA steps of 0.1° because early results showed that linear interpolation will lead to small (< 0.5 %) variations in TCO with a periodicity of 1° in the SZA, which could be falsely interpreted as changes in TCO during an eclipse. This lookup table is then multiplied by a correction term to adjust for the relatively broad spectral response functions of the GUV, resulting in a modified lookup table :
The arguments θcand Ωc indicate the respective SZA and TCO at the time of calibration. Ci(θ,Ω), with i=340 or 305, is defined as follows:
where is the modeled spectral irradiance at wavelength λi and ri is the spectral response function of channel i. Note that the correction term is equal to 1 if θ=θc and Ω=Ωc. TCO is finally calculated from the modified lookup table , the SZA θ at the time of the solar observations, and the ratio of calibrated measurements at 340 and 305 nm, defined as follows:
where V340(θ) and V305(θ) are the uncalibrated measurements of the GUV at 340 and 305 nm, respectively, and R340(θc,Ωc) and R305(θc,Ωc) are the responsivities established during calibration at θc and Ωc.
TCO is also calculated from the wavelength pairs of 340–313 and 320–305 nm using a similar approach. In the following, TCO data calculated from the 340–305, 340–313, and 320–305 pairs are referred to as TCO, TCO, and TCO, respectively. In general, TCO data are the most accurate data of the three datasets for clear-sky conditions, as they are least impacted by calibration uncertainties (Piedehierro et al., 2017). However, TCO data become more accurate at large SZAs when measurements at 305 nm are close to the detection limit. Lastly, simulations by Dahlback (1996) showed that TCO data are the least influenced by clouds. Hence, this dataset should be the most suitable for Mazatlán, the site impacted by cirrus clouds. All ozone data are available at a frequency of 1 Hz during times when the shadow band is inactive.
4.2 Solar limb darkening correction
The solar LD correction was calculated in the same manner as that for the 2017 total solar eclipse described by B&P19. In brief, the elevation, azimuth, and angular radii of the Sun and Moon were downloaded from the Horizons System of the Jet Propulsion Laboratory (JPL; https://ssd.jpl.nasa.gov/?horizons, last access: 30 April 2024) and the fraction of the solar disk as function of time during the progression of the eclipse was calculated with the algorithm by Koepke et al. (2001). However, we replaced the parameterization of the wavelength dependence of solar LD used by Koepke et al. (2001), which is based on the work of Waldmeier (1941), with the parameterization by Pierce and Slaughter (1977) and Pierce et al. (1977), which is based on data collected by the McMath–Pierce Solar Telescope of the National Solar Observatory on Kitt Peak. Figure 4 shows results of the calculations for Mazatlán. Between about 17:30 and 19:00, the shortest wavelength (305 nm) is attenuated the most, whereas the longest wavelength (1020 nm) is attenuated the least.
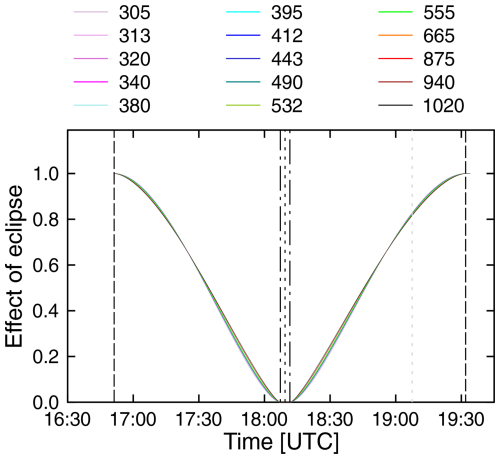
Figure 4Change in the extraterrestrial irradiance as a function of time at Mazatlán, calculated from JPL ephemeris data and the parameterizations of solar limb darkening published by Pierce and Slaughter (1977) and Pierce et al. (1977) for the wavelengths of the GUV radiometer. Vertical long-dashed lines indicate the times of the first and fourth contact, the dot-dash lines indicate the times of the second and third contact, the short-dashed line indicates the time of the eclipse maximum, and the gray dashed line indicates local solar noon.
5.1 Comparison of total column ozone measurements in San Diego
After the GUV was calibrated, TCO values calculated from GUV measurements at BSI's headquarter in San Diego during the period from 15 to 19 April 2024 were compared with TCO data from the co-located SUV-100 spectroradiometer. The latter were calculated from Version 2 spectra based on the method described in Bernhard et al. (2003). This method also uses measurements of global irradiance; however, it does not use lookup tables. Instead, measured spectra are compared with UVSPEC spectra calculated with different TCO as input, and the TCO of the model spectrum that leads to the best agreement between the measurement and model is the TCO returned by the algorithm. The method was mainly developed to retrieve TCO from global irradiance at high latitudes, where large SZAs prevail and TCO becomes critically dependent on the vertical distribution of ozone in the atmosphere. Hence, the method allows one to change profiles on a daily basis.
Figure 5a shows measurements of the two instruments as well as observations by OMI and the Microtops ozonometer. The sky was free of clouds until local solar noon on 17 April 2024. Measurements on the last day were affected by clouds, as indicated by measurements of spectral irradiance at 340 nm (Fig. 5b). For the clear-sky period, TCO data derived from the GUV for a SZA < 80° are biased low relative to the SUV-100 data, by −1.1 %, −1.1 %, and −0.9 % for TCO, TCO, and TCO, respectively. The corresponding relative standard deviations are 0.6 %, 1.0 %, and 0.9 %, respectively. For the cloudy period, the standard deviations are increased to 2.4 %, 3.5 %, and 2.2 %, respectively. The TCO measured by OMI is about 2 % lower than GUV data, while measurements by the Microtops ozonometer are 6.5 % higher (as mentioned in Sect. 3.2). Results shown in Fig. 5a confirm that TCO measurements from the GUV are accurate to within 2 %–3 % and capture variations in TCO (such as the ∼ 20 DU drop on 16 April 2024) well. TCO is least affected by clouds, confirming the conclusion by Dahlback (1996) mentioned earlier.
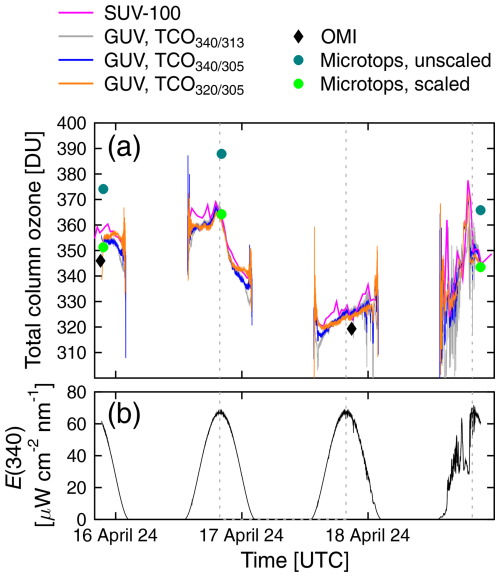
Figure 5(a) Total column ozone in San Diego calculated from Version 2 spectra of the SUV-100 spectroradiometer (pink line); derived from GUV measurements for the 340–313 (gray line), 340–305 (blue line), and 320–305 (orange line) wavelength pairs; provided by OMI (black diamond); and measured by the Microtops ozonometer (dark-green circle). Microtops measurements scaled by 1/1.065 are also shown. Only data up to SZAs of 85° are included. (b) Spectral irradiance at 340 nm measured by the GUV radiometer. Vertical broken lines indicate the times of local solar noon.
5.2 Measurements at Mazatlán
5.2.1 Spectral irradiance
Figure 6a shows global spectral irradiance measured by the GUV-3511 radiometer at Mazatlán on 8 and 9 April 2024 as well as model calculations with input parameters optimized for 8 April. Specifically, TCO was set to 283 DU (TCO retrieved by the GUV close to totality), and AOD was parameterized with the Ångström turbidity formula by setting the Ångström coefficients α and β to α=1.1080 and β=0.0234. These parameters were determined by fits to AOD data derived with GUVDP software (Sect. 5.2.2). Figure 6b shows the ratio of the measured values on 8 April 2024 to the model. Lastly, Fig. 6c shows the ratio of measurement values corrected for the LD effect (i.e., the LD functions plotted in Fig. 4) to the model. Specifically, raw data were divided by the LD functions and then reprocessed with GUVDP. It can be seen that this correction removes the effect of the eclipse with high fidelity.
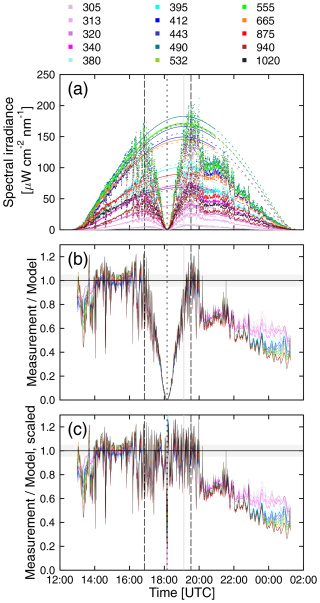
Figure 6(a) The global spectral irradiance measured on 8 April 2024 (small dots) and on 9 April 2024 (solid smooth lines) and the modeled spectral irradiance with input parameters optimized for 8 April 2024 (broken lines). (b) Ratio of measured values for 8 April 2024 to the model. The gray band indicates the region of ± 5 % about the ideal ratio of 1. Ratios for 940 nm are not shown because of the uncertainty due to water vapor absorption. Panel (c) is the same as panel (b) but measured data were divided by the LD function shown in Fig. 4. Long-dashed lines in all panels indicate the first and fourth contact. The time of the eclipse maximum is indicated by a short-dashed line, while the local solar noon is indicated by a gray line.
Figure 6 allows the following conclusions:
-
Measurements on 8 April 2024 were affected by clouds, which resulted in high variability in the measured spectral irradiance. Comparison with the model indicates that broken cirrus clouds (Fig. 2d) occurring between 14:00 and 20:00 (a period including the eclipse) mostly added scatter about unity. During this period, measurements varied by approximately ± 25 % about the value expected for clear skies. This indicates that broken cirrus clouds above the observation site either reduced the irradiance (when a cloud obscured the solar disk) or enhanced it (when the solar disk was free and additional radiation reached the detector from bright white clouds surrounding the Sun). The cloud effect was lowest between 15:15 and 15:30, when the ratio of the measurement to the model was within ± 5 % of 1 at all wavelengths.
-
After 20:00, broken cirrus cloud turned into overcast conditions. Later in the day, longer wavelengths were more strongly attenuated than shorter ones, as one would expect for a thick cloud.
-
The sky was free of clouds on 9 April throughout the day, and measurements on this day agree well with the model, giving confidence in both the measurements and the model calculations.
Figure 7 shows a close-up of the spectral irradiance within ± 10 min of totality. As was observed in 2017, the spectral irradiance decreases by more than 2 orders of magnitude when transitioning into totality. The spectral irradiance during totality is not constant and is lowest at approximately the time of the eclipse maximum. At this time, the instrument performed a shadow band sweep, but this is not obvious in the data. In fact, the variability due to moving cirrus clouds was likely larger than the shading effect of the band.
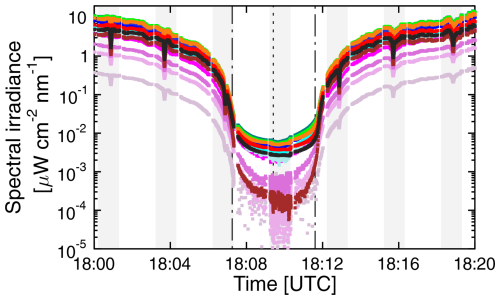
Figure 7Close-up of change in spectral irradiance within ± 10 min of totality. Before 18:03 and after 18:13, data are based on cosine-error-corrected data. Close to totality, the cosine error correction becomes uncertain, and data were scaled by the diffuse correction factor assuming isotropic sky radiance. The color coding is identical to that used in Fig. 6. Periods of shadow banding are indicated by gray shading. The times of the second and third contact are indicated by dot-dash lines, while the time of maximum eclipse is indicated by a short-dashed line.
5.2.2 Aerosol optical depth
Figure 8 shows the AOD at Mazatlán derived with GUVDP software. All AOD measurements on 8 April were affected by clouds. The AOD measured at 16:07 was the lowest value that day and was the least affected by clouds. AOD values for the cloudless day of 9 April were derived at 18:09 (the time of totality on the previous day) and at 20:54 (a time close to the end of observations on this day). As the Ångström exponent for clouds is close to 0, the fact that the spectral dependence of the AODs (quantified with the Ångström exponent α) observed on 8 and 9 April is similar suggests that the AOD measurement on 8 April is fairly accurate and not greatly affected by clouds.
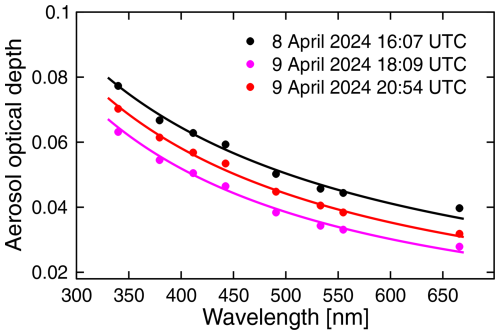
Figure 8Aerosol optical depth measured in Mazatlán on 8 and 9 April 2024 (symbols). Lines are fit functions based on the Ångström turbidity formula using the following coefficients: α=1.1080 and β=0.0234 for 8 April 2024 at 16:07; α=1.3345 and β=0.0153 for 9 April 2024 at 18:09; and α=1.2288 and β=0.0189 for 9 April 2024 at 20:45.
5.2.3 Total column ozone
Figure 9a, b, and c show TCO calculated from GUV, Microtops, and OMI measurements at Mazatlán for 7–9 April 2024. Data from 8 April were either processed “as is” or were first corrected for the change in the extraterrestrial solar spectrum during the eclipse. Figure 9d shows the power spectrum density (PSD) of TCO between 18:14:00 and 19:22:16 on 7 and 8 April 2024. The period starts shortly after the time of the third contact and is 4096 s long. During a period of this length, fluctuations in TCO have been observed by Mims and Mims (1993) and Zerefos et al. (2007), as discussed in Sect. 1.1. For comparison, Fig. 9d also shows the PSD for a hypothetical scenario in which TCO oscillates with an amplitude of 10 DU and a period of 60 s about a constant value of 300 DU. The following can be concluded from Fig. 9:
-
Uncorrected TCO measurements increase by about 30 DU before totality and decrease by about the same amount thereafter. When the wavelength-dependent change in the extraterrestrial solar spectrum is taken into consideration, there is virtually no effect of the eclipse on TCO. Hence, the increase in TCO can be entirely explained by the LD effect.
-
TCO values derived from GUV measurements on 7 and 8 April are affected by clouds, resulting in spurious variability. TCO is the least impacted. Conversely, TCO is much more impacted than TCO and TCO, as changes in ozone affect measurements at 305 nm much more strongly than at 313 nm. Therefore, changes introduced by ozone are more important at 305 nm than at 313 nm, compared with cloud effects. Measurements on the clear-sky day of 9 April 2024 are very consistent and vary smoothly with time, giving further confidence in the good quality of the GUV TCO data.
-
The cirrus cloud cover on 7 and 8 April was similar, as were the fluctuations in TCO with time. On 8 April 2024, there was no obvious change in TCO that could be attributed to bow waves. However, because of the variability introduced by clouds, a small effect from the eclipse cannot be excluded, although it would have to be smaller than about ± 1.2 DU or ± 0.4 % as estimated from TCO data.
-
During overcast conditions (second half of 8 April 2024), TCO data underestimate the actual TCO.
-
There is a small increase in TCO over the course of the eclipse, which is captured by both LD-corrected GUV and Microtops measurements; however, this increase is comparable in magnitude to increases and decreases observed during other times. In fact, variations on 7 April tend to be larger than those on the eclipse day of 8 April.
-
Scaled Microtops measurements are consistent with GUV measurements and do not indicate an increase at the time of totality nor fluctuations beyond some scatter.
-
On 9 April 2024, GUV measurements are 2.4 % higher than the OMI measurements of this day. This is the typical difference between SUV-100 and OMI measurements observed at Antarctic sites equipped with SUV-100 spectroradiometers. The reason for this small bias is unknown.
-
The PSD values for 7 and 8 April are virtually identical. There is no evidence of a periodic oscillation on 8 April that could have been triggered by bow waves. The PSD of the synthetic TCO (oscillation with an amplitude of 10 DU and a periodicity of 60 s) suggests that oscillations with an amplitude of well below 10 DU should be detectable in a PSD calculated from measured TCO data, if such fluctuations exist.
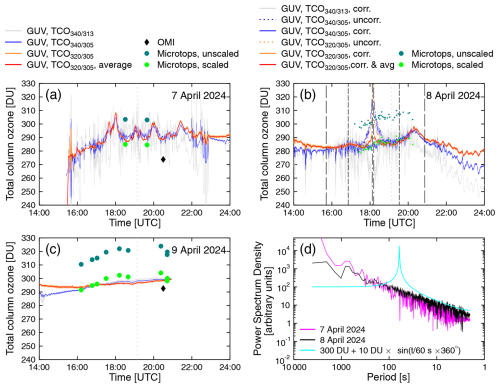
Figure 9Measurements of TCO at Mazatlán on (a) 7 April 2024, (b) 8 April 2024, (c) and 9 April 2024. TCO, TCO, and TCO measurements at 1 Hz are shown in gray, blue, and orange, respectively. The red line shows the average of TCO calculated from the 90 s global spectral irradiance segments, which are separated by the shadow banding segments. Microtops measurements are biased high (dark-green circles). Data scaled down by 6.5 % are also shown (light-green circles) for ease of comparison with GUV data. OMI measurements are only available on 7 and 9 April 2024. All data were filtered for SZAs smaller than 75°. The vertical “very long-dashed” vertical lines (before 16:00 and at about 21:00) indicate the times when the shadow of the Moon either first touched the Earth (over the Pacific) or left the Earth (over Greenland). The first and fourth contacts at Mazatlán are indicated by dashed lines, and the second and third contacts are indicated by dot-dash lines. Panel (d) shows the power spectrum density of TCO between 18:14:00 and 19:22:16 on 7 and 8 April 2024. The PSD for a hypothetical scenario in which TCO oscillates with an amplitude of 10 DU and a period of 60 s about a constant value of 300 DU is also shown (cyan line).
5.2.4 Variations in surface pressure
Figure 10a shows the surface pressure at Mazatlán on 7–9 April 2024 measured by the microbarometer. The pressure exhibits a similar diurnal cycle on the 3 d with an amplitude of about 1 hPa and a maximum at local solar noon. The diurnal cycle is caused by atmospheric tides resulting from the Sun's heating of the atmosphere during the day (Haurwitz and Cowley, 1973). Overlaid on this diurnal cycle are short-term fluctuation with an amplitude of about 0.2 hPa, which are also similar on the 3 d. There is no clear evidence that these variations are systematically different during the period of the eclipse. Furthermore, the PSD of surface pressure for the 3 d (Fig. 10b), which is based on a ∼ 1 h period starting at the time of maximum eclipse on 8 April, is also similar. Hence, there is no evidence that bow waves, which may have been excited by the eclipse, led to measurable changes in surface pressure.

Figure 10(a) Surface pressure at Mazatlán on 7–9 April measured by the microbarometer. The first and fourth contacts are indicated by dashed lines, and the second and third contacts are indicated by dot-dash lines. (b) Power spectrum density of surface pressure for the 3 d based on data collected between 18:09:25 (time to maximum eclipse on 8 April) and 19:11:02 each day.
5.3 Measurements at Fort Collins
5.3.1 Spectral irradiance
Global spectral irradiance values measured by the GUV radiometer at Fort Collins on 14 October 2023 are shown in Fig. 11. The figure also presents measurements that were corrected for the change in the extraterrestrial solar spectrum by dividing the instrument's raw data by the change in the extraterrestrial irradiance before processing with GUVDP. The correction removes the effect of the eclipse with high fidelity, leading to a smooth irradiance curve, as one would expect on a day without an eclipse. Note that measurements become affected by cloud for times after 17:15. There is almost no indication of clouds between the start of the eclipse and the aforementioned time.
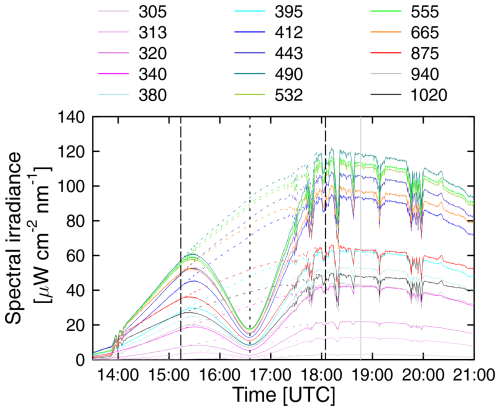
Figure 11Global spectral irradiance measured on 14 October 2024 with the GUV radiometer (solid lines) and measurements corrected for the solar LD effect (broken lines). Vertical long-dashed lines indicate the first and fourth contact. The time of the eclipse maximum is indicated by a short-dashed line, while the local solar noon is indicated by a gray line.
5.3.2 Aerosol optical depth
Figure 12a shows the AOD at Fort Collins calculated from the direct irradiance derived with GUVDP using data acquired during shadow band sweeps. Without LD correction, the AOD retrieved by the algorithm shows a large spurious peak centered on the time of maximum eclipse, as the program attributes the reduced solar irradiance to aerosols. With LD correction, the effect of the eclipse is not noticeable in the AOD data. Figure 12b shows the AODs retrieved at three times during the eclipse (at 16:01, 16:35, and 17:01). Data are very consistent: AODs calculated at the time of the maximum eclipse (at 16:35) agree almost ideally (i.e., to better than 0.01) with AODs ∼ 30 min before and after this time. This again confirms that the LD correction is accurate. The Ångström turbidity formula was fitted to the average of the three measurements, resulting in α=1.4917 and β=0.0284.

Figure 12(a) Aerosol optical depth calculated from shadow band sweeps of the GUV radiometer at Fort Collins. Thin lines indicate spurious AODs measured without LD correction, whereas thick lines indicate AOD corrected for the LD effect. The color coding is identical to that used in Fig. 11. Data were not filtered for clouds, and spikes occurring after 17:15 are attributable to clouds. Long-dashed lines indicate the first and fourth contact. The time of the eclipse maximum is indicated by a short-dashed line, while the local solar noon is indicated by a gray line. (b) Aerosol optical depth as a function of wavelength at three times during the eclipse. The broken black line shows the Ångström fit to the average of all data.
5.3.3 Total column ozone
Figure 13 shows TCO calculated from the GUV data on 14 October 2023. As was the case for Mazatlán, data were either processed as is or were corrected for the LD effect. The following can be concluded:
-
Uncorrected TCO data increase by about 8 DU before totality and decrease by a similar amount thereafter. When data are corrected for the LD effect, TCO data remain constant to within ± 1 DU (± 0.4 %). Over the time of the eclipse, corrected TCO and TCO data agree almost ideally.
-
Uncorrected TCO data increase by 16 DU and LD-corrected data decrease by ∼ 5 DU compared with the values at the start of the eclipse. (A decrease of similar magnitude is also hinted at in the LD-corrected data for Mazatlán (Fig. 9b), although scatter from cloud effects makes an assessment difficult.) The most likely reason for the overcorrection is the uncertainty in the LD coefficients near 313 nm published by Pierce and Slaughter (1977). The shape of the corrected dataset looks like an inverted LD function, strongly suggesting that the feature is caused by a systematic error in the LD correction instead of actual changes in TCO.
-
TCO measurements derived after 17:15 are affected by clouds. As was the case for Mazatlán, TCO is affected the least, whereas TCO is affected the most.
-
Early in the day (before 15:00), when SZAs are larger than 71°, TCO data are biased low.
-
There are similar wavy patterns in corrected TCO and TCO data close to the times of the first contact and maximum eclipse. The decrease in TCO is about 1 DU for the former and 1.5 DU for the latter (amplitude of 0.75 DU or 0.3 %). While these features could have been triggered by the eclipse, their magnitude is within the range of natural variability, and it would be challenging to unambiguously attribute those to the solar eclipse.
-
There are no fluctuations occurring on timescales of minutes.
-
The day's OMI measurement is 4 DU (1.5 %) higher than GUV measurements.
-
The data density is higher up to 15:35, as the shadow band was not operational before this time.
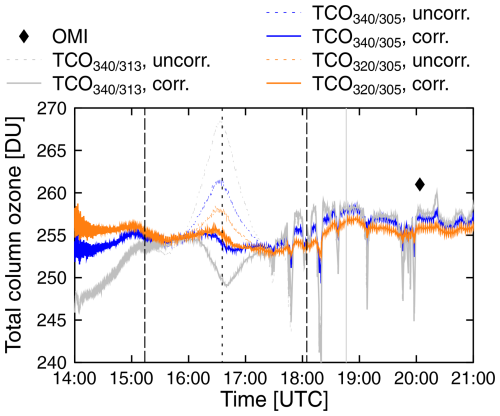
Figure 13Measurements of TCO at Fort Collins on 14 October 2024 with the GUV. TCO, TCO, and TCO data are shown in gray, blue, and orange, respectively. Uncorrected and LD-corrected data are indicated by broken and solid lines, respectively. The OMI measurement of this day is indicated by a black diamond. Long-dashed lines indicate the first and fourth contact. The time of the eclipse maximum is indicated by a short-dashed line, while the local solar noon is indicated by a gray line.
5.4 Union Glacier
5.4.1 Spectral irradiance
Figure 14a shows cosine-error-corrected measurements of global spectral irradiance by the GUV-3511 radiometer at Union Glacier performed on 4 and 5 December 2021 as well as model calculations with input parameters optimized for 4 December. Specifically, TCO was set to 215 DU (the average TCO on this day measured by OMI), and the AOD was parameterized with the Ångström turbidity formula by setting the Ångström coefficients α and β to α=1.26 and β=0.0061. These parameters were determined by fits to AOD data measured with the AERONET sunphotometer (Sect. 5.4.2). For wavelengths up to 670 nm, albedo was set to 0.95, in accordance with measurements by Cordero et al. (2014). Albedo at 875, 1020, 1245, and 1640 nm was set to 0.88, 0.75, 0.58, and 0.2 based on measurements at the South Pole (Grenfell et al., 1994). Figure 14b plots the ratio of measurements on 4 December (with and without the LD correction applied) to the model. Lastly, Fig. 14c presents the ratio of measurements on 4 to those on 5 December, again with and without the LD correction applied. As the SZAs were different on the 2 d, measurements on 5 December 2021 underwent SZA interpolation to match the SZA on 4 December 2021 before calculating the ratios.
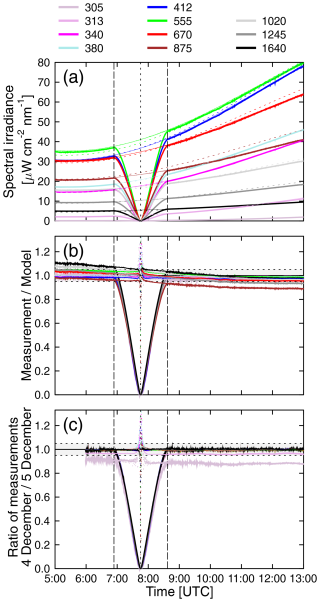
Figure 14(a) Global spectral irradiance measured at Union Glacier on (eclipse day) 4 December 2021 (thick lines) and on 5 December 2021 (thin lines) as well as the modeled spectral irradiance with input parameters optimized for 4 December 2021 (broken lines). (b) Ratio of the measurement values to the model for 4 December 2021 (solid lines) and the ratio of the LD-corrected measurement values to the model (dots). (c) Ratio of measurement values on 4 December 2021 to those on 5 December 2021 (solid lines) and the ratio of the LD-corrected measurement values on 4 December 2021 to measurement values on 5 December 2021 (dots). Long-dashed lines in all panels indicate the first and fourth contact. The time of the eclipse maximum is indicated by a short-dashed line. The horizontal dotted black lines in panels (b) and (c) indicate the region of ± 5 % about the ideal ratio of 1.
Figure 14 allows the following conclusions:
-
Both 4 and 5 December 2021 were cloudless days with stable atmospheric conditions. This is particularly obvious from the measurement ratios of the 2 d shown in Fig. 14c. Before and after the eclipse, measurements agree to within ± 1 % for wavelengths between 340 and 1640 nm. Observations at 313 and 305 nm were lower on 4 December, by about 4 % and 10 %, respectively, because of the larger TCO on 4 December (OMI measured 215 DU on 4 December and 198 DU on 5 December).
-
Before the first contact and after the fourth contact, measurements at wavelengths between 305 and 412 nm agree with the model to within ± 4 % (Fig. 14b). At longer wavelengths, ratios between the measurement and model values decrease with time, although they stay within ± 11 % of unity. This bias and downward trend are due to a systematic error in the cosine error correction. As mentioned in Sect. 3.1, the angular response functions of the GUV used at Union Glacier were not characterized; rather, generic response functions were used for the correction instead. At a SZA of 75°, the effect of cosine errors are typically the largest, and the difference between the actual (but unknown) and generic response functions can explain the pattern apparent in Fig. 14b. However, this has no consequence with respect to the assessment of the effect of the eclipse on changes in TCO, as the affected wavelengths are not used for the ozone retrieval.
-
At wavelengths in the UV range, the LD-corrected measurements agree with model calculations to within ± 5 % up to 5 min before the second and after the third contact. This period decreases to 1.5 min for wavelengths in the visible and infrared range, again confirming the accuracy of the LD-correction method. At times close to totality, measurements exceed the results of the one-dimensional (1-D) model. Assessing these differences would require a 3-D model, which is beyond the scope of this paper.
Figure 15 shows a close-up of the spectral irradiance within ± 5 min of totality. A comparison with the similar plot for Mazatlán (Fig. 7) reveals that the changes in spectral irradiances at 305 and 313 nm are much smaller at Union Glacier than at Mazatlán. This difference is likely caused by the fact that the eclipse at Union Glacier occurred at a high-albedo site and at a large SZA of 76°. Both factors lead to almost entirely diffuse radiation at these wavelengths (the direct contribution is less than 4 % at these wavelengths according to our model calculations). In contrast, spectral irradiance at 1245 and 1640 nm exhibits a steep decrease when transitioning into totality, with measurements dropping below the detection limit.
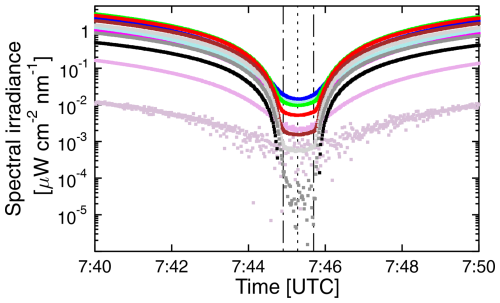
Figure 15Close-up of the change in spectral irradiance at Union Glacier within ± 5 min of totality. The color coding is identical to that used in Fig. 14. The times of the second and third contact are indicated by dot-dash lines, while the time of maximum eclipse is indicated by a short-dashed line.
5.4.2 Aerosol optical depth
Figure 16 shows the AOD values at Union Glacier measured by the AERONET sunphotometer (Sect. 3.3). As was the case for Fort Collins, AODs at Union Glacier calculated without LD correction show a large spurious peak (Fig. 16a), whereas LD-corrected data change by less than ± 0.01 before totality and by less than ± 0.02 after totality (Fig. 16b). These small variations could be caused by the low signal levels during the eclipse or by the fact that the unconcluded portion of the Sun during the eclipse is not in the center of the instrument's field of view. The AODs shortly before the first contact at 06:47, shortly after the fourth contact at 08:37, and 1 h later are consistent to within 0.004 and are smaller than 0.025 at 340 nm (Fig. 16c). An Ångström fit to the data results in α=1.26 and β=0.0061. Measured AODs show more variability about the fit line compared with variations observed at Fort Collins. This can be explained by the fact that the AODs at Union Glacier are very small and comparable to the uncertainty in the AERONET data of 0.01–0.021 (Sinyuk et al., 2020; Eck et al., 1999). These data confirm that the eclipse at Union Glacier occurred under pristine conditions, with AODs close to Antarctic background conditions (Chen et al., 2024).
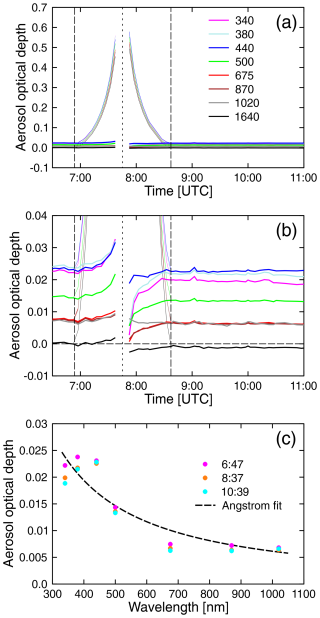
Figure 16(a) Aerosol optical depth measured by the AERONET sunphotometer at Union Glacier. Thin lines indicate spurious AODs measured without LD correction, whereas thick lines indicate AODs corrected for the LD effect. Panel (b) is the same as panel (a) but plotted on a smaller y scale to emphasize AODs after LD correction. Vertical long-dashed lines in panels (a) and (b) indicate the first and fourth contact. The time of the eclipse maximum is indicated by a short-dashed line. (c) Aerosol optical depth as a function of wavelength for three times. The broken black line shows the Ångström fit to the average of all data.
5.4.3 Total column ozone
Figure 17 shows TCO calculated from the GUV data collected at Union Glacier on 4 December 2021. As before, data were either processed as is or were corrected for the LD effect. The following can be concluded:
-
TCO data are much noisier than TCO data because of the large SZAs at Union Glacier (e.g., SZA = 77.2° at the time of the first contact). At these large SZAs, the spectral irradiance at 305 nm is less than 1 order of magnitude above the instrument's detection limit. While TCO data are typically more accurate than TCO data, as they are less affected by factors other than ozone, use of TCO becomes advantageous if the SZA is very large.
-
The LD effect leads to a spurious increase in TCO when approaching totality, as was observed at Mazatlán and Fort Collins. However, within ± 3.5 min of totality, the calculated TCO drops greatly. The drop can be seen both in TCO and TCO, but it is much stronger in the latter.
-
TCO data corrected for the LD effect scatter to within ± 2.5 DU outside of a ± 7 min interval centered on the maximum eclipse. LD-corrected TCO data are more constant than uncorrected data outside of about ± 15 min from the maximum eclipse, but the correction overcorrects closer in time to totality.
-
Apart from these changes in TCO close to totality, there is no evidence of oscillations in TCO that could be attributed to gravity waves. Closer inspection of TCO data during a period of 4 h starting with totality establishes an upper limit for short-term fluctuation in TCO of ± 0.05 DU (± 0.03 %), which is well within the range of natural variability.
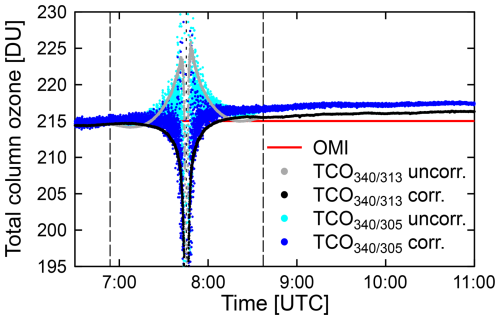
Figure 17GUV measurements of TCO at Union Glacier on 4 December 2021. Uncorrected and LD-corrected TCO data are shown in cyan and blue, respectively. Similar data calculated for TCO are shown in gray and black. The average of the OMI measurement for this day is indicated by a horizontal red line. Long-dashed lines indicate the first and fourth contact. The time of the eclipse maximum is indicated by a short-dashed line.
5.5 Reduction in spectral irradiance during totality
Figure 18 quantifies the decrease in spectral irradiance during totality by plotting “reduction factors”, defined as the ratio of spectral irradiance expected without the eclipse to the measurement at the time of totality, for three total solar eclipses: those at Mazatlán and Union Glacier discussed here and the one observed at Smith Rock State Park in Oregon on 21 August 2017 described by B&P19. Reduction factors calculated for Mazatlán are generally larger than those for Oregon. The effect is particularly strong at wavelengths where ozone absorption is high (313 and 320 nm, with 305 nm in the noise) or at 940 nm, which is affected by water vapor absorption. This can be explained by the longer path lengths for photons entering the atmosphere outside the larger shadow on 8 April 2024. (The duration of the 8 April 2024 eclipse was 4:21 min, whereas that of the 21 August 2017 eclipse was only 2:35 min. According to JPL Horizon data, the ratio of the Moon diameter to the Sun diameter during totality was 1.0574 and 1.0250 on the 2 d, respectively. Therefore, the area of the Moon's shadow was larger on 8 April 2024, which would imply that it was darker during totality in 2024 compared with 2017.)
Reduction factors for Union Glacier are considerably smaller compared with those at the other two sites. This may be due to several reasons, such as the short duration of the eclipse (48 s), the large SZA (76.1°), and the high surface albedo (up to 0.95 in the UV range). Interestingly, the reduction factor at 305 nm is lower than those of visible wavelengths, whereas the opposite is true for reduction factors at Mazatlán and Oregon. This is likely a consequence of the large SZA leading to almost entirely diffuse radiation at 305 nm at the surface. We speculate that most photons detected at the ground and at this SZA entered the atmosphere far away from the observation site and were first scattered above the ozone layer. If that were the case, the shadow of the Moon would affect only a relative small part of the area in which photons of this wavelength entered the atmosphere and subsequently traveled towards the surface. Quantifying this potential effect would require 3-D radiative transfer calculations such as those performed by Ockenfuß et al. (2020).
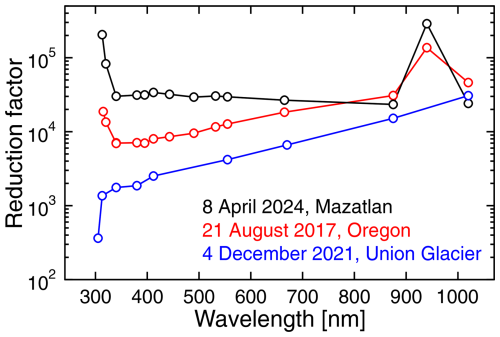
Figure 18Reduction factors defined as the ratio of spectral irradiance expected without the eclipse to the measurement at the time of totality. The red curve shows the factor for 21 August 2017 and is identical to that shown in Fig. 15 of B&P19. The black curve is the factor determined for the eclipse in Mazatlán on 8 April 2024. The spectral irradiance at the time of totality used for this plot is the average of measurements within ± 30 s of the time of the eclipse maximum. Measurements at 305 nm are below the detection limit at Mazatlán and Oregon and are not shown. Similarly, measurements at 1245 and 1640 nm at Union Glacier are below the detection limit.
Some changes in TCO during solar eclipses reported in the past are in conflict with results presented above. The potential reasons for these discrepancies are discussed below.
We found no convincing evidence of short-term fluctuations in TCO for the three eclipses discussed here, consistent with the results of our earlier publication describing the 2017 total solar eclipse (B&P19). The upper limits of the amplitude of oscillations in TCO observed at Union Glacier and Fort Collins were 0.03 % and 0.3 %, respectively. The limit for Mazatlán is somewhat larger due to the compounding effects of clouds. These variations are well within the natural variability and the uncertainty in our measurements. We also found no evidence of short-term fluctuation in surface pressure that could be attributed to the effect of gravity waves. While it cannot be excluded that conditions during past eclipses where large fluctuations in TCO were observed (e.g., Bojkov, 1968; Mims and Mims, 1993; Zerefos et al., 2000, 2007) were different, we believe that this is unlikely. For example, we found no fluctuations in TCO during the 2017 eclipse (B&P19), even though bow waves were clearly apparent in the ionosphere at this time (Zhang et al., 2017). Furthermore, totality at Mazatlán occurred at a small SZA of 20.9° and lasted quite a long time (4 min and 21 s). These conditions should have been ideal for the development of gravity waves because of the large absolute change in the solar flux and the resulting cooling of the upper and lower atmosphere over a large area. At Union Glacier, totality was relatively short (48 s) but the eclipse occurred only 17 d before the austral summer solstice, leading to significant changes in air temperature across the continent. For example, the 2 m air temperature dropped by about 3 °C at Union Glacier and by almost 5 °C at the South Pole (Garreaud et al., 2023). However, no significant changes in the TCO were detected at both Mazatlán and Union Glacier.
Increases in TCO within a few minutes of the eclipse maximum can be convincingly explained by the LD effect at Mazatlán and Fort Collins. The situation at Union Glacier is more complicated because of low solar elevations and high albedo. Nevertheless, even at this location, LD-corrected TCO data are quite constant up to 5 min before and after the period of totality. Measurements closer to totality are affected by noise in the measurements at 305 nm and 3-D effects (see below). While the LD effect has been acknowledged by several authors in the past, its magnitude is typically regarded as too small (i.e., < 0.01 % – Blumthaler et al., 2006, and Kazadzis et al., 2007; < 1 % – Zerefos et al., 2000; or < 1.6 % – Kazadzis et al., 2007) to quantitatively explain the sometimes large increases in TCO reported in these publications. In most of these cases, the LD effect is underestimated because of the use of the LD parameterization by Waldmeier (1941), which has been shown to be too small (Fig. 1; B&P19).
Increases in TCO at the time of totality are larger than increases in TCO, and the LD correction overcorrects TCO data at the three sites. The likely reason for this overcorrection is systematic errors in the coefficients published by Pierce and Slaughter (1977), which are the basis of the LD correction. This assertion is supported by the observation that the spectral shape of the uncorrected and corrected data is very similar, albeit inverted. It is highly unlikely that effects that could lead to a real change in TCO over a short periods of minutes before and after totality would have the same spectral dependence as the LD effect, which is independent of processes in the Earth's atmosphere (as it is entirely determined by the temperature structure of the Sun's photosphere). Furthermore, there is no plausible physical process that could increase the TCO by several tens of Dobson units within a few minutes and then cause a symmetrical decrease by the same amount after totality, in particular when considering that the day–night change in TCO is less than 0.6 % (Sect. 1.4).
Measurements of TCO by the Microtops instrument are about 6.5 % too high at both San Diego (Fig. 5) and Mazatlán (Fig. 9). We attribute this bias to the calibration of the instrument, even though it was acquired just before the campaign. Nevertheless, changes in TCO over time measured by the Microtops and GUV at the two sites are very consistent. Furthermore, changes in Microtops TCO data (scaled by 1/1.065) over time agree almost ideally with LD-corrected GUV data at Mazatlán. However, it is surprising that Microtops data are not affected by the LD effect (Fig. 9b). This may partly be due to the fact that the Microtops uses a smaller wavelength range (305–320 nm) than the GUV (305–340 nm), over which the wavelength dependence of the LD effect is smaller. As the instrument calculates the TCO from the 305–312 nm pair and the 312–320 nm pair separately and then combines the two results, it is conceivable that LD effects of the two bands partly cancel when merging their results. Whatever the reason, it is reassuring that Microtops measurements do not indicate variations in TCO that could be attributed to the eclipse, consistent with the GUV results.
Fluctuations in surface pressure during an eclipse can only be observed during stable atmospheric conditions (Sect. 1.3). This was the case at Mazatlán, as the diurnal cycle in pressure observed on the 3 d was almost identical with respect to both magnitude and duration (Fig. 10a). However, the data do not reveal any evidence of oscillations that could be attributed to gravity waves.
Uncorrected TCO data at Union Glacier increase by about 8 DU (4 %) leading up to totality, due to the LD effect, and then drop sharply by about 40 DU within 2.5 min before the second contact. The 3-D Monte Carlo model calculations by Emde and Mayer (2007) simulating the total solar eclipse of 29 March 2006 showed that 1-D radiative transfer calculations, which also formed the basis for the ozone lookup tables used here (Sect. 4.1), are no longer reliable about 1.5 min before the second contact. (The period applicable to the eclipse at Union Glacier could be longer.) Furthermore, by modeling the radiation of the 2017 total solar eclipse with a 3-D model similar to that used by Emde and Mayer (2007), Ockenfuß et al. (2020) found that the spectral UV irradiance close to totality becomes very sensitive to the vertical distribution of ozone in the atmosphere, surface albedo, and topography. These factors also likely played a role here. Hence, the drop in TCO is an artifact of using a lookup table that is inappropriately close in time to totality. We speculate that the sharp decrease in TCO is caused by photons that first traversed through the upper atmosphere horizontally (from a region not shaded by the Moon towards a point approximately above the site of observation) and were then scattered downward and passed through the ozone layer more vertically. This would lead to a shorter optical path length through the ozone layer compared with uneclipsed conditions. Resolving this issue quantitatively would require 3-D calculations, which are beyond the scope of this paper. It is clear, however, that the sharp apparent decrease in TCO and the immediate rebound after totality is far too fast and large in magnitude to be real.
Apart from studying variations in TCO, we also quantified the spectral irradiance during totality at Mazatlán and Union Glacier and calculated the AOD at three sites. At Mazatlán, spectral irradiance in the visible range is reduced by a factor of 30 500 on average during totality, which is a larger reduction than that observed during the 2017 total solar eclipse (B&P19). This can be explained by the larger eclipse magnitude of the 2024 eclipse, which led to a larger shadow of the Moon in 2024. Conversely, the reduction at Union Glacier was considerably lower than at the other two sites. At Fort Collins and Union Glacier, the uncorrected AOD exhibits a large peak centered on the time of the eclipse maximum. After correcting for the LD effect, the AOD remains almost constant over the period of the eclipse, providing further evidence of the fidelity of the LD correction developed by B&P19.
Measurements of spectral irradiance at 1 Hz were performed with GUVis-3511 multi-filter radiometers during solar eclipses observed at Mazatlán, Fort Collins, and Union Glacier. GUV measurements at Mazatlán were augmented by observations with a Microtops ozonometer and a microbarometer. At all sites, TCO retrieved from the data peaked at the time of maximum eclipse, but these increases could be convincingly explained by solar limb darkening, which describes the wavelength-dependent decrease in the Sun's brightness between the Sun's center and its edge. We found no evidence of periodic oscillations or other short-term fluctuations in TCO or surface pressure within the hours before or after the eclipses that exceed natural variability. The upper limits of the amplitude of oscillations in TCO observed at Union Glacier, Fort Collins, and Mazatlán were 0.03 %, 0.3 %, and 0.4 %, respectively. The slightly higher value at Mazatlán compared with Fort Collins is due to variability introduced by changing clouds. Our observations contradict reports of much larger fluctuations during previous eclipses published in the literature. We conclude that these large variations were caused by an insufficient correction for the solar limb darkening effect, measurement artifacts, data processing issues, or a combination thereof. This conclusion is also supported by the fact that day–night differences in TCO are smaller than 2 DU (∼ 0.6 %) at midlatitudes and that there is no known physical mechanism that could greatly amplify this magnitude during the relative short period of a solar eclipse. Assessing variations in TCO within ∼ 2 min of the start or the end of totality would require 3-D model calculations, which are beyond the scope of this paper. Therefore, we did not assess potential changes in TCO within in this short period. However, 3-D radiative transfer simulations of spectral solar irradiance complementing the solar eclipse at Mazatlán are planned, and these new results may provide further insights into changes in TCO close to totality.
We answer the question “Does total column ozone change during a solar eclipse?” posed in the title with “only by a very small amount and perhaps not at all”, as variations in the order of ± 0.3 % cannot be excluded. However, the cross-correlation between variations in TEC and JO1D described by Zerefos et al. (2007) and summarized in Sect. 1.1 remains unexplained. While this correlation is robust, the reported amplitudes of 5–10 DU in TCO and 3 %–5 % in JO1D are well outside the range of our measurements.
The GUVis-3511 Data Processor software and manual, raw data, and processed data shown in Figs. 4–18 are available from Zenodo (https://doi.org/10.5281/zenodo.14201523, Bernhard, 2024).
GHB devised the study, executed the measurements at Mazatlán, performed all data analyses, and wrote the manuscript. GTJ and SS performed the measurements at Fort Collins. RRC oversaw the measurements at Union Glacier. EISA, JJ, and JAR executed the measurements at Union Glacier. EISA also calibrated the GUV in 2015. RNL oversaw the project.
Germar H. Bernhard is employed by Biospherical Instruments, Inc., which is also the manufacturer of the GUVis-3511 radiometer described in this paper.
Publisher’s note: Copernicus Publications remains neutral with regard to jurisdictional claims made in the text, published maps, institutional affiliations, or any other geographical representation in this paper. While Copernicus Publications makes every effort to include appropriate place names, the final responsibility lies with the authors.
This research was funded by the Division of Atmospheric and Geospace Sciences (AGS) of the US National Science Foundation (NSF; grant no. 2328210). Any opinions, findings, and conclusions or recommendations expressed in this publication are those of the authors and do not necessarily reflect the views of the NSF. The authors wish to thank Anne L. Hoppe for coordinating travel to Mazatlán, transportation services, helping set up the instruments, and performing measurements; Anastazia T. Banaszak from the Institute of Marine Sciences and Limnology of the National Autonomous University of Mexico at Puerto Morelos, Mexico, for facilitating the project; Felipe Amezcua Martínez and his staff of the Institute of Marine Sciences and Limnology of the National Autonomous University of Mexico at Mazatlán, Mexico, for his permission to set up the instruments at his institute, his hospitality, and help with logistics; Paul Maley, expedition coordinator for the NASA Johnson Space Center Astronomical Society, Houston, Texas, for sharing his knowledge on observing solar eclipses in general and aiding the observations at Mazatlán; and Graciela Alvarez and Rosa Vazquez from the US embassy in Mexico City for facilitating the permitting process with the Mexican government. We are further grateful to Luis Gerardo Esparza Ríos, general director of the Department of Geography and Environment at the National Institute of Statistics and Geography (INEGI), Mexico; José Arturo Sánchez Monterrubio, deputy director of aerial surveys and geographical explorations of the General Directorate of Geography and Environment of Mexico; and José Alfredo Galvan Corona, general director of project operations in Mexico for granting permission to conduct scientific research in Mexico and to perform measurements at Mazatlán. Raúl R. Cordero, Edgardo I. Sepúlveda Araya, Jose Jorquera, and Juan A. Rayas acknowledge support from the Agencia Nacional de Investigación y Desarrollo (ANID) of Chile (grant no. ANILLO ACT210046) and the Chilean Antarctic Institute (INACH; grant no. Preis RT_69-20). We also wish to thank the two anonymous reviewers for their valuable comments.
This research has been supported by the US National Science Foundation (grant no. 2328210).
This paper was edited by Stelios Kazadzis and reviewed by two anonymous referees.
Akhil Raj, S. T. and Ratnam, M. V.: Ozone vertical distribution during the solar eclipse of 26 December 2019 over Gadanki: Role of background dynamics, Atmos. Pollut. Res., 12, 101116, https://doi.org/10.1016/j.apr.2021.101116, 2021.
Anderson, G. P., Clough, S. A., Kneizys, F. X., Chetwynd, J. H., and Shettle, E. P.: AFGL atmospheric constituent profiles (0–120 km), Tech. Rep. AFGL-TR-86-0110,Air Force Geophys. Lab., Bedford, Mass., 43 pp., https://apps.dtic.mil/sti/tr/pdf/ADA175173.pdf (last access: 15 May 2024), 1986.
Anderson, R. C. and Keefer, D. R.: Observation of the temperature and pressure changes during the 30 June 1973 solar eclipse, J. Atmos. Sci., 32, 228–231, 1975.
Anderson, R. C., Keefer, D. R., and Myers, O. E.: Atmospheric pressure and temperature changes during the 7 March 1970 solar eclipse, J. Atmos. Sci., 29, 583–587, 1972.
Antón, M., Serrano, A., Cancillo, M. L., Vaquero, J. M., and Vilaplana, J. M.: Solar irradiance and total ozone over El Arenosillo (Spain) during the solar eclipse of 3 October 2005, J. Atmos. Sol.-Terr. Phys., 72, 789–793, https://doi.org/10.1016/j.jastp.2010.03.025, 2010.
Bernhard, G. H.: Data complementing the publication: “Does total column ozone change during a solar eclipse?”, Zenodo [data set and code], https://doi.org/10.5281/zenodo.14201523, 2024.
Bernhard, G. and Petkov, B.: Measurements of spectral irradiance during the solar eclipse of 21 August 2017: reassessment of the effect of solar limb darkening and of changes in total ozone, Atmos. Chem. Phys., 19, 4703–4719, https://doi.org/10.5194/acp-19-4703-2019, 2019.
Bernhard, G., Booth, C. R., and McPeters, R. D.: Calculation of total column ozone from global UV spectra at high latitudes, J. Geophys. Res.-Atmos., 108, 4532, https://doi.org/10.1029/2003JD003450, 2003.
Bernhard, G., Booth, C. R., and Ehramjian, J. C.: Version 2 data of the National Science Foundation's ultraviolet radiation monitoring network: South Pole, J. Geophys. Res.-Atmos., 109, D21207, https://doi.org/10.1029/2004jd004937, 2004.
Blumthaler, M., Bais, A., Webb, A., Kazadzis, S., Kift, R., Kouremeti, N., Schallhart, B., and Kazantzidis, A.: Variations of solar radiation at the Earth's surface during the total solar eclipse of 29 March 2006, P. Soc. Photo.-Opt. Ins., 6362, U126–U133, https://doi.org/10.1117/12.689630, 2006.
Bojkov, R. D.: The ozone variations during the solar eclipse of 20 May 1966, Tellus, 20, 417–421, https://onlinelibrary.wiley.com/doi/abs/10.1111/j.2153-3490.1968.tb00382.x (last access: 17 January 2025), 1968.
Chakrabarty, D. K., Shah, N. C., and Pandya, K. V.: Fluctuation in ozone column over Ahmedabad during the solar eclipse of 24 October 1995, Geophys. Res. Lett., 24, 3001–3003, https://doi.org/10.1029/97GL03016, 1997.
Chen, L., Ding, M., She, Y., Zhang, L., Zeng, Z., Jia, J., Zheng, Y., Tian, B., Zhu, K., Wang, X., Yao, Z., and Che, H.: Regional aerosol optical depth over Antarctica, Atmos. Res., 308, 107534, https://doi.org/10.1016/j.atmosres.2024.107534, 2024.
Chimonas, G.: Internal gravity-wave motions induced in the Earth's atmosphere by a solar eclipse, J. Geophys. Res., 75, 5545–5551, 1970.
Chimonas, G.: Lamb waves generated by the 1970 solar eclipse, Planet. Space Sci., 21, 1843–1854, 1973.
Chimonas, G. and Hines, C. O.: Atmospheric gravity waves induced by a solar eclipse, J. Geophys. Res., 75, 875–875, 1970.
Chimonas, G. and Hines, C. O.: Atmospheric gravity waves induced by a solar eclipse, 2, J. Geophys. Res., 76, 7003–7005, 1971.
Colligan, T., Fowler, J., Godfrey, J., and Spangrude, C.: Detection of stratospheric gravity waves induced by the total solar eclipse of July 2, 2019, Sci. Rep., 10, 1–8, 2020.
Cordero, R. R., Damiani, A., Ferrer, J., Jorquera, J., Tobar, M., Labbe, F., Carrasco, J., and Laroze, D.: UV irradiance and albedo at Union Glacier Camp (Antarctica): A case study, PLoS One, 9, e90705, https://doi.org/10.1371/journal.pone.0090705, 2014.
Dahlback, A.: Measurements of biologically effective UV doses, total ozone abundances, and cloud effects with multichannel, moderate bandwidth filter instruments, Appl. Opt., 35, 6514–6521, https://doi.org/10.1364/AO.35.006514, 1996.
Dikty, S., Schmidt, H., Weber, M., von Savigny, C., and Mlynczak, M. G.: Daytime ozone and temperature variations in the mesosphere: a comparison between SABER observations and HAMMONIA model, Atmos. Chem. Phys., 10, 8331–8339, https://doi.org/10.5194/acp-10-8331-2010, 2010.
Dutta, G., Kumar, P. V., Ratnam, M. V., Mohammad, S., Kumar, M. C. A., Rao, P. V., Rahaman, K., and Basha, H. A.: Response of tropical lower atmosphere to annular solar eclipse of 15 January, 2010, J. Atmos. Sol.-Terr. Phys., 73, 1907–1914, 2011.
Eck, T. F., Holben, B. N., Reid, J. S., Dubovik, O., Smirnov, A., O'Neill, N. T., Slutsker, I., and Kinne, S.: Wavelength dependence of the optical depth of biomass burning, urban, and desert dust aerosols, J. Geophys. Res.-Atmos., 104, 31333–31349, https://doi.org/10.1029/1999JD900923, 1999.
Eckermann, S. D., Broutman, D., Stollberg, M. T., Ma, J., McCormack, J. P., and Hogan, T. F.: Atmospheric effects of the total solar eclipse of 4 December 2002 simulated with a high-altitude global model, J. Geophys. Res., 112, D14105, https://doi.org/10.1029/2006jd007880, 2007.
Emde, C. and Mayer, B.: Simulation of solar radiation during a total eclipse: a challenge for radiative transfer, Atmos. Chem. Phys., 7, 2259–2270, https://doi.org/10.5194/acp-7-2259-2007, 2007.
Farges, T., Le Pichon, A., Blanc, E., Perez, S., and Alcoverro, B.: Response of the lower atmosphere and the ionosphere to the eclipse of August 11, 1999, J. Atmos. Sol.-Terr. Phys., 65, 717–726, 2003.
Fritts, D. C. and Luo, Z.: Gravity wave forcing in the middle atmosphere due to reduced ozone heating during a solar eclipse, J. Geophys. Res.-Atmos., 98, 3011–3021, 1993.
Fuchs, E. C., Oudakker, G., Justinek, M., Dyer, N., Woisetschläger, J., Godines, K., Mäder, M., and Freund, F. T.: Solar eclipses and the surface properties of water, Earth Moon Planet., 123, 15–43, https://doi.org/10.1007/s11038-019-09529-0, 2019.
Garreaud, R., Bozkurt, D., Spangrude, C., Carrasco-Escaff, T., Rondanelli, R., Muñoz, R., Jubier, X. M., Lazzara, M., Keller, L., and Rojo, P.: Cooling the coldest continent: The 4 December 2021 total solar eclipse over Antarctica, Bull. Am. Meteorol. Soc., 104, E2265–E2285, https://doi.org/10.1175/bams-d-22-0272.1, 2023.
Goodwin, G. L. and Hobson, G. J.: Atmospheric gravity waves generated during a solar eclipse, Nature, 275, 109–111, 1978.
Grenfell, T. C., Warren, S. G., and Mullen, P. C.: Reflection of solar radiation by the Antarctic snow surface at ultraviolet, visible, and near-infrared wavelengths, J. Geophys. Res., 99, 18669–18684, https://doi.org/10.1029/94jd01484, 1994.
Haurwitz, B. and Cowley, A. D.: The diurnal and semidiurnal barometric oscillations global distribution and annual variation, Pure Appl. Geophys., 102, 193–222, https://doi.org/10.1007/BF00876607, 1973.
Holben, B. N., Eck, T. F., Slutsker, I., Tanré, D., Buis, J. P., Setzer, A., Vermote, E., Reagan, J. A., Kaufman, Y. J., Nakajima, T., Lavenu, F., Jankowiak, I., and Smirnov, A.: AERONET – A Federated Instrument Network and Data Archive for Aerosol Characterization, Remote Sens. Environ., 66, 1–16, https://doi.org/10.1016/S0034-4257(98)00031-5, 1998.
Hooker, S. B., Bernhard, G., Morrow, J. H., Booth, C. R., Comer, T., Lind, R. N., and Quang, V.: Optical Sensors for Planetary Radiant Energy (OSPREy): calibration and validation of current and next-generation NASA missions, NASA/TM–2011–215872, NASA Goddard Space Flight Center, Maryland, USA, https://ntrs.nasa.gov/api/citations/20130003503/downloads/20130003503.pdf (last access: 25 July 2024), 2012.
Jerlov, N., Olsson, H., and Schuepp, W.: Measurements of solar radiation at Lövånger in Sweden during the total eclipse 1945, Tellus A, 6, 44–45, https://doi.org/10.3402/tellusa.v6i1.8712, 1954.
Kawabata, Y.: Spectrographic observation of the amount of ozone at the total solar eclipse of June 19 1936, J. Astron. Geophys., 14, 1–3, 1937.
Kazadzis, S., Bais, A., Blumthaler, M., Webb, A., Kouremeti, N., Kift, R., Schallhart, B., and Kazantzidis, A.: Effects of total solar eclipse of 29 March 2006 on surface radiation, Atmos. Chem. Phys., 7, 5775–5783, https://doi.org/10.5194/acp-7-5775-2007, 2007.
Kazantzidis, A., Bais, A. F., Emde, C., Kazadzis, S., and Zerefos, C. S.: Attenuation of global ultraviolet and visible irradiance over Greece during the total solar eclipse of 29 March 2006, Atmos. Chem. Phys., 7, 5959–5969, https://doi.org/10.5194/acp-7-5959-2007, 2007.
Koepke, P., Reuder, J., and Schween, J.: Spectral variation of the solar radiation during an eclipse, Meteorol. Z., 10, 179–186, https://doi.org/10.1127/0941-2948/2001/0010-0179, 2001.
Li, J., Jiang, S., Yao, J., Cui, J., Lu, J., Tian, Y., Yang, C., Xiong, S., Wei, G., Zhang, X., Fu, S., Zhu, Z., Wang, J., Li, Z., and Zhang, H.: The Responses of Ozone to the Solar Eclipse on the 21st of June 2020 in the Mesosphere and Upper Stratosphere, Remote Sens., 16, https://doi.org/10.3390/rs16010014, 2023.
Marlton, G. J., Williams, P. D., and Nicoll, K. A.: On the detection and attribution of gravity waves generated by the 20 March 2015 solar eclipse, Philos. T. Roy. Soc. A, 374, 20150222, https://doi.org/10.1098/rsta.2015.0222, 2016.
Marty, J., Dalaudier, F., Ponceau, D., Blanc, E., and Munkhuu, U.: Surface pressure fluctuations produced by the total solar eclipse of 1 August 2008, J. Atmos. Sci., 70, 809–823, 2013.
Mateos, D., Antón, M., and Vaquero, J. M.: Influence of solar eclipse of November 3rd, 2013 on the total ozone column over Badajoz, Spain, J. Atmos. Sol.-Terr. Phys., 112, 43–46, https://doi.org/10.1016/j.jastp.2014.02.005, 2014.
Mayer, B. and Kylling, A.: Technical note: The libRadtran software package for radiative transfer calculations - description and examples of use, Atmos. Chem. Phys., 5, 1855–1877, https://doi.org/10.5194/acp-5-1855-2005, 2005.
Mims, F. M. and Mims, E. R.: Fluctuations in column ozone during the total solar eclipse of July 11, 1991, Geophys. Res. Lett., 20, 367–370, https://doi.org/10.1029/93gl00493, 1993.
Morys, M., Mims III, F. M., Hagerup, S., Anderson, S. E., Baker, A., Kia, J., and Walkup, T.: Design, calibration, and performance of MICROTOPS II handheld ozone monitor and Sun photometer, J. Geophys. Res., 106, 14573–14582, https://doi.org/10.1029/2001JD900103, 2001.
Natarajan, M., Damadeo, R., and Flittner, D.: Solar occultation measurement of mesospheric ozone by SAGE III/ISS: impact of variations along the line of sight caused by photochemistry, Atmos. Meas. Tech., 16, 75–87, https://doi.org/10.5194/amt-16-75-2023, 2023.
Neckel, H.: Analytical Reference Functions F (λ) for the Sun's Limb Darkening and Its Absolute Continuum Intensities (λλ 300 to 1100 m), Sol. Phys., 229, 13–33, 2005.
Ockenfuß, P., Emde, C., Mayer, B., and Bernhard, G.: Accurate 3-D radiative transfer simulation of spectral solar irradiance during the total solar eclipse of 21 August 2017, Atmos. Chem. Phys., 20, 1961–1976, https://doi.org/10.5194/acp-20-1961-2020, 2020.
Parrish, A., Boyd, I. S., Nedoluha, G. E., Bhartia, P. K., Frith, S. M., Kramarova, N. A., Connor, B. J., Bodeker, G. E., Froidevaux, L., Shiotani, M., and Sakazaki, T.: Diurnal variations of stratospheric ozone measured by ground-based microwave remote sensing at the Mauna Loa NDACC site: measurement validation and GEOSCCM model comparison, Atmos. Chem. Phys., 14, 7255–7272, https://doi.org/10.5194/acp-14-7255-2014, 2014.
Piedehierro, A. A., Cancillo, M. L., Serrano, A., Antón, M., and Vilaplana, J. M.: Selection of suitable wavelengths for estimating total ozone column with multifilter UV radiometers, Atmos. Environ., 160, 124–131, https://doi.org/10.1016/j.atmosenv.2017.04.022, 2017.
Pierce, A. K. and Slaughter, C.: Solar limb darkening, Sol. Phys., 51, 25–41, https://doi.org/10.1007/BF00240442, 1977.
Pierce, A. K., Slaughter, C. D., and Weinberger, D.: Solar limb darkening in the interval 7404-24 018 Å, II, Sol. Phys., 52, 179–189, https://doi.org/10.1007/bf00935800, 1977.
Sauvageat, E., Hocke, K., Maillard Barras, E., Hou, S., Errera, Q., Haefele, A., and Murk, A.: Microwave radiometer observations of the ozone diurnal cycle and its short-term variability over Switzerland, Atmos. Chem. Phys., 23, 7321–7345, https://doi.org/10.5194/acp-23-7321-2023, 2023.
Seykora, E. J., Bhatnagar, A., Jain, R. M., and Streete, J. L.: Evidence of atmospheric gravity waves produced during the 11 June 1983 total solar eclipse, Nature, 313, 124–125, 1985.
Sinyuk, A., Holben, B. N., Eck, T. F., Giles, D. M., Slutsker, I., Korkin, S., Schafer, J. S., Smirnov, A., Sorokin, M., and Lyapustin, A.: The AERONET Version 3 aerosol retrieval algorithm, associated uncertainties and comparisons to Version 2, Atmos. Meas. Tech., 13, 3375–3411, https://doi.org/10.5194/amt-13-3375-2020, 2020.
Stamnes, K., Slusser, J., and Bowen, M.: Derivation of total ozone abundance and cloud effects from spectral irradiance measurements, Appl. Opt., 30, 4418–4426, https://doi.org/10.1364/AO.30.004418, 1991.
Trees, V. J. H., de Roode, S. R., Wiltink, J. I., Meirink, J. F., Wang, P., Stammes, P., and Siebesma, A. P.: Clouds dissipate quickly during solar eclipses as the land surface cools, Commun. Earth Environ., 5, 71, https://doi.org/10.1038/s43247-024-01213-0, 2024.
Uetz, G. W., Hieber, C. S., Jakob, E. M., Wilcox, R. S., Kroeger, D., McCrate, A., and Mostrom, A. M.: Behavior of Colonial Orb-weaving Spiders during a Solar Eclipse, Ethology, 96, 24–32, https://doi.org/10.1111/j.1439-0310.1994.tb00878.x, 2010.
Waldmeier, M.: Ergebnisse und Probleme der Sonnenforschung – Probleme der kosmischen Physik, Akad. Verlagsges. Becker and Erler, Leipzig, Germany, 1941.
Williams, P. D., Read, P. L., and Haine, T. W. N.: Spontaneous generation and impact of inertia-gravity waves in a stratified, two-layer shear flow, Geophys. Res. Lett., 30, 2255, https://doi.org/10.1029/2003GL018498, 2003.
Winkler, P., Kaminski, U., Köhler, U., Riedl, J., Schroers, H., and Anwender, D.: Development of meteorological parameters and total ozone during the total solar eclipse of August 11, 1999, Meteorol. Z., 10, 193–199, https://doi.org/10.1127/0941-2948/2001/0010-0193, 2001.
Witthuhn, J., Deneke, H., Macke, A., and Bernhard, G.: Algorithms and uncertainties for the determination of multispectral irradiance components and aerosol optical depth from a shipborne rotating shadowband radiometer, Atmos. Meas. Tech., 10, 709–730, https://doi.org/10.5194/amt-10-709-2017, 2017.
Yoon, H. W., Gibson, C. E., and Barnes, P. Y.: Realization of the National Institute of Standards and Technology detector-based spectral irradiance scale, Appl. Opt., 41, 5879–5890, https://doi.org/10.1364/ao.41.005879, 2002.
Zerefos, C. S., Balis, D. S., Meleti, C., Bais, A. F., Tourpali, K., Kourtidis, K., Vanicek, K., Cappellani, F., Kaminski, U., Colombo, T., Stubi, R., Manea, L., Formenti, P., and Andreae, M. O.: Changes in surface solar UV irradiances and total ozone during the solar eclipse of August 11, 1999, J. Geophys. Res.-Atmos., 105, 26463–26473, https://doi.org/10.1029/2000jd900412, 2000.
Zerefos, C. S., Balis, D. S., Zanis, P., Meleti, C., Bais, A. F., Tourpali, K., Melas, D., Ziomas, I., Galani, E., Kourtidis, K., Papayannis, A., and Gogosheva, Z.: Changes in surface UV solar irradiance and ozone over the Balkans during the eclipse of August 11, 1999, Adv. Space Res., 27, 1955–1963, 2001.
Zerefos, C. S., Gerasopoulos, E., Tsagouri, I., Psiloglou, B. E., Belehaki, A., Herekakis, T., Bais, A., Kazadzis, S., Eleftheratos, C., Kalivitis, N., and Mihalopoulos, N.: Evidence of gravity waves into the atmosphere during the March 2006 total solar eclipse, Atmos. Chem. Phys., 7, 4943–4951, https://doi.org/10.5194/acp-7-4943-2007, 2007.
Zhang, S. R., Erickson, P. J., Goncharenko, L. P., Coster, A. J., Rideout, W., and Vierinen, J.: Ionospheric bow waves and perturbations induced by the 21 August 2017 solar eclipse, Geophys. Res. Lett., 44, 12067–12073 2017.


