the Creative Commons Attribution 4.0 License.
the Creative Commons Attribution 4.0 License.
 | 29 Jul 2025
Ambient and intrinsic dependencies of evolving ice-phase particles within a decaying winter storm during IMPACTS
Andrew DeLaFrance
Lynn A. McMurdie
Angela K. Rowe
Andrew J. Heymsfield
Mesoscale bands develop within winter cyclones as concentrated regions of locally enhanced radar reflectivity, often corresponding to intensified precipitation rates lasting several hours. Surface precipitation characteristics are governed by the microphysical properties of the ice-phase particles aloft, yet their unique microphysical evolutionary pathways and ambient environmental dependencies in banded regions remain poorly understood, in part due to a paucity of observations within clouds. Addressing this need, the Investigation of Microphysics and Precipitation for Atlantic Coast-Threatening Snowstorms measured properties of winter cyclones from airborne in situ and remote sensing platforms. Observations collected within a banded region of a decaying-stage northeast United States cyclone revealed a microphysical pathway characterized by precipitation fallout from a weak generating cell layer through an ∼ 2 km deep subsaturated downdraft region. Sublimation was a dominant evolutionary process, resulting in a > 70 % reduction in the initial characteristic ice water content (IWC). This vertical evolution was reproduced by a one-dimensional (1D) particle-based model simulation constrained by observations, conveying accuracy in the process representation. Four sensitivity simulations assessed evolutionary dependencies based on observationally informed perturbations of the ambient relative humidity, RH, and vertical air motion, w. Perturbations of ∼ 2 % RH significantly varied the resultant characteristic IWC loss, by as much as 29 %, whereas comparable perturbations of w had negligible effects. Intrinsic particle evolution during sublimation demonstrated a notable imprint on vertical profiles of radar reflectivity, but the Doppler velocity was more strongly governed by the ambient w profile. These findings contextualize radar-based discrimination of sublimation from other ice-phase processes, including riming and aggregation.
- Article
(8219 KB) - Full-text XML
- BibTeX
- EndNote


Northeast US winter cyclones commonly develop mesoscale banded regions that can produce intense rainfall and snowfall rates within concentrated regions of the storm (Novak et al., 2004, 2008; Ganetis et al., 2018). These mesoscale bands may be diagnosed from radar reflectivity measurements such as the operational NWS Multi-Radar/Multi-Sensor (MRMS) product (Zhang et al., 2011; Brodzik, 2022b). For example, Novak et al. (2006) defined a mesoscale band as having a length > 250 km, width of 20 to 100 km, and radar reflectivity > 30 dBZ for at least 2 h. Numerical weather prediction of precipitation rates within these potentially high-impact mesoscale bands is challenging, in part because of the demonstrated variations in microphysical properties and evolutionary processes, including rapid changes in crystal habits (Stark et al., 2013) and degrees of riming (Colle et al., 2014) measured at the surface.
Mesoscale banding developed during a significant midlatitude cyclone on 4 February 2022 that produced widespread and diverse wintry-mixed precipitation spanning the midwest to northeast US. At the surface, the cyclone was defined by a relatively weak, elongated low-pressure center and stationary frontal boundary positioned along the US northeastern coastline (Zaremba et al., 2024). As described in DeLaFrance et al. (2024b, see Fig. 2a and Sect. 2.1), two distinct regions of enhanced composite reflectivity developed northeast of the low-pressure center. One of the regions of enhanced reflectivity was positioned on the warm side of the frontal boundary and lacked a well-defined banding structure but produced transitory mixed-phase wintry precipitation, including rain, ice pellets, and snow, over the southern New England region and extending offshore. A second region developed near the surface stationary front that extended into New Hampshire and Maine and exhibited a well-defined banded structure, but with decreasing composite reflectivity in time. Nonetheless, the reflectivity in this banded region was consistently 6.5 to 9.0 dB greater than in the region that lacked well-defined banding. This relative and persistent enhancement in reflectivity in the banded region despite its apparent decay in time raises interesting questions about the evolutionary pathways for precipitating particles in this region and their implications for surface precipitation.
Radar reflectivity measurements have a long history of use in estimating precipitation rates, initially from simple empirically derived relationships between reflectivity and rain rate (e.g., Marshall and Palmer, 1948) and later extended to snowfall rates (e.g., Boucher and Wieler, 1985; Fujiyoshi et al., 1990; Heymsfield et al., 2016). Ambiguity in precipitation intensity due to varied microphysical particle properties has motivated the adoption of more complex relationships derived from an improved understanding of the unique effects of microphysical-processes-based evolution on radar remote sensing measurements. Often, these techniques are derived from two or more coincident radar-based measurements (e.g., Grecu et al., 2016; Chase et al., 2022; Dunnavan et al., 2023). Leveraging scattering dependencies based on the physical properties of ice crystals and calculations based on modeled snowflakes of varied complexities have shown promise in characterizing the unique effects of ice-phase microphysical processes from coincident radar-based sources (e.g., Petty and Huang, 2010; Kneifel et al., 2011, 2015; Leinonen and Moisseev, 2015; Leinonen and Szyrmer, 2015). Similarly, leveraging dependencies of intrinsic particle fall velocity on their physical properties (e.g., Mitchell, 1996; Heymsfield and Westbrook, 2010) and incorporating measurements from the radar Doppler spectrum provide a further constraint on process-based changes, especially during riming (e.g., Kalesse et al., 2016; Mason et al., 2018, 2019). Through the development of novel methods to detect and quantify the effects of microphysical processes from remote sensing radar measurements, the physical properties of the ice particles may be more accurately estimated. However, as these retrieval techniques continue to become increasingly complex and adopt multi-source measurements, validation of retrieved physical properties and inferred microphysical processes using observations from precipitating clouds remains crucially important.
Addressing this observational need, the Investigation of Microphysics and Precipitation for Atlantic Coast-Threatening Snowstorms (IMPACTS) field campaign collected measurements from precipitating clouds over the northeast and midwest US during 36 science flights over the 2020, 2022, and 2023 winters using a comprehensive suite of remote sensing and in situ instruments (McMurdie et al., 2022a). A total of 11 science flights were conducted during the 2022 deployment, with eight of those including coordination between the in situ cloud-sampling P-3 and overflying ER-2 aircraft, providing coincident remote sensing and in situ measurements within diverse winter storm environments (McMurdie et al., 2022b). These measurements have direct application towards validating remote sensing retrieval of the microphysical properties of ice crystals (e.g., Chase et al., 2020, 2022; Matrosov et al., 2022; Finlon et al., 2022; Heymsfield et al., 2023).
Elucidating process-based insights from temporally and spatially discontinuous airborne measurements within an evolving and moving cloud system remains challenging. Numerical modeling simulations are one method of connecting independent observations to microphysical processes. However, bulk schemes require a limited representation of particle properties and microphysical processes, thus presenting challenges for the integration of, or comparison with, observations (Morrison et al., 2020). Moreover, three-dimensional (3D) dynamic simulations of winter storms are subject to extrinsic uncertainties from design choices including initial conditions, grid-cell resolution, and lead time (e.g., Colle et al., 2023). However, recent advances in Lagrangian-particle-based modeling techniques have shown promise in accurately simulating ice-phase precipitation processes, typically at the expense of simplified dynamics and physical domains (e.g., Jensen and Harrington, 2015; Brdar and Seifert, 2018; Bringi et al., 2020; DeLaFrance et al., 2024a).
Recently, DeLaFrance et al. (2024b) used one-dimensional (1D) particle-based modeling simulations constrained by IMPACTS observations to elucidate process-based insights on the evolution of precipitating particles within the region of the 4 February 2022 winter storm that lacked well-defined banding. Within this region of concurrent vapor deposition, efficient aggregation, and riming, simulated particle evolution revealed that rime accumulations accounted for a dominant 55 % of the total ice-phase precipitation mass. Additionally, the riming process produced a unique change in the vertical profile of the Doppler velocity, consistent with the coincident remote sensing radar observations. For this riming-dominant evolutionary pathway, sensitivity simulations designed from observationally informed perturbations of ambient supercooled liquid water concentrations yielded a precipitation rate variability exceeding 60 % (DeLaFrance et al., 2024b). These perturbed states further demonstrated substantial variations in reflectivity and Doppler velocity that emphasized differential effects of the riming and aggregation processes. These results warrant further investigation on the implications for the dependencies of other ice-phase microphysical processes on their ambient environmental properties, particularly those associated with the banded region during this same event. With this motivation, this paper aims to address four specific questions:
-
What was the microphysical evolutionary pathway of precipitating particles that contributed to enhanced reflectivity along a mesoscale band during this IMPACTS winter storm event?
-
What is the role of the ambient environment of the evolving particles in governing precipitation fallout within the banded region?
-
What are the quantitative implications of sensitivities in the evolution of ice-phase particles to their ambient environment properties?
-
To what extent are radar remote sensing measurements of reflectivity and Doppler velocity modulated by process-based responses to perturbations in ambient environmental properties?
To address these questions, we use numerical modeling simulations constrained by IMPACTS observations from the banded region to assess process-based sensitivities and quantify their imprint on radar remote sensing measurements. In the following section, we introduce the IMPACTS instrumentation and observational strategy during the 4 February 2022 winter storm. Section 3 provides an observational analysis of the precipitation processes during this event. In Sect. 4, we establish a control simulation and discuss its observational validation. Section 5 describes four sensitivity simulations for assessing process-based dependencies on the ambient environment. We provide some context for, and discuss the utility of, our findings in Sect. 6 and offer concluding remarks in Sect. 7.
2.1 The 4 February 2022 winter storm
Because of the objective of IMPACTS to sample banded precipitation and the fact that the colder region to the north and west of the surface front presented a greater likelihood of snowfall at the surface, a banded region near the front was the primary target of the 4 February science flights. Therefore, spatial and temporal coordination of sampling from the two IMPACTS aircraft was prioritized near the banded region. Composite radar reflectivity from the NWS MRMS product shown in Fig. 1 provides spatial and temporal context of the intended sampling objectives of IMPACTS flights relative to the prominent banded enhancement elongated southwest-to-northeast near the Gulf of Maine coastline. With passage of this band, steady winter precipitation was reported at the Automated Surface Observing Stations (ASOS; Brodzik, 2022a) in Wiscasset, Maine (KIWI, location shown in Fig. 1a). Between 00:00 and 07:06 UTC on 4 February, KIWI reported above-freezing surface temperatures before rapidly decreasing below 0 °C (Fig. 2a). The hourly precipitation rate reached a modest maximum rate of 2.5 mm during the 12:00 UTC hour, and precipitation intensity gradually reduced thereafter (Fig. 2b). A relative minimum in mean sea level pressure occurred at about 19:00 UTC 4 February (Fig. 2c), associated with the passage of the surface front.
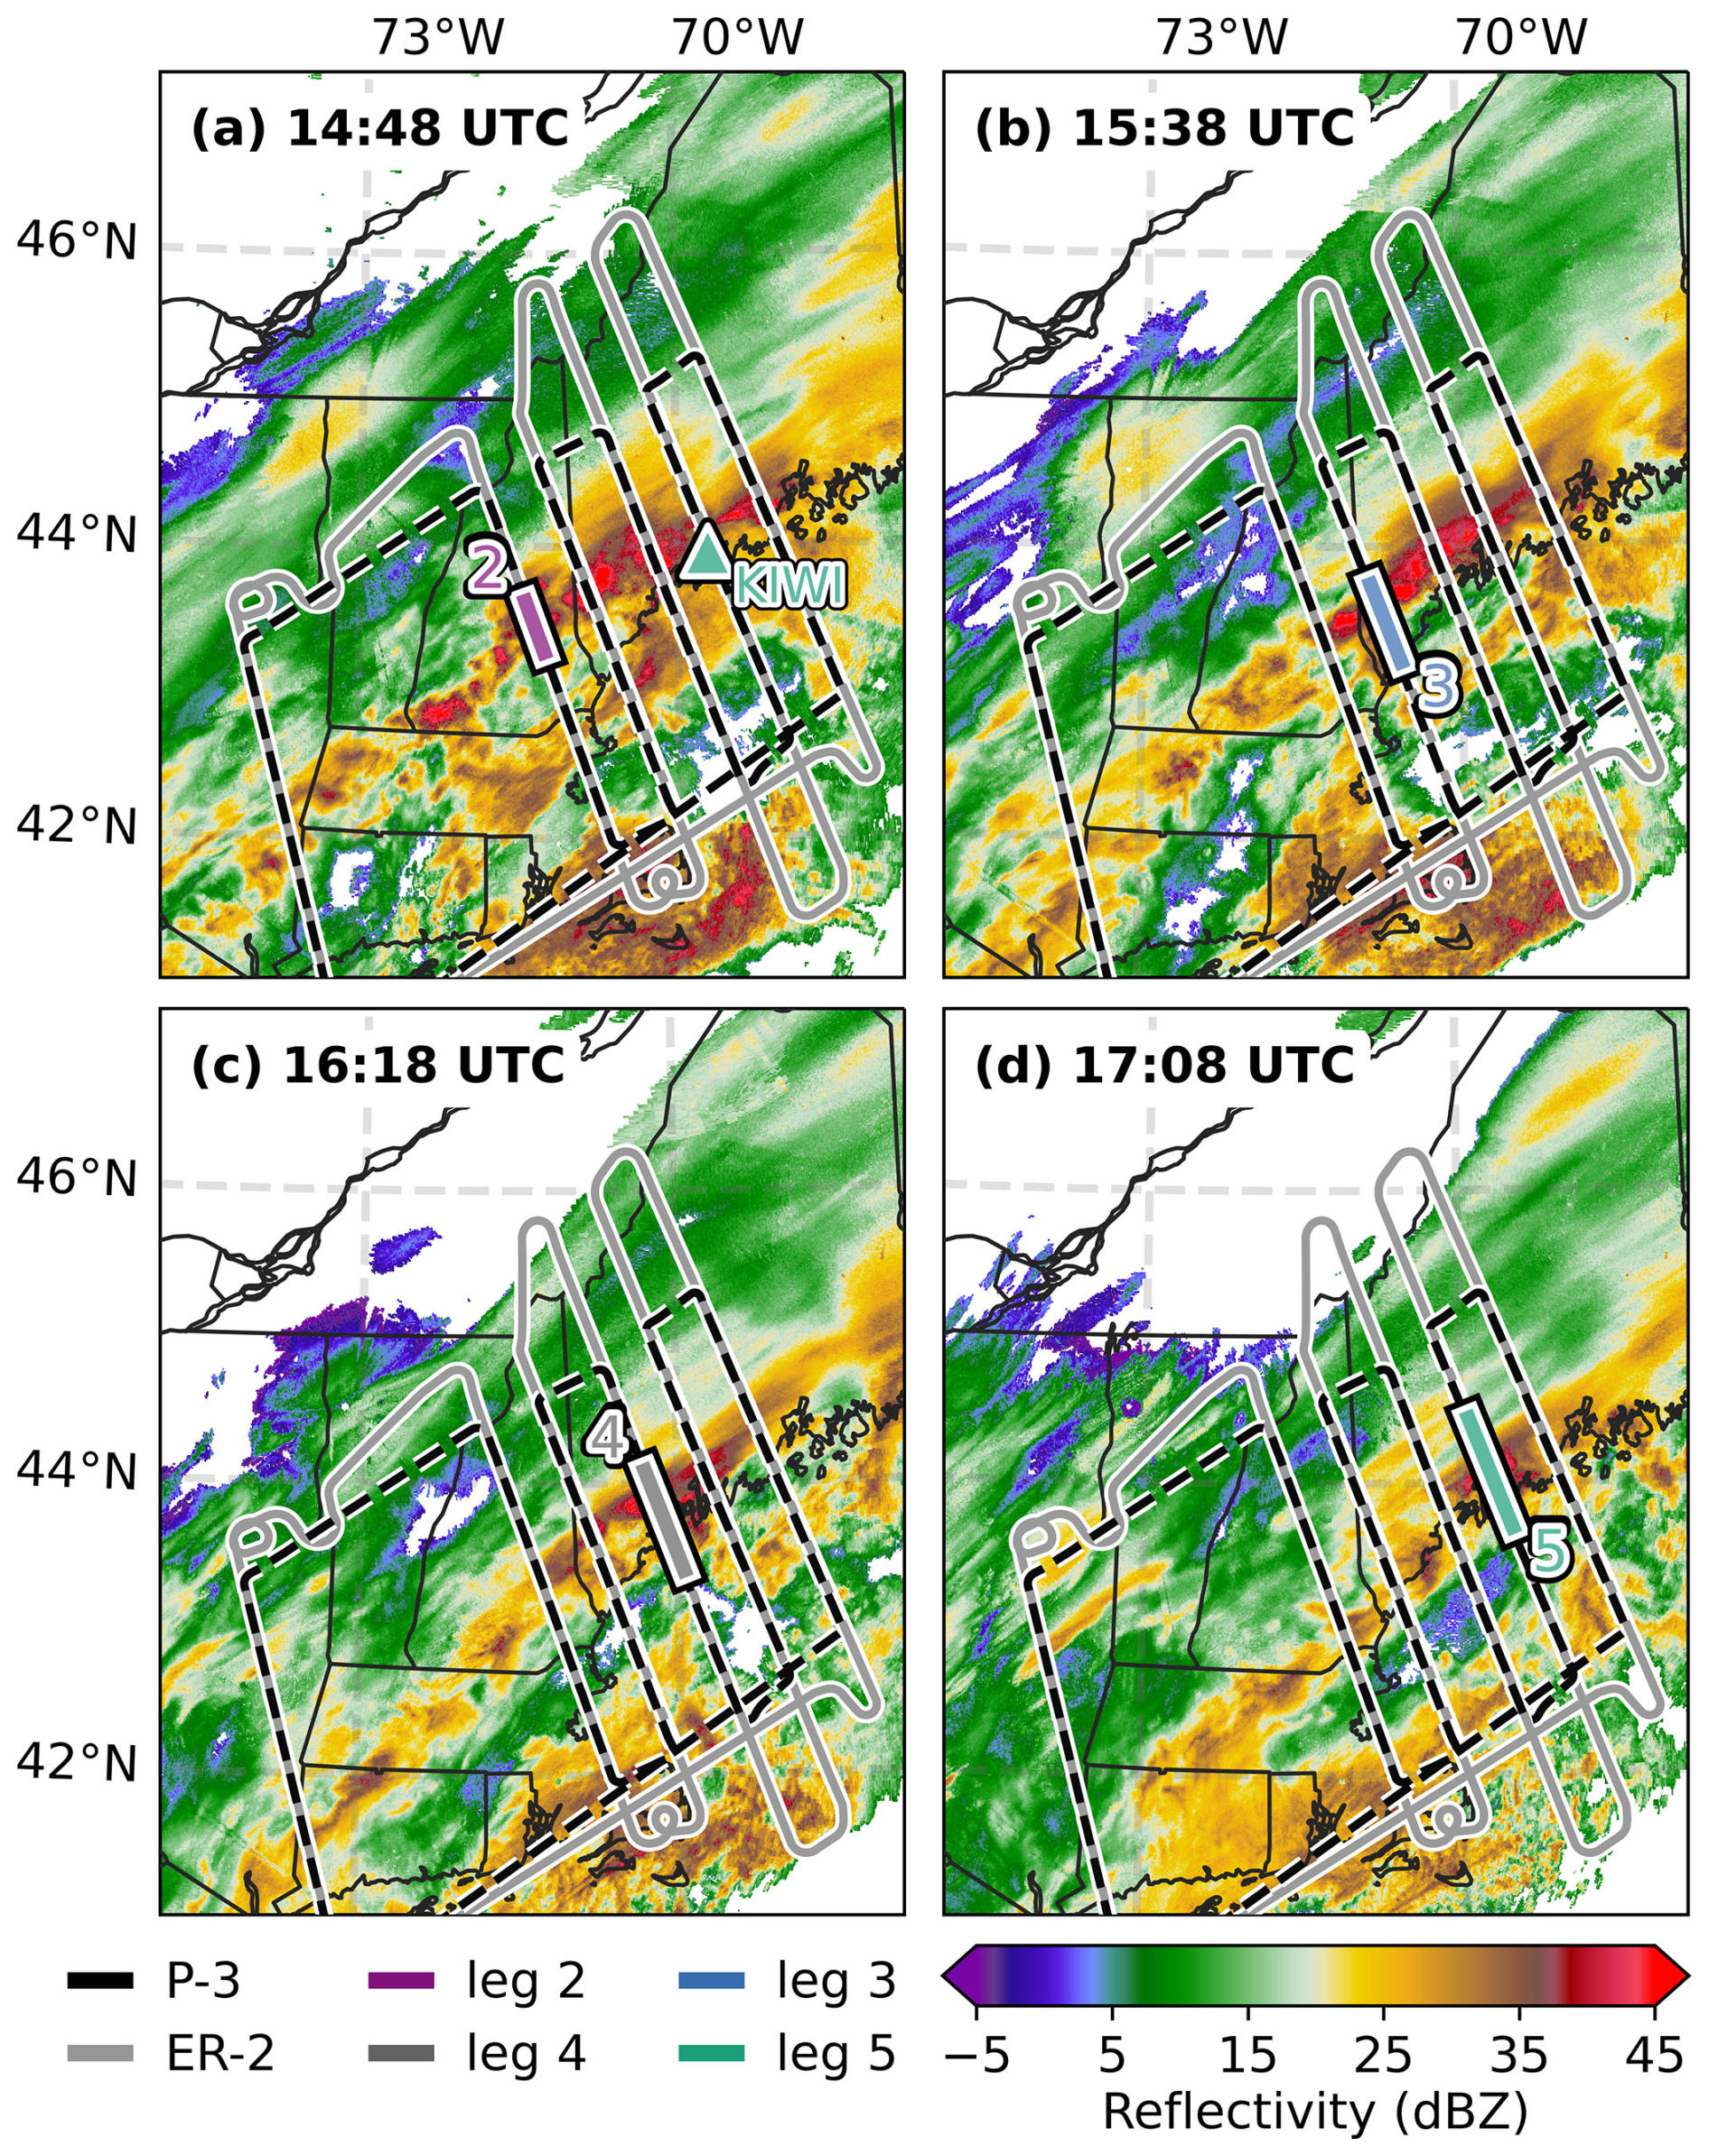
Figure 1Flight tracks for the ER-2 and P-3 aircraft on 4 February 2022, and composite reflectivity from the NWS MRMS product at the time of aircraft sampling within the region of analysis at each flight leg, as indicated by the colored lines. The ASOS surface location for Wiscasset, ME (KIWI), is shown in panel (a).
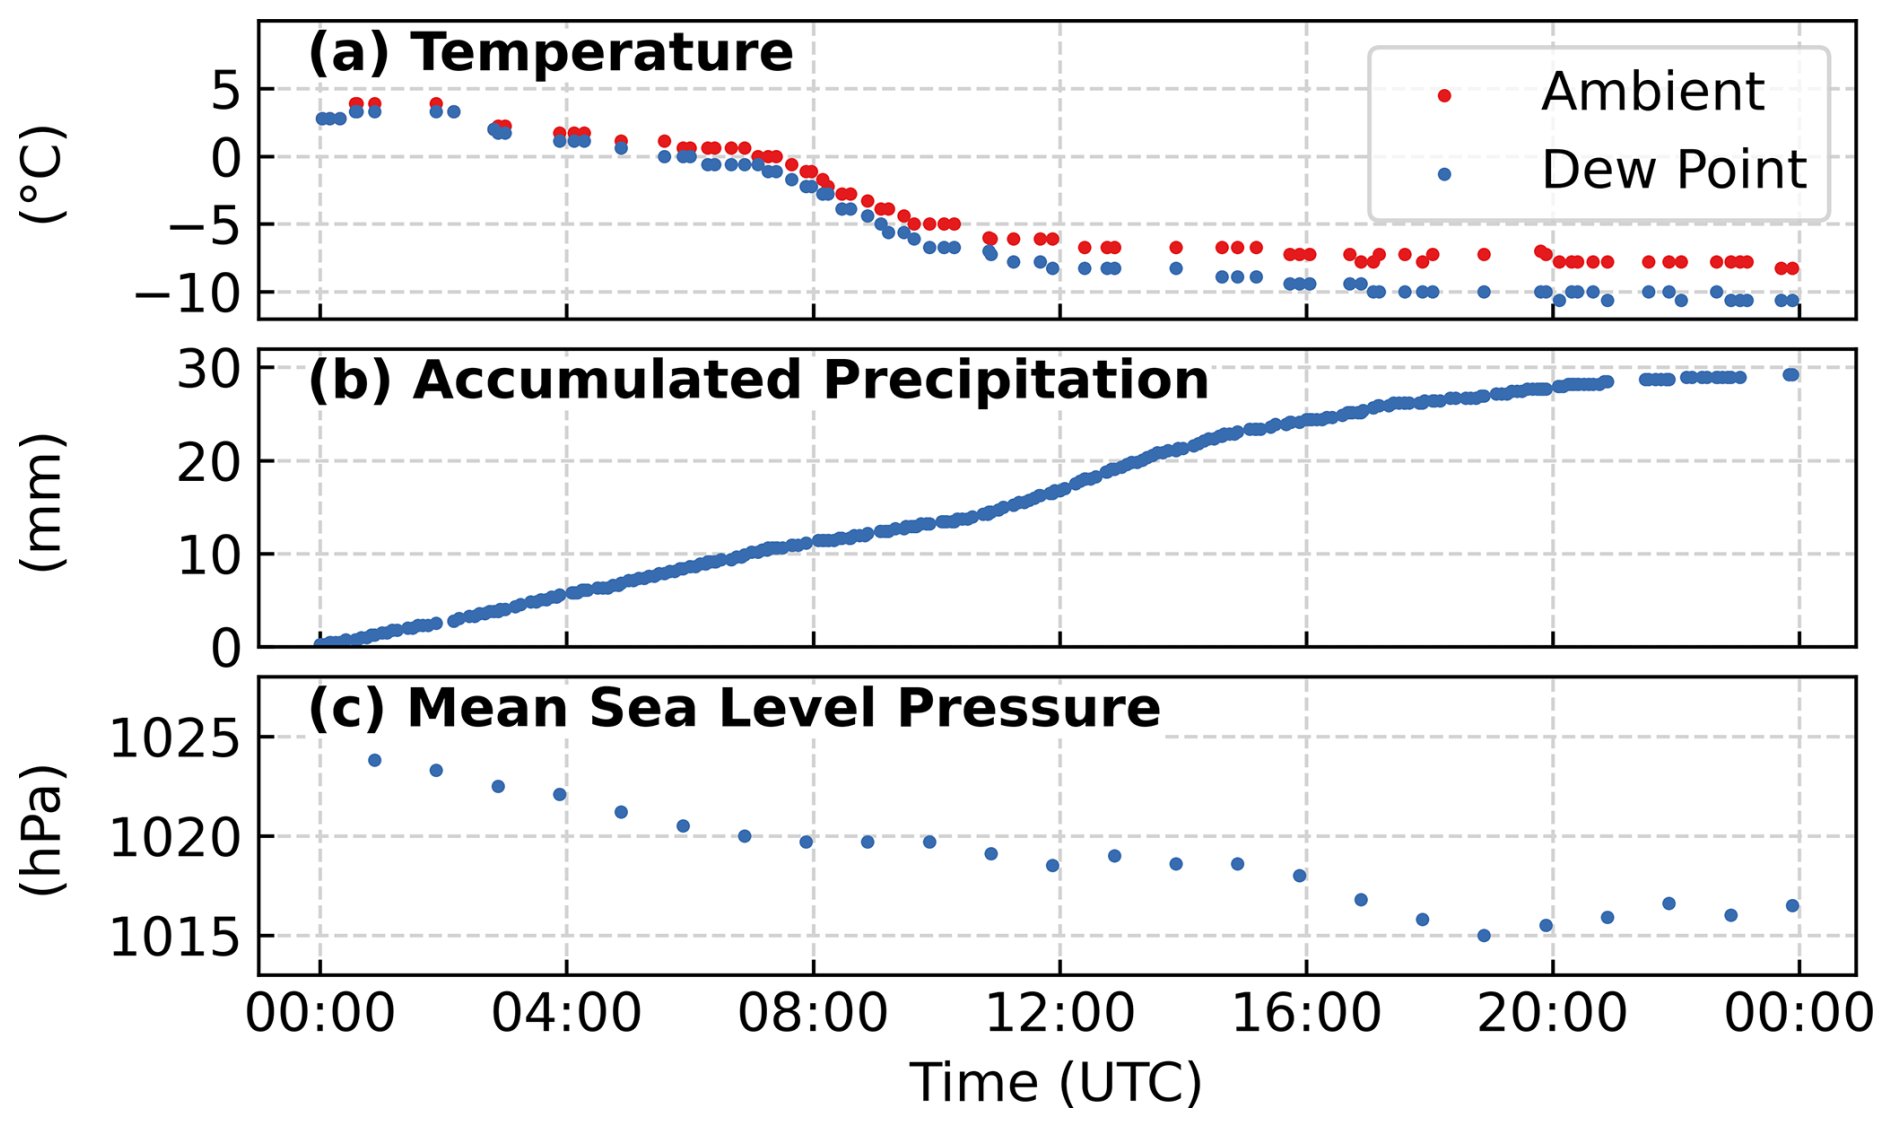
Figure 2Time series of (a) ambient temperature and dew point, (b) accumulated precipitation, and (c) mean sea level pressure measurements on 4 February 2022 at the KIWI (Wiscasset, ME) ASOS site (indicated in Fig. 1).
IMPACTS executed a flight strategy consisting of six flight legs in a “lawnmower-style” arrangement oriented orthogonal to the band that resulted in semi-Lagrangian aircraft sampling from approximately 14:00 to 18:00 UTC (Fig. 1). In contrast to sampling an evolving and moving storm along a flight leg fixed in space at varied altitudes (i.e., Eulerian), an advantage of Lagrangian sampling is that it attempts to maintain temporal and spatial continuity of the storm and the precipitating particles therein. Towards the objective of Lagrangian sampling, the P-3 aircraft, equipped with in situ cloud probes, flew at a high altitude initially and descended with each subsequent constant altitude leg while horizontally translating with the storm. The ER-2 aircraft was equipped with remote sensing instrumentation and flew in coordination with the P-3 aircraft above the storm at a constant altitude of approximately 20 To minimize temporal differences between the two aircraft owing to their differential air speeds, each aircraft sampled the center points of the flight legs at nearly the same time, and the center points were positioned near the band's along-track composite reflectivity maxima.
On the initial flight leg, the P-3 aircraft sampled at a constant altitude of 6.2 , intersecting the far western edge of the band. Flight leg 2, at an altitude of 5.5 , was positioned northeast to better intersect the region of enhanced radar echo. The remaining legs were positioned northeast of the previous leg at a distance that approximated the storm's advective speed, each at a lower altitude, and intersected the melting level on the final flight leg at 3.0 To constrain our analysis to the ice-phase precipitation processes within this storm, in situ and remote sensing measurements from flight legs 2 through 5 (5.5 to 3.6 ) are used. Obtaining precise Lagrangian observations from temporally and spatially evolving winter storms is exceptionally challenging and, from this strategy, requires that the storm maintain steady state during sampling. However, measurements collected between sampling along flight leg 2 (∼ 14:45 UTC, Fig. 1a) and flight leg 5 (∼ 17:15 UTC, Fig. 1d) occurred as the maximum composite reflectivity within the banded region weakened from 54.5 to 47.5 dBZ, which occurs at the radar bright band due to melting of the particles aloft. The reduced intensity at the bright band suggests a change in the particle properties or the downward mass flux from ice aloft, indicating a decay of storm intensity, consistent with the reduction in precipitation rate during the same time period. Thus, we suggest that flight legs 2 through 6 provided semi-Lagrangian context for coincident in situ and remote sensing measurements of the cloud and precipitation particles during evolution between 5.5 and 3.0
2.2 IMPACTS observational assets
The IMPACTS campaign benefited from a comprehensive suite of aircraft-based in situ and remote sensing instrumentation on board the cloud-penetrating P-3 and overflying ER-2 aircraft. From these instruments, the in situ measurements of precipitating particle properties and their ambient environmental conditions coincident with remote sensing radar are crucial towards addressing our research questions.
The P-3 aircraft was equipped with several particle probes to derive quantitative measures of the physical properties and concentrations of ice- and liquid-phase populations of particles. Measurements of the ice-phase particle size distributions (PSDs) were derived from a vertically oriented High-Volume Precipitation Spectrometer (HVPS) probe (Bansemer et al., 2022). The HVPS is an optical array probe (OAP), which permits sizing of a sampled ice crystal based on a two-dimensional (2D) projected image (Lawson et al., 1993) from a 128-element array with a pixel resolution of 150 µm (Bansemer et al., 2022). Thus, the HVPS is ideally suited to measuring larger ice crystals, ∼ 0.5 to 30.0 mm in diameter. Commonly, the HVPS is paired with a Two-Dimensional-Stereo (2D-S) OAP that also has a 128-element array but at a higher resolution of 10 µm and, therefore, is ideally suited for measuring small ice crystals. However, because the 2D-S did not operate during the 4 February flight, our analysis uses HVPS measurements to derive in situ PSDs from ice crystals of diameters, D, > 0.5 mm. Measurements of the liquid-phase particle population were derived from the Fast Cloud Droplet Probe (FCDP), a component of the HAWKEYE combination probe, to estimate droplet sizes within a range of 2 to 50 µm based on principles of Mie light scattering (Lawson et al., 2017). The National Center for Atmospheric Research (NCAR) provided processing of the 1 Hz particle probe data (Bansemer et al., 2022).
Particle imagery provide crucial evidence of the unique habits and geometric properties of the ice crystals and permits inferences of the microphysical processes by which they evolved. We use imagery collected from the Particle Habit Imaging and Polar Scattering (PHIPS) probe, a novel instrument composed of two cameras separated by 120° with a resolution of 2 µm within a field of view of approximately 3 mm × 2 mm (Schnaiter, 2022). For ambient environmental context, in situ meteorological properties were measured by instrumentation on board the P-3 aircraft to derive the pressure, temperature, dew point, and water vapor (Yang-Martin and Bennett, 2022). Measurements of the 3D ambient wind field were obtained from the Turbulent Air Motion Measurement System (TAMMS; Thornhill, 2022). The TAMMS instrument is a system of sensors distributed across the aircraft to estimate the horizontal and vertical components of the winds and, for the configuration on the P-3 aircraft, yields an estimated accuracy of 0.2 m s−1 for the horizontal and vertical wind speeds (Thornhill et al., 2003; Thornhill, 2022). Supplementing the IMPACTS airborne measurements, ambient meteorological conditions were obtained from operational rawinsondes at NWS launch sites (Waldstreicher and Brodzik, 2022). Additionally, standard NWS operational measurements including ASOS station data and composite radar from the MRMS product were used to assess the surface conditions and provide large-scale context during IMPACTS events.
The 4 February event was sampled by radar from the high-altitude ER-2 aircraft at the Ku (13.9 GHz), Ka (35.6 GHz), and W bands (94 GHz). As an example of one flight leg, Fig. 3 shows vertical cross sections following the ER-2 on flight leg 5. Frontogenesis and ambient air temperature derived from the 17:00 UTC NOAA Rapid Refresh (RAP) 13 km model (Benjamin et al., 2016) are shown in Fig. 3a. Notably, there is a northward sloping frontal boundary aloft indicated by the local maximum in the frontogenesis. As the ER-2 aircraft overflew the frontal band, radar reflectivity and Doppler velocity measurements were collected from the dual-band (Ku and Ka) High-Altitude Wind and Rain Airborne Profiler (HIWRAP; McLinden et al., 2022), which has a vertical resolution of 150 m (Li et al., 2016). Figure 3b and c shows these Ku-band reflectivity, ZKu, and Doppler velocity, VD_Ku, measurements from the HIWRAP radar on board the ER-2 aircraft between ∼ 17:08 and ∼ 17:16 UTC. The P-3 aircraft sampled this location at 3.6 between ∼ 17:05 and ∼ 17:17 UTC. At the center point over the band, the time difference between the two aircraft was 91 s. During flight leg 5, the two aircraft overflew the KIWI ASOS station, which reported a precipitation rate of 1.02 mm h−1 at its location ∼ 2.5 km west of the flight leg (Fig. 1a). At KIWI, a radar bright band signature of the melting level occurred near 3 on the southern portion of the flight leg and abruptly terminated to the surface near 50 km along-track distance. This termination of the melting level is most apparent in the VD_Ku gradient (Fig. 3c) associated with the change in fall velocity of melting ice-phase particles.
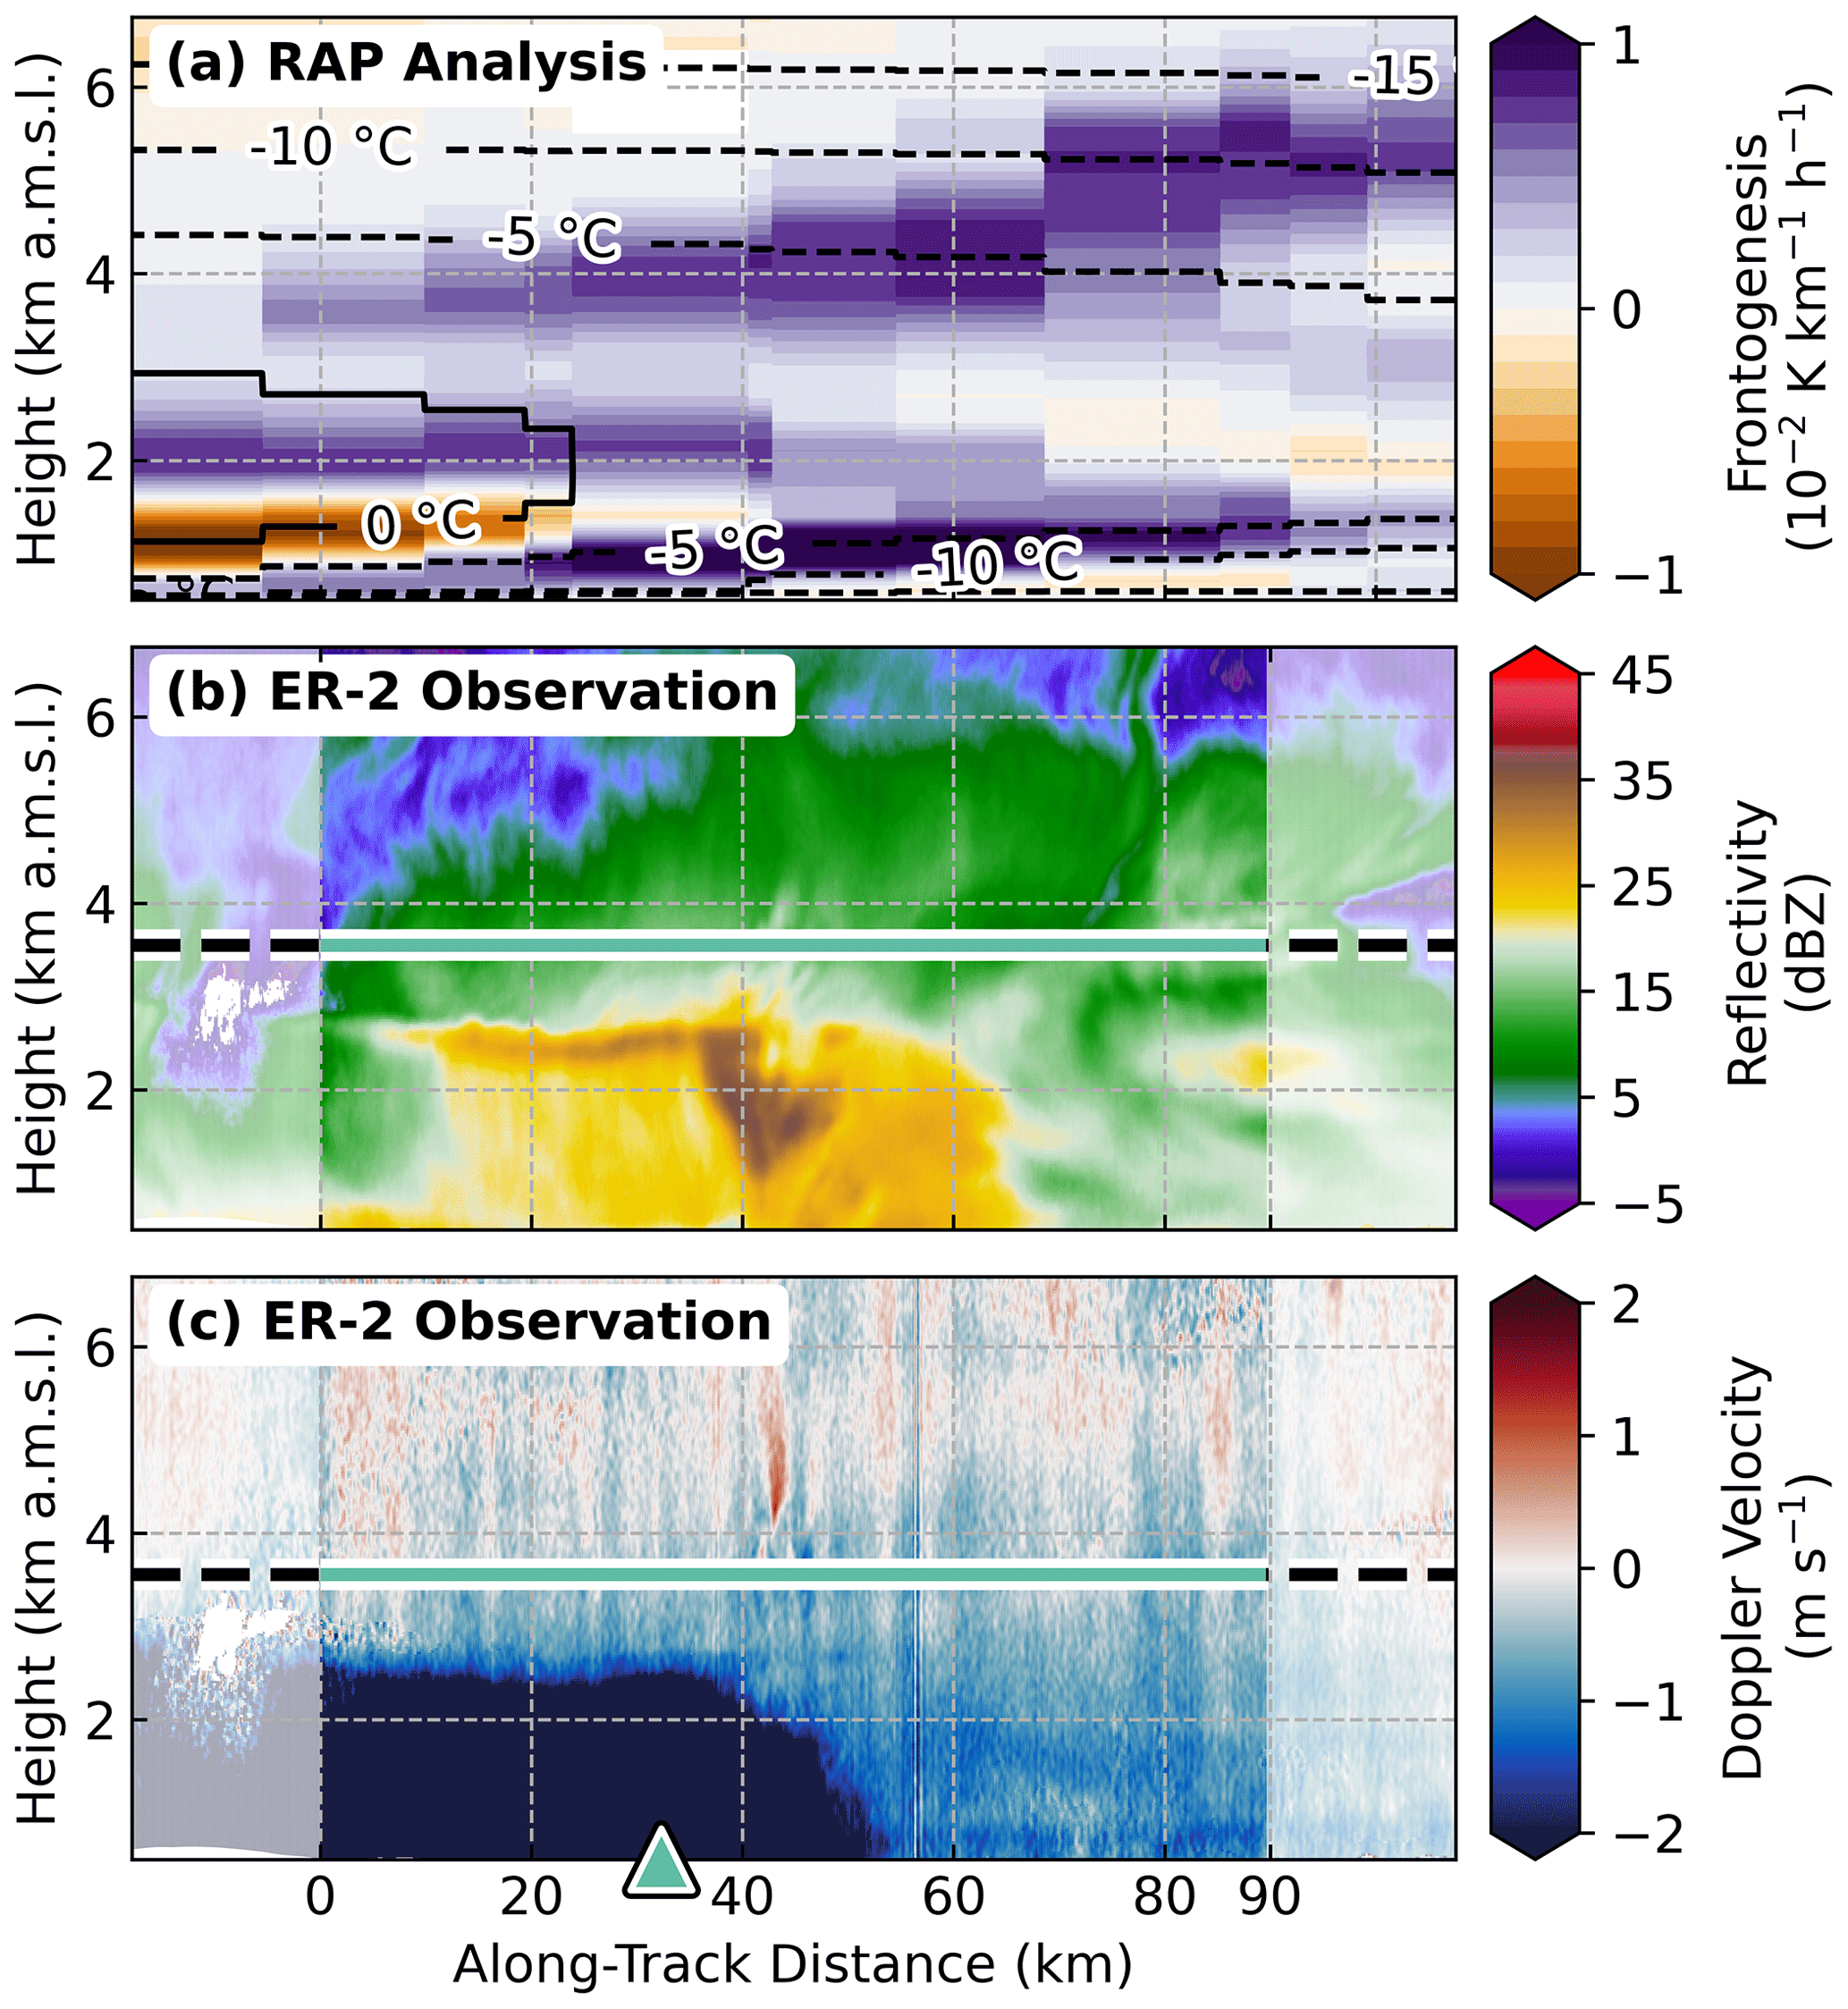
Figure 3Vertical cross sections of the (a) 17:00 UTC RAP analysis frontogenesis and ambient air temperature (contoured) corresponding to the HIWRAP Ku-band radar (b) reflectivity and (c) Doppler velocity measurements from the ER-2 flight leg 5, as shown in Fig. 1d. Coincident sampling from the P-3 aircraft occurred at 3.6 , and the in situ observational extent assessed by frontal analysis is indicated by the horizontal green line spanning 43.69 to 44.44° N. The marker in panel (c) locates the KIWI (Wiscasset, ME) ASOS surface station, positioned ∼ 2.5 km west of the flight leg (see Fig. 1a).
The banded region was associated with a prominent cloud aloft, extending to about 6 Substantial decreases in ZKu were apparent immediately above a distinct vertical gradient in ZKu at 6 (Fig. 3b). This vertical ZKu gradient exhibited small-scale [O(1 km)] structural variabilities and filaments in ZKu down to the melting level. Similar small-scale [O(1 km)] structural variabilities were present in VD_Ku near 6 , and within a background of negative VD_Ku, there were several isolated regions of substantial updrafts. Below 5 , VD_Ku became increasingly negative, which indicated either increasing particle fall velocities or a reduction in, or reversal of, ambient updrafts. The vertical cloud structure sampled by the ER-2 radar on flight leg 5 is suggestive of a weak generating cell layer near 6 and precipitation fallstreaks (e.g., Rosenow et al., 2014; Plummer et al., 2014) towards the banded region below. Operational rawinsondes launched at 12:00, 15:00, and 18:00 UTC from Portland, Maine (KGYX), which was approximately overflown on flight leg 4, demonstrated a southwest flow minimal directional wind shear above the frontal boundary (not shown). The lack of directional wind shear aloft suggests that the primary transport of ice particles aloft occurred within the vertical plane sampled by the IMPACTS aircraft and minimally through horizontal advection. Thus, we assume that successive collections of observations from descending P-3 flight legs cohesively translated with the storm motion and were minimally affected by horizontal advection along sheared surfaces aloft.
2.3 Observational context of in situ measurements
At either edge of the banded region, the horizontal extent of cloud aloft is marked by distinct gradients in ZKu (Fig. 3b). At the northern edge, a reduction in ZKu occurs at a region of significant shear in the precipitation fallstreaks, which is expected with a wind shift along a frontal boundary. Near this northern edge of the flight leg, a frontogenesis maximum is evident aloft in the RAP analysis (Fig. 3a). However, comparison of the RAP analysis (Fig. 3a) to prominent observed cloud characteristics (i.e., melting level radar bright band and sloped frontal boundary, Fig. 3b and c) indicates some spatial or temporal uncertainty in the analysis. Therefore, we use the in situ environmental measurements to objectively identify the location of the frontal boundary, establishing flight-leg specific observational domains (i.e., the observational regions indicated in Fig. 1 by different colors for each of the four flight legs) that preserve the intended Lagrangian in situ sampling of the evolving ice-phase particles.
To constrain our analysis to the air mass trailing the sloping front aloft, we define the northern extent of the horizontal observational domain by a frontogenesis maximum. We compute frontogenesis from the P-3 in situ measurements of horizontal winds, u and v, and potential temperature, θ, using the 2D form of the (Miller, 1948) equation
Because of the considerable noise in frontogenesis computed from the 1 Hz measurements, we apply a substantial smoothing using a 60 s rolling mean (Fig. 4). We assess the northern extent of the observational domain for each flight leg by identifying a relative maximum in the smoothed frontogenesis. The frontogenesis analysis indicates a frontal boundary with an apparent northward gradient with increasing height, which primarily results from the southwest-to-northeast orientation of the band. In addition, a northward-sloping frontal boundary formed from the warmer air mass to the south overrunning the cold surface air mass to the north.
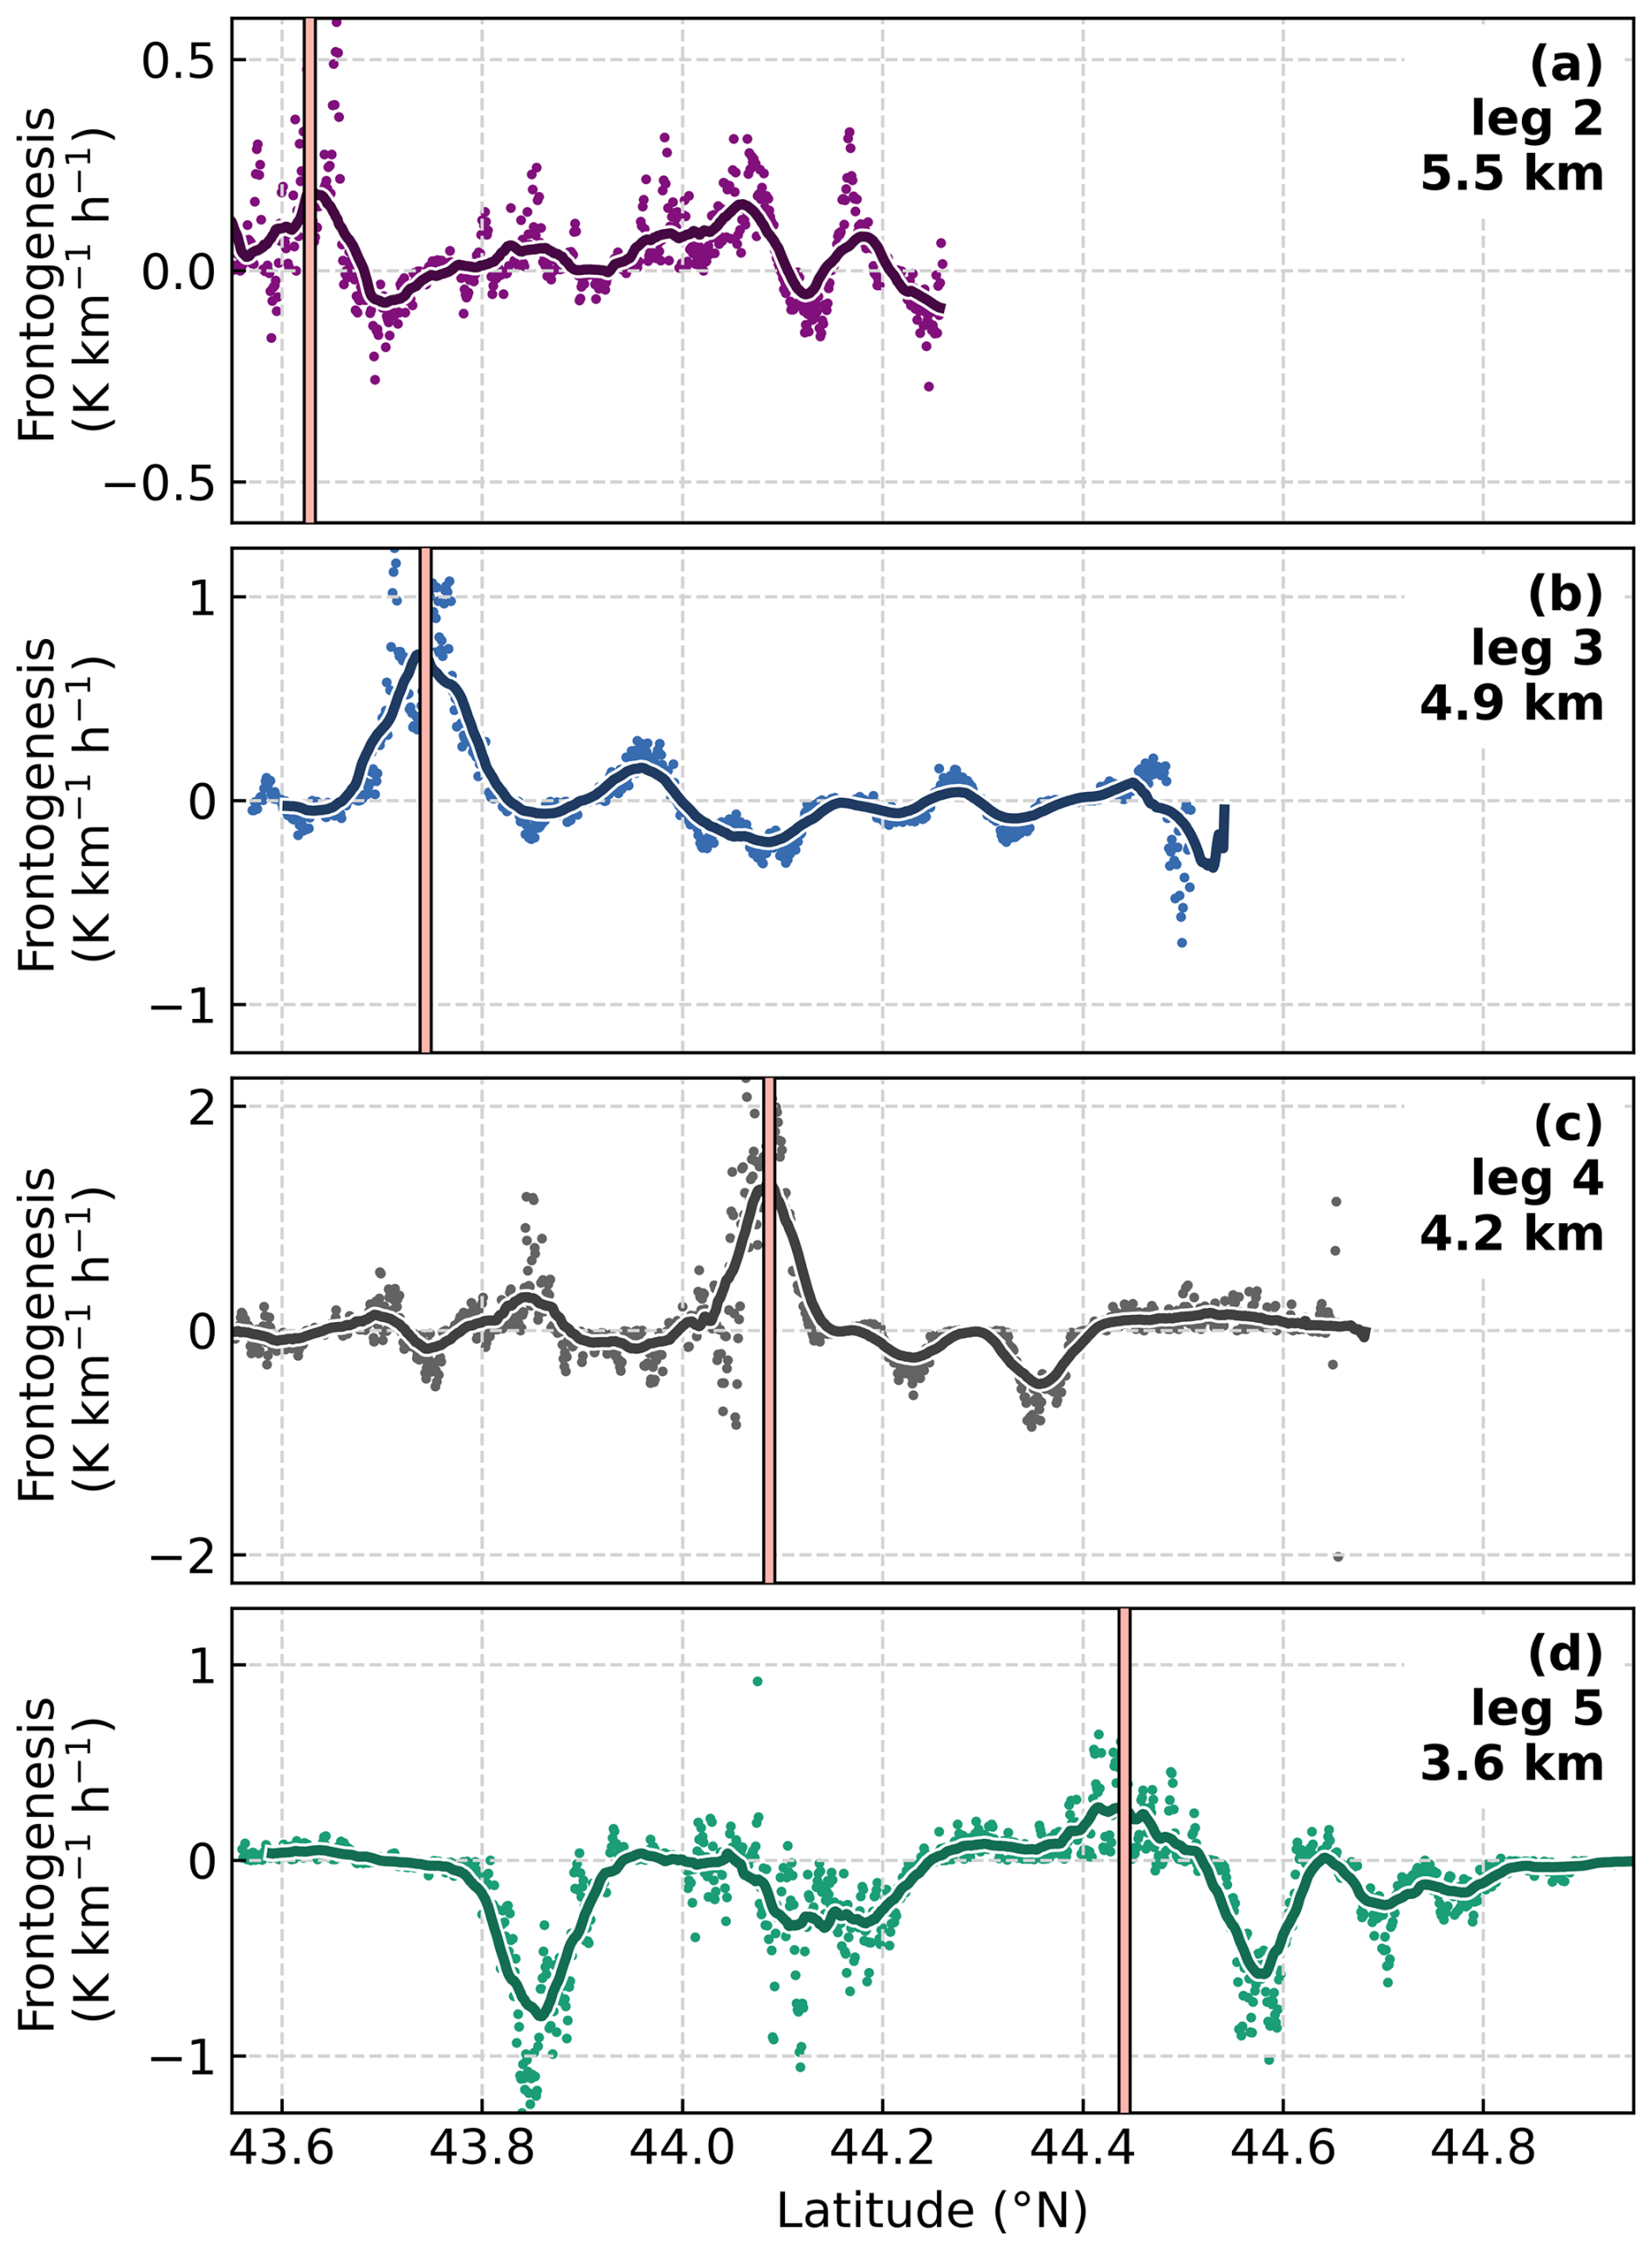
Figure 4Frontogenesis computed from 1 Hz in situ measurements (dots) with smoothing using a 60 s rolling mean (horizontal line) to estimate a maximum (vertical lines) along individual P-3 flight legs 2 to 5. Mean altitudes of the P-3 aircraft are stated for each flight leg.
At the southern edge of the band, there was a distinct absence of cloud during most of the aircraft sampling along flight legs 2 through 5 (Fig. 1a–d). Thus, we assess the southern edges of the observational domain at the altitude of the P-3 aircraft as the cloud edge. At each flight leg, we use ZKu measurements at the height of the P-3 aircraft to identify a reduction in ZKu below 0 dBZ. An exception is made for flight leg 3, which intersected a transient cloud (Fig. 1b), where we instead identify a relative minimum in ZKu (∼ 5 dBZ). All further in situ observations used for analysis in this study were obtained from within the complete segments spanning the flight-leg specific cloud-edge-assessed southern points and the frontal-boundary-assessed northern points (Fig. 1). Constrained by this approach, the evolutionary pathway of particles reaching the surface is identified by observations of the particle properties and their ambient environment collected within the cloud aloft at four altitudes descending in time. A summary of the start and end times for the ER-2 and P-3 flights along each flight leg traversing the objectively assessed banded region of cloud is provided in Table 1.
Table 1Start and end times (UTC) of ER-2 and P-3 aircraft sampling on 4 February 2022 within the objectively identified observational domains for each flight leg, as indicated in Fig. 1.
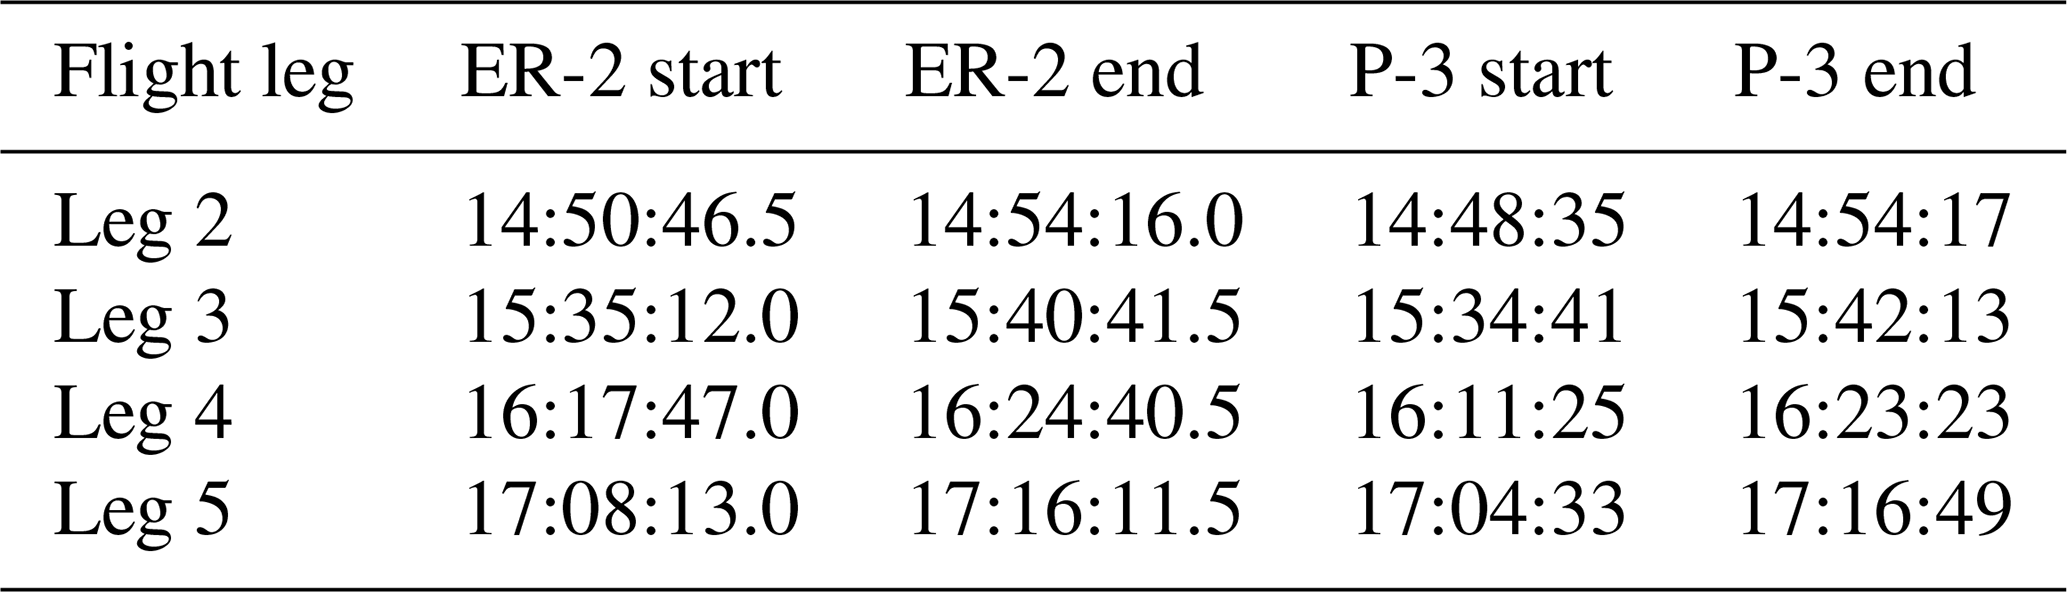
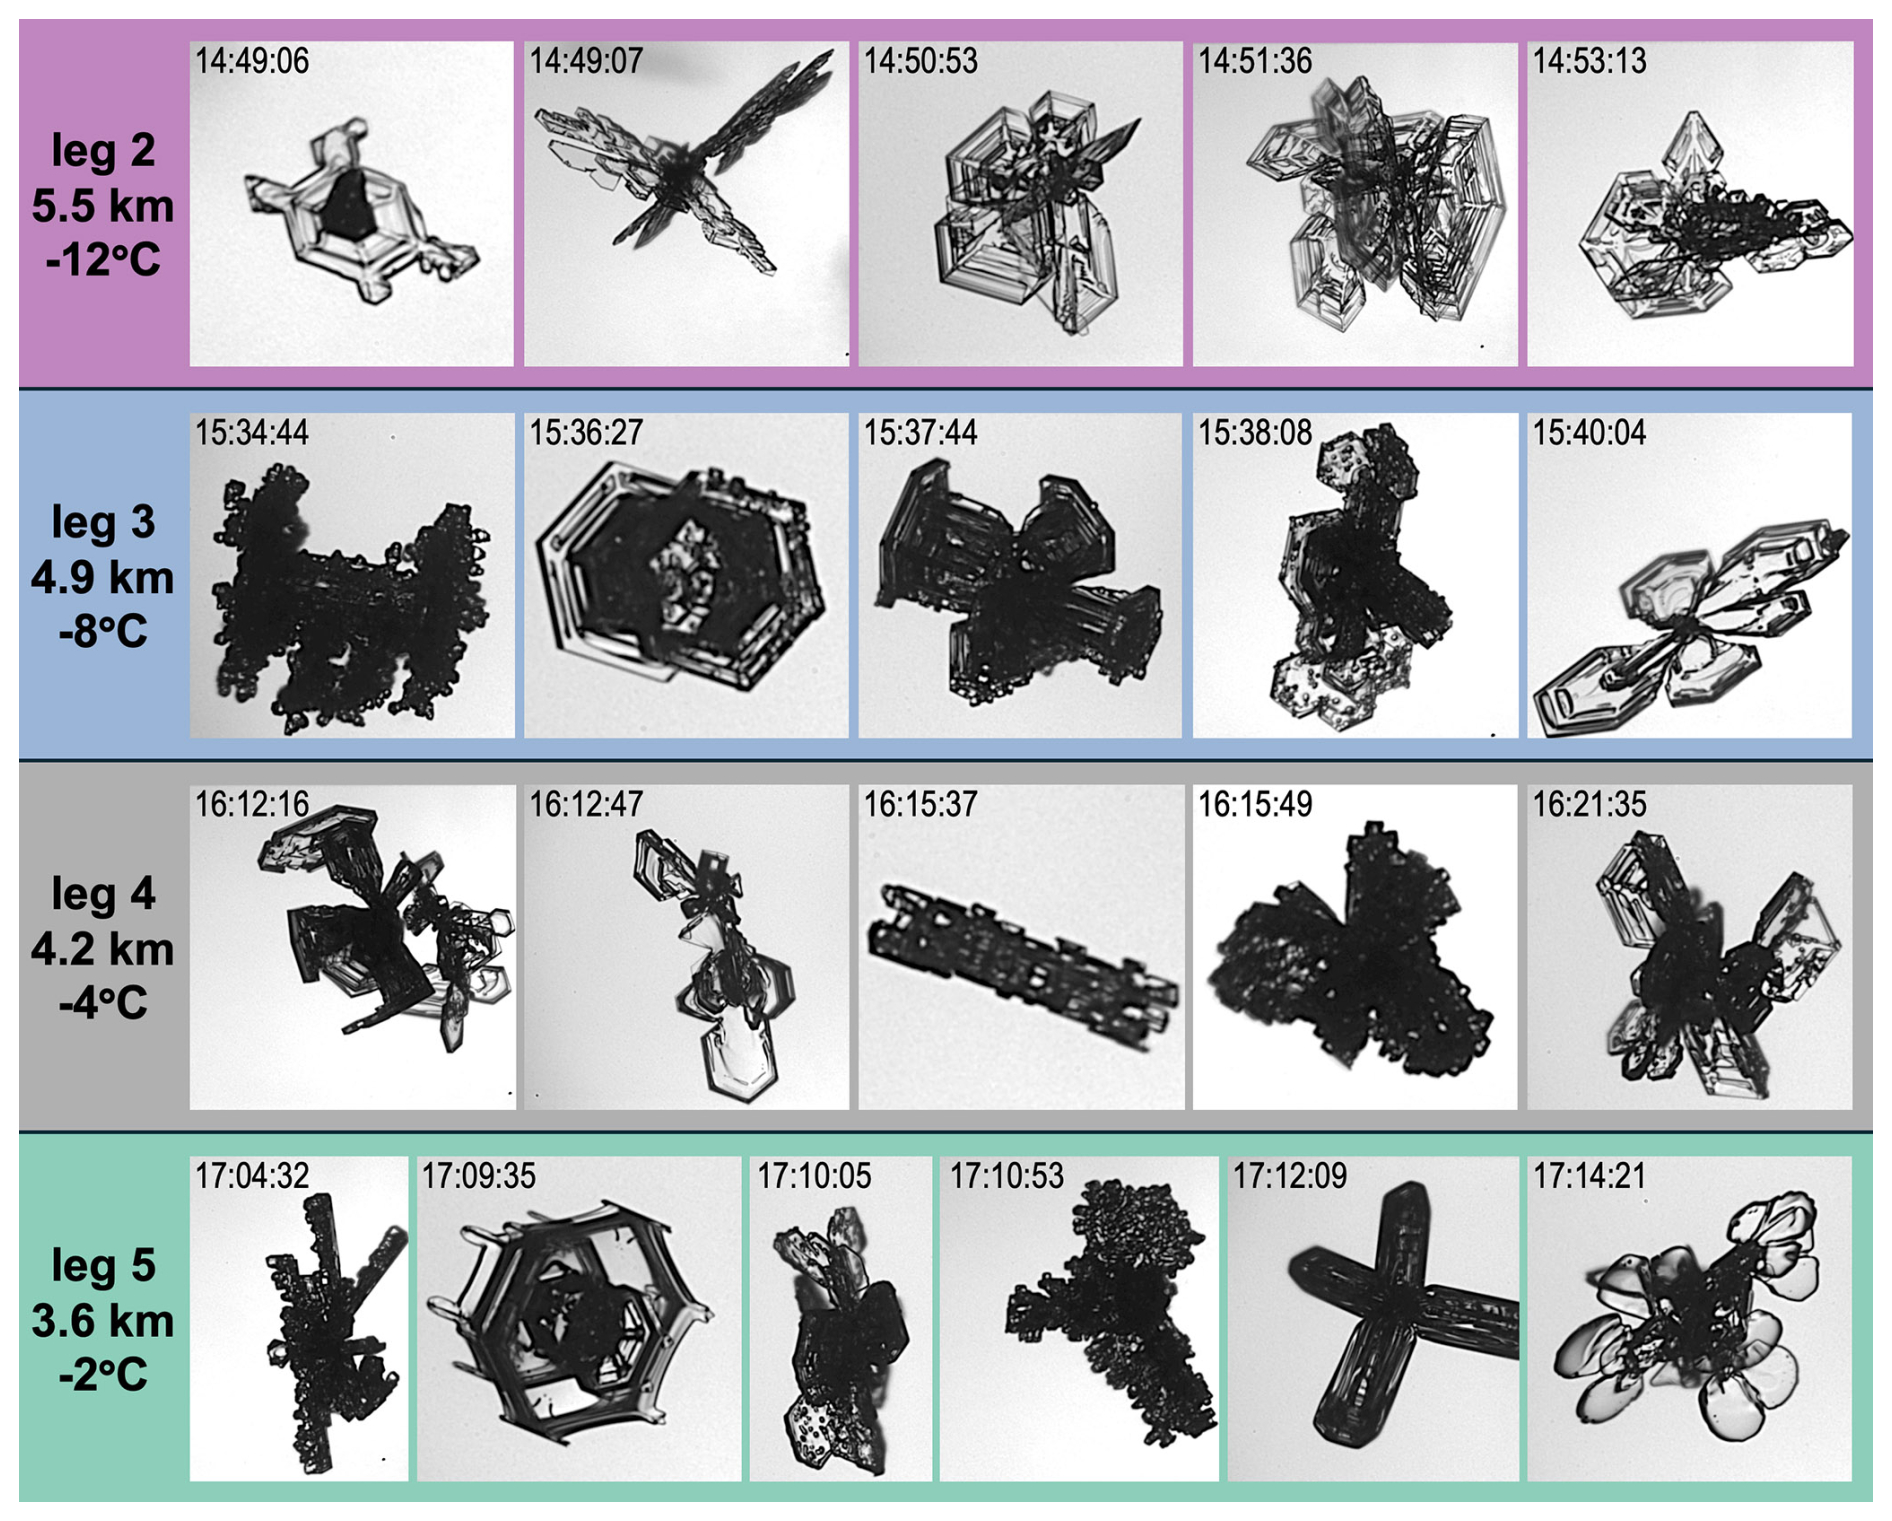
Figure 5Particle imagery collected from the PHIPS probe within the banded regions of P-3 flight legs 2 to 5. Images are intended for representation of the crystal properties only and are not to scale. Mean altitudes of the P-3 and ambient temperatures are stated for each flight leg.
Particle imagery collected from the PHIPS probe on P-3 flight legs 2 through 5 are shown in Fig. 5. At 5.5 and an ambient air temperature of −12 °C, a diversity of crystal habits was observed, including single crystal plates (e.g., 14:49:06 UTC) and dendrites (14:49:07 UTC), as well as polycrystalline structures of plates, dendrites, and side planes (e.g., 14:50:03, 14:51:36, and 14:53:13 UTC). Some of the particles at 5.5 showed evidence of sublimation (e.g., 14:49:06 UTC) in the form of rounded corners and a smooth, glossy appearance (Nelson, 1998). With descent on subsequent flight legs, there was increasing evidence of sublimation. However, beginning at flight leg 3 at 4.9 , where the ambient temperature was −8 °C and relative humidity (RH) with respect to liquid water, 83 %, there was also evidence of riming, with varied degrees of accumulated supercooled liquid water droplets (e.g., 15:34:44 and 15:36:27 UTC). Similarly diverse crystal habits with varied degrees of rime accumulation and sublimation were observed in imagery collected on flight leg 4 (4.2 , −4 °C, 82 % RH) and flight leg 5 (3.6 , −2 °C, 80 % RH).
From PHIPS particle imagery collected at all heights, relative to the prevalence of single crystals, very few aggregate particles were observed. However, transient occurrences of aggregate particles were evident among HVPS images collected on flight legs 2 through 5 (not shown). This modest evidence of aggregate particles differs from the high prevalence of aggregate particles observed within the offshore region of enhanced reflectivity that lacked well-defined banding (DeLaFrance et al., 2024b). However, riming was evident in both regions. The presence of riming among particle populations for flight legs 3 through 5 suggests a mixed-phase layer with an upper boundary between 4.9 and 5.5 , but riming occurred heterogeneously throughout the mixed-phase layer. Interestingly, populations of rimed particles were observed in close proximity to sublimated particles (e.g., 15:38:08 and 15:40:04 UTC). Additionally, some particles appeared to have experienced riming followed by sublimation at some later time (e.g., 17:10:05 UTC), whereas others appeared to only experience sublimation between formation aloft and 3.6 (e.g., 17:12:09 UTC). Collectively, particle imagery from above the band indicates that the dominant microphysical process between 5.5 and 3.6 was sublimation.
Liquid-equivalent precipitation rates at the surface are governed by the particle mass and its rate of fallout from cloud above. To determine the surface implications, we first quantify the initial ice-phase precipitation mass aloft, at 5.5 , and its evolution within cloud between 5.5 and 3.6 Figure 6 shows the median and interquartile range (IQR, 25th and 75th percentile) ice mass PSDs from all HVPS measurements of particles with D > 0.5 mm collected during P-3 flight legs 2 through 5. Consistent with DeLaFrance et al. (2024b), we assume a mass–dimension relationship following Brown and Francis (1995). The greatest ice mass concentration and largest particle sizes were identified at 5.5 Additionally, we found the most variability expressed by the IQR of PSDs at this height. However, based on the observed diversity among crystal habits at 5.5 (Fig. 5), this variability in the observed PSD is not surprising. Because measurements of ice at small particle sizes are unavailable for the 4 February event, the total ice water content (IWC) is not completely defined by measurements from the HVPS. Thus, throughout the present study, we define the characteristic IWC as the fraction of IWC computed at D > 0.5 mm, applicable to both observations and model simulation output. The median characteristic IWC at 5.5 was 0.540 g m−3 and decreased to 0.278 g m−3 at 4.9 , then further decreased to 0.127 g m−3 at 4.2 At 3.6 , the characteristic IWC slightly increased to 0.148 g m−3; however, there was a notable reduction in ice mass at the largest particle sizes, especially relative to 5.5 (Fig. 6a and d).
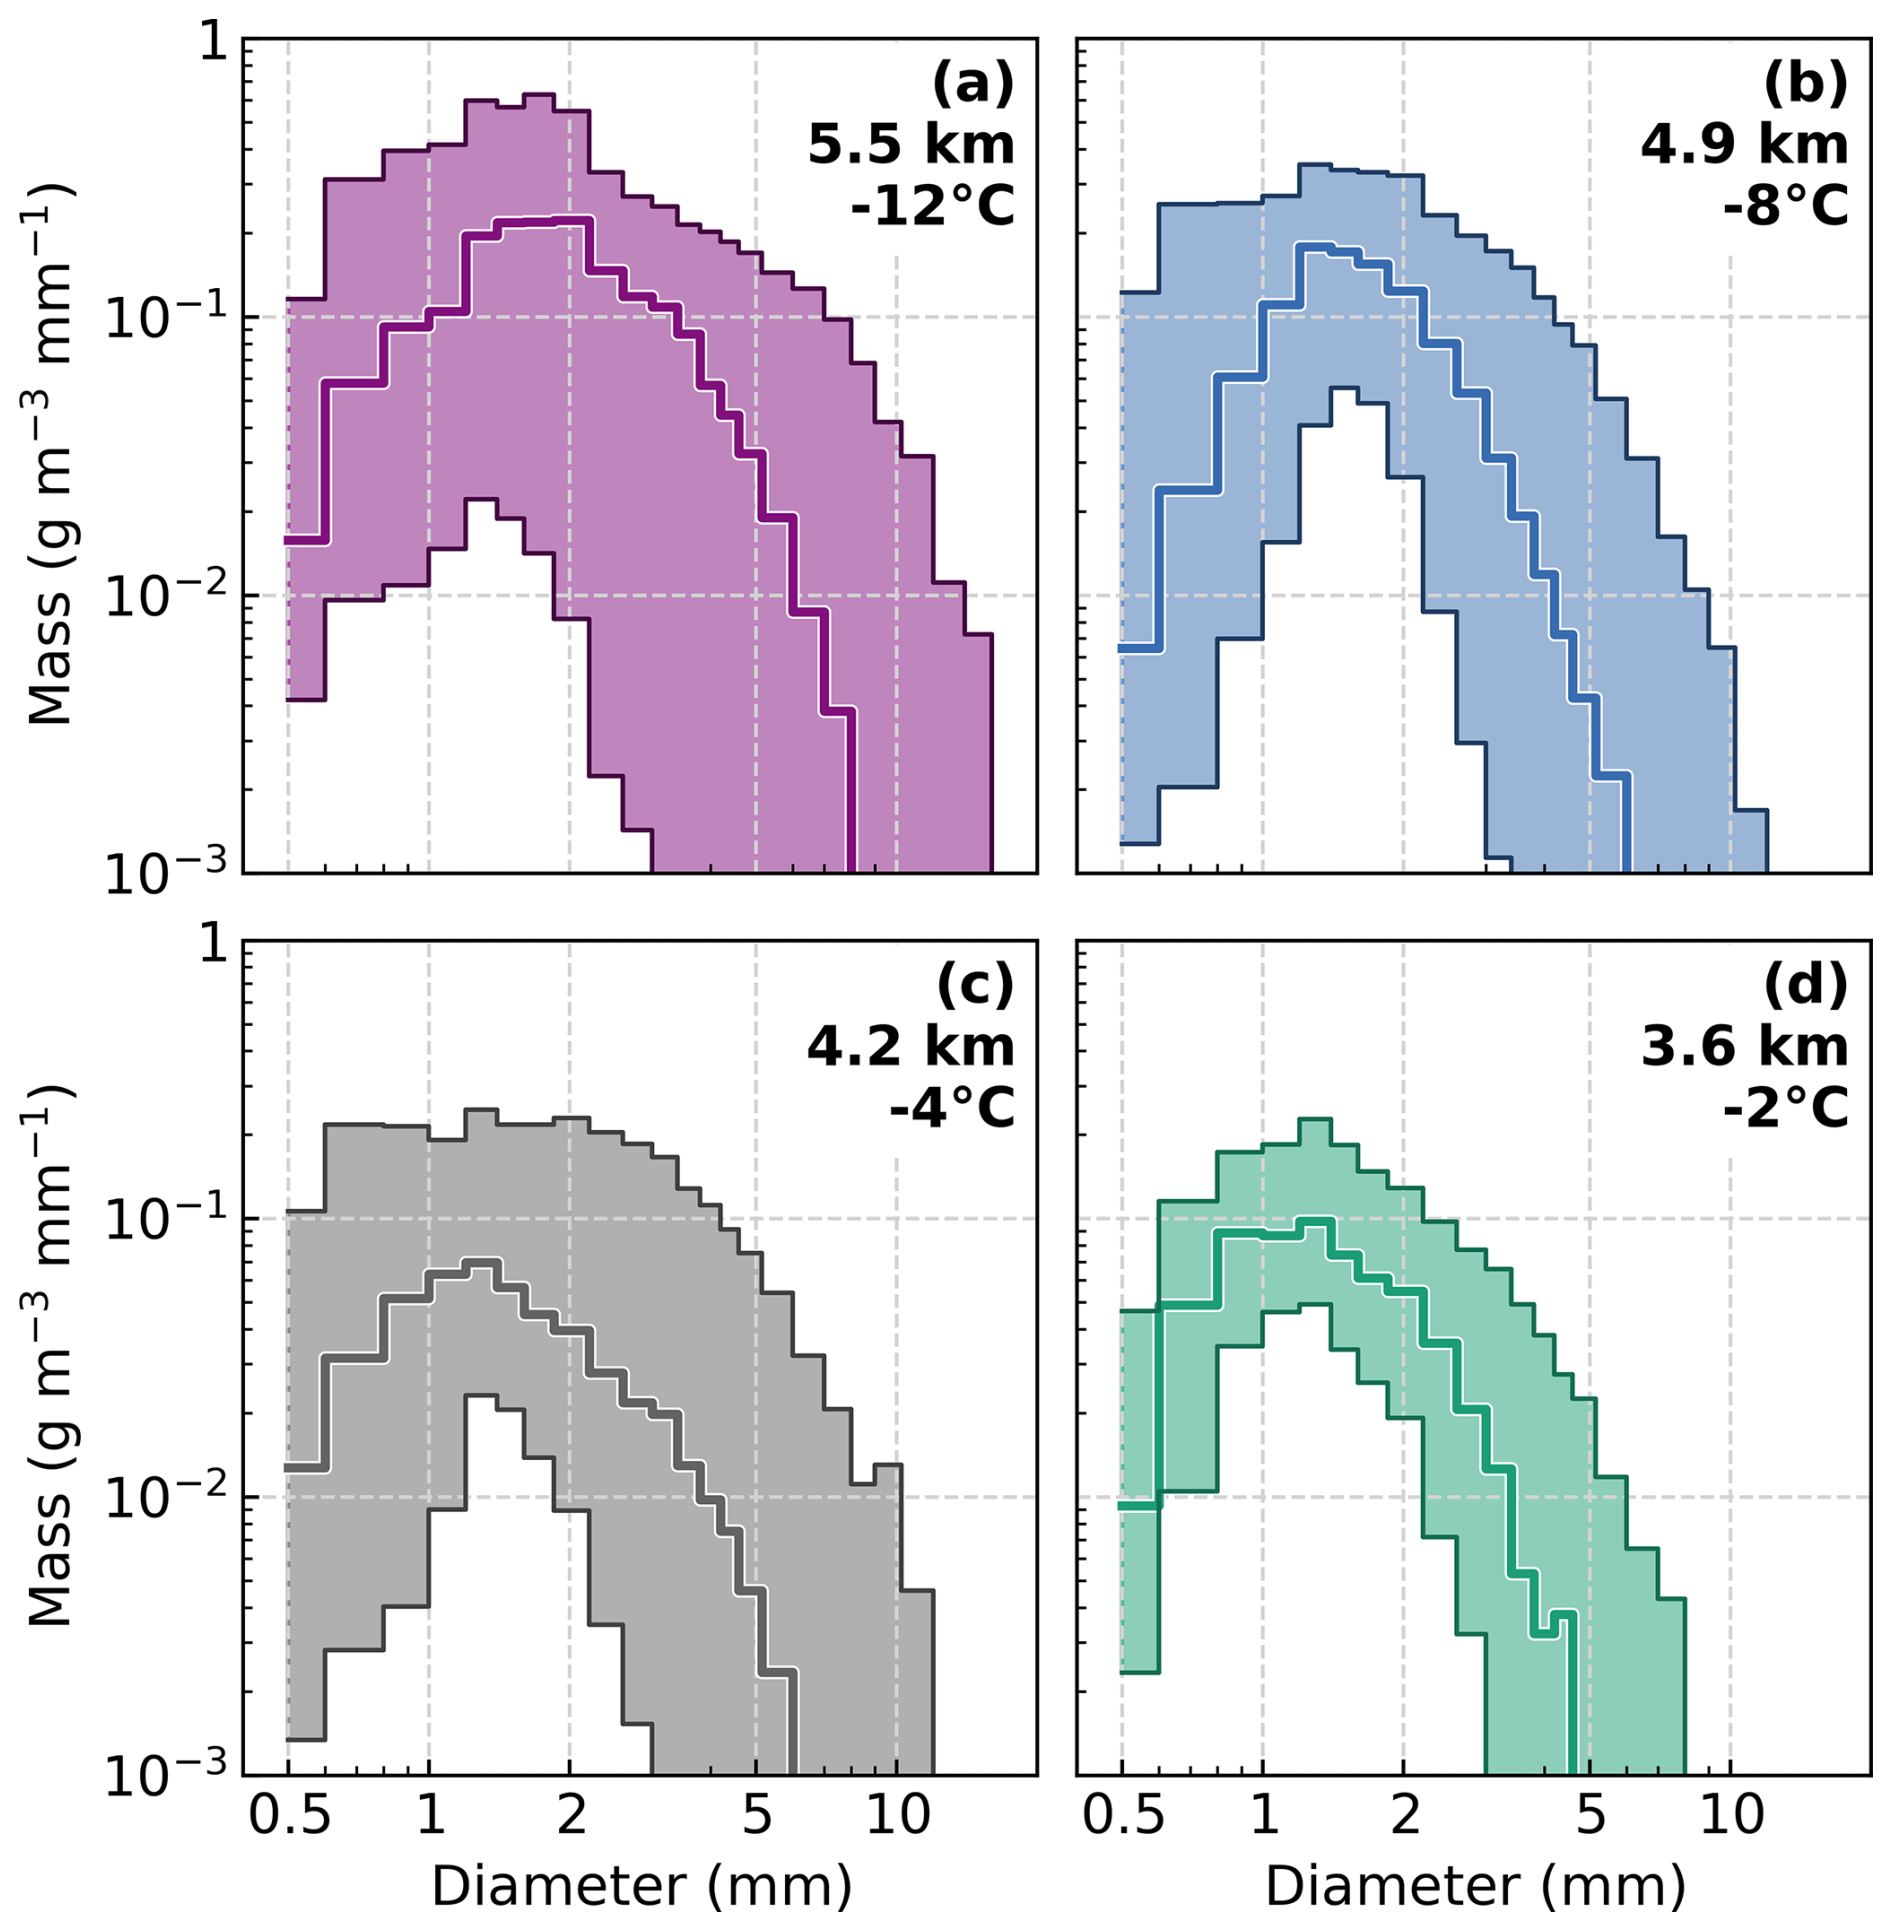
Figure 6Ice mass PSD median (line) and interquartile range (shaded) in situ measurements from the HVPS probe at particle diameters > 0.5 mm within the banded regions of individual P-3 flight legs 2 to 5. Mean altitudes of the P-3 and ambient temperatures are stated for each flight leg.
The relative maximum in ice mass at 5.5 is consistent with the notion of ice-phase particles concentrating aloft along the frontal boundary and maintained within a weak generating cell layer (Fig. 3). Precipitation fallout within the cloud below shows quantitative evidence of sublimation in the characteristic IWC loss with descent, while a reduction in particle size, especially among large particles, is consistent with the minimal evidence of aggregation in the imaged particles (Fig. 5). The small increase in characteristic IWC between 4.2 and 3.6 occurs among particles ∼ 0.5 to 2 mm in size and is most likely a result of accumulated rime mass, despite the concurrent sublimation. Due to intermittency of the FCDP instrument on 4 February, measurements of the supercooled liquid water droplets population in the banded region are available only for flight leg 5 at 3.6 At this height, there was a mean liquid water content (LWC) of 0.02 g m−3 and droplet diameter of 17 µm. However, imagery of supercooled liquid droplets and rimed particles suggest that rime accumulation occurred at least as high as 4.9 (Fig. 5). The prominence of sublimation effects concurrent with riming presents a distinctive evolutionary pathway for losses and accumulations of ice mass and requires a notable ambient environment supportive of these primary processes.
Subsaturated conditions were found at all heights within the cloud. Figure 7a shows the measured ambient RH with respect to water at each P-3 flight level. The RH was similar through the vertical profile of cloud, with median values from 79.7 % (3.6 ) to 83.0 % (4.9 ), and the range of variability was typically less than ∼ 5 %–6 % across each flight leg segment. Expressed as saturation with respect to ice in Fig. 7b, the cloud demonstrated an increasingly subsaturated ambient environment with descent. At 5.5. (−12 °C), the median ice saturation was −8.9 % and further decreased to −17.9 % at 3.6 (−2 °C). It is not readily apparent whether the magnitude of increasing subsaturation at lower heights (warmer temperatures) is representative of the cloud's vertical profile at any given time or a result of the temporal evolution between sampling at flight leg 2 and flight leg 5 (∼ 2 h) within a decaying-stage storm. Nonetheless, the subsaturated vertical profile is consistent with the evidence of sublimation among particle images at all heights (Fig. 5). However, riming requires the presence of supercooled liquid water droplets that, although not sustained in a subsaturated environment, require time to evaporate. For example, within the median observed environmental conditions on flight leg 3 at 4.9 (∼ 83 % RH, −8 °C), droplets with an initial radius, r0, of 10 µm will require ∼ 10 s to evaporate and substantially more time for larger droplets (e.g., ∼ 70 s for r0 = 30 µm; Roy et al., 2023). It is plausible that supercooled liquid water droplets were formed in locally supersaturated environments outside of the observationally constrained domain of our analysis, such as regions of sustained updrafts (e.g., Rauber and Tokay, 1991).
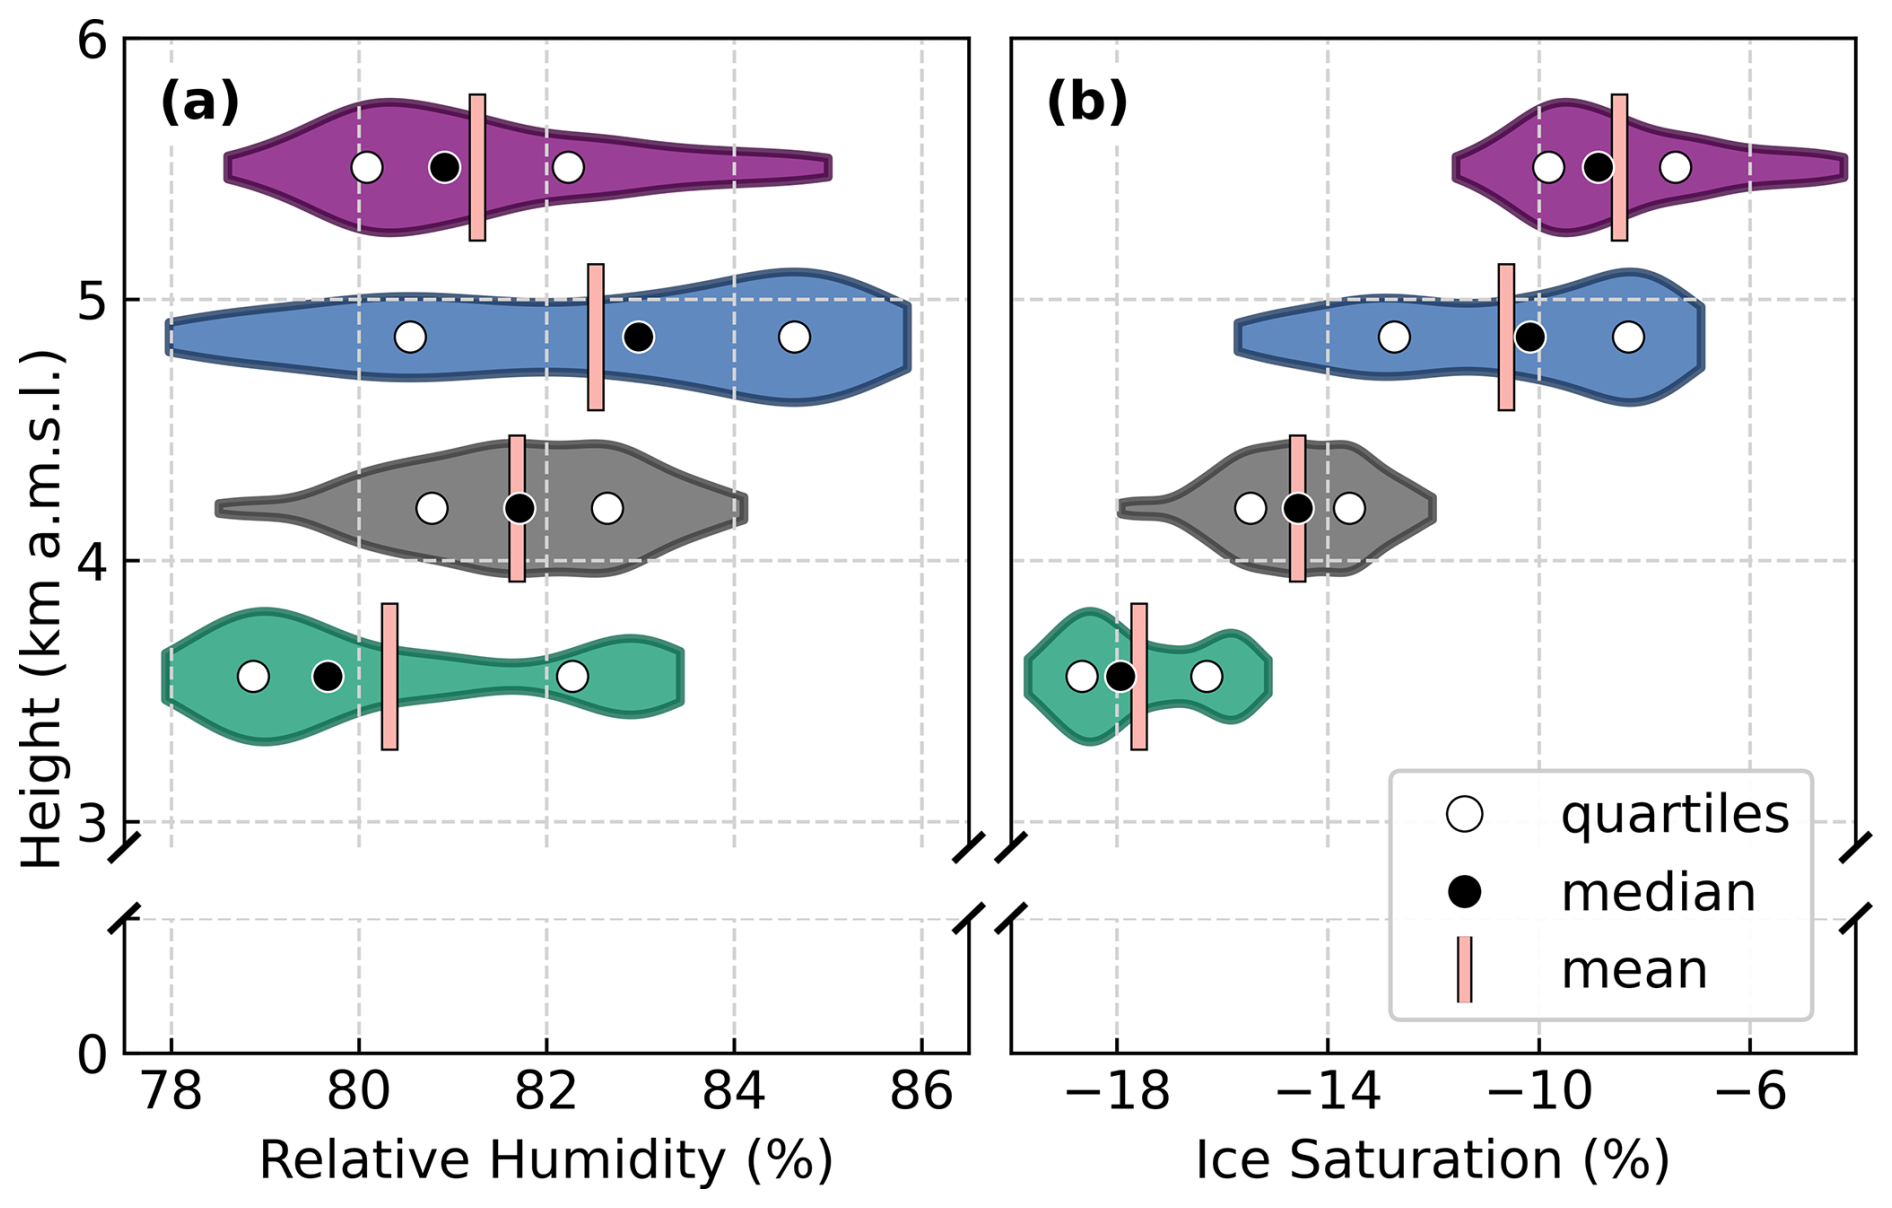
Figure 7Violin plot distributions of (a) relative humidity and (b) ice supersaturation in situ measurements within the banded regions of flight legs 2 to 5. Outliers exceeding the 5th and 95th percentiles are not plotted.
The distribution of ambient vertical wind velocity, w, measurements from the TAMMS instrument on each P-3 flight leg are shown in Fig. 8. Notably, there was a characteristic ambient updraft at 5.5 and abrupt transition to a weak downdraft below. This w profile is consistent with the notion of a weak generating cell layer with precipitation fallout inferred from the appearance along the prominent cloud top and fallstreaks in ZKu below ∼ 5 from the radar cross section along flight leg 5 (Fig. 3b). At 5.5 , the median w was 0.63 m s−1, which is weaker than updrafts of 1 to 2 m s−1 that are common in generating cells within winter cyclones (e.g., Rosenow et al., 2014; Kumjian et al., 2014; Keeler et al., 2016). Between 4.9 and 3.6 , the ambient median wind field was characterized by weak descent with w= ∼ −0.06 to ∼ −0.10 m s−1, which is within the estimated uncertainty (of 0.2 m s−1) of the TAMMS instrument. However, within this cloud layer, variabilities in w were observed, and at all heights, updrafts were identified at the upper quartile of measurements. This range of w variability was similarly evident in horizontal gradients of Doppler velocity across flight leg 5, despite an overall descent below ∼ 5 (Fig. 3c). Intermittent updrafts may have provided a source of supercooled liquid water within the subsaturated ambient background environment. It is further plausible that supercooled liquid water transport occurred through horizontal advection. However, because of the minimal evidence for directional shear aloft, it appears more likely that supercooled liquid water transport and, more importantly, particle evolution and fallout occurred within the vertical plane sampled by the aircraft. To support these observational inferences of microphysical processes associated with the band, we use an observationally constrained numerical simulation and quantify the independent process-based effects and their dependencies on properties of the ambient environment for governing the cloud's precipitation mass and rate of fallout.
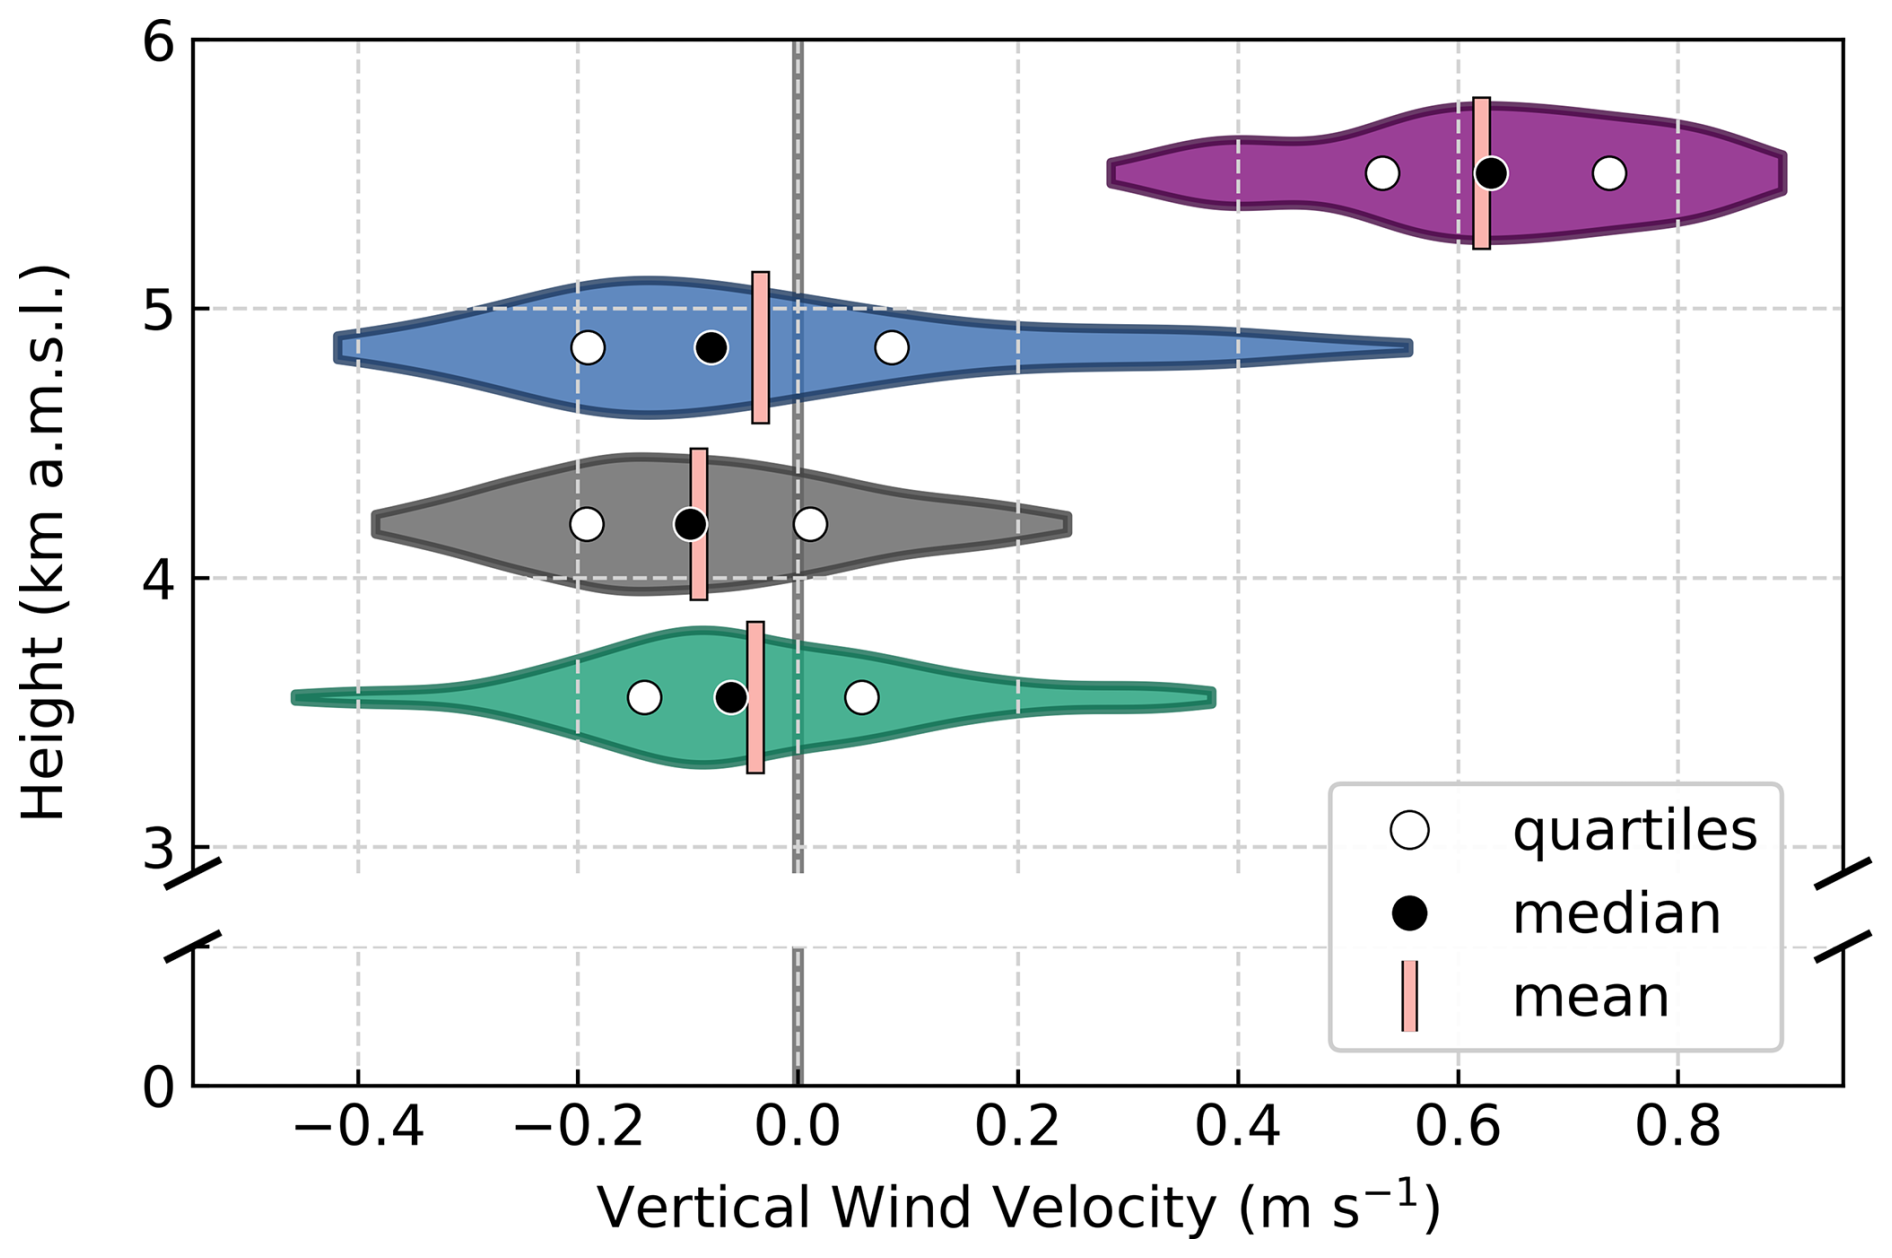
Figure 8Violin plot distributions of in situ measurements of vertical wind velocity from the TAMMS instrument within the banded regions of P-3 flight legs 2 to 5. Outliers exceeding the 5th and 95th percentiles are not plotted.
Our modeling environment is designed to permit isolation and direct manipulation of microphysical processes and the ambient environmental conditions to elucidate their independent effects on an evolving ice-phase particle population. Model selection and its design follow DeLaFrance et al. (2024b), which simulated the evolution of precipitating particles associated with the southerly displaced region of enhanced reflectivity on 4 February. As in this prior study, we use the Lagrangian-particle-based McSnow model, which has a 1D columnar domain (Brdar and Seifert, 2018). The McSnow model's particle-based scheme evolves an initial population of ice-phase particles through explicit processes of deposition (sublimation), aggregation, and riming within a prescriptive ambient environment. Constrained by the semi-Lagrangian in situ and remote sensing measurements, this McSnow model permits simulations of the likely evolution of a population of ice crystals. Furthermore, consistent with the present study's objectives, McSnow permits independent user control of these ice-phase processes, their regions of activity or inactivity within the column, and properties of the ambient environment as prescribed inputs. Furthermore, the ice-phase particle population evolves at the scale of the particle, thereby removing assumptions about the evolving PSD, which is readily accessible throughout the column. For comparability with the simulations presented in DeLaFrance et al. (2024b), we maintain consistency in the decisions regarding parameterizations and processing, with select exceptions motivated by observed properties that were unique to each region of the storm.
The first step is to create a control simulation that reproduces the observed evolution of precipitating particles within their ambient environment using inputs derived from in situ measurements between P-3 flight legs 2 through 5. Particles are introduced in the model such that the initial PSD at the upper boundary remains prescribed, which we derive from a Gamma distribution fitted to the median PSD observed at 5.5 at the uppermost P-3 flight leg (Fig. 6a). This initial PSD is represented by an estimated characteristic IWC of 0.540 g m−3 and total number concentration of 7 × 10³ m−3 (D > 0.225 µm). Newly initiated particles have a mass–dimension relationship of m = 0.00294D1.94 (cgs) following Brown and Francis (1995) for unrimed crystals but evolve independent of this assumption thereafter. Particle terminal velocity, Vt, is derived following Heymsfield and Westbrook (2010). In McSnow, modeled microphysical processes are largely independent of Eulerian grid constraints (see the discussion in Brdar and Seifert, 2018, Sect. 2). However, a gridded columnar domain provides a suitable framework for analysis of the evolved bulk particle properties. As in DeLaFrance et al. (2024b), we specify a column of 500 grid cells, equating to a vertical resolution of 11 m, based on an upper boundary at 5.5 Particles evolve within a prescriptive ambient environment, which is derived from the median value in situ measurements of standard atmospheric properties (i.e., temperature, dew point, RH, pressure) at each flight altitude (Fig. 7) and then by linearly interpolating between measurements. Similarly, w is prescribed from linear interpolation between median in situ measurements at each flight altitude (Fig. 8).
The in situ observations of inferred microphysical processes motivated several design considerations. Minimal evidence of aggregation throughout the column among particle imagery (Fig. 5) and an overall reduction in particle sizes with descent in cloud suggest a very low process efficiency. With McSnow, upon collision, two particles will remain joined as an aggregate particle dependent on a sticking efficiency parameter, Eagg, which scales from 0 to 1 (e.g., Pruppacher and Klett, 1997). Here, we adopt a sticking efficiency based on the laboratory investigations of Connolly et al. (2012), in which they identify a maximum likelihood estimate (MLE) and confidence interval (CI) for a temperature-dependent Eagg. Whereas in DeLaFrance et al. (2024b) it was appropriate to adopt an Eagg following the upper range of the CI provided in Connolly et al. (2012), here, we find it appropriate to adopt an Eagg following the lower range of the CI. Therefore, Eagg has a value of 0.4 at −15 °C and linearly reduces to 0 at −10 °C, which is maintained to 0 °C. Because rimed particles were frequently observed in particle imagery at 4.9 but not at 5.5. (Fig. 5), we define a mixed-phase layer of cloud below 5.0 where riming occurs following a stochastic procedure (Brdar and Seifert, 2018) based on prescriptive properties of the liquid water population. From the FCDP measurements, we specify an LWC of 0.02 g m−3 and characteristic droplet radius of 8 µm. Consistent with DeLaFrance et al. (2024b), all simulations run for 10 h at a time step of 5 s and average the final 5 h, after reaching a steady state, for analysis.
To verify the control simulation, we first assess the evolution of the PSD throughout the ice-phase layer of cloud. Specifically, we compare the model-simulated PSD with the median observed PSD at each P-3 flight altitude. Figure 9a composites the flight-leg-specific PSDs at D > 0.5 mm, as shown in Fig. 6. The simulated PSDs at equivalent heights from the model are shown in Fig. 9b. A primary criterion towards establishing a successful control simulation was a reproduction of the reduced characteristic IWC and particle sizes with descent that was expressed in the observations. The control simulation has a vertical evolution of the PSD that demonstrates consistency with observations, providing confidence that the modeled processes are generally representative of the observed processes. At 5.5 , the control simulation has an initial characteristic IWC of 0.606 g m−3. Between 4.9, 4.2, and 3.6 , the characteristic IWC decreased to 0.303, 0.214, and 0.119 g m−3, respectively. Some of the unique variabilities among the observations are not captured by the simulation. For example, the relative increase in mass at D = ∼ 0.5 to 2 mm between 4.2 and 3.6 in observations (Fig. 9a) is likely due to accumulation of the rime mass. In the control simulation, the rime fraction, the fractional mass attributable to accumulated rime, reaches 0.33 at 3.6 , which is consistent with a subjective assessment of rime accumulation among the particle imagery at this height (Fig. 5, leg 5). In the observed cloud, however, supercooled liquid water (and riming) was heterogeneously distributed throughout the mixed-phase layer, which is not represented in the model. While this limitation introduces some uncertainty in the simulated accumulation of rime mass, the relatively small accumulated rime fraction of 0.33 is consistent with our expectations based on prior simulations within the southerly displaced region of enhanced reflectivity (DeLaFrance et al., 2024b). Within that region of the storm, there was an ∼ 500 m deeper mixed-phase layer and a higher LWC of 0.05 g m−3, compared to 0.02 g m−3 within the frontal region, and its similarly constrained control simulation produced a rime fraction of 0.55.
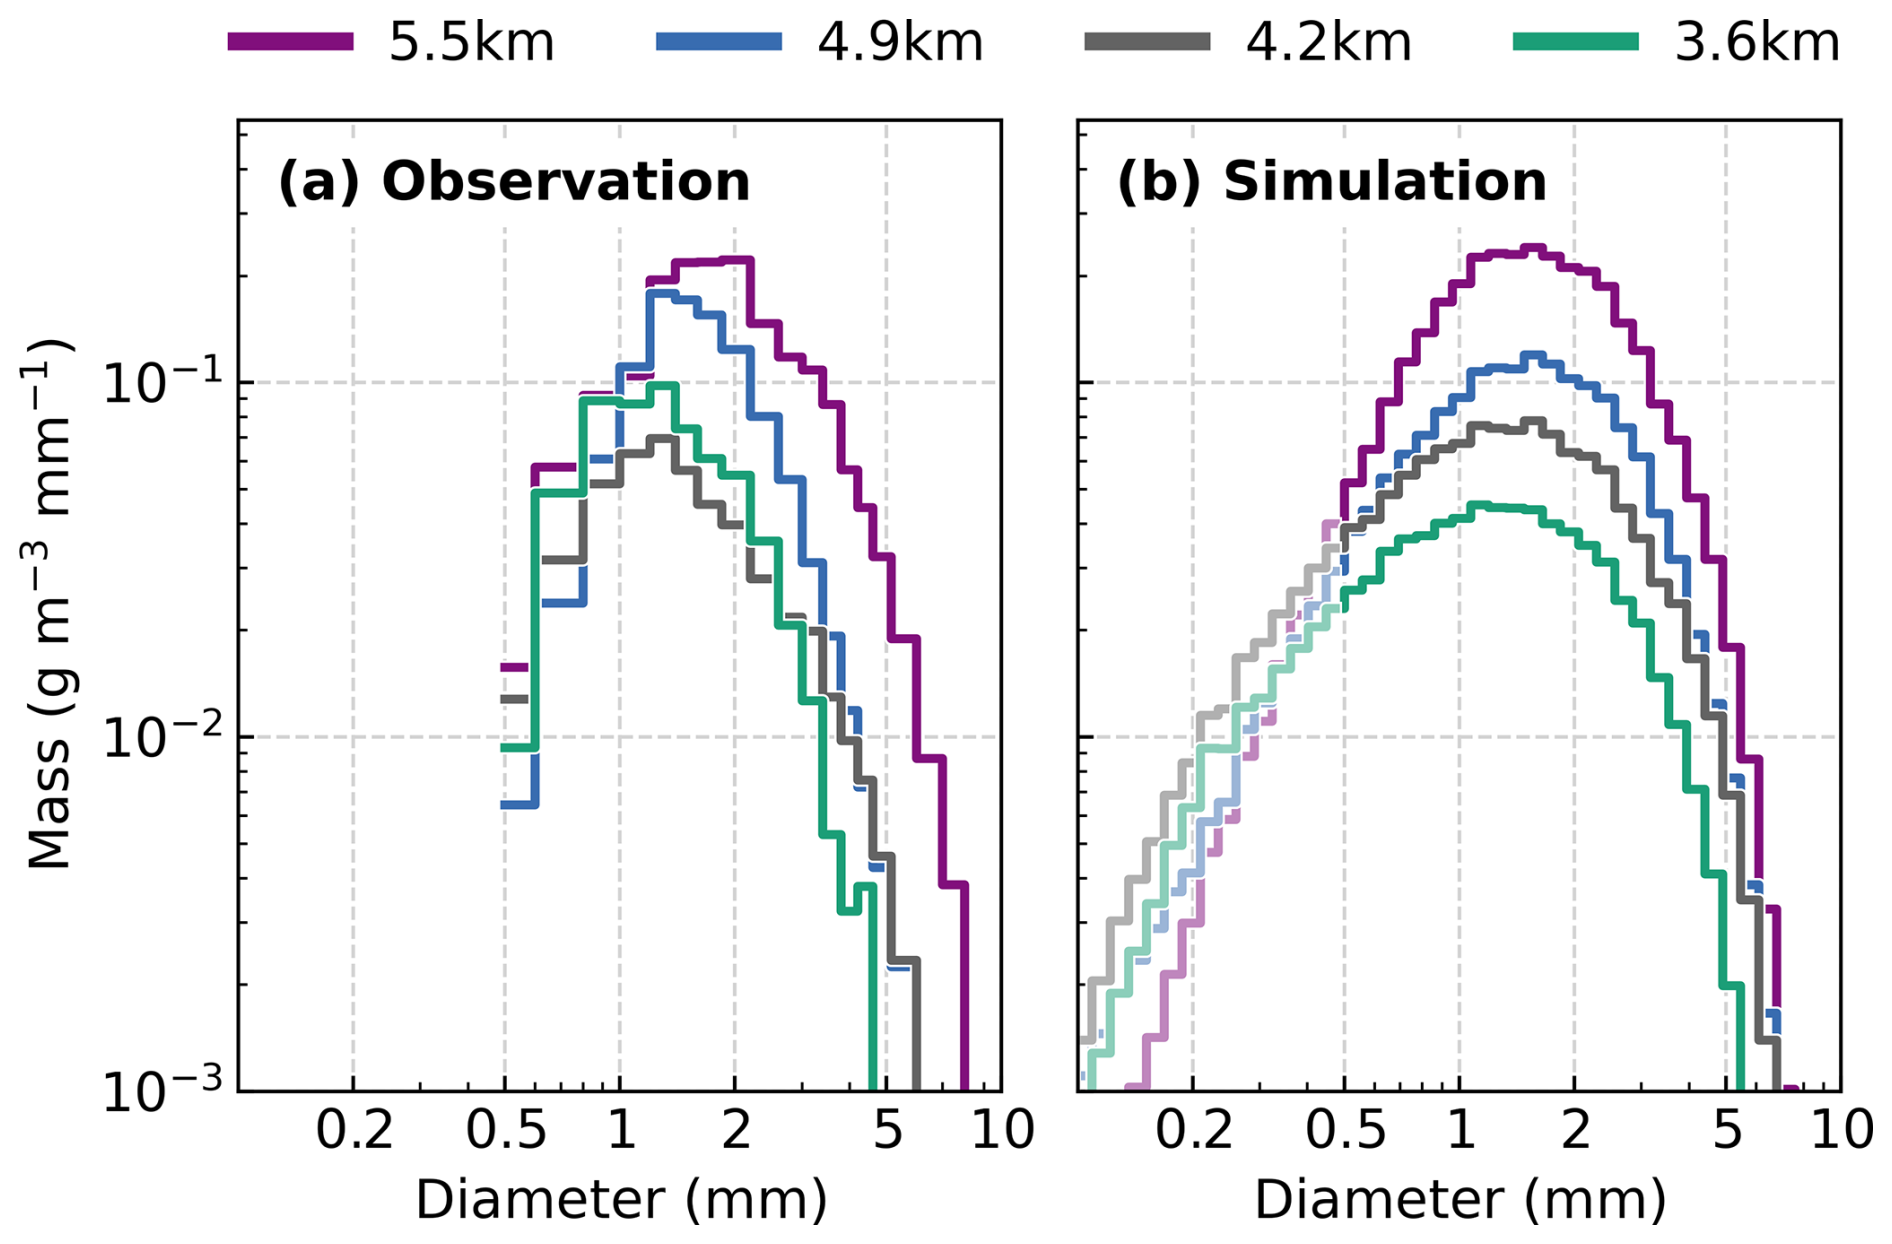
Figure 9Composite ice mass PSDs from (a) in situ observations within banded regions of P-3 flight legs 2 to 5 (see Fig. 1a–d) and (b) the control model simulation at equivalent heights. For comparison purposes, line transparency of the simulations (b) is reduced at diameters less than 0.5 mm, where observations are unavailable. Mean altitudes of the P-3 aircraft are stated for each flight leg.
Because we are motivated to identify the imprint of ice-phase microphysical processes and their sensitivities to ambient conditions on radar remote sensing measurements, we further evaluate the control simulation by computing ZKu from the evolved PSD, which is compared to coincident measurements from the overflying ER-2 HIWRAP. Estimation of radar moments from the simulated PSD follows DeLaFrance et al. (2024b) in applying a T-matrix approach (Leinonen, 2014) to estimate the Ku-band radar backscatter cross section and a two-way path integrated attenuation correction (Williams, 2022). Figure 10 shows the distribution of HIWRAP ZKu measured at the height of the P-3 aircraft across each flight leg. The observed ZKu maximized aloft and decreased between 5.5 and 4.2 , then slightly increased at 3.6 Throughout the cloud column, the control simulation demonstrates good agreement with median observation values to within ∼ 2–3 dB. The observed PSD and ZKu evolution with height support a precipitation evolution pathway described by robust production or concentration of ice within the updraft region of the generating cell layer along the frontal boundary aloft (∼ 5.5 ) and fallout within the downdraft regions below. This agreeing result establishes confidence in the quasi-idealized 1D control simulation and, crucially, the simulated microphysical processes within their ambient environment, prescriptively constrained by in situ measurements.
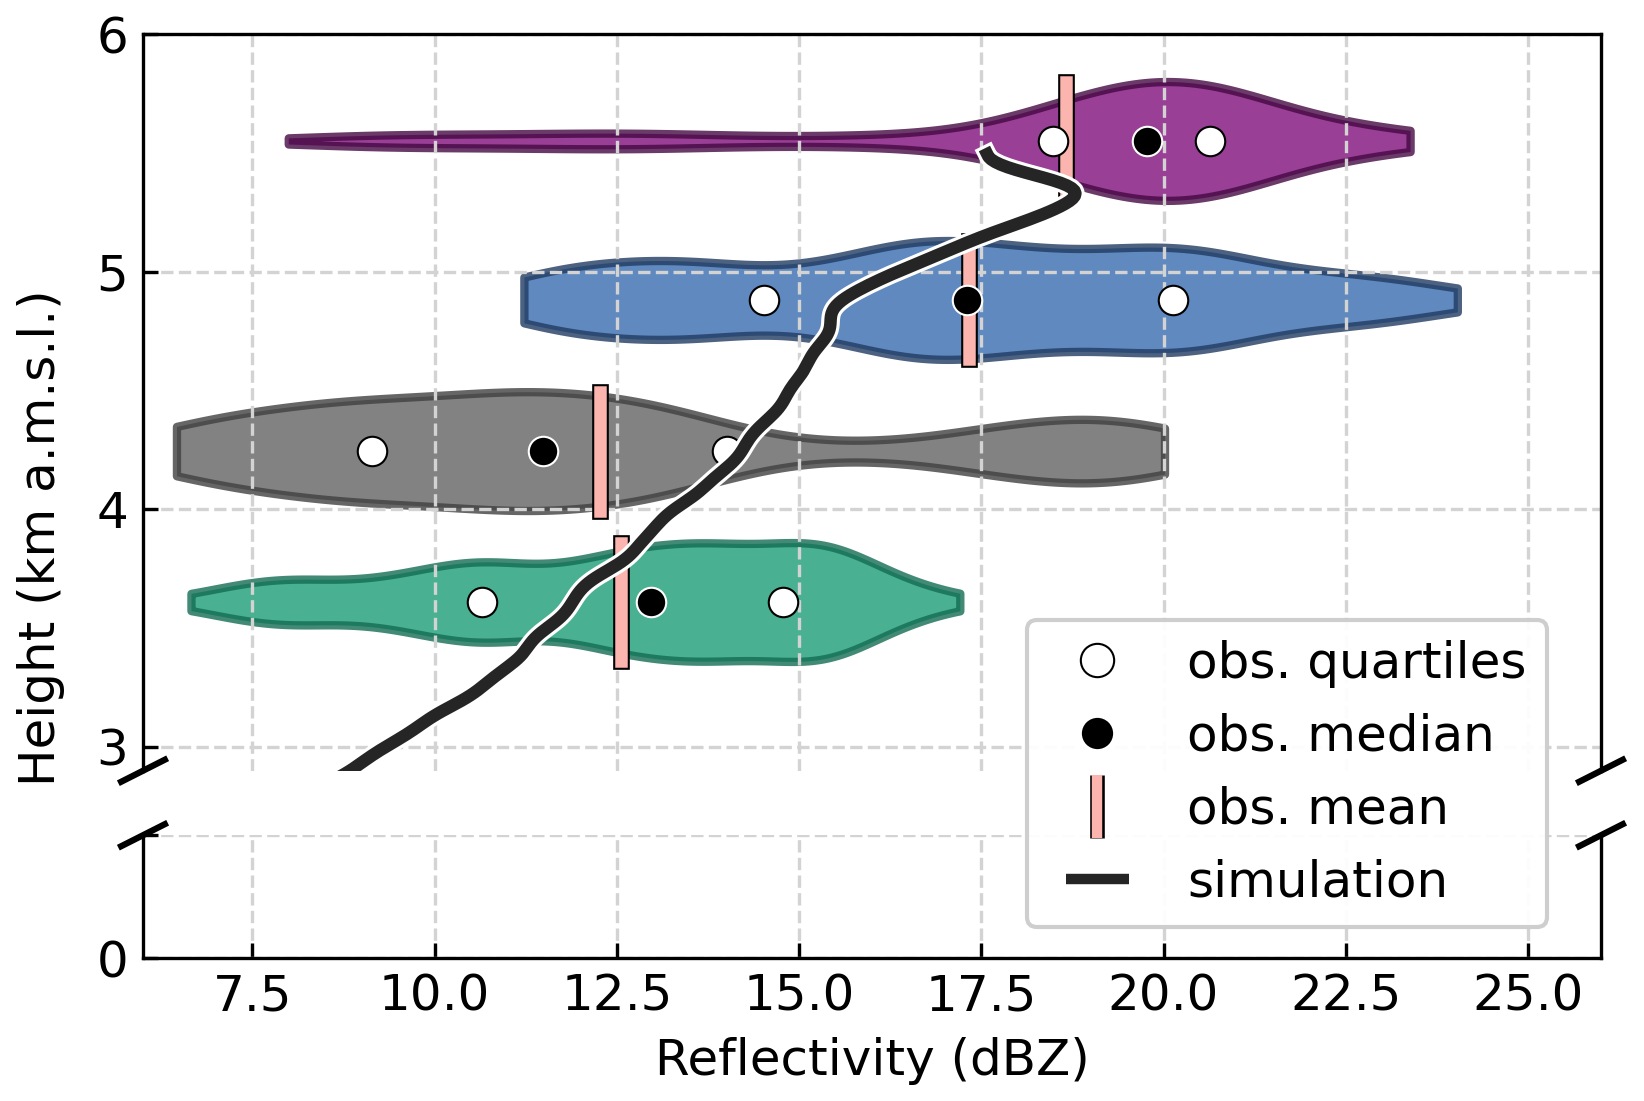
Figure 10Ku-band radar reflectivity estimated from the control simulation and violin plot distributions of reflectivity from the ER-2 HIWRAP Ku-band radar at the altitude of the P-3 aircraft within the banded regions of P-3 flight legs 2 to 5. Outliers exceeding the 5th and 95th percentiles are not plotted.
Microphysical evolution between the generating cell layer at 5.5 and 3.6 was dominated by sublimation, yielding a significant characteristic IWC loss. Riming, whether within isolated regions of updrafts or following sublimation (i.e., Fig. 5, 17:10:05 UTC), negated some of the ice mass loss, as supported by the rime fractional mass of 0.33 accumulated at 3.6 in the control simulation. Further, riming likely aided fallout through increases in particle density and, subsequently, fall speed. As a result, when assessed as the vertical mass flux at 3.6 (lowest altitude of the P-3 observations), the control simulation produced a liquid-equivalent rain rate of 0.66 mm h−1. Surface measurements at KIWI were reported as 1.02 mm during the 17:00 UTC hour, at the time of aircraft overpass on flight leg 5 (Fig. 2), and reduced to 0.76 mm h−1 during the following 18:00 UTC hour. To the extent that the control simulation precipitation rate can be compared to the available ASOS tipping bucket measurements with a resolution of 0.254 mm, the simulation is in general agreement with observations. Moreover, any underestimation of the precipitation rate by the control simulation may be a result, in part, of the absence of simulated liquid-phase precipitation formation below the melting level. Despite the subsaturated ambient environment, precipitation fallout was maintained through the cloud, contributing to a relative enhancement in surface precipitation rate with passage of the band.
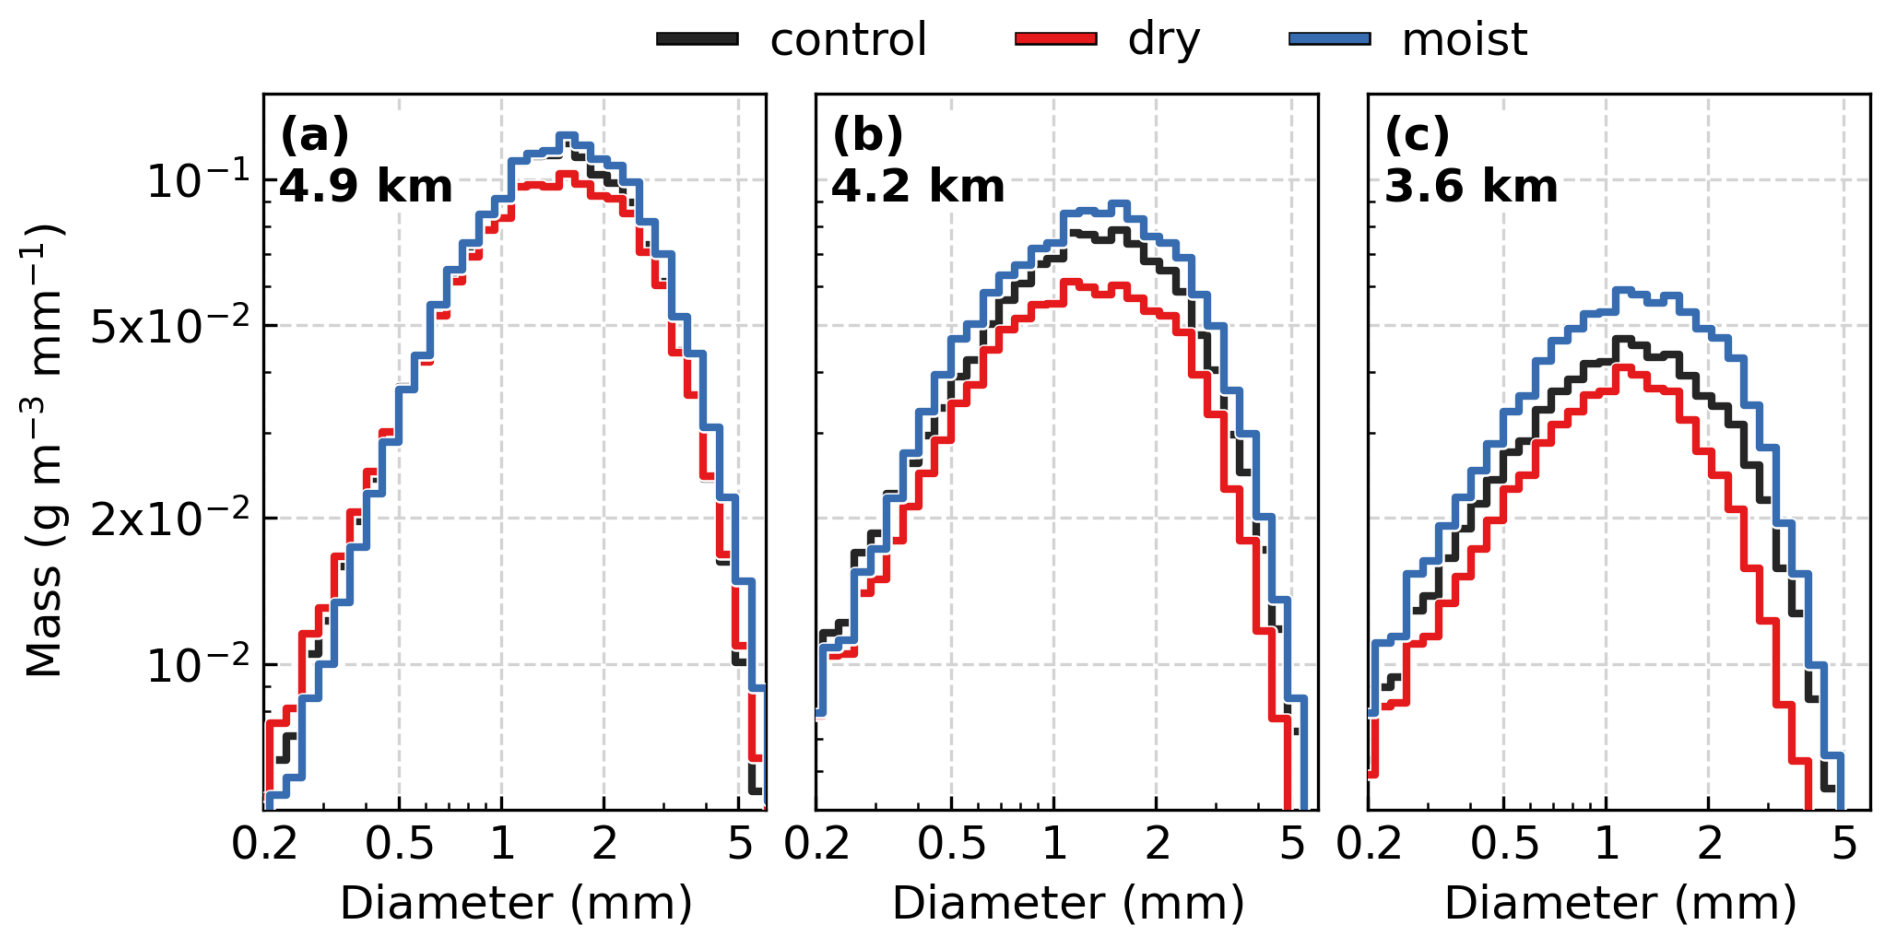
Figure 11Ice mass PSDs for the control, dry, and moist simulations at (a) 4.9 corresponding to P-3 flight leg 3, (b) 4.2 corresponding to P-3 flight leg 4, and (c) 3.6 corresponding to P-3 flight leg 5. Perturbed-state cloud RH profiles for the dry and moist simulations are derived from the interquartile range of in situ observations (see Fig. 7a).
The frontal cloud exhibited a heterogeneity expressed in the diversity of ice crystal habits and their apparent process-based evolution (e.g., sublimation and riming, Fig. 5) and, similarly, in the ambient RH (Fig. 7a) and the magnitude and direction of vertical winds below ∼ 5 (Fig. 8). Despite the promising agreement between our control simulation and the observations, a limiting assumption of the simulation is the reduction of the observed cloud's heterogeneity to a prescriptive median-state ambient environment. We are, therefore, motivated to explore the particle evolution within perturbed ambient environments constrained by the range of variability observed in the observed cloud. In considering precipitation pathways within these perturbed environments, we further aim to elucidate the ambient dependencies of the dominant microphysical process and quantify those effects on surface precipitation. Because the dominant microphysical processes acting on particles upon fallout from the generating cell layer were sublimation and sedimentation, we perturb two properties of the ambient environment that directly affect these processes and demonstrated a range of variability in the cloud, namely, RH and w (i.e., updrafts and downdrafts). From these ambient properties, two groups of sensitivity simulations are designed from the interquartile ranges of in situ measurements (Figs. 7a and 8).
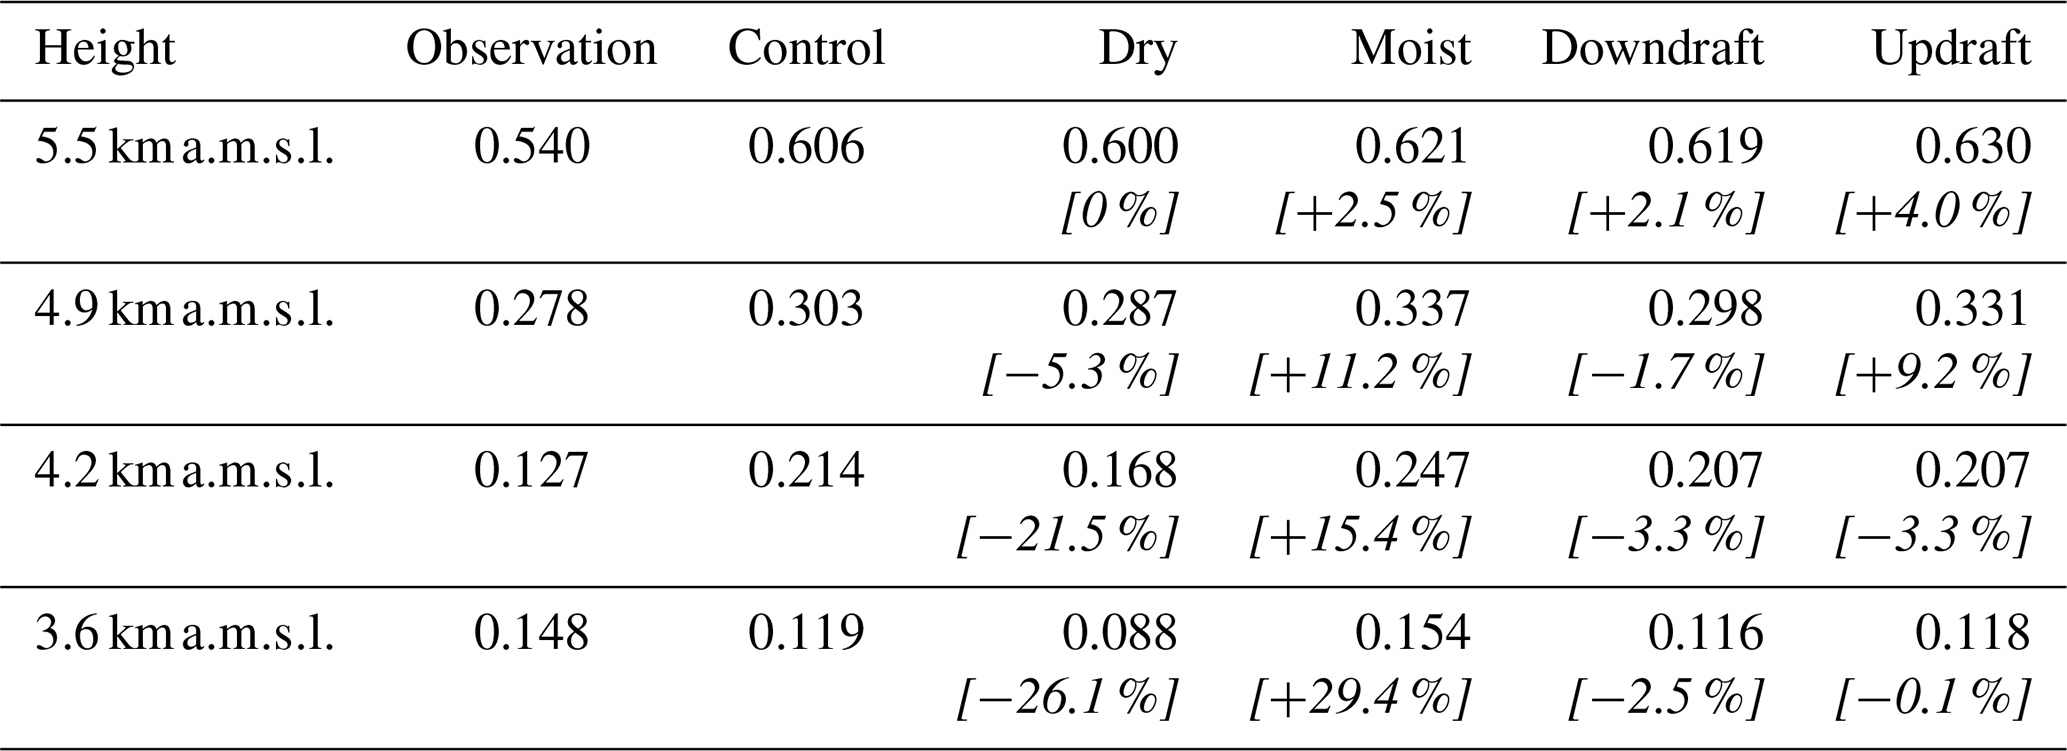
Table 2Simulated characteristic IWC (g m−3) at heights equivalent to the P-3 aircraft on flight legs 2 through 5 for the median observations and the control, dry, moist, downdraft, and updraft sensitivity simulations. Perturbed-state cloud RH profiles for the dry and moist simulations are derived from the interquartile range of in situ observations (see Fig. 7a). Perturbed-state cloud vertical wind profiles for the downdraft and updraft simulations are derived from the interquartile range of in situ observations (see Fig. 8). Percentage differences in characteristic IWC from the control simulation are provided for each perturbed-state simulation in italicized brackets.
5.1 Ambient relative humidity
For simulations that we term “dry” and “moist”, the prescriptive cloud moisture input is perturbed by assuming the 25th and 75th percentile values of observed RH (Fig. 7a). For both the dry (25th percentile) and moist (75th percentile) simulations, most perturbations at all heights were < 2 % RH, with the largest perturbation being a decrease of 2.6 % RH at 4.9 in the dry simulation and an increase of 2.9 % RH at 3.6 in the moist simulation. Figure 11 shows the simulated PSD for the control, dry, and moist simulations. Although retrievable at any height from the simulation, we found it convenient to assess the PSD at heights equivalent to P-3 flight legs 3 through 5. At 5.5 (flight leg 2), where particles are initialized, simulations do not meaningfully differ from each other. Between 4.9 and 3.6 (Fig. 11a–c), all simulations reproduce the reduction in the characteristic IWC with descent; however, the extent of loss among all particle sizes is modulated by the ambient RH. Table 2 quantitatively summarizes the characteristic IWC at each height for the control and sensitivity simulations. At 3.6 , the characteristic IWC is further reduced from the control simulation by ∼ 26 % in the dry simulation and increased by ∼ 29 % in the moist simulation. Because of the significant effects of sublimation ice losses identified in the control simulation, it is perhaps unsurprising that small perturbations (< ∼ 2 % RH) in the dry and moist simulation yield increasing departures from the control with descent. Nonetheless, these simulations demonstrate a significant dependency on ambient RH for the survival of ice mass falling through the ∼ 2 km deep subsaturated cloud layer.
5.2 Ambient vertical wind magnitude and direction
As with the ambient RH, we introduce two sensitivity simulations, termed “downdraft” and “updraft”, which perturb the prescriptive ambient w by assuming the 25th and 75th percentile values of observations (Fig. 8). Perturbation at all heights for the downdraft (25th percentile) simulation decreased w by ∼ 0.1 m s−1, yielding reduced updrafts in the generating cell layer and a stronger downdraft below. Conversely, perturbations at all heights in the updraft (75th percentile) simulation similarly increased w by ∼ 0.1 m s−1. This resulted in a completely ascending profile throughout the cloud, albeit nearly static (w = 0.01 m s−1) at 4.2 Even in this perturbed state at the upper quartile of observations, w in the generating cell layer is 0.74 m s−1, whereas updrafts greater than ∼ 1 m s−1 may be more typical of a generating cell layer. Thus, given our observationally constrained design specific to the 4 February event, our sensitivity simulations assess a relatively small range of possible updraft and downdraft magnitudes within generating cell clouds producing fallout precipitation.
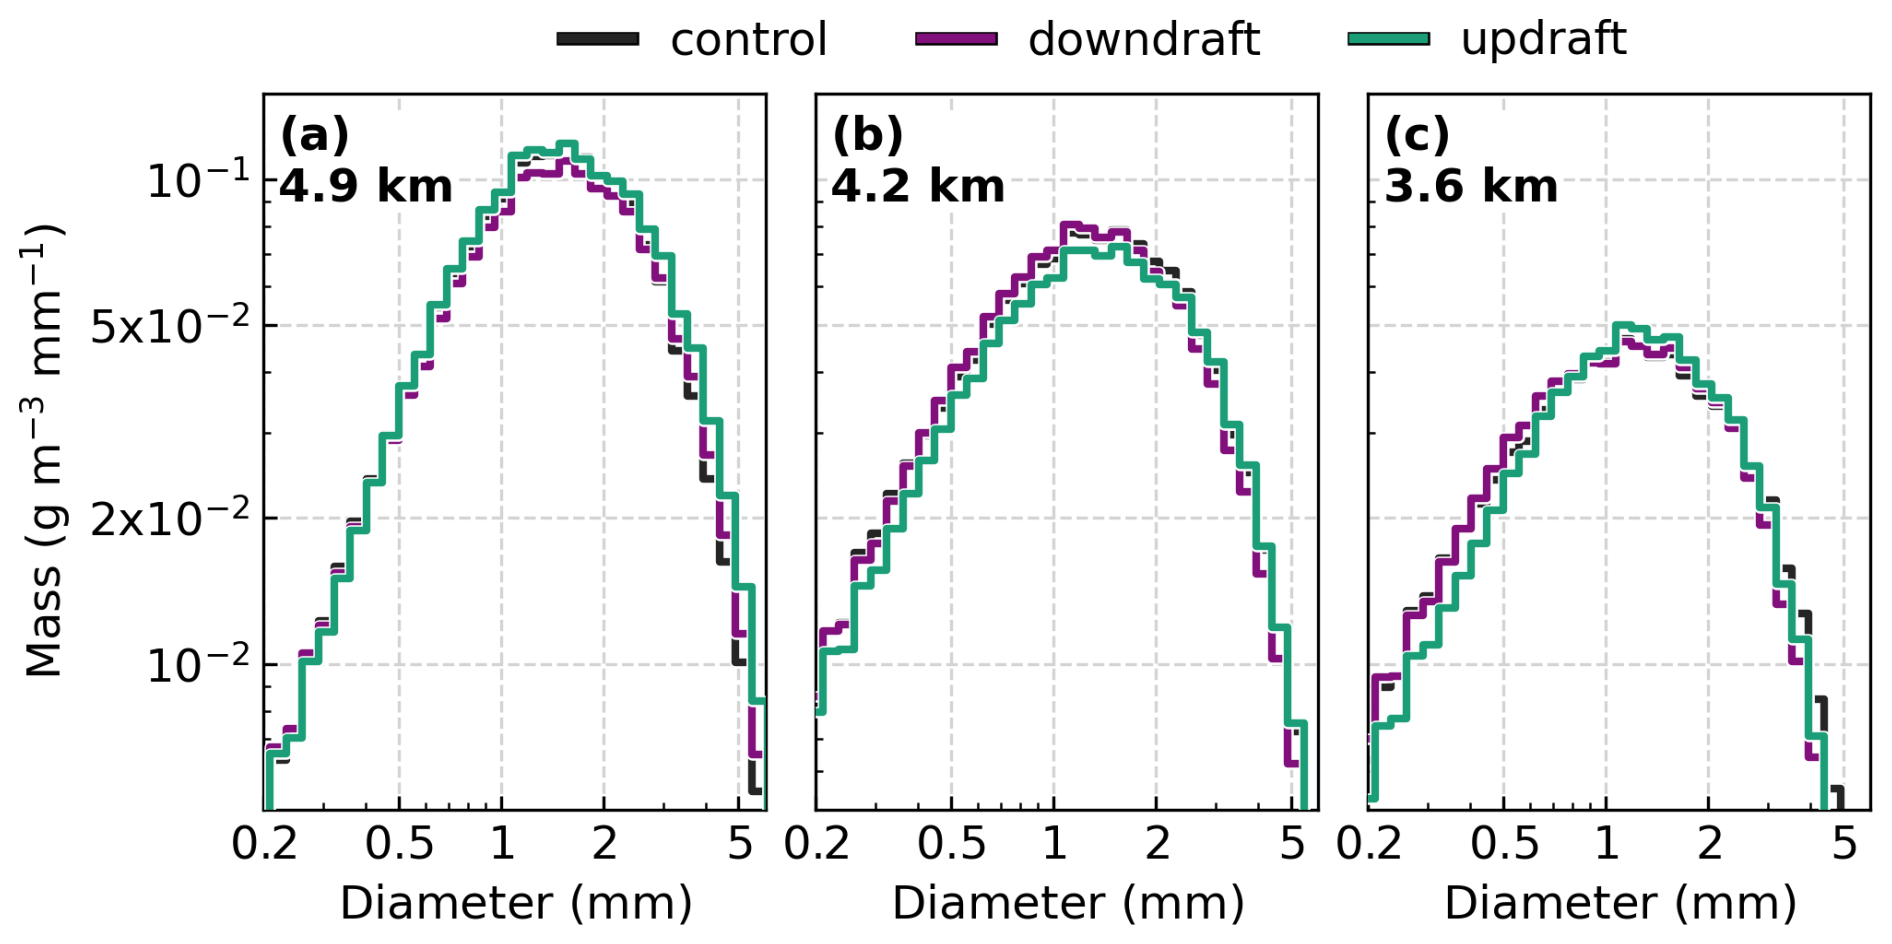
Figure 12Ice mass PSDs for the control, downdraft, and updraft simulations at (a) 4.9 corresponding to P-3 flight leg 3, (b) 4.2 corresponding to P-3 flight leg 4, and (c) 3.6 corresponding to P-3 flight leg 5. Perturbed-state cloud vertical wind profiles for the downdraft and updraft simulations are derived from the interquartile range of in situ observations (see Fig. 8).
Figure 12 shows the evolved PSD for the control, downdraft, and updraft simulations. Compared to RH, the evolved PSD demonstrates a reduced range of variation in response to the w perturbations. Notably, the greatest differences between simulations manifest at small particle sizes (D < ∼ 1 mm), which is a result of the differences in each particle's intrinsic Vt as the particles reach 3.6 (Fig. 12c). In general, Vt increases with increasing particle size (e.g., Locatelli and Hobbs, 1974). Thus, small particles have a relatively small intrinsic Vt and, when subject to a small perturbation in w (∼ 0.1 m s−1), experience an outsized net effect relative to larger, faster-falling particles. For example, at 3.6 in the control simulation, 0.2 mm diameter particles attained a Vt of −0.42 m s−1, whereas 2 mm particles had a Vt of −1.39 m s−1. Because ice mass is dominated by the larger, faster-falling particles, which were minimally affected by w perturbations, the characteristic IWC in the downdraft and updraft simulation at 3.6 were strikingly similar to the control simulation (within 2.5 %).
The most notable influence of w on the characteristic IWC occurs in the updraft simulation at 4.9 (∼ 9 % increase, Table 2). This local enhancement is likely due to the enhanced lofting and concentrating of particles, which must overcome a larger w in the updraft region immediately above the 4.9 evaluation height. However, any resultant enhancement in the characteristic IWC from additional lofting within the updraft region appears to be negated between 4.9 and 3.6 by the outsized effect of sublimation ice loss among all particle sizes. While the updraft within the generating cell layer is crucial to the production and maintenance of a relatively high characteristic IWC aloft, perturbations of w in either the updraft or downdraft regions yielded an inconsequential net effect on the characteristic IWC at 3.6 However, the sedimentation rate of particles is modified by w perturbations. For example, a 2 mm particle's sedimentation rate at 3.6 in the downdraft simulation was −1.52 m s−1, whereas in the updraft simulation, the rate slowed to −1.36 m s−1. The ice-phase contribution to surface precipitation rates is governed by the characteristic IWC, which has an evolutionary sensitivity to the ambient RH (Fig. 11), and its sedimentation rate, which is modified by w. Because of the dependency on radar remote sensing measurements to estimate precipitation rates and the diverse process-based outcomes from these ambient perturbations, we next quantify these effects on vertical profiles of ZKu and VD_Ku.
5.3 Implications of process-based responses to ambient variabilities on radar remote sensing measurements
During the 4 February event, the enhancement in the composite reflectivity field along the band was a sustained, prominent feature that suggested a local enhancement in surface precipitation (Fig. 1). However, from vertical radar profiles across the band (e.g., Fig. 3), within the ice layer, there was a relative maximum in ZKu at the generating cell layer, which weakened with descent in the fallout layer below. The more substantial maxima in column ZKu occurred from melting near 3 For the ice-phase precipitation aloft, this signature of ZKu reduction with descent is a result of sublimation loss and an inefficient aggregation process, which was supported by the results of the control simulation. These losses through the cloud have implications for the downward precipitation mass flux and, therefore, precipitation rates at the surface. Thus, by quantifying the effects of process-based evolutionary responses to perturbed ambient environments, we aim to determine the utility of remote sensing radar measurements to discern ice-phase microphysical processes and their implications for precipitation mass and its fallout.
Table 3Simulated Ku-band radar reflectivity at heights equivalent to the P-3 aircraft on flight legs 2 through 5 and the liquid-equivalent precipitation rate on flight leg 5 for the control, dry, moist, downdraft, and updraft sensitivity simulations. Perturbed-state cloud RH profiles for the dry and moist simulations are derived from the interquartile range of in situ observations (see Fig. 7a). Perturbed-state cloud vertical wind profiles for the downdraft and updraft simulations are derived from the interquartile range of in situ observations (see Fig. 8). Magnitude differences in reflectivity and precipitation rate from the control simulation are provided for each perturbed-state simulation in italicized brackets.
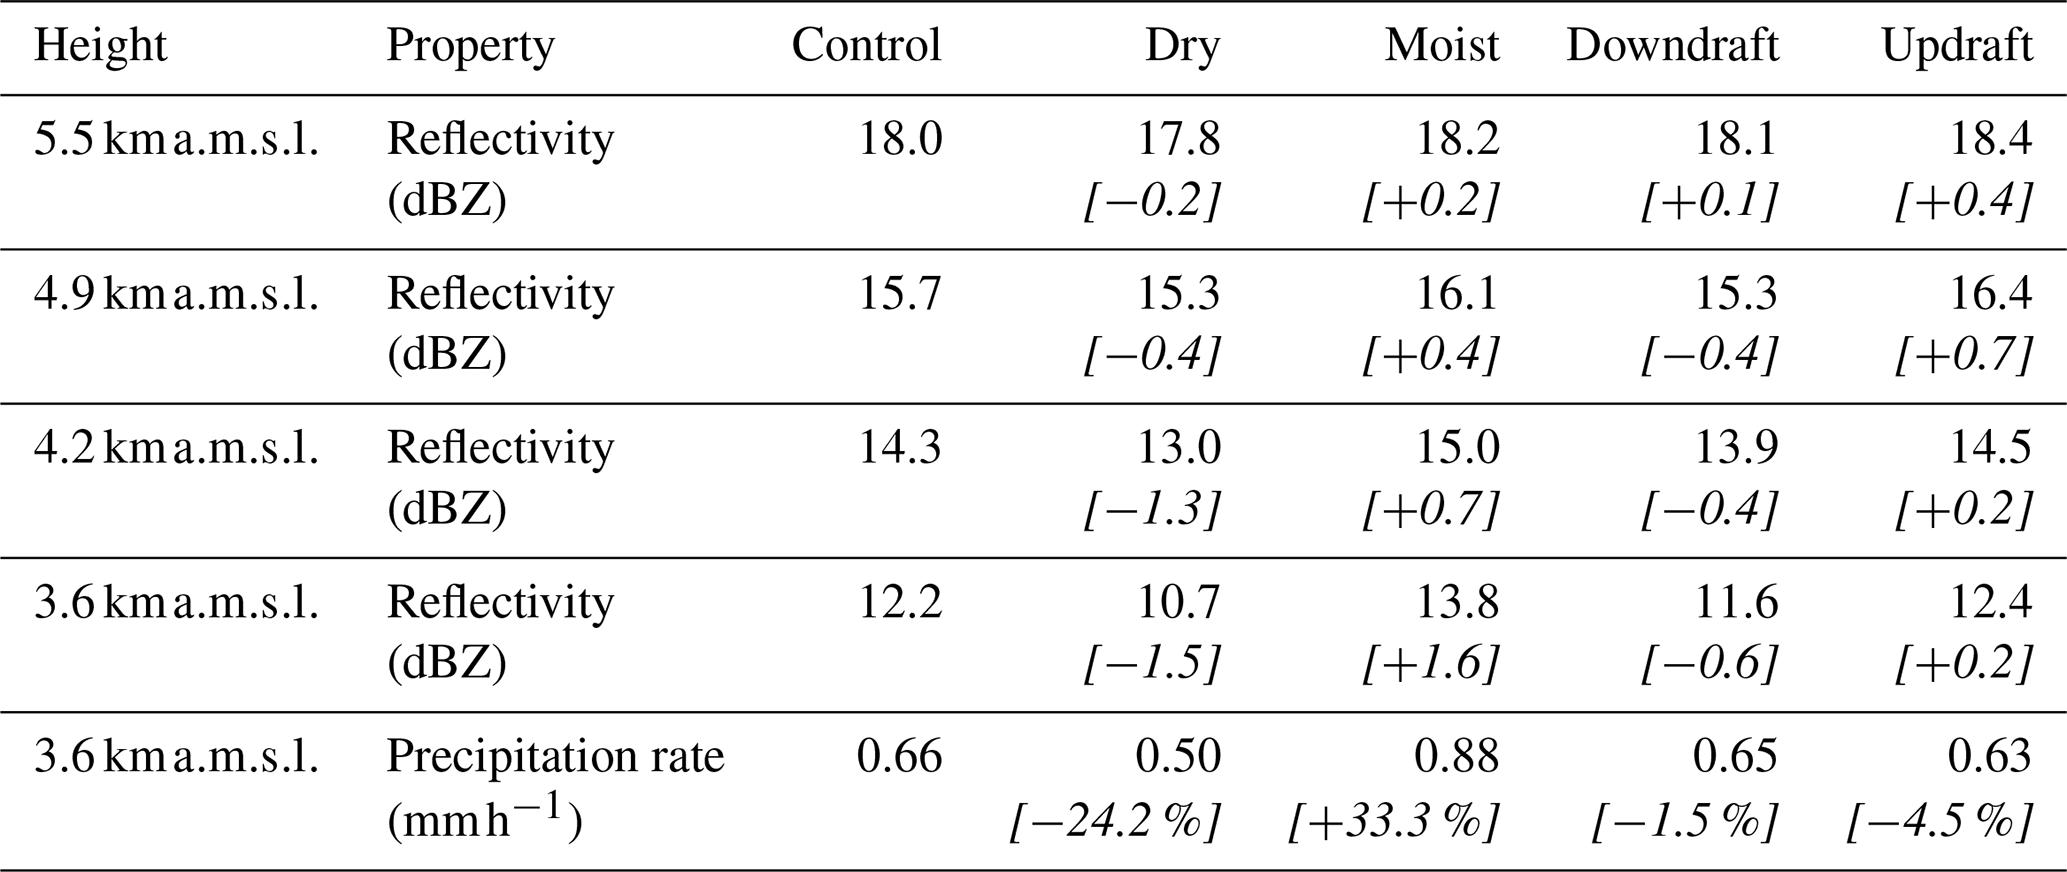
Vertical profiles of ZKu estimated from the evolving PSD between 5.5 and 3 are shown in Fig. 13 for the control and sensitivity experiments. All simulations produce a relative maximum in ZKu immediately below initialization at 5.5 associated with the updraft and concentration of ice mass, followed by a continuous reduction in ZKu with descent thereafter, which is consistent with the observations (Fig. 10). A distinct variation in the rate of change in ZKu with height occurs at 5 as a result of the initial onset of riming. Below 5 , ZKu in the RH-perturbed environments becomes increasingly differentiated from the control with descent (Fig. 13a). At 3.6 , ZKu was reduced in the dry simulation by 1.5 dB and increased in the moist simulation by 1.6 dB relative to the control (Table 3). To provide context for these results, we estimate the liquid-equivalent precipitation rate at 3.6 Reducing RH by ∼ 1 % to 2 % in the dry simulation yielded a precipitation rate decrease of ∼ 24 %, whereas similarly increasing RH yielded a precipitation rate increase of ∼ 33 % (Table 3). Thus, modification of the precipitation rate owing to differential ice losses by sublimation as a result of perturbed RH below the generating cell layer has a direct implication on the rate of change in ZKu with height. Perturbations in w produced a greater range of ZKu variation aloft, within the updraft region, although, by 3.6 , the downdraft and updraft simulations are nearly indistinguishable from the control (Fig. 13b). Similarly, the precipitation rate at 3.6 is not meaningfully affected by perturbation in w (Table 3).
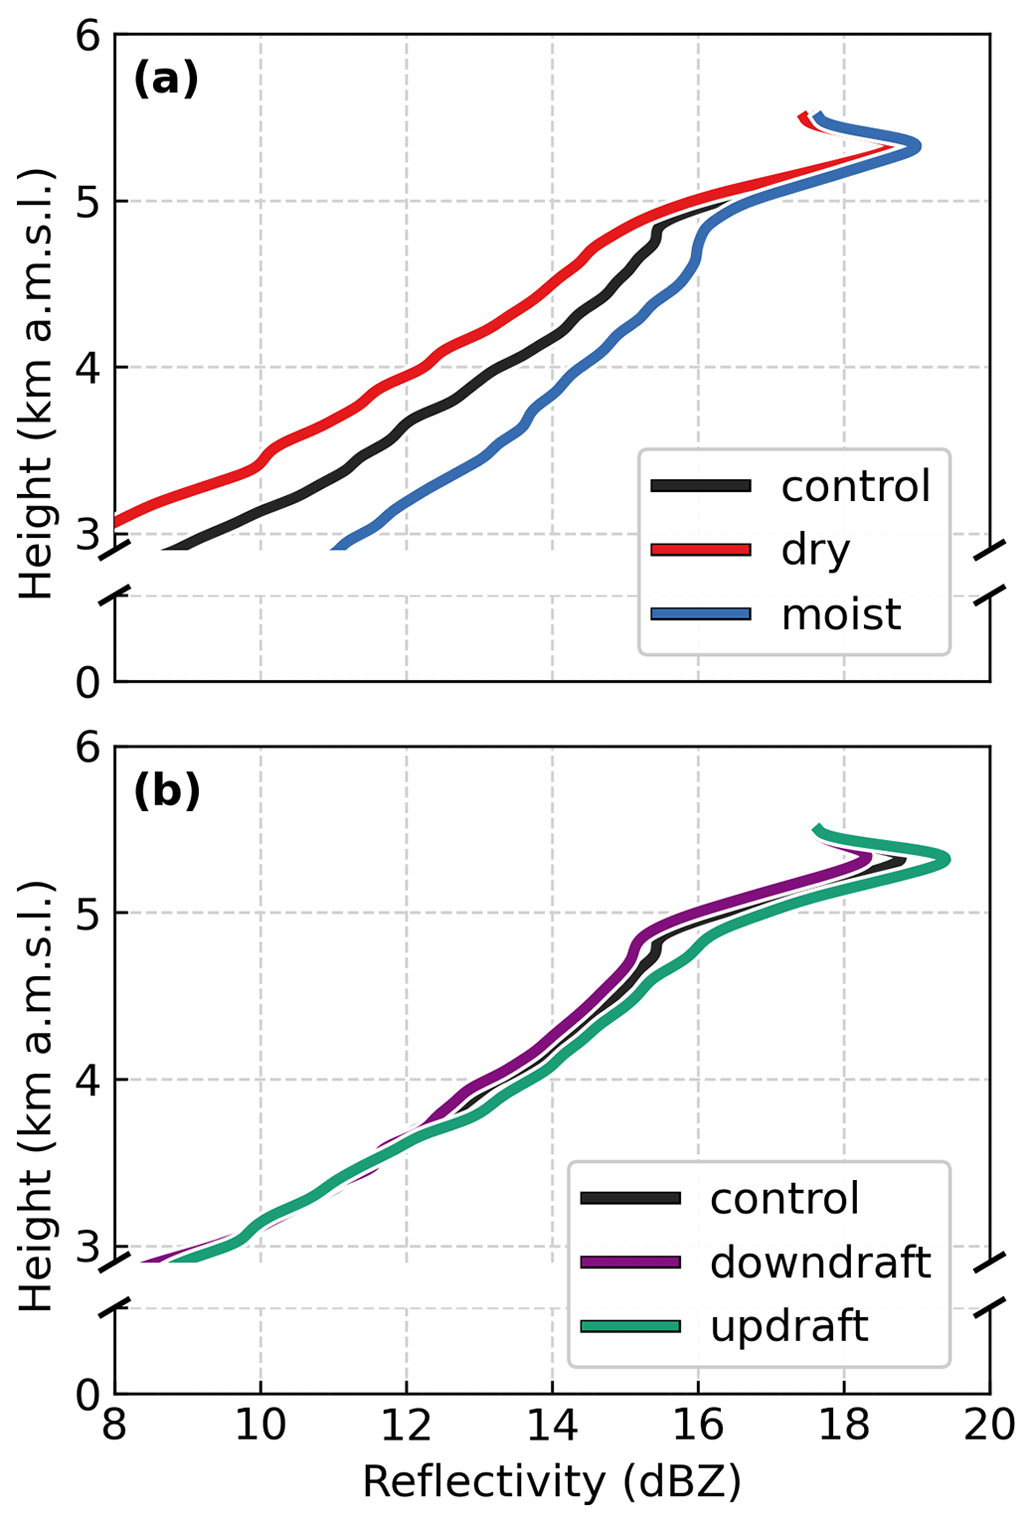
Figure 13Ku-band radar reflectivity profiles for the (a) dry- and moist-perturbed and (b) updraft- and downdraft-perturbed sensitivity simulations relative to the control simulation.
The insensitivity of the precipitation rate to perturbations in w indicates that precipitation flux through the subsaturated ice layer is more strongly governed by the characteristic IWC preserved throughout the layer than by changes in the sedimentation rate of the ice particles. This principle is similarly expressed by the simulated vertical profiles of VD_Ku (Fig. 14). Whereas relative to the control simulation, perturbations in RH produced substantial differentiation in ZKu and, ultimately, in the precipitation rate at 3.6 , a much smaller range of differentiation occurs for VD_Ku (Fig. 14a). At 3.6 , VD_Ku in the dry and moist simulations is within 0.02 m s−1 of the control simulation (−1.51 m s−1). Similarly, while the updraft and downdraft simulations appear to produce VD_Ku profiles that are distinct from the control (Fig. 14b), the magnitude of difference throughout the ice layer is explained by the magnitude of perturbation in w rather than a change in the particles' intrinsic Vt through perturbed microphysical evolution.
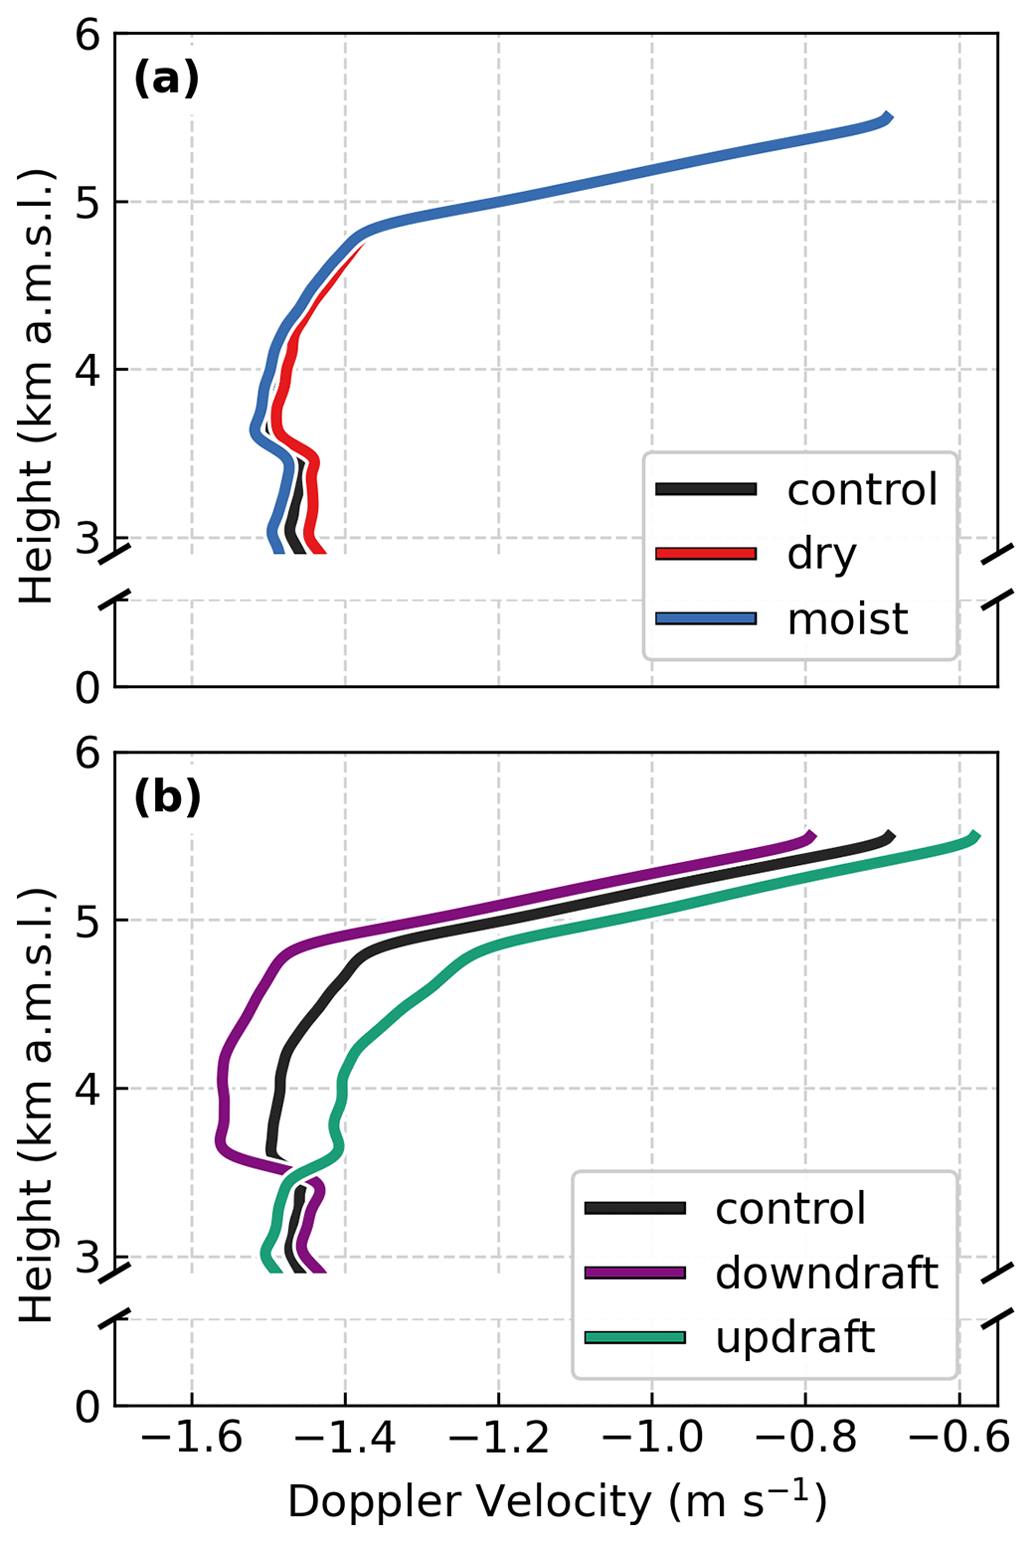
Figure 14Radar Doppler velocity profiles for the (a) dry- and moist-perturbed and (b) updraft- and downdraft-perturbed sensitivity simulations relative to the control simulation at the Ku band.
Despite the decaying stage of the winter storm, modest yet locally enhanced surface precipitation rates (∼ 1 mm h−1) were sustained at the banded region by precipitation fallout from the relatively high median characteristic IWC (0.540 g m−3) in the generating cell layer. Within updraft regions of generating cell layers, airborne observations have revealed enhancements in IWC (e.g., Houze et al., 1981; Plummer et al., 2014) and LWC (e.g., Wolde and Vali, 2001; Evans et al., 2005; Ikeda et al., 2007; Plummer et al., 2014). These generating cell layers are therefore a source region for significant precipitation enhancements in ambient environments supportive of particle growth in the fallout region below. Indeed, prior studies have found that a majority of IWC accumulation occurs below generating cell layers through vapor deposition and aggregation (e.g., Herzegh and Hobbs, 1980; Plummer et al., 2014), two processes that were notably absent in the fallout region of the banded cloud on 4 February. Thus, contrasting with the precipitation pathways more commonly associated with generating cells, the dominant microphysical process between the generating cell layer and the melting level was sublimation, which yielded a substantial (> 70 %) loss in the characteristic IWC.
The primary determinant for the rate of precipitation fallout from the banded cloud contributing to surface enhancements was the amount of ice mass preserved through the subsaturated layer. Sensitivity simulations demonstrated that, within this subsaturated environment, particle evolution and its fallout have strong dependencies on the ambient RH (Fig. 11) but weak dependencies on w (Fig. 12) when independently assessed over an equivalent range of observed variation. The intrinsic evolution of particle Vt during sublimation and, subsequently, riming contributes an outsized effect on precipitation fallout relative to perturbations of the ambient w, which affect the sedimentation rate. Nonetheless, the w profile being characterized by a median-state updraft in the generating cell layer and intermittent updraft regions within the overall descent below were necessary in establishing conditions favorable for the riming that was observed in the particle imagery. Although riming was not evident among particles within the generating cell layer at 5.5 , rimed particles were prevalent at 4.9 and below, albeit heterogeneously distributed. Provided by a supply of supercooled liquid water in updraft regions, riming is an efficient growth process for precipitation within and below the generating cell (e.g., Houze et al., 1981; Plummer et al., 2014; Kumjian et al., 2014). Rime accumulation appears to have had a prominent effect on the characteristic IWC. In the control run simulation, approximately 33 % of the characteristic IWC at 3.6 was attributable to rime accumulation. This contribution may even be underrepresented by the model based on the smaller characteristic IWC in the simulation at 3.6 and the increase in characteristic IWC from 4.2 to 3.6 in the observations that was not reproduced in the simulation.
The resultant microphysical evolutionary pathways for particles within the banded region and the southerly displaced region of enhanced reflectivity (Fig. 1) substantially differ. Riming was prevalent in both regions, but to varied degrees. In the offshore region, DeLaFrance et al. (2024b) identified robust particle growth by widespread riming that was enhanced by a highly efficient, concurrent aggregation process. Consequently, despite a similar but reduced magnitude of composite reflectivity (Fig. 1), simulated precipitation rates in the offshore region were over 2.5 times greater (1.77 mm h−1) than those simulated for the banded region (0.66 mm h−1). These differences are demonstrative of the implications of process-based modulation of microphysical properties, which remain challenging to constrain in remote sensing retrievals, and underscores the need for ice-phase process discrimination in radar measurements.
In the present study, sensitivity simulations were used to quantify the imprint of sublimation on vertical profiles of ZKu and VD_Ku. We found that the vertical profiles of ZKu demonstrate a substantial sensitivity (∼ ± 1.5 dB) to varied rates of sublimation characteristic IWC loss from perturbed RH environments (Fig. 13, Table 3), whereas VD_Ku is relatively insensitive to these perturbations (Fig. 14). Perturbations in w increase or decrease the magnitude of VD_Ku, but the rate of VD_Ku was dominated by the significantly greater median-state magnitude differences between the updraft and downdraft regions. Whereas VD_Ku was previously shown to be especially sensitive to riming-based variabilities (DeLaFrance et al., 2024b), in the present study, it provided no independent quantitative value towards differentiating the effects of sublimation (Fig. 14). Although not evaluated here, this finding likely extends to differentiation of the effects of depositional growth but for increasing ZKu with descent. In this scenario, an equivalent sensitivity of ZKu but not VD_Ku to depositional growth is analogous to the effects of aggregation (DeLaFrance et al., 2024b). A similar ambiguity in the process-based distinction between depositional growth and aggregation exists for multi-frequency radar techniques, as scattering models have shown that dendritic and complex aggregation particles occupy similar dual- and triple-frequency radar scattering signatures (e.g., Petty and Huang, 2010; Kneifel et al., 2011; Leinonen and Moisseev, 2015). Thus, discrimination between either low-density dendritic or complex aggregate particle types or between deposition- or aggregation-dominant growth from remote sensing measurements is likely to remain a challenge.
Mesoscale band development within winter storms is typically accompanied by enhanced – and, often, high-impact – surface precipitation rates over confined regions. The microphysical properties of the ice-phase particles within these banded regions remain poorly represented by numerical models and challenging to constrain in radar remote sensing retrievals, owing in part to an incomplete understanding of the diverse microphysical pathways for banded precipitation evolution. Addressing a need for more observations within clouds, the IMPACTS campaign deployed cloud-penetrating P-3 and overflying ER-2 aircraft to measure properties of a mesoscale banded region of a northeastern US winter storm on 4 February 2022. During the ∼ 3 h period that IMPACTS executed semi-Lagrangian sampling of the banded region, the storm exhibited an apparent state of decay, weakening in composite radar reflectivity intensity yet maintaining a banded structure. This paper aimed to characterize the evolutionary pathways for precipitation within the decaying-stage banded region, assess those implications for surface precipitation, quantify sensitivities to ambient environmental properties, and determine the imprint of microphysical process-based evolution on radar remote sensing measurements.
Surface precipitation along the band was associated with clouds that formed along a stationary frontal boundary having a weak generating cell layer from ∼ 6 to 5 (w = ∼ 0.6 m s−1) and precipitation fallstreaks between ∼ 5 and the melting level, near 3 The fallout region between the generating cell layer and melting level was characterized by a weak downdraft (w < ∼ −0.1 m s−1) and subsaturated (RH = ∼ 80 % to 83 %) ambient environment. Particle imagery at all heights showed evidence of sublimation; however, riming was also present in heterogeneously distributed regions of a mixed-phase layer extending to ∼ 5 We observed very little evidence of aggregation.
Quasi-idealized 1D model simulations using the Lagrangian-particle-based McSnow model were designed from observational constraints with prescriptive ambient environments. The observed reduction in characteristic IWC, particle sizes, and ZKu with descent through the ∼ 2 km deep fallout layer were reasonably reproduced by the control simulation and provided confidence in the modeled representation of precipitating particle evolution within the observed cloud. We designed four sensitivity simulations to elucidate evolutionary dependencies on ambient cloud moisture and vertical air motions based on perturbations in the prescribed RH and w profiles defined by the IQR of variability. From these sensitivity simulations, we quantified sensitivities of particle growth and decay to ambient environmental properties and estimated downward mass flux to determine the implications on precipitation fallout within the banded region. Finally, these sensitivity simulations were used to determine the process-based imprint on remote sensing measurements of ZKu and VD_Ku within this unique environment of the decay-state banded cloud. Collectively, the control simulation and four sensitivity simulations have supported the following conclusions:
-
Enhanced surface precipitation rates during the passage of the mesoscale band resulted from relatively high characteristic IWC formed within a generating cell layer that produced ice-phase precipitation fallout within a descending layer below the generating cells.
-
The ambient environment of the frontal cloud supported a dominant ice-phase microphysical evolution by sublimation and, secondarily, riming processes to yield a net characteristic IWC loss exceeding 70 % within the subsaturated fallout layer.
-
Perturbations in ambient RH (∼ 2 %) yielded a substantial change in the characteristic IWC preserved throughout the subsaturated layer (−26 % to 29 %) and in the liquid-equivalent precipitation rate (−24 % to 33 %); relative to RH, w-based perturbations (∼ 0.1 m s−1) yielded a substantially decreased range of variability in the characteristic IWC (< 2.5 %) and precipitation rate (< 4.5 %).
-
Vertical profiles of ZKu were strongly dependent on RH-perturbed rates of sublimation characteristic IWC loss throughout the cloud but dependent on w-perturbed sedimentation rates only in the updraft region; vertical profiles of VD_Ku demonstrated negligible microphysical process-based sensitivity.
The 4 February 2022 winter storm event provided a unique natural laboratory for assessing process-based implications for ice-phase precipitation evolutionary pathways within winter storms for several reasons. The winter storm was characterized by two distinct regions of enhanced reflectivity with diverse surface precipitation rates owing to their unique microphysical pathways. These regions were well sampled by aircraft during the IMPACTS field campaign, providing crucial coincident in situ and remote sensing measurements with approximately Lagrangian spatial and temporal context. The offshore region of enhanced reflectivity, which lacked well-defined banding, experienced sustained particle growth above the melting level dominated by riming (DeLaFrance et al., 2024b). The banded region to the north was more strongly affected by the decaying stage of the storm from an intrusion of subsaturated air throughout the ice-phase layer of cloud. Consequently, particle growth was unsupported by the ambient environment of the banded region, and ice loss through sublimation was a dominant microphysical pathway. For each region, the storm's observed characteristics supported the isolation of a microphysical process (i.e., riming or sublimation) in modeling sensitivity simulations to assess their unique implications for surface precipitation and sensitivities to ambient environmental properties. Results presented in the present study and DeLaFrance et al. (2024b) provide new quantitative insights on the imprint of microphysical processes on radar remote sensing measurements with application towards future retrieval algorithm development, especially among algorithms incorporating Doppler velocity measurements. Additionally, these studies provide a framework of observational constraint and validation for future quasi-idealized Lagrangian and particle-based modeling studies to further quantify the unique implications of process-based microphysical evolution within diverse winter storm environments.
IMPACTS data are publicly available through the NASA Distributed Active Archive Center (https://doi.org/10.5067/IMPACTS/DATA101, McMurdie et al., 2019). Specific IMPACTS datasets used for the analysis include NCAR Particle Probes (https://doi.org/10.5067/IMPACTS/PROBES/DATA101, Bansemer et al., 2022), Particle Habit Imaging and Polar Scattering Probe (https://doi.org/10.5067/IMPACTS/PHIPS/DATA101, Schnaiter, 2022), P-3 Meteorological and Navigation Data (https://doi.org/10.5067/IMPACTS/P3/DATA101, Yang-Martin and Bennett, 2022), Automated Surface Observing System (https://doi.org/10.5067/IMPACTS/ASOS/DATA101, Brodzik, 2022a), High Altitude Imaging Wind and Rain Airborne Profiler (https://doi.org/10.5067/IMPACTS/HIWRAP/DATA101, McLinden et al., 2022), Turbulent Air Motion Measurement System (https://doi.org/10.5067/IMPACTS/TAMMS/DATA101, Thornhill, 2022), Multi-Radar/Multi-Sensor (MRMS) Precipitation Reanalysis for Satellite Validation Product (https://doi.org/10.5067/IMPACTS/MRMS/DATA101, Brodzik, 2022b), and NOAA Soundings (https://doi.org/10.5067/IMPACTS/SOUNDING/DATA201, Waldstreicher and Brodzik, 2022).
All authors contributed to decisions on methodologies applied throughout the study. AD performed the data analysis, conducted the modeling simulations, and processed the model output. All the authors contributed to interpretations and assessed the implications of the results. AD prepared the paper with contributions from all the co-authors.
The contact author has declared that none of the authors has any competing interests.
Publisher's note: Copernicus Publications remains neutral with regard to jurisdictional claims made in the text, published maps, institutional affiliations, or any other geographical representation in this paper. While Copernicus Publications makes every effort to include appropriate place names, the final responsibility lies with the authors.
The authors acknowledge the IMPACTS team for their dedicated efforts in the collection and curation of the unique and exceptionally high-quality IMPACTS dataset. The authors also thank Aaron Bansemer for several helpful discussions regarding the interpretations and limitations of the processed microphysics probe data. Andrew DeLaFrance acknowledges NSF NCAR for resources provided to visit its Mesoscale and Microscale Meteorology Laboratory (host Andrew J. Heymsfield), supporting the initial study conceptualization and design. We are grateful for the feedback received from the three anonymous reviewers, which helped us to greatly improve this paper.
This research was supported by the National Aeronautics and Space Administration (grant nos. 80NSSC21K1589, 80NSSC19K0338, and 80NSSC19K0397). Andrew J. Heymsfield is supported by the National Science Foundation.
This paper was edited by Greg McFarquhar and reviewed by three anonymous referees.
Bansemer, A., Delene, D., Heymsfield, A., and OBrien, J.: NCAR Particle Probes IMPACTS, NASA Global Hydrometeorology Resource Center DAAC [data set], Huntsville, Alabama, USA, https://doi.org/10.5067/IMPACTS/PROBES/DATA101, 2022.
Benjamin, S. G., Weygandt, S. S., Brown, J. M., Hu, M., Alexander, C. R., Smirnova, T. G., Olson, J. B., James, E. P., Dowell, D. C., Grell, G. A., Lin, H., Peckham, S. E., Smith, T. L., Moninger, W. R., Kenyon, J. S., and Manikin, G. S.: A North American Hourly Assimilation and Model Forecast Cycle: The Rapid Refresh, Mon. Weather Rev., 144, 1669–1694, https://doi.org/10.1175/MWR-D-15-0242.1, 2016.
Boucher, R. J. and Wieler, J. G.: Radar Determination of Snowfall Rate and Accumulation, J. Appl. Meteorol. Clim., 24, 68–73, https://doi.org/10.1175/1520-0450(1985)024<0068:RDOSRA>2.0.CO;2, 1985.
Brdar, S. and Seifert, A.: McSnow: A Monte-Carlo Particle Model for Riming and Aggregation of Ice Particles in a Multidimensional Microphysical Phase Space, J. Adv. Model Earth Sy., 10, 187–206, https://doi.org/10.1002/2017MS001167, 2018.
Bringi, V., Seifert, A., Wu, W., Thurai, M., Huang, G.-J., and Siewert, C.: Hurricane Dorian Outer Rain Band Observations and 1D Particle Model Simulations: A Case Study, Atmosphere, 11, 879, https://doi.org/10.3390/atmos11080879, 2020.
Brodzik, S.: Automated Surface Observing System (ASOS) IMPACTS, NASA Global Hydrometeorology Resource Center DAAC [data set], Huntsville, Alabama, USA, https://doi.org/10.5067/IMPACTS/ASOS/DATA101, 2022a.
Brodzik, S.: Multi-Radar/Multi-Sensor (MRMS) Precipitation Reanalysis for Satellite Validation Product IMPACTS, NASA Global Hydrometeorology Resource Center DAAC [data set], Huntsville, Alabama, USA, https://doi.org/10.5067/IMPACTS/MRMS/DATA101, 2022b.
Brown, P. R. A. and Francis, P. N.: Improved Measurements of the Ice Water Content in Cirrus Using a Total-Water Probe, J. Atmos. Ocean. Tech., 12, 410–414, https://doi.org/10.1175/1520-0426(1995)012<0410:IMOTIW>2.0.CO;2, 1995.
Chase, R. J., Nesbitt, S. W., and McFarquhar, G. M.: Evaluation of the Microphysical Assumptions within GPM-DPR Using Ground-Based Observations of Rain and Snow, Atmosphere, 11, 619, https://doi.org/10.3390/atmos11060619, 2020.
Chase, R. J., Nesbitt, S. W., McFarquhar, G. M., Wood, N. B., and Heymsfield, G. M.: Direct Comparisons between GPM-DPR and CloudSat Snowfall Retrievals, J. Appl. Meteorol. Clim., 61, 1257–1271, https://doi.org/10.1175/JAMC-D-21-0081.1, 2022.
Colle, B. A., Stark, D., and Yuter, S. E.: Surface Microphysical Observations within East Coast Winter Storms on Long Island, New York, Mon. Weather Rev., 142, 3126–3146, https://doi.org/10.1175/MWR-D-14-00035.1, 2014.
Colle, B. A., Yeh, P., Finlon, J. A., McMurdie, L., McDonald, V., and DeLaFrance, A.: An Investigation of a Northeast U. S. Cyclone Event without Well-Defined Snow Banding during IMPACTS, Mon. Weather Rev., 151, 2465–2484, https://doi.org/10.1175/MWR-D-22-0296.1, 2023.
Connolly, P. J., Emersic, C., and Field, P. R.: A laboratory investigation into the aggregation efficiency of small ice crystals, Atmos. Chem. Phys., 12, 2055–2076, https://doi.org/10.5194/acp-12-2055-2012, 2012.
DeLaFrance, A., McMurdie, L. A., Rowe, A. K., and Conrick, R.: Effects of Riming on Ice-Phase Precipitation Growth and Transport Over an Orographic Barrier, J. Adv. Model Earth Sy., 16, e2023MS003778, https://doi.org/10.1029/2023MS003778, 2024a.
DeLaFrance, A., McMurdie, L. A., Rowe, A. K., and Heymsfield, A. J.: Simulated particle evolution within a winter storm: contributions of riming to radar moments and precipitation fallout, Atmos. Chem. Phys., 24, 11191–11206, https://doi.org/10.5194/acp-24-11191-2024, 2024b.
Dunnavan, E. L., Carlin, J. T., Schvartzman, D., Ryzhkov, A. V., Bluestein, H., Emmerson, S., McFarquhar, G. M., Heymsfield, G. M., and Yorks, J.: High-Resolution Snowstorm Measurements and Retrievals Using Cross-Platform Multi-Frequency and Polarimetric Radars, Geophys. Res. Lett., 50, e2023GL103692, https://doi.org/10.1029/2023GL103692, 2023.
Evans, A. G., Locatelli, J. D., Stoelinga, M. T., and Hobbs, P. V.: The IMPROVE-1 Storm of 1–2 February 2001. Part II: Cloud Structures and the Growth of Precipitation, J. Atmos. Sci., 62, 3456–3473, https://doi.org/10.1175/JAS3547.1, 2005.
Finlon, J. A., McMurdie, L. A., and Chase, R. J.: Investigation of Microphysical Properties within Regions of Enhanced Dual-Frequency Ratio during the IMPACTS Field Campaign, J. Atmos. Sci., 79, 2773–2795, https://doi.org/10.1175/JAS-D-21-0311.1, 2022.
Fujiyoshi, Y., Endoh, T., Yamada, T., Tsuboki, K., Tachibana, Y., and Wakahama, G.: Determination of a Z – R Relationship for Snowfall Using a Radar and High Sensitivity Snow Gauges, J. Appl. Meteorol., 29, 147–152, https://doi.org/10.1175/1520-0450(1990)029<0147:DOARFS>2.0.CO;2, 1990.
Ganetis, S. A., Colle, B. A., Yuter, S. E., and Hoban, N. P.: Environmental Conditions Associated with Observed Snowband Structures within Northeast U. S. Winter Storms, Mon. Weather Rev., 146, 3675–3690, https://doi.org/10.1175/MWR-D-18-0054.1, 2018.
Grecu, M., Olson, W. S., Munchak, S. J., Ringerud, S., Liao, L., Haddad, Z., Kelley, B. L., and McLaughlin, S. F.: The GPM Combined Algorithm, J. Atmos. Ocean Tech., 33, 2225–2245, https://doi.org/10.1175/JTECH-D-16-0019.1, 2016.
Herzegh, P. H. and Hobbs, P. V.: The Mesoscale and Microscale Structure and Organization of Clouds and Precipitation in Midlatitude Cyclones. II: Warm-Frontal Clouds, J. Atmos. Sci., 37, 597–611, https://doi.org/10.1175/1520-0469(1980)037<0597:TMAMSA>2.0.CO;2, 1980.
Heymsfield, A., Bansemer, A., Heymsfield, G., Noone, D., Grecu, M., and Toohey, D.: Relationship of Multiwavelength Radar Measurements to Ice Microphysics from the IMPACTS Field Program, J. Appl. Meteorol. Clim., 62, 289–315, https://doi.org/10.1175/JAMC-D-22-0057.1, 2023.
Heymsfield, A. J. and Westbrook, C. D.: Advances in the Estimation of Ice Particle Fall Speeds Using Laboratory and Field Measurements, J. Atmos. Sci., 67, 2469–2482, https://doi.org/10.1175/2010JAS3379.1, 2010.
Heymsfield, A. J., Matrosov, S. Y., and Wood, N. B.: Toward Improving Ice Water Content and Snow-Rate Retrievals from Radars. Part I: X and W Bands, Emphasizing CloudSat, J. Appl. Meteorol. Clim., 55, 2063–2090, https://doi.org/10.1175/JAMC-D-15-0290.1, 2016.
Houze, R. A., Rutledge, S. A., Matejka, T. J., and Hobbs, P. V.: The Mesoscale and Microscale Structure and Organization of Clouds and Precipitation in Midlatitude Cyclones. III: Air Motions and Precipitation Growth in a Warm-Frontal Rainband, J. Atmos. Sci., 38, 639–649, https://doi.org/10.1175/1520-0469(1981)038<0639:TMAMSA>2.0.CO;2, 1981.
Ikeda, K., Rasmussen, R. M., Hall, W. D., and Thompson, G.: Observations of Freezing Drizzle in Extratropical Cyclonic Storms during IMPROVE-2, J. Atmos. Sci., 64, 3016–3043, https://doi.org/10.1175/JAS3999.1, 2007.
Jensen, A. A. and Harrington, J. Y.: Modeling Ice Crystal Aspect Ratio Evolution during Riming: A Single-Particle Growth Model, J. Atmos. Sci., 72, 2569–2590, https://doi.org/10.1175/JAS-D-14-0297.1, 2015.
Kalesse, H., Szyrmer, W., Kneifel, S., Kollias, P., and Luke, E.: Fingerprints of a riming event on cloud radar Doppler spectra: observations and modeling, Atmos. Chem. Phys., 16, 2997–3012, https://doi.org/10.5194/acp-16-2997-2016, 2016.
Keeler, J. M., Jewett, B. F., Rauber, R. M., McFarquhar, G. M., Rasmussen, R. M., Xue, L., Liu, C., and Thompson, G.: Dynamics of Cloud-Top Generating Cells in Winter Cyclones. Part I: Idealized Simulations in the Context of Field Observations, J. Atmos. Sci., 73, 1507–1527, https://doi.org/10.1175/JAS-D-15-0126.1, 2016.
Kneifel, S., Kulie, M. S., and Bennartz, R.: A Triple-Frequency Approach to Retrieve Microphysical Snowfall Parameters, J. Geophys. Res.-Atmos., 116, D11203, https://doi.org/10.1029/2010JD015430, 2011.
Kneifel, S., Von Lerber, A., Tiira, J., Moisseev, D., Kollias, P., and Leinonen, J.: Observed Relations Between Snowfall Microphysics and Triple-Frequency Radar Measurements, J. Geophys. Res.-Atmos., 120, 6034–6055, https://doi.org/10.1002/2015JD023156, 2015.
Kumjian, M. R., Rutledge, S. A., Rasmussen, R. M., Kennedy, P. C., and Dixon, M.: High-Resolution Polarimetric Radar Observations of Snow-Generating Cells, J. Appl. Meteorol. Clim., 53, 1636–1658, https://doi.org/10.1175/JAMC-D-13-0312.1, 2014.
Lawson, P., Gurganus, C., Woods, S., and Bruintjes, R.: Aircraft Observations of Cumulus Microphysics Ranging from the Tropics to Midlatitudes: Implications for a “New” Secondary Ice Process, J. Atmos. Sci., 74, 2899–2920, https://doi.org/10.1175/JAS-D-17-0033.1, 2017.
Lawson, R. P., Stewart, R. E., Strapp, J. W., and Isaac, G. A.: Aircraft Observations of the Origin and Growth of Very Large Snowflakes, Geophys. Res. Lett., 20, 53–56, https://doi.org/10.1029/92GL02917, 1993.
Leinonen, J.: High-Level Interface to T-Matrix Scattering Calculations: Architecture, Capabilities and Limitations, Opt. Express, 22, 1655, https://doi.org/10.1364/OE.22.001655, 2014.
Leinonen, J. and Moisseev, D.: What do Triple-Frequency Radar Signatures Reveal about Aggregate Snowflakes?, J. Geophys. Res.-Atmos., 120, 229–239, https://doi.org/10.1002/2014JD022072, 2015.
Leinonen, J. and Szyrmer, W.: Radar Signatures of Snowflake Riming: A Modeling Study, Earth Space Sci., 2, 346–358, https://doi.org/10.1002/2015EA000102, 2015.
Li, L., Heymsfield, G., Carswell, J., Schaubert, D. H., McLinden, M. L., Creticos, J., Perrine, M., Coon, M., Cervantes, J. I., Vega, M., Guimond, S., Tian, L., and Emory, A.: The NASA High-Altitude Imaging Wind and Rain Airborne Profiler, IEEE T. Geosci. Remote, 54, 298–310, https://doi.org/10.1109/TGRS.2015.2456501, 2016.
Locatelli, J. D. and Hobbs, P. V.: Fall Speeds and Masses of Solid Precipitation Particles, J. Geophys. Res., 79, 2185–2197, https://doi.org/10.1029/JC079i015p02185, 1974.
Marshall, J. S. and Palmer, W. M. K.: The Distribution of Raindrops With Size, J. Meteorol., 5, 165–166, https://doi.org/10.1175/1520-0469(1948)005<0165:TDORWS>2.0.CO;2, 1948.
Mason, S. L., Chiu, C. J., Hogan, R. J., Moisseev, D., and Kneifel, S.: Retrievals of Riming and Snow Density from Vertically Pointing Doppler Radars, J. Geophys. Res.-Atmos., 123, 13807–13834, https://doi.org/10.1029/2018JD028603, 2018.
Mason, S. L., Hogan, R. J., Westbrook, C. D., Kneifel, S., Moisseev, D., and von Terzi, L.: The importance of particle size distribution and internal structure for triple-frequency radar retrievals of the morphology of snow, Atmos. Meas. Tech., 12, 4993–5018, https://doi.org/10.5194/amt-12-4993-2019, 2019.
Matrosov, S. Y., Korolev, A., Wolde, M., and Nguyen, C.: Sizing ice hydrometeor populations using the dual-wavelength radar ratio, Atmos. Meas. Tech., 15, 6373–6386, https://doi.org/10.5194/amt-15-6373-2022, 2022.
McLinden, M., Li, Lihua, and Heymsfield, Gerald M.: High Altitude Imaging Wind and Rain Airborne Profiler (HIWRAP) IMPACTS, NASA Global Hydrometeorology Resource Center DAAC [data set], Huntsville, Alabama, USA, https://doi.org/10.5067/IMPACTS/HIWRAP/DATA101, 2022.
McMurdie, L. A., Heymsfield, G., Yorks, J. E., and Braun, S. A.: Investigation of Microphysics and Precipitation for Atlantic Coast-Threatening Snowstorms (IMPACTS) Collection, NASA Global Hydrometeorology Resource Center DAAC [data set], Huntsville, Alabama, USA, https://doi.org/10.5067/IMPACTS/DATA101, 2019.
McMurdie, L. A., Heymsfield, G. M., Yorks, J. E., Braun, S. A., Skofronick-Jackson, G., Rauber, R. M., Yuter, S., Colle, B., McFarquhar, G. M., Poellot, M., Novak, D. R., Lang, T. J., Kroodsma, R., McLinden, M., Oue, M., Kollias, P., Kumjian, M. R., Greybush, S. J., Heymsfield, A. J., Finlon, J. A., McDonald, V. L., and Nicholls, S.: Chasing Snowstorms: The Investigation of Microphysics and Precipitation for Atlantic Coast-Threatening Snowstorms (IMPACTS) Campaign, B. Am. Meteorol. Soc., 103, E1243–E1269, https://doi.org/10.1175/BAMS-D-20-0246.1, 2022a.
McMurdie, L. A., Finlon, J. A., Heymsfield, G. M., and Yorks, J. E.: Investigation of Microphysics and Precipitation for Atlantic Coast Threatening Snowstorms (Impacts): The 2022 Deployment, in: IGARSS 2022 – 2022 IEEE International Geoscience and Remote Sensing Symposium, 17-22 July 2022, Kuala Lumpur, Malaysia, IEEE, 4461–4464, https://doi.org/10.1109/IGARSS46834.2022.9883693, 2022b.
Miller, J. E.: On the Concept of Frontogenesis, J. Meteorol., 5, 169–171, https://doi.org/10.1175/1520-0469(1948)005<0169:OTCOF>2.0.CO;2, 1948.
Mitchell, D. L.: Use of Mass- and Area-Dimensional Power Laws for Determining Precipitation Particle Terminal Velocities, J. Atmos. Sci., 53, 1710–1723, https://doi.org/10.1175/1520-0469(1996)053<1710:UOMAAD>2.0.CO;2, 1996.
Morrison, H., Van Lier-Walqui, M., Fridlind, A. M., Grabowski, W. W., Harrington, J. Y., Hoose, C., Korolev, A., Kumjian, M. R., Milbrandt, J. A., Pawlowska, H., Posselt, D. J., Prat, O. P., Reimel, K. J., Shima, S., Van Diedenhoven, B., and Xue, L.: Confronting the Challenge of Modeling Cloud and Precipitation Microphysics, J. Adv. Model Earth Sy., 12, e2019MS001689, https://doi.org/10.1029/2019MS001689, 2020.
Nelson, J.: Sublimation of Ice Crystals, J. Atmos. Sci., 55, 910–919, https://doi.org/10.1175/1520-0469(1998)055<0910:SOIC>2.0.CO;2, 1998.
Novak, D. R., Bosart, L. F., Keyser, D., and Waldstreicher, J. S.: An Observational Study of Cold Season–Banded Precipitation in Northeast U. S. Cyclones, Weather Forecast., 19, 993–1010, https://doi.org/10.1175/815.1, 2004.
Novak, D. R., Waldstreicher, J. S., Keyser, D., and Bosart, L. F.: A Forecast Strategy for Anticipating Cold Season Mesoscale Band Formation within Eastern U. S. Cyclones, Weather Forecast., 21, 3–23, https://doi.org/10.1175/WAF907.1, 2006.
Novak, D. R., Colle, B. A., and Yuter, S. E.: High-Resolution Observations and Model Simulations of the Life Cycle of an Intense Mesoscale Snowband over the Northeastern United States, Mon. Weather Rev., 136, 1433–1456, https://doi.org/10.1175/2007MWR2233.1, 2008.
Petty, G. W. and Huang, W.: Microwave Backscatter and Extinction by Soft Ice Spheres and Complex Snow Aggregates, J. Atmos. Sci., 67, 769–787, https://doi.org/10.1175/2009JAS3146.1, 2010.
Plummer, D. M., McFarquhar, G. M., Rauber, R. M., Jewett, B. F., and Leon, D. C.: Structure and Statistical Analysis of the Microphysical Properties of Generating Cells in the Comma Head Region of Continental Winter Cyclones, J. Atmos. Sci., 71, 4181–4203, https://doi.org/10.1175/JAS-D-14-0100.1, 2014.
Pruppacher, H. R. and Klett, J. D.: Microphysics Of Clouds And Precipitation, 2nd rev. and enl. ed., Kluwer Academic Publishers, Dordrecht, Boston, 954 pp., https://doi.org/10.1007/978-0-306-48100-0, 1997.
Rauber, R. M. and Tokay, A.: An Explanation for the Existence of Supercooled Water at the Top of Cold Clouds, J. Atmos. Sci., 48, 1005–1023, https://doi.org/10.1175/1520-0469(1991)048<1005:AEFTEO>2.0.CO;2, 1991.
Rosenow, A. A., Plummer, D. M., Rauber, R. M., McFarquhar, G. M., Jewett, B. F., and Leon, D.: Vertical Velocity and Physical Structure of Generating Cells and Convection in the Comma Head Region of Continental Winter Cyclones, J. Atmos. Sci., 71, 1538–1558, https://doi.org/10.1175/JAS-D-13-0249.1, 2014.
Roy, P., Rauber, R. M., and Di Girolamo, L.: A Closer Look at the Evolution of Supercooled Cloud Droplet Temperature and Lifetime in Different Environmental Conditions with Implications for Ice Nucleation in the Evaporating Regions of Clouds, J. Atmos. Sci., 80, 2481–2501, https://doi.org/10.1175/JAS-D-22-0239.1, 2023.
Schnaiter, F. M.: Particle Habit Imaging and Polar Scattering Probe (PHIPS) IMPACTS, NASA Global Hydrometeorology Resource Center DAAC [data set], Huntsville, Alabama, USA, https://doi.org/10.5067/IMPACTS/PHIPS/DATA101, 2022.
Stark, D., Colle, B. A., and Yuter, S. E.: Observed Microphysical Evolution for Two East Coast Winter Storms and the Associated Snow Bands, Mon. Weather Rev., 141, 2037–2057, https://doi.org/10.1175/MWR-D-12-00276.1, 2013.
Thornhill, K. L.: Turbulent Air Motion Measurement System (TAMMS) IMPACTS, NASA Global Hydrometeorology Resource Center DAAC [data set], Huntsville, Alabama, USA, https://doi.org/10.5067/IMPACTS/TAMMS/DATA101, 2022.
Thornhill, K. L., Anderson, B. E., Barrick, J. D. W., Bagwell, D. R., Friesen, R., and Lenschow, D. H.: Air Motion Intercomparison Flights during Transport and Chemical Evolution in the Pacific (TRACE-P)/ACE-ASIA, J. Geophys. Res.-Atmos., 108, 2002JD003108, https://doi.org/10.1029/2002JD003108, 2003.
Waldstreicher, J. and Brodzik, S.: NOAA Sounding IMPACTS, NASA Global Hydrometeorology Resource Center DAAC [data set], Huntsville, Alabama, USA, https://doi.org/10.5067/IMPACTS/SOUNDING/DATA201, 2022.
Williams, C. R.: How Much Attenuation Extinguishes mm-Wave Vertically Pointing Radar Return Signals?, Remote Sens.-Basel, 14, 1305, https://doi.org/10.3390/rs14061305, 2022.
Wolde, M. and Vali, G.: Polarimetric Signatures from Ice Crystals Observed at 95 GHz in Winter Clouds. Part II: Frequencies of Occurrence, J. Atmos. Sci., 58, 842–849, https://doi.org/10.1175/1520-0469(2001)058<0842:PSFICO>2.0.CO;2, 2001.
Yang-Martin, M. and Bennett, R.: P-3 Meteorological and Navigation Data IMPACTS, NASA Global Hydrometeorology Resource Center DAAC [data set], Huntsville, Alabama, USA, https://doi.org/10.5067/IMPACTS/P3/DATA101, 2022.
Zaremba, T. J., Rauber, R. M., Heimes, K., Yorks, J. E., Finlon, J. A., Nicholls, S. D., Selmer, P., McMurdie, L. A., and McFarquhar, G. M.: Cloud-Top Phase Characterization of Extratropical Cyclones over the Northeast and Midwest United States: Results from IMPACTS, J. Atmos. Sci., 81, 341–361, https://doi.org/10.1175/JAS-D-23-0123.1, 2024.
Zhang, J., Howard, K., Langston, C., Vasiloff, S., Kaney, B., Arthur, A., Van Cooten, S., Kelleher, K., Kitzmiller, D., Ding, F., Seo, D.-J., Wells, E., and Dempsey, C.: National Mosaic and Multi-Sensor QPE (NMQ) System: Description, Results, and Future Plans, B. Am. Meteorol. Soc., 92, 1321–1338, https://doi.org/10.1175/2011BAMS-D-11-00047.1, 2011.
- Abstract
- Introduction
- Observations from a banded region of enhanced reflectivity during IMPACTS
- Properties of evolving ice-phase particles and their ambient environment
- Control simulation design and validation
- Ambient controls on particle evolution
- Discussion
- Conclusions
- Code and data availability
- Author contributions
- Competing interests
- Disclaimer
- Acknowledgements
- Financial support
- Review statement
- References