the Creative Commons Attribution 4.0 License.
the Creative Commons Attribution 4.0 License.
 | 28 Jul 2025
Enrichment of organic nitrogen in fog residuals observed in the Italian Po Valley
Fredrik Mattsson
Almuth Neuberger
Liine Heikkinen
Yvette Gramlich
Marco Paglione
Matteo Rinaldi
Stefano Decesari
Paul Zieger
Ilona Riipinen
While aerosol–cloud interactions have been extensively investigated, large knowledge gaps still exist. Atmospheric organic nitrogen (ON) species and their formation in the aqueous phase are potentially important due to (1) their influence on aerosol optical and hygroscopic properties and (2) their adverse effects on human health. This study aimed to characterize the wintertime aerosol and fog chemical composition, with a focus on the formation of ON, at a rural site in the Italian Po Valley. Online chemical characterization of interstitial aerosol (nonactivated particles) and fog residuals (dried fog droplets) were performed in parallel. Fog residuals were sampled using a ground-based counterflow virtual impactor (GCVI) inlet and analyzed by a soot particle aerosol mass spectrometer (SP-AMS), while the interstitial aerosol was characterized by a high-resolution time-of-flight AMS (HR-ToF-AMS). Our results revealed an enhancement of nitrate (; 43.3 % vs. 34.6 %), ammonium (; 15.2 % vs. 11.7 %), and sulfate (; 10.5 % vs. 6.6 %) in the fog residuals compared to the ambient non-fog aerosol, while organic aerosol (OA; 27.6 % vs. 39.4 %) and refractory black carbon (rBC; 2.3 % vs. 6.3 %) were less abundant. An enrichment of ON was observed in the fog, mainly consisting of ions, partly originating from amines in the fog. ions, fragments linked to imidazoles, were overproportionally present in the fog, which was verified by proton nuclear magnetic resonance (1H-NMR) spectroscopy, suggesting aqueous-phase formation. This study demonstrates that fogs and clouds are potentially important sinks for gaseous nitrogen species and media for the aqueous production of nitrogen-containing organic aerosol in the atmosphere.
- Article
(3001 KB) - Full-text XML
-
Supplement
(1596 KB) - BibTeX
- EndNote


Aerosol particles have a significant impact on clouds and fogs, resulting in a substantial indirect climate effect. However, these complex aerosol–cloud interactions are poorly constrained, especially at the microphysical scale (Szopa et al., 2021). The interactions of aerosol particles with fogs are largely analogous to the interactions with higher-altitude clouds. Fog droplets form by the condensation of water vapor onto aerosol particles, which act as cloud condensation nuclei (CCN). For radiation fog, this typically occurs overnight, as the near-surface air cools and becomes saturated with respect to water vapor. The physical and chemical properties of the activated CCN influence the properties of the fog, such as the number and size of the fog droplets, the fog life cycle, and the effect of fog on Earth's radiation budget (Jia et al., 2019; Duplessis et al., 2021).
Fog droplets can act as reactors for transforming both gases and aerosol particles through aqueous-phase reactions. For aerosol particles, this may result in an altered size, shape, and chemical composition as the fog dissipates (Ge et al., 2012; Seinfeld and Pandis, 2016). Organic aerosol (OA), which constitutes a significant mass fraction (20 %–80 %) of the atmospheric particulate matter overall (Zhang et al., 2007), has been shown to undergo chemical transformation in fog water (Mazzoleni et al., 2010; Ehrenhauser et al., 2012), with possible implications for aerosol reactivity and toxicity. Studying OA in the atmosphere poses significant challenges due to the vast range of different compounds (Goldstein and Galbally, 2007) and the continuous evolution as these compounds reside in the atmosphere (Jimenez et al., 2009). A large, often dominant fraction of this atmospheric OA is considered secondary organic aerosol (SOA) (Hallquist et al., 2009). Volatile organic compounds (VOCs) are SOA precursors that can be emitted from both biogenic and anthropogenic sources. A major pathway for SOA formation is the partitioning of VOC-oxidation products into the particle phase. This process can be enhanced at high relative humidity for water-soluble compounds, where cloud/fog droplets or deliquesced aerosol particles act as a reactive media for new aqueous SOA (aqSOA) (Ervens et al., 2011).
While the formation mechanisms, precursors involved, and the necessary conditions for aqSOA production are poorly understood, key reactions involved are recognized. Oxidation reactions occurring in the aqueous phase play a significant role in generating low-volatility products, such as dicarboxylic acids or keto acids (Ervens, 2015). Another pathway for certain VOCs, such as ethene and isoprene, to contribute to aqSOA is through oxidation leading to the formation of glyoxal (C2H2O2) or methylglyoxal (C3H4O2), which can generate low-volatility species by hydration or oligomerization reactions (Herrmann et al., 2015). For example, in the presence of amines or amino acids, dissolved glyoxal or methylglyoxal can form nitrogen-containing compounds, such as imidazole (De Haan et al., 2011; Ervens et al., 2011). These oxidized products result in an enhanced particulate mass, which can remain in the particle phase after fog/cloud dissipation (Hallquist et al., 2009). Phenolic compounds, such as syringol and guaiacol, have been found to form dimers or oligomers upon oxidation in the aqueous phase (Sun et al., 2010; Yu et al., 2014).
Atmospheric organic nitrogen (ON) compounds are ubiquitously observed in the atmosphere and are known to partake in aqueous processes in fog and cloud droplets (Zhang and Anastasio, 2001; Laskin et al., 2015). However, their formation and the reactions involved are poorly understood. Gaseous and particulate ON represents about 30 % of the total atmospheric reactive nitrogen and plays an important role in the terrestrial and aquatic nitrogen cycles (Cape et al., 2011; Jickells et al., 2013). Sources of ON include emissions from vehicle exhaust, biomass burning, and agriculture (Rabaud et al., 2003; Cape et al., 2011), while secondary formation may occur through VOC oxidation by the nitrate radical (Ng et al., 2017) or aqueous-phase reactions in fogs or clouds (Rehbein et al., 2011). ON includes a large range of compounds, of which amines, amino acids, amides, organonitrates, nitro-compounds, and imidazoles (N-heterocyclic compounds) have been observed in fog or cloud water (Zhang et al., 2012; Youn et al., 2015; Chen et al., 2018; Kim et al., 2019; Ge et al., 2024). ON can affect the climate, as it can influence both the optical (Laskin et al., 2015; Chen et al., 2018) and hygroscopic properties (Powelson et al., 2014) of the aerosol particles – thereby affecting both the direct and indirect ways that aerosol particles interact with radiation. Moreover, ON species, such as amines and imidazoles, can have adverse effects on the environment and human health (Ge et al., 2011).
The chemical analysis of fog water and interstitial aerosol particles has proven to be an efficient way to assess the importance of aqSOA formation in cloud water (Gilardoni et al., 2016; Kim et al., 2019; Paglione et al., 2020). Within Europe, the Po Valley stands out as an important measurement site with respect to the study of the fog-processing of agricultural and industrial emissions. With a population of approximately 20 million people, the Po Valley is a densely populated region, with one of the highest levels of air pollution in Europe, recording annual mean PM2.5 (particulate matter with a diameter of 2.5 µm or smaller) concentrations of between 20 and 30 µg m−3 at several sites, well above the World Health Organization's recommended guidelines of 5 µg m−3 (EEA, 2020). The emission sources are mainly industrial, agricultural, and residential biomass burning (Scotto et al., 2021). The valley is surrounded by the Alps in the north and west and the Apennines in the south. This often results in a stagnant atmosphere, a compact mixing layer, and weak wind speeds (Vecchi et al., 2019). As a result, long-lasting episodes of high surface relative humidity (RH) and radiation fog events frequently occur during the colder winter months (Giulianelli et al., 2014). These conditions prevent the dispersion of air pollution, which can lead to the formation and buildup of secondary aerosol particles (Perrino et al., 2014). Over the past 3 decades, numerous research studies have delved into the Po Valley fog. For example, the fog water and aerosol acidity have exhibited opposite trends. The fog water pH has increased from about 5.5 to 6.5, likely due to the decreasing trends in nitrate () and sulfate () (Giulianelli et al., 2014). Simultaneously, the aerosol pH has decreased from about 5 to 4, which has mainly been contributed to total ammonium (), i.e., the buffering effect of semi-volatile ammonia (NH3), while decreasing RH and increasing temperature in the region have also been major drivers (Paglione et al., 2021; Weber et al., 2016). The physical properties of the Po Valley aerosol and fog droplets have also been studied. For example, Noone et al. (1992) found that between 20 % and 30 % of the accumulation-mode aerosol mass is scavenged by the fog. Biomass-burning emissions have a significant influence on the aerosol mass, especially during the cold months, and contribute to aqSOA formation (Gilardoni et al., 2016; Paglione et al., 2020). Furthermore, it has been established that SOA dominates the OA mass in this region, where biomass burning is a major contributor (30 %–80 %) to the PM1 mass, both to the primary OA and the SOA, during the winter months (Saarikoski et al., 2012; Paglione et al., 2020). ON has previously been observed in the Po Valley. For example, Montero-Martínez et al. (2014) found a good linear correlation between water-soluble ON and , , and ions, while biomass burning was proven to be a potentially significant nighttime contributor to ON. Saarikoski et al. (2012) identified a nitrogen-containing OA factor from positive matrix factorization (PMF). compounds comprised 14 % of this factor, which also showed a good linear correlation with and . However, to date, the role of fog in ON formation and the content of aerosols in the Po Valley has not been investigated in detail.
There are many challenges involved in obtaining in situ cloud measurements, as this typically requires an aircraft. By focusing on fog, many of these restrictions can be avoided. The analysis of aerosol–fog interactions has so far been restricted to the offline chemical analysis of fog water/aerosol chemical composition or to in situ analysis of interstitial aerosol particles. However, in situ measurements of fog droplet residuals are lacking, limiting our understanding of aerosol–fog interactions.
In this study, as part of the Fog and Aerosol InteRAction Research Italy (FAIRARI) campaign in 2021–2022 (Neuberger et al., 2025), Po Valley fog was thoroughly investigated by performing online measurements of ambient aerosol and fog residuals and by collecting fog water for offline analysis. The composition of ambient aerosol, interstitial aerosol, and fog residuals was characterized using a soot particle aerosol mass spectrometer (SP-AMS) and a high-resolution time-of-flight aerosol mass spectrometer (HR-ToF-AMS) in parallel, while fog water samples were studied offline using the SP-AMS and proton nuclear magnetic resonance (1H-NMR) spectroscopy. Previous studies performing online quantification of ON exist (e.g., Kim et al., 2019; Ge et al., 2024; Graeffe et al., 2022) but are relatively few compared to studies on other OA species. This work presents an effort to highlight particulate ON existing in fog water and fog residuals.
2.1 The FAIRARI campaign
The FAIRARI campaign was conducted between November 2021 and April 2022 at San Pietro Capofiume (SPC) in the Po Valley, Italy (Neuberger et al., 2025). The main goals of the campaign were to study various properties of aerosol particles, fog droplets, and precursor gases, in order to better understand aerosol–fog interactions. This study focuses on the period of February and March 2022, when the mobile aerosol–cloud laboratory, a measurement container equipped with instrumentation to study aerosol particles and cloud/fog droplets, was at SPC.
2.2 Measurement site
The SPC research station (44°39′15′′ N, 11°37′29′′ E) is a rural measurement site, located in the Po Valley, about 30 km northeast of Bologna, Italy. Standard particle- and gas-phase parameters and meteorological parameters are monitored continuously at the site, both by the Regional Agency for Prevention, Environment, and Energy of Emilia-Romagna (ARPAE-ER) and the Italian National Research Council – Institute of Atmospheric Sciences and Climate (CNR-ISAC). Meteorological data, such as temperature, RH, and wind speed were provided by CNR-ISAC. Since the 1980s, numerous field studies have been conducted at SPC, focusing on aerosol physical and chemical processes in fog (Noone et al., 1992; Facchini et al., 1999; Gilardoni et al., 2014), OA and its sources (Gilardoni et al., 2016; Paglione et al., 2020), gas-phase chemistry (Cai et al., 2024), and new particle formation (Lampilahti et al., 2021).
2.3 The mobile aerosol–cloud laboratory
The mobile aerosol–cloud laboratory consists of a wide range of instruments for characterizing aerosol particles, fog, and the meteorological conditions. The indoor temperature was controlled and set to 21 °C. For more details about the instrumental setup inside the mobile aerosol–cloud laboratory, see Neuberger et al. (2025). The laboratory had two inlets sampling in parallel (Fig. 1): a whole-air inlet (WAI) and a ground-based counterflow virtual impactor (GCVI; Brechtel Manufacturing Inc., USA, Model 1205) inlet. The WAI sampled the total ambient aerosol with a flow of 99 L min−1, of which 80 L min−1 was makeup flow. The inlet was heated to 20 °C until 19 February 2022, when it was changed to 30 °C.
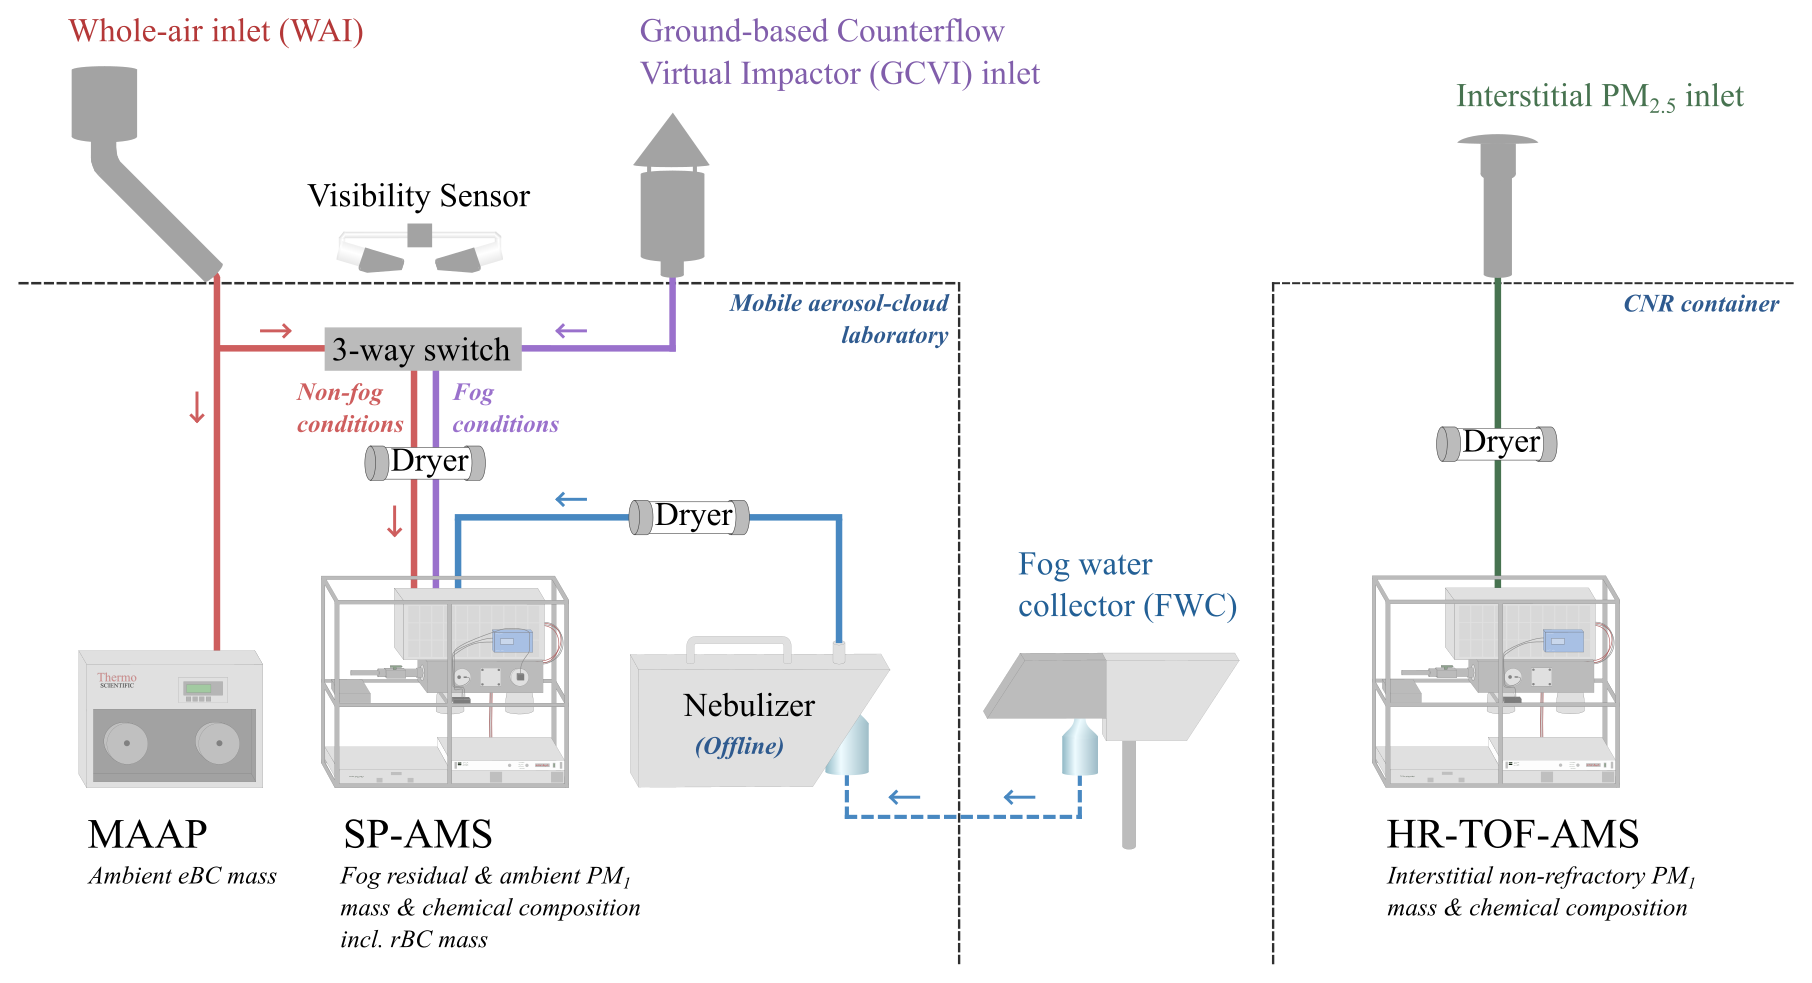
Figure 1Schematic of the experimental setup inside the two containers, including instruments relevant in this study. The two inlets in parallel, connected with a three-way switch, allow selected instruments to change the sampling inlet from the WAI to the GCVI during fog. The colored lines represent how the instruments were connected during ambient aerosol sampling using the WAI (red), during fog events using GCVI inlet (purple), and during interstitial aerosol sampling (green). Offline fog water analysis was performed in the laboratory (blue).
The sampling of dried fog droplets (fog residuals) was done using the GCVI inlet. For a more technical description of the GCVI inlet, see Shingler et al. (2012) and Karlsson et al. (2021). In brief, the working principle of the GCVI is that two opposing airflows (a sample flow and a dry, particle-free counterflow) separate particles depending on their inertia. First, the particles are accelerated onto the tip of the inlet by the wind tunnel. This concentrates the particles, resulting in an enrichment of the fog/cloud droplets compared to in the ambient air, which has to be corrected for. The interstitial aerosol is caught by an opposing counterflow, while large enough particles, i.e., fog or cloud droplets, continue traveling through the GCVI and are simultaneously dried. The resulting dried fog droplets are referred to as fog residuals in this study. During the FAIRARI campaign, the lower cut size of the GCVI inlet was set to a 7.7 µm aerodynamic diameter, while the upper size limit was approximately 40 µm. The enrichment factor was 6.7, and the sample flow through the GCVI was kept at 15 L min−1. It should be noted that we did not account for the droplet sampling efficiency of the GCVI, as suggested by Shingler et al. (2012) and Karlsson et al. (2021). Therefore, the sampled fog residual masses should be considered a lower limit of the real ambient values. Visibility was measured with a visibility sensor (Belfort Instrument Company, USA, Model 6400). Whenever the visibility was lower than 1 km, which follows the definition of fog by the World Meteorological Organization, the GCVI inlet was automatically activated, and a number of the instruments simultaneously switched from measuring behind the WAI to behind the GCVI (Neuberger et al., 2025).
The total length of the sampling lines from the WAI and GCVI to the SP-AMS were 578 and 360 cm, respectively. The sampling line from the WAI consisted of 380 cm stainless-steel tubing with a in. (6.35 mm) inner diameter (ID) and 198 cm black conductive tubing with a in. ID, while the GCVI sampling line consisted of 305 cm stainless-steel tubing with a in. ID and 55 cm black conductive tubing with a in. ID. Behind the three-way switch (Fig. 1), the sample flow was 2 L min−1, where the SP-AMS flow was 0.1 L min−1. The aerosol was consistently dried to below 30 % RH, using a 100 cm Nafion dryer (Perma Pure LLC, NJ, USA, model MD-700).
2.4 Aerosol chemical composition measurements
The soot particle aerosol mass spectrometer (SP-AMS; Aerodyne Research Inc., USA) (Onasch et al., 2012) is a high-resolution time-of-flight aerosol mass spectrometer (HR-ToF-AMS) (DeCarlo et al., 2006) equipped with a laser vaporizer in addition to the tungsten vaporizer. It measures the size-resolved aerosol mass concentration of the non-refractory submicron particulate matter (NR-PM1), which includes OA, , , , and Cl−, as well as refractory black carbon (rBC). Aerosol size distribution information is determined from the particles' time of flight using the ePToF (efficient particle time-of-flight) mode. Upon exiting the aerodynamic lens, the particles have a size-dependent velocity. The beam of particles hits a spinning chopper wheel with multiple slits. The time the particles need to go from an opening in the chopper to being acquired as several mass spectra in the mass spectrometer is used to determine the size of the particles (DeCarlo et al., 2006). Due to the additional laser vaporizer, based on the principle of the single-particle soot photometer (SP2; Droplet Measurement Technology, USA, Stephens et al., 2003), the quantification of rBC is achievable with the same instrument.
Throughout the study, the SP-AMS was alternating between three sampling modes; a single-vaporizer V mode (30 min), a dual-vaporizer V mode (30 min), and a single-vaporizer W mode (15 min). In the single-vaporizer V mode, the tungsten vaporizer is heated to 600 °C in order to flash-vaporize the NR-PM1. The vaporized particle components are ionized, using 70 eV electron impact ionization, and continue into the extraction region of the mass spectrometer. The ions are separated according to their mass-to-charge ratio (), following a V-shaped trajectory, first to the reflectron and then back to the multichannel plate (MCP) detector. In dual-vaporizer mode, an intra-cavity Nd:YAG laser (1064 nm) is activated in addition to the tungsten vaporizer, which allows quantification of rBC particles. In the single-vaporizer W mode, once again, only the tungsten vaporizer is activated; however, here, the ions entering the mass spectrometer follow a W-shaped trajectory. The ions are initially directed into a hard mirror, which makes the ions take a second flight to the reflectron before they reach the MCP detector. This provides a higher mass resolution ( = 3500) compared to the V mode ( = 2400) (DeCarlo et al., 2006).
All SP-AMS data were processed and analyzed using the SQUIRREL 1.66 and PIKA 1.26 AMS data analysis software packages (Sueper, 2024) and Igor Pro 9 (WaveMetrics, USA). The data were recorded at a 1 min resolution, which was used during analysis. The ionization efficiency was calculated from calibrations using 300 nm ammonium nitrate particles. For the rBC calibration, monodisperse rBC particles were created and nebulized using regal black mixed with deionized ultrapure Milli-Q water. The resulting relative ionization efficiencies for ammonium, nitrate, organics, sulfate, chloride, and rBC were 3.4, 1, 1.4, 1.2, 1.3, and 0.2, respectively. The collection efficiency was calculated using the composition-dependent collection efficiency approach (Middlebrook et al., 2012) and was, on average, 0.54 throughout the measurement campaign. Due to an underestimated ionization efficiency for the SP-AMS, the mass concentration measured by the SP-AMS had to be corrected (see Fig. S1 in the Supplement). This was done using data from a co-located HR-ToF-AMS provided by CNR-ISAC (from now on called the interstitial AMS; see below for further details), which in turn was validated against offline ion chromatography on parallel PM1 filter samples. The underestimation of the ionization efficiency likely originated from faulty flow settings in the calibration setup of a differential mobility particle sizer (DMPS) used for the AMS calibration. The correction factor applied to all SP-AMS data was, on average, 0.51. All elemental ratios, such as the oxygen-to-carbon (O:C) and nitrogen-to-carbon (N:C) ratios, were calculated using the improved ambient (IA) method within PIKA 1.26 (Canagaratna et al., 2015). In order to quantify the ON ion categories used in this study, , , and , the high-resolution W-mode data were used during peak fitting. The W mode was set to scan up to 106, which means that only ON ions up to this were included during the peak fitting.
In addition to the SP-AMS rBC measurements, aerosol light absorption was measured using a multi-angle absorption photometer (MAAP; Thermo Fisher Scientific, USA) (Petzold and Schönlinner, 2004), which was used to verify the rBC mass concentration from the SP-AMS. The mass absorption cross-section (MACBC) of 6.6 m2 g−1 was used to estimate the equivalent BC (eBC) mass concentration. During non-fog periods, both instruments measured behind the WAI, where they showed an overall strong linear correlation (Pearson correlation coefficient of r=0.91; see Fig. S2). The slope between the two instruments was 0.70, with the MAAP measuring on average higher mass concentrations than the SP-AMS. As the MAAP measures at a single wavelength of 670 nm, there could be interference from, e.g., brown carbon (BrC). In fact, a recent study by Shen et al. (2024) found that 23 % of total absorption at 660 nm was due to water-soluble BrC in an environment heavily influenced by biomass burning. Considering that the wintertime Po Valley aerosol is highly influenced by biomass-burning emissions, there could be interference from BrC (with respect to the eBC measured by MAAP).
Data from a second HR-ToF-AMS (interstitial AMS) were used to provide complementary information on the interstitial aerosol (i.e., nonactivated aerosol particles) chemical composition during fog events. The data from the interstitial AMS were analyzed following the same protocol as described above for the SP-AMS, but the instrument was installed in a different container and sampled aerosol particles through a PM2.5 inlet. Therefore, during fog events, this AMS sampled only the interstitial (nonactivated) particles, while fog droplets (activated particles) could not reach the sampling line because of the smaller cutoff of the sampling head (Neuberger et al., 2025). In addition, the aerosol liquid water content (ALWC) was predicted using the aerosol inorganic species – , , , and Cl− – measured by HR-ToF-AMS and K+, Ca2+, Mg2+, and Na+ from offline ion chromatography on PM1 filter samples, as inputs in the ISORROPIA II model (Fountoukis and Nenes, 2007).
2.5 Offline analysis of fog water and PM1 samples
Fog water was sampled at the SPC field station using a fog water collector (FWC), as described in more detail by Fuzzi et al. (1997) and previously used in Paglione et al. (2021). Briefly, the FWC is an automated active string collector, and sampling is dictated automatically by a built-in detector. Each individual string has a 50 % collection efficiency at a droplet radius of approximately 3 µm. The threshold value for fog has previously been validated with liquid water content measurements (Fuzzi et al., 1997). The fog droplets enter the collector via an airflow of about 17 m3 min−1, created by a fan placed in the back of the FWC. The fog droplets impact on the stainless-steel strings, leading the droplets into a glass bottle via a funnel. After collection, the fog water samples were filtered through 47 mm quartz-fiber filters and kept frozen until they were analyzed.
The offline analysis of the fog water samples took place in the laboratory, where each sample was nebulized using a Topas ATM 228 aerosol generator (Topas GmbH, Dresden, Germany) and measured with a SP-AMS. The aerosol was dried with a diffusion dryer, and the RH was kept below 20 % throughout the experiments. In total, nine fog water samples were collected in February and March 2022. Each fog water sample was analyzed using this setup for at least 1 h, while the SP-AMS altered between the same three sampling modes as during the ambient and fog residual measurements. In order to be sure of no contamination from either previous samples or the background, blank samples of deionized ultrapure Milli-Q water were measured for at least 10 min between each fog water sample. The measured signal from the blank samples was negligible. During the analysis of the fog water samples, relatively large peaks were observed in the mass spectra at 73, 143, 207, 221, and 281. These peaks are likely artifacts from the conductive silicone tubing (Timko et al., 2009); thus, they are excluded from the analysis.
Submicron particles were also sampled on pre-washed and pre-baked quartz-fiber filters (PALL, 15 cm size) using a HiVol sampler (TCR Tecora, Italy), equipped with a PM1 sampling head (Digitel Elektronik AG, Switzerland), using a nominal flow of 500 L min−1, located at ground level (Neuberger et al., 2025). The HiVol quartz-fiber samples were analyzed to chemically characterize the water-soluble organic carbon and to identify 1H-imidazole, for the first time at SPC, using proton nuclear magnetic resonance (1H-NMR) spectroscopy following the method described by Decesari et al. (2024). This method was also used to investigate the presence of 1H-imidazole in the fog water samples. Briefly, the sampled aerosol was extracted with deionized ultrapure Milli-Q water in a mechanical shaker for 1 h, and aliquots of these extracts and of fog water were dried under vacuum and redissolved in deuterium oxide (D2O) for the analysis. The 1H-NMR spectra were acquired at 600 MHz in a 5 mm probe using a Varian Unity INOVA spectrometer, at the NMR facility of the Department of Industrial Chemistry (University of Bologna). 1H-NMR spectroscopy in protic solvents provides the speciation of hydrogen atoms bonded to carbon atoms. On the basis of their frequency shifts, the signals can be attributed to H–C-containing specific functionalities (Decesari et al., 2000, 2007) and/or to specific molecules (Suzuki et al., 2001; Paglione et al., 2024). The addition of an internal standard of known concentration allows the quantification of these specific molecular tracers when well-resolved individual resonances match the spectra of standard compounds, such as 1H-imidazole, characterized by specific singlets at known chemical shifts. Sodium 3-trimethylsilyl- (2,2,3,3-d4) propionate (TSP-d4) was used as an internal standard by adding 50 µL of 0.05 % TSP-d4 (by weight) in D2O to the standard in the probe. To avoid the shifting of pH-sensitive signals, the extracts were buffered to pH 3 using a deuterated-formate/formic-acid (DCOO−=HCOOH) buffer prior to the analysis.
3.1 Time series of aerosol species, meteorological parameters, and fog events
During February and March 2022 of the FAIRARI campaign, a total of 11 fog events were measured with the aforementioned setup (see Sect. 2.3 for the definition of a fog event and Table S1 for the exact times included in each fog event). Figure 2 presents an overview of the measurements, where Fig. 2a shows the aerosol mass concentration of the different aerosol species measured with the SP-AMS, with the fog events marked as gray bars. Over the 2 months, the average ambient total PM1 mass concentration was 13.5 ± 9.1 µg m−3, which consisted of the following: OA = 5.3 ± 3.0 µg m−3, = 4.4 ± 4.3 µg m−3, = 1.1 ± 0.8 µg m−3, = 1.6 ± 1.4 µg m−3, Cl− = 0.2 ± 0.2 µg m−3, and rBC = 0.5 ± 0.3 µg m−3. The total PM1 mass concentration and the fractional composition were generally within the range of previous studies from the Po Valley (Paglione et al., 2020; Scotto et al., 2021). Compared to previous wintertime measurements performed specifically at SPC, the average PM1 mass concentration and the contribution of OA (39.4 %) were on average lower, while the contributions from the inorganic species – = 34.6 %, = 11.7 %, and = 6.6 % – were slightly elevated in the current study (Carbone et al., 2010; Gilardoni et al., 2014).
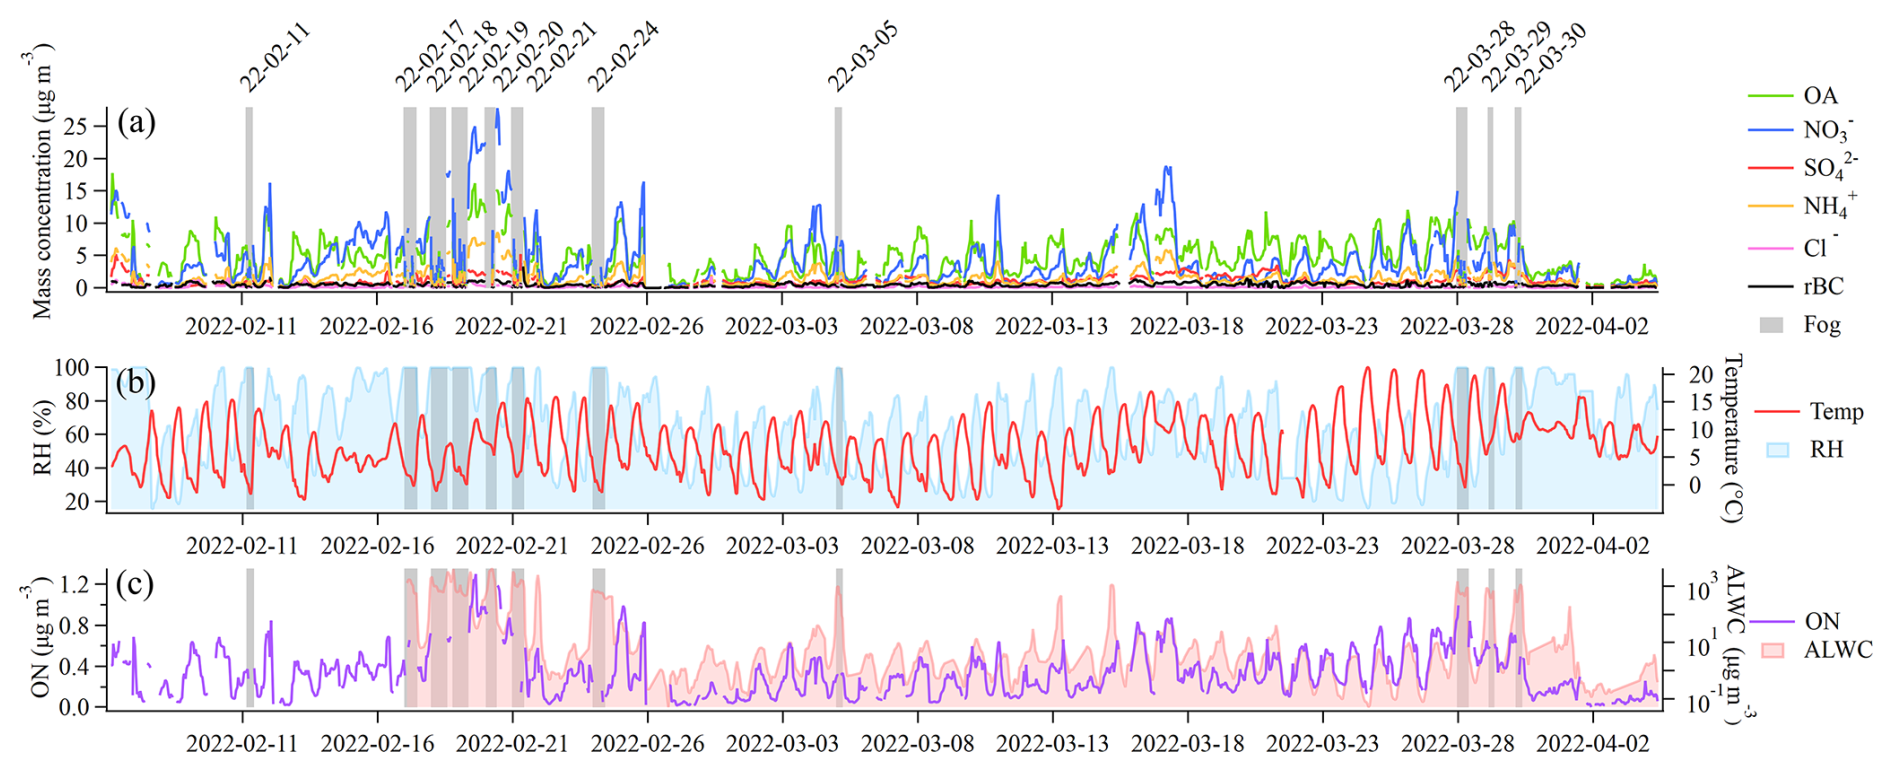
Figure 2Overview of main parameters measured during the FAIRARI campaign from February to March 2022. Panel (a) shows the mass concentrations of aerosol chemical species recorded by the SP-AMS. The fog events are highlighted using gray shading, in which the SP-AMS measured the fog residuals behind the GCVI inlet. Panel (b) shows the hourly mean temperature and relative humidity (RH). Panel (c) shows the hourly averaged mass concentrations of the ON and the calculated ALWC.
During fog, the SP-AMS automatically switched from the WAI to the GCVI in order to measure the fog residuals, which on average consisted of the following: OA = 27.6 %, = 43.3 %, = 15.2 %, = 10.5 %, and rBC = 2.3 %. During the same fog events, the average interstitial aerosol consisted of the following: OA = 32.9 %, = 37.1 %, = 14.1 %, = 4.6 %, and BC = 10.6 %. The mass scavenging efficiency (η; Eq. 1) was calculated using the average mass concentration of each chemical species before fog formation and the interstitial aerosol (Noone et al., 1992).
OA and BC were associated with the lowest mass scavenging efficiencies, on average 49 % and 36 %, respectively. , , and were more readily scavenged by the fog, with average η = 57 %, 59 %, and 57 %, respectively. Relative to both interstitial and ambient aerosol, higher contributions of ammonium nitrate and ammonium sulfate were observed in the fog residuals, while OA and rBC represented a lower fraction. These results align with what was expected: partly that the already existing, more hygroscopic, inorganic aerosol was preferred as CCN during the formation of the fog and partly that ammonium nitrate and ammonium sulfate are more readily taken up by the fog droplets.
Figure 2b shows the variations in the hourly mean temperature and RH. During the first intensive fog period (16–22 February), the average temperature was 8.8 °C, whereas the temperature was 2.8 °C during the fog events. In the second intensive fog period (27–30 March), the average temperature was 11.7 °C, whereas the temperature was 5.3 °C during the fog events. The first intensive fog period was characterized by a larger aerosol mass concentration, especially inorganic species, compared to the second period. This aerosol mass consisted of more ON and a higher aerosol liquid water content (ALWC) (Fig. 2c). By performing a Spearman rank correlation test, a moderate correlation was found between the non-fog ambient aerosol ON mass concentration and the ALWC (rs = 0.44, p = 0.052), consistent with previous studies (Liu et al., 2023). This moderate correlation indicates that the ions included in this ON family likely consisted of water-soluble ON compounds.
3.2 Comparison of two pollution episodes intersected by fog
Figure 3 shows the chemical composition of the aerosol at different stages of two periods with reoccurring fog events (16–22 February and 27–30 March), investigated in more detail here. Of these two periods, the first had particularly high PM1 loadings compared with the second one – offering a good case study for comparing aerosol–fog interactions with varying levels of pollution. The first, more polluted, intensive fog period (16–22 February) was initiated by a stagnation of the atmosphere (Neuberger et al., 2025) and a consequent buildup of pollution starting on 17 February (Fig. 3a). This buildup persisted until 20 February and was independent of the fog events occurring every night. The PM1 mass consisted of mainly , OA, and , while rBC and stayed constant over this period. Starting from 20 February, the wind intensified, resulting in a dissipation of the pollution. Both the ambient and the fog residual PM1 mass concentrations were dominated by inorganic species, especially (Fig. 3b). The fraction of OA and rBC decreased in the fog residuals, while , , and showed similar or slightly higher mass fractions in fog residuals compared to ambient.
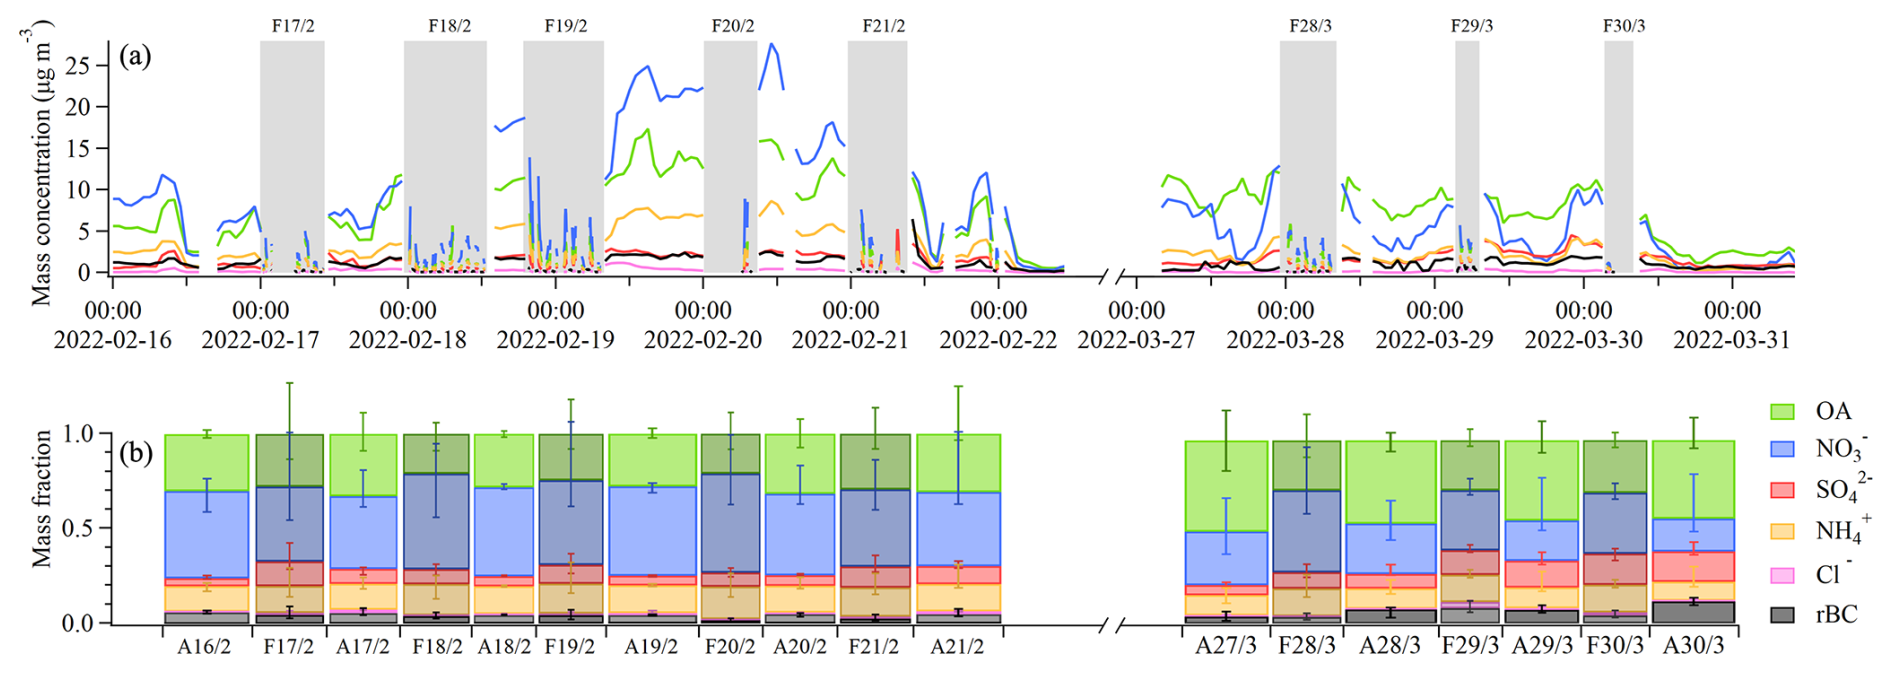
Figure 3Intensive fog episodes between 16–22 February and 27–30 March. Panel (a) shows the aerosol mass time series from the SP-AMS. Fog events are indicated by gray bars. The ambient out-of-fog data are averaged over 1 h, while the in-fog residual data are averaged over 5 min. Panel (b) shows the median mass fraction for each day, with the ambient aerosol (A) and fog residuals (F) separated. The width of each bar corresponds to the duration in panel (a), and the error bars represent the 75th and 25th percentiles.
In the second intensive fog episode (27–30 March), the ambient fraction was comparatively smaller than in the first episode, while the ambient fraction of OA, , and rBC was larger than in the first episode. The ambient fraction of was similar in both episodes. The higher ambient ratio of OA to in the second pollution episode is, however, not reflected in the fog residual composition; this looks very similar to the composition of the residuals in the first pollution episode with relatively higher nitrate contributions. During both episodes, the fog residuals were relatively enriched with inorganic components compared with the ambient aerosols.
3.3 Chemical composition of ambient aerosol, interstitial aerosol, fog residuals, and fog water
We now compare in more detail the chemical composition of the average ambient aerosol before fog and after fog and the interstitial aerosol to the fog residual and fog water composition (Fig. 4a). The ambient aerosol represents the average aerosol over the measurement campaign, excluding fog periods. Before and after fog is defined here as 1–2 h before or after a fog event, respectively, while the interstitial (nonactivated) aerosol is measured during the same fog events, by the interstitial AMS. Figure 4a reveals a scavenging of the inorganic species , , and from the interstitial mass fraction during fog. Simultaneously, these species are found to be enhanced in the fog residuals (68 % of the PM1 mass in fog), while most of the rBC remained nonactivated. The fractional compositions of the major chemical species before and after fog are relatively similar, showing that most of the particles taken up by the fog return to the particle phase upon fog dissipation. Furthermore, before and after fog showed a higher contribution of compared to the average ambient non-fog periods, while fog water showed the highest fraction of total organic carbon.
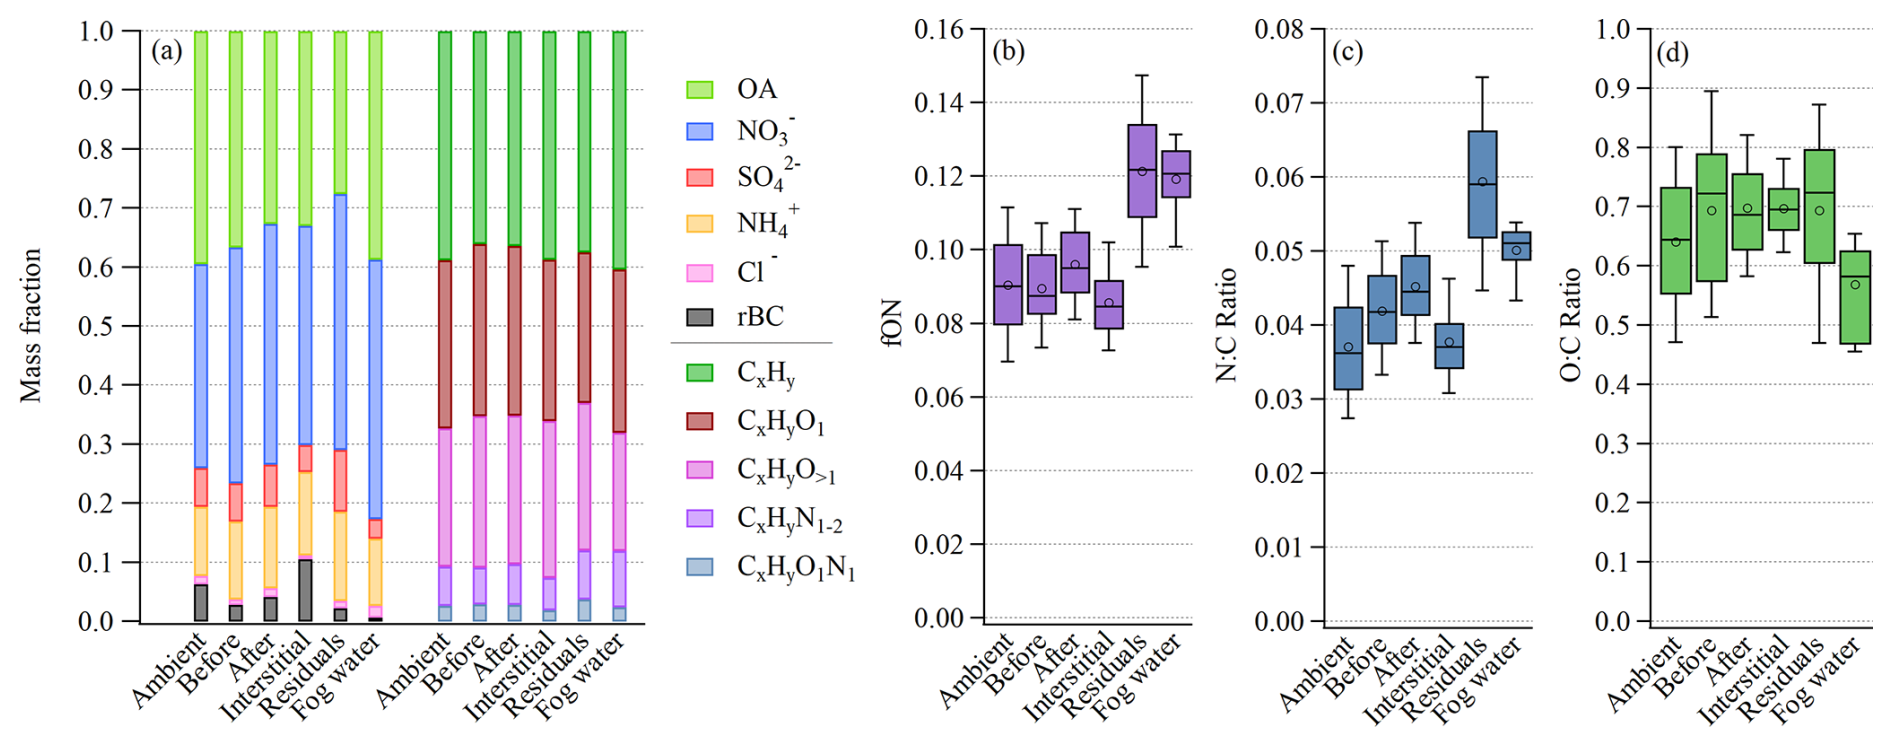
Figure 4(a) Average mass fraction of the major aerosol species (left side) and the OA families (right side). Box plots showing (b) the organic fraction of ON, (c) the N:C ratio, and (d) the O:C ratio. For all panels, the data are divided into six categories: ambient aerosol, before fog, after fog, interstitial, fog residuals, and fog water. For panels (b), (c), and (d), the whiskers above and below the boxes indicate the 90th and 10th percentiles, the boxes indicate the 75th and 25th percentiles, the circles indicate the mean, and the lines indicate the median.
Further investigating the organic mass fraction (Fig. 4a), according to its OA families (fragment elemental composition groups), a similar composition was observed in the ambient, before, after, interstitial, and fog residuals, except for the nitrogen-containing OA families ( and ), which were enhanced in the fog residuals. This is also shown in Fig. 4b, where fON is the organic fraction of ON ions. The fog residuals, measured behind the GCVI, show a distinct enhancement of ON (Fig. 4b), compared to the ambient aerosol. The nitrogen-to-carbon (N:C) ratio (Fig. 4c) was significantly higher in the fog residuals, highlighting the elevated organic nitrogen present in the fog residuals compared to the ambient aerosol.
Similar to the fog residuals, the nebulized fog water samples showed enhanced nitrogen-containing OA ( and ). Interestingly, this did not result in an equally high N:C ratio in the fog water, despite the high fraction of ON, indicating higher contributions of compounds with higher carbon numbers in the fog water compared to the residuals. This discrepancy is also reflected in the lower oxygen-to-carbon (O:C) ratio of the fog water, shown in Fig. 4d, in line with the organic mass fractions in Fig. 4a. In fact, the fog water samples contained a larger fraction of hydrocarbons (), mainly 27 and 41, compared to the other categories. Simultaneously, the fraction of more oxidized OA (CxHyO) was smaller compared to the other categories, resulting from a lower 44 () signal in the fog water compared to the fog residuals (Fig. S3). This could be, at least partly, due to the GCVI and WAI sampling inlets, where more volatile aerosol components could evaporate and partition into the gas phase due to the heating and drying, resulting in a higher O:C ratio for the fog residuals compared to fog water. However, the Po Valley fog water was expected to be relatively more oxidized. The fog water O:C ratio was previously estimated to be 0.68 ± 0.08 at SPC (Gilardoni et al., 2016), which is similar to the current study's O:C ratio in the ambient, interstitial, and fog residuals. A previously observed O:C ratio in fog water from Fresno, California, was 0.42 ± 0.04, which is less oxidized than the Po Valley fog but more similar to the Fresno pre- and post-fog (Kim et al., 2019). At a polluted site in Kanpur, India, the fog water O:C ratio was estimated to be 0.68–0.88, which again is more in line with the current study's O:C ratio for the other categories (Chakraborty et al., 2016). Another hypothesis is that the chemical composition was not consistent over all droplet sizes, which could explain the disparity between the fog water and residuals, due to the different droplet size range of the two sampling methods (i.e., FWC and GCVI). Further research is needed on the discrepancies that arise from different fog/cloud measurement techniques.
3.4 Characterization of enhanced ON in fog residuals and fog water
The ON ions were divided into three OA families; , , and . The ON mass spectra observed in the fog water (Fig. 5b) and ambient aerosol (Fig. 5c) show similarities to ON mass spectra observed in the wintertime in Fresno, California (Kim et al., 2019; Ge et al., 2024). Both of these studies utilized an HR-ToF-AMS and an atomizer for the offline analysis of fog water samples, similar to the fog water analysis in this study. The ions dominate all four ON mass spectra (Fig. 5), where a few of the observed peaks (e.g., CH4N+ and C2H6N+) are tracer fragments of amines (Ge et al., 2024). Most of the ON ions that appear in the fog residuals and fog water show a similar relative abundance (Fig. S4), especially the ions at the lower range, with the highest signals (e.g., C1H1 and C1H1N1). Considering all ON ions identified in this study, a strong correlation was found between the fog residuals and the fog water mass spectra (Pearson correlation coefficient of r=0.89). While most ions constitute a larger fraction in the fog residuals, the ions show an opposite tendency.
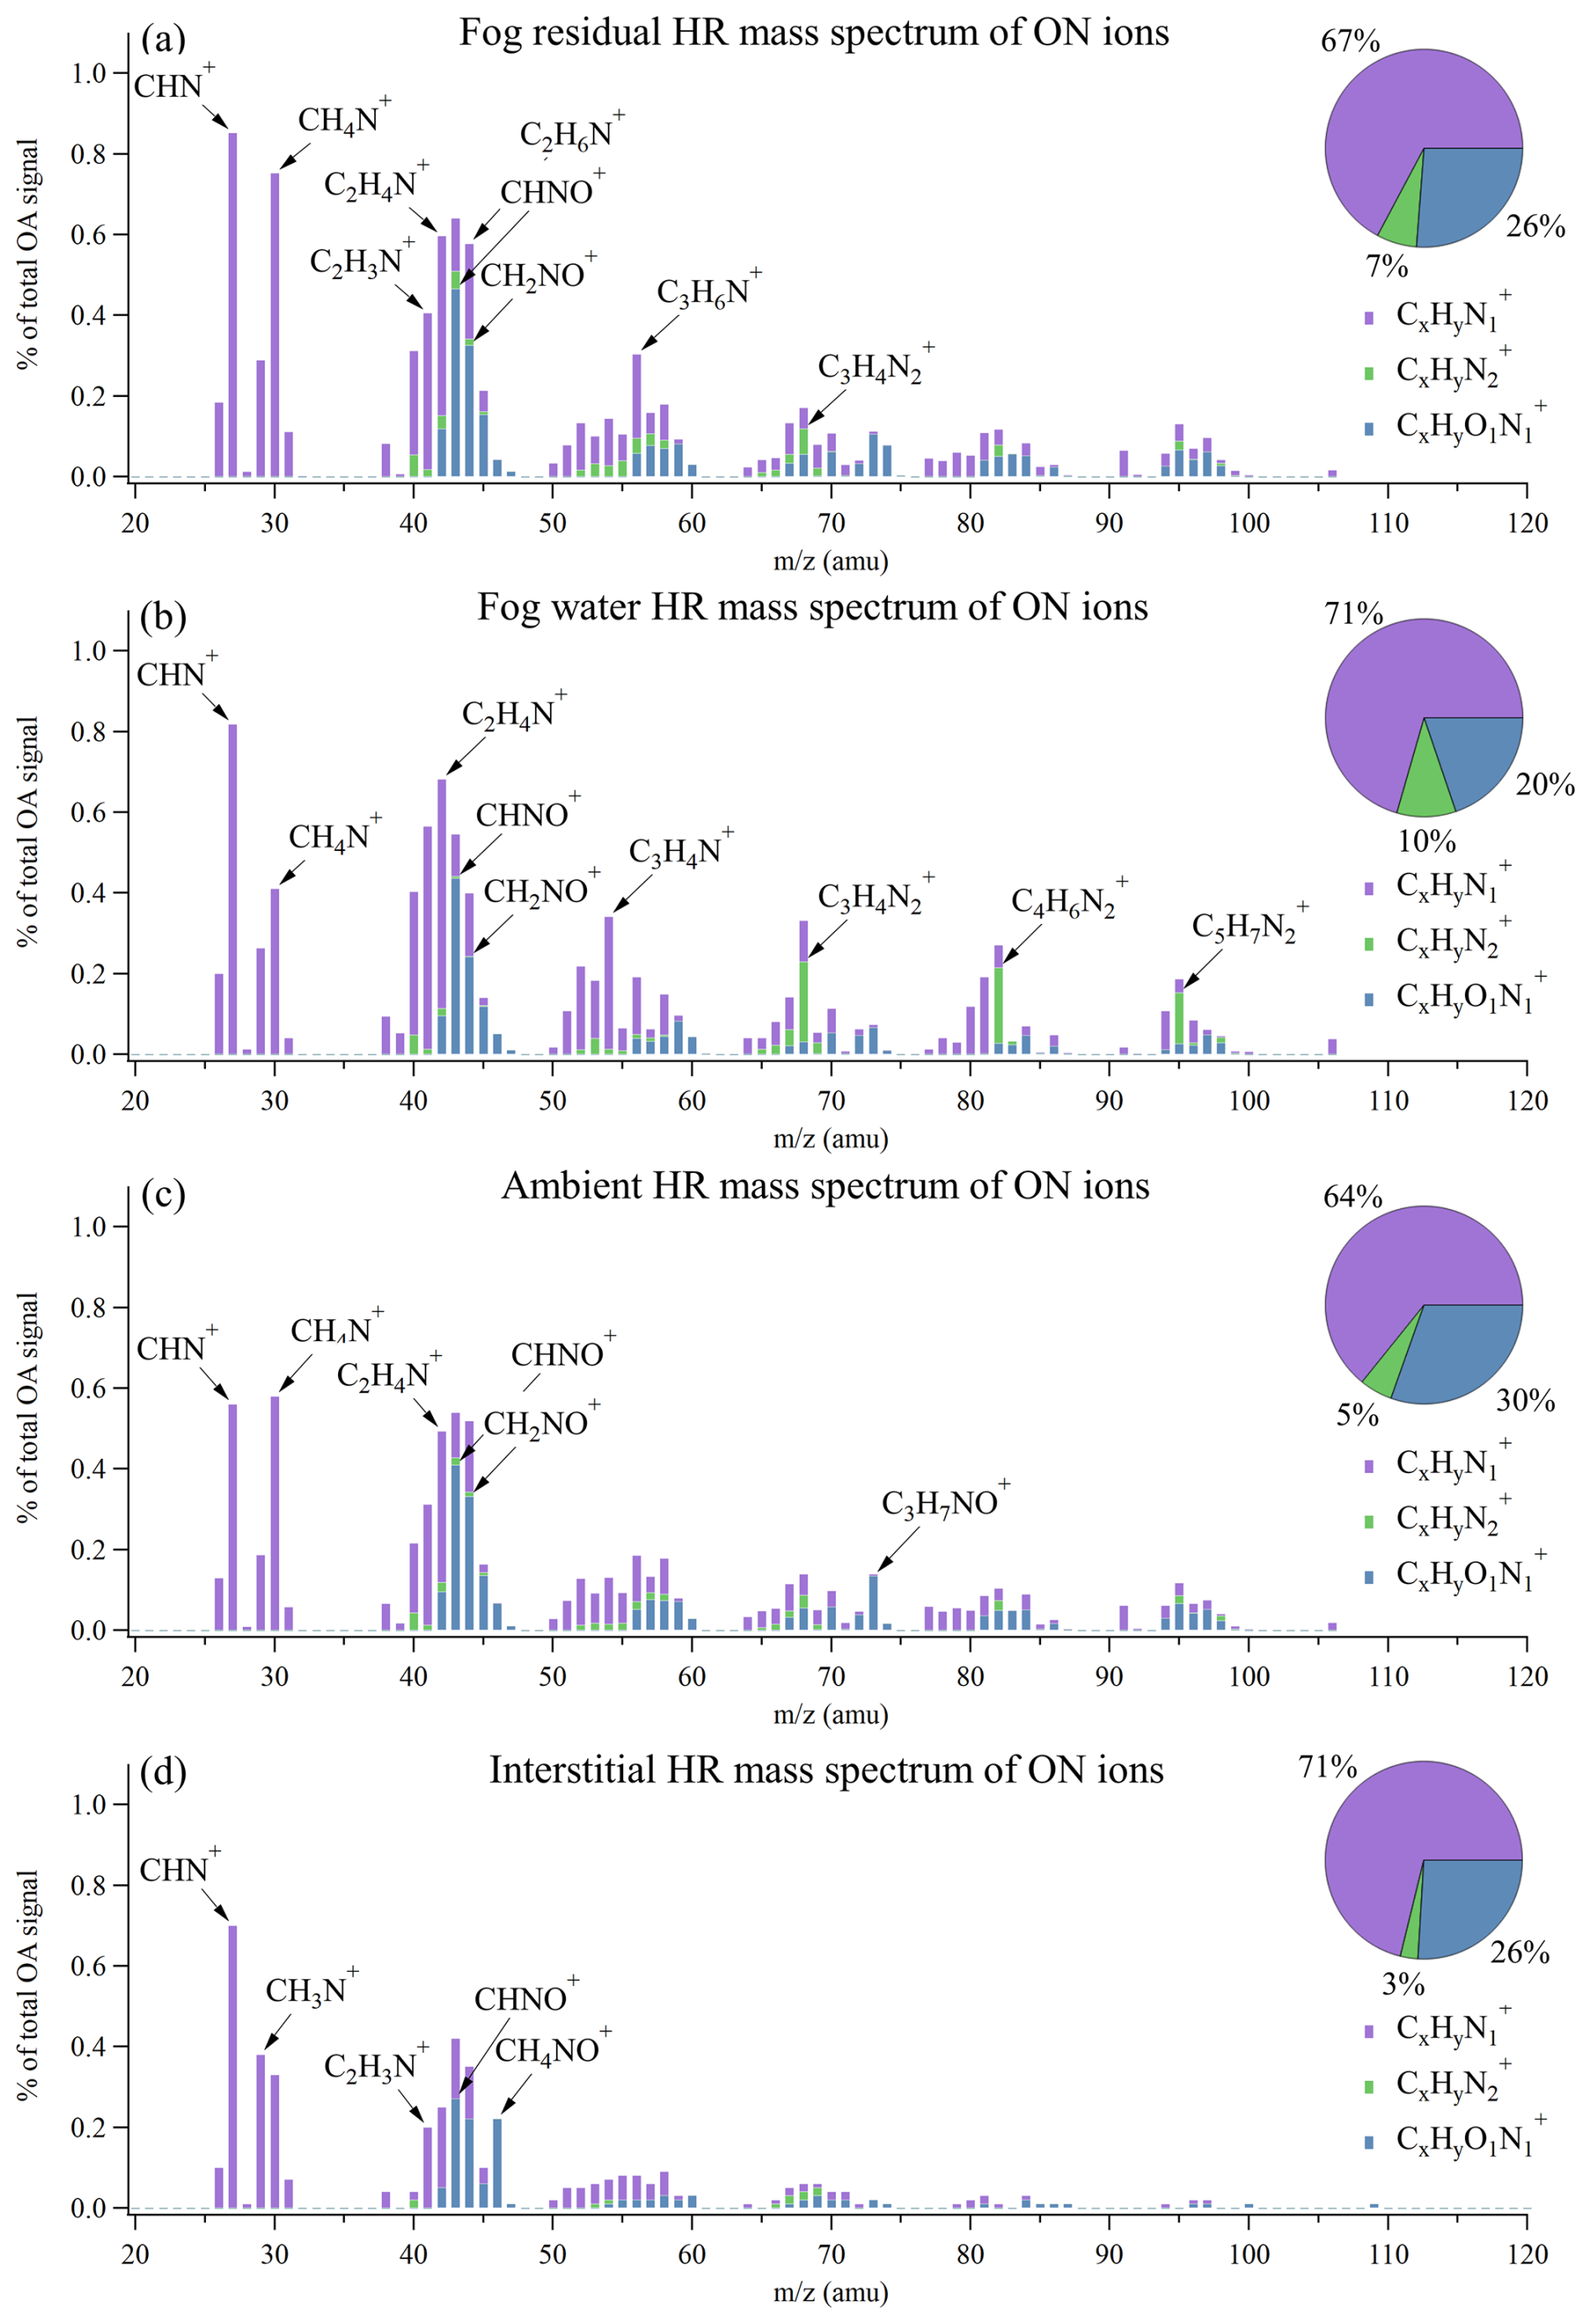
Figure 5Average high-resolution mass spectra of the nitrogen-containing organic ions presented as a percentage of the total OA signal in (a) fog residuals, (b) fog water, (c) ambient aerosol, and (d) interstitial aerosol. The pie charts show the fraction of each category (, , and ).
ions were previously found to be a major constituent in organic aerosol via source apportionment (Saarikoski et al., 2012; Sun et al., 2011). During a springtime field campaign at SPC in the Po Valley, Saarikoski et al. (2012) found a nitrogen-enriched OA (NOA) factor, where 14 % of the factor was comprised of ions. This factor had a N:C ratio of 0.078, slightly higher than the fraction in the fog residuals in our study (Fig. 4c). They argue that this factor came from local traffic sources due to its diurnal trend and sharp decrease during the nocturnal surface layer breakup. This diurnal trend is neither observed in the N:C ratio nor for any ON compounds in this study. During non-fog conditions, the N:C ratio is generally high during the day and low during the night, reaching its maximum around 14:00 LT. During the first fog and pollution week, the N:C ratio shows less of a diurnal pattern and remains at its maximum throughout the day.
A smaller fraction of the ON consisted of ions, ranging from 5 % (ambient) to 10 % (fog water). From the NIST (National Institute of Standards and Technology Standard Reference) database on electron impact ionization mass spectra, it can be found that certain imidazoles have characteristic fragmentation peaks. The three peaks giving the largest signal in the fog water mass spectra match with major signals for different imidazoles. Specifically, the C3H4 peak at 68 is likely 1H-imidazole, the C4H6 peak at 82 is likely related to 2-methyl-1H-imidazole, and C5H7 at 95 could be a fragment of 3,5-dimethylpyrazole.
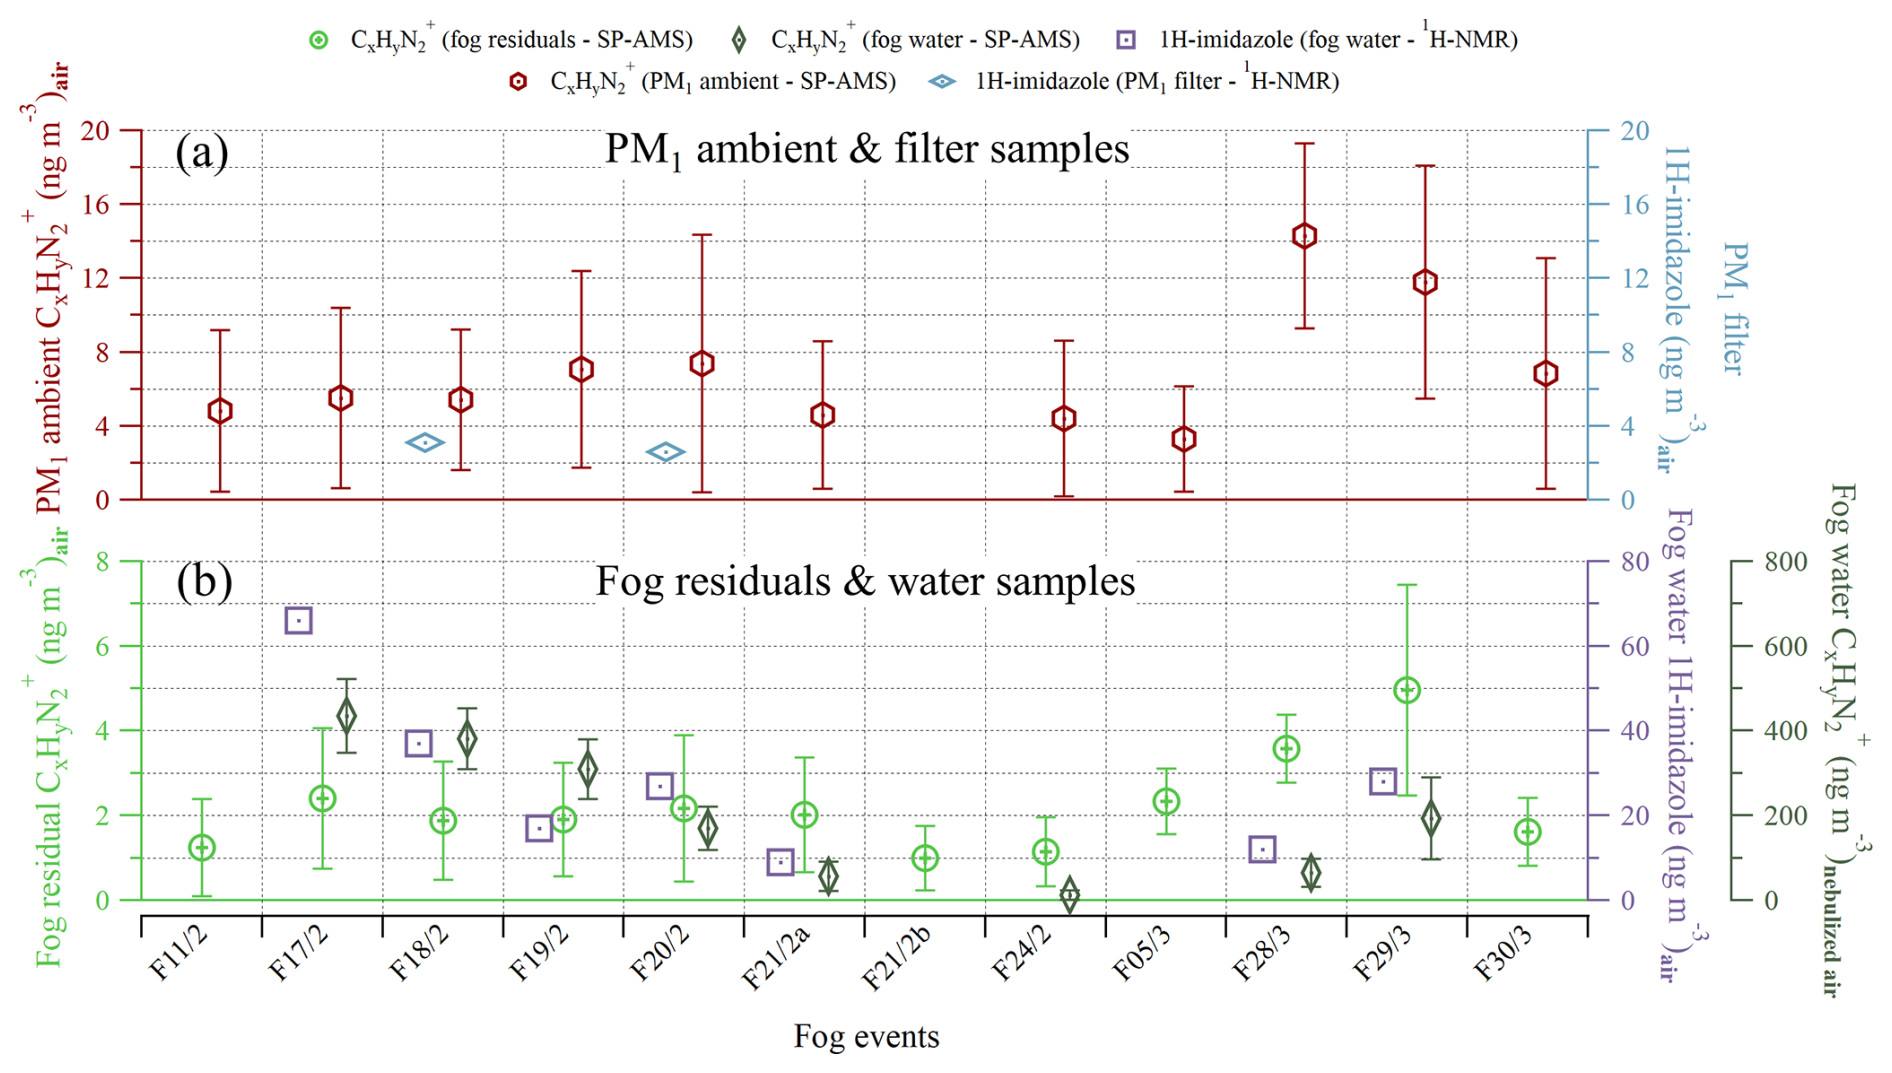
Figure 6The mass concentration of measured by SP-AMS and of 1H-imidazole measured by 1H-NMR spectroscopy for each fog event. Panel (a) shows the submicron ambient (red, left y axis) and the 1H-imidazole from offline filter samples (light blue, right y axis). Panel (b) includes the fog residual (light green, left y axis), fog water (dark green, right y axis), and fog water 1H-imidazole (purple, right y axis). The fog water 1H-imidazole concentration in mass per cubic meter of air was obtained by multiplying its concentration in fog water by the liquid water content of the air, measured by a particulate volume monitor. The fog water concentration is displayed in mass per cubic meter of nebulized air and is, thus, only used to look at the trend. Each symbol represents the mean, while the error bars represent 1 standard deviation.
The presence and concentration of 1H-imidazole were confirmed through 1H-NMR analysis conducted on the PM1 filter samples and fog water samples (Fig. 6). This compound produced two distinct singlets at 7.47 and 8.69 ppm of chemical shift and was identified by comparison with a 1H-imidazole standard under identical 1H-NMR experimental conditions (Fig. S5). The absolute concentration of 1H-imidazole should be considered a tentative quantification, due to possible re-evaporation that is not yet taken into account. However, the trends may be considered reliable. Notably, 1H-imidazole was found in all fog water samples at relatively high levels, while only trace amounts were detected in the offline PM1 samples using the 1H-NMR analysis. This strongly suggests that the compound formed under aqueous conditions, possibly through the dissolution of the gaseous fraction into fog droplets or water. Additionally, the concentrations obtained via 1H-NMR show reasonable similarities with those measured by SP-AMS, both in the ambient aerosol (Fig. 6a) and in the fog (Fig. 6b). The fog water and fog water 1H-imidazole exhibit especially similar trends. Imidazole formation from aqSOA reactions is known to occur in the atmosphere based on laboratory studies (Herrmann et al., 2015). The first observation of imidazole in laboratory-generated aerosol particles was done by Laskin et al. (2009), while the first in situ observation of imidazole in the particle phase was reported by Teich et al. (2016). Recent experiments focusing on the characterization of ON in fog water have suggested the attribution of AMS fragments to imidazoles (Kim et al., 2019; Ge et al., 2024), which were also found in the current study. However, the formation of imidazole by aerosol–fog interactions has previously never been confirmed by a molecular-level analysis integrated with online observation using aerosol mass spectrometry.
Previous laboratory studies have found evidence of the aqueous-phase production of ON compounds (such as imidazoles) from the uptake of glyoxal with amino acids (De Haan et al., 2009) or ammonium (Galloway et al., 2009). Glyoxal, an important precursor for aqSOA formation, typically fragments into C2H2, , and from electron impact ionization (Paglione et al., 2020). Over the full measurement period, no significant linear correlation (Pearson correlation coefficient) was found between the ions and the glyoxal fragments in the ambient aerosol (r = 0.38) and in the fog residuals (r = 0.37). Similarly, the ions did not show a correlation with in the ambient aerosol (r = 0.26) or in the fog residuals (r = 0.29). However, considering only the second intensive fog period (27–30 March), the ions were much more abundant in the ambient aerosol and slightly more abundant in the fog residuals. During this period, stronger correlations were found in both the ambient aerosol (r = 0.65 and r = 0.64 with glyoxal and , respectively) and in the fog residuals (r = 0.70 and r = 0.67 with glyoxal and , respectively). Throughout the campaign, the concentration of gas-phase NH3 was on relatively similar levels, fluctuating between 10 and 30 ppb (see Fig. S6). No considerable difference was found between the first (17.3 ppb) and second (15.9 ppb) intensive fog periods for NH3. While data were missing for more than half of the first period, it was found reasonable to assume that the NH3 should follow a similar trend over those days. Furthermore, the high concentration of during the first intensive fog period suggests that HNO3 was a large sink for NH3. During the second intensive fog period, however, the concentration was considerably lower, which could mean more was available for imidazole formation. Together with the more OA-dominated aerosol, this could have enhanced the formation of imidazoles through glyoxal uptake with ammonium, suggested both by the increased abundance of imidazole fragments and the stronger correlations with glyoxal and during the second intensive fog period. Meanwhile, good linear correlations were found between the ions and glyoxal fragments throughout the campaign (ambient r = 0.80 and fog residuals r = 0.84). As glyoxal is a precursor of aqSOA, this suggests that a considerable majority of the ON compounds are formed or partition into aerosol, under similar conditions as for aqSOA formation.
For imidazoles, little is known about their physicochemical properties, such as volatility. According to UK REACH (2018), 1H-imidazole has a vapor pressure of 3.27 × 10⁻¹⁰ Pa, which would mean that it has a low volatility. A more recent study estimated imidazoles in general to have a vapor pressure of 0.2 Pa or more, which instead would mean that they are highly volatile (Amugoda and Davies, 2025). However, they show that imidazoles stay in the particle phase, despite their high volatility, when they are internally mixed with inorganic salts. Therefore, imidazoles are expected to remain in the particle phase after droplet evaporation in the different inlets and drying of the aerosol. De Haan et al. (2011) found the formation of imidazoles, from nitrogen-containing species (i.e., ammonium and amines) and glyoxal, during the simulated evaporation of droplets. Ervens et al. (2011) summarized that these reactions likely occur in the evaporating droplets, when glyoxal has dissolved in the water and, simultaneously, the evaporation of water results in increasing concentrations of nitrogen-containing compounds. A possible explanation of why the ions were reduced in the online fog residual measurements, compared to fog water samples, could be that they were more concentrated in the smaller evaporating fog droplets, which were sampled more efficiently by the FWC compared to the GCVI.
Aqueous-phase processing of aerosol particles and fog chemistry was studied in the Po Valley during wintertime in 2021–2022, as part of the FAIRARI campaign. Submicron aerosol chemical characterization was carried out using an SP-AMS, for the ambient aerosol and fog residuals, and an HR-ToF-AMS, for the interstitial aerosol. The ambient PM1 concentration was on average 13.5 (± 9.1) µg m−3 throughout the campaign, which included 39 % OA, 33 % , 8 % , 12 % , 1 % Cl−, and 4 % rBC. Compared to previous wintertime measurements at the site, the PM1 mass was slightly lower, while still being dominated by OA, although to a lesser degree.
During two pollution episodes, consisting of high relative humidity and high levels of pollution, several fog events were captured. The sampling of the dried fog droplets (fog residuals) was done by applying a ground-based GCVI inlet. While the chemical composition of the fog residuals was relatively similar over these periods, the ambient aerosol was -dominated in the first period, whereas OA dominated the ambient aerosol in the second period. This was likely due to the on average lower temperature and simultaneously higher RH during the first period, which allowed more gas–particle partitioning, especially of inorganic compounds. On average over the measurement campaign, showed slightly larger variation due to temperature, indicating that it is more semi-volatile than OA.
Fog water samples were collected and analyzed with an offline nebulizer setup, using the same SP-AMS. The fog water contained an unexpectedly large fraction of total OA, especially hydrocarbons, while the signal of more oxygenated OA was lower. This stood out in contrast to the ambient aerosol and fog residuals, and it resulted in lower-than-expected N:C and O:C ratios, not consistent with previous fog water studies. Similar to this study, previous fog/cloud studies found that the mass scavenging efficiency is lower for OA than, e.g., and , and that the cloud residual mass fraction of OA is typically lower than that of the ambient aerosol. Furthermore, the mass concentration of the OA families measured by the interstitial AMS and the SP-AMS agreed well during the non-fog periods. Thus, we hypothesize this discrepancy could be due to the different sampling methods and that the chemical composition could be dissimilar in larger vs. smaller fog droplets.
A substantial enhancement of ON was found in both fog residuals and fog water samples, which also proved to be highly correlated. The fog-enhanced ON consisted of several ions, likely originating from various amino compounds, while a few ions could be identified as primary and secondary amines. These ON compounds are likely products of biomass-burning, agriculture, and animal husbandry emissions. The increased abundance of these compounds in the fog, while also showing good correlation with glyoxal fragments and moderate correlation with ALWC, suggests that a considerable amount of the ON observed in the particle phase is either produced by aqueous-phase chemical reactions or partitioning between the gas and aqueous phase.
The ions, mainly present in the fog water, suggest the formation of imidazoles in fog droplets. The related fragments linked to imidazoles have been confirmed by 1H-NMR spectroscopy and, thus, can now be used as tracer fragments. We hypothesize that the reason they were less present in the fog residuals, compared to the fog water, could be that they were more concentrated in the smaller evaporating fog droplets, which were sampled more efficiently by the FWC compared to the GCVI. In the second intensive fog period, these ions were substantially elevated in the fog residuals, and they even persisted in the aerosol phase after fog dissipation, which was not observed during the first intensive fog period. During this period, the ions showed a strong positive correlation with both glyoxal fragments and , which was not found during other periods. Compared to the first intensive fog period, the aerosol mass consisted of a lower concentration, while the fraction of OA was considerably higher, and stayed relatively constant. This could explain the elevated mass concentration of ions, as more was available for aqueous reactions with glyoxal, or other α-dicarbonyls, to form imidazoles. Because the formation of 1H-imidazole is irreversible, even small amounts could have an effect on the aerosol optical properties. This shows the importance of fog processing from both an air quality and climate perspective. The results from this study improve our understanding of fog processing and demonstrate that fogs and clouds are an important medium for the aqueous production of certain nitrogen-containing organic aerosol in the atmosphere.
All data, including HR-AMS mass spectra, are collectively available from the Bolin Centre for Climate Research database (https://doi.org/10.17043/fairari-2021-2022-1, Neuberger et al., 2024). The AMS data analysis software packages SQUIRREL 1.66 and PIKA 1.26 (http://cires1.colorado.edu/jimenez-group/wiki/index.php/ToF-AMS_Analysis_Software, Sueper, 2024) were used for processing and analyzing all SP-AMS and HR-ToF-AMS data.
The supplement related to this article is available online at https://doi.org/10.5194/acp-25-7973-2025-supplement.
FM, PZ, IR, and CM designed the study. FM, AN, LH, YG, MP, MR, SD, PZ and CM collected the data at the SPC site. FM processed and analyzed the SP-AMS data. AN and PZ processed the GCVI data. MP processed and analyzed the 1H-NMR spectroscopy data. MR processed and analyzed the interstitial HR-ToF-AMS data. FM performed the overall analysis; data visualization; and wrote the paper with input from CM, IR, and PZ. All authors gave comments and suggestions on the paper.
At least one of the (co-)authors is a member of the editorial board of Atmospheric Chemistry and Physics. The peer-review process was guided by an independent editor, and the authors also have no other competing interests to declare.
Publisher's note: Copernicus Publications remains neutral with regard to jurisdictional claims made in the text, published maps, institutional affiliations, or any other geographical representation in this paper. While Copernicus Publications makes every effort to include appropriate place names, the final responsibility lies with the authors.
The authors gratefully acknowledge Maurizio Busetto and David Hadden for their technical support in the field.
This research has been supported by the European Union's Horizon 2020 Research and Innovation program (project FORCeS; grant no. 821205), the Horizon 2020 “NPF-PANDA” project (grant no. 895875), the European Research Council (consolidator grant INTE-GRATE; grant no. 865799), and the Knut and Alice Wallenberg Foundation (grant nos. 2021.0169 and 2021.0298).
This paper was edited by Jianzhong Ma and reviewed by two anonymous referees.
Amugoda, M. and Davies, J. F.: Ammonium-Induced Stabilization of Imidazoles in Aerosol Particles, ACS Earth and Space Chemistry, 9, 729–737, 2025. a
Cai, J., Sulo, J., Gu, Y., Holm, S., Cai, R., Thomas, S., Neuberger, A., Mattsson, F., Paglione, M., Decesari, S., Rinaldi, M., Yin, R., Aliaga, D., Huang, W., Li, Y., Gramlich, Y., Ciarelli, G., Quéléver, L., Sarnela, N., Lehtipalo, K., Zannoni, N., Wu, C., Nie, W., Kangasluoma, J., Mohr, C., Kulmala, M., Zha, Q., Stolzenburg, D., and Bianchi, F.: Elucidating the mechanisms of atmospheric new particle formation in the highly polluted Po Valley, Italy, Atmos. Chem. Phys., 24, 2423–2441, https://doi.org/10.5194/acp-24-2423-2024, 2024. a
Canagaratna, M. R., Jimenez, J. L., Kroll, J. H., Chen, Q., Kessler, S. H., Massoli, P., Hildebrandt Ruiz, L., Fortner, E., Williams, L. R., Wilson, K. R., Surratt, J. D., Donahue, N. M., Jayne, J. T., and Worsnop, D. R.: Elemental ratio measurements of organic compounds using aerosol mass spectrometry: characterization, improved calibration, and implications, Atmos. Chem. Phys., 15, 253–272, https://doi.org/10.5194/acp-15-253-2015, 2015. a
Cape, J. N., Cornell, S. E., Jickells, T. D., and Nemitz, E.: Organic nitrogen in the atmosphere – Where does it come from? A review of sources and methods, Atmos. Res., 102, 30–48, 2011. a, b
Carbone, C., Decesari, S., Mircea, M., Giulianelli, L., Finessi, E., Rinaldi, M., Fuzzi, S., Marinoni, A., Duchi, R., Perrino, C., Sargolini, T., Vardè, M., Sprovieri, F., Gobbi, G., Angelini, F., and Facchini, M.: Size-resolved aerosol chemical composition over the Italian Peninsula during typical summer and winter conditions, Atmos. Environ., 44, 5269–5278, 2010. a
Chakraborty, A., Ervens, B., Gupta, T., and Tripathi, S. N.: Characterization of organic residues of size-resolved fog droplets and their atmospheric implications, J. Geophys. Res.-Atmos., 121, 4317–4332, 2016. a
Chen, X., Xie, M., Hays, M. D., Edgerton, E., Schwede, D., and Walker, J. T.: Characterization of organic nitrogen in aerosols at a forest site in the southern Appalachian Mountains, Atmos. Chem. Phys., 18, 6829–6846, https://doi.org/10.5194/acp-18-6829-2018, 2018. a, b
De Haan, D. O., Corrigan, A. L., Smith, K. W., Stroik, D. R., Turley, J. J., Lee, F. E., Tolbert, M. A., Jimenez, J. L., Cordova, K. E., and Ferrell, G. R.: Secondary organic aerosol-forming reactions of glyoxal with amino acids, Environ. Sci. Technol., 43, 2818–2824, 2009. a
De Haan, D. O., Hawkins, L. N., Kononenko, J. A., Turley, J. J., Corrigan, A. L., Tolbert, M. A., and Jimenez, J. L.: Formation of nitrogen-containing oligomers by methylglyoxal and amines in simulated evaporating cloud droplets, Environ. Sci. Technol., 45, 984–991, 2011. a, b
DeCarlo, P. F., Kimmel, J. R., Trimborn, A., Northway, M. J., Jayne, J. T., Aiken, A. C., Gonin, M., Fuhrer, K., Horvath, T., Docherty, K. S., Worsnop, D. R., and Jimenez, J. L.: Field-deployable, high-resolution, time-of-flight aerosol mass spectrometer, Anal. Chem., 78, 8281–8289, 2006. a, b, c
Decesari, S., Facchini, M. C., Fuzzi, S., and Tagliavini, E.: Characterization of water-soluble organic compounds in atmospheric aerosol: A new approach, J. Geophys. Res.-Atmos., 105, 1481–1489, 2000. a
Decesari, S., Mircea, M., Cavalli, F., Fuzzi, S., Moretti, F., Tagliavini, E., and Facchini, M. C.: Source attribution of water-soluble organic aerosol by nuclear magnetic resonance spectroscopy, Environ. Sci. Technol., 41, 2479–2484, 2007. a
Decesari, S., Paglione, M., Mazzanti, A., and Tagliavini, E.: NMR spectroscopic applications to atmospheric organic aerosol analysis–Part 1: A critical review of data source and analysis, potentialities and limitations, TrAC-Trend. Anal. Chem., 171, 117516, https://doi.org/10.1016/j.trac.2023.117516, 2024. a
Duplessis, P., Bhatia, S., Hartery, S., Wheeler, M. J., and Chang, R. Y.-W.: Microphysics of aerosol, fog and droplet residuals on the Canadian Atlantic coast, Atmos. Res., 264, 105859, https://doi.org/10.1016/j.atmosres.2021.105859, 2021. a
EEA: Air quality in Europe: 2020 report, Publications Office of the European Union, https://doi.org/10.2800/786656, 2020. a
Ehrenhauser, F. S., Khadapkar, K., Wang, Y., Hutchings, J. W., Delhomme, O., Kommalapati, R. R., Herckes, P., Wornat, M. J., and Valsaraj, K. T.: Processing of atmospheric polycyclic aromatic hydrocarbons by fog in an urban environment, J. Environ. Monitor., 14, 2566–2579, 2012. a
Ervens, B.: Modeling the processing of aerosol and trace gases in clouds and fogs, Chem. Rev., 115, 4157–4198, 2015. a
Ervens, B., Turpin, B. J., and Weber, R. J.: Secondary organic aerosol formation in cloud droplets and aqueous particles (aqSOA): a review of laboratory, field and model studies, Atmos. Chem. Phys., 11, 11069–11102, https://doi.org/10.5194/acp-11-11069-2011, 2011. a, b, c
Facchini, M. C., Fuzzi, S., Zappoli, S., Andracchio, A., Gelencsér, A., Kiss, G., Krivácsy, Z., Mészáros, E., Hansson, H.-C., Alsberg, T., and Zebühr, Y.: Partitioning of the organic aerosol component between fog droplets and interstitial air, J. Geophys. Res.-Atmos., 104, 26821–26832, 1999. a
Fountoukis, C. and Nenes, A.: ISORROPIA II: a computationally efficient thermodynamic equilibrium model for K+–Ca2+–Mg2+––Na+–––Cl−-−H2O aerosols, Atmos. Chem. Phys., 7, 4639–4659, https://doi.org/10.5194/acp-7-4639-2007, 2007. a
Fuzzi, S., Orsi, G., Bonforte, G., Zardini, B., and Franchini, P. L.: An automated fog water collector suitable for deposition networks: Design, operation and field tests, Water Air Soil Poll., 93, 383–394, 1997. a, b
Galloway, M. M., Chhabra, P. S., Chan, A. W. H., Surratt, J. D., Flagan, R. C., Seinfeld, J. H., and Keutsch, F. N.: Glyoxal uptake on ammonium sulphate seed aerosol: reaction products and reversibility of uptake under dark and irradiated conditions, Atmos. Chem. Phys., 9, 3331–3345, https://doi.org/10.5194/acp-9-3331-2009, 2009. a
Ge, X., Wexler, A. S., and Clegg, S. L.: Atmospheric amines – Part I. A review, Atmos. Environ., 45, 524–546, 2011. a
Ge, X., Zhang, Q., Sun, Y., Ruehl, C. R., and Setyan, A.: Effect of aqueous-phase processing on aerosol chemistry and size distributions in Fresno, California, during wintertime, Environ. Chem., 9, 221–235, 2012. a
Ge, X., Sun, Y., Trousdell, J., Chen, M., and Zhang, Q.: Enhancing characterization of organic nitrogen components in aerosols and droplets using high-resolution aerosol mass spectrometry, Atmos. Meas. Tech., 17, 423–439, https://doi.org/10.5194/amt-17-423-2024, 2024. a, b, c, d, e
Gilardoni, S., Massoli, P., Giulianelli, L., Rinaldi, M., Paglione, M., Pollini, F., Lanconelli, C., Poluzzi, V., Carbone, S., Hillamo, R., Russell, L. M., Facchini, M. C., and Fuzzi, S.: Fog scavenging of organic and inorganic aerosol in the Po Valley, Atmos. Chem. Phys., 14, 6967–6981, https://doi.org/10.5194/acp-14-6967-2014, 2014. a, b
Gilardoni, S., Massoli, P., Paglione, M., Giulianelli, L., Carbone, C., Rinaldi, M., Decesari, S., Sandrini, S., Costabile, F., Gobbi, G. P., Pietrogrande, M. C., Visentin, M., Scotto, F., Fuzzi, S., and Facchini, M. C.: Direct observation of aqueous secondary organic aerosol from biomass-burning emissions, P. Natl. Acade. Sci. USA, 113, 10013–10018, 2016. a, b, c, d
Giulianelli, L., Gilardoni, S., Tarozzi, L., Rinaldi, M., Decesari, S., Carbone, C., Facchini, M., and Fuzzi, S.: Fog occurrence and chemical composition in the Po valley over the last twenty years, Atmos. Environ., 98, 394–401, 2014. a, b
Goldstein, A. H. and Galbally, I. E.: Known and unexplored organic constituents in the Earth's atmosphere, Environ. Sci. Technol., 41, 1514–1521, 2007. a
Graeffe, F., Heikkinen, L., Garmash, O., Aijala, M., Allan, J., Feron, A., Cirtog, M., Petit, J.-E., Bonnaire, N., Lambe, A., Favez, O., Albinet, A., Williams, L. R., and Ehn, M.: Detecting and Characterizing Particulate Organic Nitrates with an Aerodyne Long-ToF Aerosol Mass Spectrometer, ACS Earth and Space Chemistry, 7, 230–242, 2022. a
Hallquist, M., Wenger, J. C., Baltensperger, U., Rudich, Y., Simpson, D., Claeys, M., Dommen, J., Donahue, N. M., George, C., Goldstein, A. H., Hamilton, J. F., Herrmann, H., Hoffmann, T., Iinuma, Y., Jang, M., Jenkin, M. E., Jimenez, J. L., Kiendler-Scharr, A., Maenhaut, W., McFiggans, G., Mentel, Th. F., Monod, A., Prévôt, A. S. H., Seinfeld, J. H., Surratt, J. D., Szmigielski, R., and Wildt, J.: The formation, properties and impact of secondary organic aerosol: current and emerging issues, Atmos. Chem. Phys., 9, 5155–5236, https://doi.org/10.5194/acp-9-5155-2009, 2009. a, b
Herrmann, H., Schaefer, T., Tilgner, A., Styler, S. A., Weller, C., Teich, M., and Otto, T.: Tropospheric aqueous-phase chemistry: kinetics, mechanisms, and its coupling to a changing gas phase, Chem. Rev., 115, 4259–4334, 2015. a, b
Jia, X., Quan, J., Zheng, Z., Liu, X., Liu, Q., He, H., and Liu, Y.: Impacts of anthropogenic aerosols on fog in North China Plain, J. Geophys. Res.-Atmos., 124, 252–265, 2019. a
Jickells, T., Baker, A. R., Cape, J. N., Cornell, S. E., and Nemitz, E.: The cycling of organic nitrogen through the atmosphere, Phil. T. R. Soc. B, 368, 20130115, https://doi.org/10.1098/rstb.2013.0115, 2013. a
Jimenez, J. L., Canagaratna, M. R., Donahue, N. M., Prevot, A. S. H., Zhang, Q., Kroll, J. H., DeCarlo, P. F., Allan, J. D., Coe, H., Ng, N. L., Aiken, A. C., Docherty, K. S., Ulbrich, I. M., Grieshop, A. P., Robinson, A. L., Duplissy, J., Smith, J. D., Wilson, K. R., Lanz, V. A., Hueglin, C., Sun, Y. L., Tian, J., Laaksonen, A., Raatikainen, T., Rautiainen, J., Vaattovaara, P., Ehn, M., Kulmala, M., Tomlinson, J. M., Collins, D. R., Cubison, M. J., Dunlea, J., Huffman, J. A., Onasch, T. B., Alfarra, M. R., Williams, P. I., Bower, K., Kondo, Y., Schneider, J., Drewnick, F., Borrmann, S., Weimer, S., Demerjian, K., Salcedo, D., Cottrell, L., Griffin, R., Takami, A., Miyoshi, T., Hatakeyama, S., Shimono, A., Sun, J. Y., Zhang, Y. M., Dzepina, K., Kimmel, J. R., Sueper, D., Jayne, J. T., Herndon, S. C., Trimborn, A. M., Williams, L. R., Wood, E. C., Middlebrook, A. M., Kolb, C. E., Baltensperger, U., and Worsnop, D. R.: Evolution of organic aerosols in the atmosphere, Science, 326, 1525–1529, 2009. a
Karlsson, L., Krejci, R., Koike, M., Ebell, K., and Zieger, P.: A long-term study of cloud residuals from low-level Arctic clouds, Atmos. Chem. Phys., 21, 8933–8959, https://doi.org/10.5194/acp-21-8933-2021, 2021. a, b
Kim, H., Collier, S., Ge, X., Xu, J., Sun, Y., Jiang, W., Wang, Y., Herckes, P., and Zhang, Q.: Chemical processing of water-soluble species and formation of secondary organic aerosol in fogs, Atmos. Environ., 200, 158–166, 2019. a, b, c, d, e, f
Lampilahti, J., Manninen, H. E., Nieminen, T., Mirme, S., Ehn, M., Pullinen, I., Leino, K., Schobesberger, S., Kangasluoma, J., Kontkanen, J., Järvinen, E., Väänänen, R., Yli-Juuti, T., Krejci, R., Lehtipalo, K., Levula, J., Mirme, A., Decesari, S., Tillmann, R., Worsnop, D. R., Rohrer, F., Kiendler-Scharr, A., Petäjä, T., Kerminen, V.-M., Mentel, T. F., and Kulmala, M.: Zeppelin-led study on the onset of new particle formation in the planetary boundary layer, Atmos. Chem. Phys., 21, 12649–12663, https://doi.org/10.5194/acp-21-12649-2021, 2021. a
Laskin, A., Smith, J. S., and Laskin, J.: Molecular characterization of nitrogen-containing organic compounds in biomass burning aerosols using high-resolution mass spectrometry, Environ. Sci. Technol., 43, 3764–3771, 2009. a
Laskin, A., Laskin, J., and Nizkorodov, S. A.: Chemistry of atmospheric brown carbon, Chem. Rev., 115, 4335–4382, 2015. a, b
Liu, X., Wang, H., Wang, F., Lv, S., Wu, C., Zhao, Y., Zhang, S., Liu, S., Xu, X., Lei, Y., and Wang, G.: Secondary formation of atmospheric brown carbon in China haze: Implication for an enhancing role of ammonia, Environ. Sci. Technol., 57, 11163–11172, 2023. a
Mazzoleni, L. R., Ehrmann, B. M., Shen, X., Marshall, A. G., and Collett Jr, J. L.: Water-soluble atmospheric organic matter in fog: exact masses and chemical formula identification by ultrahigh-resolution Fourier transform ion cyclotron resonance mass spectrometry, Environ. Sci. Technol., 44, 3690–3697, 2010. a
Middlebrook, A. M., Bahreini, R., Jimenez, J. L., and Canagaratna, M. R.: Evaluation of composition-dependent collection efficiencies for the Aerodyne aerosol mass spectrometer using field data, Aerosol Sci. Tech., 46, 258–271, 2012. a
Montero-Martínez, G., Rinaldi, M., Gilardoni, S., Giulianelli, L., Paglione, M., Decesari, S., Fuzzi, S., and Facchini, M. C.: On the water-soluble organic nitrogen concentration and mass size distribution during the fog season in the Po Valley, Italy, Sci. Total Environ., 485, 103–109, 2014. a
Neuberger, A., Decesari, S., Aktypis, A., Andersen, H., Baumgardner, D., Bianchi, F., Busetto, M., Cai, J., Cermak, J., Dipu, S., Ekman, A., Fuzzi, S., Gramlich, Y.,Haslett, S. L., Heikkinen, L., Joutsensaari, J., Kaltsonoudis, C., Kangasluoma, J., Krejci, R., Lupi, A., Marinoni, A., Matrali, A., Mattsson, F., Mohr, C., Nenes, A., Paglione, M., Pandis, S. N., Patel, A., Riipinen, I., Rinaldi, M., Steimer, S. S., Stolzenburg, D., Sulo, J., Vasilakopoulou, C. N., and Zieger, P.: The fog and aerosol interaction research Italy (FAIRARI) campaign, November 2021 to May 2022, Dataset version 1, Bolin Centre Database [data set], https://doi.org/10.17043/fairari-2021-2022-1, 2024. a
Neuberger, A., Decesari, S., Aktypis, A., Andersen, H., Baumgardner, D., Bianchi, F., Busetto, M., Cai, J., Cermak, J., Dipu, S., Ekman, A., Fuzzi, S., Gramlich, Y., Haslett, S. L., Heikkinen, L., Joutsensaari, J., Kaltsonoudis, C., Kangasluoma, J., Krejci, R., Angelo Lupi, Marinoni, A., Matrali, A., Mattsson, F., Mohr, C., Nenes, A., Paglione, M., Pandis, S. N., Patel, A., Riipinen, I., Rinaldi, M., Steimer, S. S., Stolzenburg, D., Sulo, J., Vasilakopoulou, C. N., and Zieger, P.: From Molecules to Droplets: The Fog and Aerosol Interaction Research Italy (FAIRARI) 2021/22 Campaign, B. Am. Meteorol. Soc., 106, E23–E50, 2025. a, b, c, d, e, f, g
Ng, N. L., Brown, S. S., Archibald, A. T., Atlas, E., Cohen, R. C., Crowley, J. N., Day, D. A., Donahue, N. M., Fry, J. L., Fuchs, H., Griffin, R. J., Guzman, M. I., Herrmann, H., Hodzic, A., Iinuma, Y., Jimenez, J. L., Kiendler-Scharr, A., Lee, B. H., Luecken, D. J., Mao, J., McLaren, R., Mutzel, A., Osthoff, H. D., Ouyang, B., Picquet-Varrault, B., Platt, U., Pye, H. O. T., Rudich, Y., Schwantes, R. H., Shiraiwa, M., Stutz, J., Thornton, J. A., Tilgner, A., Williams, B. J., and Zaveri, R. A.: Nitrate radicals and biogenic volatile organic compounds: oxidation, mechanisms, and organic aerosol, Atmos. Chem. Phys., 17, 2103–2162, https://doi.org/10.5194/acp-17-2103-2017, 2017. a
Noone, K. J., Ogren, J. A., Hallberg, A., Heintzenberg, J., Strom, J., Hansson, H.-C., Svenningsson, B., Wiedensohler, A., Fuzzi, S., Facchini, M. C., Arends, B. G., and Berner, A.: Changes in aerosol size- and phase distributions due to physical and chemical processes in fog, Tellus B, 44, 489–504, 1992. a, b, c
Onasch, T., Trimborn, A., Fortner, E., Jayne, J., Kok, G., Williams, L., Davidovits, P., and Worsnop, D.: Soot particle aerosol mass spectrometer: development, validation, and initial application, Aerosol Sci. Tech., 46, 804–817, 2012. a
Paglione, M., Gilardoni, S., Rinaldi, M., Decesari, S., Zanca, N., Sandrini, S., Giulianelli, L., Bacco, D., Ferrari, S., Poluzzi, V., Scotto, F., Trentini, A., Poulain, L., Herrmann, H., Wiedensohler, A., Canonaco, F., Prévôt, A. S. H., Massoli, P., Carbone, C., Facchini, M. C., and Fuzzi, S.: The impact of biomass burning and aqueous-phase processing on air quality: a multi-year source apportionment study in the Po Valley, Italy, Atmos. Chem. Phys., 20, 1233–1254, https://doi.org/10.5194/acp-20-1233-2020, 2020. a, b, c, d, e, f
Paglione, M., Decesari, S., Rinaldi, M., Tarozzi, L., Manarini, F., Gilardoni, S., Facchini, M. C., Fuzzi, S., Bacco, D., Trentini, A., Pandis, S. N., and Nenes, A.: Historical changes in seasonal aerosol acidity in the Po Valley (Italy) as inferred from fog water and aerosol measurements, Environ. Sci. Technol., 55, 7307–7315, 2021. a, b
Paglione, M., Beddows, D. C. S., Jones, A., Lachlan-Cope, T., Rinaldi, M., Decesari, S., Manarini, F., Russo, M., Mansour, K., Harrison, R. M., Mazzanti, A., Tagliavini, E., and Dall'Osto, M.: Simultaneous organic aerosol source apportionment at two Antarctic sites reveals large-scale and ecoregion-specific components, Atmos. Chem. Phys., 24, 6305–6322, https://doi.org/10.5194/acp-24-6305-2024, 2024. a
Perrino, C., Catrambone, M., Dalla Torre, S., Rantica, E., Sargolini, T., and Canepari, S.: Seasonal variations in the chemical composition of particulate matter: a case study in the Po Valley. Part I: macro-components and mass closure, Environ. Sci. Pollut. R., 21, 3999–4009, 2014. a
Petzold, A. and Schönlinner, M.: Multi-angle absorption photometry – a new method for the measurement of aerosol light absorption and atmospheric black carbon, J. Aerosol Sci., 35, 421–441, 2004. a
Powelson, M. H., Espelien, B. M., Hawkins, L. N., Galloway, M. M., and De Haan, D. O.: Brown carbon formation by aqueous-phase carbonyl compound reactions with amines and ammonium sulfate, Environ. Sci. Technol., 48, 985–993, 2014. a
Rabaud, N. E., Ebeler, S. E., Ashbaugh, L. L., and Flocchini, R. G.: Characterization and quantification of odorous and non-odorous volatile organic compounds near a commercial dairy in California, Atmos. Environ., 37, 933–940, 2003. a
Rehbein, P. J., Jeong, C.-H., McGuire, M. L., Yao, X., Corbin, J. C., and Evans, G. J.: Cloud and fog processing enhanced gas-to-particle partitioning of trimethylamine, Environ. Sci. Technol., 45, 4346–4352, 2011. a
Saarikoski, S., Carbone, S., Decesari, S., Giulianelli, L., Angelini, F., Canagaratna, M., Ng, N. L., Trimborn, A., Facchini, M. C., Fuzzi, S., Hillamo, R., and Worsnop, D.: Chemical characterization of springtime submicrometer aerosol in Po Valley, Italy, Atmos. Chem. Phys., 12, 8401–8421, https://doi.org/10.5194/acp-12-8401-2012, 2012. a, b, c, d
Scotto, F., Bacco, D., Lasagni, S., Trentini, A., Poluzzi, V., and Vecchi, R.: A multi-year source apportionment of PM2.5 at multiple sites in the southern Po Valley (Italy), Atmos. Pollut. Res., 12, 101192, https://doi.org/10.1016/j.apr.2021.101192, 2021. a, b
Seinfeld, J. H. and Pandis, S. N.: Atmospheric chemistry and physics: from air pollution to climate change, John Wiley & Sons, ISBN 1118947401, 2016. a
Shen, Y., Pokhrel, R. P., Sullivan, A. P., Levin, E. J. T., Garofalo, L. A., Farmer, D. K., Permar, W., Hu, L., Toohey, D. W., Campos, T., Fischer, E. V., and Murphy, S. M.: Understanding the mechanism and importance of brown carbon bleaching across the visible spectrum in biomass burning plumes from the WE-CAN campaign, Atmos. Chem. Phys., 24, 12881–12901, https://doi.org/10.5194/acp-24-12881-2024, 2024. a
Shingler, T., Dey, S., Sorooshian, A., Brechtel, F. J., Wang, Z., Metcalf, A., Coggon, M., Mülmenstädt, J., Russell, L. M., Jonsson, H. H., and Seinfeld, J. H.: Characterisation and airborne deployment of a new counterflow virtual impactor inlet, Atmos. Meas. Tech., 5, 1259–1269, https://doi.org/10.5194/amt-5-1259-2012, 2012. a, b
Stephens, M., Turner, N., and Sandberg, J.: Particle identification by laser-induced incandescence in a solid-state laser cavity, Appl. Optics, 42, 3726–3736, 2003. a
Sueper, D.: ToF-AMS Data Analysis Software, Jimenez Group, University of Colorado-Boulder [code], http://cires1.colorado.edu/jimenez-group/wiki/index.php/ToF-AMS_Analysis_Software (last access: 8 February 2024), 2024. a, b
Sun, Y. L., Zhang, Q., Anastasio, C., and Sun, J.: Insights into secondary organic aerosol formed via aqueous-phase reactions of phenolic compounds based on high resolution mass spectrometry, Atmos. Chem. Phys., 10, 4809–4822, https://doi.org/10.5194/acp-10-4809-2010, 2010. a
Sun, Y.-L., Zhang, Q., Schwab, J. J., Demerjian, K. L., Chen, W.-N., Bae, M.-S., Hung, H.-M., Hogrefe, O., Frank, B., Rattigan, O. V., and Lin, Y.-C.: Characterization of the sources and processes of organic and inorganic aerosols in New York city with a high-resolution time-of-flight aerosol mass apectrometer, Atmos. Chem. Phys., 11, 1581–1602, https://doi.org/10.5194/acp-11-1581-2011, 2011. a
Suzuki, Y., Kawakami, M., and Akasaka, K.: 1H NMR application for characterizing water-soluble organic compounds in urban atmospheric particles, Environ. Sci. Technol., 35, 2656–2664, 2001. a
Szopa, S., Naik, V., Adhikary, B., Artaxo, P., Berntsen, T., Collins, W. D., Fuzzi, S., Gallardo, L., Kiendler-Scharr, A., Klimont, Z., Liao, H., Unger, N., and Zanis, P.: Short-Lived Climate Forcers, in: Climate Change 2021: The Physical Science Basis. Contribution of Working Group I to the Sixth Assessment Report of the Intergovernmental Panel on Climate Change, edited by: Masson-Delmotte, V., Zhai, P., Pirani, A., Connors, S. L., Péan, C., Berger, S., Caud, N., Chen, Y., Goldfarb, L., Gomis, M. I., Huang, M., Leitzell, K., Lonnoy, E., Matthews, J. B. R., Maycock, T. K., Waterfield, T., Yelekçi, O., Yu, R., and Zhou, B., Cambridge University Press, 817–922, https://doi.org/10.1017/9781009157896.008, 2021. a
Teich, M., van Pinxteren, D., Kecorius, S., Wang, Z., and Herrmann, H.: First quantification of imidazoles in ambient aerosol particles: potential photosensitizers, brown carbon constituents, and hazardous components, Environ. Sci. Technol., 50, 1166–1173, 2016. a
Timko, M. T., Yu, Z., Kroll, J., Jayne, J. T., Worsnop, D. R., Miake-Lye, R. C., Onasch, T. B., Liscinsky, D., Kirchstetter, T. W., Destaillats, H., Holder, A. L., Smith, J. D., and Wilson, K. R.: Sampling artifacts from conductive silicone tubing, Aerosol Sci. Tech., 43, 855–865, 2009. a
UK REACH: Substance Evaluation Conclusion for Imidazole EC No 206-019-2 CAS No 288-32-4, https://echa.europa.eu/documents/10162/572435f5-76b7-6145-1672-565f884f8637 (last access: 20 March 2025), 2018. a
Vecchi, R., Piziali, F., Valli, G., Favaron, M., and Bernardoni, V.: Radon-based estimates of equivalent mixing layer heights: A long-term assessment, Atmos. Environ., 197, 150–158, 2019. a
Weber, R. J., Guo, H., Russell, A. G., and Nenes, A.: High aerosol acidity despite declining atmospheric sulfate concentrations over the past 15 years, Nat. Geosci., 9, 282–285, 2016. a
Youn, J.-S., Crosbie, E., Maudlin, L., Wang, Z., and Sorooshian, A.: Dimethylamine as a major alkyl amine species in particles and cloud water: Observations in semi-arid and coastal regions, Atmos. Environ., 122, 250–258, 2015. a
Yu, L., Smith, J., Laskin, A., Anastasio, C., Laskin, J., and Zhang, Q.: Chemical characterization of SOA formed from aqueous-phase reactions of phenols with the triplet excited state of carbonyl and hydroxyl radical, Atmos. Chem. Phys., 14, 13801–13816, https://doi.org/10.5194/acp-14-13801-2014, 2014. a
Zhang, G., Bi, X., Chan, L. Y., Li, L., Wang, X., Feng, J., Sheng, G., Fu, J., Li, M., and Zhou, Z.: Enhanced trimethylamine-containing particles during fog events detected by single particle aerosol mass spectrometry in urban Guangzhou, China, Atmos. Environ., 55, 121–126, 2012. a
Zhang, Q. and Anastasio, C.: Chemistry of fog waters in California's Central Valley – Part 3: Concentrations and speciation of organic and inorganic nitrogen, Atmos. Environ., 35, 5629–5643, 2001. a
Zhang, Q., Jimenez, J. L., Canagaratna, M. R., Allan, J. D., Coe, H., Ulbrich, I., Alfarra, M. R., Takami, A., Middlebrook, A. M., Sun, Y. L., Dzepina, K., Dunlea, E., Docherty, K., DeCarlo, P. F., Salcedo, D., Onasch, T., Jayne, J. T., Miyoshi, T., Shimono, A., Hatakeyama, S., Takegawa, N., Kondo, Y., Schneider, J., Drewnick, F., Borrmann, S., Weimer, S., Demerjian, K., Williams, P., Bower, K., Bahreini, R., Cottrell, L., Griffin, R. J., Rautiainen, J., Sun, J. Y., Zhang, Y. M., and Worsnop, D. R.: Ubiquity and dominance of oxygenated species in organic aerosols in anthropogenically-influenced Northern Hemisphere midlatitudes, Geophys. Res. Lett., 34, L13801, https://doi.org/10.1029/2007GL029979, 2007. a