the Creative Commons Attribution 4.0 License.
the Creative Commons Attribution 4.0 License.
 | 25 Jul 2025
Characterization of reactive oxidized nitrogen in the global upper troposphere using recent and historic commercial and research aircraft campaigns and GEOS-Chem
Gongda Lu
Robert G. Ryan
Bastien Sauvage
Reactive oxidized nitrogen (NOy) in the upper troposphere (UT) influences global climate, air quality, and tropospheric oxidants, but this understanding is limited by knowledge of the relative contributions of individual NOy components in this undersampled layer. Here, we use sporadic NASA DC-8 aircraft campaign observations, after screening for plumes and stratospheric influence, to characterize UT NOy composition and to evaluate current knowledge of UT NOy as simulated by the GEOS-Chem model. The use of DC-8 data follows confirmation that these intermittent data reproduce NOy seasonality from routine commercial aircraft observations (2003–2019), supporting the use of DC-8 data to characterize UT NOy. We find that peroxyacetyl nitrate (PAN) dominates UT NOy (30 %–64 % of NOy), followed by nitrogen oxides (NOx≡ NO + NO2) (6 %–18 %), peroxynitric acid (HNO4) (6 %–13 %), and nitric acid (HNO3) (7 %–11 %). Methyl peroxy nitrate (MPN) makes an outsized contribution to NOy (14 %–24 %) over the Southeast US relative to the other regions sampled (2 %–7 %). GEOS-Chem, sampled along DC-8 flights, exhibits much weaker seasonality than the DC-8, underestimating summer and spring NOy and overestimating winter and autumn NOy. The model consistently overestimates peroxypropionyl nitrate (PPN) by ∼ 10–16 pptv or 10 %–90 % and underestimates NO2 by 6–36 pptv or 31 %–65 %, as the model is missing PPN photolysis. A model underestimate in MPN of at least ∼ 50 pptv (13-fold) over the Southeast US results from uncertainties in processes that sustain MPN production as air ages. Our findings highlight that a greater understanding of UT NOy is critically needed to determine its role in the nitrogen cycle, air pollution, climate, and the abundance of oxidants.
- Article
(2038 KB) - Full-text XML
-
Supplement
(1293 KB) - BibTeX
- EndNote


Reactive oxidized nitrogen (NOy) in the upper troposphere impacts global climate, surface air quality, and the oxidizing capacity of the whole troposphere (Mickley et al., 1999; Bradshaw et al., 2000; Dahlmann et al., 2011; Worden et al., 2011). NOy is an important climate driver because tropospheric ozone (O3) production is limited by the availability of NOy, particularly in the upper troposphere where the radiative forcing efficiency of O3 peaks (Dahlmann et al., 2011; Worden et al., 2011; Rap et al., 2015). The influence on tropospheric O3 production also affects the abundance of the main atmospheric oxidant, the hydroxyl radical (OH), thus altering the lifetimes of the longer-lived greenhouse gas methane and the air pollutants carbon monoxide (CO) and volatile organic compounds (VOCs) (Murray et al., 2013; Seltzer et al., 2015).
Knowledge of dominant daytime NOy compounds, sources, chemistry, fate, and persistence in the upper troposphere has been largely informed by observations and models used as part of research and commercial aircraft campaigns (Boersma et al., 2011; Marais et al., 2018; Silvern et al., 2018; Travis et al., 2016, 2020). Instruments onboard research aircraft that sample the upper troposphere, in particular the recently retired NASA DC-8 platform, have undergone substantial development to directly measure and derive estimates of a large suite of upper tropospheric NOy compounds. These include nitrogen oxides (NOx≡ NO + NO2), peroxyacetyl nitrate (PAN), and other prominent PAN-type compounds, nitric acid (HNO3), peroxynitric acid (HNO4), alkylnitrates (ALKNs) and, more recently, methyl peroxy nitrate (MPN).
These aircraft campaigns have confirmed that sources of NOy to the upper troposphere are dominated by lightning NOx emissions (Levy et al., 1999; Gressent et al., 2014, 2016; Marais et al., 2018), causing a seasonal maximum in NOy in the summer months and a minimum in the winter in parts of the world, such as the northern midlatitudes, where there is large seasonal variability in lightning activity (Blakeslee et al., 2014; Stratmann et al., 2016). Other NOy source contributors include NOx emissions from cruising altitude aircraft (Brasseur et al., 1996), stratospheric downwelling of air masses laden with HNO3 and NO2 that also promote prompt formation of PANs on mixing with cold upper tropospheric air (Levy et al., 1980; Jacob et al., 2010; Liang et al., 2011), deep convective uplift of surface pollution (Ehhalt et al., 1992; Jaeglé et al., 1998; Bertram et al., 2007), and aged air masses, initially very photochemically active, that accumulate MPN (Nault et al., 2015).
Chemical cycling of dominant daytime NOy components, informed by past review and measurement compilation studies of the free troposphere (Emmons et al., 1997; Bradshaw et al., 2000), is illustrated in Fig. 1. During the day, NO and NO2 are in a photostationary steady state, as NO oxidation, mostly by O3, is balanced by NO2 photolysis. NOx also reacts to form reservoir compounds. For NO2, these include HNO3 from reaction with OH, PANs from reaction with peroxy acyl radicals (RC(O)OO), HNO4 from reaction with the hydroperoxyl radical (HO2), and MPN from reaction with the methyl peroxy radical (CH3O2). PANs in the upper troposphere are typically dominated by PAN, followed by peroxypropionyl nitrate (PPN) (Singh, 1987; Roberts, 1990; Roberts et al., 1998, 2002). For NO, reservoir compounds include ALKNs from reaction with non-acyl peroxy radicals (RO2). Recycling of reservoir compounds back to NOx is dominated by photolysis, as thermally labile peroxy nitrates (PNs) including PANs, HNO4, and MPN are stable against decomposition in the cold upper troposphere (Huey, 2007). This recycling, along with NOy sources to the upper troposphere, sustains upper tropospheric NOx concentrations at ∼ 30 pptv over the remote ocean and ∼ 100 pptv over polluted landmasses (Marais et al., 2018, 2021; Shah et al., 2023). Stable NOx reservoir compounds are transported long distances before subsiding and decomposing on warming, thus supplying other parts of the world with oxidants (HOx) and O3 precursors (NOx and peroxy radicals) (Schultz et al., 1999). Loss processes in the dry upper troposphere are slow and dominated by subsidence, resulting in long NOy lifetimes of 10–20 d (Logan, 1983; Prather and Jacob, 1997). Similarly, NOx has a lifetime of about a week compared to less than a day in the boundary layer (< 2 km) (Jaeglé et al., 1998).
Nighttime NOy chemistry is also important, but aircraft campaign measurements of the nocturnal upper troposphere mostly consist of total NOy from commercial aircraft campaigns. The nighttime chemistry not shown in Fig. 1 includes NO reaction with OH, forming nitrous acid (HONO) that accumulates in the absence of photolysis as well as NO2 reaction with O3 to form the nitrate radical (NO3), which further reacts with NO2 to produce N2O5, a precursor of aerosol nitrate (pNO3) (Bradshaw et al., 2000).
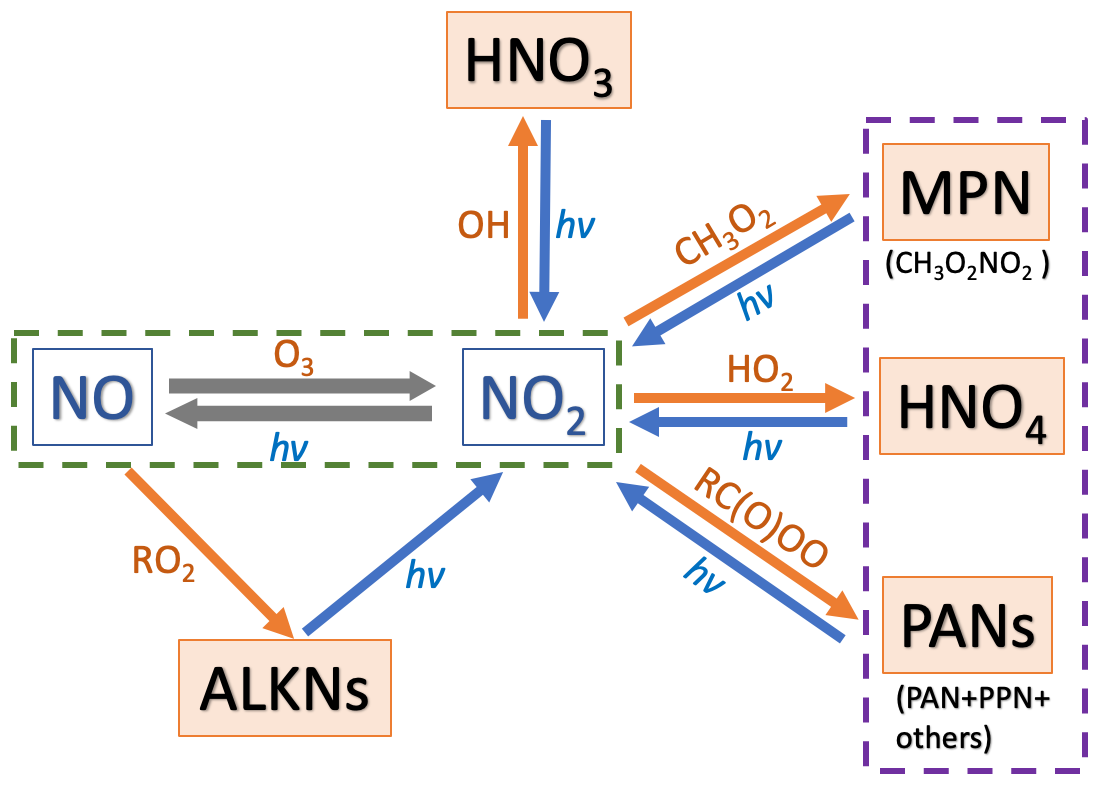
Figure 1Dominant daytime reactive oxidized gas-phase nitrogen components and reaction pathways in the upper troposphere. Arrow colours distinguish formation (orange) and photolytic (hν) decomposition (blue) of reservoir compounds. Dashed boxes indicate compounds of the NOx family (green) and those classed as peroxy nitrates (purple). “R” in RC(O)OO and RO2 represents an alkyl group.
Modelling studies evaluating the best understanding of NOy in the upper troposphere routinely identify stark discrepancies between observed and modelled total NOy, NOx, and the ratio of NO-to-NO2 in the upper layers of the troposphere (Jaeglé et al., 1998; Talbot et al., 1999; Bertram et al., 2007; Hudman et al., 2007; Liang et al., 2011; Nault et al., 2015; Huntrieser et al., 2016; Travis et al., 2016; Fisher et al., 2018; Silvern et al., 2018; Lee et al., 2022; Cohen et al., 2023). These studies have either focused on a few NOy components or a single aircraft campaign. A more holistic investigation of all NOy components is needed, as advocated by Murray et al. (2021), to reduce uncertainties in knowledge of the current, past, and potential future abundances of tropospheric oxidants. Past studies have also documented the challenges of examining measurements made in the upper troposphere. These include screening for stratospheric influence, determining the height of the chemical tropopause, and selecting observations and campaigns that are climatologically representative of a standard atmosphere (Weinheimer et al., 1994; Fuelberg et al., 2000; Bertram et al., 2007; Barth et al., 2015; Huntrieser et al., 2016). Instruments measuring NO2 are also susceptible to interference from decomposition of the least thermally stable NOx reservoir compounds, HNO4 and MPN, that are abundant in the cold upper troposphere (Ryerson et al., 2000; Shah et al., 2023). NOy from these same instruments can also be biased by decomposition of non-NOy fixed nitrogen compounds prevalent in the upper troposphere, such as hydrogen cyanide (HCN) (Bradshaw et al., 1998).
Here, we use NASA DC-8 research and In-service Aircraft for a Global Observing System (IAGOS) commercial aircraft campaign measurements, each spanning more than a decade, to characterize global NOy seasonality and composition in the upper troposphere. This follows careful campaign and data selection to isolate observations sampling the upper troposphere under standard conditions for broad assessment of consistent NOy seasonality between DC-8 and routine commercial aircraft campaign observations. We go on to use the DC-8 data to critique contemporary understanding of upper tropospheric NOy as simulated by the GEOS-Chem model.
2.1 Research aircraft observations of total and components of NOy
The DC-8 research aircraft has sampled ambient air covering the near full extent of the troposphere since its maiden campaign in 1985 (Culter, 2009). Many of the initial campaigns included instruments that measured a subset of the NOy components shown in Fig. 1, typically continuous measurements of total NOy, NO, HNO3, PAN and PPN, and whole air sampler (WAS) collection and laboratory detection of C1–C5 ALKNs (Singh et al., 1999). Since 2004, DC-8 campaigns have included continuous measurements of HNO4, other PAN-type species, and total PNs (Singh et al., 2006). Given this, we only consider DC-8 campaigns with a relatively consistent suite of instruments that mostly sampled well-mixed air representative of a climatologically standard atmosphere. These criteria eliminate the summer 2004 Intercontinental Chemical Transport Experiment-North America (INTEX-NA) campaign (Singh et al., 2006; Singh et al., 2009), which is the only DC-8 campaign since 2004 not to include a NOx and NOy chemiluminescence analyser, and the summer 2012 Deep Convective Clouds and Chemistry (DC3) campaign, which targeted convective thunderstorms influenced by fresh surface pollution and lightning NOx emissions (Barth et al., 2015).
The DC-8 campaigns we use are the Arctic Research of the Composition of the Troposphere from Aircraft and Satellites (ARCTAS) over the Arctic and sub-Arctic in spring and summer 2008 (Jacob et al., 2010), the Studies of Emissions and Atmospheric Composition, Clouds and Climate Coupling by Regional Surveys (SEAC4RS) over the Southeast US in late summer and early autumn 2013 (Toon et al., 2016), the Korea-United States Air Quality (KORUS-AQ) over South Korea in late spring and early summer 2016 (Crawford et al., 2021), and the Atmospheric Tomography Mission (ATom), which included four sub-campaigns along the same flight path from pole to pole over the Atlantic and Pacific Oceans in all four seasons from 2016 to 2018 (Thompson et al., 2021). ATom sub-campaigns are ATom-1 in July–August, ATom-2 in January–February, ATom-3 in September–October, and ATom-4 in April–May. The data for these campaigns are from NASA data portals for each campaign, downloaded as merged 1 min files for ARCTAS (NASA, 2009), SEAC4RS (NASA, 2015), and KORUS-AQ (NASA, 2017) and as two separate merged files for ATom, with the WAS C1–C5 ALKNs data at variable time intervals of 40 s, 1, and 2 min and without the WAS C1–C5 ALKNs data at 1 min resolution (NASA, 2021).
Figure 2 shows the global sampling extent of the upper troposphere by NASA DC-8 after applying filtering criteria to the data to isolate observations representative of photochemical steady state (PSS) conditions. For this, we select daytime (08:30–15:30 local solar time or LST) observations within a wide pressure range from 180 hPa (∼ 8 km) to the DC-8 ceiling of 450 hPa (∼ 12 km). This captures the full vertical extent of the midlatitude upper troposphere but not the tropics. The tropical tropopause, according to NASA Modern-Era Retrospective analysis for Research and Applications version 2 (MERRA-2) meteorology, extends to ∼ 16 km. We separate the stratosphere from the troposphere with a tropopause definition that can be applied to all datasets. We remove data with observed O3 concentrations above thresholds that represent the location of the chemical tropopause (Zahn et al., 2002). The thresholds we use are a single year-round value for the tropics (20° N to 20° S) of 100 ppbv (Dameris, 2015) and seasonally varying values everywhere else calculated using the day-of-year dependent O3 tropopause equation derived by Zahn et al. (2002) from the inverse relationship between O3 and CO observations from commercial aircraft campaigns. These are 120 ppbv in spring, 103 ppbv in summer, 74 ppbv in autumn, and 91 ppbv in winter. We also screen for stratospheric intrusions (identified as observations with > 1.25 mol mol−1) (Hudman et al., 2007), fresh NOx emissions ( mol mol−1), fresh convection (large (> 10 nm diameter) condensation nuclei > 104 cm−3), biomass burning plumes (CO > 200 ppbv and acetonitrile > 200 pptv) (Shah et al., 2023) as well as instances where NO2 photolysis frequencies are approximately zero. The latter removes high latitude ATom measurements obtained at 08:30–15:30 LST under dark conditions during polar twilight or polar night. The data that are retained correspond to solar zenith angles ≤ 80° in polar regions and ≤60° at other latitudes. The proportion of observations at 450–180 hPa is 42 %–50 % for ATom and 16 %–37 % for the other campaigns. After applying all other data screening, 20 % of all data are retained for ATom and 7 %–11 % for the other campaigns.
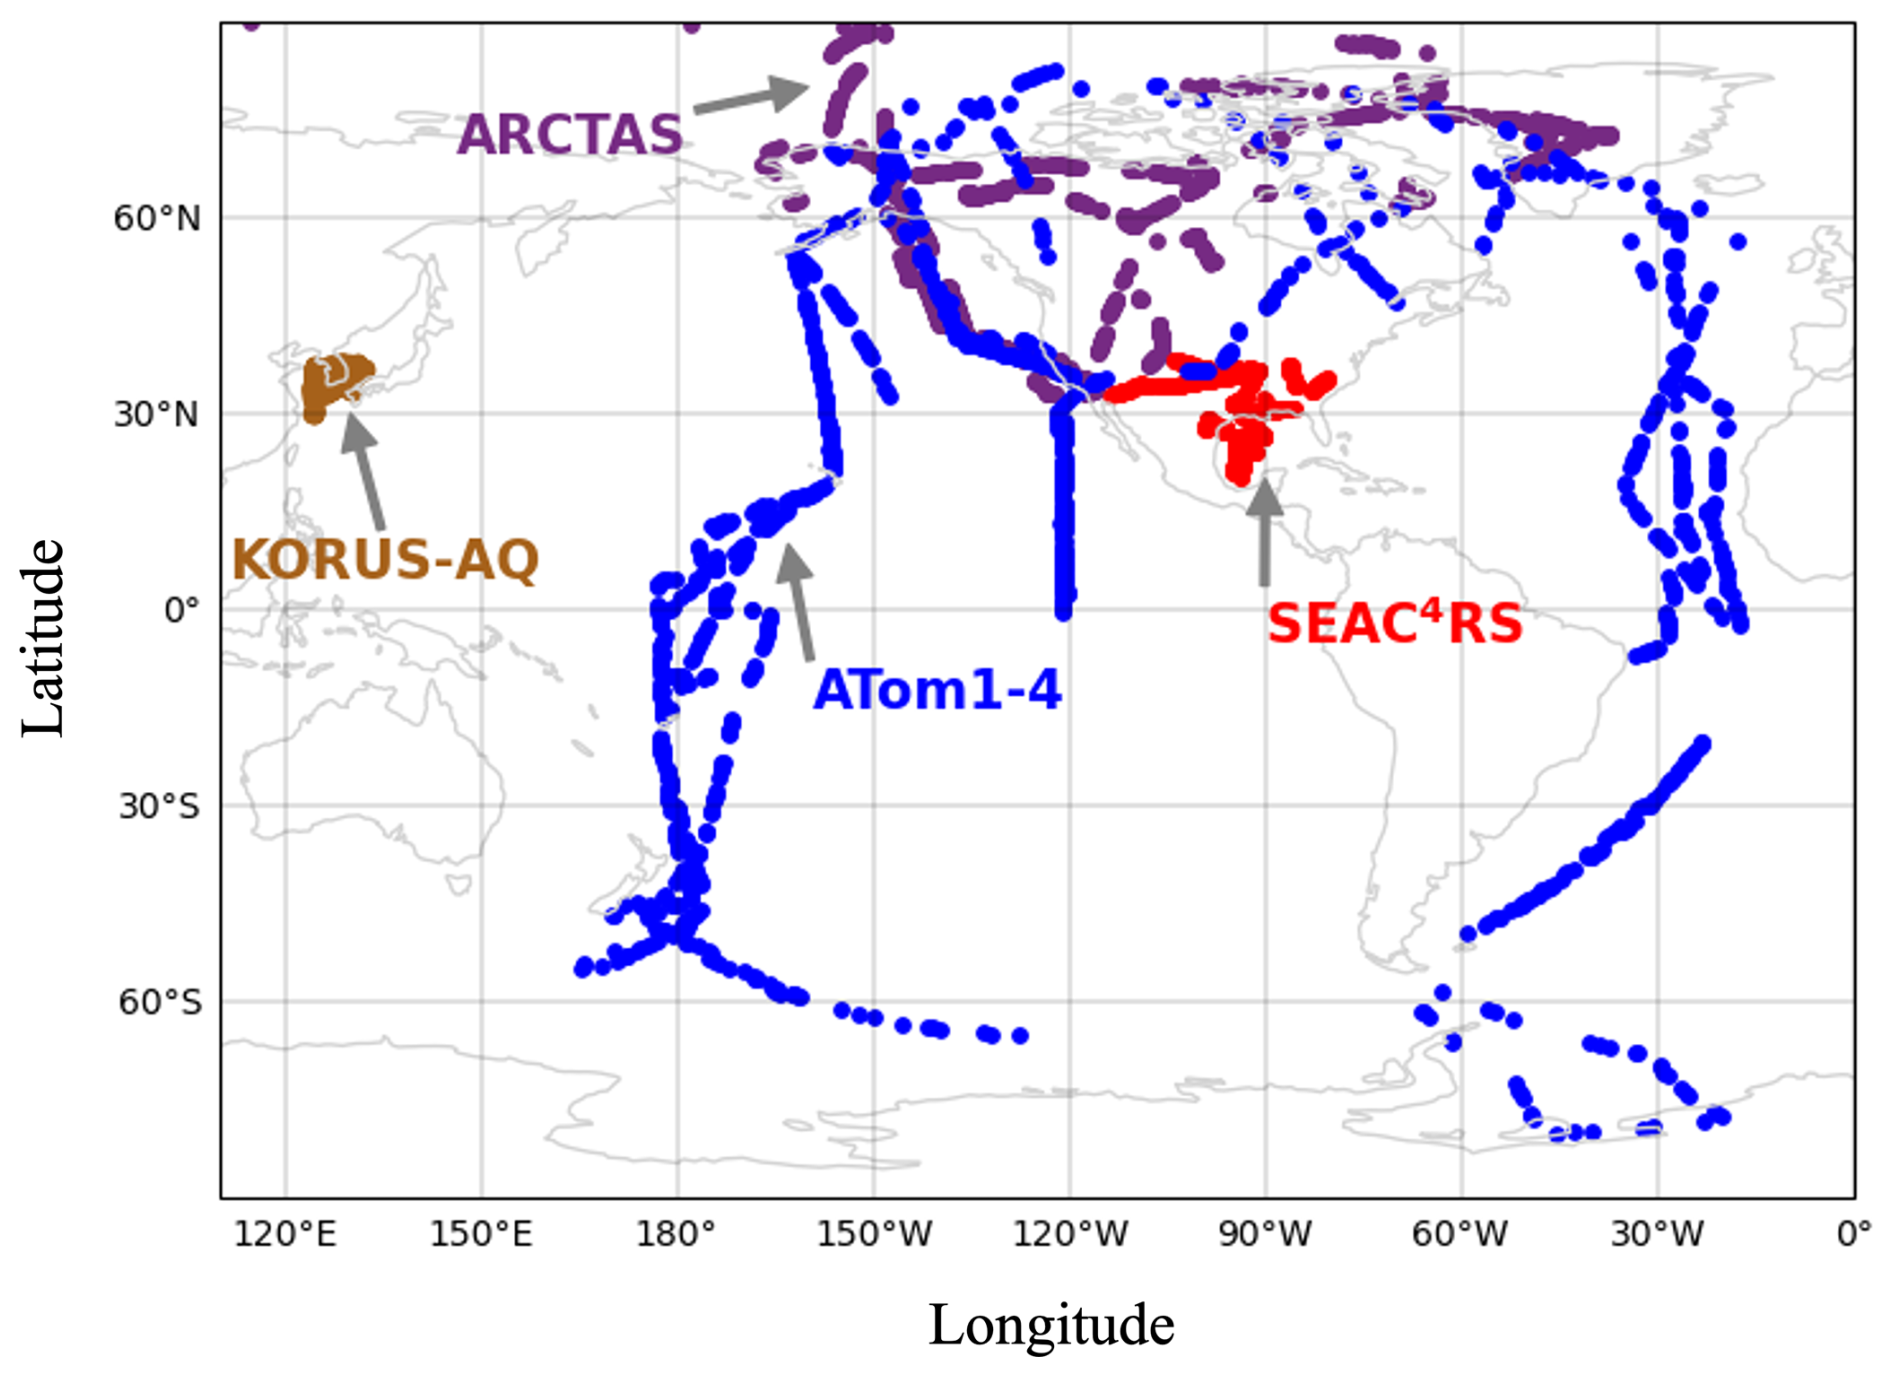
Figure 2Extent of NASA DC-8 sampling of the upper troposphere under standard, steady state conditions. Colours distinguish ARCTAS (plum), SEAC4RS (red), KORUS-AQ (brown), and ATom (blue). ATom points are 1 min resolution data.
The DC-8 instruments measuring NOy components (Fig. 1) that are common to all campaigns include a chemiluminescence instrument measuring NO, NO2, and total NOy (Ryerson et al., 2000; Pollack et al., 2010; Bourgeois et al., 2022), a chemical ionization mass spectrometer (CIMS) measuring HNO3 (Crounse et al., 2006), a CIMS measuring HNO4, PAN, PPN, and other PANs (Huey, 2007), and a Whole Air Sampler (WAS) collecting samples analysed in the laboratory using gas chromatography with flame ionization and atomic emission to detect C1–C5 ALKNs (Blake et al., 2003). The other PANs measured with the CIMS include peroxyacryloyl nitrate (APAN), peroxyisobutyryl nitrate (PiBN), peroxybutyryl nitrate (PBN), and peroxybenzoyl nitrate (PBZN). Other instruments deployed for select campaigns are Thermal-Dissociation Laser Induced Fluorescence (TD-LIF) measuring NO2, total PNs, and total ALKNs (ARCTAS, KORUS-AQ, SEAC4RS) (Day et al., 2002) and the PAN and Trace Hydrohalocarbon ExpeRiment (PANTHER) instrument measuring PAN (ATom). There are also TD-LIF methyl peroxy nitrate (MPN) measurements reported in the SEAC4RS dataset and derived for ARCTAS by Browne et al. (2011).
Concentrations of NO2 in the upper troposphere are close to chemiluminescence instrument uncertainty (Pollack et al., 2010; Bourgeois et al., 2022), and the measurements include interference from decomposition of NOx reservoir compounds in the instrument inlet. The Reed et al. (2016b) temperature-dependent inlet temperature decomposition profiles of individual NOx reservoir compounds for an instrument similar to that operated on the DC-8 suggest interference of 80 %–100 % MPN and 15 %–45 % HNO4 for the typical inlet temperature range of the DC-8 chemiluminescence instrument of 20–30 °C (Bourgeois et al., 2022). For the campaigns that measured HNO4 and derived or measured MPN, this amounts to 13–27 pptv for ARCTAS and 71–92 pptv for SEAC4RS. Given this, we instead calculate NO2 using the NO–NO2 photochemical steady state (PSS) approximation, as is now standard (Travis et al., 2016; Shah et al., 2023; Horner et al., 2024). Conversion of NO to NO2, mostly (75 %) due to oxidation by O3 in the upper troposphere (Silvern et al., 2018), is balanced by NO2 photolysis back to NO:
As NOx is in steady state for the daylight observations we isolate, NO2 can be calculated as follows:
Compounds in square brackets are in molecules cm−3. NO and NO2 are in pptv. Terms not introduced yet include the NO2 photolysis frequency, , in s−1; bromine monoxide (BrO); and rate constants of NO oxidation (Reaction R1) (k1−3) in cm3 molecule−1 s−1. Temperature-dependent values of k1−3 are those recommended by the Jet Propulsion Laboratory (JPL) (Burkholder et al., 2020), calculated using DC-8 ambient temperature measurements. NO, [O3], and are from the DC-8 measurements, and [HO2] is from the DC-8 measurements for all campaigns except SEAC4RS when it was not measured. We use GEOS-Chem (detailed in Sect. 2.3) simulated [HO2] to estimate SEAC4RS PSS NO2. [BrO] is obtained from GEOS-Chem for all campaigns. NO is also converted to NO2 by organic peroxy radicals (RO2), but we ignore this reaction as it is relatively insignificant throughout the free troposphere (Shah et al., 2023).
The NOy components not measured during specific campaigns are inferred. These include HNO4 for KORUS-AQ and ATom-3-4, PPN for ATom-1-2, and MPN for ARCTAS, ATom-1-4, and KORUS-AQ. The approaches used to infer these values differ, informed by the results; therefore, a detailed description of this inference is provided in Sect. 3.2.
2.2 Commercial aircraft observations of total NOy
We use routine observations of upper tropospheric total NOy from instruments on commercial long-haul passenger aircraft to determine if the intermittency and brevity of DC-8 campaign observations are representative of climatological conditions. The In-service Aircraft for a Global Observing System (IAGOS) European research infrastructure (Boulanger et al., 2018) provides routine in situ measurements of NOy (Petzold et al., 2015). These are available from two IAGOS programmes: the Measurement of Ozone and Water Vapor by Airbus In-Service Aircraft (MOZAIC) (Marenco et al., 1998) from 2001 to 2005 (Volz-Thomas et al., 2005) and the Civil Aircraft for the Regular Investigation of the Atmosphere Based on an Instrument Container (CARIBIC) since December 2004 (Brenninkmeijer et al., 2007; Stratmann et al., 2016).
We consider the MOZAIC and CARIBIC observations together (collectively named IAGOS), as both programmes employed a chemiluminescence instrument with the same NOy detection technique (Volz-Thomas et al., 2005; Brenninkmeijer et al., 2007). Direct intercomparison of NOy is not possible, as there is no overlap in MOZAIC and CARIBIC NOy. Data from 2003 to 2019 are used: 2003–2005 for MOZAIC and 2005–2019 for CARIBIC. We isolate daytime, upper tropospheric observations by applying the same O3 tropopause, stratospheric O3 intrusion, and daytime filtering as is applied to DC-8 data (Sect. 2.1), using IAGOS O3 and CO measurements. There are no NO2 photolysis frequency measurements, but the requirement for spatial coincidence with ATom excludes polar twilight and night measurements at high latitudes. We do not screen for observations impacted by fresh emissions, vertical convection, or biomass burning plumes, due to unavailability of concurrent measurements of suitable chemical tracers in the IAGOS data. As we consider 17 years of IAGOS data, we assume that the influence of these is dampened in the long-term median of NOy. Both the IAGOS and DC-8 data are gridded to the same 2° latitude × 2.5° longitude grid.
2.3 The GEOS-Chem model
We use the GEOS-Chem global 3D chemical transport model version 13.0.2 (https://doi.org/10.5281/zenodo.4681204, The International GEOS-Chem User Community, 2021) to represent contemporary understanding of upper tropospheric NOy for comparison to DC-8. The model is driven with consistent MERRA-2 assimilated meteorology at 2° × 2.5° (latitude × longitude) over 47 vertical layers from the surface of the Earth to 0.01 hPa. The model emissions local to the upper troposphere include cruising altitude aircraft from the Aviation Emissions Inventory Code (AEIC) (Stettler et al., 2011) and lightning emissions as described in Murray et al. (2012). Surface emissions of NOx and VOC precursors of ALKNs and PNs are from the anthropogenic Community Emissions Data System (CEDS) inventory of Hoesly et al. (2018); the Model of Emissions of Gases and Aerosols from Nature (MEGAN) biogenic VOC inventory version 2.1 (Guenther et al., 2012); the soil NOx emission inventory of Hudman et al. (2012); and the Global Fire Emissions Database version 4 with small fires (GFED4s) for open burning of biomass (Giglio et al., 2013). Wet deposition of gas-phase HNO3, the terminal sink for NOy subsiding from the upper troposphere, includes in-cloud (rainout) and below-cloud (washout) scavenging as detailed in Amos et al. (2012) and enhanced scavenging as described by Luo et al. (2020).
We sample the model at the same time and location as the DC-8 observations using the ObsPack diagnostic (https://www.esrl.noaa.gov/gmd/ccgg/obspack/, last access: 23 October 2021), following a minimum 10-month spin-up preceding each campaign to initialize chemistry and large-scale circulation throughout the troposphere. Modelled components of NOy include NO, NO2, HNO3, HNO4, PAN, PPN, peroxymethacroyl nitrate (MPAN), MPN, and ALKNs.
3.1 DC-8 campaign NOy seasonality and budget closure
Figure 3 compares seasonality in UT NOy from IAGOS and DC-8. Most of the overlap is with ATom along the North Atlantic flight corridor in all seasons, ARCTAS over the Canadian Arctic and Greenland in March–May (MAM) and June–August (JJA), and SEAC4RS over the Southeast US in September–November (SON). IAGOS NOy exhibits similar peaks in spring (563 pptv) and summer (565 pptv), due to intensive seasonal lightning in the Northern Hemisphere (Stratmann et al., 2016). The decline in this source decreases NOy in autumn to 365 pptv, and NOy further decreases in winter to an annual minimum of 284 pptv.
DC-8 NOy seasonality is similar to that of IAGOS, though the magnitude of DC-8 NOy is consistently, on average, ∼ 130 pptv (range of 80 pptv in SON to 170 pptv in DJF) less than IAGOS NOy in all seasons. The ∼ 130 pptv greater IAGOS NOy likely results from differences in sampling altitudes. The two campaigns sample distinct altitude ranges of the upper portion of the upper troposphere centred at ∼ 240 hPa (∼ 10 km) for IAGOS and a wider vertical extent of the lower portion of the upper troposphere centred at ∼ 360 hPa (∼ 1.5 km below IAGOS) for DC-8 (Fig. S1 in the Supplement). There is a general pattern of a steep increase in NOy with altitude, with the exception of IAGOS layers located near 300 hPa in March–May and September–November (Fig. S1). Average NOy is similar between the two campaigns for the rare instances that DC-8 and IAGOS sample the same pressure layers (Fig. S1). Another minor factor may be IAGOS NOy instrument interference from HCN. The IAGOS chemiluminescence instruments use a hydrogen (H2) reagent to convert oxygenated nitrogen compounds to NO, whereas DC-8 uses CO, a compound not permitted on commercial aircraft (Bradshaw et al., 1998; Volz-Thomas et al., 2005; Thomas et al., 2015). The H2 reagent converts anywhere from 2 % to 20 % of HCN to NOy (Weinheimer, 2006). HCN ambient concentrations typically seasonally vary from ∼ 200 to 300 pptv in the upper troposphere, amounting to an interference of 4–60 pptv (Li et al., 2003; Le Breton et al., 2013).
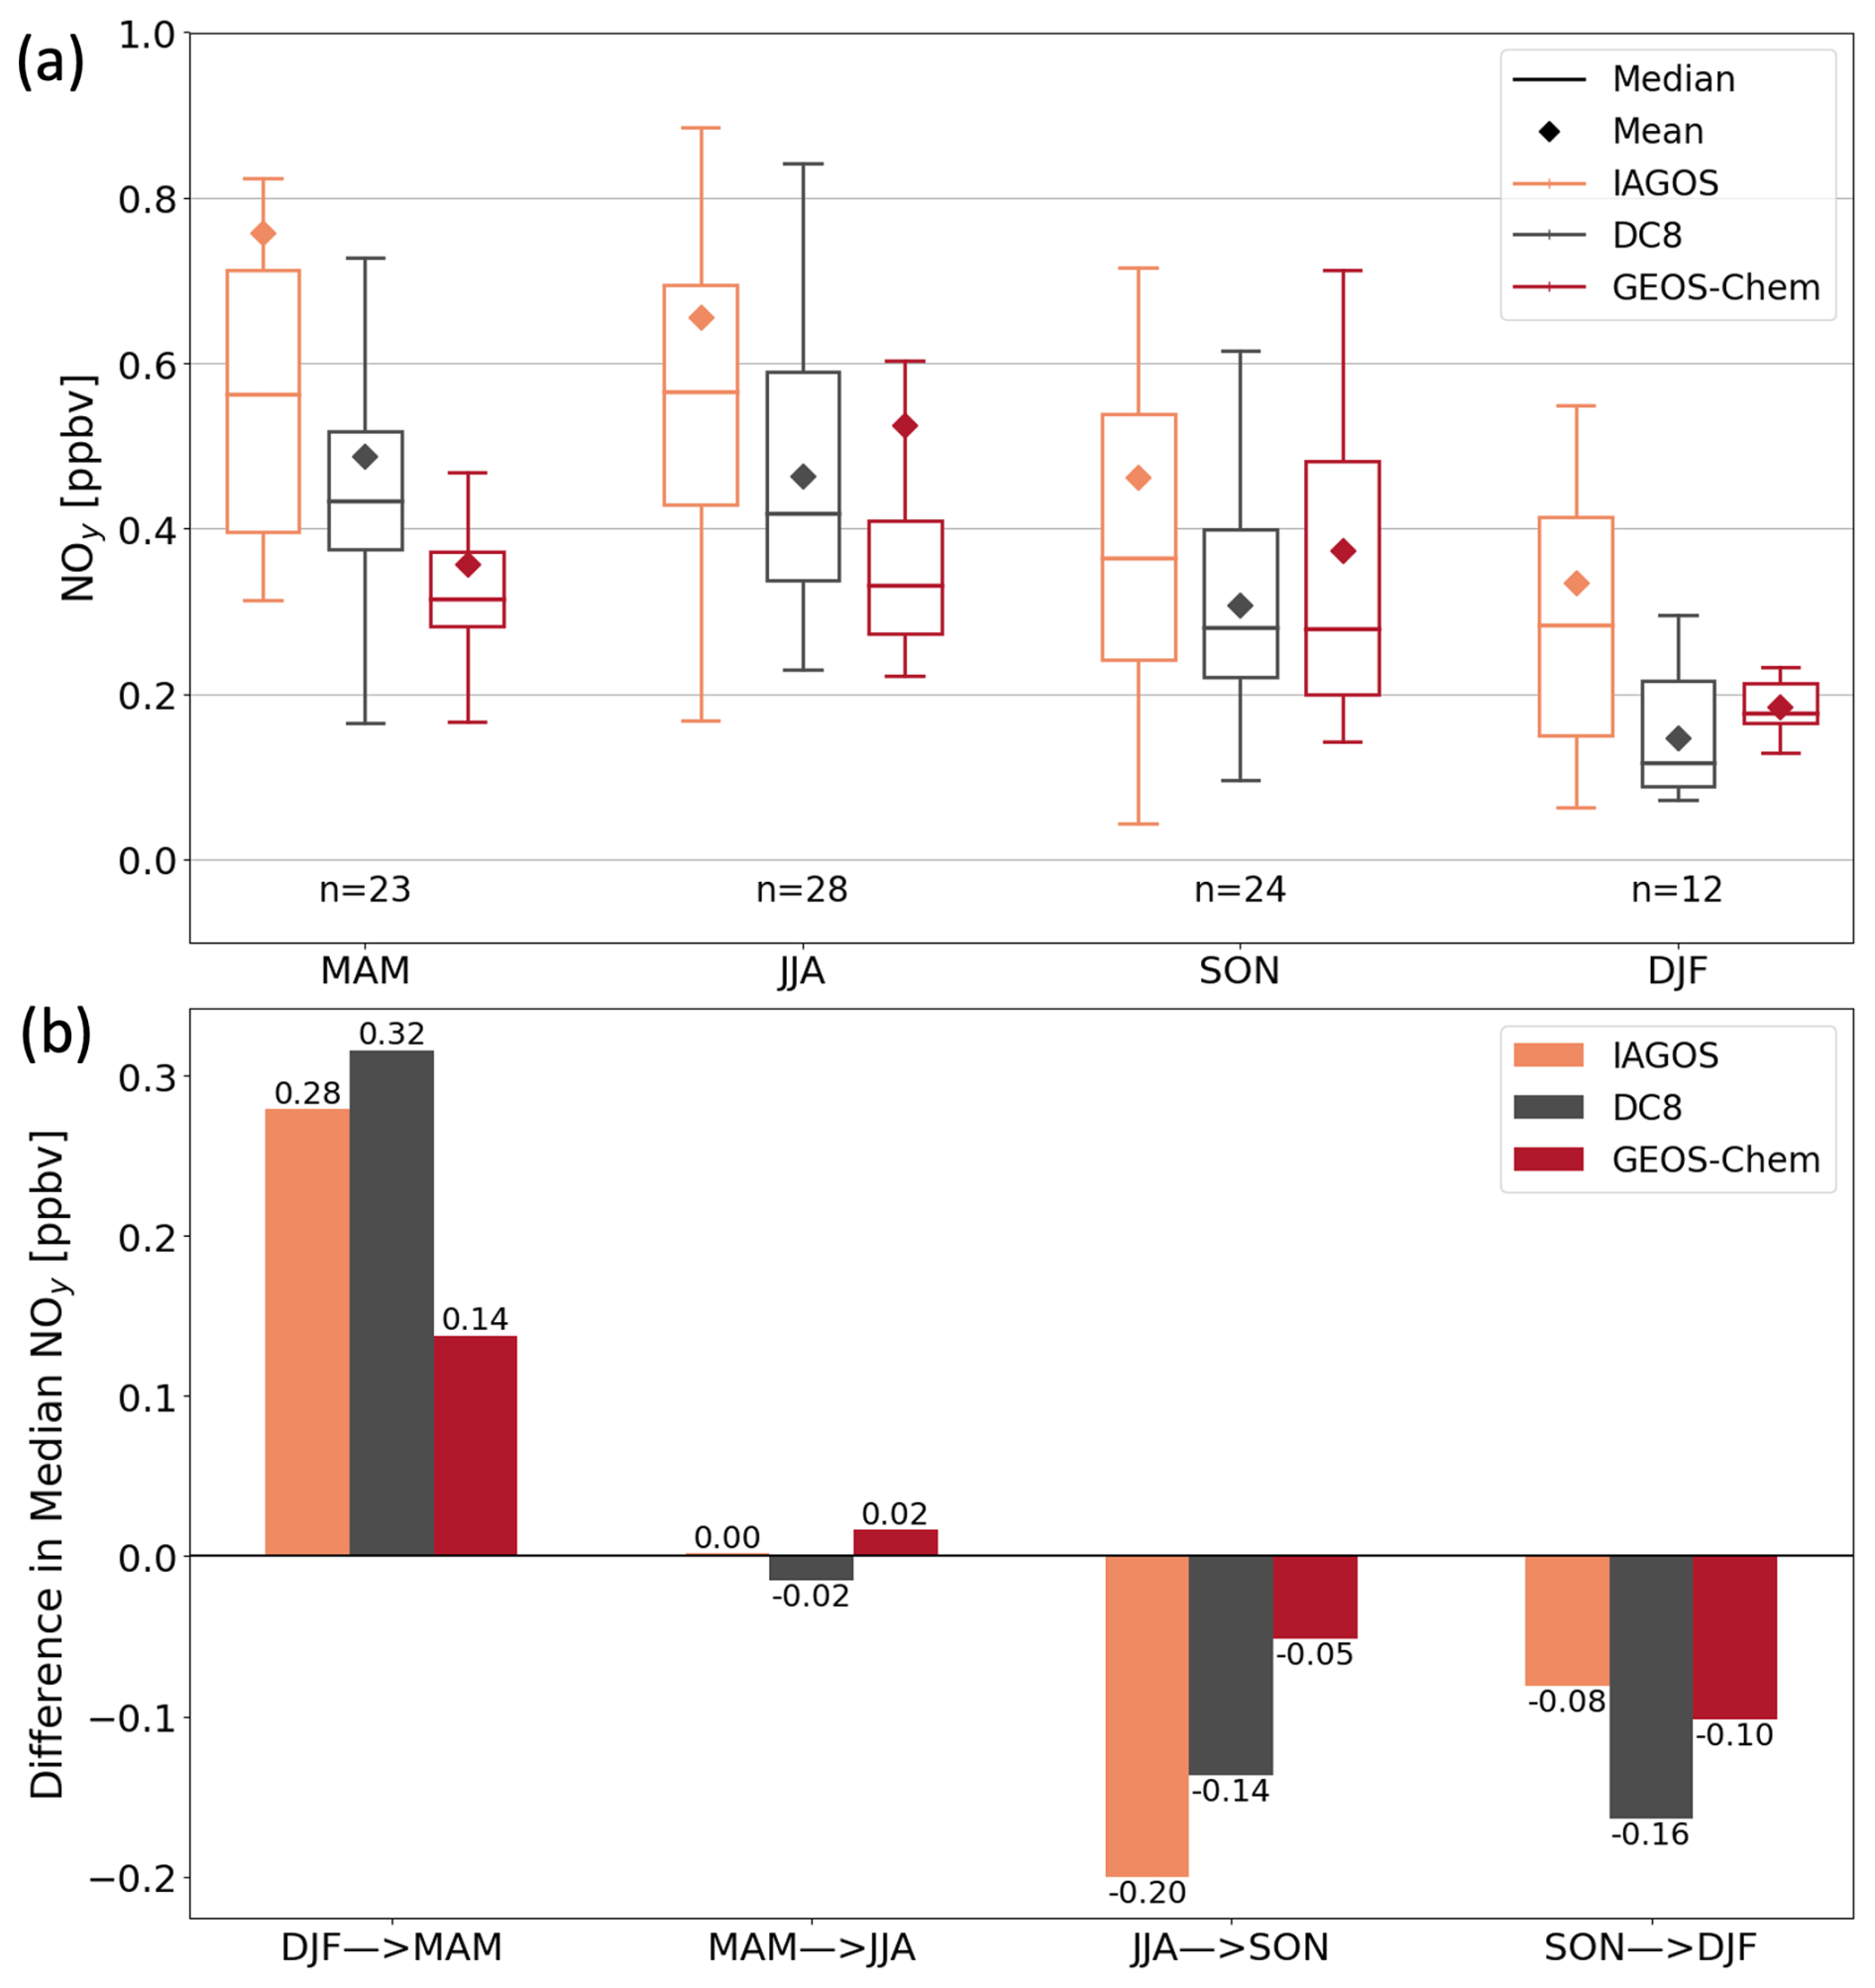
Figure 3Seasonality of Northern Hemisphere upper tropospheric NOy. Panels show seasonal means and medians (a) and seasonal transitions (b) of collocated gridded 2° × 2.5° NOy from IAGOS (orange), DC-8 (grey), and GEOS-Chem (red). Data in (a) are medians (lines), 25th and 75th percentiles (boxes), and means (diamonds). Inset text in (a) gives the number (n) of overlapping grid cells. Seasonality in (b) is the change in median NOy in (a) from one season to the next.
Figure 4 shows the relationship between the sum of individual NOy components and total NOy for each DC-8 campaign. We use these scatterplots to determine whether most NOy components are measured in each campaign, given our intention to use DC-8 to assess contemporary understanding of upper tropospheric NOy. The instruments and individual components of NOy summed for comparison with total NOy are listed in Table 1. The measured components include NO; PSS NO2 (Eq. 1); HNO3; PAN measured as PAN for all ATom sub-campaigns and as part of total PNs for ARCTAS, SEAC4RS, and KORUS-AQ; HNO4 measured as HNO4 for ATom-1 and -2 and as part of total PNs for ARCTAS, SEAC4RS, and KORUS-AQ; C1–C5 ALKNs for all ATom sub-campaigns; total ALKNs for SEAC4RS, KORUS-AQ, and ARCTAS; PPN and other PANs for all except ATom-1 and -2; and MPN as part of total PNs for ARCTAS, SEAC4RS, and KORUS-AQ. The evaluation in Fig. 4 is biased towards the Northern Hemisphere, as the low time resolution sampling of the WAS C1–C5 ALKNs during ATom leads to loss of data in the Southern Hemisphere (Fig. 2) to achieve coincidence of DC-8 total and individual components of NOy.
Table 1Observations of individual NOy components summed to assess budget closure in Fig. 4.
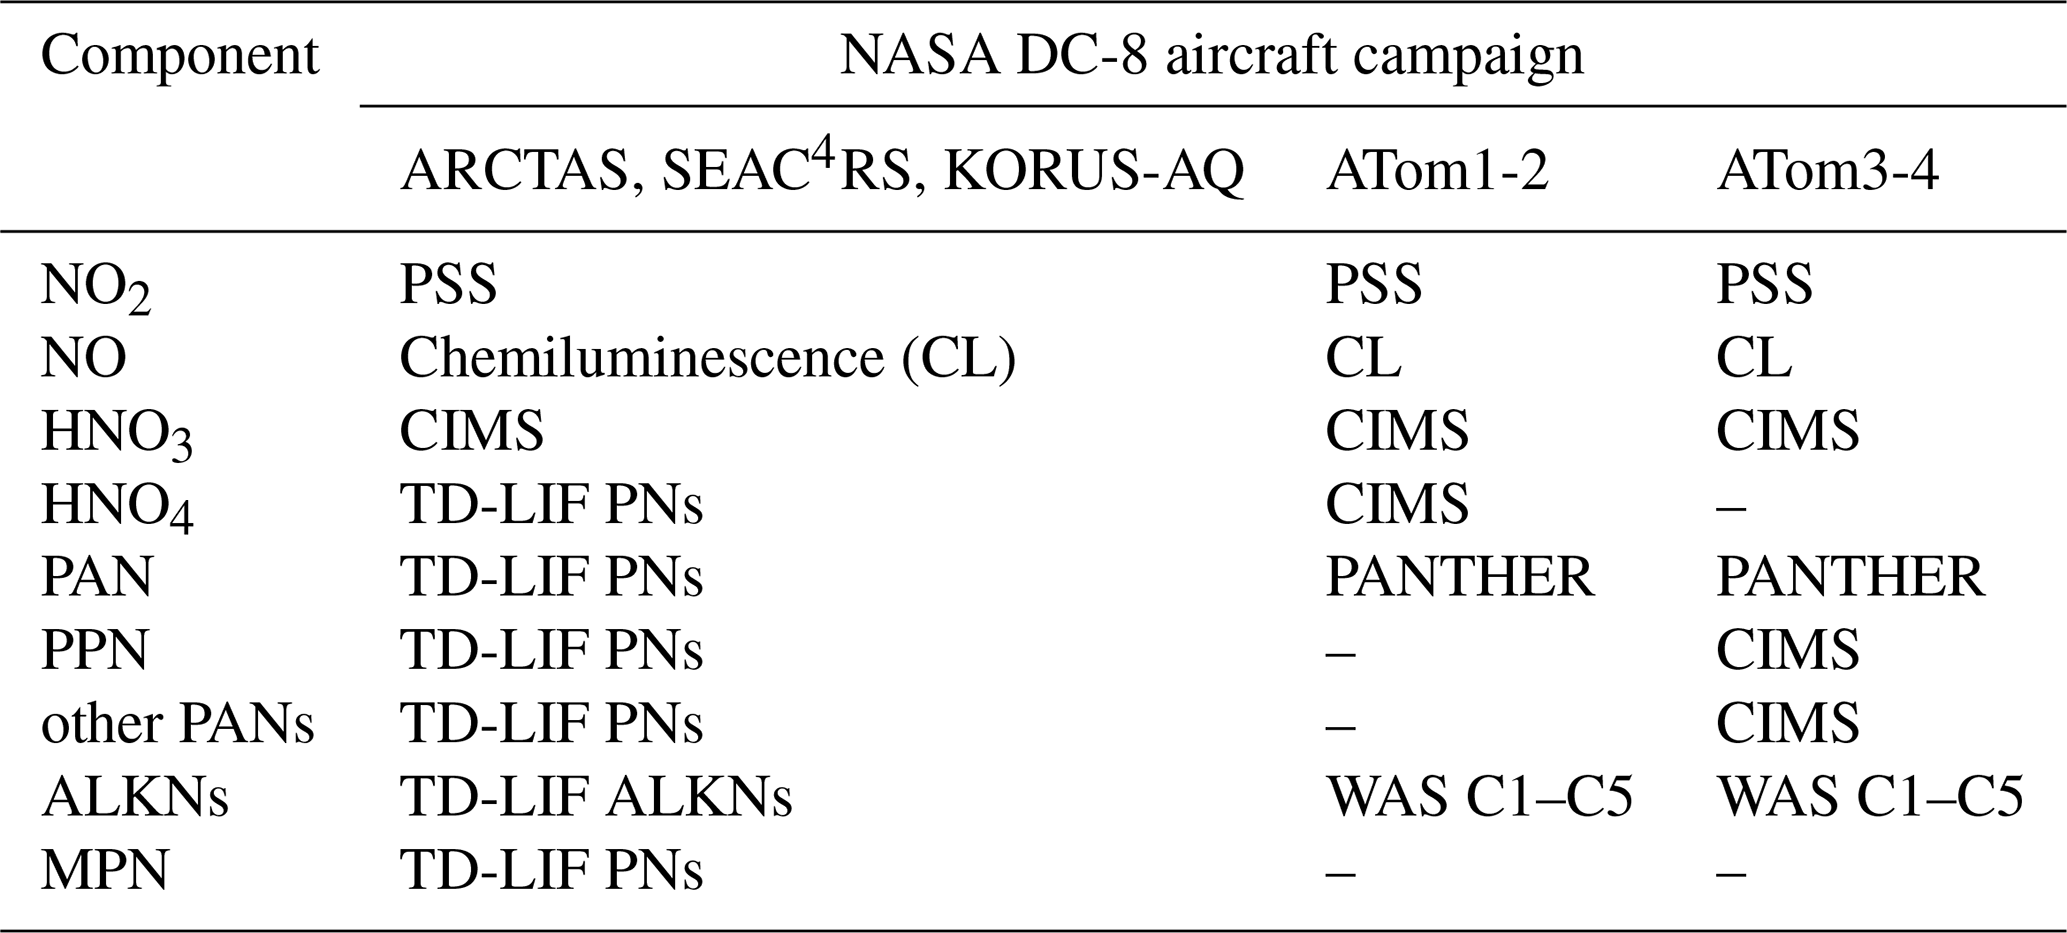
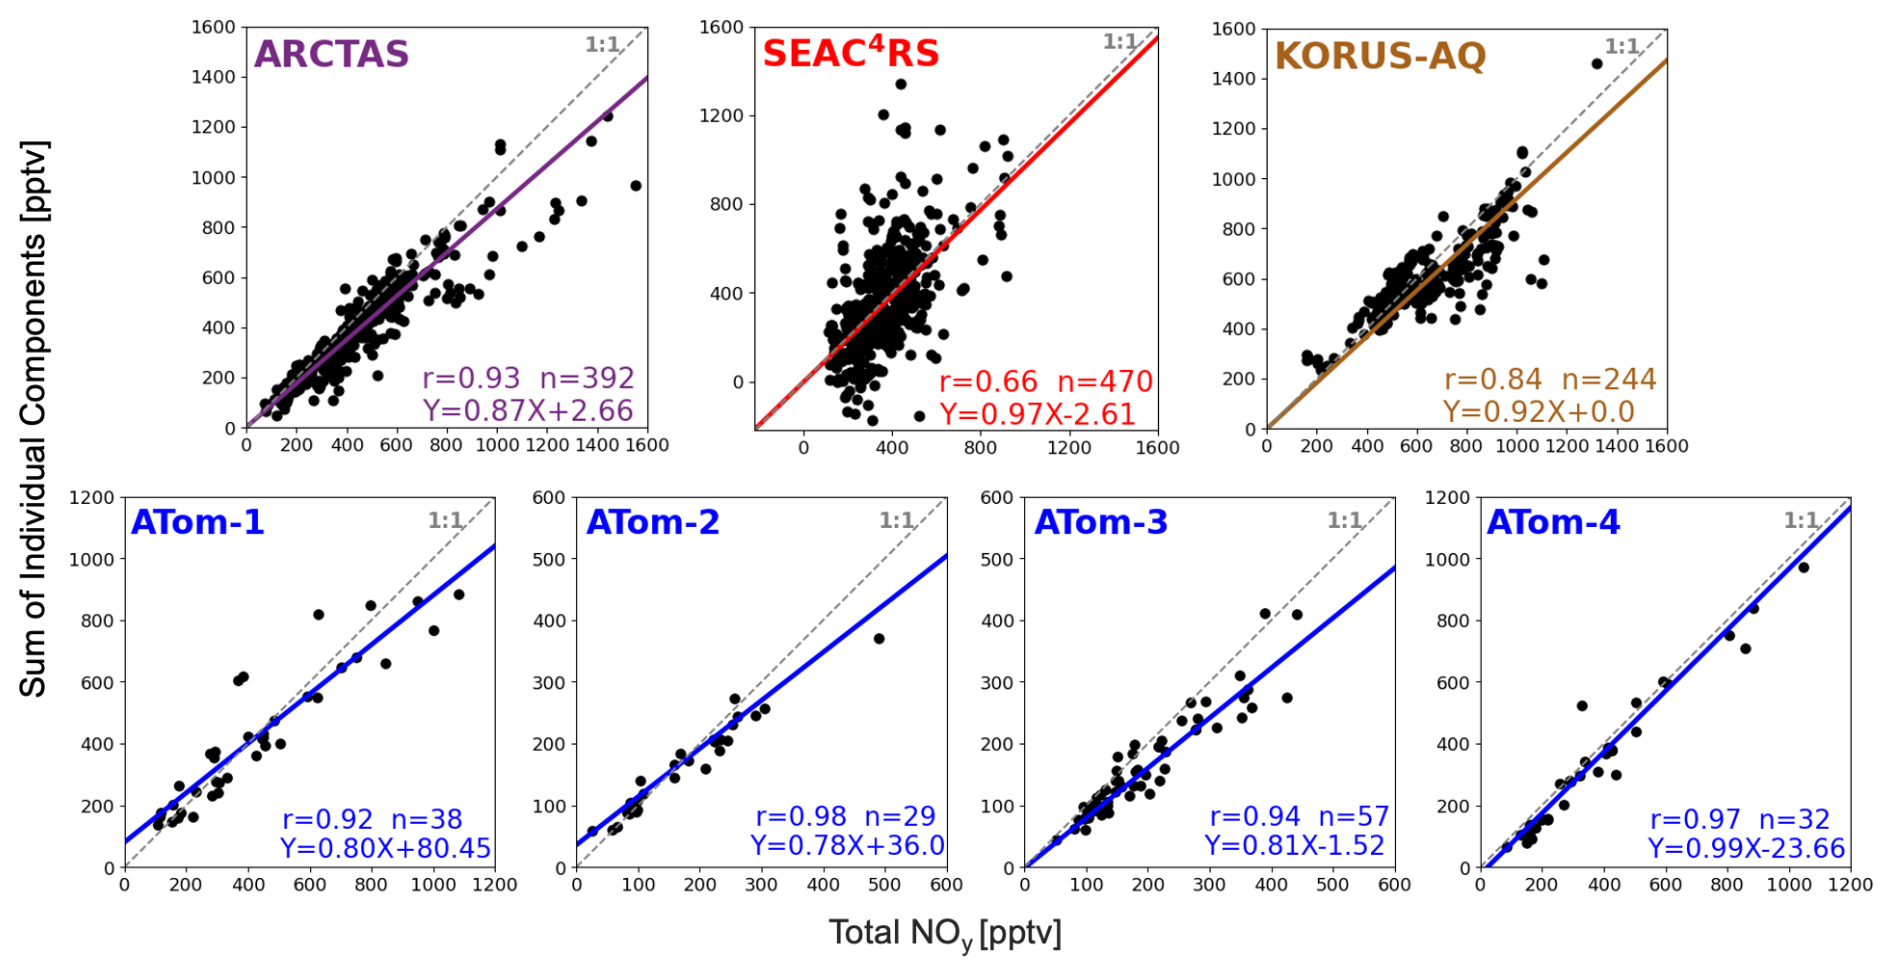
Figure 4Proportion of reactive oxidized nitrogen components measured during each campaign. Individual points compare the coincident sum of individual NOy components (Table 1) to measured total NOy during NASA DC-8 campaigns. Individual NOy components used in the figure are detailed in the text. Dashed grey lines represent the 1:1 relationship. Coloured lines and inset equations show the Theil–Sen regression fit to the observations. Other inset values are Pearson's correlation coefficients (r) and number of points (n). Axis ranges differ in each panel.
Total measured NOy and the sum of individual NOy components are strongly correlated (r > 0.8) for all campaigns except SEAC4RS (r=0.66). The weaker correlation for SEAC4RS is due to the large contribution of MPN to total PNs measured by the TD-LIF instrument, leading to a large contribution of MPN to total NOy for many of the points that stray most from the 1:1 line (Fig. S2). If instead we replace TD-LIF PNs with the sum of CIMS PANs and HNO4, the correlation with total measured NOy increases to r=0.91, but the regression slope decreases from 0.97 in Fig. 4 to 0.82, as MPN is ∼ 20 % of SEAC4RS NOy. The large contribution of MPN to total NOy during SEAC4RS (Fig. S2) results from aged air initially influenced by lightning, biomass burning, and deep convective uplift of surface pollution with large quantities of VOCs and NOx. These large quantities of VOCs and NOx cause very active photochemistry that enhances the abundance of the MPN precursor, CH3O2 (Browne et al., 2011; Nault et al., 2015).
The regression slopes in Fig. 4 indicate that most NOy components are measured during each campaign, ranging from 0.78 for ATom-2 (78 % of individual NOy components measured) to 0.99 for ATom-4 (99 % measured). The slopes suggest that between 1 % and 22 % of NOy originates from factors such as unmeasured components, positive interference in the NOy instrument, or a low bias in the TD-LIF PNs. Bradshaw et al. (1998) estimated a temperature-dependent interference from HCN of 8 %–15 % for chemiluminescence instruments that, like those deployed on DC-8 campaigns, use a CO reagent. We estimate a lower-end (8 %) interference for mean ambient upper troposphere temperatures measured along the flight paths in Fig. 2. Using DC-8 HCN observations, this amounts to ∼ 53 ppt or 12 % of NOy for ARCTAS, ∼ 19 pptv or 5 % of NOy for SEAC4RS, ∼ 40 pptv or 6 % of NOy for KORUS-AQ, and ∼ 17 pptv or 6 % of NOy for ATom 1-4. These lower-end interference estimates are similar in size to the percent of unaccounted NOy (13 % for ARCTAS, 3 % for SEAC4RS, 8 % for KORUS-AQ, 1 %–22 % for ATom).
Chemiluminescence NOy instruments also measure pNO3 but with uncertain sampling efficiencies (Bourgeois et al., 2022). For 100 % sampling efficiency, we use the aerosol mass spectrometer (AMS) measurements of submicron (< 1 µm) pNO3 to estimate a pNO3 contribution that is at most 1 % of NOy for ARCTAS for a median pNO3 of ∼ 0.01 µg m−3 (∼ 4 pptv), ∼ 4 % for SEAC4RS for pNO3 of ∼ 0.04 µg m−3 (∼ 14 pptv), ∼ 4 % for KORUS-AQ for pNO3 ∼ 0.07 µg m−3 (∼ 25 pptv), and < 2 % for ATom for pNO3<0.01 µg m−3 (∼ 4 pptv).
TD-LIF measurements of PNs are calculated from the difference in NO2 detected with the NO2 channel and with the PNs channel set to a temperature at which all PNs decompose (Day et al., 2002). A bias in NO2 could therefore impart a bias in PNs. The largest source of TD-LIF interference is the 100 % thermal decomposition of MPN (Reed et al., 2016b), and MPN during SEAC4RS far exceeds that of any of the other campaigns. If we use the higher-end MPN interference of 21 % from Shah et al. (2023) for SEAC4RS, this equates to ∼ 5 pptv of SEAC4RS PSS NO2. This is only ∼ 3 % of the 190 pptv SEAC4RS PNs.
3.2 Upper tropospheric NOy composition
Figure 5 provides a breakdown of the absolute and relative contributions of individual NOy components to total NOy. ATom-1 and -4 are combined, as these sub-campaigns have a very similar range in NOy (Fig. 4) and in median total and individual components of NOy, as the sampled seasons (spring and summer) have very similar NOy (Fig. 3). Similarly, ATom-2 and -3 (autumn and winter) are combined. Campaigns are further grouped into remote (ARCTAS, ATom) and continental (SEAC4RS, KORUS-AQ), as local influence from continental sources, like anthropogenic emissions and intense lightning, leads to a greater relative contribution of NOx and lesser contribution of PAN for the continental upper troposphere and vice versa for the remote upper troposphere.
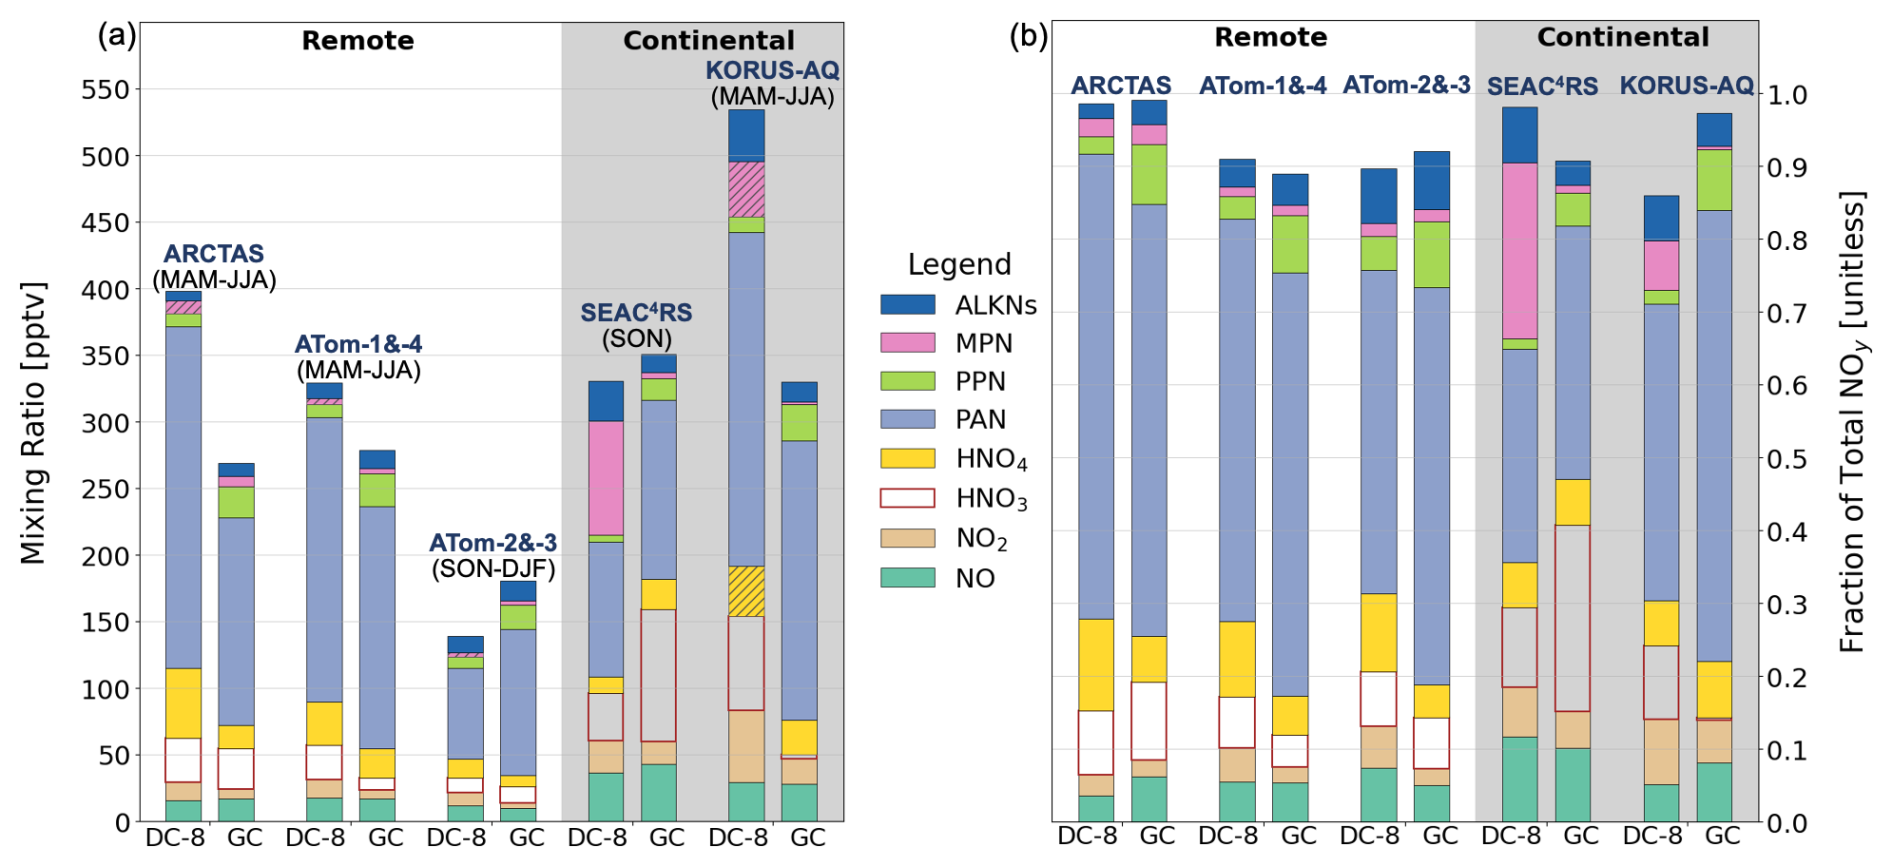
Figure 5NOy composition in the upper troposphere along DC-8 flight tracks. Bars represent the median values of absolute (a) and relative (b) individual NOy components observed and inferred from observations during DC-8 campaigns and simulated by GEOS-Chem (GC). Seasons sampled are given above each bar (a), and the grey shading distinguishes sampling in the remote (no shading) and continental (shaded) upper troposphere. Hatching in (a) indicates inferred concentrations (see text for details). Bar components from bottom to top are NO, NO2, HNO3, HNO4, PAN, PPN, MPN, and ALKNs.
Inferred DC-8 HNO4 and PPN in Fig. 5 use ATom-1 HNO4 and ATom-4 PPN for combined ATom-1 and -4 components and, similarly, ATom-2 HNO4 and ATom-3 PPN for combined ATom-2 and -3. KORUS-AQ HNO4 is estimated to be 37 pptv by multiplying the SEAC4RS median fraction of HNO4 () by the KORUS-AQ median NOy. SEAC4RS is used because HNO4 is thermally unstable (Ryerson et al., 2000) and so varies with temperature. Mean upper troposphere ambient temperatures for KORUS-AQ (252 K) are more consistent with SEAC4RS (246 K) than the other campaigns (238 K for ARCTAS, 238–241 K for ATom).
The inferred ∼ 10 pptv ARCTAS MPN is from the estimate by Browne et al. (2011). KORUS-AQ MPN is estimated by bounding a potential range from two approaches. The first is the median value of the difference between TD-LIF total PNs and the sum of all individual CIMS PANs and our inferred HNO4 of 37 pptv, yielding MPN = 75 pptv. This likely overestimates MPN, as the CIMS instrument does not measure an exhaustive suite of PANs. Lee et al. (2022) estimated with a box model and KORUS-AQ measurements that unmeasured PANs account for ∼ 20 % of total PNs during KORUS-AQ, though this applies to air masses impacted by petrochemical and other anthropogenic VOCs and NOx emissions. Accounting for these unmeasured PANs yields a lower-bound KORUS-AQ MPN of 8 pptv. The MPN thus inferred for KORUS-AQ is 42 pptv, taken as the midpoint between 8 and 75 pptv, and it accounts for 7 % of KORUS-AQ NOy. As the GEOS-Chem model MPN is consistent with DC-8 inferred MPN during ARCTAS, we multiply the GEOS-Chem ATom MPN fractions ( ∼ 0.01 for ATom-1 and -4 and ∼ 0.02 for ATom-2 and -3) by ATom DC-8 NOy to infer ATom MPN of < 6 pptv.
Only the C1–C5 ALKNs are shown in Fig. 5 for ATom. The remote measurements of total ALKNs available from ARCTAS that would be most suitable to assess the likely contribution of longer chain (> C5) ALKNs are on median 5 pptv less than the ATom C1–C5 ALKNs measurements. The ARCTAS total ALKNs measurements are also very noisy, as indicated by a range of −113 pptv to ∼ 333 pptv. The range in ARCTAS WAS C1–C5 measurements, by comparison, is 8–29 pptv. Contributions of > C5 ALKNs to total ALKNs for SEAC4RS (∼ 50 %) and KORUS-AQ (∼ 60 %), representative of the continental upper troposphere, suggest that > C5 ALKNs in remote regions are < 50 % of total ALKNs or < 12 pptv (median of C1–C5 ALKNs for ATom1-4). According to the measurements, remote region C1–C5 ALKNs are dominated by methyl nitrate (C1 ALKN), accounting for 40 % of ATom C1–C5 ALKNs and 49 % for ARCTAS. Second is isopropyl nitrate (C3 ALKN), making up 17 % of ATom C1–C5 ALKNs and 25 % for ARCTAS. The > C3 ALKNs dominate ALKNs in the continental upper troposphere, accounting for 92 % of total ALKNs for SEAC4RS and 71 % for KORUS-AQ. We estimate these as the difference between TD-LIF total ALKNs and the sum of WAS C1-C3 ALKNs.
The sum of KORUS-AQ NOy components totals 531 pptv, > 130 pptv higher than SEAC4RS, ARCTAS, and ATom-1 and -4, all of which are within a narrow range of 330–400 pptv. Minimum NOy values are for the remote autumn and winter measurements from ATom-2 and -3 at 141 pptv. Despite the wide range in absolute total and components of NOy, the relative contribution of many individual NOy components is consistent across all campaigns. These include NO (7 ± 3 %; mean ± 1σ standard deviation), NO2 (6 ± 2 %), HNO3 (9 ± 2 %), HNO4 (9 ± 3 %), PPN (3 ± 1 %), and ALKNs (5 ± 3 %). PAN, the dominant NOy component in all campaigns, is least consistent, ranging from 30 %–41 % for the continental upper troposphere to 44 %–64 % for the remote upper troposphere. The HNO4 fraction (10 %–13 %) in the remote upper troposphere is higher than in the continental upper troposphere (∼ 6 %), due to colder temperatures for ATom and ARCTAS. MPN is uniquely prominent during SEAC4RS, accounting for 24 % of NOy compared to 2 %–7 % inferred for all other campaigns. pNO3, absent in Fig. 5 due to the uncertain sampling efficiency of the chemiluminescence instrument, is at most 4 % for SEAC4RS and KORUS-AQ (Sect. 3.1), comparable to the contribution from PPN.
The far larger fraction of MPN to total NOy during SEAC4RS (Fig. 5b) warrants further investigation, as the relative proportion of MPN to total NOy ranges from negligible to 100 % (Fig. S2). If we instead estimate MPN by subtracting the sum of HNO4 and all PANs measured with the CIMS instrument from the TD-LIF PNs, making the assumption that CIMS measures most PANs, MPN is 49 pptv and the SEAC4RS median contribution to NOy declines from 24 % to 14 %. This is still at least double the contribution for any other campaign. A small proportion of HNO4 is measured in the MPN channel of the TD-LIF instrument. This represents about 11 %, according to Nault et al. (2015). For the CIMS median HNO4 of 12.6 pptv during SEAC4RS, the HNO4 interference is only 1.4 pptv, so it does not affect the 14 %–24 % contribution.
The NOy composition information in Fig. 5 has a Northern Hemisphere sampling bias to achieve coincidence. ATom observations south of the Equator exhibit a similar seasonal pattern to the Northern Hemisphere: summer > spring > autumn > winter NOy, except that the Southern Hemisphere spring and summer NOy differ by ∼ 90 pptv, whereas there is a near-negligible difference for the Northern Hemisphere (Fig. 3). As with the Northern Hemisphere, PAN accounts for most Southern Hemisphere NOy, ranging from ∼ 32 % for ATom-1 (July–August) to ∼ 42 % for ATom-2 (January–February).
Nighttime-dominant NOy compounds N2O5, NO3, and HONO are not included in Fig. 5, as these have near-negligible daytime abundances. Of these, there are only measurements of N2O5, limited to ATom-3 and -4, that represent ∼ 0.1 % of upper tropospheric NOy along the daytime ATom flight tracks in Fig. 2. NO3 has a lifetime of a few seconds during the day, due to efficient photolysis (Brown and Stutz, 2012). HONO also rapidly photolyses with a near-surface lifetime of 15 min (Sörgel et al., 2011). Photolysis of HONO would be further enhanced (by ∼ 50 % at 390 nm) in the upper troposphere where photolysis frequencies are enhanced (Hofzumahaus et al., 2002; Reed et al., 2016a).
3.3 Contemporary understanding of UT NOy
GEOS-Chem Northern Hemisphere upper troposphere NOy is compared to the observations in Figs. 3 and 5. In Fig. 3, the GEOS-Chem median NOy is less than that of DC-8 in summer and spring by ∼ 103 pptv, similar to that of DC-8 in autumn and greater than that of DC-8 in winter by ∼ 60 pptv. As a result of these differences in absolute NOy, the model underestimates the IAGOS and DC-8 seasonal shifts in NOy from winter to spring and from summer to autumn.
The sum of the GEOS-Chem fractional contributions of NOy components in Fig. 5b does not equal 1 because the model NOy budget also includes components not measured during DC-8 campaigns, such as MPAN and halogenated ALKNs. Consistent across all campaigns is a model underestimate of NO2 and an overestimate of PPN. The model version we use does not include photolysis of PPN, even though this is known to occur (Harwood et al., 2003). PPN photolysis rather than thermal decomposition is the dominant loss pathway of PPN in the cold upper troposphere. PPN photolysis is scheduled for inclusion in a later model version (version 14.5) than that used here (Horner et al., 2024). Inclusion of PPN photolysis would liberate up to ∼ 16 pptv NO2, resolving the 10–16 pptv model underestimate in NO2. Other studies have addressed model biases in NO2 by including photolysis of pNO3 forming HONO that rapidly photolyses to NOx (Shah et al., 2023; Horner et al., 2024). pNO3 concentrations are too small in the upper troposphere for this to be a substantial NO2 source. These are, on median, ∼ 0.01 µg m−3 during ARCTAS, ∼ 0.07 µg m−3 during KORUS-AQ, ∼ 0.04 µg m−3 during SEAC4RS, and < 0.01 µg m−3 during ATom (Sect. 3.1).
The model exhibits significant campaign-specific biases in total NOy for ARCTAS (129 pptv underestimate), KORUS-AQ (205 pptv underestimate), ATom-1 and -4 (51 pptv underestimate), and ATom-2 and -3 (42 pptv overestimate). The model underestimate in ARCTAS NOy is due mostly to a ∼ 100 pptv low bias in PAN and, to a lesser extent, a 35 pptv underestimate in HNO4. The model bias for ATom-2 and -3 is due almost entirely to PAN. For KORUS-AQ, all NOy components except PPN are underestimated, indicative of an overall underestimate in NOy sources to the upper troposphere over this region. The ATom-1 and -4 underestimation in NOy is primarily due to a low model bias in PAN and HNO3. Overall, the model underestimates the contrast in upper tropospheric NOy between the remote and continental upper troposphere.
GEOS-Chem simulates individual C1-C3 ALKNs, but most > C3 ALKNs are included as a lumped species. There are other > C3 ALKNs represented individually in the model, such as those formed from isoprene oxidation (Fisher et al., 2016), but abundances of these are near negligible in the upper troposphere. DC-8 C1 ALKN is only 4 % of ALKNs for SEAC4RS and 11 % for KORUS-AQ, whereas in the model these are a much greater component of ALKNs: 40 % for SEAC4RS and 29 % for KORUS-AQ. Modelled > C3 ALKNs are a far smaller portion of total ALKNs (29 % for SEAC4RS and 23 % for KORUS-AQ) than the observations (Sect. 3.2). Modelled C1 ALKN concentrations are consistently less than the observed values by ∼ 2 pptv for ARCTAS and ∼ 1 pptv for ATom. Modelled C3 ALKN is ∼ 1 pptv lower than the observations for ARCTAS but ∼ 1 pptv higher than the observations for ATom.
The sum of measured and modelled individual NOy components is not significantly different for SEAC4RS, though the model overestimates HNO3 by 64 pptv and underestimates MPN by 81 pptv compared to the TD-LIF measurements and by 45 pptv compared to MPN inferred using TD-LIF PNs and CIMS measurements of HNO4 and PANs (Sect. 3.2). The low bias in the model in MPN suggests that the model underestimates the influence of NOx and reactive VOC sources on aged air over source regions with a mix of emissions from fires and lightning and deep convective injection of surface pollution. Chen et al. (2019) estimated that the GEOS-Chem underestimate in free-tropospheric VOCs during SEAC4RS is on average ∼ 60 % but exceeds a factor of 2 for many of the VOCs assessed. The high bias in modelled HNO3 during SEAC4RS (Fig. 5) could be because of a factor of 2 overestimate in modelled H2O2 compared to observed H2O2 for SEAC4RS. An overestimate in H2O2 indicates a model overestimate in HO2 that promotes formation of HNO3 and that would also account for the ∼ 10 pptv overestimate in modelled HNO4. Modelled HO2 is used to calculate PSS NO2 for SEAC4RS (Eq. (1), Sect. 2.1), but this only imparts a small high bias (∼ 1.7 pptv) in SEAC4RS PSS NO2. Model bias in H2O2 for ARCTAS (> 100 pptv) may also be responsible for the model underestimate in ARCTAS HNO4 of ∼ 35 pptv.
Modelled KORUS-AQ HNO3, ALKNs, and MPN are all biased low. The low biases in these NOy components may be because of a general underestimate in NOy sources over South Korea where there are large anthropogenic NOx and VOC sources that are represented in the model with a global inventory (CEDS) that may not suitably account for local emissions (Travis et al., 2024). Lightning NOx emissions could also be underestimated in the heavily parameterized inventory in GEOS-Chem (Murray et al., 2012; Marais et al., 2018), but this is a challenging NOx source to evaluate over locations that include other prominent sources of NOx.
The model biases identified in this work hinder the accurate determination of the radiative effect of tropospheric ozone for short-term climate impact assessments, the oxidative capacity of the troposphere in quantifying the lifetime and persistence of the greenhouse gas methane, tropospheric column densities of NO2 from space-based UV-visible instruments that are retrieved with modelled vertical profiles of NO2, NOx emissions by means of comparing modelled and observed oxidized nitrate wet deposition fluxes that depend on the abundance of soluble HNO3, and harm from nitrogen deposition to vulnerable habitats.
We used NASA DC-8 aircraft measurement data from the ARCTAS, SEAC4RS, KORUS-AQ, and ATom campaigns to characterize reactive oxidized nitrogen (NOy) in the global upper troposphere. This followed confirmation from comparison to routine total NOy measurements from the IAGOS commercial aircraft campaign that DC-8 has the same seasonality as peak NOy in summer and spring and minimum NOy in winter in the Northern Hemisphere. Consistency supports the use of DC-8 campaign data to characterize NOy under standard daytime conditions.
We also confirm that most (78 %–99 %) NOy components were measured during DC-8 campaigns. These include nitrogen oxides (NOx) and inorganic (HNO3 and HNO4) and organic (PANs, MPN, and alkyl nitrates) reservoirs of NOx. PAN is the dominant NOy component for all campaigns (30 %–64 %), followed by NOx (6 %–18 %), HNO4 (6 %–13 %), and HNO3 (7 %–11 %). The relative contribution of most other components is similar across all campaigns, except for MPN. MPN is 14 %–24 % of NOy for SEAC4RS over the Southeast US and much less (2 %–7 %) for all other campaigns, though MPN measurements are rare and susceptible to biases.
The GEOS-Chem model is sampled along the DC-8 flight tracks to assess the state of knowledge of upper tropospheric NOy. Consistent model biases for all campaigns include an overestimate in PPN and underestimate in NO2. The model lacks PPN photolysis that would address the PPN model bias and mostly resolve the NO2 bias. In the continental upper troposphere, the model underestimates total NOy for KORUS-AQ but reproduces total NOy for SEAC4RS, though with too much HNO3 and too little MPN. Over remote regions, the model biases are less severe and are likely related to the weak seasonal variability in total NOy in comparison to DC-8 and IAGOS. A possible cause of this is errors in model representation of maritime lightning NOx emissions that influence NOy abundance in spring and summer.
Our results underscore the need for sustained measurements of upper tropospheric reactive oxidized nitrogen for further refinement of knowledge of upper tropospheric NOy sources, advection, and chemical processing. This is crucial for advancing our understanding of the global nitrogen cycle and its broader environmental impacts.
All data and software used in this study are from publicly accessible repositories: Zenodo for GEOS-Chem (https://doi.org/10.5281/zenodo.4681204, The International GEOS-Chem User Community, 2021), the AERIS data service for IAGOS (Boulanger et al., 2018), and NASA data archives for ARCTAS (https://www-air.larc.nasa.gov/cgi-bin/ArcView/arctas?DC8=1, NASA, 2009), SEAC4RS (https://www-air.larc.nasa.gov/cgi-bin/ArcView/seac4rs, NASA, 2015), KORUS-AQ (https://asdc.larc.nasa.gov/project/KORUS-AQ, NASA, 2017), and ATom (https://daac.ornl.gov/cgi-bin/dsviewer.pl?ds_id=1925, NASA, 2021).
The study concept was developed by EAM and NW. NW led the data analysis and simulated GEOS-Chem. The manuscript was initiated by NW and co-written by EAM. GL aided in data analysis, RGR in the use of ObsPack, and BS in the use of IAGOS NOy observations. All authors reviewed and edited the manuscript.
The contact author has declared that none of the authors has any competing interests.
Publisher’s note: Copernicus Publications remains neutral with regard to jurisdictional claims made in the text, published maps, institutional affiliations, or any other geographical representation in this paper. While Copernicus Publications makes every effort to include appropriate place names, the final responsibility lies with the authors.
We are grateful for the provision of the NASA DC-8 aircraft observations by the instrument PIs Paul O. Wennberg, Ronald C. Cohen, Thomas B. Ryerson, Chelsea Thompson, Andrew Weinheimer, L. Gregory Huey, Jim Elkins, and Donald R. Blake, as well as for the IAGOS-Core data provided by Andreas Volz-Thomas and IAGOS-CARIBIC data by Helmut Ziereis. The authors acknowledge the strong support of the European Commission, Airbus, and the airlines (Lufthansa, Air France, Austrian Airlines, Air Namibia, Cathay Pacific, Iberia, and China Airlines to date) for carrying the IAGOS-Core equipment and performing its maintenance since 1994. IAGOS-CARIBIC NOy measurement funding was provided by the German Aerospace Centre (DLR). In its last 10 years of operation, IAGOS-Core has been funded by INSU–CNRS (France), Météo-France, Université Paul Sabatier (Toulouse, France), and Forschungszentrum Jülich (FZJ, Jülich, Germany). IAGOS has been additionally funded by the EU projects IAGOSDS and IAGOS-ERI. The IAGOS-Core and the IAGOS-CARIBIC databases are supported by AERIS. IAGOS-CARIBIC data are also available from the IAGOS-CARIBIC team (see http://www.caribic-atmospheric.com, last access: 23 May 2023).
This research has been supported by the European Research Council under the European Union's Horizon 2020 research and innovation programme, through a Starting Grant awarded to Eloise A. Marais, UpTrop (grant no. 851854).
This paper was edited by Benjamin A. Nault and reviewed by two anonymous referees.
Amos, H. M., Jacob, D. J., Holmes, C. D., Fisher, J. A., Wang, Q., Yantosca, R. M., Corbitt, E. S., Galarneau, E., Rutter, A. P., Gustin, M. S., Steffen, A., Schauer, J. J., Graydon, J. A., Louis, V. L. St., Talbot, R. W., Edgerton, E. S., Zhang, Y., and Sunderland, E. M.: Gas-particle partitioning of atmospheric Hg(II) and its effect on global mercury deposition, Atmos. Chem. Phys., 12, 591–603, https://doi.org/10.5194/acp-12-591-2012, 2012.
Barth, M. C., Cantrell, C. A., Brune, W. H., Rutledge, S. A., Crawford, J. H., Huntrieser, H., Carey, L. D., MacGorman, D., Weisman, M., Pickering, K. E., Bruning, E., Anderson, B., Apel, E., Biggerstaff, M., Campos, T., Campuzano-Jost, P., Cohen, R., Crounse, J., Day, D. A., Diskin, G., Flocke, F., Fried, A., Garland, C., Heikes, B., Honomichl, S., Hornbrook, R., Huey, L. G., Jimenez, J. L., Lang, T., Lichtenstern, M., Mikoviny, T., Nault, B., O'Sullivan, D., Pan, L. L., Peischl, J., Pollack, I., Richter, D., Riemer, D., Ryerson, T., Schlager, H., St. Clair, J., Walega, J., Weibring, P., Weinheimer, A., Wennberg, P., Wisthaler, A., Wooldridge, P. J., and Ziegler, C.: The Deep Convective Clouds and Chemistry (DC3) Field Campaign, B. Am. Meteorol. Soc., 96, 1281–1309, https://doi.org/10.1175/bams-d-13-00290.1, 2015.
Bertram, T. H., Perring, A. E., Wooldridge, P. J., Crounse, J. D., Kwan, A. J., Wennberg, P. O., Scheuer, E., Dibb, J., Avery, M., Sachse, G., Vay, S. A., Crawford, J. H., McNaughton, C. S., Clarke, A., Pickering, K. E., Fuelberg, H., Huey, G., Blake, D. R., Singh, H. B., Hall, S. R., Shetter, R. E., Fried, A., Heikes, B. G., and Cohen, R. C.: Direct measurements of the convective recycling of the upper troposphere, Science, 315, 816–820, https://doi.org/10.1126/science.1134548, 2007.
Blake, N. J., Blake, D. R., Swanson, A. L., Atlas, E., Flocke, F., and Rowland, F. S.: Latitudinal, vertical, and seasonal variations of C1-C4 alkyl nitrates in the troposphere over the Pacific Ocean during PEM-Tropics A and B: Oceanic and continental sources, J. Geophys. Res.-Atmos., 108, 8242, https://doi.org/10.1029/2001JD001444, 2003.
Blakeslee, R. J., Mach, D. M., Bateman, M. G., and Bailey, J. C.: Seasonal variations in the lightning diurnal cycle and implications for the global electric circuit, Atmos. Res., 135–136, 228–243, https://doi.org/10.1016/j.atmosres.2012.09.023, 2014.
Boersma, K. F., Eskes, H. J., Dirksen, R. J., van der A, R. J., Veefkind, J. P., Stammes, P., Huijnen, V., Kleipool, Q. L., Sneep, M., Claas, J., Leitão, J., Richter, A., Zhou, Y., and Brunner, D.: An improved tropospheric NO2 column retrieval algorithm for the Ozone Monitoring Instrument, Atmos. Meas. Tech., 4, 1905–1928, https://doi.org/10.5194/amt-4-1905-2011, 2011.
Boulanger, D., Blot, R., Bundke, U., Gerbig, C., Hermann, M., Nédélec, P., Rohs, S., and Ziereis, H., IAGOS final quality controlled Observational Data L2 – Vertical profiles, AERIS [data set], https://doi.org/10.25326/07, 2018.
Bourgeois, I., Peischl, J., Neuman, J. A., Brown, S. S., Allen, H. M., Campuzano-Jost, P., Coggon, M. M., DiGangi, J. P., Diskin, G. S., Gilman, J. B., Gkatzelis, G. I., Guo, H., Halliday, H. A., Hanisco, T. F., Holmes, C. D., Huey, L. G., Jimenez, J. L., Lamplugh, A. D., Lee, Y. R., Lindaas, J., Moore, R. H., Nault, B. A., Nowak, J. B., Pagonis, D., Rickly, P. S., Robinson, M. A., Rollins, A. W., Selimovic, V., St. Clair, J. M., Tanner, D., Vasquez, K. T., Veres, P. R., Warneke, C., Wennberg, P. O., Washenfelder, R. A., Wiggins, E. B., Womack, C. C., Xu, L., Zarzana, K. J., and Ryerson, T. B.: Comparison of airborne measurements of NO, NO2, HONO, NOy, and CO during FIREX-AQ, Atmos. Meas. Tech., 15, 4901–4930, https://doi.org/10.5194/amt-15-4901-2022, 2022.
Bradshaw, J., Sandholm, S., and Talbot, R.: An update on reactive odd-nitrogen measurements made during recent NASA Global Tropospheric Experiment programs, J. Geophys. Res.-Atmos., 103, 19129–19148, https://doi.org/10.1029/98JD00621, 1998.
Bradshaw, J., Davis, D., Grodzinsky, G., Smyth, S., Newell, R., Sandholm, S., and Liu, S.: Observed distributions of nitrogen oxides in the remote free troposphere from the NASA Global Tropospheric Experiment Programs, Rev. Geophys., 38, 61–116, https://doi.org/10.1029/1999rg900015, 2000.
Brasseur, G. P., Müller, J.-F., and Granier, C.: Atmospheric impact of NOx emissions by subsonic aircraft: A three dimensional model study, J. Geophys. Res.-Atmos., 101, 1423–1428, https://doi.org/10.1029/95jd02363, 1996.
Brenninkmeijer, C. A. M., Crutzen, P., Boumard, F., Dauer, T., Dix, B., Ebinghaus, R., Filippi, D., Fischer, H., Franke, H., Frieβ, U., Heintzenberg, J., Helleis, F., Hermann, M., Kock, H. H., Koeppel, C., Lelieveld, J., Leuenberger, M., Martinsson, B. G., Miemczyk, S., Moret, H. P., Nguyen, H. N., Nyfeler, P., Oram, D., O'Sullivan, D., Penkett, S., Platt, U., Pupek, M., Ramonet, M., Randa, B., Reichelt, M., Rhee, T. S., Rohwer, J., Rosenfeld, K., Scharffe, D., Schlager, H., Schumann, U., Slemr, F., Sprung, D., Stock, P., Thaler, R., Valentino, F., van Velthoven, P., Waibel, A., Wandel, A., Waschitschek, K., Wiedensohler, A., Xueref-Remy, I., Zahn, A., Zech, U., and Ziereis, H.: Civil Aircraft for the regular investigation of the atmosphere based on an instrumented container: The new CARIBIC system, Atmos. Chem. Phys., 7, 4953–4976, https://doi.org/10.5194/acp-7-4953-2007, 2007.
Brown, S. S. and Stutz, J.: Nighttime radical observations and chemistry, Chem. Soc. Rev., 41, 6405–6447, https://doi.org/10.1039/C2CS35181A, 2012.
Browne, E. C., Perring, A. E., Wooldridge, P. J., Apel, E., Hall, S. R., Huey, L. G., Mao, J., Spencer, K. M., Clair, J. M. St., Weinheimer, A. J., Wisthaler, A., and Cohen, R. C.: Global and regional effects of the photochemistry of CH3O2NO2: evidence from ARCTAS, Atmos. Chem. Phys., 11, 4209–4219, https://doi.org/10.5194/acp-11-4209-2011, 2011.
Burkholder, J. B., Sander, S. P., Abbatt, J., Barker, J. R., Cappa, C., Crounse, J. D., Dibble, T. S., Huie, R. E., Kolb, C. E., Kurylo, M. J., Orkin, V. L., Percival, C. J., Wilmouth, D. M., and Wine, P. H.: Chemical kinetics and photochemical data for use in atmospheric studies, evaluation No. 19, JPL Publication 19-5, https://jpldataeval.jpl.nasa.gov/pdf/NASA-JPL%20Evaluation%2019-5.pdf (last access: 20 May 2024), 2020.
Chen, X., Millet, D. B., Singh, H. B., Wisthaler, A., Apel, E. C., Atlas, E. L., Blake, D. R., Bourgeois, I., Brown, S. S., Crounse, J. D., de Gouw, J. A., Flocke, F. M., Fried, A., Heikes, B. G., Hornbrook, R. S., Mikoviny, T., Min, K.-E., Müller, M., Neuman, J. A., O'Sullivan, D. W., Peischl, J., Pfister, G. G., Richter, D., Roberts, J. M., Ryerson, T. B., Shertz, S. R., Thompson, C. R., Treadaway, V., Veres, P. R., Walega, J., Warneke, C., Washenfelder, R. A., Weibring, P., and Yuan, B.: On the sources and sinks of atmospheric VOCs: an integrated analysis of recent aircraft campaigns over North America, Atmos. Chem. Phys., 19, 9097–9123, https://doi.org/10.5194/acp-19-9097-2019, 2019.
Cohen, Y., Hauglustaine, D., Sauvage, B., Rohs, S., Konjari, P., Bundke, U., Petzold, A., Thouret, V., Zahn, A., and Ziereis, H.: Evaluation of modelled climatologies of O3, CO, water vapour and NOy in the upper troposphere–lower stratosphere using regular in situ observations by passenger aircraft, Atmos. Chem. Phys., 23, 14973–15009, https://doi.org/10.5194/acp-23-14973-2023, 2023.
Crawford, J. H., Ahn, J.-Y., Al-Saadi, J., Chang, L., Emmons, L. K., Kim, J., Lee, G., Park, J.-H., Park, R. J., Woo, J. H., Song, C.-K., Hong, J.-H., Hong, Y.-D., Lefer, B. L., Lee, M., Lee, T., Kim, S., Min, K.-E., Yum, S. S., Shin, H. J., Kim, Y.-W., Choi, J.-S., Park, J.-S., Szykman, J. J., Long, R. W., Jordan, C. E., Simpson, I. J., Fried, A., Dibb, J. E., Cho, S., and Kim, Y. P.: The Korea–United States Air Quality (KORUS-AQ) field study, Elementa, 9, 00163, https://doi.org/10.1525/elementa.2020.00163, 2021.
Crounse, J. D., McKinney, K. A., Kwan, A. J., and Wennberg, P. O.: Measurement of gas-phase yydroperoxides by Chemical Ionization Mass Spectrometry, Anal. Chem., 78, 6726–6732, https://doi.org/10.1021/ac0604235, 2006.
Culter, F.: NASA DC-8 Flying Laboratory Aircraft, https://ghrc.nsstc.nasa.gov/home/sites/default/files/cutler_dc8.pdf, (last access: 3 October 2024), 2009.
Dahlmann, K., Grewe, V., Ponater, M., and Matthes, S.: Quantifying the contributions of individual NOx sources to the trend in ozone radiative forcing, Atmos. Environ., 45, 2860–2868, https://doi.org/10.1016/j.atmosenv.2011.02.071, 2011.
Dameris, M.: Stratosphere/Troposphere exchange and structure | Tropopause, in: Encyclopedia of Atmospheric Sciences, 2nd Edn., edited by: North, G. R., Pyle, J., and Zhang, F., Academic Press, Oxford, 269–272, https://doi.org/10.1016/B978-0-12-382225-3.00418-7, 2015.
Day, D. A., Wooldridge, P. J., Dillon, M. B., Thornton, J. A., and Cohen, R. C.: A thermal dissociation laser-induced fluorescence instrument for in situ detection of NO2, peroxy nitrates, alkyl nitrates, and HNO3, J. Geophys. Res.-Atmos., 107, 4046, https://doi.org/10.1029/2001jd000779, 2002.
Ehhalt, D. H., Rohrer, F., and Wahner, A.: Sources and distribution of NOx in the upper troposphere at northern mid-latitudes, J. Geophys. Res.-Atmos., 97, 3725–3738, https://doi.org/10.1029/91JD03081, 1992.
Emmons, L. K., Carroll, M. A., Hauglustaine, D. A., Brasseur, G. P., Atherton, C., Penner, J., Sillman, S., Levy, H., Rohrer, F., Wauben, W. M. F., Van Velthoven, P. F. J., Wang, Y., Jacob, D., Bakwin, P., Dickerson, R., Doddridge, B., Gerbig, C., Honrath, R., Hübler, G., Jaffe, D., Kondo, Y., Munger, J. W., Torres, A., and Volz-Thomas, A.: Climatologies of NOx and NOy: A comparison of data and models, Atmos. Environ., 31, 1851–1904, https://doi.org/10.1016/s1352-2310(96)00334-2, 1997.
Fisher, J. A., Jacob, D. J., Travis, K. R., Kim, P. S., Marais, E. A., Chan Miller, C., Yu, K., Zhu, L., Yantosca, R. M., Sulprizio, M. P., Mao, J., Wennberg, P. O., Crounse, J. D., Teng, A. P., Nguyen, T. B., St. Clair, J. M., Cohen, R. C., Romer, P., Nault, B. A., Wooldridge, P. J., Jimenez, J. L., Campuzano-Jost, P., Day, D. A., Hu, W., Shepson, P. B., Xiong, F., Blake, D. R., Goldstein, A. H., Misztal, P. K., Hanisco, T. F., Wolfe, G. M., Ryerson, T. B., Wisthaler, A., and Mikoviny, T.: Organic nitrate chemistry and its implications for nitrogen budgets in an isoprene- and monoterpene-rich atmosphere: constraints from aircraft (SEAC4RS) and ground-based (SOAS) observations in the Southeast US, Atmos. Chem. Phys., 16, 5969–5991, https://doi.org/10.5194/acp-16-5969-2016, 2016.
Fisher, J. A., Atlas, E. L., Barletta, B., Meinardi, S., Blake, D. R., Thompson, C. R., Ryerson, T. B., Peischl, J., Tzompa-Sosa, Z. A., and Murray, L. T.: Methyl, ethyl, and propyl nitrates: Global distribution and impacts on reactive nitrogen in remote marine environments, J. Geophys. Res.-Atmos., 123, 12429–12451, https://doi.org/10.1029/2018jd029046, 2018.
Fuelberg, H. E., Hannan, J. R., van Velthoven, P. F. J., Browell, E. V., Bieberbach Jr., G., Knabb, R. D., Gregory, G. L., Pickering, K. E., and Selkirk, H. B.: A meteorological overview of the Subsonic Assessment Ozone and Nitrogen Oxide Experiment (SONEX) period, J. Geophys. Res.-Atmos., 105, 3633–3651, https://doi.org/10.1029/1999JD900917, 2000.
Giglio, L., Randerson, J. T., and van der Werf, G. R.: Analysis of daily, monthly, and annual burned area using the fourth-generation global fire emissions database (GFED4), J. Geophys. Res.-Biogeo., 118, 317–328, https://doi.org/10.1002/jgrg.20042, 2013.
Gressent, A., Sauvage, B., Defer, E., Pätz, H. W., Thomas, K., Holle, R., Cammas, J.-P., Nédélec, P., Boulanger, D., Thouret, V., and Volz-Thomas, A.: Lightning NOx influence on large-scale NOy and O3 plumes observed over the northern mid-latitudes, Tellus B, 66, 25544, https://doi.org/10.3402/tellusb.v66.25544, 2014.
Gressent, A., Sauvage, B., Cariolle, D., Evans, M., Leriche, M., Mari, C., and Thouret, V.: Modeling lightning-NOx chemistry on a sub-grid scale in a global chemical transport model, Atmos. Chem. Phys., 16, 5867–5889, https://doi.org/10.5194/acp-16-5867-2016, 2016.
Guenther, A. B., Jiang, X., Heald, C. L., Sakulyanontvittaya, T., Duhl, T., Emmons, L. K., and Wang, X.: The Model of Emissions of Gases and Aerosols from Nature version 2.1 (MEGAN2.1): an extended and updated framework for modeling biogenic emissions, Geosci. Model Dev., 5, 1471–1492, https://doi.org/10.5194/gmd-5-1471-2012, 2012.
Harwood, M. H., Roberts, J. M., Frost, G. J., Ravishankara, A. R., and Burkholder, J. B.: Photochemical Studies of CH3C(O)OONO2 (PAN) and CH3CH2C(O)OONO2 (PPN): NO3 Quantum Yields, J. Phys. Chem. A, 107, 1148–1154, https://doi.org/10.1021/jp0264230, 2003.
Hoesly, R. M., Smith, S. J., Feng, L., Klimont, Z., Janssens-Maenhout, G., Pitkanen, T., Seibert, J. J., Vu, L., Andres, R. J., Bolt, R. M., Bond, T. C., Dawidowski, L., Kholod, N., Kurokawa, J. I., Li, M., Liu, L., Lu, Z., Moura, M. C. P., O'Rourke, P. R., and Zhang, Q.: Historical (1750–2014) anthropogenic emissions of reactive gases and aerosols from the Community Emissions Data System (CEDS), Geosci. Model Dev., 11, 369–408, https://doi.org/10.5194/gmd-11-369-2018, 2018.
Hofzumahaus, A., Kraus, A., Kylling, A., and Zerefos, C. S.: Solar actinic radiation (280–420 nm) in the cloud–free troposphere between ground and 12 km altitude: Measurements and model results, J. Geophys. Res.-Atmos., 107, 8139, https://doi.org/10.1029/2001jd900142, 2002.
Horner, R. P., Marais, E. A., Wei, N., Ryan, R. G., and Shah, V.: Vertical profiles of global tropospheric nitrogen dioxide (NO2) obtained by cloud slicing the TROPOspheric Monitoring Instrument (TROPOMI), Atmos. Chem. Phys., 24, 13047–13064, https://doi.org/10.5194/acp-24-13047-2024, 2024.
Hudman, R. C., Jacob, D. J., Turquety, S., Leibensperger, E. M., Murray, L. T., Wu, S., Gilliland, A. B., Avery, M., Bertram, T. H., Brune, W., Cohen, R. C., Dibb, J. E., Flocke, F. M., Fried, A., Holloway, J., Neuman, J. A., Orville, R., Perring, A., Ren, X., Sachse, G. W., Singh, H. B., Swanson, A., and Wooldridge, P. J.: Surface and lightning sources of nitrogen oxides over the United States: Magnitudes, chemical evolution, and outflow, J. Geophys. Res., 112, D12S05, https://doi.org/10.1029/2006jd007912, 2007.
Hudman, R. C., Moore, N. E., Mebust, A. K., Martin, R. V., Russell, A. R., Valin, L. C., and Cohen, R. C.: Steps towards a mechanistic model of global soil nitric oxide emissions: implementation and space based-constraints, Atmos. Chem. Phys., 12, 7779–7795, https://doi.org/10.5194/acp-12-7779-2012, 2012.
Huey, L. G.: Measurement of trace atmospheric species by chemical ionization mass spectrometry: Speciation of reactive nitrogen and future directions, Mass Spectrom. Rev., 26, 166–184, https://doi.org/10.1002/mas.20118, 2007.
Huntrieser, H., Lichtenstern, M., Scheibe, M., Aufmhoff, H., Schlager, H., Pucik, T., Minikin, A., Weinzierl, B., Heimerl, K., Pollack, I. B., Peischl, J., Ryerson, T. B., Weinheimer, A. J., Honomichl, S., Ridley, B. A., Biggerstaff, M. I., Betten, D. P., Hair, J. W., Butler, C. F., Schwartz, M. J., and Barth, M. C.: Injection of lightning-produced NOx, water vapor, wildfire emissions, and stratospheric air to the UT/LS as observed from DC3 measurements, J. Geophys. Res.-Atmos., 121, 6638–6668, https://doi.org/10.1002/2015JD024273, 2016.
Jacob, D. J., Crawford, J. H., Maring, H., Clarke, A. D., Dibb, J. E., Emmons, L. K., Ferrare, R. A., Hostetler, C. A., Russell, P. B., Singh, H. B., Thompson, A. M., Shaw, G. E., McCauley, E., Pederson, J. R., and Fisher, J. A.: The Arctic Research of the Composition of the Troposphere from Aircraft and Satellites (ARCTAS) mission: design, execution, and first results, Atmos. Chem. Phys., 10, 5191–5212, https://doi.org/10.5194/acp-10-5191-2010, 2010.
Jaeglé, L., Jacob, D. J., Wang, Y., Weinheimer, A. J., Ridley, B. A., Campos, T. L., Sachse, G. W., and Hagen, D. E.: Sources and chemistry of NOx in the upper troposphere over the United States, Geophys. Res. Lett., 25, 1705–1708, https://doi.org/10.1029/97gl03591, 1998.
Le Breton, M., Bacak, A., Muller, J. B. A., O'Shea, S. J., Xiao, P., Ashfold, M. N. R., Cooke, M. C., Batt, R., Shallcross, D. E., Oram, D. E., Forster, G., Bauguitte, S. J.-B., Palmer, P. I., Parrington, M., Lewis, A. C., Lee, J. D., and Percival, C. J.: Airborne hydrogen cyanide measurements using a chemical ionisation mass spectrometer for the plume identification of biomass burning forest fires, Atmos. Chem. Phys., 13, 9217–9232, https://doi.org/10.5194/acp-13-9217-2013, 2013.
Lee, Y. R., Huey, L. G., Tanner, D. J., Takeuchi, M., Qu, H., Liu, X., Ng, N. L., Crawford, J. H., Fried, A., Richter, D., Simpson, I. J., Blake, D. R., Blake, N. J., Meinardi, S., Kim, S., Diskin, G. S., Digangi, J. P., Choi, Y., Pusede, S. E., Wennberg, P. O., Kim, M. J., Crounse, J. D., Teng, A. P., Cohen, R. C., Romer, P. S., Brune, W., Wisthaler, A., Mikoviny, T., Jimenez, J. L., Campuzano-Jost, P., Nault, B. A., Weinheimer, A., Hall, S. R., and Ullmann, K.: An investigation of petrochemical emissions during KORUS-AQ: Ozone production, reactive nitrogen evolution, and aerosol production, Elementa, 10, 00079, https://doi.org/10.1525/elementa.2022.00079, 2022.
Levy II, H., Mahlman, J. D., and Moxim, W. J.: A stratospheric source of reactive nitrogen in the unpolluted troposphere, Geophys. Res. Lett., 7, 441–444, https://doi.org/10.1029/GL007i006p00441, 1980.
Levy II, H., Moxim, W. J., Klonecki, A. A., and Kasibhatla, P. S.: Simulated tropospheric NOx: Its evaluation, global distribution and individual source contributions, J. Geophys Res.-Atmos., 104, 26279–26306, https://doi.org/10.1029/1999JD900442, 1999.
Li, Q., Jacob, D. J., Yantosca, R. M., Heald, C. L., Singh, H. B., Koike, M., Zhao, Y., Sachse, G. W., and Streets, D. G.: A global three-dimensional model analysis of the atmospheric budgets of HCN and CH3CN: Constraints from aircraft and ground measurements, J. Geophys. Res.-Atmos., 108, 8827, https://doi.org/10.1029/2002JD003075, 2003.
Liang, Q., Rodriguez, J. M., Douglass, A. R., Crawford, J. H., Olson, J. R., Apel, E., Bian, H., Blake, D. R., Brune, W., Chin, M., Colarco, P. R., da Silva, A., Diskin, G. S., Duncan, B. N., Huey, L. G., Knapp, D. J., Montzka, D. D., Nielsen, J. E., Pawson, S., Riemer, D. D., Weinheimer, A. J., and Wisthaler, A.: Reactive nitrogen, ozone and ozone production in the Arctic troposphere and the impact of stratosphere-troposphere exchange, Atmos. Chem. Phys., 11, 13181–13199, https://doi.org/10.5194/acp-11-13181-2011, 2011.
Logan, J. A.: Nitrogen oxides in the troposphere: Global and regional budgets, J. Geophys. Res.-Oceans, 88, 10785–10807, https://doi.org/10.1029/JC088iC15p10785, 1983.
Luo, G., Yu, F., and Moch, J. M.: Further improvement of wet process treatments in GEOS-Chem v12.6.0: impact on global distributions of aerosols and aerosol precursors, Geosci. Model Dev., 13, 2879–2903, https://doi.org/10.5194/gmd-13-2879-2020, 2020.
Marais, E. A., Jacob, D. J., Choi, S., Joiner, J., Belmonte-Rivas, M., Cohen, R. C., Beirle, S., Murray, L. T., Schiferl, L. D., Shah, V., and Jaeglé, L.: Nitrogen oxides in the global upper troposphere: interpreting cloud-sliced NO2 observations from the OMI satellite instrument, Atmos. Chem. Phys., 18, 17017–17027, https://doi.org/10.5194/acp-18-17017-2018, 2018.
Marais, E. A., Roberts, J. F., Ryan, R. G., Eskes, H., Boersma, K. F., Choi, S., Joiner, J., Abuhassan, N., Redondas, A., Grutter, M., Cede, A., Gomez, L., and Navarro-Comas, M.: New observations of NO2 in the upper troposphere from TROPOMI, Atmos. Meas. Tech., 14, 2389–2408, https://doi.org/10.5194/amt-14-2389-2021, 2021.
Marenco, A., Thouret, V., Nédélec, P., Smit, H., Helten, M., Kley, D., Karcher, F., Simon, P., Law, K., Pyle, J., Poschmann, G., Von Wrede, R., Hume, C., and Cook, T.: Measurement of ozone and water vapor by Airbus in-service aircraft: The MOZAIC airborne program, an overview, J. Geophys. Res.-Atmos., 103, 25631–25642, https://doi.org/10.1029/98jd00977, 1998.
Mickley, L. J., Murti, P. P., Jacob, D. J., Logan, J. A., Koch, D. M., and Rind, D.: Radiative forcing from tropospheric ozone calculated with a unified chemistry-climate model, J. Geophys. Res.-Atmos., 104, 30153–30172, https://doi.org/10.1029/1999jd900439, 1999.
Murray, L. T., Jacob, D. J., Logan, J. A., Hudman, R. C., and Koshak, W. J.: Optimized regional and interannual variability of lightning in a global chemical transport model constrained by LIS/OTD satellite data, J. Geophys. Res.-Atmos., 117, D20307, https://doi.org/10.1029/2012jd017934, 2012.
Murray, L. T., Logan, J. A., and Jacob, D. J.: Interannual variability in tropical tropospheric ozone and OH: The role of lightning, J. Geophys. Res.-Atmos., 118, 11468–11480, https://doi.org/10.1002/jgrd.50857, 2013.
Murray, L. T., Fiore, A. M., Shindell, D. T., Naik, V., and Horowitz, L. W.: Large uncertainties in global hydroxyl projections tied to fate of reactive nitrogen and carbon, P. Natl. Acad. Sci. USA, 118, e2115204118, https://doi.org/10.1073/pnas.2115204118, 2021.
NASA: Airborne Science Data for Atmospheric Composition, NASA [data set], https://www-air.larc.nasa.gov/cgi-bin/ArcView/arctas?DC8=1, (last access: 24 October 2024), 2009.
NASA: Airborne Science Data for Atmospheric Composition, NASA [data set], https://www-air.larc.nasa.gov/cgi-bin/ArcView/seac4rs (last access: 24 October 2024), 2015.
NASA: EARTHDATA, Korea United States Air Quality Study, NASA [data set], https://asdc.larc.nasa.gov/project/KORUS-AQ (last access: 24 October 2024), 2017.
NASA: EARTHDATA, ATom: Merged Atmospheric Chemistry, Trace Gases, and Aerosols, Version 2, NASA [data set], https://daac.ornl.gov/cgi-bin/dsviewer.pl?ds_id=1925 (last access: 24 October 2024) , 2021.
Nault, B. A., Garland, C., Pusede, S. E., Wooldridge, P. J., Ullmann, K., Hall, S. R., and Cohen, R. C.: Measurements of CH3O2NO2 in the upper troposphere, Atmos. Meas. Tech., 8, 987–997, https://doi.org/10.5194/amt-8-987-2015, 2015.
Petzold, A., Thouret, V., Gerbig, C., Zahn, A., Brenninkmeijer, C. A. M., Gallagher, M., Hermann, M., Pontaud, M., Ziereis, H., Boulanger, D., Marshall, J., Nédélec, P., Smit, H. G. J., Friess, U., Flaud, J.-M., Wahner, A., Cammas, J.-P., and Volz-Thomas, A.: Global-scale atmosphere monitoring by in-service aircraft – Current achievements and future prospects of the European Research Infrastructure IAGOS, Tellus B, 67, 28452, https://doi.org/10.3402/tellusb.v67.28452, 2015.
Pollack, I. B., Lerner, B. M., and Ryerson, T. B.: Evaluation of ultraviolet light-emitting diodes for detection of atmospheric NO2 by photolysis - chemiluminescence, J. Atmos. Chem., 65, 111–125, https://doi.org/10.1007/s10874-011-9184-3, 2010.
Prather, M. J. and Jacob, D. J.: A persistent imbalance in HOx and NOx photochemistry of the upper troposphere driven by deep tropical convection, Geophys. Res. Lett., 24, 3189–3192, https://doi.org/10.1029/97GL03027, 1997.
Rap, A., Richards, N. A. D., Forster, P. M., Monks, S. A., Arnold, S. R., and Chipperfield, M. P.: Satellite constraint on the tropospheric ozone radiative effect, Geophys. Res. Lett., 42, 5074–5081, https://doi.org/10.1002/2015gl064037, 2015.
Reed, C., Brumby, C. A., Crilley, L. R., Kramer, L. J., Bloss, W. J., Seakins, P. W., Lee, J. D., and Carpenter, L. J.: HONO measurement by differential photolysis, Atmos. Meas. Tech., 9, 2483–2495, https://doi.org/10.5194/amt-9-2483-2016, 2016a.
Reed, C., Evans, M. J., Di Carlo, P., Lee, J. D., and Carpenter, L. J.: Interferences in photolytic NO2 measurements: explanation for an apparent missing oxidant?, Atmos. Chem. Phys., 16, 4707–4724, https://doi.org/10.5194/acp-16-4707-2016, 2016b.
Roberts, J. M.: The atmospheric chemistry of organic nitrates, Atmos. Environ. A-Gen., 24, 243–287, https://doi.org/10.1016/0960-1686(90)90108-Y, 1990.
Roberts, J. M., Williams, J., Baumann, K., Buhr, M. P., Goldan, P. D., Holloway, J., Hübler, G., Kuster, W. C., McKeen, S. A., Ryerson, T. B., Trainer, M., Williams, E. J., Fehsenfeld, F. C., Bertman, S. B., Nouaime, G., Seaver, C., Grodzinsky, G., Rodgers, M., and Young, V. L.: Measurements of PAN, PPN, and MPAN made during the 1994 and 1995 Nashville Intensives of the Southern Oxidant Study: Implications for regional ozone production from biogenic hydrocarbons, J. Geophys. Res.-Atmos., 103, 22473–22490, https://doi.org/10.1029/98JD01637, 1998.
Roberts, J. M., Flocke, F., Stroud, C. A., Hereid, D., Williams, E., Fehsenfeld, F., Brune, W., Martinez, M., and Harder, H.: Ground-based measurements of peroxycarboxylic nitric anhydrides (PANs) during the 1999 Southern Oxidants Study Nashville Intensive, J. Geophys. Res.-Atmos., 107, ACH 1-1–ACH 1-10, https://doi.org/10.1029/2001JD000947, 2002.
Ryerson, T. B., Williams, E. J., and Fehsenfeld, F. C.: An efficient photolysis system for fast-response NO2 measurements, J. Geophys. Res.-Atmos., 105, 26447–26461, https://doi.org/10.1029/2000JD900389, 2000.
Schultz, M. G., Jacob, D. J., Wang, Y., Logan, J. A., Atlas, E. L., Blake, D. R., Blake, N. J., Bradshaw, J. D., Browell, E. V., Fenn, M. A., Flocke, F., Gregory, G. L., Heikes, B. G., Sachse, G. W., Sandholm, S. T., Shetter, R. E., Singh, H. B., and Talbot, R. W.: On the origin of tropospheric ozone and NOx over the tropical South Pacific, J. Geophys. Res.-Atmos., 104, 5829–5843, https://doi.org/10.1029/98jd02309, 1999.
Seltzer, K. M., Vizuete, W., and Henderson, B. H.: Evaluation of updated nitric acid chemistry on ozone precursors and radiative effects, Atmos. Chem. Phys., 15, 5973–5986, https://doi.org/10.5194/acp-15-5973-2015, 2015.
Shah, V., Jacob, D. J., Dang, R., Lamsal, L. N., Strode, S. A., Steenrod, S. D., Boersma, K. F., Eastham, S. D., Fritz, T. M., Thompson, C., Peischl, J., Bourgeois, I., Pollack, I. B., Nault, B. A., Cohen, R. C., Campuzano-Jost, P., Jimenez, J. L., Andersen, S. T., Carpenter, L. J., Sherwen, T., and Evans, M. J.: Nitrogen oxides in the free troposphere: implications for tropospheric oxidants and the interpretation of satellite NO2 measurements, Atmos. Chem. Phys., 23, 1227–1257, https://doi.org/10.5194/acp-23-1227-2023, 2023.
Silvern, R. F., Jacob, D. J., Travis, K. R., Sherwen, T., Evans, M. J., Cohen, R. C., Laughner, J. L., Hall, S. R., Ullmann, K., Crounse, J. D., Wennberg, P. O., Peischl, J., and Pollack, I. B.: Observed NO/NO2 Ratios in the Upper Troposphere Imply Errors in NO-NO2-O3 Cycling Kinetics or an Unaccounted NOx Reservoir, Geophys. Res. Lett., 45, 4466–4474, https://doi.org/10.1029/2018gl077728, 2018.
Singh, H. B.: Reactive nitrogen in the troposphere, Environ. Sci. Technol., 21, 320–327, https://doi.org/10.1021/es00158a001, 1987.
Singh, H. B., Thompson, A. M., and Schlager, H.: SONEX airborne mission and coordinated POLINAT-2 activity: Overview and accomplishments, Geophys. Res. Lett., 26, 3053–3056, https://doi.org/10.1029/1999GL900588, 1999.
Singh, H. B., Brune, W. H., Crawford, J. H., Jacob, D. J., and Russell, P. B.: Overview of the summer 2004 Intercontinental Chemical Transport Experiment–North America (INTEX-A), J. Geophys. Res.-Atmos., 111, D24S01, https://doi.org/10.1029/2006JD007905, 2006.
Singh, H. B., Brune, W. H., Crawford, J. H., Flocke, F., and Jacob, D. J.: Chemistry and transport of pollution over the Gulf of Mexico and the Pacific: spring 2006 INTEX-B campaign overview and first results, Atmos. Chem. Phys., 9, 2301–2318, https://doi.org/10.5194/acp-9-2301-2009, 2009.
Sörgel, M., Regelin, E., Bozem, H., Diesch, J.-M., Drewnick, F., Fischer, H., Harder, H., Held, A., Hosaynali-Beygi, Z., Martinez, M., and Zetzsch, C.: Quantification of the unknown HONO daytime source and its relation to NO2, Atmos. Chem. Phys., 11, 10433–10447, https://doi.org/10.5194/acp-11-10433-2011, 2011.
Stettler, M. E. J., Eastham, S., and Barrett, S. R. H.: Air quality and public health impacts of UK airports. Part I: Emissions, Atmos. Environ., 45, 5415–5424, https://doi.org/10.1016/j.atmosenv.2011.07.012, 2011.
Stratmann, G., Ziereis, H., Stock, P., Brenninkmeijer, C. A. M., Zahn, A., Rauthe-Schöch, A., Velthoven, P. V., Schlager, H., and Volz-Thomas, A.: NO and NOy in the upper troposphere: Nine years of CARIBIC measurements onboard a passenger aircraft, Atmos. Environ., 133, 93–111, https://doi.org/10.1016/j.atmosenv.2016.02.035, 2016.
Talbot, R. W., Dibb, J. E., Scheuer, E. M., Kondo, Y., Koike, M., Singh, H. B., Salas, L. B., Fukui, Y., Ballenthin, J. O., Meads, R. F., Miller, T. M., Hunton, D. E., Viggiano, A. A., Blake, D. R., Blake, N. J., Atlas, E., Flocke, F., Jacob, D. J., and Jaegle, L.: Reactive nitrogen budget during the NASA SONEX Mission, Geophys. Res. Lett., 26, 3057–3060, https://doi.org/10.1029/1999GL900589, 1999.
The International GEOS-Chem User Community: geoschem/GCClassic: GEOS-Chem 13.0.2 (13.0.2), Zenodo [code], https://doi.org/10.5281/zenodo.4681204, 2021.
Thomas, K., Berg, M., Boulanger, D., Houben, N., Gressent, A., Nédélec, P., Pätz, H.-W., Thouret, V., and Volz-Thomas, A.: Climatology of NOy in the troposphere and UT/LS from measurements made in MOZAIC, Tellus B, 67, 28793, https://doi.org/10.3402/tellusb.v67.28793, 2015.
Thompson, C. R., Wofsy, S. C., Prather, M. J., Newman, P. A., Hanisco, T. F., Ryerson, T. B., Fahey, D. W., Apel, E. C., Brock, C. A., Brune, W. H., Froyd, K., Katich, J. M., Nicely, J. M., Peischl, J., Ray, E., Veres, P. R., Wang, S., Allen, H. M., Asher, E., Bian, H., Blake, D., Bourgeois, I., Budney, J., Bui, T. P., Butler, A., Campuzano-Jost, P., Chang, C., Chin, M., Commane, R., Correa, G., Crounse, J. D., Daube, B., Dibb, J. E., Digangi, J. P., Diskin, G. S., Dollner, M., Elkins, J. W., Fiore, A. M., Flynn, C. M., Guo, H., Hall, S. R., Hannun, R. A., Hills, A., Hintsa, E. J., Hodzic, A., Hornbrook, R. S., Huey, L. G., Jimenez, J. L., Keeling, R. F., Kim, M. J., Kupc, A., Lacey, F., Lait, L. R., Lamarque, J.-F., Liu, J., Mckain, K., Meinardi, S., Miller, D. O., Montzka, S. A., Moore, F. L., Morgan, E. J., Murphy, D. M., Murray, L. T., Nault, B. A., Neuman, J. A., Nguyen, L., Gonzalez, Y., Rollins, A., Rosenlof, K., Sargent, M., Schill, G., Schwarz, J. P., St. Clair, J. M., Steenrod, S. D., Stephens, B. B., Strahan, S. E., Strode, S. A., Sweeney, C., Thames, A. B., Ullmann, K., Wagner, N., Weber, R., Weinzierl, B., Wennberg, P. O., Williamson, C. J., Wolfe, G. M., and Zeng, L.: The NASA Atmospheric Tomography (ATom) Mission: Imaging the chemistry of the global atmosphere, B. Am. Meteorol. Soc., 103, E761–E790, https://doi.org/10.1175/bams-d-20-0315.1, 2021.
Toon, O. B., Maring, H., Dibb, J., Ferrare, R., Jacob, D. J., Jensen, E. J., Luo, Z. J., Mace, G. G., Pan, L. L., Pfister, L., Rosenlof, K. H., Redemann, J., Reid, J. S., Singh, H. B., Thompson, A. M., Yokelson, R., Minnis, P., Chen, G., Jucks, K. W., and Pszenny, A.: Planning, implementation, and scientific goals of the Studies of Emissions and Atmospheric Composition, Clouds and Climate Coupling by Regional Surveys (SEAC4RS) field mission, J. Geophys. Res.-Atmos., 121, 4967–5009, https://doi.org/10.1002/2015jd024297, 2016.
Travis, K. R., Jacob, D. J., Fisher, J. A., Kim, P. S., Marais, E. A., Zhu, L., Yu, K., Miller, C. C., Yantosca, R. M., Sulprizio, M. P., Thompson, A. M., Wennberg, P. O., Crounse, J. D., St. Clair, J. M., Cohen, R. C., Laughner, J. L., Dibb, J. E., Hall, S. R., Ullmann, K., Wolfe, G. M., Pollack, I. B., Peischl, J., Neuman, J. A., and Zhou, X.: Why do models overestimate surface ozone in the Southeast United States?, Atmos. Chem. Phys., 16, 13561–13577, https://doi.org/10.5194/acp-16-13561-2016, 2016.
Travis, K. R., Heald, C. L., Allen, H. M., Apel, E. C., Arnold, S. R., Blake, D. R., Brune, W. H., Chen, X., Commane, R., Crounse, J. D., Daube, B. C., Diskin, G. S., Elkins, J. W., Evans, M. J., Hall, S. R., Hintsa, E. J., Hornbrook, R. S., Kasibhatla, P. S., Kim, M. J., Luo, G., McKain, K., Millet, D. B., Moore, F. L., Peischl, J., Ryerson, T. B., Sherwen, T., Thames, A. B., Ullmann, K., Wang, X., Wennberg, P. O., Wolfe, G. M., and Yu, F.: Constraining remote oxidation capacity with ATom observations, Atmos. Chem. Phys., 20, 7753–7781, https://doi.org/10.5194/acp-20-7753-2020, 2020.
Travis, K. R., Nault, B. A., Crawford, J. H., Bates, K. H., Blake, D. R., Cohen, R. C., Fried, A., Hall, S. R., Huey, L. G., Lee, Y. R., Meinardi, S., Min, K.-E., Simpson, I. J., and Ullman, K.: Impact of improved representation of volatile organic compound emissions and production of NOx reservoirs on modeled urban ozone production, Atmos. Chem. Phys., 24, 9555–9572, https://doi.org/10.5194/acp-24-9555-2024, 2024.
Volz-Thomas, A., Berg, M., Heil, T., Houben, N., Lerner, A., Petrick, W., Raak, D., and Pätz, H.-W.: Measurements of total odd nitrogen (NOy) aboard MOZAIC in-service aircraft: instrument design, operation and performance, Atmos. Chem. Phys., 5, 583–595, https://doi.org/10.5194/acp-5-583-2005, 2005.
Weinheimer, A. J.: Chemical Methods: Chemiluminscence, Chemical Amplification, Electrochemistry, and Derivation, in: Analytical Techniques for Atmospheric Measurement, 311–360, https://doi.org/10.1002/9780470988510.ch7, 2006.
Weinheimer, A. J., Walega, J. G., Ridley, B. A., Gary, B. L., Blake, D. R., Blake, N. J., Rowland, F. S., Sachse, G. W., Anderson, B. E., and Collins, J. E.: Meridional distributions of NOx, NOy, and other species in the lower stratosphere and upper troposphere during AASE II, Geophys. Res. Lett., 21, 2583–2586, https://doi.org/10.1029/94GL01897, 1994.
Worden, H. M., Bowman, K. W., Kulawik, S. S., and Aghedo, A. M.: Sensitivity of outgoing longwave radiative flux to the global vertical distribution of ozone characterized by instantaneous radiative kernels from Aura-TES, J. Geophys. Res., 116, D14115, https://doi.org/10.1029/2010jd015101, 2011.
Zahn, A., Brenninkmeijer, C. A. M., Asman, W. A. H., Crutzen, P. J., Heinrich, G., Fischer, H., Cuijpers, J. W. M., and van Velthoven, P. F. J.: Budgets of O3 and CO in the upper troposphere: CARIBIC passenger aircraft results 1997–2001, J. Geophys. Res.-Atmos., 107, ACH 6-1–ACH 6-20, https://doi.org/10.1029/2001JD001529, 2002.