the Creative Commons Attribution 4.0 License.
the Creative Commons Attribution 4.0 License.
 | 22 Jul 2025
Discussion of the spectral slope of the lidar ratio between 355 and 1064 nm from multiwavelength Raman lidar observations
Ronny Engelmann
Holger Baars
Benedikt Gast
Dietrich Althausen
Albert Ansmann
The extinction-to-backscatter ratio, also known as the lidar ratio, is an important quantity in active remote sensing with lidar. It is a key parameter in aerosol typing and an essential quantity to derive the extinction coefficient from elastic backscatter lidars like the spaceborne Cloud–Aerosol Lidar and Infrared Pathfinder Satellite Observations (CALIPSO) or ceilometer observations. The present study discusses the spectral dependence of the lidar ratio from the frequently measured lidar ratios at 355 and 532 nm to the rarely observed lidar ratio at 1064 nm. Therefore, a special focus is put on the rotational Raman lidar method applied to the emission wavelength of 1064 nm. We present a literature review on existing triple-wavelength lidar ratio observations and add new measurements for marine and continental aerosol. For cirrus clouds and marine and continental aerosol the spectral behavior is neutral; for sulfate aerosol, we see a decrease from 532 to 1064 nm. In the case of mineral dust, the lidar ratio slightly increases towards 1064 nm, and in the case of aged smoke an increase with wavelength is found. Furthermore, we observe an increase in the lidar ratio with relative humidity for continental aerosol and report hygroscopic growth factors. The findings are compared to the assumptions made in the CALIPSO version 4 automated aerosol classification and lidar ratio selection algorithm (Kim et al., 2018). We could confirm these assumptions for marine and sulfate aerosol. However, we see slight differences for mineral dust and continental aerosol and pronounced differences for elevated smoke.
- Article
(6158 KB) - Full-text XML
- BibTeX
- EndNote


Aerosol particles are a major constituent of the atmosphere. They influence the Earth's radiation budget directly by scattering and absorbing longwave and shortwave radiation and indirectly by influencing cloud formation and precipitation. They are highly variable in space and time. This behavior challenges the observations of aerosol particles. Ground-based in situ measurements help to estimate aerosol's influence on human health but do not provide a reasonable assessment of the aerosol impact on cloud formation and radiation. Therefore, vertically resolved observations are needed. Light detection and ranging (lidar) systems are proven to be the most suitable to provide the required vertical profile of aerosol optical properties from the ground up to the stratosphere. In the past decades, multiwavelength lidar systems became widely used (e.g., Althausen et al., 2000; Burton et al., 2015; Engelmann et al., 2016; Haarig et al., 2017a). Usually, light pulses are emitted at 355, 532, and 1064 nm and the elastically backscattered light is detected (Mie lidar principle). In order to assess the mass concentration and optical depth of the aerosol load, measurements of the extinction coefficient are necessary. Additional detection of the elastically backscattered and Doppler-broadened light from air molecules (high-spectral-resolution lidar, HSRL; Shipley et al., 1983) or Raman backscattered by nitrogen molecules (vibrational–rotational Raman transitions; Ansmann et al., 1992) enables the direct measurement of the extinction coefficient. Alternatively, the pure rotational Raman transitions can be used to derive the extinction coefficient (e.g., Achtert et al., 2013;Veselovskii et al., 2015; Haarig et al., 2016). The HSRL and Raman lidar methods enable the independent measurement of the backscatter and extinction coefficient and thus the calculation of the extinction-to-backscatter ratio (lidar ratio). This ratio depends on the aerosol type and is therefore a favorable and useful quantity in state-of-the-art aerosol typing schemes (e.g., Burton et al., 2012; Floutsi et al., 2024). Backscatter lidars (Mie lidars) including ceilometers (e.g., E-profile) and micro-pulse lidars (Campbell et al., 2002) need to assume an aerosol-type-dependent lidar ratio to derive the extinction coefficient. At 355 and 532 nm, there are a large number of Raman and HSRL measurements available and lidar ratio statistics reported (e.g., by Müller et al., 2007; Floutsi et al., 2023). However, at 1064 nm almost all lidars are simple backscatter lidars, e.g., the lidars in PollyNET (Baars et al., 2016), the European Research Lidar Network (EARLINET), and the Asian dust and aerosol lidar observation network (AD-Net; Nishizawa et al., 2017), or spaceborne lidars such as the Cloud–Aerosol Lidar with Orthogonal Polarization (CALIOP; Omar et al., 2009; Kim et al., 2018), the Cloud–Aerosol Transport System (CATS; Yorks et al., 2016), and the Aerosol and Carbon Detection Lidar (ACDL/DQ-1; Dai et al., 2024). Furthermore, a great number of ceilometers are operated at 1064 nm (e.g., Wiegner et al., 2019). Therefore, there is a high need to know the lidar ratio at this wavelength to derive extinction coefficients from these numerous backscatter lidar observations.
Lidar ratio retrievals from the Aerosol Robotic Network (AERONET) provide global statistics for mineral dust (Shin et al., 2018), but the retrievals at the near-infrared wavelengths are not validated by measurements yet. They are based on modeling optical properties of spheroids (Dubovik et al., 2006), which may fail in predicting the correct spectral slope at 180° scattering angle (e.g., Zubko et al., 2013; Wandinger et al., 2023). Furthermore, additional instruments can be used to constrain the extinction coefficient and to estimate the lidar ratio. Ground-based backscatter lidar observations can make use of the columnar extinction coefficient provided by a sun photometer as aerosol optical depth (AOD) (e.g., Mattis et al., 2004; Tesche et al., 2009). For CALIPSO, a solution was found by using opaque water clouds for AOD estimation (Hu et al., 2007) or the ocean surface reflectance and additional cloud radar returns; this is the so-called Synergized Optical Depth of Aerosols (SODA) technique to derive independently the AOD (e.g., Josset et al., 2011; Painemal et al., 2019). The retrieval algorithms from passive sensors and the columnar AOD to constrain the extinction coefficient are helpful, but here we will present direct measurements.
The first rotational Raman lidar measurements at 1064 nm were reported by Haarig et al. (2016) with a cirrus case study. Since then, measurements in smoke layers (Haarig et al., 2018), desert dust (Haarig et al., 2022; Gebauer et al., 2024), and sulfate–marine mixtures (Gebauer et al., 2024) have been reported. Additionally, new lidar systems are designed to measure the extinction at 1064 nm (Wang et al., 2024a, b).
One aim of this study is to check the assumptions of the lidar ratio at 1064 nm made for Cloud–Aerosol Lidar and Infrared Pathfinder Satellite Observations (CALIPSO) version 4 (v4) aerosol typing and the lidar ratio selection algorithm presented in Kim et al. (2018). For this reason, we gathered rotational Raman observations for the CALIPSO aerosol types clean marine, dust, clean continental, elevated smoke, and sulfate/other and discuss them compared to the respective values used by Kim et al. (2018).
In the present study, we first shortly present the rotational Raman technique applied in the near-infrared wavelength range (Sect. 2). Some corrections and limitations are discussed in the Appendix. Then, we show two case studies of marine and continental aerosol as an addition to the rare lidar ratio observations at 1064 nm already existing (Sect. 3). Furthermore, we investigate the influence of relative humidity (RH) on the lidar ratio of continental aerosol and derive hygroscopic growth parameters for the backscatter coefficient, extinction coefficient, and lidar ratio at 355, 532, and 1064 nm. The main part is the discussion of the spectral dependence of the lidar ratio of different aerosol types and the comparison to CALIPSO v4 values in Sect. 4, which is followed by a conclusion in Sect. 5.
Extinction coefficients and lidar ratios at 355 and 532 nm were derived with the vibrational–rotational Raman lidar technique. The signals of the inelastically backscattered light at 387 and 607 nm (vibrational–rotational Raman lines of nitrogen) were used. This technique is widely known and needs no further description at this point (see, e.g., Ansmann et al., 1992).
Recently, the pure rotational Raman technique (Whiteman, 2003a, b) has been applied to derive the extinction coefficient, e.g., at 532 nm (Veselovskii et al., 2015) or 355 nm (Ortiz-Amezcua et al., 2020), but also allows us to obtain the extinction coefficient at 1064 nm. The first direct extinction measurement at 1064 nm ever was performed in a cirrus cloud (Haarig et al., 2016) with the Backscatter Extinction lidar-Ratio Temperature Humidity profiling Apparatus (BERTHA).
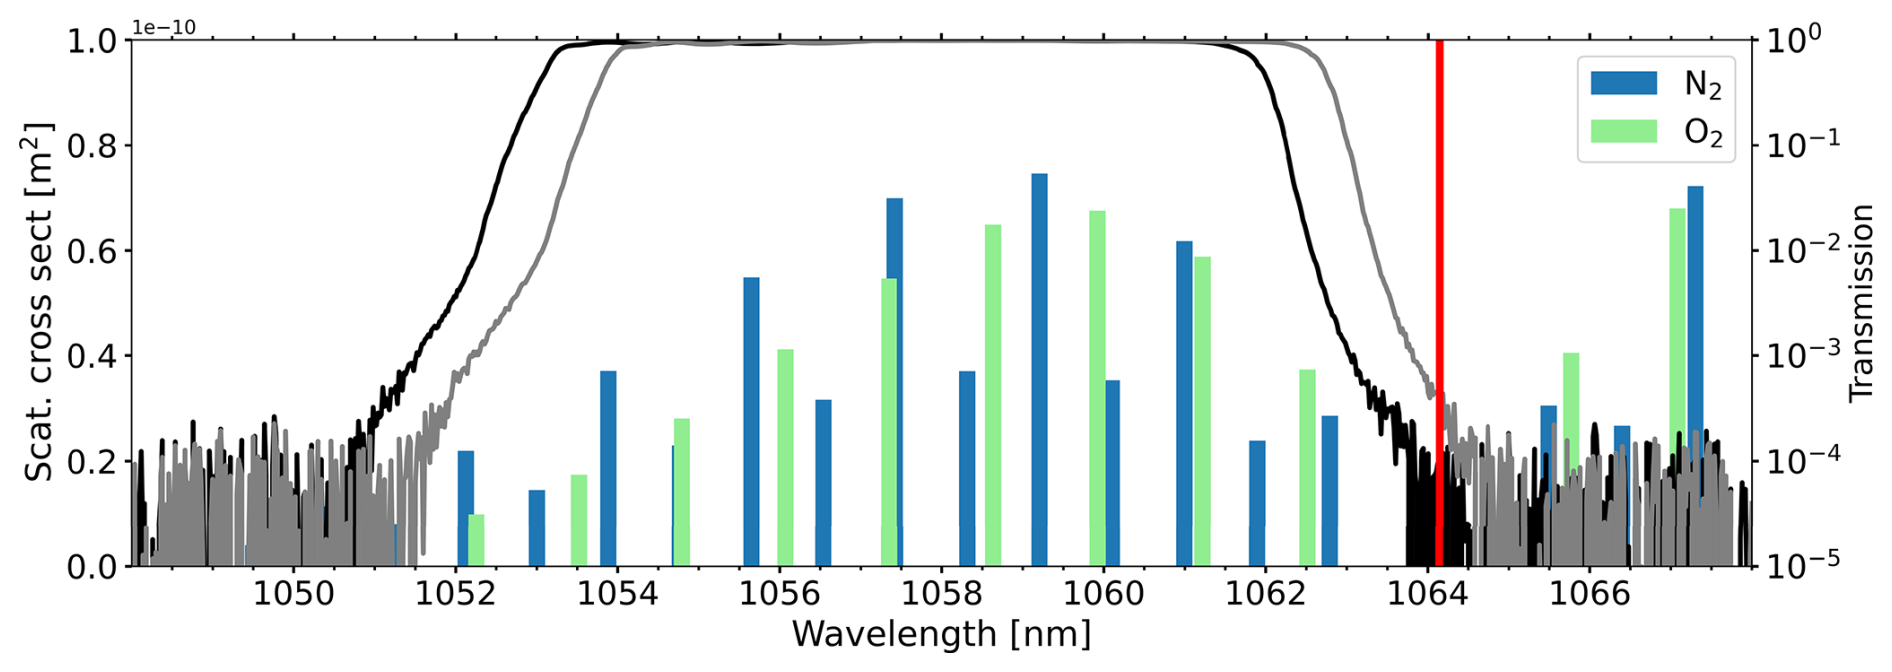
Figure 1The scattering cross-section (left y axis) of the rotational Raman lines of nitrogen (N2, blue) and oxygen (O2, green) excited at a wavelength of 1064.14 nm (marked by a red vertical line). Additionally, the transmission curves of both interference filters are shown on a logarithmic scale (right y axis). The suppression of the elastic backscatter at 1064.14 nm is better for interference filter 1 (black line) than for interference filter 2 (gray line).
The same technique introduced in BERTHA is now also applied for the PollyXT observations at Mindelo, Cabo Verde. We will give a short description here. A full technical description of the implementation of the rotational Raman technique was already presented by Haarig et al. (2016). Interference filters (Alluxa, Santa Rosa, USA, https://alluxa.com/, last access: 15 December 2024) centered at 1058 nm with transmissions from 1053 to 1062 nm (9 nm bandwidth) were used to detect the rotational Raman lines of nitrogen and oxygen as shown in Fig. 1. Wang et al. (2024b) recently presented a slightly different approach by using an interference filter centered at 1056 nm with a width of 6 nm to reduce the spectral cross-talk. Figure 1 presents the calculated rotational Raman lines and the transmission curves of the interference filters as measured by the manufacturer. The filters are slightly different in their transmission properties. The suppression at the emitted laser wavelength of 1064.14 nm is crucial and is better achieved for filter 1 (shown as a black line in Fig. 1). By using two interference filters we were able to achieve a suppression of 8 orders of magnitude of the elastically backscattered light. The correction of the still remaining spectral cross-talk and of the temperature dependence of the rotational Raman lines is described in Appendix Sect. A1. The molecular signal at 1064 nm is 81 times weaker compared to the one at 355 nm due to the strong wavelength dependence of Rayleigh scattering. This is one of the main limitations of the rotational Raman method at 1064 nm. Therefore, long temporal and vertical averaging is necessary, which limits our current approach to the analysis of case studies only. The limitations of the rotational Raman method at 1064 nm are discussed in greater detail in Appendix Sect. A2.
Extinction and lidar ratio measurements at 1064 nm of marine and continental aerosol are still lacking in the literature. Therefore, we report these cases in greater detail in the following section, before the spectral slope of various aerosol types is discussed in Sect. 4. Additionally, we investigate the effect of hygroscopic growth on the lidar ratio of continental aerosol in Sect. 3.3.
3.1 Triple-wavelength lidar ratio observations of marine aerosol at Cabo Verde
Since the summer of 2021, TROPOS has operated a new PollyXT lidar at the Ocean Science Centre Mindelo (16.878° N, 24.995° W) at São Vicente Island, Cabo Verde. In addition to previous PollyXT systems described in Engelmann et al. (2016), this lidar has the capability to measure the depolarization ratio and the extinction coefficient at 1064 nm. These capabilities were used for the first time in the study of Gebauer et al. (2024) to derive the so-called data set (three backscatter coefficients, three extinction coefficients, three depolarization ratios) of Saharan dust and sulfate aerosol from the Cumbre Vieja (Spain) eruption in autumn of 2021.
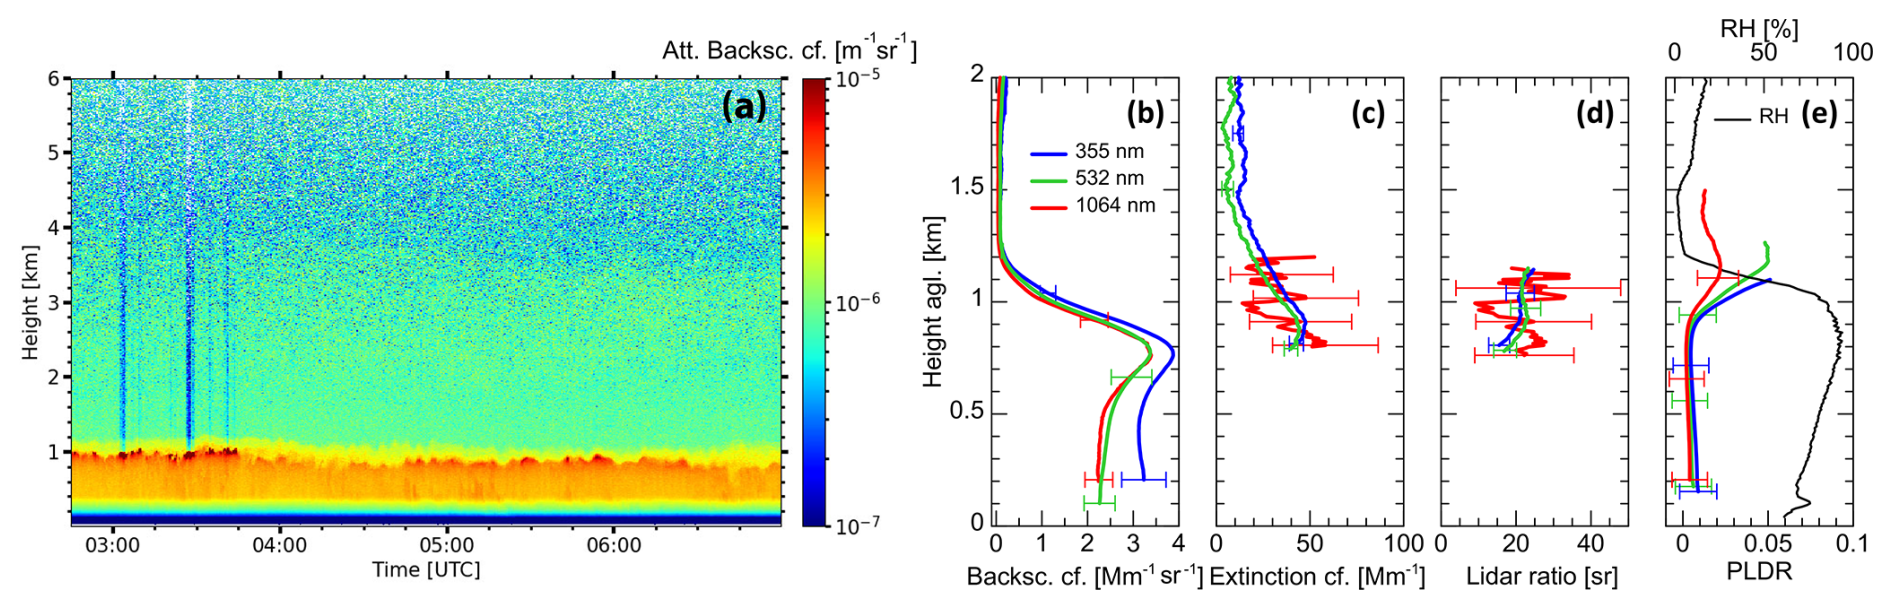
Figure 2Lidar observations of marine aerosol below 1 km height at Mindelo, Cabo Verde, on 26 March 2022: (a) time–height display of PollyXT observations (attenuated backscatter coefficient at 532 nm). The vertical profiles are provided above ground level (a.g.l.) between 03:45 and 05:50 UTC: (b) particle backscatter coefficient, (c) particle extinction coefficient, (d) lidar ratio, and (e) particle linear depolarization ratio (PLDR) and relative humidity (RH, black line, upper x axis). A gliding average of 200 m was applied for the backscatter coefficient and depolarization ratio and of 750 m for the extinction coefficient and lidar ratio.
Here, we present a case of marine aerosol observed on 26 March 2022 (Fig. 2). Cumulus clouds were detected on top of the marine boundary layer at around 1 km height until 03:45 UTC. These optically dense water clouds cause significant laser light attenuation, indicated by the vertical blue columns above the marine boundary layer. We use the cloud-free observations after 03:45 UTC for aerosol profiling. Another aerosol layer reaching up to 4 km height can be seen above the marine boundary layer. This faint layer has a much weaker backscatter signal of 0.2 compared to a maximum backscatter coefficient of 3.1 (at 532 nm) in the marine aerosol layer (Fig. 2b). It is a mixed layer (PLDR of 0.13 ± 0.02 at 532 nm) of mineral dust, urban haze, and biomass burning smoke originating from the African continent as often observed during SAMUM-2 (Saharan Mineral Dust Experiment) campaign in 2008 (Tesche et al., 2011).
Focusing on the layer below 1 km height, the low depolarization ratio (<0.01) and a lidar ratio of 20–25 sr (at 355 and 532 nm) plus the location in the Atlantic Ocean undoubtedly characterize this layer as a clean marine boundary layer. The optical properties are summarized in Table 1. The extinction and lidar ratio data at 1064 nm are quite noisy and the uncertainties are high. Nevertheless, the spectrally neutral behavior of the lidar ratio is obvious and will be further discussed in Sect. 4.1.1. An interesting feature is the increase in the depolarization ratio on top of the marine aerosol layer between 1.0 and 1.5 km height up to 0.05 at 532 nm. We have observed in the past that the increase in the depolarization ratio is linked to drying marine aerosol (Haarig et al., 2017b; Bohlmann et al., 2018). Drier air masses from above mixed with the humid marine layer cause this process and also lead to the dissolving of the cumulus clouds. However, the presence of some mineral dust particles and their effect on the depolarization ratio cannot be fully excluded here.
3.2 Triple-wavelength lidar ratio observations of continental aerosol at Leipzig
The summer of 2018 was one of the hottest and driest summers in Germany since the beginning of systematic weather reporting. These conditions favored the development of vertically extended planetary boundary layers of continental aerosol up to 4 km height. On the night of 7 August 2018, five Raman polarization lidars were operated simultaneously at Leipzig (51.12° N, 12.3° E): BERTHA, MARTHA (Multiwavelength Atmospheric Raman lidar for Temperature, Humidity and Aerosol profiling; e.g., Jimenez et al., 2019), PollyXT–OCEANET (e.g., Engelmann et al., 2021), PollyXT–LACROS (Leipzig Aerosol and Cloud Remote Observations System; e.g., Radenz et al., 2021), and Polly 1st (e.g., Engelmann et al., 2016). A picture with the five lidar beams (visible at 532 nm) at the Leibniz Institute for Tropospheric Research is shown in Fig. 3. The lidar ratio at 532 nm was observed with all systems, the lidar ratio at 355 nm with all lidars except Polly 1st, and the lidar ratio at 1064 nm only with BERTHA. The BERTHA lidar was manually operated for 2 h and 22 min (Fig. 4a). The essential cross-talk correction (see Appendix A1) was done using the liquid clouds between 3 and 4 km height before 21:00 UTC. A spectral cross-talk correction factor of was determined. As already mentioned, the same interference filters have been used as at Cabo Verde (since 2021). However, the suppression of the elastic signal by neutral density filters was much stronger (optical thickness of 3.1 compared to 1.0 at Cabo Verde; Sect. 3.1). The measurement of the extinction coefficient at 1064 nm with BERTHA was only possible for heights > 2.2 km because of remaining overlap effects in the near-infrared channels at heights below.
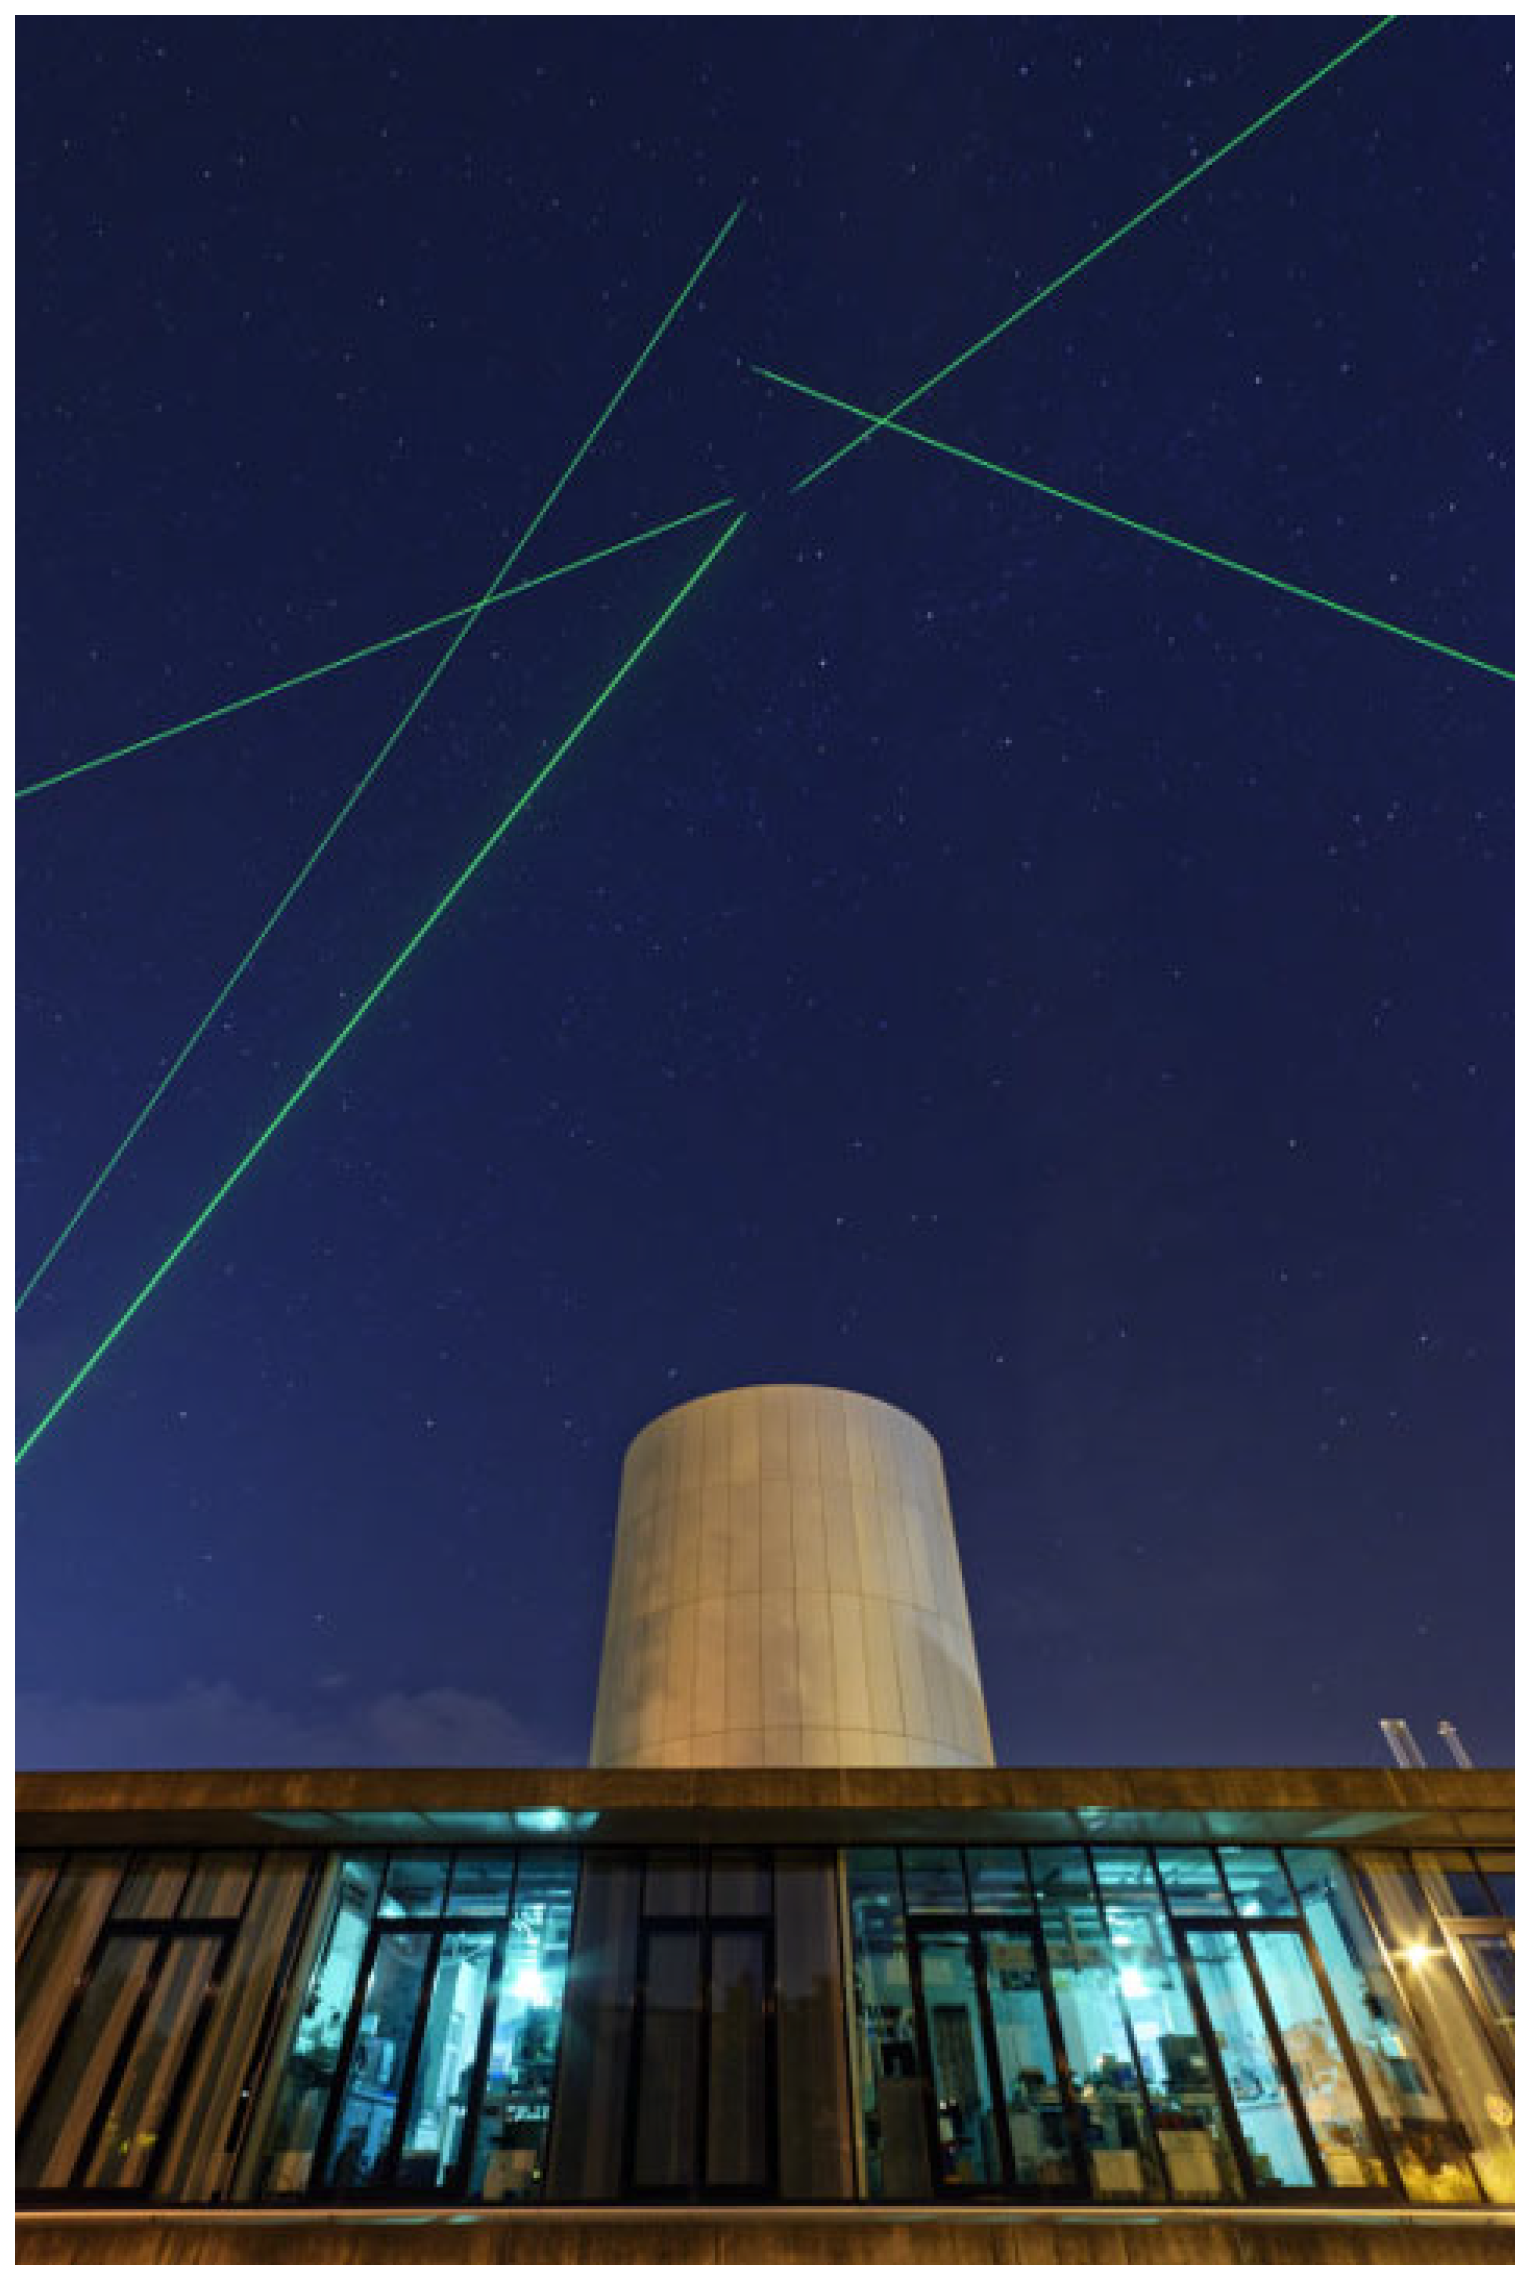
Figure 3Five lidar beams over the Leibniz Institute for Tropospheric Research on the night of 7 August 2018 (photo by Tilo Arnhold, public relations of TROPOS).
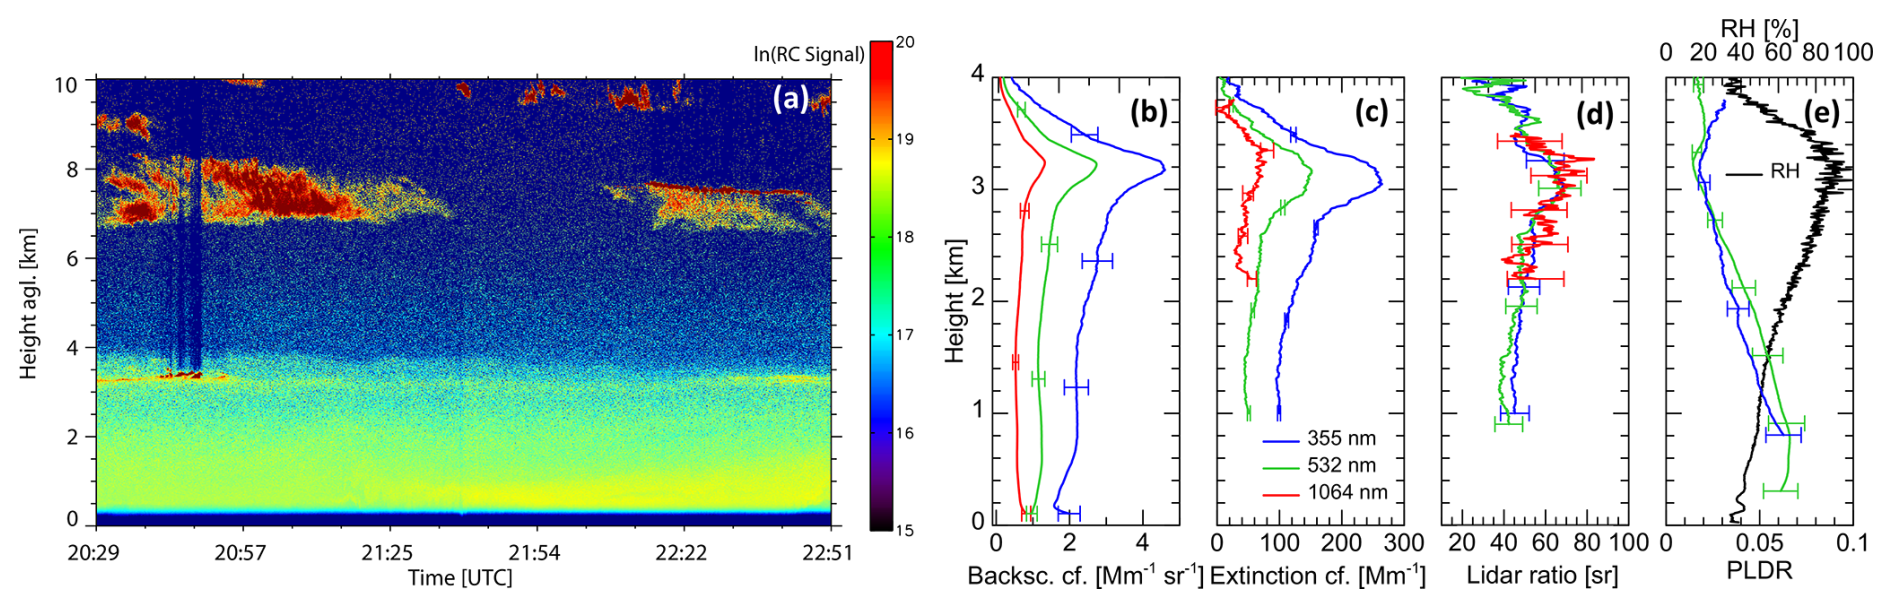
Figure 4Lidar observations of continental aerosol at Leipzig on 7 August 2018: (a) time–height display of BERTHA observations (range-corrected signal at 532 nm). The vertical profiles of the optical properties are shown above ground level (a.g.l.) between 20:55 and 22:51 UTC: (b) particle backscatter coefficient, (c) particle extinction coefficient, (d) lidar ratio, and (e) particle linear depolarization ratio (PLDR) and relative humidity (RH, black line, upper x axis). The data at 1064 nm (red) are recorded with BERTHA, and the data at 355 (blue) and 532 nm (green) are shown from the PollyXT–LACROS measurements. A gliding average of 200 m was applied for the backscatter coefficient and depolarization ratio; 500 m at 355 and 532 nm (750 m at 1064 nm) was applied for the extinction coefficient and lidar ratio.
The recorded profiles are shown in Fig. 4b–e for the time between 20:55 and 22:51 UTC in order to exclude the liquid clouds at the beginning of the observations. At around 2.8 km height, a significant increase in the backscatter and extinction coefficient was observed (Fig. 4b, c). This increase is linked to an increase in relative humidity and therefore to hygroscopic growth of the continental aerosol particles. The relative humidity (shown in Fig. 4e) was calculated from the water vapor measurements of PollyXT–LACROS calibrated with the integrated water vapor derived from a microwave radiometer (HATPRO, RPG, Meckenheim, Germany) and the temperature profile of the ECMWF (European Centre for Medium-Range Weather Forecasts). The formation of the liquid clouds before 21:00 UTC in this layer and the decrease in the depolarization ratio are further indications of the increase in relative humidity with height as obvious from the derived RH profile (Fig. 4e). A detailed discussion about the hygroscopic growth and the calculation of growth factors of the backscatter coefficient, extinction coefficient, and lidar ratio at all three lidar wavelengths is given in the next section (Sect. 3.3) because here we want to focus on the spectral behavior of the lidar ratio.
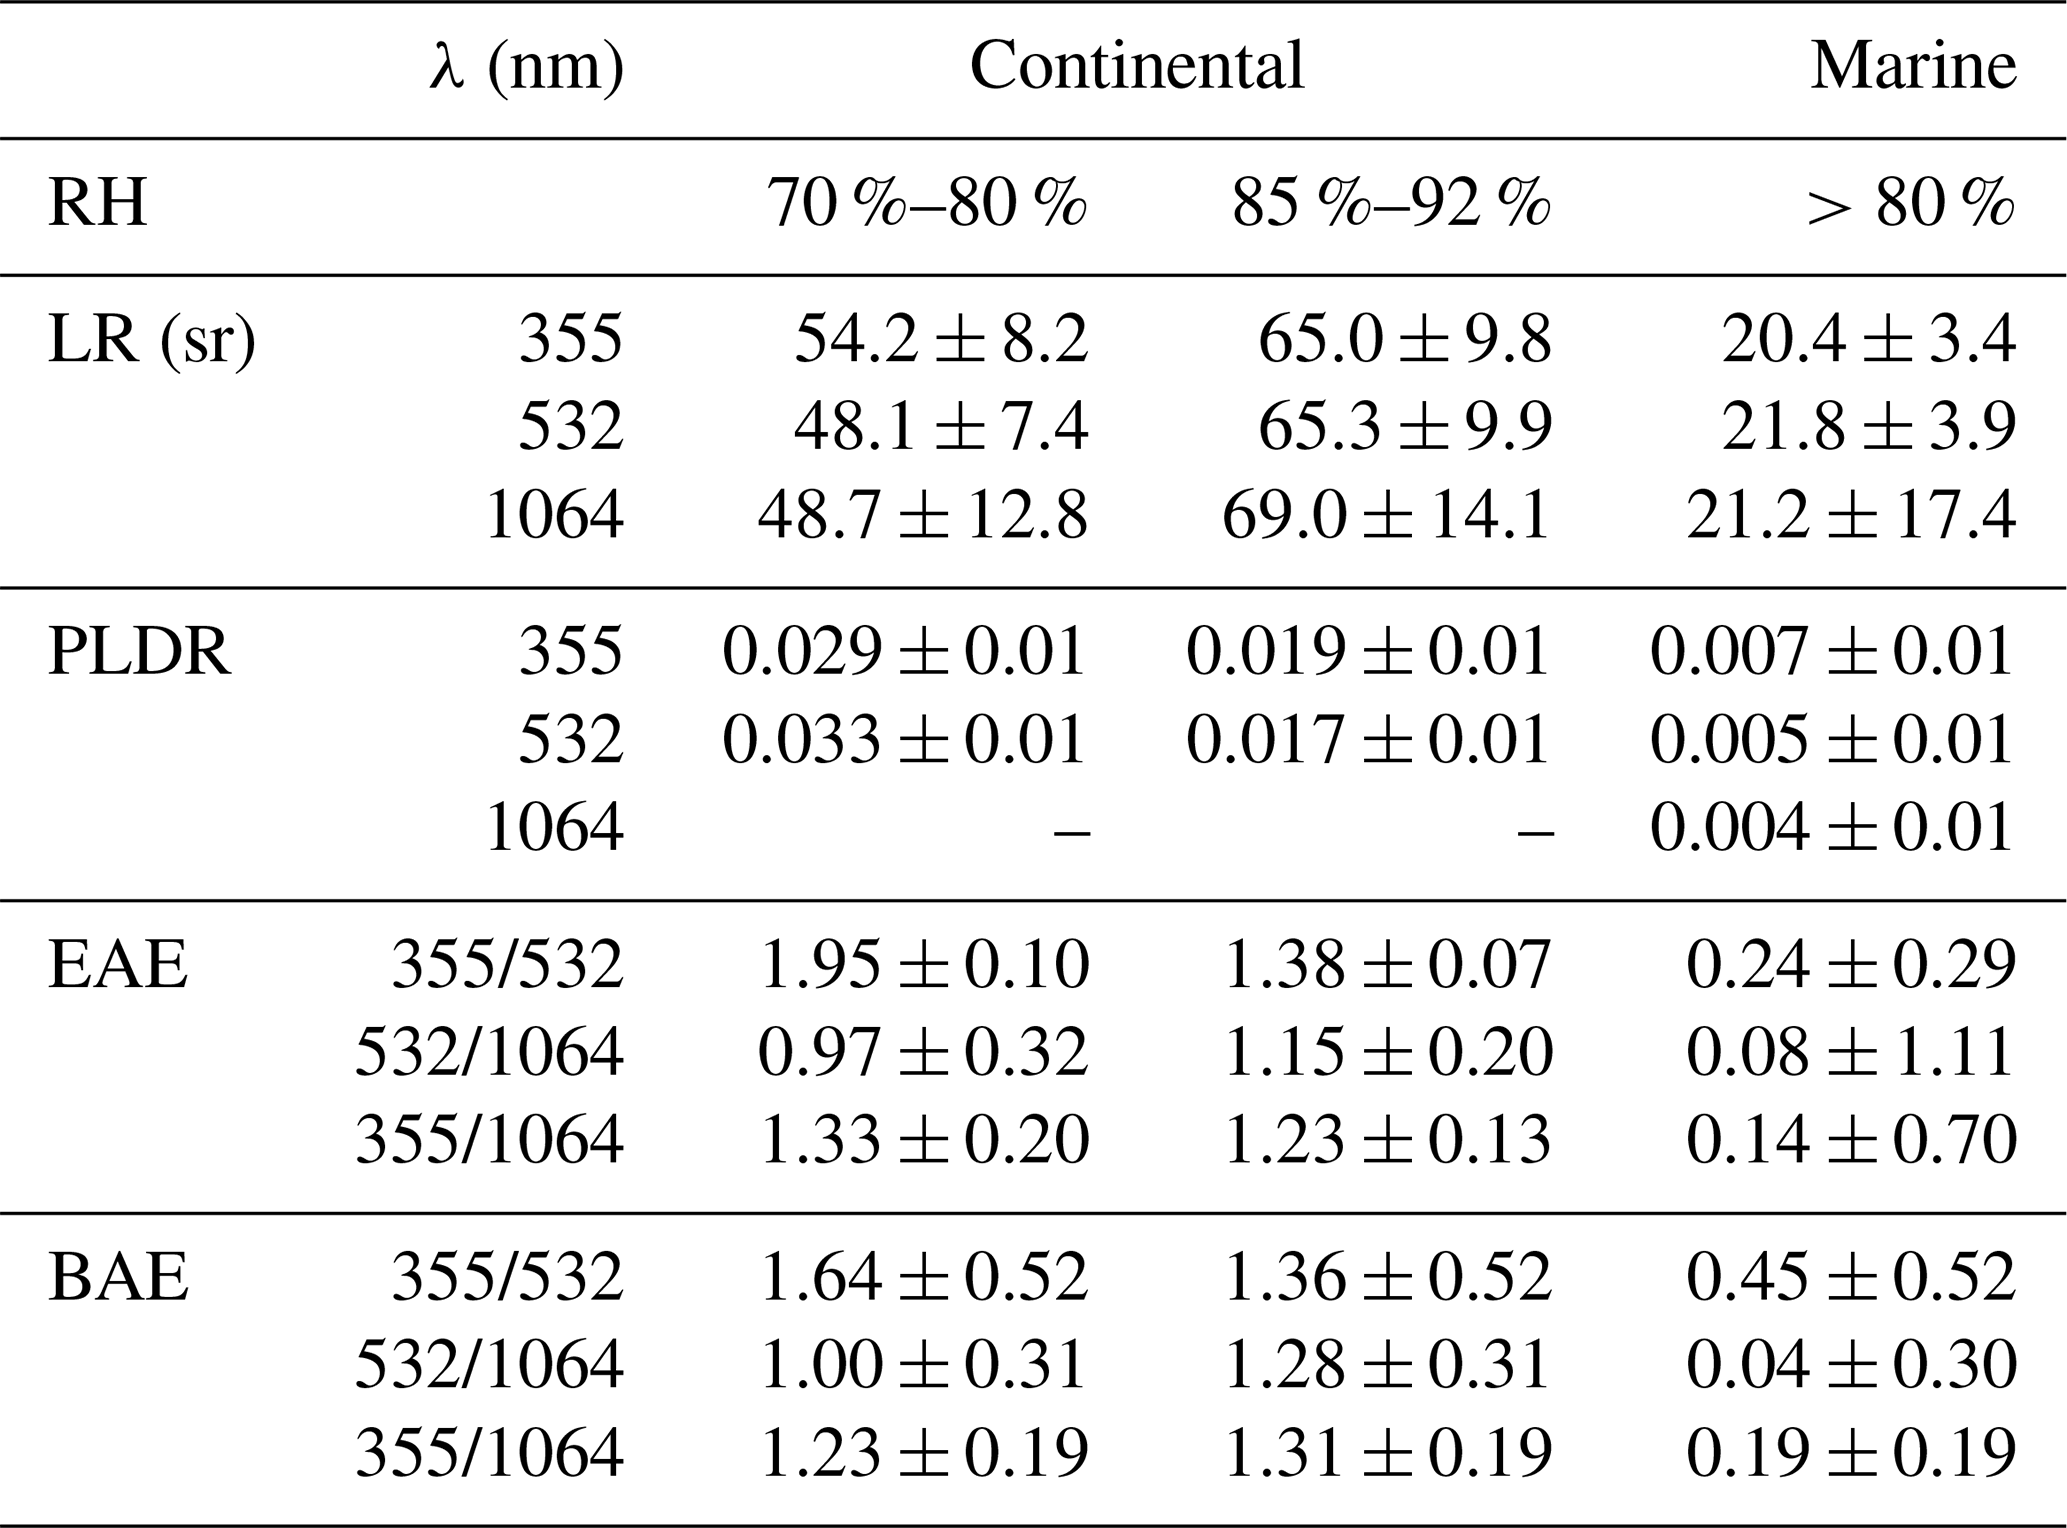
The intensive optical properties are summarized in Table 1. They are separated for the conditions below 80 % RH (reached at 2.61 km height) and above 85 % RH (observed between 2.94 and 3.30 km height). This separation is motivated by the findings of Skupin et al. (2016), who showed that the extinction enhancement factor starts to increase drastically at an RH of 85 %. A similarly strong enhancement for the extinction at around 2.9 km height can also be seen in our measurements in Fig. 4c. The increase in the extinction coefficient is stronger than the increase in the backscatter coefficient, leading to an increase in the lidar ratio with increasing RH. Our observations show that the lidar ratios for hygroscopically grown continental aerosol are in the range of 65–69 sr for all three lidar wavelengths, while lidar ratios at lower RH are in the range of 48–54 sr. An increase in the lidar ratio with RH for continental aerosol was predicted by Ackermann (1998), simulated by Zhao et al. (2017) in the North China Plain, and retrieved from in situ observations by Düsing et al. (2021) in central Germany.
To avoid the influence of hygroscopic growth in our discussion about the spectral slope of the lidar ratio, we will focus on the aerosol layer below 2.61 km height as representative for continental aerosol. Here, the lidar ratio ranges between 48 and 54 sr at all three lidar wavelengths. At 355 and 532 nm, a variety of aerosol typing schemes exist. The low depolarization ratios (around 0.03), the intermediate lidar ratios (45–55 sr), and the enhanced Ångström exponents would result in “anthropogenic pollution” according to Groß et al. (2013) and are in perfect agreement with the “central European background” discussed in Floutsi et al. (2023). Furthermore, it is in line with long-term observations of planetary boundary layer (PBL) aerosol properties in central Europe (Mattis et al., 2004). Thus, we are confident that these measurements represent continental aerosol and can be used to compare it to the category of “clean continental” in CALIPSO v4 aerosol typing, which will be done in Sect. 4.1.3.
Table 1The optical properties observed in the continental (Leipzig, 7 August 2018) and marine (Mindelo, 26 March 2022) boundary layer. The range of relative humidity (RH) is provided additionally. In the case of continental aerosol, the values at 1064 nm were measured with BERTHA, and the values at 355 and 532 nm were measured with PollyXT–LACROS. λ – wavelength, LR – lidar ratio, PLDR – particle linear depolarization ratio, EAE – extinction-related Ångström exponent, BAE – backscatter-related Ångström exponent.
3.3 Hygroscopic growth of continental aerosol at Leipzig
In this section we describe the hygroscopic growth of continental aerosol which was observed on 7 August 2018 at Leipzig. The measurements are described in the previous section, where we focused on the spectral lidar ratio. Here, we derive the hygroscopic growth factors for the backscatter coefficient, the extinction coefficient, and the lidar ratio. To our knowledge, it is the first lidar study which reports the hygroscopic growth factors of these three quantities at 355, 532, and 1064 nm simultaneously. Therefore, it offers the possibility to study the spectral dependence of the hygroscopic behavior of the aerosol optical properties.
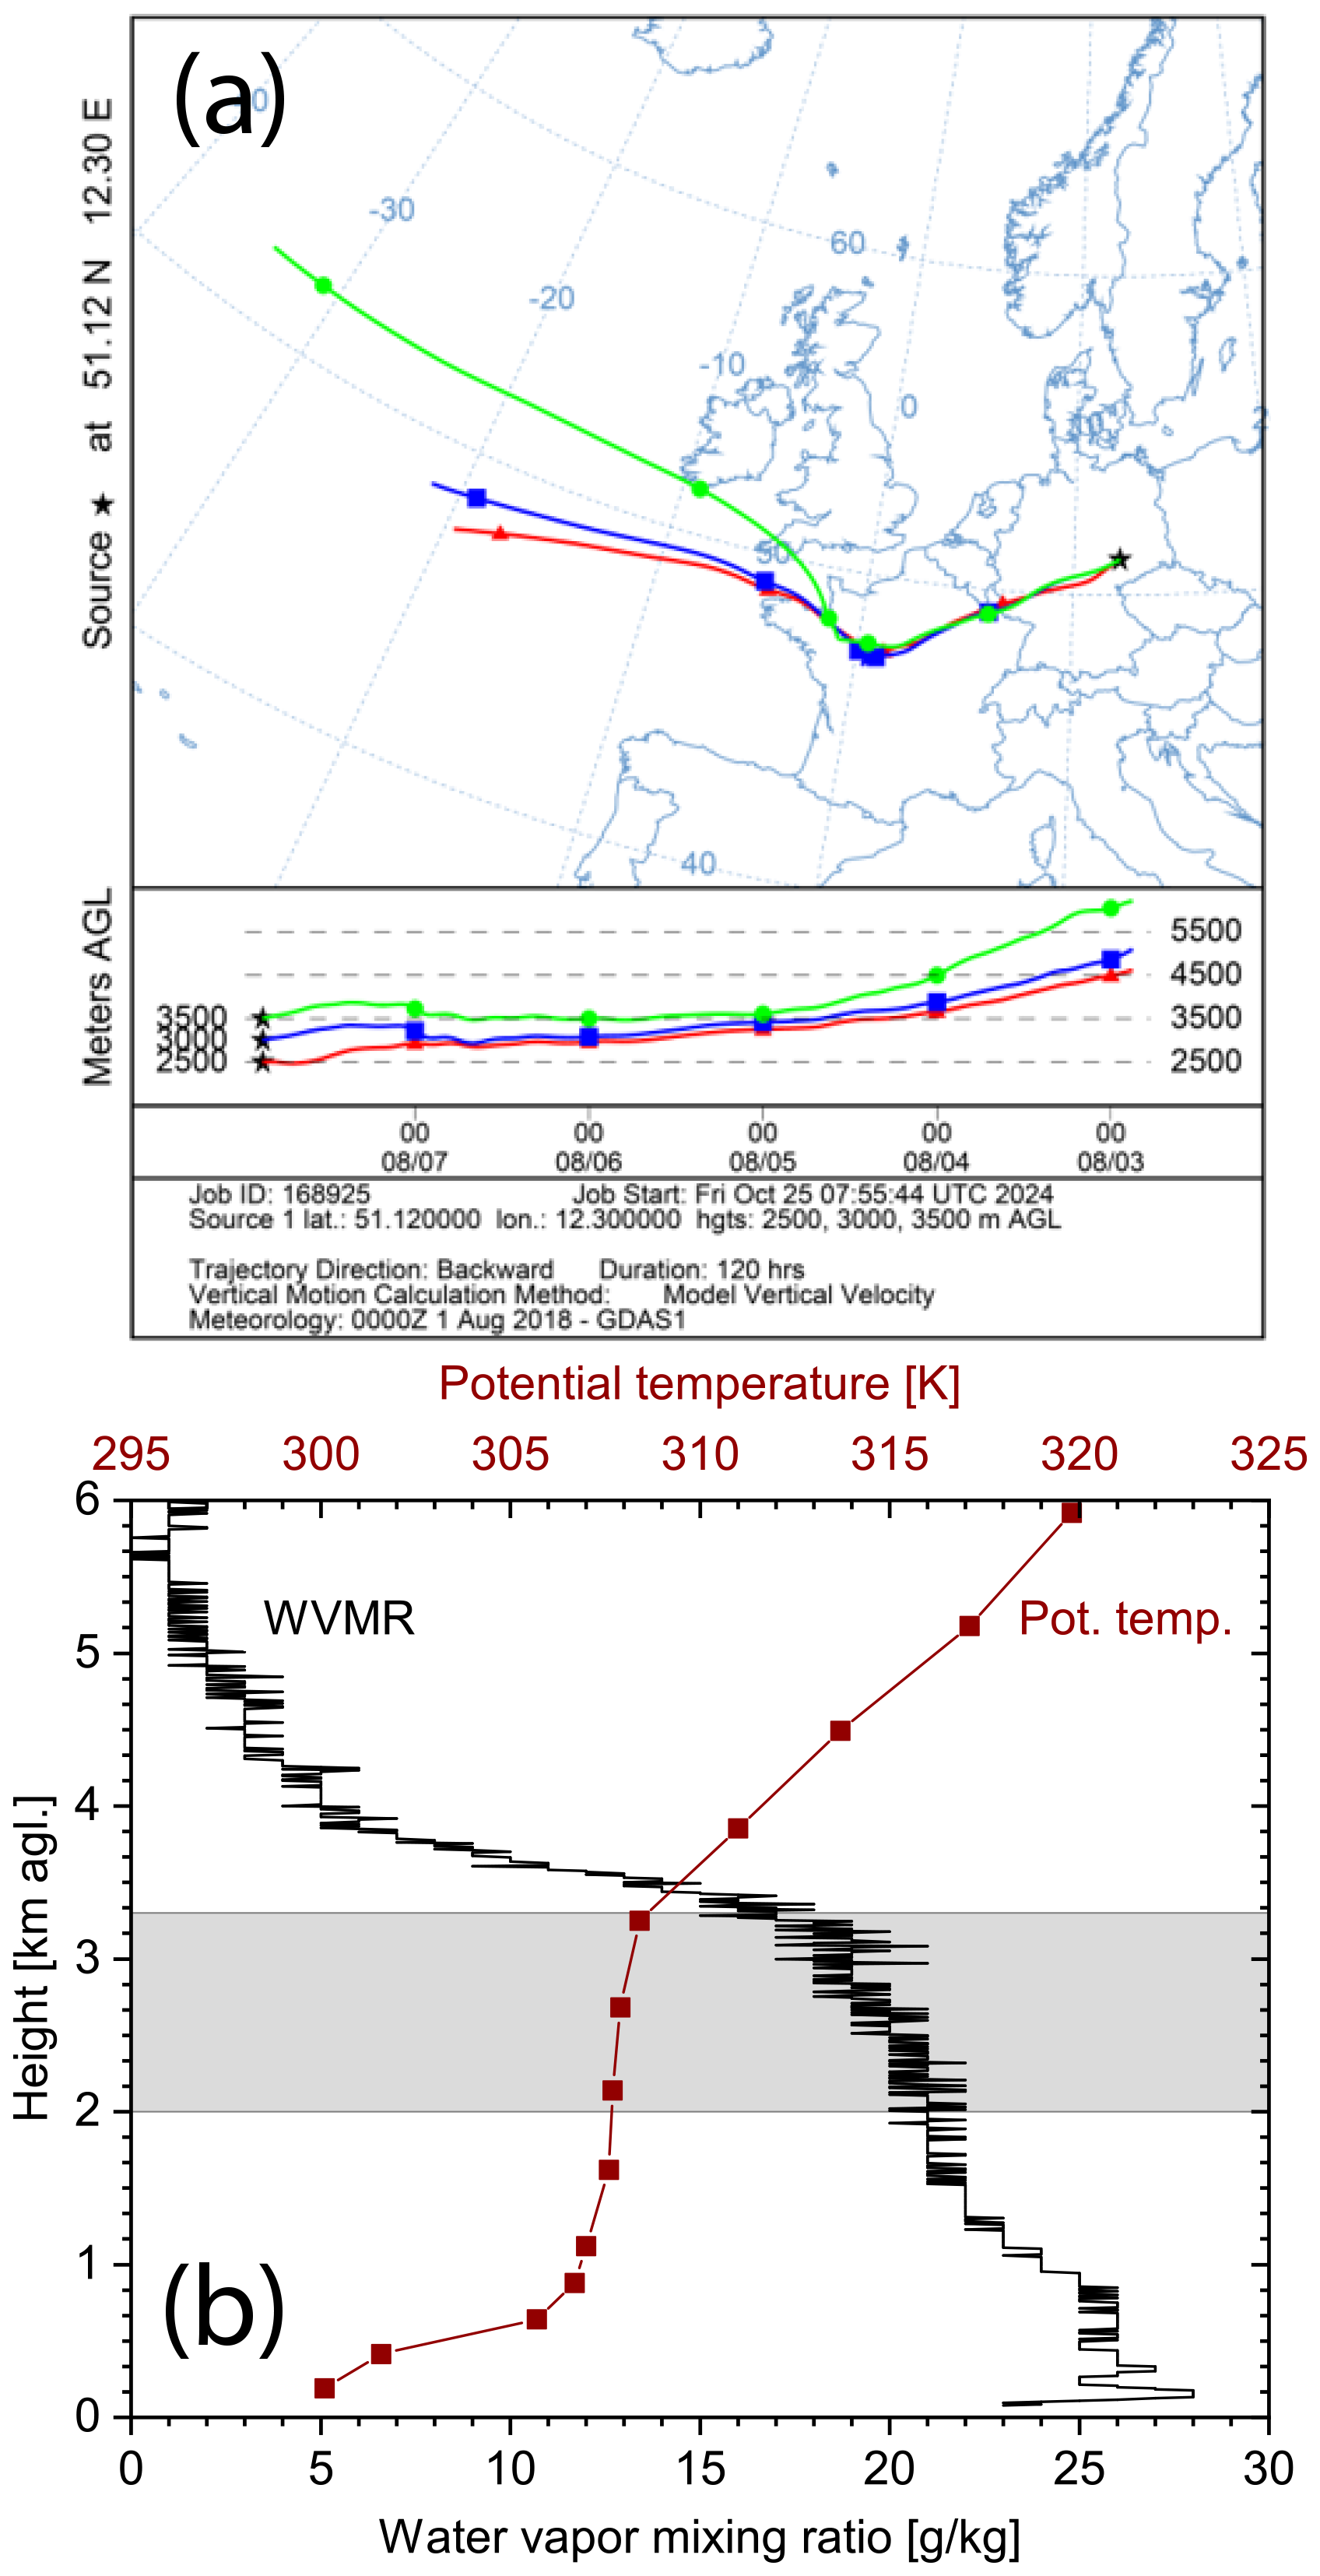
Figure 5(a) 5 d back trajectory calculated by HYSPLIT (Stein et al., 2015). The trajectories arriving at 2.5, 3.0, and 3.5 km height shared the same atmospheric path for the 48–72 h prior to their arrival at Leipzig. (b) Water vapor mixing ratio (WVMR, lower x axis) from the PollyXT–LACROS measurements and potential temperature (upper x axis) from GDAS 1.0 profiles. The height range (2.0–3.3 km a.g.l.) used for the hygroscopic study is shaded in gray. The constant potential temperature and WVMR are clear indications for a stable atmospheric layering.
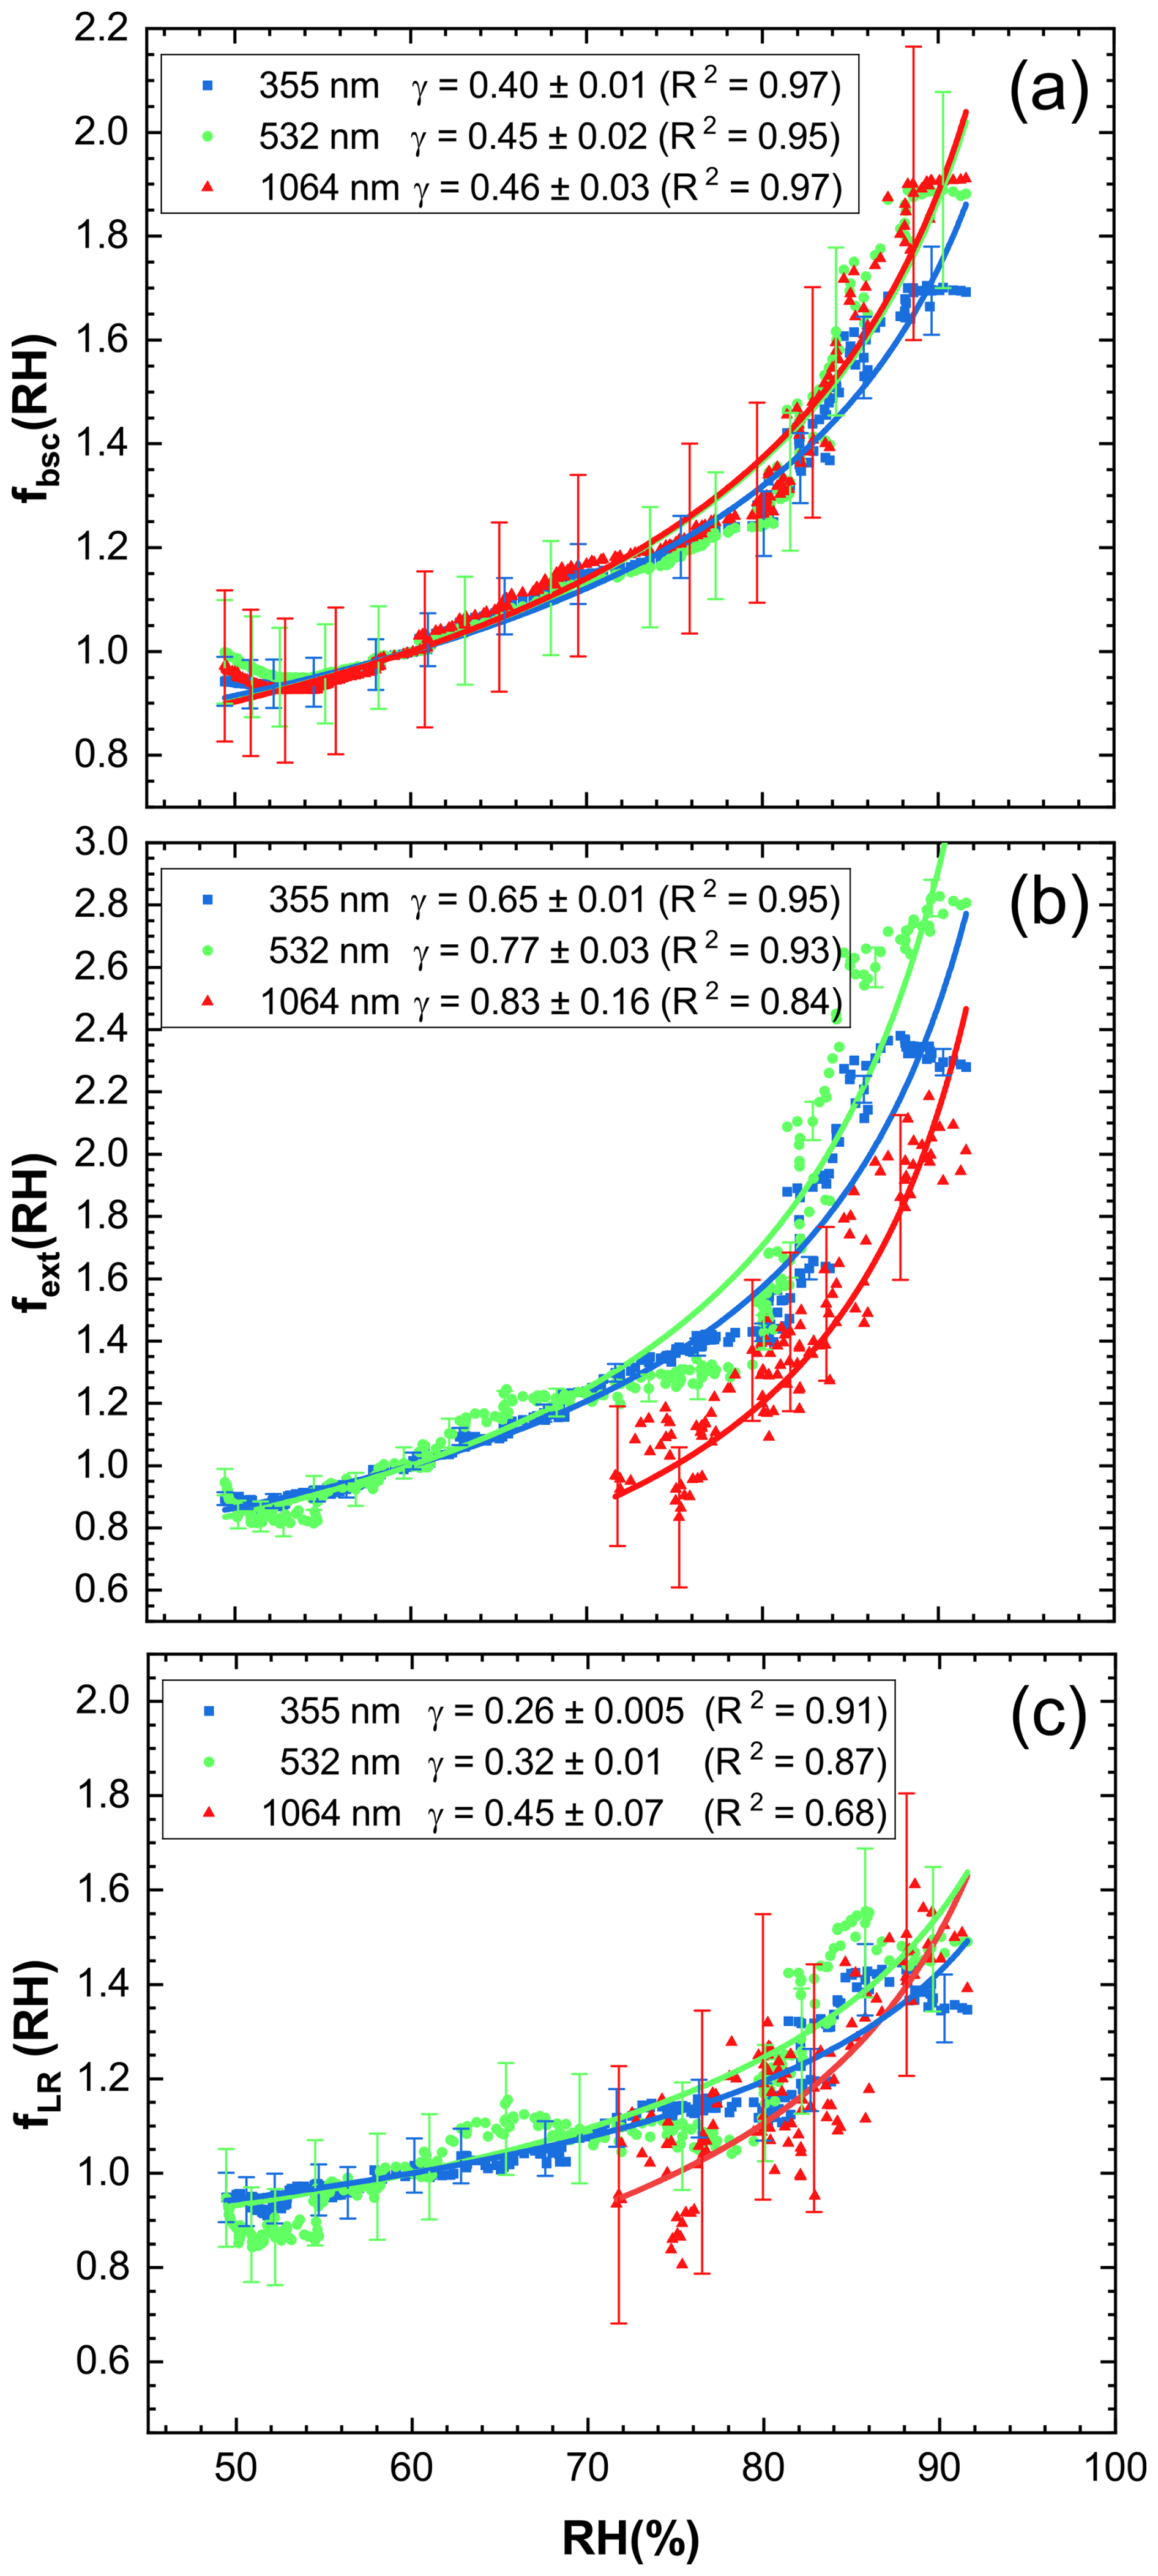
Figure 6(a) Backscatter enhancement factor fbsc, (b) extinction enhancement factor fext, and (c) lidar ratio enhancement factor fLR. A relative humidity (RH) of 60 % is used to normalize the enhancement factors for all quantities except of the extinction coefficient and lidar ratio at 1064 nm, where 75 % RH is used. The hygroscopic growth parameter γ at 355, 532, and 1064 nm is given for all quantities. Additionally, the R2 value of the fit following Eq. (2) is listed. The uncertainty already includes the fit error and the uncertainty of the quantity itself (see last column of Table 2).
In order to link these changes in the optical properties to hygroscopic growth, it is important to check first that the same air mass and aerosol load were present in this height range. The HYSPLIT back trajectories (Fig. 5a) for the heights of 2.5, 3.0, and 3.5 km indicate the same origin of the air masses. On the 3 d prior to the observation, the trajectories followed exactly the same path from northern France to central Germany. The origin of the air masses from the Atlantic Ocean might result in some remaining marine particles in the observed air masses. Additionally, we checked the water vapor mixing ratio from the PollyXT–LACROS observations and the potential temperature from the Global Data Assimilation System (GDAS 1.0). Both are constant in the height range from 2.0 to 3.3 km, as shown in Fig. 5b. This behavior clearly indicates a well-mixed atmosphere, where the same aerosol load was present. All changes in the optical properties in this height range can therefore be attributed to changes in RH.
In order to study the hygroscopic growth, we compute enhancement factors fχ of quantity χ (backscatter coefficient (bsc), extinction coefficient (ext) and lidar ratio – LR) at wavelength λ:
The enhancement factors are normalized to the reference relative humidity RHref. It is 60 % for all quantities except the extinction coefficient and lidar ratio at 1064 nm, where RHref of 75 % is used because of overlap issues in the 1064 nm Raman signals. The hygroscopic growth of aerosol optical properties is commonly described by the Hänel parameterization (Hänel, 1976), which introduces the hygroscopic growth parameter γχ(λ) that describes the dependency of a quantity χ with RH. It depends on aerosol type (in this case continental aerosol) and wavelength. The Hänel parameterization is given by
The results for all nine quantities are presented in Fig. 6 where the γχ(λ) parameter is given. The first finding is that the extinction enhancement is stronger (γext between 0.65 and 0.83) than the backscatter enhancement (γbsc between 0.40 and 0.46), which leads to an enhancement of the lidar ratio (γLR between 0.26 and 0.45) because the lidar ratio is the extinction-to-backscatter ratio. The second finding is that the lidar ratio enhancement increases with wavelength from γLR = 0.26 ± 0.005 at 355 nm to 0.32 ± 0.01 at 532 nm and further to 0.45 ± 0.07 at 1064 nm. This increase with wavelength is already visible in the backscatter and extinction enhancement where the lowest γ values are observed at 355 nm.
Table 2The hygroscopic growth parameters γ of quantity χ, the absolute uncertainty of the fit σfit, the relative uncertainty of the quantity σχ in the studied RH interval (height interval), and the resulting absolute uncertainty of σγ of the hygroscopic growth parameter.
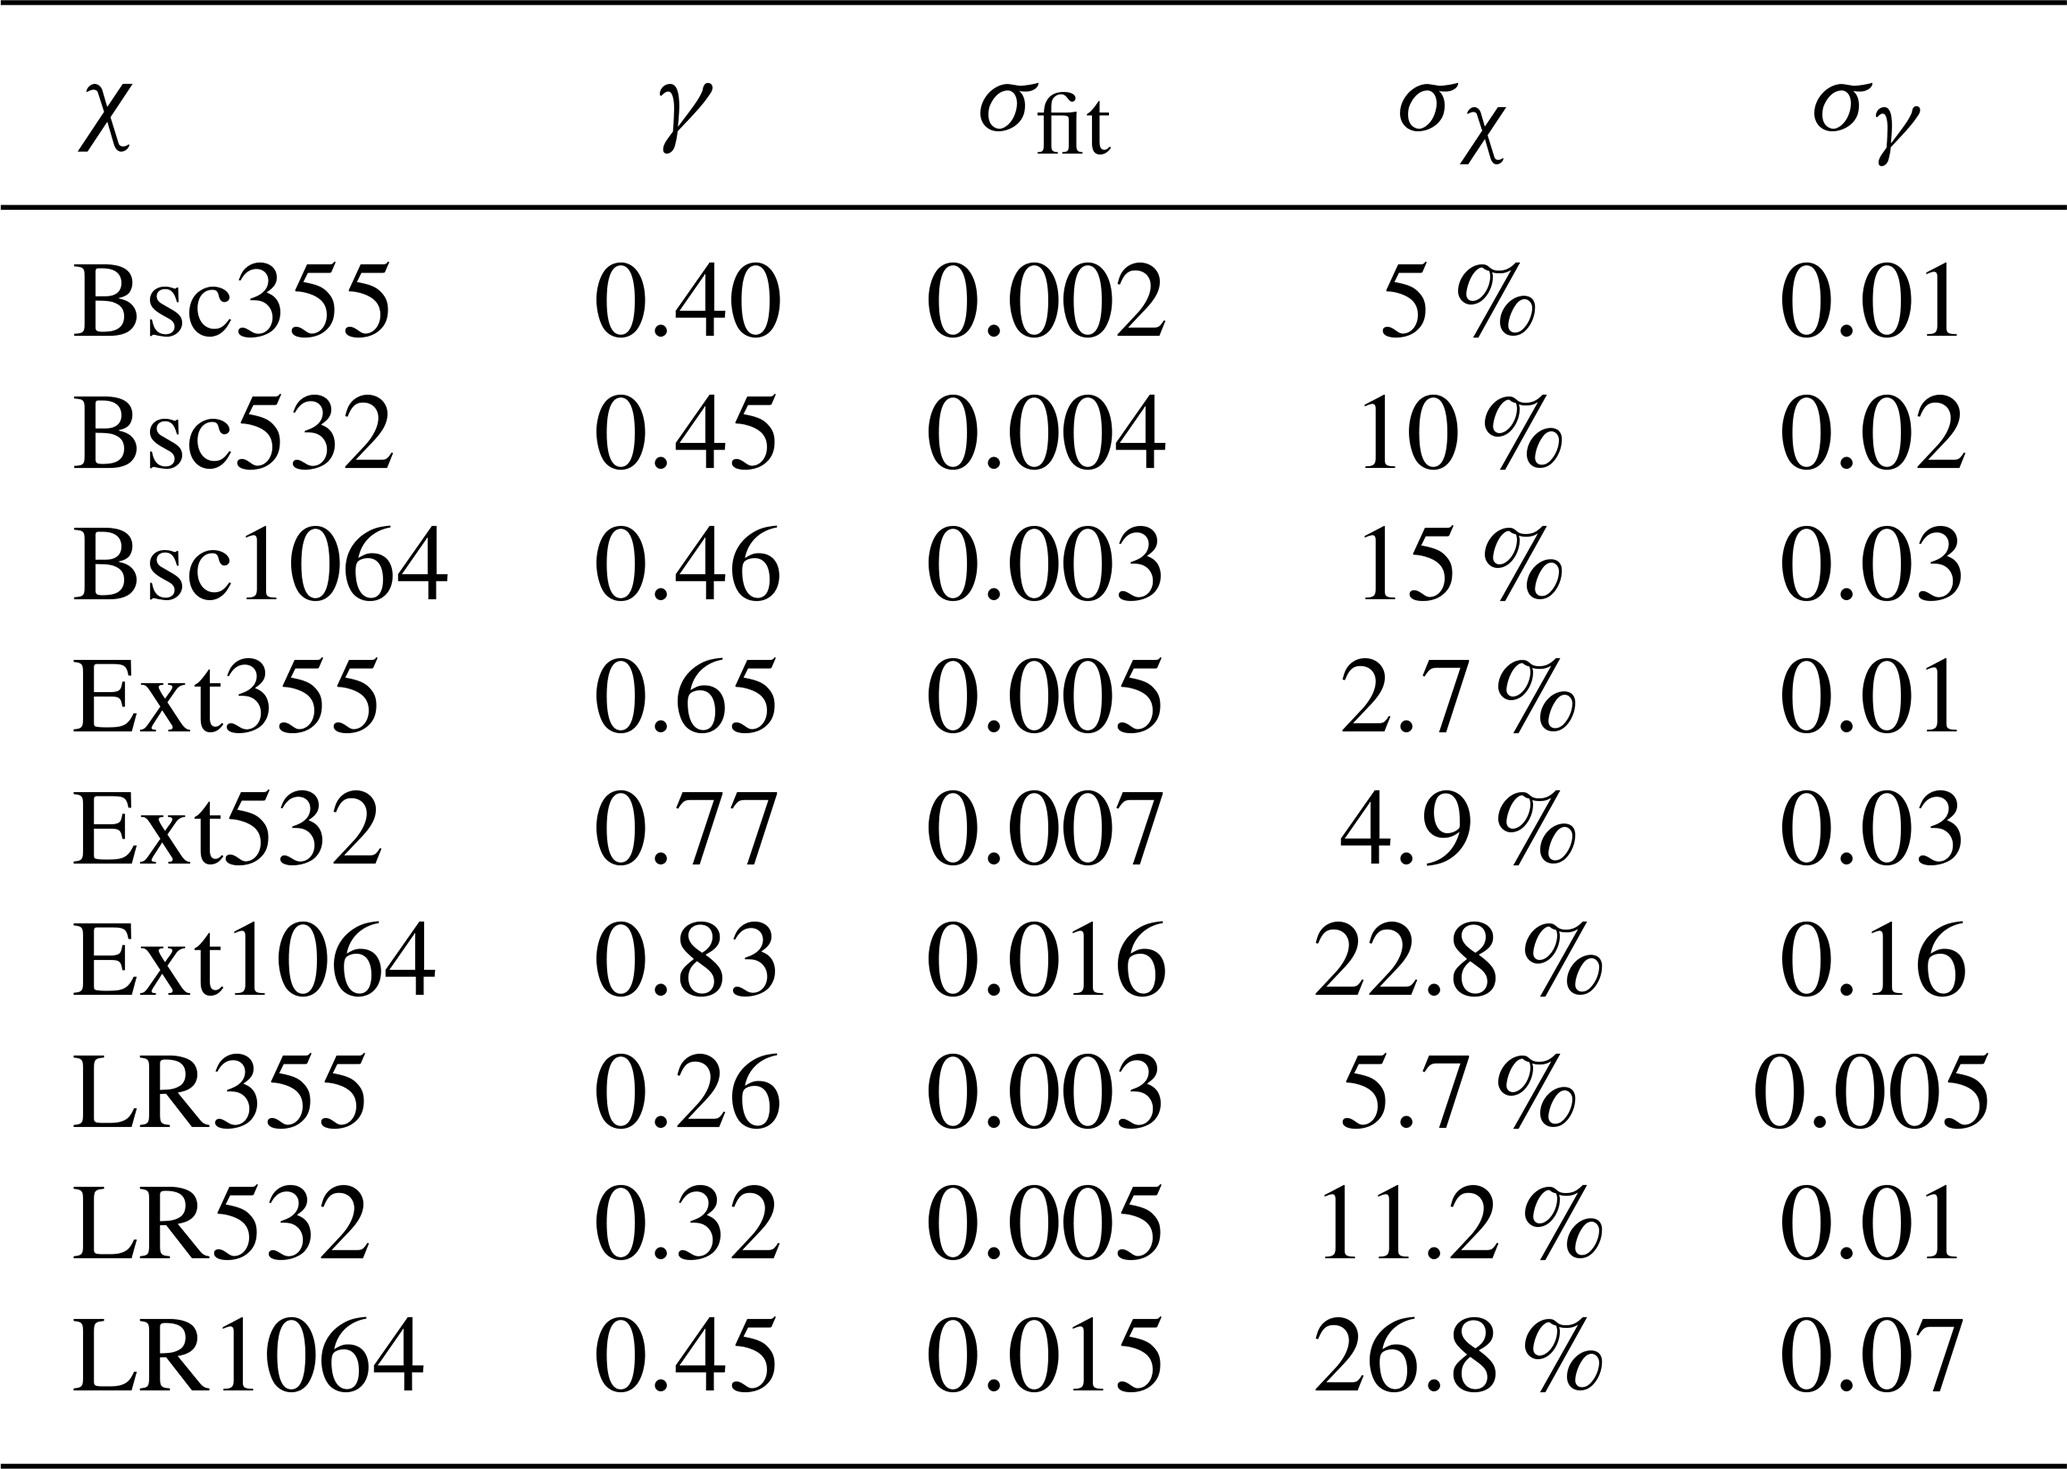
To estimate the uncertainty of γ we consider the error of the fit and the uncertainty of the quantity itself (Table 2). The uncertainty of the backscatter coefficient is assumed to be 5 %, 10 %, and 15 % at 355, 532, and 1064 nm, respectively, as outlined in the Appendix of Haarig et al. (2017a). The relative uncertainty of the extinction coefficient and the lidar ratio in the studied layer is given in Table 2. There, the overall absolute uncertainty of γ is calculated from the square root of the quadratic sum of both uncertainties. This uncertainty is provided with the plots in Fig. 6.
In the following, we compare our findings to previous observations.
3.3.1 Hygroscopic growth of the backscatter coefficient
Sicard et al. (2022) studied the hygroscopic growth of the backscatter coefficient on a statistical basis at 355, 532, and 1064 nm. Their measurements were performed in Barcelona, Spain, on the Mediterranean Sea, which is much more strongly influenced by highly hygroscopic sea salt particles than continental Leipzig. They observed backscatter hygroscopic growth parameters of 0.65 to 0.81. Therefore, these measurements are not comparable to our observations of continental aerosol at Leipzig (400 km away from the ocean). Our backscatter hygroscopic growth parameters and their spectral dependence are comparable to those measured by Bedoya-Velásquez et al. (2018) in the Sierra Nevada in southern Spain: γbsc (355 nm) = 0.40 ± 0.01 and γbsc(532 nm) = 0.48 ± 0.01. Although the site is also close to the ocean, the station is located at the northern slopes of the Sierra Nevada mountains, which limits the influence of marine air masses. Miri et al. (2024) used the fluorescence backscatter coefficient to normalize the backscatter coefficient in order to ensure that the aerosol load does not change during the measurements. In the case of urban pollution over Lille, northern France, they report a γbsc(532 nm) of 0.47 ± 0.03, which aligns well with our value of 0.45 ± 0.02. Navas-Guzmán et al. (2019) studied a smoke mixture in Switzerland and found similar values at 355 nm (γbsc = 0.48 ± 0.08) but then a spectral decrease towards the wavelength of 1064 nm (γbsc = 0.29 ± 0.08). Pérez-Ramírez et al. (2021) studied mixtures of sulfate and organics at the east coast of North America and found a spectral decrease in the γbsc parameter but with values in the same range (0.31 till 0.46) and one value at 355 nm which reached up to 0.65 ± 0.10. It can be concluded that there is a slight wavelength dependence on the γbsc parameter for continental aerosol. However, this dependence sensitively depends on the composition of the aerosol mixture, which is not well defined in the case of continental aerosol.
3.3.2 Hygroscopic growth of the extinction coefficient
The hygroscopic growth of the extinction coefficient was mostly studied with in situ instrumentation on the ground (for details see Zieger et al., 2013; Titos et al., 2016, 2021). Measurements with a spectral aerosol extinction monitoring system (Skupin et al., 2016) at ground level found γext(550 nm) = 0.46 ± 0.30 for 4 years of measurements at Leipzig, so our observations of γext(532 nm) = 0.77 ± 0.03 would be on the upper edge of the long-term observations and represent a strong hygroscopic case. As mentioned above, a slight marine influence in the observed air masses cannot be completely excluded. Jefferson et al. (2017) found in a 7-year study over the Southern Great Plains in North America values of γext(550 nm) = 0.44 ± 0.16 for sub-1 µm particles and 0.40 ± 0.15 for sub-10 µm particles.
3.3.3 Hygroscopic growth of the lidar ratio
Previous studies of the lidar ratio enhancement used airborne particle properties to calculate the lidar ratio enhancement. Ackermann (1998) modeled the lidar ratio enhancement for continental aerosol and found that the lidar ratios vary between 40 and 80 sr. However, his modeled spectral behavior is not consistent with our observations. Ferrare et al. (1998) comprehensively studied the hygroscopic growth of the backscatter and extinction coefficient by using ground-based Raman lidar measurements at the Southern Great Plains (central USA, continental aerosol) with collocated airborne in situ observations. They derived the hygroscopic growth parameter γr from the in situ measurements to describe the changes in particle radius r. A γr of 0.3 ± 0.05 was in good agreement with Raman lidar observations. In these observations, they found a strong increase in the extinction coefficient at 351 nm with RH and a weaker increase in the lidar ratio (fLR=1.26 from 60 % to 90 %–95 % RH). For the same RH range the lidar ratio enhancement factor in our observations was 1.34 at 355 nm and 1.43 (at 90 % RH) according to the fitted parameterization. The study of Zhao et al. (2017) was motivated by the investigation of the influence of the lidar ratio with RH on the retrieval of elastic lidars where a lidar ratio has to be assumed. However, they used a different parameterization of the hygroscopic growth that makes it difficult to compare to our results. The hygroscopic growth of the lidar ratio was studied by Düsing et al. (2021) for the rural site of Melpitz, Germany. They used in situ measurements from an airborne platform as input into Mie calculations to derive the lidar ratio hygroscopic growth parameters. The strongest enhancement was found at 532 nm (γLR = 0.48 ± 0.01) and lower values at 355 (γLR = 0.29 ± 0.01) and 1064 nm (γLR = 0.31 ± 0.01). In contrast to their modeling results, we observe from Raman lidar observations an increase in the γLR with wavelength. Only the value at 355 nm (γLR = 0.26 ± 0.005) is comparable to their study. However, in general the agreement of the modeled values at 532 and 1064 nm with the lidar observations was poor so that closure could not be reached by Düsing et al. (2021).
With our study, we could show with direct measurements that the lidar ratio of continental aerosol depends on RH and we could derive hygroscopic growth factors for each wavelength for the backscatter coefficient, extinction coefficient, and lidar ratio.
In this section, we discuss the spectral dependence of the lidar ratio based on the observations at 355, 532, and 1064 nm. An extensive literature study to constrain the lidar ratio at 1064 nm from auxiliary observations and calculations was presented by Kim et al. (2018) for the CALIPSO v4 automated aerosol classification and lidar ratio selection algorithm. They estimated the lidar ratio at 1064 nm in order to analyze the CALIPSO observations at this wavelength. The CALIPSO v4 lidar ratios at 532 nm were examined by Li et al. (2022) with the SODA (Synergized Optical Depth of Aerosols) technique (Josset et al., 2011; Painemal et al., 2019). From ground-based lidars, Floutsi et al. (2023) provided a comprehensive study about the lidar ratios at 355 and 532 nm in the collection of depolarization ratios, lidar ratios, and Ångström exponents (so-called DeLiAn). Hence, the special focus of the present study is on the spectral slope from 532 to 1064 nm. We subdivide our findings according to the spectral behavior of the lidar ratio from 532 to 1064 nm in spectrally neutral (Sect. 4.1), decreasing (Sect. 4.2), and increasing behavior (Sect. 4.3). Then, we want to shed light on the connection of the extinction and backscatter-related Ångström exponent to the Ångström exponent of the lidar ratio (Sect. 4.4).
Figure 7 summarizes the spectral behavior of the lidar ratio observed with Raman lidars for five aerosol types and ice clouds and compares the results to the CALIPSO v4 algorithm. Table 3 lists the references and their abbreviations used in the following, and Tables 4 and 5 provide the exact values for the results presented in Fig. 7.
Floutsi et al. (2023)Gebauer et al. (2024)Haarig et al. (2016)Haarig et al. (2018)Haarig et al. (2022)Hofer et al. (2020)Kim et al. (2018)Mamouri and Ansmann (2017)Mattis et al. (2004)Ohneiser et al. (2020)Omar et al. (2010)Tesche et al. (2009)Table 3References and their abbreviations used in the following tables and figures.
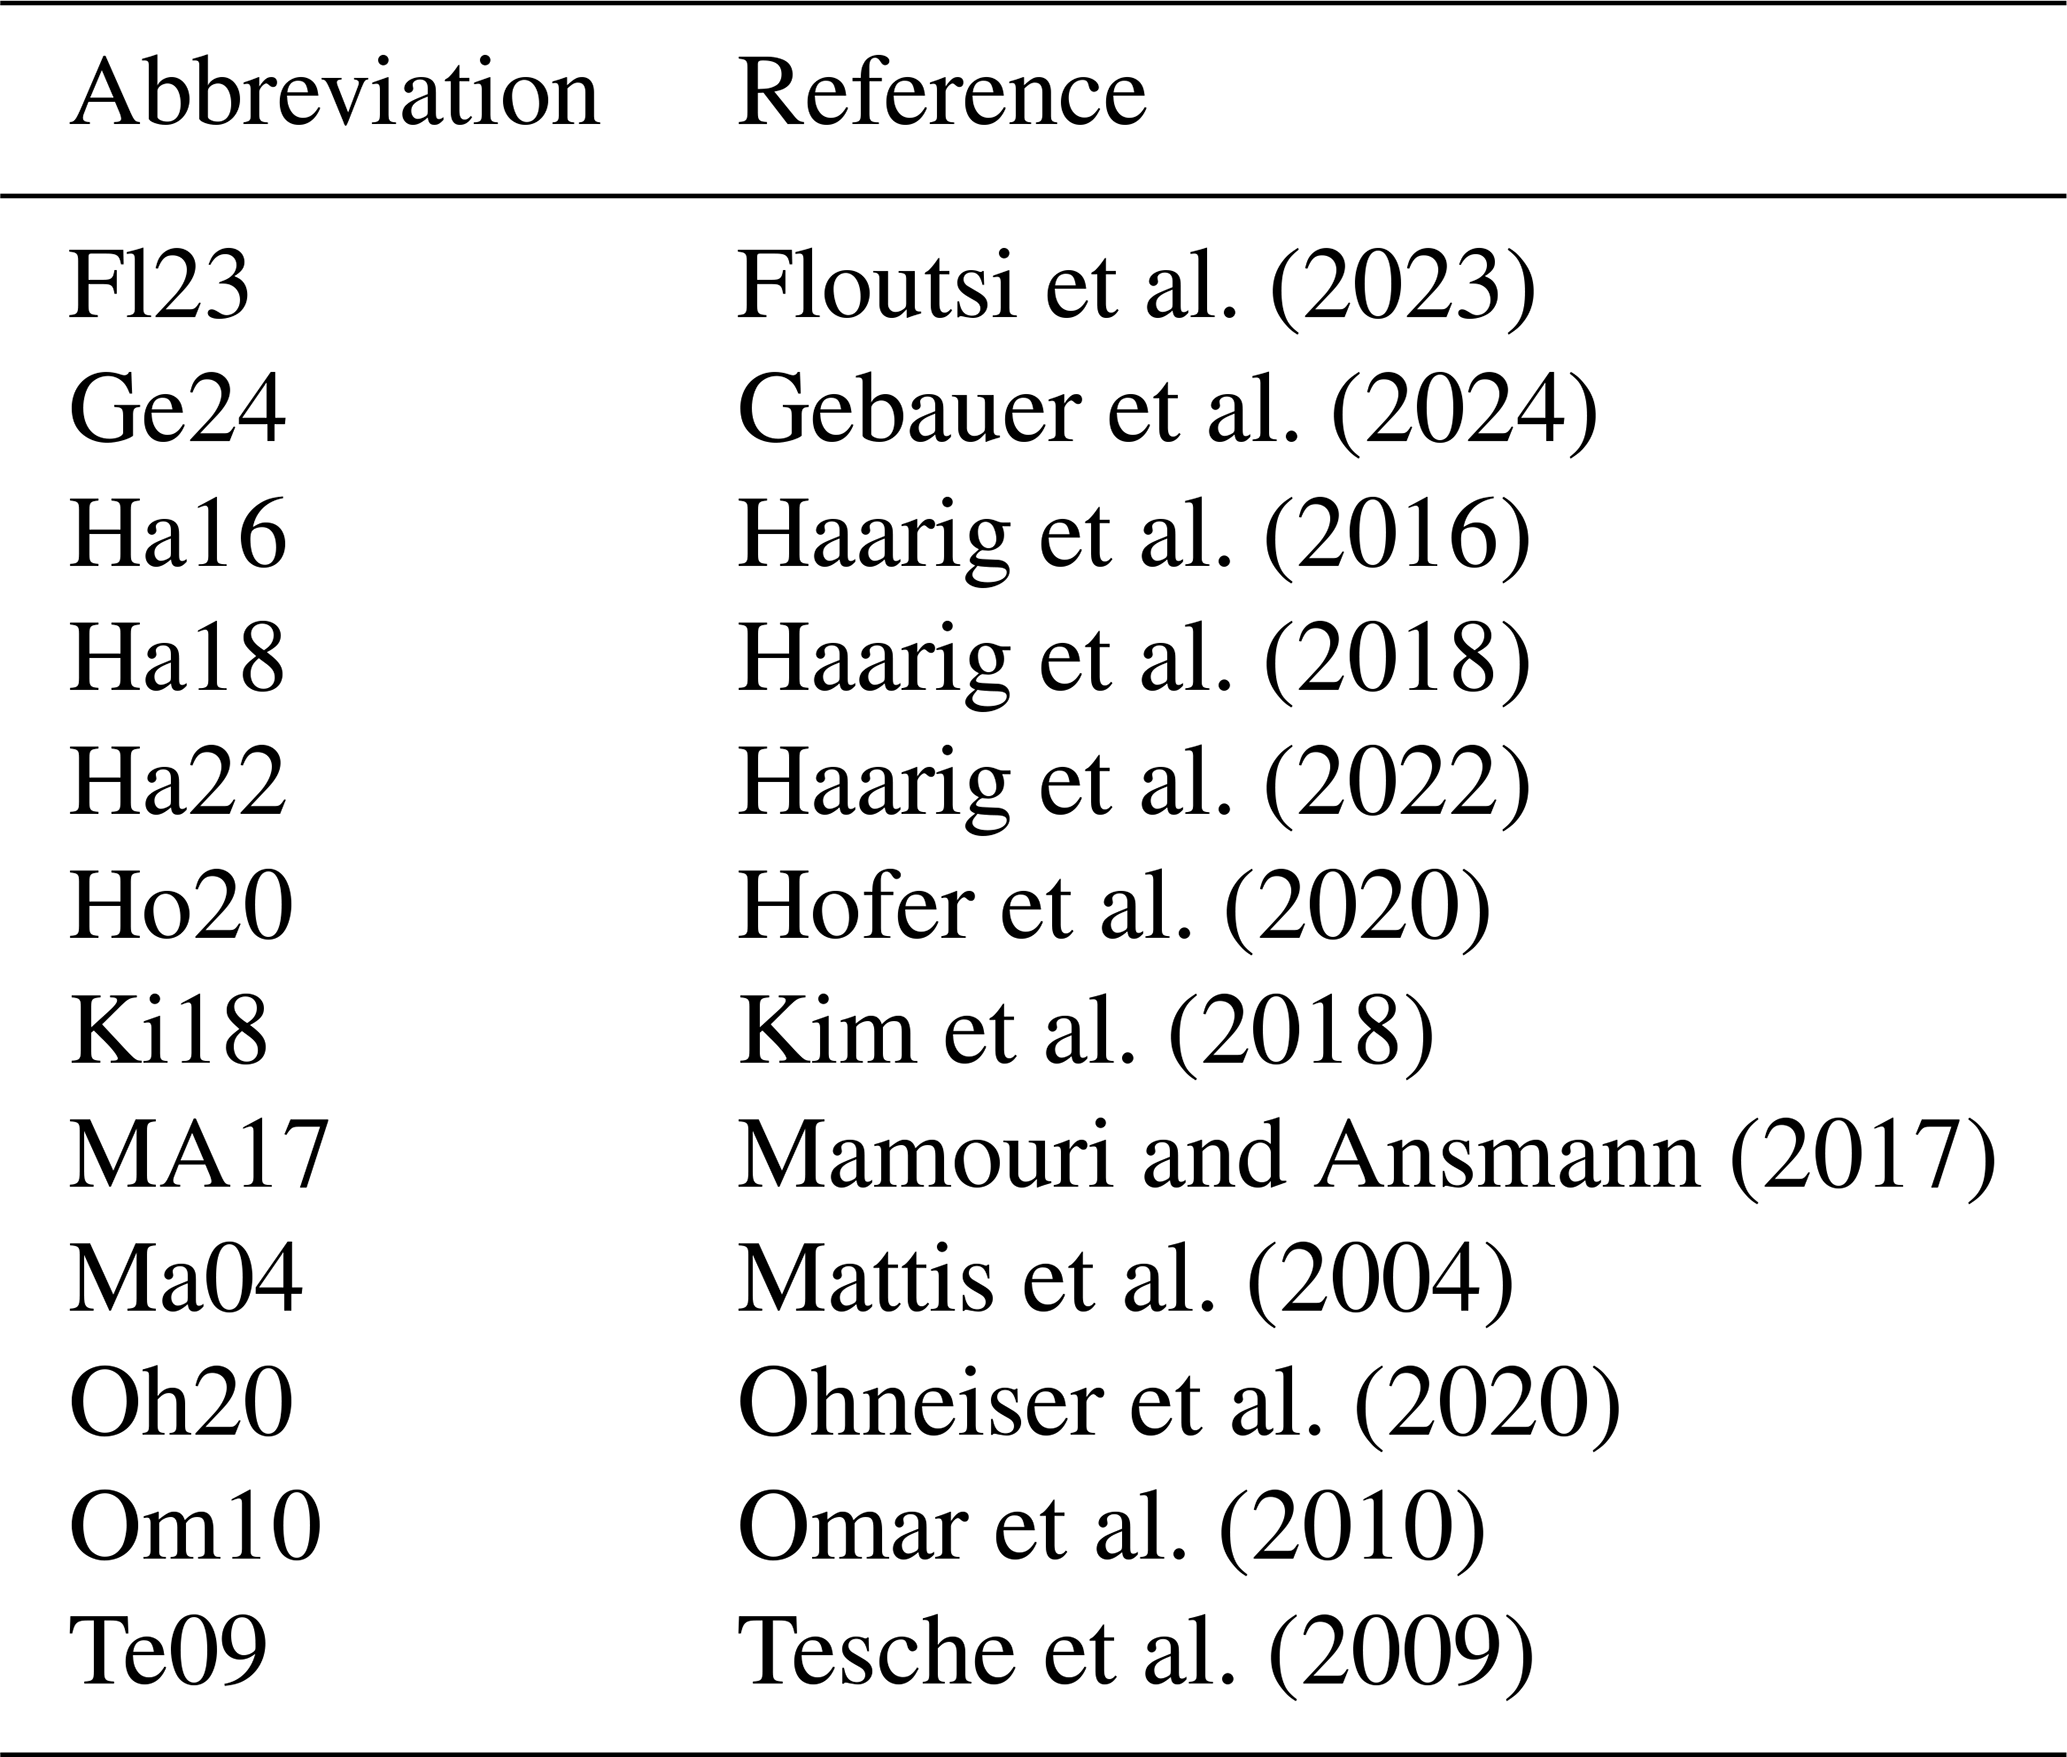
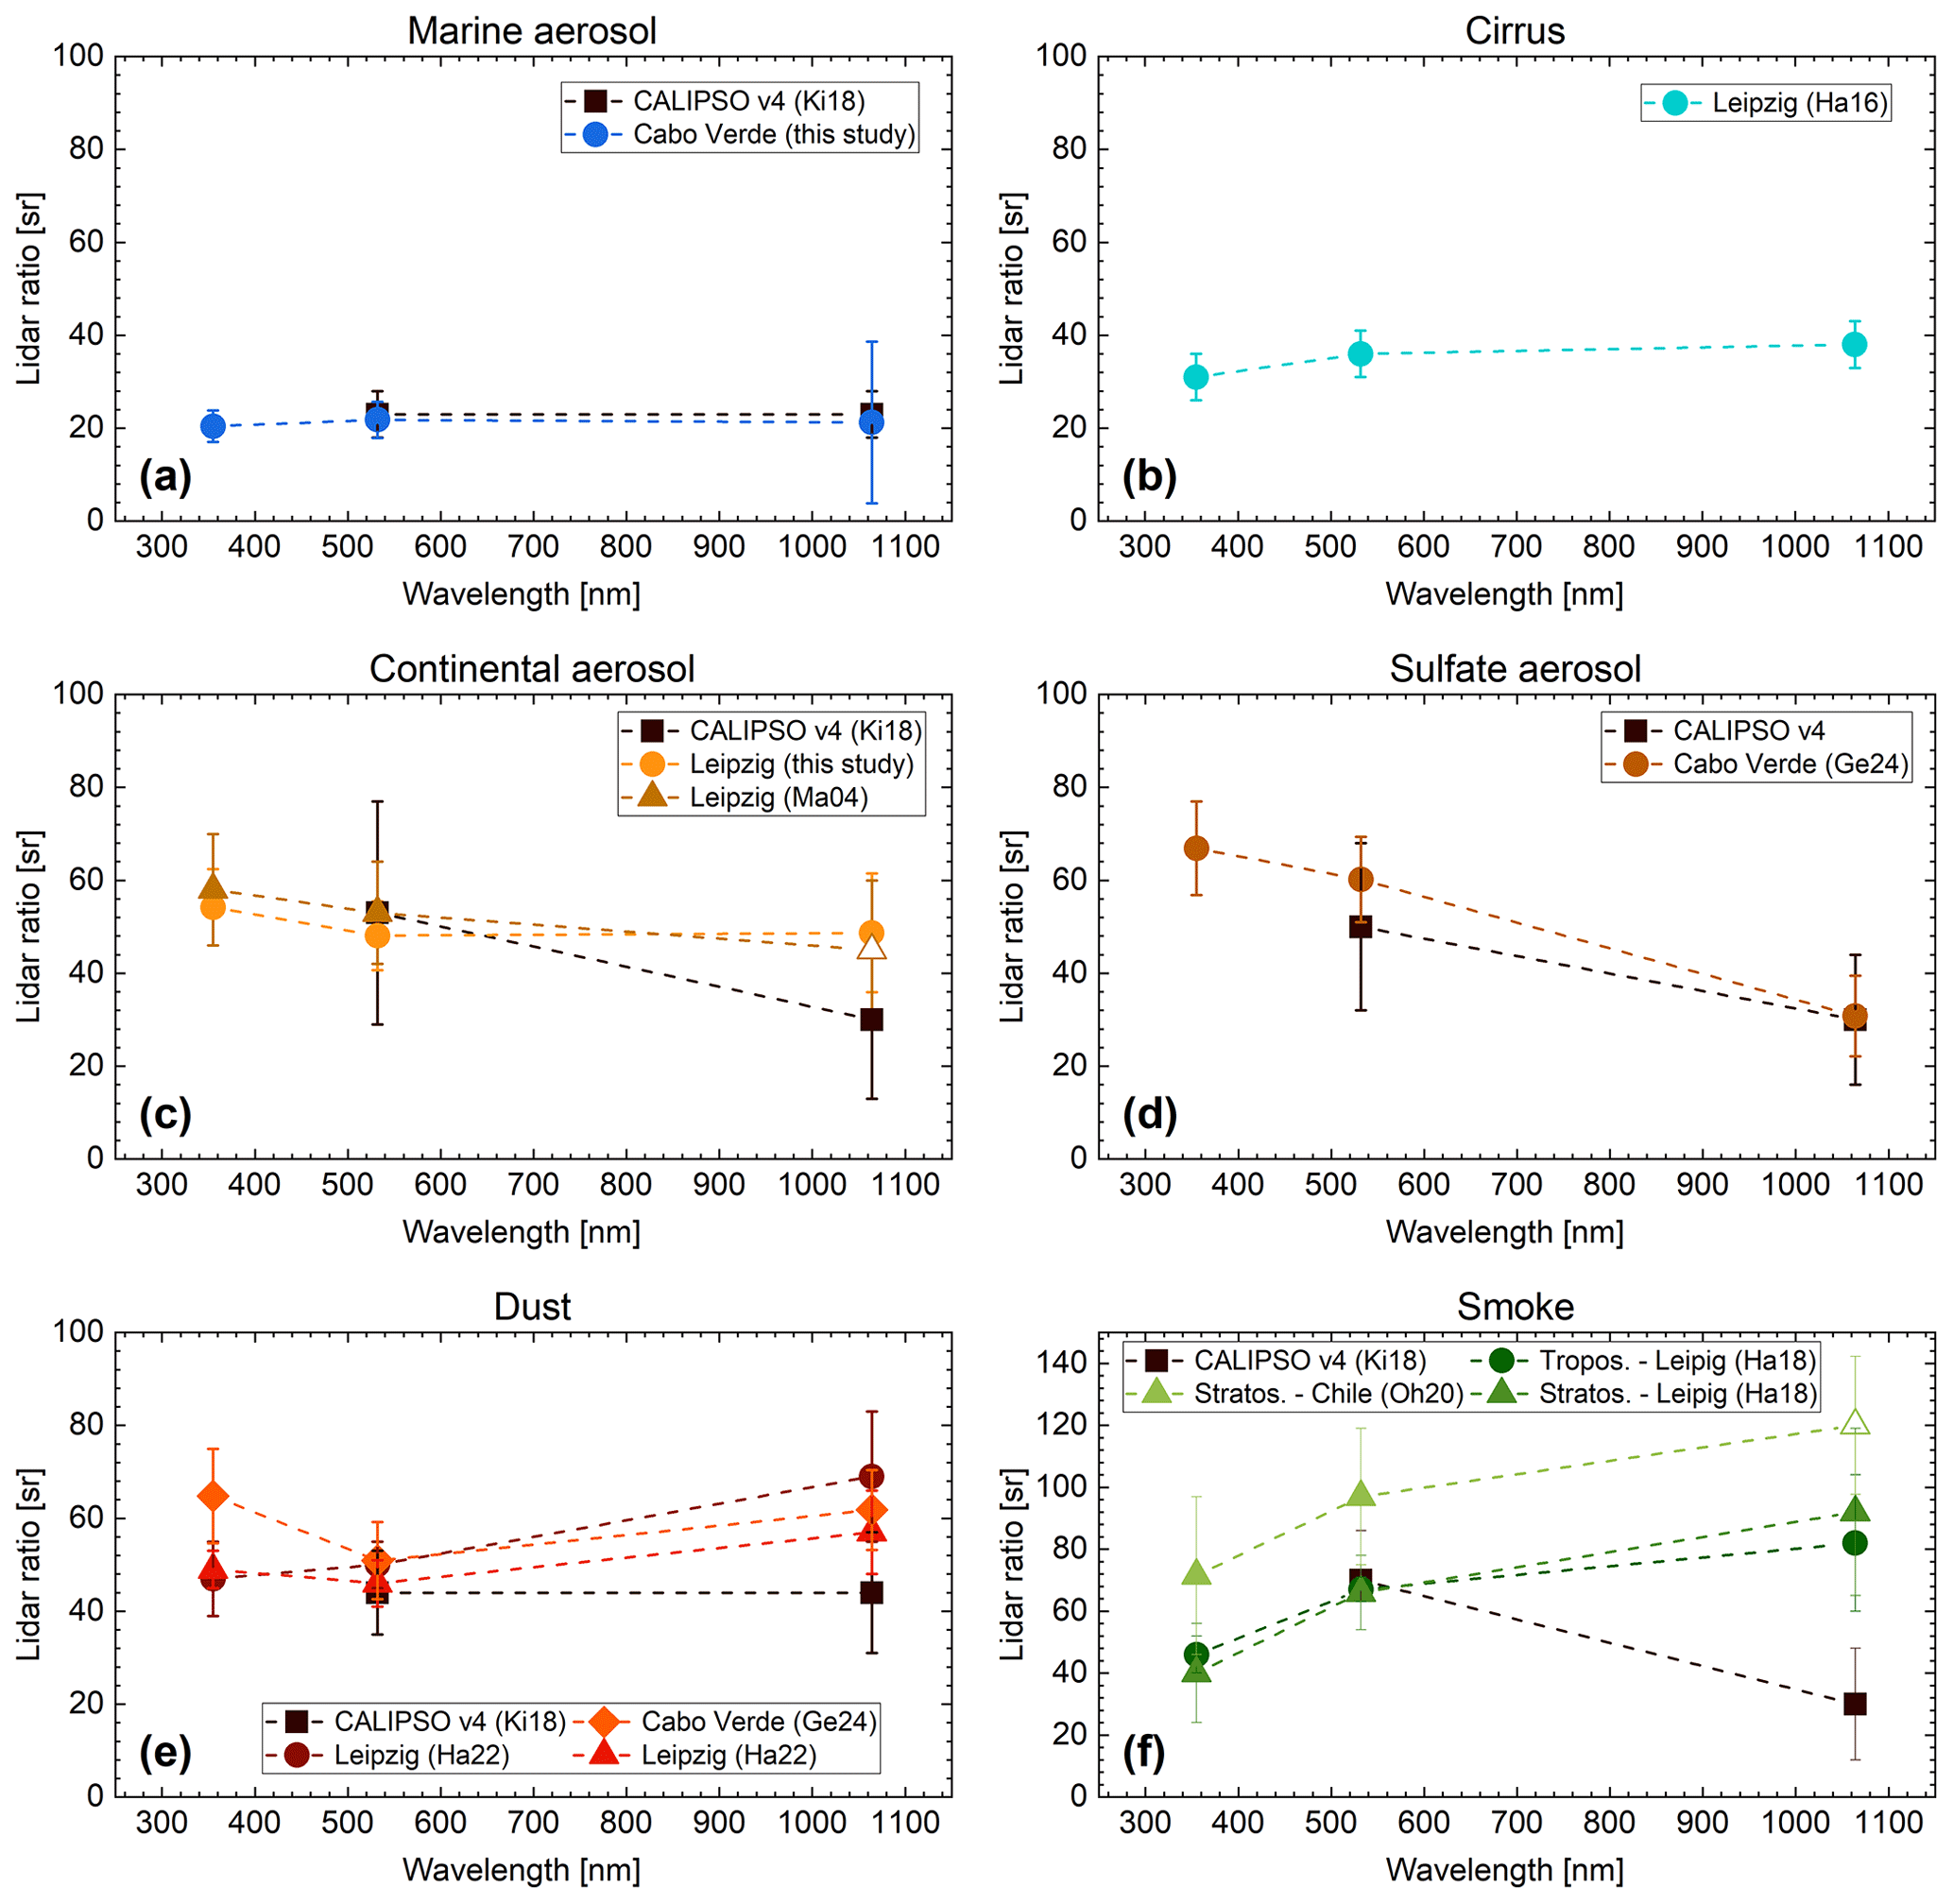
Figure 7Spectral slope of the lidar ratio for (a) marine aerosol, (b) cirrus clouds, (c) continental aerosol, (d) sulfate aerosol, (e) mineral dust, and (f) smoke (in the troposphere and stratosphere). The Raman lidar observations shown in filled colored symbols are compared to the assumptions made in the CALIPSO v4 aerosol typing and lidar ratio selection algorithm (black squares). Open symbols refer to a combination of lidar and photometer observations. The references are listed in Table 3 and the values are provided for convenience in Table 4 and separately for mineral dust in Table 5.
Table 4The spectral lidar ratio and the ratio of lidar ratios discussed in this study and compared to CALIPSO v4 (values at 532 and 1064 nm; Kim et al., 2018) and DeLiAn (values at 355 and 532 nm; Floutsi et al., 2023). The abbreviations for the references are given in Table 3.
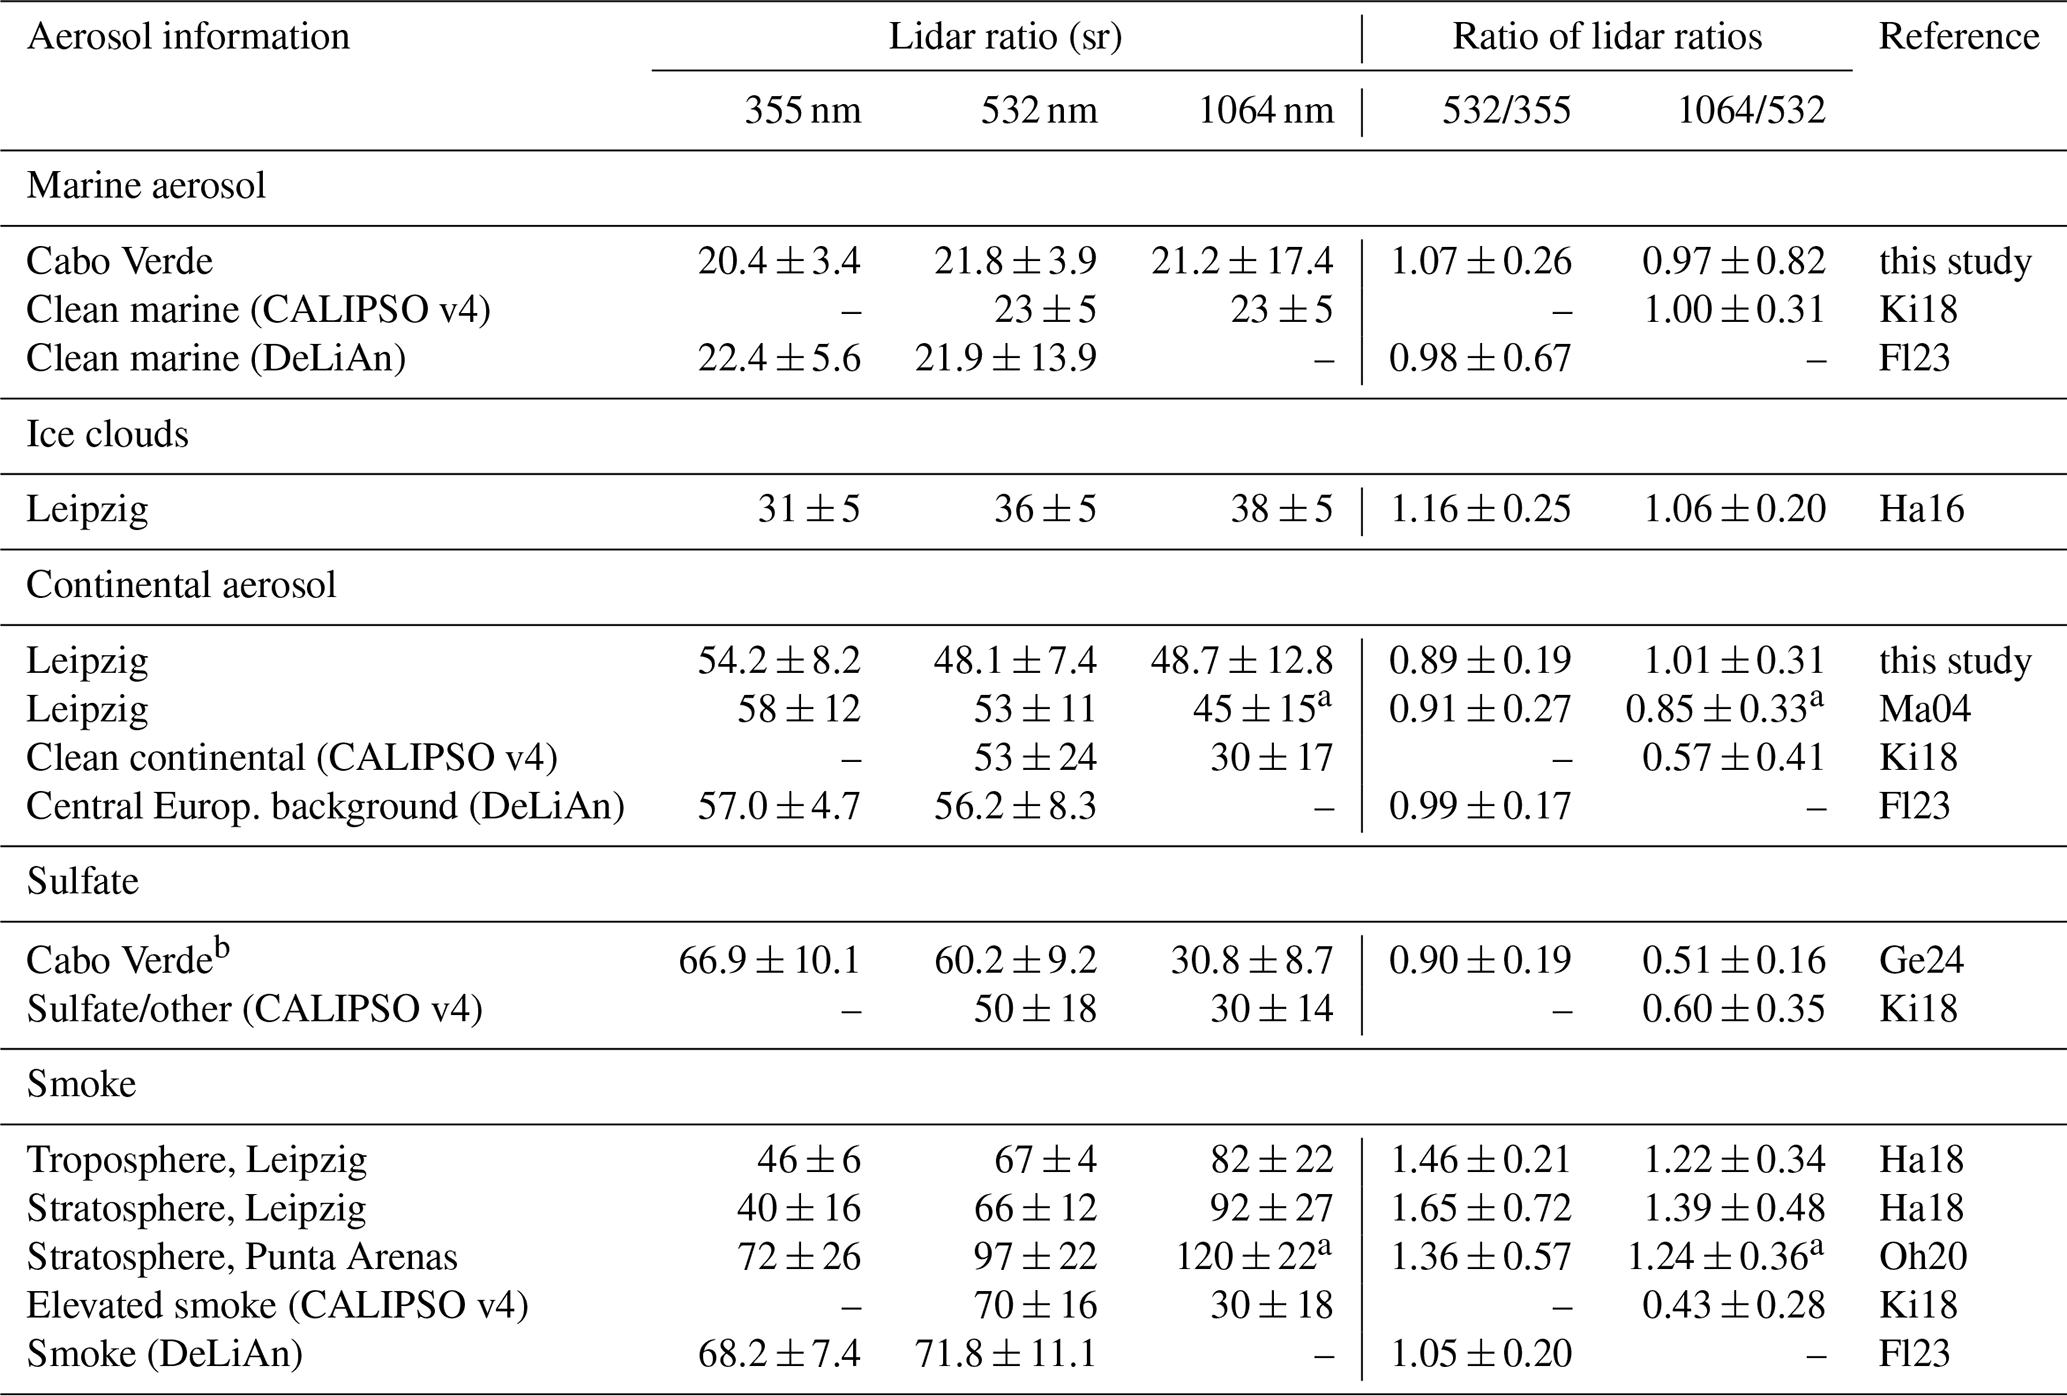
a Estimated using lidar and photometer. b Mixed with marine aerosol.
4.1 Spectrally neutral behavior of the lidar ratio
For three case studies, a spectrally neutral behavior of the lidar ratio from 532 to 1064 nm is shown in Fig. 7a–c. The values are provided in Table 4.
4.1.1 Marine aerosol
The spectrally neutral behavior of the lidar ratio from 355 to 532 nm was already observed as collected by Floutsi et al. (2023). According to our observations at Cabo Verde (Sect. 3.1), the lidar ratio at 1064 nm does not increase compared to the lidar ratio at 532 nm (Fig. 7a). This finding contradicts previous modeling results (e.g., Ackermann, 1998; Haarig et al., 2017b; Kahnert and Kanngießer, 2024), but it confirms the assumptions introduced for CALIPSO v4 (Kim et al., 2018). The lidar ratio at 1064 nm decreased from 45 ± 23 sr (CALIPSO v3) to 23 ± 5 sr (CALIPSO v4) and is now the same value as for 532 nm. This reduction was based on the SODA technique applied to marine aerosol lidar ratios at 1064 nm (Josset et al., 2012). Also, the marine aerosol network observations presented by Sayer et al. (2012) and AERONET observations at marine sites (Cattrall et al., 2005) indicated a spectrally neutral behavior of the marine lidar ratio, which could now be confirmed by Raman lidar observations for marine aerosol under humid conditions.
4.1.2 Cirrus clouds
The large ice crystals of cirrus clouds with sizes typically >100 µm introduce a spectrally neutral behavior in the wavelength range of 355 to 1064 nm, both in the backscatter coefficient and the extinction coefficient and therefore in the lidar ratio as well (Fig. 7b, Sect. 4.4). Voudouri et al. (2020) studied the lidar ratios of cirrus clouds at three different locations and found no spectral dependence in the wavelength range from 355 to 532 nm. Haarig et al. (2016) presented the first measurements of the lidar ratio at 1064 nm in a cirrus cloud (at Leipzig, Germany) and found no spectral dependence up to 1064 nm. The backscatter color ratio between 1064 and 532 nm was intensively studied by Vaughan et al. (2010), who used a large data set of cirrus observations from airborne lidar measurements. They found a color ratio of 1.01 ± 0.25. Under the assumption that the extinction coefficient does not change in the given wavelength range (because the ice crystals are much larger than the wavelengths), the lidar ratio also should not change. However, the study of Vaughan et al. (2010) pointed out that the natural variability (25 %) of the backscatter color ratio is higher than expected and thus in some cases a spectral dependence is possible.
4.1.3 Continental aerosol
Continental aerosol is a mixture of anthropogenic pollution, biological particles, and soil dust and may vary with location and season. Therefore, its optical properties can vary considerably for different mixtures of light-absorbing and scattering aerosol fractions.
Mattis et al. (2004) studied the aerosol properties in the PBL above Leipzig, Germany, in the years 2000 to 2003. The authors found mean lidar ratios of 58 ± 12 sr at 355 nm and 53 ± 11 sr at 532 nm. Furthermore, they used a combination of sun photometer AOD and lidar column-integrated backscatter coefficient to estimate the lidar ratio at 1064 nm, which was found to be 45 ± 15 sr. These values are in line with the measurements of continental aerosol presented in our study (Sect. 3.2).
The presented case study of continental aerosol shows a spectrally neutral behavior of the lidar ratio. The lidar ratio values for RH < 80 % are provided in Table 4. The lidar ratio increases with increasing RH. However, the spectrally neutral behavior remains even under increasing relative humidity as discussed in Sect. 3.2 and 3.3. In contrast, CALIPSO v4 assumes a lower lidar ratio at 1064 nm (30 ± 17 sr) compared to 532 nm (53 ± 24 sr). However, considering the large variety of continental aerosol particles, we refrain from advising a change in the CALIPSO lidar ratio selection algorithm. The case presented here was characterized by enhanced RH (70 %–80 %), and following the discussion of the hygroscopic growth of the lidar ratio (Sect. 3.3), dry continental aerosol might have lower lidar ratios. The hygroscopic growth of the lidar ratio at 1064 nm (hygroscopic growth parameter γLR = 0.45 ± 0.07) was stronger compared to 355 nm (γLR = 0.26 ± 0.005). An extrapolation of the hygroscopic growth curve using Eqs. (1) and (2) to a dry RH of 40 % would lead to a lidar ratio of 30 sr at 1064 nm, 39 sr at 532 nm, and 43 sr at 355 nm. This extrapolation is linked to a high uncertainty and therefore it is shown here just to describe the trend that can be expected for dry continental aerosol. Furthermore, it highlights the importance of considering the relative humidity in the lidar ratio selection in the case of continental aerosol as discussed by Zhao et al. (2017).
4.2 Decreasing lidar ratio from 532 to 1064 nm
For sulfate-dominated aerosol discussed in Gebauer et al. (2024), a decrease in the lidar ratio towards 1064 nm was observed, as shown in Fig. 7d. The values are provided in Table 4.
Sulfate aerosol
Gebauer et al. (2024) observed the volcanic sulfate plume from the Cumbre Vieja eruption on La Palma (Canary Islands, Spain) in early autumn of 2021. The Raman lidar measurements were performed at Mindelo, Cabo Verde, with the same PollyXT as used for the observations of marine aerosol in Sect. 3.1. Here, the case study in Fig. 7d presents a mixture of sulfate and marine aerosol because the sulfate aerosol arrived in the marine aerosol layer at the Cabo Verde islands. However, this mixture was strongly dominated by sulfate aerosol with >80 % contribution to the AOD at 532 nm in the layer (Gebauer et al., 2024). The lidar ratio of the mixture decreased from 60.2 ± 9.2 sr at 532 nm to 30.8 ± 8.7 sr at 1064 nm. The lidar ratios are measured in the troposphere, whereas the assumptions for the aerosol type “sulfate/other” in the CALIPSO v4 lidar ratio selection algorithm (50 ± 18 sr at 532 nm and 30 ± 18 sr at 1064 nm) are considered for the stratosphere (Kim et al., 2018). Nevertheless, the ground-based measurements confirm the assumptions about the lidar ratios of sulfate aerosol.
4.3 Increasing lidar ratio from 532 to 1064 nm
The observations in dust and smoke layers point to an increase in the lidar ratio at 1064 nm compared to the values at 532 nm, as shown in Fig. 7e, f. The values for smoke are provided in Table 4 and for dust in Table 5.
Table 5The spectral lidar ratio and the ratio of lidar ratios for mineral dust compared to CALIPSO v4 (values at 532 and 1064 nm; Kim et al., 2018) and DeLiAn (values at 355 and 532 nm; Floutsi et al., 2023). The abbreviations for the references are given in Table 3.
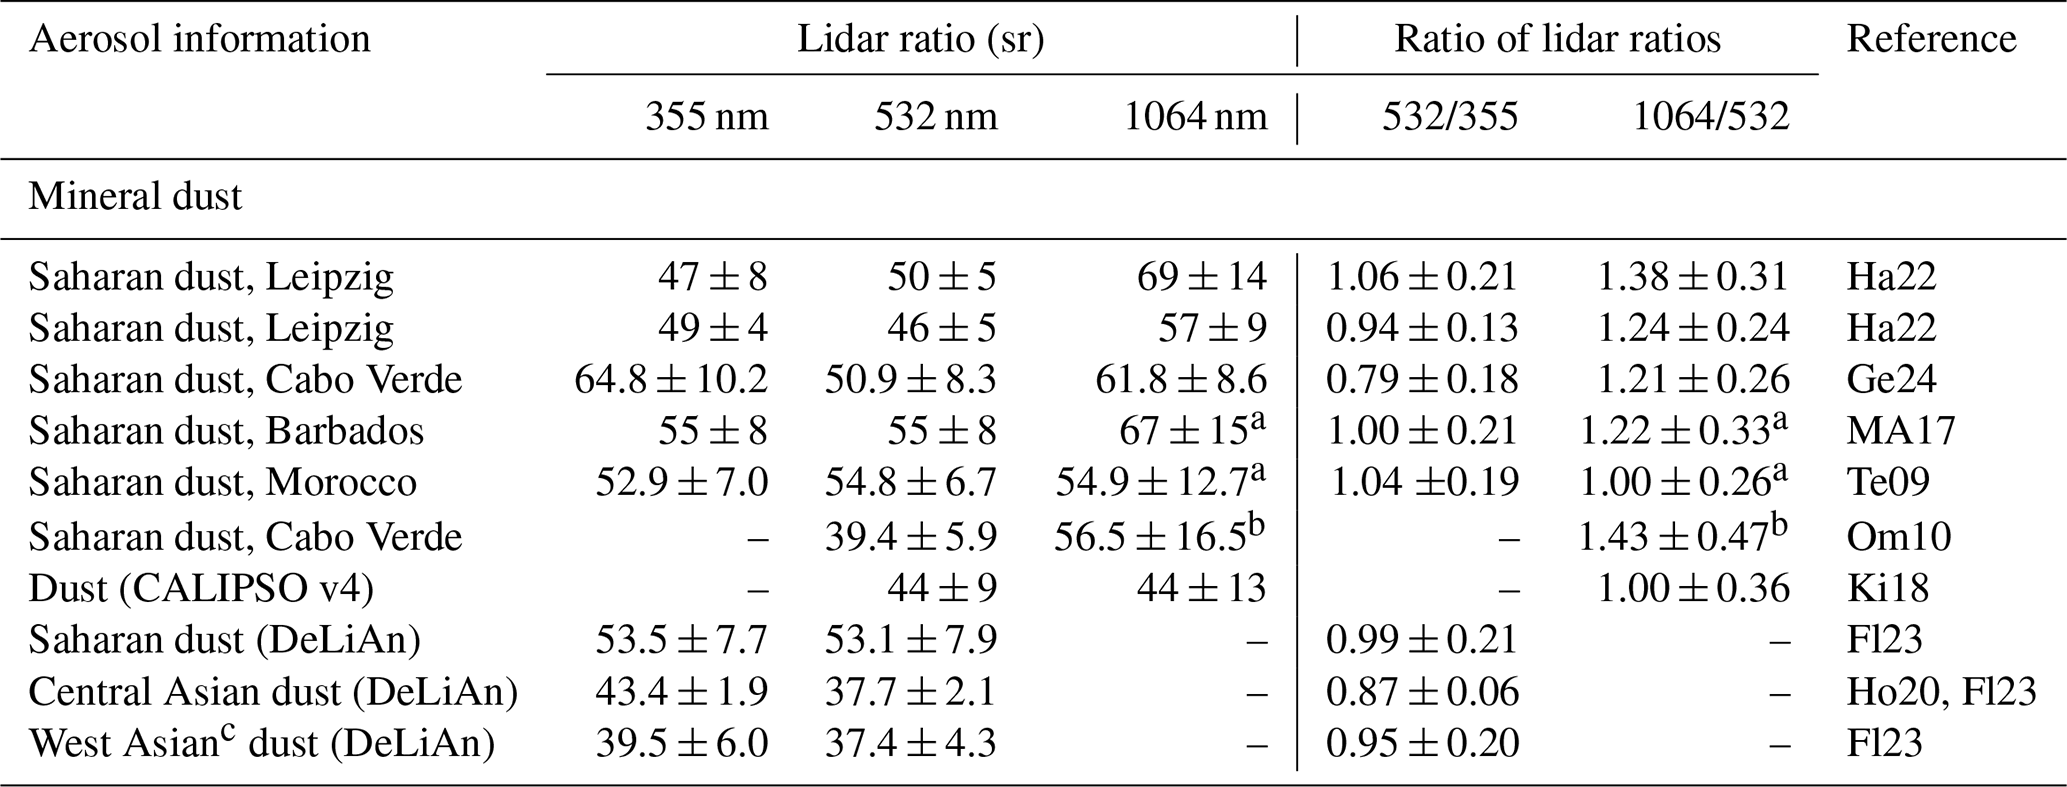
a Estimated using lidar and photometer. b Estimated using lidar and airborne in situ observations. c Also sometimes referred to as the Middle East. However, the “Middle East” is rather a political term, whereas “West Asia” is a geographical term.
4.3.1 Mineral dust
The Raman lidar measurements point to an increase in the dust lidar ratio towards the wavelength of 1064 nm in plumes of Saharan dust (Fig. 7e). Haarig et al. (2022) observed two cases of Saharan dust at Leipzig, Germany, in February and March 2021. Gebauer et al. (2024) reported a case of Saharan dust at Mindelo, Cabo Verde, measured in September 2021 (Fig. 7e and Table 5). Previous studies based on a combination of the lidar backscatter coefficient at 1064 nm and the sun photometer AOD at 1020 nm point to an increase in the lidar ratio as well (Mamouri and Ansmann, 2017): long-range-transported Saharan dust at Barbados showed a lidar ratio of 67 ± 15 sr at 1064 nm compared to 55 ± 8 sr at 532 nm. However, the combination of lidar and sun photometer used in Tesche et al. (2009) resulted in a spectrally neutral behavior of the dust lidar ratio. An early CALIPSO study (data version 2) by Liu et al. (2008) pointed to an increase in the lidar ratio from 532 to 1064 nm for Saharan dust over the Atlantic Ocean. Furthermore, Omar et al. (2010) used airborne in situ observations at Cabo Verde to constrain the CALIPSO extinction profile and provided dust lidar ratios of 39.4 ± 5.9 sr at 532 nm and 56.5 ± 16.5 sr at 1064 nm. These findings are reflected in the previous CALIPSO lidar ratios (v3 and before) of 40 ± 20 sr and 55 ± 17 sr at 532 and 1064 nm, respectively (Omar et al., 2009). In contrast, in version 4 a spectrally neutral lidar ratio of 44 ± 9 and 44 ± 13 sr is assumed at 532 and 1064 nm, respectively.
The AERONET database (Holben et al., 1998) also includes lidar ratios for the wavelengths from 440 to 1020 nm. Müller et al. (2010) calculated lidar ratios for Saharan dust from AERONET observations, which showed a slight increase towards larger wavelengths. However, the lidar ratios at 440 nm were unrealistically high and not comparable to observations at 355 or 532 nm. The study of Schuster et al. (2012) uses the dust size distributions and refractive index estimates from several AERONET stations around the desert regions to calculate regional dust lidar ratios, which show a slight spectral decrease from 532 to 1064 nm. However, newer studies based on AERONET data (version 3) point to a sharp decrease in the dust lidar ratio from 440 to 675 nm and then to a slight increase towards 1020 nm (Shin et al., 2018). They studied AERONET-retrieved lidar ratios for several deserts and found the highest lidar ratios for the Sahara. A similar spectral slope but with a more pronounced increase in the lidar ratio towards the near-infrared was found by analyzing the AERONET measurements with the Generalized Retrieval of Aerosol and Surface Properties (GRASP; Torres et al., 2017; Dubovik et al., 2021) for six and seven wavelengths, which includes 1640 nm (Toledano et al., 2019; Haarig et al., 2022). However, all these results depend on the optical model to describe the irregular shape of mineral dust particles.
The modeling of dust lidar ratios (e.g., Gasteiger et al., 2011; Saito and Yang, 2021; Kong et al., 2022) is a challenging task because the lidar ratio depends on the size and shape distributions and the complex refractive index of the dust particles, which represents the mineralogical composition. Saito and Yang (2021) predicted a slight increase in the lidar ratio towards 1064 nm, especially for the small dust particles. Gasteiger et al. (2011) modeled for case studies during the Saharan Mineral Dust Experiment (SAMUM) a U-shaped spectral slope of the lidar ratio with a minimum at 532 and 710 nm and an increase towards 355 and 1064 nm.
The spectral slope of the lidar ratio of mineral dust contains information about its source regions. Because measurements at 1064 nm were not available yet, the discussion focuses on the spectral slope from 355 to 532 nm. Often, a spectrally neutral behavior was observed (Tesche et al., 2011; Groß et al., 2015), but sometimes the values in the UV were higher (Mattis et al., 2002; Bohlmann et al., 2018; Gebauer et al., 2024). Veselovskii et al. (2020) found both spectral behaviors in their observations at Dakar, Senegal. They could explain the two scenarios with differences in the imaginary part of the complex refractive index. In some source regions, the absorption, especially in the UV wavelength range, was found to be significantly higher compared to other regions (Di Biagio et al., 2019). Gómez Maqueo Anaya et al. (2024) tried to link these differences in the lidar ratio and the imaginary part of the refractive index to differences in the hematite content in the source region. However, the strongest correlation was found between the backscatter-related Ångström exponent and the hematite content.
Compared to the lidar observations of western Saharan dust presented in Fig. 7e, the CALIPSO v4 algorithm does not capture the increase in the lidar ratio from 532 to 1064 nm. A spectrally neutral behavior is assumed (44 sr), whereas the Raman lidar observations point to an increase in the lidar ratio by 21 %–38 %. The presented dust lidar ratios are solely for western Saharan dust. It is known that the lidar ratios at 355 and 532 nm are lower for Arabian dust (Filioglou et al., 2020), western and Central Asian dust (Hofer et al., 2020), and East Asian dust (Murayama et al., 2004). In Table 5, we present Central and West Asian dust lidar ratios collected in the DeLiAn database (Floutsi et al., 2023). A different mineralogical composition is the most plausible reason for differences in the observed lidar ratio (e.g., Schuster et al., 2012; Zhang et al., 2024; Gómez Maqueo Anaya et al., 2024). These differences might affect the values at 1064 nm and the respective spectral slope as well. There is a need for lidar ratio measurements at 1064 nm of dust from different source regions. The CALIPSO v4 lidar ratio selection algorithm (Kim et al., 2018) uses one lidar ratio for all dust cases and includes the natural variability in its uncertainties. Regional dust lidar ratios are under discussion for the CALIPSO v5 algorithm.
4.3.2 Smoke
The spectrally resolved lidar observations presented in Fig. 7f show a clear increase in the lidar ratio with wavelength. Haarig et al. (2018) observed smoke layers above central Europe that originated from wildfires in western Canada. The smoke layers were detected in both the troposphere and the stratosphere. The Raman lidar measurements revealed almost the same lidar ratios in the troposphere and stratosphere (Table 4) for this event and explored for the first time the lidar ratio at 1064 nm of smoke. It is challenging to derive 1064 nm extinction in such thin smoke layers. There are some uncertainties involved, but nevertheless, the direction of the spectral slope is clear. Further evidence was provided by Ohneiser et al. (2020), who combined the lidar backscatter coefficient and the AERONET AOD to estimate a lidar ratio at 1064 nm for Australian smoke observed in the stratosphere above Punta Arenas, Chile. They found a lidar ratio of 120 ± 22 sr at 1064 nm, which is quite high. Nevertheless, the ratio of lidar ratios (1064 to 532 nm) is similar to the values observed by Haarig et al. (2018) and provided in Table 4.
An overview of lidar ratio measurements in atmospheric smoke layers is presented in the literature (Haarig et al., 2018; Adam et al., 2020; Ansmann et al., 2021). There seem to be two regimes of the spectral lidar ratio (355-to-532 nm) in smoke layers. Studies of aged boreal (Siberian, Canadian) smoke point to a clear increase from values of 30–50 sr at 355 nm towards 50–70 sr at 532 nm (Murayama et al., 2004; Müller et al., 2005; Ortiz-Amezcua et al., 2017; Haarig et al., 2018; Hu et al., 2019). Higher lidar ratios but with the same spectral behavior were observed in the Arctic (Ohneiser et al., 2021). Other measurements for European, Amazonian, and fresh smoke report spectrally neutral lidar ratios (Veselovskii et al., 2015; Alados-Arboledas et al., 2011; Baars et al., 2012; Pereira et al., 2014). However, measurements of spectral decreasing lidar ratios are rare (Nicolae et al., 2013). The DeLiAn collection results in a spectrally neutral lidar ratio (Floutsi et al., 2023). Janicka et al. (2023) present a comprehensive analysis of multiyear smoke observations (2013–2022) with a PollyXT lidar at Warsaw, Poland. They showed observations at 355 and 532 nm and separated the smoke layers by source region. Smoke originated from western Europe (approximately 2 d of atmospheric transport) exhibited a spectrally neutral behavior with lidar ratios of 65 ± 17 sr, whereas smoke from eastern Europe (1–3 d of transport) showed a decrease with wavelength from 71 ± 14 sr at 355 nm to 59 ± 12 sr at 532 nm. Smoke that was advected over long distances from the Iberian Peninsula (5–7 d) or North America (4.5–8 d) exhibited the aforementioned spectral increase from 34 ± 10 sr and 37 ± 16 sr at 355 nm to 55 ± 14 and 58 ± 17 sr at 532 nm for Iberian and North American smoke, respectively. According to their observations, the lidar ratio at 532 nm varies less (55 to 65 sr) compared to the lidar ratio at 355 nm (34 to 71 sr).
The observations of Haarig et al. (2018) clearly belong to the category of increasing lidar ratios with wavelength, which seems to be a typical feature for long-range-transported smoke, no matter whether in the troposphere or in the stratosphere. The spectral slope of the lidar ratio used in CALIPSO v4 is based on a comprehensive study of smoke-affected AERONET observations (Sayer et al., 2014). These authors found a monotonic decrease in the lidar ratio with wavelength from 355 to 532 and 1064 nm for all stations (close to the source and in the transport regime) except the boreal near-source stations for which the values at 355 and 532 nm are almost the same and then the decrease occurred towards 1064 nm. The spheroid model used for the AERONET retrievals is known to have problems in calculating the spectral slope of the backscattering properties at 180°. It could not reproduce the spectral increase from 355 to 532 nm, which was commonly found with lidar measurements for long-range-transported smoke. Therefore, the persistent spectral decrease towards the wavelength of 1064 nm found for all AERONET sites seems questionable now that direct measurements at this wavelength are available.
It is difficult to draw firm conclusions for a future CALIPSO lidar ratio selection algorithm because atmospheric smoke layers show a different spectral behavior of the lidar ratio in the wavelength range of 355 to 532 nm, and it can be assumed that the spectral slope towards 1064 nm is affected as well. The presented observations of lidar ratios at 1064 nm cover only the category of long-range-transported, aged smoke from extratropical source regions. However, the CALIPSO lidar ratio selection algorithm needs to use global lidar ratios per aerosol type to cover, for example, the smoke plumes originating from tropical Africa (e.g., Rajapakshe et al., 2017). On the other side, ground-based lidar stations might select the best-matching lidar ratios according to the dominant smoke influence at their location.
In summary, the spectral slope of the lidar ratio for smoke obviously contains information about the smoke characteristics, such as transport pathways, burning material, and source region – a potential which is not fully exploited yet. The capability of lidar measurements of atmospheric smoke layers was recently augmented by means of laser-induced aerosol fluorescence observations (Veselovskii et al., 2022; Hu et al., 2022; Gast et al., 2025).
4.4 Extinction- and backscatter-related Ångström exponents
We want to support the discussion about the reasons for the observed spectral slope of the lidar ratio by looking at the spectral slope of the extinction and backscatter coefficient.
The spectral slope of the lidar ratio S between two wavelengths (λ1 and λ2) is a result of the spectral slope of the extinction coefficient α and backscatter coefficient β. Therefore, the Ångström exponent of the lidar ratio (SAE) can be expressed by the extinction-related Ångström exponent (EAE) and the backscatter-related Ångström exponent (BAE) in the following way.
Table 6The measured extinction-related Ångström exponent (EAE), backscatter-related Ångström exponent (BAE), and lidar-ratio-related Ångström exponent (SAE) for the wavelength range 532 to 1064 nm from Raman lidar observations.
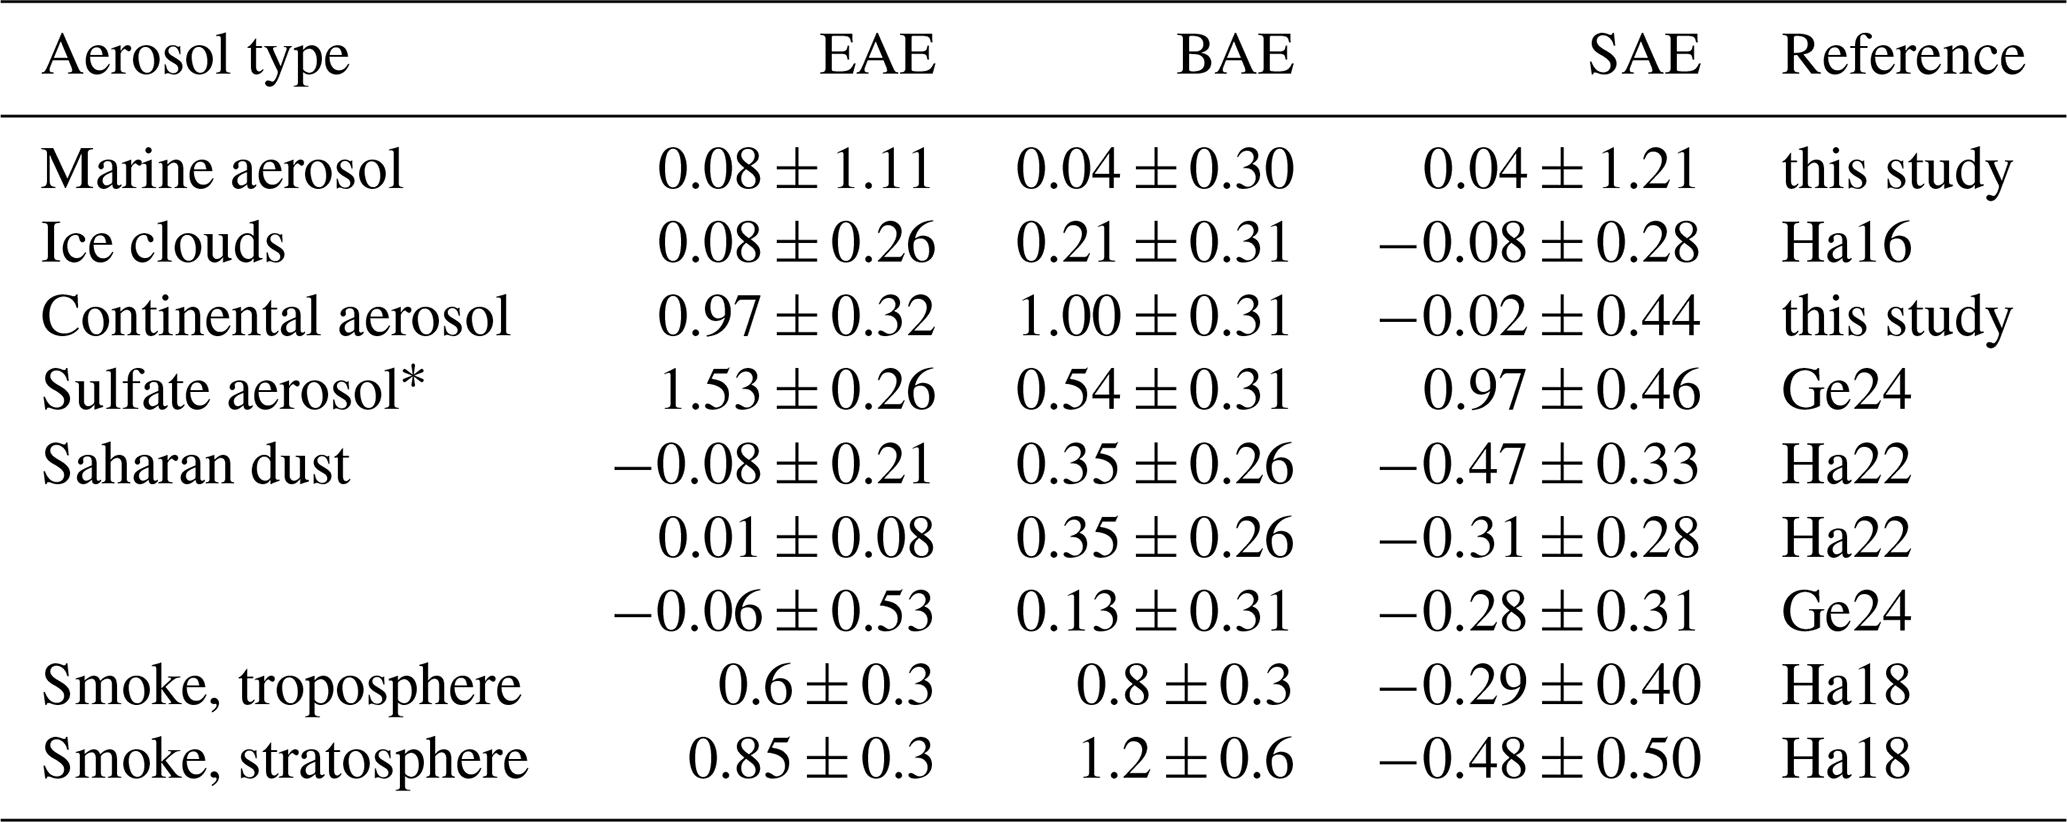
* Mixed with marine aerosol.
In Table 6, we report the corresponding Ångström exponents (only shown for the 532 to 1064 nm wavelength range) for the discussed Raman lidar observations. The presented results follow Eq. (3) within the uncertainties. Deviations from the exact agreement can be explained by different vertical smoothing lengths. The backscatter coefficients and the corresponding BAE need less vertical smoothing compared to the extinction coefficient and subsequently the lidar ratio.
The positive SAE of sulfate aerosol indicates a decrease in the lidar ratio with increasing wavelength. For marine aerosol, continental aerosol, and ice clouds, the SAE is close to zero (−0.1 < SAE < 0.1), which indicates spectrally neutral behavior, whereas, for dust and smoke, the SAE is negative (), which indicates spectrally increasing behavior.
The EAE is close to zero (−0.1 < EAE < 0.1) for large aerosol particles (such as mineral dust and marine aerosol) and ice clouds. Smoke particles show an EAE of 0.6 to 0.85, and the even smaller continental and sulfate aerosol particles exhibit EAE > 0.95.
The BAE is always above zero, which indicates that the backscatter coefficient always decreases from 532 to 1064 nm. The strongest decrease is observed for smoke and continental aerosol (BAE > 0.8), which exhibit a pronounced wavelength dependence of the backscatter coefficient. In the case of sulfate-dominated aerosol, a mixture of marine and sulfate was observed, which probably decreased the BAE compared to pure sulfate aerosol. The BAE is the smallest but still positive for large, non-absorbing particles such as marine aerosol and ice crystals. We especially want to highlight the high BAE in the 532 to 1064 nm wavelength range for the long-range-transported Saharan dust observed at Leipzig (Haarig et al., 2022). The BAE from 355 to 532 nm for the same observations is close to zero or even negative.
Thanks to the rotational Raman technique at 1064 nm (Haarig et al., 2016), the first direct measurements of the lidar ratio at 1064 nm have been conducted since 2015. In this work, we reviewed the existing observations to provide an overview of lidar ratio values at 1064 nm but also at 355 and 532 nm. The existing triple-wavelength lidar ratio observations at 355, 532, and 1064 nm were discussed with respect to five aerosol types (mineral dust, smoke, sulfate, marine, and continental aerosol), and ice crystals in cirrus clouds and their spectral behavior have been investigated. Previous studies (e.g., Müller et al., 2007; Floutsi et al., 2023) could only focus on the widespread observations of the lidar ratio at 355 and 532 nm. Now, we were able to expand the wavelength range from 355 to 1064 nm and discuss the findings with respect to the spectral behavior of the lidar ratio for different aerosol types. We could identify the following key results.
-
For marine aerosol and ice crystals in cirrus clouds, a spectrally neutral behavior of the lidar ratio was found. Here, the spectrally neutral behavior was present for the entire observed wavelength range (355 to 1064 nm).
-
For continental aerosol, a spectrally neutral behavior of the lidar ratio was found as well. The lidar ratio of continental aerosol increases with RH. The dependence of lidar ratio on RH is stronger at longer wavelengths with hygroscopic growth parameters of γLR(355 nm) = 0.26±0.005, γLR(532 nm) = 0.32± 0.01, and γLR(1064 nm) = 0.45±0.07.
-
For sulfate aerosol, the lidar ratio decreases with wavelength. In the presented case study of Gebauer et al. (2024), the spectral decrease is more pronounced towards 1064 nm, whereas the lidar ratios at 355 and 532 nm are almost the same with only a slight decrease with wavelength.
-
For mineral dust, an increase in the lidar ratio was found in the wavelength range from 532 to 1064 nm for source regions in the western Sahara. The spectral slope from 355 to 532 nm is neutral or decreasing according to the mineralogical composition in the source region. Differences in the spectral behavior of the imaginary part of the refractive index (absorption) are most probably the reason (Veselovskii et al., 2020).
-
For wildfire smoke, an increasing lidar ratio with wavelength is a typical feature for long-range-transported smoke, which extends to 1064 nm as well (Haarig et al., 2018). However, for fresh smoke and medium-range-transported smoke (approximately <3 d), a spectrally neutral or rarely decreasing behavior has been observed for the wavelength range 355 to 532 nm (e.g., Janicka et al., 2023). Moreover, smoke originating from tropical regions tends to show a spectrally neutral behavior (355 to 532 nm) as well (e.g., Baars et al., 2012).
The spectral slope of the lidar ratio from 532 to 1064 nm was compared to the CALIPSO v4 aerosol typing and lidar ratio selection algorithm (Kim et al., 2018). Good agreement was found for the aerosol type of “clean marine”. Also for the stratospheric aerosol type “sulfate/other”, good agreement was found with the tropospheric sulfate observations. In the case of “clean continental”, the Raman lidar observations show a spectrally neutral behavior under humid conditions (RH between 70 % and 80 %), whereas CALIPSO v4 assumes lower values at 1064 nm compared to 532 nm. The study of hygroscopic growth indicates that this is valid under dry conditions because the longer wavelengths are more affected by the aerosol hygroscopic growth. In the case of mineral dust, the Raman lidar measurements point to a slight increase in the lidar ratio towards 1064 nm, while CALIPSO v4 assumes a spectrally neutral lidar ratio. Within the uncertainties, these values still agree. The strongest discrepancy was detected for elevated smoke and stratospheric smoke. For these aerosol types, CALIPSO v4 assumes a strong decrease with wavelength ( = 0.43 ± 0.28), whereas the Raman lidar observations point to an increase with wavelength. We discussed the variety of spectral lidar ratios for smoke and came to the conclusion that for long-range-transported smoke, the spectral increase is a typical feature. Stratospheric smoke layers are in most cases transported over large distances from the wildfire source. Therefore, we would recommend updating the lidar ratio at 1064 nm for this aerosol type for a CALIPSO v5 algorithm. The tropospheric smoke layers exhibit a varying spectral behavior in the 355 to 532 nm wavelength range, and therefore it is difficult to predict the values at 1064 nm and to give recommendations for the CALIPSO lidar ratio selection algorithm, e.g., for elevated smoke.
The rotational Raman lidar technique is shortly introduced in Sect. 2. Here, we firstly describe the applied spectral cross-talk and temperature correction and then discuss the limitations of the technique.
A1 Corrections
In addition to the vibrational–rotational Raman lidar analysis, two corrections were applied to the rotational Raman measurement at 1058 nm: a correction for the spectral cross-talk introduced by the elastically backscattered light at 1064.14 nm and a correction due to the temperature dependence of the intensity of the rotational Raman lines (e.g., Behrendt and Nakamura, 2002). The temperature dependence of the vibrational–rotational Raman signals at 387 and 607 nm is weaker and a spectral cross-talk correction has not been considered because the suppression of the elastic backscattered light is easier to achieve due to the larger spectral distance. In our setup, the spectral cross-talk correction clearly dominates over the temperature correction in terms of magnitude for the rotational Raman measurements.
A1.1 Cross-talk correction
The spectral cross-talk correction was already outlined in Haarig et al. (2022) and is discussed here for the PollyXT at Cabo Verde. A persistent deck of altocumulus clouds, which frequently occur in the upper part of the Saharan air layer between approximately 4.0–4.5 km altitude, is best suited for the spectral cross-talk correction. The vibrational Raman signals at 387 and 607 nm, which are not influenced by any spectral cross-talk, show a pronounced decrease in the cloud layer. However, the rotational Raman signal at 1058 nm is influenced by the high elastic return signal at 1064 nm from the cloud droplets. The influence of the elastic signal has to be subtracted from the rotational Raman signal. The empirical cross-talk correction factor cS is chosen in such a way that the influence of the elastic signal is removed and the rotational Raman signal decays in a way similar to the vibrational Raman signals. The spectral cross-talk correction is applied to the range-corrected Raman signal of PRa using the elastic range-corrected signal Pel at 1064 nm in the following way:
The spectral cross-talk depends not only on the interference filters, but also on the sensitivity of the elastic channel, which depends on the applied neutral density filters. Therefore, a new spectral cross-talk correction factor has to be determined if the neutral density filters in the elastic channel are changed. For the PollyXT on Cabo Verde, cS was 0.00067 ± 0.00003 between 10 September 2021 and 28 January 2022 (see the sulfate aerosol case in Gebauer et al., 2024), and afterwards cS was 0.00014 ± 0.00004 until 23 March 2023 (see the marine aerosol case in Sect. 3.1). During the first time period, the neutral density filters in the elastic channel were equivalent to an optical thickness of 1.3; in the second period, the neutral density filters were reduced to 1.0. The spectral cross-talk correction is applied before the temperature correction.
A1.2 Temperature correction
The temperature dependence of the transmitted intensity through the two interference filters is shown in Fig. A1. It was calculated from the temperature-dependent intensity of the rotational Raman lines (Adam, 2009) multiplied by the transmittance curves of both filters (Fig. 1). The same filters were used first in BERTHA and later in the PollyXT at Cabo Verde. The correction of the temperature-dependent transmission of the range-corrected rotational Raman signal PRa is performed with respect to a temperature T0 of 288.15 K using a polynomial fit of the third order:
where the fit coefficients are , and . A detailed discussion about the temperature dependence of the rotational Raman lines can be found in Behrendt and Nakamura (2002), Veselovskii et al. (2015), and Wang et al. (2024a).
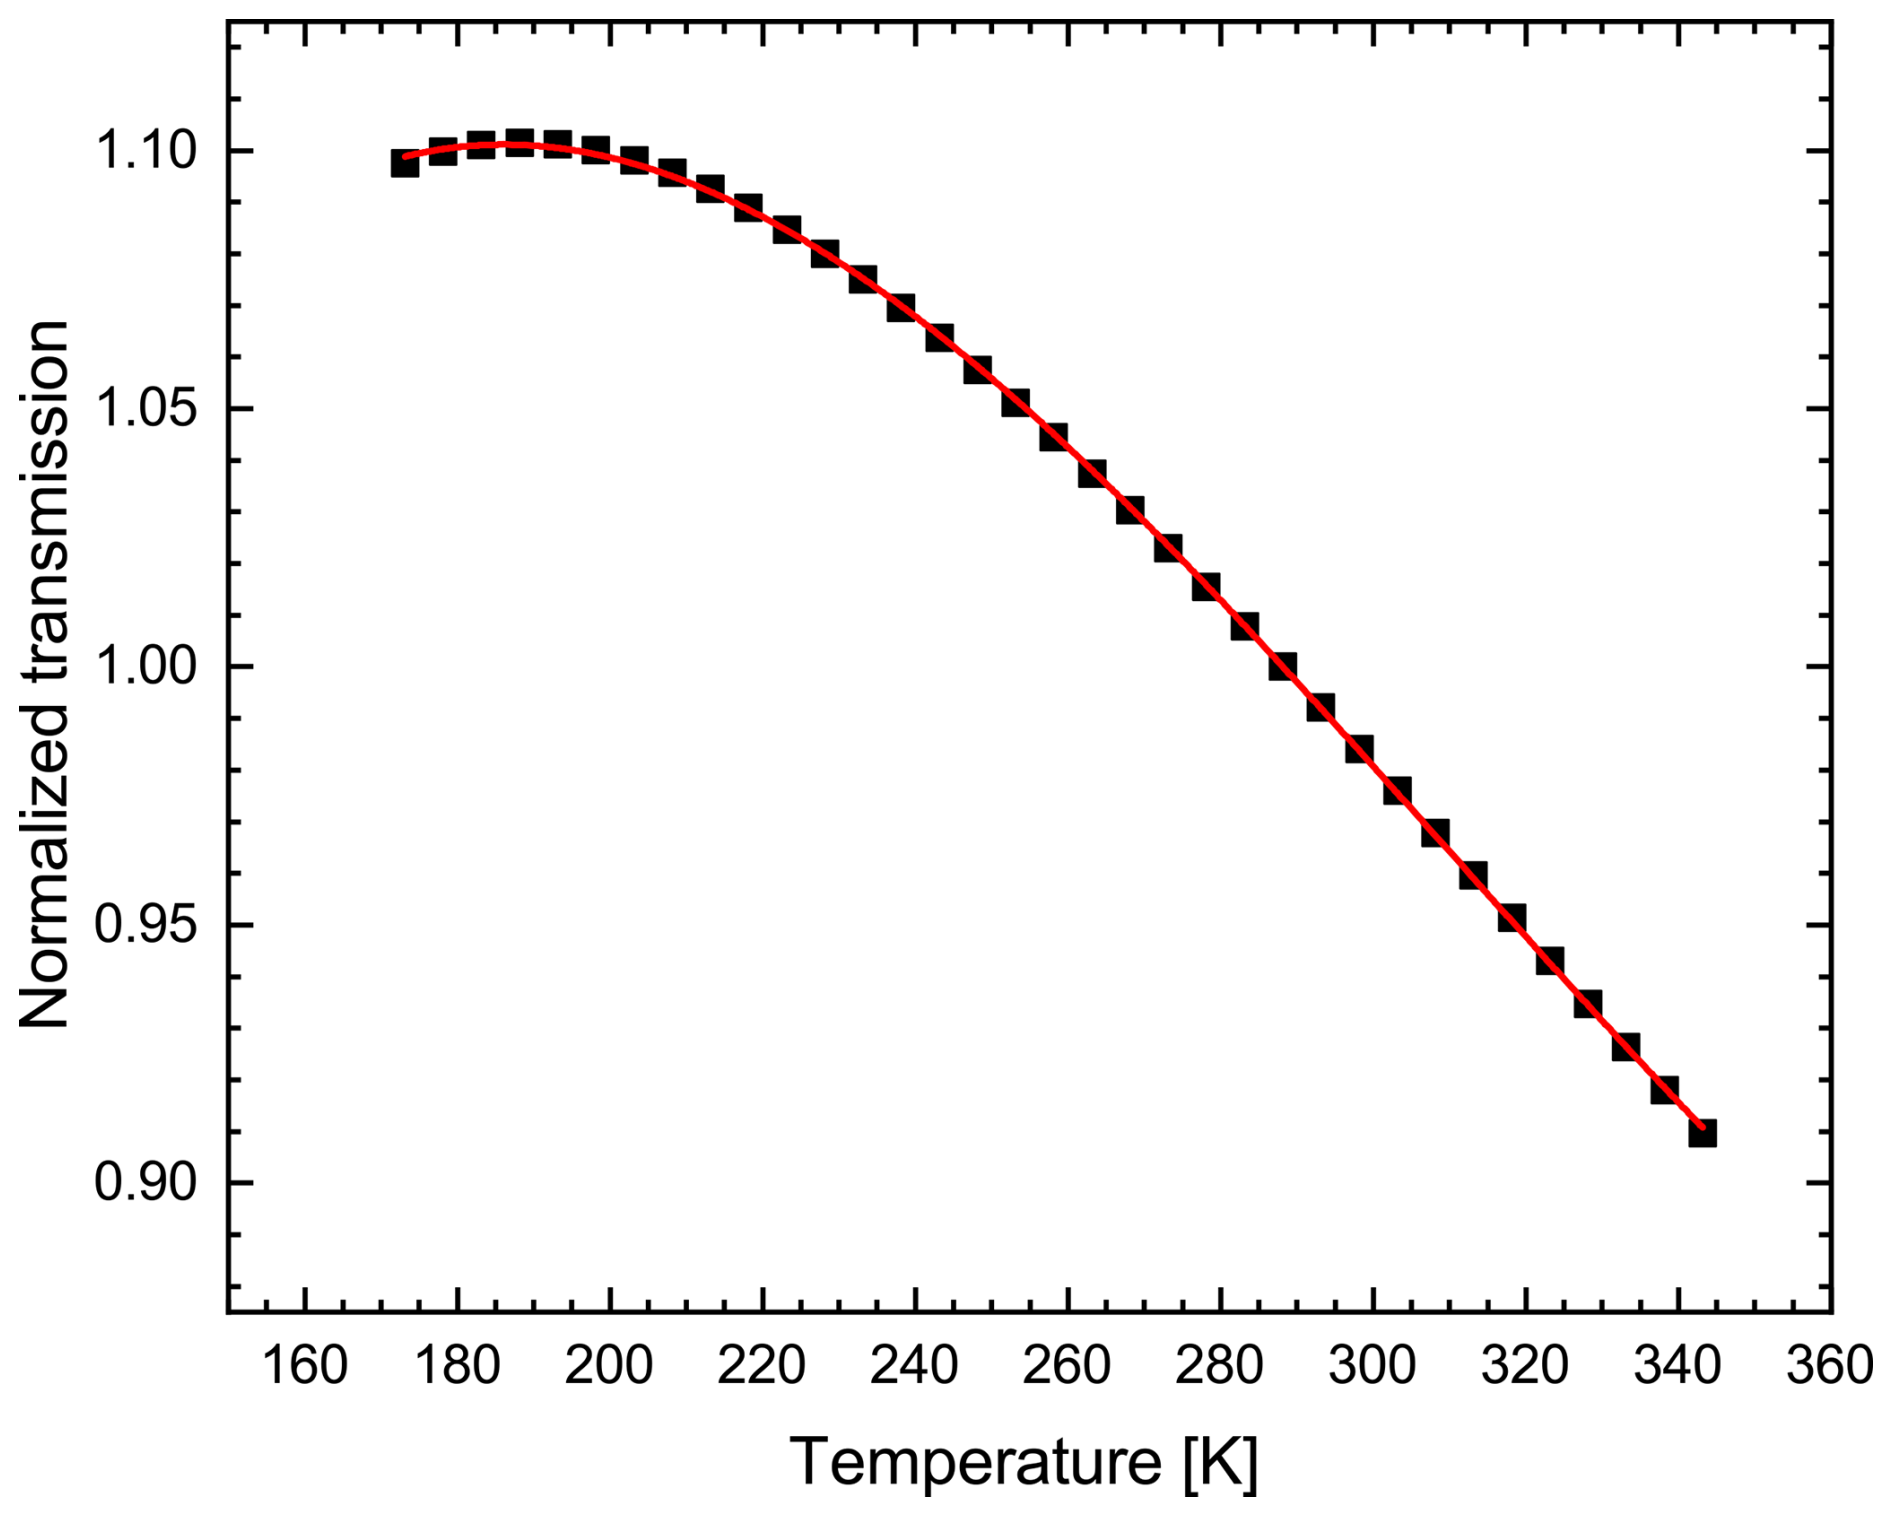
Figure A1The temperature-dependent transmission of the rotational Raman lines when applying both interference filters simultaneously. The transmission is normalized to a temperature of T0 = 288.15 K. The polynomial fit curve to the data points is used to correct the rotational Raman signal for the temperature effect.
A2 Limitations
In this subsection, we discuss the limitations of the rotational Raman lidar technique for its application in the near-infrared wavelength range, which currently prevents an automatic analysis. Therefore, we can base our present study on case studies only.
-
The molecular signal at 1064 nm is 81 times lower compared to observations at 355 nm because the scattering cross-section for Rayleigh scattering scales with λ−4 (λ – wavelength). Therefore, long averaging periods (>2 h) are necessary. The lower energy of the PollyXT laser at 1064 nm (∼ 80 mJ at 100 Hz) compared to BERTHA (nominal up to 1000 mJ – 30 Hz – at 1064 nm; Haarig et al., 2016), together with the smaller telescope (30 cm mirror compared to 53 cm mirror in BERTHA), especially limits useful signal detection to 4.5 km height on Cabo Verde, whereas strong BERTHA signals allowed us to compute even the extinction coefficient of a stratospheric smoke layer at around 15 km height at Leipzig (Haarig et al., 2018).
-
We use photomultiplier tubes (PMTs, R3236 from Hamamatsu Photonics, Japan) to detect the signals in the near-infrared to cover several orders of magnitude in the backscattered signal. The single-photon quantum efficiency of the PMTs is low (0.08 %). Longer temporal and vertical averaging is necessary for our PMTs because of the reduced quantum efficiency. Furthermore, the detectors are aging, which further decreases their sensitivity. Wang et al. (2024b) used silicon single-photon avalanche diodes (Excelitas Technologies Corp., Canada) with a quantum efficiency of 2.5 %, which is more than 30 times higher. Analog detection with avalanche photodiodes provides an even higher quantum efficiency of around 40 %. However, the analog detection has difficulties accurately detecting the signal as oscillations may occur, which significantly affect the extinction retrieval. Nevertheless, due to the optical design of PollyXT it is not possible to apply these methods currently but may be an option for future development.
-
The large filter width (9 nm) limits the observations to nighttime hours only. Vibrational–rotational Raman measurements are also limited to nighttime, whereas rotational Raman observations at shorter wavelengths provide daytime extinction observations as well (e.g., Arshinov et al., 2005). Due to the reasons discussed above, however, its not applicable at 1064 nm yet.
-
The calibration of the backscatter coefficient at 1064 nm is not trivial (e.g., Vaughan et al., 2009) because of the low molecular signal at 1064 nm. The photon counting detection implemented in BERTHA and PollyXT is sensitive to the low molecular signal at 1064 nm. A slight variation in the backscatter coefficient affects the lidar ratio. A cirrus cloud helps to constrain the backscatter coefficient by comparison to the observations at 532 and 355 nm and assuming a color ratio of 1 (Vaughan et al., 2010, 2019).
The PollyXT data are available at https://polly.tropos.de/ (PollyNET, 2025). The optical profiles of marine aerosol (Sect. 3.1) and continental aerosol (Sect. 3.2) are available at https://doi.org/10.5281/zenodo.15234831 (Haarig et al., 2025). HYSPLIT trajectories were calculated using the online tool at https://www.ready.noaa.gov/hypub-bin/trajtype.pl?runtype=archive (HYSPLIT, 2025).
MH analyzed the data at 1064 nm, conceptualized the study, and wrote the paper. RE conceptualized the rotational Raman measurements and together with DA strongly supported the measurements with BERTHA and PollyXT. BG performed the calculations for the temperature correction. HB supported the analysis of the PollyXT data, and AA supported the discussion of the results. All co-authors provided valuable input to the paper.
The contact author has declared that none of the authors has any competing interests.
Publisher's note: Copernicus Publications remains neutral with regard to jurisdictional claims made in the text, published maps, institutional affiliations, or any other geographical representation in this paper. While Copernicus Publications makes every effort to include appropriate place names, the final responsibility lies with the authors.
We are grateful to all the people from the Ocean Science Centre Mindelo (OSCM) and TROPOS whose strong support enabled the lidar measurements at Mindelo, Cabo Verde. We gratefully acknowledge the European Space Agency (ESA) for the AIRSENSE (Aerosol and aerosol-cloud Interaction from Remote SENSing Enhancement) project through contract 4000142902/23/I-NS in the framework of the ESA Atmosphere Science Cluster – Research Opportunities 5 – European Coordinated Study on Aerosols and Aerosol/Cloud Interactions. Many improvements in terms of both hardware and software were triggered by the fruitful discussions and network activities within the European Research Lidar Network (EARLINET) and ACTRIS. We thank Tilo Arnhold, the public relations officer of TROPOS, for the photo of the five lidar beams at Leipzig (Fig. 3). We thank the two anonymous reviewers for their time and effort.
This research has been supported by the Bundesministerium für Bildung und Forschung (grant no. 01LK2001A), the Bundesministerium für Wirtschaft und Energie (grant no. 50EE1721C), Horizon 2020 (grant nos. 739530 and 871115), and the European Space Agency (grant no. 4000142902/23/I-NS).
This paper was edited by Eduardo Landulfo and reviewed by two anonymous referees.
Achtert, P., Khaplanov, M., Khosrawi, F., and Gumbel, J.: Pure rotational-Raman channels of the Esrange lidar for temperature and particle extinction measurements in the troposphere and lower stratosphere, Atmos. Meas. Tech., 6, 91–98, https://doi.org/10.5194/amt-6-91-2013, 2013. a
Ackermann, J.: The Extinction-to-Backscatter Ratio of Tropospheric Aerosol: A Numerical Study, J. Atmos. Ocean. Tech., 15, 1043–1050, https://doi.org/10.1175/1520-0426(1998)015<1043:TETBRO>2.0.CO;2, 1998. a, b, c
Adam, M.: Notes on Temperature-Dependent Lidar Equations, J. Atmos. Ocean. Tech., 26, 1021–1039, https://doi.org/10.1175/2008JTECHA1206.1, 2009. a
Adam, M., Nicolae, D., Stachlewska, I. S., Papayannis, A., and Balis, D.: Biomass burning events measured by lidars in EARLINET – Part 1: Data analysis methodology, Atmos. Chem. Phys., 20, 13905–13927, https://doi.org/10.5194/acp-20-13905-2020, 2020. a
Alados-Arboledas, L., Müller, D., Guerrero-Rascado, J. L., Navas-Guzmán, F., Pérez-Ramírez, D., and Olmo, F. J.: Optical and microphysical properties of fresh biomass burning aerosol retrieved by Raman lidar, and star-and sun-photometry, Geophys. Res. Lett., 38, l01807, https://doi.org/10.1029/2010GL045999, 2011. a
Althausen, D., Müller, D., Ansmann, A., Wandinger, U., Hube, H., Clauder, E., and Zörner, S.: Scanning 6-Wavelength 11-Channel Aerosol Lidar, J. Atmos. Ocean. Tech., 17, 1469–1482, https://doi.org/10.1175/1520-0426(2000)017<1469:SWCAL>2.0.CO;2, 2000. a
Ansmann, A., Wandinger, U., Riebesell, M., Weitkamp, C., and Michaelis, W.: Independent measurement of extinction and backscatter profiles in cirrus clouds by using a combined Raman elastic-backscatter lidar, Appl. Optics, 31, 7113–7131, https://doi.org/10.1364/AO.31.007113, 1992. a, b
Ansmann, A., Ohneiser, K., Mamouri, R.-E., Knopf, D. A., Veselovskii, I., Baars, H., Engelmann, R., Foth, A., Jimenez, C., Seifert, P., and Barja, B.: Tropospheric and stratospheric wildfire smoke profiling with lidar: mass, surface area, CCN, and INP retrieval, Atmos. Chem. Phys., 21, 9779–9807, https://doi.org/10.5194/acp-21-9779-2021, 2021. a
Arshinov, Y., Bobrovnikov, S., Serikov, I., Ansmann, A., Wandinger, U., Althausen, D., Mattis, I., and Müller, D.: Daytime operation of a pure rotational Raman lidar by use of a Fabry–Perot interferometer, Appl. Optics, 44, 3593–3603, https://doi.org/10.1364/AO.44.003593, 2005. a
Baars, H., Ansmann, A., Althausen, D., Engelmann, R., Heese, B., Müller, D., Artaxo, P., Paixao, M., Pauliquevis, T., and Souza, R.: Aerosol profiling with lidar in the Amazon Basin during the wet and dry season, J. Geophys. Res.-Atmos., 117, d21201, https://doi.org/10.1029/2012JD018338, 2012. a, b
Baars, H., Kanitz, T., Engelmann, R., Althausen, D., Heese, B., Komppula, M., Preißler, J., Tesche, M., Ansmann, A., Wandinger, U., Lim, J.-H., Ahn, J. Y., Stachlewska, I. S., Amiridis, V., Marinou, E., Seifert, P., Hofer, J., Skupin, A., Schneider, F., Bohlmann, S., Foth, A., Bley, S., Pfüller, A., Giannakaki, E., Lihavainen, H., Viisanen, Y., Hooda, R. K., Pereira, S. N., Bortoli, D., Wagner, F., Mattis, I., Janicka, L., Markowicz, K. M., Achtert, P., Artaxo, P., Pauliquevis, T., Souza, R. A. F., Sharma, V. P., van Zyl, P. G., Beukes, J. P., Sun, J., Rohwer, E. G., Deng, R., Mamouri, R.-E., and Zamorano, F.: An overview of the first decade of PollyNET: an emerging network of automated Raman-polarization lidars for continuous aerosol profiling, Atmos. Chem. Phys., 16, 5111–5137, https://doi.org/10.5194/acp-16-5111-2016, 2016. a
Bedoya-Velásquez, A. E., Navas-Guzmán, F., Granados-Muñoz, M. J., Titos, G., Román, R., Casquero-Vera, J. A., Ortiz-Amezcua, P., Benavent-Oltra, J. A., de Arruda Moreira, G., Montilla-Rosero, E., Hoyos, C. D., Artiñano, B., Coz, E., Olmo-Reyes, F. J., Alados-Arboledas, L., and Guerrero-Rascado, J. L.: Hygroscopic growth study in the framework of EARLINET during the SLOPE I campaign: synergy of remote sensing and in situ instrumentation, Atmos. Chem. Phys., 18, 7001–7017, https://doi.org/10.5194/acp-18-7001-2018, 2018. a
Behrendt, A. and Nakamura, T.: Calculation of the calibration constant of polarization lidar and its dependency on atmospheric temperature, Opt. Express, 10, 805–817, https://doi.org/10.1364/OE.10.000805, 2002. a, b
Bohlmann, S., Baars, H., Radenz, M., Engelmann, R., and Macke, A.: Ship-borne aerosol profiling with lidar over the Atlantic Ocean: from pure marine conditions to complex dust–smoke mixtures, Atmos. Chem. Phys., 18, 9661–9679, https://doi.org/10.5194/acp-18-9661-2018, 2018. a, b
Burton, S. P., Ferrare, R. A., Hostetler, C. A., Hair, J. W., Rogers, R. R., Obland, M. D., Butler, C. F., Cook, A. L., Harper, D. B., and Froyd, K. D.: Aerosol classification using airborne High Spectral Resolution Lidar measurements – methodology and examples, Atmos. Meas. Tech., 5, 73–98, https://doi.org/10.5194/amt-5-73-2012, 2012. a
Burton, S. P., Hair, J. W., Kahnert, M., Ferrare, R. A., Hostetler, C. A., Cook, A. L., Harper, D. B., Berkoff, T. A., Seaman, S. T., Collins, J. E., Fenn, M. A., and Rogers, R. R.: Observations of the spectral dependence of linear particle depolarization ratio of aerosols using NASA Langley airborne High Spectral Resolution Lidar, Atmos. Chem. Phys., 15, 13453–13473, https://doi.org/10.5194/acp-15-13453-2015, 2015. a
Campbell, J. R., Hlavka, D. L., Welton, E. J., Flynn, C. J., Turner, D. D., Spinhirne, J. D., Scott, V. S., and Hwang, I. H.: Full-Time, Eye-Safe Cloud and Aerosol Lidar Observation at Atmospheric Radiation Measurement Program Sites: Instruments and Data Processing, J. Atmos. Ocean. Tech., 19, 431–442, https://doi.org/10.1175/1520-0426(2002)019<0431:FTESCA>2.0.CO;2, 2002. a
Cattrall, C., Reagan, J., Thome, K., and Dubovik, O.: Variability of aerosol and spectral lidar and backscatter and extinction ratios of key aerosol types derived from selected Aerosol Robotic Network locations, J. Geophys. Res.-Atmos., 110, D10S11, https://doi.org/10.1029/2004JD005124, 2005. a
Dai, G., Wu, S., Long, W., Liu, J., Xie, Y., Sun, K., Meng, F., Song, X., Huang, Z., and Chen, W.: Aerosol and cloud data processing and optical property retrieval algorithms for the spaceborne ACDL/DQ-1, Atmos. Meas. Tech., 17, 1879–1890, https://doi.org/10.5194/amt-17-1879-2024, 2024. a
Di Biagio, C., Formenti, P., Balkanski, Y., Caponi, L., Cazaunau, M., Pangui, E., Journet, E., Nowak, S., Andreae, M. O., Kandler, K., Saeed, T., Piketh, S., Seibert, D., Williams, E., and Doussin, J.-F.: Complex refractive indices and single-scattering albedo of global dust aerosols in the shortwave spectrum and relationship to size and iron content, Atmos. Chem. Phys., 19, 15503–15531, https://doi.org/10.5194/acp-19-15503-2019, 2019. a
Dubovik, O., Sinyuk, A., Lapyonok, T., Holben, B. N., Mishchenko, M., Yang, P., Eck, T. F., Volten, H., Muñoz, O., Veihelmann, B., van der Zande, W. J., Leon, J.-F., Sorokin, M., and Slutsker, I.: Application of spheroid models to account for aerosol particle nonsphericity in remote sensing of desert dust, J. Geophys. Res.-Atmospheres, 111, D11208, https://doi.org/10.1029/2005JD006619, 2006. a
Dubovik, O., Fuertes, D., Litvinov, P., Lopatin, A., Lapyonok, T., Doubovik, I., Xu, F., Ducos, F., Chen, C., Torres, B., Derimian, Y., Li, L., Herreras-Giralda, M., Herrera, M., Karol, Y., Matar, C., Schuster, G. L., Espinosa, R., Puthukkudy, A., Li, Z., Fischer, J., Preusker, R., Cuesta, J., Kreuter, A., Cede, A., Aspetsberger, M., Marth, D., Bindreiter, L., Hangler, A., Lanzinger, V., Holter, C., and Federspiel, C.: A Comprehensive Description of Multi-Term LSM for Applying Multiple a Priori Constraints in Problems of Atmospheric Remote Sensing: GRASP Algorithm, Concept, and Applications, Front. Remote Sens., 2, 23, https://doi.org/10.3389/frsen.2021.706851, 2021. a
Düsing, S., Ansmann, A., Baars, H., Corbin, J. C., Denjean, C., Gysel-Beer, M., Müller, T., Poulain, L., Siebert, H., Spindler, G., Tuch, T., Wehner, B., and Wiedensohler, A.: Measurement report: Comparison of airborne, in situ measured, lidar-based, and modeled aerosol optical properties in the central European background – identifying sources of deviations, Atmos. Chem. Phys., 21, 16745–16773, https://doi.org/10.5194/acp-21-16745-2021, 2021. a, b, c
Engelmann, R., Kanitz, T., Baars, H., Heese, B., Althausen, D., Skupin, A., Wandinger, U., Komppula, M., Stachlewska, I. S., Amiridis, V., Marinou, E., Mattis, I., Linné, H., and Ansmann, A.: The automated multiwavelength Raman polarization and water-vapor lidar PollyXT: the neXT generation, Atmos. Meas. Tech., 9, 1767–1784, https://doi.org/10.5194/amt-9-1767-2016, 2016. a, b, c
Engelmann, R., Ansmann, A., Ohneiser, K., Griesche, H., Radenz, M., Hofer, J., Althausen, D., Dahlke, S., Maturilli, M., Veselovskii, I., Jimenez, C., Wiesen, R., Baars, H., Bühl, J., Gebauer, H., Haarig, M., Seifert, P., Wandinger, U., and Macke, A.: Wildfire smoke, Arctic haze, and aerosol effects on mixed-phase and cirrus clouds over the North Pole region during MOSAiC: an introduction, Atmos. Chem. Phys., 21, 13397–13423, https://doi.org/10.5194/acp-21-13397-2021, 2021. a
Ferrare, R. A., Melfi, S. H., Whiteman, D. N., Evans, K. D., Poellot, M., and Kaufman, Y. J.: Raman lidar measurements of aerosol extinction and backscattering: 2. Derivation of aerosol real refractive index, single-scattering albedo, and humidification factor using Raman lidar and aircraft size distribution measurements, J. Geophys. Res.-Atmos., 103, 19673–19689, https://doi.org/10.1029/98JD01647, 1998. a
Filioglou, M., Giannakaki, E., Backman, J., Kesti, J., Hirsikko, A., Engelmann, R., O'Connor, E., Leskinen, J. T. T., Shang, X., Korhonen, H., Lihavainen, H., Romakkaniemi, S., and Komppula, M.: Optical and geometrical aerosol particle properties over the United Arab Emirates, Atmos. Chem. Phys., 20, 8909–8922, https://doi.org/10.5194/acp-20-8909-2020, 2020. a
Floutsi, A. A., Baars, H., Engelmann, R., Althausen, D., Ansmann, A., Bohlmann, S., Heese, B., Hofer, J., Kanitz, T., Haarig, M., Ohneiser, K., Radenz, M., Seifert, P., Skupin, A., Yin, Z., Abdullaev, S. F., Komppula, M., Filioglou, M., Giannakaki, E., Stachlewska, I. S., Janicka, L., Bortoli, D., Marinou, E., Amiridis, V., Gialitaki, A., Mamouri, R.-E., Barja, B., and Wandinger, U.: DeLiAn – a growing collection of depolarization ratio, lidar ratio and Ångström exponent for different aerosol types and mixtures from ground-based lidar observations, Atmos. Meas. Tech., 16, 2353–2379, https://doi.org/10.5194/amt-16-2353-2023, 2023. a, b, c, d, e, f, g, h, i, j
Floutsi, A. A., Baars, H., and Wandinger, U.: HETEAC-Flex: an optimal estimation method for aerosol typing based on lidar-derived intensive optical properties, Atmos. Meas. Tech., 17, 693–714, https://doi.org/10.5194/amt-17-693-2024, 2024. a
Gast, B., Jimenez, C., Ansmann, A., Haarig, M., Engelmann, R., Fritzsch, F., Floutsi, A. A., Griesche, H., Ohneiser, K., Hofer, J., Radenz, M., Baars, H., Seifert, P., and Wandinger, U.: Invisible aerosol layers: improved lidar detection capabilities by means of laser-induced aerosol fluorescence, Atmos. Chem. Phys., 25, 3995–4011, https://doi.org/10.5194/acp-25-3995-2025, 2025. a
Gasteiger, J., Wiegner, M., Groß, S., Freudenthaler, V., Toledano, C., Tesche, M., and Kandler, K.: Modelling lidar-relevant optical properties of complex mineral dust aerosols, Tellus B, 63, 725–741, https://doi.org/10.1111/j.1600-0889.2011.00559.x, 2011. a, b
Gebauer, H., Floutsi, A. A., Haarig, M., Radenz, M., Engelmann, R., Althausen, D., Skupin, A., Ansmann, A., Zenk, C., and Baars, H.: Tropospheric sulfate from Cumbre Vieja (La Palma) observed over Cabo Verde contrasted with background conditions: a lidar case study of aerosol extinction, backscatter, depolarization and lidar ratio profiles at 355, 532 and 1064 nm, Atmos. Chem. Phys., 24, 5047–5067, https://doi.org/10.5194/acp-24-5047-2024, 2024. a, b, c, d, e, f, g, h, i, j, k
Gómez Maqueo Anaya, S., Althausen, D., Hofer, J., Haarig, M., Wandinger, U., Heinold, B., Tegen, I., Faust, M., Baars, H., Ansmann, A., Engelmann, R., Skupin, A., Heese, B., and Schepanski, K.: Investigating the link between mineral dust hematite content and intensive optical properties by means of lidar measurements and aerosol modelling, EGUsphere [preprint], https://doi.org/10.5194/egusphere-2024-3159, 2024. a, b
Groß, S., Esselborn, M., Weinzierl, B., Wirth, M., Fix, A., and Petzold, A.: Aerosol classification by airborne high spectral resolution lidar observations, Atmos. Chem. Phys., 13, 2487–2505, https://doi.org/10.5194/acp-13-2487-2013, 2013. a
Groß, S., Freudenthaler, V., Schepanski, K., Toledano, C., Schäfler, A., Ansmann, A., and Weinzierl, B.: Optical properties of long-range transported Saharan dust over Barbados as measured by dual-wavelength depolarization Raman lidar measurements, Atmos. Chem. Phys., 15, 11067–11080, https://doi.org/10.5194/acp-15-11067-2015, 2015. a
Haarig, M., Engelmann, R., Ansmann, A., Veselovskii, I., Whiteman, D. N., and Althausen, D.: 1064 nm rotational Raman lidar for particle extinction and lidar-ratio profiling: cirrus case study, Atmos. Meas. Tech., 9, 4269–4278, https://doi.org/10.5194/amt-9-4269-2016, 2016. a, b, c, d, e, f, g, h
Haarig, M., Ansmann, A., Althausen, D., Klepel, A., Groß, S., Freudenthaler, V., Toledano, C., Mamouri, R.-E., Farrell, D. A., Prescod, D. A., Marinou, E., Burton, S. P., Gasteiger, J., Engelmann, R., and Baars, H.: Triple-wavelength depolarization-ratio profiling of Saharan dust over Barbados during SALTRACE in 2013 and 2014, Atmos. Chem. Phys., 17, 10767–10794, https://doi.org/10.5194/acp-17-10767-2017, 2017a. a, b
Haarig, M., Ansmann, A., Gasteiger, J., Kandler, K., Althausen, D., Baars, H., Radenz, M., and Farrell, D. A.: Dry versus wet marine particle optical properties: RH dependence of depolarization ratio, backscatter, and extinction from multiwavelength lidar measurements during SALTRACE, Atmos. Chem. Phys., 17, 14199–14217, https://doi.org/10.5194/acp-17-14199-2017, 2017b. a, b
Haarig, M., Ansmann, A., Baars, H., Jimenez, C., Veselovskii, I., Engelmann, R., and Althausen, D.: Depolarization and lidar ratios at 355, 532, and 1064 nm and microphysical properties of aged tropospheric and stratospheric Canadian wildfire smoke, Atmos. Chem. Phys., 18, 11847–11861, https://doi.org/10.5194/acp-18-11847-2018, 2018. a, b, c, d, e, f, g, h, i
Haarig, M., Ansmann, A., Engelmann, R., Baars, H., Toledano, C., Torres, B., Althausen, D., Radenz, M., and Wandinger, U.: First triple-wavelength lidar observations of depolarization and extinction-to-backscatter ratios of Saharan dust, Atmos. Chem. Phys., 22, 355–369, https://doi.org/10.5194/acp-22-355-2022, 2022. a, b, c, d, e, f
Haarig, M., Engelmann, R., Baars, H., Gast, B., Althausen, D., and Ansmann, A.: Optical profiles of continental and marine aerosol from lidar observations at Leipzig, Germany, and Mindelo, Cabo Verde, Zenodo [data set], https://doi.org/10.5281/zenodo.15234831, 2025. a
Hänel, G.: The Properties of Atmospheric Aerosol Particles as Functions of the Relative Humidity at Thermodynamic Equilibrium with the Surrounding Moist Air, Adv. Geophys., 19, 73–188, https://doi.org/10.1016/S0065-2687(08)60142-9, 1976. a
Hofer, J., Ansmann, A., Althausen, D., Engelmann, R., Baars, H., Fomba, K. W., Wandinger, U., Abdullaev, S. F., and Makhmudov, A. N.: Optical properties of Central Asian aerosol relevant for spaceborne lidar applications and aerosol typing at 355 and 532 nm, Atmos. Chem. Phys., 20, 9265–9280, https://doi.org/10.5194/acp-20-9265-2020, 2020. a, b
Holben, B., Eck, T., Slutsker, I., Tanré, D., Buis, J., Setzer, A., Vermote, E., Reagan, J., Kaufman, Y., Nakajima, T., Lavenu, F., Jankowiak, I., and Smirnov, A.: AERONET – Federated Instrument Network and Data Archive for Aerosol Characterization, Remote Sens. Environ., 66, 1–16, https://doi.org/10.1016/S0034-4257(98)00031-5, 1998. a
Hu, Q., Goloub, P., Veselovskii, I., Bravo-Aranda, J.-A., Popovici, I. E., Podvin, T., Haeffelin, M., Lopatin, A., Dubovik, O., Pietras, C., Huang, X., Torres, B., and Chen, C.: Long-range-transported Canadian smoke plumes in the lower stratosphere over northern France, Atmos. Chem. Phys., 19, 1173–1193, https://doi.org/10.5194/acp-19-1173-2019, 2019. a
Hu, Q., Goloub, P., Veselovskii, I., and Podvin, T.: The characterization of long-range transported North American biomass burning plumes: what can a multi-wavelength Mie–Raman-polarization-fluorescence lidar provide?, Atmos. Chem. Phys., 22, 5399–5414, https://doi.org/10.5194/acp-22-5399-2022, 2022. a
Hu, Y., Vaughan, M., Liu, Z., Powell, K., and Rodier, S.: Retrieving Optical Depths and Lidar Ratios for Transparent Layers Above Opaque Water Clouds From CALIPSO Lidar Measurements, IEEE Geosci. Remote Sens. Lett., 4, 523–526, https://doi.org/10.1109/LGRS.2007.901085, 2007. a
HYSPLIT: HYbrid Single-Particle Lagrangian Integrated Trajectory model, backward trajectory calculation tool, HYSPLIT [data set], https://www.ready.noaa.gov/hypub-bin/trajtype.pl?runtype=archive (last access: 25 October 2024), 2025. a
Janicka, L., Davuliene, L., Bycenkiene, S., and Stachlewska, I. S.: Long term observations of biomass burning aerosol over Warsaw by means of multiwavelength lidar, Opt. Express, 31, 33150–33174, https://doi.org/10.1364/OE.496794, 2023. a, b
Jefferson, A., Hageman, D., Morrow, H., Mei, F., and Watson, T.: Seven years of aerosol scattering hygroscopic growth measurements from SGP: Factors influencing water uptake, J. Geophys. Res.-Atmos., 122, 2017JD026804, https://doi.org/10.1002/2017JD026804, 2017. a
Jimenez, C., Ansmann, A., Engelmann, R., Haarig, M., Schmidt, J., and Wandinger, U.: Polarization lidar: an extended three-signal calibration approach, Atmos. Meas. Tech., 12, 1077–1093, https://doi.org/10.5194/amt-12-1077-2019, 2019. a
Josset, D., Rogers, R., Pelon, J., Hu, Y., Liu, Z., Omar, A., and Zhai, P.-W.: CALIPSO lidar ratio retrieval over the ocean, Opt. Express, 19, 18696–18706, https://doi.org/10.1364/OE.19.018696, 2011. a, b
Josset, D., Pelon, J., Hu, Y., Rogers, R., Liu, Z., Omar, A., Vaughan, M., Zhai, P.-W., and the ICARE team: Global Scale Lidar RatioRetrieval Over the Ocean, in: 26th International Laser Radar Conference(ILRC 26), edited by: Papayannis, A., Balis, D., Amiridis, V., and Heli, P., Greece, 25–29 June, 2012. a
Kahnert, M. and Kanngießer, F.: Optical Characterization of Marine Aerosols Using a Morphologically Realistic Model With Varying Water Content: Implications for Lidar Applications and Passive Polarimetric Remote Sensing, Geophys. Res. Lett., 51, e2023GL107541, https://doi.org/10.1029/2023GL107541, 2024. a
Kim, M.-H., Omar, A. H., Tackett, J. L., Vaughan, M. A., Winker, D. M., Trepte, C. R., Hu, Y., Liu, Z., Poole, L. R., Pitts, M. C., Kar, J., and Magill, B. E.: The CALIPSO version 4 automated aerosol classification and lidar ratio selection algorithm, Atmos. Meas. Tech., 11, 6107–6135, https://doi.org/10.5194/amt-11-6107-2018, 2018. a, b, c, d, e, f, g, h, i, j, k, l
Kong, S., Sato, K., and Bi, L.: Lidar Ratio–Depolarization Ratio Relations of Atmospheric Dust Aerosols: The Super-Spheroid Model and High Spectral Resolution Lidar Observations, J. Geophys. Res.-Atmos., 127, e2021JD035629, https://doi.org/10.1029/2021JD035629, 2022. a
Li, Z., Painemal, D., Schuster, G., Clayton, M., Ferrare, R., Vaughan, M., Josset, D., Kar, J., and Trepte, C.: Assessment of tropospheric CALIPSO Version 4.2 aerosol types over the ocean using independent CALIPSO–SODA lidar ratios, Atmos. Meas. Tech., 15, 2745–2766, https://doi.org/10.5194/amt-15-2745-2022, 2022. a
Liu, Z., Omar, A., Vaughan, M., Hair, J., Kittaka, C., Hu, Y., Powell, K., Trepte, C., Winker, D., Hostetler, C., Ferrare, R., and Pierce, R.: CALIPSO lidar observations of the optical properties of Saharan dust: A case study of long-range transport, J. Geophys. Res.-Atmos., 113, d07207, https://doi.org/10.1029/2007JD008878, 2008. a
Mamouri, R.-E. and Ansmann, A.: Potential of polarization/Raman lidar to separate fine dust, coarse dust, maritime, and anthropogenic aerosol profiles, Atmos. Meas. Tech., 10, 3403–3427, https://doi.org/10.5194/amt-10-3403-2017, 2017. a, b
Mattis, I., Ansmann, A., Althausen, D., Jaenisch, V., Wandinger, U., Müller, D., Arshinov, Y. F., Bobrovnikov, S. M., and Serikov, I. B.: Relative-humidity profiling in the troposphere with a Raman lidar, Appl. Optics, 41, 6451–6462, https://doi.org/10.1364/AO.41.006451, 2002. a
Mattis, I., Ansmann, A., Müller, D., Wandinger, U., and Althausen, D.: Multiyear aerosol observations with dual-wavelength Raman lidar in the framework of EARLINET, J. Geophys. Res.-Atmos., 109, D13203, https://doi.org/10.1029/2004JD004600, 2004. a, b, c, d
Miri, R., Pujol, O., Hu, Q., Goloub, P., Veselovskii, I., Podvin, T., and Ducos, F.: Innovative aerosol hygroscopic growth study from Mie–Raman–fluorescence lidar and microwave radiometer synergy, Atmos. Meas. Tech., 17, 3367–3375, https://doi.org/10.5194/amt-17-3367-2024, 2024. a
Müller, D., Mattis, I., Wandinger, U., Ansmann, A., Althausen, D., and Stohl, A.: Raman lidar observations of aged Siberian and Canadian forest fire smoke in the free troposphere over Germany in 2003: Microphysical particle characterization, J. Geophys. Res.-Atmos., 110, d17201, https://doi.org/10.1029/2004JD005756, 2005. a
Müller, D., Ansmann, A., Mattis, I., Tesche, M., Wandinger, U., Althausen, D., and Pisani, G.: Aerosol-type-dependent lidar ratios observed with Raman lidar, J. Geophys. Res.-Atmos., 112, D16202, https://doi.org/10.1029/2006JD008292, 2007. a, b
Müller, D., Weinzierl, B., Petzold, A., Kandler, K., Ansmann, A., Müller, T., Tesche, M., Freudenthaler, V., Esselborn, M., Heese, B., Althausen, D., Schladitz, A., Otto, S., and Knippertz, P.: Mineral dust observed with AERONET Sun photometer, Raman lidar, and in situ instruments during SAMUM 2006: Shape-independent particle properties, J. Geophys. Res.-Atmos., 115, D07202, https://doi.org/10.1029/2009JD012520, 2010. a
Murayama, T., Müller, D., Wada, K., Shimizu, A., Sekiguchi, M., and Tsukamoto, T.: Characterization of Asian dust and Siberian smoke with multi-wavelength Raman lidar over Tokyo, Japan in spring 2003, Geophys. Res. Lett., 31, l23103, https://doi.org/10.1029/2004GL021105, 2004. a, b
Navas-Guzmán, F., Martucci, G., Collaud Coen, M., Granados-Muñoz, M. J., Hervo, M., Sicard, M., and Haefele, A.: Characterization of aerosol hygroscopicity using Raman lidar measurements at the EARLINET station of Payerne, Atmos. Chem. Phys., 19, 11651–11668, https://doi.org/10.5194/acp-19-11651-2019, 2019. a
Nicolae, D., Nemuc, A., Müller, D., Talianu, C., Vasilescu, J., Belegante, L., and Kolgotin, A.: Characterization of fresh and aged biomass burning events using multiwavelength Raman lidar and mass spectrometry, J. Geophys. Res.-Atmos., 118, 2956–2965, https://doi.org/10.1002/jgrd.50324, 2013. a
Nishizawa, T., Sugimoto, N., Matsui, I., Shimizu, A., Hara, Y., Itsushi, U., Yasunaga, K., Kudo, R., and Kim, S.-W.: Ground-based network observation using Mie–Raman lidars and multi-wavelength Raman lidars and algorithm to retrieve distributions of aerosol components, J. Quant. Spectrosc. Ra., 188, 79–93, https://doi.org/10.1016/j.jqsrt.2016.06.031, 2017. a
Ohneiser, K., Ansmann, A., Baars, H., Seifert, P., Barja, B., Jimenez, C., Radenz, M., Teisseire, A., Floutsi, A., Haarig, M., Foth, A., Chudnovsky, A., Engelmann, R., Zamorano, F., Bühl, J., and Wandinger, U.: Smoke of extreme Australian bushfires observed in the stratosphere over Punta Arenas, Chile, in January 2020: optical thickness, lidar ratios, and depolarization ratios at 355 and 532 nm, Atmos. Chem. Phys., 20, 8003–8015, https://doi.org/10.5194/acp-20-8003-2020, 2020. a, b
Ohneiser, K., Ansmann, A., Chudnovsky, A., Engelmann, R., Ritter, C., Veselovskii, I., Baars, H., Gebauer, H., Griesche, H., Radenz, M., Hofer, J., Althausen, D., Dahlke, S., and Maturilli, M.: The unexpected smoke layer in the High Arctic winter stratosphere during MOSAiC 2019–2020 , Atmos. Chem. Phys., 21, 15783–15808, https://doi.org/10.5194/acp-21-15783-2021, 2021. a
Omar, A., Liu, Z., Vaughan, M., Thornhill, K., Kittaka, C., Ismail, S., Hu, Y., Chen, G., Powell, K., Winker, D., Trepte, C., Winstead, E., and Anderson, B.: Extinction-to-backscatter ratios of Saharan dust layers derived from in situ measurements and CALIPSO overflights during NAMMA, J. Geophys. Res.-Atmos., 115, D24217, https://doi.org/10.1029/2010JD014223, 2010. a, b
Omar, A. H., Winker, D. M., Vaughan, M. A., Hu, Y., Trepte, C. R., Ferrare, R. A., Lee, K.-P., Hostetler, C. A., Kittaka, C., Rogers, R. R., Kuehn, R. E., and Liu, Z.: The CALIPSO Automated Aerosol Classification and Lidar Ratio Selection Algorithm, J. Atmos. Ocean. Tech., 26, 1994–2014, https://doi.org/10.1175/2009JTECHA1231.1, 2009. a, b
Ortiz-Amezcua, P., Guerrero-Rascado, J. L., Granados-Muñoz, M. J., Benavent-Oltra, J. A., Böckmann, C., Samaras, S., Stachlewska, I. S., Janicka, Ł., Baars, H., Bohlmann, S., and Alados-Arboledas, L.: Microphysical characterization of long-range transported biomass burning particles from North America at three EARLINET stations, Atmos. Chem. Phys., 17, 5931–5946, https://doi.org/10.5194/acp-17-5931-2017, 2017. a
Ortiz-Amezcua, P., Bedoya-Velásquez, A. E., Benavent-Oltra, J. A., Pérez-Ramírez, D., Veselovskii, I., Castro-Santiago, M., Bravo-Aranda, J. A., Guedes, A., Guerrero-Rascado, J. L., and Alados-Arboledas, L.: Implementation of UV rotational Raman channel to improve aerosol retrievals from multiwavelength lidar, Opt. Express, 28, 8156–8168, https://doi.org/10.1364/OE.383441, 2020. a
Painemal, D., Clayton, M., Ferrare, R., Burton, S., Josset, D., and Vaughan, M.: Novel aerosol extinction coefficients and lidar ratios over the ocean from CALIPSO–CloudSat: evaluation and global statistics, Atmos. Meas. Tech., 12, 2201–2217, https://doi.org/10.5194/amt-12-2201-2019, 2019. a, b
Pereira, S. N., Preißler, J., Guerrero-Rascado, J. L., Silva, A. M., and Wagner, F.: Forest Fire Smoke Layers Observed in the Free Troposphere over Portugal with a Multiwavelength Raman Lidar: Optical and Microphysical Properties, Scientific World Journal, 2014, 11, https://doi.org/10.1155/2014/421838, 2014. a
Pérez-Ramírez, D., Whiteman, D. N., Veselovskii, I., Ferrare, R., Titos, G., Granados-Muñoz, M. J., Sánchez-Hernández, G., and Navas-Guzmán, F.: Spatiotemporal changes in aerosol properties by hygroscopic growth and impacts on radiative forcing and heating rates during DISCOVER-AQ 2011, Atmos. Chem. Phys., 21, 12021–12048, https://doi.org/10.5194/acp-21-12021-2021, 2021. a
PollyNET: PollyNET, https://polly.tropos.de/ (last access: 17 April 2025), 2025. a
Radenz, M., Bühl, J., Seifert, P., Baars, H., Engelmann, R., Barja González, B., Mamouri, R.-E., Zamorano, F., and Ansmann, A.: Hemispheric contrasts in ice formation in stratiform mixed-phase clouds: disentangling the role of aerosol and dynamics with ground-based remote sensing, Atmos. Chem. Phys., 21, 17969–17994, https://doi.org/10.5194/acp-21-17969-2021, 2021. a
Rajapakshe, C., Zhang, Z., Yorks, J. E., Yu, H., Tan, Q., Meyer, K., Platnick, S., and Winker, D. M.: Seasonally transported aerosol layers over southeast Atlantic are closer to underlying clouds than previously reported, Geophys. Res. Lett., 44, 5818–5825, https://doi.org/10.1002/2017GL073559, 2017. a
Saito, M. and Yang, P.: and Advanced Bulk Optical Models Linking the Backscattering and Microphysical Properties of Mineral Dust Aerosol, Geophys. Res. Lett., 48, e2021GL095121, https://doi.org/10.1029/2021GL095121, 2021. a, b
Sayer, A. M., Smirnov, A., Hsu, N. C., and Holben, B. N.: A pure marine aerosol model, for use in remote sensing applications, J. Geophys. Res.-Atmos., 117, D05213, https://doi.org/10.1029/2011JD016689, 2012. a
Sayer, A. M., Hsu, N. C., Eck, T. F., Smirnov, A., and Holben, B. N.: AERONET-based models of smoke-dominated aerosol near source regions and transported over oceans, and implications for satellite retrievals of aerosol optical depth, Atmos. Chem. Phys., 14, 11493–11523, https://doi.org/10.5194/acp-14-11493-2014, 2014. a
Schuster, G. L., Vaughan, M., MacDonnell, D., Su, W., Winker, D., Dubovik, O., Lapyonok, T., and Trepte, C.: Comparison of CALIPSO aerosol optical depth retrievals to AERONET measurements, and a climatology for the lidar ratio of dust, Atmos. Chem. Phys., 12, 7431–7452, https://doi.org/10.5194/acp-12-7431-2012, 2012. a, b
Shin, S.-K., Tesche, M., Kim, K., Kezoudi, M., Tatarov, B., Müller, D., and Noh, Y.: On the spectral depolarisation and lidar ratio of mineral dust provided in the AERONET version 3 inversion product, Atmos. Chem. Phys., 18, 12735–12746, https://doi.org/10.5194/acp-18-12735-2018, 2018. a, b
Shipley, S. T., Tracy, D. H., Eloranta, E. W., Trauger, J. T., Sroga, J. T., Roesler, F. L., and Weinman, J. A.: High spectral resolution lidar to measure optical scattering properties of atmospheric aerosols. 1: Theory and instrumentation, Appl. Optics, 22, 3716–3724, https://doi.org/10.1364/AO.22.003716, 1983. a
Sicard, M., Fortunato dos Santos Oliveira, D. C., Muñoz-Porcar, C., Gil-Díaz, C., Comerón, A., Rodríguez-Gómez, A., and Dios Otín, F.: Measurement report: Spectral and statistical analysis of aerosol hygroscopic growth from multi-wavelength lidar measurements in Barcelona, Spain, Atmos. Chem. Phys., 22, 7681–7697, https://doi.org/10.5194/acp-22-7681-2022, 2022. a
Skupin, A., Ansmann, A., Engelmann, R., Seifert, P., and Müller, T.: Four-year long-path monitoring of ambient aerosol extinction at a central European urban site: dependence on relative humidity, Atmos. Chem. Phys., 16, 1863–1876, https://doi.org/10.5194/acp-16-1863-2016, 2016. a, b
Stein, A. F., Draxler, R. R., Rolph, G. D., Stunder, B. J. B., Cohen, M. D., and Ngan, F.: NOAA's HYSPLIT Atmospheric Transport and Dispersion Modeling System, B. Am. Meteorol. Soc., 96, 2059–2077, https://doi.org/10.1175/BAMS-D-14-00110.1, 2015. a
Tesche, M., Ansmann, A., Müller, D., Althausen, D., Mattis, I., Heese, B., Freudenthaler, V., Wiegner, M., Esselborn, M., Pisani, G., and Knippertz, P.: Vertical profiling of Saharan dust with Raman lidars and airborne HSRL in southern Morocco during SAMUM, Tellus B, 61, 144–164, https://doi.org/10.1111/j.1600-0889.2008.00390.x, 2009. a, b, c
Tesche, M., Groß, S., Ansmann, A., Müller, D., Althausen, D., Freudenthaler, V., and Esselborn, M.: Profiling of Saharan dust and biomass-burning smoke with multiwavelength polarization Raman lidar at Cape Verde, Tellus B, 63, 649–676, https://doi.org/10.1111/j.1600-0889.2011.00548.x, 2011. a, b
Titos, G., Cazorla, A., Zieger, P., Andrews, E., Lyamani, H., Granados-Muñoz, M. J., Olmo, F., and Alados-Arboledas, L.: Effect of hygroscopic growth on the aerosol light-scattering coefficient: A review of measurements, techniques and error sources, Atmos. Environ., 141, 494–507, https://doi.org/10.1016/j.atmosenv.2016.07.021, 2016. a
Titos, G., Burgos, M. A., Zieger, P., Alados-Arboledas, L., Baltensperger, U., Jefferson, A., Sherman, J., Weingartner, E., Henzing, B., Luoma, K., O'Dowd, C., Wiedensohler, A., and Andrews, E.: A global study of hygroscopicity-driven light-scattering enhancement in the context of other in situ aerosol optical properties, Atmos. Chem. Phys., 21, 13031–13050, https://doi.org/10.5194/acp-21-13031-2021, 2021. a
Toledano, C., Torres, B., Velasco-Merino, C., Althausen, D., Groß, S., Wiegner, M., Weinzierl, B., Gasteiger, J., Ansmann, A., González, R., Mateos, D., Farrel, D., Müller, T., Haarig, M., and Cachorro, V. E.: Sun photometer retrievals of Saharan dust properties over Barbados during SALTRACE, Atmos. Chem. Phys., 19, 14571–14583, https://doi.org/10.5194/acp-19-14571-2019, 2019. a
Torres, B., Dubovik, O., Fuertes, D., Schuster, G., Cachorro, V. E., Lapyonok, T., Goloub, P., Blarel, L., Barreto, A., Mallet, M., Toledano, C., and Tanré, D.: Advanced characterisation of aerosol size properties from measurements of spectral optical depth using the GRASP algorithm, Atmos. Meas. Tech., 10, 3743–3781, https://doi.org/10.5194/amt-10-3743-2017, 2017. a
Vaughan, M., Garnier, A., Josset, D., Avery, M., Lee, K.-P., Liu, Z., Hunt, W., Pelon, J., Hu, Y., Burton, S., Hair, J., Tackett, J. L., Getzewich, B., Kar, J., and Rodier, S.: CALIPSO lidar calibration at 1064 nm: version 4 algorithm, Atmos. Meas. Tech., 12, 51–82, https://doi.org/10.5194/amt-12-51-2019, 2019. a
Vaughan, M. A., Powell, K. A., Winker, D. M., Hostetler, C. A., Kuehn, R. E., Hunt, W. H., Getzewich, B. J., Young, S. A., Liu, Z., and McGill, M. J.: Fully Automated Detection of Cloud and Aerosol Layers in the CALIPSO Lidar Measurements, J. Atmos. Ocean. Tech., 26, 2034–2050, https://doi.org/10.1175/2009JTECHA1228.1, 2009. a
Vaughan, M. A., Liu, Z., McGill, M. J., Hu, Y., and Obland, M. D.: On the spectral dependence of backscatter from cirrus clouds: Assessing CALIOP's 1064 nm calibration assumptions using cloud physics lidar measurements, J. Geophys. Res.-Atmos., 115, D14206, https://doi.org/10.1029/2009JD013086, 2010. a, b, c
Veselovskii, I., Whiteman, D. N., Korenskiy, M., Suvorina, A., and Pérez-Ramírez, D.: Use of rotational Raman measurements in multiwavelength aerosol lidar for evaluation of particle backscattering and extinction, Atmos. Meas. Tech., 8, 4111–4122, https://doi.org/10.5194/amt-8-4111-2015, 2015. a, b, c, d
Veselovskii, I., Hu, Q., Goloub, P., Podvin, T., Korenskiy, M., Derimian, Y., Legrand, M., and Castellanos, P.: Variability in lidar-derived particle properties over West Africa due to changes in absorption: towards an understanding, Atmos. Chem. Phys., 20, 6563–6581, https://doi.org/10.5194/acp-20-6563-2020, 2020. a, b
Veselovskii, I., Hu, Q., Goloub, P., Podvin, T., Barchunov, B., and Korenskii, M.: Combining Mie–Raman and fluorescence observations: a step forward in aerosol classification with lidar technology, Atmos. Meas. Tech., 15, 4881–4900, https://doi.org/10.5194/amt-15-4881-2022, 2022. a
Voudouri, K. A., Giannakaki, E., Komppula, M., and Balis, D.: Variability in cirrus cloud properties using a PollyXT Raman lidar over high and tropical latitudes, Atmos. Chem. Phys., 20, 4427–4444, https://doi.org/10.5194/acp-20-4427-2020, 2020. a
Wandinger, U., Floutsi, A. A., Baars, H., Haarig, M., Ansmann, A., Hünerbein, A., Docter, N., Donovan, D., van Zadelhoff, G.-J., Mason, S., and Cole, J.: HETEAC – the Hybrid End-To-End Aerosol Classification model for EarthCARE, Atmos. Meas. Tech., 16, 2485–2510, https://doi.org/10.5194/amt-16-2485-2023, 2023. a
Wang, A., Yin, Z., Mao, S., Wang, L., Yi, Y., Chen, Q., Müller, D., and Wang, X.: Measurements of particle extinction coefficients at 1064 nm with lidar: temperature dependence of rotational Raman channels, Opt. Express, 32, 4650–4667, https://doi.org/10.1364/OE.514608, 2024a. a, b
Wang, L., Yin, Z., Lu, T., Yi, Y., Dong, X., Dai, Y., Bu, Z., Chen, Y., and Wang, X.: 1064 nm rotational Raman polarization lidar for profiling aerosol and cloud characteristics, Opt. Express, 32, 14963–14977, https://doi.org/10.1364/OE.518259, 2024b. a, b, c
Whiteman, D. N.: Examination of the traditional Raman lidar technique. I. Evaluating the temperature-dependent lidar equations, Appl. Optics, 42, 2571–2592, https://doi.org/10.1364/AO.42.002571, 2003a. a
Whiteman, D. N.: Examination of the traditional Raman lidar technique. II. Evaluating the ratios for water vapor and aerosols, Appl. Optics, 42, 2593–2608, https://doi.org/10.1364/AO.42.002593, 2003b. a
Wiegner, M., Mattis, I., Pattantyús-Ábrahám, M., Bravo-Aranda, J. A., Poltera, Y., Haefele, A., Hervo, M., Görsdorf, U., Leinweber, R., Gasteiger, J., Haeffelin, M., Wagner, F., Cermak, J., Komínková, K., Brettle, M., Münkel, C., and Pönitz, K.: Aerosol backscatter profiles from ceilometers: validation of water vapor correction in the framework of CeiLinEx2015, Atmos. Meas. Tech., 12, 471–490, https://doi.org/10.5194/amt-12-471-2019, 2019. a
Yorks, J. E., McGill, M. J., Palm, S. P., Hlavka, D. L., Selmer, P. A., Nowottnick, E. P., Vaughan, M. A., Rodier, S. D., and Hart, W. D.: An overview of the CATS level 1 processing algorithms and data products, Geophys. Res. Lett., 43, 4632–4639, https://doi.org/10.1002/2016GL068006, 2016. a
Zhang, Y., Saito, M., Yang, P., Schuster, G., and Trepte, C.: Sensitivities of Spectral Optical Properties of Dust Aerosols to Their Mineralogical and Microphysical Properties, J. Geophys. Res.-Atmos., 129, e2023JD040181, https://doi.org/10.1029/2023JD040181, 2024. a
Zhao, G., Zhao, C., Kuang, Y., Tao, J., Tan, W., Bian, Y., Li, J., and Li, C.: Impact of aerosol hygroscopic growth on retrieving aerosol extinction coefficient profiles from elastic-backscatter lidar signals, Atmos. Chem. Phys., 17, 12133–12143, https://doi.org/10.5194/acp-17-12133-2017, 2017. a, b, c
Zieger, P., Fierz-Schmidhauser, R., Weingartner, E., and Baltensperger, U.: Effects of relative humidity on aerosol light scattering: results from different European sites, Atmos. Chem. Phys., 13, 10609–10631, https://doi.org/10.5194/acp-13-10609-2013, 2013. a
Zubko, E., Muinonen, K., Muñoz, O., Nousiainen, T., Shkuratov, Y., Sun, W., and Videen, G.: Light scattering by feldspar particles: Comparison of model agglomerate debris particles with laboratory samples, J. Quant. Spectrosc. Ra., 131, 175–187, https://doi.org/10.1016/j.jqsrt.2013.01.017, 2013. a
- Abstract
- Introduction
- Rotational Raman measurements at 1064 nm
- Measurements for marine and continental aerosol
- Discussion of the spectral slope of the lidar ratio
- Conclusions
- Appendix A: Corrections and limitations of the rotational Raman lidar method at 1064 nm
- Data availability
- Author contributions
- Competing interests
- Disclaimer
- Acknowledgements
- Financial support
- Review statement
- References