the Creative Commons Attribution 4.0 License.
the Creative Commons Attribution 4.0 License.
 | 21 Jul 2025
Physical processes influencing the Asian climate due to black carbon emission over East Asia and South Asia
Feifei Luo
Bjørn H. Samset
Camilla W. Stjern
Manoj Joshi
Laura J. Wilcox
Robert J. Allen
Wei Hua
Shuanglin Li
Many studies have shown that black carbon (BC) aerosols over Asia have significant impacts on regional climate but with large diversities in the intensity, spatial distribution, and physical mechanism of regional responses. In this study, we utilized a set of systematic regional aerosol perturbations (SyRAPs) using a reduced-complexity climate model, FORTE2 (Fast Ocean Rapid Troposphere Experiment version 2), to investigate responses of the Asian climate to BC aerosols over East Asia only, South Asia only, and both regions at once and to thoroughly examine related physical processes. Results show that regional BC aerosols lead to strong surface cooling, air temperature warming in the low-level troposphere, and drying over the perturbed areas, with seasonal differences in magnitude and spatial distribution. Atmospheric energy budget analysis suggests that reductions in local precipitation primarily depend on the substantial local atmospheric heating due to shortwave absorption by BC. Increases in dry-static-energy (DSE) flux divergence partly offset the reduced precipitation over North China in summer and most of China and India in the other three seasons. Decreases in DSE flux divergence lead to a stronger reduction in precipitation over South China and central India in summer. Changes in DSE flux divergence are mainly due to vertical motions driven by diabatic heating in the middle and lower troposphere. BC perturbations also exert non-local climate impacts through the changes in DSE flux divergence. This study provides a full chain of physical processes of the local climate responses to the Asian BC increases and gives some insights to better understand the uncertainties in model responses.
- Article
(13611 KB) - Full-text XML
-
Supplement
(2831 KB) - BibTeX
- EndNote


Black carbon (BC) aerosol, a short-lived pollutant and climate forcer, is emitted from the incomplete combustion of biomass and fossil fuels and exerts significant effects on global and regional climate (Ramanathan and Carmichael, 2008; Bond et al., 2013; Stjern et al., 2017; IPCC, 2021; Li et al., 2022). Alongside the rapid economic developments of China and India over the past few decades, East Asia and South Asia have become the highest-BC-emissions hotspots in the world. Despite BC emissions from China decreasing substantially in the past decade, East Asia and South Asia are expected to remain the sites of the highest BC loadings globally in the coming decades (Lund et al., 2019). Hence, the climate impacts of BC emissions from East Asia and South Asia have been extensively investigated (e.g., Li et al., 2016; Lou et al., 2019a; Xie et al., 2020; Westervelt et al., 2020; Herbert et al., 2022; Yang et al., 2022). Although many model studies have shown that Asian BC aerosols are of great importance for local climate (especially the Asian monsoonal systems), considerable uncertainty exists regarding the intensity and spatial distribution of the Asian climate responses to BC forcings, as well as regarding the related physical mechanisms.
Menon et al. (2002) found that during summer, a large BC forcing induced a “southern flooding and northern drought” precipitation pattern in China based on a global climate model (GCM). In contrast, some subsequent modeling studies have found that BC forcing acted to suppress precipitation in South China and East China while strengthening it in the north (Gu et al., 2006; Zhang et al., 2009; Liu et al., 2018). Additionally, some studies have suggested that BC aerosols cause a tripolar precipitation pattern with wetting–drying–wetting from North China to South China (Mahmood and Li, 2014; Xie et al., 2020) or that there is no statistically significant response in precipitation over East China (Jiang et al., 2013; Guo et al., 2013; Wang et al., 2017).
Regional precipitation responses to BC aerosols can be attributed to both surface cooling induced by aerosol–radiation interaction (ARI) and atmospheric heating by aerosol absorption (Stier et al., 2024). However, the relative importance of the two effects is debated. Persad et al. (2017) have shown that surface cooling dominates the reduction in the East Asian summer precipitation due to the decreased land–sea thermal contrast, whilst atmospheric heating partially offsets the reduction. Xie et al. (2020) have proposed that the precipitation responses mainly result from the upper-level atmospheric heating over Asia, which enhances the upper-level meridional land–sea thermal gradient and subsequently strengthens the low-level monsoon circulation.
Similarly, the South Asian summer monsoon (SASM) exhibits inconsistent responses to BC forcings. Some model studies have suggested that increased BC aerosols can lead to a weakened SASM (Lau and Kim, 2007; Meehl et al., 2008), while others have found that there should be a strengthened SASM via increasing the atmospheric meridional land–sea thermal gradient or an elevated heat pump effect (Lau et al., 2006; Xie et al., 2020; Westervelt et al., 2020). Westervelt et al. (2018) conducted aerosol removal experiments using three coupled GCMs (CGCMs) and found that Indian BC decreases led to no change or a small decrease in precipitation in India.
In addition, Jiang et al. (2017) found that BC forcing can lead to an intensification of the East Asian winter monsoon (EAWM) northern mode via heating the Tibetan Plateau using the Community Atmosphere Model version 5 (CAM5). On the contrary, Lou et al. (2019b) have suggested that BC emitted from the North China can weaken the EAWM through ocean, sea ice, and cloud feedbacks based on the Community Earth System Model (CESM). BC aerosol can also affect spring and autumn precipitation in China (Guo et al., 2013; Hu and Liu, 2014; Deng et al., 2014).
By comparing the sum of Asian climate responses to individual responses over East Asia and South Asia with the responses to simultaneous forcing, the regional linearity of BC forcing has been investigated, but the results remain unclear. Chen et al. (2020) and Herbert et al. (2022) suggested that the responses are highly nonlinear due to interactions of atmospheric circulation changes, based on a regional climate model and an atmospheric general circulation model (AGCM), respectively. In contrast, Recchia and Lucarini (2023) and Stjern et al. (2024) found that the responses were almost linear in most Asian regions. The difference may be related to the different spatial extents of the aerosol perturbation in the simulation design (Stjern et al., 2024).
These inconsistent results and the large uncertainty in the simulated response of the Asian climate to BC changes are partly related to differences in the modeling approach (e.g., AGCMs versus CGCMs/Earth system models (ESMs)) and also the magnitude and location of the BC perturbation. Atmosphere-only GCMs lack sea surface temperature (SST) feedbacks, which are crucial in influencing the Asian monsoon (Dong et al., 2019), while CGCMs or ESMs involving more and more complex physical processes make it difficult to identify the key physical processes behind impacts of regional BC aerosols on Asian climate. The inconsistency may also be associated with model-specific differences. Different models that include different physical processes, combined with different experiment designs that can influence the atmospheric circulation response, make it challenging to understand the causes of differences between studies.
Hence, reduced-complexity models, such as FORTE2 (Fast Ocean Rapid Troposphere Experiment version 2), provide an alternative and useful tool for such studies, given that such models not only include all the main mechanisms of aerosol–climate interactions, but also allow fast speeds of integration and longer simulations with lower cost. Stjern et al. (2024) have utilized FORTE2 to perform a series of systematic regional aerosol perturbation (SyRAP) simulations, employing regionally realistic aerosol forcing for the period 2003–2021 from the Copernicus Atmosphere Monitoring Service (CAMS) reanalysis (Inness et al., 2019). The core simulations include (1) baseline simulations forced by greenhouse gas (GHG) concentrations in different climate states (i.e., pre-industrial, present-day, and future CO2 levels) and no aerosol; (2) perturbation simulations forced by added absorbing aerosols (BC and organic carbon, OC) or scattering aerosols (sulfate, SO4) over East Asia only, South Asia only, and both regions simultaneously with only ARI effects and GHG concentrations in different climate states; and (3) aerosol–cloud interaction (ACI) simulations forced by added SO4 in the combined region of East Asia and South Asia in which ACIs were turned on. The SyRAP–FORTE2 framework enables comprehensive analysis of climate effects of different regional aerosol perturbations and aerosol species, as well as of ARI versus ACI, and allows comparison of their relative importance and interactions (Stjern et al., 2024).
In this study, considering that BC aerosols mostly impact climate through ARI, we aim to address the following two questions focused on BC ARI effects based on the simulations of the regional BC perturbations in SyRAP–FORTE2: (1) what are the responses of Asian climate to East Asian BC perturbations, South Asian BC perturbations, or both regions simultaneously? (2) What are the key physical processes involved in these responses?
The rest of the paper is organized as follows. Section 2 describes the FORTE2 model, SyRAP simulations, and analysis methods and datasets; Sect. 3 briefly evaluates the climatology of SyRAP simulations, examines responses to the regional BC perturbations in SyRAP–FORTE2, and investigates the underlying physical processes; Sect. 4 compares the results of the atmospheric energy budget in SyRAP–FORTE2 with those in the Precipitation Driver Response Model Intercomparison Project (PDRMIP) models; and finally, a summary and discussion are provided in Sect. 5.
2.1 The FORTE2 model
FORTE2 is an intermediate-complexity coupled atmosphere–ocean general circulation model (Blaker et al., 2021). The atmospheric component is the Intermediate General Circulation Model 4 (IGCM4) with a horizontal resolution of approximately 2.8° (T42) and 35σ levels extending up to 0.1 hPa (Joshi et al., 2015). IGCM4 includes schemes for radiation, land-surface properties, convection, precipitation, and clouds (Zhong and Haigh, 1995; Betts and Miller, 1993). The oceanic component is the Modular Ocean Model Array (MOMA) with horizontal grid spacing 2° × 2° and 15 z-layer levels increasing in thickness with depth from 30 m at the surface to 800 m at the bottom (Webb, 1996). Sea ice is represented by a barrier to heat fluxes between the ocean and atmosphere components. FORTE2 runs without flux adjustments (Blaker et al., 2021). Blaker et al. (2021) have thoroughly evaluated FORTE2's skill in simulating the atmosphere, ocean, and major climatic modes, suggesting that FORTE2 can satisfactorily simulate a climate state and climate variability.
2.2 Regional BC perturbation simulations in SyRAP–FORTE2
SyRAP–FORTE2 used the global gridded monthly aerosol optical depths (AODs) and vertical distributions from the CAMS reanalysis (CAMSRA) for 2003–2021 (Inness et al., 2019) rather than the aerosol gas emissions/concentrations employed by most CMIP6 models. CAMSRA incorporates anthropogenic BC emissions from the MACCity inventory (Granier et al., 2011) for 2003–2010, transitioning to Representative Concentration Pathway 8.5 emissions (Riahi et al., 2011) post-2010. The simulations were idealized with monthly AOD climatologies prescribed as repeating annual cycles. The regional annual mean BC AOD perturbation is about 0.015 for East China and about 0.01 for India (Fig. S1 in the Supplement). Aerosols were distributed vertically uniformly from the second-lowest model layer (σ or = 0.88, approximately 950 m above the surface) up to a pressure level pmin. For each grid box, pmin was derived from CAMSRA as either 850 hPa or the lowest pressure level where the 2003–2021 mean mixing ratio falls below 5 × 10⁹ kg kg−1, whichever value is lower. In topographic regions, additional constraints require σmin < 0.75 and pmin > 300 hPa. The seasonal changes in the regional mean pmin over China and India are illustrated in Fig. S2. Aerosols are not transported in FORTE2. The application of aerosol distributions from a reanalysis means that the simulations include a realistic aerosol spatial distribution, but the lack of aerosol transport means that there are no feedbacks between the climate response and the aerosol distribution (e.g., increased precipitation leading to increased aerosol removal). For more details on aerosol implementation in FORTE2, see Stjern et al. (2024).
There is no significant difference in Asian climate responses to BC aerosols between the pre-industrial and present-day climate conditions in the SyRAP–FORTE2 simulations (Stjern et al., 2024). Hence, in this study the baseline simulation (piC) and the BC perturbation simulations of three different regions in the pre-industrial climate conditions (280 ppmv) were performed to explore potential physical processes of Asian BC aerosols influencing the local climate (Table 1). Given that BC primarily influences climate through the direct scattering and absorption of radiation (Bond et al., 2013), only climate impacts due to ARI (including the semi-direct effect of BC) were considered here. All simulations were run for 200 years, with years 51–200 used for analysis.
Table 1Summary of SyRAP–FORTE2 simulations used in the study.
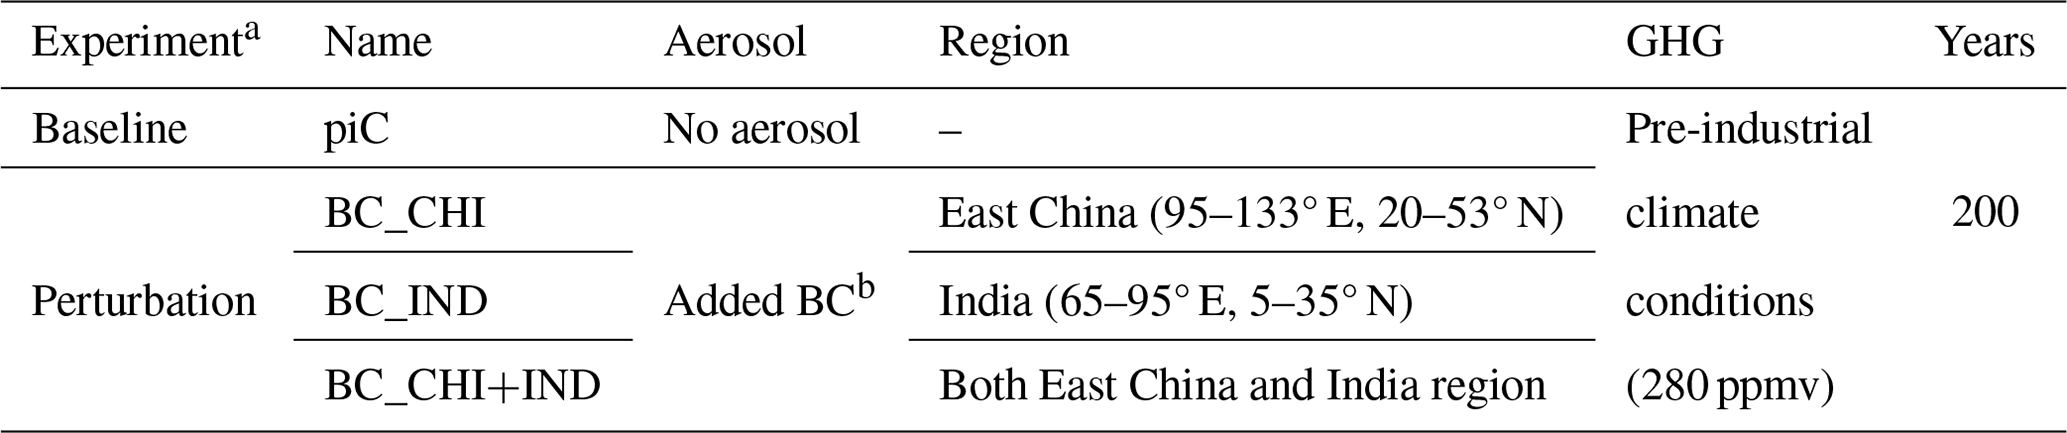
a Only the ARI effect is considered. b CAMSRA monthly climatology of BC AOD for 2003–2021.
2.3 Analysis methods and datasets
The response to a particular regional forcing is estimated by the mean difference between the perturbation simulation and the baseline simulation. Statistical significance of the response is assessed using a two-tailed Student's t test.
The atmospheric energy budget is applied to understand the precipitation responses (Muller and O'Gorman, 2011; Richardson et al., 2016; Liu et al., 2018). The energy associated with precipitation can be separated into a thermodynamic component with only changes in diabatic cooling (Q) and a dynamic component with only changes in dry-static-energy (DSE) flux divergence (H), as shown in Eq. (1):
where Lc is the latent heat of condensation, P is precipitation, and δ denotes a perturbation.
Then,
where LWC is atmospheric longwave cooling, SWA is atmospheric shortwave absorption, and SH is sensible heat flux from the surface.
δH is calculated as a residual between LcδP and δQ. Furthermore, H can be seen as the sum of the changes in mean (Hm) and eddy (Htrans) components. δHm can be decomposed into four components associated with dynamic and thermodynamic effects on vertical and horizontal advection of DSE, as shown in Eq. (3):
where ω is vertical velocity, s is DSE, p is pressure, g is the gravitational acceleration, u is the horizontal wind vector, ∇ is the horizontal gradient, and an overbar indicates climatological monthly means. Therefore, HDyn_v is related to changes in vertical velocity, HThermo_v is related to changes in vertical DSE gradients, HDyn_h is related to changes in horizontal winds, and HThermo_h is related to changes in horizontal DSE gradients. δHtrans is calculated as a residual between δH and δHm.
Monthly precipitation, surface temperature (Ts), and horizontal wind components were used from the NOAA-CIRES-DOE 20th Century Reanalysis V3 (20CR) on a 2° × 2° grid spanning 1806 to 2015 (Compo et al., 2011) to evaluate the skill of FORTE2 in simulating observed climate variables. The 20CR data are only based on surface observations of the synoptic pressure of NOAA's Physical Sciences Laboratory. Monthly sea level pressure (SLP) data were from the Hadley Centre (HadSLP) at a horizontal resolution of 5° × 5° (Allan and Ansell, 2006).
To compare the response of FORTE2 to BC perturbations with those of CMIP class models, we used the perturbation simulations of PDRMIP at 10 times the modern Asian BC concentrations/emissions and their corresponding baseline simulations with modern aerosol concentrations/emissions and greenhouse gases under year-2000 conditions from five GCMs (CESM1-CAM5, GISS-E2-R, HadGEM3, MIROC, and NorESM1; Table S1 in the Supplement). More details of the PDRMIP design can be found in Myhre et al. (2017), and an overview of the Asian monsoon response is given in Liu et al. (2018).
3.1 Evaluation of baseline climate in SyRAP–FORTE2
Blaker et al. (2021) present a detailed overview of the FORTE2 climatology. The model simulates the Asian climate well, and the more focused evaluation presented by Stjern et al. (2024) demonstrates that FORTE2 is an appropriate tool to study the effects of local aerosol perturbations on Asian climate. Here, for completeness, we assess an overview of the skill of FORTE2 in simulating the Asian climate. The seasonal evolutions of precipitation and surface temperature (Ts) in East China and India and the climatology of lower-tropospheric circulation (SLP and 850 hPa horizontal wind) in the baseline experiment (piC) are compared with those in the reanalyses from 1851 to 1896. FORTE2 reproduces the seasonality of precipitation in East China reasonably well but slightly overestimates the averaged magnitude by about 1 mm d−1 in summer (Fig. 1a). However, the model underestimates the magnitude of South Asian summer monsoon precipitation by approximately 4 mm d−1 during June–September relative to 20CR. Dry biases in Indian summer precipitation of similar magnitudes are found in many CMIP5 and CMIP6 models (Sperber et al., 2013; Wilcox et al., 2020; Liu et al., 2024). Differences between reanalyses and observational datasets can also have similar magnitudes (Wilcox et al., 2020). Hence, we conclude that the FORTE2 representation of monsoon precipitation is suitable for our study. The model performs fairly well in terms of the seasonality of temperature and the magnitudes in both regions (Fig. 1b).
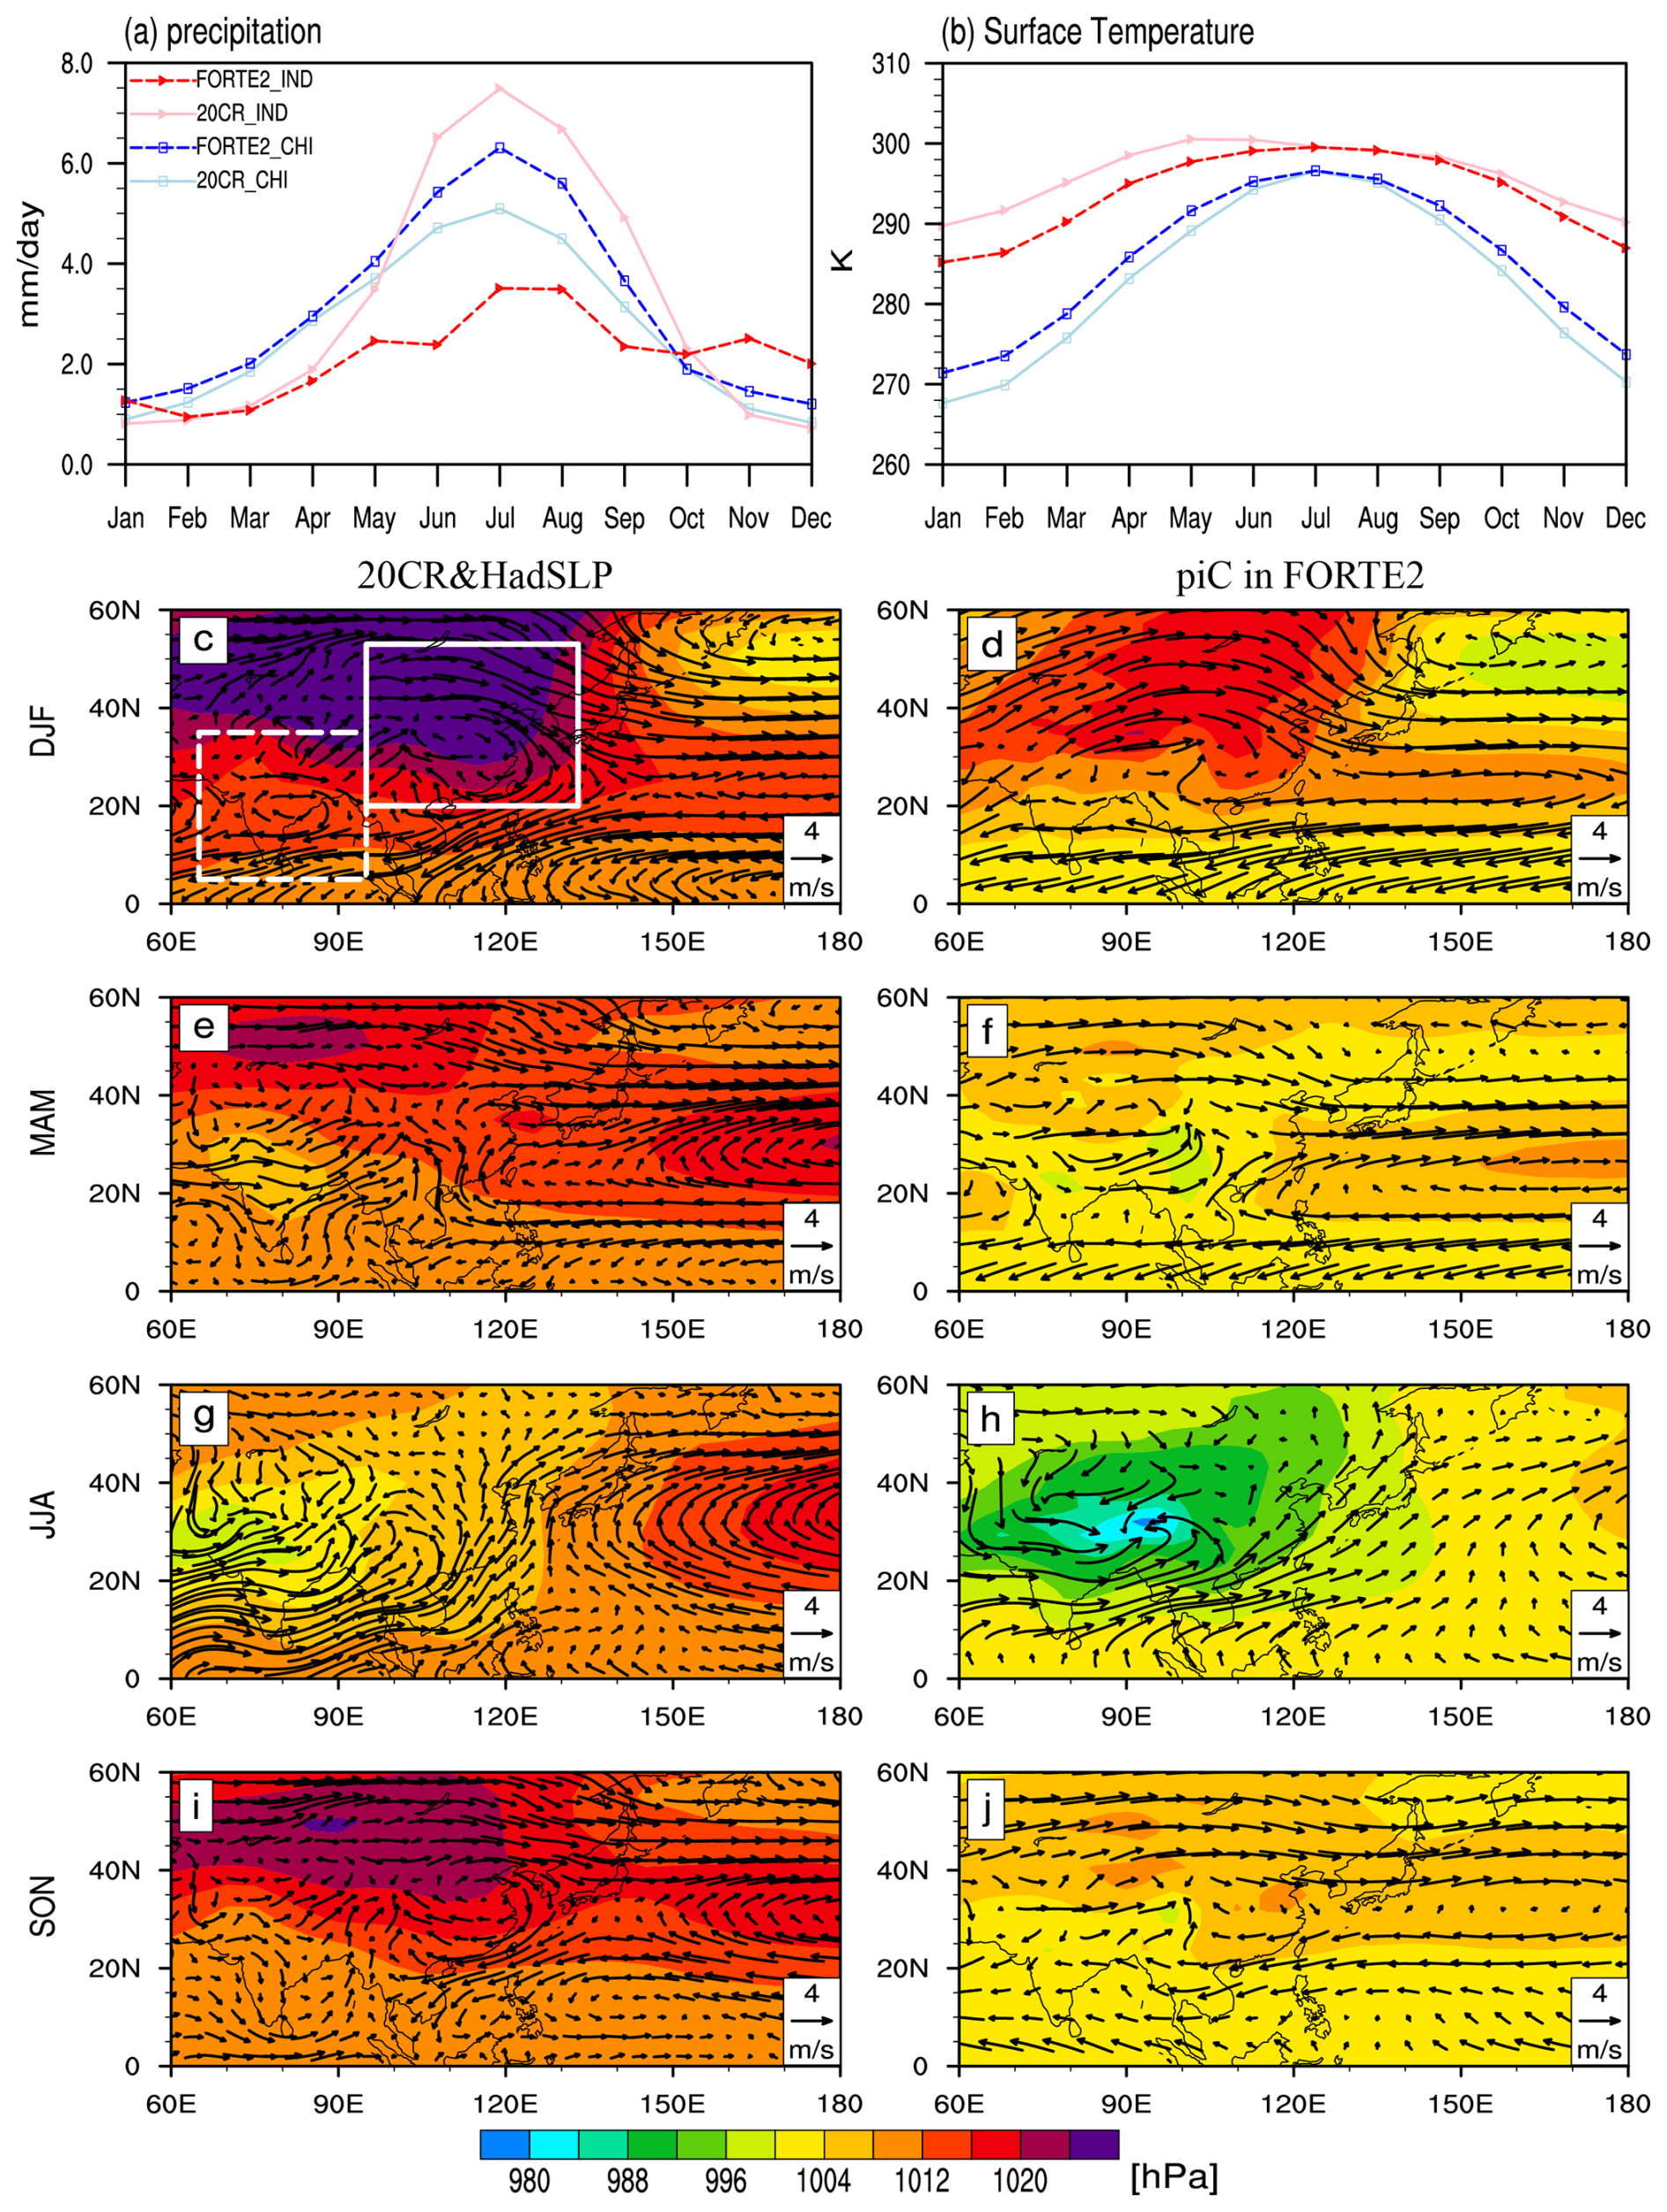
Figure 1(a) Seasonal evolutions of the regional mean precipitation (unit: mm d−1) of 20CR (solid lines) and the baseline simulation of FORTE2 (dashed lines) for East Asia (95–133° E, 20–53° N; the solid white box in panel c) (light-blue and blue lines), and India (65–95° E, 5–35° N; the dashed white box in panel c) (pink and red lines). (b) The same as panel (a) but for surface temperature (unit: K). (c–j) The climate state of SLP (unit: hPa) and 850 hPa horizontal winds (unit: m s−1) in (left) 20CR and HadSLP and (right) the baseline simulation of FORTE2 in four seasons.
The simulated SLPs are generally lower than those in HadSLP in all four seasons, especially for the Siberian High in winter and the western North Pacific Subtropical High (WPSH) and the Indian Low in summer (Fig. 1c–j). Compared to the reanalyses, the simulated Indian Low is overly strong, and its eastern fringe and the westerlies from the Indian Ocean extend too far east into the western North Pacific; so does the Indian summer monsoon trough (Fig. 1g and h). This corresponds to the model dry bias over the Indian subcontinent (Figs. 1a and S3e–f). Meanwhile, the WPSH is too weak to expand sufficiently far west, corresponding to the very weak easterlies along the southern fringe of the WPSH, which leads to less rainfall over the Philippines (Fig. S3e–f) and underestimates the effects of the WPSH on the East Asian summer monsoon (Fig. 1g–h). Despite these deficiencies, the model captures the essential features of lower-tropospheric circulation, precipitation, and temperature over Asia and is consistent with the results of Stjern et al. (2024).
3.2 Temperature and precipitation responses
Figure 2 shows spatial patterns of Ts responses to increased Asian BC aerosols in four seasons. First, there is substantial land cooling over the perturbed regions in all four seasons but with distinct seasonal differences in distributions and values. Under BC_CHI, cooling is observed in most of China in winter and spring (Fig. 2a–b), with area-averaged values of −0.9 ± 1.2 K (mean value ± 1 standard deviation) and −1.1 ± 0.9 K, respectively (Fig. 3a). The large standard deviations indicate the large spread of distributions of responses (Fig. S4). There is slight warming of sea surface temperatures near China in spring. In summer and autumn, cooling is seen mainly in the region to the north of the Yangtze River valley, especially in North China, while there is weak warming to the south (Fig. 2c–d). The area-averaged values are therefore relatively small compared to those in winter and spring, with values of approximately −0.7 ± 0.7 K for summer and autumn (Fig. 3a).
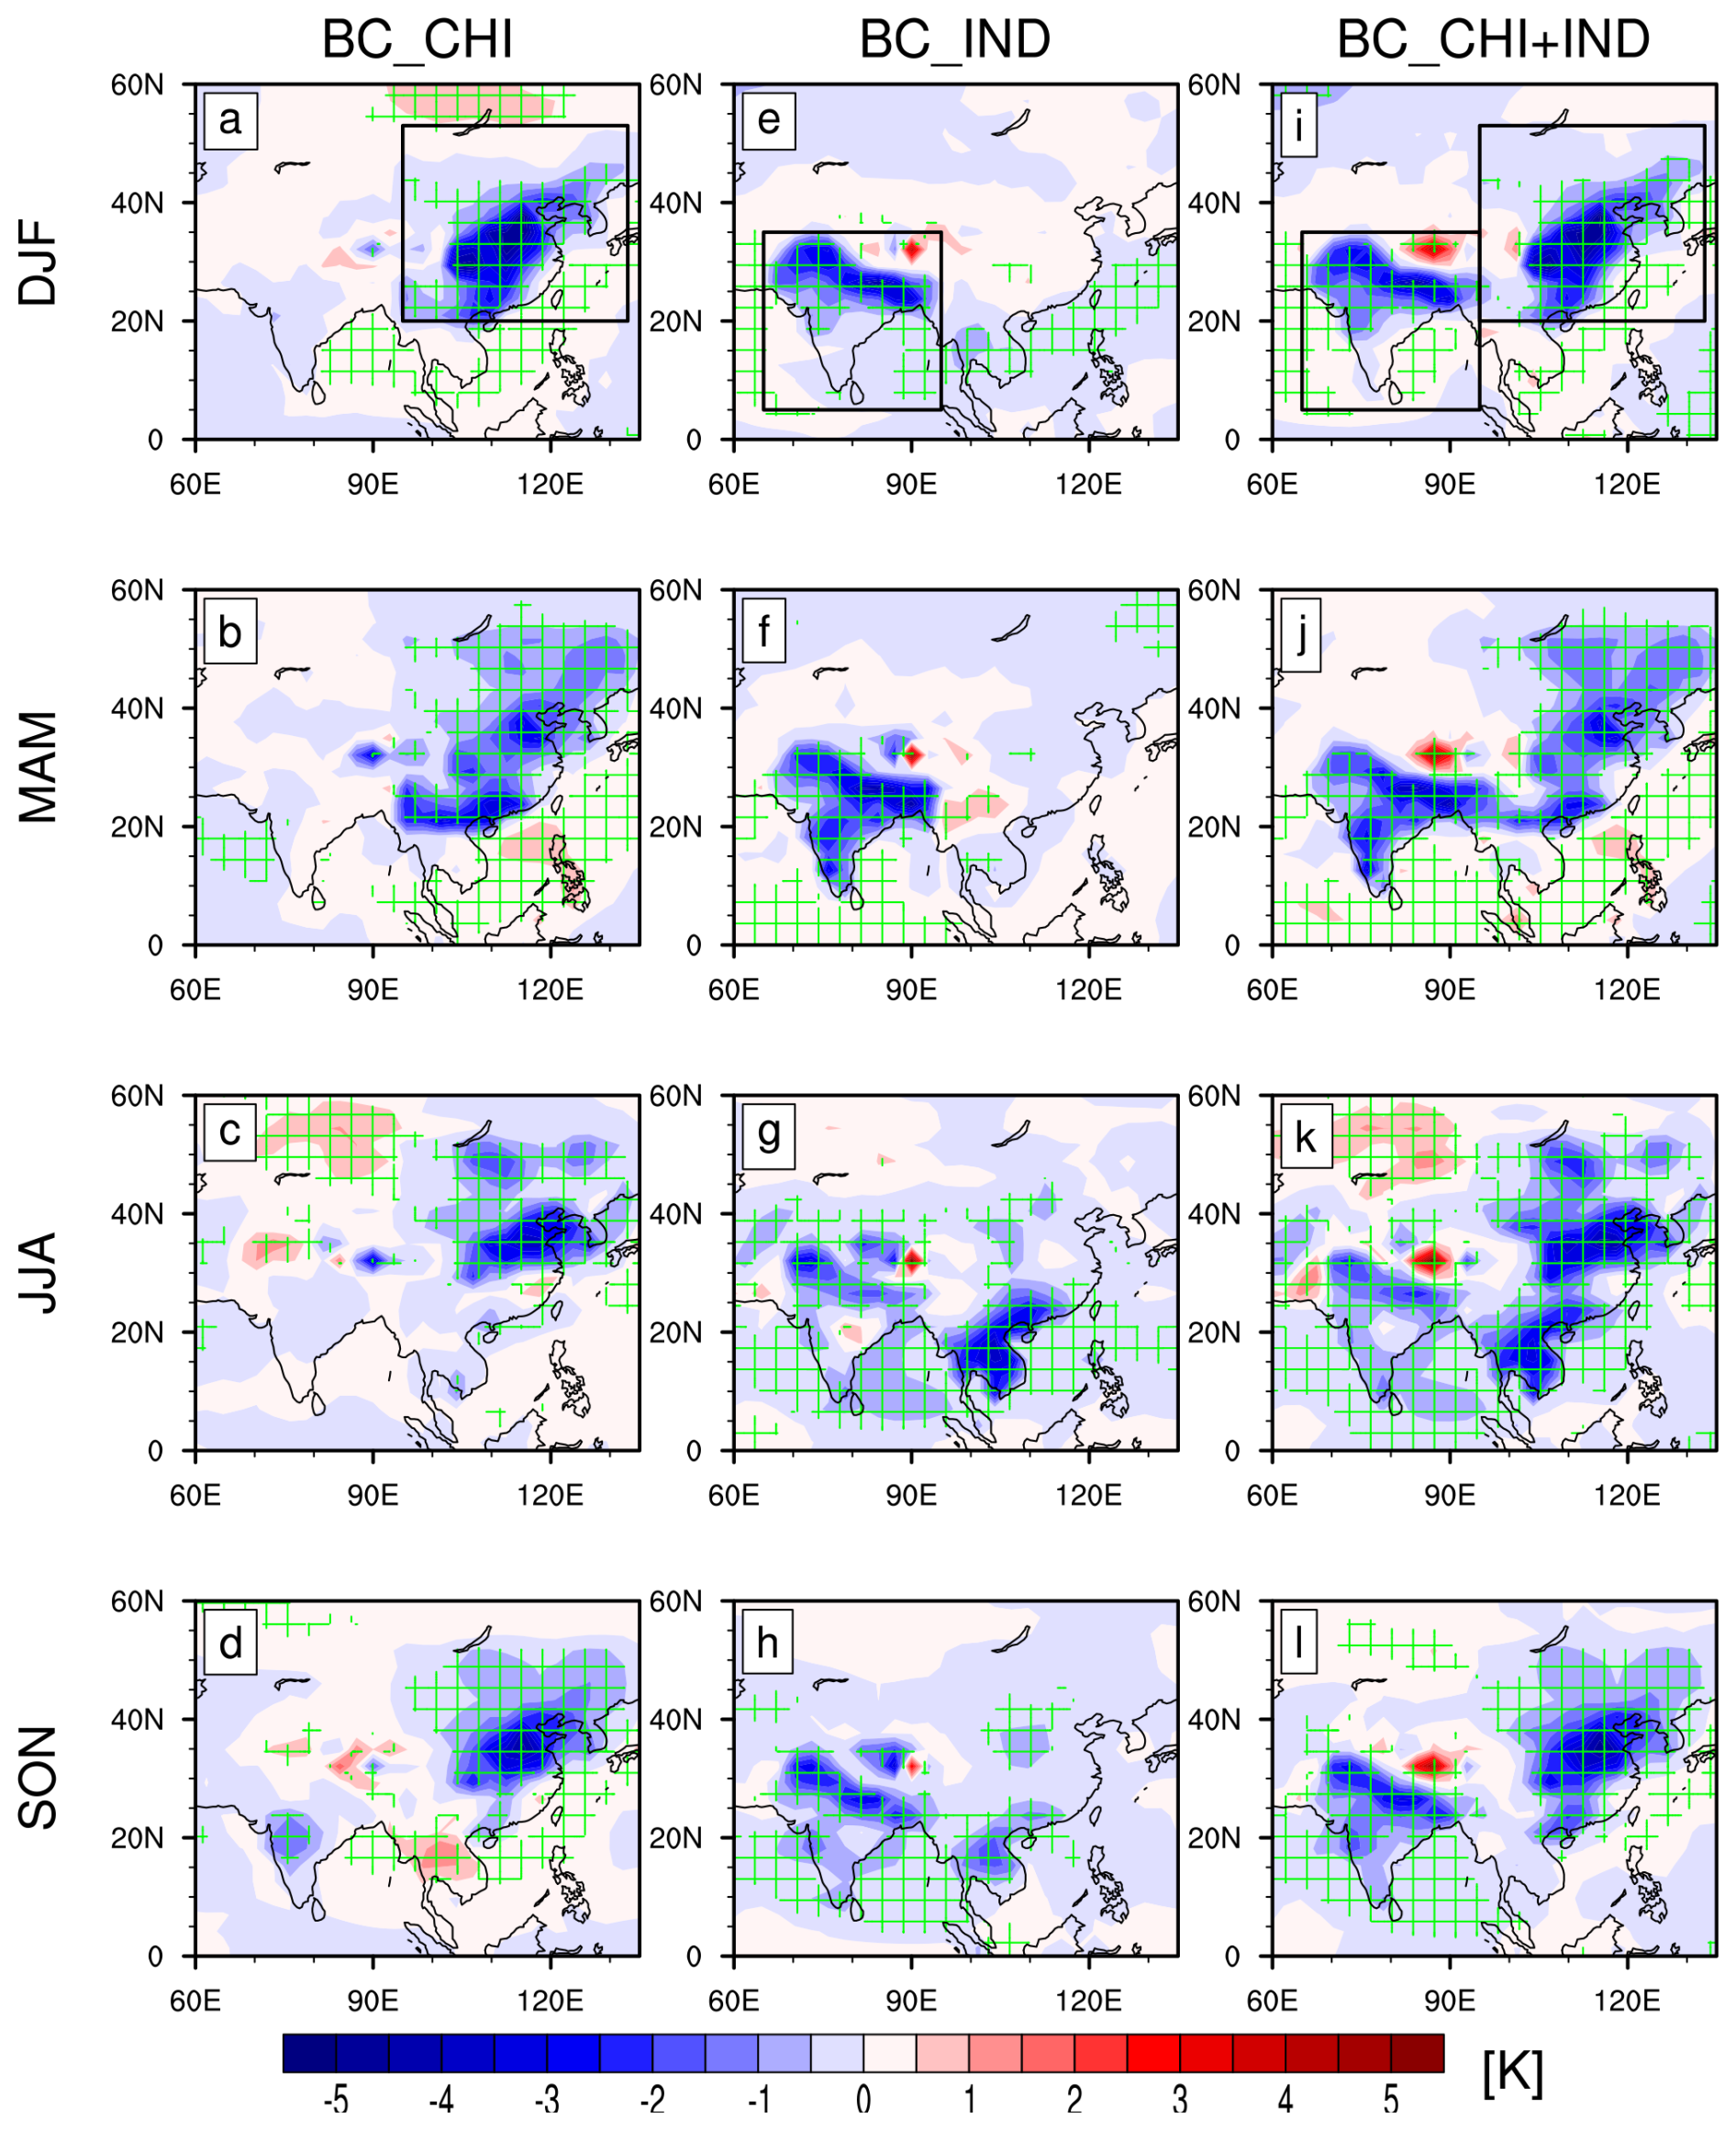
Figure 2Spatial patterns of Ts responses in (a–d) BC_CHI, (e–h) BC_IND, and (i–l) BC_CHI+IND for four seasons. The green grid lines indicate the regions where the responses are statistically significant above a 95 % level based on a two-tailed Student's t test. The black boxes in panels (a), (e), and (i) highlight the regions where BC aerosols are perturbed. Unit: K.
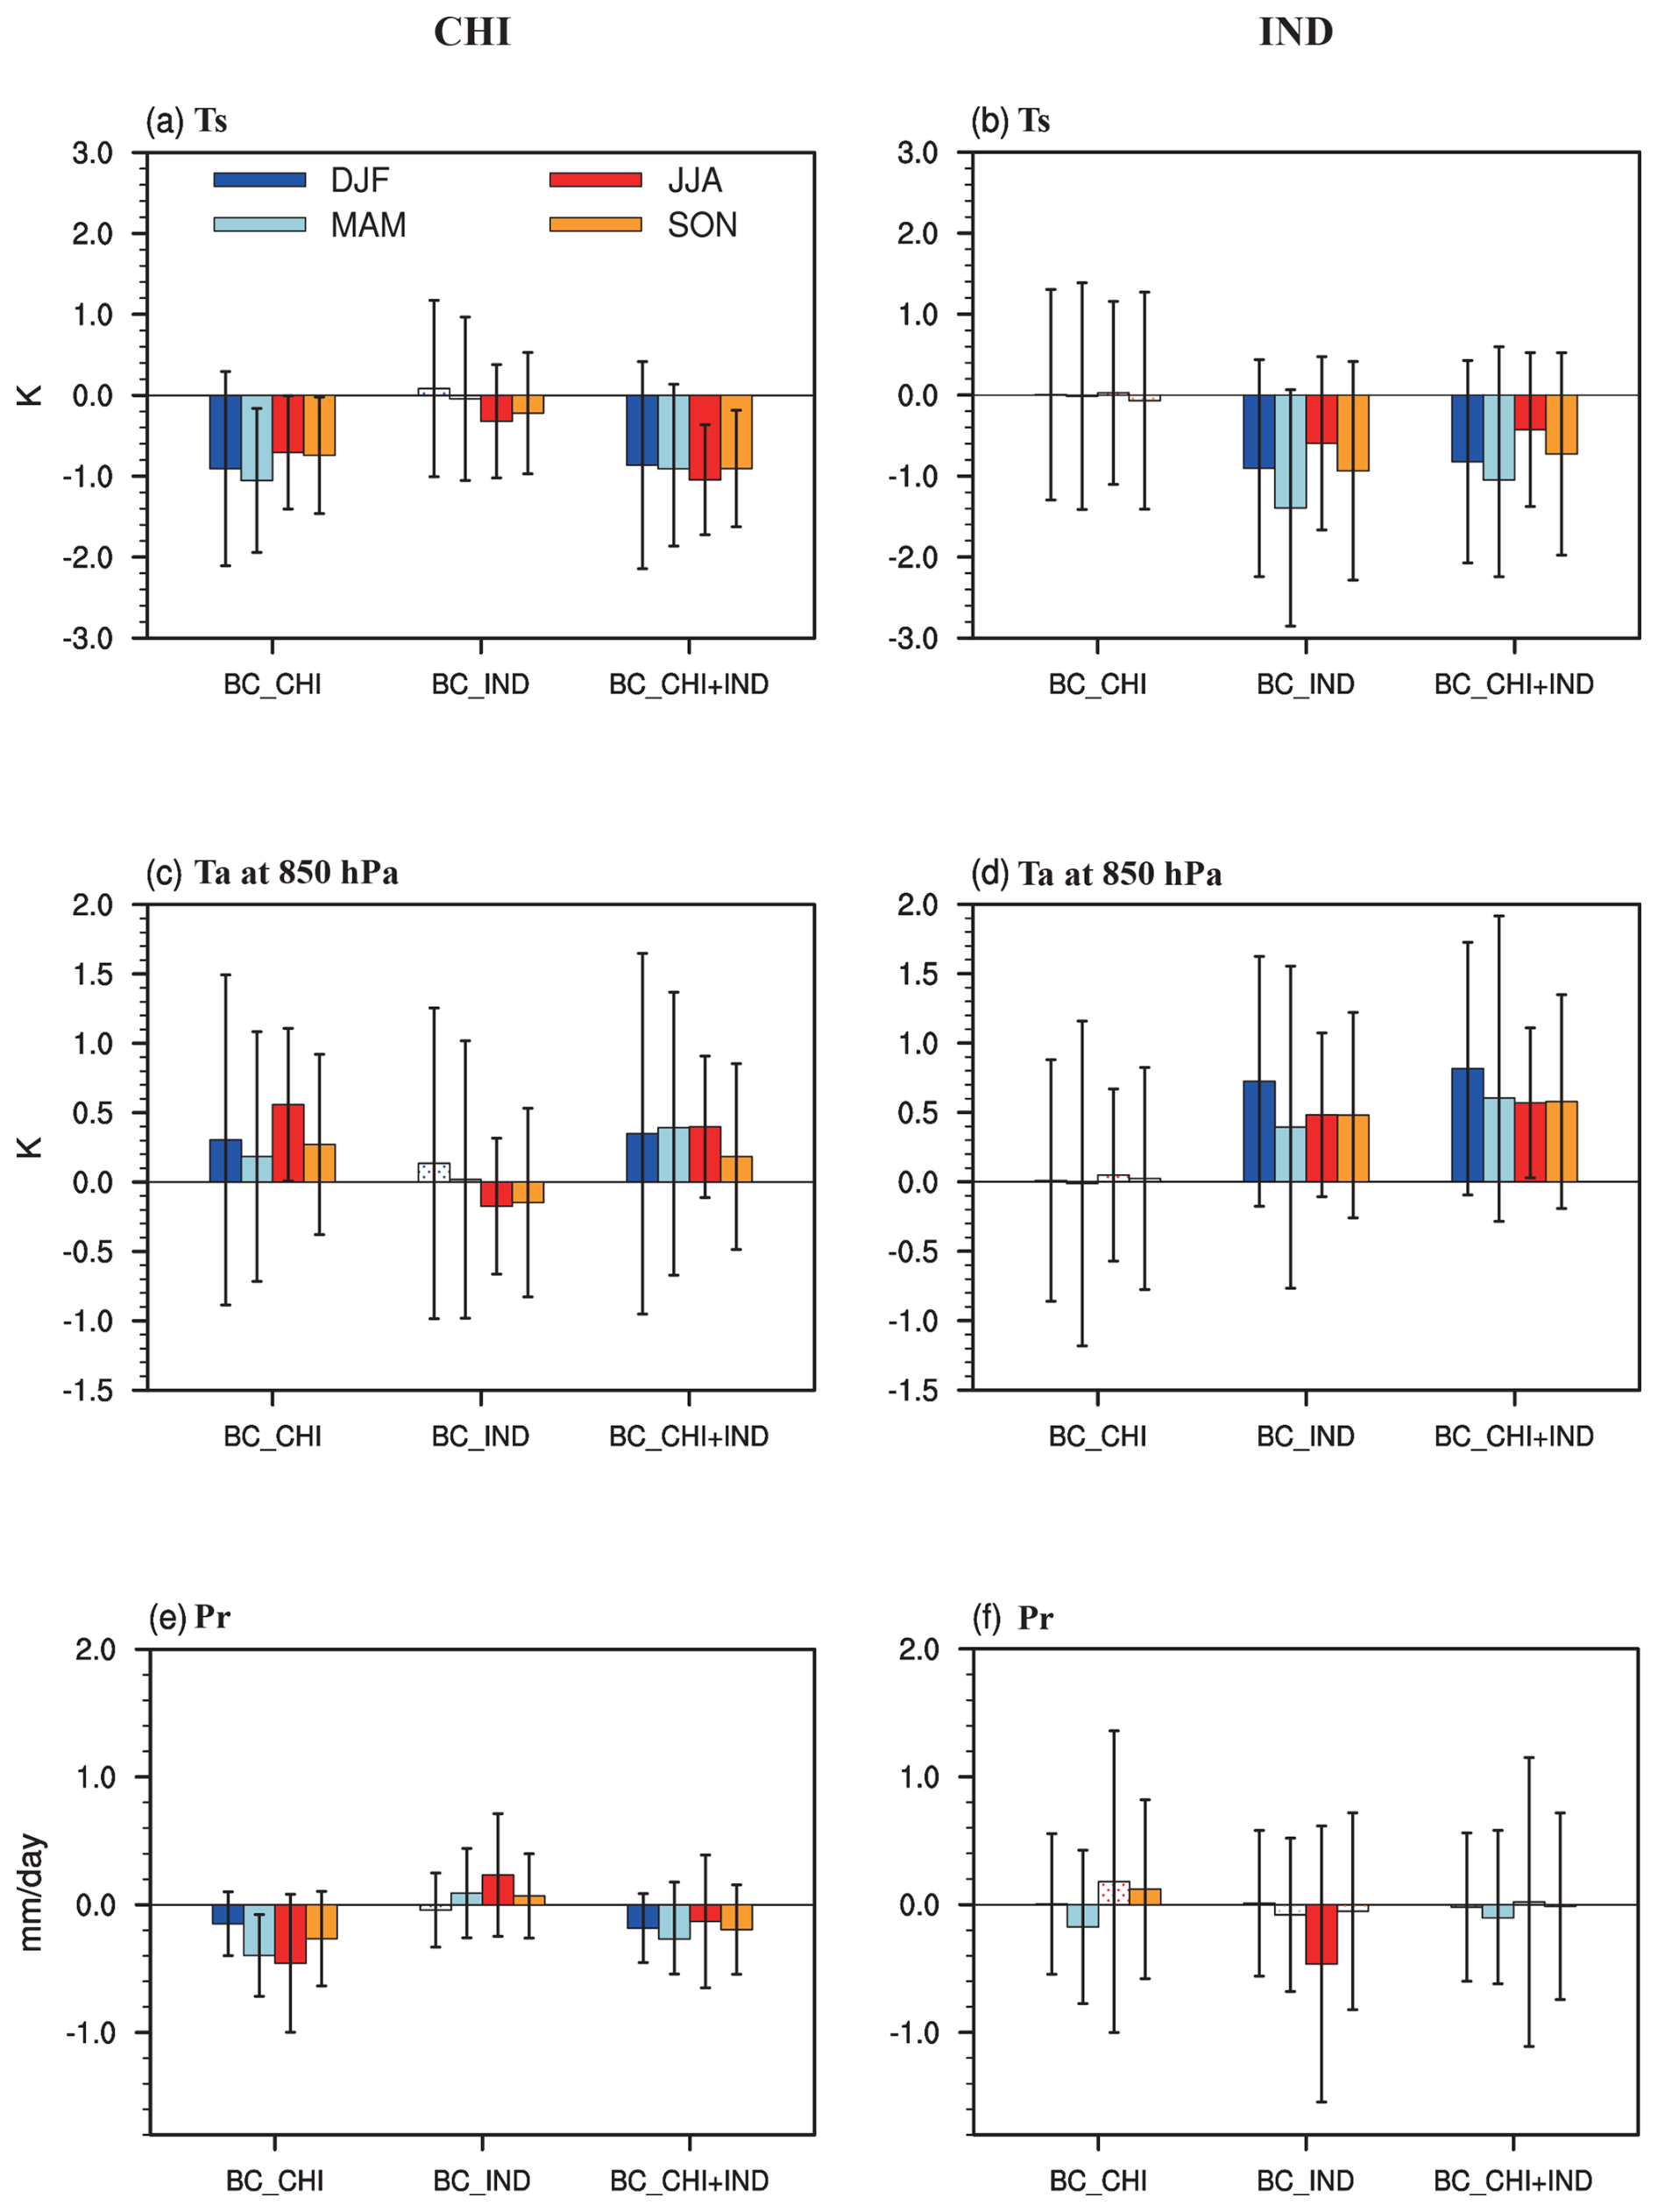
Figure 3Area-averaged land responses of (a–b) Ts, (c–d) Ta at 850 hPa, and (e–f) precipitation over East China (CHI: 95–133° E, 20–53° N) and India (IND: 65–95° E, 5–35° N) for four seasons (DJF: blue bars; MAM: light-blue bars; JJA: red bars; SON: yellow bars). Solid bars indicate the responses are statistically significant above a 95 % level based on a two-tailed Student's t test. Error bars represent ±1 standard deviation of the response.
Under BC_IND, the strongest cooling occurs in the whole of India in spring, with an area-averaged value of −1.4 ± 1.4 K but with weak warming in the tropical Indian Ocean (Figs. 2f and 3b). The significant cooling is concentrated in northern India in the other three seasons, with the area-averaged Ts decreased by 0.9 ± 1.3 K for winter and autumn and 0.6 ± 1.1 K for summer (Figs. 2e, g, h and 3b). The ocean surrounding the Indian subcontinent shows smaller cooling in the three seasons.
Secondly, the BC perturbations cause not only the local responses, but also non-local responses through atmospheric circulations. The increased BC over East China leads to a dipolar pattern in India, with warming to the north and cooling to the south in summer and autumn and significant warming in Central Asia in summer and Southeast Asia in autumn (Fig. 2c–d). BC emissions over India can induce cooling in Southeast Asia in all seasons, with the strongest responses occurring in summer (averaged value of about 1.15 K). Meanwhile, there is significant cooling in central and southern China in summer and autumn, with temperature decreases of 0.3 ± 0.7 and 0.2 ± 0.7 K, respectively (Figs. 2g–h and 3a). These added impacts lead to a stronger East Asian cooling response under BC_CHI+IND than under BC_CHI in summer and autumn (Figs. 2k–l and 3a). Moreover, comparison between the combined regional responses and the sum of individual regional responses shows nearly insignificant differences, suggesting that the impact of Asian BC aerosol on the Asian Ts is regionally linear in all four seasons (Fig. S5).
In contrast to Ts responses, the responses in air temperature (Ta) at 850 hPa show significant warming over much of the perturbed regions (Figs. 3c–d and 4). Cooling occurs over a few perturbed regions, such as central China under BC_CHI and BC_CHI+IND in winter (Fig. 4a, i). The vertical distribution of the temperature response is characterized by cooling at the surface and warming in the lower troposphere. This is a result of atmospheric absorption of solar shortwave (SW) radiation by BC aerosols and is consistent with many previous studies (e.g., Li et al., 2016). Outside the perturbed regions, the Ta responses are in line with the Ts response, for example cooling over China and Southeast Asia under BC_IND in summer and autumn (Figs. 3c and 4g, h).
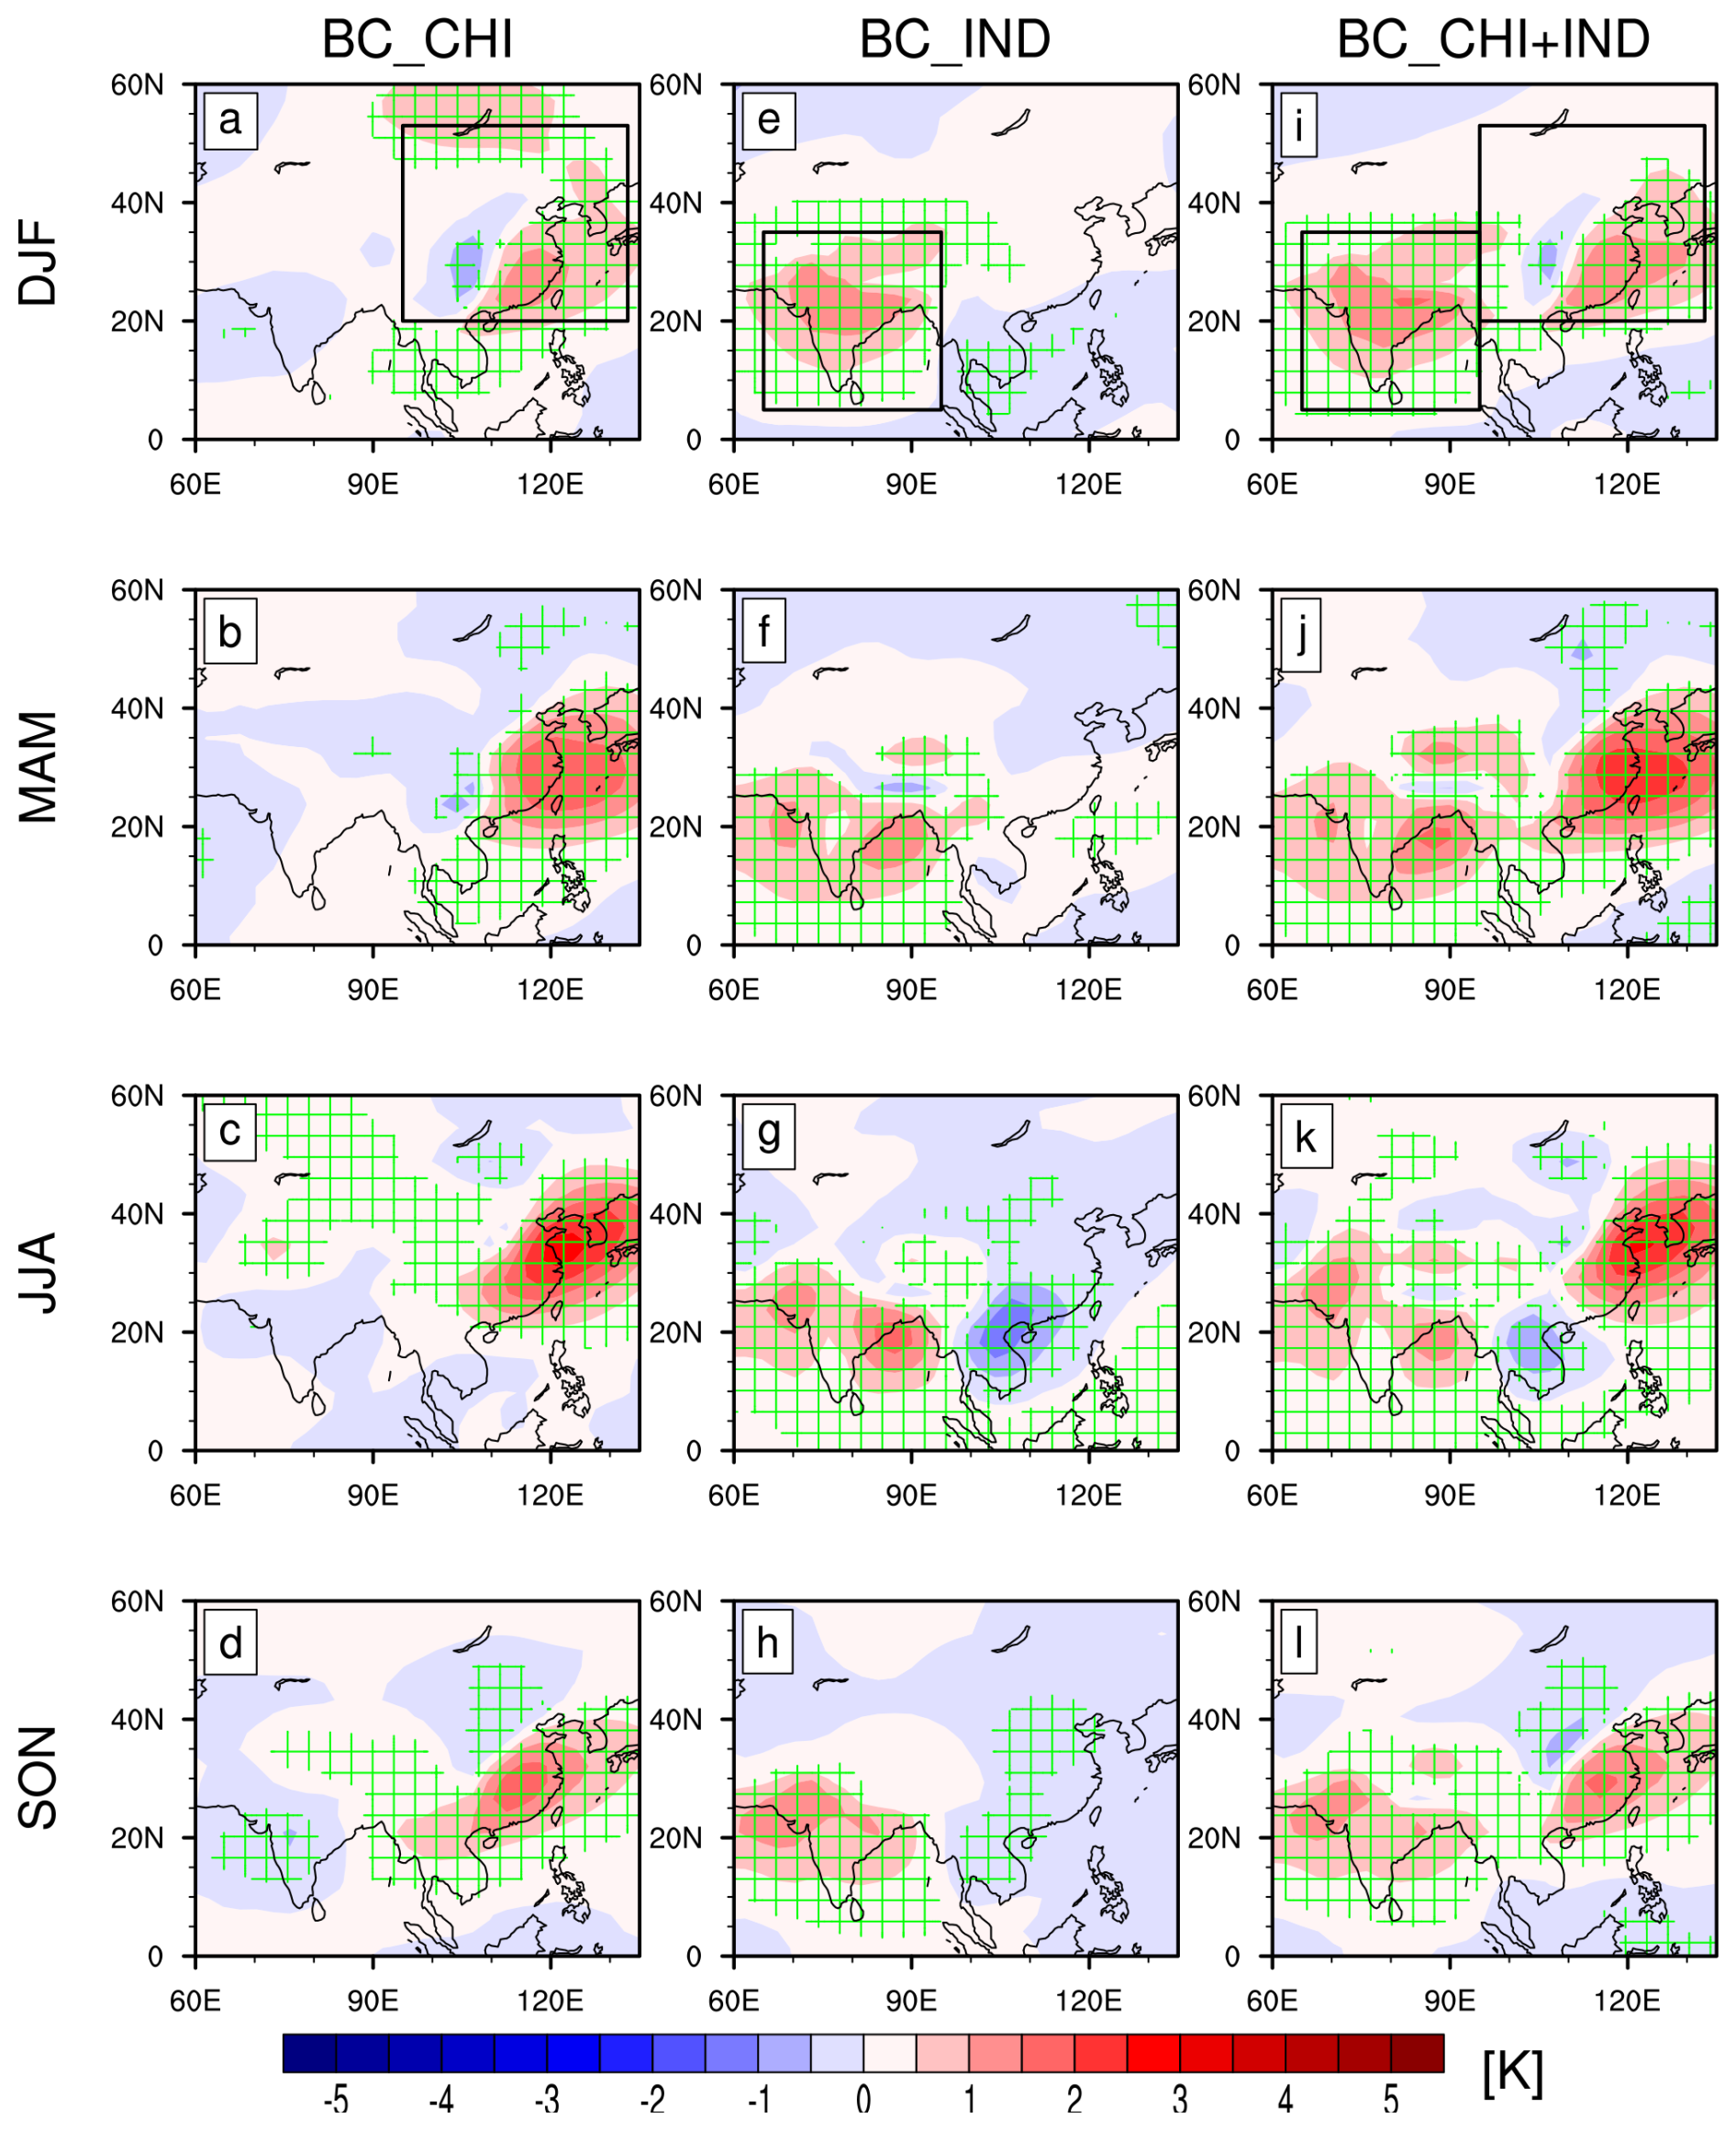
Figure 4Spatial patterns of Ta responses at 850 hPa in (a–d) BC_CHI, (e–h) BC_IND, and (i–l) BC_CHI+IND for four seasons. The green grid lines indicate the regions where the responses are statistically significant above a 95 % level based on a two-tailed Student's t test. The black boxes in panels (a), (e), and (i) highlight the regions where BC aerosols are perturbed. Unit: K.
Increased BC over East China primarily induces robust drying over most of China in all four seasons (Figs. 3e and 5a–d). Specifically, the spatial distribution in summer shows a substantial decrease over southern China (up to 40 %), a relatively weak decrease over North China, and a weak increase over Northwest China, with the area-averaged precipitation decreasing by 0.5 ± 0.5 mm d−1 (Figs. 3e, 5c, and S6c). In spring and autumn, the decreased precipitation is mainly located in South China and Northeast China by up to about 40 % (Fig. 5b and d). Although the absolute change is the weakest in winter (−0.2 ± 0.3 mm d−1), the relative change in central China decreases by up to about 60 % (Figs. 3e, 5a, and S6a). Under BC_IND, the response over the Indian subcontinent is only statistically significant in summer, with a decrease of 0.5 ± 1.1 mm d−1 (∼ 21 %) (Figs. 3f and 5g).
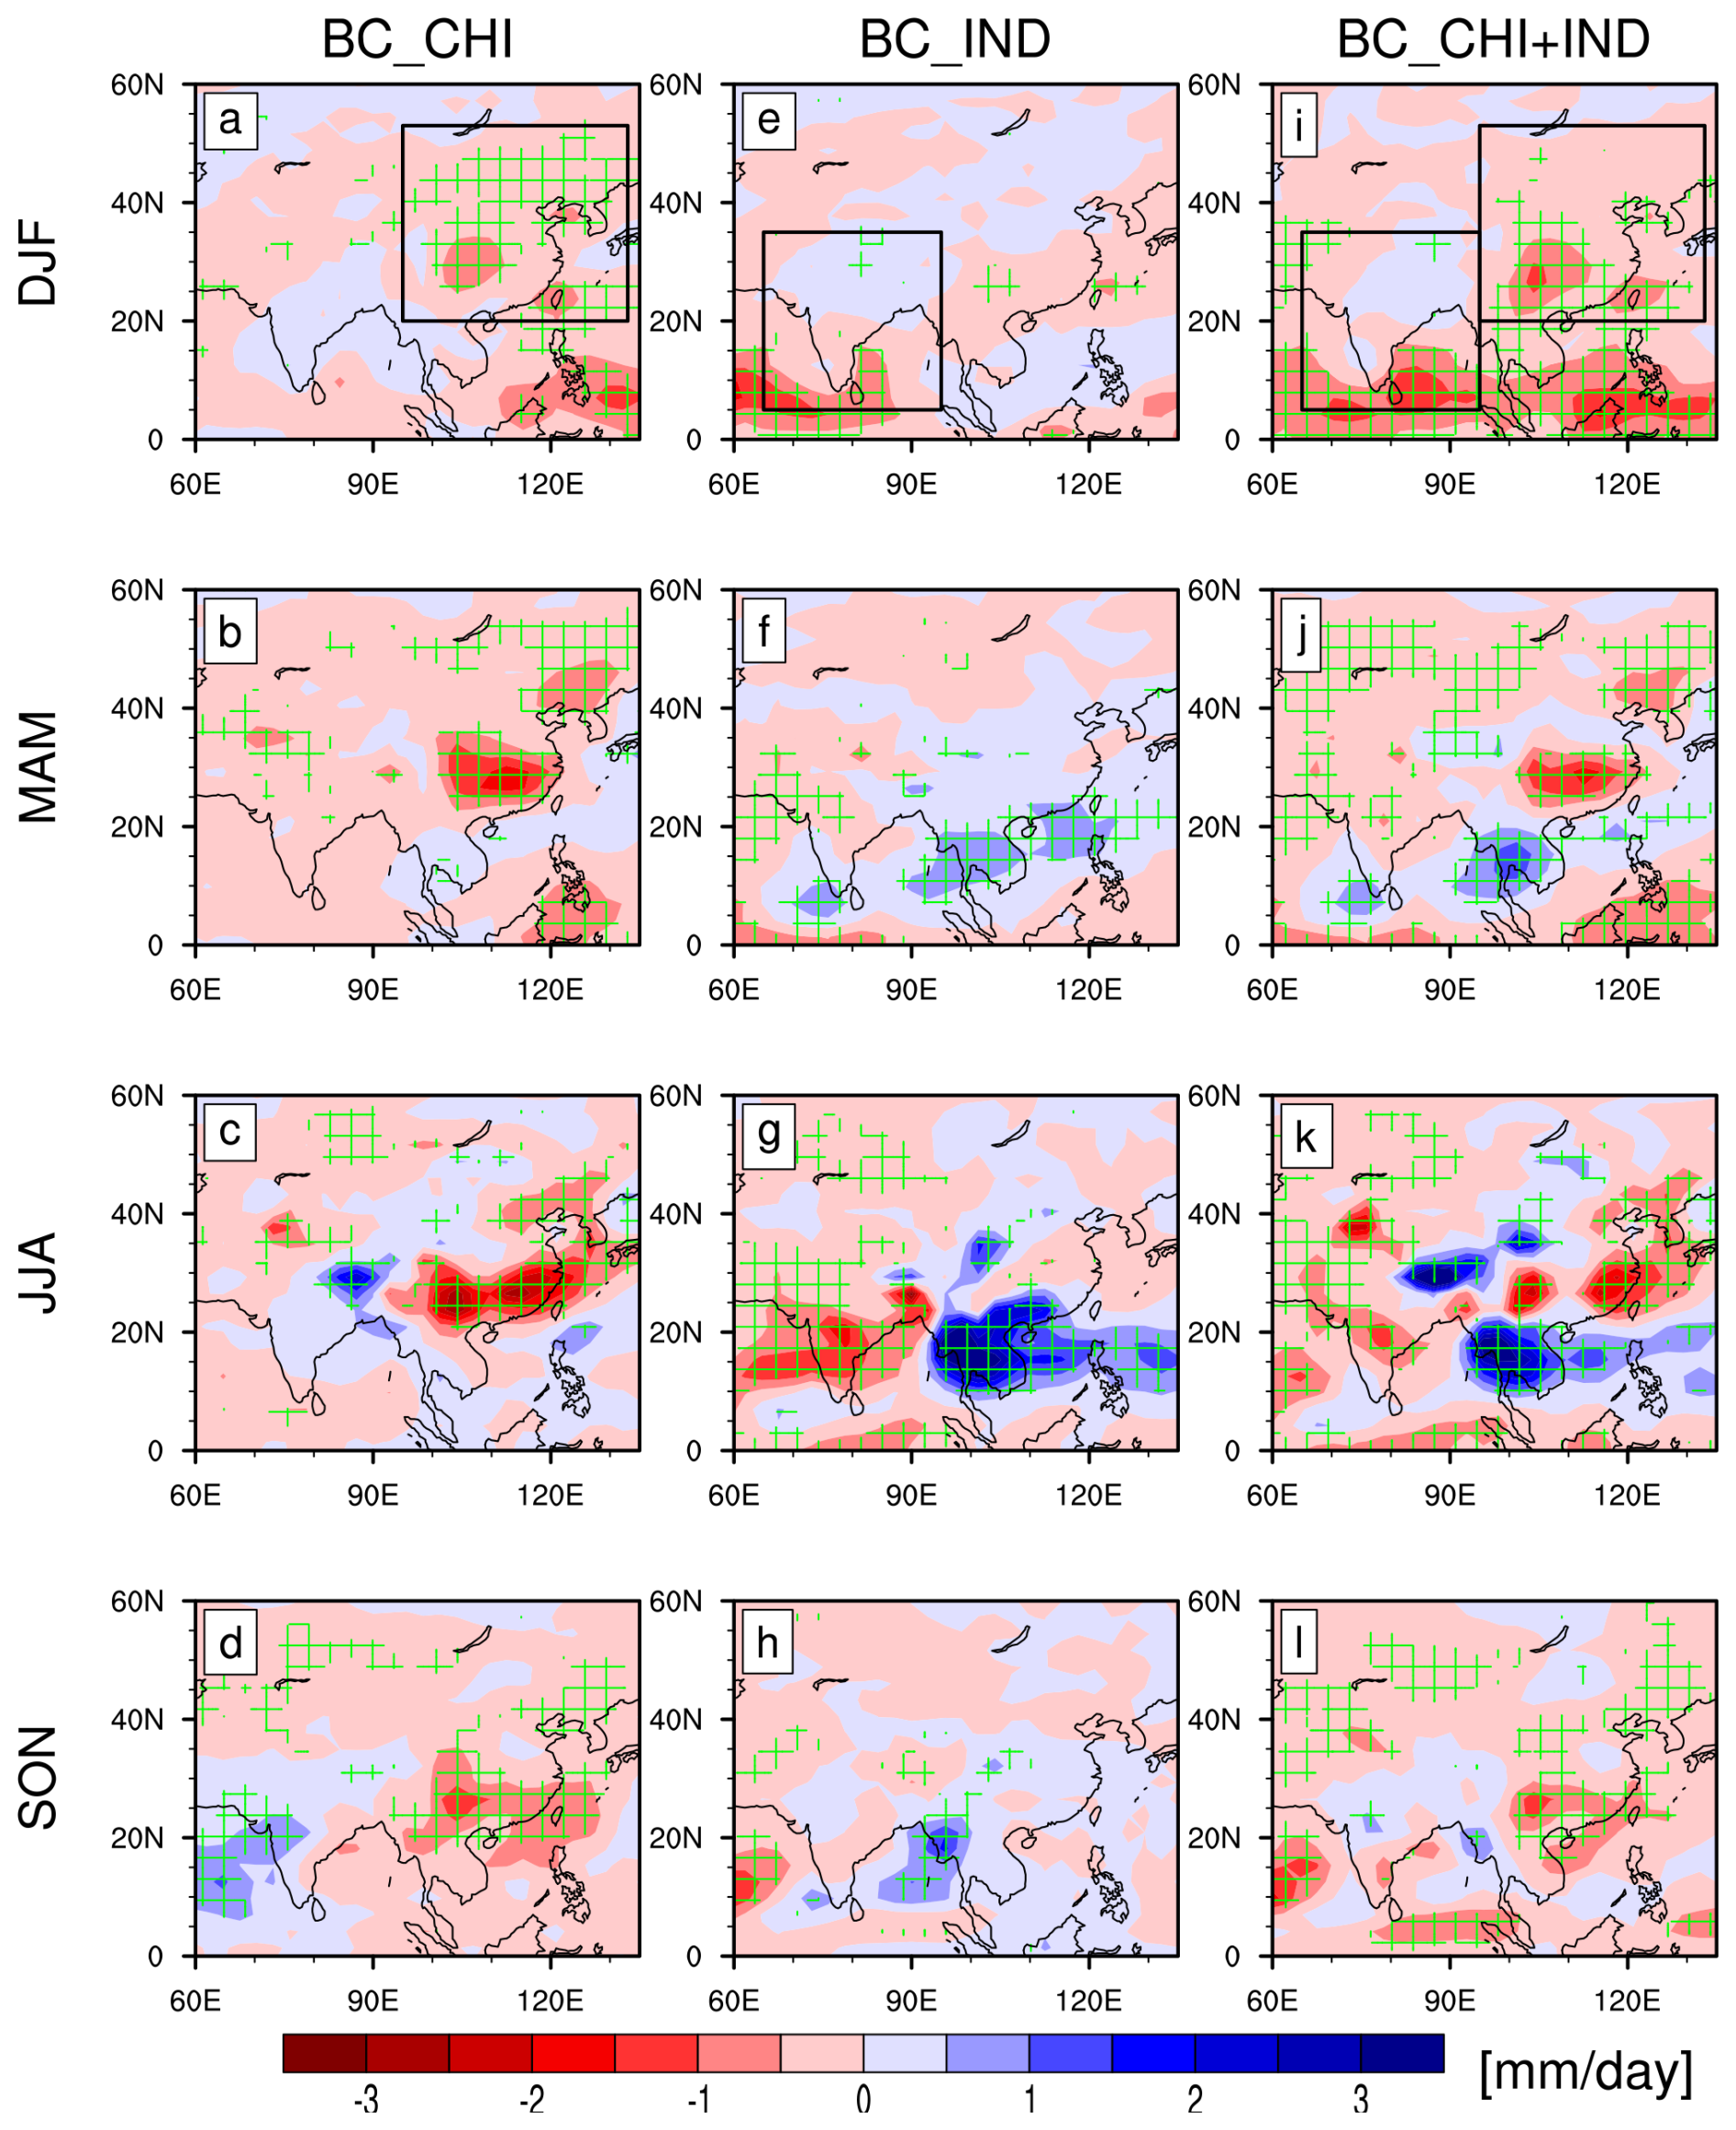
Figure 5Spatial patterns of precipitation responses in (a–d) BC_CHI, (e–h) BC_IND, and (i–l) BC_CHI+IND for four seasons. The green grid lines indicate the regions where the responses are statistically significant above the 95 % level based on a two-tailed Student's t test. The black boxes in panels (a), (e), and (i) highlight the regions where BC aerosols are perturbed. Unit: mm d−1.
Additionally, under BC_CHI there is increased rainfall over India in summer and autumn, which can counteract the local decrease due to the Indian BC forcing (Figs. 3f and 5c–d). Hence, when considering the simultaneous BC forcing in the two regions (BC_CHI+IND) in summer and autumn, there is no significant change in the regional mean, showing a dipolar pattern with more rainfall over northern India and less rainfall over southern India (Figs. 3f and 5k–l). On the other hand, BC_IND can induce a significant precipitation increase over China and Southeast Asia in spring and summer (Fig. 5f–g), partially offsetting the decrease in response to BC_CHI over China. Hence, the responses under BC_CHI+IND are weaker for China than those under BC_CHI (Fig. 3e). For regional linearity, the responses are almost linear (Fig. S7). Only a few regions exhibit nonlinear responses, such as a decrease over southern Thailand in winter and an increase over northeastern India in spring and summer. The above analysis regarding the summer part has been presented in Stjern et al. (2024) but is included here as a precursor to the detailed mechanistic analysis that follows.
3.3 Energy balance response
The following analysis mainly focuses on summer for clarity; the results for the other three seasons are in the Supplement (Figs. S9–S12, S14–S18). The spatial patterns of net top-of-atmosphere (TOA) and surface energy responses to regional BC aerosols in summer are illustrated in Fig. 6. As expected, there are increases in net downward TOA shortwave (SW) radiation, with area mean responses of 7.3 to 9.6 W m−2 associated with decreases in convective clouds over the perturbed regions (Figs. 6a–c and S8j–l). Decreases in net surface downward SW radiation can be seen with area mean responses of −22.6 to −27.8 W m−2 due to SW absorption by BC aerosols (Fig. 6d–f). Significant increases in low and middle clouds also contribute to the reduced surface SW radiation (Fig. S8d–i). Hence, there is warming in the troposphere and cooling at the surface in these perturbed regions. The enhanced net surface upward longwave (LW) radiation makes a small contribution to the local surface cooling, with area mean responses from −3.2 to −5.8 W m−2 (Fig. 6g–i), which is related to the decreased convective clouds (Fig. S8j–l). On the contrary, the positive changes in downward sensible heat (SH) (8.1 to 9.8 W m−2) and latent heat (LH) (9.5 to 12.9 W m−2) cause a warming effect that partly offsets the cooling in the perturbation regions (Fig. 6j–o). The reduced SH is caused by the weakened vertical temperature differences between the surface and lower atmosphere. The decrease in upward LH is associated with upper-level heating through atmospheric stabilization that suppresses moisture transport and with reduced soil moisture availability due to decreased rainfall. Outside the perturbation regions, the negative changes in SW radiation, LW radiation, and LH are responsible for the cooling in Southeast Asia and South China induced by the increased BC in India (Fig. 6e, h, n). Similar results can be seen in the other three seasons (Table S2).
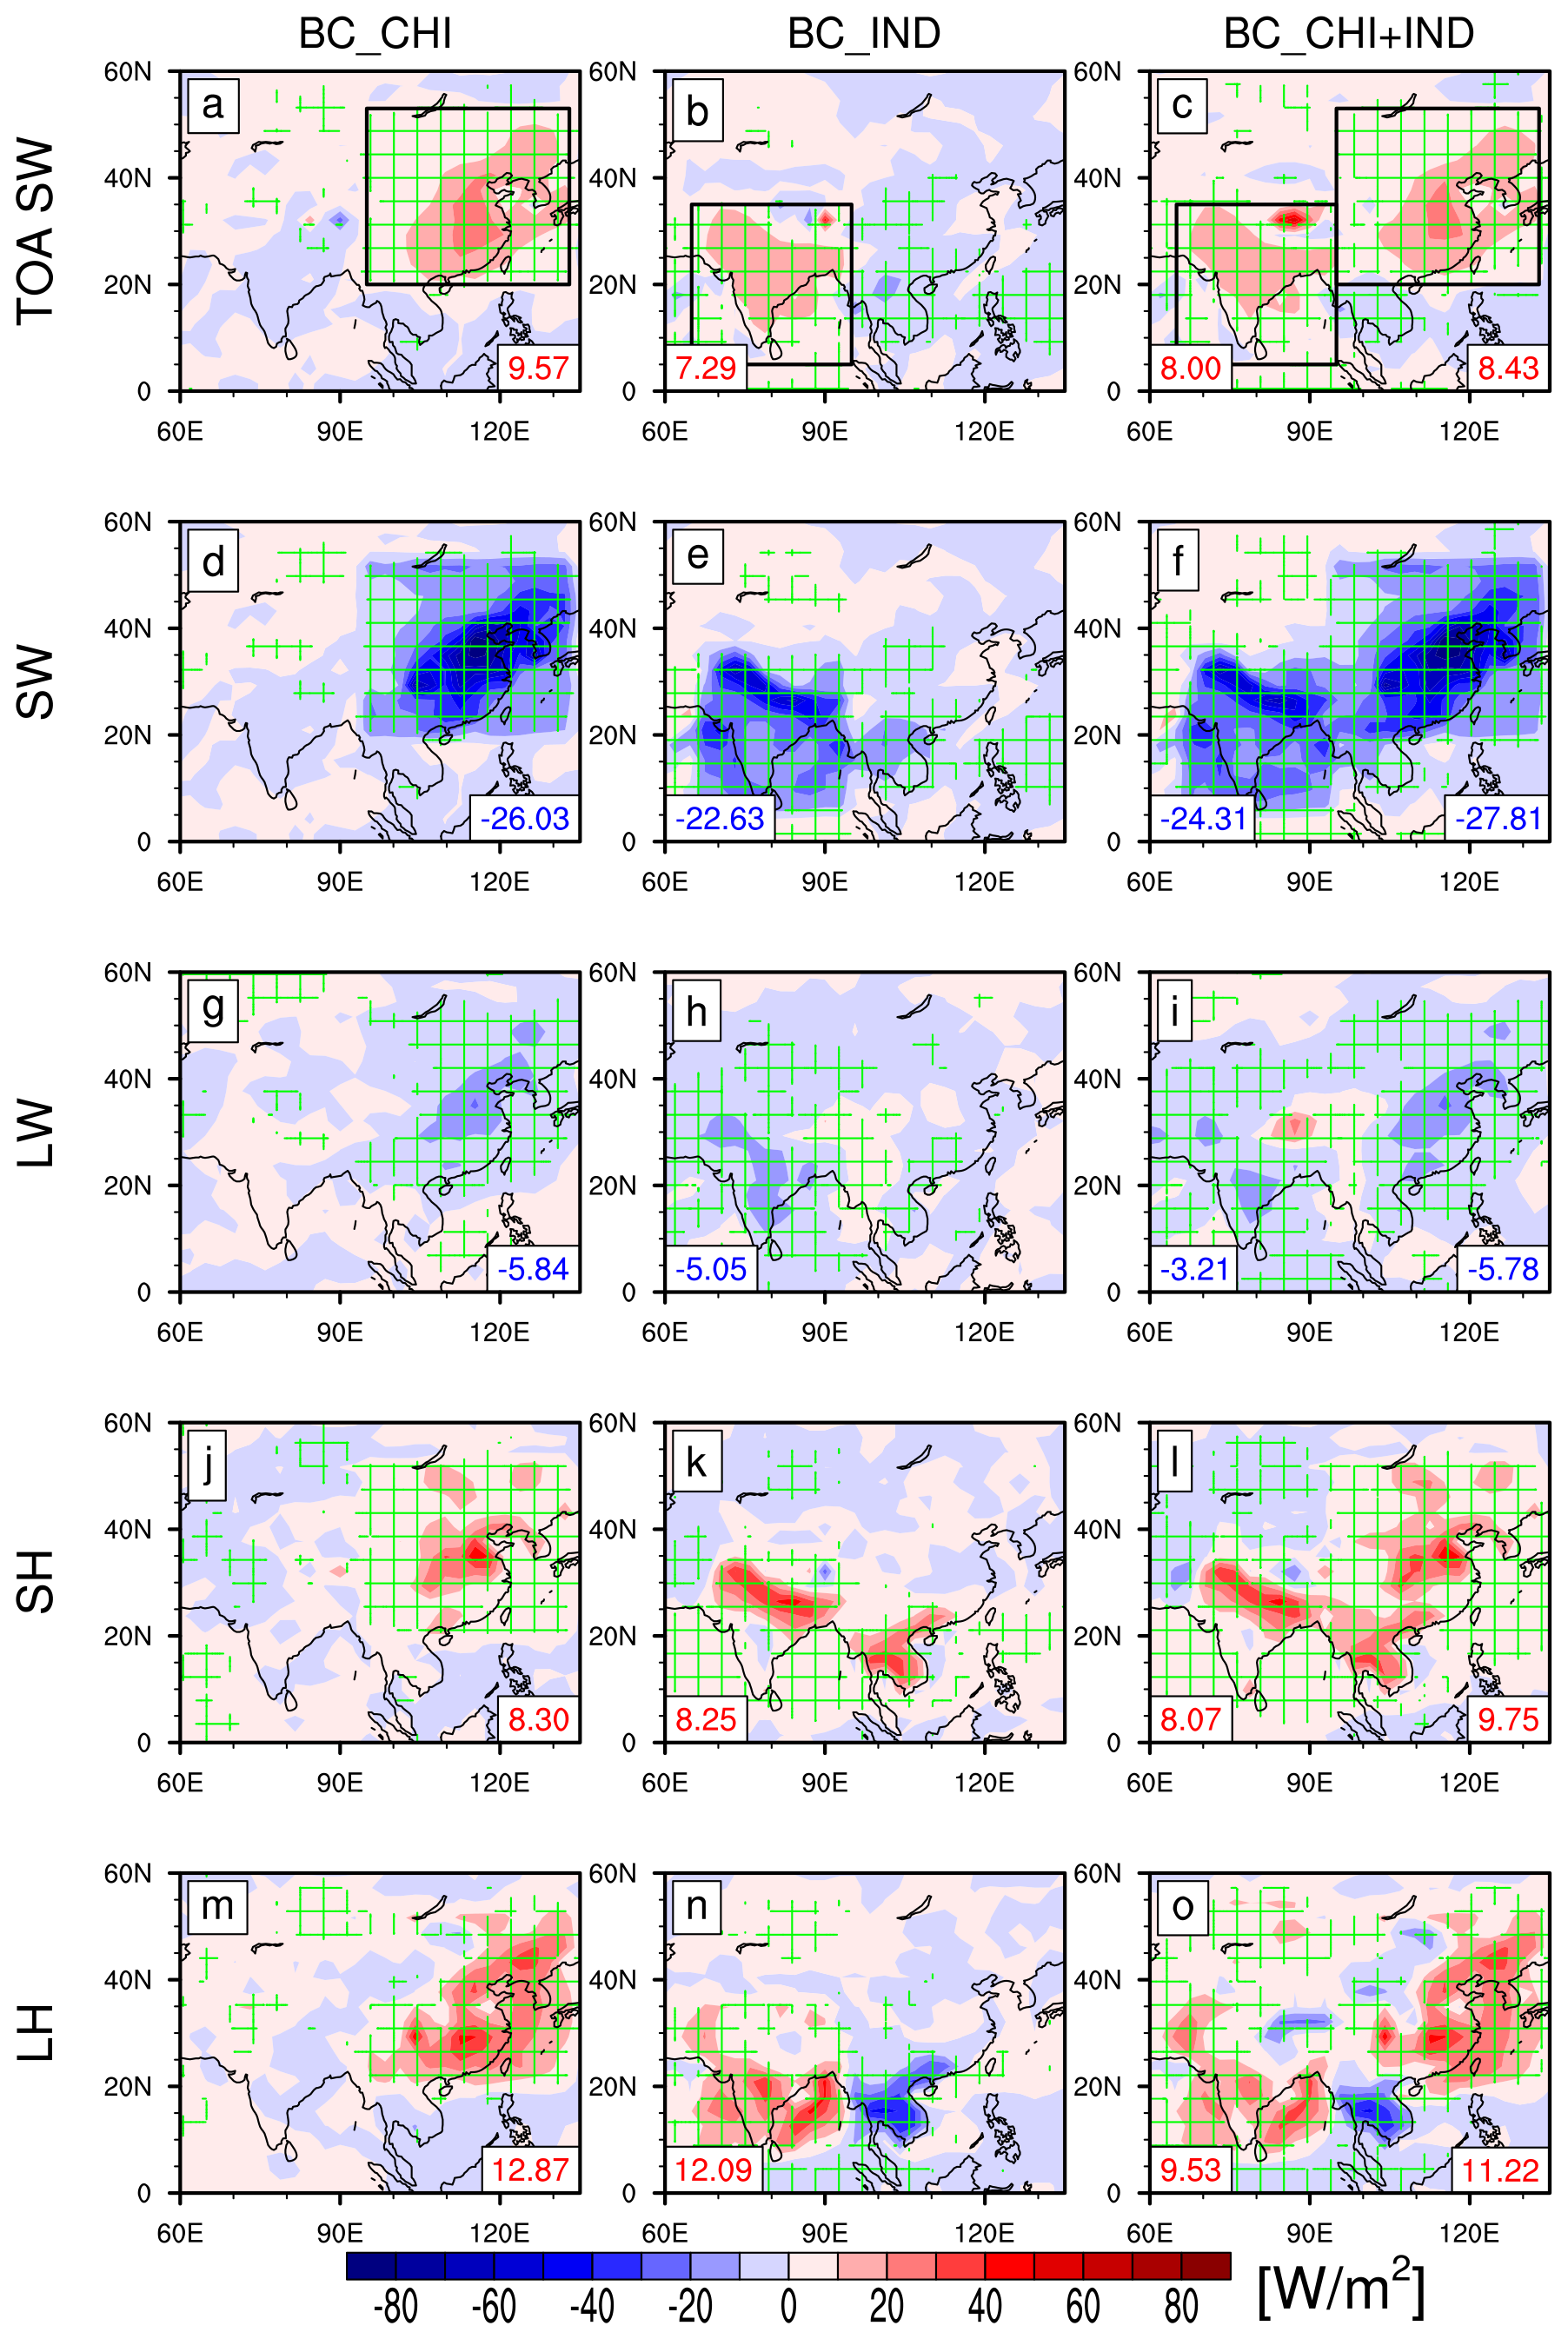
Figure 6Spatial patterns of net TOA and surface energy responses in summer in BC_CHI, BC_IND, and BC_CHI+IND. (a–c) TOA SW radiation, (d–f) surface SW radiation, (g–i) surface LW radiation, (j–l) surface SH, and (m–o) surface LH. Positive values mean downward for radiation and flux changes. Area-averaged values over East China and India are given in the lower-right corners and lower-left corners, respectively. The green grid lines indicate the regions where the responses are statistically significant above a 95 % level based on a two-tailed Student's t test. The black squares highlight the regions where BC is perturbed. Unit: W m−2.
Figure 7 shows area-averaged atmospheric column energy budget terms (see Eq. 1) over East China and India in summer. For the drying in East China/India under BC_CHI/BC_IND, the substantial reductions in the diabatic cooling (δQ) are the prime driver of the decreases in the energy of precipitation (LcδP), while the increases in the DSE flux divergence (δH) offset the effect of δQ to a large extent.
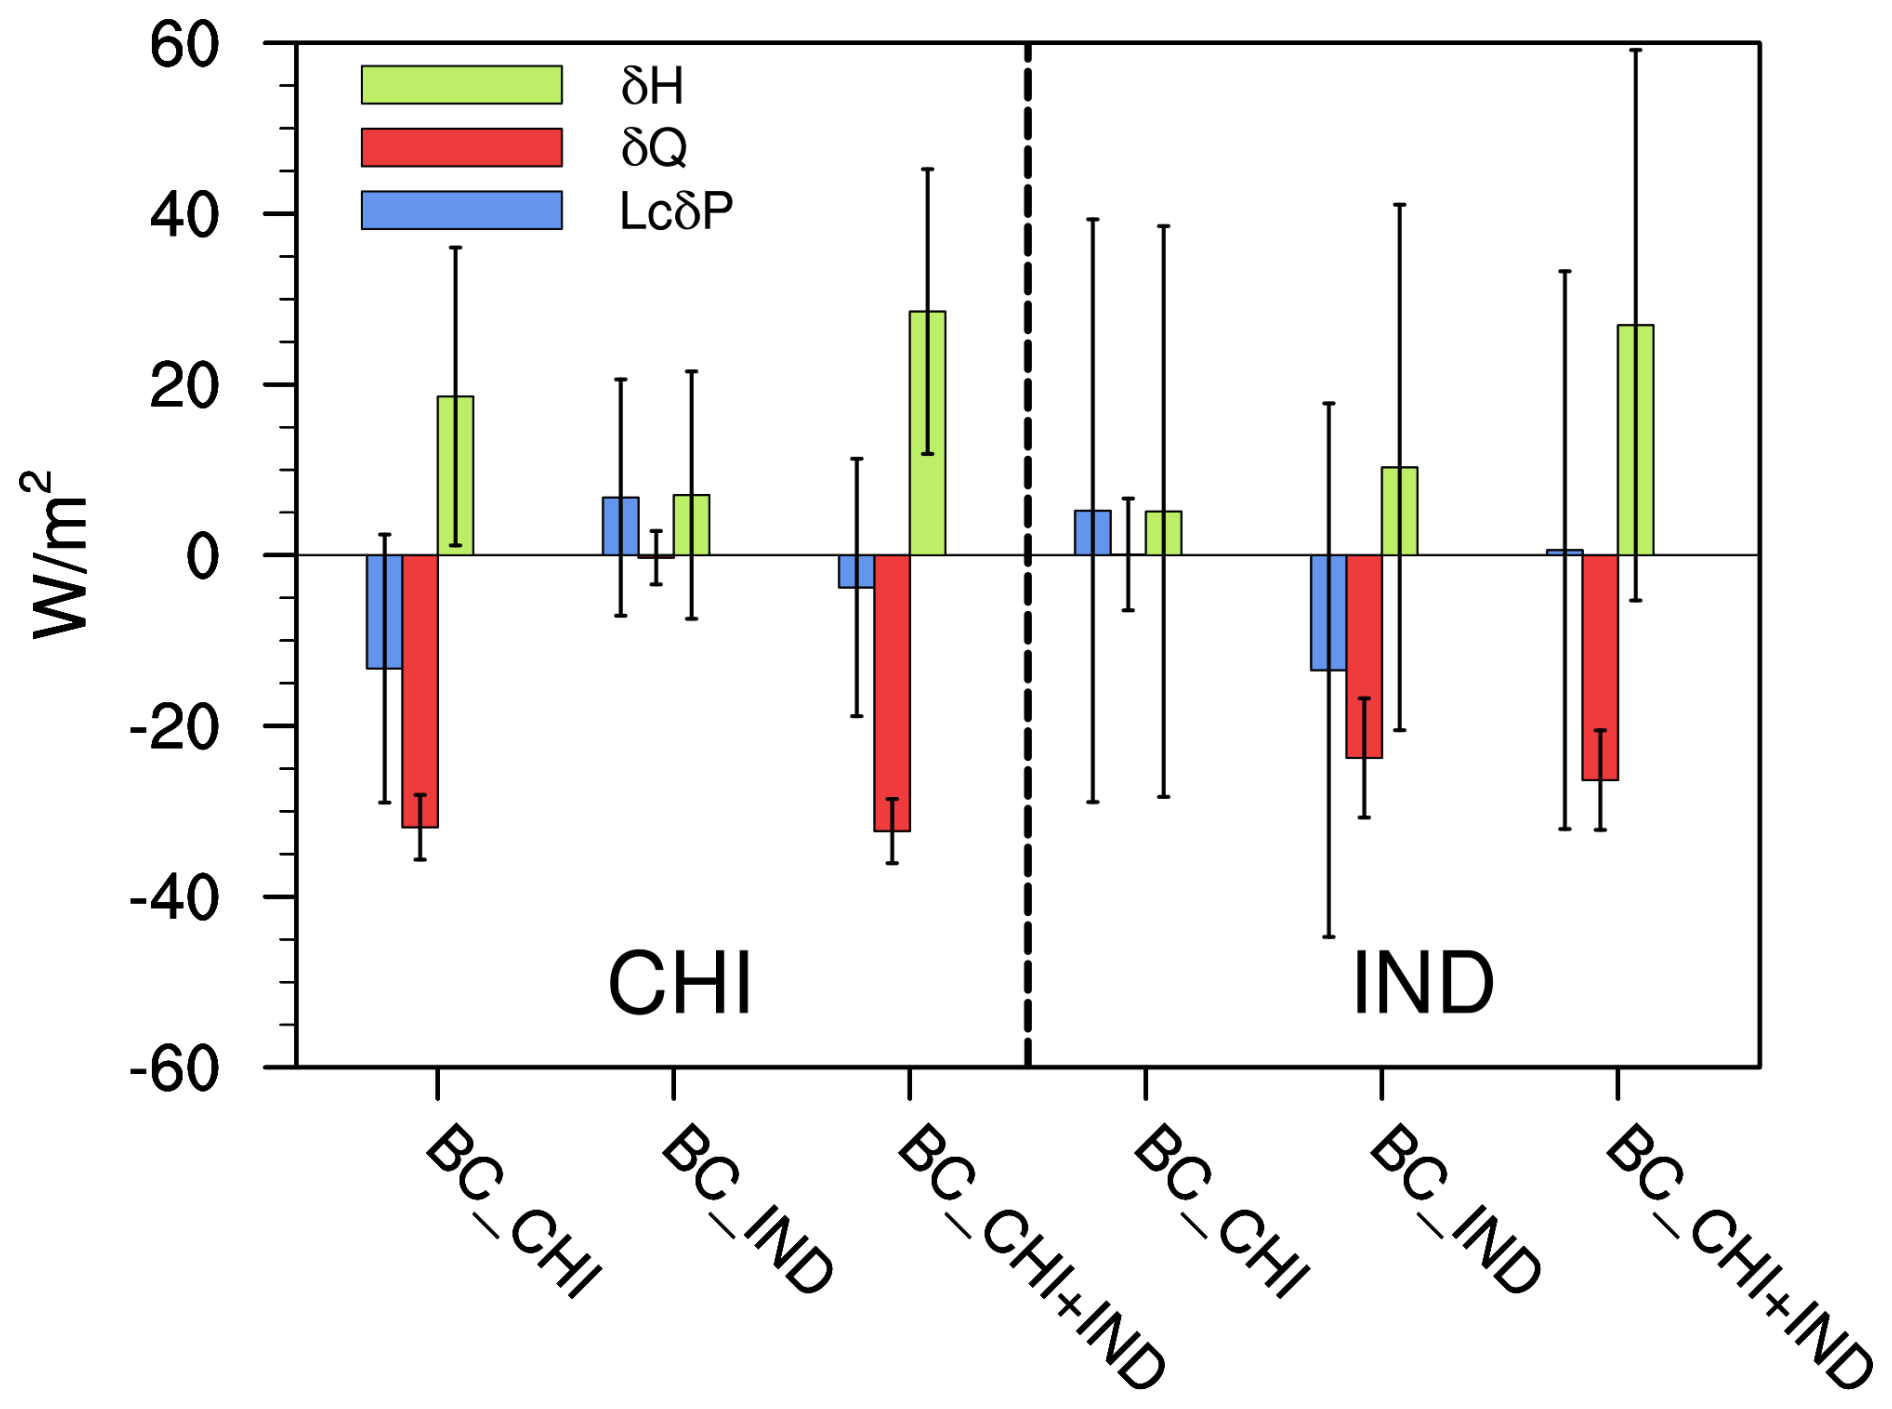
Figure 7Summer area-averaged responses of the atmospheric energy budget terms over East China (CHI: 95–133° E, 20–53° N) and India (IND: 65–95° E, 5–35° N) in BC_CHI, BC_IND, and BC_CHI+IND. Error bars represent ±1 standard deviation of the response. Unit: W m−2.
The enhanced precipitation in China under BC_IND and in India under BC_CHI is the result of increased δH (the blue and green bars in Fig. 7 are almost identical), with a negligible contribution of δQ. Hence, the local precipitation response to local BC increases is largely driven by δQ, while the remote precipitation response is largely driven by δH. Consequently, it can be found that the larger changes in δH lead to the smaller responses in LcδP over China and India under BC_CHI+IND, relative to the changes under BC_CHI and BC_IND. It should be mentioned that the relatively large uncertainties (error bars in Fig. 7) of LcδP mainly depend on δH. The other three seasons show similar results (Fig. S9).
Spatially, δQ shows a significant decrease throughout all the perturbed regions in the three simulations, with large decreases located over North China and northern India (Fig. 8d–f). Under BC_CHI, δH exhibits a dipolar pattern with positive changes north of the Yangtze River and negative changes in the south (Fig. 8g). Hence, δH and δQ cancel each other out in North China and Northeast China, while they combine with each other south of the Yangtze River. As a result, there is the strongest precipitation decrease in South China and a relatively weak decrease in North China (Fig. 8a). Under BC_IND, significant positive δH can be found along the southern edge of the Himalayas and the southern tip of the Indian subcontinent, and weak and nonsignificant negative changes can be found in central India (Fig. 8h). δH can therefore offset the negative changes in δQ in northern and southern India. The substantial LcδP reduction in central India is mainly driven by δQ (Fig. 8b).
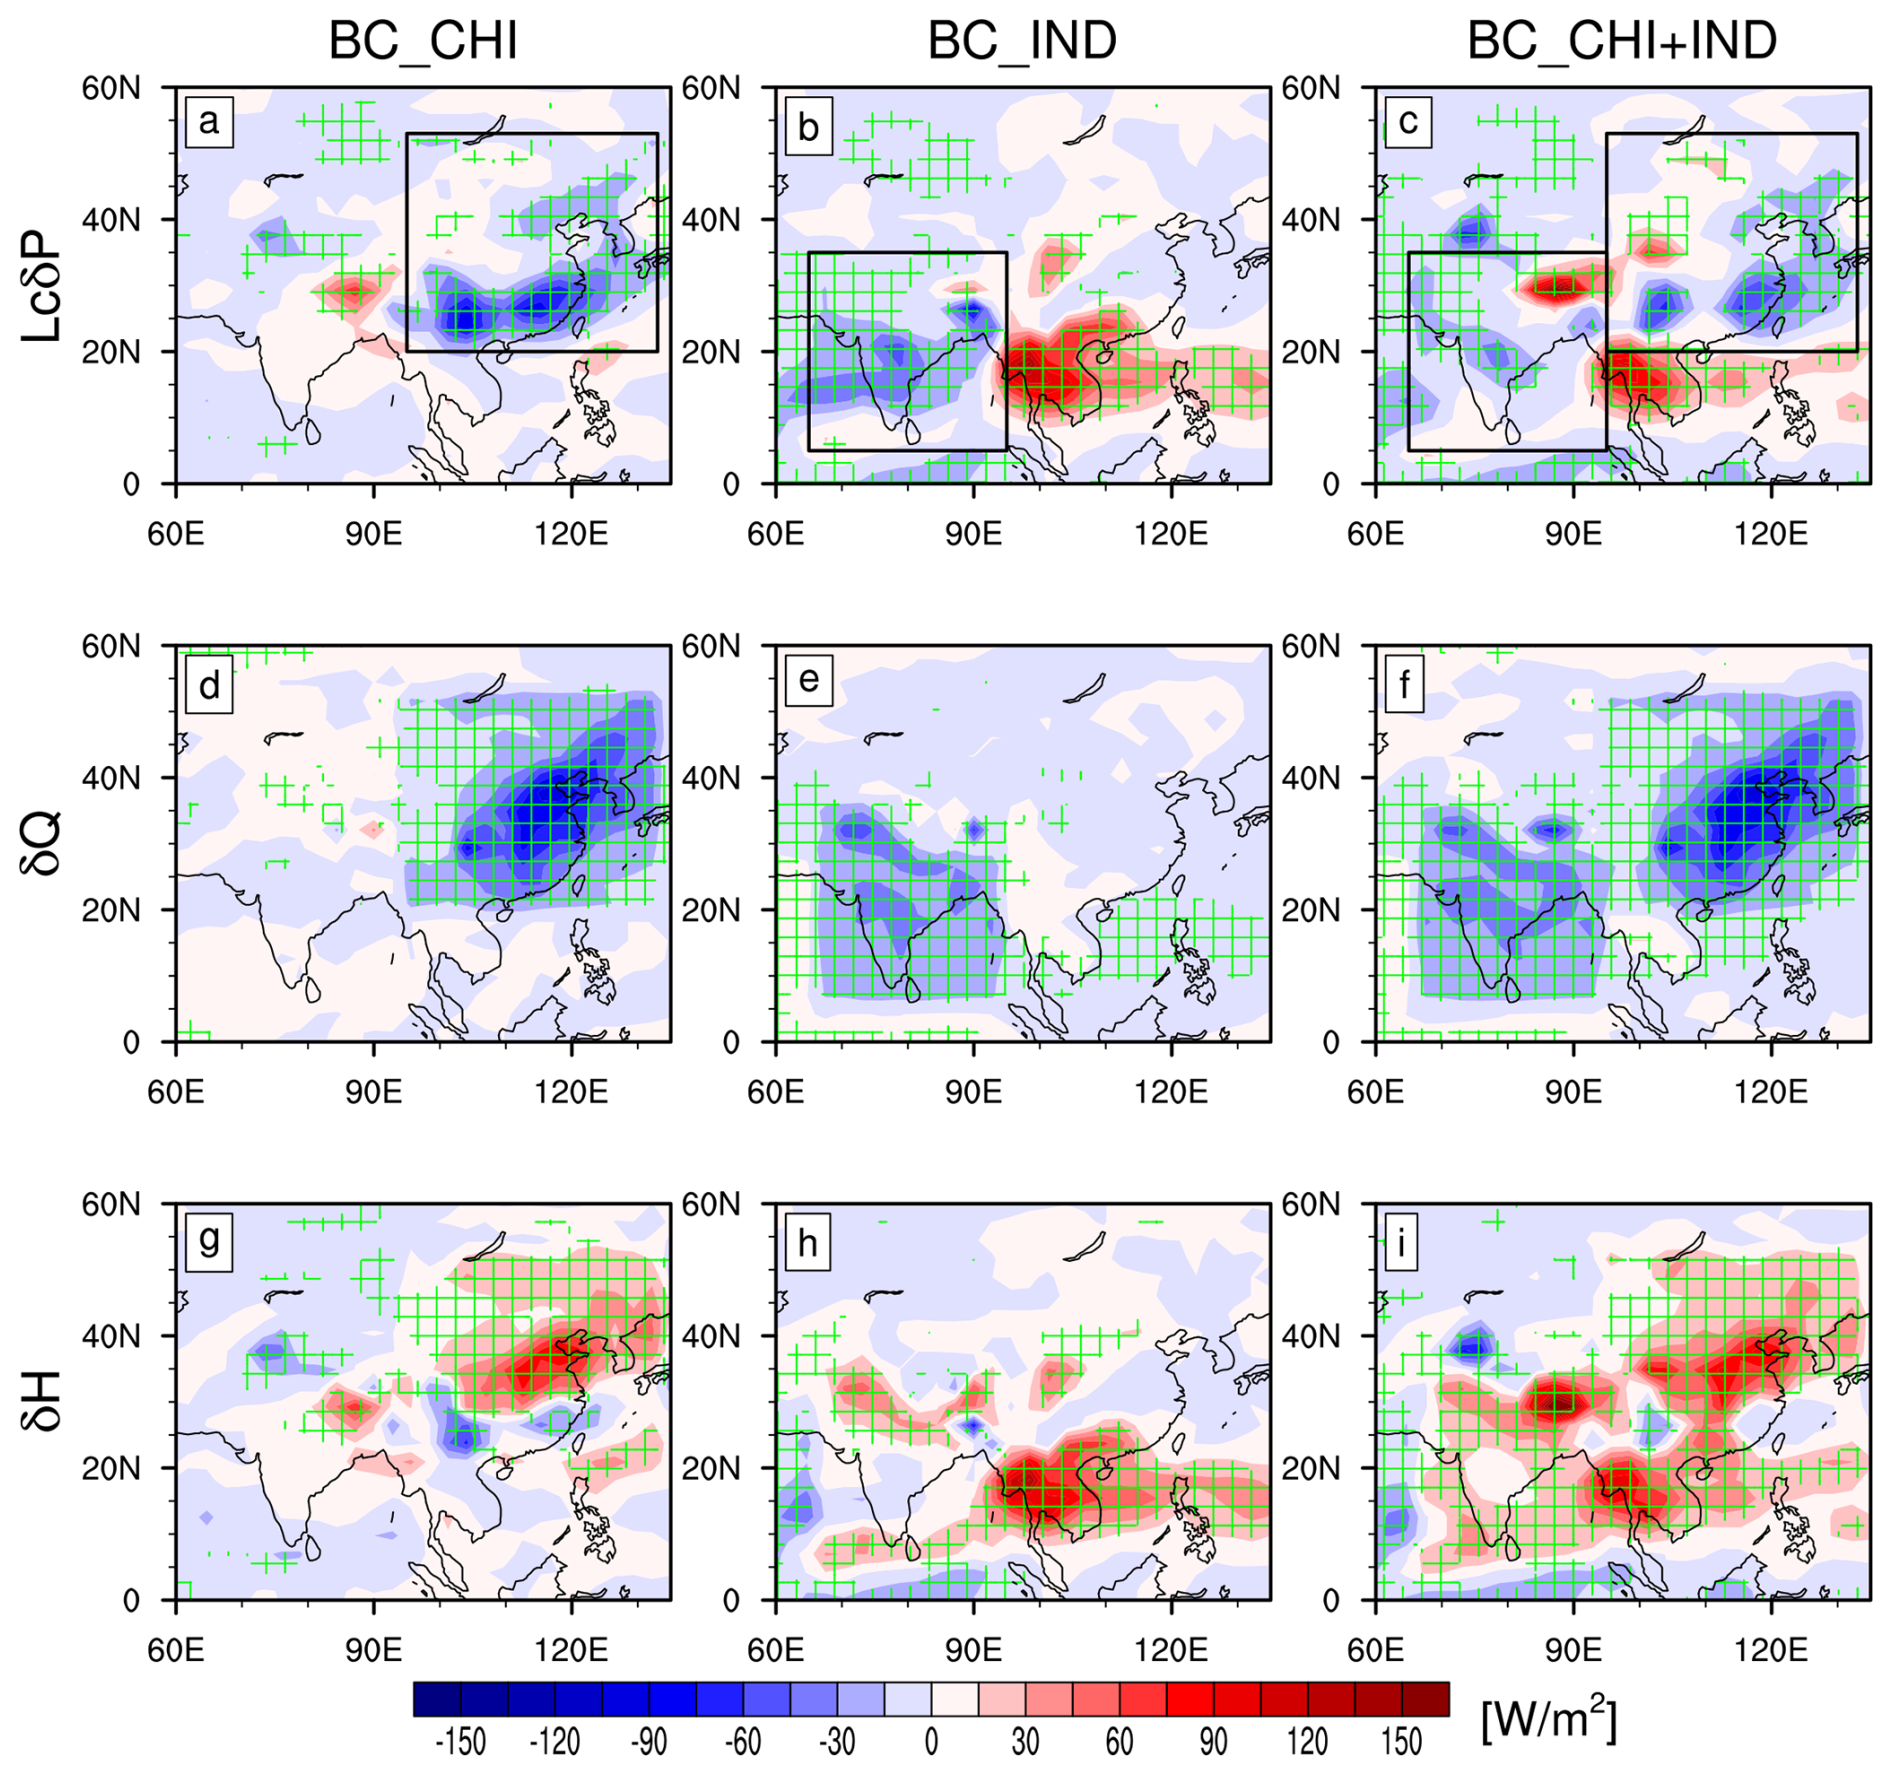
Figure 8Summer spatial patterns of responses of the atmospheric energy budget terms in BC_CHI, BC_IND, and BC_CHI+IND. (a–c) LcδP, (d–f) δQ, and (g–i) δH. The green grid lines indicate the regions where the responses are statistically significant above a 95 % level based on a two-tailed Student's t test. The black squares highlight the regions where BC is perturbed. Unit: W m−2.
In addition, δH is the dominating factor for LcδP beyond the perturbation regions, for example positive changes in northeastern India under BC_CHI and from Southeast Asia to the tropical western Pacific and central China under BC_IND (Fig. 8g–h). Under BC_CHI+IND, the extent and magnitude of δH are larger than those in the simulations of individual regions (Fig. 8i), which indicates greater balance between δH and δQ, corresponding to relatively weak precipitation over East China and India (Figs. 7 and 8c). Relative to summer, δQ and δH have negative and positive changes, respectively, throughout the perturbation regions in the other three seasons (Figs. S10–S12). In winter and spring, there is a marked seesaw pattern of δH between Asia and the tropical Indian Ocean and maritime continent under BC_CHI+IND, reducing precipitation in the latter regions (Figs. S10c, i and S11c, i). Overall, the combined effect of δH and δQ shapes the spatial pattern of precipitation responses to the regional BC.
The reductions in δQ (see Eq. 2) are dominated by the strong atmospheric heating due to SW absorption by BC aerosols (−δSWA) and also contributed to by the small decreases in the atmospheric longwave cooling (δLWC) (Fig. S13a–f). The sensible heat flux from the surface (−δSH) slightly increases δQ (Fig. S13g–i).
3.4 Dynamic processes responsible for responses
Due to storage constraints, 3D atmospheric output from FORTE2 was archived on three pressure levels, 250, 500, and 850 hPa, to capture key aspects of the tropospheric circulation response. While this precludes quantitative analysis of the component terms of Hm and Htrans, it is sufficient to identify the main contributor to Hm. We now examine the four terms of δHm (see Eq. 3), comprising the dynamic components with changes in vertical and horizontal atmospheric circulations (δHDyn_v and δHDyn_h) and thermodynamic components with changes in vertical and horizontal DSE gradients (δHThermo_v and δHThermo_h). Figure 9 displays spatial patterns of the four components in summer in the three simulations. In general, δHDyn_v highly resembles δH in all simulations, and the magnitudes in δHDyn_v are far greater than those in the other three terms, suggesting that the dynamic effect of vertical circulation is the primary contributor to δH (Fig. 9a–c). δHThermo_v and δHDyn_h show minimal anomalies in all regions for all experiments. Larger anomalies are seen in δHThermo_h, where negative anomalies offset some of the influence of δHDyn_v over Southeast Asia in the BC_IND and BC_CHI+IND experiments. However, these anomalies are insufficient to influence the sign of δH, which is still primarily driven by δHDyn_v in this region. In the other seasons, δHDyn_v remains the most important factor (Figs. S14–S16), although it is more strongly offset by δHDyn_h and δHThermo_h in winter. The effects of horizontal circulation are relatively weak in spring and autumn.
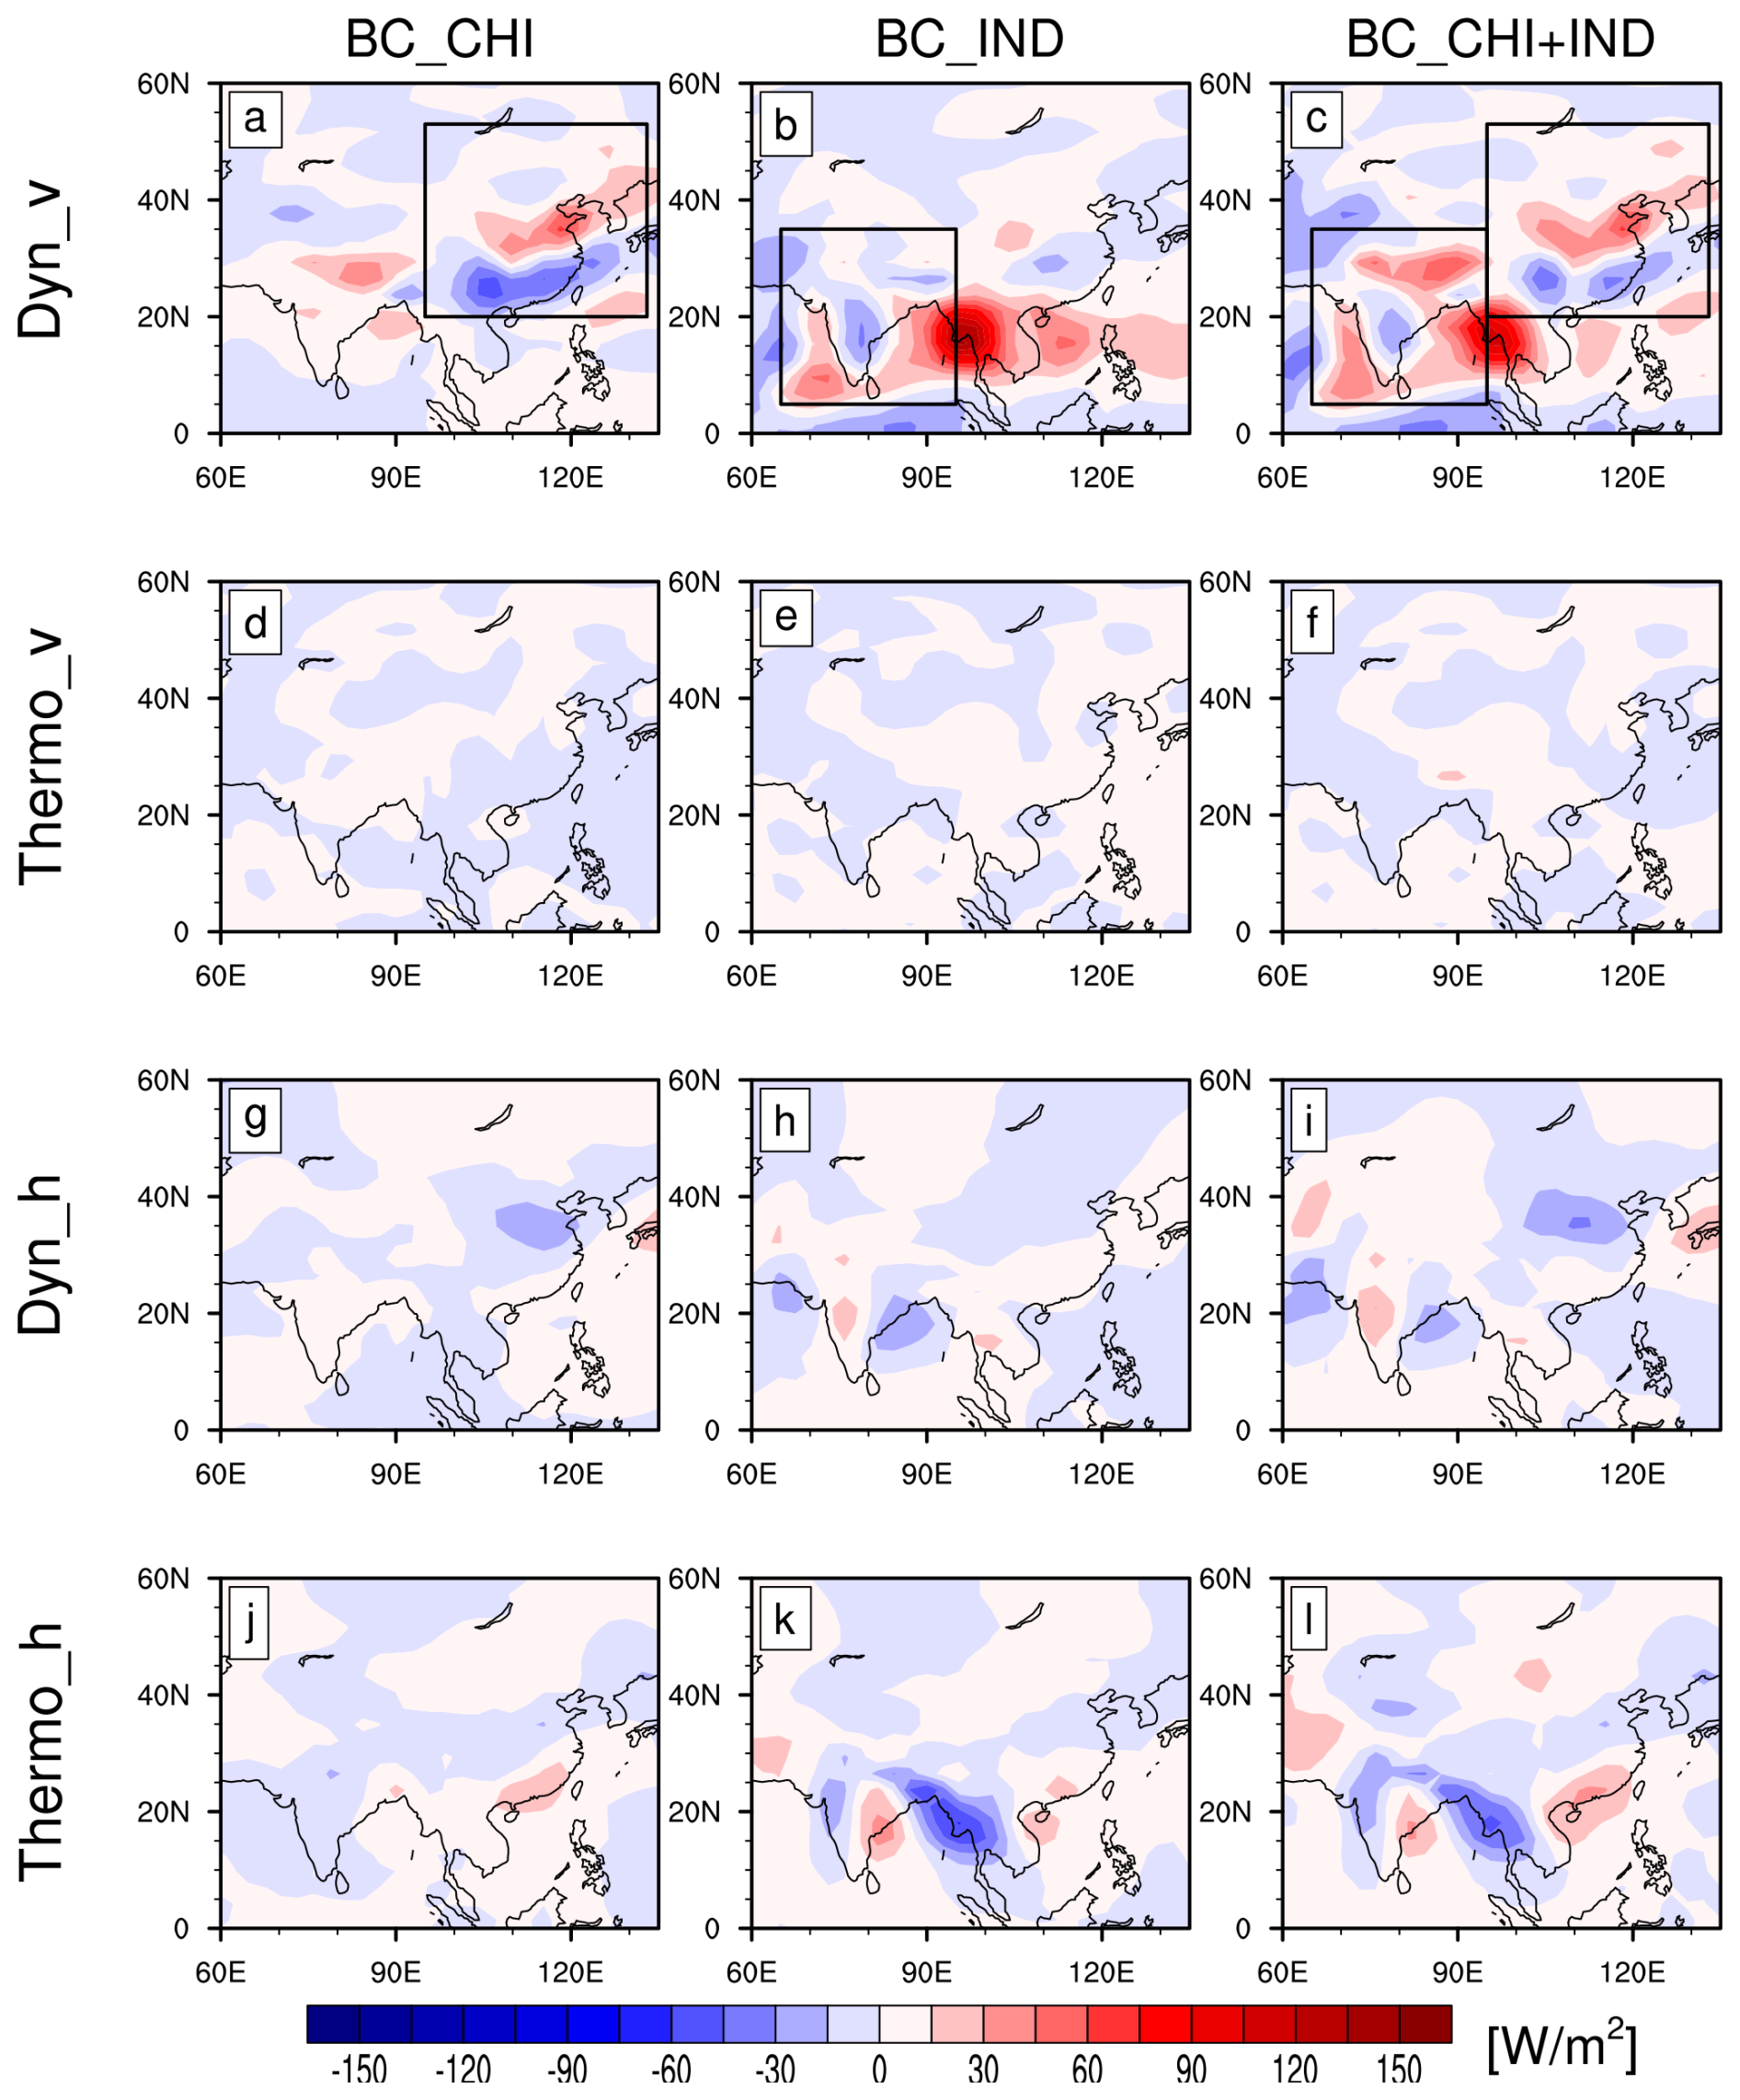
Figure 9Summer spatial patterns of responses in the four terms decomposed by δHm in BC_CHI, BC_IND, and BC_CHI+IND. (a–c) The dynamic components with changes in vertical atmospheric circulations (δHDyn_v), (d–f) the thermodynamic components with changes in vertical atmospheric circulations (δHThermo_v), (g–i) the dynamic components with changes in horizontal DSE gradients (δHDyn_h), and (j–l) the thermodynamic components with changes in horizontal DSE gradients (δHThermo_h). The black squares highlight the regions where BC is perturbed. Unit: W m−2.
Based on the above analysis, we conclude that vertical movement is the primary contributor to δHm. As expected, the spatial patterns of responses in vertical velocity (ω) at 500 hPa correspond well to those in δHDyn_v (Fig. 10a–c). Anomalous ascent corresponds to the increase in δHDyn_v, leading to more precipitation, which offsets the precipitation reduction driven by decreased δQ, while anomalous descent amplifies precipitation suppression caused by the reduced δQ.
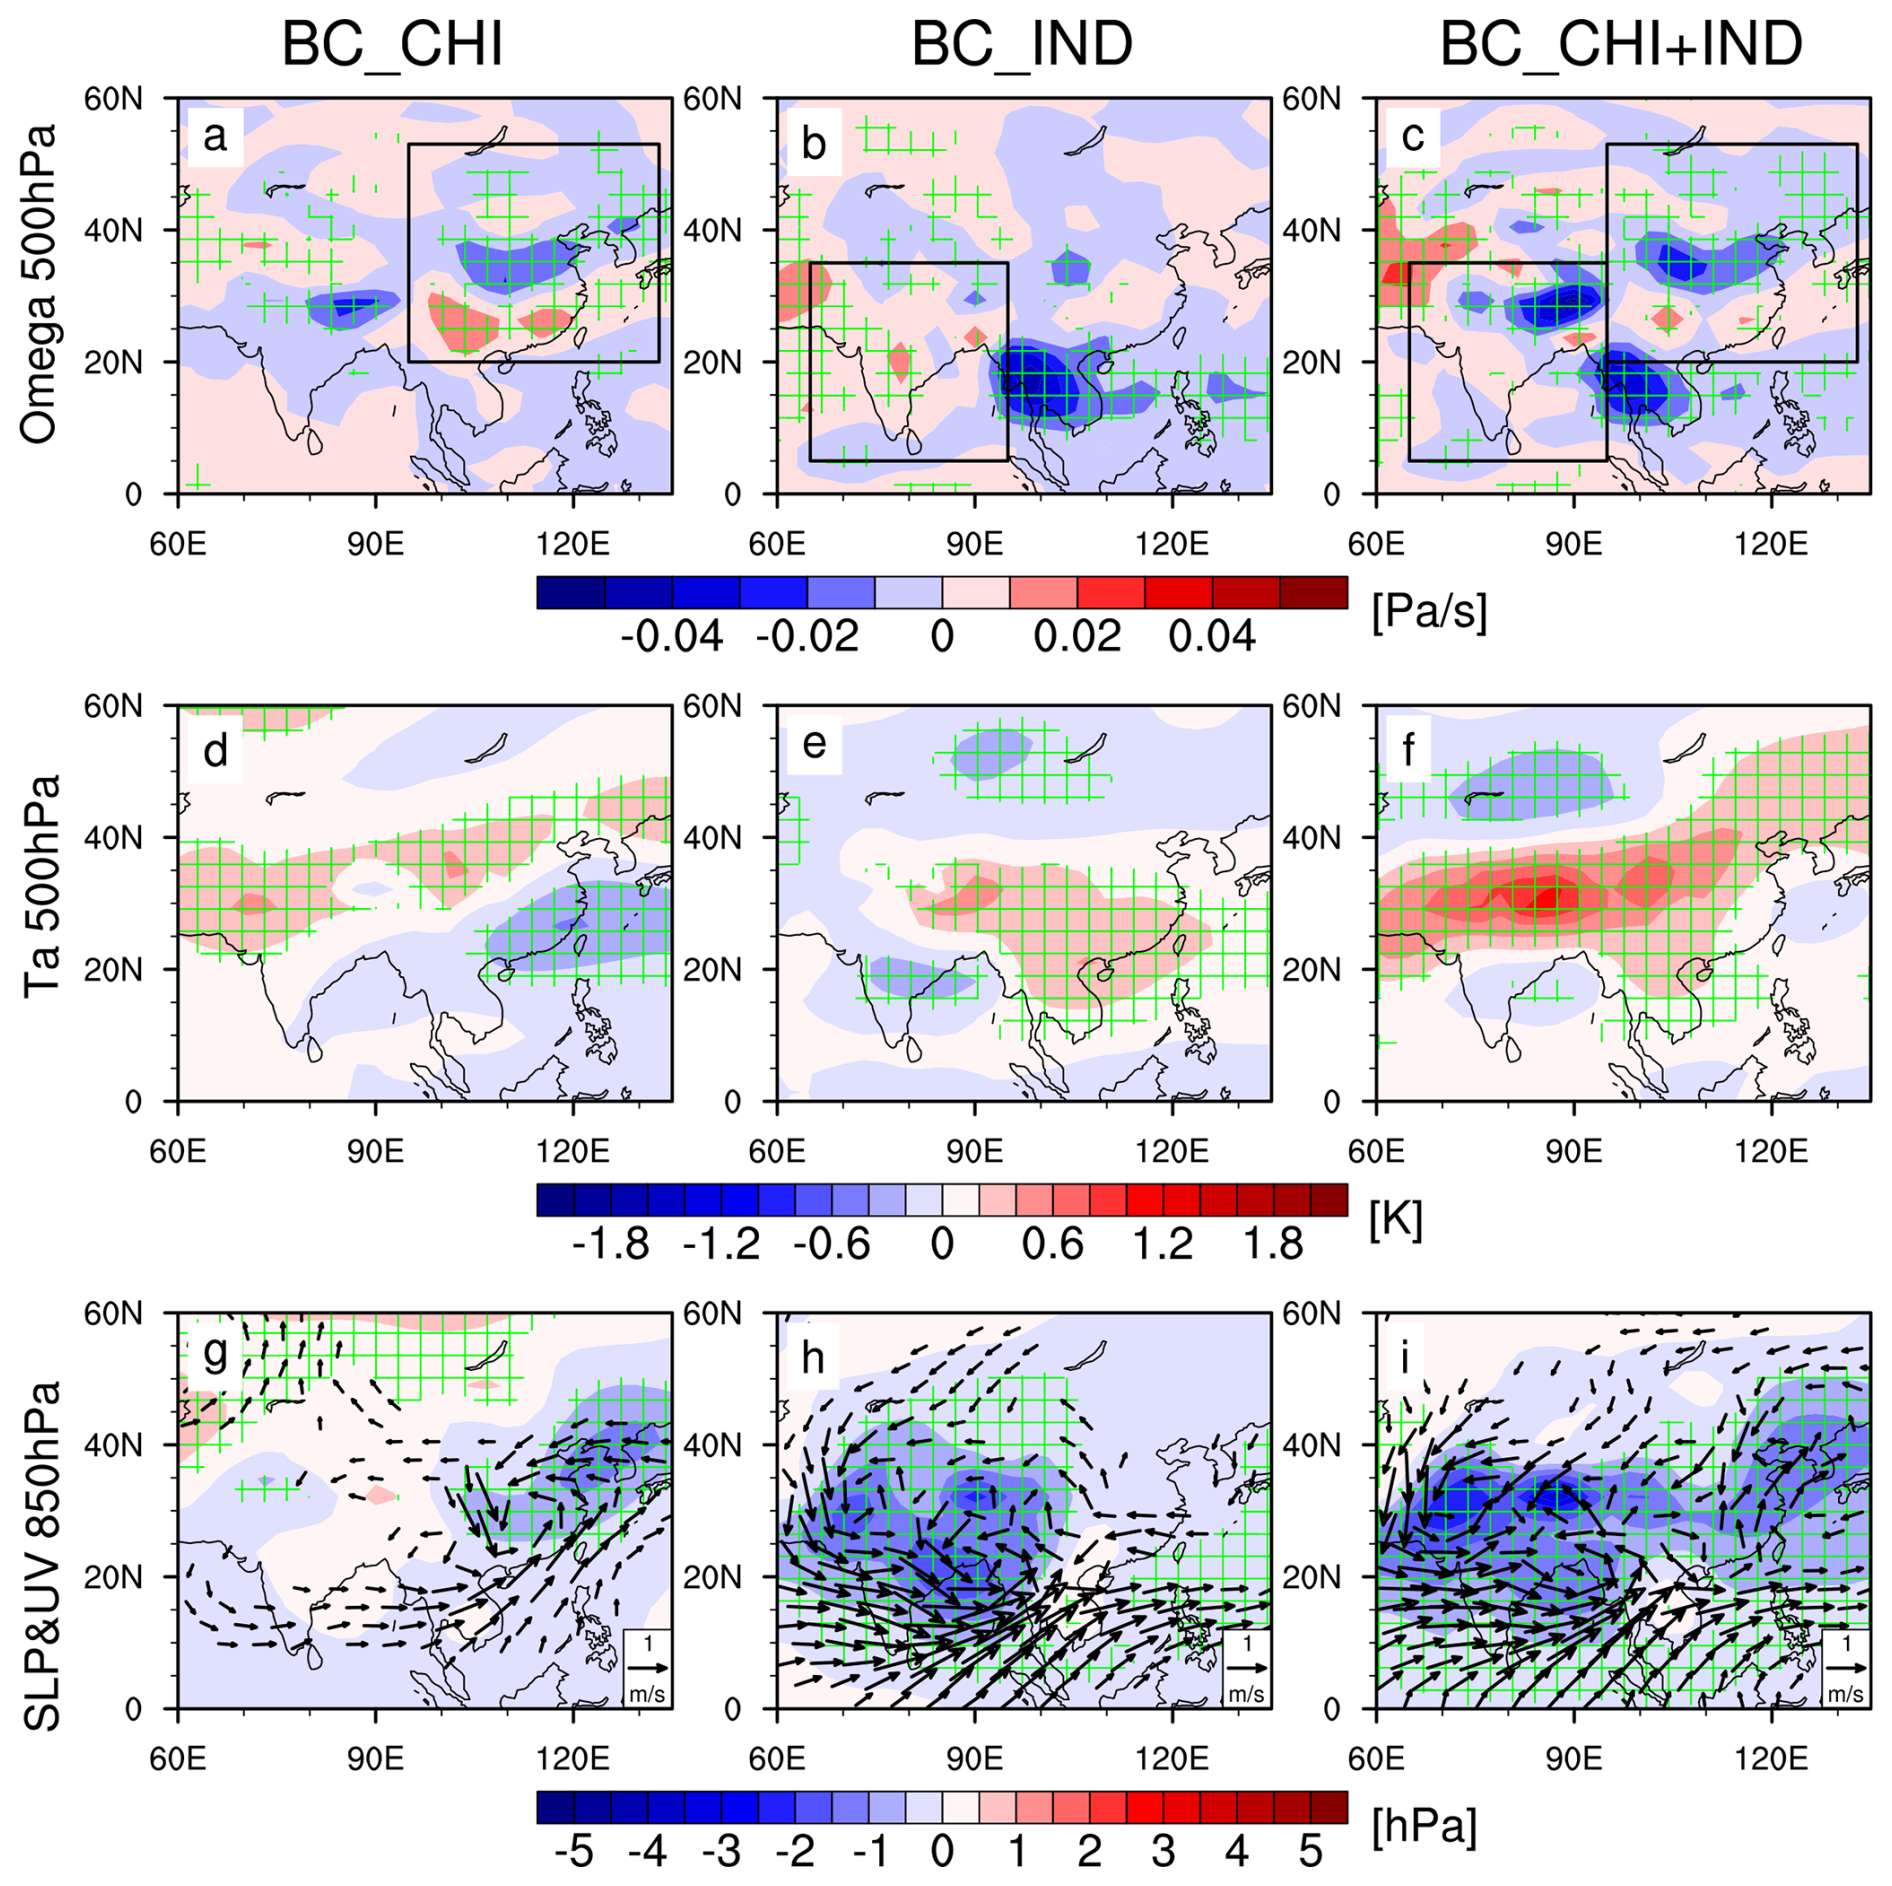
Figure 10Summer spatial patterns of responses in (a–c) ω at 500 hPa (unit: Pa s−1), (d–f) Ta at 500 hPa (unit: K), and (g–i) SLP (unit: hPa) and horizontal wind at 850 hPa (unit: m s−1) in BC_CHI, BC_IND, and BC_CHI+IND. The green grid lines indicate the regions where the responses are statistically significant above a 95 % level based on a two-tailed Student's t test. Wind vectors are only shown for grid boxes where at least one component of the wind significant above the 95 % level is shown. The black squares highlight the regions where BC is perturbed.
Why does the vertical velocity exhibit such changes? It seems to be related to the tropospheric temperature responses, reflected by a good corresponding relationship between the ω and Ta responses at 500 hPa (Fig. 10a–f). The warm anomalies favor a divergence in the middle troposphere, which in turn is associated with anomalous ascent. The cold anomalies are associated with a convergence and descending motion. The abovementioned relationship also exists in the other seasons, and it is more pronounced at 850 hPa (Figs. 4 and S17).
From the transects of zonal-mean diabatic heating over the perturbation regions, changes to tropospheric heating can be seen more clearly (Fig. 11). Under BC_CHI, the responses in diabatic heating show a meridional dipolar structure through the whole troposphere over East China, with cooling over the region to the south of 32° N (the Yangtze River basin), and warming to the north (Fig. 11a). The dipolar pattern corresponds well to the meridional distributions of precipitation, vertical velocity, and Ta at 500 hPa. The cooling center located in the middle troposphere is due to the reduced latent heat release caused by the substantial decrease in precipitation over South China. The heating center in the lower troposphere in the north mainly results from SW absorption by increased BC aerosol. The difference between South China and North China is associated with the larger AOD perturbation imposed north of the Yangtze basin in SyRAP–FORTE2 (Fig. S1). In BC_CHI+IND, there is a similar dipolar pattern, except for warming in the lower troposphere to the south of 30° N (Fig. 11b). The warming is related to the increased precipitation over South China because of the BC aerosols over India.
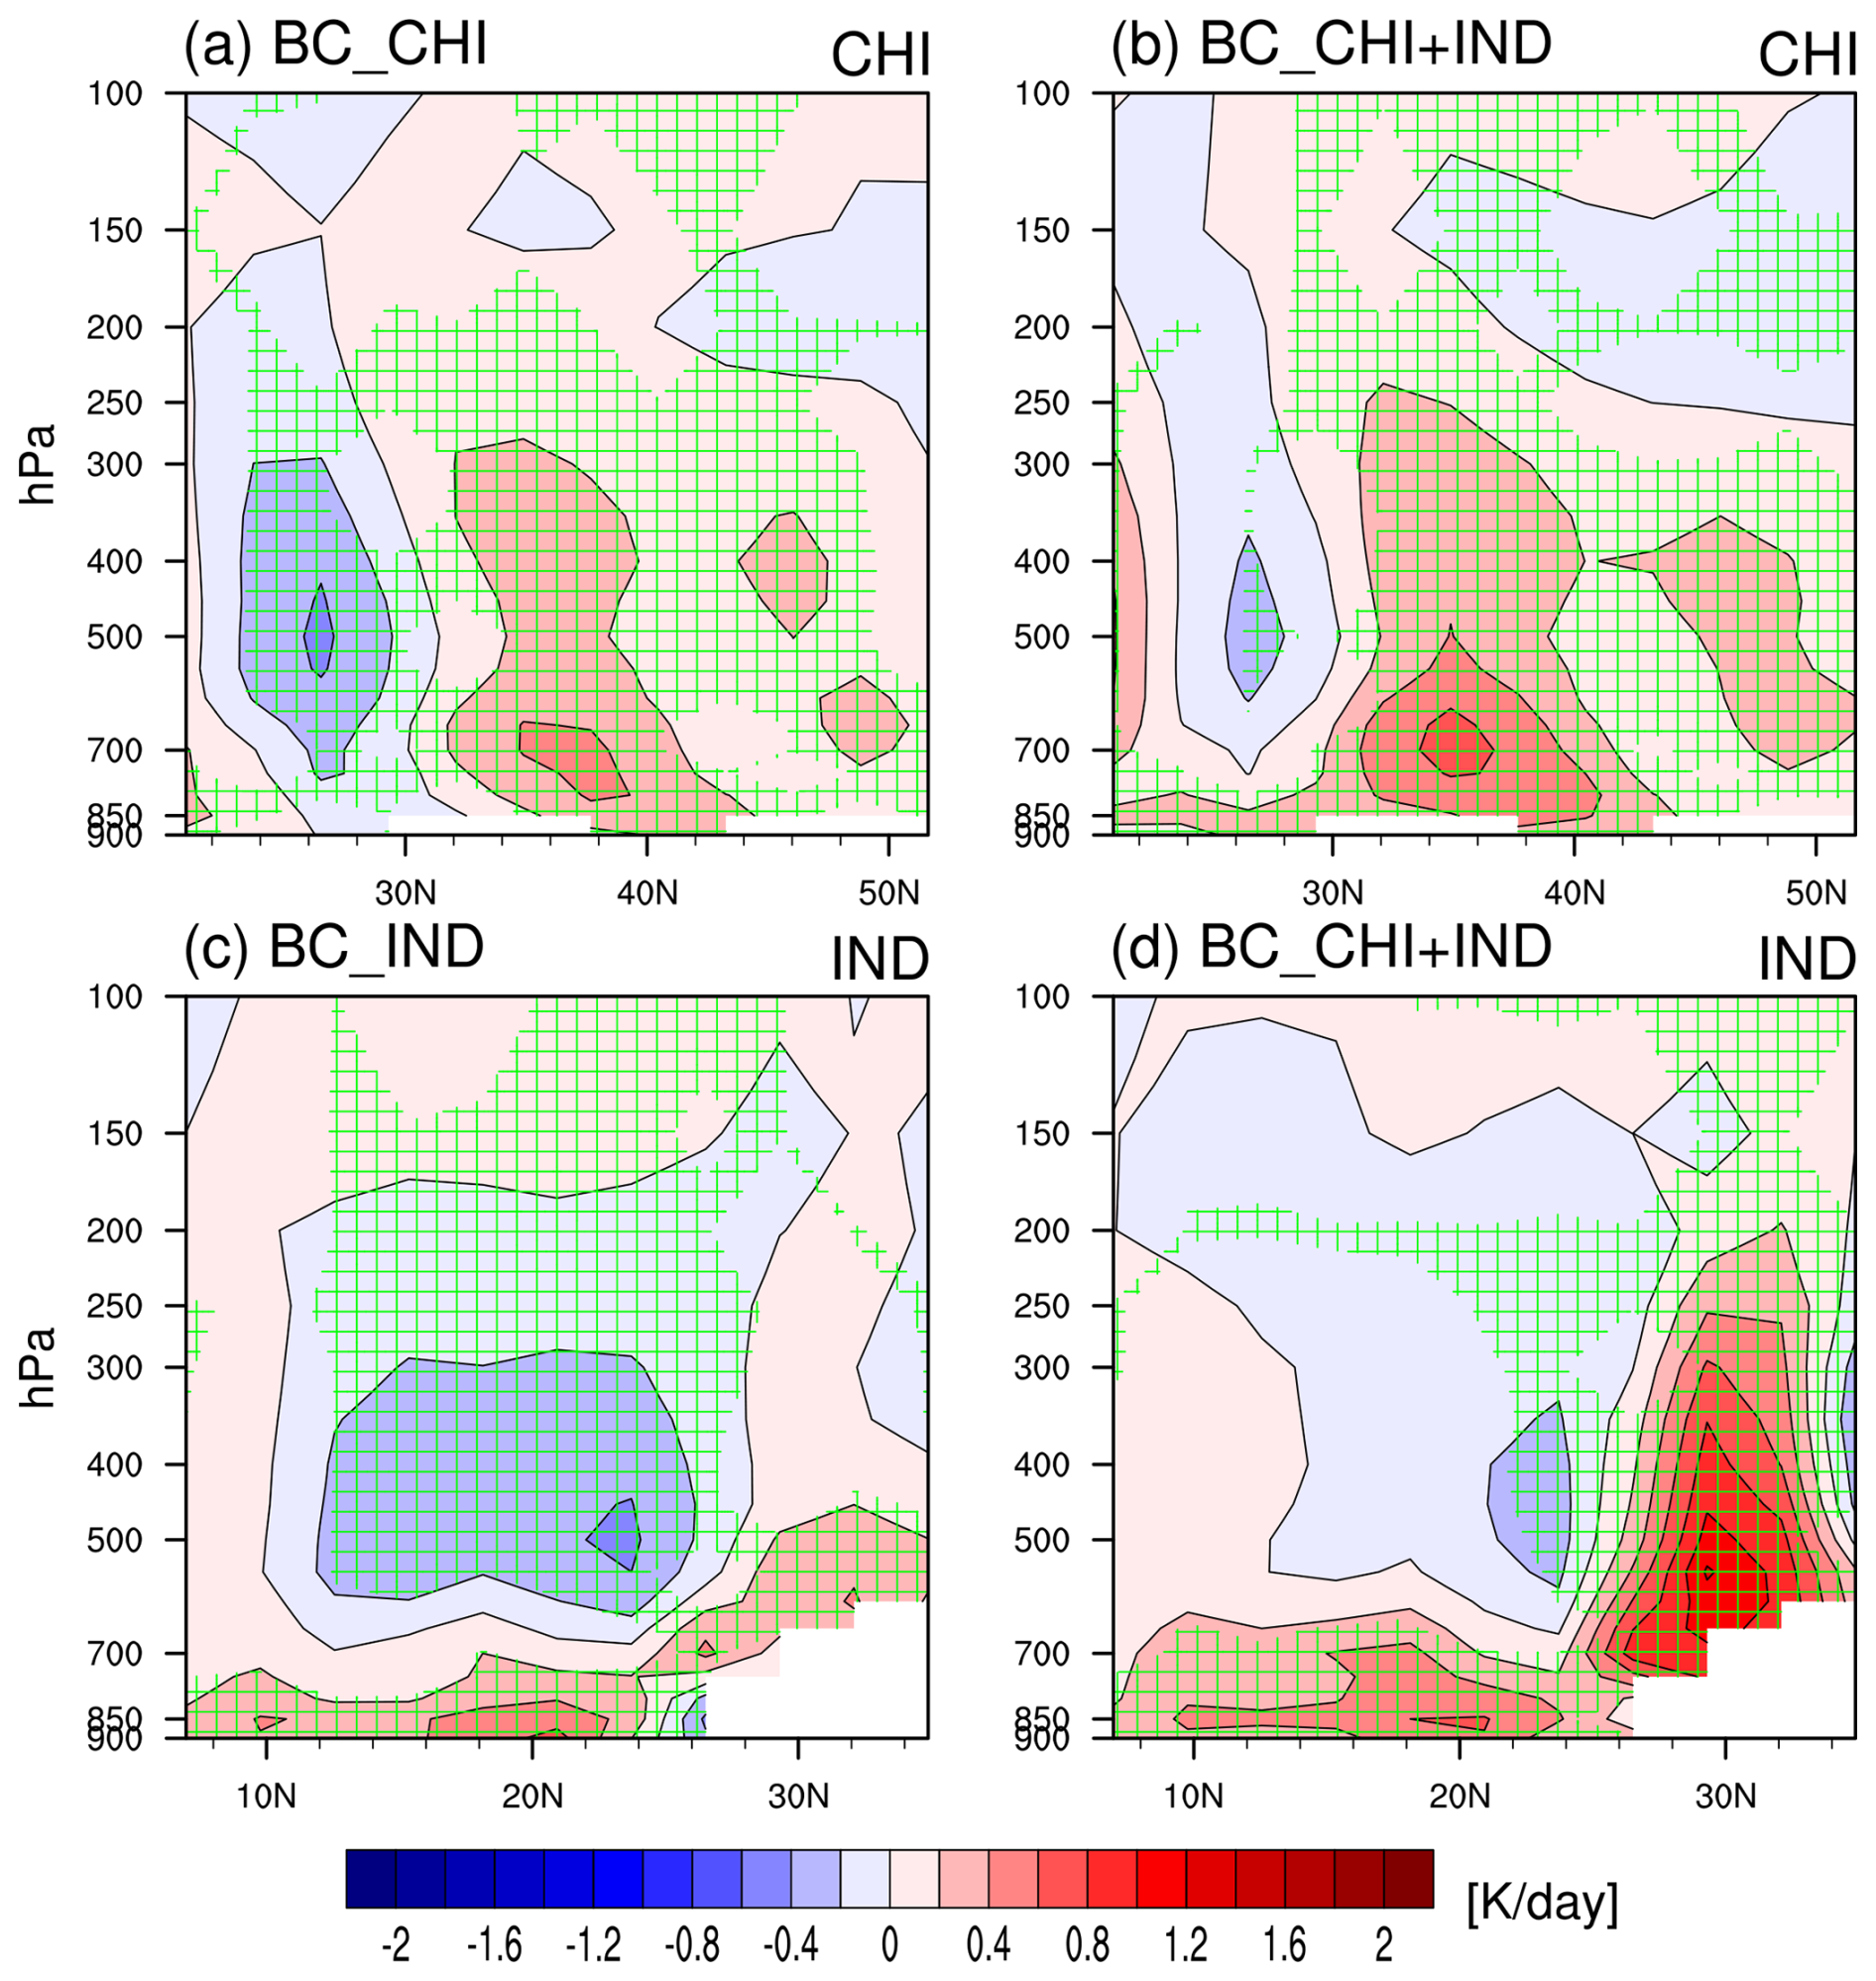
Figure 11Zonal mean of diabatic heating responses averaged over (a, b) East China (95–133° E, the black square in Fig. 10a) for BC_CHI and BC_CHI+IND and (c, d) India (65–95° E, the black square in Fig. 10b) for BC_IND and BC_CHI+IND in summer. The green grid lines indicate the regions where the responses are statistically significant above the 95 % level based on a two-tailed Student's t test. The white part indicates a symbol of topography. Unit: K d−1.
For India in BC_IND, there is also a cooling center associated with the reduced precipitation in the middle troposphere (Fig. 11c), corresponding to a cold anomaly and descending motion at 500 hPa (Fig. 10b, e). In the lower troposphere, warming can be seen south of the Tibetan Plateau. Compared with BC_IND, the cold anomaly is weaker, but the warm anomalies are strengthened under BC_CHI+IND (Fig. 11d). Hence, a significant ascending motion can be found in northeastern India resulting from the effect of increased BC over East Asia (Fig. 10c) and is consistent with that in Herbert et al. (2022). In the other three seasons, however, unlike in summer, there is no cooling center in the middle troposphere, and the heating centers are situated in the lower troposphere (Fig. S18). Overall, the diabatic heating induced by the increased BC aerosols in the lower troposphere leads to an ascending motion, explaining the increased δH over the perturbation regions.
Considering that the dynamic and thermodynamic effects of horizontal atmospheric circulations make some contributions to δH, we look at the changes in lower-tropospheric horizontal circulation in response to changes in regional BC aerosols (Fig. 10g–i). Under BC_CHI, the cyclone anomaly over East China leads to anomalous easterly wind over North China, with the cutoff of the moisture supply from the south (Fig. 10g). Under BC_IND, the westerly anomalies associated with the cyclonic circulation over India favor strengthening the Indian summer monsoon, which corresponds to the increase in δHDyn_h (Fig. 10h). The responses in the circulations to both regions at once can be seen as the sum of responses to the two separate regions (Fig. 10i). Additionally, there is a cyclonic circulation over East China and an anticyclonic circulation over central China in winter under BC_CHI (Fig. S19), leading to anomalous northerly wind across central China and then suppressed precipitation over the region, which is in agreement with the decrease in δHDyn_h (Fig. S14g). The changes in horizontal circulations are related to the changes in Ta and ω in the lower troposphere (Figs. 4 and S17).
3.5 Energy budget analysis in other coupled models
To evaluate the precipitation response and the mechanisms in FORTE2, we compare the results of energy budget analysis (see Eq. 1) in the PDRMIP simulations forced by 10 times the present-day Asian BC concentrations/emissions in five CMIP-class models to those in the SyRAP–FORTE2 BC_CHI+IND experiment. Spatial patterns of summer energy budgets in the PDRMIP and FORTE2 models are illustrated in Fig. 12. There are significant decreases in δQ over most of Asia in all of the PDRMIP models, which is generally consistent with the results under BC_CHI+IND (Fig. 12g–l). Three models (CESM1-CAM5, GISS-E2-R, and NorESM1) have similar distributions of δQ to BC_CHI+IND, showing a maximum center in North China and northern India. δH increases significantly in India and most of East China in these models (Fig. 12m, n, q), again roughly resembling the changes in BC_CHI+IND (Fig. 12r), while the other two models show a significant increase in northern India and North China with weaker magnitudes (Fig. 12o–p). The PDRMIP multi-model mean changes in δH (Fig. 7 in Liu et al., 2018) are also similar to the changes in BC_CHI+IND. In addition, GISS-E2-R and MIROC show evident decreases in δH and precipitation in Southeast Asia, while the other three models show no significant changes. This is contrary to the significant increases seen in FORTE2. There are large differences in the total LcδP responses across these models (Fig. 12a–f). However, some precipitation changes are consistent in most of the models, such as decreases over South China and increases over North China and northern India.
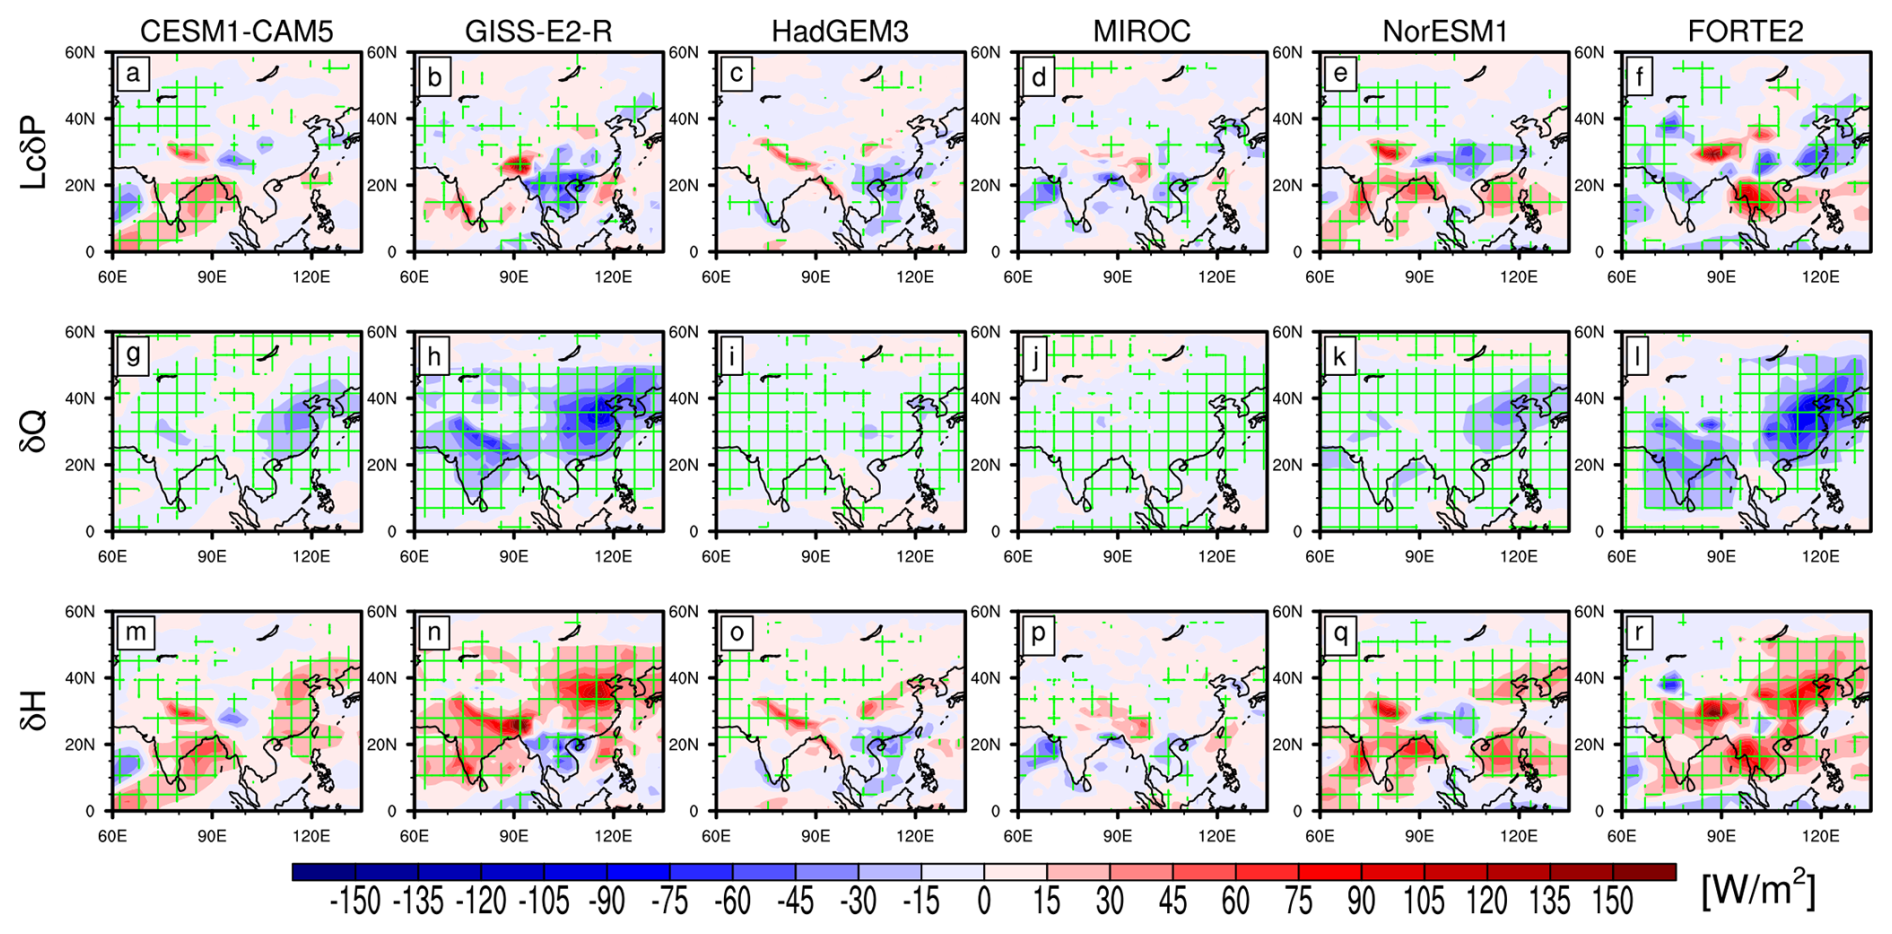
Figure 12Summer spatial patterns of responses of the atmospheric energy budget terms in the five PDRMIP models and the BC_CHI+IND simulation in FORTE2. (a–f) LcδP, (g–l) δQ, and (m–r) δH. The green grid lines indicate the regions where the responses are statistically significant above a 95 % level based on a two-tailed Student's t test. Unit: W m−2.
Figure 13 shows the regional means of each energy budget term over East China and India in summer under the PDRMIP and FORTE2 models. There is a weak and insignificant reduction in LcδP from −0.6 (HadGEM3) to −7.2 W m−2 (NorESM1) for East China, which is comparable to the value of −3.8 W m−2 under BC_CHI+IND (Fig. 13a). Hence, the increased BC perturbations over Asia lead to slight decreases in precipitation over East China in all of the models. The regional means range from −1.2 (MIROC) to 13.7 W m−2 (NorESM1) for India (Fig. 13b). Except for MIROC, LcδP in the other models has stronger increases than that under BC_CHI+IND, about 0.6 W m−2, which may be related to the larger drying bias of Indian summer precipitation in FORTE2 or the much larger BC perturbation in PDRMIP.
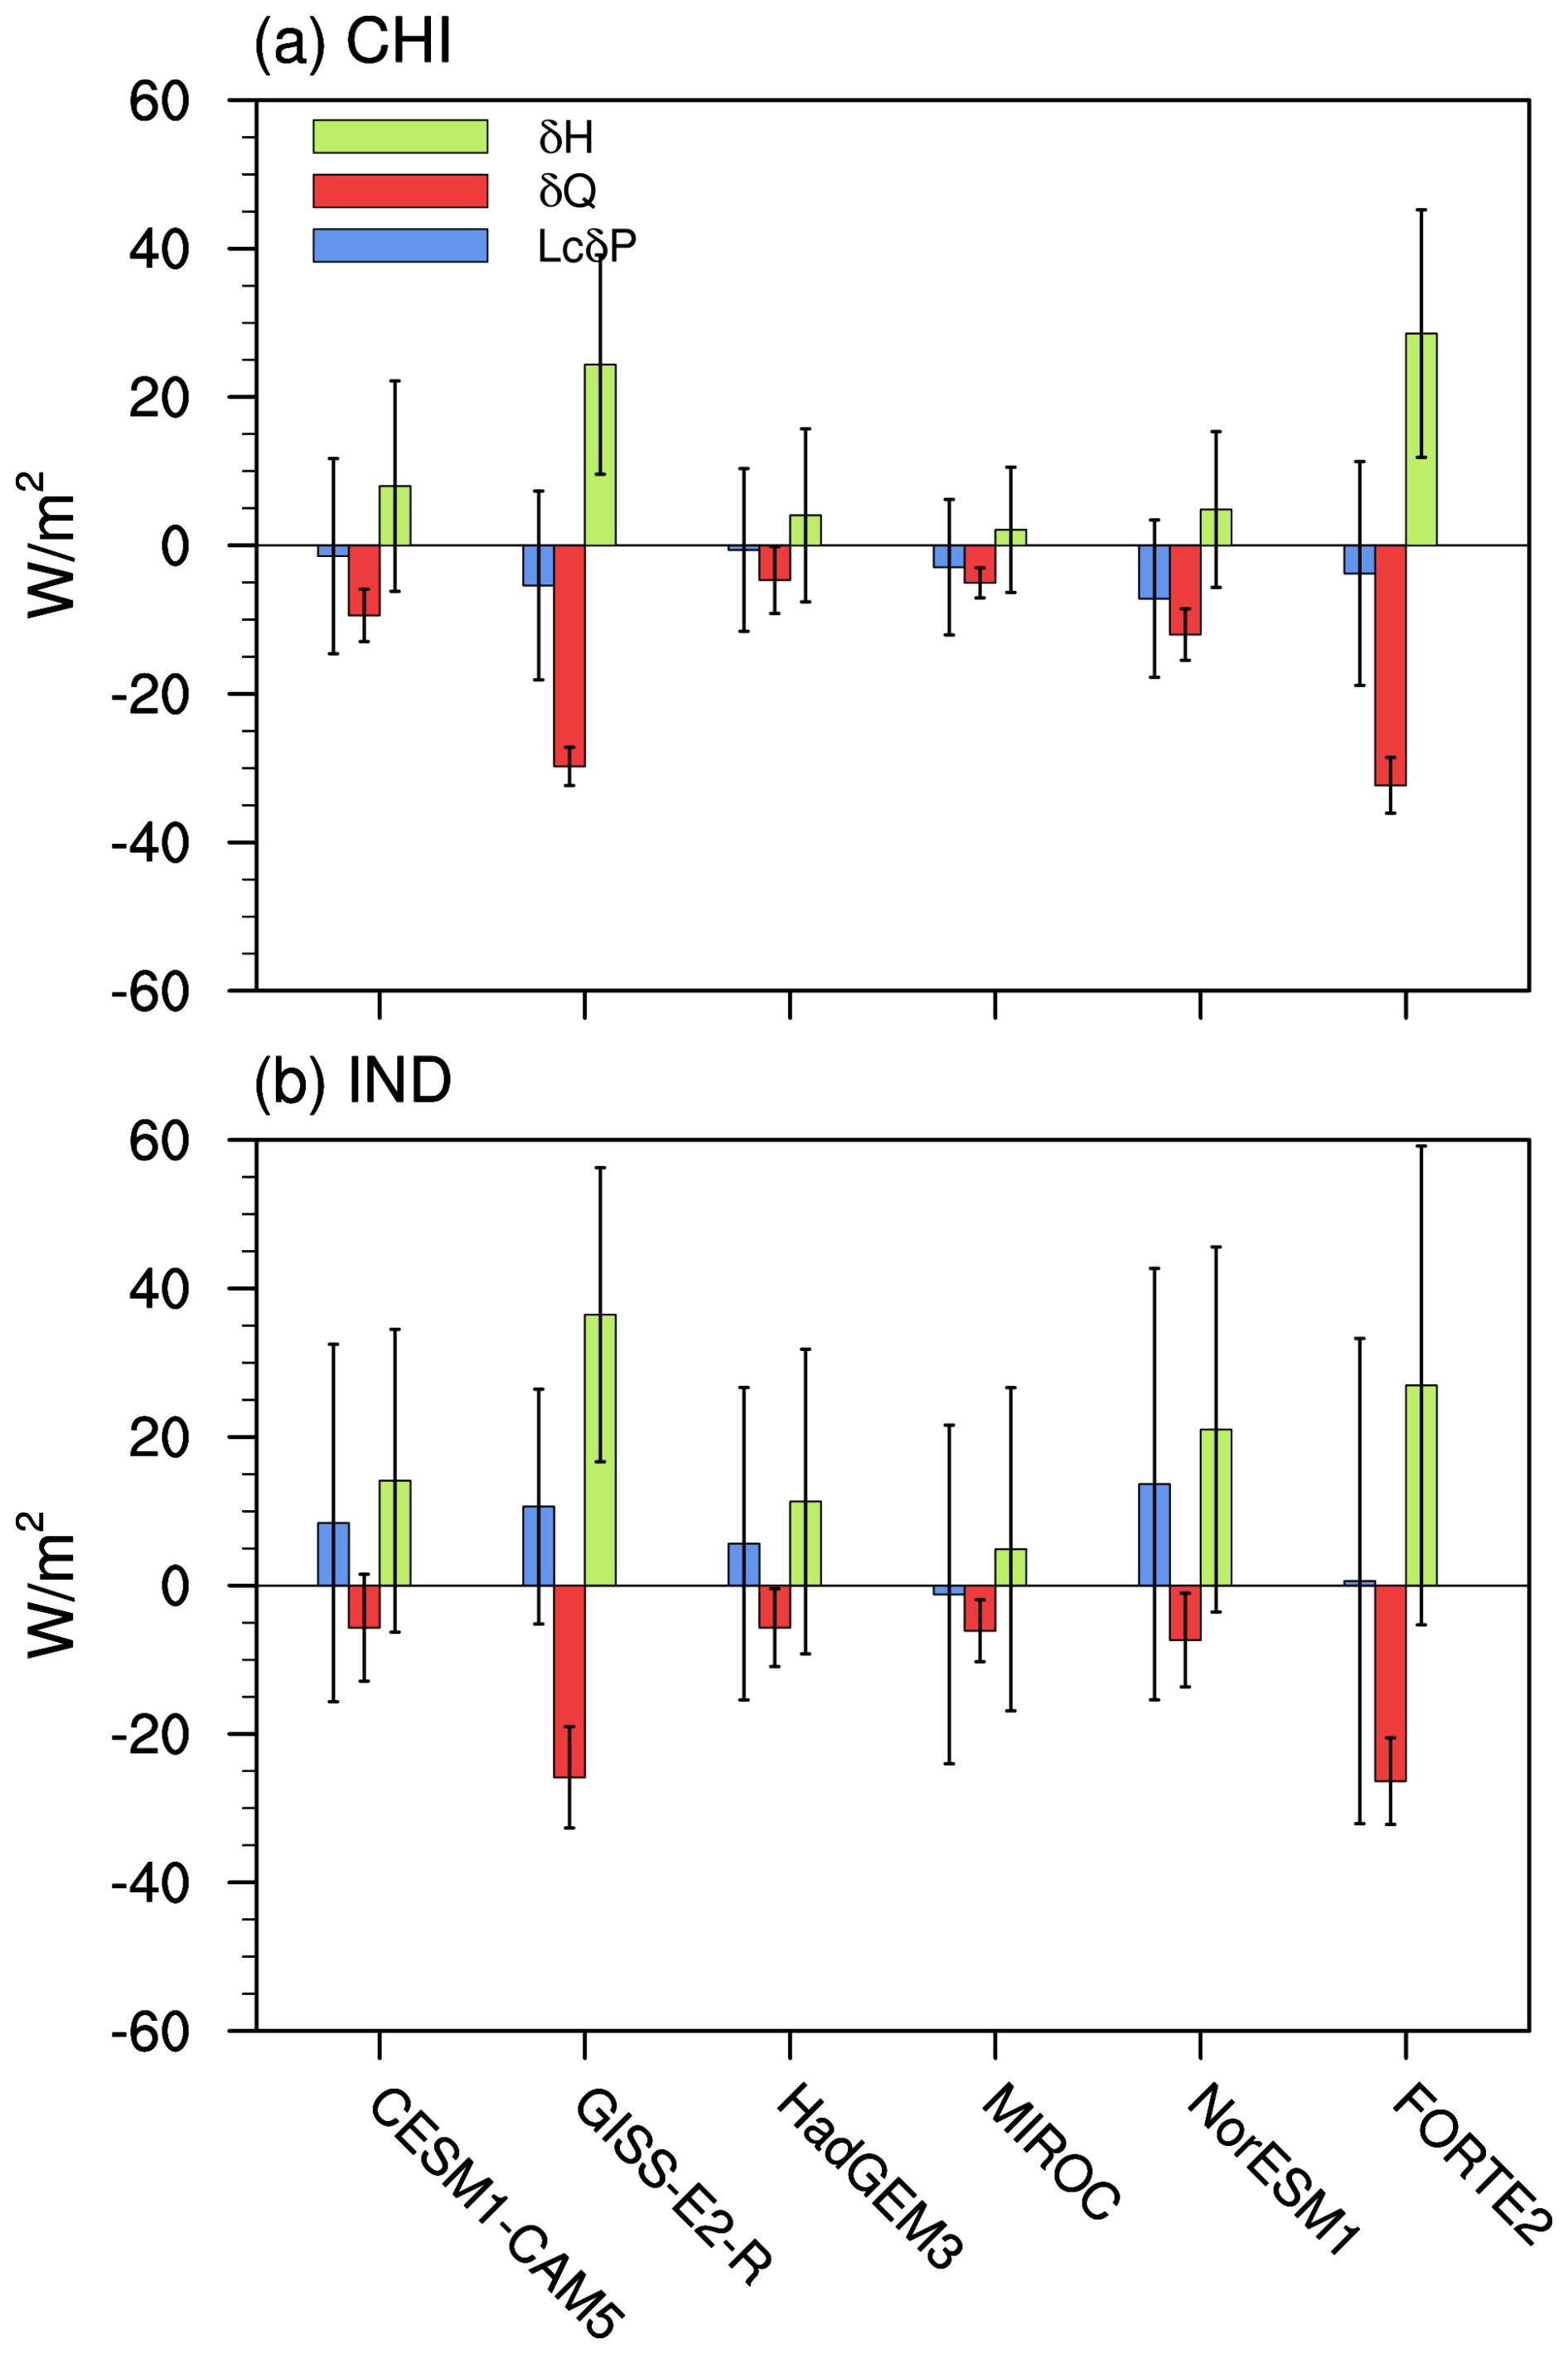
Figure 13Summer area-averaged responses of the atmospheric energy budget terms over (a) East China (CHI: 95–133° E, 20–53° N) and (b) India (IND: 65–95° E, 5–35° N) in the five PDRMIP models and the BC_CHI+IND simulation in FORTE2. Error bars represent ±1 standard deviation of the response. Unit: W m−2.
The effect of δQ decreases LcδP, with a large range from −4.7 (HadGEM3) to −29.8 W m−2 (GISS-E2-R), for East China, while δH has an opposing effect, from 2.1 (MIROC) to 24.4 W m−2 (GISS-E2-R) (Fig. 13a). Similarly, δQ changes from −5.7 (HadGEM3) to −25.8 W m−2 (GISS-E2-R) for India and δH from 4.9 (MIROC) to 36.5 W m−2 (GISS-E2-R) (Fig. 13b). The magnitudes in δQ and δH under the PDRMIP models are much smaller than those in FORTE2 in both regions, except for in relation to GISS-E2-R. The negative effect of δQ and the positive effect of δH can also be seen in the PDRMIP multi-model mean for the whole Asian region (Liu et al., 2018). There are substantial differences in the magnitudes and spatial patterns of precipitation responses between FORTE2 and the PDRMIP models, which are to be expected from their large range of aerosol radiative forcing and climatological precipitation values. However, these precipitation responses among these models are overall consistent qualitatively, indicating that thermodynamic processes dominantly decrease precipitation, while dynamic processes increase precipitation and partially offset the effects of δQ.
In this study, we have investigated the Asian climatic responses to adding BC aerosols to two separate regions (East China and India) and both regions at once, and we have examined the associated physical processes with SyRAP simulations based on the reduced-complexity climate model FORTE2. Our main findings are as follows.
BC increases over East Asia or South Asia lead to a local strong surface cooling and lower-tropospheric air temperature warming in all four seasons, with seasonal differences in magnitude and spatial distribution. The responses in temperature are dominated by the substantial decreases in surface SW radiation due to SW absorption by BC aerosols. BC over East Asia causes significant drying in South China and Northeast China in spring, summer, and autumn. In winter, there is a significant reduction in central China. BC over South Asia induces a substantial decrease in rainfall in India in summer. Also, South Asian BC induces significant temperature decreases and precipitation increases in Southeast Asia during summer and autumn.
Responses in temperature and precipitation to Asian BC forcing are mostly linear regionally in all four seasons. There are relatively small decreases in precipitation responses to adding BC over both regions simultaneously, compared to the local reductions in precipitation responses to BC increases over East Asia and South Asia separately. This is because BC over East Asia increases precipitation in northeastern India, while BC over South Asia increases precipitation over southern and central China.
Using an energy budget analysis, we find that reductions in the energy of local precipitation (LcδP) over the perturbation regions result from decreases in net atmospheric diabatic cooling (δQ). The increases in the dry-static-energy (DSE) flux divergence (δH) play a role in offsetting the effects of δQ to a large extent. Consequently, the responses in precipitation to Asian BC can be considered the result of interactions between thermodynamic and dynamic processes. For δQ, the reductions are mainly due to the strong atmospheric heating (−δSWA). For δH, the increases depend mainly on the positive changes in the dynamic processes associated with vertical atmospheric circulations (δHDyn_v). We find that δHDyn_v patterns correspond well to vertical velocity change patterns in the middle and lower troposphere. Anomalous ascent is primarily triggered by the warming in the middle and lower troposphere over North China in summer and in most of Asia in the other seasons. However, there is anomalous descent in southern China and central India in summer, which is a result of cool anomalies in the middle troposphere due to the reduced latent heat release caused by the substantial decrease in precipitation. The difference in diabatic heating at the middle and lower troposphere is related to the difference in spatial distributions of AOD in the different seasons.
It is well known that the East Asian summer monsoon (EASM) and SASM underwent weakening trends during the second half of the 20th century (Wang, 2001; Bollasina et al., 2011). Although the variations in the Asian summer monsoon (ASM) have been attributed to many factors, including internal variability and external forcing, the strong increases in BC emissions from East Asia and South Asia (Lund et al., 2019) could, according to this study, have played a role in weakening the ASM over the past decades. The increased BC could also alleviate the enhanced precipitation over South China due to GHG increase since the mid-1990s (Tian et al., 2018). Since the early 2010s, anthropogenic aerosols (including BC and sulfate) have been decreasing in East China, while they have continued to rise in India; these are trends which are expected to continue over the coming decades (Lund et al., 2019; Samset et al., 2019). Hence, there is a new dipole pattern characterized by decreasing aerosols over East China and increasing aerosols over India. Given that responses to Asian BC forcing are linear regionally in the SyRAP–FORTE2 simulations, the impacts of the dipole pattern on the Asian climate can be roughly estimated by the sum of responses to BC over China multiplied by −1 and responses to BC over India. The result shows that there are warm anomalies in North China and cold anomalies in South China, Southeast Asia, and most of India, and there are positive precipitation anomalies over most of China (especially South China) and Southeast Asia and negative anomalies over India (Fig. S20). This is overall consistent with the result in Xiang et al. (2023), although their result involves the combined effect of BC and sulfate.
Comparative analysis with the CGCM/ESM results from PDRMIP has elucidated the key physical mechanisms of Asian climate responses to regional BC perturbations. The thermodynamic process dominates the precipitation reduction, while the dynamic process provides partial compensation. The SyRAP–FORTE2 experiment series allows systematic comparison of impacts of different Asian subregions, aerosol species, and climate backgrounds within a consistent modeling framework. Notably, FORTE2 includes a parameterization of ACI, enabling direct comparison of the relative contributions of ARI and ACI. Related work will be conducted in a next step and may provide new insights into regional aerosol impacts.
Large differences in the magnitude and spatial pattern of precipitation responses to BC exist across all the models. These discrepancies may partly be due to the much larger BC perturbation in PDRMIP and partly due to model-specific differences. The FORTE2 simulation only accounts for ARI effects, incorporating the semi-direct effect of BC, while PDRMIP models exhibit varying treatments of indirect effects. The models with all aerosol indirect effects (particularly CESM1-CAM5 and NorESM1) increase precipitation over India, contrasting with the reduced precipitation in FORTE2. Additionally, despite the much weaker BC forcing in FORTE2, it produces larger thermodynamic (δQ) and dynamic (δH) responses than most PDRMIP models (except for GISS-E2-R). This may arise from the absence of wet-deposition feedbacks in FORTE2 (Stjern et al., 2024). Further work to understand the mechanisms behind model differences in the response to BC would help to reduce uncertainties and improve confidence in future Asian climate change projections.
The NOAA-CIRES-DOE 20th Century Reanalysis V3 (20CR) datasets are obtained from https://psl.noaa.gov/data/gridded/data.20thC_ReanV3.html (Compo et al., 2011). HadSLP is provided by the UK Met Office Hadley Centre and can be downloaded at http://www.metoffice.gov.uk/hadobs/hadslp2/ (Allan and Ansell, 2006). The PDRMIP data can be accessed through the World Data Center for Climate (WDCC) data server at https://doi.org/10.26050/WDCC/PDRMIP_2012-2021 (Andrews et al., 2021). Data of the SyRAP–FORTE2 experiments reported in this paper are available without restriction on reasonable request to Camilla W. Stjern at the CICERO Center for International Climate Research.
The supplement related to this article is available online at https://doi.org/10.5194/acp-25-7647-2025-supplement.
FL and BHS designed the study. CWS, LJW, and MJ ran the model simulations. FL carried out the analysis and visualized the results. All authors discussed the results and edited the paper.
At least one of the (co-)authors is a member of the editorial board of Atmospheric Chemistry and Physics. The peer-review process was guided by an independent editor, and the authors also have no other competing interests to declare.
Publisher's note: Copernicus Publications remains neutral with regard to jurisdictional claims made in the text, published maps, institutional affiliations, or any other geographical representation in this paper. While Copernicus Publications makes every effort to include appropriate place names, the final responsibility lies with the authors.
Some of the research presented in this paper was carried out on the High Performance Computing Cluster supported by the Research and Specialist Computing Support service at the University of East Anglia. We acknowledge the Center for Advanced Study in Oslo, Norway, which funded and hosted our HETCLIF center during the academic year of 2023–2024. Feifei Luo is supported by the Scientific Research of Chengdu University of Information Technology (grant no. KYTZ202210). Bjørn H. Samset, Camilla W. Stjern, Laura J. Wilcox, Manoj Joshi, and Robert J. Allen were supported by the Research Council of Norway (grant no. 324182 (CA3THY)). The authors acknowledge the editor, Yuan Wang, and the three anonymous reviewers for their valuable comments that improved the paper.
This research has been supported by the Second Tibetan Plateau Scientific Expedition and Research Program (grant no. 2019QZKK010203).
This paper was edited by Yuan Wang and reviewed by three anonymous referees.
Allan, R. and Ansell, T.: A new globally-complete monthly historical gridded mean sea level pressure dataset (HadSLP2): 1850–2004, J. Climate, 19, 5816–5842, https://doi.org/10.1175/JCLI3937.1, 2006 (data available at: http://www.metoffice.gov.uk/hadobs/hadslp2/, last access: 18 July 2025).
Andrews, T., Boucher, O., Fläschner, D., Kasoar, M., Kharin, V. V., Kirkevåg, A., Lamarque, J.-F., Myhre, G., Mülmenstädt, J., Oliviè, D. J. L., Samset, B. H., Sandstad, M., Shawki, D., Shindell, D., Stier, P., Takemura, T., Voulgarakis, A., and Watson-Parris, D.: Precipitation Driver Response Model Intercomparison Project data sets 2013-2021, World Data Center for Climate (WDCC) at DKRZ [data set], https://doi.org/10.26050/WDCC/PDRMIP_2012-2021, 2021.
Betts, A. K. and Miller, M. J.: The Betts-Miller scheme, in: The Representation of Cumulus Convection in Numerical Models of the Atmosphere, Chap. 9, edited by: Emanuel, K. A. and Raymond, D. J., Amer. Meteor. Soc., Meteor. Mon., 24, 107–121, 1993.
Blaker, A. T., Joshi, M., Sinha, B., Stevens, D. P., Smith, R. S., and Hirschi, J. J.-M.: FORTE 2.0: a fast, parallel and flexible coupled climate model, Geosci. Model Dev., 14, 275–293, https://doi.org/10.5194/gmd-14-275-2021, 2021.
Bollasina, M. A., Ming, Y., and Ramaswamy, V.: Anthropogenic aerosols and the weakening of the South Asian summer monsoon, Science, 334, 502–505, https://doi.org/10.1126/science.1204994, 2011.
Bond, T. C., Doherty, S. J., Fahey, D. W., Forster, P., Berntsen, T., DeAngelo, B., Flanner, M., Ghan, S., Kächer, B., Koch, D., Kinne, S., Kondo, Y., Quinn, P. K., Sarofim, M. C., Schultz, M. G., Schulz, M., Venkataraman, C., Zhang, H., Zhang, S., Bellouin, N., Guttikunda, S. K., Hopke, P. K., Jacobson, M. Z., Kaiser, J. W., Klimont, Z., Lohmann, U., Schwarz, J. P., Shindell, D., Storelvmo, T., Warren, S. G., and Zender, C. S.: Bounding the role of black carbon in the climate system: A scientific assessment, J. Geophys. Res.-Atmos., 118, 5380–5552, 2013.
Chen, H., Zhuang, B., Liu, J., Li, S., Wang, T., Xie, X., Xie, M., Li, M., and Zhao, M.: Regional Climate Responses in East Asia to the Black Carbon Aerosol Direct Effects from India and China in Summer, J. Climate, 33, 9783–9800, https://doi.org/10.1175/JCLI-D-19-0706.1, 2020.
Compo, G. P., Whitaker, S., Sardeshmukh, J., Matsui, N., Allan, R. J., Yin, X., Gleason, B. E., Vose, R. S., Rutledge, G., Bessemoulin, P., Brönnimann, S., Brunet, M., Crouthamel, R. I., Grant, A. N., Groisman, P. Y., Jones, P. D., Kruk, M. C., Kruger, A. C., Marshall, G. J., Maugeri, M., Mok, H. Y., Nordli, Ø., Ross, T. F., Trigo, R. M., Wang, X. L., Woodruff, S. D., and Worley, S. J.: The Twentieth Century Reanalysis Project, Q. J. Roy. Meteor. Soc., 137, 1–28, 2011 (data available at: https://psl.noaa.gov/data/gridded/data.20thC_ReanV3.html, last access: 18 July 2025).
Deng, J., Xu, H., Ma, H., and Jiang, Z.: Numerical study of the effect of anthropogenic aerosols on spring persistent rain over eastern China, J. Meteorol. Res., 28, 341–353, 2014.
Dong, B., Wilcox, L. J., Highwood, E. J., and Sutton, R. T.: Impacts of recent decadal changes in Asian aerosols on the East Asian summer monsoon: roles of aerosol–radiation and aerosol–cloud interactions, Clim. Dynam., 53, 3235–3256, https://doi.org/10.1007/s00382-019-04698-0, 2019.
Granier, C., Bessagnet, B., Bond, T., D'Angiola, A., Denier van der Gon, H., Frost, G. J., Heil, A., Kaiser, J. W., Kinne, S., Klimont, Z., Kloster, S., Lamargue, J. F., Liousse, C., Masui, T., Meleux, F., Mieville, A., Ohara, T., Raut, J. C., Riahi, K., Schultz, M. G., Smith, S. J., Thompson, A., Aardenne, J., van der Werf, G. R., and van Vuuren, D. P.: Evolution of anthropogenic and biomass burning emissions of air pollutants at global and regionalscales during the 1980–2010 period, Climatic Change, 109, 163–190, https://doi.org/10.1007/s10584-011-0154-1, 2011.
Gu, Y., Liou, K. N., Xue, Y., Mechoso, C. R., Li, W., and Luo, Y.: Climatic effects of different aerosol types in China simulated by the UCLA general circulation model, J. Geophys. Res., 111, D15201, https://doi.org/10.1029/2005JD006312, 2006.
Guo, L., Highwood, E. J., Shaffrey, L. C., and Turner, A. G.: The effect of regional changes in anthropogenic aerosols on rainfall of the East Asian Summer Monsoon, Atmos. Chem. Phys., 13, 1521–1534, https://doi.org/10.5194/acp-13-1521-2013, 2013.
Herbert, R., Wilcox, L. J., Joshi, M., Highwood, E., and Frame, D.: Nonlinear response of Asian summer monsoon precipitation to emission reductions in South and East Asia, Environ. Res. Lett., 17, 014005, https://doi.org/10.1088/1748-9326/ac3b19, 2022.
Hu, N. and Liu, X.: Modeling study of the effect of anthropogenic aerosols on late spring drought in South China, Acta Meteorol. Sin., 27, 701–715, https://doi.org/10.1007/s13351-013-0506-z, 2014.
Inness, A., Ades, M., Agustí-Panareda, A., Barré, J., Benedictow, A., Blechschmidt, A.-M., Dominguez, J. J., Engelen, R., Eskes, H., Flemming, J., Huijnen, V., Jones, L., Kipling, Z., Massart, S., Parrington, M., Peuch, V.-H., Razinger, M., Remy, S., Schulz, M., and Suttie, M.: The CAMS reanalysis of atmospheric composition, Atmos. Chem. Phys., 19, 3515–3556, https://doi.org/10.5194/acp-19-3515-2019, 2019.
IPCC: Climate Change 2021: The Physical Science Basis. Contribution of Working Group I to the Sixth Assessment Report of the Intergovernmental Panel on Climate Change, edited by: Masson-Delmotte, V., Zhai, P., Pirani, A., Connors, S. L., Péan, C., Berger, S., Caud, N., Chen, Y., Goldfarb, L., Gomis, M. I., Huang, M., Leitzell, K., Lonnoy, E., Matthews, J. B. R., Maycock, T. K., Waterfield, T., Yelekçi, O., Yu, R., and Zhou, B., Cambridge University Press, Cambridge, United Kingdom and New York, NY, USA, 2391 pp., https://doi.org/10.1017/9781009157896, 2021.
Jiang, Y., Liu, X., Yang, X. Q., and Wang, M.: A numerical study of the effect of different aerosol types on East Asian summer clouds and precipitation, Atmos. Environ., 70, 51–63, 2013.
Jiang, Y., Yang, X. Q., Liu, X., Yang, D., Sun, X., Wang, M., Ding, A., Wang, T., and Fu, C.: Anthropogenic aerosol effects on East Asian winter monsoon: The role of black carbon-induced Tibetan Plateau warming, J. Geophys. Res.-Atmos., 122, 5883–5902, https://doi.org/10.1002/2016JD026237, 2017.
Joshi, M., Stringer, M., van der Wiel, K., O'Callaghan, A., and Fueglistaler, S.: IGCM4: a fast, parallel and flexible intermediate climate model, Geosci. Model Dev., 8, 1157–1167, https://doi.org/10.5194/gmd-8-1157-2015, 2015.
Lau, K. M. and Kim, K. M.: Does aerosol strengthen or weaken the Asian monsoon?, in: Mountains: Witnesses of Global Change, edited by: Baudo, R., Tartari, G., and Vuillermoz, E., Elsevier, Amsterdam, the Netherlands, https://doi.org/10.1016/S0928-2025(06)10003-6, 2007.
Lau, K. M., Kim, M. K., and Kim, K. M.: Asian monsoon anomalies induced by aerosol direct forcing: the role of the Tibetan Plateau, Clim. Dynam., 26, 855–664, 2006.
Li, J., Carlson, B. E., Yung, Y. L., Lv, D., Hansen, J., Penner, J., Liao, H., Ramaswamy, V., Kahn, R., Zhang, P., Dubovik, O., Ding, A., Lacis, A., Zhang, L., and Dong, Y.: Scattering and absorbing aerosols in the climate system, Nature Reviews Earth & Environment, 3, 363–379, https://doi.org/10.1038/s43017-022-00296-7, 2022.
Li, Z., Lau, W. K., Ramanathan, V., Wu, G., Ding, Y., Manoj, M. G., Liu, J., Qian, Y., Li, J., Zhou, T., Fan, J., Rosenfeld, D., Ming, Y., Wang, Y., Huang, J., Wang, B., Xu, X., Lee, S. S., Cribb, M., Zhang, F., Yang, X., Takemura, T., Wang, K., Xia, X., Yin, Y., Zhang, H., Guo, J., Zhai, P. M., Sugimoto, N., Babu, S. S., and Brasseur, G. P.: Aerosol and Monsoon Climate Interactions over Asia, Rev. Geophys., 54, 866–929, https://doi.org/10.1002/2015rg000500, 2016.
Liu, L., Shawki, D., Voulgarakis, A., Kasoar, M., Samset, B. H., Myhre, G., Forster, P. M., Hodnebrog, Ø, Sillmann, J., Aalbergsjø, S. G., Boucher, O., Faluvegi, G., Iversen, T., Kirkevåg, A., Lamarque, J., Olivié, D., Richardson, T., Shindell, D., and Takemura, T.: A PDRMIP Multimodel Study on the Impacts of Regional Aerosol Forcings on Global and Regional Precipitation, J. Climate, 31, 4429–4447, https://doi.org/10.1175/JCLI-D-17-0439.1, 2018.
Liu, Z., Bollasina, M. A., and Wilcox, L. J.: Impact of Asian aerosols on the summer monsoon strongly modulated by regional precipitation biases, Atmos. Chem. Phys., 24, 7227–7252, https://doi.org/10.5194/acp-24-7227-2024, 2024.
Lou, S., Yang, Y., Wang, H., Lu, J., Smith, S., Liu, F., and Rasch, P.: Black Carbon Increases Frequency of Extreme ENSO Events, J. Climate, 32, 8323–8333, https://doi.org/10.1175/JCLI-D-19-0549.1, 2019a.
Lou, S., Yang, Y., Wang, H., Smith, S., Qian, Y., and Rasch, P.: Black carbon amplifies haze over the North China Plain by weakening the East Asian winter monsoon, Geophys. Res. Lett., 46, 452–460, https://doi.org/10.1029/2018GL080941, 2019b.
Lund, M. T., Myhre, G., and Samset, B. H.: Anthropogenic aerosol forcing under the Shared Socioeconomic Pathways, Atmos. Chem. Phys., 19, 13827–13839, https://doi.org/10.5194/acp-19-13827-2019, 2019.
Mahmood, R. and Li, S.: Remote influence of South Asian black carbon aerosol on East Asian summer climate, Int. J. Climatol., 34, 36–48, https://doi.org/10.1002/joc.3664, 2014.
Meehl, G. A., Arblaster, J. M., and Collins, W. D.: Effects of black carbon aerosols on the Indian monsoon, J. Climate, 21, 2869–2882, https://doi.org/10.1175/2007JCLI1777.1, 2008.
Menon, S., Hansen, J., Nazarenko, L., Nazarenko, L., and Luo, Y.: Climate effects of black carbon aerosols in China and India, Science, 297, 2250–2253, 2002.
Muller, C. J. and O'Gorman, P. A.: An energetic perspective on the regional response of precipitation to climate change, Nat. Climate Change, 1, 266–271, https://doi.org/10.1038/nclimate1169, 2011.
Myhre, G., Forster, P., Samset, B., Hodnebrog, Ø., Sillmann, J., Aalbergsjø, S. G., Andrews, T., Boucher, O., Faluvegi, G., and Flächner, D.: PDRMIP: A precipitation driver and response model intercomparison project, protocol and preliminary results, B. Am. Meteorol. Soc., 98, 1185–1198, https://doi.org/10.1175/BAMS-D-16-0019.1, 2017.
Persad, G. G., Paynter, D. J., Ming, Y., and Ramaswamy, V.: Competing Atmospheric and Surface-Driven Impacts of Absorbing Aerosols on the East Asian Summertime Climate, J. Climate, 30, 8929–8949, https://doi.org/10.1175/JCLI-D-16-0860.1, 2017.
Ramanathan, V. and Carmichael, G.: Global and regional climate changes due to black carbon, Nat. Geosci., 1, 221–227, https://doi.org/10.1038/ngeo156, 2008.
Recchia, L. G. and Lucarini, V.: Modelling the effect of aerosol and greenhouse gas forcing on the South Asian and East Asian monsoons with an intermediate-complexity climate model, Earth Syst. Dynam., 14, 697–722, https://doi.org/10.5194/esd-14-697-2023, 2023.
Riahi, K., Rao, S., Krey, V., Cho, C., Chirkov, V., Fischer, G., Kindermann, G., Nakicenovic, N., and Rafaj, P.: RCP 8.5 – A scenario of comparatively high greenhouse gas emissions, Climatic Change, 109, 33–57, https://doi.org/10.1007/s10584-011-0149-y, 2011.
Richardson, T. B., Forster, P. M., Andrews, T., and Parker, D.: Understanding the rapid precipitation response to CO2 and aerosol forcing on a regional scale, J. Climate, 29, 583–594, https://doi.org/10.1175/JCLI-D-15-0174.1, 2016.
Samset, B. H., Lund, M. T., Bollasina, M., Myhre, G., and Wilcox, L.: Emerging Asian aerosol patterns, Nat. Geosci., 12, 582–584, https://doi.org/10.1038/s41561-019-0424-5, 2019.
Sperber, K. R., Annamalai, H., Kang, I. S., Kitoh, A., Moise, A., Turner, A., Wang, B., and Zhou, T.: The Asian summer monsoon: an intercomparison of CMIP5 vs. CMIP3 simulations of the late 20th century, Clim. Dynam., 41, 2711–2744, 10.1007/s00382-012-1607-6, 2013.
Stier, P., van den Heever, S. C., Christensen, M. W., Gryspeerdt, E., Dagan, G., Saleeby, S. M., Bollasina, M., Donner, L., Emanuel, K., Ekman, A. M. L., Feingold, G., Field, P., Forster, P., and Haywood, J.: Multifaceted Aerosol Effects on Precipitation, Nat. Geosci., 17, 719–732, https://doi.org/10.1038/s41561-024-01482-6, 2024.
Stjern, C. W., Samset, B. H., Myhre, G., Forster, P. M., Hodnebrog, Ø, Andrews, T., Boucher, O., Faluvegi, G., Iversen, T., Kasoar, M., Kharin, V., Kirkevåg, A., Lamarque, J.-F., Olivieì, D., Richardson, T., Shawki, D., Shindell, D., Smith, C., Takemura, T., and Voulgarakis, A.: Rapid adjustments cause weak surface temperature response to increased black carbon concentrations, J. Geophys. Res.-Atmos., 122, 11462–11481, https://doi.org/10.1002/2017JD027326, 2017.
Stjern, C., Joshi, M., Wilcox, L., Gollo, A., and Samset, B.: Systematic Regional Aerosol Perturbations (SyRAP) in Asia using the intermediate-resolution global climate model FORTE2, J. Adv. Model. Earth Sy., 16, e2023MS004171, https://doi.org/10.1029/2023MS004171, 2024.
Tian, F., Dong, B., Robson, J., and Sutton, R.: Forced decadal changes in the East Asian summer monsoon: the roles of greenhouse gases and anthropogenic aerosols, Clim. Dynam., 51, 3699–3715, https://doi.org/10.1007/s00382-018-4105-7, 2018.
Wang, H.: The weakening of the Asian monsoon circulation after the end of 1970's, Adv. Atmos. Sci., 18, 376–386, https://doi.org/10.1007/BF02919316, 2001.
Wang, Z., Lin, L., Yang, M., Xu, Y., and Li, J.: Disentangling fast and slow responses of the East Asian summer monsoon to reflecting and absorbing aerosol forcings, Atmos. Chem. Phys., 17, 11075–11088, https://doi.org/10.5194/acp-17-11075-2017, 2017.
Webb, D. J.: An ocean model code for array processor computers, Comput. Geosci., 22, 569–578, 1996.
Westervelt, D. M., Conley, A. J., Fiore, A. M., Lamarque, J.-F., Shindell, D. T., Previdi, M., Mascioli, N. R., Faluvegi, G., Correa, G., and Horowitz, L. W.: Connecting regional aerosol emissions reductions to local and remote precipitation responses, Atmos. Chem. Phys., 18, 12461–12475, https://doi.org/10.5194/acp-18-12461-2018, 2018.
Westervelt, D. M., You, Y., Li, X., Ting, M., Lee, D., and Ming, Y.: Relative importance of greenhouse gases, sulfate, organic carbon, and black carbon aerosol for South Asian monsoon rainfall changes, Geophys. Res. Lett., 47, e2020GL088363, https://doi.org/10.1029/2020GL088363, 2020.
Wilcox, L. J., Liu, Z., Samset, B. H., Hawkins, E., Lund, M. T., Nordling, K., Undorf, S., Bollasina, M., Ekman, A. M. L., Krishnan, S., Merikanto, J., and Turner, A. G.: Accelerated increases in global and Asian summer monsoon precipitation from future aerosol reductions, Atmos. Chem. Phys., 20, 11955–11977, https://doi.org/10.5194/acp-20-11955-2020, 2020.
Xiang, B., Xie, S. P., Kang, S. M., and Kramer, R.: An emerging Asian aerosol dipole pattern reshapes the Asian summer monsoon and exacerbates northern hemisphere warming, npj Clim. Atmos. Sci., 6, 77, https://doi.org/10.1038/s41612-023-00400-8, 2023.
Xie, X., Myhre, G., Liu, X., Li, X., Shi, Z., Wang, H., Kirkevåg, A., Lamarque, J.-F., Shindell, D., Takemura, T., and Liu, Y.: Distinct responses of Asian summer monsoon to black carbon aerosols and greenhouse gases, Atmos. Chem. Phys., 20, 11823–11839, https://doi.org/10.5194/acp-20-11823-2020, 2020.
Yang, J., Kang, S., Chen, D., Zhao, L., Ji, Z., Duan, K., Deng, H., Tripathee, L., Du, W., Rai, M., Yan, F., Li, Y., and Gillies, R.: South Asian black carbon is threatening the water sustainability of the Asian Water Tower, Nat. Commun., 13, 7360, https://doi.org/10.1038/s41467-022-35128-1, 2022.
Zhang, H., Wang, Z., Guo, P., and Wang, Z.: A modeling study of the effects of direct radiative forcing due to carbonaceous aerosol on the climate in East Asia, Adv. Atmos. Sci., 26, 57–66, https://doi.org/10.1007/s00376-009-0057-5, 2009.
Zhong, W. Y. and Haigh, J. D.: Improved broad-band emissivity parameterization for water vapor cooling calculations, J. Atmos. Sci., 52, 124–148, 1995.