the Creative Commons Attribution 4.0 License.
the Creative Commons Attribution 4.0 License.
 | 18 Jul 2025
Machine-learning-assisted chemical characterization and optical properties of atmospheric brown carbon in Nanjing, China
Yu Huang
Xingru Li
Dan Dan Huang
Ruoyuan Lei
Binhuang Zhou
Yunjiang Zhang
The light-absorbing organics, namely brown carbon (BrC), can significantly affect atmospheric visibility and radiative forcing, yet current knowledge of the chemical composition of BrC is largely limited to a number of certain classes of compounds; the chemical and optical properties, and particularly linkage between the two, remain poorly understood. To address this, a comprehensive analysis was conducted on the particulate matter (PM2.5) samples collected in Nanjing, China, during 2022–2023, with a focus on the identification of key BrC molecules. Several important clues related to BrC were found. First, the water-soluble organic aerosol (WSOA) was more oxygenated during the cold season (CS) due to a highly oxidized secondary OA (SOA) factor that was strongly associated with aqueous and heterogenous reactions, especially during the nighttime, while the WSOA during the summer season (SS) was less oxygenated and the SOA was mainly from photochemical reactions. Fossil fuel combustion hydrocarbon-like OA was the largest and dominant contributor to the light absorption during CS (55.6 %–63.7 %). Secondly, our observations reveal that aqueous oxidation can lead to notable photo-enhancement during CS, while photochemical oxidation on the contrary caused photo-bleaching during SS. Both water-soluble and methanol-soluble organics had four key fluorophores, including three factors related to humic-like substances (HULIS) and one protein-like component. Thirdly, molecular characterization shows that CHON compounds were the most abundant species overall, followed by CHO and CHN compounds, and the significant presence of organosulfates in CS samples reaffirmed the importance of aqueous-phase formation. Finally, building upon the molecular characterization and light absorption measurement results, a machine learning approach was applied to identify the key BrC molecules and 31 compounds including polycyclic aromatic hydrocarbons (PAHs), oxyheterocyclic PAHs, quinones, and nitrogen-containing species, which can be a good reference for future studies.
- Article
(5169 KB) - Full-text XML
-
Supplement
(2932 KB) - BibTeX
- EndNote


In ambient air, some organic aerosol (OA) species, termed “brown carbon” (BrC), can absorb light in the near-ultraviolet (UV) and visible spectrum (Andreae and Gelencsér, 2006; Chen et al., 2020b). BrC absorption exhibits strong wavelength dependence, whereby typically the absorption increases as the wavelength decreases (Laskin et al., 2015); it can also contribute to the darkening of ice and snow surfaces, particularly in low-latitude and polar regions (Yan et al., 2018; Brown et al., 2022; Chakrabarty et al., 2023). Thus, BrC can play a crucial role in global climate and air quality (Jo et al., 2016; Feng et al., 2013). Some studies show that the global radiative forcing of BrC ranges from approximately 0.22 to 0.57 W m−2, equivalent to 27 %–70 % of that of black carbon (BC) (Lin et al., 2014; Zhang et al., 2017). Xu et al. (2024) used a global climate model to estimate that BrC accounts for 19 % and 12 % of the total light absorption by carbonaceous aerosols, with direct radiative forcing of 0.110 and 0.205 W m−2, in China during winter and summer, respectively. DeLessio et al. (2024) estimated the top-of-the-atmosphere (TOA) radiative effect of BrC to be 0.04 W m−2.
The sources of atmospheric BrC are highly complex, as BrC can originate from multiple primary sources (Hecobian et al., 2010; Chakrabarty et al., 2010; Gu et al., 2022) as well as various secondary chemical processes (Fleming et al., 2020; Jiang et al., 2021; Chen et al., 2020b; Wang et al., 2021). The primary sources mainly include coal combustion, biomass burning, and vehicular emissions (Wang et al., 2016; Sun et al., 2016; Qi et al., 2019; Chen et al., 2018; Gu et al., 2022); besides, a significant presence of chromophores originating from the ocean has been observed, indicating that the ocean/marine emission is likely also an important source of BrC (Cavalli et al., 2004). As said, secondary BrC species can be generated from many processes, for instance, the aromatic secondary OA (SOA) species formed under high NOx concentrations (Liu et al., 2024); reaction products of biogenic or anthropogenic SOAs with nitrogen-containing substances such as NH3 and NH (Updyke et al., 2012; Shapiro et al., 2009; Bones et al., 2010); and aqueous-phase reaction products from various carbonyl/phenolic precursors in cloud, fog, and aerosol water (Hu et al., 2017; Wang et al., 2021; Li et al., 2023; Ou et al., 2021).
The optical properties of BrC are closely related to the sources and composition of OA. Recent studies have linked BrC light absorption with various sources resolved from factor analysis of OA determined by aerosol mass spectrometer (AMS) methods (Chen et al., 2020b; Zhong et al., 2023; Chen et al., 2016), and they have provided the mass absorption efficiency (MAE) of individual BrC sources and factors. Current studies have identified several classes of light-absorbing organics in ambient OA, such as aromatic carboxylic acids, phenols, nitroaromatic compounds (NACs), polycyclic aromatic hydrocarbons (PAHs), and their derivatives (Lin et al., 2018; Huang et al., 2018; Wang et al., 2021; Xing et al., 2023; Gu et al., 2022; Chen et al., 2020b; Kuang et al., 2023; Laskin et al., 2025). Some lignin pyrolysis and burning products including coumarins, flavonoids, stilbenes, and several sulfur-containing species are also significant BrC constituents (Fleming et al., 2020; Budisulistiorini et al., 2017; Huang et al., 2022). Xing et al. (2023) identified a series of BrC chromophores, encompassing nitrophenols, benzoic acids, oxygenated PAHs, phenols, aryl amides/amines, phenylpropene derivatives, coumarins and flavonoids, pyridines, and nitrobenzoic acids. Nevertheless, current knowledge regarding the molecular composition of BrC is still incomplete and the identified species only occupy a limited fraction of the BrC total light absorption (<25 %) (Wang et al., 2024). For example, Zhang et al. (2013) measured eight NACs in Los Angeles and found that they contributed about 4 % of water-soluble BrC light absorption at 365 nm; Huang et al. (2018) measured 18 PAHs and their derivatives in Xi'an and found that they accounted for ∼ 1.7 % of the overall absorption of methanol-soluble BrC on average; Gu et al. (2022) quantified eight NACs present in PM2.5 during winter in Nanjing, which together accounted for at most ∼ 9 % of the total BrC absorption at 365 nm. On the other hand, the fluorescent properties of OA can be determined by excitation–emission matrix (EEM) fluorescence spectroscopy (Murphy et al., 2013; Stubbins et al., 2014). By performing parallel factor (PARAFAC) analysis on EEM data, key fluorophores can be identified (Xie et al., 2020; Chen et al., 2020a; Chen et al., 2021). These fluorophores are also linked with different sources such as biomass burning, coal combustion, and vehicle emissions (Tang et al., 2020).
Emerging non-targeted approaches based on gas chromatography (GC) or liquid chromatography (LC) coupled with high-resolution mass spectrometry can detect hundreds to thousands of molecules in OA (Kuang et al., 2023; Mao et al., 2022), enabling the identification of potential BrC species by connecting them with the light absorption of OA. However, these approaches often output multi-dimensional data with numerous variables, which must be evaluated appropriately. Traditional statistical methods often perform poorly when handling large datasets and fail to accurately elucidate complex interplay among variables (Fasola et al., 2020). Machine learning (ML) is a powerful tool to effectively resolve such non-linear relationships and address issues of collinearity among variables (Tang et al., 2024). For instance, Zhang et al. (2023) employed a random forest (RF) algorithm to quantify the factors driving PM2.5 trends in the Tibetan Plateau from 2015 to 2022, revealing the importance of anthropogenic emission reductions, and a similar ML approach was used for resolving the driving factors of ozone pollution too (Zhu et al., 2024). Li et al. (2022b) applied the ML–RF approach to analyze the sources of OA in submicron PM (PM1) and PM2.5, showing the importance of secondary processes in supermicron PM. Wang et al. (2022a) integrated positive matrix factorization (PMF) with a multi-layer perceptron (MLP) neural network to analyze the sources of BrC light absorption. Very recently, Wang et al. (2024) applied the ML method to predict the optical properties of BrC with known chromophores.
In this study, we conducted a systematic investigation on the chemical and optical properties on fine particulate matter (PM2.5) samples in both the daytime and the nighttime collected in Nanjing, China, during the summer and cold seasons of 2022–2023. Particularly, for the first time, we applied the ML–RF algorithm to connect the light-absorbing characteristics with the determined organic molecules, aiming to identify more unknown key BrC molecules. Our findings regarding the BrC properties, especially the BrC molecules identified, can be a good reference, and the ML application can be an example of practice for future studies as well.
2.1 Sampling site and sample collection
The PM2.5 filter samples were collected in Nanjing, China, from 11 July to 23 August 2022, 30 November to 10 December 2022, 13 February to 20 February 2023, and 3 to 31 March 2023. The first period represents the hot summer season (SS) (81 samples), and the later three periods represent the cold season (CS) (83 samples); note samples were not collected during precipitation in both seasons. The sampling site was located inside the campus of the Nanjing University of Information Science and Technology (32°12′20.82′′ N, 118°42′25.46′′ E). The site was in a suburban area surrounded by residential buildings and close to traffic arteries and industrial zones (including chemical engineering, petrochemical, and power plants and iron-making and steel-making plants).
A high-volume sampler (Jinshida Ltd. Qingdao, China, model KB-1000) with a flow rate of 1.05 m3 min−1 was employed. PM2.5 samples were collected on prebaked (450 °C) quartz fiber filters (Pallflex, USA, size of 8 × 10 in.). Daytime samples were collected from 08:00 to 18:00 (local Beijing time here and throughout), and nighttime samples were collected from 19:00 to 07:00 the next day. Each filter was wrapped in aluminum foil and kept frozen at −20 °C until analysis. The concentrations of common gas pollutants (SO2, NO2, CO, and O3) were obtained from the nearby National Environmental Monitoring Center (http://www.cnemc.cn/, last access: 30 June 2025), while the meteorological parameters (air temperature, relative humidity, and wind speed and direction) were recorded at the same site as PM2.5.
2.2 Chemical analyses
2.2.1 Measurements of inorganic ions, organic carbon (OC), and elemental carbon (EC)
A number of round pieces (20 mm diameter) were punched from each sample filter and were extracted using 50 mL of ultrapure water (18.25 MΩ ⋅ cm) (10 pieces) and methanol (4 pieces). The filter pieces underwent 30 min of sonication and were filtrated through polytetrafluoroethylene (PTFE) syringe filters (0.22 µm) to remove insoluble materials. Cations (NH, Na+, K+, Mg2+, Ca2+) were measured using an 881 Compact IC Pro (Metrohm, Switzerland); anions (NO, SO, Cl−, F−) were determined by an ICS2100 (Dionex, USA). The water-soluble organic carbon (WSOC) (µg C m−3) was measured by a total organic carbon (TOC) analyzer (TOC-L, Shimazu, Japan). Operational details of these analyses can be found in our previous work (Chen et al., 2020a).
Concentrations of total elemental carbon (EC) and organic carbon (OC) in samples were measured using a thermal optical carbon analyzer (RT-4; Sunset Laboratory, USA) on a separate round filter piece (17 mm diameter) using the IMPROVE TOT protocol (Bai et al., 2020). In addition, the residual OC and EC contents in samples after methanol extraction were determined with the same method as described above and were subtracted from the total OC content to derive the methanol-soluble OC (MSOC) (µg C m−3).
2.2.2 Bulk analysis of organics
We employed an Aerodyne soot particle AMS (SP-AMS) to determine the bulk composition of water-soluble OA (WSOA) (Onasch et al., 2012). It should be noted that, direct AMS analysis on the methanol-soluble OA (MSOA) is currently unfeasible, even though MSOA might be more important than WSOA in terms of both concentration and light absorption. This is the same for almost all offline AMS analysis methods (O'Brien et al., 2019; Vasilakopoulou et al., 2023) due to the methanol solvent and its associated organic impurities not being able to be effectively removed, making the obtained MSOA signals unidentifiable.
The analysis procedure of WSOA is similar to that described in Ge et al. (2017). In brief, eight round pieces (20 mm diameter) of each filter were sonicated in 40 mL of ultrapure water, and the aqueous extract was nebulized using an atomizer (TSI, model 3076). Then the mist was dried by a silica gel diffusion dryer, and the remaining particles were sent to the SP-AMS. The SP-AMS was operated in a laser-off mode; therefore it measured non-refractory species that can be rapidly vaporized at 600 °C (SP-AMS oven temperature). Note the SP-AMS employs a 70 eV electron impact (EI) ionization scheme, so the vaporized species are fragmented into positively charged ions with different mass-to-charge () ratios, and we obtained the composition of WSOA in the form of lumped molecular fragments rather than detailed molecular composition.
The SP-AMS data were post-processed using the Igor-based ToF-AMS analysis toolkit (SQUIRREL version 1.56D and PIKA version 1.15D). Elemental ratios including hydrogen-to-carbon (), oxygen-to-carbon (), and nitrogen-to-carbon () ratios as well as the ratio of organic mass to organic carbon () were calculated using the methods proposed in Aiken et al. (2008), Canagaratna et al. (2015), and Ge et al. (2024). The WSOA mass concentration of each sample was normalized by multiplying the WSOC concentration with its corresponding ratio. Then, we conducted the PMF analysis to resolve the sources of WSOA by utilizing the PMF evaluation toolkit (version 2.06) (Ulbrich et al., 2009), strictly followed the protocol described in Zhang et al. (2011). As usual, we included only ions with , and PMF solutions were explored by varying the number of factors (from three to eight) and rotation parameters (fpeak, from −1 to 1 with an increment of 0.2). Based on the diagnostic plots in Fig. S1 in the Supplement, the four-factor solution was selected as the best solution. The factors include a hydrocarbon-like OA (HOA) related to fossil fuel combustion, a biomass-burning-related OA (BBOA), a less oxidized oxygenated OA (OOA1), and a more oxidized oxygenated OA (OOA2) (see details in Sect. 3.1.2).
2.2.3 Molecular characterization of organics
The molecular-level characterization of organic species was conducted using ultra-high-performance liquid chromatography with a quadrupole time-of-flight (QTOF) mass spectrometer (UPLC–QTOF–MS) (ACQUITY UPLC H-Class coupled with a Xevo G2-XS QTOF, Waters). The sample pretreatment was described in Sect. S1, and the analyzed organics are those dissolved in methanol (namely MSOA). Compound separation was performed with a Luna Omega 1.6 µm C18 column (100 mm × 2.1 mm × 1.6 µm), and the sample aliquot was subjected to electrospray ionization (ESI), and detected in both positive and negative ion modes. The scanning range for each mass spectrum was 50–1200, with a scanning rate of one spectrum per 0.1 s. More details are presented in Sect. S2.
The original UPLC–QTOF–MS data were processed using the Mass Spectrometry-Data Independent Analysis (MS-DIAL, version 4.92) software (Tsugawa et al., 2015), including peak extraction, alignment, and deconvolution, achieving a detection probability of 70 % in all samples for any identified compound. The method of systematic error removal using random forest (SERRF, an ML algorithm) was then introduced to reduce systematic errors and normalize the measured data (Fig. S2). All deconvoluted spectra were imported into the SIRIUS (version 5.6.2) toolkit (Dührkop et al., 2019) to determine molecular formulas. The semi-quantitative concentrations of identified molecules were expressed in the normalized peak areas (NPAs), defined as their peak areas acquired from SERRF divided by air volumes of the samples.
In addition, the double-bond equivalent (DBE) was used to indicate the level of unsaturation of the compound (Bae et al., 2011), and the aromaticity equivalent (Xc) (Yassine et al., 2014) was used to indicate the molecular structure. , , and DBE values of the sample were averaged over all identified molecules based on their relative abundances (see details in Sect. S3).
2.3 Optical analyses
2.3.1 Light absorption properties
The light absorption spectra of both WSOC and MSOC in 200–800 nm were obtained using a UV–Vis spectrophotometer (UV-3600, Shimadzu, Japan) with a 0.5 nm interval. The absorbance at a certain wavelength λ (Aλ) was corrected by subtracting that at 700 nm (A700) (near zero, as background), and the corresponding light absorption coefficient (Absλ, M m−1) was calculated as below (Hecobian et al., 2010):
where Vl represents the volume of the extract (water or methanol), Va denotes the corresponding air volume of the filter piece, and L is the optical path length (0.01 m here).
The corresponding mass absorption efficiency (MAEλ, m2 g−1) can then be calculated as below:
where [WSOC] ([MSOC]) represents the mass concentration of WSOC (MSOC). Following previous studies (Laskin et al., 2015; Chen et al., 2018; Xie et al., 2020; Chen et al., 2020b), the light absorption at 365 nm (Abs365) was employed as a surrogate for BrC in this work.
The relationship between the absorption Ångström exponent (AAE) (an index of the wavelength dependence) (Andreae and Gelencsér, 2006) and light absorption is shown below:
where K is a constant related to light absorption, and we computed the AAE values in the 300–450 nm range.
Additionally, a multi-linear regression (MLR) method was used to estimate the contributions of different WSOA factors to the light absorption of total WSOA, as shown in the following equation:
Here, HOA, BBOA, OOA1, and OOA2 represent time series of the WSOA factors. a, b, c, and d are the fitting parameters, which are the mass absorption efficiency (MAE) values of the corresponding factors.
The direct radiative forcing effect of BrC can be represented by the simple forcing efficiency (SFE) (in W g−1), which is the energy added to the earth–atmosphere system per unit mass of aerosol (Bond and Bergstrom, 2006). The SFE of BrC at the wavelength λ can be expressed below (Chen and Bond, 2010):
where S(λ) represents the solar irradiance at λ obtained from the ASTM G173–03 reference spectra. τatm denotes the atmospheric transmission (0.79); FC is set to 0.6, indicating the fraction of cloud cover; the global average value of αs is fixed at 0.19, representing the surface albedo; β is the backscatter fraction; and MSE and MAE are the mass scattering efficiency and mass absorption efficiency of BrC, respectively.
When estimating the radiative effect of BrC, the direct radiative forcing caused by aerosol scattering can be neglected. Therefore, the absorbed radiative forcing within a given spectral range is calculated by the following simplified equation:
2.3.2 Fluorescence properties
Characterization of the excitation–emission matrix (EEM) of the extracts was performed using a fluorescence spectrophotometer (Cary Eclipse, Agilent, USA). The wavelength range of excitation was set from 230 to 500 nm, and that of emission was from 250 to 600 nm. The scanning resolutions of excitation and emission were 5 and 2 nm, respectively, with a scanning speed of 1200 nm min−1. The photomultiplier tube (PMT) detector voltage was set at 600 V. The measurement was subjected to instrument calibration, internal filter correction, and Raman/Rayleigh scattering correction, and all EEM spectra were subjected to blank filter subtraction. The processed data were further analyzed using PARAFAC analysis to group potential components with similar fluorescent properties. The analysis was performed using MATLAB R2022b software with the drEEM toolbox (Murphy et al., 2013).
Fluorescent properties of the extracts were also characterized by the humification index (HIX), biological index (BIX), and fluorescence index (FI). HIX is defined as the ratio of integrated fluorescence emission intensity in the range of 435–480 nm to that in the range of 300–345 nm when excited at 254 nm; BIX is calculated as the ratio of emission intensity at 380 nm to that of 430 nm for the excitation wavelength of 310 nm; FI is the ratio of emission intensity at 470 nm to that of 520 nm under a fixed 370 nm excitation wavelength (Birdwell and Engel, 2010; McKnight et al., 2001).
2.4 Machine learning identification of key light-absorbing species
The ML–RF model was used here to screen the key light-absorbing species by linking the target variable (Abs365) with the identified organic molecules (in NPAs), via the “randomforest()” function in R software (version 4.3.2). Note that since molecular characterization was conducted on MSOA (not WSOA), light absorption data of MSOA were also used here for consistency. The model included 500 decision trees and estimated the variance through cross-validation during training. The dataset was divided into a training set (80 % of total) and a test set (20 % of total) to assure accuracy and robustness of the model.
The model outputted two key indices to assess the importance of each molecule to the light absorption. One metric is IncNPu_val, which can measure the purity of nodes. During the construction of each tree in the RF model, each split can increase the purity of nodes; therefore if a variable is used more frequently in splitting, it makes a larger contribution to the increase in purity of nodes, and then the variable is considered to be important. IncMSE_val is another index based on the mean squared error (MSE). When we permute a variable, increase in the projected error can serve as a measure of its importance. If a variable with a significant impact on the predicted results were permuted, the model's MSE would increase significantly, resulting in a high IncMSE_val value (González et al., 2015). Under the 50th percentile of IncMSE_val, some variables had zero or even negative contributions to IncMSE_val. Considering the definition of IncMSE_val, such variables would have either no or a negative influence on model fitting; thus only the top 50 % of compounds were chosen. Afterwards, intersections of the two indices were considered potential BrC chromophores.
Moreover, a molecule typically requires substantial uninterrupted conjugation on its molecular backbone to effectively absorb visible light (Lin et al., 2018); therefore a compound with a ratio of DBE to carbon () greater than that of linear polyenes (with a molecular formula of CxHx+2, = 0.5) (Cain et al., 2014) is treated as a potential BrC compound. Besides, the ratio should be less than the upper limit of DBE for natural compounds ( = 0.9) (Lobodin et al., 2012). Finally, the candidate compounds that passed the aforementioned criteria were compared with those in open-source databases, including MoNA (https://mona.fiehnlab.ucdavis.edu/, last access: 30 June 2025) and MassBankEU (https://massbank.eu/, last access: 30 June 2025), to be interpreted as the key BrC compounds.
3.1 Chemical properties
3.1.1 General characteristics
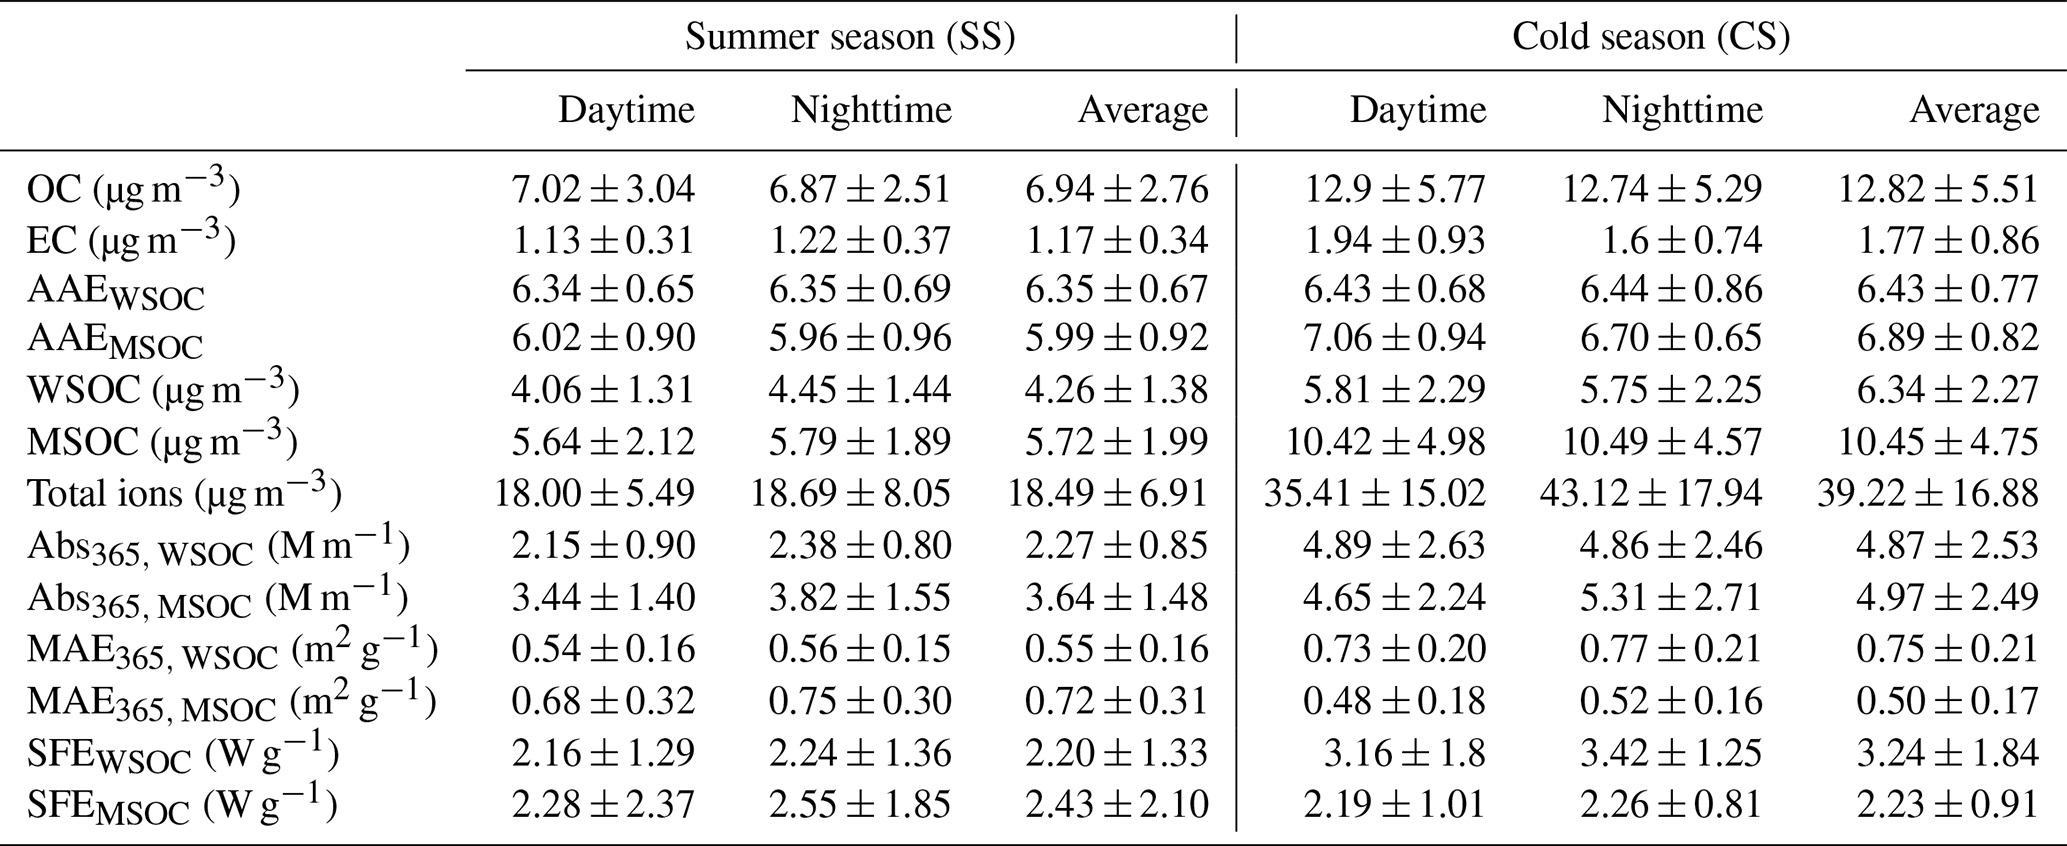
During the sampling period, the temperatures were 34.34 ± 3.23 °C (daytime) (± 1 standard deviation hereinafter) and 30.85 ± 2.97 °C (nighttime) during SS, 13.00 ± 6.04 °C (daytime) and 9.97 ± 5.04 °C (nighttime) during CS, and the relative humidity (RH) levels were 53.61 ± 10.33 % (daytime) and 65.88 ± 9.87 % (nighttime) during SS and 47.81 ± 18.94 % (daytime) and 55.56 ± 15.74 % (nighttime) during CS (Fig. 1a and b). Figure 1c depicts the temporal variations of different components. Average concentrations of OC, EC, WSOC, MSOC, and total ionic species during the daytime and nighttime in the two seasons are summarized in Table 1. Clearly, concentrations of all components were higher in CS than in SS, but the daytime–nighttime differences were relatively small in both seasons. Also, the MSOC levels were larger than WSOC levels in all samples. MSOC occupied 82.4 % and 81.5 % and WSOC occupied 61.3 % and 49.5 % of the total OC during SS and CS, respectively, indicating that methanol can more effectively extract the aerosol organics than water.
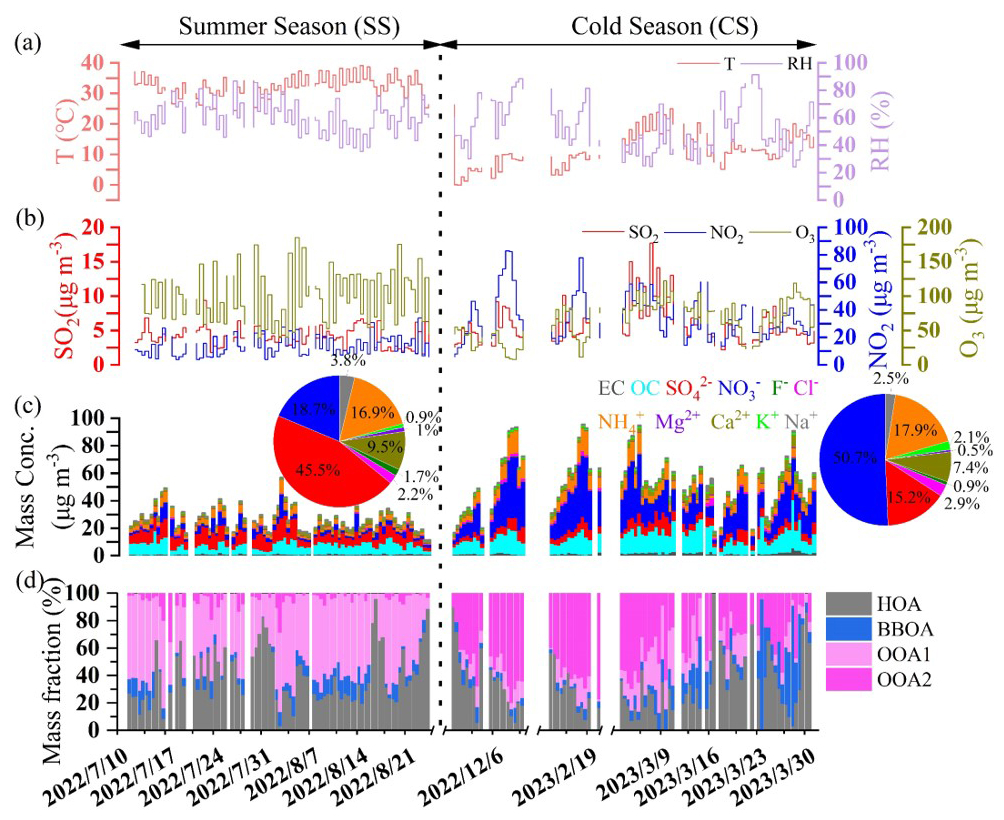
Figure 1Time series of (a) air temperature (T) and relative humidity (RH); (b) concentrations of nitrogen dioxide (NO2), sulfur dioxide (SO2), and ozone (O3); (c) concentrations of different inorganic ions, total organic carbon (OC), and elemental carbon (EC) (the two inset pie charts are the average mass contributions of difference ions to the total ions during SS and CS, respectively); and (d) mass percentages of different factors with respect to the total water-soluble OA.
Table 1The average mass concentrations of major chemical components as well as the parameters of optical properties of PM2.5 collected in Nanjing during two seasons.
The mean mass contributions of different ions to their total during SS and CS, respectively, are shown in Fig. 1c too. The particles were neutral overall as the molar ratios of inorganic anions to cations were 0.97 and 0.98 during SS and CS, respectively (Fig. S3). The most abundant ion was sulfate in SS (45.5 %) and nitrate in CS (50.7 %), as low temperatures during CS favor the partitioning of nitrate to the particle phase. The sulfur oxidation ratio (SOR, [SO]([SO] + [SO2])) and nitrogen oxidation ratio (NOR, [NO]([NO] + [NO2])) were 0.58 and 0.16 (daytime) and 0.56 and 0.17 (nighttime) during SS and 0.40 and 0.28 (daytime) and 0.42 and 0.30 (nighttime) during CS, respectively. NOR was indeed much higher in CS, especially during the nighttime, than in SS. Furthermore, ammonium (NH) was the predominant cation, while sulfate, nitrate, and chloride were major anions. The scatterplots of molar concentrations of ammonium versus summed sulfate, nitrate, and chloride (Fig. S4) reveal different bonding forms of the aerosol inorganic salts in different seasons. The correlations were both tight (correlation coefficients close to 1), yet the fitted slopes during SS were 0.80 (daytime) and 0.89 (nighttime), while those during CS were 0.98 (daytime) and 0.99 (nighttime), respectively. Such results demonstrate that ammonium was too deficient to neutralize the cations; therefore significant quantities of metal salts (such as sodium, calcium sulfate, and nitrate) could exist during SS, while during CS, most inorganic species were in the forms of (NH4)2SO4, NH4NO3, and NH4Cl with no appreciable metal salts.
3.1.2 Features and sources of water-soluble organics
Regarding the water-soluble portion of organic species (WSOA), Fig. 2a presents the average high-resolution mass spectra (HRMS) during SS and CS, respectively. It can be seen that, WSOA during CS appeared to be much more oxygenated than that during SS (: 0.58 and 0.59 vs. 0.44 and 0.45). To further unravel causes of such differences, PMF analysis was conducted and the HRMS of resolved factors are presented in Fig. 2b, while mass contributions of these factors during SS and CS as well as Pearson's correlation coefficients (r) of these factors with other components are illustrated in Fig. 3.
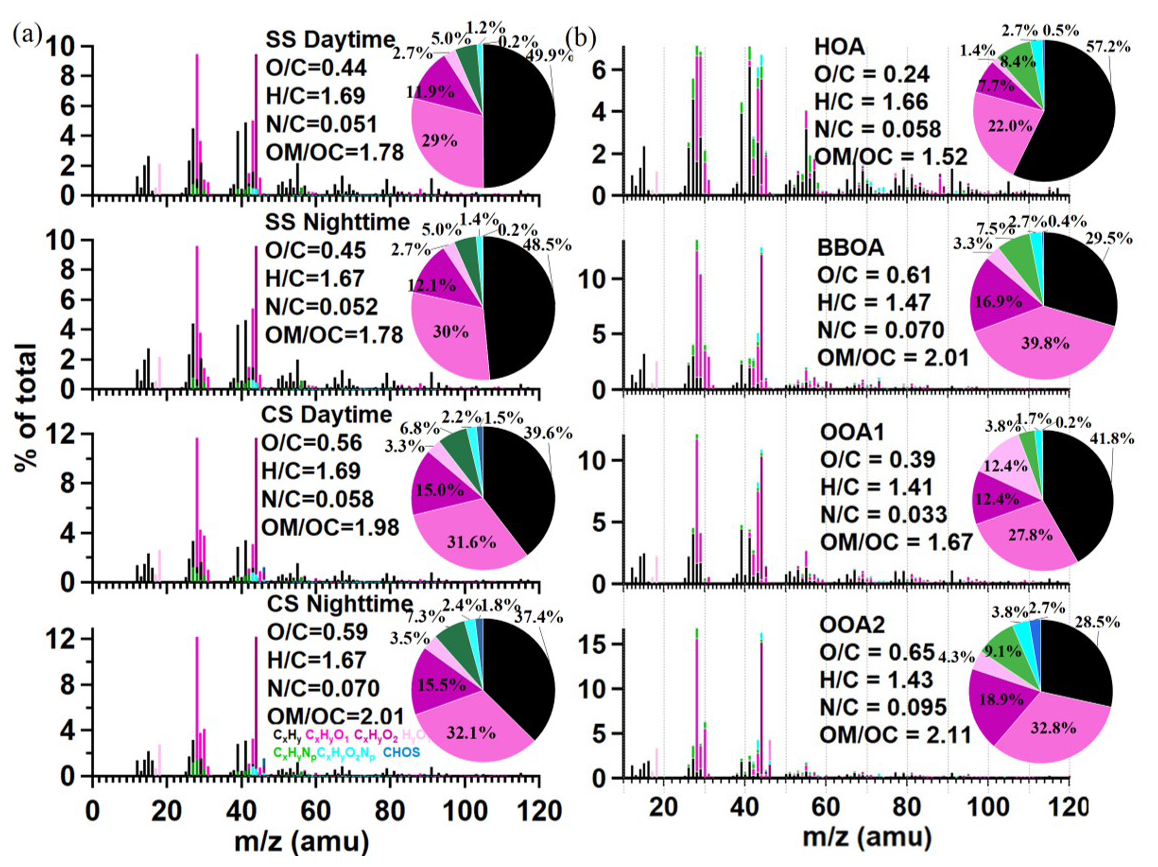
Figure 2High-resolution mass spectra (HRMS) of (a) the water-soluble OA (WSOA) during different periods and (b) the four resolved factors (HOA, BBOA, OOA1, OOA2). Ions are classified into and colored by different ion families, and inset pie charts in both panels show the mass fractional contributions of different ion families to the total HRMS.
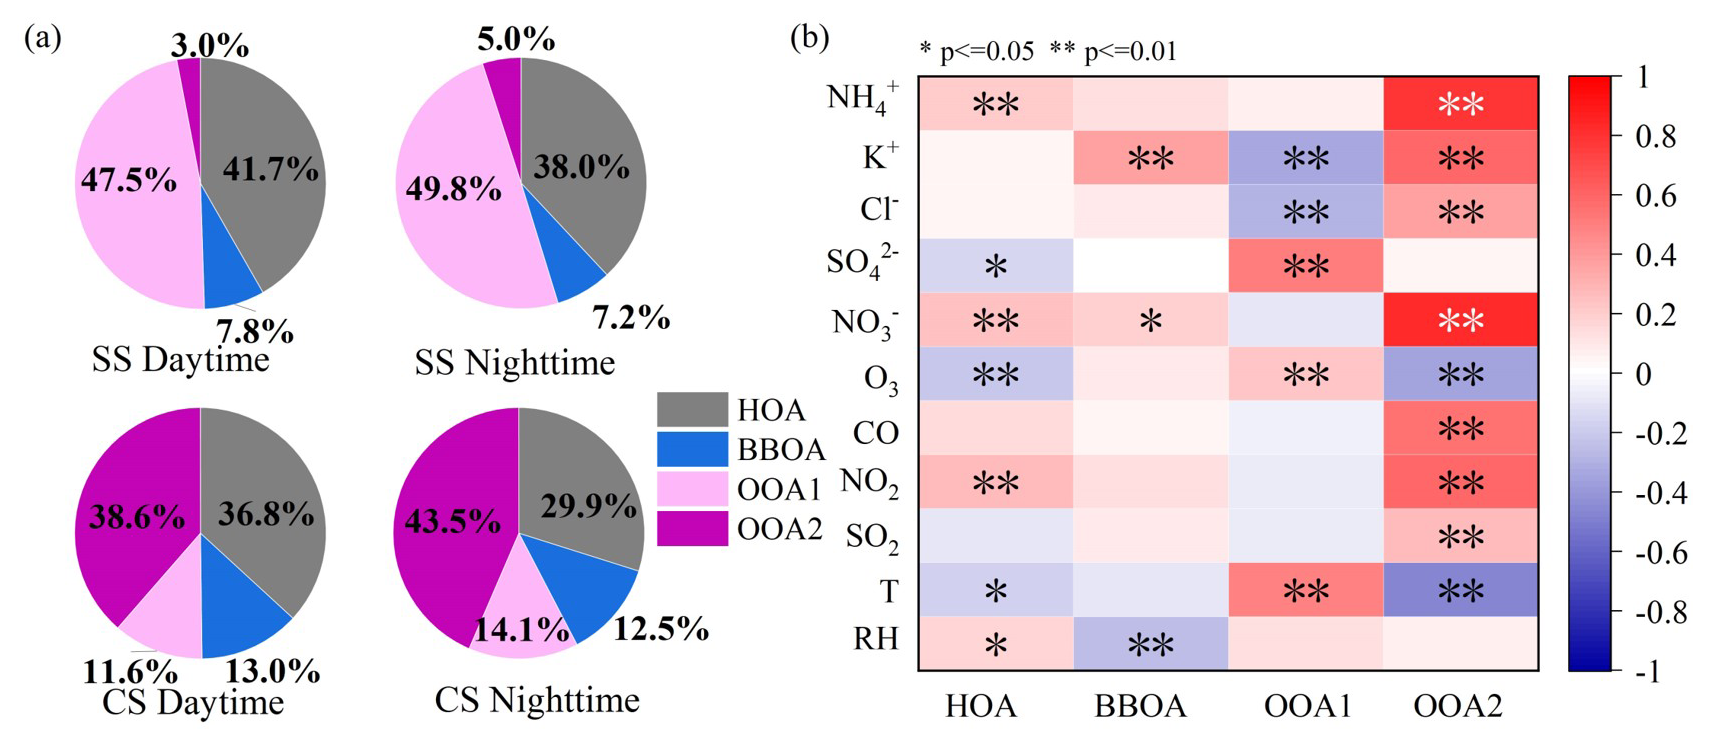
Figure 3(a) Average mass contributions of the four factors to WSOA during different periods and (b) cross-correlation coefficients (Pearson's r) among the four factors and other aerosol components as well as gaseous species.
The HOA MS was dominated by CxH ions (57.2 %), such as C4H ( 55) and C4H ( 57), primarily originating from hydrocarbons emitted from fossil fuel combustion (such as traffic) (Canagaratna et al., 2004). Among the four factors, HOA exhibited the lowest ratio (0.24) and the highest ratio (1.66). This is consistent with the behavior of HOA from a number of previous offline AMS studies (Daellenbach et al., 2017; Liu et al., 2021; Ye et al., 2017; Qiu et al., 2019). The second factor was identified as BBOA, since it has distinct peaks at 60 (mainly C2H4O, 0.76 % of the total HRMS) and 73 (mainly C3H5O, 1.09 % of the total HRMS), which are characteristic fragments associated with levoglucosan, a tracer compound of biomass burning particles (Kumar et al., 2022; Qin et al., 2017). Correlations between BBOA and these two tracer ions were indeed tight (0.71 with C2H4Oand 0.82 with C3H5O). A notably positive correlation between BBOA and K+ (Fig. 3b) further supports its BB origin as K+ is also a common BB emission tracer (Yu et al., 2018). Note the BBOA here had a relatively high ratio of 0.61 compared to those identified in previous offline AMS measurements, such as at Yangzhou (0.45) (Ge et al., 2017) and Beijing, China (0.59) (Qiu et al., 2019), and Marseille, France (0.54) (Bozzetti et al., 2017), suggesting the presence of partially aged BBOA species in this factor.
The other two factors are secondary. OOA1 was less oxidized with an of 0.39, and OOA2 was more oxygenated with the highest of 0.65 among all factors. OOA1 had characteristic fragments at 29 (CHO+) and 43 (mainly C2H3O+), while OOA2 had the lower fraction of oxygen-free CxH ions (28.5 %) but the largest fraction of oxygenated ions (32.8 % of CxHyO and 18.9 % of CxHyO) among the four factors. OOA2 correlated well with CO ( 44) (r of 0.81), a characteristic ion of highly oxygenated carboxylic/dicarboxylic acids. Moreover, OOA2 had the highest of 0.095 as well as the highest fractions of CxHyN+ (9.1 %) (such as CH2N+, CHN+, and CH4N+) and CxHyOzN+ (3.8 %) (such as CHON+, CH2NO+, and CH4NO+), indicating the corresponding presence of amines and amino acids (Ge et al., 2024). Besides, the level of OOA2 is close to that of fog water observed in Fresno, indicating the aqueous-phase reactions are likely an source of those nitrogen-containing ions in OOA2 (Kim et al., 2019). In addition, sulfur-containing organic ions (such as CH2S+, CH3SO, and CHS+) were almost exclusively present in OOA2 and as a significant fraction (2.7 %), as such ions were strongly associated with aqueous and heterogenous reactions (Zorn et al., 2008; Huang et al., 2020; Petters et al., 2021; McNeill, 2015), indicating that OOA2 was very likely linked with the aqueous and heterogenous formation pathway.
The time series of mass contributions of the four factors are shown in Fig. 1d, and significant differences can be observed during the two sampling seasons, as can be seen clearly in Fig. 3a. HOA was a significant source in both SS and CS, and as expected, it was higher during the daytime due to the higher traffic activities. BBOA was much less important than HOA, but its contribution during CS was obviously more than that during SS (12.5 %–13.0 % vs. 7.2 %–7.8 %), and accordingly, the HOA contribution was slightly larger during SS than during CS (38.0 %–41.7 % vs. 29.9 %–36.8 %). It is worth mentioning that BBOA can be more important than HOA, such as in Beijing during the autumn polluted period (38.3 % of WSOA) (Hu et al., 2020); in Delhi, India (31 %–34 % of WSOA) (Bhowmik et al., 2024); and in urban and rural Catalonia, Spain (up to 26 % of WSOA) (Veld et al., 2023). In general, the dominance of SOA in WSOA observed here was consistent with most of the aforementioned offline AMS studies, except that POA was found to dominate WSOA in Delhi, India (Bhowmik et al., 2024). However, mass contributions of the two individual SOA factors in different seasons in this study were strikingly different. OOA1 occupied nearly half of the total WSOA (47.5 %–49.8 %), while contributions of OOA2 were only 3.0 %–5.0 % during SS; on the other hand, OOA2 occupied 38.6 %–43.5 % of WSOA mass, while those of OOA1 were down to 11.6 %–14.1 %. The much larger OOA2 fraction during CS explains its overall high oxidation degree depicted in Fig. 2. These results are highly consistent with our previous studies, as we show that during summer in Nanjing, photochemical reactions dominate the SOA formation and yield less oxygenated OA (Xian et al., 2023; Wang et al., 2022b), while during cold seasons, aqueous formation of SOA becomes more important, which can generate highly oxygenated OA (Wu et al., 2018). The air temperature (a solar radiation indicator) and ozone (a photochemical product) both correlated positively with OOA1 but negatively with OOA2 (Fig. 3b), further verifying the dominance of photochemical production of OOA1 and not OOA2. In accordance with what is well known, particulate nitrate was strongly associated with heterogenous reactions and gas-to-particle partitioning is favored under low temperature and high RH, especially during CS, and indeed, OOA2 correlated much more tightly with NH4NO3 than OOA1 did.
3.2 Optical properties
3.2.1 Light-absorbing properties of WSOC and MSOC
The average light absorption coefficients of BrC in WSOC and MSOC in 300–700 nm during the daytime and nighttime of SS and CS are illustrated in Fig. 4a. As expected, the values all exponentially decreased as a function of wavelength. The calculated AAE values are listed in Table 1. It is interesting to find that the WSOC AAE showed no significant difference between SS and CS (6.35 vs. 6.43), while that of MSOC AAE appeared to be notable (5.99 vs. 6.89). Compared with the MSOC AAE, the WSOC AAE was higher during SS but smaller during CS. The AAE values obtained here are slightly smaller than those reported in Beijing (7.3–7.5 of WSOC) (Du et al., 2014; Chen et al., 2016), comparable to that in Guangzhou (6.7 of WSOC) (Fan et al., 2016). Note that Chen and Bond (2010) report that particles generated from smoldering of various types of wood exhibit an AAE of 6.9–11.6 (MSOC); Lambe et al. (2013) show that lab-generated secondary BrC possesses an AAE of 5.2–8.8 (MSOC). Compared with these values, our measured AAE values (<7) here probably suggest a dominance of secondarily formed BrC for both WSOC and MSOC. This can be verified by Fig. 3a for WSOC, as indeed it was dominated by SOA, particularly during the nighttime, in both seasons. However, the large difference in WSOA chemical composition in different seasons (especially SOA proportions) did not result in a large difference in WSOC AAE, clearly demonstrating the non-correspondence of chemical species to light-absorbing species (a.k.a. BrC). On the contrary, for MSOC, the relatively large differences in MSOC AAEs in different seasons likely reflect the distinction of BrC species but not necessarily of chemical constitution. The light absorption coefficients at 365 nm (Abs365) are listed in Table 1 too. The average Abs365, WSOC during CS (4.87 M m−1) was approximately 2.15 times that of SS (2.27 M m−1), and that of MSOC during CS (4.97 M m−1) was also much larger than that during SS (3.64 M m−1); nighttime values were higher than those in the daytime expect for WSOC during CS. For the same set of samples, Abs365, MSOC values were typically larger than Abs365, WSOC values except that CS daytime Abs365, MSOC was slightly smaller than Abs365, WSOC (4.65 vs. 4.89 M m−1). Scatterplots of Abs365 versus WSOC (and MSOC) and Abs365, WSOC versus Abs365, MSOC for the four series of samples are given in Fig. S5. The correlations were generally high, especially those of WSOC and MSOC (r>0.80), suggesting that there is a large overlap of extracted species between WSOC and MSOC, as well as their BrC constituents.
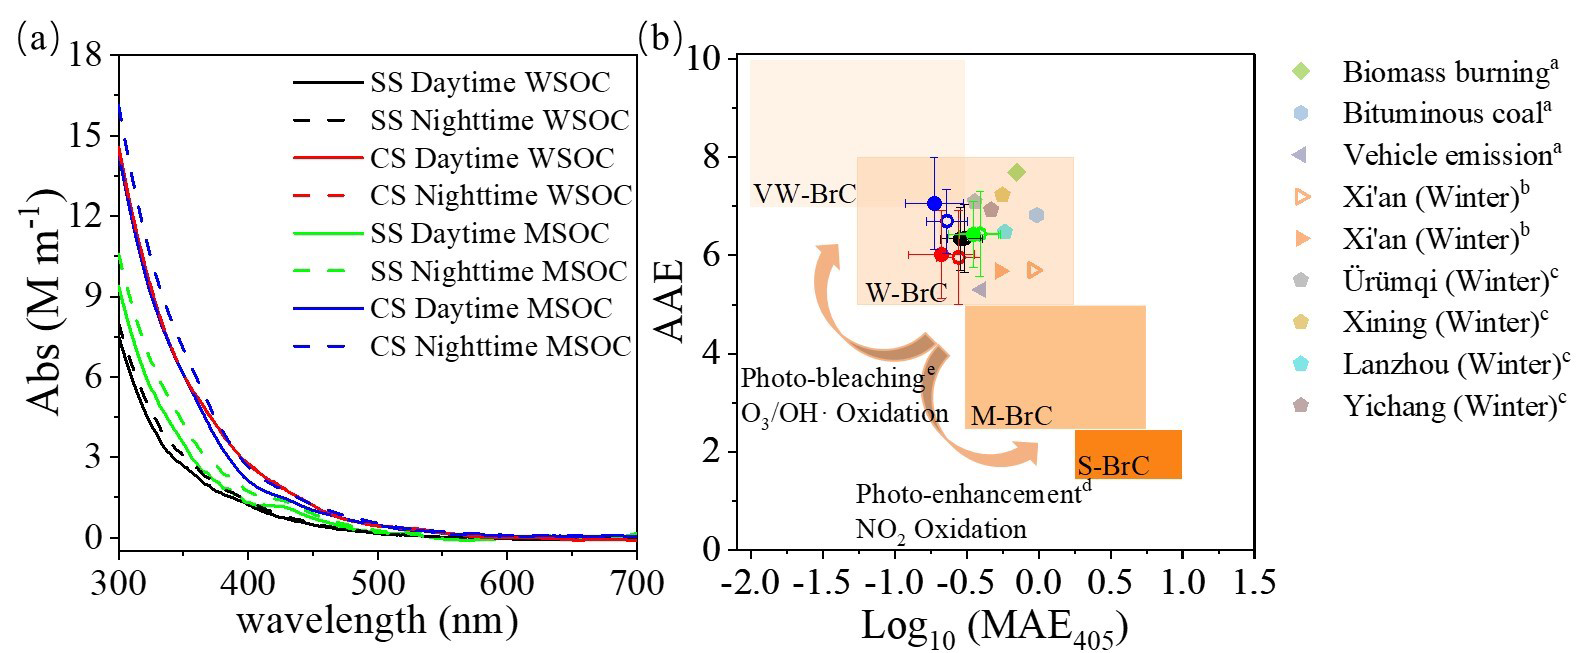
Figure 4(a) Light absorption coefficients (Abs) of the water-soluble OC (WSOC) and methanol-soluble OC (MSOC) as a function of wavelength and (b) distribution of the measured data in the log10(MAE405)–AAE space (Saleh, 2020) (MAE405: mass absorption efficiency at 405 nm; AAE: absorption Ångström exponent). The shaded areas indicate very weakly (VW), weakly (W), moderately (M), and strongly (S) absorbing brown carbon (BrC), respectively. Other markers indicate results from a Huang et al. (2018), b Chen et al. (2018), and c Zhong et al. (2023).
Regarding the MAE at 365 nm (MAE365), MAE365, WSOC during CS (0.75 m2 g−1) was higher than that during SS (0.55 m2 g−1), indicating its stronger light absorption ability during CS; however, MAE365, MSOC, unlike Abs365, MSOC, was smaller during CS than during SS (0.50 vs. 0.72 m2 g−1). Besides, MAE365 values for both WSOC and MSOC were slightly larger during the nighttime than during the daytime in both seasons. Compared to previous winter studies, MAE365, WSOC in Nanjing here was lower than that in Beijing (1.21–1.26 m2 g−1) (Du et al., 2014; Chen et al., 2016; Li et al., 2020), which is similar to our earlier observation in Yangzhou (0.75 m2 g−1), but the MAE365, MSOC appears to be lower than that in Yangzhou (1.12 m2 g−1) (Chen et al., 2020b). To further explain the low MAE365 observed here, we investigated the air mass origins of our samples collected in different periods via back trajectory analysis (at an altitude of 200 m and 24 h backwards) using MeteInfo (version 3.0.0) (Wang, 2019). As shown in Fig. S6, only a limited fraction of air mass trajectories passed through sea and coastal areas (clusters 4 and 5, 27.05 % during the daytime and 29.54 % during the nighttime) during SS, while during CS, proportions of trajectories that intercepted sea/coastal air increased to 79.80 % (clusters 1, 2, and 3 during the daytime) and 69.44 % (clusters 2, 3, and 4 during the nighttime). Note that the air masses during CS are somewhat unusual as typically they mainly originate from inland regions (Wu et al., 2019b), which might cause the low MAE365 observed in this work as particles affected by marine air can be less light-absorptive than those influenced by inland air (Li et al., 2022a).
Saleh (2020) proposes a method that uses the MAE405 (MAE at 405 nm)–AAE two-dimensional space to assess the light-absorbing ability of BrC, as shown in Fig. 4b. The majority of samples in this study fall into the regime of W-BrC (weakly light-absorptive BrC) with a few MSOC samples located in the VW-BrC (very weak BrC) regime, which is similar to a few other observations (Zhou et al., 2021; Xu et al., 2022). The BrC in MSOC seemed to cover a broader region than that in WSOC, indicating that the MSOC BrC might contain a wider array of species and/or originate from more diverse sources/processes. The daytime–nighttime difference of MSOC BrC was also more obvious than that of WSOC BrC.
Finally, we estimated the SFE values of WSOC and MSOC in the range of 300–700 nm, considering the actual visible light wavelength as well as the negligible light absorption above 700 nm of BrC. As summarized in Table 1, the mean SFEMSOC (2.43 W g−1) during SS was higher than that of WSOC (2.20 W g−1), but it became smaller during CS (2.23 W g−1) and was much lower than that of WSOC (3.24 W g−1). The SFEWSOC values in both SS and CS were lower than those in Beijing (4.6 ± 1.7 W g−1 in summer and 6.2 ± 2.0 W g−1 in winter), especially in CS (Deng et al., 2022). For both WSOC and MSOC, SFE values during the nighttime were slightly larger.
3.2.2 Source apportionment of light absorption of WSOC
In Sect. 3.1.2, sources of WSOA are identified and quantified; herein we apply a multiple linear regression (MLR) algorithm to apportion the light absorption of WSOC to these sources. A scatterplot of reconstructed Abs365, WSOC versus measured values is shown in Fig. S7. The fitted slope is 1.06 with a Pearson's r of 0.90, verifying the robustness of this method applied to our dataset. The calculated regression coefficients, representing the factors' MAE365 values (m2 g−1), are listed in Table 2. Compared to our earlier results (Chen et al., 2020b), the HOA MAE365 (0.71 m2 g−1) was much lower than that in Yangzhou (1.46 m2 g−1), while the BBOA MAE365 values were similar (0.71 vs. 0.77); MAE365 values of OOA1 (0.12 m2 g−1) and OOA2 (0.83 m2 g−1) were very close to the two SOA factors in Yangzhou (0.11 and 0.85 m2 g−1). However, here the less oxygenated OOA1 has a small MAE365, while in Yangzhou, the more oxygenated SOA has a similar MAE365 to OOA1, and vice versa for the other pair. This work finds that the more oxidized SOA has a stronger light absorption ability, which is the opposite to the result reported for Yangzhou. Nevertheless, the two findings are not contradictory, as atmospheric aging can lead to either photo-enhancement or photo-bleaching, depending upon the precursors. For instance, aqueous oxidation of BBOA can increase (Gilardoni et al., 2016), yet conversely aqueous processing of fossil fuel combustion OA can decrease the light absorptivity of OA (Wang et al., 2021). As discussed in Sect. 3.2.1, the unusual air masses during CS in this work clearly indicate different precursors from those in Yangzhou.
Table 2Multi-linear regression results of the four factors and corresponding average contributions to the total light absorption of water-soluble organics (WSOA).
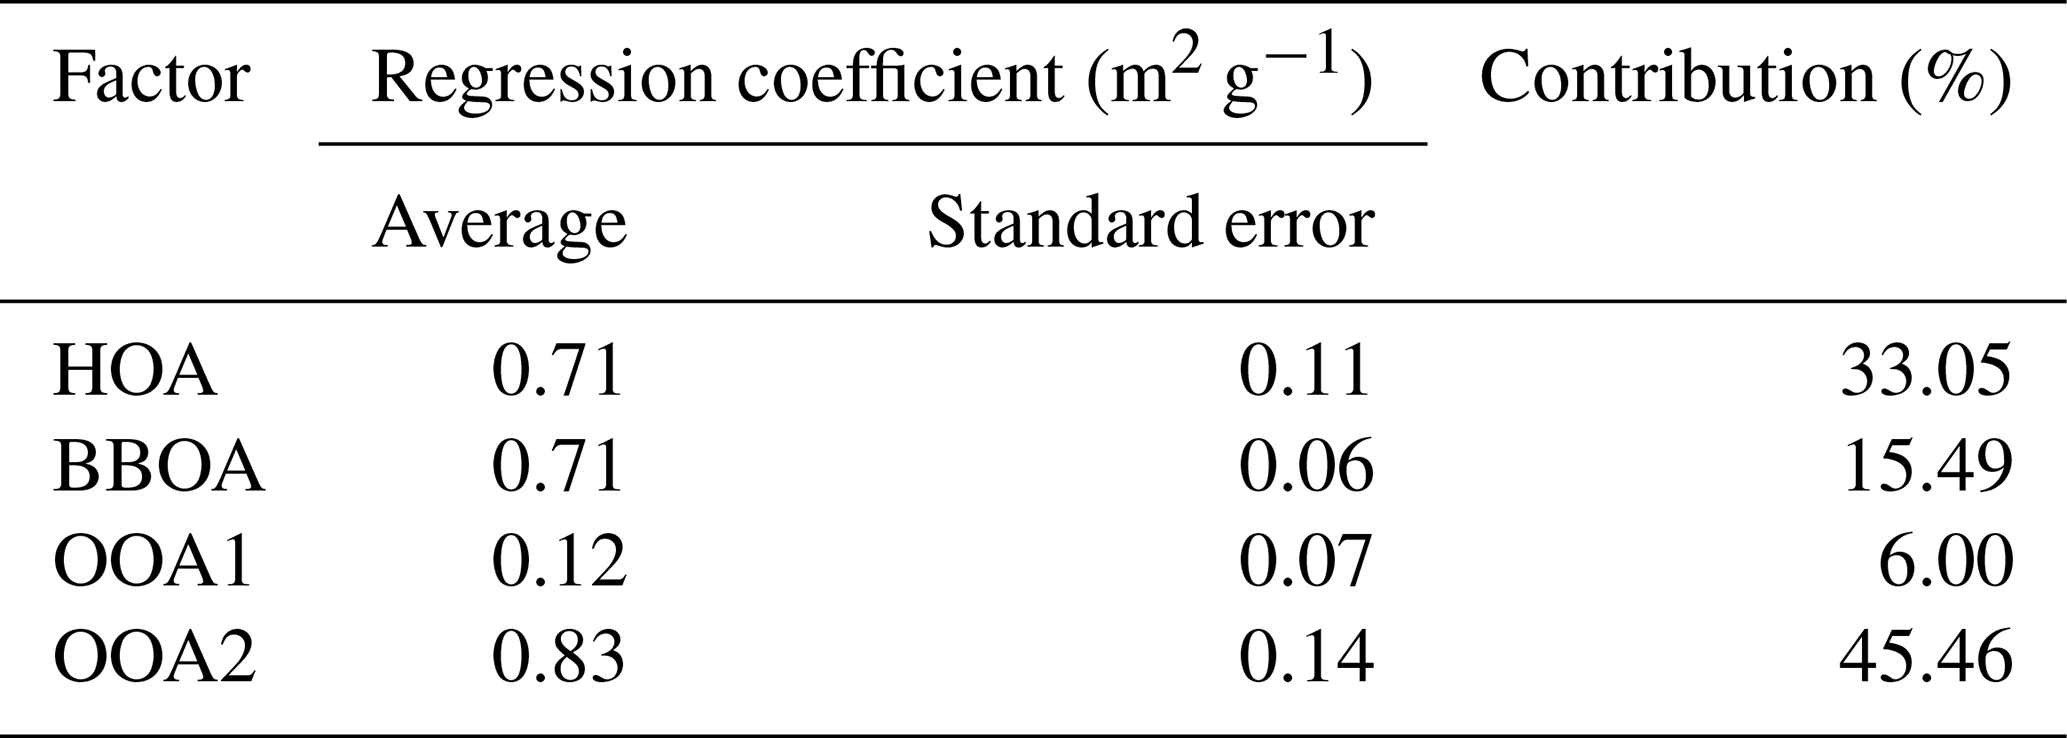
The average contributions of HOA, BBOA, OOA1, and OOA2 to Abs365, WSOC across the whole campaign were 33.05 %, 15.49 %, 6.00 %, and 45.46 %, respectively (Table 2). Figure 5 further presents contributions of the factors under different scenarios. Compared with their mass contributions shown in Fig. 3a, during SS, the dominant contributor of light absorption became HOA (daytime 63.7 %, nighttime 55.6 %), and contributions of BBOA and OOA2 both increased relative to their mass fractions, while OOA1's contribution was largely reduced to 15.0 %–16.2 % due to its small MAE365. Previous studies have consistently identified coal combustion (Fan et al., 2016; Li et al., 2019; Song et al., 2019) and traffic emissions (Hecobian et al., 2010) as significant contributors to BrC, and this together with our results here highlights the substantial impact of anthropogenic fossil fuel combustion on atmospheric visibility. During CS, OOA2 dominated the light absorption (daytime 50.7 %, nighttime 63.0 %) owing to its large mass contribution as well as large MAE365, and OOA1 became a very minor contributor (2.1 %–2.8 %). HOA contribution decreased, while the BBOA contribution increased, both relative to their mass fractions. Overall, we find that primary fossil fuel combustion emissions govern water-soluble BrC light absorption during SS especially during the daytime, while during CS, secondary highly aged species (likely from aqueous and heterogenous reactions) dominate, especially during the nighttime.
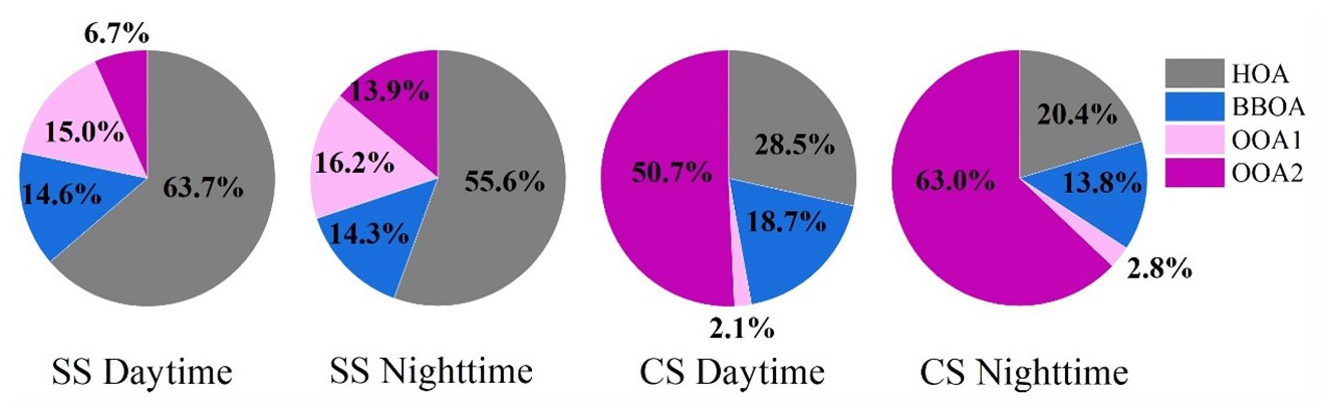
Figure 5Contributions of the four factors to the total light absorption of WSOA during different periods.
To further explore the impact of atmospheric aging on BrC, we plot MAE365 as a function of in Fig. 6. Interestingly, during SS, MAE365 generally decreased with the increase in , especially in the daytime as its fitted slope of −1.56 was over 2 times that of nighttime (−0.76). On the other hand, MAE365 showed an increasing trend against during CS, particularly at nighttime as the fitted slope was 1.43, larger than that of daytime (1.12). These results further support our earlier findings and underscore the fact that during summer, photochemical reactions can lead to photo-bleaching of aerosols, while during cold seasons, aqueous and heterogenous reactions might dominate the secondary formation and lead to photo-enhancement; clearly, photochemical oxidation and aqueous and heterogenous reactions are more active during the daytime and nighttime, respectively, which is consistent with the slopes in Fig. 6. Also, photochemically produced SOA was often less or moderately oxygenated and that from aqueous and heterogenous oxidation was more oxidized, and there is a turning point at values of 0.45–0.5 in the MAE365– plot. Many studies have shown that aqueous reactions are a source of BrC (e.g., Li et al., 2022c; Laskin et al., 2015; Ye et al., 2019), but evidence also shows that further aqueous aging of BrC can lead to photo-bleaching (e.g., Zhao et al., 2015; Lei et al., 2025); therefore a certain turning point can exist if the OA evolution is governed by a certain process. The real atmospheric processes are, however, complicated, and such points might be less clear. Nevertheless, similar points have indeed been observed previously (Zhong et al., 2023; Jiang et al., 2022).
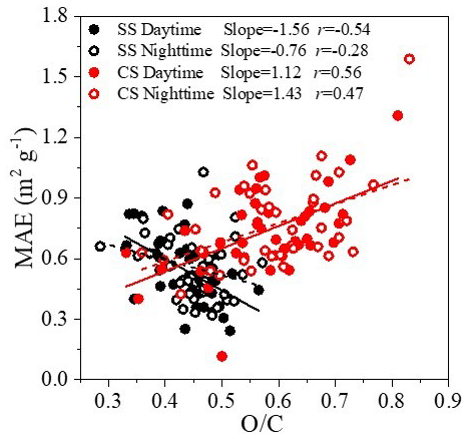
Figure 6Scatterplot of MAE365 (mass absorption efficiency at 365 nm) versus the oxygen-to-carbon () ratios for the WSOA.
3.2.3 Fluorescent properties of WSOC and MSOC
The fluorescence indices like HIX, BIX, and FI can infer the types and sources of dissolved organic matter (DOM) in aquatic systems and soils (Lee et al., 2013; Huguet et al., 2009). Recently, these indices have been employed to investigate sources and aging processes of atmospheric OA (Fu et al., 2015; Qin et al., 2018; Deng et al., 2022; Murphy et al., 2013). Here, we calculated these indices for both WSOC and MSOC.
HIX represents the degree of humification, and a high HIX means high aggregation, a high ratio, and high aromaticity of the organics (Zsolnay et al., 1999; McKnight et al., 2001; Birdwell and Engel, 2010); thus it normally increases upon aging (Fan et al., 2019a; Murphy et al., 2013). In this study, HIX values of WSOC during SS and CS were on average 3.34 and 4.68, respectively (Table 3), much less than the HIX levels in aquatic or soil DOM (Dong et al., 2017), suggesting an overall low aromaticity of atmospheric OA in Nanjing. As a comparison, the WSOC HIX values are higher than those in Colorado, USA (2.42) (Xie et al., 2016), and Tianjin, China (2.73 and 2.22) (Deng et al., 2022), but significantly lower than the WSOC HIX in Nanjing during 2017–2018 (7.07) (Xie et al., 2020). An earlier study proposes the HIX ranges of 1.4–5 for fresh SOA and 4.2–6.1 for aged SOA (Lee et al., 2013). Despite influences of other primary sources, the average HIX during SS fell into the fresh SOA range and the value during CS entered the edge of aged SOA, in line with the oxidation degrees of OA (Fig. 2a) and mass proportions of fresh/aged SOA factors (namely, OOA1/OOA2) (Fig. 3a) during different seasons. The average HIX values of MSOC (2.72 and 3.48) were lower than those of WSOC in both seasons, indicating that HULIS with high aromaticity are preferentially soluble in water.
Table 3The average values of fluorescence indices of both water-soluble organic carbon (WSOC) and methanol-soluble organic carbon (MSOC).
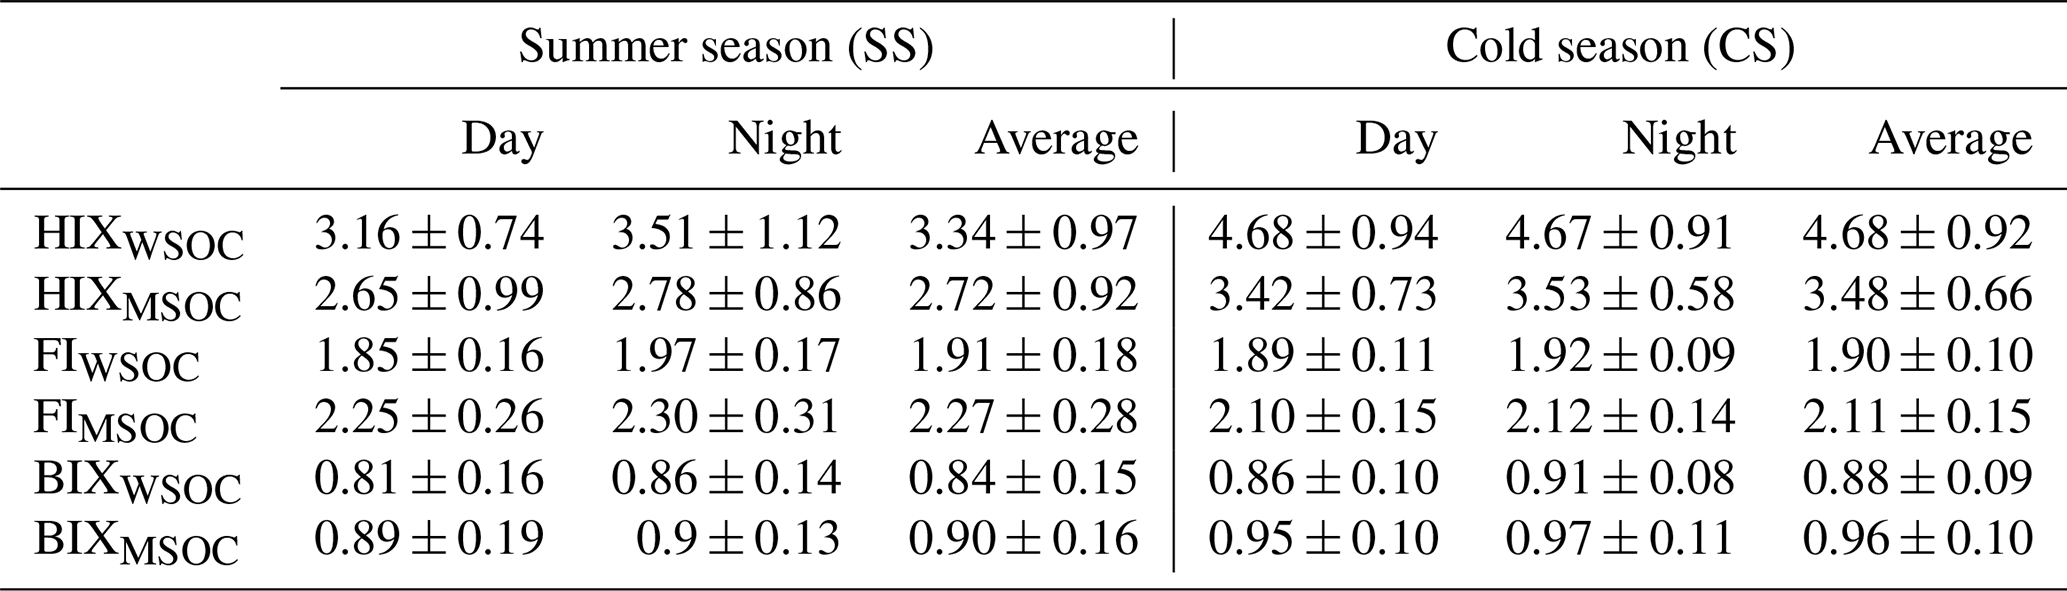
FI is indicative of the relative contributions of terrestrial and biogenic sources, while BIX, in contrast to HIX, can be treated as a freshness index. A fluorophore is often associated with high aromaticity if FI is low (Fu et al., 2015), and a high BIX indicates a high content of freshly released organics (such as biologically or microbially derived species) (Wen et al., 2021; Huguet et al., 2009; Murphy et al., 2013). The average WSOC BIX values during SS and CS were determined to be 0.84 and 0.88, respectively, with corresponding FI values of 1.91 and 1.90 (Table 3). The corresponding MSOC BIX values were 0.90 and 0.96, and MSOC FI values were 2.27 and 2.11, respectively. Compared with results during 2017–2018 in Nanjing, BIX and FI values of WSOC were similar, yet those of MSOC here were larger (Xie et al., 2020). Figure 7 shows the measured data in HIX–FI and HIX–BIX diagrams along with results from a few other studies. It can be seen that almost all BIX values were distributed in the range of 0.6–1 (Huguet et al., 2009) and FI values were distributed within 1.6–1.9 (McKnight et al., 2001), suggesting that OA in both seasons was influenced by a mix of terrestrial and microbial/biogenic sources. For both WSOC and MSOC, BIX was slightly higher during CS than during SS, which can be attributed to the fact that OA during CS contained more aged SOA species. Nearly no differences for WSOC FI during different seasons were observed, but the MSOC FI during CS was slightly lower than that during SS, meaning that MSOC during CS had a high aromaticity as expected. In addition, BIX and FI values during the nighttime were marginally higher than those during the daytime in all cases.
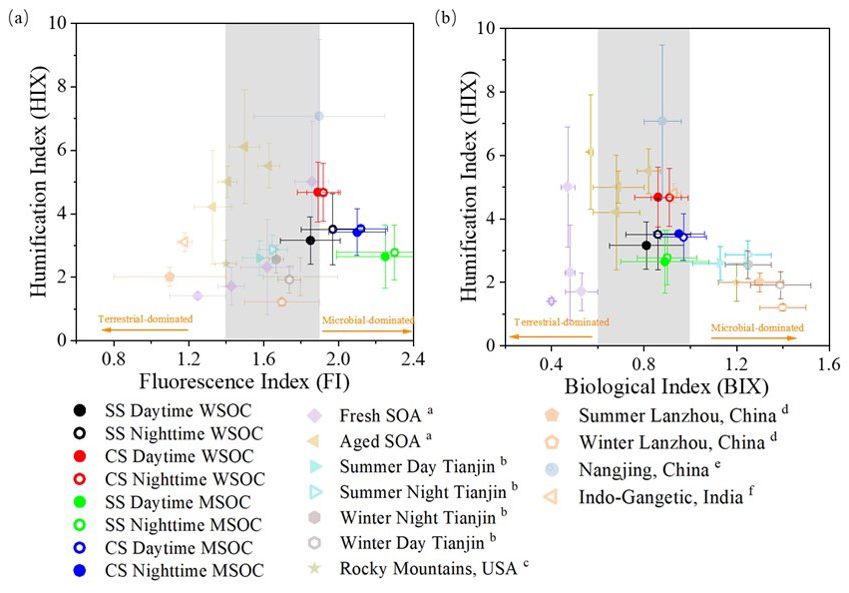
Figure 7Distribution of the fluorescent indices of measured data in this study and a few other studies (a Lee et al., 2013; b Deng et al., 2022; c Xie et al., 2016; d Qin et al., 2018; e Xie et al., 2016; f Dey et al., 2021): (a) The humification index (HIX) versus the fluorescence index (FI) and (b) HIX versus the biological index (BIX). The shaded areas mark 0.6–1 of BIX (Huguet et al., 2009) and 1.6–1.9 of FI (McKnight et al., 2001).
3.2.4 Identification of key fluorophores of WSOC and MSOC
The 3D EEM–PARAFAC analysis was adopted to identify the key fluorophores of BrC, with results in Figs. 8 and S8. Four components were resolved for both WSOC and MSOC. For WSOC, C1 exhibited a peak at Ex = 230 nm and Em = 374 nm, identified as less oxidized HULIS typically associated with combustion sources. Its contribution was only 4.9 % during SS but increased to 19.2 % during CS (Fig. S8a). C2 had a prominent peak at Ex = 230 nm and Em = 396 nm and a second peak at Ex = 320 nm and Em = 396 nm, classified as a HULIS-related component too, as the dual-peak distribution of the fluorescence spectrum is often associated with HULIS (Coble, 1996; Murphy et al., 2011; Yu et al., 2015); its second peak indicates the abundance of compounds with condensed aromatics, conjugated bonds, and non-linear rings (Matos et al., 2015), likely a mix of primary and secondary sources. The C2 contribution was thus comparable during different seasons (37.5 % vs. 38.6 %), and it seemed to be more important in the nighttime than in the daytime (44.0 % vs. 26.9 % during SS and 41.4 % vs. 34.8 % during CS). The C3 component, with a peak at Ex = 240 nm and Em = 446 nm, was considered a highly oxidized HULIS component, related to secondary processes (Cheng et al., 2016; Cao et al., 2021). Hawkins et al. (2016) and Aiona et al. (2017) reported a fluorescent pattern of products from the aqueous-phase reaction of aldehydes with ammonium sulfate or amines (Ex <250/300 nm and Em >400 nm), matching the pattern identified here well. As discussed earlier, aqueous and heterogenous reactions contributed to WSOA, especially during CS; correspondingly, the C3 contribution was indeed much higher during CS than during SS (24.1 % vs. 14.7 %). C4, with a prominent peak at Ex = 230 nm and Em = 308 nm and a second peak at Ex = 275 nm and Em = 305 nm, was characterized as a protein-like component (Yan and Kim, 2017; Wu et al., 2019a; Chen et al., 2020b). C4 was the single largest contributor (42.9 %) during SS, particularly during the daytime (55.0 %), but became the smallest during CS (18.0 %).
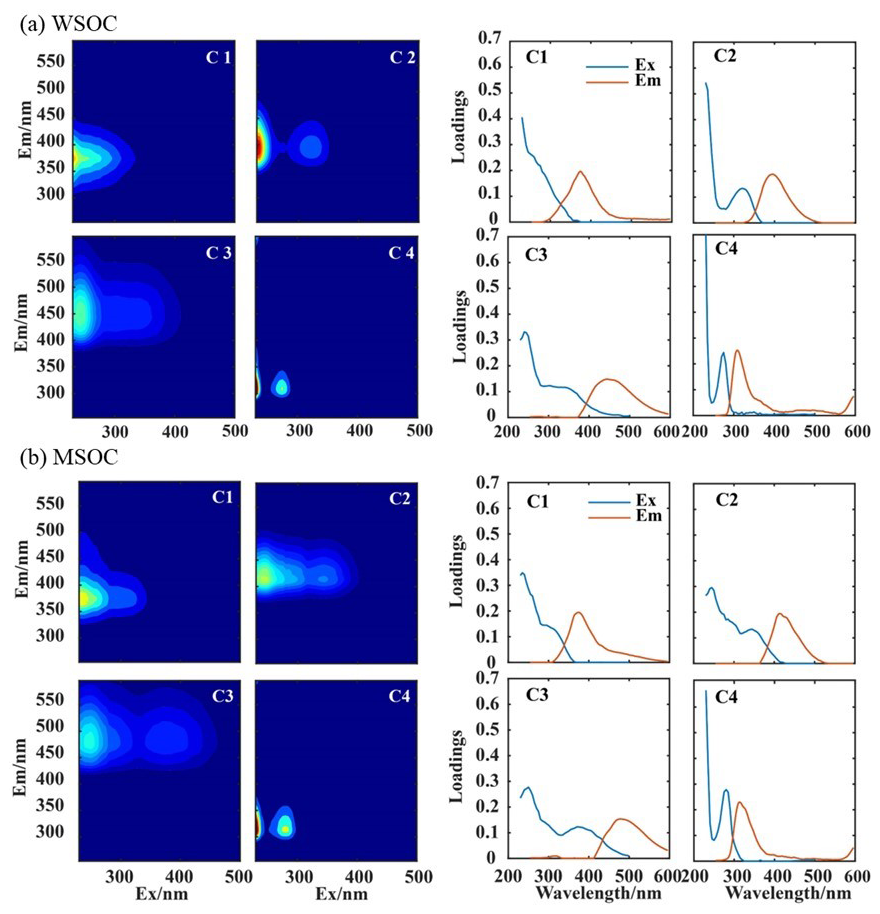
Figure 8Four fluorescence components (C1–C4) and the corresponding fluorescence intensities of emission (brown) and excitation (blue) against wavelength: (a) WSOC and (b) MSOC.
Similarly for MSOC, three HULIS-related fluorophores (C1–C3) and one proteinaceous fluorophore (C4) were separated (Fig. 8b). The spectral signatures between the two series of fluorophores were slightly different, with the MSOC peak excitation and emission wavelengths being a bit larger than those of WSOC, especially for C2 and C3. Figure S8b shows contributions of the different components to MSOC fluorescence. C1 was much more important in MSOC (26.6 % in SS and 39.2 % in CS) than in WSOC and became the largest contributor of MSOC during CS; summed C2 and C3 contributions (30.7 % in SS and 37.0 % in CS) were on the other hand much lower than in WSOC; C4 remained the largest (42.6 %), similar to that in WSOC during SS. The increased contributions of the protein-like fluorophore (C4) during SS in both WSOC and MSOC were likely due to its major origin of biological activities, which can be enhanced by the relatively high temperatures during SS (Fan et al., 2020); this is likely the reason that C4 contributions during the daytime were higher than those during the nighttime in both SS and CS. Furthermore, some studies (Barsotti et al., 2016; Chen et al., 2021, 2020b; Cao et al., 2021; Deng et al., 2022) also point out that C4 contains not only proteinaceous species from biological activities but also certain PAHs or phenolic substances from fossil fuel and/or biomass burning, especially in urban aerosols. Probably, the proteinaceous species dominated the fluorescence during SS for both WSOC and MSOC, while during CS, PAHs and phenolic compounds became more important and might prefer to dissolve in methanol, therefore leading to its higher contribution in MSOC than in WSOC (23.8 % vs. 18.0 %). Different solubilities of HULIS components in water and methanol may partially lead to their different contributions in WSOC and MSOC.
3.3 Molecular composition of organics
3.3.1 Overview of identified molecules
We classified the identified molecular formulas of organics (here MSOA) via UPLC–QTOF–MS analysis into eight categories, namely CH, CHO, CHN, CHS, CHON, CHOS, CHNS, and CHONS. Overall, the negative (ESI−) and positive (ESI+) ion modes identified 466–865 and 644–1065 formulas, respectively (details in Table S1). Figures S9 and S10 shows the number and signal fractions (relative abundances of signal intensities), respectively, of different classes of compounds.
Under the ESI+ mode, CHON compounds were the most abundant species in term of the number fraction – nearly half during SS (daytime 50.5 % and nighttime 46.9 %) and over half during CS (daytime 54.1 % and nighttime 55.1 %); the abundance of its signal was even more prevalent – over half in all cases and up to 67.7 % during the SS daytime. The second most abundant species comprised CHO compounds, occupying 23.0 %–30.6 % of the total number of molecules and 15.4 %–21.9 % of the total signal intensity; CHONS and CHN species were the other two relatively abundant classes – together occupying ∼ 20 % (number fraction) and ∼ 10 %–24 % (signal fraction) of the total identified compounds. Contributions of other the four classes of compounds were very minor, in terms of both number and signal intensity. Relatively, under the ESI− mode, CHO compounds marginally prevailed over CHON compounds in number (36.2 %–44.4 % vs. 32.6 %–38.0 %), but during CS their signal fractions were still lower (33.3 %–35.1 % vs. 39.3 %–46.5 %). More enrichment of CHO compounds in ESI− than in ESI+ is consistent with a previous study (Lin et al., 2012) as these compounds most likely contain carboxyl groups and are easily deprotonated in ESI− mode. Number fractions of CHONS compounds in ESI− mode were ∼ 5 %–10 % more than those in ESI+ mode, while the most contrasting difference was that CHN compounds were rarely detected in ESI+ mode, and instead CHOS compounds that were negligible in ESI− mode could be effectively detected in ESI+ mode (3.9 %–4.8 % in number) and their signal fractions were more significant (6.4 %–17.4 %).
3.3.2 CHO compounds
We plot the detected CHO compounds in van Krevelen (VK) diagrams according to their and ratios in Fig. 9. Most molecules had ratios <0.5 but a broad distribution of ratios (0.5–2.0). Molecules with high ratios (≥1.5) and low ratios (≤0.5) (Region A) are typically associated with aliphatic compounds, while those with low ratios (≤1.0) and low ratios (≤0.5) (Region B) are usually assigned to oxygenated aromatics (Kourtchev et al., 2014). We further calculated the Xc values of all CHO compounds to investigate their molecular structures, as seen in Fig. 9. Clearly, saturated aliphatic CHO compounds (Xc <2.5) were most abundant (323 out of 418 in ESI+ mode and 315 out of 481 in ESI− mode) and mainly distributed in Region A. An appreciable number of unsaturated compounds, particularly those with benzene ring or naphthalene ring structures (2.5< Xc <2.8), were distributed across values of 0.5 to 1.75 but with <0.5 in ESI− mode and from of 0.1 to 1.75 but with a few in >0.5.
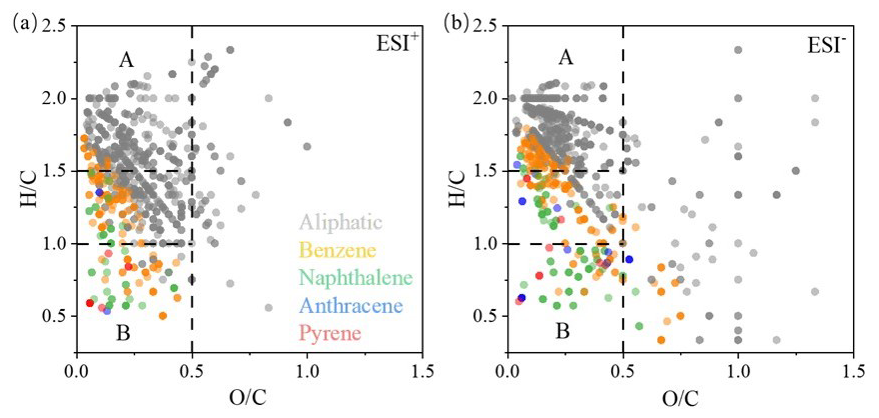
Figure 9Van Krevelen diagrams for CHO compounds detected in (a) ESI+ and (b) ESI− mode. The markers with different colors represent aliphatic compounds (Xc <2.50), aromatic benzene ring structures (2.50≤ Xc <2.71), naphthalene ring structures (2.71≤ Xc <2.80), anthracene ring structures (2.80≤ Xc <2.83), and pyrene ring structures (2.83≤ Xc <2.92) (Mao et al., 2022).
The oxygenation state (OSc) (Kroll et al., 2011) (defined as ) is another metric to assess the aging/oxidation degree of a compound. Figure 10 illustrates the dependence of OSc on the carbon number for all CHO compounds. The molecules had a broad coverage of OSc (−2 to +2) and carbon number (up to 50). Kroll et al. (2011) grouped the compounds into different origins according to their OSc and C numbers, including fossil fuel combustion HOA, BBOA, semi-volatile oxygenated OA (SV-OOA, typically less oxidized), and low-volatility oxygenated OA (LV-OOA, typically more oxidized), as marked in Fig. 10. Obviously, for both ESI− and ESI+ modes, a large portion of compounds belonged to HOA and BBOA. In ESI+ mode, a significant portion of molecules were located in the BBOA region, while in ESI− mode, more molecules tended to be found in the HOA region, and even more molecules were located within the HOA regime during CS than during SS (Figs. S11 and S12), indicating large influences of anthropogenic emissions. Besides, the number of nighttime LV-OOA molecules was more than that of daytime, particularly during CS, which gives supporting evidence of aqueous and heterogenous reactions.
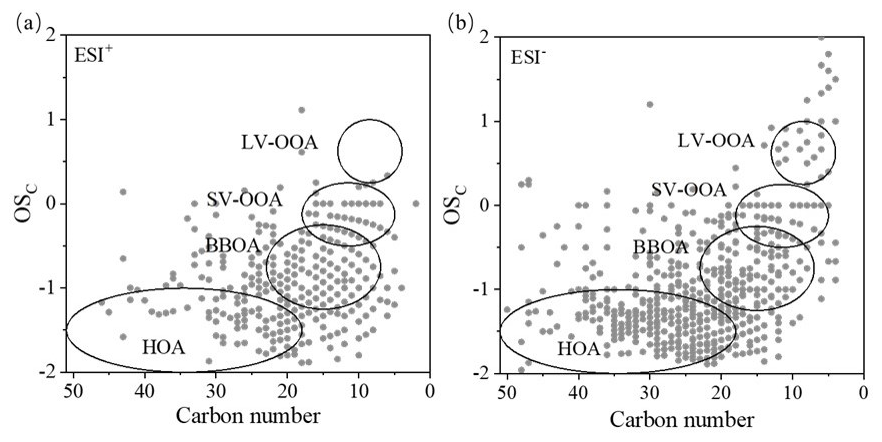
Figure 10Scatterplots of the carbon oxidation state (OSc) versus carbon number for CHO compounds: (a) ESI+ mode and (b) ESI− mode. The circled areas represent those from fossil fuel combustion hydrocarbon-like OA (HOA), biomass burning OA (BBOA), semi-volatile oxygenated OA (SV-OOA), and low-volatility oxygenated OA (LV-OOA) (Kroll et al., 2011).
3.3.3 CHON and CHN compounds
We mapped the detected CHON compounds colored by Xc in the VK diagrams, as shown in Fig. 11. The compounds were sorted into different series according to the functional groups as well. For the ESI+ mode (Fig. 11a), the compounds containing a -NO moiety were dominant and a majority of CHON compounds were saturated with Xc <2.5. Among them, C6H15NO(CH2)n might represent N, N-diethylethanolamine homologous compounds and C6H15NO2(CH2)n might represent diisopropanolamine homologous compounds, as both compounds possess lone-pair electrons, prone to having positive charge (Ge et al., 2011). Unsaturated CHON compounds with Xc ≥2.5 located in the bottom-left corner, such as C5H5NO(CH2)n, C7H7NO(CH2)n, C8H7NO(CH2)n, and C9H7NO(CH2)n, are likely homologous compounds of hydroxypyridine, benzamide, 4-hydroxybenzene acetonitrile, and hydroxyquinoline, respectively (Ma and Hays, 2008; Wang et al., 2020). In ESI− mode, the compounds are scattered more widely than those in ESI+ mode in the VK plot (Fig. 11b), and the majority of them contain one or two nitrogen atoms. Over 25 % of the CHON formulas can be classified as monocyclic or polycyclic compounds with Xc ≥2.5 (even up to 68 % during the SS daytime, inferred from Figs. S13 and S14). The identified series of homologous compounds mostly situated in the bottom-left corner and also with Xc ≥2.5, such as C6H5NO3(CH2)n, C6H5NO4(CH2)n, C8H7NO3(CH2)n, C8H7NO4(CH2)n, and C10H7NO3(CH2)n, are likely nitrophenol, nitrocatechol, nitroacetophenone, nitrophenylacetic acid, and nitronaphthol homologues, respectively (Wang et al., 2018b; Song et al., 2019; Lin et al., 2017; Lin et al., 2015).
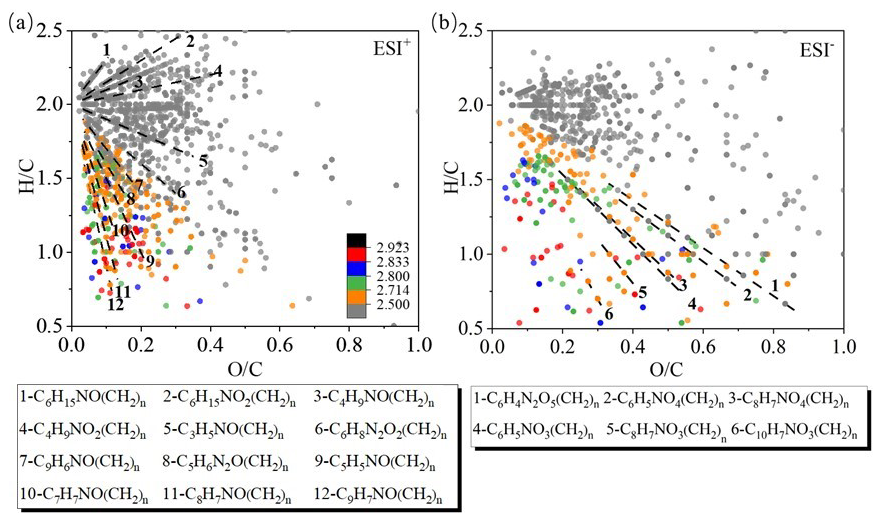
Figure 11Van Krevelen diagrams for CHON compounds detected in both ESI+ and ESI− mode. The data are also colored by Xc values (see caption of Fig. 9), and the different dashed lines represent different series of compounds.
As stated in Sect. 3.3.1, CHN compounds were only enriched in ESI+ mode. The scatterplot of versus of these compounds is depicted in Fig. 12 (results of different periods are shown in Fig. S15). Similarly, they are colored by Xc and sorted into a number of different series. Most of these compounds were amines with one or two N atoms. The series of aliphatic amines and other monocyclic species with Xc <2.71 are mostly located in the upper part of the plot, including C6H15N(CH2)n, C5H11N(CH2)n and C6H12N(CH2)n, C4H6N2(CH2)n, C5H6N2(CH2)n, C7H6N2(CH2)n, and C11H17N(CH2)n. Note the presence of two N-heterocyclic species, which is a sign of the presence of BBOA (Wang et al., 2017). The series of C10H9N(CH2)n (1N-PAHs) with Xc ≥2.71 may represent the aminonaphthalene homologues (Ge et al., 2011), likely from initial burning of carbonaceous materials (Mao et al., 2022).
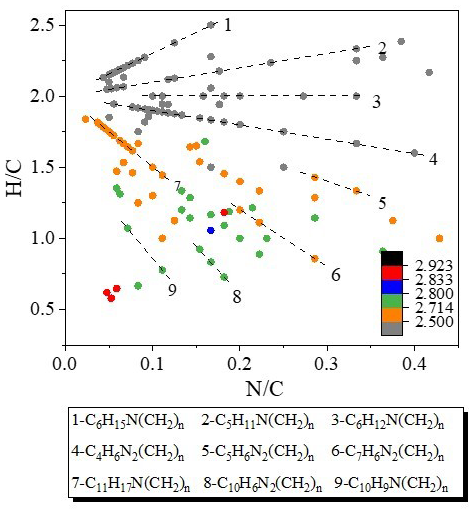
Figure 12Van Krevelen diagram of the CHN compounds in ESI+ mode. The data are also colored by Xc values (see caption of Fig. 9), and the different dashed lines represent different series of compounds.
3.3.4 CHOS and CHONS compounds
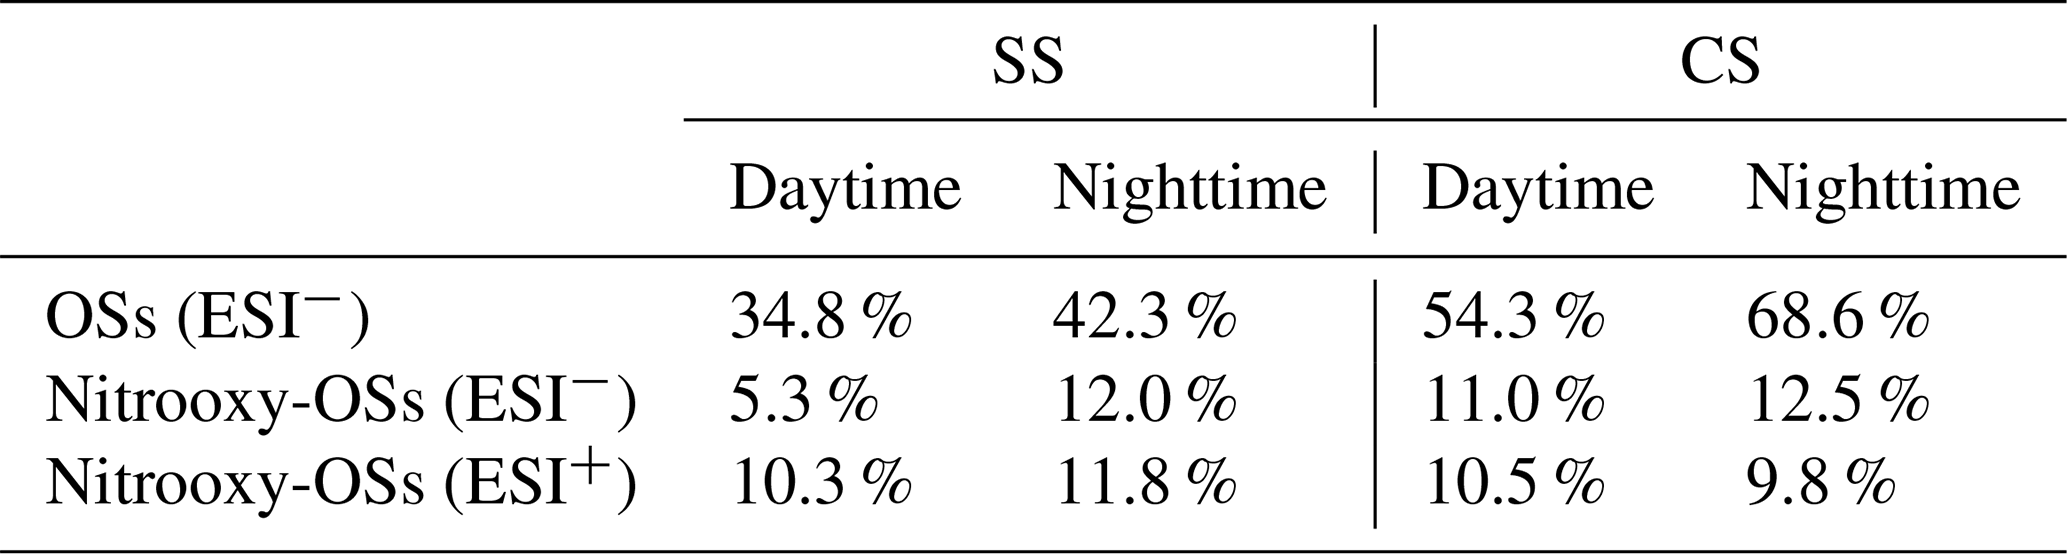
Among the CHOS formulas (only significant in ESI− mode), ones with ratios ≥4 were classified as organosulfates (OSs), which were the most abundant type (Table 4). Their number fractions were particularly high during CS (daytime 54.3 %, nighttime 68.6 %), reiterating the importance of aqueous SOA formation during CS. For the CHONS compounds, in ESI− mode, 5.3 %–12.5 % of the formulas had O(4S + 3N) ratios ≥1, allowing them to be assigned to −OSO3H and −ONO2 groups, namely nitrooxy-organosulfates (nitrooxy-OSs) (Wang et al., 2018a); while in ESI+ mode, 9.8 %–11.8 % of the total CHONS formulas were categorized as nitrooxy-OSs (Table 4).
Table 4The percentages of organosulfates (OSs) in CHOS compounds in ESI− mode and those of nitrooxy-OSs in CHONS compounds in both modes.
3.4 Machine-learning-assisted identification of key BrC molecules
To enhance the robustness of ML analysis, we first incorporated all detected compounds without assigned molecular formulas of both positive and negative modes (4953 formulas: ESI+, 2863; ESI−, 2090) into the ML model. After ML analysis, a total of 1477 molecules (ESI+: 795; ESI−: 682) were found to have positive values for both IncNPu_val and IncMSE_val. Among them, 1051 molecules (ESI+: 420; ESI−: 450) were assigned corresponding molecular formulas; furthermore, a total of 149 compounds with (ESI+: 52; ESI−: 97) were chosen. By comparison with the database, we finally proposed 31 compounds (ESI+: 18, ESI−: 13) as the key BrC species; details regarding their molecular formulas, proposed structures, etc., are summarized in Table S2. These species are related to four out of eight identified types of compounds (CH, CHO, CHN, and CHON) (Fig. 13). To the best of our knowledge, 6 out of the 31 species (4-methylcoumarin, urocanate, 3-hydroxybenzoic acid, chrysin, 2-hydroxypyridine, and 4-hydroxyacetophenone) have not been reported before as important BrC species.
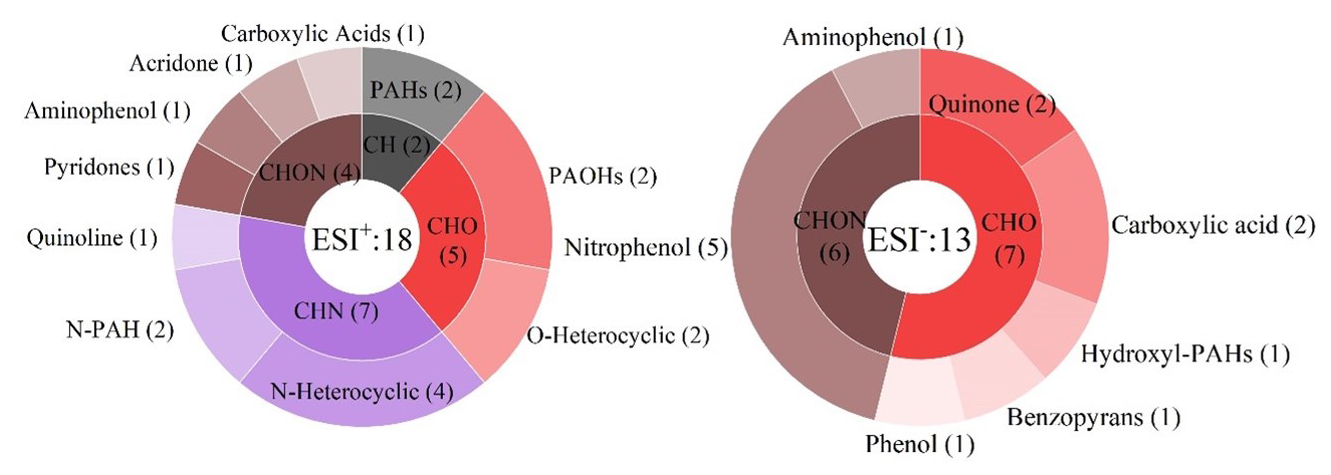
Figure 13Distributions of the key machine-learning-identified light-absorbing organic compounds (details in Table S2 in the Supplement).
Two PAHs (acenaphthylene and fluoranthene, belonging to the CH category) in ESI+ mode were identified, consistent with PAHs being known to be important BrC species (Aurell et al., 2015; Kuang et al., 2021).
Twelve CHO compounds (5 in ESI+ mode and 7 in ESI− mode) were identified. In ESI+ mode, 9-fluorenone and benzanthrone belonging to oxyheterocyclic PAHs (O-PAHs) are known as important BrC chromophores (Kuang et al., 2023); scopoletin is also known as a light-absorbing compound (Zhang, 2018), and phthalic anhydride is an oxygen-containing heterocyclic compound. A previous study reports that methanol (the solvent used here) might react with conjugated carbonyl species (such as phthalic anhydride, maleic anhydride, and maleimide) (Chen et al., 2022), thereby affecting the light absorption of relevant BrC species; further studies are needed to verify whether phthalic anhydride is a key chromophore. In ESI− mode, a pair of quinone isomers (1-hydroxyanthraquinone and 2-hydroxyanthraquinone) were resolved, in agreement with Kuang et al. (2023), who identified 1-hydroxyanthraquinone as a BrC chromophore in Beijing; 1-hydroxypyrene is a hydroxylated PAHs and has also been proven to be a BrC species before (Huang et al., 2022).
The seven identified CHN compounds (exclusively in ESI+ mode) included four N-heterocyclics, two nitro-PAHs, and one quinoline compound. It is well known that biomass burning (BB) releases a lot of BrC species. As mentioned earlier, CHN compounds are abundant in BB emissions (such as agricultural waste burning and forest fires (Laskin et al., 2009)); small N-containing heterocyclic compounds with one or two aromatic rings can be effectively produced from thermal decomposition of plants (Ma and Hays, 2008), and high-temperature pyrolysis of CHN compounds and N-containing plant materials can result in N-PAHs (Lin et al., 2016). Therefore, the identification of the CHN species here as key BrC chromophores is well justified.
The remaining confirmed BrC molecules included 10 CHON compounds (4 in ESI+ mode and 6 in ESI− mode). For ESI− mode, 3-hydroxyanthranilic acid is an amino phenolic compound−, and the five remaining compounds are all nitrophenols, well known as BrC species (Li et al., 2020). Another amino phenolic compound, 2-aminophenol, was identified in ESI+ mode. Previously, efficient light absorption at 275 nm of 2-aminophenol has been reported, which can be further enhanced in the presence of Fe3+ due to formation of oligomers (Al-Abadleh et al., 2022). For acridone in ESI+ mode, earlier studies have shown that acridine exhibits increased light absorbance in the wavelength range of 260–320 nm under irradiation in N2, air, or O2; additionally, a deep-yellow layer forms on the surface, indicating the production of light-absorbing products, which were identified as acridone (Negron-Encarnacion and Arce, 2007).
For the BrC species identified here, most species contain at least one benzene ring (such as PAHs and NACs), except two compounds (2-hydroxypyridine and urocanate) have other aromatic ring structures. This is reasonable as organic compounds with benzene or other aromatic rings (with conjugated double bonds) are known to be strongly light-absorbing. The −OH and −COOH groups on the benzene ring can enhance ultraviolet light absorption at near-UV wavelengths (Jacobson, 1999). The −NO2 group can further increase light absorbance at longer wavelengths (Jacobson, 1999). Our identified BrC list includes compounds with such functional groups. Note that some nitrogen-containing heterocyclic compounds are usually secondary products of aqueous reactions between carbonyl compounds (such as glyoxal and methylglyoxal) and amines or ammonium (Powelson et al., 2014); thus identification of them here as key BrC species is also supporting evidence of the occurrence of aqueous reactions.
This work performed a comprehensive investigation into the chemical and optical properties of BrC in ambient PM2.5 samples. Regarding the chemical properties, it was found that methanol was able to extract more OC than water (∼ 82.0 % vs. 49.5 %–61.3 % of total OC). The WSOA was composed of two primary factors related to fossil fuel combustion (HOA) and biomass burning (BBOA) and two SOA factors (a less oxidized OOA1 and a highly oxygenated OOA2). During CS, OOA2 was abundant (38.6 %–43.5 %), while during SS, OOA1 was abundant (47.5 %–49.8 %); HOA was also an important contributor in both seasons (29.9 %–41.7 %), but BBOA contribution was relatively minor (7.2 %–13.0 %). Further analyses reveal that OOA1 was mainly associated with photochemical reactions, while OOA2 was strongly linked with aqueous and heterogenous reactions.
Regarding the optical properties, our observation shows that Abs365, MSOC was typically larger than Abs365, WSOC, but though MAE365, MSOC was still larger than MAE365, WSOC during SS, it became smaller than MAE365, WSOC during CS, likely owing to the air mass trajectories during CS significantly intercepting sea/coastal air. The light-absorbing abilities of both WSOC and MSOC were weak, but our observations suggest that aqueous oxidation can lead to significant photo-enhancement; therefore the light absorption of WSOA was dominated by OOA2 (50.7 %–63.0 %) during CS. In contrast, photochemical oxidation could cause a photo-bleaching effect, and therefore the contribution of OOA1 to WSOA absorbance was small (15.0 %–16.2 %). The HOA contribution was prevailing during SS (55.6 %–63.7 %). PARAFAC analysis on the fluorescent spectra of both WSOC and MSOC resolved four key components, including three HULIS components and one protein-like component. HIX, BIX, and FI indices also suggest that both WSOC and MSOC originated from a mix of terrestrial and microbial/biogenic sources.
The molecular analysis determined 644–1065 molecules in ESI+ mode and 466–865 molecules in ESI− mode. Overall, CHON compounds were the most abundant type, especially in ESI+ mode, while CHO compounds slightly exceeded CHON compounds in number but were still lower in signal intensity. CHN compounds were the third most important class and only detectable in ESI+ mode. VK diagrams further demonstrate the different aromaticity-equivalent (Xc) values and evolutionary pathways of the different classes of compounds. In addition, a significant presence of organosulfates and nitroxy-organosulfates in CS samples, especially during the nighttime, reaffirms the importance of aqueous-phase oxidation during CS. Finally, based on the molecular characterization and light absorption measurement results, we applied the ML–RF algorithm to identify the key BrC molecules, and we successfully identified 31 key species, including mainly the PAHs, oxyheterocyclic PAHs (O-PAHs), quinones, and N-containing compounds; some of them are newly identified.
Of course, our study has some limitations. One limitation is that no source apportionment was conducted on MSOA due to technical difficulties; therefore a full closure between emission sources and optical properties of total OA is incomplete. Development of a proper method should be the subject of our future work. Our findings here expand the understanding on chemical (both bulk and molecular level) and optical properties (both light absorption and fluorescence) of BrC and are valuable in evaluating BrC impact on air quality and radiation balance, yet our method with ML analysis here serves only as a valuable attempt; more studies are clearly needed.
Nevertheless, the ML approach has demonstrated its great potential in identifying new key BrC species (4-methylcoumarin, urocanate, etc. here) as well as reaffirming the importance of known key BrC molecules (such as the nitrogen-containing aromatic molecules); such an ML-identified list can be a useful reference for future studies. Of course, since there are a number of different types of ML algorithms (such as supervised, unsupervised, semi-supervised, and reinforcement learning) used in environmental research, each with its own advantages and pitfalls (Zhu et al., 2023), the rigorous, accurate, robust, and practicable ML analysis requires more effort and will likely be an active and important topic in the future. The ML approach can be a powerful and promising tool to achieve a quantitative closure between the BrC molecules and their total light absorption.
The software code to analyze the SP-AMS data is publicly available at https://cires1.colorado.edu/jimenez-group/ToFAMSResources/ToFSoftware/index.html (Sueper, 2023). The software code to analyze the UPLC–QTOF–MS data is publicly available at https://systemsomicslab.github.io/compms/msdial/main.html (Tsugawa et al., 2020). The software code using SERRF to normalize UPLC–QTOF–MS data is available at https://slfan.shinyapps.io/ShinySERRF/ (Fan et al., 2019b).
The data in this study are available from the authors upon request (caxinra@163.com).
The supplement related to this article is available online at https://doi.org/10.5194/acp-25-7619-2025-supplement.
YH, XL, and DDH conducted the experiments. YH, XL, RL, BZ, YZ, and XG performed the data analysis. YH and XG wrote the paper. All authors reviewed the paper and provided useful suggestions.
The contact author has declared that none of the authors has any competing interests.
Publisher’s note: Copernicus Publications remains neutral with regard to jurisdictional claims made in the text, published maps, institutional affiliations, or any other geographical representation in this paper. While Copernicus Publications makes every effort to include appropriate place names, the final responsibility lies with the authors.
We sincerely thank those who provided logistic help at the Center for Experimental Atmospheric Science and Environmental Meteorology of Nanjing University of Information Science and Technology (NUIST) during sampling.
This research has been supported by the National Natural Science Foundation of China (grant nos. 22361162668 and 42021004).
This paper was edited by Minghuai Wang and reviewed by two anonymous referees.
Aiken, A. C., DeCarlo, P. F., Kroll, J. H., Worsnop, D. R., Huffman, J. A., Docherty, K. H. S., Ulbrich, I. M., Mohr, C., Kimmel, J. l. R., Sueper, D., Sun, Y. l., Zhang, Q., Trimborn, A., Northway, M., Ziemann, P. J., Canagaratna, M. a. R., Onasch, T. B., Alfarra, M. R., Prevot, A. S. H., Dommen, J., Duplissy, J., Metzger, A., Baltensperger, U., and Jimenez, J. L.: and ratios of primary, secondary, and ambient organic aerosols with high-resolution time-of-flight aerosol mass spectrometry, Environ. Sci. Technol., 42, 4478–4485, https://doi.org/10.1021/es703009q, 2008.
Aiona, P. K., Lee, H. J., Leslie, R., Lin, P., Laskin, A., Laskin, J., and Nizkorodov, S. A.: Photochemistry of products of the aqueous reaction of methylglyoxal with ammonium sulfate, ACS Earth Space Chem., 1, 522–532, https://doi.org/10.1021/acsearthspacechem.7b00075, 2017.
Al-Abadleh, H. A., Motaghedi, F., Mohammed, W., Rana, M. S., Malek, K. A., Rastogi, D., Asa-Awuku, A. A., and Guzman, M. I.: Reactivity of aminophenols in forming nitrogen-containing brown carbon from iron-catalyzed reactions, Commun. Chem., 5, 112, https://doi.org/10.1038/s42004-022-00732-1, 2022.
Andreae, M. O. and Gelencsér, A.: Black carbon or brown carbon? The nature of light-absorbing carbonaceous aerosols, Atmos. Chem. Phys., 6, 3131–3148, https://doi.org/10.5194/acp-6-3131-2006, 2006.
Aurell, J., Gullett, B. K., and Tabor, D.: Emissions from southeastern U.S. Grasslands and pine savannas: Comparison of aerial and ground field measurements with laboratory burns, Atmos. Environ., 111, 170–178, https://doi.org/10.1016/j.atmosenv.2015.03.001, 2015.
Bae, E., Yeo, I. J., Jeong, B., Shin, Y., Shin, K. H., and Kim, S.: Study of double bond equivalents and the numbers of carbon and oxygen atom distribution of dissolved organic matter with negative-mode FT-ICR MS, Anal. Chem., 83, 4193–4199, https://doi.org/10.1021/ac200464q, 2011.
Bai, D. P., Wang, H. L., Tan, Y., Yin, Y., Wu, Z. J., Guo, S., Shen, L. J., Zhu, B., Wang, J. H., and Kong, X. C.: Optical properties of aerosols and chemical composition apportionment under different pollution levels in Wuhan during January 2018, Atmosphere, 11, 17, https://doi.org/10.3390/atmos11010017, 2020.
Barsotti, F., Ghigo, G., and Vione, D.: Computational assessment of the fluorescence emission of phenol oligomers: A possible insight into the fluorescence properties of humic-like substances (HULIS), J. Photochem. Photobiol. A, 315, 87–93, https://doi.org/10.1016/j.jphotochem.2015.09.012, 2016.
Bhowmik, H. S., Tripathi, S. N., Shukla, A. K., Lalchandani, V., Murari, V., Devaprasad, M., Shivam, A., Bhushan, R., Prévôt, A. S. H., and Rastogi, N.: Contribution of fossil and biomass-derived secondary organic carbon to winter water-soluble organic aerosols in Delhi, India, Sci. Total Environ., 912, 168655, https://doi.org/10.1016/j.scitotenv.2023.168655, 2024.
Birdwell, J. E. and Engel, A. S.: Characterization of dissolved organic matter in cave and spring waters using UV–Vis absorbance and fluorescence spectroscopy, Org. Geochem., 41, 270–280, https://doi.org/10.1016/j.orggeochem.2009.11.002, 2010.
Bond, T. C. and Bergstrom, R. W.: Light absorption by carbonaceous particles: an investigative review, Aerosol Sci. Technol., 40, 27–67, https://doi.org/10.1080/02786820500421521, 2006.
Bones, D. L., Henricksen, D. K., Mang, S. A., Gonsior, M., Bateman, A. P., Nguyen, T. B., Cooper, W. J., and Nizkorodov, S. A.: Appearance of strong absorbers and fluorophores in limonene-O3 secondary organic aerosol due to NH4+-mediated chemical aging over long time scales, J. Geophys. Res.-Atmos., 115, D05203, https://doi.org/10.1029/2009JD012864, 2010.
Bozzetti, C., El Haddad, I., Salameh, D., Daellenbach, K. R., Fermo, P., Gonzalez, R., Minguillón, M. C., Iinuma, Y., Poulain, L., Elser, M., Müller, E., Slowik, J. G., Jaffrezo, J.-L., Baltensperger, U., Marchand, N., and Prévôt, A. S. H.: Organic aerosol source apportionment by offline-AMS over a full year in Marseille, Atmos. Chem. Phys., 17, 8247–8268, https://doi.org/10.5194/acp-17-8247-2017, 2017.
Brown, H., Wang, H. L., Flanner, M., Liu, X. H., Singh, B., Zhang, R. D., Yang, Y., and Wu, M. X.: Brown Carbon Fuel and Emission Source Attributions to Global Snow Darkening Effect, J. Adv. Model. Earth Sy., 14, e2021MS002768, https://doi.org/10.1029/2021ms002768, 2022.
Budisulistiorini, S. H., Riva, M., Williams, M., Chen, J., Itoh, M., Surratt, J. D., and Kuwata, M.: Light-absorbing brown carbon aerosol constituents from combustion of indonesian peat and biomass, Environ. Sci. Technol., 51, 4415–4423, https://doi.org/10.1021/acs.est.7b00397, 2017.
Cain, J., Laskin, A., Kholghy, M. R., Thomson, M. J., and Wang, H.: Molecular characterization of organic content of soot along the centerline of a coflow diffusion flame, Phys. Chem. Chem. Phys., 16, 25862–25875, https://doi.org/10.1039/C4CP03330B, 2014.
Canagaratna, M. R., Jayne, J. T., Ghertner, D. A., Herndon, S., Shi, Q., Jimenez, J. L., Silva, P. J., Williams, P., Lanni, T., Drewnick, F., Demerjian, K. L., Kolb, C. E., and Worsnop, D. R.: Chase studies of particulate emissions from in-use New York City vehicles, Aerosol Sci. Technol., 38, 555–573, https://doi.org/10.1080/02786820490465504, 2004.
Canagaratna, M. R., Jimenez, J. L., Kroll, J. H., Chen, Q., Kessler, S. H., Massoli, P., Hildebrandt Ruiz, L., Fortner, E., Williams, L. R., Wilson, K. R., Surratt, J. D., Donahue, N. M., Jayne, J. T., and Worsnop, D. R.: Elemental ratio measurements of organic compounds using aerosol mass spectrometry: characterization, improved calibration, and implications, Atmos. Chem. Phys., 15, 253–272, https://doi.org/10.5194/acp-15-253-2015, 2015.
Cao, T., Li, M., Zou, C., Fan, X., Song, J., Jia, W., Yu, C., Yu, Z., and Peng, P.: Chemical composition, optical properties, and oxidative potential of water- and methanol-soluble organic compounds emitted from the combustion of biomass materials and coal, Atmos. Chem. Phys., 21, 13187–13205, https://doi.org/10.5194/acp-21-13187-2021, 2021.
Cavalli, F., Facchini, M. C., Decesari, S., Mircea, M., Emblico, L., Fuzzi, S., Ceburnis, D., Yoon, Y. J., O'Dowd, C. D., Putaud, J. P., and Dell'Acqua, A.: Advances in characterization of size-resolved organic matter in marine aerosol over the North Atlantic, J. Geophys. Res.-Atmos., 109, D24215, https://doi.org/10.1029/2004JD005137, 2004.
Chakrabarty, R. K., Moosmüller, H., Chen, L.-W. A., Lewis, K., Arnott, W. P., Mazzoleni, C., Dubey, M. K., Wold, C. E., Hao, W. M., and Kreidenweis, S. M.: Brown carbon in tar balls from smoldering biomass combustion, Atmos. Chem. Phys., 10, 6363–6370, https://doi.org/10.5194/acp-10-6363-2010, 2010.
Chakrabarty, R. K., Shetty, N. J., Thind, A. S., Beeler, P., Sumlin, B. J., Zhang, C., Liu, P., Idrobo, J. C., Adachi, K., Wagner, N. L., Schwarz, J. P., Ahern, A., Sedlacek III, A. J., Lambe, A., Daube, C., Lyu, M., Liu, C., Herndon, S., Onasch, T. B., and Mishra, R.: Shortwave absorption by wildfire smoke dominated by dark brown carbon, Nat. Geosci., 16, 683–688, https://doi.org/10.1038/s41561-023-01237-9, 2023.
Chen, K. P., Raeofy, N., Lum, M., Mayorga, R., Woods, M., Bahreini, R., Zhang, H. F., and Lin, Y. H.: Solvent effects on chemical composition and optical properties of extracted secondary brown carbon constituents, Aerosol Sci. Technol., 56, 917–930, https://doi.org/10.1080/02786826.2022.2100734, 2022.
Chen, Q. C., Miyazaki, Y., Kawamura, K., Matsumoto, K., Coburn, S., Volkamer, R., Iwamoto, Y., Kagami, S., Deng, Y. G., Ogawa, S. H., Ramasamy, S., Kato, S., Ida, A., Kajii, Y., and Mochida, M.: Characterization of chromophoric water-soluble organic matter in urban, forest, and marine aerosols by HR-ToF-AMS analysis and excitation–emission matrix spectroscopy, Environ. Sci. Technol., 50, 10351–10360, https://doi.org/10.1021/acs.est.6b01643, 2016.
Chen, Q. C., Li, J. W., Hua, X. Y., Jiang, X. T., Mu, Z., Wang, M. M., Wang, J., Shan, M., Yang, X. D., Fan, X. J., Song, J. Z., Wang, Y. Q., Guan, D. J., and Du, L.: Identification of species and sources of atmospheric chromophores by fluorescence excitation-emission matrix with parallel factor analysis, Sci. Total Environ., 718, 137322, https://doi.org/10.1016/j.scitotenv.2020.137322, 2020a.
Chen, Q. C., Hua, X. Y., Li, J. W., Chang, T., and Wang, Y. Q.: Diurnal evolutions and sources of water-soluble chromophoric aerosols over Xi'an during haze event, in Northwest China, Sci. Total Environ., 786, 147412, https://doi.org/10.1016/j.scitotenv.2021.147412, 2021.
Chen, Y. and Bond, T. C.: Light absorption by organic carbon from wood combustion, Atmos. Chem. Phys., 10, 1773–1787, https://doi.org/10.5194/acp-10-1773-2010, 2010.
Chen, Y. F., Ge, X. L., Chen, H., Xie, X. C., Chen, Y. T., Wang, J. F., Ye, Z. L., Bao, M. Y., Zhang, Y. L., and Chen, M. D.: Seasonal light absorption properties of water-soluble brown carbon in atmospheric fine particles in Nanjing, China, Atmos. Environ., 187, 230–240, https://doi.org/10.1016/j.atmosenv.2018.06.002, 2018.
Chen, Y. F., Xie, X. C., Shi, Z., Li, Y. L., Gai, X. Y., Wang, J. F., Li, H. W., Wu, Y., Zhao, X. Y., Chen, M. D., and Ge, X. L.: Brown carbon in atmospheric fine particles in Yangzhou, China: Light absorption properties and source apportionment, Atmos. Res., 244, 105028, https://doi.org/10.1016/j.atmosres.2020.105028, 2020b.
Cheng, Y., He, K. B., Du, Z. Y., Engling, G., Liu, J. M., Ma, Y. L., Zheng, M., and Weber, R. J.: The characteristics of brown carbon aerosol during winter in Beijing, Atmos. Environ., 127, 355–364, https://doi.org/10.1016/j.atmosenv.2015.12.035, 2016.
Coble, P. G.: Characterization of marine and terrestrial DOM in seawater using excitation-emission matrix spectroscopy, Mar. Chem., 51, 325–346, https://doi.org/10.1016/0304-4203(95)00062-3, 1996.
Daellenbach, K. R., Stefenelli, G., Bozzetti, C., Vlachou, A., Fermo, P., Gonzalez, R., Piazzalunga, A., Colombi, C., Canonaco, F., Hueglin, C., Kasper-Giebl, A., Jaffrezo, J.-L., Bianchi, F., Slowik, J. G., Baltensperger, U., El-Haddad, I., and Prévôt, A. S. H.: Long-term chemical analysis and organic aerosol source apportionment at nine sites in central Europe: source identification and uncertainty assessment, Atmos. Chem. Phys., 17, 13265–13282, https://doi.org/10.5194/acp-17-13265-2017, 2017.
DeLessio, M. A., Tsigaridis, K., Bauer, S. E., Chowdhary, J., and Schuster, G. L.: Modeling atmospheric brown carbon in the GISS ModelE Earth system model, Atmos. Chem. Phys., 24, 6275–6304, https://doi.org/10.5194/acp-24-6275-2024, 2024.
Deng, J., Ma, H., Wang, X., Zhong, S., Zhang, Z., Zhu, J., Fan, Y., Hu, W., Wu, L., Li, X., Ren, L., Pavuluri, C. M., Pan, X., Sun, Y., Wang, Z., Kawamura, K., and Fu, P.: Measurement report: Optical properties and sources of water-soluble brown carbon in Tianjin, North China – insights from organic molecular compositions, Atmos. Chem. Phys., 22, 6449–6470, https://doi.org/10.5194/acp-22-6449-2022, 2022.
Dey, S., Mukherjee, A., Polana, A. J., Rana, A., Mao, J. Y., Jia, S. G., Yadav, A. K., Khillare, P. S., and Sarkar, S.: Brown carbon aerosols in the Indo-Gangetic Plain outflow: insights from excitation emission matrix (EEM) fluorescence spectroscopy, Environ. Sci.: Processes Impacts, 23, 745–755, https://doi.org/10.1039/D1EM00050K, 2021.
Dong, W. M., Wan, J. M., Tokunaga, T. K., Gilbert, B., and Williams, K. H.: Transport and humification of dissolved organic matter within a semi-arid floodplain, J. Environ. Sci, 57, 24–32, https://doi.org/10.1016/j.jes.2016.12.011, 2017.
Du, Z. Y., He, K. B., Cheng, Y., Duan, F. K., Ma, Y. L., Liu, J. M., Zhang, X. L., Zheng, M., and Weber, R.: A yearlong study of water-soluble organic carbon in Beijing II: Light absorption properties, Atmos. Environ., 89, 235–241, https://doi.org/10.1016/j.atmosenv.2014.02.022, 2014.
Dührkop, K., Fleischauer, M., Ludwig, M., Aksenov, A. r. A., Melnik, A. V., Meusel, M., Dorrestein, P. r. C., Rousu, J., and Böcker, S.: SIRIUS 4: a rapid tool for turning tandem mass spectra into metabolite structure information, Nat. Methods, 16, 299–302, https://doi.org/10.1038/s41592-019-0344-8, 2019.
Fan, X., Wei, S., Zhu, M., Song, J., and Peng, P.: Comprehensive characterization of humic-like substances in smoke PM2.5 emitted from the combustion of biomass materials and fossil fuels, Atmos. Chem. Phys., 16, 13321–13340, https://doi.org/10.5194/acp-16-13321-2016, 2016.
Fan, X. J., Yu, X. F., Wang, Y., Xiao, X., Li, F. Y., Xie, Y., Wei, S. Y., Song, J. Z., and Peng, P. A.: The aging behaviors of chromophoric biomass burning brown carbon during dark aqueous hydroxyl radical oxidation processes in laboratory studies, Atmos. Environ., 205, 9–18, https://doi.org/10.1016/j.atmosenv.2019.02.039, 2019a.
Fan, S., Kind, T., Cajka, T., Hazen, S. L., Tang, W. H. W., Kaddurah-Daouk, R., Irvin, M. R., Arnett, D. K., Barupal, D. K., and Fiehn, O.: Systematic Error Removal Using Random Forest for Normalizing Large-Scale Untargeted Lipidomics Data, Anal. Chem., 91, 3590–3596, https://doi.org/10.1021/acs.analchem.8b05592, 2019b (code available at: https://slfan.shinyapps.io/ShinySERRF/, last access: 30 June 2025).
Fan, Y., Liu, C.-Q., Li, L., Ren, L., Ren, H., Zhang, Z., Li, Q., Wang, S., Hu, W., Deng, J., Wu, L., Zhong, S., Zhao, Y., Pavuluri, C. M., Li, X., Pan, X., Sun, Y., Wang, Z., Kawamura, K., Shi, Z., and Fu, P.: Large contributions of biogenic and anthropogenic sources to fine organic aerosols in Tianjin, North China, Atmos. Chem. Phys., 20, 117–137, https://doi.org/10.5194/acp-20-117-2020, 2020.
Fasola, S., Maio, S., Baldacci, S., La Grutta, S., Ferrante, G., Forastiere, F., Stafoggia, M., Gariazzo, C., and Viegi, G.: Effects of particulate matter on the incidence of respiratory diseases in the pisan longitudinal study, Int. J. Env. Res. Pu., 17, 2540, https://doi.org/10.3390/ijerph17072540, 2020.
Feng, Y., Ramanathan, V., and Kotamarthi, V. R.: Brown carbon: a significant atmospheric absorber of solar radiation?, Atmos. Chem. Phys., 13, 8607–8621, https://doi.org/10.5194/acp-13-8607-2013, 2013.
Fleming, L. T., Lin, P., Roberts, J. M., Selimovic, V., Yokelson, R., Laskin, J., Laskin, A., and Nizkorodov, S. A.: Molecular composition and photochemical lifetimes of brown carbon chromophores in biomass burning organic aerosol, Atmos. Chem. Phys., 20, 1105–1129, https://doi.org/10.5194/acp-20-1105-2020, 2020.
Fu, P. Q., Kawamura, K., Chen, J., Qin, M. Y., Ren, L. J., Sun, Y. L., Wang, Z. F., Barrie, L. A., Tachibana, E., Ding, A. J., and Yamashita, Y.: Fluorescent water-soluble organic aerosols in the High Arctic atmosphere, Sci. Rep., 5, 9845, https://doi.org/10.1038/srep09845, 2015.
Ge, X. L., Wexler, A. S., and Clegg, S. L.: Atmospheric amines – part I. a review, Atmos. Environ., 45, 524–546, https://doi.org/10.1016/j.atmosenv.2010.10.012, 2011.
Ge, X. L., Li, L., Chen, Y. F., Chen, H., Wu, D., Wang, J. F., Xie, X. C., Ge, S., Ye, Z. L., Xu, J. Z., and Chen, M. D.: Aerosol characteristics and sources in Yangzhou, China resolved by offline aerosol mass spectrometry and other techniques, Environ. Pollut., 225, 74–85, https://doi.org/10.1016/j.envpol.2017.03.044, 2017.
Ge, X., Sun, Y., Trousdell, J., Chen, M., and Zhang, Q.: Enhancing characterization of organic nitrogen components in aerosols and droplets using high-resolution aerosol mass spectrometry, Atmos. Meas. Tech., 17, 423–439, https://doi.org/10.5194/amt-17-423-2024, 2024.
Gilardoni, S., Massoli, P., Paglione, M., Giulianelli, L., Carbone, C., Rinaldi, M., Decesari, S., Sandrini, S., Costabile, F., Gobbi, G. P., Pietrogrande, M. C., Visentin, M., Scotto, F., Fuzzi, S., and Facchini, M. C.: Direct observation of aqueous secondary organic aerosol from biomass-burning emissions, P. Natl. Acad. Sci. USA, 113, 10013–10018, https://doi.org/10.1073/pnas.1602212113, 2016.
González, C., Mira-M., J., and Juárez, I.: Important variable assessment and electricity price forecasting based on regression tree models: classification and regression trees, Bagging and Random Forests, IET Gener. Transm. Dis., 9, 1120-=1128, https://doi.org/10.1049/iet-gtd.2014.0655, 2015.
Gu, C. J., Cui, S. J., Ge, X. L., Wang, Z. Y., Chen, M. J., Qian, Z. H., Liu, Z. Y., Wang, X. F., and Zhang, Y. J.: Chemical composition, sources and optical properties of nitrated aromatic compounds in fine particulate matter during winter foggy days in Nanjing, China, Environ. Res., 212, 113255, https://doi.org/10.1016/j.envres.2022.113255, 2022.
Hawkins, L. N., Lemire, A. N., Galloway, M. M., Corrigan, A. L., Turley, J. J., Espelien, B. M., and De H., D. O.: Maillard chemistry in clouds and aqueous aerosol as a source of atmospheric humic-like substances, Environ. Sci. Technol., 50, 7443–7452, https://doi.org/10.1021/acs.est.6b00909, 2016.
Hecobian, A., Zhang, X., Zheng, M., Frank, N., Edgerton, E. S., and Weber, R. J.: Water-Soluble Organic Aerosol material and the light-absorption characteristics of aqueous extracts measured over the Southeastern United States, Atmos. Chem. Phys., 10, 5965–5977, https://doi.org/10.5194/acp-10-5965-2010, 2010.
Hu, J., Wang, P., Ying, Q., Zhang, H., Chen, J., Ge, X., Li, X., Jiang, J., Wang, S., Zhang, J., Zhao, Y., and Zhang, Y.: Modeling biogenic and anthropogenic secondary organic aerosol in China, Atmos. Chem. Phys., 17, 77–92, https://doi.org/10.5194/acp-17-77-2017, 2017.
Hu, R. L., Xu, Q. C., Wang, S. X., Hua, Y., Bhattarai, N., Jiang, J K., Song, Y., Daellenbach, K. R., Qi, L., Prevot, A. S. H., and Hao, J. M.: Chemical characteristics and sources of water-soluble organic aerosol in southwest suburb of Beijing, J. Environ. Sci., 95, 99–110, https://doi.org/10.1016/j.jes.2020.04.004, 2020.
Huang, L. B., Liu, T. S., and Grassian, V. H.: Radical-Initiated formation of aromatic organosulfates and sulfonates in the aqueous phase, Environ. Sci. Technol., 54, 11857–11864, https://doi.org/10.1021/acs.est.0c05644, 2020.
Huang, R. J., Yang, L., Cao, J. J., Chen, Y., Chen, Q., Li, Y. J., Duan, J., Zhu, C. S., Dai, W. T., Wang, K., Lin, C. S., Ni, H. Y., Corbin, J. C., Wu, Y. F., Zhang, R. J., Tie, X. X., Hoffmann, T., O'Dowd, C., and Dusek, U.: Brown carbon aerosol in urban Xi'an, northwest China: the composition and light absorption properties, Environ. Sci. Technol., 52, 6825–6833, https://doi.org/10.1021/acs.est.8b02386, 2018.
Huang, R. J., Yang, L., Shen, J. C., Yuan, W., Gong, Y. Q., Ni, H. Y., Duan, J., Yan, J., Huang, H. B., You, Q. H., and Li, Y., J.: Chromophoric fingerprinting of brown carbon from residential biomass burning, Environ. Sci. Technol. Lett., 9, 102–111, https://doi.org/10.1021/acs.estlett.1c00837, 2022.
Huguet, A., Vacher, L., Relexans, S., Saubusse, S., Froidefond, J. M., and Parlanti, E.: Properties of fluorescent dissolved organic matter in the Gironde Estuary, Org. Geochem., 40, 706–719, https://doi.org/10.1016/j.orggeochem.2009.03.002, 2009.
Jacobson, M. Z.: Isolating nitrated and aromatic aerosols and nitrated aromatic gases as sources of ultraviolet light absorption, J. Geophys. Res.-Atmos., 104, 3527–3542, https://doi.org/10.1029/1998JD100054, 1999.
Jiang, W. Q., Misovich, M. V., Hettiyadura, A. P. S., Laskin, A., McFall, A. S., Anastasio, C., and Zhang, Q.: Photosensitized Reactions of a phenolic carbonyl from wood combustion in the aqueous phase – chemical evolution and light absorption properties of aqSOA, Environ. Sci. Technol., 55, 5199–5211, https://doi.org/10.1021/acs.est.0c07581, 2021.
Jiang, X. T., Liu, D. T., Li, Q., Tian, P., Wu, Y. Z., Li, S. Y., Hu, K., Ding, S., Bi, K., Li, R. J., Huang, M. Y., Ding, D. P., Chen, Q. C., Kong, S. F., Li, W. J., Pang, Y., and He, D.: Connecting the light absorption of atmospheric organic aerosols with oxidation state and polarity, Environ. Sci. Technol., 56, 12873–12885, https://doi.org/10.1021/acs.est.2c02202, 2022.
Jo, D. S., Park, R. J., Lee, S., Kim, S.-W., and Zhang, X.: A global simulation of brown carbon: implications for photochemistry and direct radiative effect, Atmos. Chem. Phys., 16, 3413–3432, https://doi.org/10.5194/acp-16-3413-2016, 2016.
Kim, H. J., Collier, S., Ge, X. L., Xu, J. Z., Sun, Y. L., Jiang, W. Q., Wang, Y. L., Herckes, P., and Zhang, Q.: Chemical processing of water-soluble species and formation of secondary organic aerosol in fogs, Atmos. Environ., 200, 158–166, https://doi.org/10.1016/j.atmosenv.2018.11.062, 2019.
Kourtchev, I., O'Connor, I. P., Giorio, C., Fuller, S. J., Kristensen, K., Maenhaut, W., Wenger, J. C., Sodeau, J. R., Glasius, M., and Kalberer, M.: Effects of anthropogenic emissions on the molecular composition of urban organic aerosols: An ultrahigh resolution mass spectrometry study, Atmos. Environ., 89, 525–532, https://doi.org/10.1016/j.atmosenv.2014.02.051, 2014.
Kroll, J. H., Donahue, N. M., Jimenez, J. L., Kessler, S. H., Canagaratna, M. R., Wilson, K. R., Altieri, K. E., Mazzoleni, L. R., Wozniak, A. S., Bluhm, H., Mysak, E. R., Smith, J. D., Kolb, C. E., and Worsnop, D. R.: Carbon oxidation state as a metric for describing the chemistry of atmospheric organic aerosol, Nat. Chem., 3, 133–139, https://doi.org/10.1038/nchem.948, 2011.
Kuang, Y., Shang, J., and Chen, Q. C.: Effect of ozone aging on light absorption and fluorescence of brown carbon in soot particles: The important role of polycyclic aromatic hydrocarbons, J. Hazard. Mater., 413, 125406, https://doi.org/10.1016/j.jhazmat.2021.125406, 2021.
Kuang, Y., Shang, J., Sheng, M. S., Shi, X. D., Zhu, J. L., and Qiu, X. H.: Molecular Composition of Beijing PM2.5 Brown Carbon Revealed by an Untargeted Approach Based on Gas Chromatography and Time-of-Flight Mass Spectrometry, Environ. Sci. Technol., 57, 909–919, https://doi.org/10.1021/acs.est.2c05918, 2023.
Kumar, V., Giannoukos, S., Haslett, S. L., Tong, Y., Singh, A., Bertrand, A., Lee, C. P., Wang, D. S., Bhattu, D., Stefenelli, G., Dave, J. S., Puthussery, J. V., Qi, L., Vats, P., Rai, P., Casotto, R., Satish, R., Mishra, S., Pospisilova, V., Mohr, C., Bell, D. M., Ganguly, D., Verma, V., Rastogi, N., Baltensperger, U., Tripathi, S. N., Prévôt, A. S. H., and Slowik, J. G.: Highly time-resolved chemical speciation and source apportionment of organic aerosol components in Delhi, India, using extractive electrospray ionization mass spectrometry, Atmos. Chem. Phys., 22, 7739–7761, https://doi.org/10.5194/acp-22-7739-2022, 2022.
Lambe, A. T., Cappa, C. D., Massoli, P., Onasch, T. B., Forestieri, S. D., Martin, A. T., Cummings, M. J., Croasdale, D. R., Brune, W. H., Worsnop, D. R., and Davidovits, P.: Relationship between Oxidation Level and Optical Properties of Secondary Organic Aerosol, Environ. Sci. Technol., 47, 6349–6357, https://doi.org/10.1021/es401043j, 2013.
Laskin, A., Smith, J. S., and Laskin, J.: Molecular characterization of nitrogen-containing organic compounds in biomass burning aerosols using high-resolution mass spectrometry, Environ. Sci. Technol., 43, 3764–3771, https://doi.org/10.1021/es803456n, 2009.
Laskin, A., Laskin, J., and Nizkorodov, S. A.: Chemistry of atmospheric brown carbon, Chem. Rev., 115, 4335–4382, https://doi.org/10.1021/cr5006167, 2015.
Laskin, A., West, C. P., and Hettiyadura, A. P. S.: Molecular insights into the composition, sources, and aging of atmospheric brown carbon, Chem. Soc. Rev., 54, 1583–1612, 10.1039/d3cs00609c, 2025.
Lee, H. L., Laskin, A., Laskin, J., and Nizkorodov, S. A.: Excitation–emission spectra and fluorescence quantum yields for fresh and aged biogenic secondary organic aerosols, Environ. Sci. Technol., 47, 5763–5770, https://doi.org/10.1021/es400644c, 2013.
Lei, R. Y., Sha, Y. Y., Meng, H. F., Huang, Y., Ye, J. H., Huang, D. D., Zhang, Y. J., Wu, Y., Li, Y. J., and Ge, X. L.: Aqueous phase photolysis of 4-nitrocatechol: Reaction kinetics, evolutions of chemical composition, light absorption and oxidation potential, Atmos. Environ., 343, 120981, https://doi.org/10.1016/j.atmosenv.2024.120981, 2025.
Li, H., Qin, X. F., Wang, G. C., Xu, J., Wang, Lu, D., Liu, C., Zheng, H., Liu, J. G., Huang, K., and Deng, C. R.: Conjoint impacts of continental outflows and marine sources on brown carbon in the East China sea: Abundances, optical properties, and formation processes, Atmos. Environ., 273, 118959, https://doi.org/10.1016/j.atmosenv.2022.118959, 2022a.
Li, H. W., Cui, L., Huang, Y., Zhang, Y. J., Wang, J. F., Chen, M. D., and Ge, X. L.: Concurrent dominant pathways of multifunctional products formed from nocturnal isoprene oxidation, Chemosphere, 322, 138185, https://doi.org/10.1016/j.chemosphere.2023.138185, 2023.
Li, M., Wang, X. F., Lu, C. Y., Li, R., Zhang, J., Dong, S. W., Yang, L. X., Xue, L., Chen, J. M., and Wang, W. X.: Nitrated phenols and the phenolic precursors in the atmosphere in urban Jinan, China, Sci. Total Environ., 714, 136760, https://doi.org/10.1016/j.scitotenv.2020.136760, 2020.
Li, M. J., Fan, X. J., Zhu, M. B., Zou, C. L., Song, J. Z., Wei, S. Y., Jia, W. L., and Peng, P. A.: Abundance and light absorption properties of brown carbon emitted from residential coal combustion in China, Environ. Sci. Technol., 53, 595–603, https://doi.org/10.1021/acs.est.8b05630, 2019.
Li, S., Chen, C., Yang, G.-l., Fang, J., Sun, Y., Tang, L., Wang, H., Xiang, W., Zhang, H., Croteau, P. L., Jayne, J. T., Liao, H., Ge, X., Favez, O., and Zhang, Y.: Sources and processes of organic aerosol in non-refractory PM1 and PM2.5 during foggy and haze episodes in an urban environment of the Yangtze River Delta, China, Environ. Res., 212, 113557, https://doi.org/10.1016/j.envres.2022.113557, 2022b.
Li, X., Tao, Y., Zhu, L., Ma, S., Luo, S., Zhao, Z., Sun, N., Ge, X., and Ye, Z.: Optical and chemical properties and oxidative potential of aqueous-phase products from OH and 3C*-initiated photooxidation of eugenol, Atmos. Chem. Phys., 22, 7793–7814, https://doi.org/10.5194/acp-22-7793-2022, 2022c.
Lin, G. X., Penner, J. E., Flanner, M. G., Sillman, S., Xu, L., and Zhou, C.: Radiative forcing of organic aerosol in the atmosphere and on snow: effects of SOA and brown carbon, J. Geophys. Res.-Atmos., 119, 7453–7476, https://doi.org/10.1002/2013JD021186, 2014.
Lin, P., Rincon, A. G., Kalberer, M., and Yu, J. Z.: Elemental composition of HULIS in the pearl river delta region, China: results inferred from positive and negative electrospray high resolution mass spectrometric data, Environ. Sci. Technol., 46, 7454–7462, https://doi.org/10.1021/es300285d, 2012.
Lin, P., Liu, J. M., Shilling, J. E., Kathmann, S. M., Laskin, J., and Laskin, A.: Molecular characterization of brown carbon (BrC) chromophores in secondary organic aerosol generated from photo-oxidation of toluene, Phys. Chem. Chem. Phys., 17, 23312–23325, https://doi.org/10.1039/C5CP02563J, 2015.
Lin, P., Aiona, P. K., Li, Y., Shiraiwa, M., Laskin, J., Nizkorodov, S. A., and Laskin, A.: Molecular characterization of brown carbon in ciomass curning aerosol particles, Environ. Sci. Technol., 50, 11815–11824, https://doi.org/10.1021/acs.est.6b03024, 2016.
Lin, P., Bluvshtein, N., Rudich, Y., Nizkorodov, S. A., Laskin, J., and Laskin, A.: Molecular chemistry of atmospheric brown carbon inferred from a nationwide biomass burning event, Environ. Sci. Technol., 51, 11561–11570, https://doi.org/10.1021/acs.est.7b02276, 2017.
Lin, P., Fleming, L. T., Nizkorodov, S. A., Laskin, J., and Laskin, A.: Comprehensive molecular characterization of atmospheric brown carbon by high resolution mass spectrometry with electrospray and atmospheric pressure photoionization, Anal. Chem., 90, 12493–12502, https://doi.org/10.1021/acs.analchem.8b02177, 2018.
Liu, S. J., Wang, Y. Q., Zhang, S., Chen, Y. B., Wu, C., Zhang, G. Q., and Wang, G. H.: The synergistic effect of NOx and SO2 on the formation and light absorption of secondary organic aerosols from o-xylene photooxidation, Atmos. Res., 304, 107387, https://doi.org/10.1016/j.atmosres.2024.107387, 2024.
Liu, Y., Li, H. W., Cui, S. J., Nie, D. Y., Chen, Y. F., and Ge, X. L.: Chemical Characteristics and Sources of Water-Soluble Organic Nitrogen Species in PM2.5 in Nanjing, China, Atmosphere, 12, 574, https://doi.org/10.3390/atmos12050574, 2021.
Lobodin, V. V., Marshall, A. G., and Hsu, C. S.: Compositional space boundaries for organic compounds, Anal. Chem., 84, 3410–3416, https://doi.org/10.1021/ac300244f, 2012.
Ma, Y. L. and Hays, M. D.: Thermal extraction–two-dimensional gas chromatography–mass spectrometry with heart-cutting for nitrogen heterocyclics in biomass burning aerosols, J. Chromatogr. A, 1200, 228–234, https://doi.org/10.1016/j.chroma.2008.05.078, 2008.
Mao, J. F., Cheng, Y., Bai, Z., Zhang, W., Zhang, L. Y., Chen, H., Wang, L. N., Li, L., and Chen, J. M.: Molecular characterization of nitrogen-containing organic compounds in the winter North China Plain, Sci. Total. Environ., 838, 156189, https://doi.org/10.1016/j.scitotenv.2022.156189, 2022.
Matos, J. T. V., Freire, S. M. S. C., Duarte, R. M. B. O., and Duarte, A. C.: Natural organic matter in urban aerosols: comparison between water and alkaline soluble components using excitation–emission matrix fluorescence spectroscopy and multiway data analysis, Atmos. Environ., 102, 1–10, https://doi.org/10.1016/j.atmosenv.2014.11.042, 2015.
McKnight, D. M., Boyer, E. W., Westerhoff, P. K., Doran, P. T., Kulbe, T., and Andersen, D. T.: Spectrofluorometric characterization of dissolved organic matter for indication of precursor organic material and aromaticity, Limnol. Oceanogr., 46, 38–48, https://doi.org/10.4319/lo.2001.46.1.0038, 2001.
McNeill, V. F.: Aqueous organic chemistry in the atmosphere: sources and chemical processing of organic aerosols, Environ. Sci. Technol., 49, 1237–1244, https://doi.org/10.1021/es5043707, 2015.
Murphy, K. R., Hambly, A., Singh, S., Henderson, R. K., Baker, A., Stuetz, R., and Khan, S. J.: Organic matter fluorescence in municipal water recycling schemes: toward a unified PARAFAC model, Environ. Sci. Technol., 45, 2909–2916, https://doi.org/10.1021/es103015e, 2011.
Murphy, K. R., Stedmon, C. A., Graeber, D., and Bro, R.: Fluorescence spectroscopy and multi-way techniques. PARAFAC, Anal. Methods, 5, 6557–6566, https://doi.org/10.1039/c3ay41160e, 2013.
Negron-Encarnacion, I. and Arce, R.: Light-induced transformations of aza-aromatic pollutants adsorbed on models of atmospheric particulate matter: Acridine and 9(10-H) acridone, Atmos. Environ., 41, 6771–6783, https://doi.org/10.1016/j.atmosenv.2007.04.062, 2007.
O'Brien, R. E., Ridley, K. J., Canagaratna, M. R., Jayne, J. T., Croteau, P. L., Worsnop, D. R., Budisulistiorini, S. H., Surratt, J. D., Follett, C. L., Repeta, D. J., and Kroll, J. H.: Ultrasonic nebulization for the elemental analysis of microgram-level samples with offline aerosol mass spectrometry, Atmos. Meas. Tech., 12, 1659–1671, https://doi.org/10.5194/amt-12-1659-2019, 2019.
Onasch, T. B., Trimborn, A., Fortner, E. C., Jayne, J. T., Kok, G. L., Williams, L. R., Davidovits, P., and Worsnop, D. R.: Soot particle aerosol mass spectrometer: development, validation, and initial application, Aerosol Sci. Technol., 46, 804–817, https://doi.org/10.1080/02786826.2012.663948, 2012.
Ou, Y., Nie, D. Y., Chen, H., Ye, Z. L., and Ge, X. L.: Characterization of products from the aqueous-phase photochemical oxidation of benzene-diols, Atmosphere, 12, 534, https://doi.org/10.3390/atmos12050534, 2021.
Petters, S. S., Cui, T. Q., Zhang, Z. F., Gold, A., McNeill, V. F., Surratt, J. D., and Turpin, B. J.: Organosulfates from dark aqueous reactions of isoprene-derived epoxydiols under cloud and fog conditions: kinetics, mechanism, and effect of reaction environment on regioselectivity of sulfate addition, ACS Earth Space Chem., 5, 474–486, https://doi.org/10.1021/acsearthspacechem.0c00293, 2021.
Powelson, M. H., Espelien, B. M., Hawkins, L. N., Galloway, M. M., and De Haan, D. O.: Brown Carbon Formation by Aqueous-Phase Carbonyl Compound Reactions with Amines and Ammonium Sulfate, Environ. Sci. Technol., 48, 985–993, https://doi.org/10.1021/es4038325, 2014.
Qi, L., Chen, M., Stefenelli, G., Pospisilova, V., Tong, Y., Bertrand, A., Hueglin, C., Ge, X., Baltensperger, U., Prévôt, A. S. H., and Slowik, J. G.: Organic aerosol source apportionment in Zurich using an extractive electrospray ionization time-of-flight mass spectrometer (EESI-TOF-MS) – Part 2: Biomass burning influences in winter, Atmos. Chem. Phys., 19, 8037–8062, https://doi.org/10.5194/acp-19-8037-2019, 2019.
Qin, J. J., Zhang, L. M., Zhou, X. M., Duan, J. C., Mu, S. T., Xiao, K., Hu, J. N., and Tan, J. H.: Fluorescence fingerprinting properties for exploring water-soluble organic compounds in PM2.5 in an industrial city of northwest China, Atmos. Environ., 184, 203–211, https://doi.org/10.1016/j.atmosenv.2018.04.049, 2018.
Qin, Y. M., Tan, H. B., Li, Y. J., Schurman, M. I., Li, F., Canonaco, F., Prévôt, A. S. H., and Chan, C. K.: Impacts of traffic emissions on atmospheric particulate nitrate and organics at a downwind site on the periphery of Guangzhou, China, Atmos. Chem. Phys., 17, 10245–10258, https://doi.org/10.5194/acp-17-10245-2017, 2017.
Qiu, Y. M., Xie, Q. R., Wang, J. F., Xu, W. Q., Li, L. J., Wang, Q. Q., Zhao, J., Chen, Y. T., Chen, Y. F., Wu, Y. Z., Du, W., Zhou, W., Lee, J., Zhao, C. F., Ge, X. L., Fu, P. Q., Wang, Z., Worsnop, D. R., and Sun, Y. L.: Vertical characterization and source apportionment of water-soluble organic aerosol with high-resolution aerosol mass spectrometry in Beijing, China, ACS Earth Space Chem., 3, 273–284, https://doi.org/10.1021/acsearthspacechem.8b00155, 2019.
Saleh, R.: From Measurements to Models: Toward Accurate Representation of Brown Carbon in Climate Calculations, Curr. Pollut. Rep., 6, 90–104, https://doi.org/10.1007/s40726-020-00139-3, 2020.
Shapiro, E. L., Szprengiel, J., Sareen, N., Jen, C. N., Giordano, M. R., and McNeill, V. F.: Light-absorbing secondary organic material formed by glyoxal in aqueous aerosol mimics, Atmos. Chem. Phys., 9, 2289–2300, https://doi.org/10.5194/acp-9-2289-2009, 2009.
Song, J. Z., Li, M. J., Fan, X. J., Zou, C. L., Zhu, M. B., Jiang, B., Yu, Z. Q., Jia, W. L., Liao, Y. H., and Peng, P. A.: Molecular Characterization of water- and methanol-soluble organic compounds emitted from residential coal combustion using ultrahigh-resolution electrospray ionization fourier transform ion cyclotron resonance mass spectrometry, Environ. Sci. Technol., 53, 13607–13617, https://doi.org/10.1021/acs.est.9b04331, 2019.
Stubbins, A., Lapierre, J. F., Berggren, M., Prairie, Y. T., Dittmar, T., and del Giorgio, P. A.: What's in an EEM? Molecular Signatures Associated with Dissolved Organic Fluorescence in Boreal Canada, Environ. Sci. Technol., 48, 10598–10606, https://doi.org/10.1021/es502086e, 2014.
Sueper, D.: ToF-AMS Software downloads, Univeristy of Colorado [software], https://cires1.colorado.edu/jimenez-group/ToFAMSResources/ToFSoftware/index.html (last access: 30 June 2025), 2023.
Sun, Y., Du, W., Fu, P., Wang, Q., Li, J., Ge, X., Zhang, Q., Zhu, C., Ren, L., Xu, W., Zhao, J., Han, T., Worsnop, D. R., and Wang, Z.: Primary and secondary aerosols in Beijing in winter: sources, variations and processes, Atmos. Chem. Phys., 16, 8309–8329, https://doi.org/10.5194/acp-16-8309-2016, 2016.
Tang, J., Li, J., Su, T., Han, Y., Mo, Y., Jiang, H., Cui, M., Jiang, B., Chen, Y., Tang, J., Song, J., Peng, P., and Zhang, G.: Molecular compositions and optical properties of dissolved brown carbon in biomass burning, coal combustion, and vehicle emission aerosols illuminated by excitation–emission matrix spectroscopy and Fourier transform ion cyclotron resonance mass spectrometry analysis, Atmos. Chem. Phys., 20, 2513–2532, https://doi.org/10.5194/acp-20-2513-2020, 2020.
Tang, J., Li, J., Zhao, S. Z., Zhong, G. C., Mo, Y. Z., Jiang, H. X., Jiang, B., Chen, Y. J., Tang, J. H., Tian, C. G., Zong, Z., Hussain S., J., Song, J. Z., and Zhang, G.: Molecular signatures and formation mechanisms of water-soluble chromophores in particulate matter from Karachi in Pakistan, Sci. Total Environ., 914, 169890, https://doi.org/10.1016/j.scitotenv.2024.169890, 2024.
Tsugawa, H., Cajka, T., Kind, T., Ma, Y., Higgins, B., Ikeda, K., Kanazawa, M., VanderGheynst, J., Fiehn, O., and Arita, M.: MS-DIAL: data-independent MS/MS deconvolution for comprehensive metabolome analysis, Nat. Methods, 12, 523–526, https://doi.org/10.1038/nmeth.3393, 2015.
Tsugawa, H., Ikeda, K., Takahashi, M., Satoh, A., Mori, Y., Uchino, H., Okahashi, N., Yamada, Y., Tada, I., Bonini, P., Higashi, Y., Okazaki, Y., Zhou, Z., Zhu, Z. J., Koelmel, J., Cajka, T., Fiehn, O., Saito, K., Arita, M., and Arita, M.: A lipidome atlas in MS-DIAL 4, Nat. Biotechnol., 38, 1159–1163, https://doi.org/10.1038/s41587-020-0531-2, 2020 (code available at: https://systemsomicslab.github.io/compms/msdial/main.html, last access: 30 June 2025).
Ulbrich, I. M., Canagaratna, M. R., Zhang, Q., Worsnop, D. R., and Jimenez, J. L.: Interpretation of organic components from Positive Matrix Factorization of aerosol mass spectrometric data, Atmos. Chem. Phys., 9, 2891–2918, https://doi.org/10.5194/acp-9-2891-2009, 2009.
Updyke, K. M., Nguyen, T. B., and Nizkorodov, S. A.: Formation of brown carbon via reactions of ammonia with secondary organic aerosols from biogenic and anthropogenic precursors, Atmos. Environ., 63, 22–31, https://doi.org/10.1016/j.atmosenv.2012.09.012, 2012.
Vasilakopoulou, C. N., Florou, K., Kaltsonoudis, C., Stavroulas, I., Mihalopoulos, N., and Pandis, S. N.: Development and evaluation of an improved offline aerosol mass spectrometry technique, Atmos. Meas. Tech., 16, 2837–2850, https://doi.org/10.5194/amt-16-2837-2023, 2023.
Veld, M., Khare, P., Hao, Y. F., Reche, C., Pérez, N., Alastuey, A., Yus-Díez, J., Marchand, N., Prevot, A. S. H., Querol, X., and Daellenbach, K. R.: Characterizing the sources of ambient PM10 organic aerosol in urban and rural Catalonia, Spain, Sci. Total Environ., 902, 166440, https://doi.org/10.1016/j.scitotenv.2023.166440, 2023.
Wang, D., Shen, Z., Zhang, Q., Lei, Y., Zhang, T., Huang, S., Sun, J., Xu, H., and Cao, J.: Winter brown carbon over six of China's megacities: light absorption, molecular characterization, and improved source apportionment revealed by multilayer perceptron neural network, Atmos. Chem. Phys., 22, 14893–14904, https://doi.org/10.5194/acp-22-14893-2022, 2022a.
Wang, J., Ge, X., Chen, Y., Shen, Y., Zhang, Q., Sun, Y., Xu, J., Ge, S., Yu, H., and Chen, M.: Highly time-resolved urban aerosol characteristics during springtime in Yangtze River Delta, China: insights from soot particle aerosol mass spectrometry, Atmos. Chem. Phys., 16, 9109–9127, https://doi.org/10.5194/acp-16-9109-2016, 2016.
Wang, J. F., Ye, J. H., Zhang, Q., Zhao, J., Wu, Y. Z., Li, J. Y., Liu, D. T., Li, W. J., Zhang, Y. G., Wu, C., Xie, C. H., Qin, Y. M., Lei, Y. L., Huang, X. P., Guo, J. P., Liu, P. F., Fu, P. Q., Li, Y. J., Lee, H. C., Choi, H., Zhang, J., Liao, H., Chen, M. D., Sun, Y. L., Ge, X. L., Martin, S. T., and Jacob, D. J.: Aqueous production of secondary organic aerosol from fossil-fuel emissions in winter Beijing haze, P. Natl. Acad. Sci. USA, 118, e2022179118, https://doi.org/10.1073/pnas.2022179118, 2021.
Wang, J. F., Ge, X. L., Sonya, C., Ye, J. H., Lei, Y. L., Chen, M. D., and Zhang, Q.: Influence of regional emission controls on the chemical composition, sources, and size distributions of submicron aerosols: Insights from the 2014 Nanjing Youth Olympic Games, Sci. Total Environ., 807, 150869, https://doi.org/10.1016/j.scitotenv.2021.150869, 2022b.
Wang, K., Zhang, Y., Huang, R. J., Cao, J. J., and Hoffmann, T.: UHPLC-Orbitrap mass spectrometric characterization of organic aerosol from a central European city (Mainz, Germany) and a Chinese megacity (Beijing), Atmos. Environ., 189, 22–29, https://doi.org/10.1016/j.atmosenv.2018.06.036, 2018a.
Wang, L., Wang, X., Gu, R., Wang, H., Yao, L., Wen, L., Zhu, F., Wang, W., Xue, L., Yang, L., Lu, K., Chen, J., Wang, T., Zhang, Y., and Wang, W.: Observations of fine particulate nitrated phenols in four sites in northern China: concentrations, source apportionment, and secondary formation, Atmos. Chem. Phys., 18, 4349–4359, https://doi.org/10.5194/acp-18-4349-2018, 2018b.
Wang, X. K., Hayeck, N., Brüggemann, M., Abis, L., Riva, M., Lu, Y. Q., Wang, B. W., Chen, J. M., George, C., and Wang, L.: Chemical Characteristics and Brown Carbon Chromophores of Atmospheric Organic Aerosols Over the Yangtze River Channel: A Cruise Campaign, J. Geophys. Res.-Atmos., 125, e2020JD032497, https://doi.org/10.1029/2020jd032497, 2020.
Wang, Y., Huang, R. J., Zhong, H. B., Wang, T., Yang, L., Yuan, W., Xu, W., and An, Z. S.: Predictions of the Optical Properties of Brown Carbon Aerosol by Machine Learning with Typical Chromophores, Environ. Sci. Technol., 58, 20588–20597, https://doi.org/10.1021/acs.est.4c09031, 2024.
Wang, Y. J., Hu, M., Lin, P., Guo, Q. F., Wu, Z. J., Li, M. G., Zeng, L. M., Song, Y., Zeng, L. W., Wu, Y. S., Guo, S., Huang, X. F., and He, L. Y.: Molecular characterization of nitrogen-containing organic compounds in humic-like substances emitted from straw residue burning, Environ. Sci. Technol., 51, 5951–5961, https://doi.org/10.1021/acs.est.7b00248, 2017.
Wang, Y. Q.: An open source software suite for multi-dimensional meteorological data computation and visualisation, Journal of Open Research Software, 7, 21, https://doi.org/10.5334/jors.267, 2019.
Wen, H., Zhou, Y., Xu, X. Y., Wang, T. S., Chen, Q. L., Chen, Q. C., Li, W. J., Wang, Z., Huang, Z. W., Zhou, T., Shi, J. S., Bi, J. R., Ji, M. X., and Wang, X.: Water-soluble brown carbon in atmospheric aerosols along the transport pathway of Asian dust: Optical properties, chemical compositions, and potential sources, Sci. Total Environ., 789, 147971, https://doi.org/10.1016/j.scitotenv.2021.147971, 2021.
Wu, G. M., Ram, K., Fu, P. Q., Wang, W., Zhang, Y. L., Liu, X. Y., Stone, E. A., Pradhan, B. B., Dangol, P. M., Panday, A. K., Wan, X., Bai, Z. P., Kang, S. C., Zhang, Q. G., and Cong, Z. Y.: Water-soluble brown carbon in atmospheric aerosols from Godavari (Nepal), a regional representative of south Asia, Environ. Sci. Technol., 53, 3471–3479, https://doi.org/10.1021/acs.est.9b00596, 2019a.
Wu, Y. Z., Ge, X. L., Wang, J. F., Shen, Y. F., Ye, Z. L., Ge, S., Wu, Y., Yu, H., and Chen, M. D.: Responses of secondary aerosols to relative humidity and photochemical activities in an industrialized environment during late winter, Atmos. Environ., 193, 66–78, https://doi.org/10.1016/j.atmosenv.2018.09.008, 2018.
Wu, Y. Z., Liu, D. T., Wang, J. F., Shen, F. Z., Chen, Y. F., Cui, S. J., Ge, S., Wu, Y., Chen, M. D., and Ge, X. L.: Characterization of size-resolved hygroscopicity of black carbon-containing particle in urban environment, Environ. Sci. Technol., 53, 14212–14221, https://doi.org/10.1021/acs.est.9b05546, 2019b.
Xian, J. K., Cui, S. J., Chen, X. Z., Wang, J. Y., Xiong, Y. F., Gu, C. J., Wang, Y., Zhang, Y. J., Li, H. W., Wang, J. F., and Ge, X. L.: Online chemical characterization of atmospheric fine secondary aerosols and organic nitrates in summer Nanjing, China, Atmos. Res., 290, 106783, https://doi.org/10.1016/j.atmosres.2023.106783, 2023.
Xie, M. J., Mladenov, N., Williams, M. W., Neff, J. C., Wasswa, J., and Hannigan, M. P.: Water soluble organic aerosols in the Colorado Rocky Mountains, USA: composition, sources and optical properties, Sci. Rep., 6, 39339, https://doi.org/10.1038/srep39339, 2016.
Xie, X. C., Chen, Y. F., Nie, D. Y., Liu, Y., Liu, Y., Lei, R. Y., Zhao, X. Y., Li, H. W., and Ge, X. L.: Light-absorbing and fluorescent properties of atmospheric brown carbon: A case study in Nanjing, China, Chemosphere, 251, 126350, https://doi.org/10.1016/j.chemosphere.2020.126350, 2020.
Xing, C., Wan, Y. B., Wang, Q. Q., Kong, S. F., Huang, X. P., Ge, X. L., Xie, M. J., and Yu, H.: Molecular Characterization of Brown Carbon Chromophores in Atmospherically Relevant Samples and Their Gas-Particle Distribution and Diurnal Variation in the Atmosphere, J. Geophys. Res.-Atmos., 128, e2022JD038142, https://doi.org/10.1029/2022JD038142, 2023.
Xu, J. Z., Hettiyadura, A. P. S., Liu, Y. M., Zhang, X. H., Kang, S. C., and Laskin, A.: Atmospheric Brown Carbon on the Tibetan Plateau: Regional Differences in Chemical Composition and Light Absorption Properties, Environ. Sci. Technol. Lett., 9, 219–225, https://doi.org/10.1021/acs.estlett.2c00016, 2022.
Xu, L. L., Lin, G. X., Liu, X. H., Wu, C. L., Wu, Y. F., and Lou, S. J.: Constraining Light Absorption of Brown Carbon in China and Implications for Aerosol Direct Radiative Effect, Geophys. Res. Lett., 51, e2024GL109861, https://doi.org/10.1029/2024gl109861, 2024.
Yan, G. and Kim, G.: Speciation and sources of brown carbon in precipitation at seoul, Korea: insights from excitation–emission matrix spectroscopy and carbon isotopic analysis, Environ. Sci. Technol., 51, 11580–11587, https://doi.org/10.1021/acs.est.7b02892, 2017.
Yan, J. P., Wang, X. P., Gong, P., Wang, C. F., and Cong, Z. Y.: Review of brown carbon aerosols: recent progress and perspectives, Sci. Total Environ., 634, 1475–1485, https://doi.org/10.1016/j.scitotenv.2018.04.083, 2018.
Yassine, M. M., Harir, M., Dabek-Z., E., and Schmitt-K., P.: Structural characterization of organic aerosol using Fourier transform ion cyclotron resonance mass spectrometry: Aromaticity equivalent approach, Rapid Commun. Mass Spectrom., 28, 2445–2454, https://doi.org/10.1002/rcm.7038, 2014.
Ye, Z. L., Li, Q., Liu, J. S., Luo, S. P., Zhou, Q. F., Bi, C. L., Ma, S. S., Chen, Y. F., Chen, H., Li, L., and Ge, X. L.: Investigation of submicron aerosol characteristics in Changzhou, China: Composition, source, and comparison with co-collected PM2.5, Chemosphere, 183, 176–185, https://doi.org/10.1016/j.chemosphere.2017.05.094, 2017.
Ye, Z. L., Qu, Z. X., Ma, S. S., Luo, S. P., Chen, Y. T., Chen, H., Chen, Y. F., Zhao, Z. Z., Chen, M. D., and Ge, X. L.: A comprehensive investigation of aqueous-phase photochemical oxidation of 4-ethylphenol, Sci. Total Environ., 685, 976–985, https://doi.org/10.1016/j.scitotenv.2019.06.276, 2019.
Yu, H. R., Liang, H., Qu, F. S., Han, Z. S., Shao, S. L., Chang, H. Q., and Li, G. B.: Impact of dataset diversity on accuracy and sensitivity of parallel factor analysis model of dissolved organic matter fluorescence excitation-emission matrix, Sci. Rep., 5, 10207, https://doi.org/10.1038/srep10207, 2015.
Yu, J. T., Yan, C. Q., Liu, Y., Li, X. Y., Zhou, T., and Zheng, M.: Potassium: a tracer for biomass burning in Beijing?, Aerosol Air Qual. Res., 18, 2447–2459, https://doi.org/10.4209/aaqr.2017.11.0536, 2018.
Zhang, B. Q., Zhang, Y. J., Zhang, K. X., Zhang, Y. C., Ji, Y., Zhu, B. Z., Liang, Z. Y., Wang, H. L., and Ge, X. L.: Machine learning assesses drivers of PM2.5 air pollution trend in the Tibetan Plateau from 2015 to 2022, Sci. Total Environ., 878, 163189, https://doi.org/10.1016/j.scitotenv.2023.163189, 2023.
Zhang, Q., Jimenez, J. L., Canagaratna, M. R., Ulbrich, I. M., Ng, N. L., Worsnop, D. R., and Sun, Y. L.: Understanding atmospheric organic aerosols via factor analysis of aerosol mass spectrometry: a review, Anal. Bioanal. Chem., 401, 3045–3067, https://doi.org/10.1007/s00216-011-5355-y, 2011.
Zhang, S. Y.: Detection of scopolamine in nori fruit juice and its traditional chinese medicine compound health products by high performance liquid chromatography, World Latest Medicine Information, 18, 91–92, https://doi.org/10.19613/j.cnki.1671-3141.2018.82.066, 2018.
Zhang, X. L., Lin, Y. H., Surratt, J. D., and Weber, R. J.: Sources, composition and absorption Ångström exponent of light-absorbing organic components in aerosol extracts from the Los Angeles basin, Environ. Sci. Technol., 47, 3685–3693, https://doi.org/10.1021/es305047b, 2013.
Zhang, Y. Z., Forrister, H., Liu, J. M., Dibb, J., Anderson, B., Schwarz, J. P., Perring, A. E., Jimenez, J. L., Campuzano-Jost, P., Wang, Y. H., Nenes, A., and Weber, R. J.: Top-of-atmosphere radiative forcing affected by brown carbon in the upper troposphere, Nat. Geosci., 10, 486–489, https://doi.org/10.1038/ngeo2960, 2017.
Zhao, R., Lee, A. K. Y., Huang, L., Li, X., Yang, F., and Abbatt, J. P. D.: Photochemical processing of aqueous atmospheric brown carbon, Atmos. Chem. Phys., 15, 6087–6100, https://doi.org/10.5194/acp-15-6087-2015, 2015.
Zhong, M., Xu, J., Wang, H., Gao, L., Zhu, H., Zhai, L., Zhang, X., and Zhao, W.: Characterizing water-soluble brown carbon in fine particles in four typical cities in northwestern China during wintertime: integrating optical properties with chemical processes, Atmos. Chem. Phys., 23, 12609–12630, https://doi.org/10.5194/acp-23-12609-2023, 2023.
Zhou, Y., West, C. P., Hettiyadura, A. P. S., Niu, X., Wen, H., Cui, J., Shi, T., Pu, W., Wang, X., and Laskin, A.: Measurement report: Molecular composition, optical properties, and radiative effects of water-soluble organic carbon in snowpack samples from northern Xinjiang, China, Atmos. Chem. Phys., 21, 8531–8555, https://doi.org/10.5194/acp-21-8531-2021, 2021.
Zhu, B., Fang, J., Zhang, Y., Qiu, J., Chen, K., Zhang, K., Liang, H., Yang, H., Ding, Y., and Ge, X.: Machine learning elucidates ubiquity of enhanced ozone air pollution in China linked to the spring festival effect, Atmos. Pollut. Res., 15, 102127, https://doi.org/10.1016/j.apr.2024.102127, 2024.
Zhu, J. J., Yang, M., and Ren, Z. J.: Machine Learning in Environmental Research: Common Pitfalls and Best Practices, Environ. Sci. Technol., 57, 17671–17689, https://doi.org/10.1021/acs.est.3c00026, 2023.
Zorn, S. R., Drewnick, F., Schott, M., Hoffmann, T., and Borrmann, S.: Characterization of the South Atlantic marine boundary layer aerosol using an aerodyne aerosol mass spectrometer, Atmos. Chem. Phys., 8, 4711–4728, https://doi.org/10.5194/acp-8-4711-2008, 2008.
Zsolnay, A., Baigar, E., Jimenez, M., Steinweg, B., and Saccomandi, F.: Differentiating with fluorescence spectroscopy the sources of dissolved organic matter in soils subjected to drying, Chemosphere, 38, 45–50, https://doi.org/10.1016/S0045-6535(98)00166-0, 1999.