the Creative Commons Attribution 4.0 License.
the Creative Commons Attribution 4.0 License.
 | 18 Jul 2025
Accelerated impact of airborne glaciogenic seeding of stratiform clouds by turbulence
Meilian Chen
Xiaoqin Jing
Jiaojiao Li
Jing Yang
Xiaobo Dong
Bart Geerts
Baojun Chen
Lulin Xue
Mengyu Huang
Ping Tian
Shaofeng Hua
Several recent studies have reported complete cloud glaciation induced by airborne-based glaciogenic cloud seeding over plains. Since turbulence is an important factor controlling mixed-phase clouds, including ice initiation, snow growth, and cloud longevity, it is hypothesized that turbulence may have an impact on the seeding effect. To understand the role of turbulence in seeded clouds, idealized Weather Research and Forecasting (WRF) large eddy simulations over flat terrain were conducted for a shallow stratiform cloud in which complete glaciation was observed. The results show that the model can reasonably capture the magnitude and spatial distributions of radar echoes in seeded areas. Sensitivity tests suggest that, for this case, stronger turbulence enhanced the particle dispersion, the nucleation of silver iodide (AgI) particles, and the growth of ice crystals, which accelerated cloud glaciation, even though the condensation of droplets was also enhanced. The faster cloud glaciation intensified precipitation within a short time after seeding, while the liquid water was quickly consumed, leading to a decrease in precipitation rate in the further downwind areas. Such a transition from positive to negative seeding effect is more pronounced for seeding with a higher AgI release rate. This study provides strong evidence that turbulence plays a vital role in the physical chain of events associated with cloud seeding.
- Article
(14616 KB) - Full-text XML
- BibTeX
- EndNote


For more than half a century, clouds have been seeded operationally in many arid and semi-arid regions to enhance precipitation artificially (Rauber et al., 2019; Wang et al., 2021; Geerts and Rauber, 2022). Silver iodide (AgI), which has a similar molecular lattice structure to that of ice, is the most widely used glaciogenic seeding material as it can act as ice nucleating particles (INPs) at temperatures higher than most aerosols (DeMott, 1995). For instance, AgI particles of 1 µm can nucleate at −4 °C, and the nucleation of AgI particles of 0.1 µm requires temperatures as low as −8 °C (Lou et al., 2021). It has been demonstrated that AgI seeding can enhance precipitation under suitable conditions based on recent field experiments such as the 2017 Seeded and Natural Orographic Wintertime Clouds: The Idaho Experiment (SNOWIE; French et al., 2018; Tessendorf et al., 2019; Friedrich et al., 2020). However, in most cases, the seeding impact usually cannot be readily identified as the radar seeding signatures are often obscured by the large variability of natural precipitation (Geerts and Rauber, 2022; Zaremba et al., 2024). For a radar signature to be attributed unambiguously to seeding, the seeding-induced cloud phase relaxation time should be short compared to the characteristic time of natural dynamical and microphysical processes such as turbulent mixing, and cloud glaciation should be traceable to seeding release (French et al., 2018).
A decrease in cloud top or complete cloud clearing following aerial seeding is often regarded as a sign of efficient seeding (though it does not indicate enhancement in surface precipitation) (Mason, 1971; Wallace and Hobbs, 2006; Rogers and Yau, 1989). It is a result of complete glaciation in seeding areas, which means the liquid water consumption by ice growth is faster than liquid water formation by dynamic forcing or liquid water supply from areas outside the seeding region by turbulent mixing. This leads to the liquid water content (LWC) approaching zero. A decrease in cloud top has been reported in several studies in which seeding experiments were conducted over flat land (plains) (e.g., Yue et al., 2021; Li et al., 2022; Wang et al., 2021). However, this phenomenon has not been observed when seeding is conducted over mountains such as in SNOWIE, because the orographic lifting can continuously provide liquid water through condensation. Also, a dynamic (buoyant) response to the latent heat released by cloud glaciation can raise the cloud top (Bruintjes, 1999). Although the complete cloud glaciation is helpful in identifying seeding signatures, it indicates that there may be insufficient liquid water and thus precipitation suppression downwind of the target areas, leading to the so-called “robbing Peter to pay Paul” phenomenon (Long, 2001; DeFelice et al., 2014). Some studies argue that the positive seeding effect may extend 50–200 km downwind of the target area (e.g., Solak et al., 2003; Griffith et al., 2005; DeFelice et al., 2014; Mazzetti et al., 2023). If those results are valid, it implies a continuous liquid water supply along the seeding-impacted areas. Using X-band radar data collected in the 2012 AgI Seeding Cloud Impact Investigation (ASCII) experiment conducted over mountains in Wyoming (Geerts et al., 2013), Jing et al. (2016) found that the enhancement of precipitation by seeding can extend to 50 km (limited by the radar detection range). Their study, as well as Xue et al. (2014, 2016), highlighted that mechanisms such as hydraulic jump, lee convection, or turbulence in the lee of the target mountain are vital in the vertical dispersion of AgI particles and the generation of supercooled liquid water over the downwind mountain. Beyond-target (or “extra-area”) positive seeding impacts have also been documented in SNOWIE cases (e.g., Fig. 15 in Xue et al., 2022).
In mixed-phase clouds over flat land (plains), turbulence is regarded as the most important mechanism for producing supercooled liquid water and maintaining the mixed-phase clouds (Morrison et al., 2012; Korolev and Mazin, 2003). Without turbulence, a mixed-phase cloud can be completely glaciated in a few hours or less due to the Wegener–Bergeron–Findeisen (WBF) diffusional growth process, depending on the ice particle concentration (Rangno and Hobbs, 2001; Morrison et al., 2012). Korolev and Mazin (2003) proposed a formula (shown later in Sect. 3.4) for the minimum vertical velocity that is required to trigger the condensation of liquid water and the simultaneous growth of droplets and ice crystals. Korolev and Field (2008) point out that turbulent fluctuations may not repeatedly produce a mixed-phase cloud as harmonic oscillations but may maintain a long-lived mixed-phase environment. Hill et al. (2014) confirmed the validity of the theoretical framework of Korolev and Mazin (2003) in 3D large eddy simulations (LESs), which further demonstrated a positive correlation between turbulence and LWC. Turbulence not only affects the formation of liquid water but also influences the growth of ice and snow particles in clouds (Chu et al., 2018). Turbulence can promote net ice growth and precipitation through alternating updrafts and downdrafts, while it can suppress ice growth through cloud top entrainment of dry air (Chu et al., 2018). On the contrary, turbulence may result in pure liquid and ice clusters, which shrink the contact volume between ice and liquid water; thus, the ice growth rate declines (Tan and Storelvmo, 2016; Deng et al., 2024). Recently, based on LES, Yang et al. (2024a) showed that mixed-phase clouds can be long-lived when there is a balance among liquid water generation, ice growth, and turbulent mixing.
According to the studies mentioned above, it is evident that turbulence is helpful to continuously provide liquid water in mixed-phase clouds; thus, a scientific question is raised: is seeding in stronger turbulence helpful to avoid the “robbing Peter to pay Paul” effect and extend the positive seeding effect downwind of the target areas? If not, how does turbulence affect the seeding effect? To address these questions, this paper investigates the physical responses of cloud microphysics and precipitation to turbulence using LES. The simulations are done over flat land, in order to focus on the effect of turbulence. However, the results are relevant to mountains, because turbulence also plays a vital role in particle dispersion and ice growth in orographic clouds (Xue et al., 2014; Chu et al., 2018; Jing et al., 2016), where most operational cloud seeding is conducted. A case with complete glaciation observed in the seeding plume is selected for the simulation, and sensitivity tests by altering the turbulent strength are conducted. The results will deepen our understanding of the impacts of turbulence on the glaciogenic cloud seeding effect and further explain the competition among LWC and cloud glaciation in mixed-phase environments.
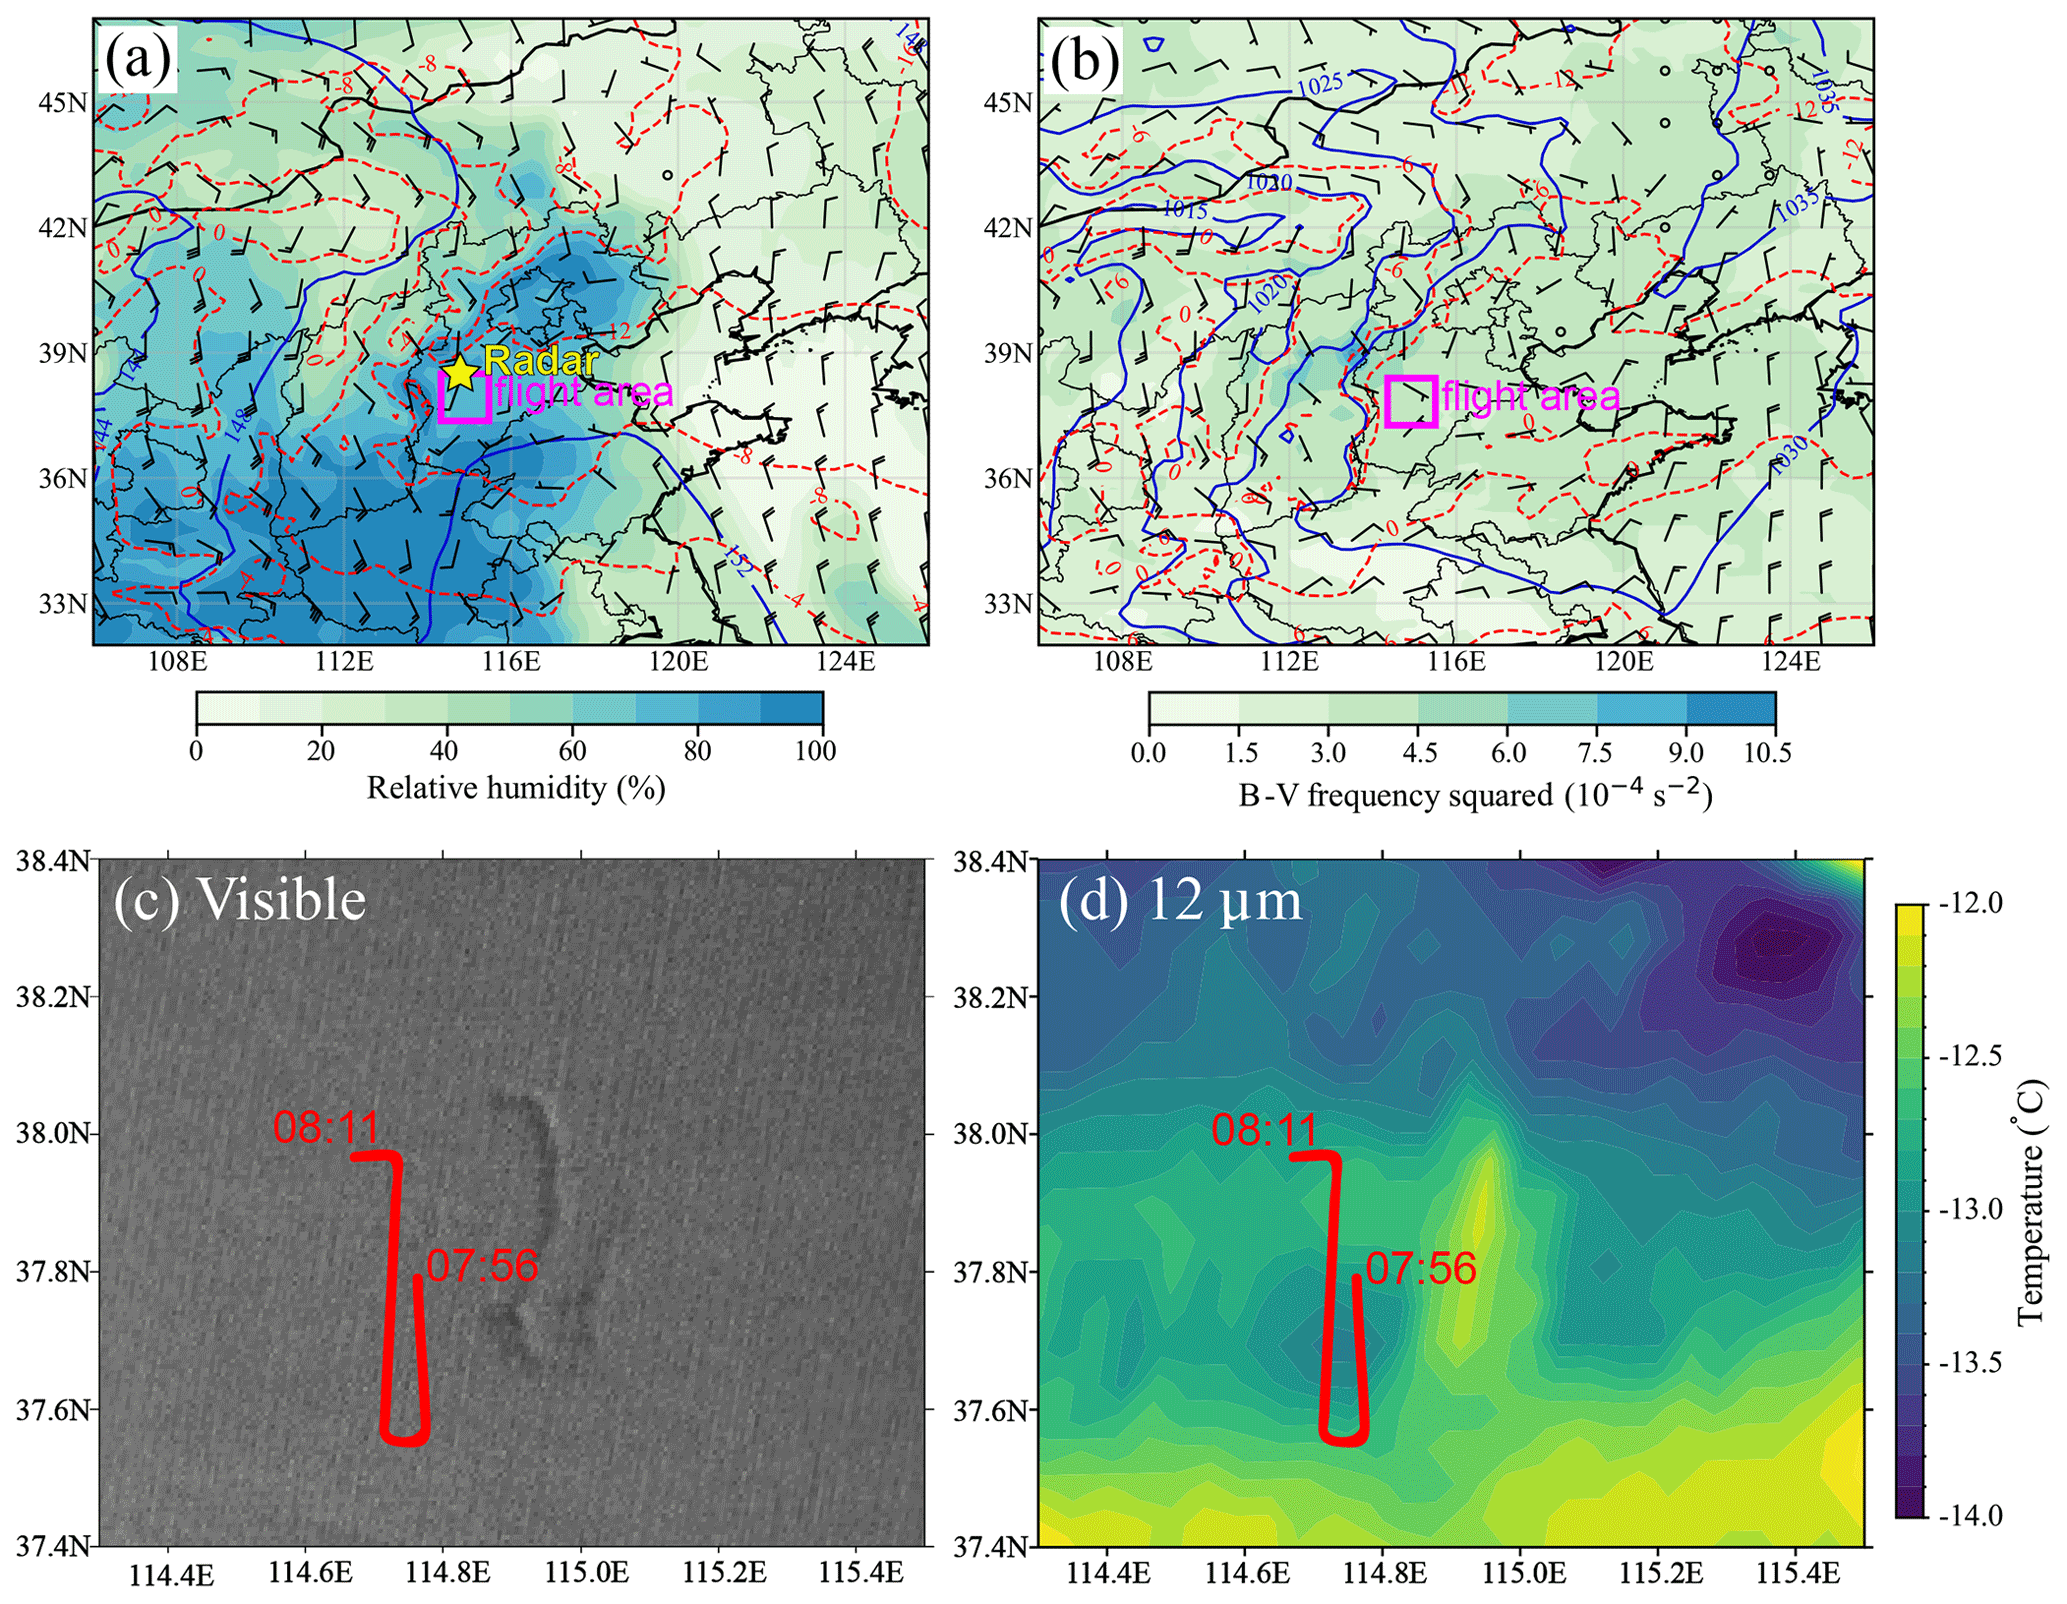
Figure 1(a) Synoptic conditions at 850 hPa in North China at 06:00 UTC on 20 January 2022 obtained from ERA5 reanalysis data, including the geopotential height (dam, blue contours), isotherms (°C, red contours), wind barbs, and relative humidity (shaded). The yellow star indicates the location of the radar, and the magenta box is the flight area. (b) Map of sea-level pressure, surface temperature, 10 m wind and B–V frequency squared at the cloud layer (1.3–1.9 km above ground level). (c) Visible image and (d) brightness temperature at 12 µm obtained from the Fengyun 4A (FY4A) satellite at 08:45 UTC. The red lines indicate the seeding trajectory.
The rest of the paper is organized as follows. Section 2 describes the case and the model setup. In Sect. 3, the model results are evaluated using radar and satellite measurements, and the impacts of turbulence on the seeding effect are analyzed. A discussion and the main findings are presented in Sects. 4 and 5, respectively.
2.1 Case description
On 20 January 2022, an airborne glaciogenic cloud seeding experiment was conducted in Hebei Province over the North China Plain. A persistent supercooled stratiform cloud was documented in the flight area before it was seeded. No surface precipitation was observed, and no radar echo was detected by the ground-based S-band radar, suggesting minor or no natural ice formation in the cloud. Weak low-level baroclinicity was present, with colder air to the north, and a weak southerly flow provided sufficient water vapor, resulting in a high ambient relative humidity (Fig. 1a). There was warm air advection in this area as suggested by the wind veering (Fig. 1a and b). A high-level (500 hPa) cloud system was controlled by dry westerly flow around a weak ridge that dominated in the flight area (not shown). A stratiform cloud deck was present at 1.4–1.9 km above the ground level (Figs. 1c and 3b). This cloud was decoupled from the surface, only ∼ 500 m deep, non-precipitating (Fig. 2), and with a cloud top temperature of about −16 °C (as illustrated in Fig. 3a of the following subsection). The environment was synoptically quiescent and stably stratified as seen from the positive Brunt–Väisälä frequency at the cloud layer (Fig. 1b) and the potential temperature profile in Fig. 3a.
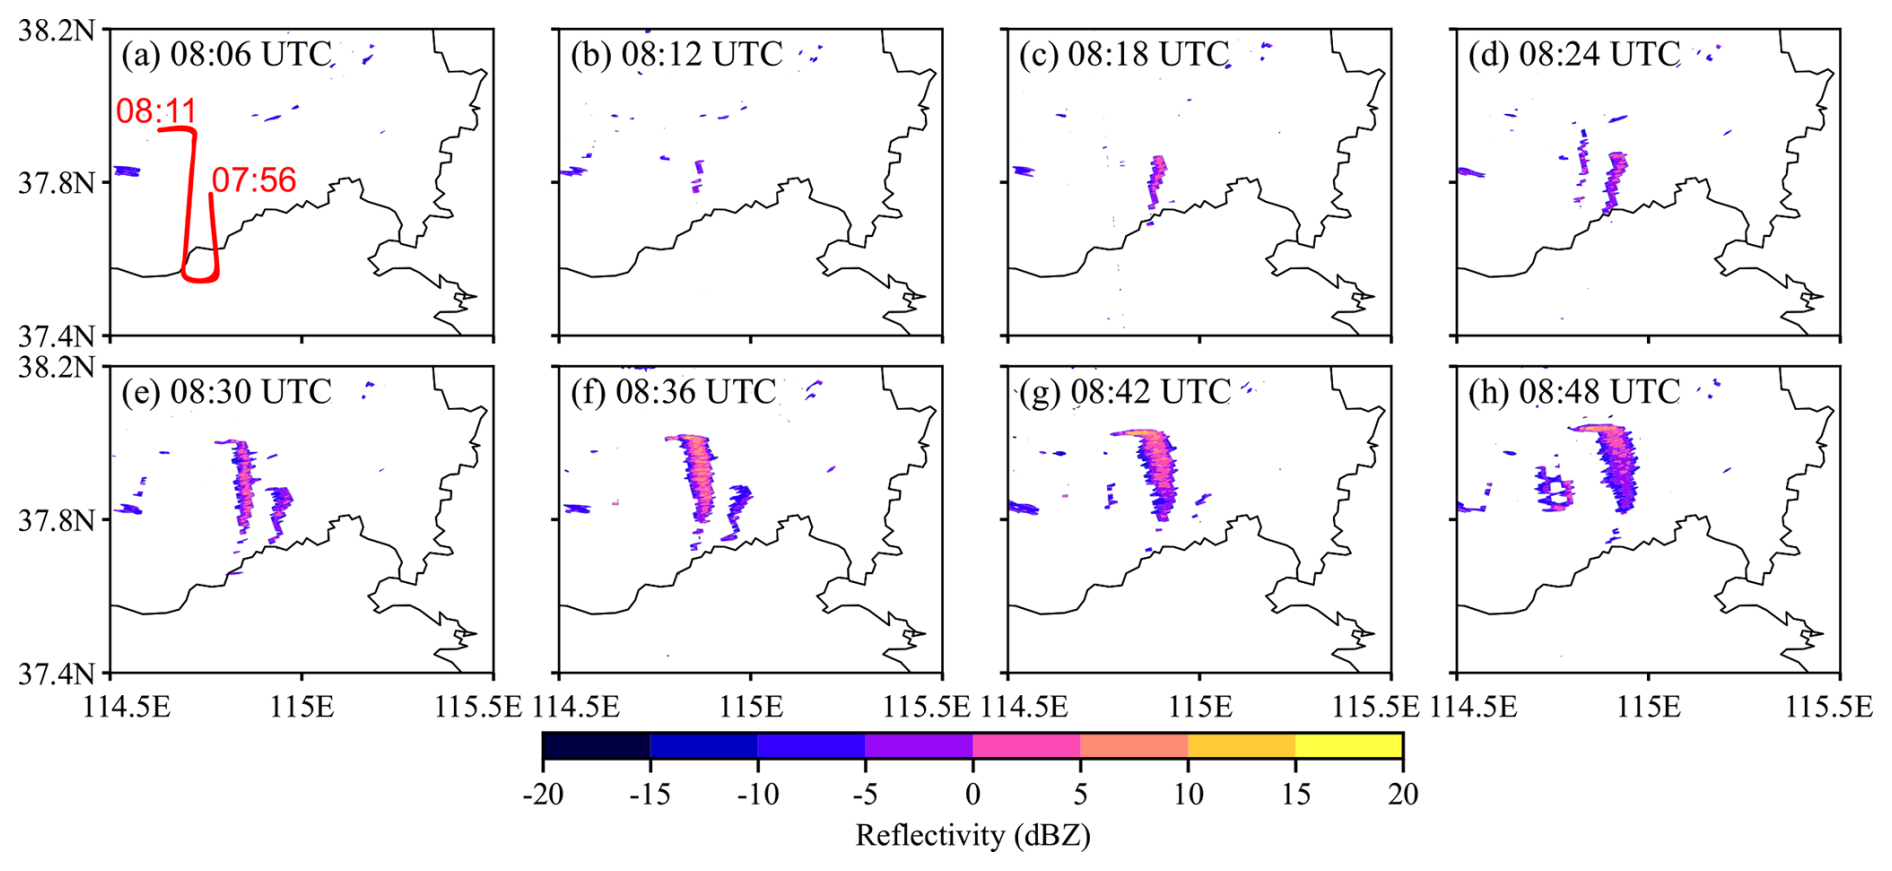
Figure 2The radar reflectivity at 1.5° elevation from 08:06 to 08:48 UTC measured by a ground-based S-band radar located north of the flight area.
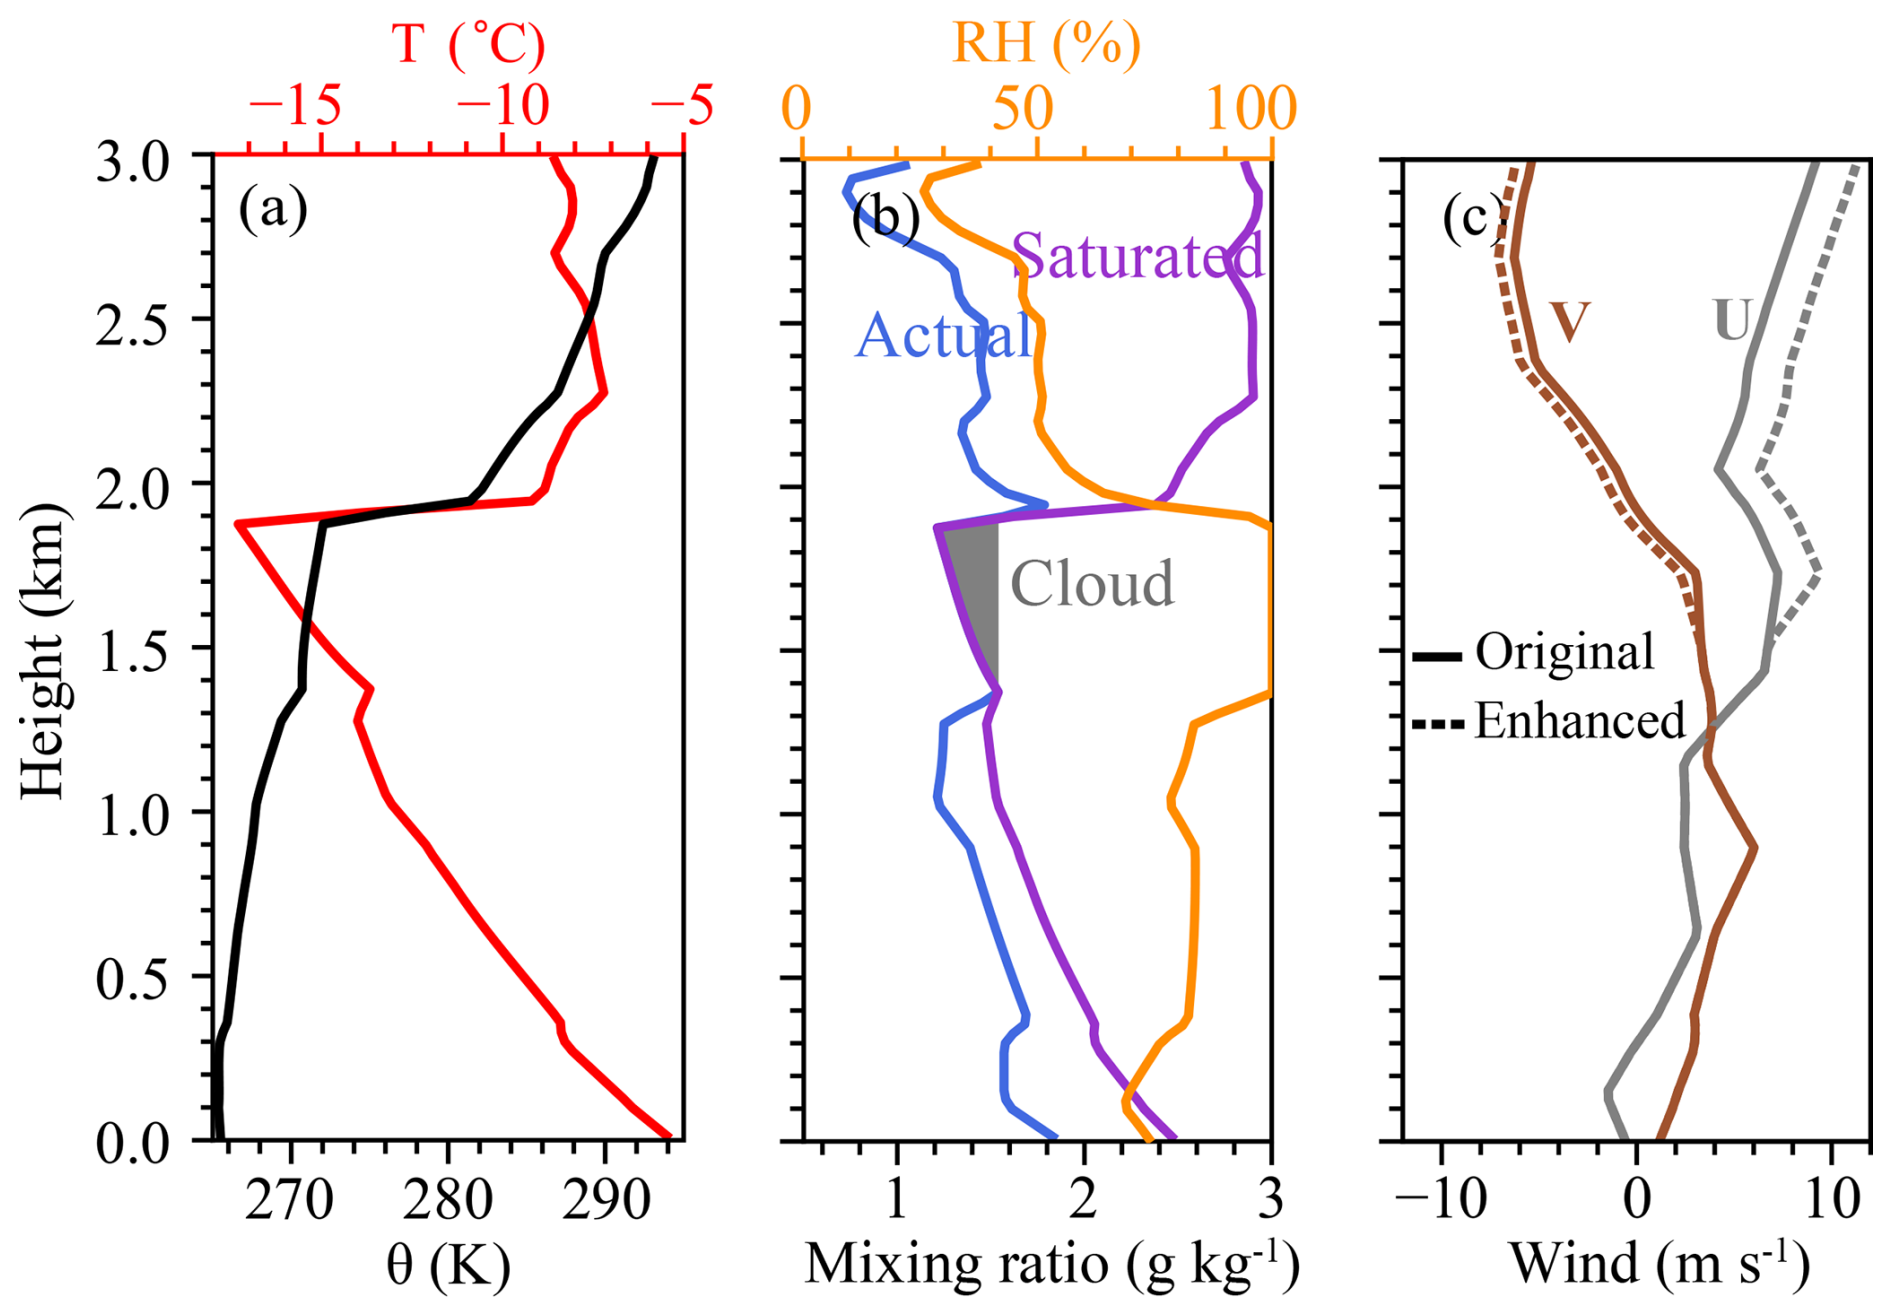
Figure 3The initial vertical profiles of (a) temperature and potential temperature; (b) actual vapor mixing ratio, saturation vapor mixing ratio relative to water, and relative humidity; and (c) original and enhanced U and V components. The grey shaded area in (b) indicates the initial liquid water mixing ratio.
Seeding was conducted at the cloud top at about 08:00 UTC, as shown by the red lines in Fig. 1c. The true air speed of the aircraft was approximately 100 m s−1, and the release rate of AgI particles was 1014 s−1 as estimated based on the mass burned per second using burn-in-place pyrotechnic flares. The aircraft flew one and a half north–south-oriented legs while seeding (Fig. 1c). Any seeding signatures would have to reveal the same spatial pattern in the cloud/precipitation field (advected downwind), as illustrated vividly in photographs of the first airborne cloud seeding experiments (Schaefer, 1949) and reproduced in many meteorology textbooks (e.g., Rogers and Yau, 1989; Lutgens et al., 2006). In areas unaffected by seeding, the cloud top was fairly flat as seen from the visible images detected by the FY4A satellite at 08:45 UTC (Fig. 1c), and the brightness temperature at 12 µm varied between −12 and −14 °C (Fig. 1d). Clear seeding signatures were detected downwind of the seeding line on both the visible and infrared images. The IR brightness temperature increased by about 2 °C along the advected flight track, indicating that the clouds become thinner, and the cloud tops descend due to the consumption of supercooled liquid water by the growth of ice crystals. The more resolved visible image reveals a reduction in cloud brightness along the same track, indicating a reduction in droplet concentration and an enhancement in reflected solar radiation along the northeast flank of the cloud top depression (at 08:00 UTC the sun is in the southwest in the flight area). The displacement of the satellite signature relative to the flight track is consistent with the wind speed and direction at the cloud top level.
The seeding signatures were also detected by the ground-based S-band radar (Fig. 2), which is located north of the flight area (Fig. 1a). The radar has a range resolution of 250 m and operates in a volume-scanning mode with nine elevation angles. The scan at 1.5° best captured the enhanced reflectivity since the cloud depth was only about 500 m. As seen in Fig. 2a, the radar echo appeared about 10 min after seeding. This is consistent with radar data collected during airborne AgI seeding of a shallow stratus cloud deck under quiescent synoptic conditions in Switzerland (Henneberger et al., 2023) and continuously strengthened till 08:42 UTC. Since the seeding started from the eastern flight leg, the radar reflectivity exhibited sequential enhancement. The reflectivity varied between −10 and 10 dBZ, and it gradually weakened after 08:48 UTC. Although changes in radar reflectivity and brightness temperature indicate ice crystals forming, no surface precipitation from cloud seeding was observed. Furthermore, since the cloud was mostly liquid and since no surface precipitation was observed in areas unaffected by seeding either, we are not able to investigate the downwind effect of precipitation using observations. However, we may conclude that the LWC that is available for precipitation downwind of the target area has been reduced by the seeding operation. The downwind effect will be discussed using simulations in Sect. 3.
2.2 Model setup
The LES mode in the Weather Research and Forecasting model is used to conduct idealized numerical simulations for the case described above. To reproduce the entire seeding trajectory, we use a domain size of 80 km × 80 km × 3 km with periodic lateral boundaries. The surface is assumed to be flat. The model has a horizontal resolution of 100 m and 90 levels in the vertical direction. The idealized simulation with this resolution can resolve eddies larger than 600 m, and this is sufficient to reveal the influence of the seeding effect based on our analysis. The seeding trajectory is the same as that performed in the field experiment, in which the aircraft flew at a speed of 100 m s−1 along the red line in Fig. 1c and released the AgI particles near the cloud top. The AgI particles are assumed to be homogeneously mixed in a grid box as soon as they are released from the aircraft. The physics schemes used in the simulation include the fast spectral bin microphysics scheme (Khain et al., 2004), the Revised MM5 surface layer scheme (Jiménez et al., 2012), the Noah Land Surface Model (Tewari et al., 2004), and the Rapid Radiative Transfer Model (Mlawer et al., 1997). We use the default natural ice nucleation parameterizations in the fast spectral bin microphysics scheme, including deposition and condensation nucleation, contact nucleation (Meyers et al., 1992), and immersion freezing (Bigg, 1953). Cumulus and boundary layer parameterization are turned off in the LES. The cloud condensation nuclei (CCN) concentration is expressed by , where N0 refers to the CCN concentration at a supersaturation level of 1 %, Sw represents the supersaturation with respect to water (%), and k is the slope of the CCN size distribution. For the continental area of China, N0 = 4000 cm−3 and k=0.9 at the surface are assumed. This is a polluted condition. We also tried a lower CCN concentration (N0 = 2000 cm−3), but the results are similar (not shown). The reason is that in this case there was no warm rain process, and the ice particles grew through the WBF process (discussed later), which is primarily controlled by the LWC rather than the droplet concentration. For other cases in which the microphysics schemes are sensitive to the droplet concentration, the seeding effect could be different between cases with clean and polluted environments. This is out of the focus of this study, but it would be interesting to investigate the aerosol impact in the future.
The parameterization of AgI nucleation implemented in the fast spectral bin microphysics scheme was developed by Xue et al. (2013), including four nucleation modes: deposition nucleation, condensation nucleation, contact freezing, and immersion freezing. The fraction of AgI aerosols that can nucleate is confined to a specific range of temperature and supersaturation ratio, and the sum of the four nucleation mode fractions cannot exceed one. The contact and immersion freezing modes require distinct consideration of the proportion of AgI particles removed by droplets and the other non-activated fractions immersed in the droplets. Droplets collect AgI particles through Brownian diffusion, turbulent diffusion, and phoretic effects (Xue et al., 2013). The majority of the AgI particles remain in the droplets after being removed from the air, while the remainder are converted into AgI-containing hydrometeors via contact and immersion freezing. The activation process of AgI particles acting as CCN is not considered in the model.
A single real sounding is used to drive the model, i.e., the LES contains no horizontal heterogeneity initially, and large-scale synoptic conditions do not evolve during the model time. Although the simulated results using accurate 3D reanalysis data might be more consistent with observations, the idealized LES is more effective for attributing seeding effect variations to turbulence, as it explicitly excludes influences from larger-scale dynamics. The sounding was launched at the Luancheng station, which was located in the research area shown in Fig. 1 at 00:00 UTC on 20 January 2022. Thermodynamic and wind profiles are shown in Fig. 3. The atmosphere is saturated at the altitude of 1372–1893 m. Above 1893 m, a strong inversion layer was present. We implemented an initial LWC profile which increases from 0 to 0.2 g kg−1 from the cloud base to 1893 m and decreases rapidly to 0 at the cloud top (grey shaded area in Fig. 3b). With the presence of the saturated layer and the inversion layer, supercooled liquid water can persist, enabling the simulated cloud to be maintained in the model. The original wind speed is weak (solid lines in Fig. 3c), which results in a weak turbulent environment. To investigate the effect of different turbulence intensities on the seeding effect, we follow the method in Hill et al. (2014), which shows that enhancement of vertical wind shear in LES can intensify the modeled turbulence. The wind shear between 1519 and 1733 m height is enhanced five times (dashed lines in Fig. 3c); this causes a decrease in Richardson number in this layer from 16.81 to 0.67, indicating favorable conditions for turbulence development.
Figure 4a and b show the average turbulence intensities and turbulent kinetic energy (TKE) from the simulations with default and enhanced wind shear components. It is seen that the turbulence intensity and TKE increase in the first hour, and there is no clear difference between the two simulations at this stage. Therefore, a spin-up time of at least 1 h is needed. The differences in the turbulence intensity between the two simulations can be clearly seen after 1 h, with the maximum difference around 03:00 model time (MT). In this study, to ensure the sufficient development of the cloud, a 2 h spin-up period was chosen. The cross-sections of vertical velocity (Fig. 4c and d) prove that the updrafts and downdrafts are enhanced due to the stronger wind shear, and it is expected that the enhanced turbulence will influence the droplet activation, ice nucleation, and growth of hydrometeors.
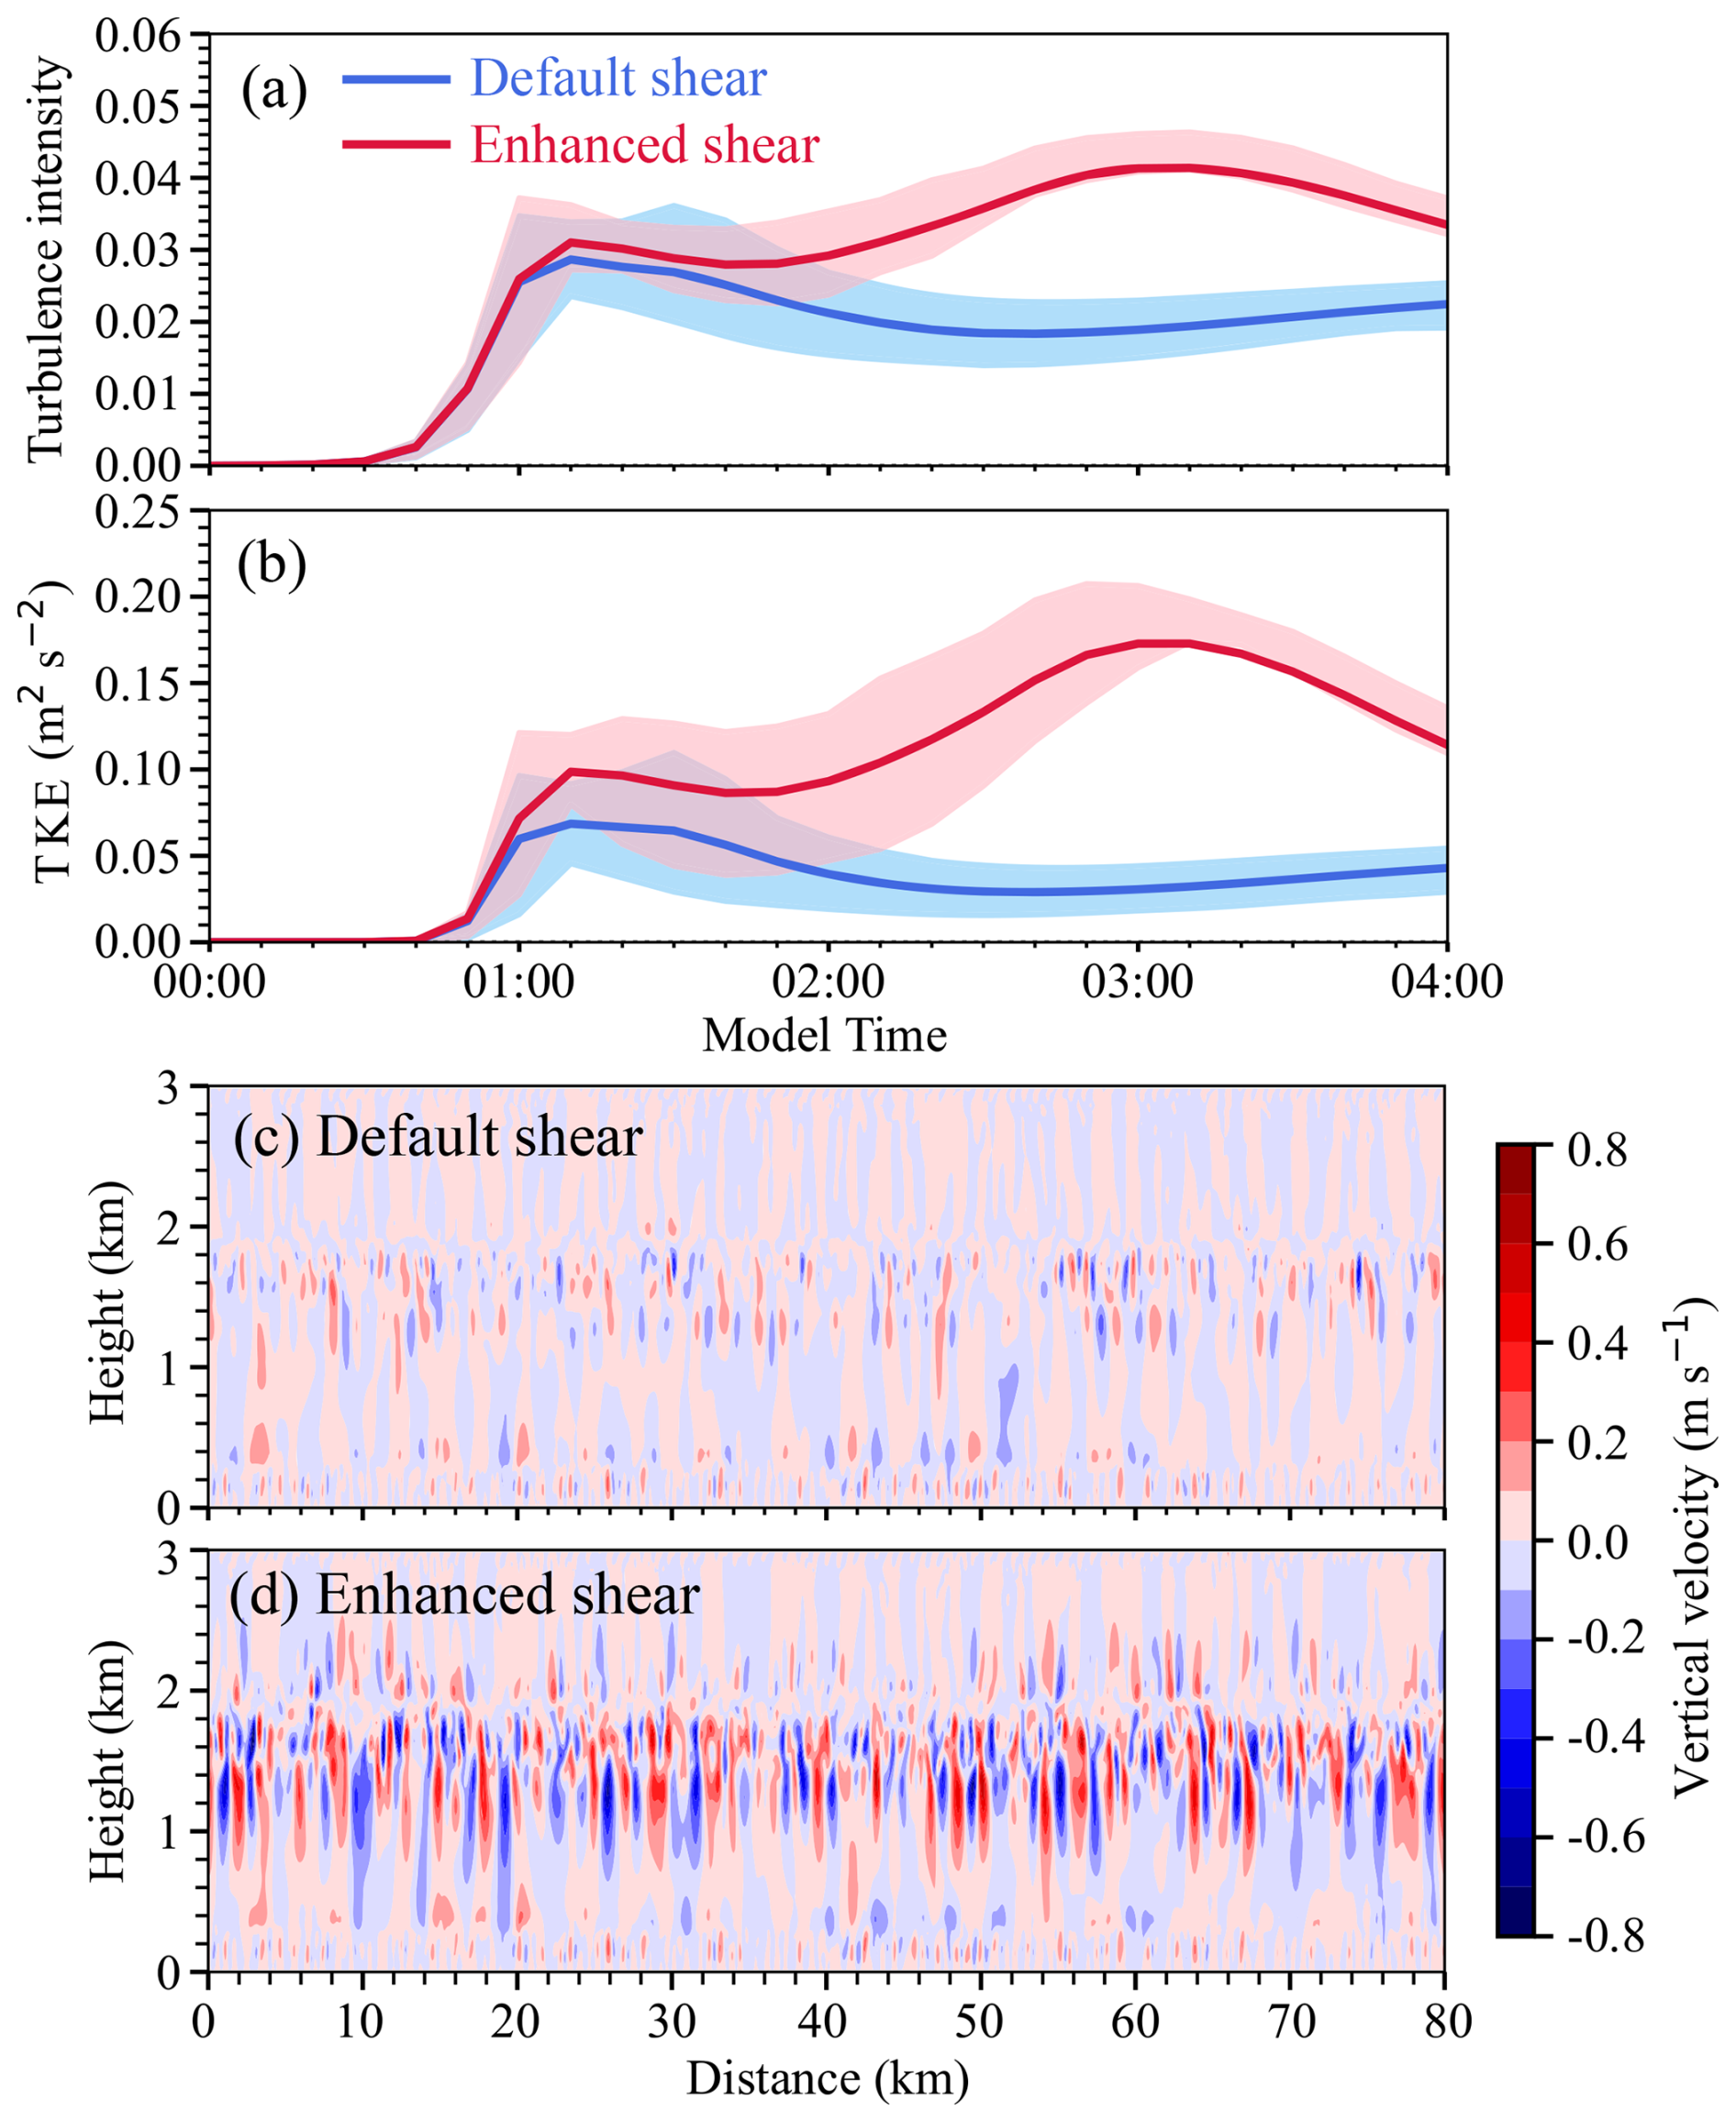
Figure 4Temporal variations of turbulence intensity (a) and TKE (b) from the simulations with default and enhanced wind shear. The upper and lower boundaries of the shaded areas respectively indicate the 75th and 25th percentiles, and the solid lines indicate the mean values. Panels (c) and (d) are the cross-sections of vertical velocity at 03:00 MT from the simulations with default and enhanced wind shear, respectively.
In addition, to test whether turbulence plays the same role for varying AgI concentrations, we enhanced the AgI release rate by 10 times (i.e., 1015 s−1) in both experiments with default and enhanced shear components. The abbreviations for different experiments are listed in Table 1. To investigate the seeding effect, we will compare the cloud microphysics and precipitation in SEED and NOSEED areas. In this study, SEED and NOSEED areas are defined as the areas affected and unaffected by the seeding plumes at each moment, respectively. Thus, the SEED and NOSEED areas moved with time along the direction of the prevailing wind. Since the observed cloud was mostly liquid before seeding, we turned off natural ice nucleation when validating the model results (control experiment). However, to better understand the differences in ice generation and growth in both SEED and NOSEED areas, we show analyses from experiments with natural ice nucleation turned on after the model validation section. The natural ice nucleation and the seeding of the experiments in Table 1 start at 02:00 MT. Since the seeding signature is unambiguous (as shown in Fig. 7 in Sect. 3.2), analysis between SEED and NOSEED areas can inherently provide the necessary contrast between seeding and no seeding simulations, making experiments with no seeding unnecessary in this study.
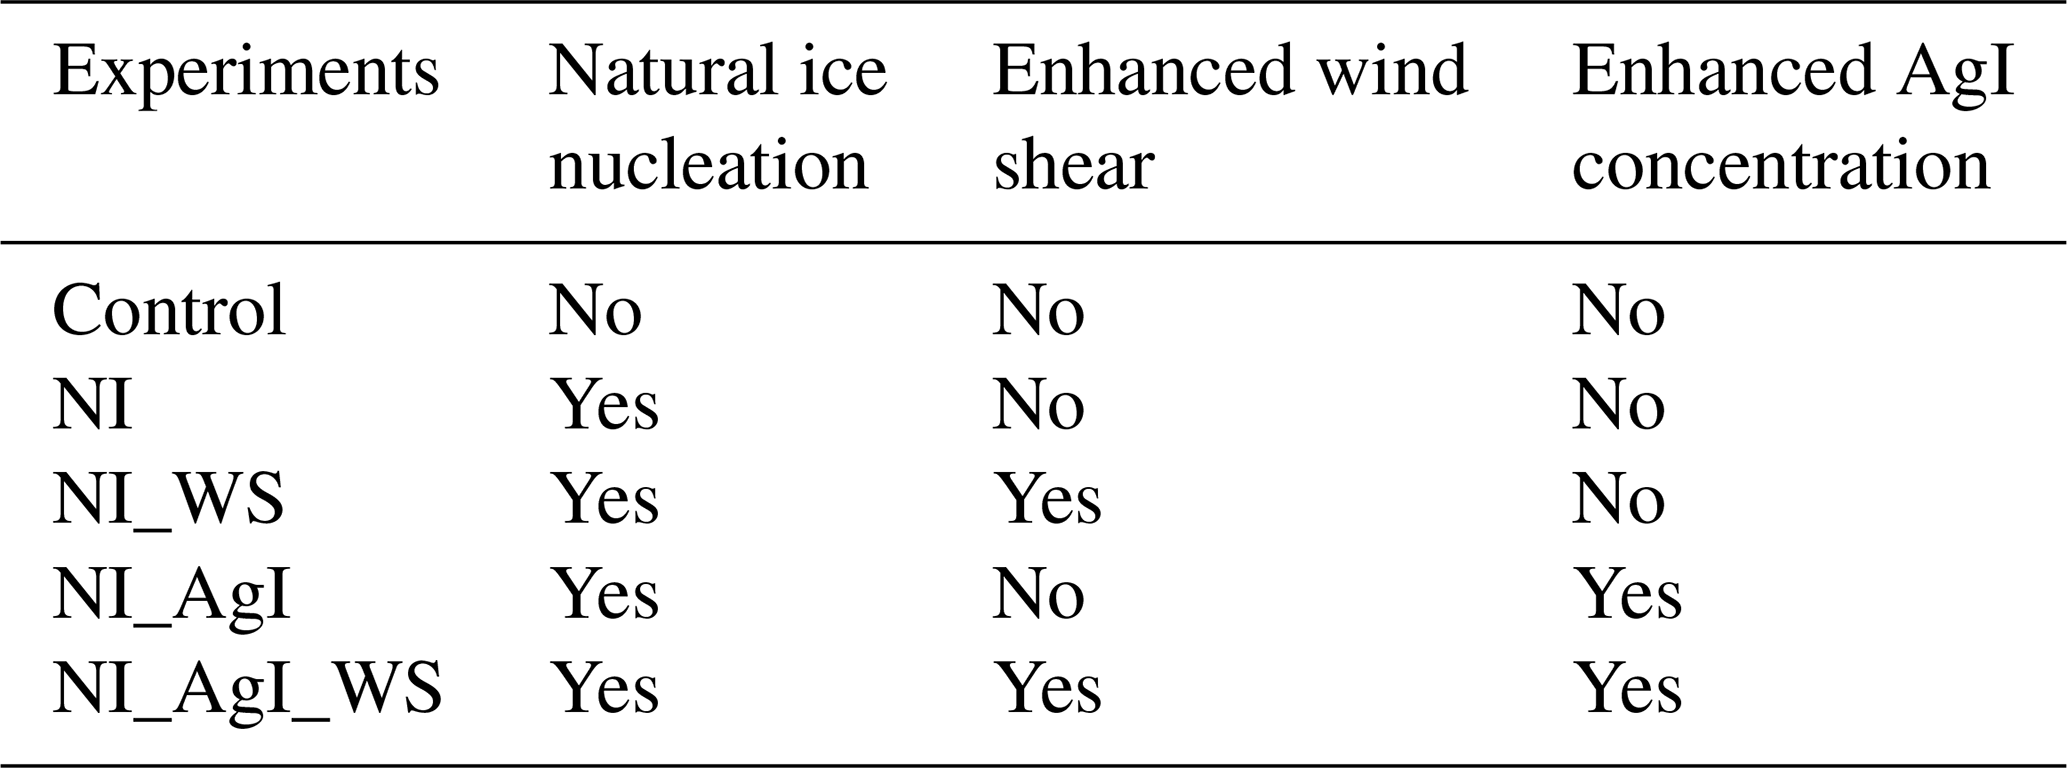
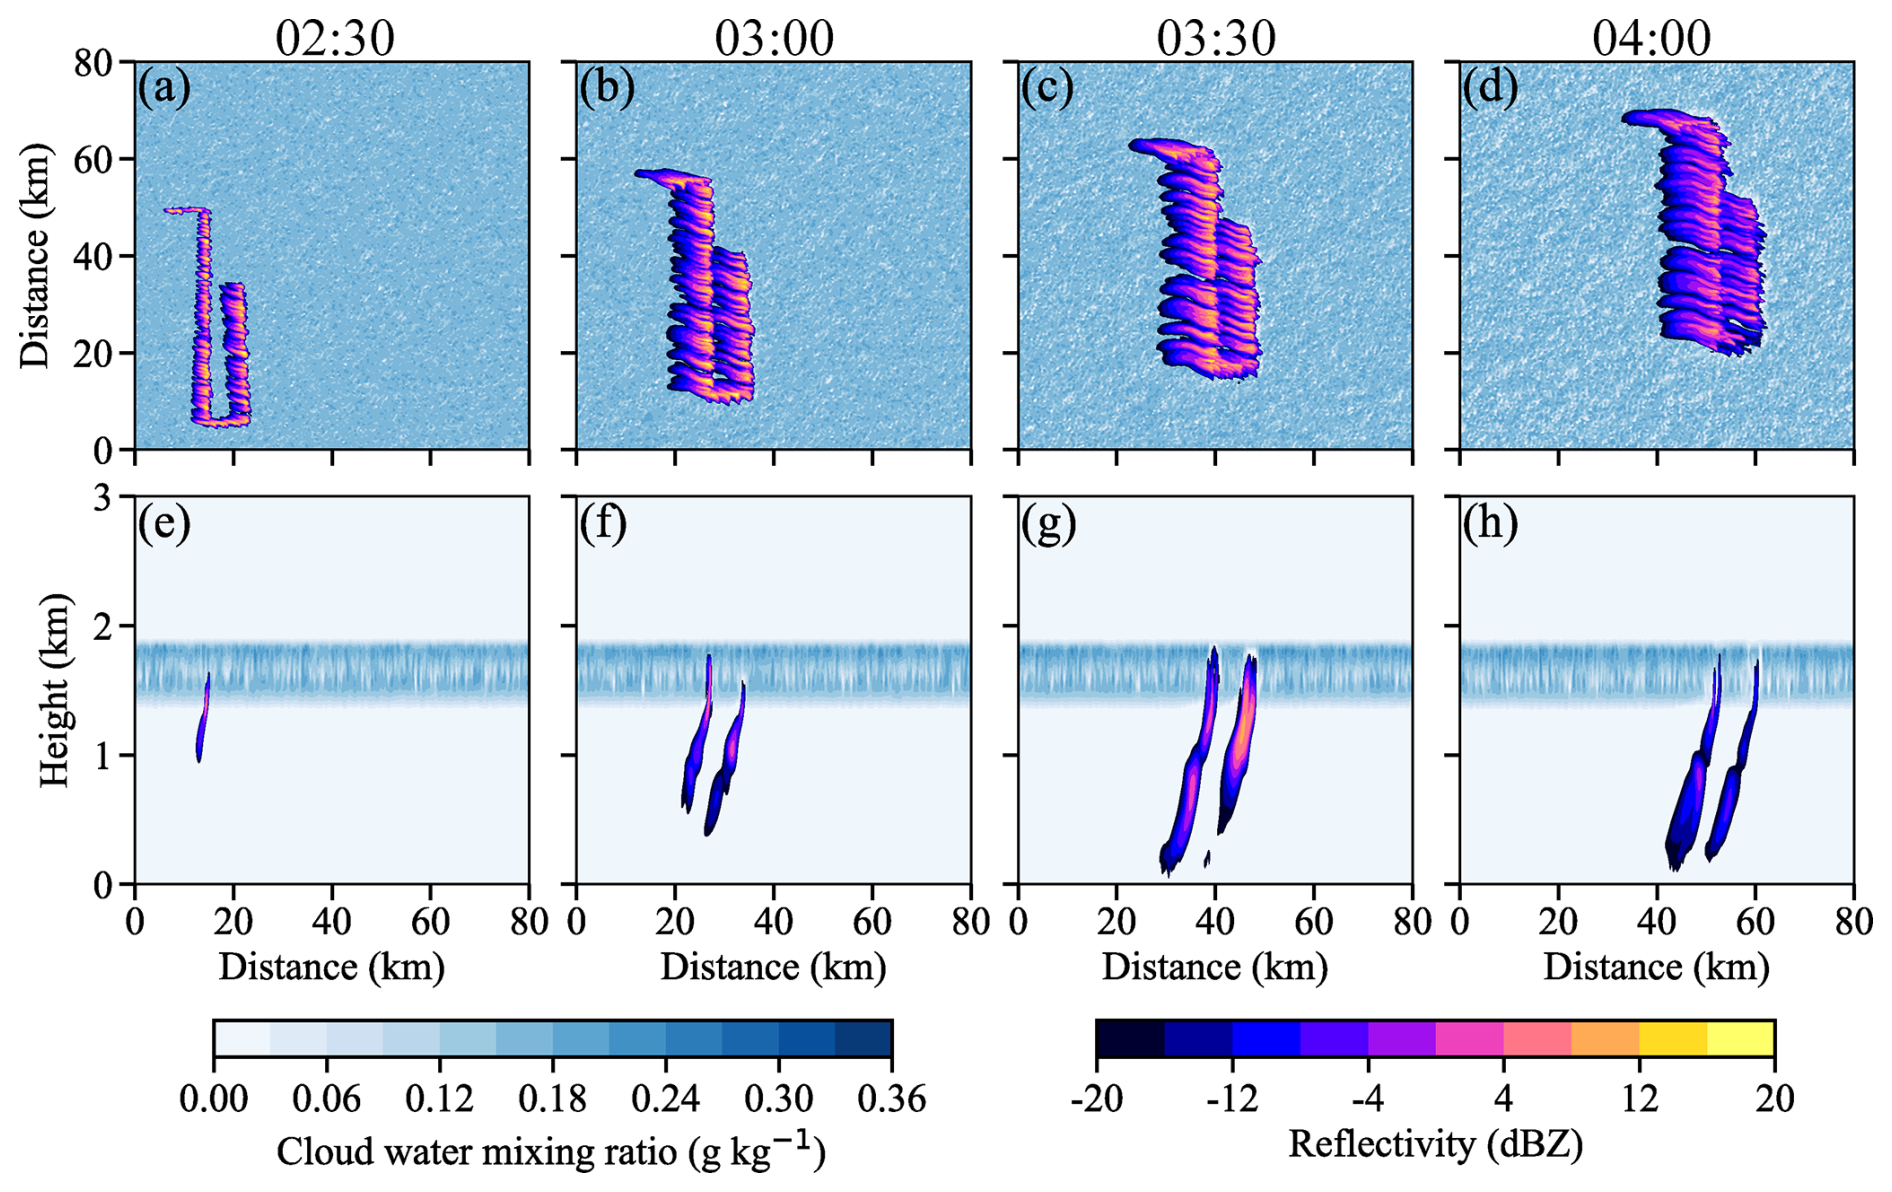
Figure 5(a–d) Maps of composite reflectivity and cloud water mixing ratio from the control experiment at seeding height from 02:30 to 04:00 MT. (e–h) Cross-sections of reflectivity and cloud water mixing ratios from the control experiment along y = 40 km from 02:30 to 04:00 MT.
3.1 Model evaluation
The modeled reflectivity from the control simulation without natural ice nucleation is shown in Fig. 5. Since we use idealized LES, it is within expectation that there are inevitably some differences between the modeled and observed results. Therefore, we do not directly compare the model with observation here, but we focus on evaluating the magnitude and temporal variation of radar reflectivity. It is seen from Fig. 5 that the spatial distribution of enhanced radar reflectivity is controlled by the seeding trajectory and moved northeasterly with time. With higher resolution, the model can produce finer structures of reflectivity distribution than the observation. The magnitude of modeled reflectivity varies between −12 and 12 dBZ, generally consistent with the observation shown in Fig. 2, but it seems that the horizontal dispersion of the seeding plume was weaker in the modeled than the observed data. Consistent with observations, the seeding signatures can be seen in the model approximately 10 min after seeding (not shown). The seeding signatures kept strengthening for about 1.5 h before turning weaker, which is slightly longer than observed (Fig. 2), suggesting that in the actual cloud the cloud glaciation is faster than in the model. This is consistent with the findings of Omanovic et al. (2024), who also reported a slower WBF process in LES than in the observation.
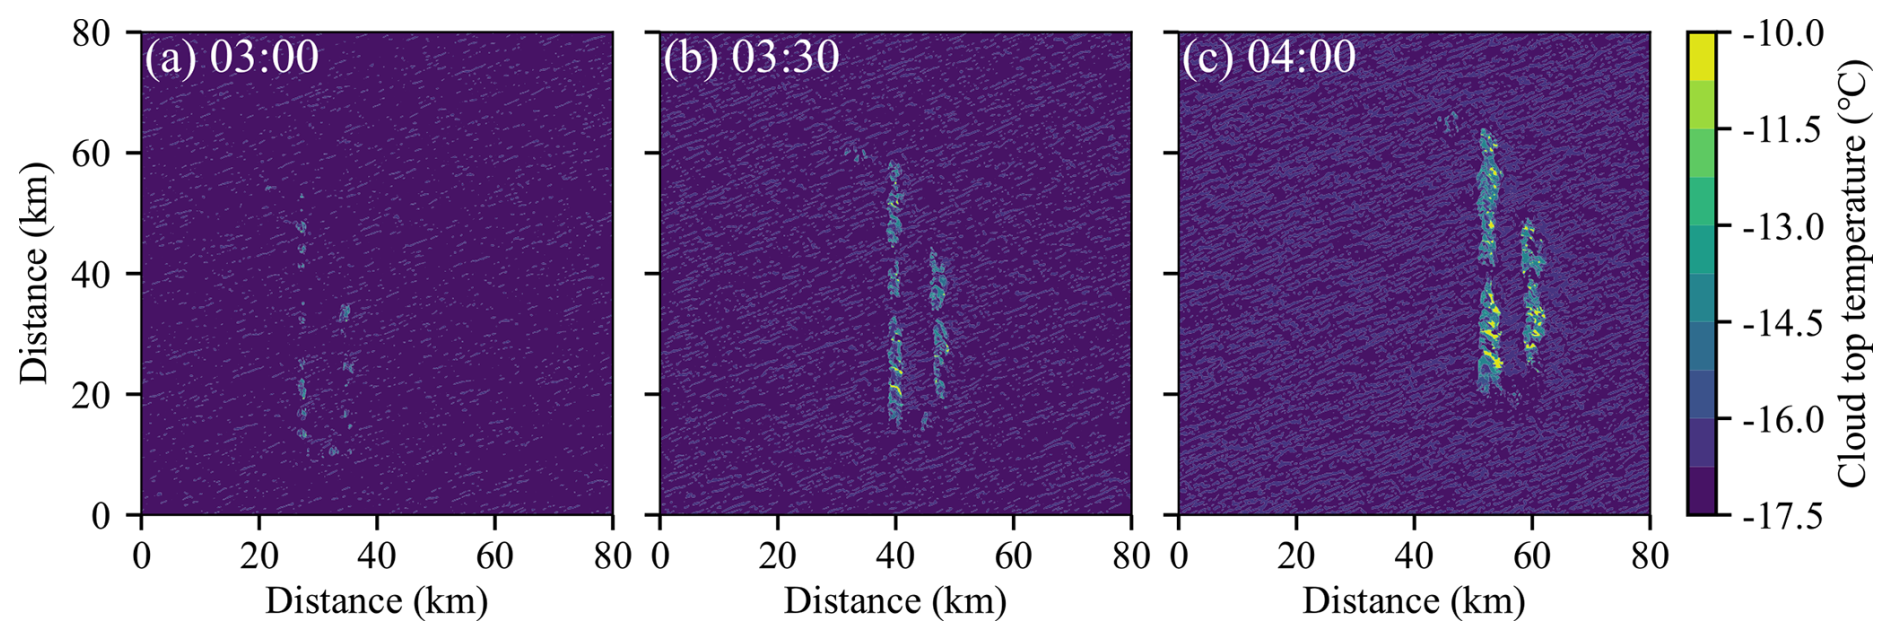
Due to the consumption of the supercooled liquid water, the cloud top height decreased (identified using a threshold of total water content greater than 0.001 g kg−1), and in most of the SEED areas the cloud top temperature increased by about 2 °C after 2 h (Fig. 6), which is generally consistent with the observations. In the NOSEED area, the cloud top persisted at about 1.9 km (Fig. 5e–h). In the observation, cloud thinning was clearly seen almost in the entire seeding plume 15 min after seeding, while in the model the increase in cloud top temperature was seen only in a small fraction of the SEED area within 1 h after the seeding was performed. This difference again suggests that cloud glaciation was faster in the actual cloud than in the model.
Such a difference could be due to multiple reasons. From the perspective of dynamics, large-scale forcing is not considered in the model, and we use a single sounding measurement to drive the simulation, while in the real cloud the wind field and cloud top stratification may change with time. From the perspective of microphysics, the study lacks measurements of CCN concentration, so the droplet size and concentration may have uncertainties. In addition, the ice growth rate in the model may be underestimated as the crystal shape is not sufficiently considered in the model. A recent study by Yang et al. (2024b) showed that the ice growth rate would be higher at −15 °C if assuming a plate-like shape rather than a spherical particle. Regardless of the uncertainties, the model can reasonably reproduce the magnitude and spatial distribution of radar reflectivity, as well as the increase in cloud top temperature, providing confidence for us to investigate the impacts of turbulence on the glaciogenic seeding effect using the model simulations.
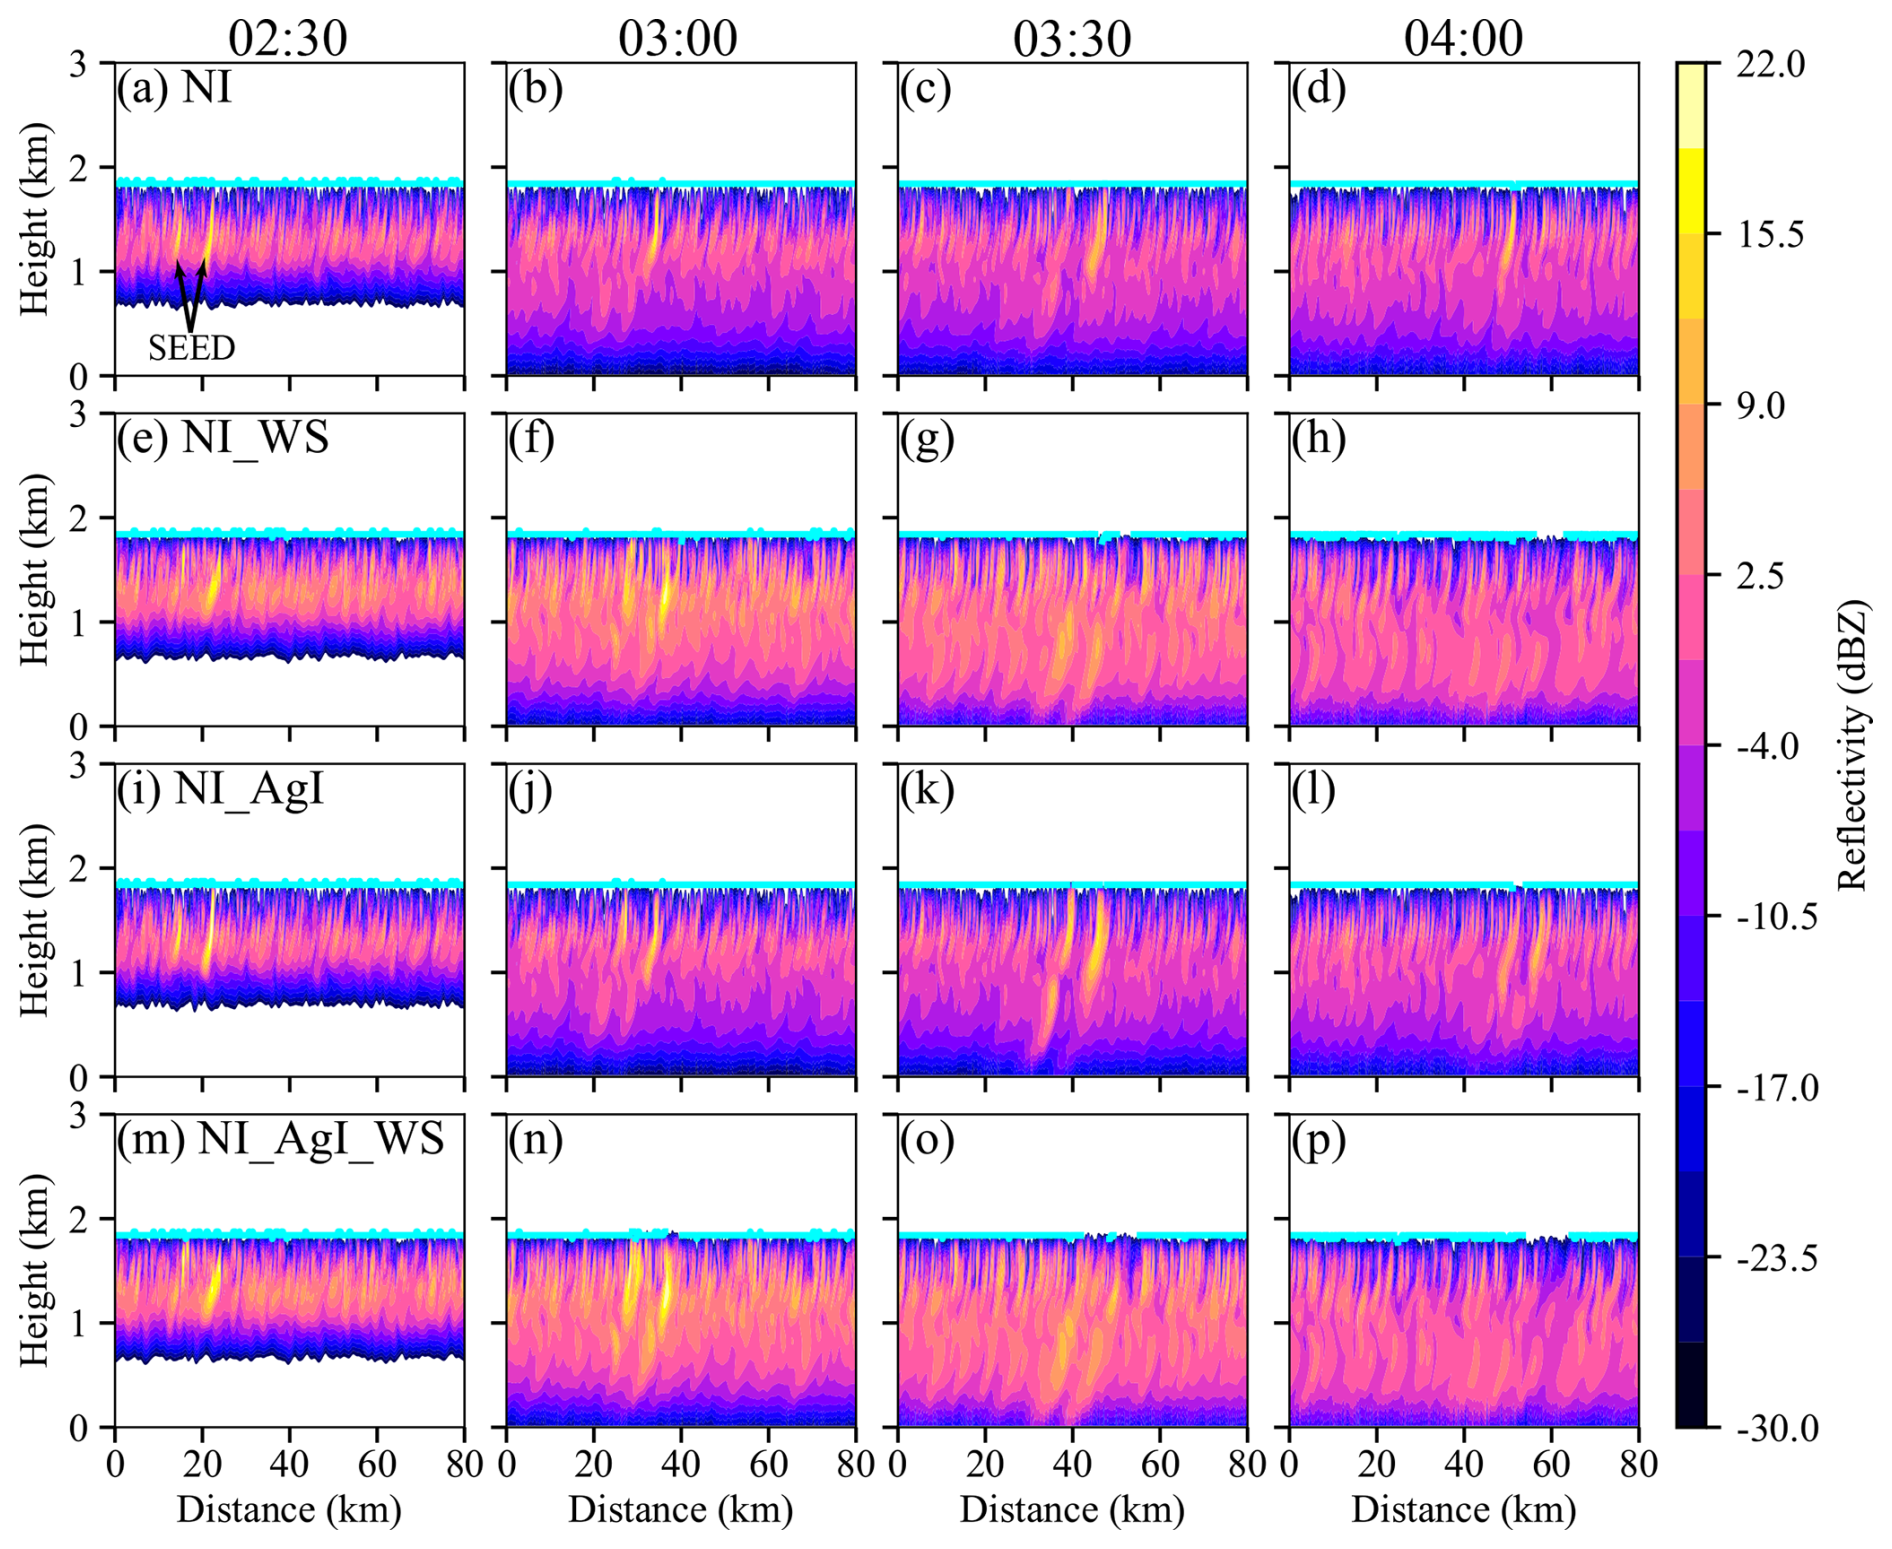
Figure 7East–west cross-sections of reflectivity from (a–d) NI, (e–h) NI_WS, (i–l) NI_AgI, and (m–p) NI_AgI_WS experiments from 02:30 to 04:00 MT. The cyan lines indicate the top of the liquid layer. Natural ice nucleation is allowed in the simulations. The cross-sections are selected at y = 20, y = 20, y = 40, and y = 50 km at 02:30, 03:00, 03:30, and 04:00 MT, respectively.
3.2 Cloud microphysics
In this section, we investigate the changes in cloud microphysics after seeding was performed in the four different numerical experiments (NI, NI_WS, NI_AgI, and NI_AgI_WS), in which natural ice nucleation is allowed. Figure 7 shows the cross-sections of radar reflectivity, where the background radar reflectivity is the result of natural ice nucleation. It is seen that cloud seeding can induce enhancement in radar reflectivity. At 02:30 MT, the maximum reflectivity at a lower AgI release rate was about 15 dBZ (Fig. 7a and e), which is slightly larger than in the simulation without natural ice (Fig. 5). With a larger AgI seeding rate, the maximum radar reflectivity reached 22 dBZ at 02:30 MT, when there was still sufficient LWC to support the ice growth (Fig. 7i and m). The stronger turbulence enhanced the horizontal dispersion of the AgI particles, so the horizontal spread of seeding plumes was larger in the NI_WS and NI_AgI_WS experiments than the other two. In NOSEED areas, the radar reflectivity was higher in the experiments with stronger turbulence, suggesting higher ice concentrations and larger ice particles. Later at 03:00 MT, the radar reflectivity in SEED areas became larger in the NI_WS and NI_AgI_WS experiments than the other two. However, the positive seeding effects attenuated more rapidly in the experiments with stronger turbulence (Fig. 7g and o). At 04:00 MT, the NI_WS and NI_AgI_WS experiments obtained a negative seeding effect, and the liquid layer top (cyan lines) disappeared. However, in the NI and NI_AgI experiments, enhancement of radar reflectivity in SEED areas can last for a longer time (Fig. 7d and l).
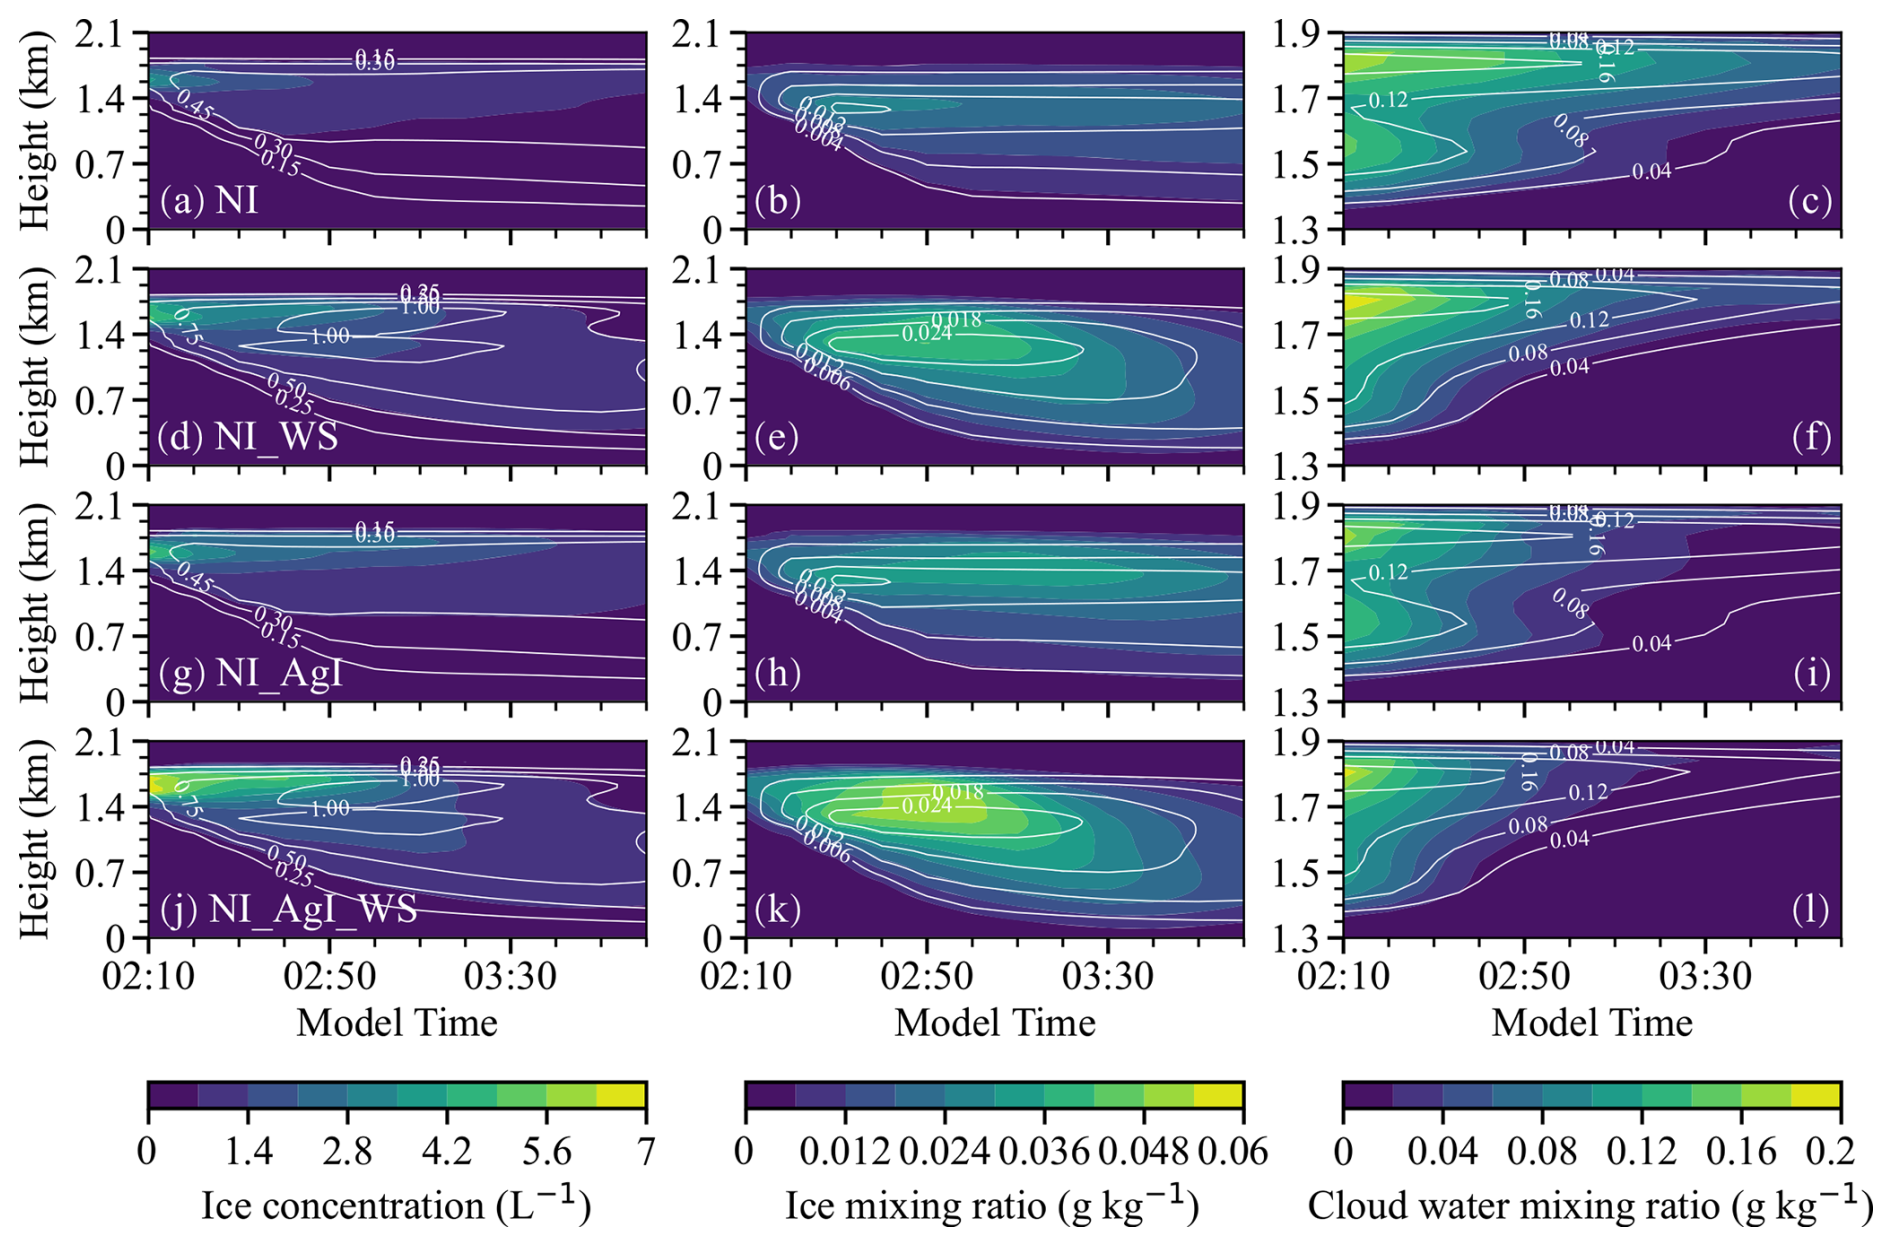
Figure 8Time–height diagrams of ice concentration (left panels), ice mixing ratio (middle panels), and cloud water mixing ratio (right panels) from the (a–c) NI, (d–f) NI_WS, (g–i) NI_AgI and (j–l) NI_AgI_WS experiments. The color shading applies to the SEED areas, and the white contours are for the NOSEED areas.
The positive impact of turbulence on ice nucleation is also evident in the time–height diagrams of averaged ice concentration and ice water content (IWC) (Fig. 8). It can be seen that with stronger turbulence the cloud obtained a higher ice concentration in SEED (color-shaded) areas soon after seeding (Fig. 8a, d, g, and j), with the maximum value reaching 7 L−1 in the NI_AgI_WS experiment, which is 1.4 times higher than that in the NI_AgI experiment. However, in the SEED areas, the ice concentrations in the NI_WS and NI_AgI_WS experiments decreased rapidly with time and became similar to that in the NI and NI_AgI experiments after 03:20 MT. At the same time, stronger turbulence also promotes the nucleation of natural ice crystals in NOSEED areas (grey contours). The modeled natural ice concentrations in the experiments with enhanced turbulence have similar temporal variation patterns as the turbulence intensity (Fig. 4a), and a maximum value exceeding 1 L−1 was found between 02:50 and 03:20 MT. In the experiments with default turbulence intensity, the ice concentration was lower than 0.5 L−1 and changed little with time after 02:20 MT. The higher concentrations of ice crystals tend to consume LWC more rapidly as crystals grow, so it is seen that the decrease in LWC in the SEED area is fastest in the NI_AgI_WS experiment (Fig. 8l), resulting in a higher IWC (up to 0.053 g kg−1) before 02:50 MT. Although enhanced turbulence produced more supercooled liquid water, it is evident that the cloud glaciation rate was faster after seeding and that the clouds rapidly became thinner. SEED areas completely glaciated when liquid water remained in NOSEED areas. This process involves competition among liquid water generation, turbulent mixing, and cloud glaciation, which is analyzed in detail below.
To better understand the ice growth and LWC consumption at different turbulence intensities, the depositional growth rate of ice crystals and the condensation rate of droplets in SEED areas are plotted in Fig. 9, which were calculated based on mass change per unit time. The ice growth is dominated by the WBF process rather than riming and aggregation in this case (not shown). Compared to the diffusional growth rate, the riming and aggregation rate are rather minor for such a thin cloud. This is consistent with dual-polarization radar measurements for seeded wintertime stratiform clouds (Jing et al., 2015; Jing and Geerts, 2015). It can be seen that turbulence contributed significantly to the growth of ice crystals (Fig. 9a and b), and overall, the experiments with enhanced turbulence had a higher deposition rate before 03:00 MT; then it became lower than that in clouds with weaker turbulence due to the insufficient liquid water supply. The experiment with higher AgI concentration produced greater changes in mass because of more ice crystals. Figure 9c and d show the condensation rate of liquid water. In weak turbulence with relatively low AgI concentration, the condensation rate varied mostly between 0 and −2 × 10⁻⁵ , suggesting a relatively weak water consumption (Fig. 9c). While in a stronger turbulent cloud, the condensation rate was greater between 02:00 and 03:00 MT, indicating that the generation of liquid water was significantly slower than its consumption by ice growth. With more AgI particles seeded, the condensation rate shifted to negative in both simulations, indicating a faster cloud glaciation (Fig. 9d). At the cloud tops, turbulence can promote the evaporation of liquid water due to the entrainment of dry air and detrainment of vapor, so cloud glaciation was faster near cloud tops, even though entrainment of dry air may also suppress ice growth to some extent (Chu et al., 2018). Significant entrainment is unlikely in this case because of the very strong inversion just above the cloud top (Fig. 3).
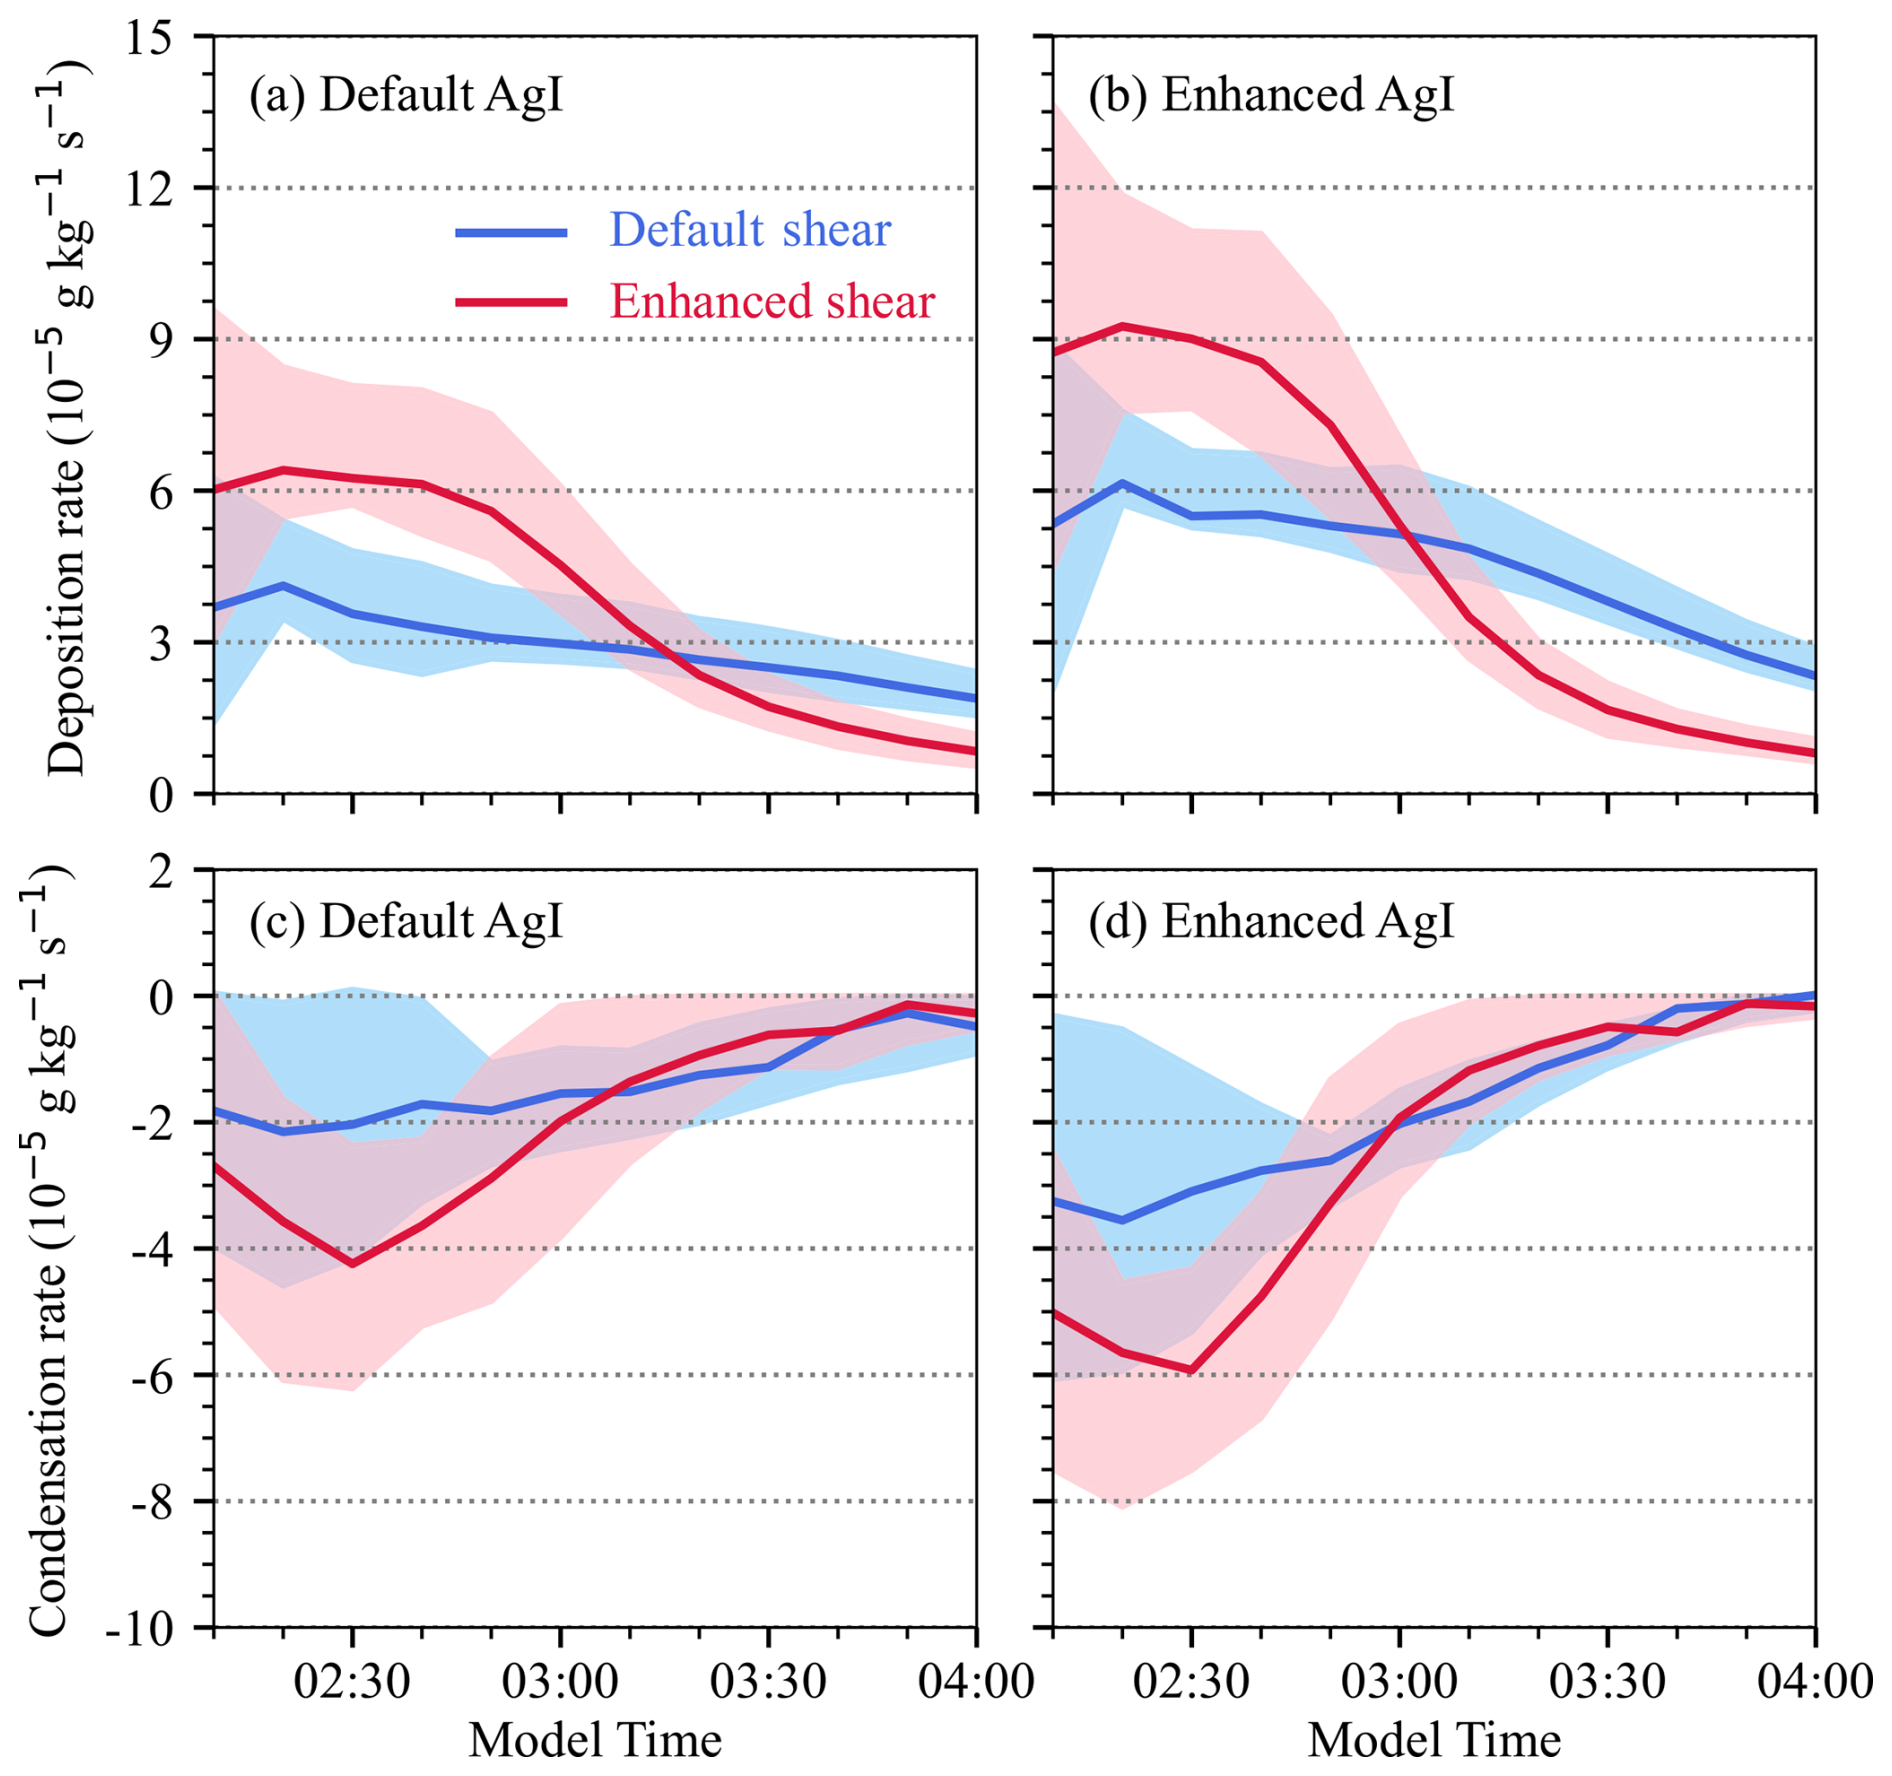
Figure 9Temporal variations of (a, b) ice depositional growth rate and (c, d) droplet condensation rate in SEED areas at different AgI concentrations and shear intensities. The upper and lower boundaries of the shaded areas indicate the 75th and 25th percentiles, and the solid lines represent the mean values.
In short, based on the analyses of Figs. 7–9, it is seen that stronger turbulence enhances the ice nucleation and ice growth in the cloud. Even though stronger updrafts can provide more liquid water, the cloud in the SEED areas glaciated more rapidly as the water consumption is faster than the water supply, and the turbulence is not able to maintain the cloud in a mixed phase.
3.3 Surface precipitation
Due to the faster cloud glaciation induced by stronger turbulence, it is expected that the precipitation may be enhanced only within a short time in the SEED areas after seeding is performed, and the seeding effect may be negative after the cloud is glaciated. Figure 10 shows the difference in the precipitation rates and the cumulative precipitation between the SEED and NOSEED areas. The precipitation regions for SEED and NOSEED at each moment are determined based on cumulative precipitation characteristics. Note that the surface precipitation rate was rather low because of the strong sublimation caused by the dry sub-cloud layer (Fig. 3). However, the differences in precipitation between the SEED and NOSEED areas are clear. It is seen from the figure that the positive seeding effect was significant after the turbulence was enhanced. The enhancement in precipitation rate in NI_WS was even greater than that in the NI_AgI experiment. With both turbulence and AgI enhanced, the maximum enhancement in precipitation rate was about 10 times greater than that in the NI experiment, resulting in greater cumulative precipitation in the SEED areas (Fig. 10b). However, due to the fast depletion of LWC, the precipitation rates in the NI_WS and NI_AgI_WS experiments were lower in the SEED area than in the NOSEED area after 04:10 MT. In clouds with default turbulence intensity, the seeding effect was positive most of the time if using less AgI, and the cumulative precipitation generally increased with time. With more AgI seeded, the seeding effect became negative, and the cumulative precipitation decreased after 04:40 MT. Due to the slower cloud glaciation process, the seeding-induced enhanced cumulative precipitation in the NI_AgI experiment exceeded that in the NI_WS experiment (Fig. 10b).
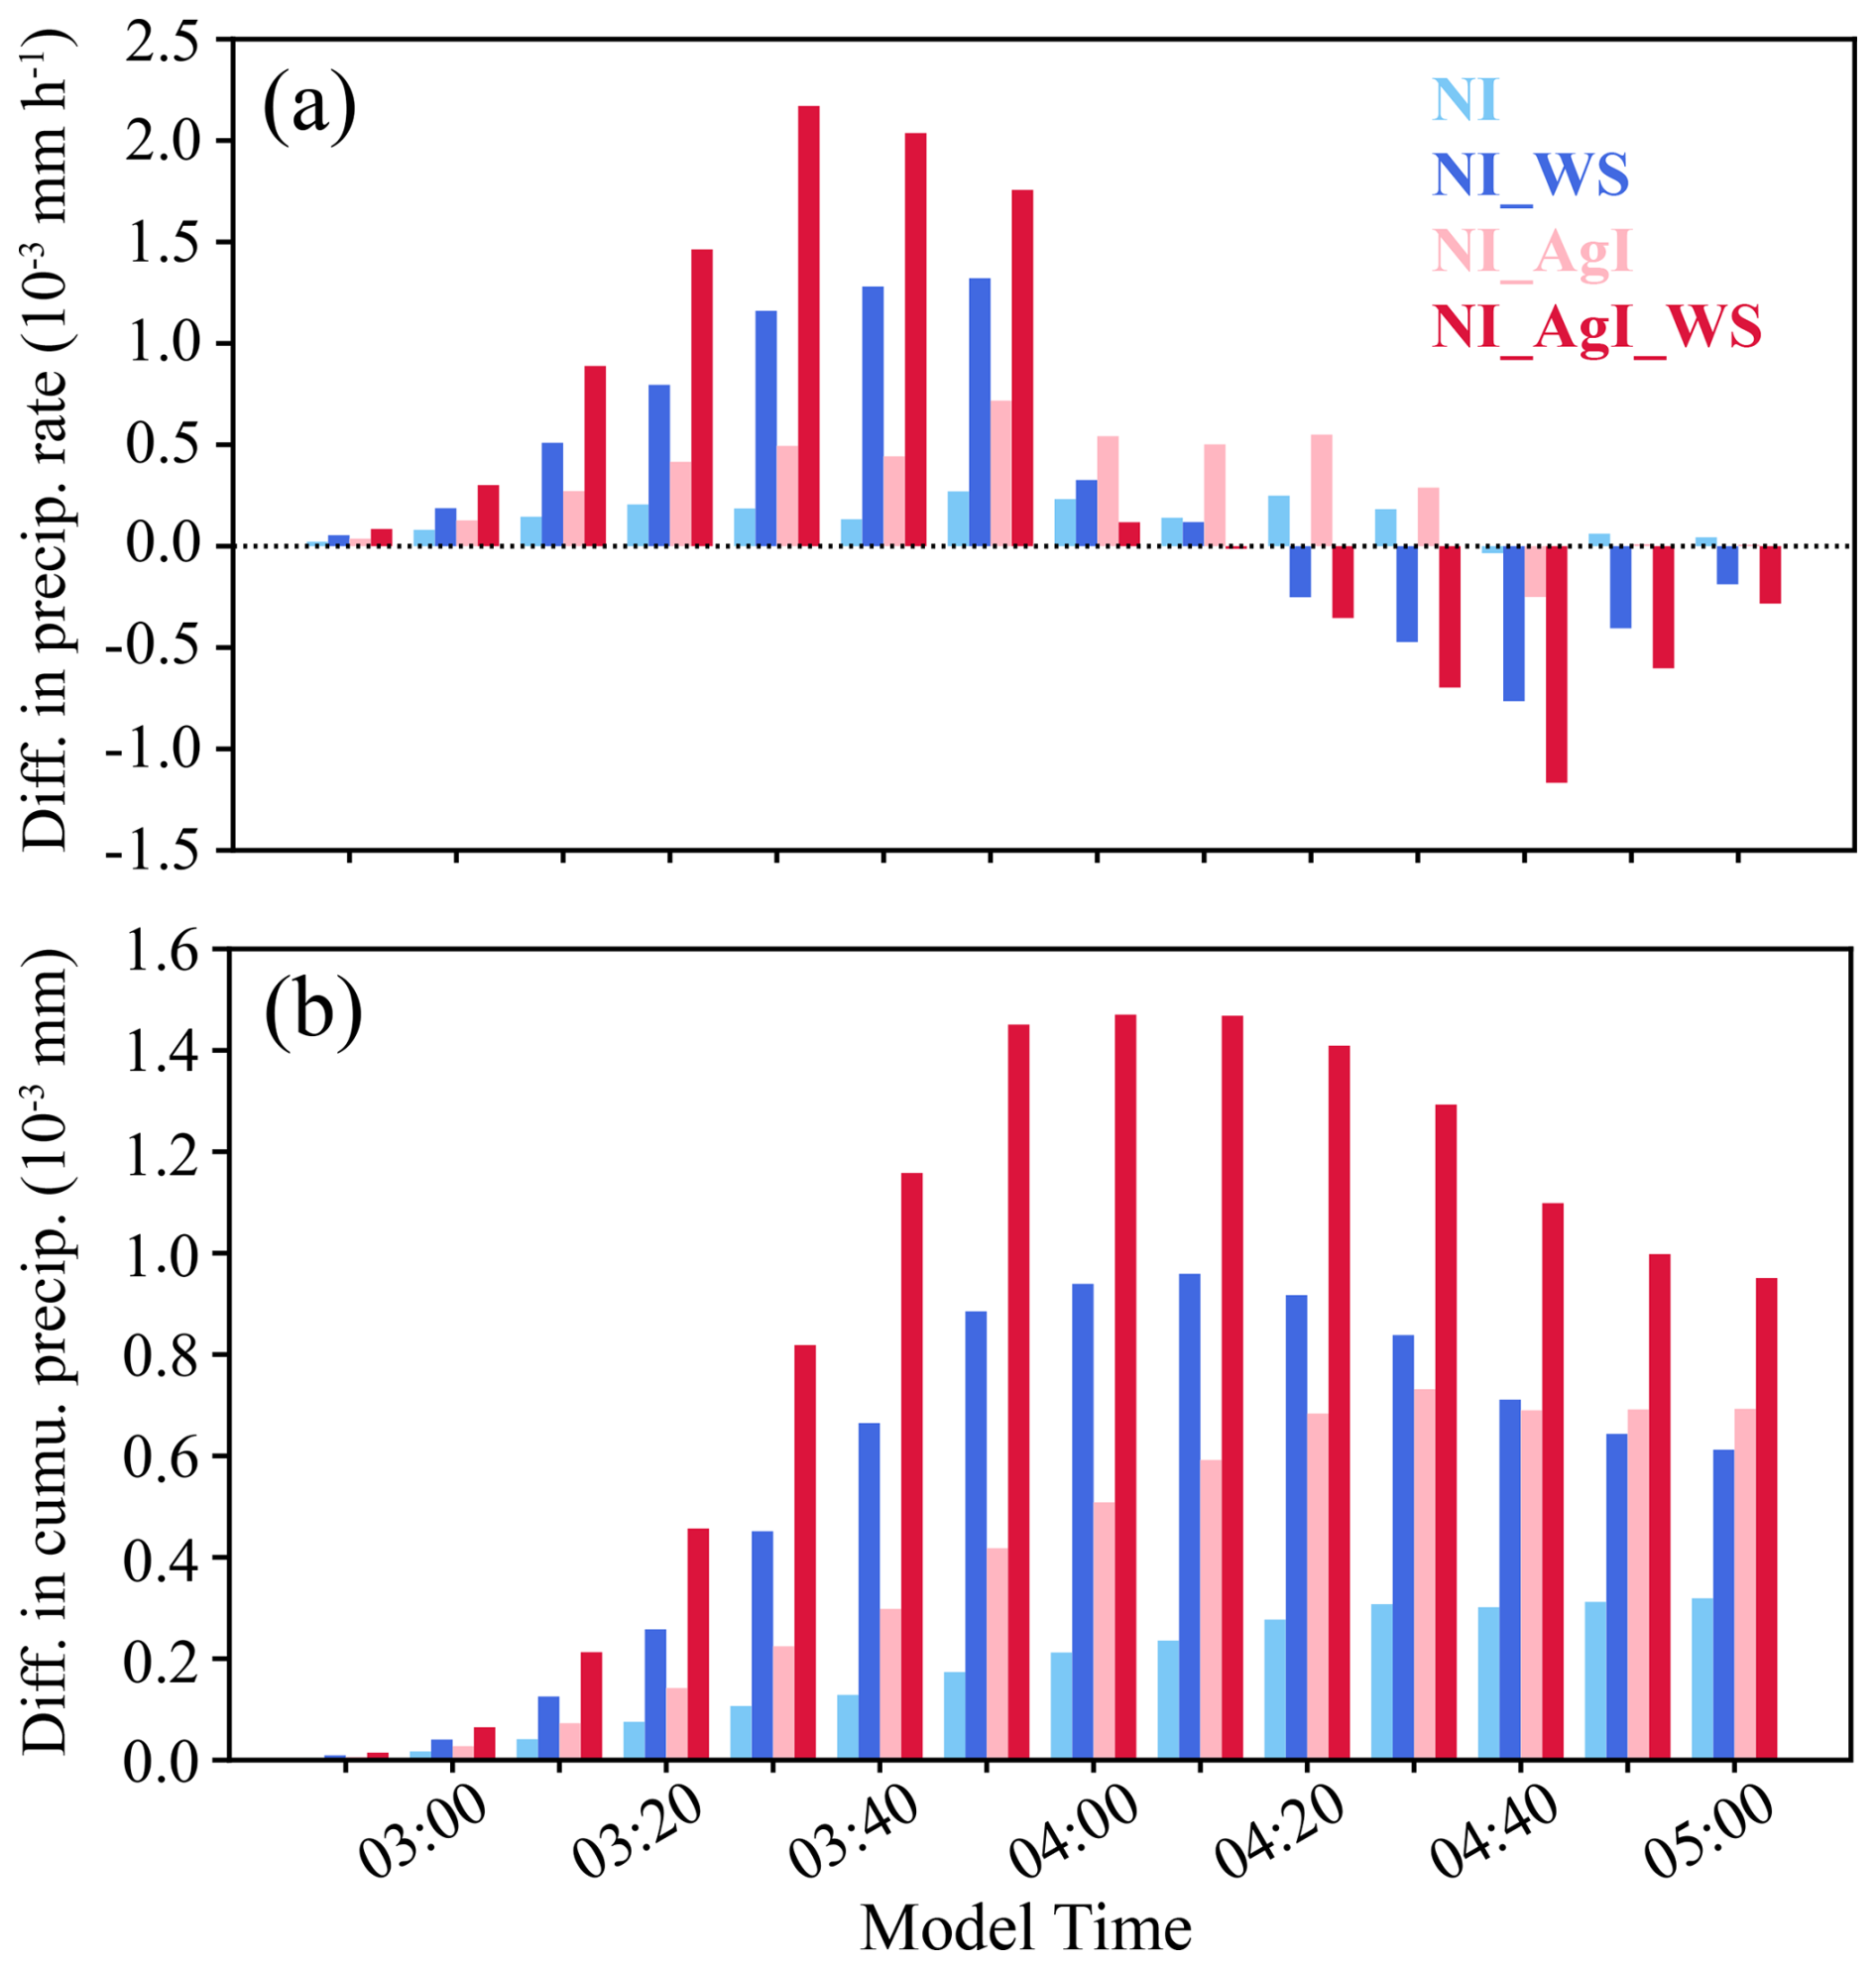
Figure 10Temporal variations of the differences in (a) precipitation rates and (b) cumulative precipitation between SEED and NOSEED areas.
The negative seeding effect induced by turbulence after 04:10 MT resulted in a decrease in precipitation in the downwind SEED areas. This can be intuitively seen from the maps of differences in cumulative precipitation compared to the average natural precipitation (Fig. 11). In the NI simulation (Fig. 11a), the SEED area obtained more precipitation than NOSEED areas all the time. With enhanced AgI concentration (Fig. 11c), the precipitation in the SEED area obtained more enhancement, especially between 40–50 km along the x distance. However, as the cloud moved further downwind, the magnitude of the seeding effect became similar in the NI_AgI and the NI experiments. With turbulence enhanced (NI_WS), the accumulated precipitation increased rapidly in the SEED area and then decreased as the cloud moved northeastward. The seeding effect became negative in the downwind areas, indicating the presence of the “robbing Peter to pay Paul” effect. Such a transition from positive to negative seeding effects was more substantial in magnitude in the NI_AgI_WS experiment than in the NI_WS experiment (Fig. 11d), but the area with a negative seeding effect is similar to that with a positive effect in both simulations. On the contrary, under weaker turbulence, even though the cumulative amount of precipitation enhanced by seeding is less than that with stronger turbulence, it generates more sustained precipitation enhancement and is more beneficial if one wants a positive seeding effect in a larger target area. The absolute (relative) increases in water volume in the areas affected by seeding (black boxes in Fig. 11) are 976.3 m3 (8.0 %), 1291.2 m3 (5.1 %), 2042.7 m3 (16.7 %), and 2234.1 m3 (8.7 %) in the NI, NI_WS, NI_AgI, and NI_AgI_WS experiments, respectively, which were calculated by comparing the average cumulative precipitation inside and outside the boxes. The results demonstrate that both seeding and enhanced turbulence can induce significant precipitation changes. Although uncertainties associated with the microphysics scheme and the unresolved smaller turbulent eddies may affect the magnitude of precipitation changes, they are unlikely to explain such clear precipitation variations.
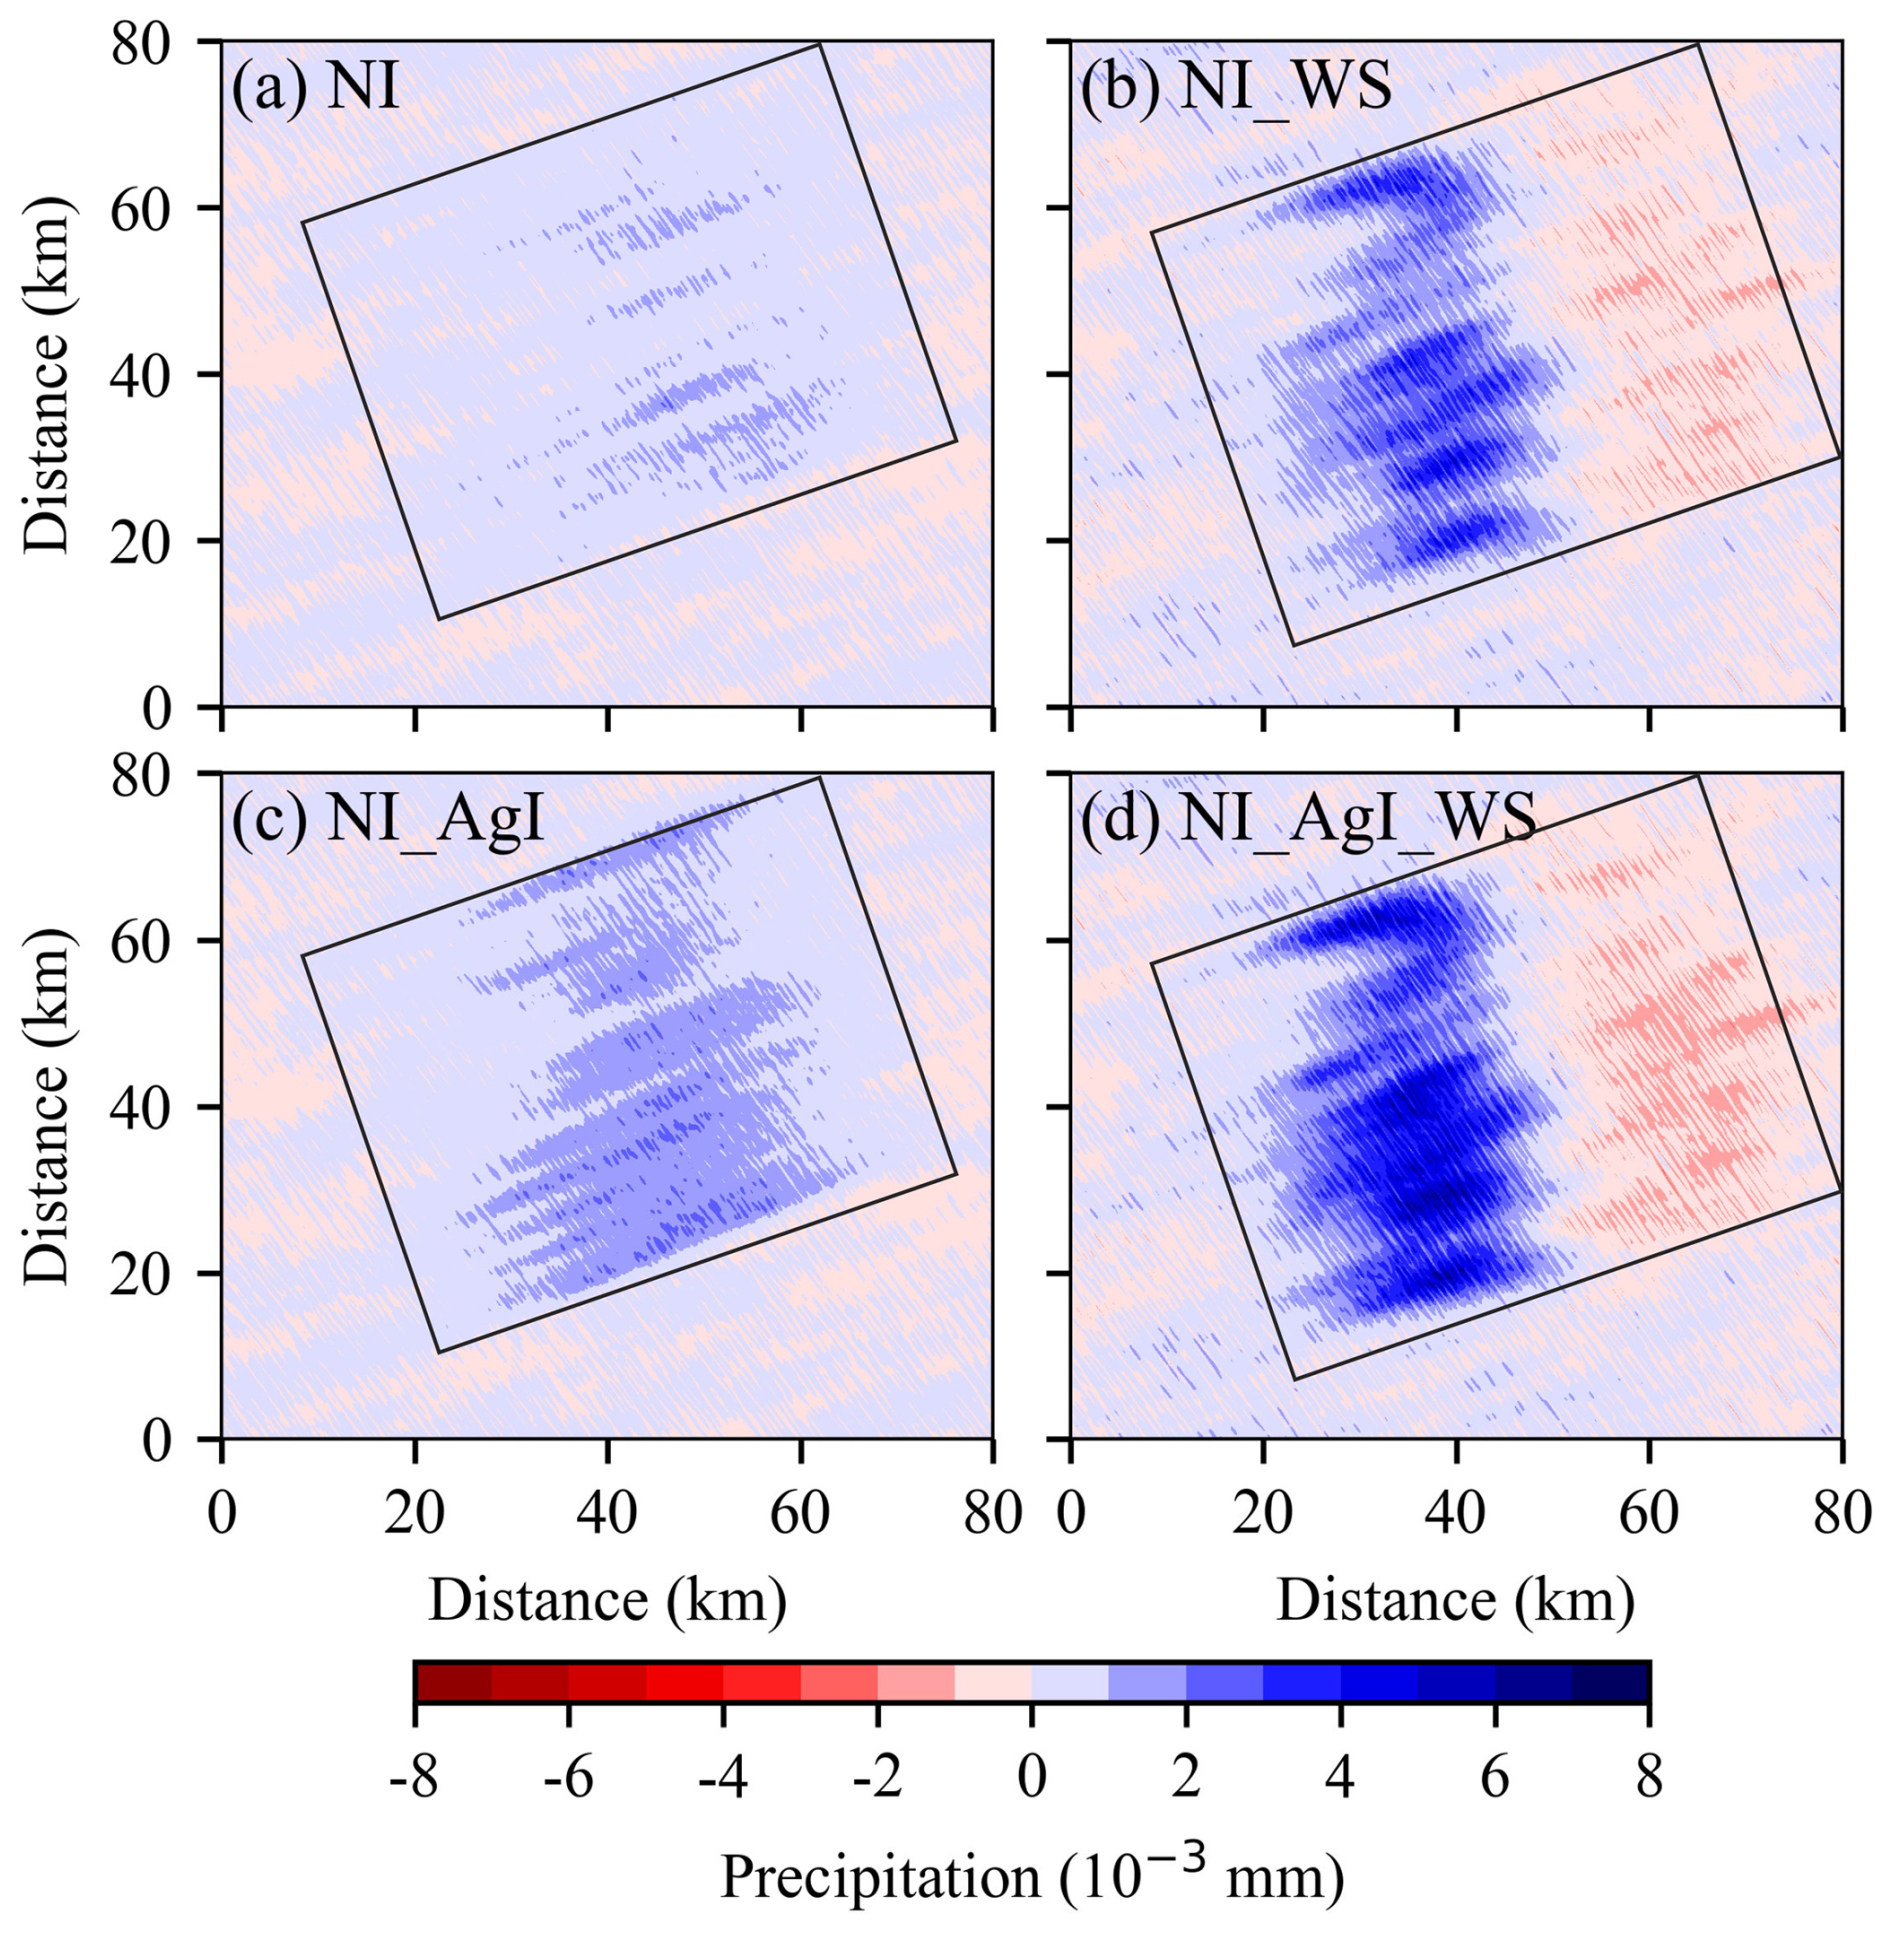
Figure 11Maps of difference in cumulative precipitation compared to the average natural precipitation from the (a) NI, (b) NI_WS, (c) NI_AgI, and (d) NI_AgI_WS experiments.
3.4 Role of turbulence in cloud glaciation
Turbulence helps the clouds maintain a mixed-phase state by enhancing mixing and liquid condensation, but it also promotes the dispersal and activation of AgI INPs and the growth of ice crystals. For the case presented in this paper, the latter dominated in the SEED area. This section further quantifies the competition among turbulent mixing, liquid condensation, and cloud glaciation.
Figure 12 shows the characteristic times of turbulent mixing and cloud glaciation in the SEED area, which were calculated using the formulas in Korolev and Milbrandt (2022):
where L is the spatial scale (in m), and ε is the turbulence energy dissipation rate (in m2 s−3), which is proportional to turbulent kinetic energy (e.g., Pokharel et al., 2017). ρi is the density of ice (in kg m−3), c is the ice particle shape factor characterizing capacitance (0 < c≤ 1, c=1 for sphere), is the supersaturation over ice, and Ew(T) and Ei(T) are the saturation vapor pressures with respect to liquid and ice at temperature T, respectively. Ni is the ice particle concentration, Li is the latent heat for ice sublimation, k is the coefficient of air heat conductivity, Rv is the specific gas constant of water vapor, and D is the coefficient of water vapor diffusion in the air.
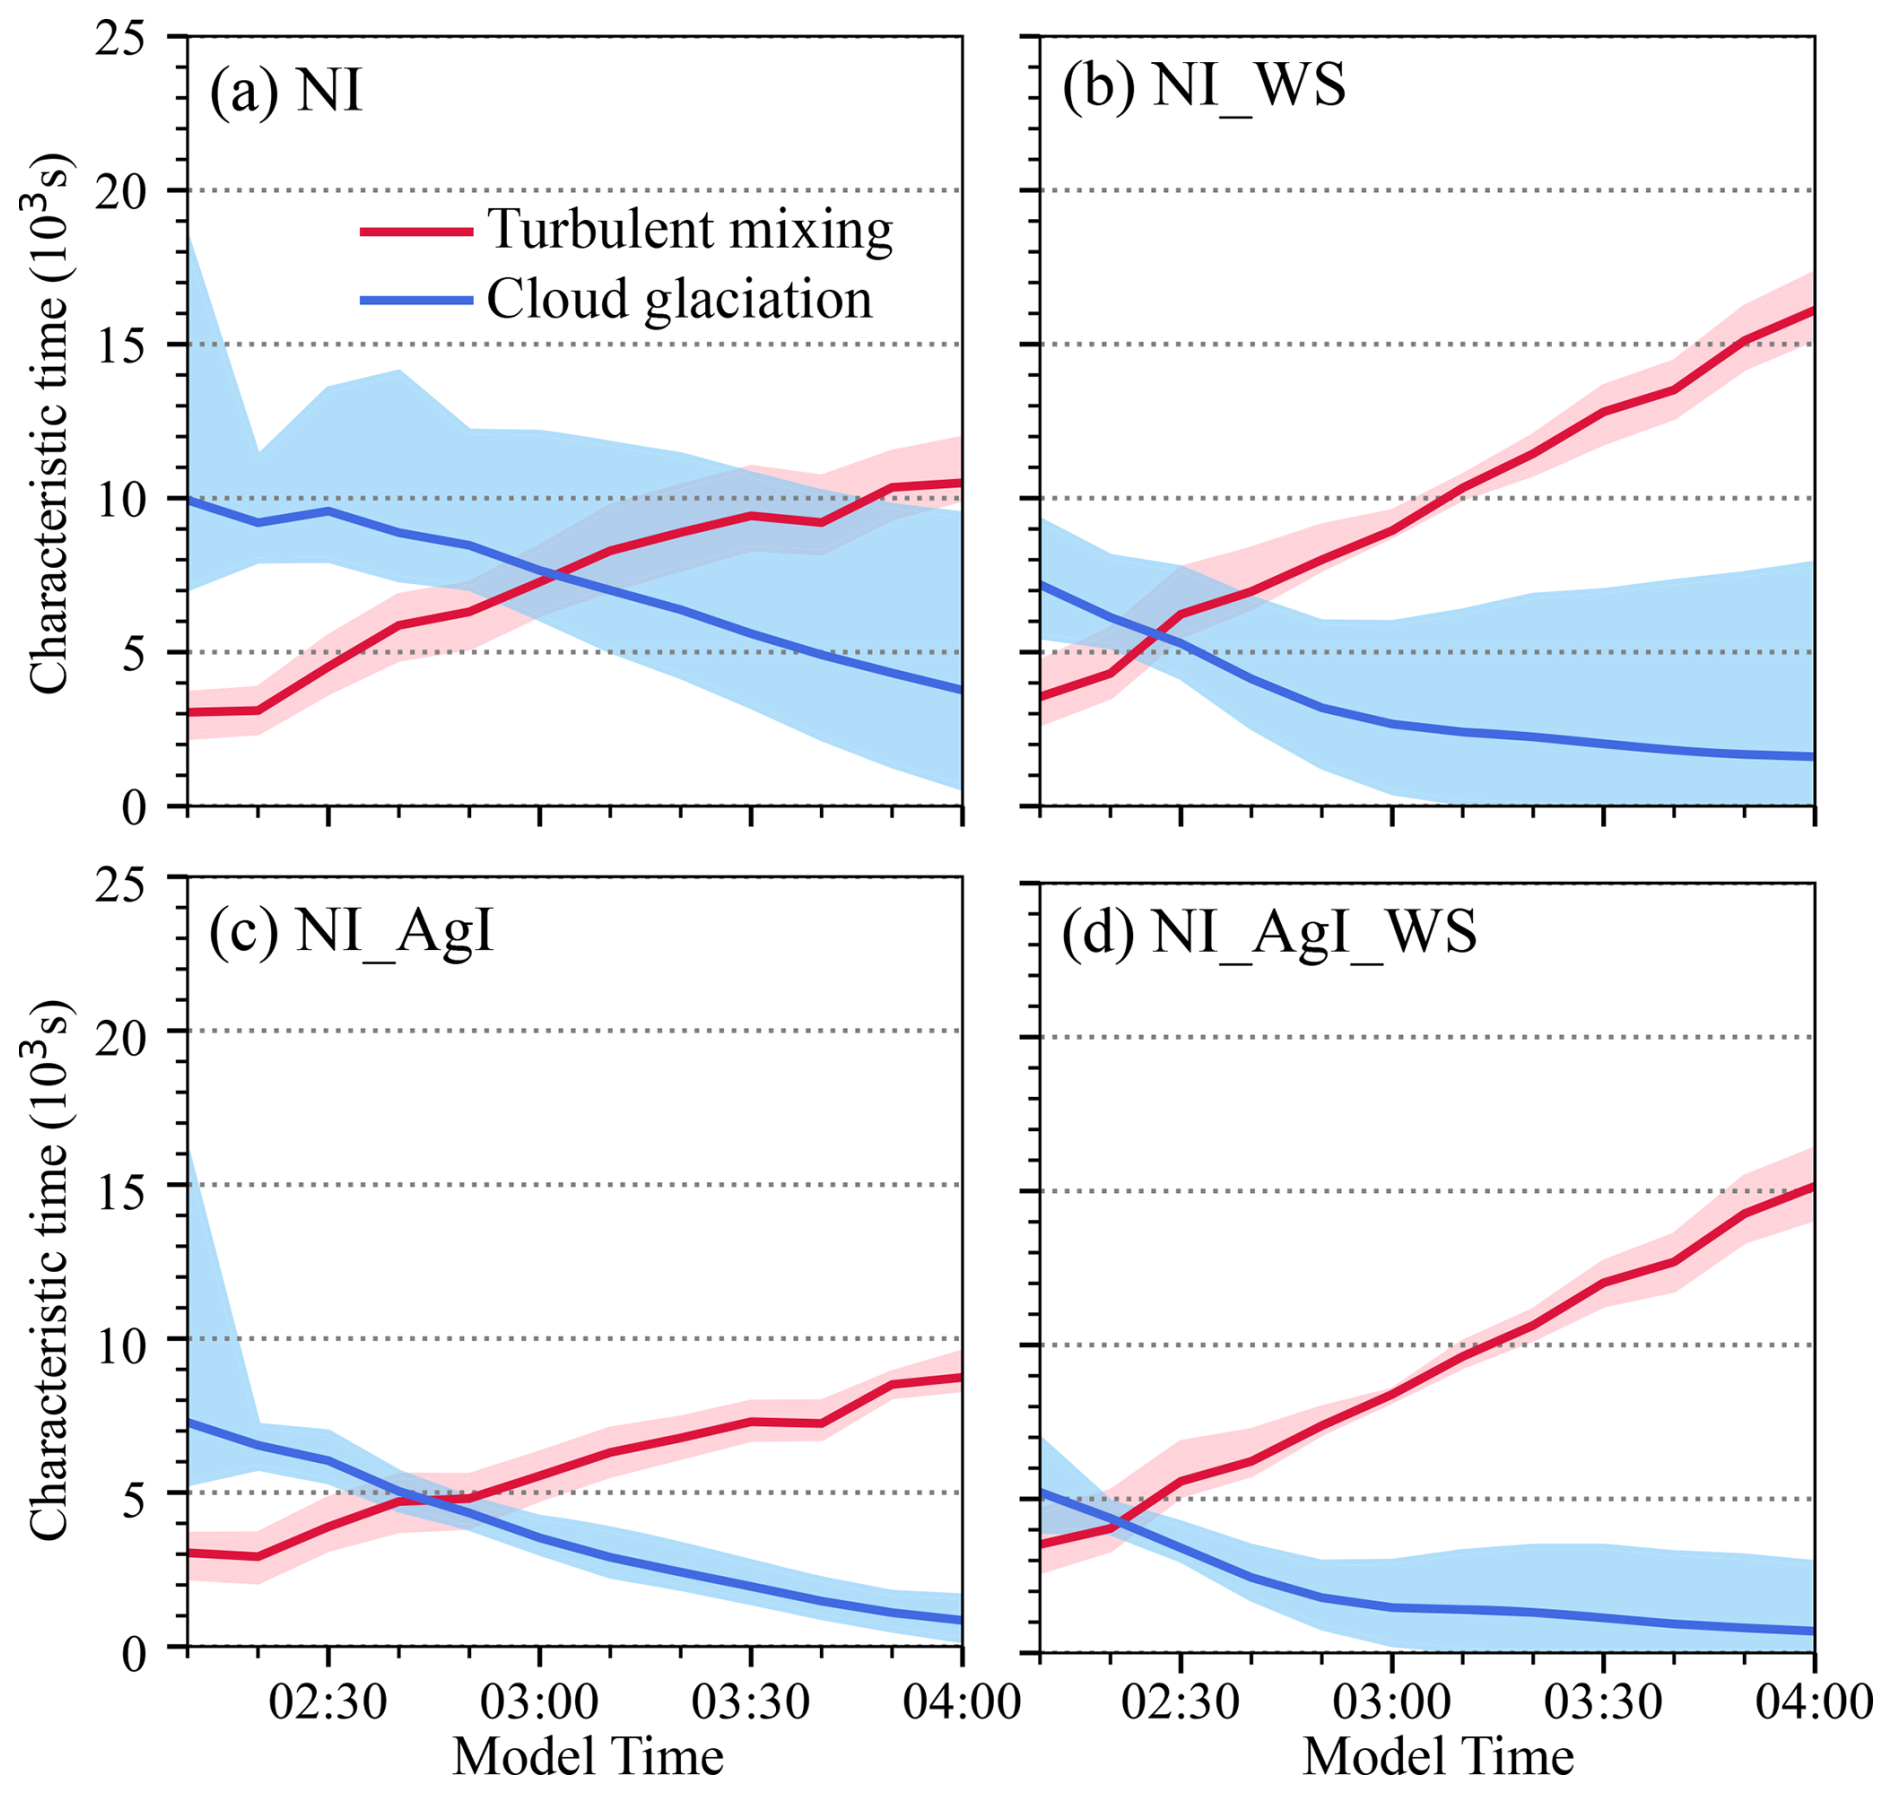
Figure 12Temporal variations of the characteristic times of turbulence mixing and cloud glaciation in SEED areas from the (a) NI, (b) NI_WS, (c) NI_AgI, and (d) NI_AgI_WS experiments. The upper and lower boundaries of the shaded areas indicate the 75th and 25th percentiles, and the solid lines indicate the means.
In all our simulations, as the AgI particles disperse, the scales of the seeding plume broaden, resulting in a larger L. Therefore, the mixing timescale τmix increases with time, indicating more time is required to refill the SEED area with liquid water through mixing only. On the other hand, the cloud glaciation timescale τgl decreases with time, because the LWC is continuously reduced in the SEED areas (Fig. 8c, f, i, and l).
By comparing the right and left panels in Fig. 12, it can be seen that the enhanced turbulence accelerated the cloud glaciation, and the characteristic time of mixing became larger due to the enhanced spread of the seeding plume. Applying more AgI aerosols had negligible impacts on τmix but clearly enhanced the cloud glaciation (Fig. 12c). The intersection of the curves, which indicates the time when the rate of cloud glaciation exceeded the turbulent mixing, was significantly advanced by the stronger turbulence and stronger seeding rate in NI_AgI_WS (Fig. 12d). The differences among the four panels better explain why turbulence enhanced the cloud glaciation. In the NI experiment, in which the mixed-phase cloud maintains in the SEED area for a relatively long period, τgl is smaller than τmix after 03:00 MT, meaning that the turbulent mixing was not fast enough to fill the seeding plume with liquid water, and new liquid formation must be more important to maintain the cloud in a mixed phase after this time.
Although the cloud glaciation was accelerated by turbulence, data do not indicate that droplet condensation was entirely prevented in the SEED areas, because there were updrafts strong enough to force droplets to grow. The threshold of vertical velocity (w∗) for which both droplets and ice can grow (Korolev and Mazin, 2003; Hill et al., 2014) is
where η is a coefficient dependent on temperature and pressure, Vf is the ventilation factor, and Ni and ri are the number concentration and mean radius of ice crystals, respectively. In our simulations, condensation occurred in the area with a vertical velocity greater than w∗, while evaporation took place when the vertical velocity is lower than w∗, regardless of whether turbulence or AgI amount was enhanced (Fig. 13). Therefore, liquid water condensation can still occur in SEED areas even after the cloud is glaciated. However, the fractional area with a positive condensation rate substantially decreased with time (Fig. 13c), especially in the experiments with enhanced turbulence. Liquid water that forms in such a small area can be rapidly consumed by ice growth, and there is no chance for them to fill the glaciated area through turbulent mixing. Therefore, the cloud ultimately glaciated in SEED areas. It should be noted that w∗ in Fig. 13a and b is calculated under constant temperature and pressure conditions, whereas temperature and pressure within clouds are not constant, and the ice shape can also influence the condensation rate. Consequently, there could be a low occurrence of negative condensation rates even when vertical velocities are slightly above w∗. Nonetheless, this does not alter the overall distribution of condensation rates when vertical velocities are above or below w∗.
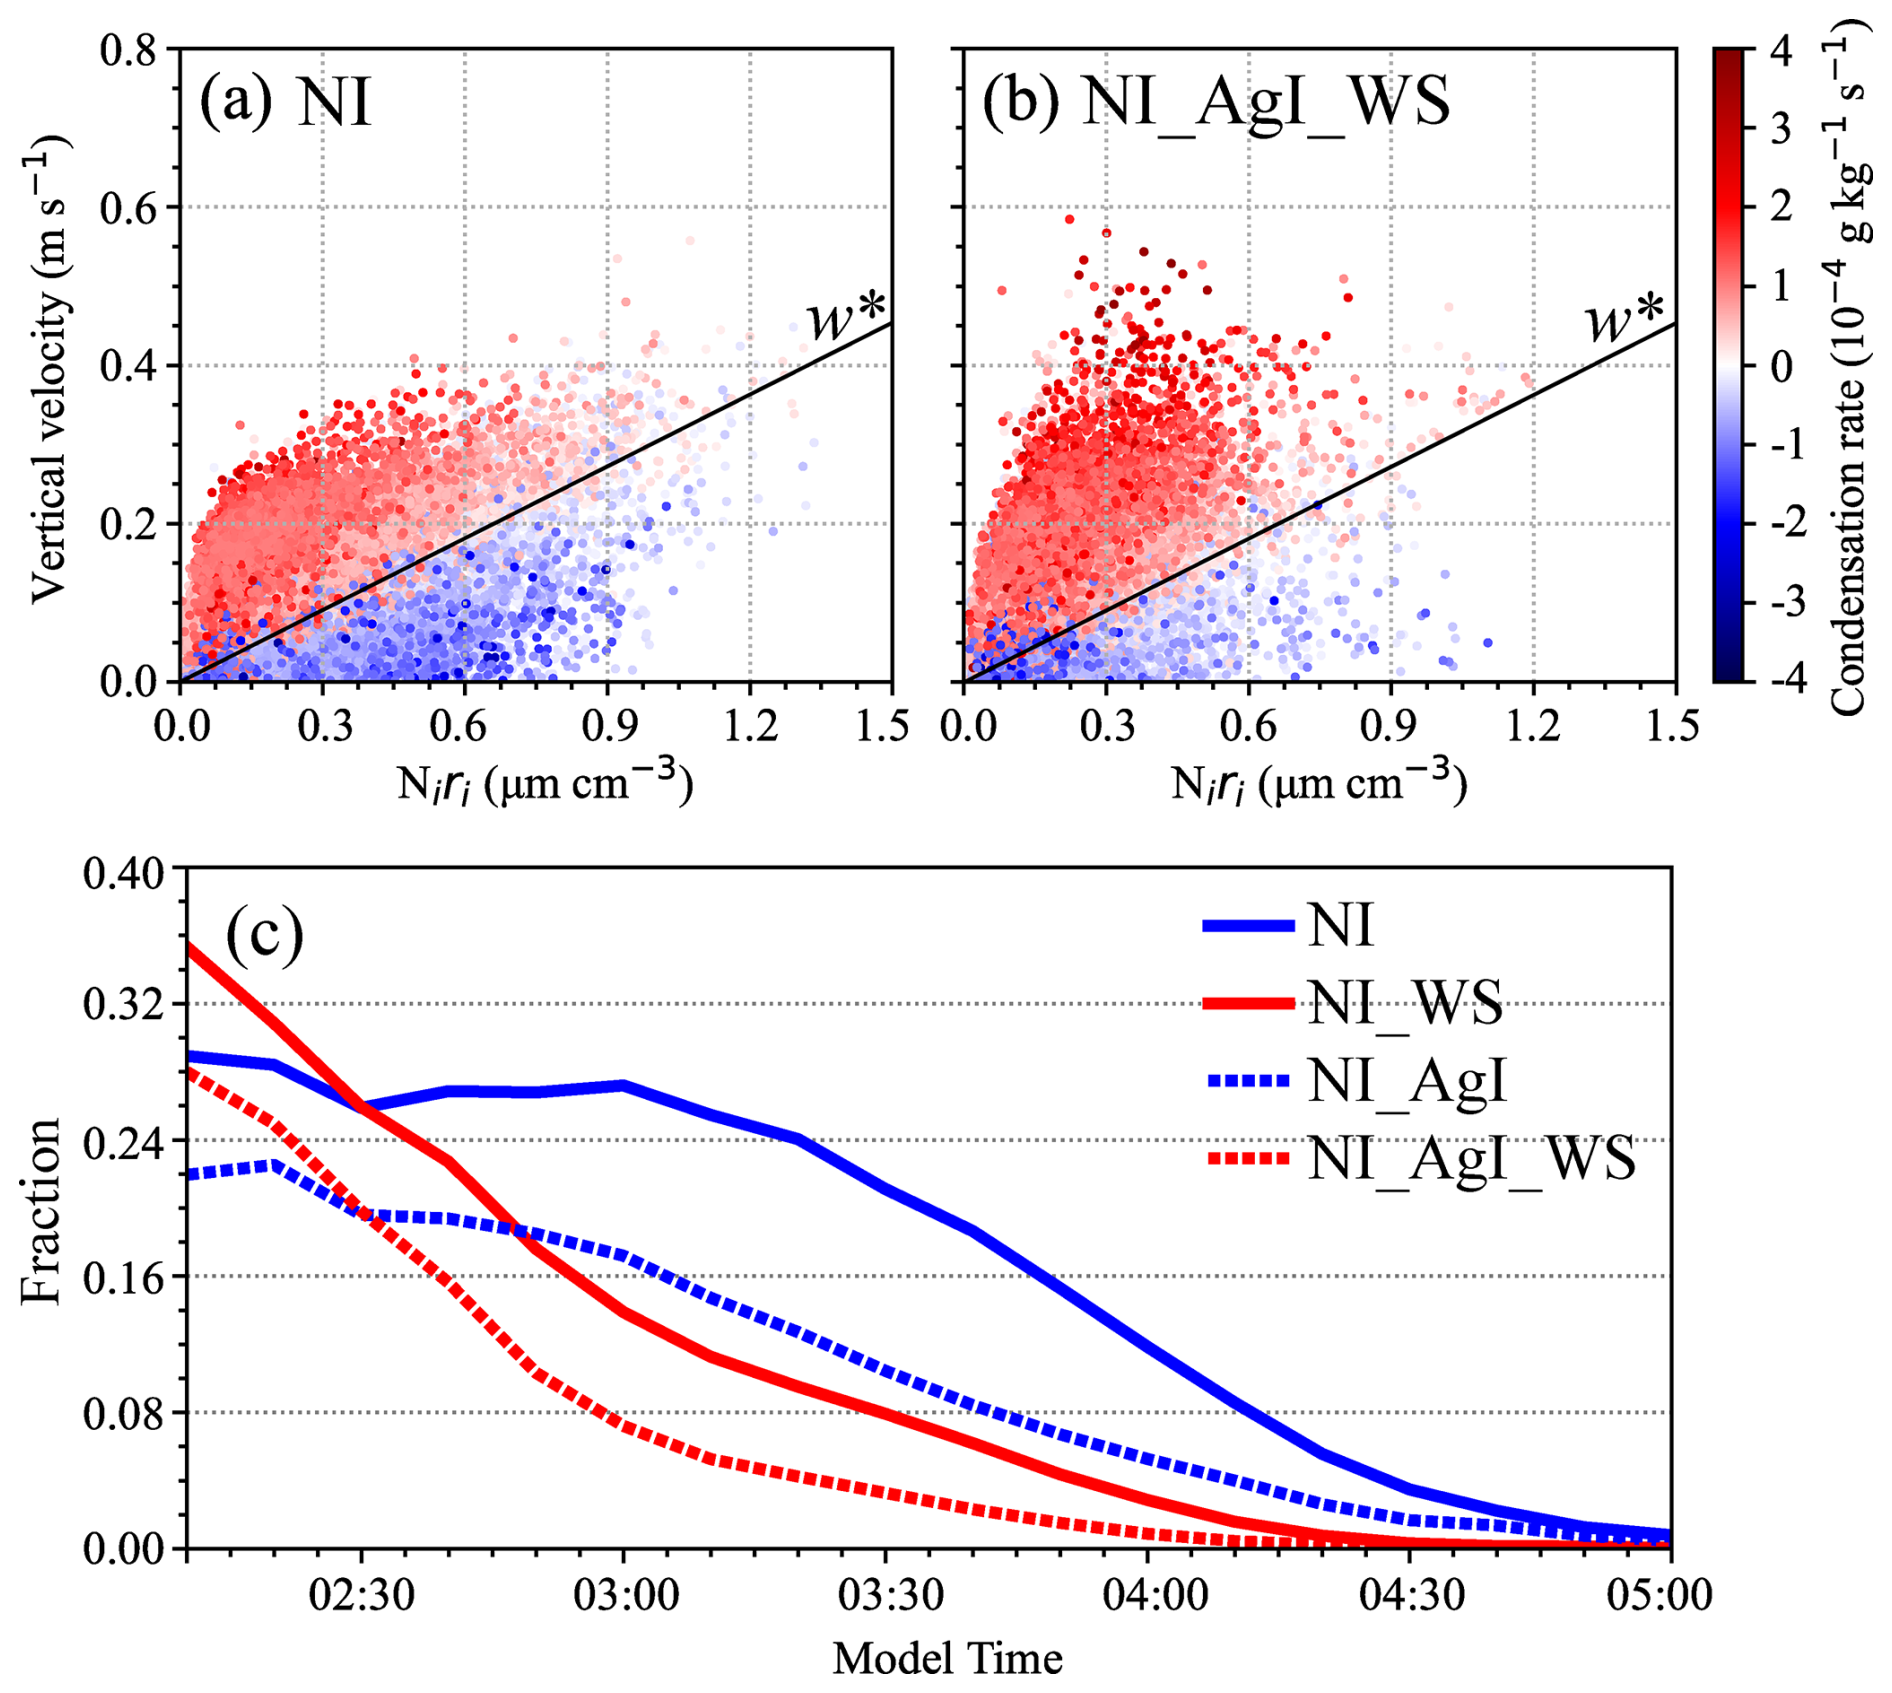
Figure 13Condensation rates in SEED areas under different vertical velocities and Niri from (a) NI and (b) NI_AgI_WS experiments at 03:30 MT. The black lines represent the minimum vertical velocity for which both liquid and ice can grow, which were calculated using Eq. (3) at 700 hPa and −15 °C. (c) The fraction of area with positive condensation rate in SEED areas.
In short, for the case presented here, stronger turbulence can enhance the mixing and updrafts in which condensation can occur in SEED areas, but the mixing is too slow and the area where droplets can grow is too small to maintain the mixed-phase clouds, resulting in fast cloud glaciation and the decrease in precipitation in downwind SEED areas.
In this study, the impacts of turbulence on airborne-based glaciogenic seeding effects are investigated using Weather Research and Forecasting (WRF) large eddy simulation (LES). The results show that for the case analyzed here, i.e., a well-capped, shallow (∼ 500 m deep) decoupled stratus cloud with cloud top of −16 °C, a stronger shear-driven turbulence can enhance the dispersion of AgI particles as well as the nucleation and growth of ice crystals, which ultimately produces more precipitation but accelerates the cloud glaciation, even though the mixing and liquid condensation are also enhanced. These impacts are the same for seeding with a lower or higher AgI aerosol amount. Such a negative downwind effect is also shown in some previous modeling studies. For example, Pourghasemi et al. (2022) coupled the aerosol-aware Thompson–Eidhammer microphysics scheme with an aerosol model and applied it to the WRF model to simulate airborne seeding in an upwind region. The seeding experiment was realized by varying the concentration of ice nuclei aerosols after AgI had been dispersed in clouds. Compared to the experiment without seeding, the aerosol increase produced more cloud water, more intense vertical airflow, and a 4.1 % decrease in mean accumulated precipitation in the downwind area of positive precipitation induced by seeding. In our study, an increase in AgI amount slightly reduced the downwind precipitation (Fig. 10), but we highlight that dynamics such as turbulence are also very important in controlling the downwind effect.
The results obtained in this study are based on a case study using idealized LES and a few sensitivity tests of different turbulent intensities and AgI amounts; however, the basic principle should be the same for different cases: the competition among liquid condensation, mixing, and cloud glaciation determines whether turbulence helps to maintain the clouds in a mixed phase or create the “robbing Peter to pay Paul” effect. We acknowledge that turbulence may play different roles in different cases. For example, since ice growth is slower at temperatures colder or warmer than −15 °C (Chen and Lamb, 1994; Fukuta and Takahashi, 1999; Harrington et al., 2019; Yang et al., 2024b), turbulence may have a weaker positive impact on ice growth; thus, it could be helpful to maintain the cloud in a mixed phase if seeding at a temperature that is different from this study. In addition, we investigated a shallow stratiform cloud here. For deeper clouds such as nimbostratus, which are often associated with frontal passages, there may be more liquid water supply and stronger natural ice nucleation, including through secondary ice production processes. It is less likely that turbulence alone can result in complete cloud glaciation in SEED areas in these clouds; at least, there is no observational evidence. Moreover, the updrafts and downdrafts in this study are only driven by turbulence; if turbulence is imposed on a larger-scale dynamic forcing (e.g., orographic gravity waves), it may have different impacts on cloud microphysics such as enhancing the riming and aggregation processes (e.g., Houze and Medina, 2005; Grasmick et al., 2021, 2022), which may in turn result in a different impact on the seeding effect. Finally, if the layer with supercooled droplets is sufficiently close to moist neutrally stratified conditions, then the glaciation by airborne seeding may release sufficient heat to result in buoyant ascent, creating its own turbulence, raising cloud top heights, and possibly enhancing surface precipitation, i.e., the dynamic seeding concept (Simpson et al., 1967; Bruintjes, 1999). In the case simulated here, the cloud layer was too stably stratified for such a buoyant ascent of seeded air parcels. To provide a complete understanding of how turbulence affects the glaciogenic seeding effect, more observational and modeling studies are needed in the future.
We showed that natural precipitation can be enhanced due to stronger turbulence, which is consistent with previous studies that used different methods to alter the turbulence intensity in the model. For example, by using buoyancy perturbation to induce turbulence in LES, Chu et al. (2018) found that the net outcome of turbulence on snow growth is positive and leads to a net increase in precipitation amount and duration. Recently, Sarnitsky et al. (2024), based on a statistical model, suggested that submeter turbulence has minor impacts on ice growth, while turbulence at larger scales can strongly affect cloud glaciation. In our simulation, we can only resolve the turbulence that is larger than 600 m, but the results of how turbulence affects cloud phase partitioning and precipitation are similar to previous studies using finer resolution (Chu et al., 2018; Yang et al., 2024a). Although we do not focus on the impacts of turbulence on natural precipitation in this study, the results provide additional evidence that turbulence can significantly affect the precipitation in both NOSEED and SEED areas; thus, its impact on cloud microphysics and precipitation should be carefully parameterized in numerical weather prediction (NWP) models.
In this study, by using LES, we investigated the impacts of turbulence on airborne glaciogenic cloud seeding in mixed-phase stratiform clouds. The case was conducted over the North China Plain, with complete cloud glaciation observed in the SEED area. The model captured the magnitude and spatial distribution of seeding-induced reflectivity enhancement along the flight track. Five sensitivity tests were conducted: a control run, which was driven by the default sounding data and actual seeding strategy without natural ice nucleation, and the other four, in which natural ice nucleation was turned on and turbulence and/or AgI release rate were enhanced. The turbulence is enhanced by intensifying the vertical wind shear. The main findings are as follows:
-
For shallow, capped stratiform clouds in a quiescent wintertime environment, stronger turbulence can accelerate the seeding effect by enhancing AgI particle dispersion, ice nucleation, and ice growth through the WBF process, resulting in faster consumption of LWC and cloud glaciation in the SEED area, even though stronger turbulence also enhances the liquid water formation.
-
Once cloud glaciation is accelerated by stronger turbulence, the precipitation rate can be enhanced within a short time after seeding is performed, but the downwind precipitation may decline, causing a “robbing Peter to pay Paul” effect. Such a transition from a positive to a negative seeding effect is more substantial for a higher AgI release rate.
-
It is the competition among liquid condensation, mixing, and cloud glaciation that determines the downwind effect of glaciogenic cloud seeding. For the shallow cloud presented in this paper, neither the liquid condensation nor the turbulent mixing can overcome the cloud glaciation intensification by turbulence.
Although this study is based on a case study analysis with limitations, the results provide non-negligible evidence that turbulence plays a vital role in the dynamical/microphysical chain of events associated with glaciogenic cloud seeding. However, to further understand the role of turbulence in natural and seeded clouds under different conditions, more observational and modeling studies are needed in the future. In addition, to better simulate natural and seeded clouds and precipitation in NWP models, further development of parameterizations capturing the impact of turbulence on ice initiation and other mixed-phase cloud processes is needed.
The WRF model is available at https://www2.mmm.ucar.edu/wrf/users/download/get_source.html (NCAR MMM, 2024). The sounding data, radar data, and satellite data are available at https://doi.org/10.5281/zenodo.14604420 (Yang, 2025).
MC, XJ, and JL conducted the numerical simulations. MC, XJ, and JY analyzed the observational and model results. MC, XJ, and JY prepared the paper. XD provided the data of radar measurements. BG, YY, BC, and XL provided inputs on the method and analysis. All the authors provided significant feedback on the paper.
The contact author has declared that none of the authors has any competing interests.
Publisher's note: Copernicus Publications remains neutral with regard to jurisdictional claims made in the text, published maps, institutional affiliations, or any other geographical representation in this paper. While Copernicus Publications makes every effort to include appropriate place names, the final responsibility lies with the authors.
The authors acknowledge the High Performance Computing Center of Nanjing University of Information Science & Technology for their support of this work, and we acknowledge the Xingtai Atmospheric Environment Field Scientific Test Base of CMA for collecting the data and for providing high-quality products. We appreciate the editor and reviewers for their insightful comments and suggestions.
This research has been supported by the National Key R&D Program of China (grant no. 2024YFF0811200), the National Natural Science Foundation of China (grant nos. 42475201 and 42230604), the Beijing Municipal Science and Technology Commission (grant no. Z221100005222016), and the CMA Key Innovation Team Support Project (grant no. CMA2022ZD10).
This paper was edited by Tak Yamaguchi and reviewed by three anonymous referees.
Bigg, E. K.: The formation of atmospheric ice crystals by the freezing of droplets, Q. J. Roy. Meteor. Soc., 79, 510–519, https://doi.org/10.1002/qj.49707934207, 1953.
Bruintjes, R. T.: A Review of Cloud Seeding Experiments to Enhance Precipitation and Some New Prospects, B. Am. Meteorol. Soc., 80, 805–820, https://doi.org/10.1175/1520-0477(1999)080<0805:AROCSE>2.0.CO;2, 1999.
Chen, J.-P. and Lamb, D.: The theoretical basis for the parameterization of ice crystal habits: Growth by vapor deposition, J. Atmos. Sci., 51, 1206–1222, https://doi.org/10.1175/1520-0469(1994)051<1206:TTBFTP>2.0.CO;2, 1994.
Chu, X., Xue, L., Geerts, B., and Kosović, B.: The impact of boundary layer turbulence on snow growth and precipitation: Idealized Large Eddy Simulations, Atmos. Res., 204, 54–66, https://doi.org/10.1016/j.atmosres.2018.01.015, 2018.
DeFelice, T., Golden, J., Griffith, D., Woodley, W., Rosenfeld, D., Breed, D., Solak, M., and Boe, B.: Extra area effects of cloud seeding – An updated assessment, Atmos. Res., 135, 193–203, https://doi.org/10.1016/j.atmosres.2013.08.014, 2014.
DeMott, P. J.: Quantitative descriptions of ice formation mechanisms of silver iodide-type aerosols, Atmos. Res., 38, 63–99, https://doi.org/10.1016/0169-8095(94)00088-U, 1995.
Deng, Y., Yang, J., Yin, Y., Cui, S., Zhang, B., Bao, X., Chen, B., Li, J., Gao, W., and Jing, X.: Quantifying the spatial inhomogeneity of ice concentration in mixed-phase stratiform cloud using airborne observation, Atmos. Res., 298, 107153, https://doi.org/10.1016/j.atmosres.2023.107153, 2024.
French, J. R., Friedrich, K., Tessendorf, S. A., Rauber, R. M., Geerts, B., Rasmussen, R. M., Xue, L., Kunkel, M. L., and Blestrud, D. R.: Precipitation formation from orographic cloud seeding, P. Natl. Acad. Sci. USA, 115, 1168–1173, https://doi.org/10.1073/pnas.1716995115, 2018.
Friedrich, K., Ikeda, K., Tessendorf, S. A., French, J. R., Rauber, R. M., Geerts, B., Xue, L., Rasmussen, R. M., Blestrud, D. R., Kunkel, M. L., Dawson, N., and Parkinson, S.: Quantifying snowfall from orographic cloud seeding, P. Natl. Acad. Sci. USA, 117, 5190–5195, https://doi.org/10.1073/pnas.1917204117, 2020.
Fukuta, N. and Takahashi, T.: The growth of atmospheric ice crystals: A summary of findings in vertical supercooled cloud tunnel studies, J. Atmos. Sci., 56, 1963–1979, https://doi.org/10.1175/1520-0469(1999)056<1963:TGOAIC>2.0.CO;2, 1999.
Geerts, B. and Rauber, R. M.: Glaciogenic Seeding of Cold-Season Orographic Clouds to Enhance Precipitation: Status and Prospects, B. Am. Meteorol. Soc., 103, E2302–E2314, https://doi.org/10.1175/BAMS-D-21-0279.1, 2022.
Geerts, B., Pokharel, B., Friedrich, K., Breed, D., Rasmussen, R., Yang, Y., Miao, Q., Haimov, S., Boe, B., and Lawrence, B.: The AgI Seeding Cloud Impact Investigation (ASCII) campaign 2012: overview and preliminary results, Journal of Weather Modification, 45, 24–43, https://doi.org/10.54782/jwm.v45i1.121, 2013.
Grasmick, C., Geerts, B., Chu, X., French, J. R., and Rauber, R. M.: Detailed Dual-Doppler Structure of Kelvin–Helmholtz Waves from an Airborne Profiling Radar over Complex Terrain. Part II: Evidence for Precipitation Enhancement from Observations and Modeling, J. Atmos. Sci., 78, 3455–3472, https://doi.org/10.1175/JAS-D-20-0392.1, 2021.
Grasmick, C., Geerts, B., French, J. R., Haimov, S., and Rauber, R. M.: Estimating Microphysics Properties in Ice-Dominated Clouds from Airborne Ka–W-band Dual-Wavelength Ratio Reflectivity Factor in Close Proximity to In Situ Probes, J. Atmos. Ocean. Tech., 39, 1815–1833, https://doi.org/10.1175/JTECH-D-21-0147.1, 2022.
Griffith, D. A., Solak, M. E., Almy, R. D., and Gibbs, D.: The Santa Barbara Cloud Seeding Project in Coastal Southern California, Summary of Results and Their Implications, Journal of Weather Modification, 37, 21–27, https://doi.org/10.54782/jwm.v37i1.221, 2005.
Harrington, J. Y., Moyle, A., Hanson, L. E., and Morrison, H.: On Calculating Deposition Coefficients and Aspect-Ratio Evolution in Approximate Models of Ice Crystal Vapor Growth, J. Atmos. Sci., 76, 1609–1625, https://doi.org/10.1175/JAS-D-18-0319.1, 2019.
Henneberger, J., Ramelli, F., Spirig, R., Omanovic, N., Miller, A. J., Fuchs, C., Zhang, H., Bühl, J., Hervo, M., Kanji, Z. A., Ohneiser, K., Radenz, M., Rösch, M., Seifert, P., and Lohmann, U.: Seeding of Supercooled Low Stratus Clouds with a UAV to Study Microphysical Ice Processes: An Introduction to the CLOUDLAB Project, B. Am. Meteorol. Soc., 104, E1962–E1979, https://doi.org/10.1175/BAMS-D-22-0178.1, 2023.
Hill, A. A., Field, P. R., Furtado, K., Korolev, A., and Shipway, B. J.: Mixed-phase clouds in a turbulent environment. Part 1: Large-eddy simulation experiments, Q. J. Roy. Meteor. Soc., 140, 855–869, https://doi.org/10.1002/qj.2177, 2014.
Houze Jr., R. A. and Medina, S.: Turbulence as a Mechanism for Orographic Precipitation Enhancement, J. Atmos. Sci., 62, 3599–3623, https://doi.org/10.1175/JAS3555.1, 2005.
Jiménez, P. A., Dudhia, J., González-Rouco, J. F., Navarro, J., Montávez, J. P., and García-Bustamante, E.: A Revised Scheme for the WRF Surface Layer Formulation, Mon. Weather Rev., 140, 898–918, https://doi.org/10.1175/MWR-D-11-00056.1, 2012.
Jing, X. and Geerts, B.: Dual-Polarization Radar Data Analysis of the Impact of Ground-Based Glaciogenic Seeding on Winter Orographic Clouds. Part II: Convective Clouds, J. Appl. Meteorol. Clim., 54, 2099–2117, https://doi.org/10.1175/JAMC-D-15-0056.1, 2015.
Jing, X., Geerts, B., Friedrich, K., and Pokharel, B.: Dual-Polarization Radar Data Analysis of the Impact of Ground-Based Glaciogenic Seeding on Winter Orographic Clouds. Part I: Mostly Stratiform Clouds, J. Appl. Meteorol. Clim., 54, 1944–1969, https://doi.org/10.1175/JAMC-D-14-0257.1, 2015.
Jing, X., Geerts, B., and Boe, B.: The Extra-Area Effect of Orographic Cloud Seeding: Observational Evidence of Precipitation Enhancement Downwind of the Target Mountain, J. Appl. Meteorol. Clim., 55, 1409–1424, https://doi.org/10.1175/JAMC-D-15-0188.1, 2016.
Khain, A., Pokrovsky, A., Pinsky, M., Seifert, A., and Phillips, V.: Simulation of Effects of Atmospheric Aerosols on Deep Turbulent Convective Clouds Using a Spectral Microphysics Mixed-Phase Cumulus Cloud Model. Part I: Model Description and Possible Applications, J. Atmos. Sci., 61, 2963–2982, https://doi.org/10.1175/JAS-3350.1, 2004.
Korolev, A. and Field, P. R.: The Effect of Dynamics on Mixed-Phase Clouds: Theoretical Considerations, J. Atmos. Sci., 65, 66–86, https://doi.org/10.1175/2007JAS2355.1, 2008.
Korolev, A. and Milbrandt, J.: How are mixed-phase clouds mixed?, Geophys. Res. Lett., 49, e2022GL099578, https://doi.org/10.1029/2022GL099578, 2022.
Korolev, A. V. and Mazin, I. P.: Supersaturation of Water Vapor in Clouds, J. Atmos. Sci., 60, 2957–2974, https://doi.org/10.1175/1520-0469(2003)060<2957:SOWVIC>2.0.CO;2, 2003.
Li, D., Zhao, C., Yue, Z., Liu, C., Sun, Y., and Cohen, J. B.: Response of cloud and precipitation properties to seeding at a supercooled cloud-top layer, Earth Space Sci., 9, e2021EA001791, https://doi.org/10.1029/2021EA001791, 2022.
Long, A. B.: Review of downwind extra-area effects of precipitation enhancement, Journal of Weather Modification, 33, 24–45, https://doi.org/10.54782/jwm.v33i1.237, 2001.
Lou, X., Fu, Y., and Su, Z.: Advances of silver iodide seeding agents for weather modification, J. Appl. Meteor. Sci., 32, 146–159, https://doi.org/10.11898/1001-7313.20210202, 2021.
Lutgens, F. K., Tarbuck, E. J., and Tasa, D.: The atmosphere: An introduction to meteorology, 10th edition, Prentis Hall, New York, ISBN 978-0131874626, 520 pp., 2006.
Mason, B. J.: The physics of clouds, 2nd edition, Clarendon Press, Oxford, UK, ISBN 978-0198516033, 686 pp., 1971.
Mazzetti, T., Geerts, B., and Xue, L.: A Numerical Evaluation of the Impact of Operational Ground-Based Glaciogenic Cloud Seeding on Precipitation over the Wind River Range, Wyoming, J. Appl. Meteorol. Clim., 62, 489–510, https://doi.org/10.1175/JAMC-D-22-0132.1, 2023.
Meyers, M. P., DeMott, P. J., and Cotton, W. R.: New Primary Ice–Nucleation Parameterizations in an Explicit Cloud Model, J. Appl. Meteorol., 31, 708–721, https://doi.org/10.1175/1520-0450(1992)031<0708:NPINPI>2.0.CO;2, 1992.
Mlawer, E. J., Taubman, S. J., Brown, P. D., Iacono, M. J., and Clough, S. A.: Radiative transfer for inhomogeneous atmospheres: RRTM, a validated correlated-k model for the longwave, J. Geophys. Res.-Atmos., 102, 16663–16682, https://doi.org/10.1016/j.jqsrt.2004.05.058, 1997.
Morrison, H., Boer, G. D., Feingold, G., Harrington, J. Y., Shupe, M. D., and Sulia, K. J.: Resilience of persistent Arctic mixed-phase clouds, Nat. Geosci., 5, 11–17, https://doi.org/10.1038/ngeo1332, 2012.
NCAR MMM: Weather Research & Forecasting Model (WRF), UCAR, https://www2.mmm.ucar.edu/wrf/users/download/get_source.html (last access: 2 July 2024), 2024.
Omanovic, N., Ferrachat, S., Fuchs, C., Henneberger, J., Miller, A. J., Ohneiser, K., Ramelli, F., Seifert, P., Spirig, R., Zhang, H., and Lohmann, U.: Evaluating the Wegener–Bergeron–Findeisen process in ICON in large-eddy mode with in situ observations from the CLOUDLAB project, Atmos. Chem. Phys., 24, 6825–6844, https://doi.org/10.5194/acp-24-6825-2024, 2024.
Pokharel, B., Geerts, B., Chu, X., and Bergmaier, P.: Profiling Radar Observations and Numerical Simulations of a Downslope Wind Storm and Rotor on the Lee of the Medicine Bow Mountains in Wyoming, Atmosphere, 8, 39, https://doi.org/10.3390/atmos8020039, 2017.
Pourghasemi, M. A., Memarian, M. H., and Zare, A.: Assessment of Possible Precipitation Enhancement by Glaciogenic Cloud Seeding Using WRF: A Case Study, Russ. Meteorol. Hydrol., 47, 553–560, https://doi.org/10.3103/S106837392207010X, 2022.
Rangno, A. and Hobbs, P.: Ice particles in stratiform clouds in the Arctic and possible mechanisms for the production of high ice concentrations, J. Geophys. Res., 106, 15065–15075, https://doi.org/10.1029/2000JD900286, 2001.
Rauber, R. M., Geerts, B., Xue, L., French, J., Friedrich, K., Rasmussen, R. M., Tessendorf, S. A., Blestrud, D. R., Kunkel, M. L., and Parkinson, S.: Wintertime Orographic Cloud Seeding–A Review, J. Appl. Meteorol. Clim., 58, 2117–2140, https://doi.org/10.1175/JAMC-D-18-0341.1, 2019.
Rogers, R. R. and Yau M. K.: A short course in cloud physics, 3rd edition, Pergammon Press, New York, ISBN 978-0750632157, 304 pp., 1989.
Sarnitsky, G., Sardina, G., Svensson, G., Pumir, A., Hoffmann, F., Mehlig, B.: Does small-scale turbulence matter for ice growth in mixed-phase clouds?, arXiv:2410.06724, https://doi.org/10.48550/arXiv.2410.06724, 2024.
Schaefer, V. J.: The formation of ice crystals in the laboratory and the atmosphere, Chem. Rev., 44, 291–320, https://doi.org/10.1021/cr60138a004, 1949.
Simpson, J., Brier, G. W., and Simpson, R. H.: Stormfury Cumulus Seeding Experiment 1965: Statistical Analysis and Main Results, J. Atmos. Sci., 24, 508–521, https://doi.org/10.1175/1520-0469(1967)024<0508:SCSESA>2.0.CO;2, 1967.
Solak, M. E., Yorty, D. P., and Griffith, D. A.: Estimations of downwind cloud seeding effects in utah, Journal of Weather Modification, 35, 52–58, https://doi.org/10.54782/jwm.v51i1.715, 2003.
Tan, I. and Storelvmo, T.: Sensitivity Study on the Influence of Cloud Microphysical Parameters on Mixed-Phase Cloud Thermodynamic Phase Partitioning in CAM5, J. Atmos. Sci., 73, 709–728, https://doi.org/10.1175/JAS-D-15-0152.1, 2016.
Tessendorf, S. A., French, J. R., Friedrich, K., Geerts, B., Rauber, R. M., Rasmussen, R. M., Xue, L., Ikeda, K., Blestrud, D. R., Kunkel, M. L., Parkinson, S., Snider, J. R., Aikins, J., Faber, S., Majewski, A., Grasmick, C., Bergmaier, P. T., Janiszeski, A., Springer, A., Weeks, C., Serke, D. J., and Bruintjes, R.: A Transformational Approach to Winter Orographic Weather Modification Research: The SNOWIE Project, B. Am. Meteorol. Soc., 100, 71–92, https://doi.org/10.1175/BAMS-D-17-0152.1, 2019.
Tewari, M., Chen, F., Wang, W., Dudhia, J., LeMone, M. A., Mitchell, K., Ek, M., Gayno, G., Wegiel, J., and Cuenca, R. H.: Implementation and verification of the unified NOAH land surface model in the WRF model, 20th Conference on Weather Analysis and Forecasting/16th Conference on Numerical Weather Prediction, 12–16 January 2004, Seattle, WA, USA, American Meteorological Society, 11–15, http://ams.confex.com/ams/84Annual/techprogram/paper_69061.htm (last access: 15 July 2025), 2004.
Wallace, J. M. and Hobbs, P. V.: Atmospheric science an introductory survey, Second edition, Elsevier Inc., New York, ISBN 978-0127329512, 504 pp., 2006.
Wang, J., Yue, Z., Rosenfeld, D., Zhang, L., Zhu, Y., Dai, J., Yu, X., and Li, J.: The evolution of an AgI cloud-seeding track in central China as seen by a combination of radar, satellite, and disdrometer observations, J. Geophys. Res.-Atmos., 126, e2020JD033914, https://doi.org/10.1029/2020JD033914, 2021.
Xue, L., Hashimoto, A., Murakami, M., Rasmussen, R., Tessendorf, S. A., Breed, D., Parkinson, S., Holbrook, P., and Blestrud, D.: Implementation of a Silver Iodide Cloud-Seeding Parameterization in WRF. Part I: Model Description and Idealized 2D Sensitivity Tests, J. Appl. Meteorol. Clim., 52, 1433–1457, https://doi.org/10.1175/JAMC-D-12-0148.1, 2013.
Xue, L., Chu, X., Rasmussen, R., Breed, D., Boe, B., and Geerts, B.: The Dispersion of Silver Iodide Particles from Ground-Based Generators over Complex Terrain. Part II: WRF Large-Eddy Simulations versus Observations, J. Appl. Meteorol. Clim., 53, 1342–1361, https://doi.org/10.1175/JAMC-D-13-0241.1, 2014.
Xue, L., Chu, X., Rasmussen, R., Breed, D., and Geerts, B.: A Case Study of Radar Observations and WRF LES Simulations of the Impact of Ground-Based Glaciogenic Seeding on Orographic Clouds and Precipitation. Part II: AgI Dispersion and Seeding Signals Simulated by WRF, J. Appl. Meteorol. Clim., 55, 445–464, https://doi.org/10.1175/JAMC-D-15-0115.1, 2016.
Xue, L., Weeks, C., Chen, S., Tessendorf, S. A., Rasmussen, R. M., Ikeda, K., Kosovic, B., Behringer, D., French, J. R., Friedrich, K., Zaremba, T. J., Rauber, R. M., Lackner, C. P., Geerts, B., Blestrud, D., Kunkel, M., Dawson, N., and Parkinson, S.: Comparison between Observed and Simulated AgI Seeding Impacts in a Well-Observed Case from the SNOWIE Field Program, J. Appl. Meteorol. Clim., 61, 345–367, https://doi.org/10.1175/JAMC-D-21-0103.1, 2022.
Yang, J.: Accelerated impact of airborne glaciogenic seeding of stratiform clouds by turbulence, Zenodo [data set], https://doi.org/10.5281/zenodo.14604420, 2025.
Yang, J., Qin, Z., Deng, Y., Chen, M., Jing, X., Yin, Y., Lu, C., Chen, B., Zhang, B., and Bao, X.: On the cluster scales of hydrometeors in mixed-phase stratiform clouds, Geophys. Res. Lett., 51, e2024GL108166, https://doi.org/10.1029/2024GL108166, 2024a.
Yang, J., Li, J., Chen, M., Jing, X., Yin, Y., Geerts, B., Wang, Z., Liu, Y., Chen, B., Hua, S., Hu, H., Dong, X., Tian, P., Chen, Q., and Gao, Y.: Estimating the concentration of silver iodide needed to detect unambiguous signatures of glaciogenic cloud seeding, Atmos. Chem. Phys., 24, 13833–13848, https://doi.org/10.5194/acp-24-13833-2024, 2024b.
Yue, Z., Yu, X., Liu, G., Wang, J., Dai, Jin., and Li, J.: Effect evaluation of an operational precipitation enhancement in cold clouds by aircraft, Acta Meteorol. Sin., 79, 853–863, https://doi.org/10.11676/qxxb2021.051, 2021.
Zaremba, T. J., Rauber, R. M., Girolamo, L. D., Loveridge, J. R., and McFarquhar, G. M.: On the Radar Detection of Cloud Seeding Effects in Wintertime Orographic Cloud Systems, J. Appl. Meteorol. Clim., 63, 27–45, https://doi.org/10.1175/JAMC-D-22-0154.1, 2024.