the Creative Commons Attribution 4.0 License.
the Creative Commons Attribution 4.0 License.
 | 18 Jul 2025
Aircraft observations of biomass burning pollutants in the equatorial lower stratosphere over the tropical western Pacific during boreal winter
Jasna V. Pittman
Bruce C. Daube
Steven C. Wofsy
Elliot L. Atlas
Maria A. Navarro
Eric J. Hintsa
Fred L. Moore
Geoff S. Dutton
James W. Elkins
Troy D. Thornberry
Andrew W. Rollins
Eric J. Jensen
Thaopaul Bui
Jonathan Dean-Day
Leonhard Pfister
Recent studies hypothesize that emissions from fires reaching the stratosphere can provide aerosols and aerosol precursors that initiate stratospheric ozone loss and lead to radiative heating of the stratosphere and cooling of the surface. Air from the troposphere enters the stratosphere primarily over the tropical western Pacific (TWP) during boreal winter. We report observations in the TWP of persistent, ubiquitous pollution in the tropical tropopause layer (TTL) and lower stratosphere (LS) during the Airborne Tropical TRopopause EXperiment (ATTREX) campaign in February–March 2014. We found carbon monoxide (CO) concentrations increased by up to 65 % above background levels in the deep tropics (5° S–15° N; 16–17 km). Correlations of CO with hydrocarbon and halocarbon species indicated a biomass burning source, with the largest CO increases in cloud-free air. Satellite observations did not detect the thin layers of CO observed by the aircraft and revealed Africa, Indonesia, and the western and central Pacific as geographical hot spots for CO in the TTL. Backward trajectories also identified convective encounters in these areas, highlighting delivery of biomass burning pollutants to the TWP by both nearby and remote convection. Contributions from Africa and Indonesia were nearly 60 %, with transport timescales of 10 d to several weeks. Our study confirms that air in the TTL over the TWP is affected by emissions from distant fires that can rapidly reach the tropical LS, the principal source region for air entering the global stratosphere, supporting the view that fires in tropical regions can impact stratospheric composition and temperature.
- Article
(7653 KB) - Full-text XML
-
Supplement
(2690 KB) - BibTeX
- EndNote


Emissions of long-lived ozone (O3)-depleting substances (ODSs) of anthropogenic origin, such as chlorofluorocarbons (CFCs) and hydrochlorofluorocarbons (HCFCs), have contributed to significant thinning of the stratospheric O3 layer via chlorine- and bromine-based chemistry (Solomon, 1999; Fahey et al., 2018, and references therein). Banning the production and emission of ODSs has helped reverse stratospheric O3 loss, with a current forecast for recovery to 1980 stratospheric O3 levels over the next 4 decades (Fahey et al., 2018; Amos et al., 2020).
In addition to the longer-lived CFCs and HCFCs, ODSs include halogenated very short lived substances (VSLSs). These compounds have atmospheric lifetimes of less than 6 months, which limit their buildup in the atmosphere. Fast transport via deep overshooting convection could provide a mechanism for rapid injection of these VSLSs into the stratosphere, enhancing the impact on stratospheric O3 (Koenig et al., 2017; Oram et al., 2017; Wales et al., 2018; Filus et al., 2020; Tegtmeier et al., 2020; Treadaway et al., 2022). The impact of halogenated VSLSs on the recovery of the stratospheric O3 layer is uncertain and a matter of concern because their emissions are unregulated and have continued to increase over time (Hossaini et al., 2017; Oram et al., 2017).
Recent studies have identified another mechanism for initiating stratospheric O3 loss that could potentially threaten the recovery of the O3 layer (Bernath et al., 2022; Solomon et al., 2022, 2023): increasing aerosols from wildfires. These studies were motivated by recent observations of stratospheric injection of smoke from wildfires at various extratropical latitudes (e.g., Torres et al., 2020; Khaykin et al., 2020). Aerosols induce stratospheric O3 loss, mainly over polar latitudes, at very cold temperatures, involving condensed water vapor (H2O), sulfate aerosols, nitric acid, halogens from ODSs or VSLSs, and solar ultraviolet (UV) radiation. Aerosols from wildfires may contribute to not only an increase in sulfates, but also an increase in both primary and secondary organic aerosols that can take up hydrochloric acid, enabling chlorine activation to occur at warmer temperatures (Solomon et al., 2023). While still requiring halogens, the addition of wildfire aerosols to the stratosphere provides a new mechanism that could lead to more widespread stratospheric O3 destruction that is no longer concentrated over polar latitudes during cold springtime conditions. As surface temperatures have risen, so have the frequency and intensity of fire weather throughout the world (Jones et al., 2022). Therefore, wildfire aerosols and aerosol precursors injected into the stratosphere could impede the recovery of stratospheric O3 as CFC concentrations decline.
Direct injection of smoke and biomass burning products into the lower stratosphere (LS) has previously been reported in the extratropics (Jost et al., 2004; Cammas et al., 2009; Hooghiem et al., 2020; Peterson et al., 2021; Katich et al., 2023). At these higher latitudes, the descending motion of the Brewer–Dobson circulation dominates, limiting transport into the global stratosphere (Holton et al., 1995). In the tropics, products of seasonal biomass burning have frequently been observed in the upper troposphere (UT), as evidenced by elevated carbon monoxide (CO) (e.g., aircraft measurements – Ashfold et al., 2015; Anderson et al., 2016; Cussac et al., 2020; Lannuque et al., 2021; satellite observations – Schoeberl et al., 2006; Huang et al., 2012) and by a distinct mixture of trace gases and aerosols (Blake et al., 1996; Mauzerall et al., 1998; Andreae and Merlet, 2001; Gkatzelis et al., 2024). Although they are persistent features in the UT, these pollution events have not been reported in the higher-altitude tropical LS, in part due to limited in situ sampling capabilities (Duncan et al., 2007; Rossow and Pearl, 2007).
Most air reaches the tropical stratosphere through the tropical tropopause layer (TTL), a region ∼ 4.5 km in depth, with a bottom at ∼ 14 km (Fueglistaler et al., 2009). The TTL serves as the transition region from the convectively driven UT to the radiatively dominated LS. Ascent rates throughout this transition layer are season dependent, with the fastest ascent into the tropical LS occurring during boreal winter (Fueglistaler et al., 2004; Park et al., 2010; Bergman et al., 2012). Reaching the high altitudes of the TTL requires strong convective lofting, which preferentially occurs over the longitudes of the deepest convection, namely the tropical western Pacific (TWP), the Indian Ocean, Africa, and South America (Alcala and Dessler, 2002; Gettelman et al., 2002a; Fueglistaler et al., 2004; Bergman et al., 2012; Jensen et al., 2015). Within these geographical regions, satellite observations show that the strongest and deepest convection occurs over the TWP during boreal winter (Gettelman et al., 2002a), making these longitudes a preferential entry point into the tropical stratosphere.
The present study examines the Airborne Tropical TRopopause EXperiment (ATTREX) dataset, which extensively profiled the TTL and the LS over the TWP during boreal winter. We investigate multiple trace gases of pollution origin, which we argue represent the influx of recent biomass burning products directly into the critical region for transport into the global stratosphere, the TTL and LS over the TWP. We complement analysis of the aircraft dataset with satellite observations and backward trajectories to address three science questions. (i) Does pollution from biomass fires reach and measurably affect the composition of the TTL and LS over the TWP, the main gateway to the global stratosphere during boreal winter? (ii) What chemical trace gases are being brought by this pollution that could impact stratospheric aerosols and O3? (iii) What are the characteristics of the transport processes involved (i.e., geographical origin, transport pathways, and transport timescales)?
This paper is structured as follows. Section 2 provides a description of the aircraft campaign, in situ measurements, satellite observations, and trajectory calculations. Section 3 characterizes the pollution plumes by exploring locations within the TTL, chemical composition, spatial and temporal context within the satellite record, geographic origin, transport pathways, and transit timescales to the TWP. Section 4 summarizes the conclusions of our study.
2.1 Aircraft campaign
The ATTREX campaign was one of NASA's Earth Venture Suborbital-1 investigations. This 5-year project focused on studying physical and chemical processes in the TTL, such as dehydration mechanisms, cloud formation, rates and pathways of vertical transport into the stratosphere, and the effects of tropical waves and deep convection on chemical composition (Jensen et al., 2017a). A payload consisting of 12 instruments that measured chemical trace gases, cloud properties, radiative fluxes, and meteorological conditions was installed on the remotely piloted NASA Global Hawk aircraft. No aerosol measurements were made during this campaign. The sampling strategy consisted of long-duration flights (18 to 24 h each) continuously profiling the depth of the TTL (∼ 14–19 km, 350–430 K, 150–70 hPa), reaching higher altitudes as the flight progressed. Measurements were made during two field deployments in the boreal winters of 2013 and 2014. The 2013 flights were based out of the Edwards Air Force Base, CA (34.92° N, 117.89° W), and sampled the TTL over the central and eastern Pacific in February–March 2013 (ATTREX-2). The 2014 flights were based out of Guam (13.39° N, 144.66° E) and sampled the TTL over the western Pacific in February–March 2014 (ATTREX-3). The full ATTREX dataset provides over 280 flight hours and over 300 vertical profiles in the TTL, covering a wide area of the Pacific Ocean: from 130 to 270° E in longitude and across the Equator from 12° S to 35° N. This study focuses on a subset of the ATTREX dataset, namely the deep tropics, between 12° S and 15° N over the western Pacific (ATTREX-3). The geographical coverage of all ATTREX science flights is shown in Fig. 1.
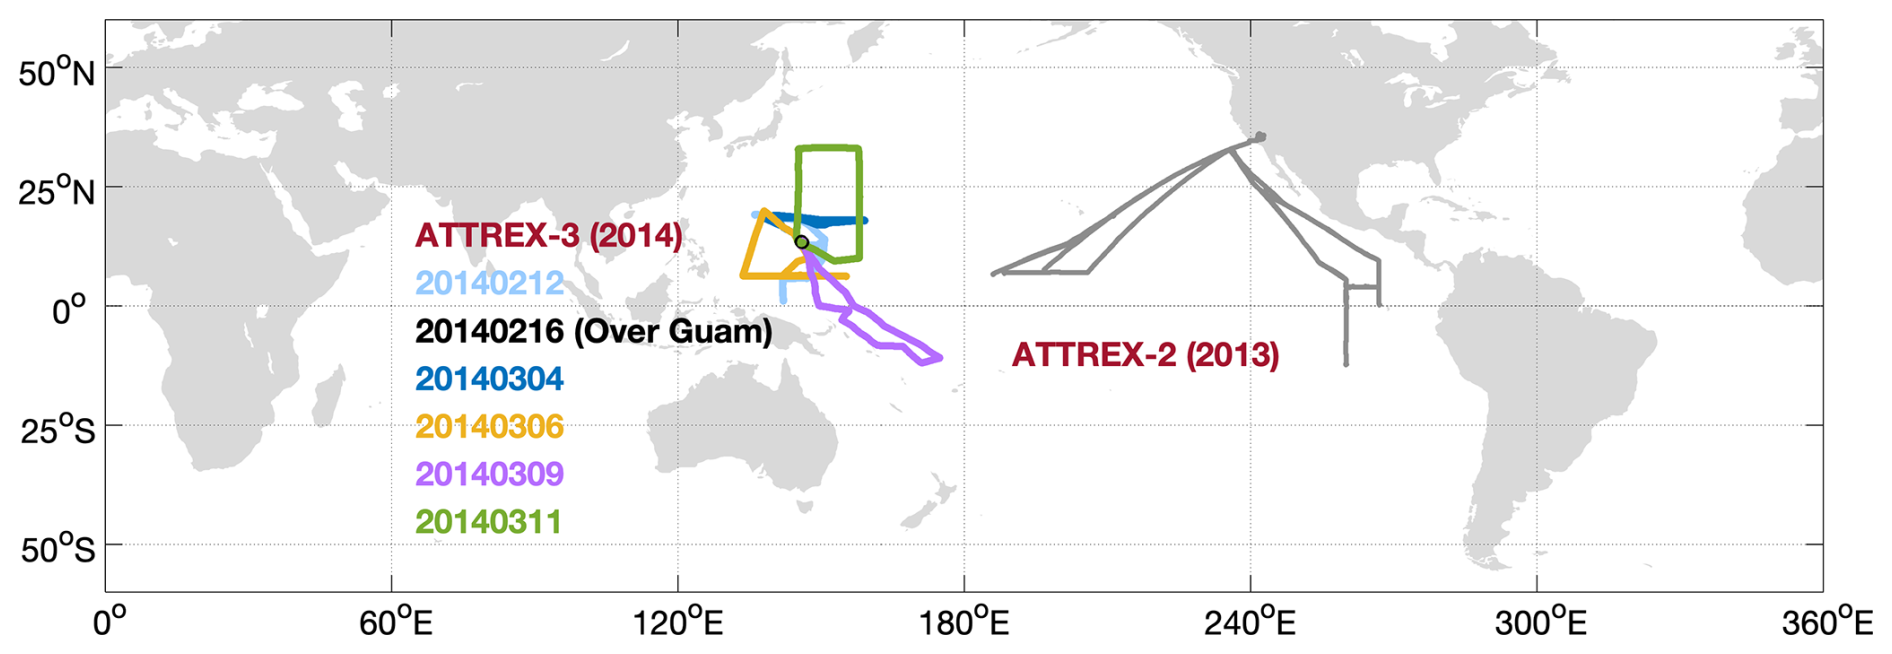
Figure 1NASA Global Hawk science flights during ATTREX-2 (eastern and central Pacific, February–March 2013) and ATTREX-3 (western Pacific, February–March 2014). Dates are given in the figure as YYYYMMDD.
2.2 Aircraft measurements
2.2.1 HUPCRS
In situ measurements of carbon dioxide (CO2), methane (CH4), and CO were obtained by the Harvard University Picarro Cavity Ringdown Spectrometer (HUPCRS). The instrument was designed and built for autonomous operation on aircraft sampling in the UT/LS region during the ATTREX campaign. It consists of a G2401-m Picarro gas analyzer (Picarro Inc., Santa Clara, CA, USA) repackaged in a temperature-controlled pressure vessel, a separate calibration system with two multi-species gas standards, and an external pump and pressure control assembly designed to allow operation at a wide range of altitudes. The Picarro analyzer uses wavelength-scanned cavity ringdown spectroscopy technology (Crosson, 2008; Rella et al., 2013; Chen et al., 2013) to individually measure and report each trace gas within a ∼ 2.2 s cycle.
The HUPCRS dataset consists of CO2 and CH4 for ATTREX-2 and CO2, CH4, and CO for ATTREX-3. Data are reported every 10 s. Precision during flights was ±0.2 parts per million by volume (ppmv) for CO2 and ±0.30 parts per billion by volume (ppbv) for CH4 during ATTREX-2 and ±0.02 ppmv for CO2, ±0.20 ppbv for CH4, and ±2.5 ppbv for CO during ATTREX-3. See the Supplement Sect. S1 for a more detailed description of the HUPCRS flight operation, instrument schematics (Fig. S1 in the Supplement), and in-flight performance (Figs. S2 and S3).
2.2.2 UCATS
In situ measurements of O3 were obtained by the Unmanned Aircraft Systems (UAS) Chromatograph for Atmospheric Trace Species (UCATS) package that contains a model 205 UV photometer from 2B Technologies (Boulder, CO) (Hintsa et al., 2021). The detection technique is based on direct absorption of 254 nm light, following Beer–Lambert's law. The instrument is a dual-beam photometer that measures the ratio of light intensity between ambient air (no O3 removed) and ambient air that is scrubbed (O3 removed by manganese-dioxide-coated screens). Scrubbed and unscrubbed air alternatively passes through each cell as a solenoid valve switches the flow paths every 2 s. Data are reported every 10 s with a precision of 5–10 ppbv. In ATTREX-3, UCATS flew two model 205 instruments and reported the average of the two instruments to improve precision.
2.2.3 GWAS
A wide range of hydrocarbons and halogenated compounds were measured by the Global Hawk Whole Air Sampler (GWAS). GWAS consists of a set of stainless-steel canisters filled with ambient air along the flight, with fill times ranging from 30 s at 14 km to 90 s at 19 km. Each canister is pressurized to ∼ 2500–3500 hPa (40–50 psia) and analyzed in the laboratory, typically within 2 to 3 weeks from collection time, using a multi-channel GC/MS/FID/ECD system (Agilent 7890 GC, 5973 MS) (Andrews et al., 2016; Schauffler et al., 1999). A set of 90 canisters was used per flight. Due to aircraft power limitations, GWAS pumps had to be turned off during descents, so sample collection took place during ascents only. GWAS reports numerous compounds, including chlorofluorocarbons, hydrochlorofluorocarbons, halocarbons, hydrocarbons, and halogenated VSLSs. The present analysis focuses on GWAS trace gases with a wide range of atmospheric lifetimes (from a few days to decades) and source origins (e.g., combustion, industrial emissions, marine emissions, VSLS production). The trace gases include ethane (C2H6), ethyne (C2H2), propane (C3H8), n-butane (C4H10), benzene (C6H6), methyl chloride (CH3Cl), tetrachloroethylene (C2Cl4), methyl iodide (CH3I), bromoform (CHBr3), dibromomethane (CH2Br2), chloroform (CHCl3), and dichloromethane (CH2Cl2).
2.2.4 NOAA water
In situ measurements of water vapor and total water were obtained by the NOAA hygrometer. The instrument is a two-channel, tunable diode laser absorption spectrometer that utilizes cells that are under constant pressure, temperature, and flow conditions (Thornberry et al., 2015). One channel measures water vapor from ambient air, while the other channel measures total water from a heated forward-facing inlet, which in the presence of clouds includes ambient water vapor and additional water evaporated from cloud particles. The instrument also carries an onboard calibration system that performs periodic checks on instrument stability and performance during flight. Precision during flight was better than 0.17 ppmv (1 s, 1σ), and uncertainties were 5 % ±0.23 ppmv for water vapor and 20 % for ice water content.
2.2.5 MMS
Ambient physical, geophysical, and thermal parameters along the flight were measured in situ by the Meteorological Measurement System (MMS), including pressure, temperature, and three-dimensional winds, which are calibrated and corrected for aircraft orientation (Scott et al., 1990). MMS has an integrated global positioning system (GPS), the LN100g INS, which provides aircraft GPS altitude, latitude, and longitude. Data are reported at a rate of 1 Hz and with a precision of 0.3 hPa for pressure and 0.3 K for temperature. Potential temperature is calculated from MMS pressure and temperature.
Identification and characterization of the tropopause are done using MMS vertical profiles of temperature. We calculate the lapse rate tropopause (LRT) based on the World Meteorological Organization's definition of the lowest level where the lapse rate decreases to 2 K km−1 or less and remains less than 2 K km−1 in a 2 km layer above this level. We also identify the cold point tropopause (CPT) as the altitude of the minimum temperature within the sampled vertical profile, provided that measurements below and above this altitude were obtained. Given the high altitude of the CPT in the tropics, the flight strategy, and aircraft limitations, the CPT was not reachable until later in each flight.
2.3 Satellite observations
The Microwave Limb Sounder (MLS) was launched on the NASA Aura satellite on 15 July 2004. The instrument measures thermal microwave radiation emitted from the limb of Earth's atmosphere, forward along the satellite's flight direction. It provides global coverage from 82° N to 82° S with an Equator crossing time of 13:30 local time. We use the CO product retrieved from dual bands in the MLS 240 GHz radiometer (Livesey et al., 2008). We focus on the 100 hPa level, which has a horizontal resolution of 4.5 km (cross path) by 450 km (along path) and a vertical resolution of ∼ 4.9 km. We use daily V005 L2GP data following the data-screening procedure described in the version 5.0x data quality document. The resulting CO product has a reported accuracy of ±19 ppbv and ±30 % and precision of 14 ppbv. We examine data from the middle of February to the middle of March (day of year 40 to 70), covering the period between 2010 and 2020.
2.4 Backward trajectories
ATTREX gas-phase in situ data are complemented with backward-trajectory calculations to investigate the geographical origin of air and transport characteristics of air in the TTL over the TWP. The trajectory method used in this study is described in Pfister et al. (2001), Bergman et al. (2012), and Jensen et al. (2017b). Trajectories were driven by ERA Interim temperature and wind fields, with resolutions of 6 h, ∼ 1 km in the vertical in the TTL region, and 0.75° in the horizontal, and were advected 40 d backward in time. The trajectories were run on isentropic coordinates using monthly diabatic heating rates derived from cloud observations in 2007 (Yang et al., 2010). Single-trajectory calculations in the TTL can diverge from actual air mass paths within 1 to 2 weeks (Podglajen et al., 2014; Bergman et al., 2016). Here we use an ensemble of trajectories to provide a more robust statistical analysis, initializing a cluster of 25 parcels centered at the aircraft location at 2 min intervals along the track. The cluster was set up as a curtain perpendicular to the flight track with five heights and five trajectories at each height, separated from each other within 0.5° in both latitude and longitude. In this study, we focus on trajectories initialized at aircraft altitudes only.
Once computed, trajectory temperatures were compared to 3-hourly geostationary satellite infrared brightness temperature and precipitation fields. Each trajectory was tagged as convectively influenced when satellite fields coincident in space and time showed a precipitating cloud top to be at a higher altitude (lower temperature) than the parcel (Pfister et al., 2022). Trajectories considered in this study were truncated at the convective encounter closest in time to the flight date, when parcel and cloud top height comparison criteria were met.
In this section, we examine the chemical composition and origin of unexpected plumes encountered over the TWP during ATTREX-3. We first examine high-frequency measurements obtained from the HUPCRS and UCATS instruments. The carbon-based trace gases CO2, CH4, and CO provide clear evidence of persistent pollution plumes in and above the TTL over the TWP, characterized by enhancements over background levels. We further explore the composition of these plumes by examining lower-frequency data obtained from the GWAS sample analysis. We then examine the humidity environment in and around these plumes. The large-scale context of these plumes is explored using spaceborne data from the MLS instrument. Lastly, we analyze results from backward-trajectory calculations to elucidate the origin and transport characteristics of these plumes.
3.1 In situ trace gas distributions in the TTL
Extensive high-resolution vertical sampling of the TTL was achieved with the NASA Global Hawk aircraft during the ATTREX campaign. The maximum latitudinal extent was covered over a 1-week period with four flights, approximately 24 h long each, in March 2014. Vertical profiles of CO2, CH4, CO, and O3 between 14 and 18.5 km in the deep tropics (12° S–15° N) over the western Pacific during these March flights are shown in Figs. 2 and 3. We use GPS altitude as the vertical coordinate to evaluate trace gas mixing ratios and temperature changes over time. Multiple surfaces of relevance are also shown in these two figures: the LRT and CPT in Figs. 2 and 3 and the 100 hPa isobar and 380 K isentrope in Fig. 3. These surfaces are derived from in situ measurements of ambient temperature, pressure, and GPS altitude. They are commonly used in TTL studies to identify and evaluate chemical, radiative, and dynamic processes that link the tropical UT and LS and directly impact global stratospheric composition (e.g., Randel and Jensen, 2013; Pan et al., 2018). Figure 2 focuses on the magnitude of the mixing ratio variability and the altitude range (minimum and maximum) of the LRT and CPT over all latitudes analyzed. Figure 3 elucidates the spatial distribution of the mixing ratio variability seen in Fig. 2 but in the context of latitude-specific altitudes for all four surfaces mentioned above.
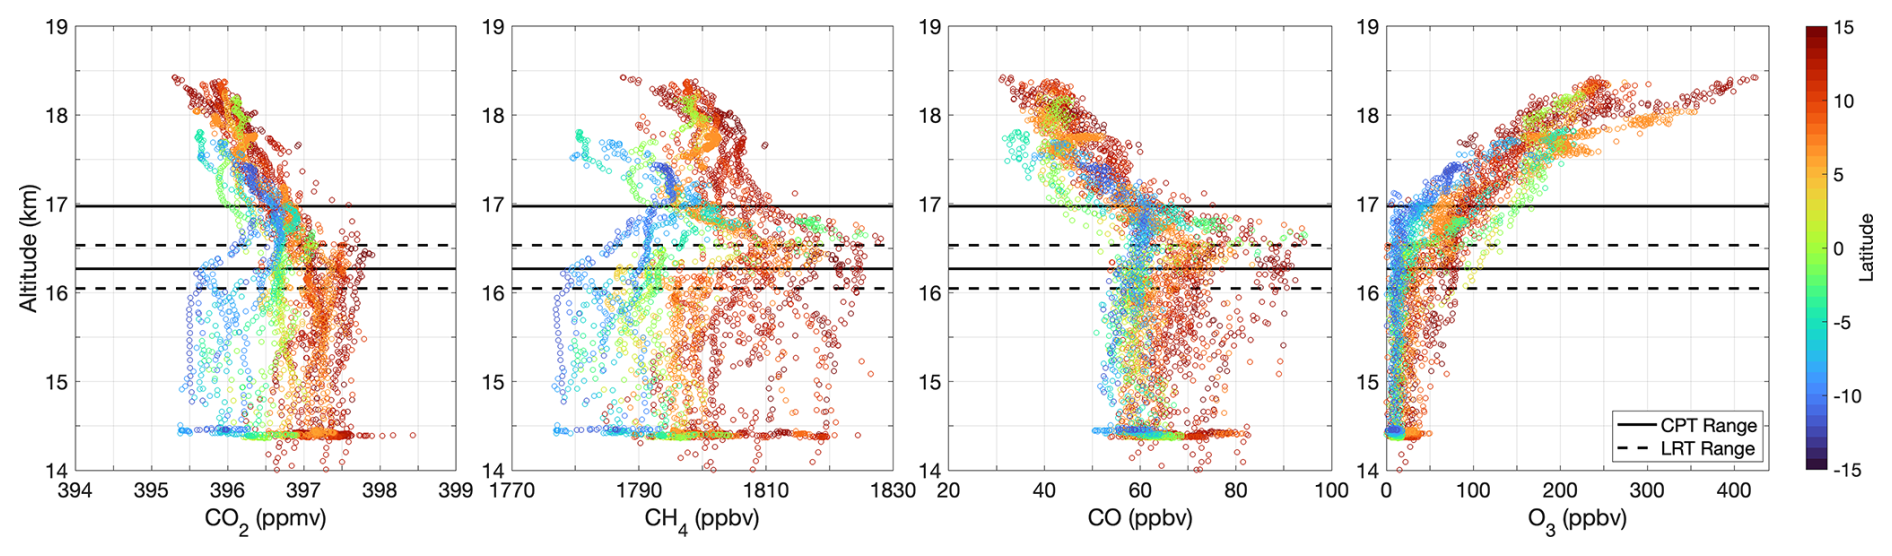
Figure 2ATTREX-3 vertical profiles of CO2, CH4, CO, and O3 in the deep tropics (12° S–15° N) over the western Pacific in March 2014 as a function of GPS altitude. Data are color-coded by latitude of sampling. Minimum and maximum lapse rate tropopause (LRT) heights (dashed lines) and cold point tropopause (CPT) heights (solid lines) are also shown.
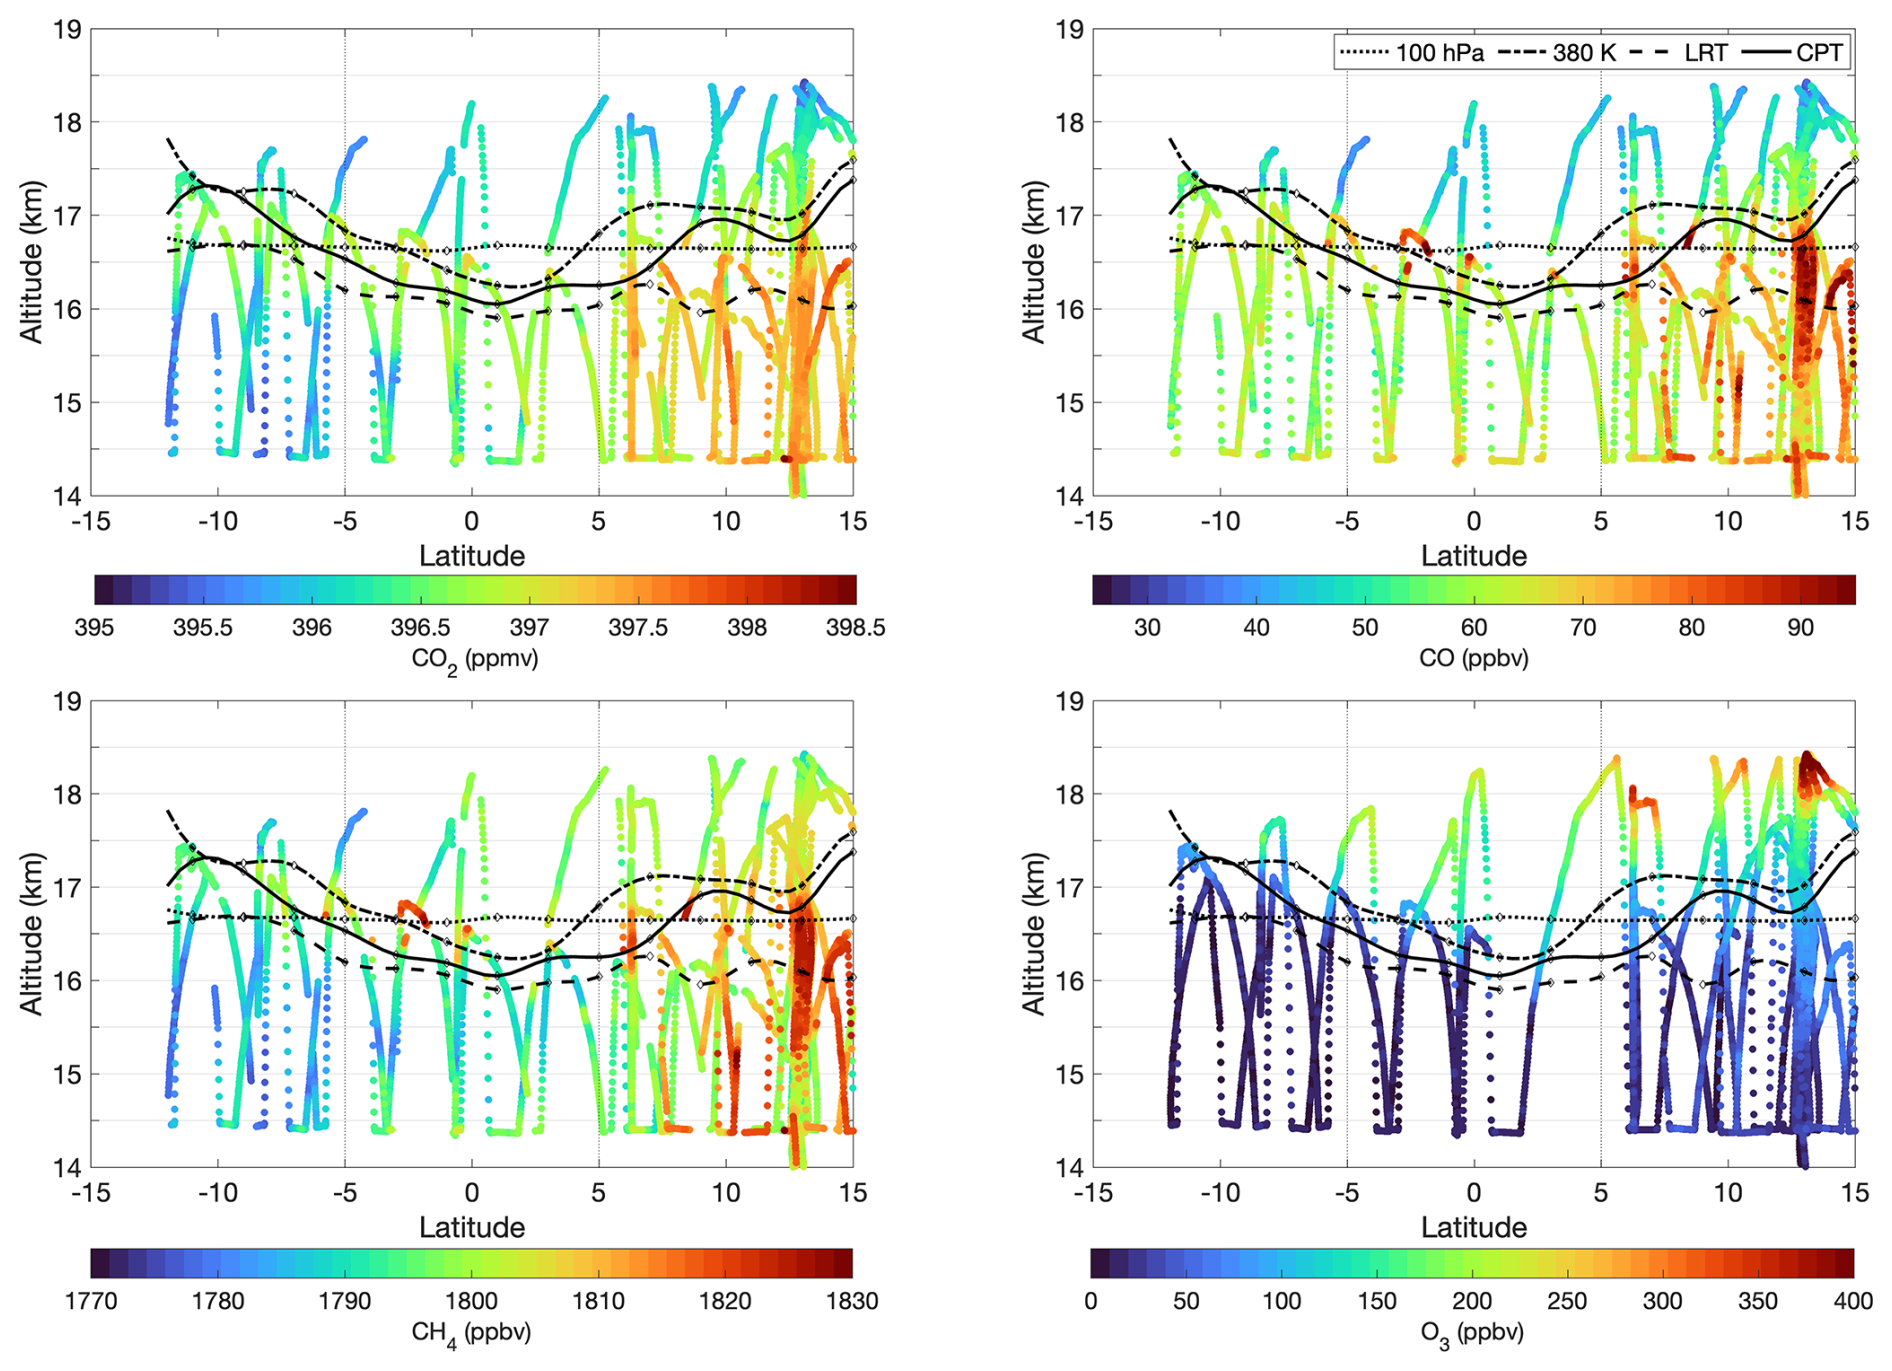
Figure 3Latitude distribution of CO2, CH4, CO, and O3 in the deep tropics (12° S–15° N) over the western Pacific in March 2014 during ATTREX-3. Vertical coordinate is GPS altitude. Data are color-coded by trace gas mixing ratios. The black lines correspond to the lapse rate tropopause (LRT), cold point tropopause (CPT), 100 hPa isobar, and 380 K isentrope determined by in situ measurements of ambient temperature, pressure, and GPS altitude.
Several notable features stand out in the spatial distribution of these trace gases, namely (i) large trace gas variability within the 4 km layer sampled in the TTL and LS, (ii) interhemispheric gradients, and (iii) spatially coherent enhancements in all carbon-based trace gases up to 17 km in altitude.
The observed variability in mixing ratios provide evidence of the changing dynamic regimes as a function of altitude. The nearly constant mixing ratios between 14.5 km and the LRT seen in Fig. 2 are consistent with convection rapidly lofting air to these altitudes. Above the CPT, the observed decreases in mixing ratios with increasing altitudes for CH4 and CO are primarily driven by reaction with OH radicals. At these altitudes and low latitudes, most of the air ascends into the tropical stratosphere as part of the global-scale Brewer–Dobson circulation but at rates slower than the chemical reaction rates, giving rise to the observed profiles. These low-stratospheric altitudes in the deep tropics can also be influenced by equatorward transport and mixing in of older air. These processes would contribute to decreases in CH4 and CO mixing ratios by bringing in chemically processed air with even lower CH4 and CO. The contribution from these processes could be evaluated by examining additional trace gases such as O3. Coincident measurements of O3 show a steep increase above the CPT, driven by favorable conditions for fast photochemical production in the TLS. Equatorward transport of older air would be evident as departures from tropical mixing ratios, namely increases in O3 and decreases in CH4 and CO. The ATTREX-3 observations suggest a negligible contribution from this transport process, certainly at the altitudes of the pollution plumes of interest where O3 mixing ratios remained below 100 ppbv, a threshold commonly used to separate tropospheric air from stratospheric air in the tropics (Folkins, 2002). For CO2, the variability as a function of altitude is dominated by a combination of seasonal processes in the biosphere (photosynthesis and respiration), secular increases over time (e.g., Park et al., 2010), and a contribution from oxidation of CH4 at higher altitudes. In between the LRT and the CPT, various physical and chemical processes are at play (Pan et al., 2018; Pan et al., 2019).
The interhemispheric gradients observed in Figs. 2 and 3 are mainly driven by emissions at the surface. The carbon-based trace gases have strong anthropogenic and natural sources. Emissions of CO2 are driven by year-round fossil fuel consumption and seasonal modulations by the biosphere. Emissions of CH4 are driven by natural wetlands, as well as the oil and gas industry, agricultural activities, landfills, and combustion. Emissions of CO are driven by biomass burning, incomplete combustion, and oxidation of CH4 and other hydrocarbons (HCs). For O3, the main driver is photochemical production from precursor gases, such as nitrogen oxides and volatile organic compounds, emitted by anthropogenic activity. These activities vary widely between hemispheres; therefore, it is not surprising that the surface air convectively lofted to the TTL reflects such differences. Multiple measurements (ground based, airborne, and spaceborne) have documented interhemispheric gradients of these trace gases at the surface and in the troposphere (Wofsy and HIPPO Science Team and Cooperating Modellers and Satellite Teams, 2011; Rigby et al., 2017; Newton et al., 2018; Martínez-Alonso et al., 2020). The ATTREX-3 data shown in Figs. 2 and 3, however, provide new evidence that these gradients are carried aloft into the TTL and even into the LS in the TWP, albeit attenuated in magnitude.
In addition to interhemispheric differences, distinct departures from background conditions were observed throughout the TTL over the TWP. These departures were spatially coherent, especially the enhancements in CH4 and CO. They were observed both below the LRT and into the LS and as far south as 5° S, as seen in Fig. 3. Unlike the carbon-based trace gases, O3 mixing ratios in the UT and LS fall within distinct ranges, as evident in Fig. 2. Below 17 km, the highest O3 mixing ratios sampled, around 150 ppbv, were found within 5° in latitude from the Equator. Figure 3 shows that this elevated O3 was associated with stratospheric air, where the CPT and the 380 K isentrope, an isentrope associated with the lowest boundary for the stratosphere at all latitudes, were at their lowest GPS altitudes. In the absence of other sources of air, these stratospheric air masses would have lower CH4 and CO concentrations than the air at lower altitudes in the vertical column; however, the ATTREX-3 measurements revealed the opposite. We see the classic C-shaped profile associated with convective transport of pollution into the UT at other latitudes, as shown in Fig. 2, but at these equatorial latitudes we actually observe excess pollutants in the LS.
Figure 4 examines vertical profiles of CO on a flight-by-flight basis, covering the period between 12 February 2014 and 11 March 2014. Data are color-coded by latitude of sampling. CO mixing ratios show a maximum above 16 km in most flights, as well as variability as a function of latitude and time. In February, higher CO was encountered throughout the TTL closer to the Equator (e.g., 12 February 2014). In March, more homogeneity within each hemisphere was observed with distinct mixing ratio regimes across the Equator during the southern survey flight on 9 March 2014. The largest CO enhancements were encountered during this flight, with enhancement ratios over lower TTL mixing ratios of up to 55 % for data between 5 and 15° N and 65 % for data 5° from the Equator. During the 11 March 2014 flight, a difference of nearly 30 ppbv was evident in the 16–17 km layer sampled by the aircraft. This difference is driven by longitude of sampling (see Fig. 1), with the higher mixing ratios encountered on the westernmost leg, suggesting air masses of different origins being advected by different flow patterns. Overall, the observation of persistently polluted layers during the period of aircraft sampling indicates that sources of elevated CO reached the TTL and did so repeatedly. Given our interest in understanding what enters the LS over the TWP, our analysis focuses on the 16–17 km layer, where LRT and CPT surfaces were frequently found.
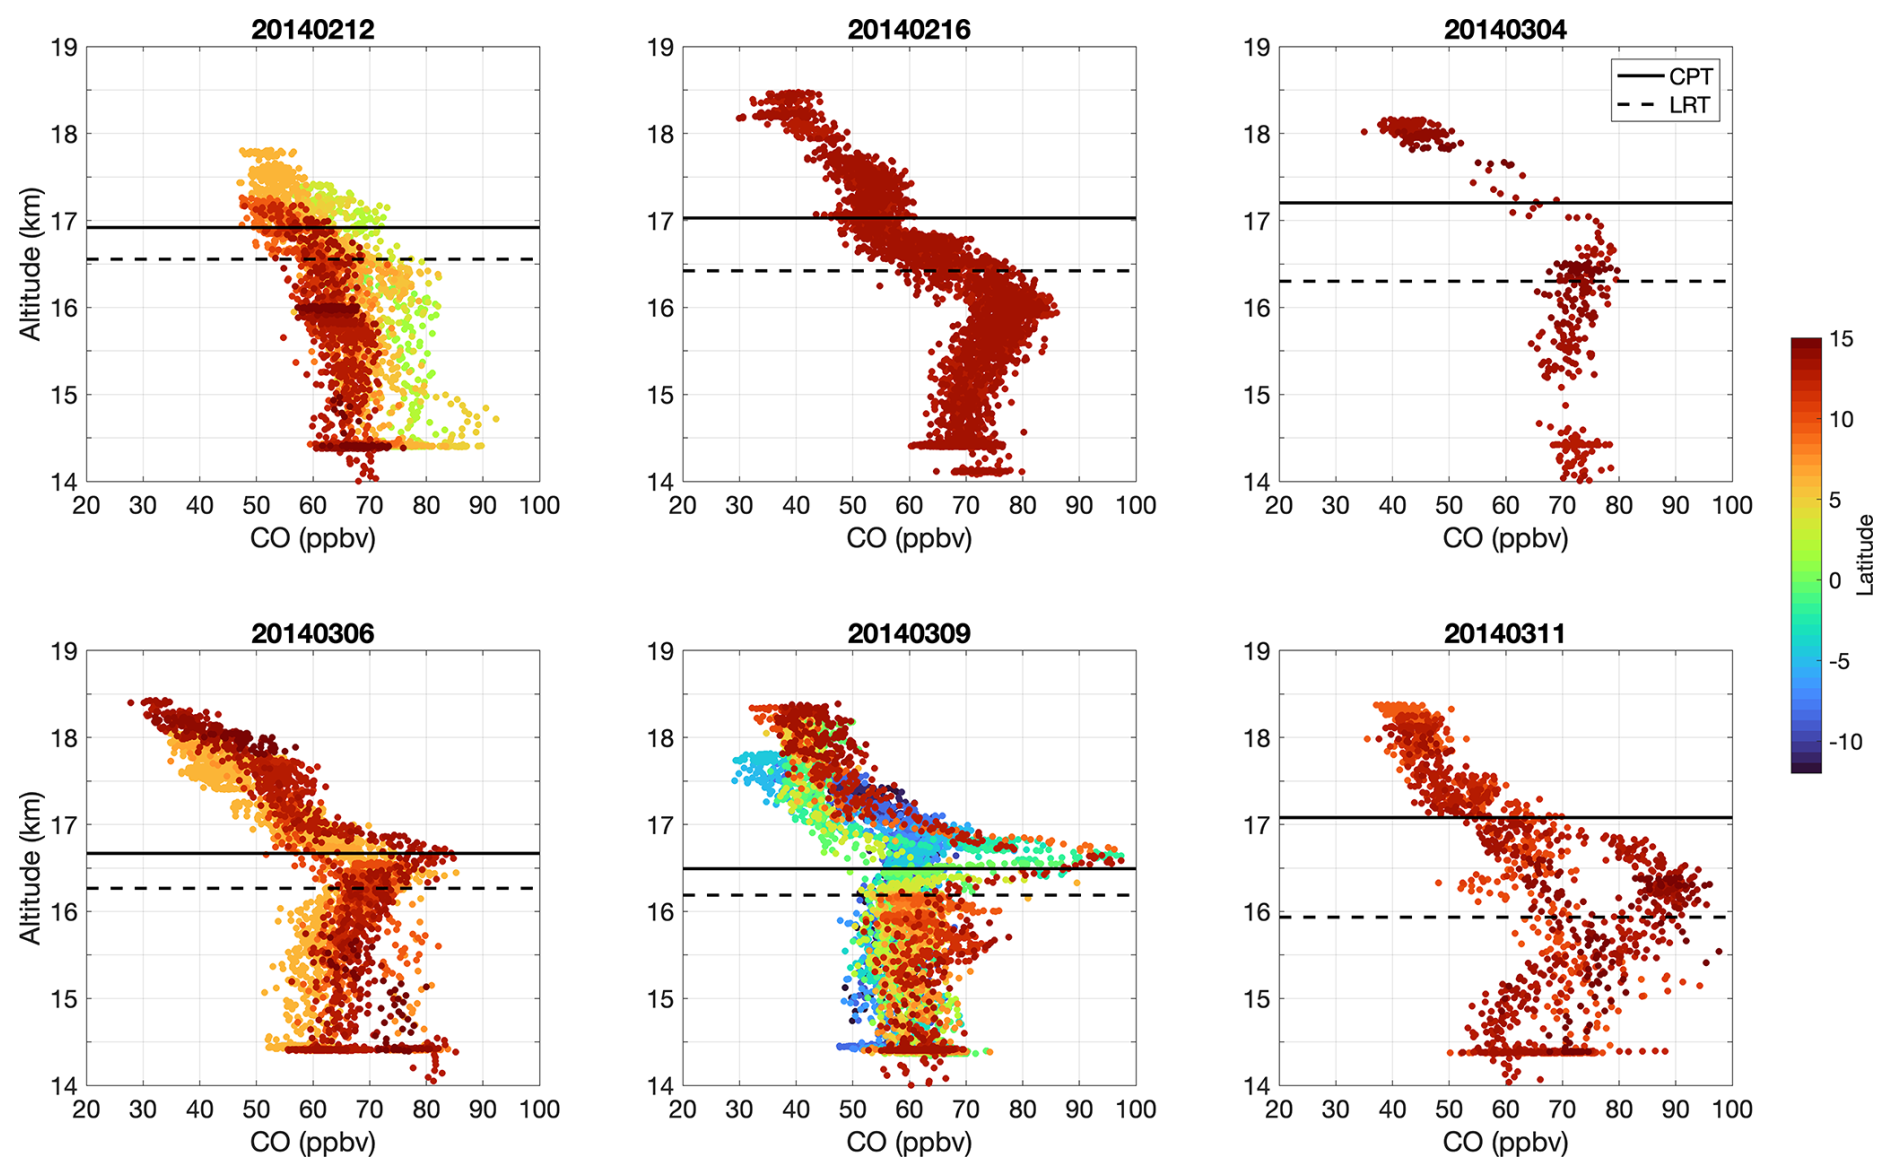
Figure 4ATTREX-3 vertical profiles of CO in the deep tropics (12° S–15° N) over the western Pacific in February and March 2014 as a function of GPS altitude. Each panel corresponds to an individual research flight with data color-coded by latitude of sampling. Also shown are the flight average cold point tropopause (CPT; solid line) and lapse rate tropopause (LRT; dashed line). The flight on 9 March 2014 was the only one sampling the Southern Hemisphere, extending to 12° S. The observed variability between 15 and 17 km on 11 March 2014 is driven by sampling of different air masses, separated by 13° in longitude (see flight path in Fig. 1). The higher mixing ratios were captured on the western leg of that flight. Dates are given in the figure as YYYYMMDD.
Guided by similarity in mixing ratios, especially as evidenced by CO2, we divide the dataset into three latitude bins across the Equator. These bins are defined as follows: the Northern Hemisphere (NH) for data between 5 and 15° N, the Equator (EQ) for data between 5° S and 5° N, and the Southern Hemisphere (SH) for data between 5 and 12° S. Most of the sampling occurred in the NH, with EQ sampling during segments in two flights and SH sampling during one flight only.
To further investigate the observed trace gas spatial coherence, we examine correlations of CO with CO2, CH4, and O3, as shown in Fig. 5. This figure focuses on data north of 5° S. Data are color-coded to highlight pollution plumes found at 16–17 km (red) against the LS background (blue) and the UT background (gray). The CO–CO2 correlation shows distinct branches with medium levels of CO2 (397 ppmv) at the highest CO. Excluding the highest CO mixing ratios, these two tracers show a strong positive correlation where younger air has higher CO and CO2. This correlation is consistent with the time of the year, where CO2 in the Northern Hemisphere lower troposphere heads towards peak levels as the biosphere transitions from wintertime respiration to summertime photosynthesis. The fact that the air masses with the highest CO do not have the highest CO2 is an indication of unusual sources, such as continental origin, a different latitude, and/or combustion origin, all factors that also contribute to CO2 variability. These air masses with the highest CO and medium levels of CO2 have the highest CH4 mixing ratios, an indication of contribution from additional sources, such as biomass burning, combustion, and the oil and gas industry. Elevated CO, when accompanied by reactive HC and in the presence of nitrogen oxides, can lead to O3 formation over time. During ATTREX-3, mixing ratios of O3 within the CO plume remained very close to background UT levels (generally below 100 ppbv). This suggests no significant photochemical production of O3 from the time of convective lofting to the time of aircraft sampling.
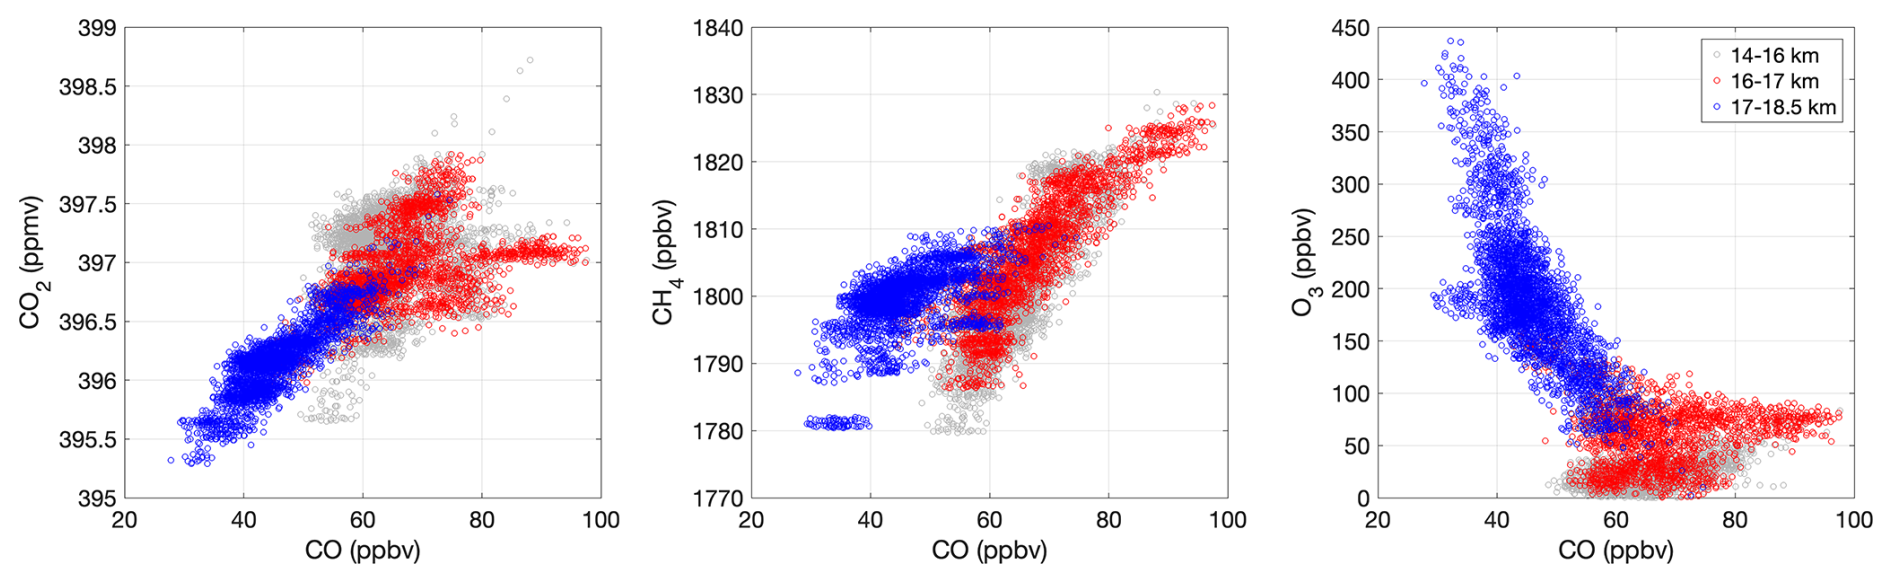
Figure 5Correlations of CO versus CO2, CH4, and O3 in the deep tropics (5° S–15° N) over the western Pacific in March 2014 during ATTREX-3. Data are color-coded by altitude: below most of the pollution plumes at 14–16 km (gray), peak of the pollution layer at 16–17 km (red), and above the pollution plumes at 17–18.5 km (blue). Pollution plumes with the highest CO mixing ratios (> 75 ppbv at the 80th percentile) are associated with distinct CO2 branches, the highest CH4 mixing ratios, and O3 mixing ratios below 100 ppbv, consistent with tropospheric values.
3.2 Pollution plume composition
We examine the chemical composition of pollution plumes using a more extensive suite of chemical trace gases, collected at both low and high frequencies. We start by defining pollution as air masses with CO mixing ratios higher than the 80th percentile within each latitude bin. This threshold translates to 75 ppbv CO for the NH bin, 71 ppbv CO for the EQ bin, and 63 ppbv CO for the SH bin.
Figure 6 shows vertical profiles of CO, CH4, and HCs with varying atmospheric lifetimes: biomass burning products, such as C3H8 (2 weeks), C2H2 (3 weeks), and CH3Cl (1.5 years), and urban/industrial emissions, such as C2Cl4 (4 months), collected in March 2014. Data are grouped into the three latitude bins defined in Sect. 3.1. The extreme mixing ratios observed by HUPCRS were not captured in the GWAS data, as shown in this figure. Pairing of these two instruments with significantly different response times required averaging HUPCRS data to GWAS sampling times, which were increasingly longer at higher altitudes, where we observed peak mixing ratios for multiple trace gases. This pairing also contributed to a loss of up to 20 % of the data when GWAS sampling occurred during periodic in-flight calibration times for HUPCRS. Despite these limitations, there is still clear evidence of the presence of these unexpected pollutants in the TTL and LS over the TWP, including trace gases with very short atmospheric lifetimes such as propane and ethyne, in both the Northern Hemisphere and the equatorial zone.
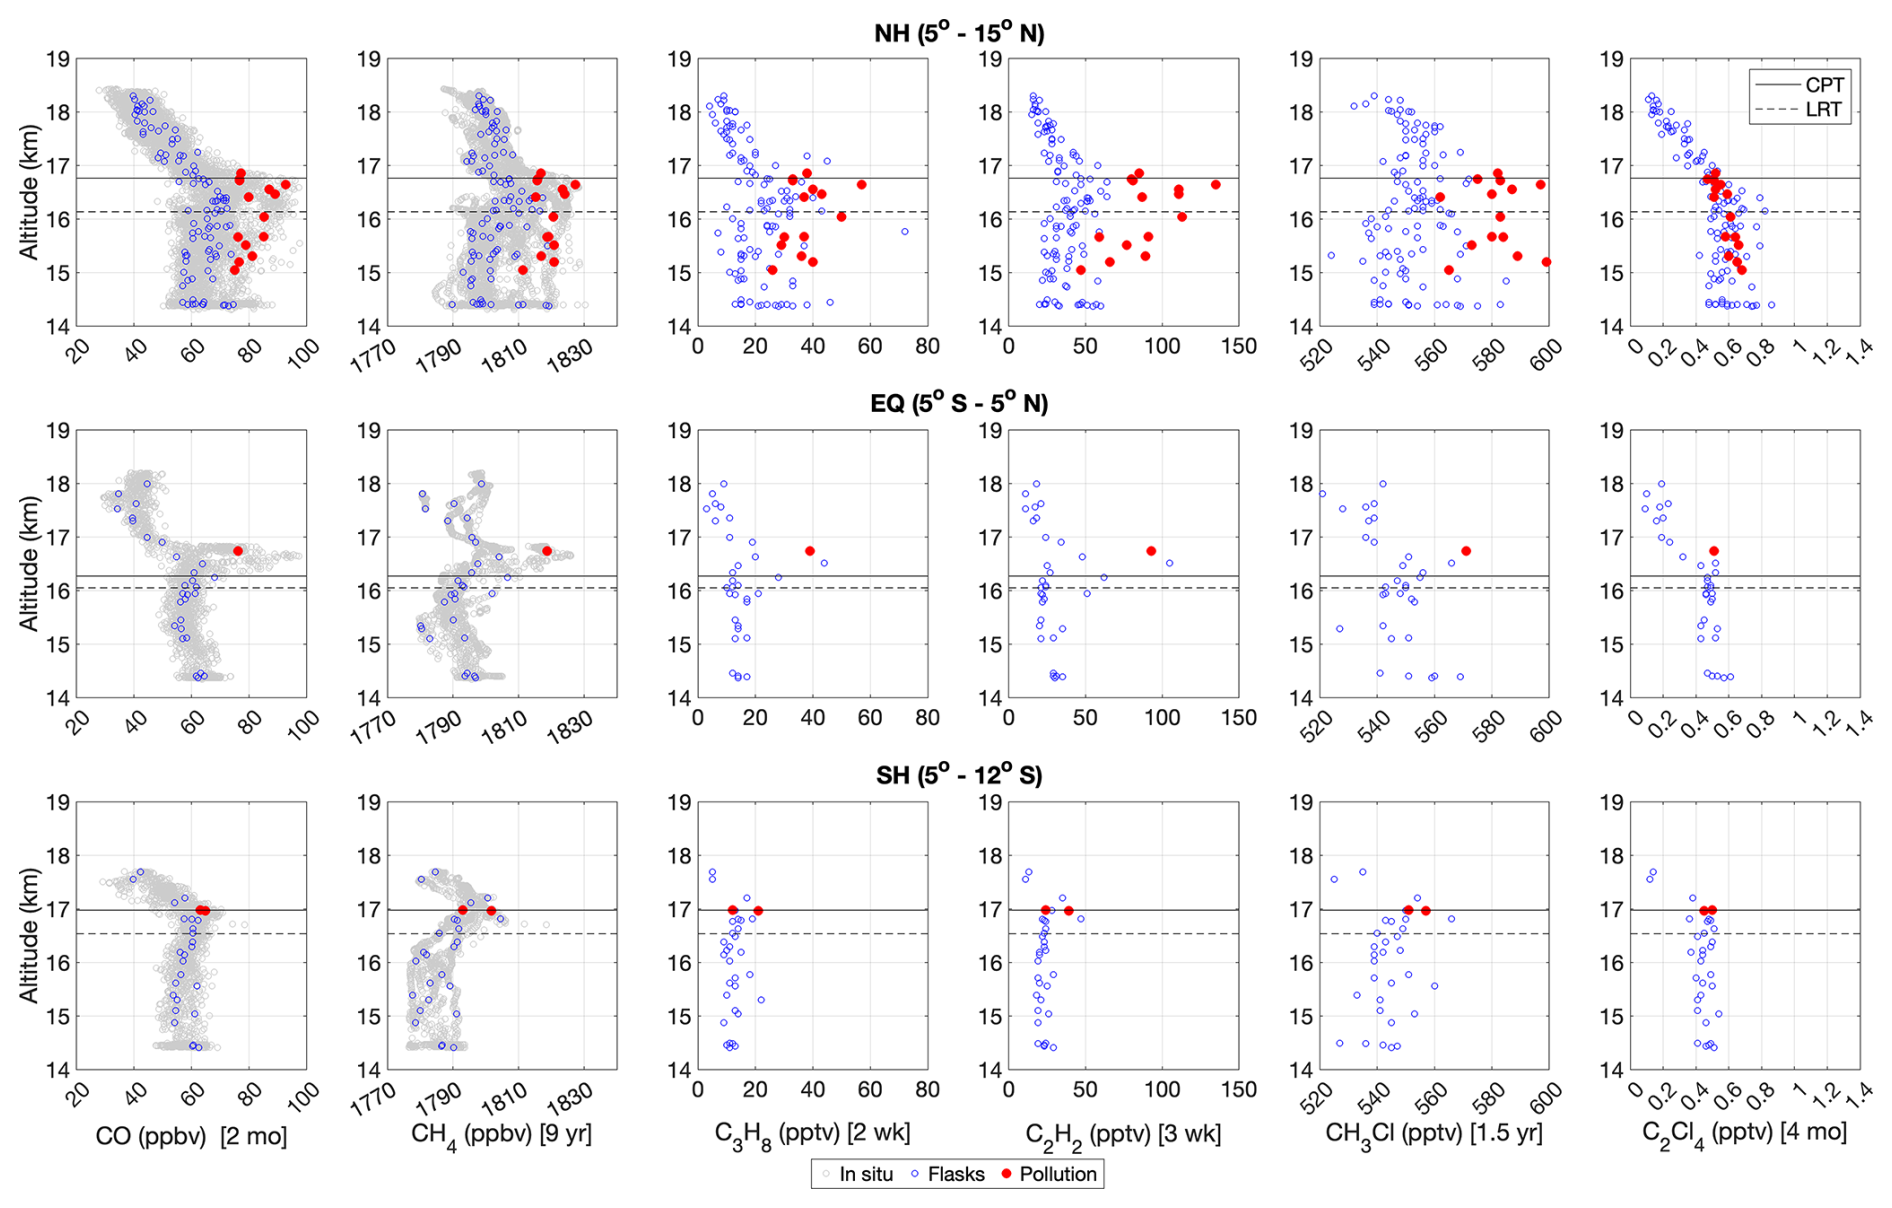
Figure 6Vertical profiles of CO, CH4, C3H8, C2H2, CH3Cl, and C2Cl4 in the deep tropics over the western Pacific in March 2014 during ATTREX-3. The gray points are for in situ measurements, blue points are for GWAS canisters, and red points are GWAS canisters with CO mixing ratios above the 80th percentile within each latitude bin. Also shown are the latitudinally averaged cold point tropopause (CPT; solid line) and lapse rate tropopause (LRT; dashed line). The top row shows NH bin data (5–15° N), the middle row shows EQ bin data (5° S–5° N), and the bottom row shows SH bin data (5–12° S). Atmospheric lifetimes for each trace gas are listed in the square brackets.
The HCs and CH3Cl shown in Fig. 6 are known to be emitted by biomass burning (Mauzerall et al., 1998; Blake et al., 1999; Akagi et al., 2011; Santee et al., 2013; Andreae, 2019). In all instances where distinct enhancements over background levels were observed in CO and CH4 (NH and EQ bins), HC and CH3Cl enhancements were also observed. In these air masses, however, C2Cl4, a tracer of urban origin, remained unchanged. This result points to biomass burning as the source of these pollution plumes, with undetectable urban/industrial contributions. The HC data also confirm that pollution inputs were pervasive for the duration of the campaign and extended across the Equator, well into the thermally defined LS.
Next, we quantify the degree of correlation between trace gases by calculating enhancement ratios. The enhancement ratio (slope) is determined from a least-squares regression using the reduced-major-axis method (Hirsch and Gilroy, 1984). In addition to slopes, we calculate the coefficient of determination (r2) and p values at the 95 % confidence interval to assess the statistical significance of the correlations. Figure 7 shows correlations of CO against trace gases with a wide range of atmospheric lifetimes, ranging from days (e.g., n-C4H10) and months (e.g., C2H6) to years (e.g., CH3Cl and CH4). This figure also includes a CH4 versus C2H6 correlation to investigate the potential contribution from the oil and gas industry. The data considered are for altitudes below 17 km. The color-coded data are for the southern survey flight only (9 March 2014), with the NH bin represented by filled circles and the EQ bin represented by filled diamonds. The least-squares regression is performed on a single flight (9 March 2014) with data below 17 km in order to exclude flight-to-flight variability in UT background mixing ratios (as seen in Figs. 4 and 6) and photochemically aged air at higher altitudes.
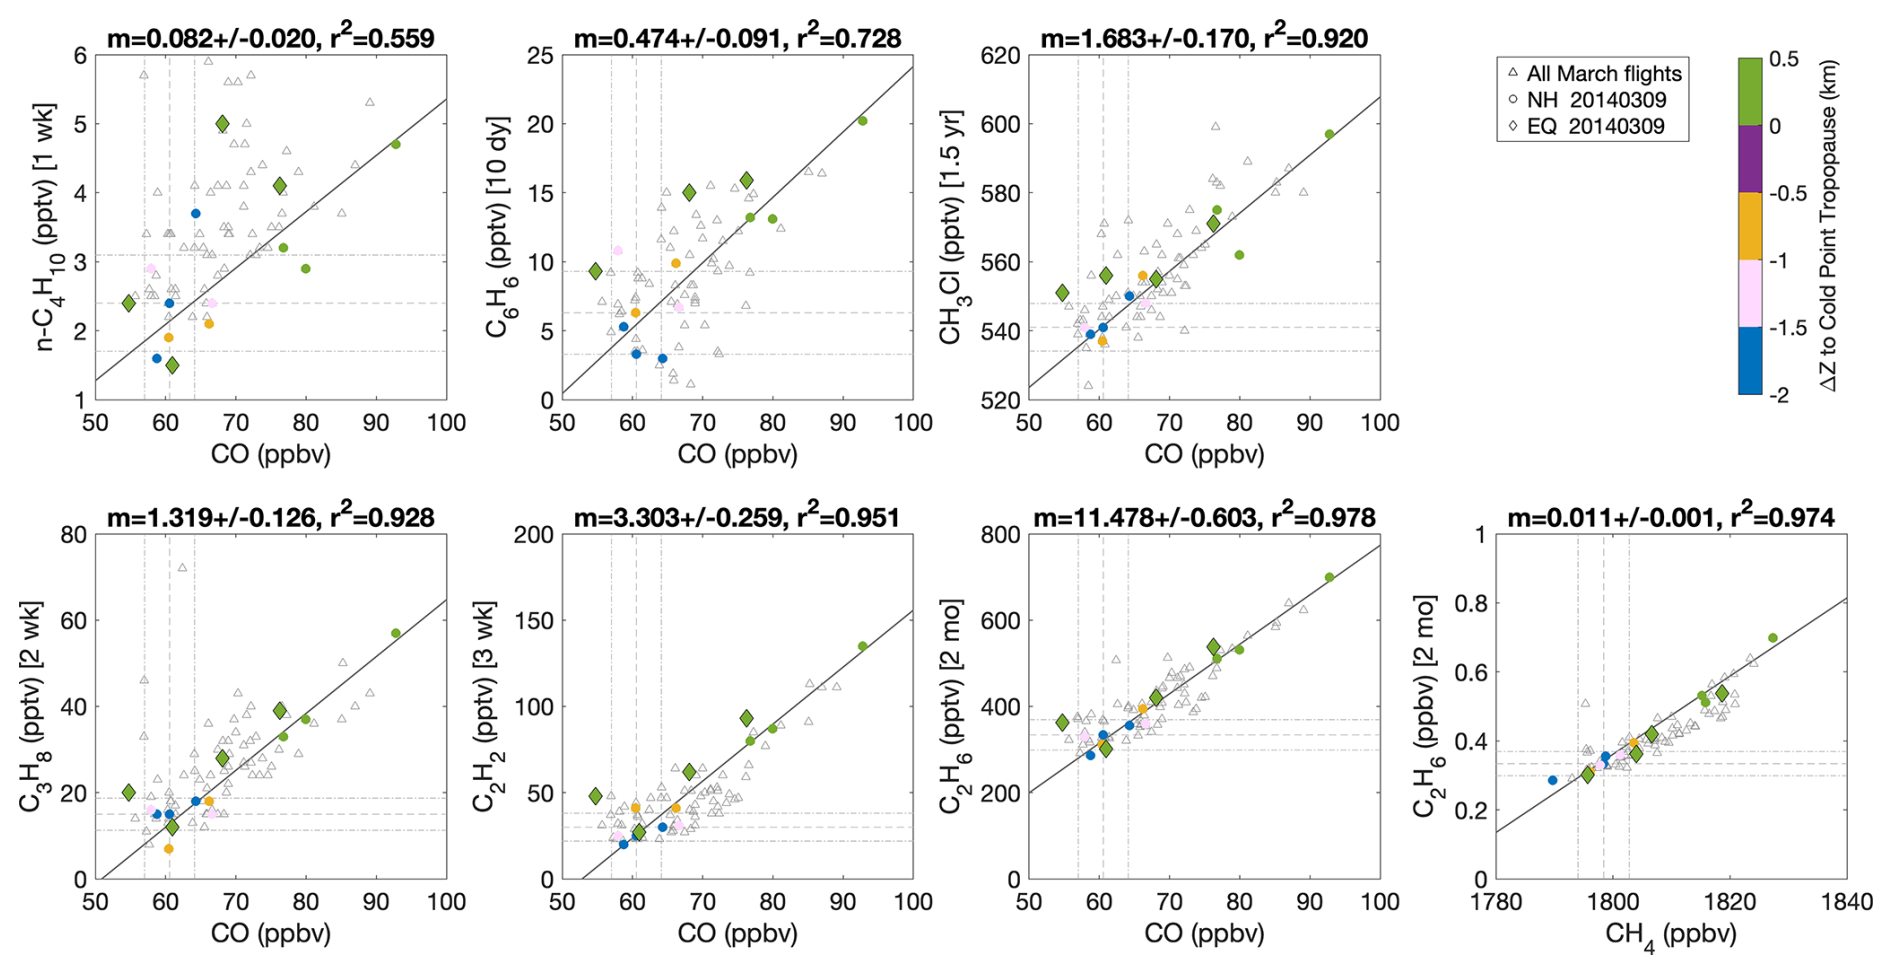
Figure 7Correlations of CO versus various hydrocarbons and CH3Cl, as well as CH4 versus C2H6, in the deep tropics over the western Pacific in March 2014 during ATTREX-3. Data are between 14 and 17 km. The open gray triangles correspond to March flights between 4 March 2014 and 11 March 2014. Color-coded data are for the NH bin (circles) and the EQ bin (diamonds) on 9 March 2014, where the color corresponds to the altitude relative to the cold point tropopause (CPT) within each latitude bin. The latitude bins are defined as 5–15° N for the NH bin and 5° S–5° N for the EQ bin. Atmospheric lifetimes for non-methane hydrocarbons and CH3Cl are listed in the square brackets.
All trace gas pairings with CO show strong and positive correlations in the NH bin. Lower r2 values are observed for trace gases with lifetimes shorter than 10 d, and all other trace gases show r2 over 0.9. In all cases, p values are less than 0.05 (0.0129 for n-C4H10, 0.0017 for C6H6, and less than 0.00001 for all others), which indicates that the correlations are statistically significant. Given the limited number of canisters in the EQ bin, we do not perform a statistical analysis; however, we note similar patterns qualitatively, especially for trace gases with atmospheric lifetimes longer than 10 d. The magnitudes of the slopes obtained are consistent with previous aircraft studies of biomass burning, except for correlations of CH4 with C2H6 and CO, where slopes were nearly an order of magnitude larger during ATTREX-3 (Mauzerall et al., 1998; Mühle et al., 2002; Gkatzelis et al., 2024). The observed excess CH4 suggests influences of additional sources, such as emissions from the oil and gas industry (Mühle et al., 2002).
We consider a wide range of atmospheric lifetimes to assess an approximate transport timescale based on which set of trace gases exhibits weaker correlations with CO. Weaker correlations arise, in part, due to faster chemical loss compared to transport rate. On 9 March 2014, we find correlations to be the weakest for trace gases with atmospheric lifetimes shorter than 10 d, suggesting that it took at least that amount of time for the polluted air to reach our region of sampling. These results are in agreement with previous measurements (Mauzerall et al., 1998; Gkatzelis et al., 2024).
Next, we examine various halogenated VSLSs associated with the pollution plume. Figure 8 is the same as Fig. 6 but for vertical profiles of CH3I, CHBr3, CH2Br2, CHCl3, and CH2Cl2 along with CO. Chlorine VSLSs are chosen as markers of anthropogenic emissions from urban or industrial source regions, and bromine and iodine VSLSs reflect oceanic sources, though significant anthropogenic emissions of bromine VSLSs in coastal regions have been reported (Jia et al., 2023). In all cases, we find no changes in these halogenated compounds within the pollution plumes compared to background levels. The only enhancement observed was in CH3I but not within the pollution plume. On 4 March 2014, we sampled recent convective air (0.5 to 2 d old) in the TTL, just south of the active typhoon Faxai (Jensen et al., 2017a). The rapid injection of surface air into the TTL was evident in the elevated CH3I mixing ratios between 16 and 17 km. Longer-lived trace gases, such as CO2 and CH4, showed mixing ratios that were consistent with those of nearby ground stations during the time frame of the storm, corroborating the age of the air (Jensen et al., 2017a). The observed mixing ratios of the halogenated VSLSs confirm the undetectable influence of urban sources or oceanic emissions in the polluted layer of the LS. Furthermore, the low levels of CHBr3 are consistent with a continental source that is not influenced by any nearby coastal or oceanic emissions. All these observations combined indicate that these plumes would not have a direct effect on global stratospheric O3 via rapid delivery of halogenated VSLSs to this key region of entry into the global stratosphere.
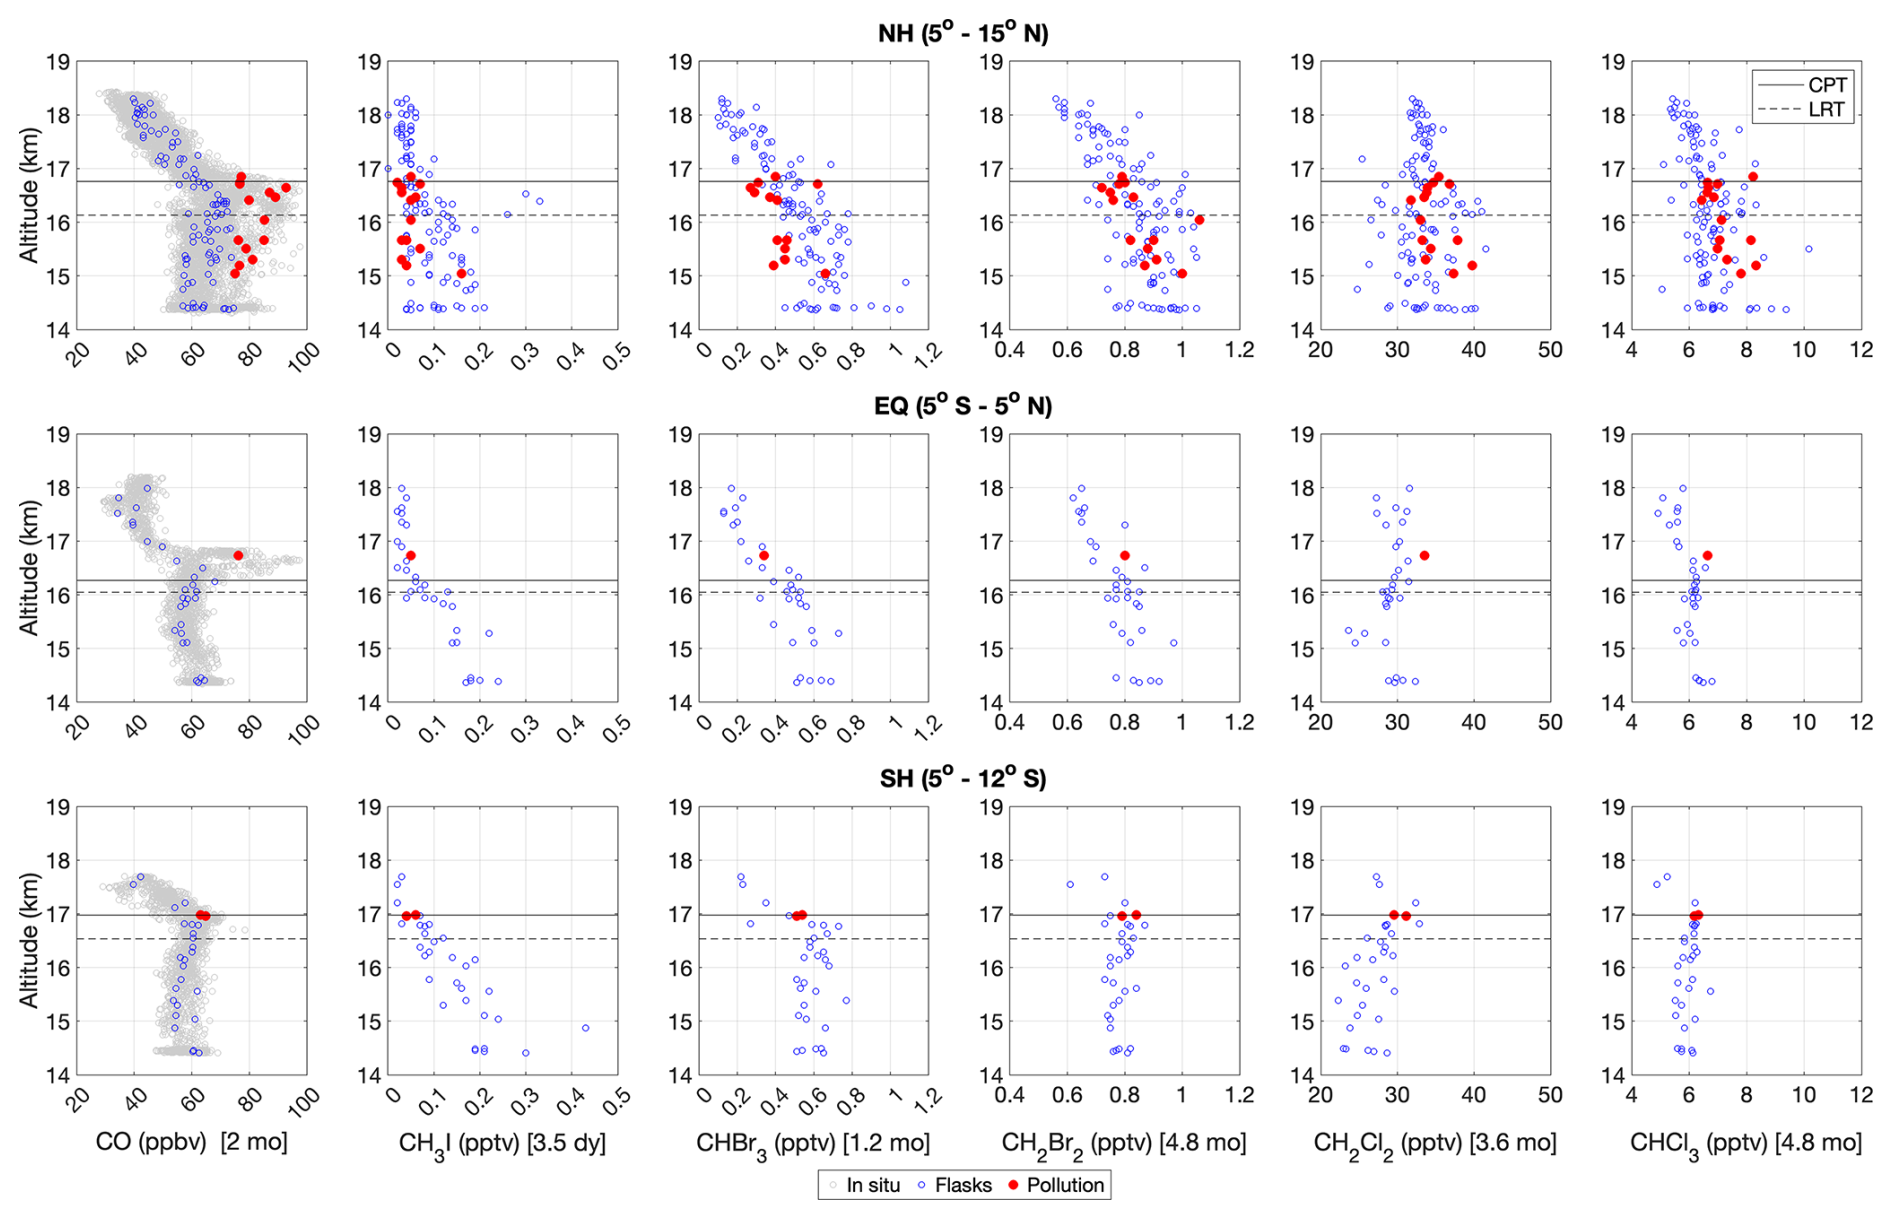
Figure 8Vertical profiles of CO, CH3I, bromine VSLS, and chlorine VSLS in the deep tropics over the western Pacific in March 2014 during ATTREX-3. The gray points are for in situ measurements, blue points are for GWAS canisters, and red points are GWAS canisters with CO mixing ratios above the 80th percentile within each latitude bin. Also shown are the latitudinally averaged cold point tropopause (CPT; solid line) and lapse rate tropopause (LRT; dashed line). The top row shows NH bin data (5–15° N), the middle row shows EQ bin data (5° S–5° N), and the bottom row shows SH bin data (5°–12° S). Atmospheric lifetimes for each trace gas are listed in the square brackets.
In addition to hydrocarbons and halocarbons, we examine H2O and the thermal environment where the pollution plumes were encountered. Focusing on the 16–17 km layer, where peak CO mixing ratios were observed, we find the pollution plumes, defined as CO mixing ratios above the 80th percentile, to be mostly in subsaturated air (76 %) compared to saturated (8 %) and supersaturated (15 %) air. At these altitudes, clouds were encountered 20 % of the time but only 12 % of the time within the pollution plumes. In this analysis, we define clouds as enhanced total water exceeding H2O by more than 5 ppmv. This threshold allows for an examination of the more frequently encountered thicker clouds. A lower threshold for cloud definition of 1 ppmv, for instance, only impacts 2 % of the data within the pollution plumes and has no effect on the overall conclusions. Taking into account measurement uncertainties and variability in ambient conditions (Rollins et al., 2016; Jensen et al., 2017b), we define saturation as relative humidity of 98 %–102 % and supersaturation as relative humidity above 102 %.
Figure 9 illustrates the H2O and ambient temperature correlation in clear air and in clouds within the context of all CO mixing ratios sampled in the 16–17 km layer in March 2014. Also included in the figure are lines of constant relative humidity over ice. In clouds, air masses with the highest CO mixing ratios remained close to saturation (at or 20 % above), over a wide range of H2O (1.8–4.4 ppmv) and temperature (185.3–192.5 K). In clear air, air masses with the highest CO mixing ratios were mostly subsaturated, as mentioned above. Three distinct regimes in clear air as a function of H2O, however, stand out: (i) a wide range of temperatures in mostly subsaturated air at the lowest H2O, (ii) a narrow range of temperatures in supersaturated air at the highest H2O, and (iii) a combination of (i) and (ii). Guided by the observations, we assign H2O values of 3.5 and 5 ppmv as approximate thresholds for clustering purposes. The first regime, with H2O below 3.5 ppmv, was encountered over a wide range of temperatures (187.5–201 K) and CO mixing ratios (42.8–97.4 ppbv). Most of these low-H2O air masses were in subsaturated air, an indication that local temperature conditions were not the drivers of dehydration to the observed levels, consistent with previous studies (Gettelman et al., 2002b; Fueglistaler et al., 2004; Pan et al., 2019). The second regime, with H2O above 5 ppmv, was encountered over a narrower range of temperatures (190.6–192.6 K) and CO mixing ratios (57.2–74.8 ppbv). These air masses were all in supersaturated air. The third regime, with H2O between 3.5 and 5 ppmv, was encountered over a wider range of temperatures (189.4–194.9 K) and CO mixing ratios (52.1–95.5 ppbv) compared to the second regime. Unlike the other two regimes, this third regime shows a strong correlation between relative humidity and CO mixing ratios where pollution plumes were found in warmer and subsaturated air.
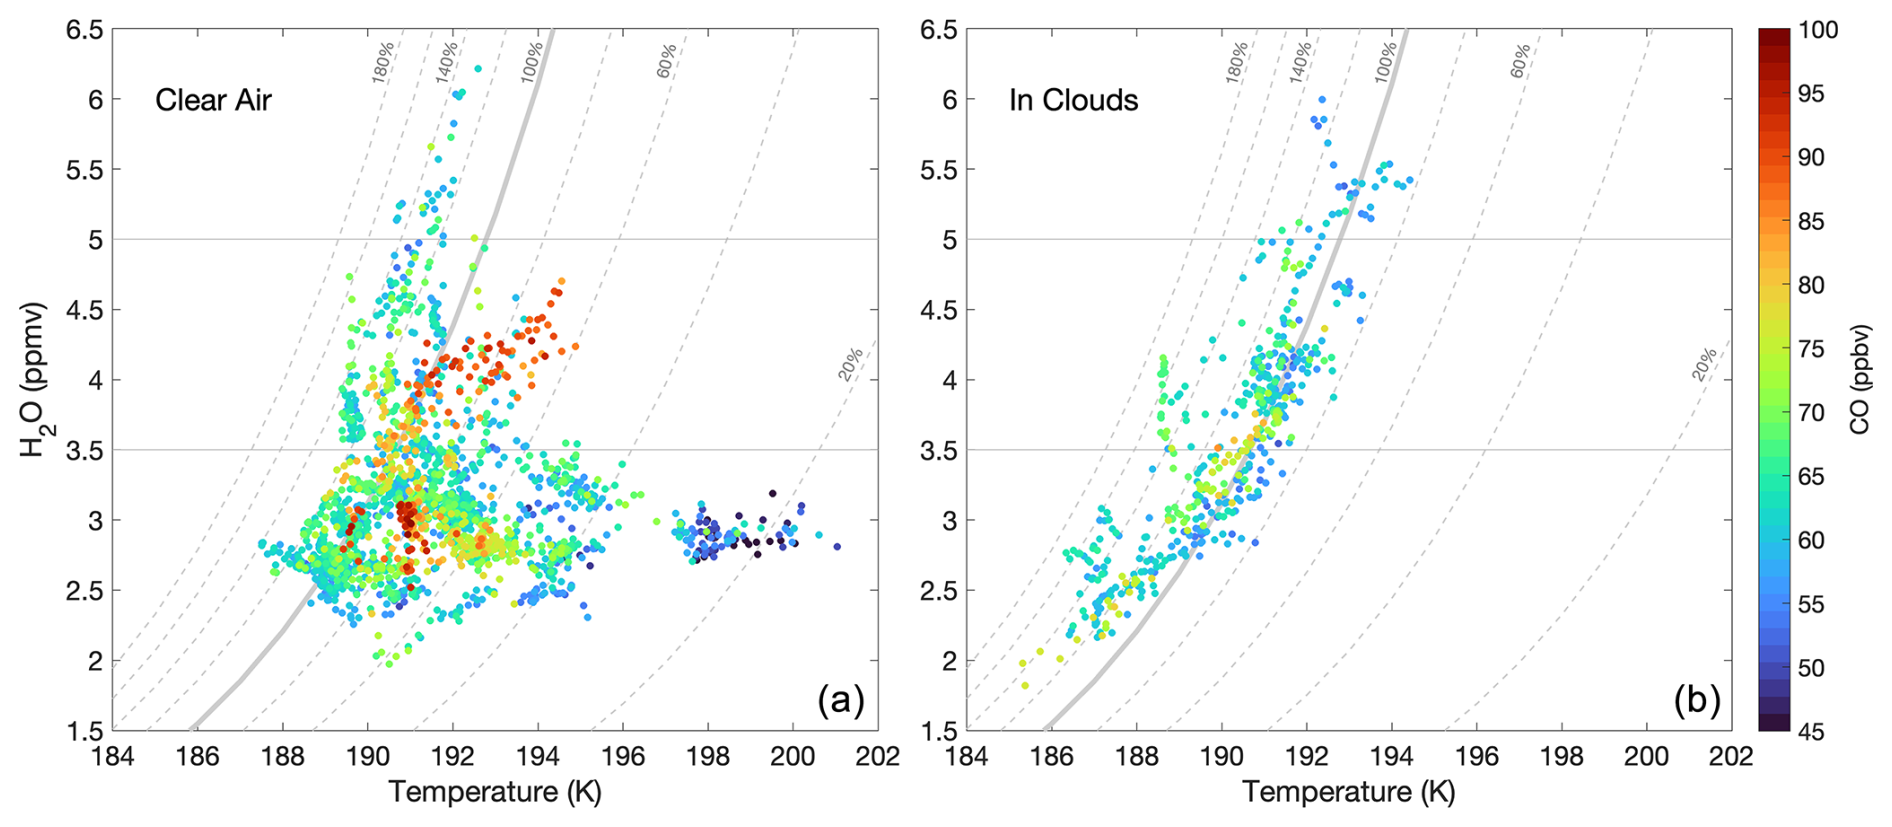
Figure 9Correlation of ambient temperature and water vapor for air masses sampled in the deep tropics (12° S–15° N) over the western Pacific in March 2014 during ATTREX-3. Data are at altitudes of peak CO mixing ratios, between 16 and 17 km, and color-coded by CO mixing ratios. Lines of constant relative humidity over ice are also shown (solid for 100 % and dashed for all others). Panel (a) is for clear air, and panel (b) is inside clouds. Clouds are defined as enhanced total water greater than 5 ppmv over water vapor. Three water vapor regimes are analyzed in this study: below 3.5 ppmv, between 3.5 and 5 ppmv, and above 5 ppmv. See text for details.
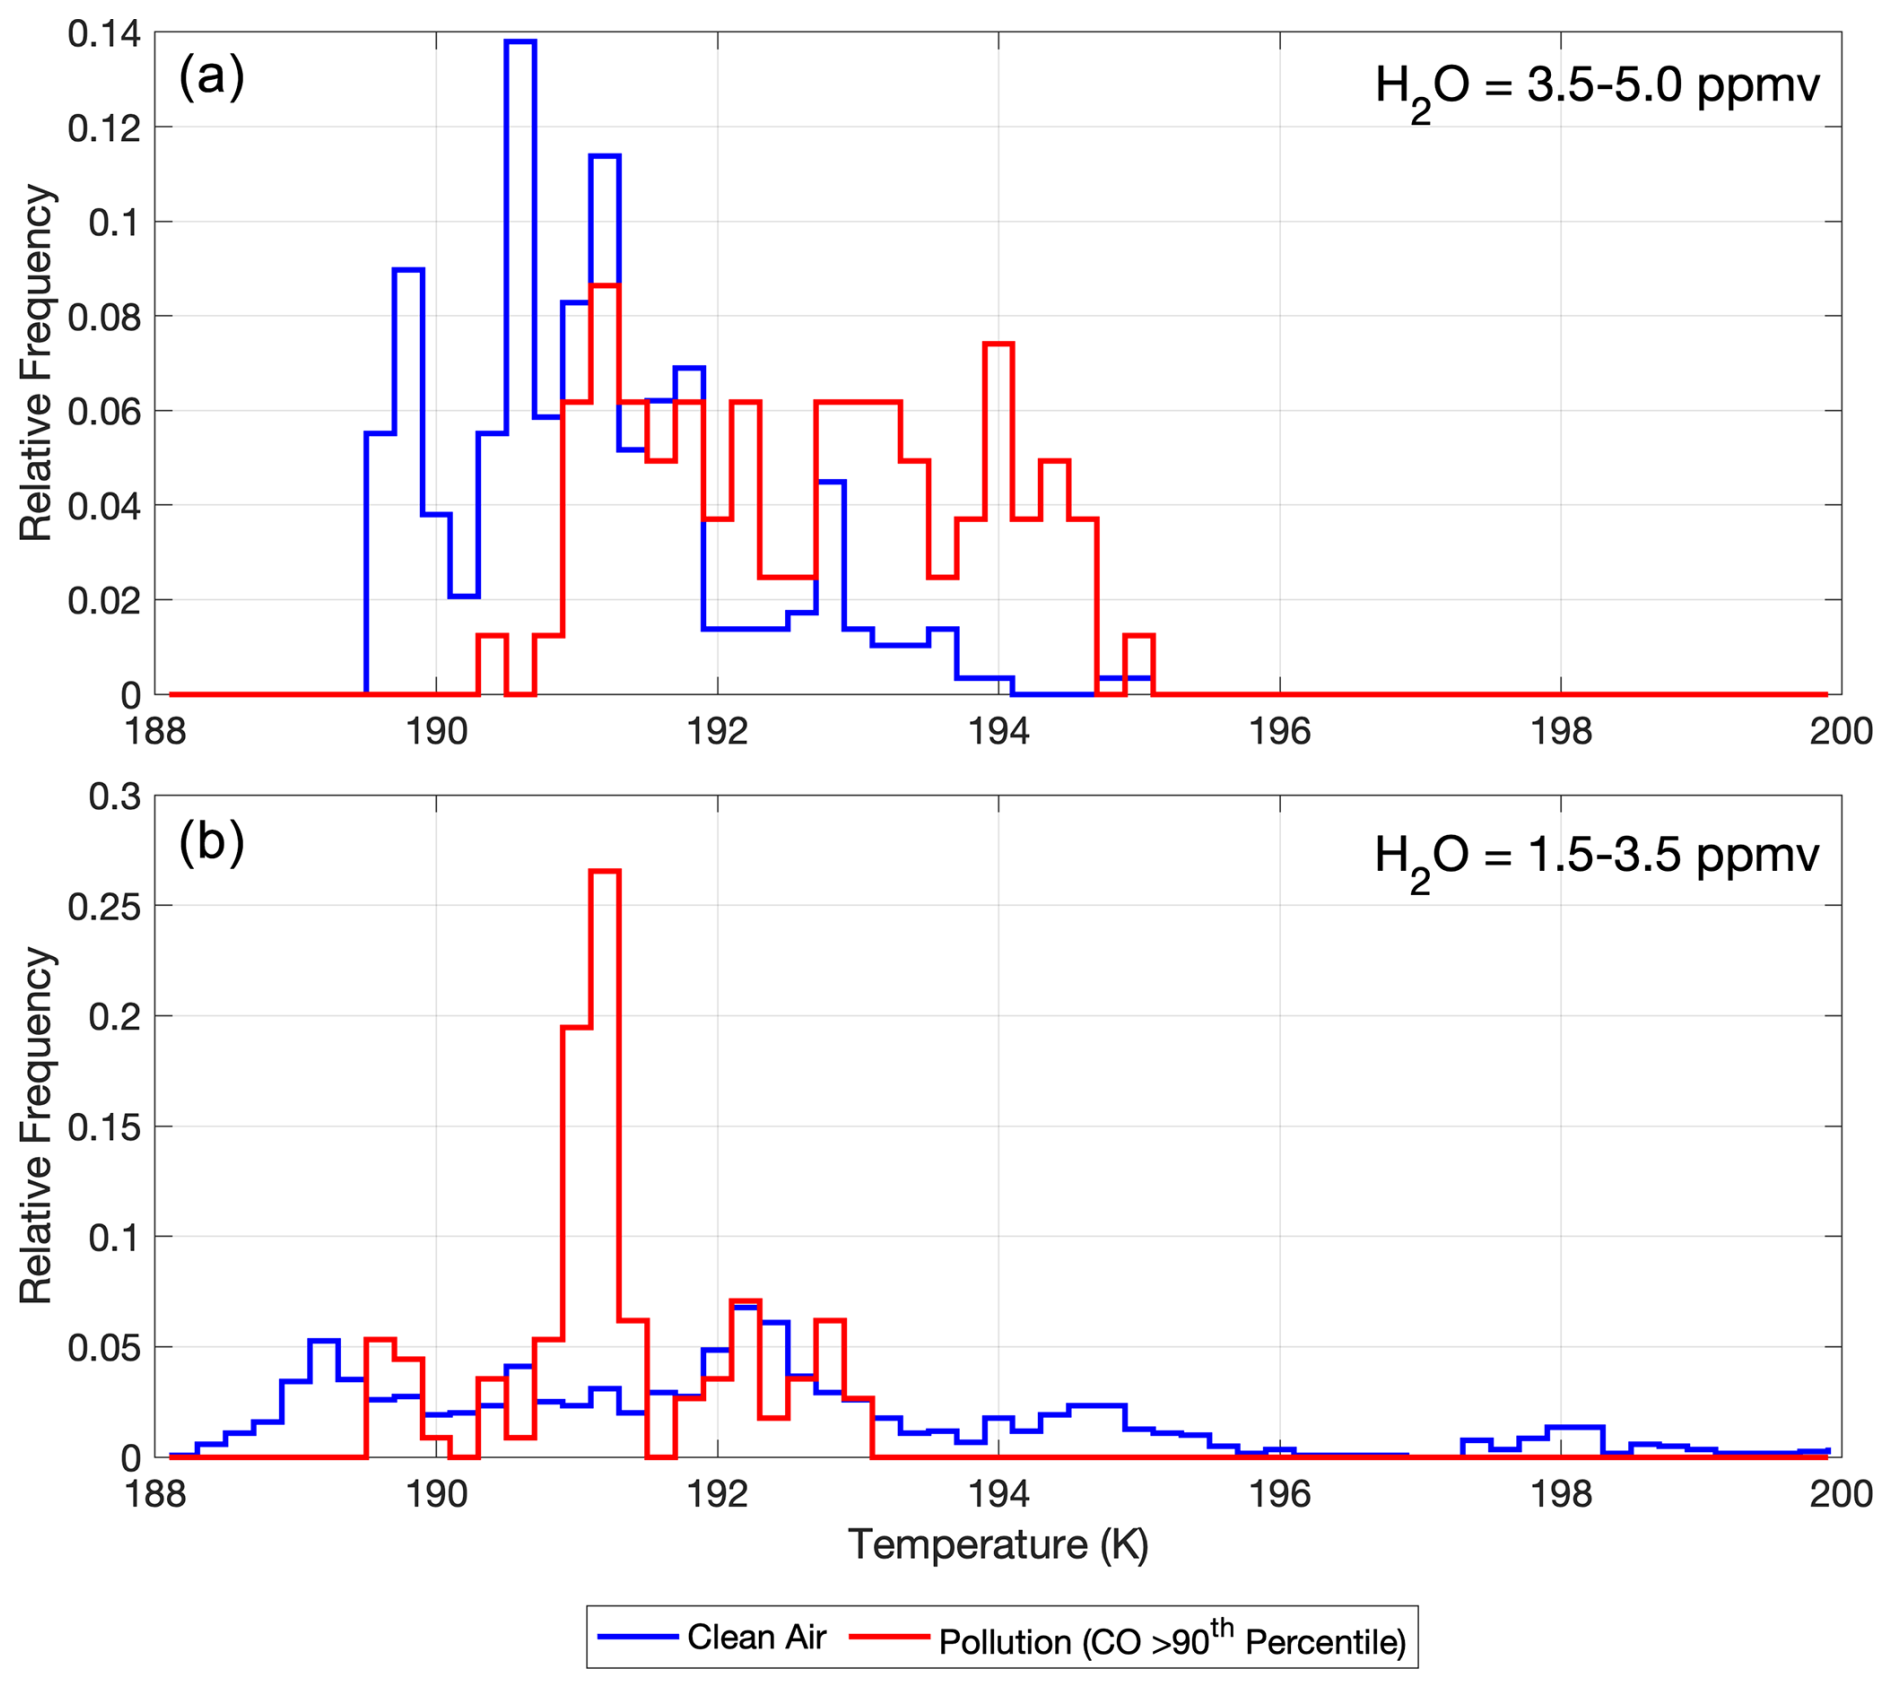
Figure 10Histograms of ambient temperature in cloud-free air at two water vapor regimes: 3.5 to 5 ppmv (a) and 1.5 to 3.5 ppmv (b). A 90th percentile threshold in CO is used to separate polluted air (red) from clean air (blue). These air masses were sampled at altitudes between 16 and 17 km in the deep tropics (12° S–15° N) over the western Pacific in March 2014 during ATTREX-3.
We quantify the relationship between temperature and CO by examining histograms of ambient temperature in clean versus the most extremely polluted air masses (90th percentile CO) in the first and third regimes, as shown in Fig. 10. At the lower H2O mixing ratios, we find the temperature range of polluted air to be within the temperature range of clean air. At higher H2O mixing ratios, however, we find an average temperature increase of 1.52 K in the polluted air. These air masses, associated with warmer temperatures and the highest CO within the 3.5 and 5 ppmv range in H2O, were not frequently encountered (∼ 15 % of the time).
Cloud formation is a key mechanism in the TTL for regulating water vapor mixing ratios entering the global stratosphere (Randel and Jensen, 2013). The ATTREX-3 dataset provides evidence of pollution plumes primarily residing in cloud-free air within the TTL, above the level of maximum convective detrainment (see Fig. S4). Whether an underlying physical process exists linking biomass burning pollutants with local warmer temperatures and potential suppression of cloud formation is a topic of great interest, but it is outside the scope of this study.
3.3 Satellite observations of CO
In this section, we examine the larger spatial and temporal context of the pollution plumes observed during ATTREX-3 using 100 hPa MLS CO. We first compare ranges in CO between MLS at 100 Pa and the equivalent aircraft altitudes (∼ 80–140 hPa) within the deep tropics (15° S–15° N) in February–March 2014 (see Fig. S5). We find the range in CO to be comparable between the aircraft measurements and the satellite observations (±2 standard deviations from the average) over the longitudes sampled by the aircraft. When considering all longitudes, MLS observations show the highest CO, both on average and in extreme values, to be over Africa during the time frame of the ATTREX-3 flights.
Next, we examine the satellite record to identify geographical locations for CO hot spots. During ATTREX-3, we find the CO hot spots to be over Africa, Indonesia, and the central Pacific, as shown in Fig. 11. Previous studies have reported repeated CO hot spots over the same geographical regions during boreal winter, indicating that these are persistent seasonal sources of elevated CO (Schoeberl et al., 2006; Duncan et al., 2007; Huang et al., 2012).
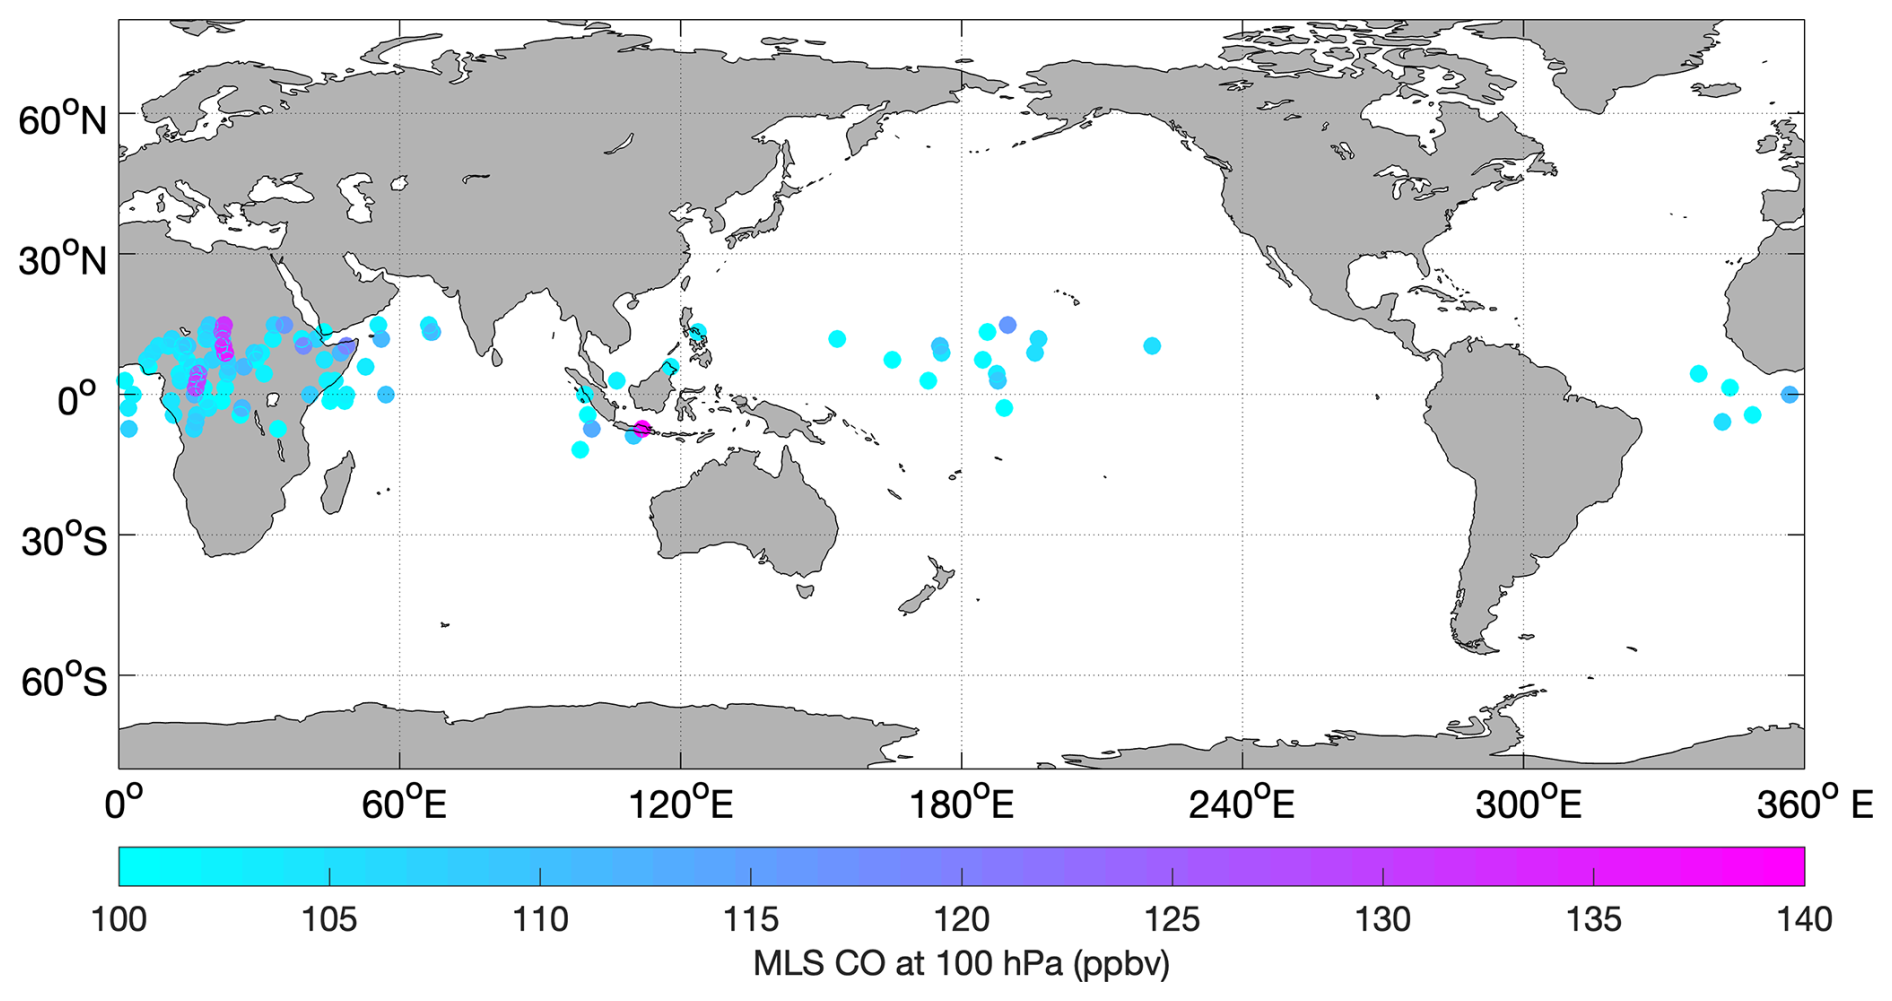
Figure 11Satellite observations of CO at 100 hPa obtained by the Microwave Limb Sounder (MLS) across the deep tropics (15° S–15° N) in February–March 2014. Data are for CO > 100 ppbv. The largest mixing ratio of 155 ppbv is found over Indonesia. This single value is excluded from the color bar to better visualize the range of the remaining observations. These high CO mixing ratios were found over tropical Africa, Indonesia, and the western and central Pacific.
Lastly, we can use the satellite record to assess how 2014 compared to other years. We examine extreme CO from MLS over a 10-year period, 2010 to 2020 (Fig. S6). We define extreme CO as mixing ratios that are larger than 2 standard deviations above the average. We find 2014 to be at or below average for extreme CO mixing ratios across the tropics, and Africa was a dominant CO hot spot during that period.
Comparing in situ aircraft data and spaceborne observations requires a careful approach, especially when exploring extreme values. Spatial and temporal coincidences, as well as favorable environmental conditions for ideal comparisons, are nearly impossible to achieve. The more sensible approach is to explore the statistics of the measurements considering larger areas of measurements. One consideration in this comparison approach is the vertical resolution of the datasets. In situ CO shows the pollution layer to be contained mainly between 15.5 and 17 km (see Figs. 2–4). The closest altitude in the MLS retrieval is the 100 hPa level, which comprises a weighted sampling ∼ 4.9 km in depth that extends hundreds of kilometers horizontally. This coarser spatial resolution makes it challenging to detect extreme events from space when they occupy only a fraction of the retrieved volume. A second consideration is the uncertainty of the measurement. Even though the CO range is comparable between the aircraft and the satellite instruments for data over the TWP, a Kolmogorov–Smirnov test at the 95 % confidence interval revealed that the satellite data were not statistically different from a normal distribution. In contrast, the aircraft data did not follow a normal distribution (see Fig. S7). These results imply that the extremely high values in the aircraft measurements are indistinguishable from noise in the spaceborne observations obtained in the vicinity (in both space and time) of the aircraft sampling.
3.4 Convective origin and transport timescales from backward trajectories
Convection is responsible for lofting surface air to the TTL (Fueglistaler et al., 2009, and references therein). Results from convectively influenced backward trajectories for various ranges of altitudes and CO mixing ratios over multiple flights are summarized in Fig. 12. Two altitude ranges are used: (1) TTL and lower TLS (14.5–17 km) and (2) the layer of peak CO mixing ratios (16–17 km). The geographical regions of convective encounters are defined as follows: Africa (0–50 and 345–360° E), the Indian Ocean (50–100° E), Indonesia (100–125° E, north of 10° S), Australia (100–155° E, 10–35° S), the western Pacific (125–180° E), the central Pacific (180–210° E), the eastern Pacific (210–270° E), and South America (270–330° E). The western and central Pacific oceans are the dominant convective source regions of air throughout the TTL during ATTREX-3. Above 16 km, where peak CO mixing ratios were sampled, we find the western and central Pacific to be the dominant source regions; however, contributions from convective encounters over continental regions were also significant. On the flight of 9 March 2014, for example, remote continental source regions showed comparable contributions to TTL composition over the TWP as nearby marine source regions. Two such remote regions are Africa and Indonesia. These results are consistent with satellite observations showing that a large percentage of deep convection occurs over tropical Africa and Indonesia during boreal winter (Alcala and Dessler, 2002; Liu et al., 2020).
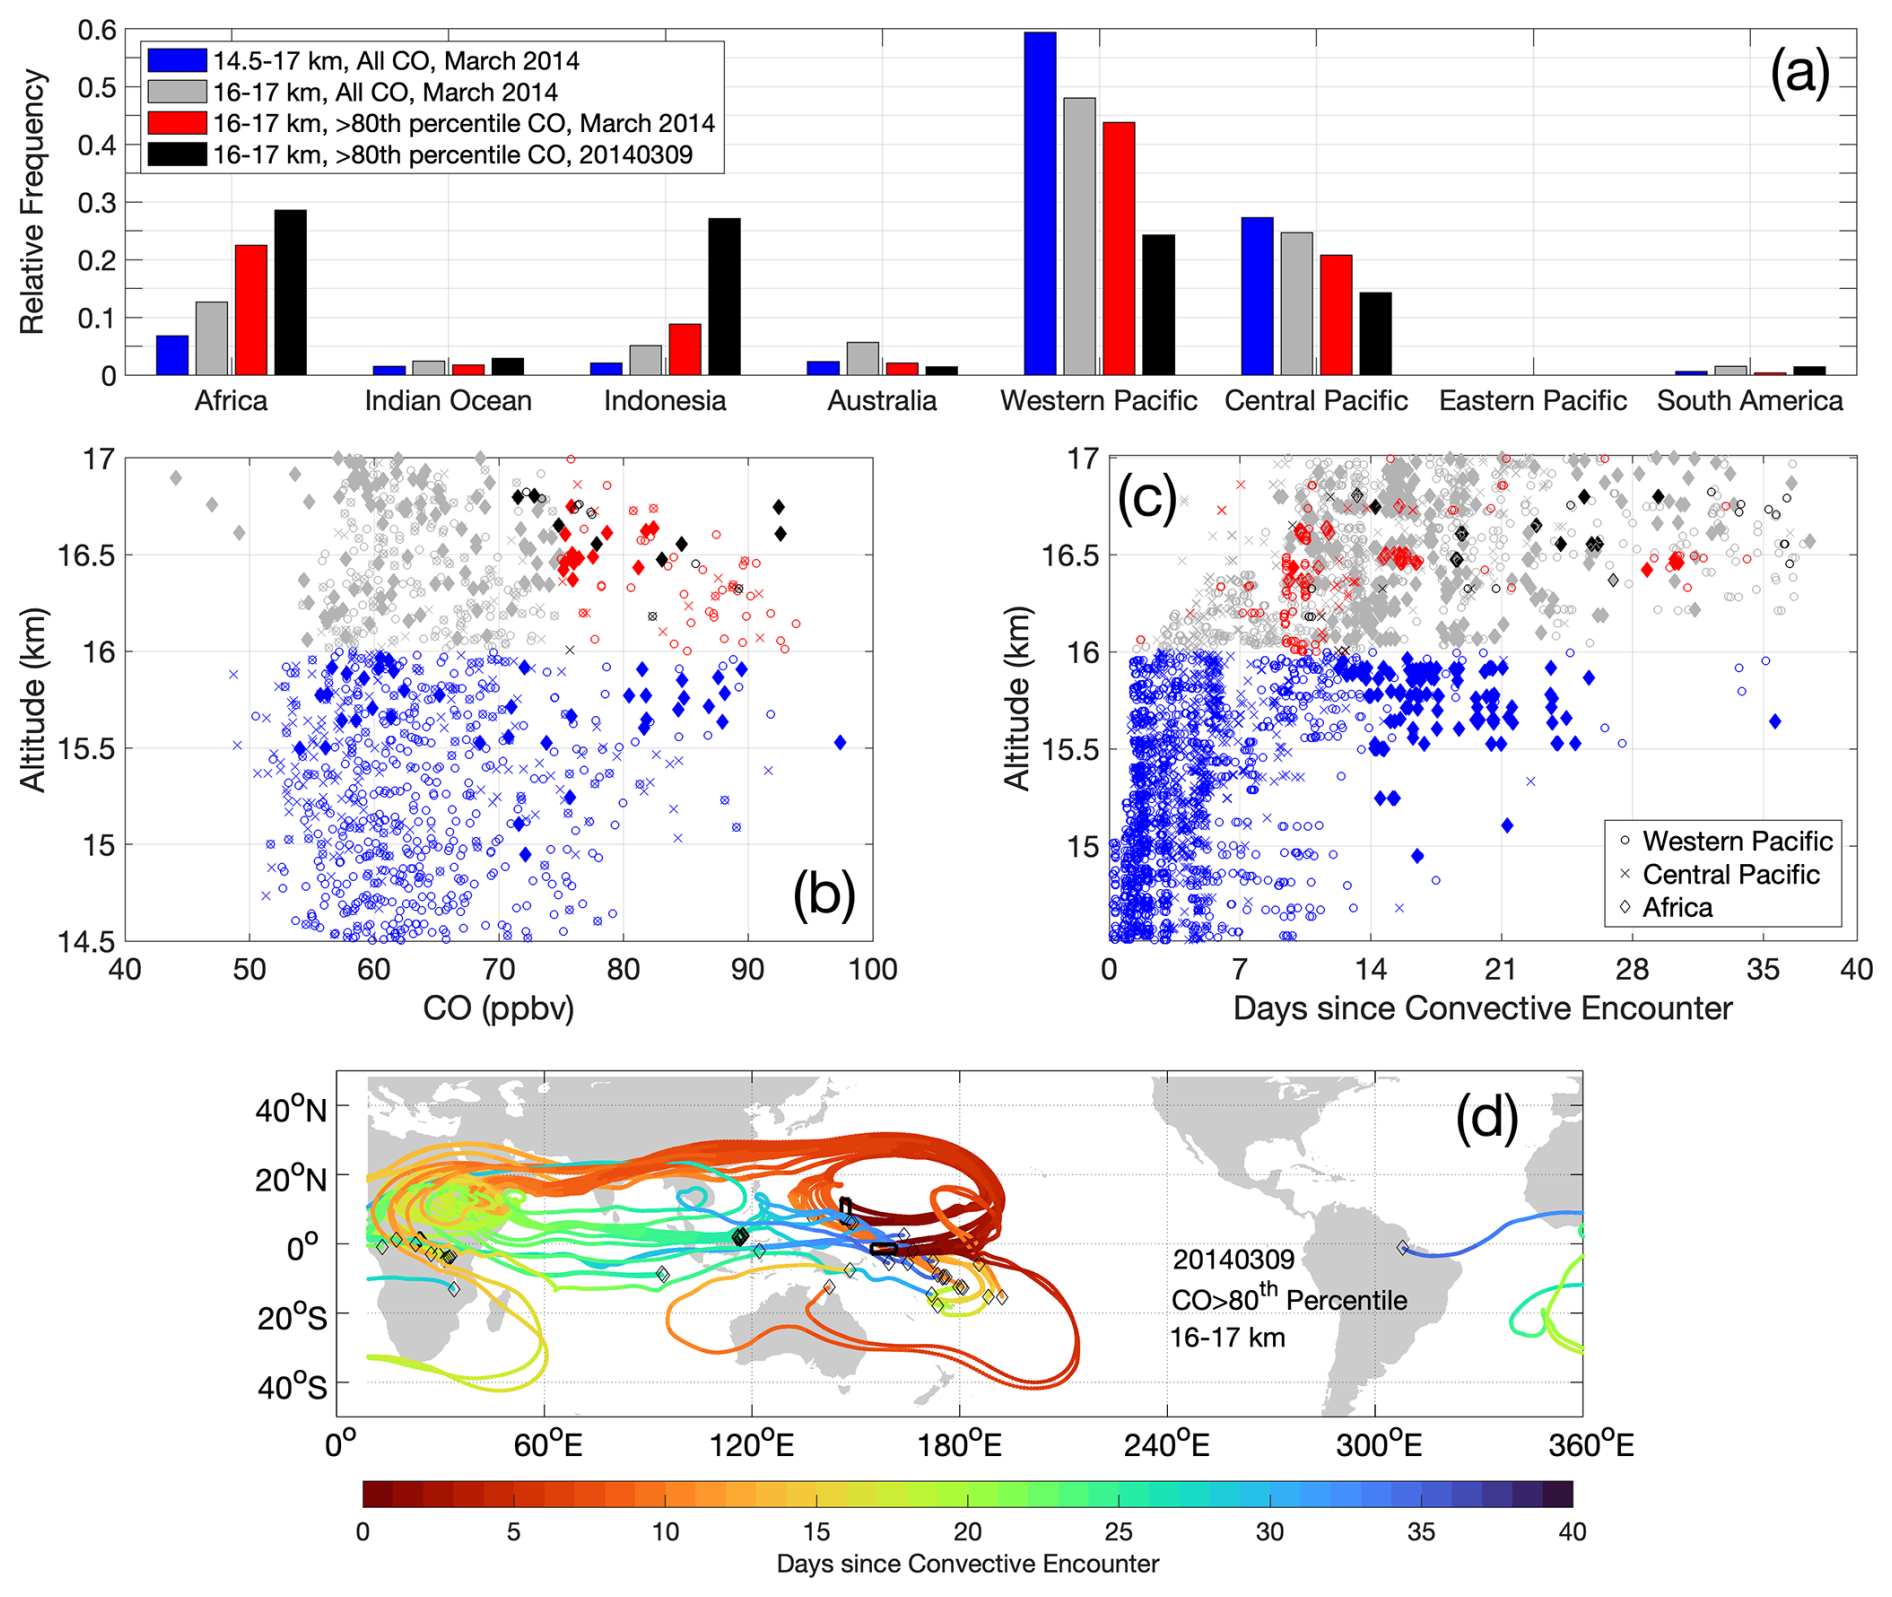
Figure 12Convective properties of air sampled in the deep tropics (12° S–15° N) over the western Pacific in March 2014 during ATTREX-3. (a) Relative frequency of convective encounters over continental and marine source regions at various altitudes, CO mixing ratios, and times. Bars for March 2014 are average values over the four science flights (see Fig. 1). (b) Vertical profile of CO for the dominant regions of convective encounters: the western Pacific (circles), the central Pacific (crosses), and Africa (diamonds). (c) Same as (b) but for days since the most recent convective encounter. The color-coding for (b) and (c) is the same as that for (a). (d) Backward trajectories for polluted air sampled in the 16–17 km layer between 5° S and 15° N on 9 March 2014. Pollution is defined as CO mixing ratios above the 80th percentile. The color-coding in (d) corresponds to the number of days between the convective encounter identified by backward-trajectory calculations and aircraft sampling. The black rectangle and black diamonds shown in (d) correspond to the location of aircraft measurements and convective encounters, respectively.
In general, the transport timescales were proportional to the longitudinal separation between areas of convection and aircraft sampling, as shown in Fig. 12c and d. The shortest transport timescales were for air masses lofted by marine convection nearby, a few days prior to sampling. There were a few instances, however, when the nearby marine convection occurred 5 weeks prior to aircraft sampling. Air masses associated with convection over land traveled for longer periods of times, 10 d to 4 weeks, from Africa and Indonesia. Even though Indonesia is closer to the TWP, air masses lofted by local convection traveled westward first due to dominant upper-level easterly winds at these low latitudes during ATTREX-3.
Associating pollution plumes with convective encounters over the TWP and central Pacific requires additional considerations. The polluted air masses are clearly not of a marine origin but of a continental origin based on the chemical composition revealed by in situ measurements of multiple trace gases. One possibility is a different advection–convection transport pattern. If convection lofts air from the surface below, polluted air would first need to be advected from continental sources to the TWP following a general eastward flow at lower altitudes prior to convective entrainment and lofting over the TWP. These various combinations of convection and long-range advection transport processes have been identified in previous studies (Jiang et al., 2007; Huang et al., 2012) and thus cannot be ruled out. Another consideration is wind uncertainties in operational analyses. The analyses rely on observations, such as those from radiosonde stations. In remote regions like the western Pacific, limited observations exist, which contributes to an increase in meteorological field uncertainties (Podglajen et al., 2014).
Results from these trajectory calculations in terms of geographic source regions and transport timescales are consistent with the chemical composition and atmospheric lifetimes discussed in Sect. 3.2. Analysis of aircraft measurements collected over nearly a decade revealed not only that Africa was a persistent source of CO in the UT, but also that anthropogenic sources and biomass burning contributed the same order of magnitude to the UT CO budget during boreal winter (Lannuque et al., 2021). This finding could explain the discrepancy between observed CH4 enhancements during ATTREX-3 and those expected from a biomass burning source alone by attributing the difference to other sources of pollution to the UT, such as the oil and gas industry. During ATTREX-3 in February and March 2014, strong fire activity was evident from space over equatorial Africa and Indonesia (Anderson et al., 2016). Associating the observed elevated CO, CH4, and various HCs with biomass burning over Africa and Indonesia is therefore very plausible.
In situ and flask measurements of multiple trace gases revealed frequent, horizontally widespread, and vertically compact pollution plumes of a continental origin in the tropical tropopause layer and lower stratosphere over the tropical western Pacific upwelling region during the boreal winter of 2014. Analysis of the chemical composition of the pollution plumes using correlations of multiple trace gases, including CO, CH4, CO2, O3, H2O, HCs, and halocarbons, indicated biomass burning as the dominant source of pollution. A possible contribution from the oil and gas industry could not be excluded. No enhancements in halogenated VSLSs were found in these plumes, suggesting undetectable contributions from urban areas or oceans (e.g., CHBr3). These pollution plumes were found primarily in cloud-free regions, as well as in warmer air masses of equivalent H2O mixing ratios. Additional data and further analysis would be needed to assess whether an underlying physical process exists linking biomass burning products with local warmer temperatures and potential suppression of cloud formation.
Satellite observations of CO from MLS along with backward-trajectory calculations coupled with satellite observations of precipitating cloud tops were in agreement with geographical source regions for these plumes, namely Africa, Indonesia, and the western and central Pacific. The continental contribution from Africa and Indonesia was on average 31 % during the ATTREX-3 March flights, increasing to nearly 60 % on the 9 March 2014 flight. A 10-year MLS record showed that Africa is a consistent source region of TTL CO in the deep tropics during boreal winter and that 2014, the year in which aircraft measurements were analyzed in this study, was below average for extreme CO mixing ratios across the deep tropics. The high-CO events measured by the aircraft over the TWP were not detected by MLS. Possible explanations for the discrepancy include different volumes of air sampled by each platform, different vertical resolutions, and instrument sensitivity to sporadic high mixing ratios that are comparable in magnitude to the noise in the retrieval.
Backward-trajectory calculations also provided transit times between convective delivery and aircraft sampling in the TTL and LS over the TWP. Transport timescales from continental convection ranged between 10 d and 4 weeks, while a wider range of 1 to 5 weeks was associated with transport from nearby marine convection. These transport timescales were consistent with atmospheric lifetimes of the trace gases examined.
Satellite observations and trajectory studies have identified the TWP as the main region where convectively lofted air enters the tropical stratosphere, with the fastest ascent rates through the TTL during boreal winter. This study, conducted over the longitudes and during the time of year mentioned earlier, reveals that air sampled in the TTL and LS was sourced not only from the nearby marine boundary layer, but also from distant, continental regions across the tropics prior to convective lofting to the TTL and advection to the TWP.
Stratospheric composition, which has a direct impact on the recovery of the O3 layer, depends on the composition of tropospheric air convectively lofted to the TTL. Of particular concern is the fast convective delivery of halogenated VSLSs to the TTL and tropical LS, where their short atmospheric lifetimes are no longer a limiting factor influencing stratospheric O3 concentrations. Rapid delivery of halogenated VSLSs from Asian emission sources to the TTL over the TWP during boreal autumn, a season of slower ascent into the stratosphere, has been reported (Treadaway et al., 2022). The present study did not find evidence of VSLS transport to the TWP during boreal winter.
However, this study did find rapid delivery of trace gases from biomass burning sources, including gas-phase precursors to secondary organic aerosols, such as C6H6 (Borrás and Tortajada-Genaro, 2012; Arias et al., 2021). The associated aerosols have been hypothesized to contribute to stratospheric O3 loss (Solomon et al., 2023) via halogen activation under new thermal and chemical environments. Biomass burning inputs can also impact the radiative properties of the TTL by altering concentrations of radiatively active gases, such as CH4, CO2, and O3 (Gettelman et al., 2004) and aerosols. The latter can modify scattering and absorption of shortwave and longwave radiation, as well as influence cloud formation and life cycles (Fueglistaler et al., 2009; Huynh and McNeill, 2024, and references therein). An increase in the intensity and frequency of fire activity in a warming climate coupled with biomass burning pollutants rapidly reaching the TWP, as shown in this study, could have a significant impact on both radiation and chemistry in the TTL and tropical LS regions and, ultimately, on global stratospheric composition and climate.
Multiple studies have now shown that a variety of source regions of pollution can rapidly reach the remote and critical altitudes of the TTL and LS over the TWP year-round. Accurately forecasting changes in stratospheric composition and climate hence hinges on continuously monitoring the composition of the atmosphere at multiple spatial and temporal scales.
NASA ATTREX aircraft data are available at the NASA Langley Atmospheric Science Data Center (https://doi.org/10.5067/ASDC_DAAC/ATTREX/0003, NASA, 2015a; https://doi.org/10.5067/AIRCRAFT/ATTREX/CLOUD-H2O-TRACER-RADIATION, NASA, 2015b). NASA Aura MLS remote sensing data are available at the NASA Goddard Earth Sciences DISC (https://disc.gsfc.nasa.gov/datacollection/ML2CO_NRT_005.html, EOS MLS Science Team, 2022). ERA Interim products are available, following registration, at ECMWF (https://www.ecmwf.int/en/forecasts/dataset/ecmwf-reanalysis-interim, ECMWF, 2011).
The supplement related to this article is available online at https://doi.org/10.5194/acp-25-7543-2025-supplement.
JP and SW designed and executed the analysis. All co-authors performed the measurements and calculations and conducted their quality assurance and control. JP drafted the paper, and the co-authors provided editorial comments and corrections.
The contact author has declared that none of the authors has any competing interests.
Publisher’s note: Copernicus Publications remains neutral with regard to jurisdictional claims made in the text, published maps, institutional affiliations, or any other geographical representation in this paper. While Copernicus Publications makes every effort to include appropriate place names, the final responsibility lies with the authors.
We would like to gratefully acknowledge the pilots and ground crew of the NASA Global Hawk aircraft, as well as the NASA ESPO team, for their dedication and excellent work. We would also like to thank the JPL MLS science team for providing satellite data. We wish to extend a special thank you to Maryann Sargent and Jacob Lindaas for their invaluable contribution to field operations. Elliot Atlas acknowledges the contributions of Richard Lueb, Roger Hendershot, and Steve Gabbard to technical support in the field, as well as Xiaorong Zhu and Leslie Pope for GWAS lab analysis.
This research has been supported by the NASA Earth Venture program (grant nos. NNX10AO82A, NNA15BB89P, and NNX10AO83A).
This paper was edited by Marc von Hobe and reviewed by two anonymous referees.
Alcala, C. M. and Dessler, A. E.: Observations of deep convection in the tropics using the Tropical Rainfall Measuring Mission (TRMM) precipitation radar, J. Geophys. Res., 107, AAC 17-1–AAC 17-7, https://doi.org/10.1029/2002JD002457, 2002.
Akagi, S. K., Yokelson, R. J., Wiedinmyer, C., Alvarado, M. J., Reid, J. S., Karl, T., Crounse, J. D., and Wennberg, P. O.: Emission factors for open and domestic biomass burning for use in atmospheric models, Atmos. Chem. Phys., 11, 4039–4072, https://doi.org/10.5194/acp-11-4039-2011, 2011.
Amos, M., Young, P. J., Hosking, J. S., Lamarque, J.-F., Abraham, N. L., Akiyoshi, H., Archibald, A. T., Bekki, S., Deushi, M., Jöckel, P., Kinnison, D., Kirner, O., Kunze, M., Marchand, M., Plummer, D. A., Saint-Martin, D., Sudo, K., Tilmes, S., and Yamashita, Y.: Projecting ozone hole recovery using an ensemble of chemistry–climate models weighted by model performance and independence, Atmos. Chem. Phys., 20, 9961–9977, https://doi.org/10.5194/acp-20-9961-2020, 2020.
Anderson, D. C., Nicely, J. M., Salawitch, R. J., Canty, T. P., Dickerson, R. R., Hanisco, T. F., Wolfe, G. M., Apel, E. C., Atlas, E., Bannan, T., Bauguitte, S., Blake, N. J., Bresch, J. F., Campos, T. L., Carpenter, L. J., Cohen, M. D., Evans, M., Fernandez, R. P., Kahn, B. H., Kinnison, D. E., Hall, S. R., Harris, N. R. P., Hornbrook, R. S., Lamarque J.-F., Le Breton, M., Lee, J. D., Percival, C., Pfister, L., Pierce, R. B., Riemer, D. D., Saiz-Lopez, A., Stunder, B. J. B., Thompson, A. M., Ullmann, K., Vaughan, A., and Weinheimer, A. J.: A pervasive role for biomass burning in tropical high ozone/low water structures, Nat. Commun., 7, 10267, https://doi.org/10.1038/ncomms10267, 2016.
Andreae, M. O.: Emission of trace gases and aerosols from biomass burning – an updated assessment, Atmos. Chem. Phys., 19, 8523–8546, https://doi.org/10.5194/acp-19-8523-2019, 2019.
Andreae, M. O. and Merlet, P.: Emission of trace gases and aerosols from biomass burning, Global Biogeochem. Cy., 15, 955–966, https://doi.org/10.1029/2000GB001382, 2001.
Andrews, S. J., Carpenter, L. J., Apel, E. C., Atlas, E., Donets, V., Hopkins, J. R., Hornbrook, R. S., Lewis, A. C., Lidster, R. T., Lueb, R., Minaeian, J., Navarro, M., Punjabi, S., Riemer, D., and Schauffler, S.: A comparison of very short lived halocarbon (VSLS) and DMS aircraft measurements in the tropical west Pacific from CAST, ATTREX and CONTRAST, Atmos. Meas. Tech., 9, 5213–5225, https://doi.org/10.5194/amt-9-5213-2016, 2016.
Arias, P. A., Bellouin, N., Coppola, E., Jones, R. G., Krinner, G., Marotzke, J., Naik, V., Palmer, M. D., Plattner, G.-K., Rogelk, J., Rojas, M., Sillmann, J., Storelvmo, T., Thorne, P. W., and Trewin, B.: Technical Summary In Climate Change 2021: The Physical Science Basis, Contribution of Working Group I to the Sixth Assessment Report of the Intergovernmental Panel on Climate Change, Cambridge University Press, Cambridge, United Kingdom and New York, NY, USA, 33–144, https://doi.org/10.1017/9781009157896.002, 2021.
Ashfold, M. J., Pyle, J. A., Robinson, A. D., Meneguz, E., Nadzir, M. S. M., Phang, S. M., Samah, A. A., Ong, S., Ung, H. E., Peng, L. K., Yong, S. E., and Harris, N. R. P.: Rapid transport of East Asian pollution to the deep tropics, Atmos. Chem. Phys., 15, 3565–3573, https://doi.org/10.5194/acp-15-3565-2015, 2015.
Bergman, J. W., Jensen, E. J., Pfister, L., and Wang, Q.: Seasonal differences of vertical-transport efficiency in the tropical tropopause layer: On the interplay between tropical deep convection, large-scale vertical ascent, and horizontal circulations, J. Geophys. Res., 117, D05302, https://doi.org/10.1029/2011JD016992, 2012.
Bergman, J. W., Jensen, E. J., Pfister, L., and Bui, T. V.: Air parcel trajectory dispersion near the tropical tropopause, J. Geophys. Res.-Atmos., 121, 3759–3775, https://doi.org/10.1002/2015JD024320, 2016.
Bernath, P., Boone, C., and Crouse, J.: Wildfire smoke destroys stratospheric ozone, Science, 375, 1292–1295, https://doi.org/10.1126/science.abm5611, 2022.
Blake, N. J., Blake, D. R., Sive, B. C.,Chen, T., Rowland, F. S., Collins, J., Sachse, G. W., and Anderson, B. E.: Biomass burning emissions and vertical distribution of atmospheric methyl halides and other reduced carbon gases in the South Atlantic region, J. Geophys. Res., 101, 24151–24164, https://doi.org/10.1029/96JD00561, 1996.
Blake, N. J., Blake, D. R., Wingenter, O. W., Sive, B. C., Kang, C., Thornton, D. C., Bandy, A. R., Atlas, E. L., Flocke, F. M., Harris, J. M., and Rowland, F. S.: Aircraft measurements of the latitudinal, vertical, and seasonal variations of NMHCs, methyl nitrate, methyl halides, and DMS during the First Aerosol Characterization Experiment (ACE 1). J. Geophys. Res., 104, 21803–21818, https://doi.org/10.1029/1999JD900238, 1999.
Borrás, E. and Tortajada-Genaro, L. A.: Secondary organic aerosol formation from the photo-oxidation of benzene, Atmos. Environ., 47, 154–163, https://doi.org/10.1016/j.atmosenv.2011.11.020, 2012.
Cammas, J.-P., Brioude, J., Chaboureau, J.-P., Duron, J., Mari, C., Mascart, P., Nédélec, P., Smit, H., Pätz, H.-W., Volz-Thomas, A., Stohl, A., and Fromm, M.: Injection in the lower stratosphere of biomass fire emissions followed by long-range transport: a MOZAIC case study, Atmos. Chem. Phys., 9, 5829–5846, https://doi.org/10.5194/acp-9-5829-2009, 2009.
Chen, H., Karion, A., Rella, C. W., Winderlich, J., Gerbig, C., Filges, A., Newberger, T., Sweeney, C., and Tans, P. P.: Accurate measurements of carbon monoxide in humid air using the cavity ring-down spectroscopy (CRDS) technique, Atmos. Meas. Tech., 6, 1031–1040, https://doi.org/10.5194/amt-6-1031-2013, 2013.
Crosson, E. R.: A cavity ring-down analyzer for measurements of atmospheric levels of methane, carbon dioxide, and water vapor, Appl. Phys. B, 92, 403–408, 2008.
Cussac, M., Marécal, V., Thouret, V., Josse, B., and Sauvage, B.: The impact of biomass burning on upper tropospheric carbon monoxide: a study using MOCAGE global model and IAGOS airborne data, Atmos. Chem. Phys., 20, 9393–9417, https://doi.org/10.5194/acp-20-9393-2020, 2020.
Duncan, B. N., Strahan, S. E., Yoshida, Y., Steenrod, S. D., and Livesey, N.: Model study of the cross-tropopause transport of biomass burning pollution, Atmos. Chem. Phys., 7, 3713–3736, https://doi.org/10.5194/acp-7-3713-2007, 2007.
European Centre for Medium-range Weather Forecast (ECMWF): The ERA-Interim reanalysis dataset, Copernicus Climate Change Service (C3S) [data set], https://www.ecmwf.int/en/forecasts/dataset/ecmwf-reanalysis-interim (last access: 6 April 2023), 2011.
EOS MLS Science Team: MLS/Aura Near-Real-Time L2 Carbon Monoxide (CO) Mixing Ratio V005, Goddard Earth Sciences Data and Information Services Center (GES DISC) [data set], https://disc.gsfc.nasa.gov/datacollection/ML2CO_NRT_005.html (last access: 6 April 2023), 2022.
Fahey, D. W., Newman, P. A., Pyle, J. A., Safari, B., Chipperfield, M. P., Karoly, D. J., Kinnison, D. E., Ko, M. K., Santee, M. L., and Doherty, S. J.: Executive Summary: Scientific Assessment of Ozone Depletion: 2018, World Meteorological Organization, Global Ozone Research and Monitoring Project-Report No. 58, Geneva, Switzerland, 67 pp., ISBN 978-1-7329317-0-1, 2018.
Filus, M. T., Atlas, E. L., Navarro, M. A., Meneguz, E., Thomson, D., Ashfold, M. J., Carpenter, L. J., Andrews, S. J., and Harris, N. R. P.: Transport of short-lived halocarbons to the stratosphere over the Pacific Ocean, Atmos. Chem. Phys., 20, 1163–1181, https://doi.org/10.5194/acp-20-1163-2020, 2020.
Folkins, I.: Tropical Ozone as an Indicator of Deep Convection, J. Geophys. Res., 107, 4184, https://doi.org/10.1029/2001JD001178, 2002.
Fueglistaler, S., Wernli, H., and Peter, T.: Tropical troposphere-to-stratosphere transport inferred from trajectory calculations, J. Geophys. Res., 109, D03108, https://doi.org/10.1029/2003JD004069, 2004.
Fueglistaler, S., Dessler, A. E., Dunkerton, T. J., Folkins, I., Fu, Q., and Mote, P. W.: Tropical tropopause layer, Rev. Geophys., 47, RG1004, https://doi.org/10.1029/2008RG000267, 2009.
Gettelman, A., Salby, M. L., and Sassi, F.: Distribution and influence of convection in the tropical tropopause region, J. Geophys. Res., 107, 4080, https://doi.org/10.1029/2001JD001048, 2002a.
Gettelman, A., Randel, W. J., Wu, F., and Massie, S. T.: Transport of water vapor in the tropical tropopause layer, Geophys. Res. Lett., 29, 1009, https://doi.org/10.1029/2001GL013818, 2002b.
Gettelman, A., Forster, P. M. de F., Fujiwara, M., Fu, Q., Vömel, H., Gohar, L. K., Johanson, C., and Ammerman, M.: Radiation balance of the tropical tropopause layer, J. Geophys. Res., 109, D07103, https://doi.org/10.1029/2003JD004190, 2004.
Gkatzelis, G. I., Coggon, M. M., Stockwell, C. E., Hornbrook, R. S., Allen, H., Apel, E. C., Bela, M. M., Blake, D. R., Bourgeois, I., Brown, S. S., Campuzano-Jost, P., St. Clair, J. M., Crawford, J. H., Crounse, J. D., Day, D. A., DiGangi, J. P., Diskin, G. S., Fried, A., Gilman, J. B., Guo, H., Hair, J. W., Halliday, H. S., Hanisco, T. F., Hannun, R., Hills, A., Huey, L. G., Jimenez, J. L., Katich, J. M., Lamplugh, A., Lee, Y. R., Liao, J., Lindaas, J., McKeen, S. A., Mikoviny, T., Nault, B. A., Neuman, J. A., Nowak, J. B., Pagonis, D., Peischl, J., Perring, A. E., Piel, F., Rickly, P. S., Robinson, M. A., Rollins, A. W., Ryerson, T. B., Schueneman, M. K., Schwantes, R. H., Schwarz, J. P., Sekimoto, K., Selimovic, V., Shingler, T., Tanner, D. J., Tomsche, L., Vasquez, K. T., Veres, P. R., Washenfelder, R., Weibring, P., Wennberg, P. O., Wisthaler, A., Wolfe, G. M., Womack, C. C., Xu, L., Ball, K., Yokelson, R. J., and Warneke, C.: Parameterizations of US wildfire and prescribed fire emission ratios and emission factors based on FIREX-AQ aircraft measurements, Atmos. Chem. Phys., 24, 929–956, https://doi.org/10.5194/acp-24-929-2024, 2024.
Hintsa, E. J., Moore, F. L., Hurst, D. F., Dutton, G. S., Hall, B. D., Nance, J. D., Miller, B. R., Montzka, S. A., Wolton, L. P., McClure-Begley, A., Elkins, J. W., Hall, E. G., Jordan, A. F., Rollins, A. W., Thornberry, T. D., Watts, L. A., Thompson, C. R., Peischl, J., Bourgeois, I., Ryerson, T. B., Daube, B. C., Gonzalez Ramos, Y., Commane, R., Santoni, G. W., Pittman, J. V., Wofsy, S. C., Kort, E., Diskin, G. S., and Bui, T. P.: UAS Chromatograph for Atmospheric Trace Species (UCATS) – a versatile instrument for trace gas measurements on airborne platforms, Atmos. Meas. Tech., 14, 6795–6819, https://doi.org/10.5194/amt-14-6795-2021, 2021.
Hirsch, R. M. and Gilroy, E. J.: Methods of fitting a straight line to data: Examples in water resources, Water Resour. Bull., 20, 705–711, 1984.
Holton, J. R., Haynes, P. H., McIntyre, M. E., Douglass, A. R., Rood, R. B., and Pfister, L.: Stratosphere-troposphere exchange, Rev. Geophys., 33, 403–439, https://doi.org/10.1029/95RG02097, 1995.
Hooghiem, J. J. D., Popa, M. E., Röckmann, T., Grooß, J.-U., Tritscher, I., Müller, R., Kivi, R., and Chen, H.: Wildfire smoke in the lower stratosphere identified by in situ CO observations, Atmos. Chem. Phys., 20, 13985–14003, https://doi.org/10.5194/acp-20-13985-2020, 2020.
Hossaini, R., Chipperfield, M. P., Montzka, S. A., Leeson, A. A., Dhomse, S. S., and Pyle, J. A.: The increasing threat to stratospheric ozone from dichloromethane, Nat. Commun., 8, 1–9, https://doi.org/10.1038/ncomms15962, 2017.
Huang, L., Fu, R., Jiang, J. H., Wright, J. S., and Luo, M.: Geographic and seasonal distributions of CO transport pathways and their roles in determining CO centers in the upper troposphere, Atmos. Chem. Phys., 12, 4683–4698, https://doi.org/10.5194/acp-12-4683-2012, 2012.
Huynh, H. N. and McNeill, V. F.: The potential environmental and climate impacts of stratospheric aerosol injection: a review Environ. Sci. Atmos., 4, 114, https://doi.org/10.1039/d3ea00134b, 2024.
Jensen, E. J., Pfister, L., Ueyama, R., Bergman, J. W., and Kinnison, D.: Investigation of the transport processes controlling the geographic distribution of carbon monoxide at the tropical tropopause, J. Geophys. Res.-Atmos., 120, 2067–2086, https://doi.org/10.1002/2014JD022661, 2015.
Jensen, E. J., Pfister, L., Jordan, D. E., Bui, T. V., Ueyama, R., Singh, H. B., Thornberry, T. D., Rollins, A. W., Gao, R., Fahey, D. W., Rosenlof, K. H., Elkins, J. W., Diskin, G. S., DiGangi, J. P., Lawson, R. P., Woods, S., Atlas, E. L., Navarro Rodriguez, M. A., Wofsy, S. C., Pittman, J., Bardeen, C. G., Toon, O. B., Kindel, B. C., Newman, P. A., McGill, M. J., Hlavka, D. L., Lait, L. R., Schoeberl, M. R., Bergman, J. W., Selkirk, H. B., Alexander, M. J., Kim, J., Lim, B. H., Stutz, J., and Pfeilsticker, K.: The NASA Airborne Tropical Tropopause Experiment (ATTREX): High-altitude aircraft measurements in the tropical western Pacific, B. Am. Meteorol. Soc., 98, 129–143, https://doi.org/10.1175/BAMS-D-14-00263.1, 2017a.
Jensen, E. J., Thornberry, T. D., Rollins, A. W., Ueyama, R., Pfister, L., Bui, T., Diskin, G. S., DiGangi, J. P., Hintsa, E., Gao, R.-S., Woods, S., Lawson, R. P., and Pittman, J.: Physical processes controlling the spatial distributions of relative humidity in the tropical tropopause layer over the Pacific, J. Geophys. Res., 122, 6094–6107, https://doi.org/10.1002/2017JD026632, 2017b.
Jia, Y., Hahn, J., Quack, B., Jones, E., Brehon, M., and Tegtmeier, S.: Anthropogenic bromoform at the extratropical tropopause, Geophys. Res. Lett., 50, e2023GL102894, https://doi.org/10.1029/2023GL102894, 2023.
Jiang, J. H., Livesey, N. J., Su, H., Neary, L., McConnell, J. C., and Richards, N. A. D.: Connecting surface emissions, convective uplifting, and long-range transport of carbon monoxide in the upper troposphere: New observations from the Aura Microwave Limb Sounder, Geophys. Res. Lett., 34, L18812, https://doi.org/10.1029/2007GL030638, 2007.
Jones, M. W, Abatzoglou, J. T., Veraverbeke, S., Andela, N., Lasslop, G., Forkel, M., Smith, A. J. P., Burton, C., Betts, R. A., van der Werf, G. R., Sitch, S., Canadell, J. G., Santin, C., Kolden, C., Doerr, S. H., and Le Quere, C.: Global and Regional Trends and Drivers of Fire Under Climate Change, Rev. Geophys., 60, e2020RG000726, https://doi.org/10.1029/2020RG000726, 2022.
Jost, H.-J., Drdla, K., Stohl, A., Pfister, L., Loewenstein, M., Lopez, J. P., Hudson, P. K., Murphy, D. M., Cziczo, D. J., Fromm, M., Bui, T. P., Dean-Day, J., Gerbig, C., Mahoney, M. J., Richard, E. C., Spichtinger, N., Pittman, J. V., Weinstock, E. M., Wilson, J. C., and Xueref, I.: In-situ observations of mid-latitude forest fire plumes deep in the stratosphere, Geophys. Res. Lett., 31, L11101, https://doi.org/10.1029/2003GL019253, 2004.
Katich, J. M., Apel, E. C., Bourgeois, I., Brock, C. A., Bui, T. P., Campuzano-Jost, P., Commane, R., Daube, B., Dollner, M., Fromm, M., Froyd, K. D., Hills, A. J., Hornbrook, R. S., Jimenez, J. L., Kupc, A., Lamb, K. D., McKain, K., Moore, F., Murphy, D. M., Nault, B. A., Peischl, J., Perring, A. E., Peterson, D. A., Ray, E. A., Rosenlof, K. H., Ryerson, T., Schill, G. P., Schroder, J. C., Weinzierl, B., Thompson, C., Williamson, C. J., Wofsy, S. C., Yu, P., and Schwarz, J. P.: Pyrocumulonimbus affect average stratospheric aerosol composition, Science, 379, 815–820, https://doi.org/10.1126/science.add3101, 2023.
Khaykin, S., Legras, B., Bucci, S., Sellitto, P., Isaksen, L., Tencé, F., Bekki, S., Bourassa, A., Rieger, L., Zawada, D., and Jumelet, J.: The 2019/20 Australian wildfires generated a persistent smoke-charged vortex rising up to 35 km altitude, Commun. Earth Environ., 1, 22, https://doi.org/10.1038/s43247-020-00022-5, 2020.
Koenig, T. K., Volkamer, R., Baidar, S., Dix, B., Wang, S., Anderson, D. C., Salawitch, R. J., Wales, P. A., Cuevas, C. A., Fernandez, R. P., Saiz-Lopez, A., Evans, M. J., Sherwen, T., Jacob, D. J., Schmidt, J., Kinnison, D., Lamarque, J.-F., Apel, E. C., Bresch, J. C., Campos, T., Flocke, F. M., Hall, S. R., Honomichl, S. B., Hornbrook, R., Jensen, J. B., Lueb, R., Montzka, D. D., Pan, L. L., Reeves, J. M., Schauffler, S. M., Ullmann, K., Weinheimer, A. J., Atlas, E. L., Donets, V., Navarro, M. A., Riemer, D., Blake, N. J., Chen, D., Huey, L. G., Tanner, D. J., Hanisco, T. F., and Wolfe, G. M.: BrO and inferred Bry profiles over the western Pacific: relevance of inorganic bromine sources and a Bry minimum in the aged tropical tropopause layer, Atmos. Chem. Phys., 17, 15245–15270, https://doi.org/10.5194/acp-17-15245-2017, 2017.
Lannuque, V., Sauvage, B., Barret, B., Clark, H., Athier, G., Boulanger, D., Cammas, J.-P., Cousin, J.-M., Fontaine, A., Le Flochmoën, E., Nédélec, P., Petetin, H., Pfaffenzeller, I., Rohs, S., Smit, H. G. J., Wolff, P., and Thouret, V.: Origins and characterization of CO and O3 in the African upper troposphere, Atmos. Chem. Phys., 21, 14535–14555, https://doi.org/10.5194/acp-21-14535-2021, 2021.
Livesey, N. J., Filipiak, M. J., Froidevaux, L., Read, W. G., Lambert, A., Santee, M. L., Jiang, J. H., Pumphrey, H. C., Waters, J. W., Cofield, R. E., Cuddy, D. T., Daffer, W. H., Drouin, B. J., Fuller, R. A., Jarnot, R. F., Jiang, Y. B., Knosp, B. W., Li, Q. B., Perun, V. S., Schwartz, M. J., Snyder, W. V., Stek, P. C., Thurstans, R. P., Wagner, P. A., Avery, M., Browell, E. V., Cammas, J.-P., Christensen, L. E., Diskin, G. S., Gao, R.-S., Jost, H.-J., Loewenstein, M., Lopez, J. D., Nedelec, P., Osterman, G. B., Sachse, G. W., and Webster, C. R.: Validation of Aura Microwave Limb Sounder O3 and CO observations in the upper troposphere and lower stratosphere, J. Geophys. Res., 113, D15S02, https://doi.org/10.1029/2007JD008805, 2008.
Liu, N., Liu, C., and Hayden, L.: Climatology and Detection of Overshooting Convection From 4 Years of GPM Precipitation Radar and Passive Microwave Observations, J. Geophys. Res., 110, D23104, https://doi.org/10.1029/2005JD006063, 2020.
Martínez-Alonso, S., Deeter, M., Worden, H., Borsdorff, T., Aben, I., Commane, R., Daube, B., Francis, G., George, M., Landgraf, J., Mao, D., McKain, K., and Wofsy, S.: 1.5 years of TROPOMI CO measurements: comparisons to MOPITT and ATom, Atmos. Meas. Tech., 13, 4841–4864, https://doi.org/10.5194/amt-13-4841-2020, 2020.
Mauzerall, D. L., Logan, J. A., Jacob, D. J., Anderson, B. E., Blake, D. R., Bradshaw, J. D., Heikes, B., Sachse, G. W., Singh, H., and Talbot, B.: Photochemistry in biomass burning plumes and implications for tropospheric ozone over the tropical South Atlantic, J. Geophys. Res., 103, 8401–8423, https://doi.org/10.1029/97JD02612, 1998.
Mühle, J., C., Brenninkmeijer, A. M., Rhee, T. S., Slemr, F., Oram, D. E., Penkett, S. A., and Zahn, A.: Biomass burning and fossil fuel signatures in the upper troposphere observed during a CARIBIC flight from Namibia to Germany, Geophys. Res. Lett., 29, 1910, https://doi.org/10.1029/2002GL015764, 2002.
NASA: ATTREX Global Hawk UAS In-Situ Trace Gas Measurements, NASA Langley Atmospheric Science Data Center DAAC [data set], https://doi.org/10.5067/ASDC_DAAC/ATTREX/0003, 2015a.
NASA: ATTREX Global Hawk UAS Meteorological and Navigational Measurements, NASA Langley Atmospheric Science Data Center DAAC [data set], https://doi.org/10.5067/AIRCRAFT/ATTREX/CLOUD-H2O-TRACER-RADIATION, 2015b.
Newton, R., Vaughan, G., Hintsa, E., Filus, M. T., Pan, L. L., Honomichl, S., Atlas, E., Andrews, S. J., and Carpenter, L. J.: Observations of ozone-poor air in the tropical tropopause layer, Atmos. Chem. Phys., 18, 5157–5171, https://doi.org/10.5194/acp-18-5157-2018, 2018.
Oram, D. E., Ashfold, M. J., Laube, J. C., Gooch, L. J., Humphrey, S., Sturges, W. T., Leedham Elvidge, E. C., Forster, G. L., Harris, N. R. P., Mead, M. I., Samah, A. A., Phang, S. M., Ou-Yang, C.-F., Lin, N.-H., Wang, J.-L., Baker, A. K., Brenninkmeijer, C. A. M., and Sherry, D.: A growing threat to the ozone layer from short-lived anthropogenic chlorocarbons, Atmos. Chem. Phys., 17, 11929–11941, https://doi.org/10.5194/acp-17-11929-2017, 2017.
Pan, L. L., Honomichl, S. B., Bui, T. P., Thornberry, T., Rollins, A., Hintsa, E., and Jensen, E. J.: Lapse rate or cold point: The tropical tropopause identified by in situ trace gas measurements, Geophys. Res. Lett., 45, 10756–10763, https://doi.org/10.1029/2018GL079573, 2018.
Pan, L. L., Honomichl, S. B., Thornberry, T., Rollins, A., Bui, T. P., Pfister, L., and Jensen, E. J.: Observational evidence of horizontal transport-driven dehydration in the TTL, Geophys. Res. Lett., 46, 7848–7856, https://doi.org/10.1029/2019GL083647, 2019.
Park, S., Atlas, E. L., Jiménez, R., Daube, B. C., Gottlieb, E. W., Nan, J., Jones, D. B. A., Pfister, L., Conway, T. J., Bui, T. P., Gao, R.-S., and Wofsy, S. C.: Vertical transport rates and concentrations of OH and Cl radicals in the Tropical Tropopause Layer from observations of CO2 and halocarbons: implications for distributions of long- and short-lived chemical species, Atmos. Chem. Phys., 10, 6669–6684, https://doi.org/10.5194/acp-10-6669-2010, 2010.
Peterson, D. A., Fromm, M. D., McRae, R. H. D., Campbell, J. R., Hyer, E. J., Taha, G., Camacho, C. P., Kablick III, G. P., Schmidt, C. C., and DeLand, M. T.: Australia's Black Summer pyrocumulonimbus super outbreak reveals potential for increasingly extreme stratospheric smoke events, npj Clim. Atmos. Sci., 4, 38, https://doi.org/10.1038/s41612-021-00192-9, 2021.
Pfister, L., Selkirk, H. B., Jensen, E. J., Schoeberl, M. R., Toon, O. B., Browell, E. V., Grant, W. B., Gary, B., Mahoney, M. J., Bui, T. V., and Hintsa, E.: Aircraft observations of thin cirrus clouds near the tropical tropopause, J. Geophys. Res., 106, 9765–9786, https://doi.org/10.1029/2000JD900648, 2001.
Pfister, L., Ueyama, R., Jensen, E. J., and Schoeberl, M. R.: Deep convective cloud top altitudes at high temporal and spatial resolution, Earth and Space Science, 9, e2022EA002475, https://doi.org/10.1029/2022EA002475, 2022.
Podglajen, A., Hertzog, A., Plougonven, R., and Žagar, N.: Assessment of the accuracy of (re)analyses in the equatorial lower stratosphere, J. Geophys. Res.-Atmos., 119, 11166–11188, https://doi.org/10.1002/2014JD021849, 2014.
Randel, W. J. and Jensen, E.: Physical processes in the tropical tropopause layer and their roles in a changing climate, Nat. Geosci., 6, 169–176, https://doi.org/10.1038/ngeo1733, 2013.
Rella, C. W., Chen, H., Andrews, A. E., Filges, A., Gerbig, C., Hatakka, J., Karion, A., Miles, N. L., Richardson, S. J., Steinbacher, M., Sweeney, C., Wastine, B., and Zellweger, C.: High accuracy measurements of dry mole fractions of carbon dioxide and methane in humid air, Atmos. Meas. Tech., 6, 837–860, https://doi.org/10.5194/amt-6-837-2013, 2013.
Rigby, M., Montzka, S. A., Prinn, R. G., White, J. W., Young, D., O'Doherty, S., Lunt, M. F., Ganesan, A. L., Manning, A. J., Simmonds, P. G., and Salameh, P. K.: Role of atmospheric oxidation in recent methane growth, P. Natl. Acad. Sci. USA, 114, 5373–5377, https://doi.org/10.1073/pnas.1616426114, 2017.
Rollins, A. W., Thornberry, T. D., Gao, R. S., Woods, S., Lawson, R. P., Bui, T. P., Jensen, E. J., and Fahey, D. W.: Observational constraints on the efficiency of dehydration mechanisms in the tropical tropopause layer, Geophys. Res. Lett., 43, 2912–2918, https://doi.org/10.1002/2016GL067972, 2016.
Rossow, W. and Pearl, C.: 22-Year survey of tropical convection penetrating into the lower stratosphere, Geophys. Res. Lett., 34, L04803, https://doi.org/10.1029/2006GL028635, 2007.
Santee, M. L., Livesey, N. J., Manney, G. L., Lambert, A., and Read, W. G.: Methyl chloride from the Aura Microwave Limb Sounder: First global climatology and assessment of variability in the upper troposphere and stratosphere, J. Geophys. Res.-Atmos., 118, 13532–13560, https://doi.org/10.1002/2013JD020235, 2013.
Schauffler, S. M., Atlas, E. L., Blake, D. R., Flocke, F., Lueb, R. A., Lee-Taylor, J. M., Stroud, V., and Travnicek, W.: Distributions of brominated organic compounds in the troposphere and lower stratosphere, J. Geophys. Res.-Atmos. 104, 21513–21535, https://doi.org/10.1029/1999JD900197, 1999.
Schoeberl, M. R., Duncan, B. N., Douglass, A. R., Waters, J. W., Livesey, N. J., Read, W. J., and Filipiak, M. J.: The carbon monoxide tape recorder, Geophys. Res. Lett., 33, L12811, https://doi.org/10.1029/2006GL026178, 2006.
Scott, S. G., Bui, T. P., Chan, K. R., and Bowen, S. W.: The meteorological measurement system on the NASA ER-2 aircraft, J. Atmos. Ocean. Tech., 7, 525–540, 1990.
Solomon, S.: Stratospheric ozone depletion: A review of concepts and history, Rev. Geophys., 37, 275–316, https://doi.org/10.1029/1999RG900008, 1999.
Solomon, S., Dube, K., Stone, K., Yu, P., Kinnison, D., Toon, O. B., Strahan, S. E., Rosenlof, K. H., Portmann, R., Davis, S., Randel, W., Bernath, P., Boone, C., Bardeen, C. G., Bourassa, A., Zawada, D., and Degenstein, D.: On the stratospheric chemistry of midlatitude wildfire smoke, P. Natl. Acad. Sci. USA, 119, e2117325119, https://doi.org/10.1073/pnas.2117325119, 2022.
Solomon, S., Stone, K., Yu, P., Murphy, D. M., Kinnison, D., Ravishankara, A. R., and Wang, P.: Chlorine activation and enhanced ozone depletion induced by wildfire aerosol, Nature, 615, 260–264, https://doi.org/10.1038/s41586-022-05683-0, 2023.
Tegtmeier, S., Atlas, E., Quack, B., Ziska, F., and Krüger, K.: Variability and past long-term changes of brominated very short-lived substances at the tropical tropopause, Atmos. Chem. Phys., 20, 7103–7123, https://doi.org/10.5194/acp-20-7103-2020, 2020.
Thornberry, T. D., Rollins, A. W., Gao, R. S., Watts, L. A., Ciciora, S. J., McLaughlin, R. J., and Fahey, D. W.: A two-channel, tunable diode laser-based hygrometer for measurement of water vapor and cirrus cloud ice water content in the upper troposphere and lower stratosphere, Atmos. Meas. Tech., 8, 211–224, https://doi.org/10.5194/amt-8-211-2015, 2015.
Torres, O., Bhartia, P. K., Taha, G., Jethva, H., Das, S., Colarco, P., Krotkov, N., Omar, A., and Ahn, C.: Stratospheric injection of massive smoke plume from Canadian boreal fires in 2017 as seen by DSCOVR-EPIC, CALIOP, and OMPS-LP observations, J. Geophys. Res., 125, e2020JD032579, https://doi.org/10.1029/2020JD032579, 2020.
Treadaway, V., Atlas, E., Schauffler, S., Navarro, M., Ueyama, R., Pfister, L., Thornberry, T., Rollins, A., Elkins, J., Moore, F., and Rosenlof, K.: Long-range transport of Asian emissions to the West Pacific tropical tropopause layer, J. Atmos. Chem., 29, 81–100, https://doi.org/10.1007/s10874-022-09430-7, 2022.
Wales, P. A., Salawitch, R. J., Nicely, J. M., Anderson, D. C., Canty, T. P., Baidar, S., Dix, B., Koenig, T. K., Volkamer, R., Chen, D., Huey, L. G., Tanner, D. J., Cuevas, C. A., Fernandez, R. P., Kinnison, D. E., Lamarque J.-F., Saiz-Lopez, A., Atlas, E. L., Hall, S. R., Navarro, M. A., Pan, L. L., Schauffler, S. M., Stell, M., Tilmes, S., Ullmann, K., Weinheimer, A. J., Akiyoshi, H., Chipperfield, M. P., Deushi, M., Dhomse, S. S., Feng, W., Graf, P., Hossaini, R., Jockel, P., Mancini, E., Michou, M., Morgenstern, O., Oman, L. D., Pitari, G., Plummer, D. A., Revell, L. E., Rozanov, E., Saint-Martin, D., Schofield, R., Stenke, A., Stone, K. A., Visioni, D., Yamashita, Y., and Zeng, G.: Stratospheric injection of brominated very short-lived substances: Aircraft observations in the Western Pacific and representation in global models, J. Geophys. Res., 123, 5690–5719, https://doi.org/10.1029/2017JD027978, 2018.
Wofsy S. C. and HIPPO Science Team and Cooperating Modellers and Satellite Teams: HIAPER Pole-to-Pole Observations (HIPPO): fine-grained, global-scale measurements of climatically important atmospheric gases and aerosols, Philos. T. R. Soc. A, 369, 2073–2086, https://doi.org/10.1098/rsta.2010.0313, 2011.
Yang, Q., Fu, Q., and Hu, Y.: Radiative impacts of clouds in the tropical tropopause layer, J. Geophys. Res., 115, D00H12, https://doi.org/10.1029/2009JD012393, 2010.