the Creative Commons Attribution 4.0 License.
the Creative Commons Attribution 4.0 License.
 | 14 Jul 2025
Impact of weather systems on observed precipitation at Ny-Ålesund (Svalbard)
Christian Buhren
Rosa Gierens
Giovanni Chellini
Melanie Lauer
Andreas Walbröl
Sandro Dahlke
Pavel Krobot
Mario Mech
Ground-based precipitation observations are sparse in the Arctic but are needed to better understand precipitation processes and to provide reference data sets for models and satellite products. This study presents new, temporally highly resolved precipitation measurements from a Pluvio precipitation gauge and a Parsivel disdrometer at the Arctic research station AWIPEV, part of the Ny-Ålesund Research Station, Svalbard. Using the information on the precipitation phase by Parsivel, we derived a temperature-dependent separation of precipitation into liquid and solid mass. The Pluvio precipitation amount and the Parsivel/temperature-based precipitation type were analyzed for the period August 2017–December 2021 and related to the presence of synoptic-scale weather systems, i.e., atmospheric rivers (ARs), cyclones and fronts, detected from ERA5 reanalysis data. ARs occurred only 8 % of the time at Ny-Ålesund but contributed to about 42 % of the total precipitation amount with a high liquid mass fraction (72 %). Cyclones occurred 20 % of the time and were associated with 39 % of the precipitation, mainly in solid form (62 %). Frontal systems play a minor role in the precipitation amount at Ny-Ålesund. Extreme events, i.e., days with daily precipitation sums above the 98th percentile, contribute 18 % to the total precipitation amount. All of these events are related to enhanced water vapor transport, often in the form of ARs and in combination with fronts and a high liquid mass fraction. Liquid precipitation in winter is mainly connected to ARs. These new measurements will help to better characterize uncertainties in gauge-based precipitation observations and the local variability of precipitation.
- Article
(9464 KB) - Full-text XML
- BibTeX
- EndNote


Precipitation is a key climate variable that is critical to the Arctic climate system. It is an integral part of the hydrological cycle and has a direct impact on the Arctic Ocean and land freshwater budget (e.g. Serreze et al., 1995; Cullather et al., 2000; Prowse et al., 2015; Vihma et al., 2016). In the Arctic, most of the precipitation falls as snow (Bintanja and Andry, 2017), altering the surface albedo (Box et al., 2012; Riihelä et al., 2019) and thus the surface energy budget. Snow also directly contributes to the surface mass balance of the cryosphere. For example, precipitation is the major positive contribution to the mass balance of the Greenland ice sheet (Bring et al., 2016; van den Broeke et al., 2009), as well as to ice caps and glaciers in the Arctic. Snow on sea ice also affects sea ice growth and decay via different snow–sea ice interactions (Serreze and Hurst, 2000).
In the last few decades, the Arctic has experienced a rapidly changing climate with a substantial increase in near-surface air temperature, known as Arctic amplification (Serreze and Francis, 2006; Serreze and Barry, 2011; Wendisch et al., 2023). Recent studies have shown that Arctic warming during the last few decades was 4 times higher than global warming (Zhou et al., 2024; Rantanen et al., 2022). In particular, the Svalbard archipelago is located in the warmest region of the Arctic and has experienced the highest temperature increase (Dahlke and Maturilli, 2017). The potential causes for Arctic amplification are central questions in Arctic research (Wendisch et al., 2023). In this context, various local feedback mechanisms (e.g., albedo, lapse rate, water vapor, Planck and cloud feedback), as well as remote ones (e.g., oceanic heat and meridional heat and moisture transport), are discussed (e.g., Goosse et al., 2018; Pithan and Mauritsen, 2014; Wendisch et al., 2023; Mewes and Jacobi, 2019).
The increase in Arctic temperature and the associated mechanisms mentioned before also affect the hydrological cycle of the Arctic climate system and, thus, precipitation. Observations (Serreze et al., 2024; Champagne et al., 2024; Hanssen-Bauer et al., 2019), reanalyses and climate models (Serreze et al., 2024; Cai et al., 2024) reveal a substantial increase in precipitation in the Arctic in the last few decades. For example, all precipitation gauges in Svalbard show a positive trend in annual precipitation, with significant trends for Bjørnøya, Hopen and Ny-Ålesund (Hanssen-Bauer et al., 2019). However, since gauge data in Hanssen-Bauer et al. (2019) have not been corrected for undercatch, trends of precipitation are also uncertain due to the shift to more liquid precipitation, which is more efficiently collected by precipitation gauges. The significant observed positive trend for Ny-Ålesund has also been confirmed by Champagne et al. (2024), who also distinguished between solid and liquid precipitation amounts and applied different correction functions to 12-hourly precipitation gauge data. The authors pointed out that correcting for undercatch is crucial in trend detection since it significantly impacts the trend magnitude, particularly for snowfall and thus also for total precipitation. Although both solid and liquid precipitation amounts at Ny-Ålesund show positive trends, only the liquid one was found to be significant (independently of the correction method). Also, future projections reveal an increase in Arctic precipitation (Cai et al., 2024; McCrystall et al., 2021; Bintanja and Andry, 2017; Bintanja et al., 2020). These simulations have also demonstrated the increasing importance of rain as it will become the most dominant precipitation type in the future in the Arctic (Dou et al., 2022; Bintanja, 2018; Bintanja and Andry, 2017).
The discrimination of the precipitation phase is thus crucial to accurately describe Arctic precipitation changes. For precipitation gauge measurements, it is critical since correction functions often depend on precipitation type. As direct observations on the precipitation phase are usually not available, temperature is often used as a proxy to differentiate between solid and liquid (Champagne et al., 2024; Kochendorfer et al., 2017; Førland and Hanssen-Bauer, 2000; Kneifel et al., 2022). In this way, precipitation amounts from gauge measurements, for example, can be divided into solid and liquid. For example, Champagne et al. (2024) regarded all precipitation as solid for 2 m temperatures <1 °C and as liquid otherwise. In numerical weather prediction and climate models, parameterizations of precipitation processes and thus phase discrimination heavily depend on temperature (e.g., ECMWF, 2016; Seifert and Beheng, 2005). Also, in land surface models, a temperature threshold and/or a temperature range in which both rain and snow occur is often assumed (Jennings et al., 2018; Harpold et al., 2017; Feiccabrino et al., 2015). However, the assumed temperature dependencies and applied thresholds are very uncertain.
Recent simulation studies have shown that in the 21st century not just the Arctic mean precipitation will increase but also its interannual variability (Bintanja et al., 2020; Hartmuth et al., 2023). Thus, extreme precipitation is also becoming more likely. The increase in precipitation is caused by different reasons, i.e., a higher local moisture supply (Bintanja and Selten, 2014; Kopec et al., 2016) and increased poleward transport of atmospheric moisture from lower latitudes (Bengtsson et al., 2011; Bintanja et al., 2020; McCrystall et al., 2021; Pettersen et al., 2022), but also by a stronger radiative loss of energy to space (Pithan and Jung, 2021). Observations have shown an increase in the frequency of extreme precipitation events (e.g., Vikhamar-Schuler et al., 2016; Serreze et al., 2015). Based on precipitation gauge data, Serreze et al. (2015), for example, revealed a significant increase in frequency and intensity for extreme precipitation events at Ny-Ålesund in winter. Vikhamar-Schuler et al. (2016) further showed that the occurrence of melt days, i.e., days with temperature >0 °C, and the accumulated precipitation during these events have increased in Svalbard in winter. Rain-on-snow events, which have implications for the cryosphere, ecosystem and infrastructure, have also been studied in further detail (e.g., Hansen et al., 2014, 2019; Peeters et al., 2019; Xie et al., 2024).
Such extreme winter events are connected to warm and moist air masses being advected and are also related to cyclones whose number has been found to increase in the last few decades (Wickström et al., 2020; Rinke et al., 2017). Based on station and Modern-Era Retrospective analysis for Research and Applications (MERRA) reanalysis data from 1979 to 2014, Serreze et al. (2015) showed that the general synoptic situation during extreme precipitation events at Ny-Ålesund is linked to low-surface-pressure systems off the southeast coast of Greenland and between Greenland and Svalbard, with positive anomalies in 500 hPa height over Scandinavia and the Barents Sea and negative anomalies centered over Greenland. These conditions favor a southerly flow with advection of water vapor from the North Atlantic. Strong uplift in the regions of low surface pressure then causes precipitation formation. Furthermore, atmospheric rivers (ARs; Ralph et al., 2020) are an essential mechanism for the poleward transport of moisture (Guan and Waliser, 2015). They can significantly impact the Arctic via enhanced precipitation, concurrent heat advection and increased longwave downward radiation with subsequent snow and ice melt (e.g., Mattingly et al., 2018, 2020; Bresson et al., 2022). In a recent study by Lauer et al. (2023), the impact of ARs and associated weather systems on Arctic precipitation has been analyzed in detail. Based on ERA5 reanalysis data, precipitation was attributed to ARs, cyclones and fronts for two campaign periods in early summer 2017 and early spring 2019. Lauer et al. (2023) found that for the early spring campaign, precipitation was dominated by cyclone-related weather systems, while for the early summer period both ARs and fronts contributed by 40 % and 55 %, respectively. Furthermore, Dobler et al. (2020) investigated atmospheric circulation types, their future changes and their impact on precipitation over Svalbard. Based on future climate projections using a regional climate model, they found a distinct increase in precipitation over Svalbard in the period 2071–2100 compared to 1971–2000. This increase is not related to changes in circulation type frequencies but rather due to changes in atmospheric conditions, particularly during cyclonic circulation patterns.
Even though many studies addressed precipitation in the Arctic and Svalbard in particular, observing and modeling Arctic precipitation is still very challenging and associated with quite some uncertainties. Continuous, highly temporally resolved ground-based observations of precipitation, which are still sparse in the Arctic, are thus necessary to understand precipitation and precipitation-related processes better and to act as a reference data set. In this study, we therefore present a new data set of ground-based precipitation observations at Ny-Ålesund, Svalbard, which includes an OTT Pluvio2L weighing gauge and an OTT Parsivel2 disdrometer. While the Pluvio measures surface precipitation amount, precipitation type is provided by the Parsivel. Compared to classical manual precipitation gauge data, Pluvio measurements rely on the weighing principle and are available at a high temporal resolution, i.e., 1 min. The precipitation bucket is combined with a weighing mechanism including a stainless steel load cell and a temperature sensor that accounts for temperature changes. Since the whole bucket is weighed, there are no losses due to wetting of the inner walls. Due to the high temporal sampling, uncertainties due to evaporation are avoided. With a high manufacturer-declared accuracy, i.e., the larger value of 0.01 mm or ±1 %, trace precipitation can be, in principle, better captured. Of course, wind-induced undercatch still affects the measurements as this is the case for all precipitation gauges. While manual 12-hourly precipitation measurements have been performed by the Norwegian Meteorological Institute (MET Norway) with a standard precipitation gauge already since 1975, automatic hourly resolved precipitation measurements with a Geonor T-200 only started in 1997 by MET Norway. However, the recorded Geonor data can not be directly used as more sophisticated data corrections and noise filtering must be applied first (Mareile Wolff, Norwegian Meteorological Institute, personal communication, 19 January 2025). With the Parsivel precipitation type classification, temperature-independent information on the precipitation phase is now available, further facilitating mass separation into liquid and solid precipitation. In this way, Pluvio and Parsivel complement the existing MET Norway precipitation observations at Ny-Ålesund. This paper will present the results of data from more than 4 years of Pluvio and Parsivel measurements. As previous studies have highlighted the importance of large-scale circulation patterns for precipitation, we link the observed precipitation at Ny-Ålesund to specific weather systems on the synoptic scale, i.e., here, ARs, cyclones and frontal zones following the methodology by Lauer et al. (2023). In this paper, we will thus focus on the following research questions:
-
Can the Parsivel constrain a temperature-based mass separation of precipitation into solid and liquid precipitation? How do phase occurrence and mass separation depend on temperature?
-
How are precipitation amount and type related to large-scale synoptic systems like ARs, cyclones and fronts?
-
Which role do these systems play in extreme precipitation events?
In the next section, the different data sets and methods are introduced. In Sect. 3, the performance of the Pluvio and Parsivel measurements is assessed. This includes a comparison of the Pluvio precipitation amount to the MET Norway manual observations (with and without undercatch correction applied) and a discussion on how precipitation type is attributed. Section 4 deals with the impact of ARs, cyclones and fronts on precipitation at Ny-Ålesund. Conclusions are presented in Sect. 5.
The core instruments used in this analysis are a Parsivel and a Pluvio, operated by the University of Cologne within the Transregional Collaborative Research Centre (TR 172) “Arctic Amplification: Climate Relevant Atmospheric and Surface Processes and Feedback Mechanisms (AC)3” (https://ac3-tr.com, last access: 10 July 2025; Wendisch et al., 2017). The instruments were installed in 2017 at the German–French AWIPEV research base (78.92308° N, 11.92108° E; 11 m above mean sea level; Fig. 1) that is operated jointly by the Alfred Wegener Institute Helmholtz Centre for Polar and Marine Research (AWI) and the French Polar Institute Paul-Émile Victor (IPEV) and is part of the Ny-Ålesund Research Station, Svalbard. In this work, the data for the years 2017–2021 are considered. More detailed descriptions of the instruments and the additional data used in this study are given below.
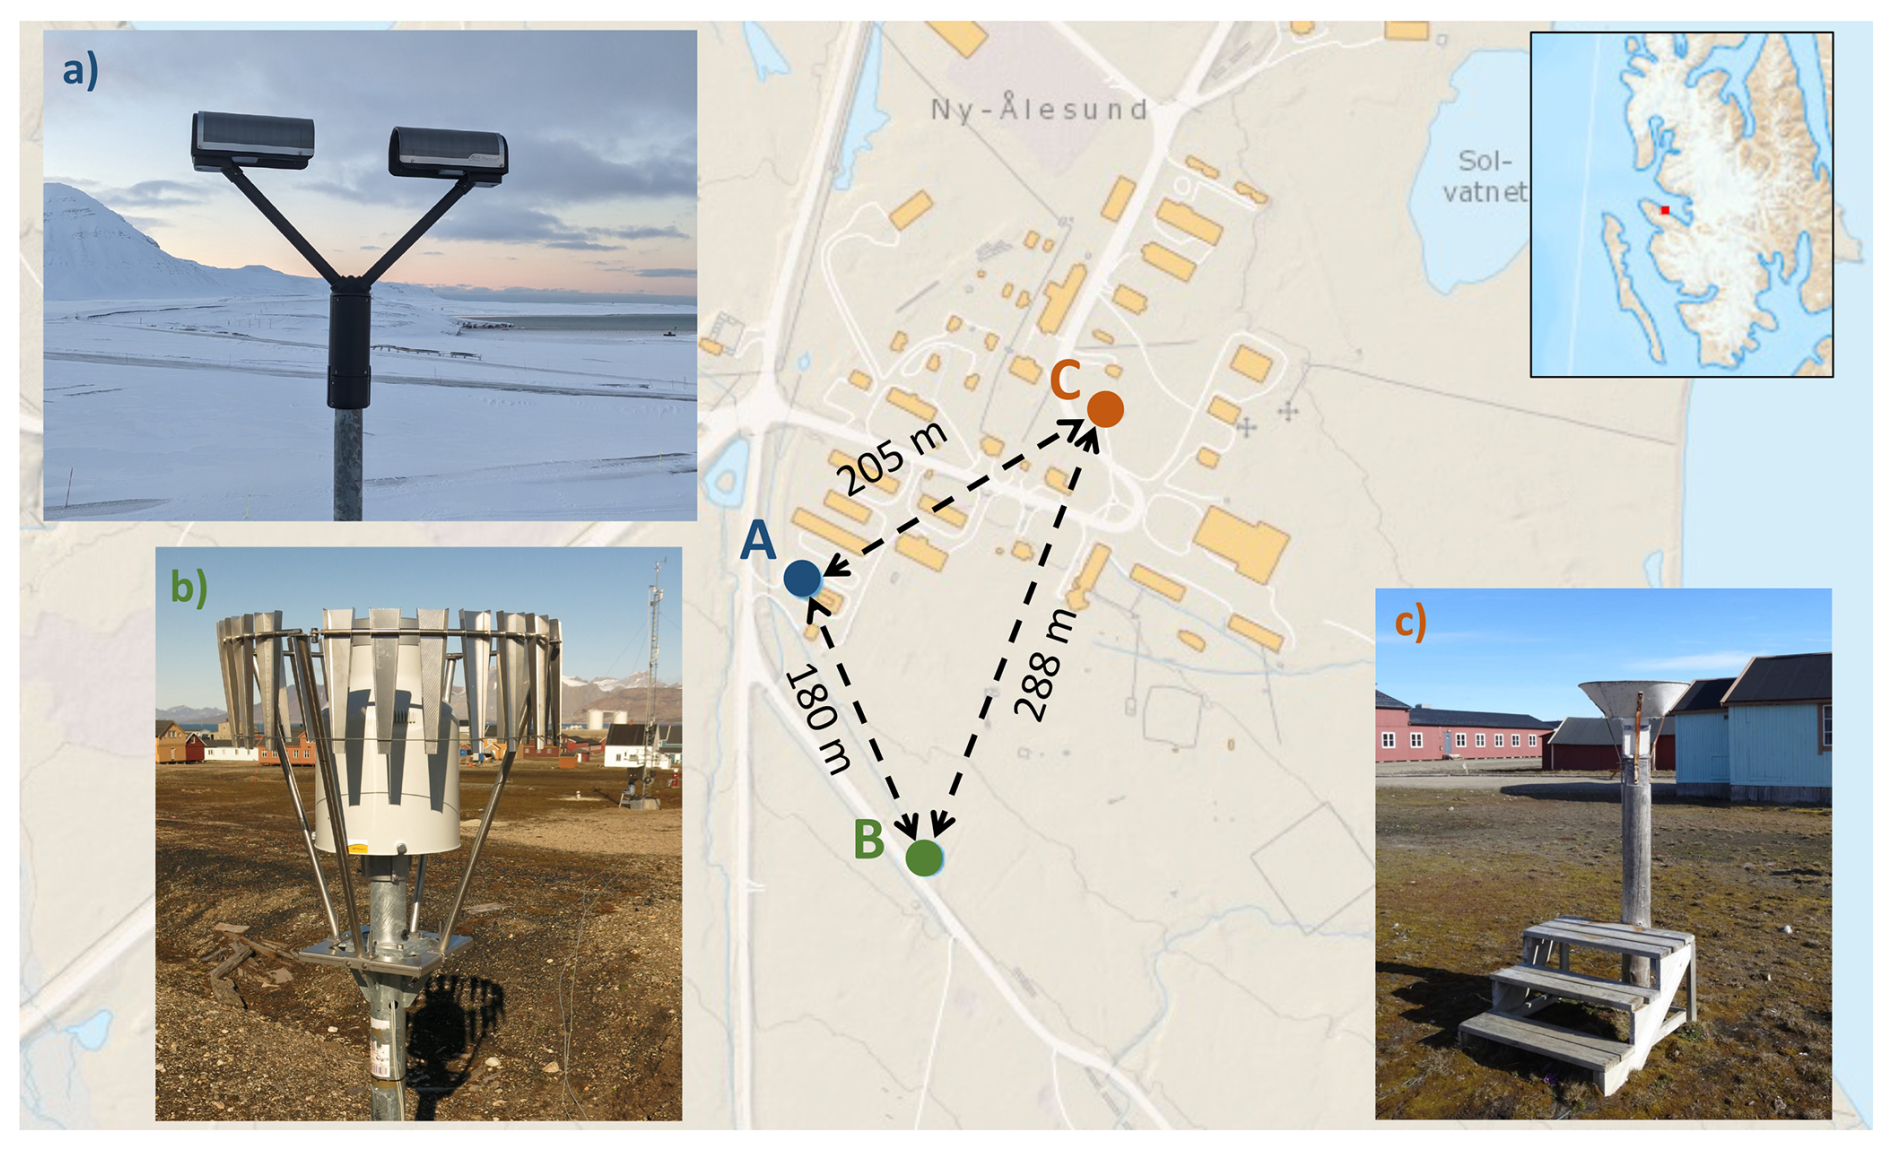
Figure 1(a) Parsivel and (b) Pluvio of the University of Cologne at Ny-Ålesund. The Parsivel is located on the roof platform of the AWIPEV atmospheric observatory (location A), while Pluvio is installed in the field about 180 m away (location B). In addition, the MET Norway precipitation gauge (c) located in the center of Ny-Ålesund (location C) is shown. The map of Ny-Ålesund and the map inset showing the location of Ny-Ålesund in northwestern Svalbard are taken from https://toposvalbard.npolar.no (last access: 16 April 2025) courtesy of the Norwegian Polar Institute.
2.1 Pluvio
The Pluvio2L 400 manufactured by OTT HydroMet GmbH is an automated weighing gauge with a collecting area of 400 cm2. The Pluvio has been installed in the measurement field about 180 m away from the Parsivel (Fig. 1). Precipitation falling into the bucket is weighed every 6 s. The difference between the bucket content at time step t+1 and at time step t gives the precipitation amount during the integration time. The OTT software provides different outputs in a 1 min resolution. In this study, the non-real-time output of the OTT software is used, which is particularly suited for daily and monthly totals (OTT, 2016b). The non-real-time output is delayed by 5 min and provides a more precise precipitation sum due to better filtering: fine precipitation is collected over 1 h and output after reaching the threshold of 0.05 mm within that hour. There will be no output if the fine precipitation does not reach the threshold within an hour. The resolution of the precipitation values is 0.01 mm. The measurement uncertainty is the larger value of ±0.1 mm or ±1 % (OTT, 2016b). The Pluvio data are available from 2 August 2017 onward (Ebell et al., 2023b). The data availability in each month is generally larger than 90 % (Fig. A1a). Months with longer data gaps are March and August 2019, July 2019, October and November 2020, and November 2021. The data gaps are only critical for the monthly precipitation sums of March and July 2019 and October 2020 since significant precipitation has been reported by the MET Norway precipitation data during the missing periods. Thus, the yearly precipitation sums for 2019 and 2020 are most likely underestimated. The Pluvio data used in this work were filtered according to the instrument status provided by the OTT software. The software indicates if the instrument operates correctly or if an event associated with a “warning” or an “alarm” occurred. All times when the instrument status is associated with an alarm, i.e., an unstable or incorrect weight measurement, have been excluded from the analysis.
Uncertainties in the precipitation amount also arise due to an undercatch of precipitation, particularly of solid precipitation and when wind speed is high. Also, blowing snow can affect the measurements. To reduce this uncertainty, the Pluvio is surrounded by a single Alter wind shield, which has been shown to substantially improve the detection of precipitation and reduce the undercatch of precipitation (Nitu et al., 2018): within the World Meteorological Organization (WMO) Solid Precipitation Intercomparison Experiment (SPICE) project, it has been found that overall a shielded gauge improved the catch efficiency by 0.1 to 0.2 compared to an unshielded gauge. We also applied an empirical correction function by Wolff et al. (2015) to the 1 min precipitation data to correct for wind-induced precipitation losses. This correction function has been developed based on gauge measurements in southern Norway and depends on temperature and wind speed at gauge height (see Eq. 12 in Wolff et al., 2015). The advantage of this correction function is that it can be directly applied to the total precipitation amount and does not require a mass separation of the precipitation into liquid and solid first. As this paper does not focus on evaluating correction functions, we want to point out that the estimated undercatch strongly depends on the chosen correction function (Champagne et al., 2024).
Figure 2b shows the frequency of detected precipitation by Pluvio. Using the 1 min resolved Pluvio time series results in monthly precipitation frequencies of up to 5 % only and in all-time average values of 1 %. Using daily accumulated Pluvio data increases the monthly precipitation frequency to 4 %–63 % (all-time average of 38 %) and, if a threshold of 1 mm is applied, to 4 %–46 % (all-time average of 22 %).
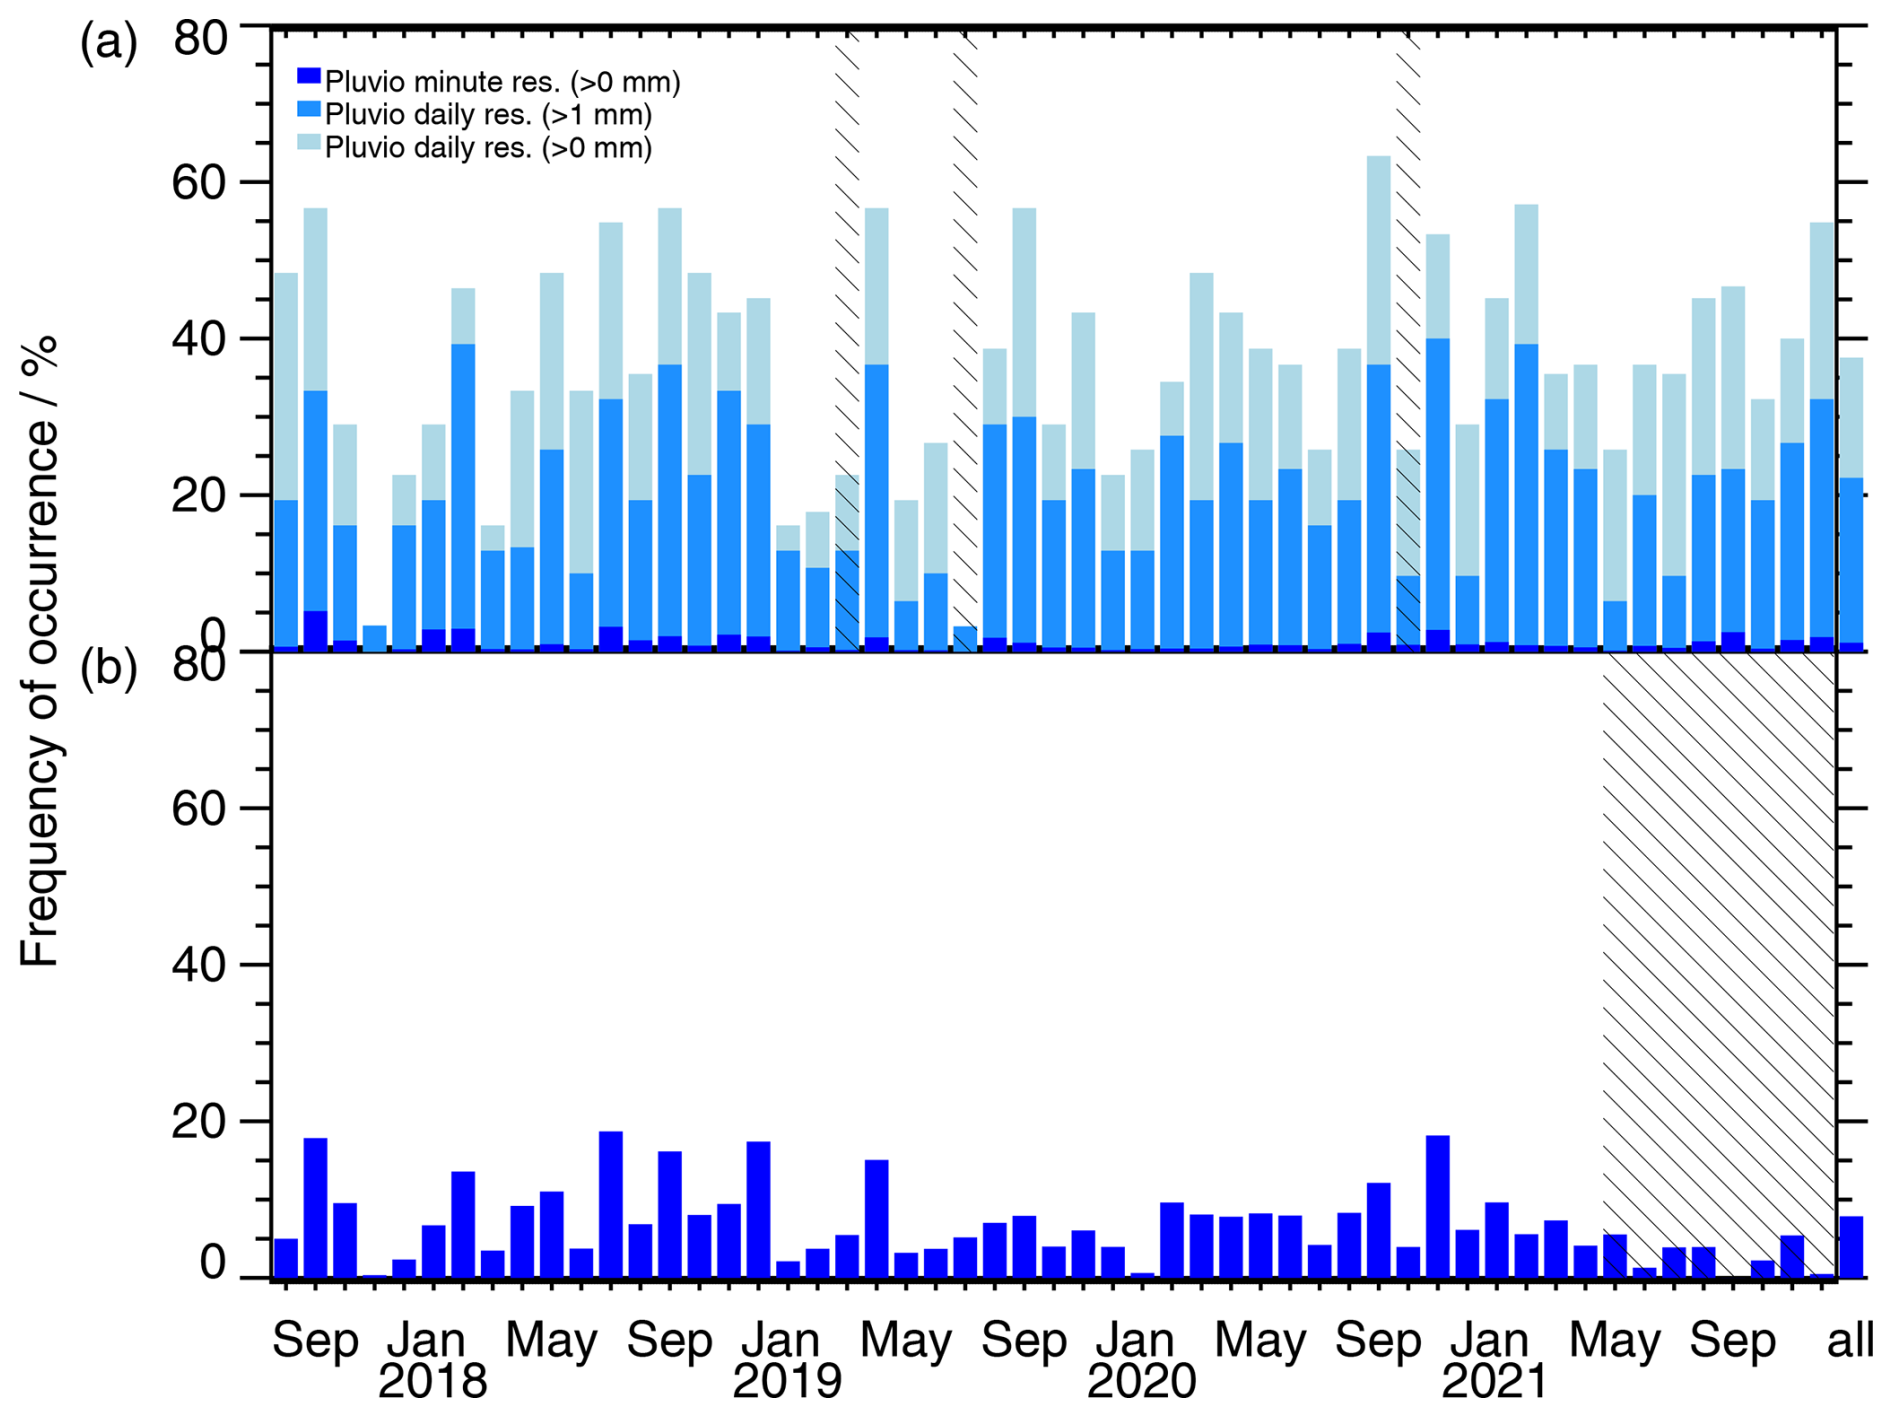
Figure 2Monthly frequency of precipitation occurrence for (a) Pluvio and (b) Parsivel. The monthly values have been calculated from the 1 min resolved data (dark blue in all panels). For Pluvio, monthly precipitation occurrence has also been calculated based on daily precipitation amounts >1 mm (medium blue) and >0 mm (light blue), respectively. Hatched areas indicate months when the monthly values are unknown/unreliable due to missing measurements. The last column shows the frequency of precipitation occurrence for the whole-time period considered (1 August 2017–31 December 2021).
2.2 Parsivel
The current OTT weather sensor Parsivel2 is an optical laser disdrometer. It provides information on fall speed, size and type of precipitating particles at 1 min temporal resolution. The Parsivel consists of two sensor heads with a 30 mm wide, 180 mm long and 1 mm high laser light strip in-between (OTT, 2016a). The output voltage of the Parsivel is reduced when a precipitation particle falls through the laser beam. The reduction of output voltage is proportional to the particle size. The particle speed is determined by the duration of the voltage signal, i.e., the time the particle needs to enter and leave the laser beam. Measurable size ranges are between 0.2 and 8 mm for liquid precipitation and between 0.2 and 25 mm for solid precipitation, with 32 size classes in total. Measured fall speeds are in the range of 0.2 and 20 m s−1 with 32 particle speed classes. The OTT Parsivel software also retrieves the type of precipitation particles, namely, “drizzle”, “drizzle with rain”, “rain”, “rain/drizzle with snow”, “snow”, “snow grains”, “graupel” and “hail”. The actual retrieval of the precipitation type is proprietary, but in principle, it relies on the fact that different particle types have different fall speed–size relationships. OTT reports that the differentiation of the precipitation types of drizzle, rain, hail and snow corresponds to the observations of a weather observer in more than 97 % of the cases (OTT, 2016a).
At AWIPEV, the Parsivel has been installed on the western roof platform of the atmospheric observatory (Fig. 1). Data are available since 29 April 2017 (Ebell et al., 2023a). Until May 2021, data coverage is generally high (Fig. A1b). From June 2021 onward, longer measurement gaps occurred, and the OTT Parsivel software quality flag often indicated problems with the glass cover/laser. This was related to humidity condensing inside the instrument. Opening and drying the instrument helped in the short term. Still, the problem re-emerged, such that the number of valid Parsivel measurements was strongly reduced until the end of 2021. In this study, only data for which the quality flag indicated reliable measurements were used. In June 2022, this instrument has been replaced by a new Parsivel.
Compared to the 1 min resolved Pluvio measurements, the precipitation signal occurrence is much higher for Parsivel (Fig. 2). For the whole period (August 2017–December 2021), it is 8 % (compared to the 1 % of Pluvio). This is due to the fact that the Parsivel already detects a few precipitating particles whose mass might not be large enough to be measured by the Pluvio.
2.3 Additional observational data sets
For the analysis of precipitation type and the correction of precipitation undercatch, we also use the 2 m temperature (T2 m) and 2 m wind speed measured as part of the Baseline Surface Radiation Network (BSRN) station at Ny-Ålesund (Maturilli, 2020). The data are provided in 1 min resolution and are taken about 40 m away from the Pluvio. In general, daily mean T2 m values are above 0 °C from June to September and rarely exceed 10 °C (Fig. A2). The lowest temperatures are found in March. This is in line with the long-term observations at Ny-Ålesund (Dahlke et al., 2020; Maturilli et al., 2013). Fig. A2 in Appendix A also reveals a large variability of daily mean T2 m in the cold season with even positive values in winter, indicating the potential for liquid precipitation.
Furthermore, we used precipitation measurements taken with the old Norwegian precipitation gauge of MET Norway located in the center of the village and thus about 290 m away from the Pluvio (Fig. 1). In particular, we use the data set published by Jacobi and Champagne (2024), which includes the original 12 h precipitation sums of MET Norway always reported at 06:00 and 18:00 UTC and corrected precipitation sums based on different correction methods as described in Champagne et al. (2024). The corrections applied include corrections due to wetting and evaporation losses within the 12 h period, i.e., constant values of 0.075 mm for rain and 0.05 mm for snow, as well as losses due to aerodynamic effects. To correct for the latter, six different correction functions have been applied by Champagne et al. (2024). Two of the corrections (Adam and Lettenmaier, 2003; Kochendorfer et al., 2017) are only valid for snow. The proposed corrections by Hanssen-Bauer et al. (1996) and Førland et al. (1996) have separate correction functions for solid and liquid precipitation. Thus, the total precipitation that the MET Norway gauge has measured had to be separated into a liquid and solid component first. Champagne et al. (2024) used here the 12-hourly average temperature and a corresponding snow-to-total precipitation ratio that has been derived from hourly temperature data and from assuming that all precipitation is solid for temperatures lower than 1 °C and liquid for temperatures equal or higher than 1 °C. This allocation of liquid and solid precipitation is not needed for the correction functions by Wolff et al. (2015) and Kochendorfer et al. (2017), which have been applied as well to the total precipitation sums. All correction functions use temperature (except for the correction functions for solid only) and wind speed information, typically at gauge height. Some correction functions also have an additional version that uses wind speed at 10 m height. In the present study, we use the original (uncorrected) MET Norway data, as well as the corrected precipitation values based on the ensemble mean of all corrections analyzed in Champagne et al. (2024), which are also provided in the data set by Jacobi and Champagne (2024) and recommended by the authors.
2.4 Atmospheric river, cyclone and front detection
To associate precipitation to synoptic-scale weather events, we analyzed ERA5 reanalysis (Hersbach et al., 2020) data as in Lauer et al. (2023) from 1 August 2017 to 31 December 2021. To this end, ARs, cyclones (CYs) and fronts (FRs) were detected north of 60° N. The details of the weather event detection methods are provided in Lauer et al. (2023), and we give only a summary here. The AR detection algorithm applied is the second version (Guan et al., 2018) of the original method by Guan and Waliser (2015). It is based on thresholds in integrated water vapor transport (IVT) and its geometry. The IVT must exceed the monthly 85th percentile of IVT that has been calculated for each grid cell based on ERA5 data from 1979–2020. Also, the lower limit of 50 kg m−1 s−1 must be exceeded. In addition, the IVT direction has to be along the detected AR axis within 45°. The length of the AR has to be longer than 2000 km, and the length-to-width ratio needs to be higher than 2. If the direction and geometric criteria are not fulfilled, the same checks are repeated for the 87.5th percentile. If the direction and geometric criteria are still not fulfilled, checks are repeated for the 90th, 92.5th and 95th percentiles. An example of a detected AR on 13 January 2018 is shown in Fig. 3. Cyclones are detected based on mean sea level pressure (MSLP) following Sprenger et al. (2017), who used a refined version of Wernli and Schwierz (2006). In principle, grid points with a minimum in MSLP are detected, and for every local MSLP minimum, the outermost closed MSLP contour is determined. Cyclones that occur over regions with surface elevations higher than 1500 m are excluded. Finally, frontal systems are calculated from a threshold in the horizontal gradient of equivalent potential temperature at 700 hPa, i.e., 4 K 100 km−1 (Jenkner et al., 2010; Schemm et al., 2015). Precipitation occurring within a distance of up to 200 km of the frontal line is assumed to be associated with the front.
Each reanalysis data grid point (0.25°×0.25° resolution) is thus classified in terms of the (non-)occurrence of an AR, cyclone (CY) and front (FR). Like the reanalysis data, this weather system classification data set has an hourly temporal resolution. A weather event is then detected for Ny-Ålesund if the grid box in which Ny-Ålesund is located is part of the region of the weather event. In total, seven different combinations are thus possible: the weather systems can occur separately, i.e., only ARs (O-AR), only CYs (O-CY) and only fronts (O-FR), or simultaneously in different combinations (AR-FR, AR-CY, AR-CY-FR, CY-FR).
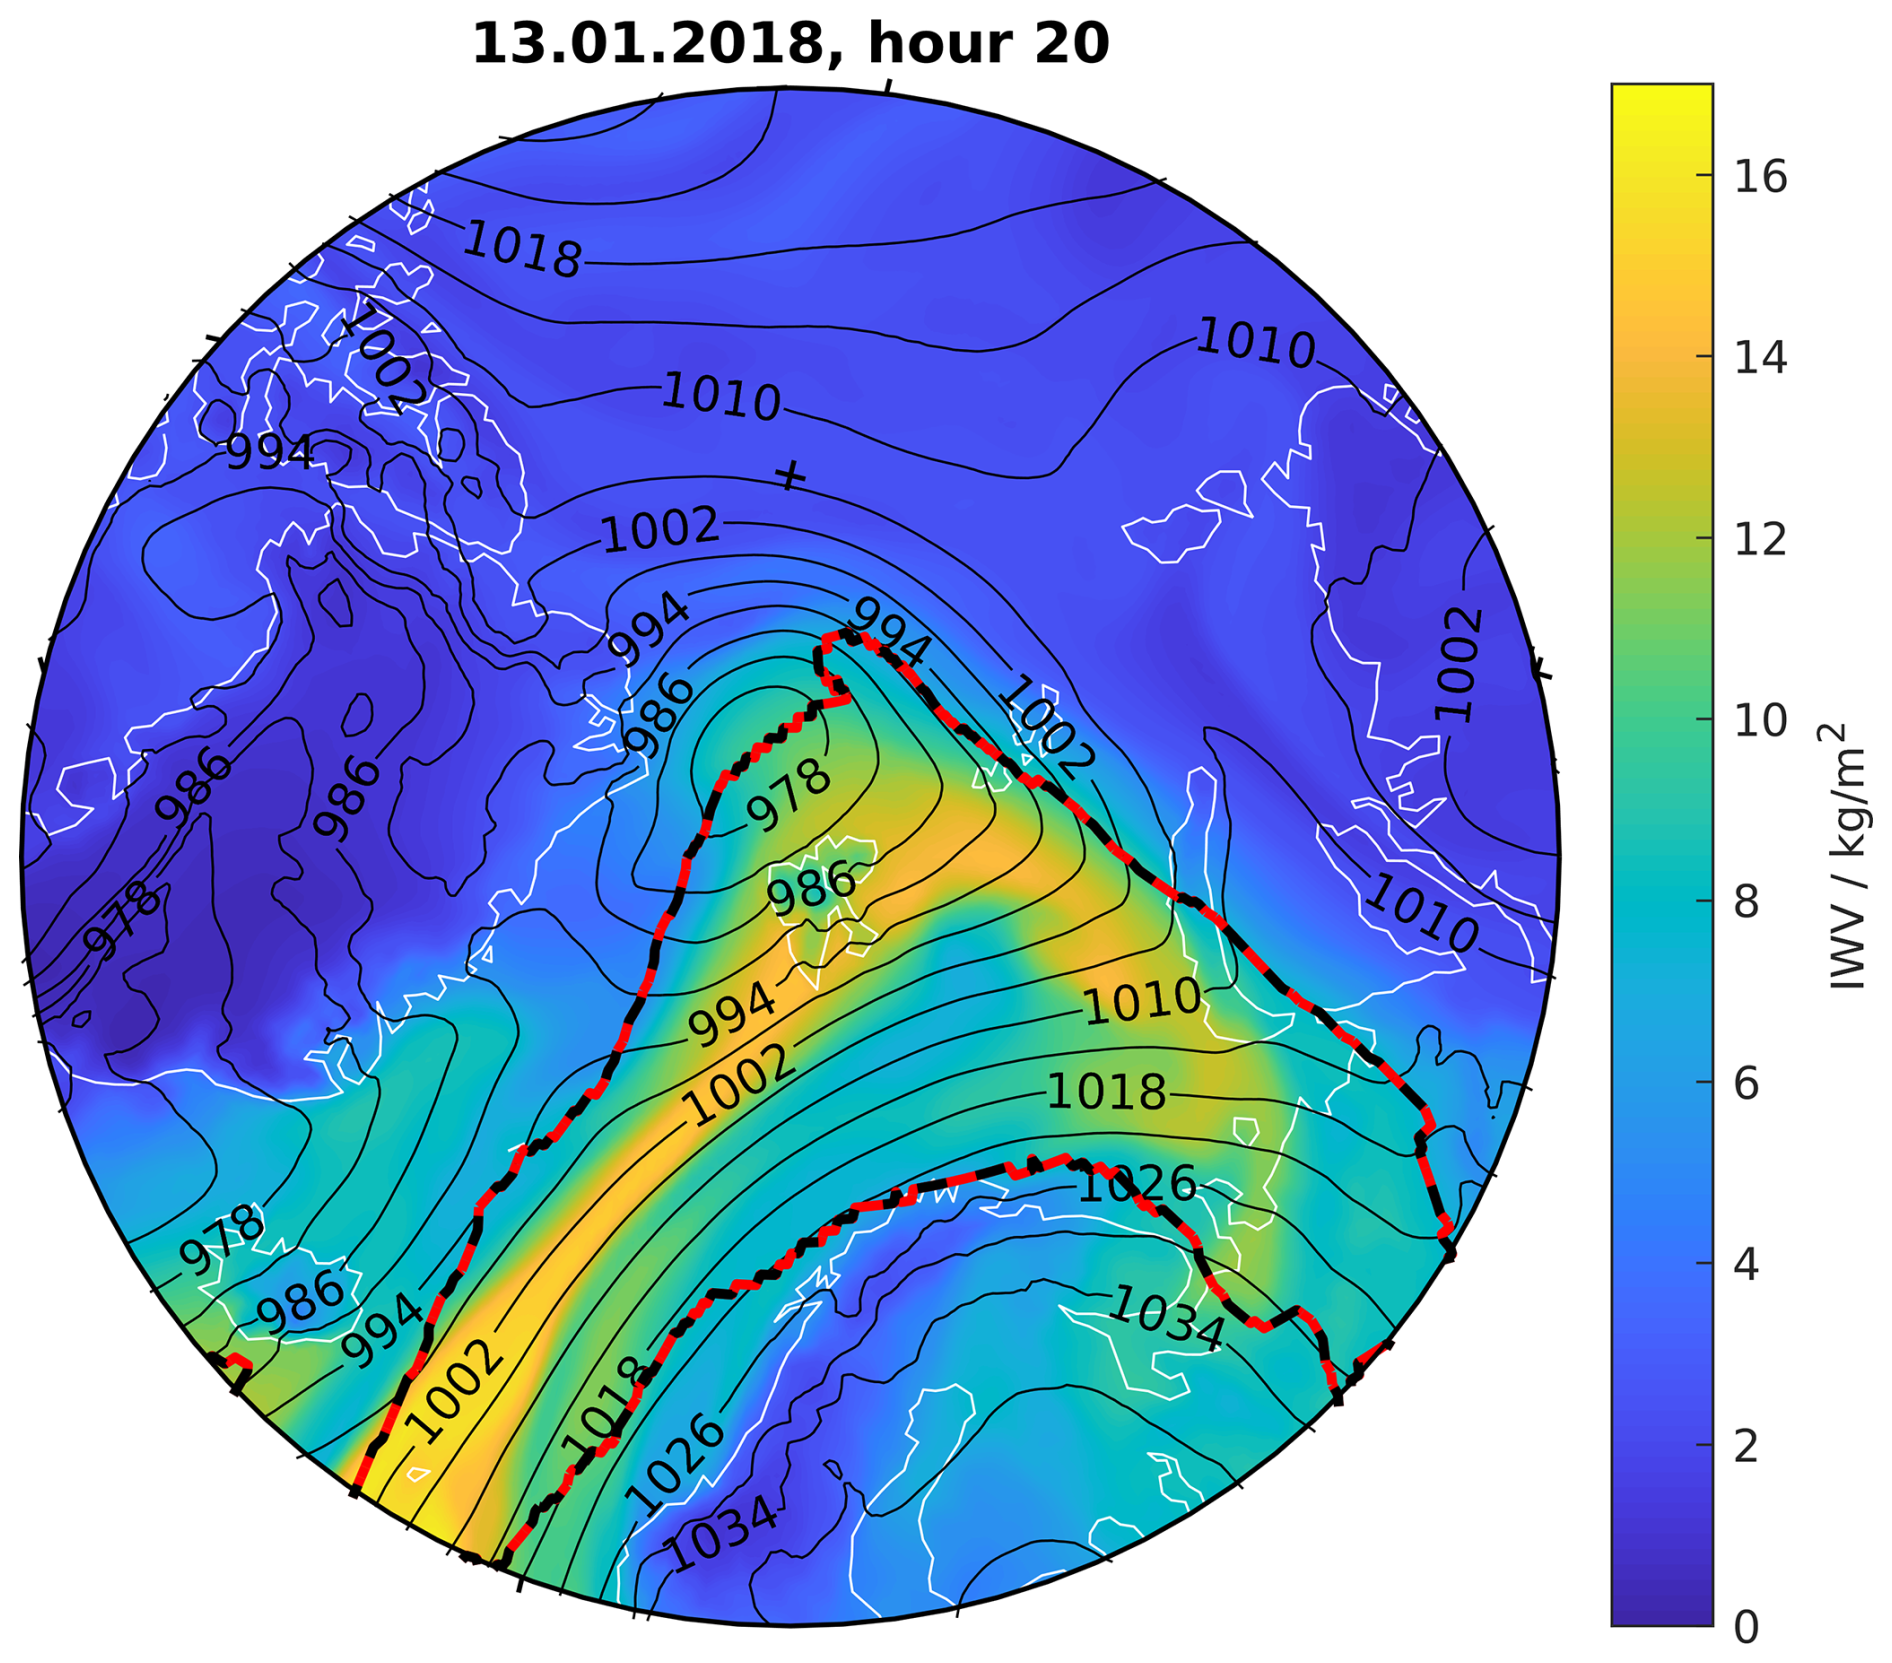
Figure 3Integrated water vapor (IWV, in kg m−2; colors) and mean sea level pressure (in hPa; black contours) on 13 January 2018 at 20:00 UTC from the ERA5 reanalysis. The dashed black and red line indicates the boundaries of the detected atmospheric river.
Before we analyze the impact of different weather systems on precipitation at Ny-Ålesund, we first look at the performance of Pluvio and Parsivel. For Pluvio, we can compare the measurements to the MET Norway precipitation data (Sect. 3.1). The Parsivel measurements are indirectly assessed by relating them to the observed temperature and wind speed (Sect. 3.2). Based on these findings, a new separation of precipitation mass into liquid and solid precipitation is proposed.
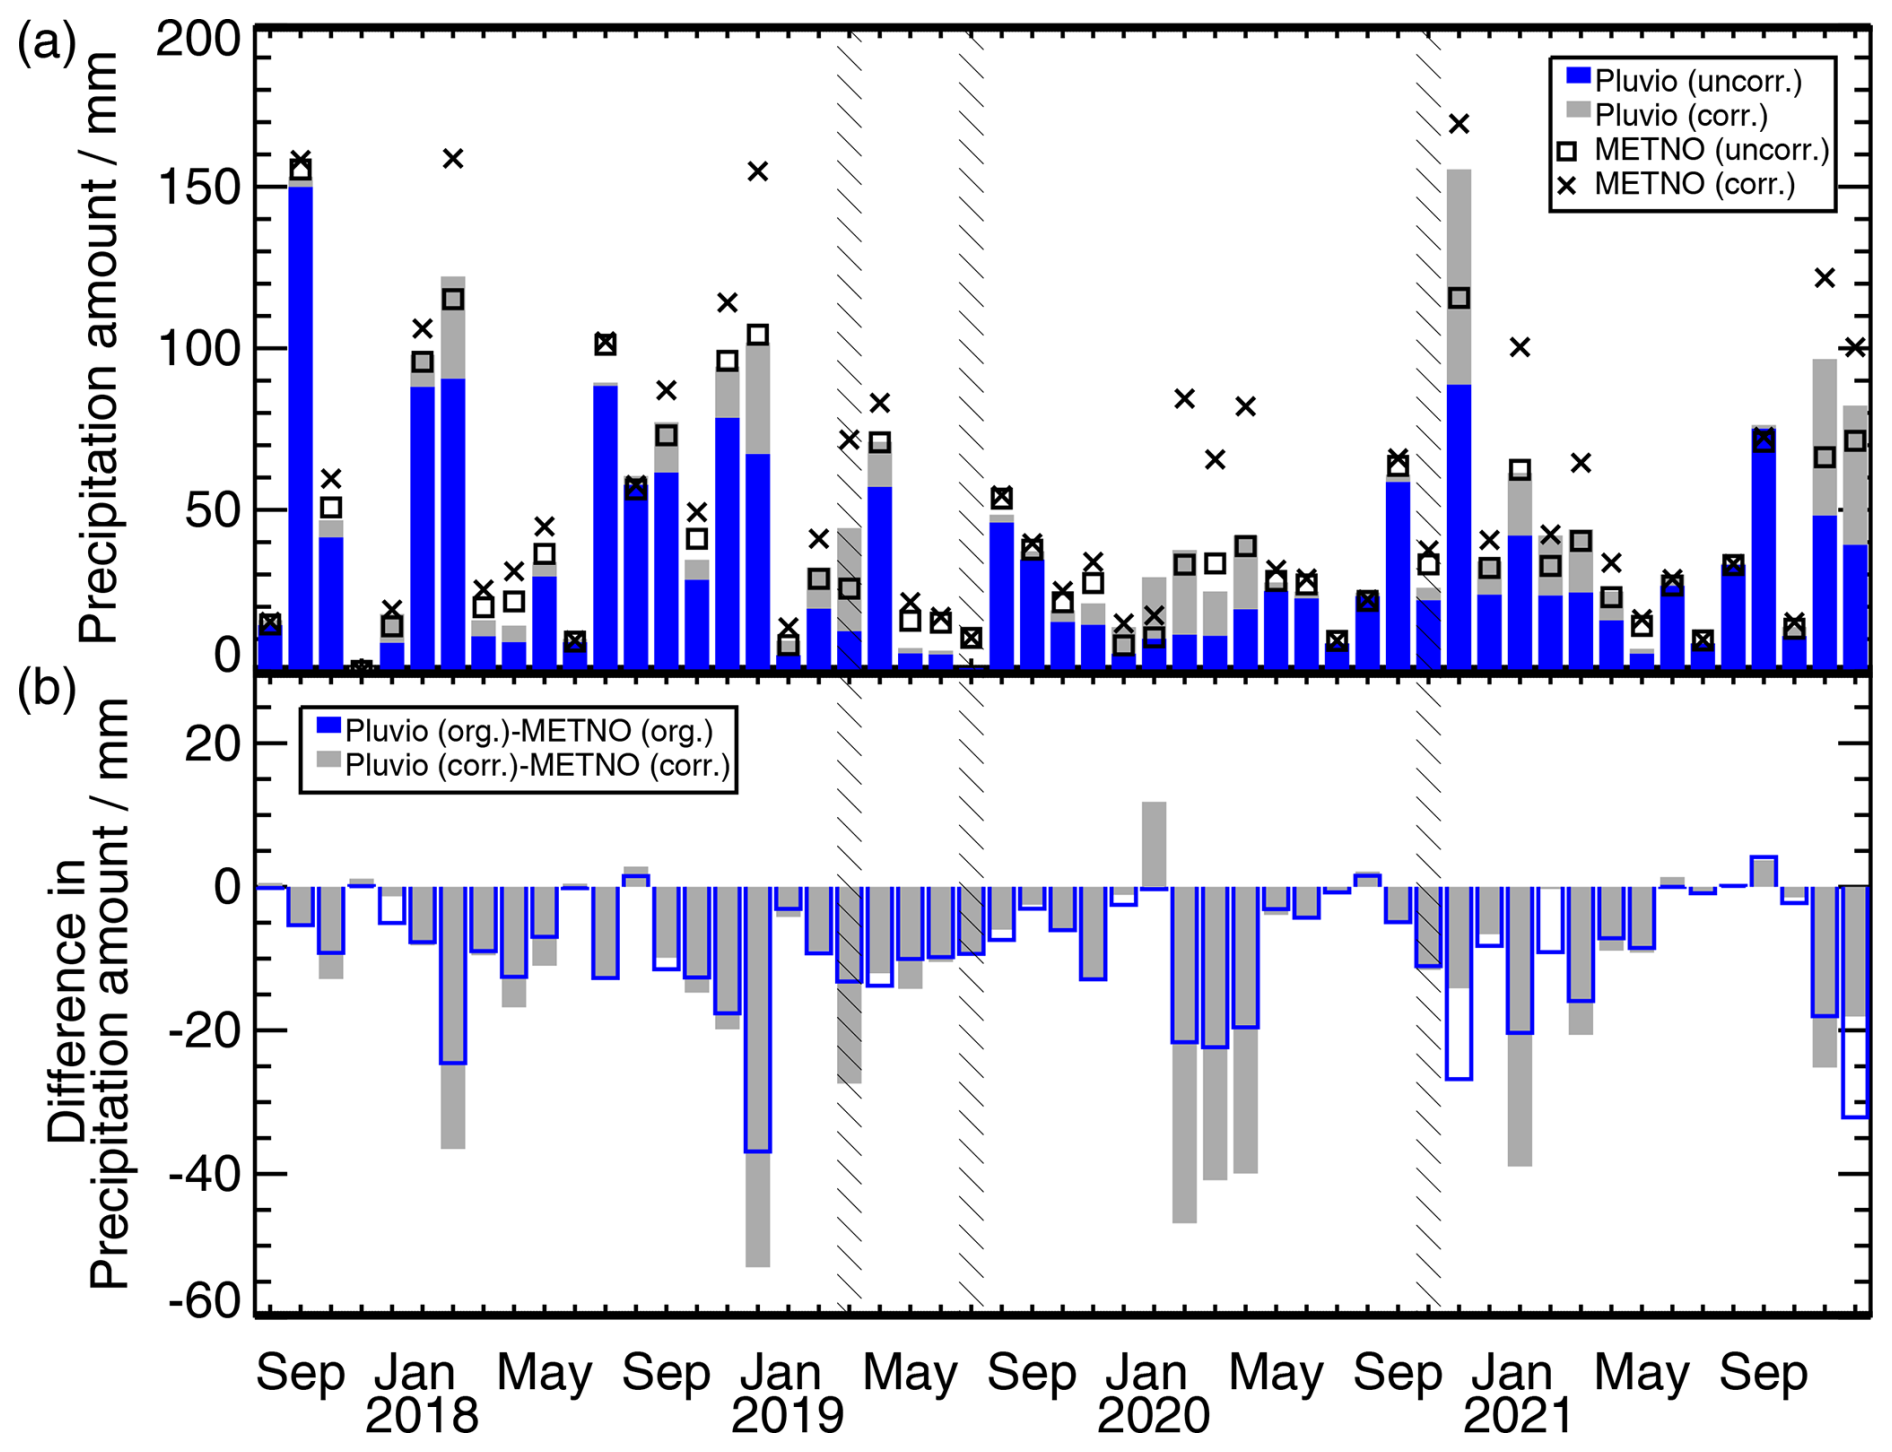
Figure 4(a) Monthly precipitation amount (in mm) from Pluvio based on the uncorrected (blue) and corrected data following Wolff et al. (2015) (gray). The uncorrected (squares) and the ensemble-mean-corrected (x symbols) precipitation measurements of the MET Norway precipitation gauge from Champagne et al. (2024) are shown as well. Areas with hatching indicate months for which the monthly precipitation sums from Pluvio are underestimated due to measurement gaps. (b) Differences in monthly precipitation amount between Pluvio and MET Norway for uncorrected (blue) and corrected values (gray).
Table 1Annual precipitation amount (in mm) of the uncorrected and corrected Pluvio and MET Norway precipitation gauge data. For the corrected MET Norway data, the results of the ensemble mean of all corrections of Champagne et al. (2024) are shown.
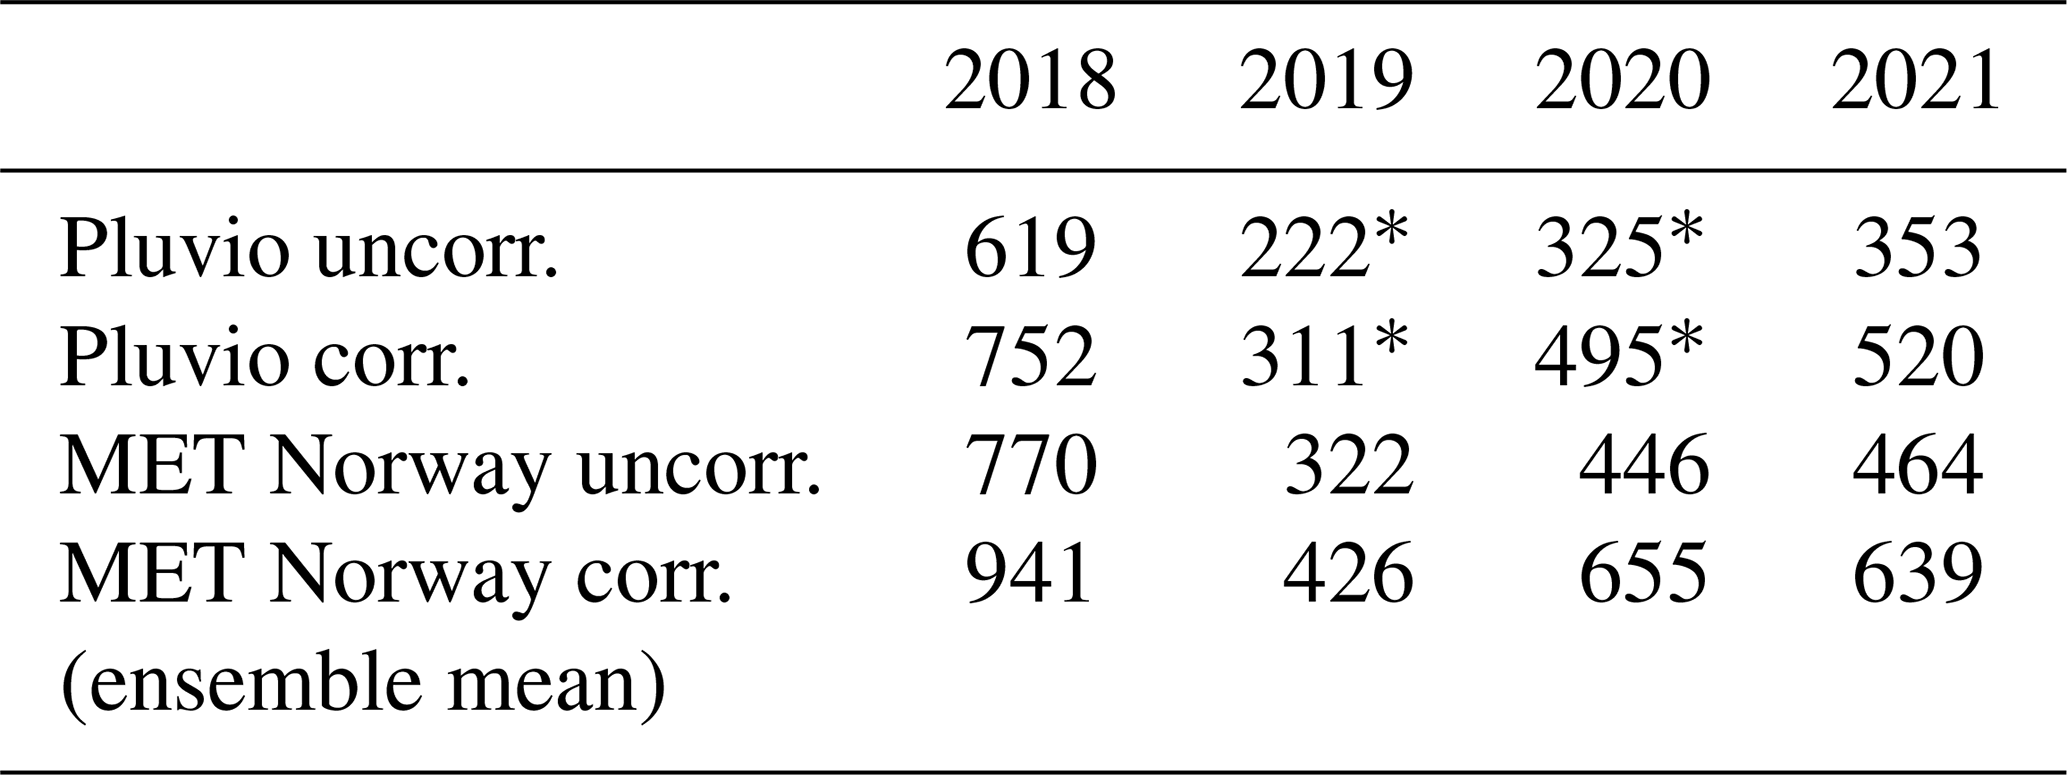
* Underestimated due to measurement gaps.
3.1 Precipitation amount from different sensors and correction methods
Figure 4 depicts the monthly precipitation amount of the uncorrected Pluvio data, the corrected Pluvio data following Wolff et al. (2015), and the MET Norway uncorrected and ensemble-mean-corrected precipitation sums. Monthly corrected precipitation sums from Pluvio show a large variability ranging from 1 mm (October 2017) to 155 mm (September 2017). There is no apparent seasonality in precipitation amount from this relatively short period. Other studies with long-term precipitation measurements have found a seasonal cycle in precipitation amount at different stations in Svalbard with a minimum in late spring/early summer and a maximum in September/October (Hanssen-Bauer et al., 2019; Vikhamar-Schuler et al., 2016). For most stations (including Ny-Ålesund), also a second maximum in March is typical.
Considering effects due to wind-induced undercatch adds 0.5 % to 257 % to the uncorrected monthly values of Pluvio. In absolute terms, the largest correction is found for November 2020 with an additional 67 mm. The large variability in monthly precipitation sums is also reflected in the large range of yearly precipitation sums (Table 1). With 752 mm of precipitation, 2018 was a very wet year. The MET Norway time series since 1975 (not shown) reveals that 2018 was even a record year with the largest annual precipitation amount, while the long-term annual average of the manual (uncorrected) precipitation measurements is 436 mm. In contrast, 2019 was a relatively dry year with a corrected Pluvio precipitation amount of about 311 mm (Table 1). As mentioned before, the estimates of annual precipitation amounts from Pluvio are likely underestimated for 2019 and 2020 due to measurement gaps during some precipitation periods. However, the MET Norway data also indicate a relatively low annual precipitation amount for 2019.
When comparing the monthly and yearly precipitation sums of the Pluvio to the MET Norway precipitation measurements, we find quite some differences for both the corrected and uncorrected values (Figs. 4, A3, Table 1). For most of the months, Pluvio has smaller precipitation amounts. For the uncorrected monthly data, this results in a bias of −9.4 mm and a standard deviation of 9.1 mm (Fig. A3a). The negative bias is also reflected in the uncorrected daily precipitation sums with a corresponding value of −0.3 mm and a standard deviation of 1.1 mm (Fig. A3c). When comparing the corrected data, i.e., the Wolff et al. (2015) correction for the Pluvio data and the ensemble mean correction from Champagne et al. (2024) for the MET Norway data, differences are even larger (Figs. 4, A3). These differences accumulate to a difference in the yearly corrected precipitation sums of 189 mm (2018) and 119 mm (2021). Since the ensemble mean correction of Champagne et al. (2024) includes several different correction functions, we also compared the corrected Pluvio data to the corrected precipitation data using the Wolff et al. (2015) method (with 2 m wind speed) of Champagne et al. (2024). In this case, the differences are even slightly larger (not shown). Bias and standard deviation of the monthly precipitation amount are −14.9 and 19.2 mm, respectively.
Several reasons likely contribute to the differences between the different data sets. For the uncorrected data, the smaller precipitation sums of Pluvio (blue bars in Fig. 4b) hint at a stronger wind-induced loss at the location of Pluvio. Due to the surrounding buildings, the MET Norway precipitation gauge seems more shielded and less exposed to wind effects than the Pluvio. However, even the corrected monthly Pluvio values are smaller in some months than the uncorrected MET Norway gauge data. This means that, most likely, the Wolff et al. (2015) correction still underestimates the wind-induced precipitation loss.
Since the corrected precipitation values of Pluvio are smaller even for the same correction function applied, this shows that these differences are likely also related to differences in the input temperature and wind speed data sets, differences in how the wind affects the measurements due to the different locations of the two instruments and different temporal resolutions/data sampling (1 min vs. 12-hourly resolved data, different sampling of temperature and wind speed data). All these effects lead to the differences between the corrected data sets (gray bars in Fig. 4b).
The assumed wind speed has a strong impact on the precipitation correction. Champagne et al. (2024) took 10 m wind speed measurements taken in the open measurement field about 160 m away from the MET Norway gauge (see Fig. S1 in the Supplement of Champagne et al., 2024) In order to consider a more representative wind speed value at the gauge height and location, they assumed a logarithmic wind profile to calculate wind speed at 2 m height and took an average vertical angle of obstacles around the gauge into account (Eq. 1 in Champagne et al., 2024). However, this wind speed estimate is still very uncertain. For the Pluvio measurements, we use wind sensor measurements at the same height, which are only about 40 m away from the Pluvio. So these wind speed measurements should be a very good estimate for the actual wind speed at the Pluvio.
Furthermore, the temporal resolution, i.e., the accumulation/averaging periods, of the data also plays a role. Champagne et al. (2024) have analyzed 12-hourly resolved data using 12 h averages of temperature and wind speed, while we use 1 min resolved data of precipitation, temperature and wind speed to which the correction is applied. The latter results in a better temporal matching between the precipitation amount and the actual temperature and wind speed when the precipitation occurred. Jacobi et al. (2019), for example, have compared the manual MET Norway precipitation observations, the Pluvio measurements and the automatic precipitation measurements of the Geonor for a full hydrological year (September 2017–September 2018) at Ny-Ålesund and also took different correction methods and temporal resolutions into account. The Geonor is located in the same field as the Pluvio, about 140 m apart. Jacobi et al. (2019) showed that, independent of the correction method, the correction was higher for the temporally coarser resolved data. Yearly precipitation sums increased by about 70–80 mm when daily-resolved instead of hourly-resolved data were used. They also found that the stronger correction was mainly associated with solid precipitation. Furthermore, in their study, the yearly precipitation sums of both Pluvio and Geonor were lower than the manual MET Norway measurements. However, an excellent agreement between Pluvio and Geonor annual precipitation sums had been found, giving trust to the Pluvio measurements. For the following analyses, we rely on the corrected Pluvio data using the Wolff et al. (2015) method.
3.2 Precipitation type attribution
The Pluvio provides precipitation amount, but the question of how much of the mass is solid and how much is liquid remains. Here, the Parsivel can provide independent information and help to constrain a temperature-based mass separation which is useful for cases when no Parsivel measurements are available. To analyze this in more detail, we focused on the period from August 2017 to December 2020, i.e., the period when the data coverage of Parsivel is very good (see Fig. A1b). We took all corrected 1 min resolved Pluvio precipitation values larger than 0 mm into account, for which also the Parsivel had detected a precipitation signal within ±10 min. The Pluvio precipitation signal was then declared as solid if the classes “snow”, “snow grains”, “graupel” and “hail” were the dominating precipitation types within the ±10 min interval. We included “graupel” and “hail” in the solid class even though the microphysical processes might be quite different in these cases. However, the occurrence of these two classes is very low (<1.9 % for graupel and <0.001 % for hail) and does not impact the key findings. If liquid Parsivel class “drizzle”, “drizzle with rain”, or “rain” was dominating, the Pluvio precipitation amount was associated with liquid precipitation. In a few cases (0.7 % of all cases), mixed-phase precipitation (“rain, drizzle with snow”) was dominating the Parsivel signal. Here, half of the Pluvio precipitation amount was attributed to solid and half to liquid precipitation. However, since these cases contribute only 0.7 % to the total precipitation amount, they do not significantly affect the results.
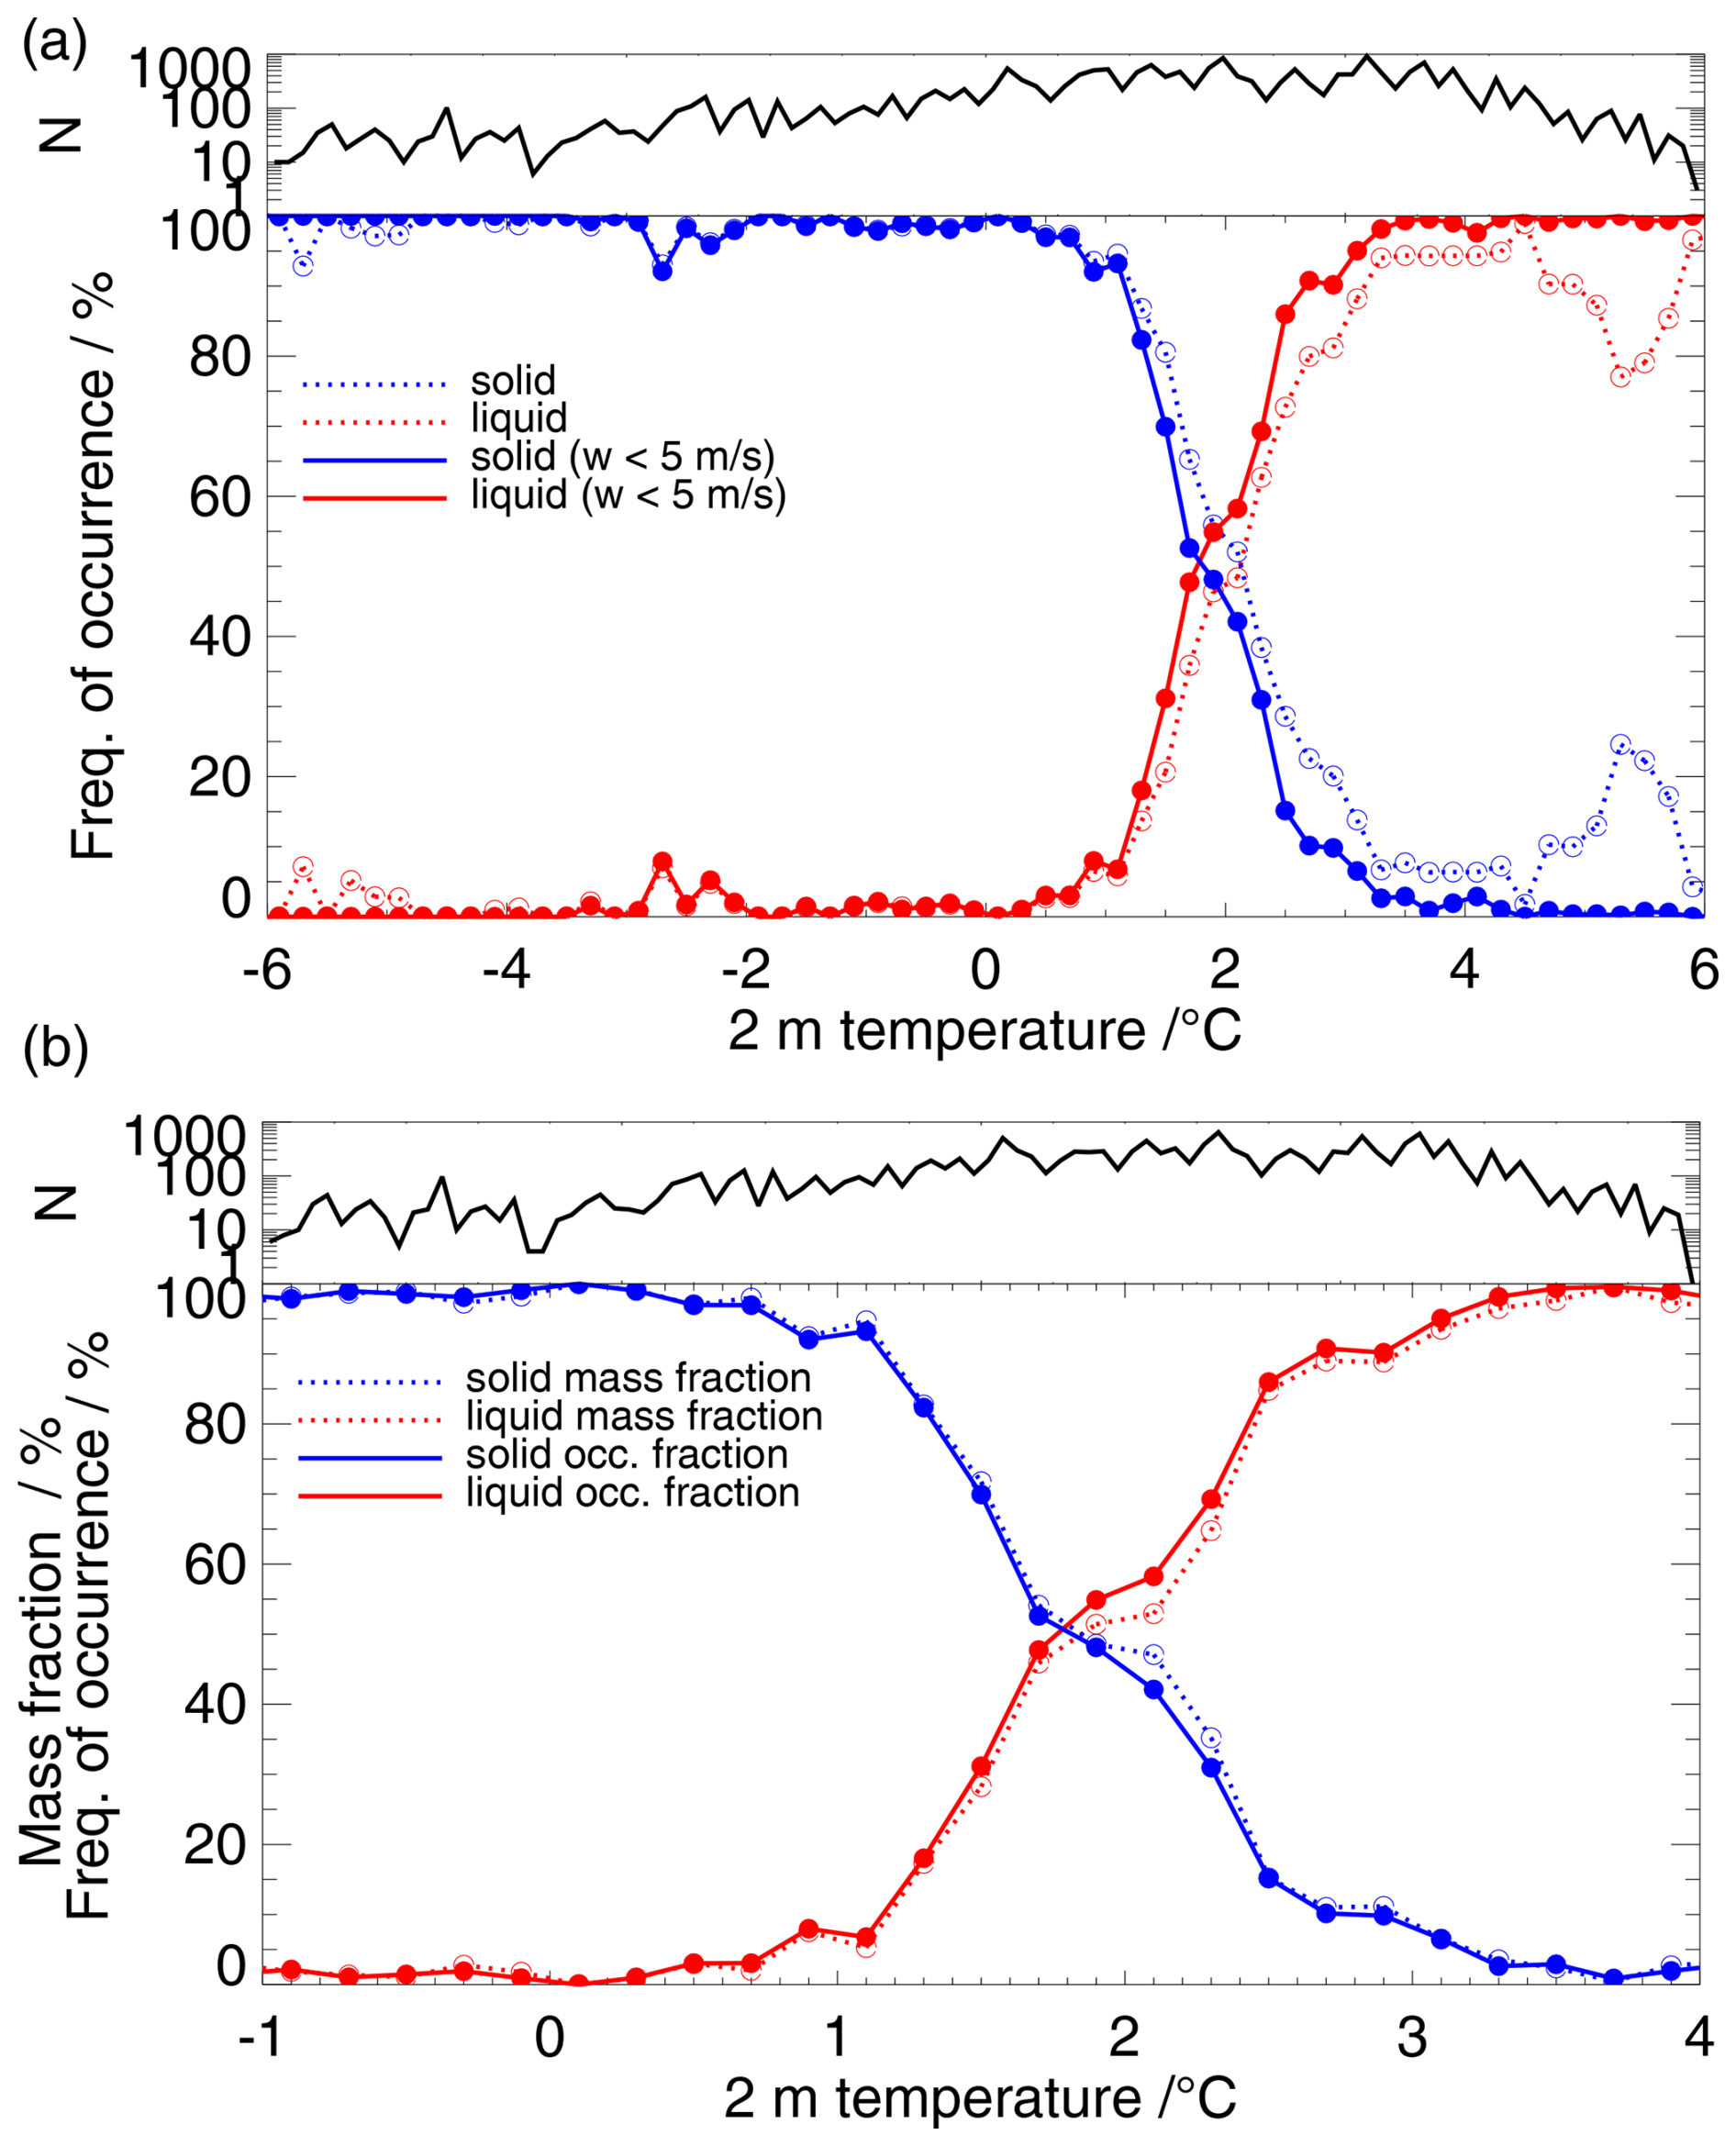
Figure 5(a) Frequency of occurrence of solid (blue) and liquid (red) precipitation as a function of 2 m temperature. Solid and liquid precipitation values were determined from the Parsivel measurements at all times when the Pluvio detected a measurement signal for the period August 2017 to December 2020. See also Sect. 3.2 for more details. Note that liquid and solid precipitation can occur at the same time such that the sum of liquid and solid occurrence can be >100 %. Temperature bin size is 0.2 °C: [0.2,0.4), [0.4,0.6), etc., with N being the number of cases within a temperature class. Results for all cases (dotted lines) and cases with 2 m wind speeds w<5 m s−1 only (solid lines) are shown. (b) Zoom-in view into the temperature range of −1 and 4 °C. The solid (blue) and liquid (red) occurrence fractions for cases with 2 m wind speeds w<5 m s−1 are shown (solid lines). The dotted lines indicate the corresponding mass fractions as a function of temperature. See also Table 2.
The occurrence of liquid and solid precipitation was then analyzed as a function of 2 m temperature (Fig. 5a). When taking all cases into account (dotted lines in Fig. 5a), liquid precipitation is detected by Parsivel even for temperatures far below 0 °C and solid precipitation even for temperatures higher than 5 °C. Wind and turbulence can affect the particle velocity when passing through the Parsivel laser beam such that the measured velocity does not correspond to the true fall speed of the precipitation particles. Subsequently, this effect will result in a misclassification of the measured particles. Filtering the data by removing cases with 2 m wind speeds higher than 5 m s−1 (solid lines in Fig. 5a) results in a smoother transition from solid to liquid precipitation, removing liquid occurrence at very low temperatures and almost all solid precipitation at temperatures higher than 3 °C. Even after filtering, the Parsivel data show an unexpectedly higher liquid occurrence around −3 to −2 °C. Looking at these cases in more detail reveals that all these situations occur during periods when solid precipitation only has been detected by Parsivel in other minutes (not shown). A possible temperature inversion resulting in positive temperatures in upper height levels could be excluded from radiosonde profiles. We also checked similar cases for more recent dates for which measurements by a video in situ snowfall sensor (VISSS; Maahn et al., 2024) at Ny-Ålesund are available. The VISSS was installed at Ny-Ålesund in September 2021 and is operated in the measurement field about 140 m northwest of Pluvio. Visual inspection of the pictures of the particles taken by VISSS for a case on 5 May 2023 showed that only solid precipitation was present (Maximilian Maahn, University of Leipzig, personal communication 25 August 2023). Interestingly, Chellini et al. (2022, 2023) found that low-level mixed-phase clouds at Ny-Ålesund produce small fast-falling ice particles in this temperature regime, which could be misinterpreted as drizzle. The detected Parsivel particle sizes are relatively small during these cold “liquid” events, with a mean volume equivalent diameter of 1.3 mm only. We thus assume that the Parsivel algorithm falsely classifies these smaller solid particles in this temperature regime as “rain” or “drizzle”.
The transition temperature regime, where both liquid and solid occur, is roughly between 1 and 3 °C (see Fig. 5b). If we look at the solid and liquid mass fractions (dotted lines in Fig. 5b), we find that the temperature dependency of the mass separation follows the phase occurrence frequency. This shows that the occurrence of solid (liquid) precipitation at a specific temperature can also be used as a proxy for the separation into the corresponding mass. At about 1.8 °C, half of the precipitation mass is solid and half is liquid. This value is higher compared to other studies using a temperature threshold to differentiate between liquid and solid precipitation, e.g., 1 °C in Champagne et al. (2024). Although Champagne et al. (2024) do not further explain this threshold, Jacobi et al. (2019) also identified a similar value. Based on 24 h accumulated precipitation measurements, 24 h averaged temperatures and weather observers' reports of precipitation type for the time period 1975 to 2007, Jacobi et al. (2019) showed that solid and liquid precipitation equally occur at around 1±0.5 °C. However, it has to be emphasized that, on the one hand, the weather observer reports are subjective and, on the other hand, the analyzed 24 h mean temperature is not the actual temperature at which the precipitation occurred. Due to the higher temporal sampling of our data, a better temporal matching is possible, resulting in different solid/liquid fractions.
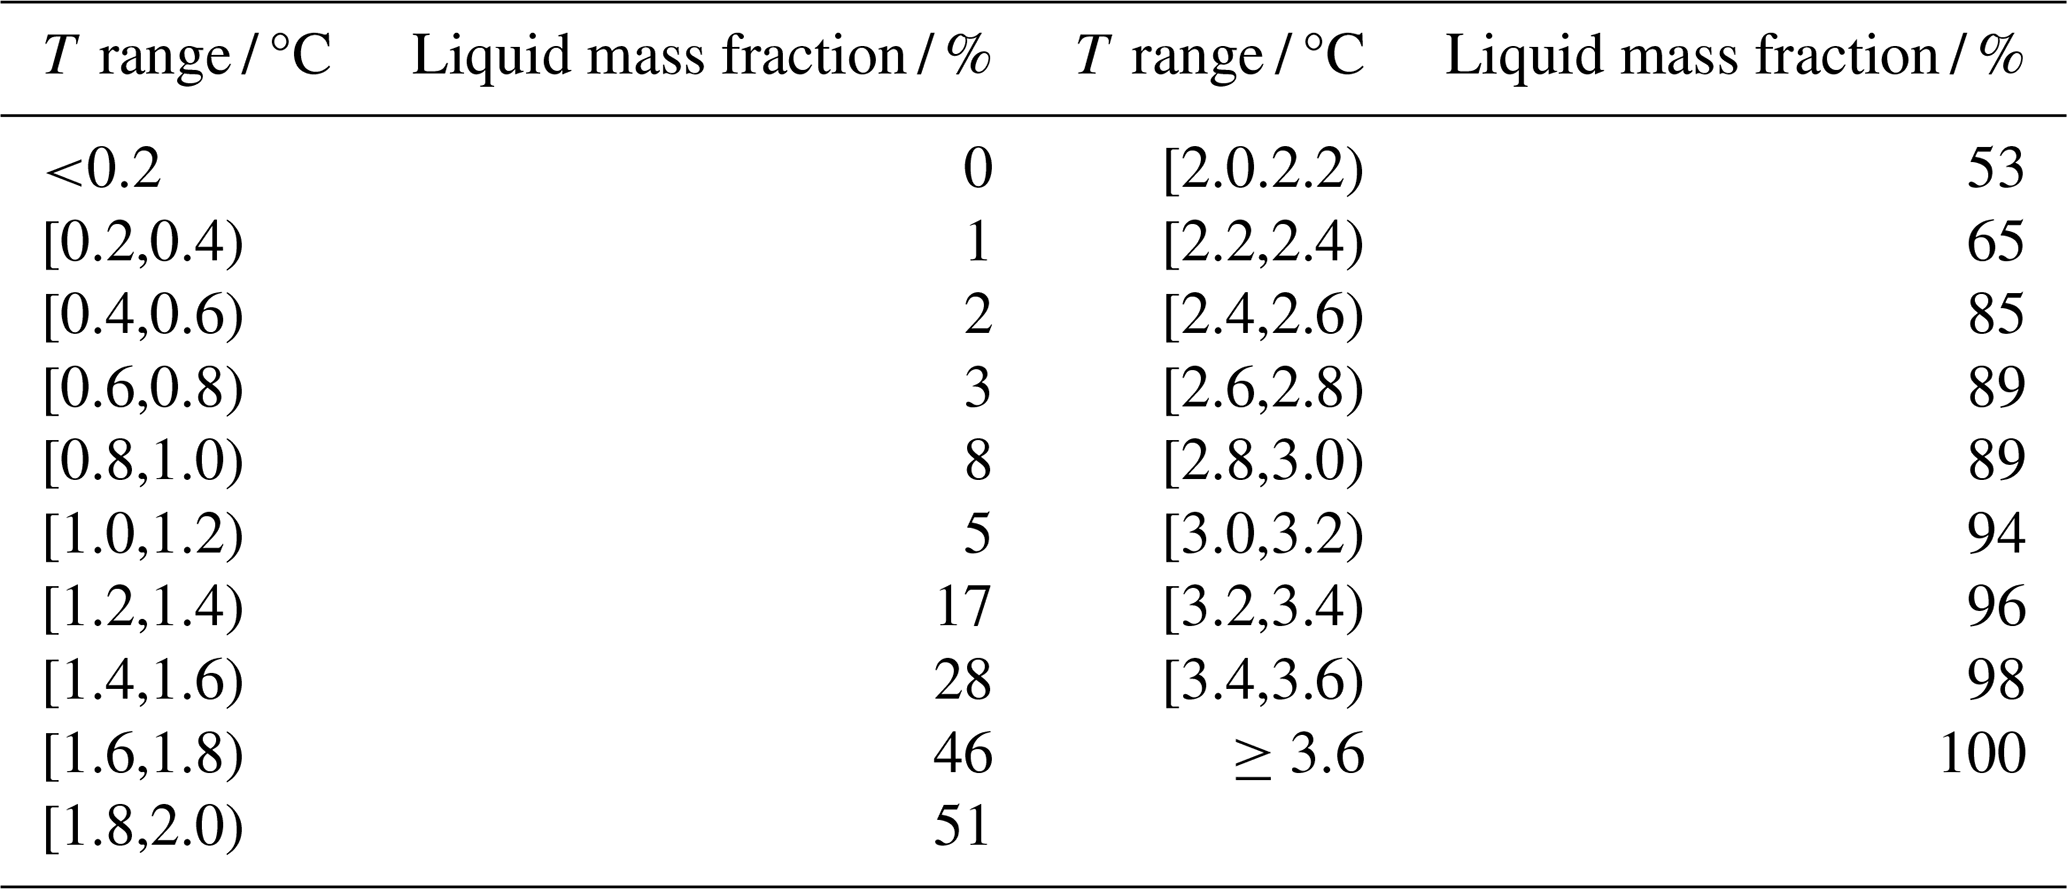
To split precipitation into solid and liquid for the whole period of August 2017 to December 2021, we applied a combined Parsivel and temperature-based mass separation (TMS) method: for temperatures <0.2 °C, we assume all precipitation to be solid. All precipitation is assumed to be liquid for temperatures ≥3.6 °C. For the temperature range in-between, we check first if Parsivel detected precipitation within ±10 min and if wind speeds are <5 m s−1. If this is the case, we use the Parsivel classification, as explained earlier, to discriminate between liquid and solid and attribute the precipitation mass correspondingly. If precipitation phase information is not available from the Parsivel due to missing or erroneous Parsivel data (in particular in 2021; see Fig. A1b), due to no detected precipitation by Parsivel or due to wind speeds ≥5 m s−1, the 2 m temperature is used for the mass separation as shown in Fig. 5b (for the exact values, see Table 2). In some cases, no temperature measurements were available, so the precipitation phase could not be determined for the corrected Pluvio precipitation amounts. However, this affected less than 2 mm of the whole precipitation amount in the period from August 2017 to December 2021.
Table 2Liquid mass fraction as a function of 2 m temperature derived from corrected Pluvio precipitation amount and Parsivel precipitation type for the period August 2017 to December 2020. For temperatures <0.2 °C (≥3.6 °C), all precipitation is assumed to be solid (liquid). For the temperature range between 0.2 and 3.6 °C, the liquid mass fraction corresponds to the values shown in Fig. 5b.
The resulting monthly liquid precipitation amount and liquid mass fraction are shown in Fig. 6a, and the yearly liquid and solid precipitation sums are shown in Table 3. Liquid precipitation typically dominates the total precipitation amount from April to September. However, a substantial amount of liquid precipitation can also be found in January, February, November and December 2018, as well as November 2020. For 2018, this results in a high liquid precipitation fraction of 52 %, while in 2021 the liquid fraction is only 29 %. We also analyzed the effect of using a simple temperature threshold (denoted T1 °C), assuming all precipitation to be solid for temperatures <1 °C as in Champagne et al. (2024) (Fig. 6b). For some months, this significantly increases liquid precipitation (by up to 53 mm), resulting in generally higher yearly liquid precipitation fractions with an additional 6 to 15 percentage points (Table 3). Using only the temperature-based mass separation (TMS) as derived from the Parsivel observations (and thus no direct Parsivel observations at all) has a smaller effect, even though for some months differences are several millimeters, showing still the uncertainty related to phase attribution. However, the yearly liquid mass fraction of the TMS method is similar to the combined Parsivel/TMS method (Table 3).
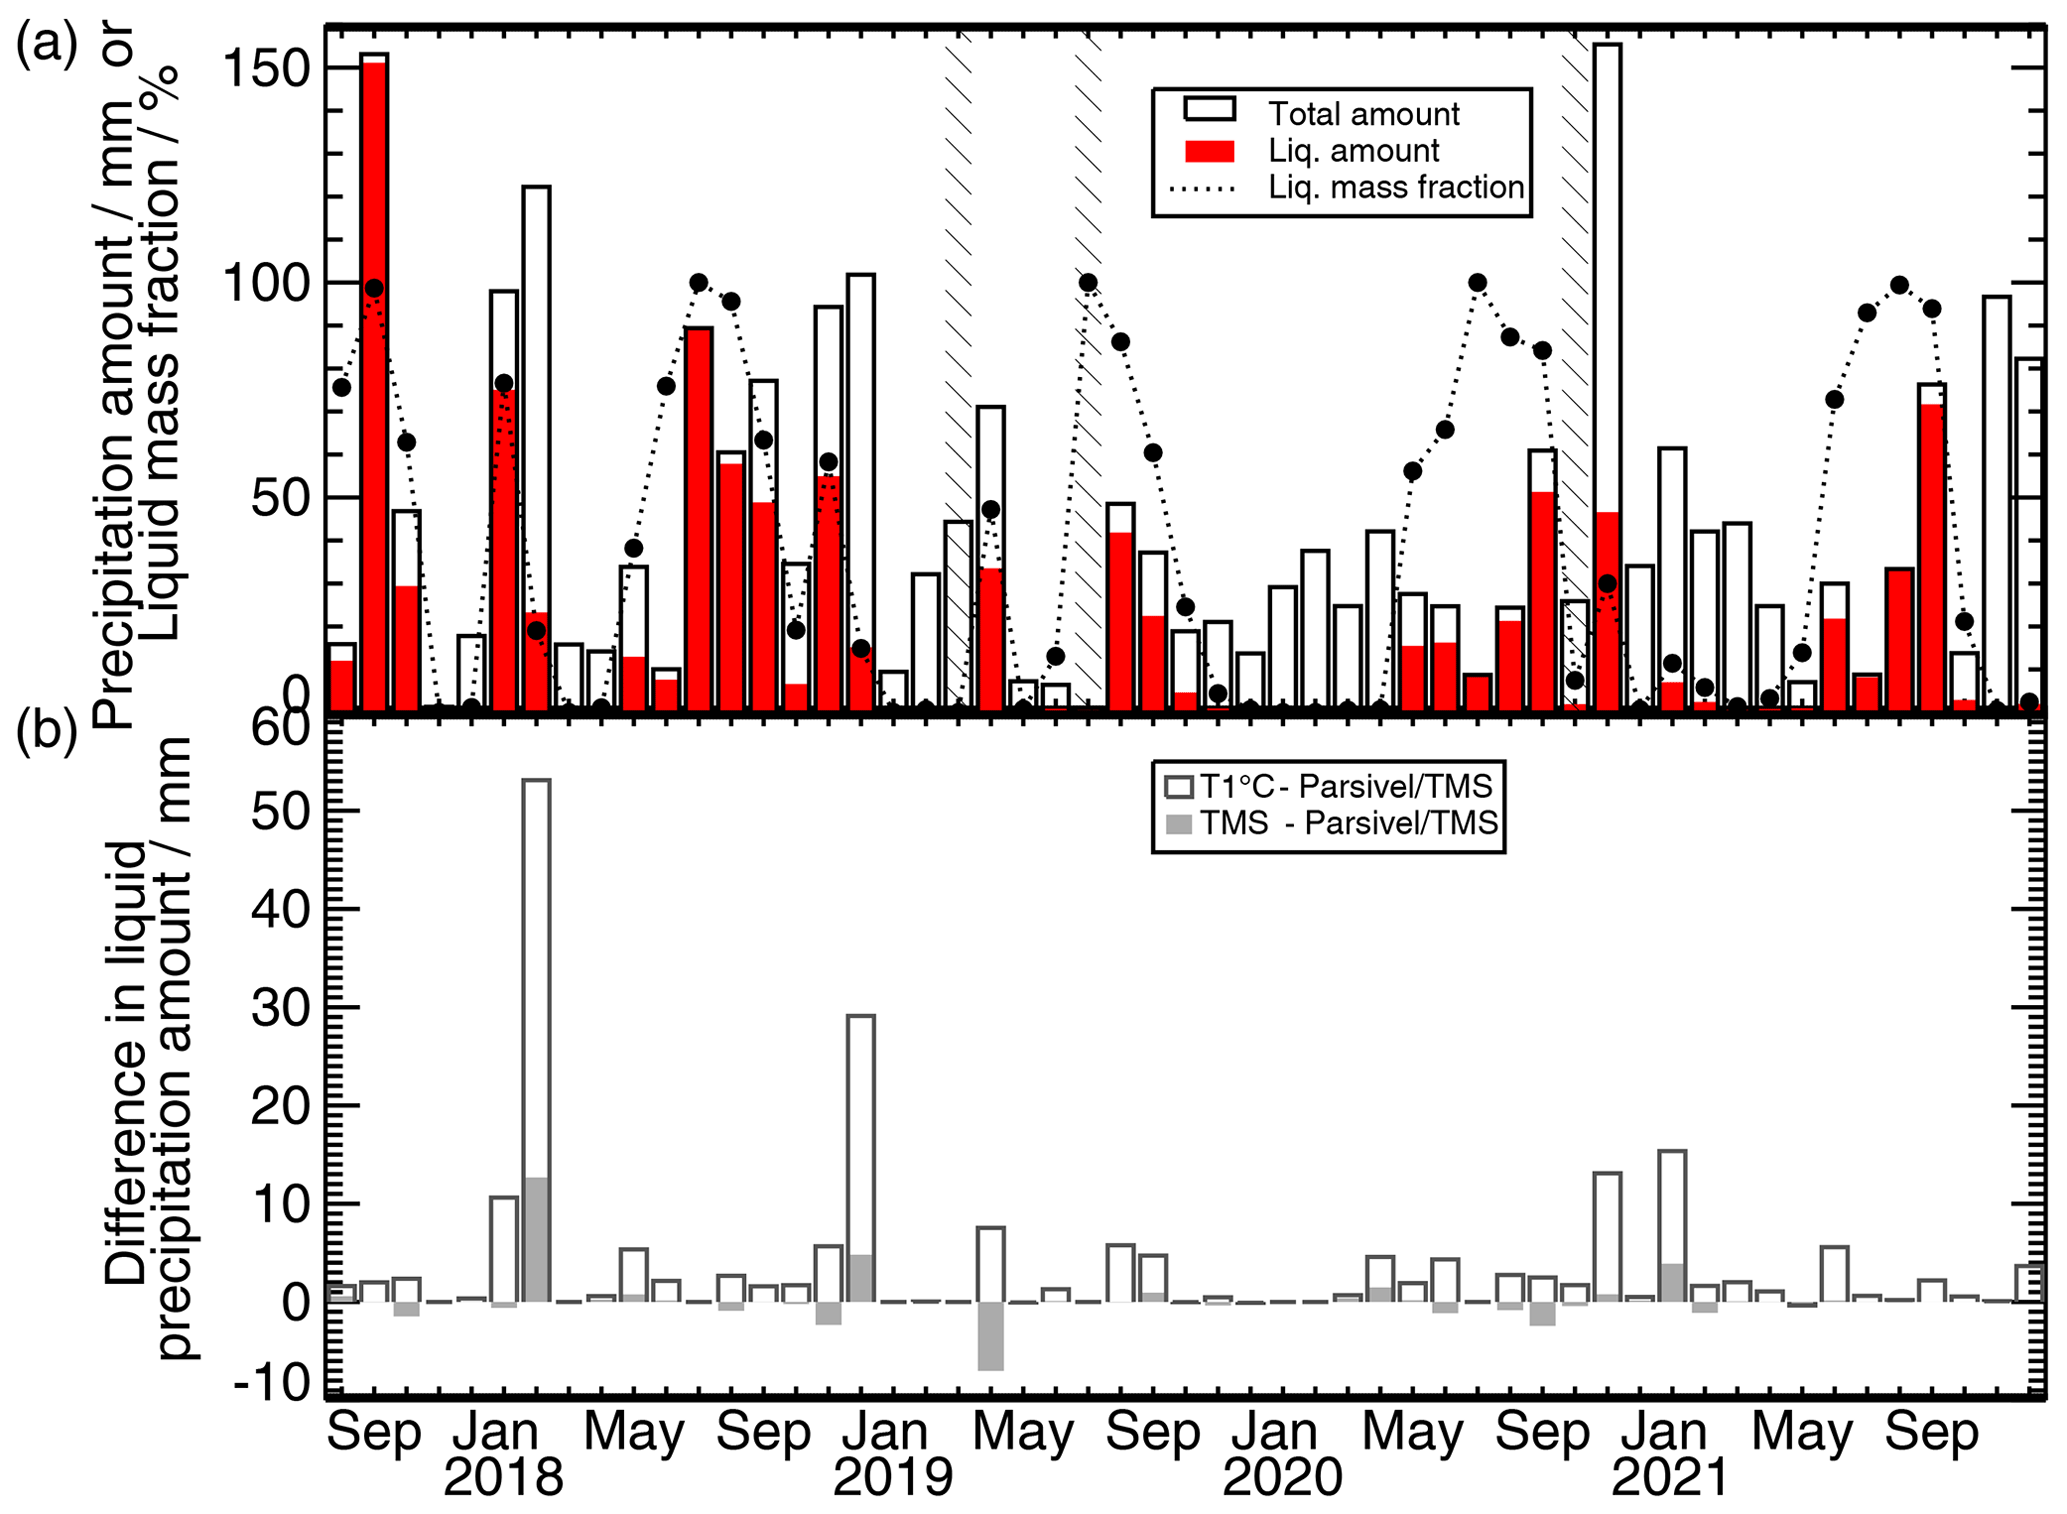
Figure 6(a) Total monthly precipitation (in mm) from corrected Pluvio data (black contour bars). The corresponding liquid precipitation amount (in mm) from the combined Parsivel/temperature-based mass separation (Parsivel/TMS; filled red bars) and the monthly liquid fraction (in %, dotted line) are shown as well. (b) Differences in monthly liquid precipitation amount (in mm) if the temperature-based mass separation (TMS; filled light gray bars bars) or a simple temperature threshold of 1 °C (T1 °C; dark gray contour bars) is used.
Table 3Annual liquid precipitation amount (in mm) and liquid fraction of the total annual precipitation amount (in %; brackets) based on the combined Parsivel/temperature-based mass separation (TMS) method, the TMS method only and a simple temperature threshold of 1 °C (denoted T1 °C) applied to the corrected Pluvio data.
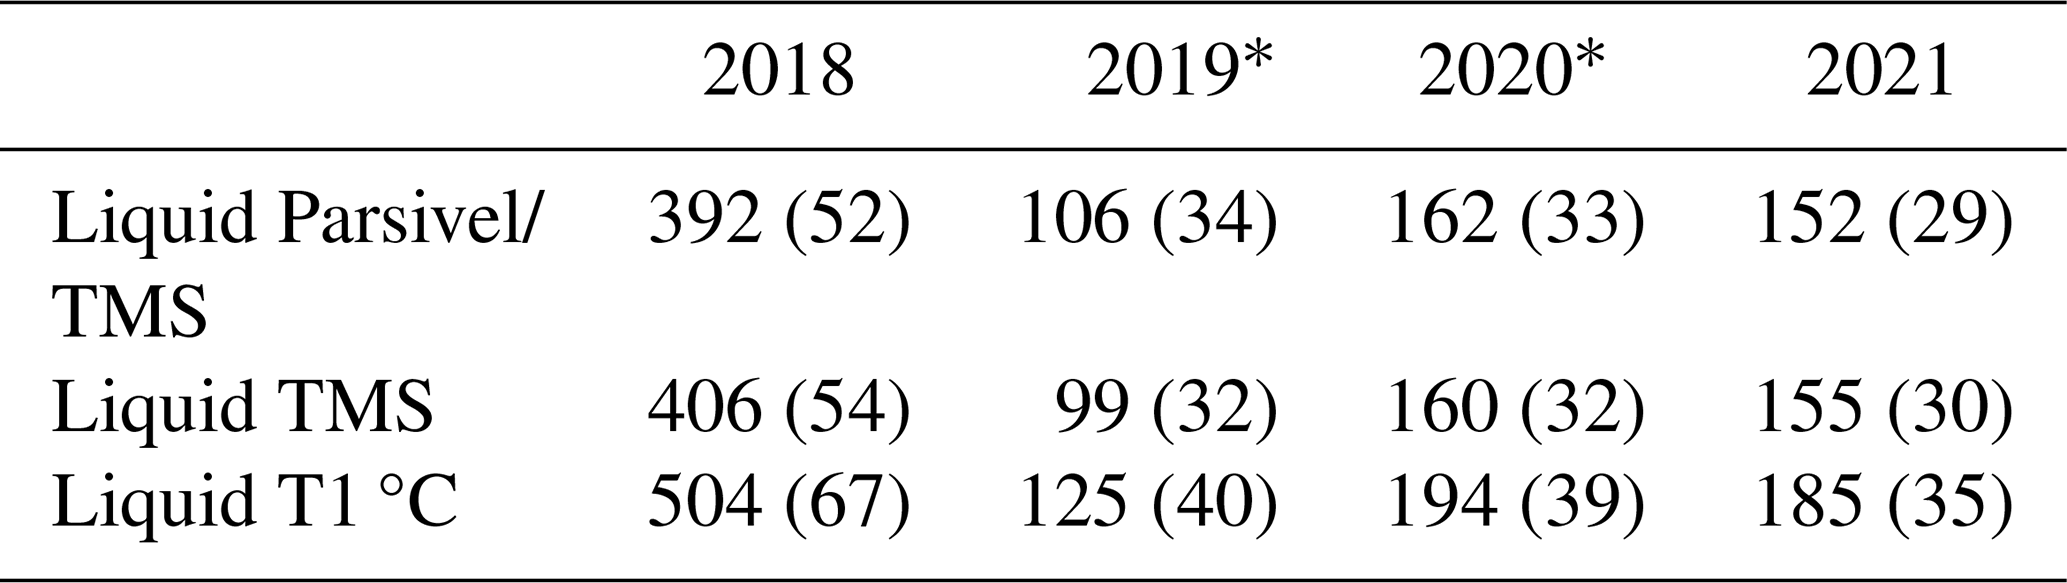
* Yearly values underestimated due to measurement gaps.
Since Champagne et al. (2024) applied the 1 °C temperature threshold to hourly mean 2 m temperature values, we also calculated hourly liquid and solid precipitation sums from the 1 min resolved liquid and solid values of the combined Parsivel/TMS method and set those in context to hourly mean 2 m temperatures (Fig. A4). Also, for hourly averaged 2 m temperatures and hourly accumulated liquid and solid precipitation sums, we find a similar temperature dependency for the mass separation as shown in Fig. 5b.
To better understand the impact of large-scale weather systems on precipitation at Ny-Ålesund, we set the local precipitation observations in context to the occurrence of ARs, cyclones and frontal systems, which have been detected using ERA5 reanalysis data and the methods explained in Sect. 2.4. We first have a look at the monthly and whole-time statistics before zooming in to hourly and daily precipitation data. As outlined in Sect. 1, not only the total precipitation amount but also the precipitation intensity is a decisive variable for the Arctic climate system.
The monthly occurrence of these systems is depicted in Fig. 7 and also listed for the different years as well as for the entire study period (1 August 2017–31 December 2021) in Table 4.
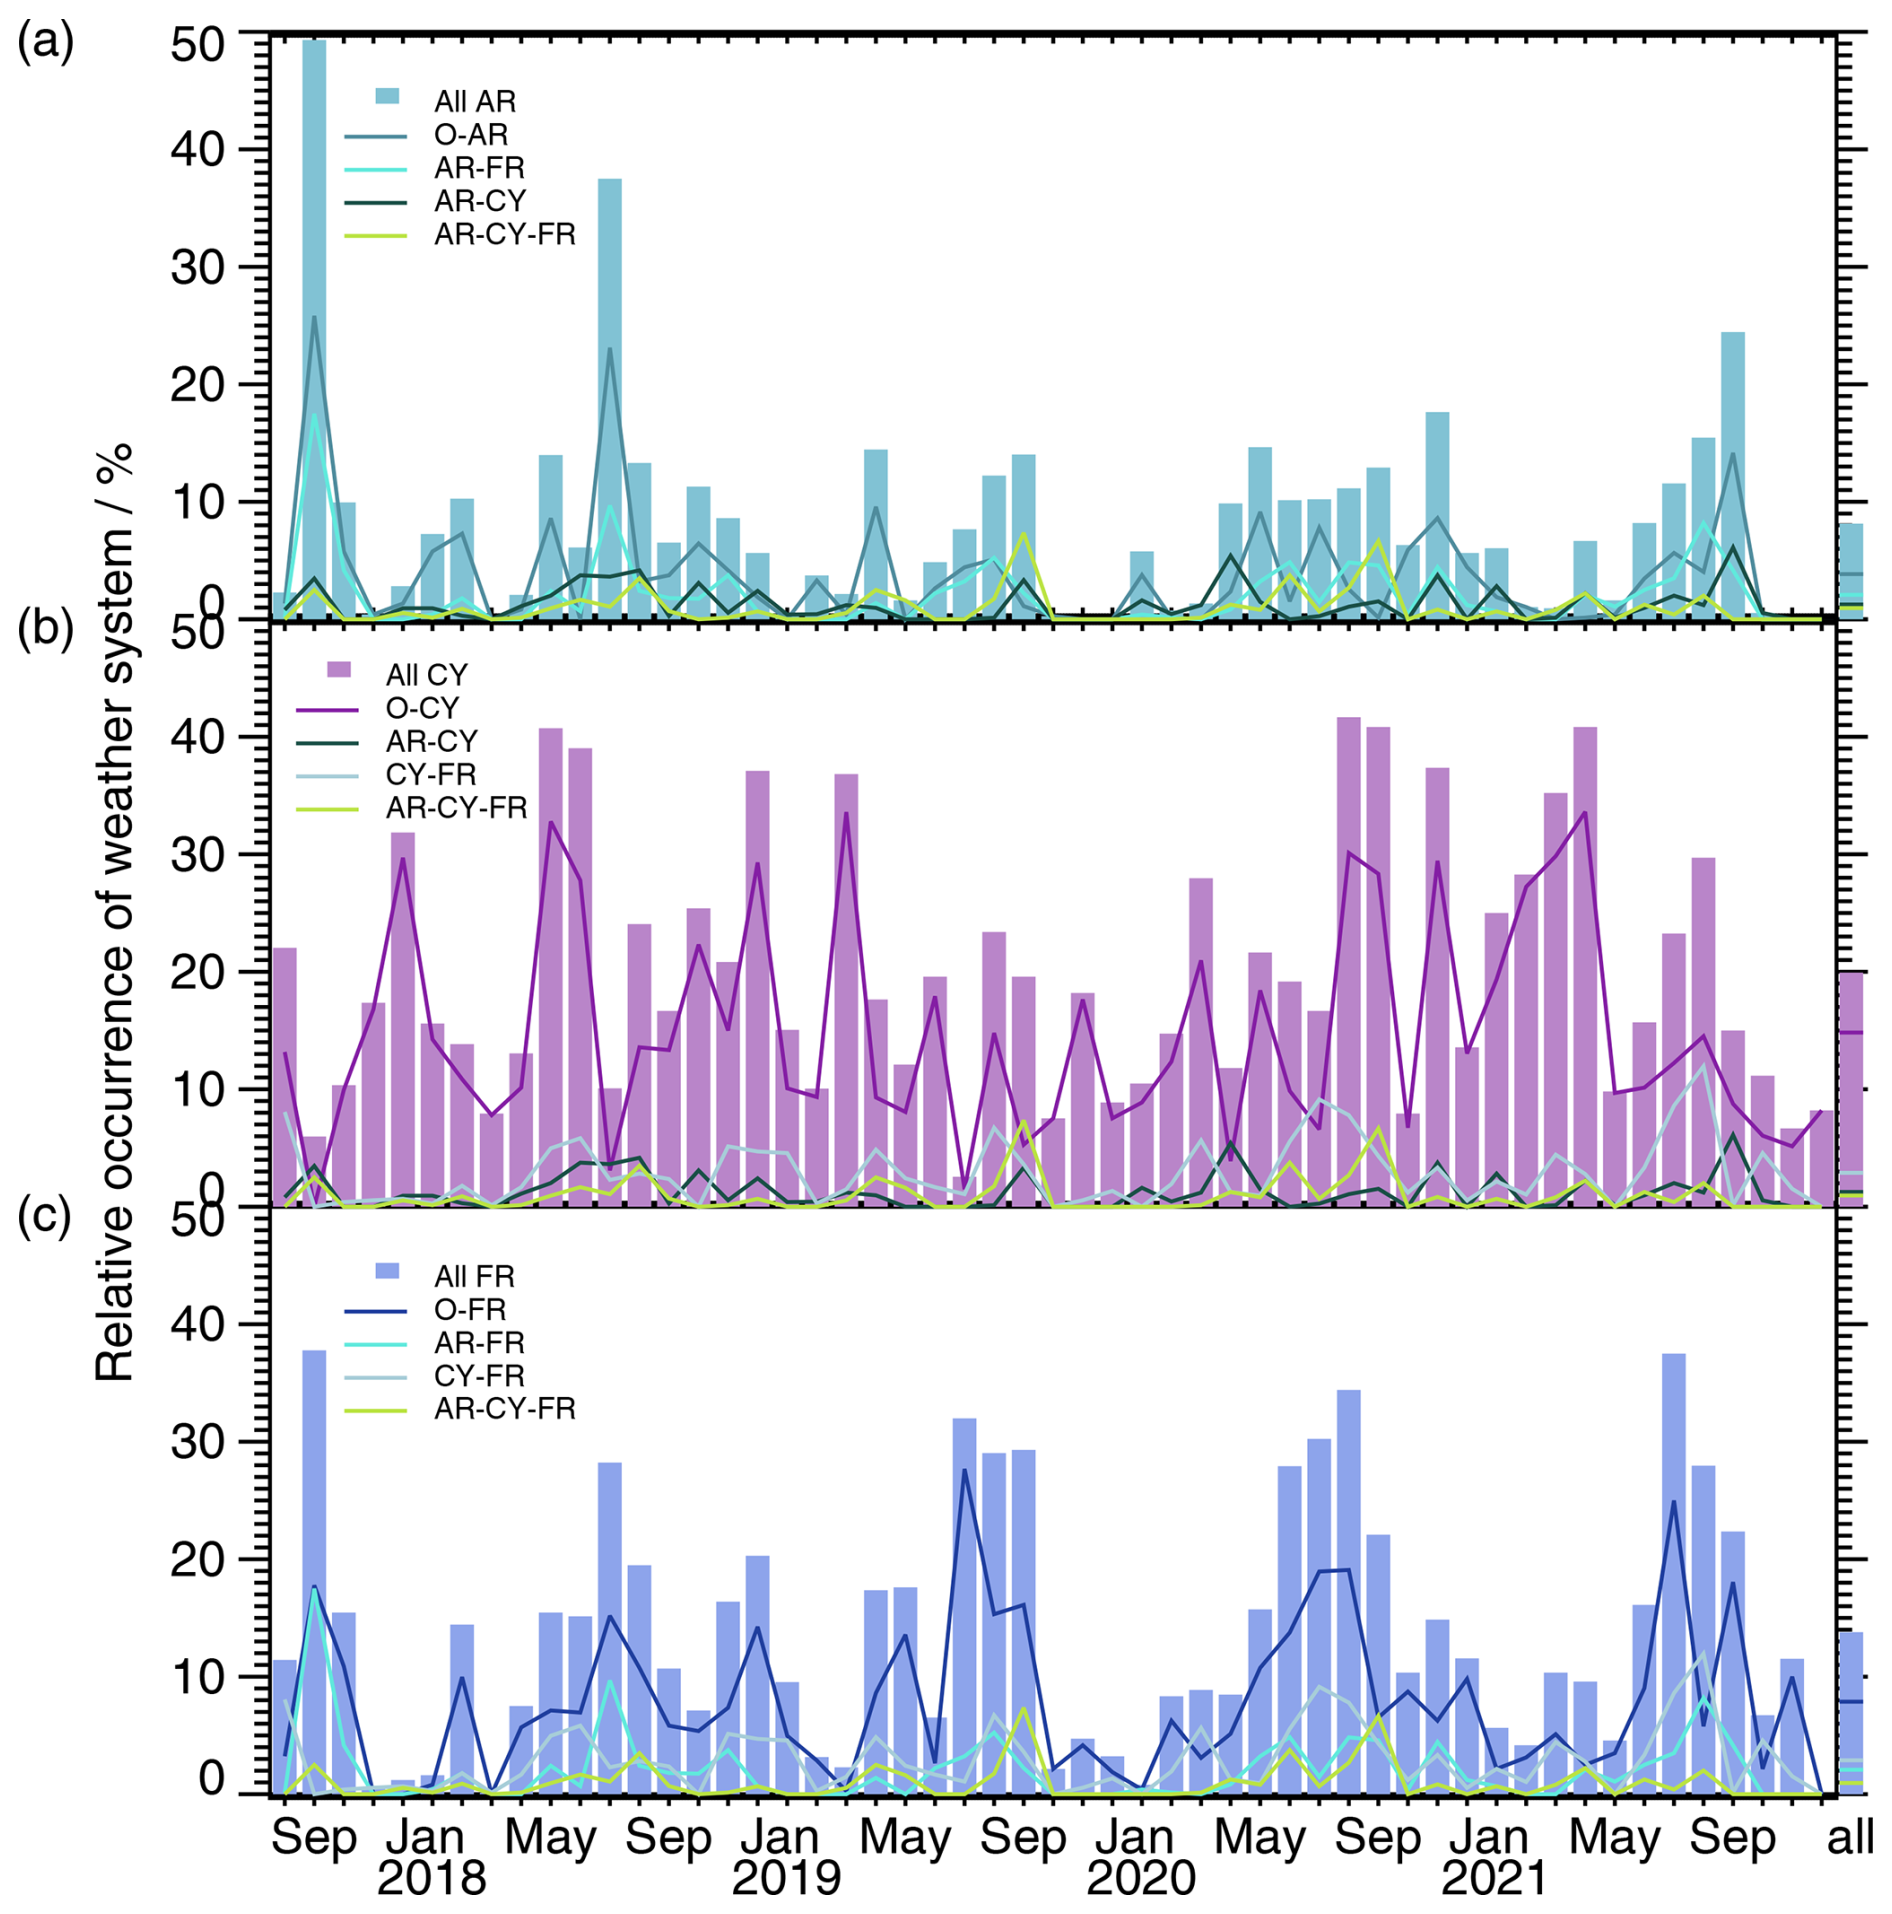
Figure 7Monthly occurrence (in %) of weather systems related to (a) atmospheric rivers (denoted AR), (b) cyclones (denoted CY) and (c) fronts (denoted FR). Weather systems can occur separately (O-AR, O-CY, O-FR) or at the same time in different combinations (colored lines; see legends). Label “all” (colored bars) includes all cases with a certain system regardless of whether the other two systems are present or not. The last column shows the occurrence of weather systems for the whole-time period considered (1 August 2017–31 December 2021).
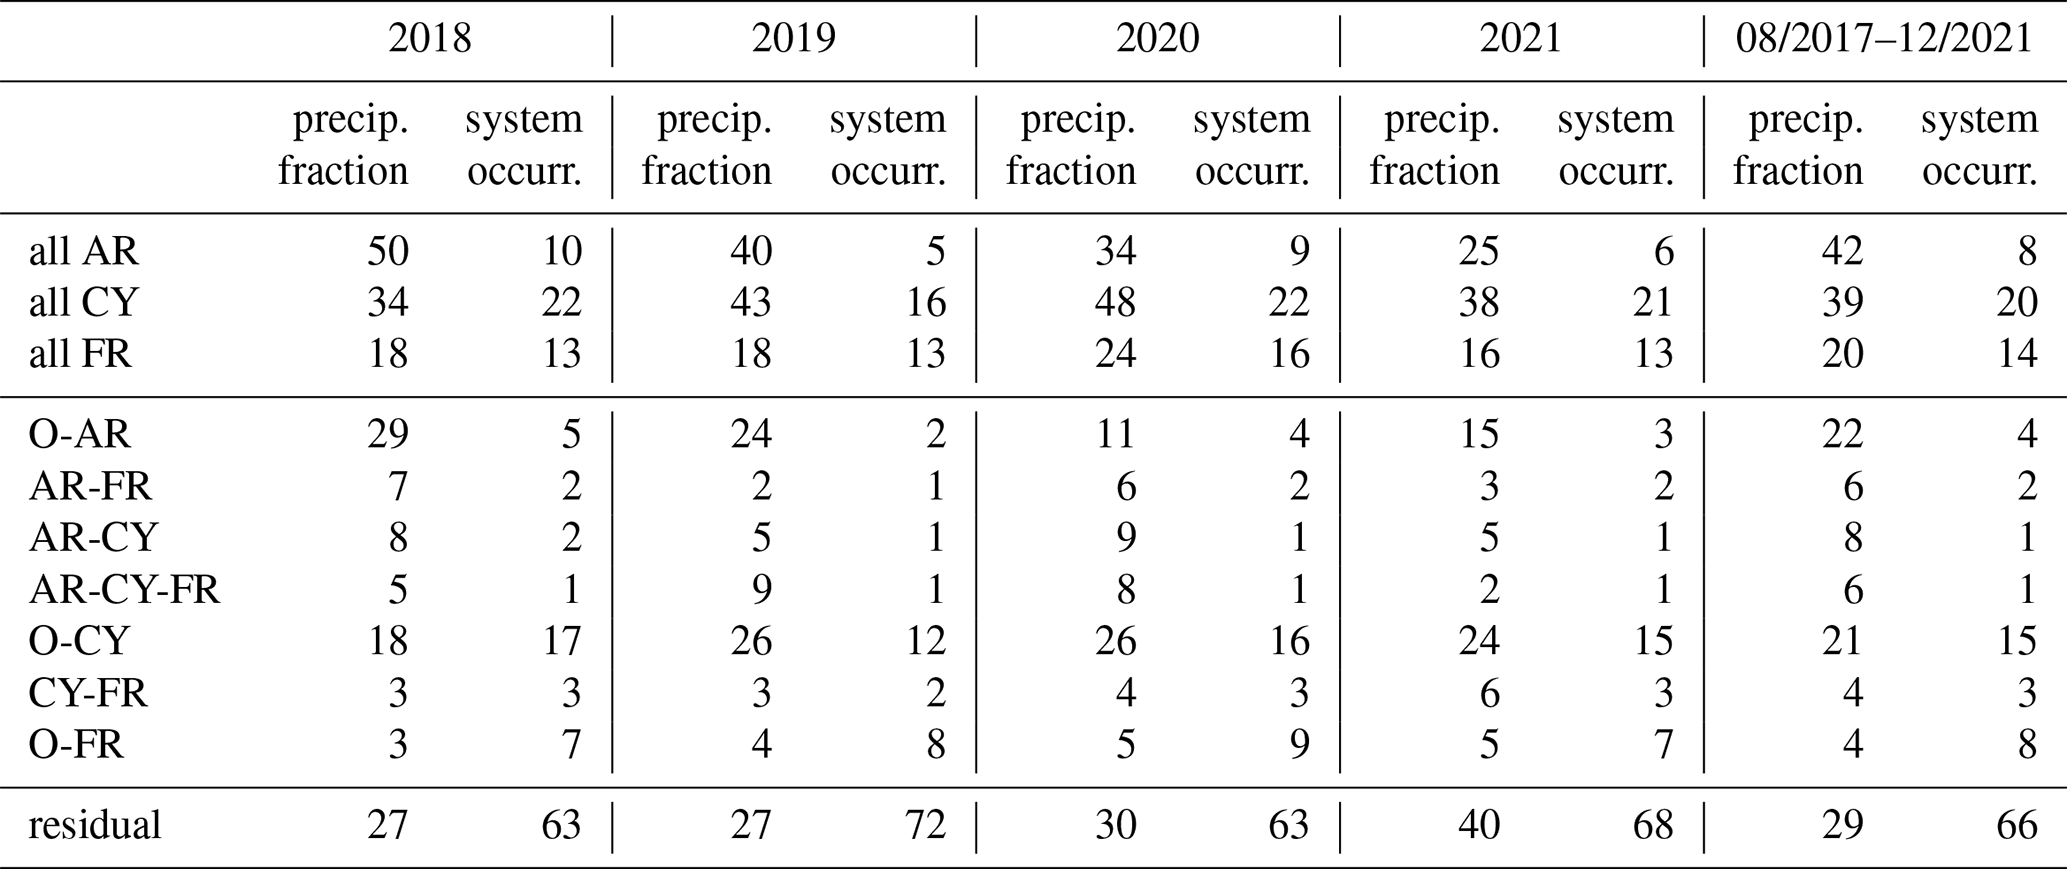
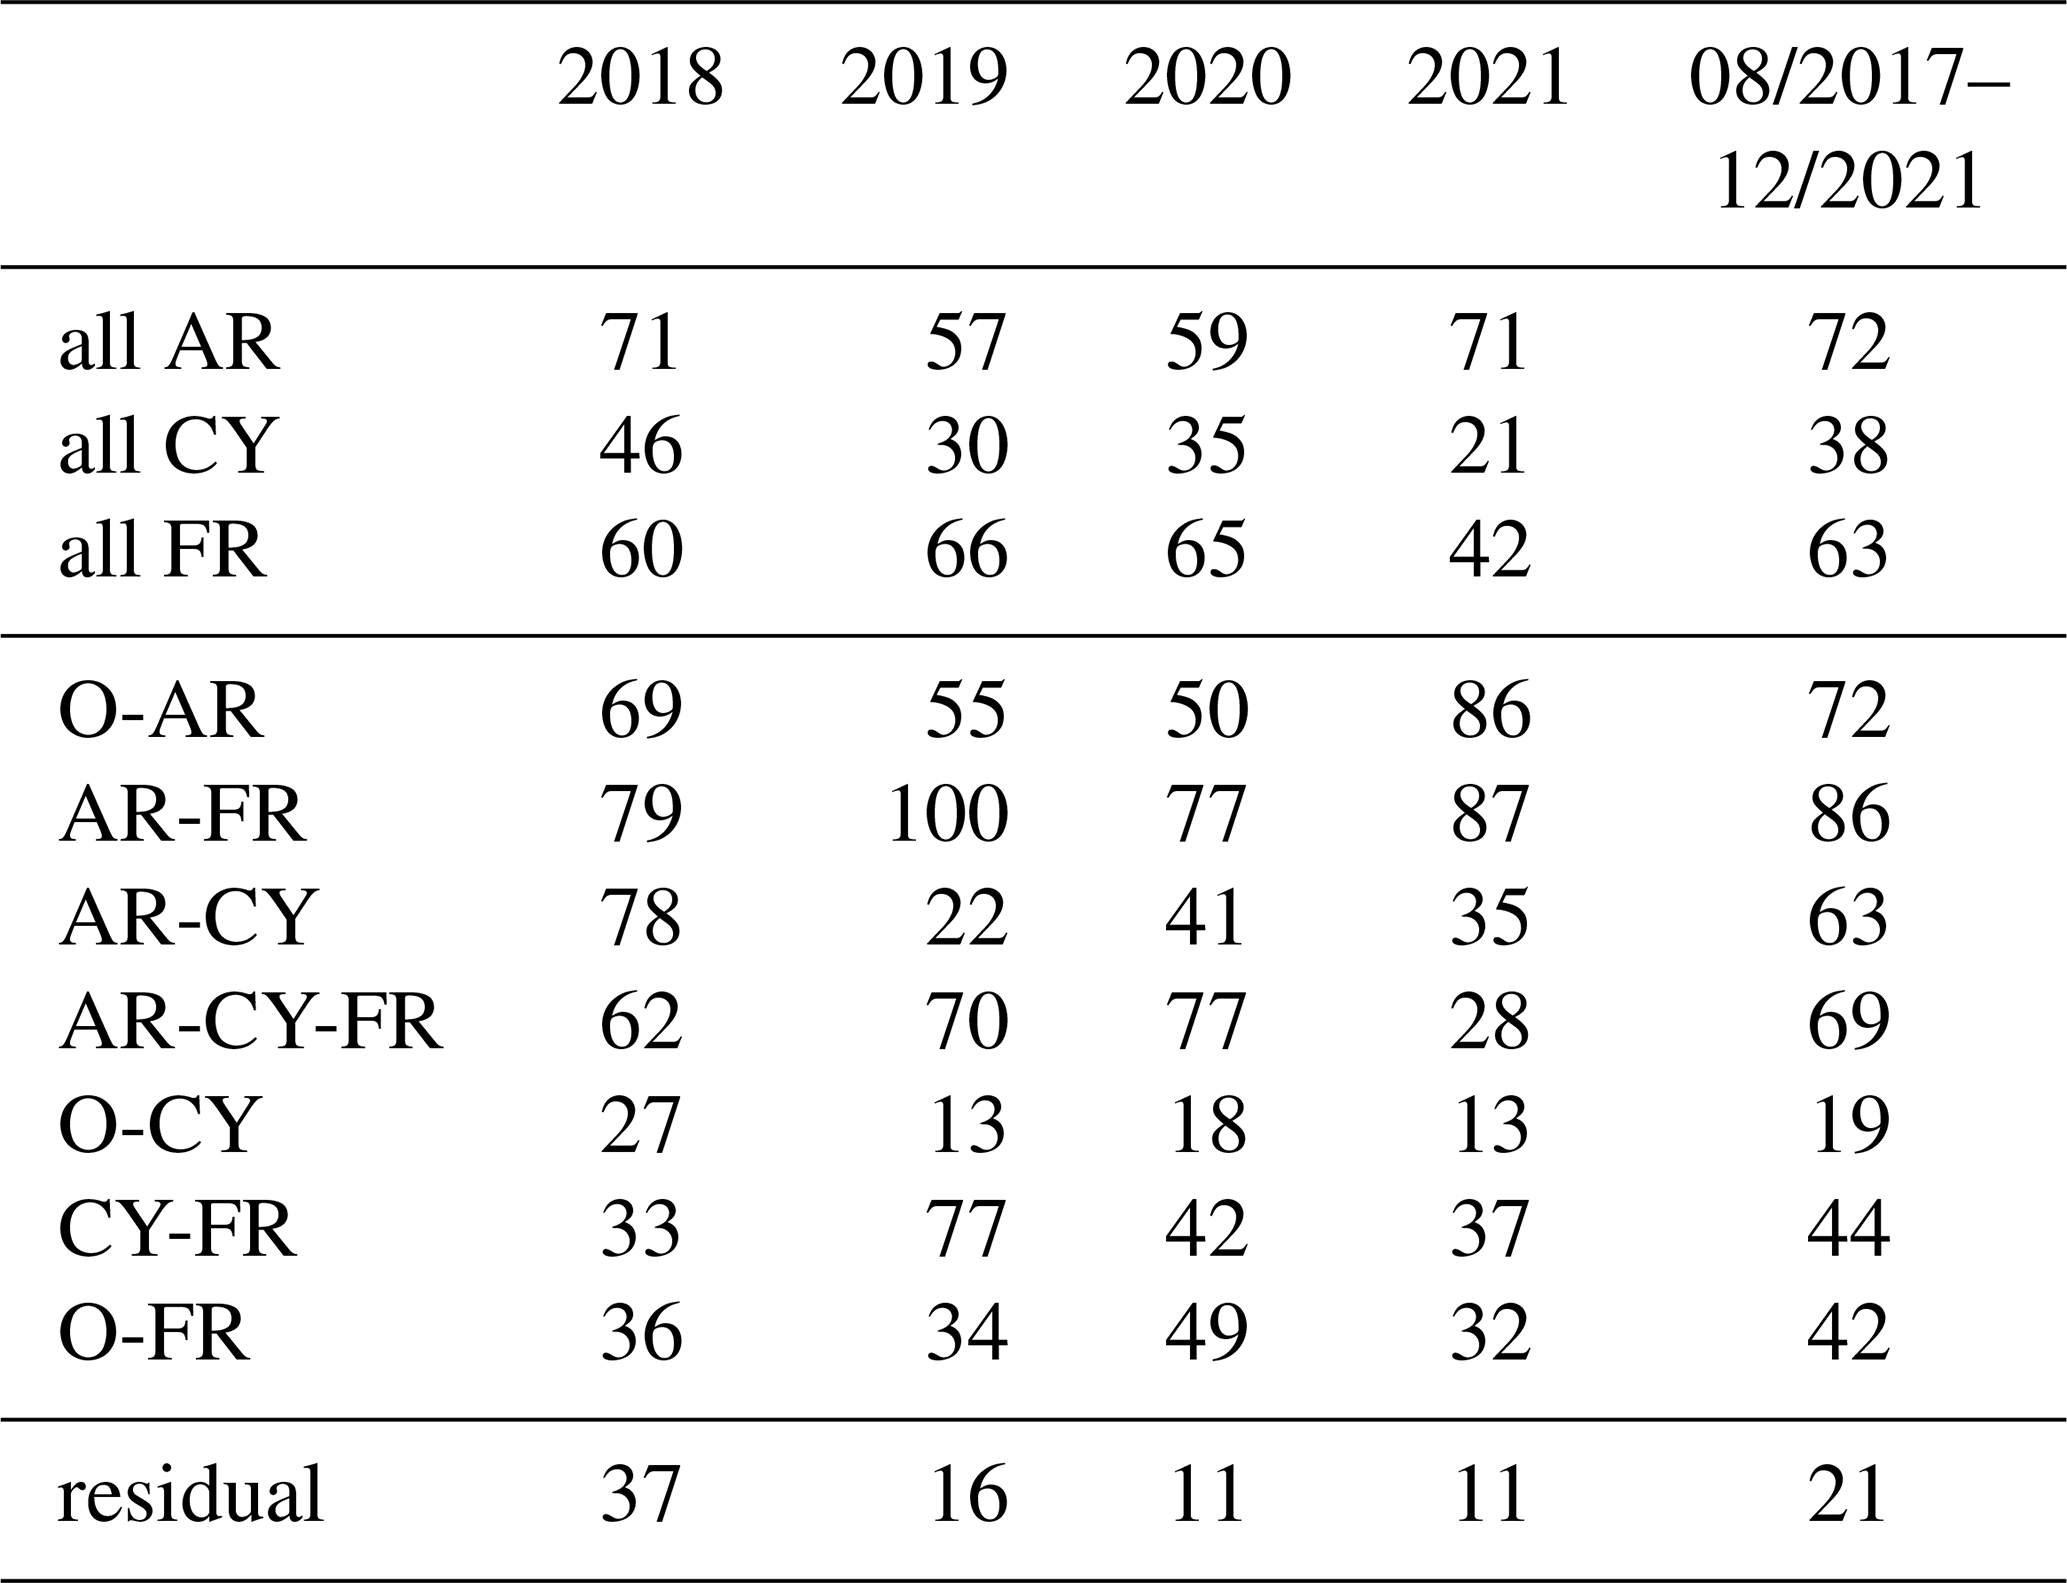
Table 4Contribution of atmospheric rivers (AR), cyclones (CY) and fronts (FR) to the corrected Pluvio precipitation amount (in %) and their frequency of occurrence (in %) for different years and the whole-time period considered (1 August 2017–31 December 2021). Weather systems can occur separately (O-AR, O-CY, O-FR) or at the same time in different combinations. Label “all” includes all cases with a certain system regardless of whether the other two systems are present or not.
Weather systems can occur separately (O-AR, O-CY, O-FR) or at the same time in different combinations (“co-located” in the following). On average, ARs (separated and co-located) occur 8 % of the time with a high variability in the monthly values ranging from 0 % in some months to an exceptionally high occurrence of 49 % and 37 % in September 2017 and July 2018, respectively. A seasonal dependency is not clearly evident from this short period, although the occurrence of ARs is slightly higher on average in summer (12 %) than in the other months of the year (7 %). Half of the ARs at Ny-Ålesund occurred without the presence of cyclones or fronts. Cyclones occur each month at Ny-Ålesund with a generally higher frequency (whole-time average of 20 %) compared to ARs. 75 % of these cyclones occur separately from the other two weather systems. On average, fronts occur 14 % of the time at Ny-Ålesund. Monthly front occurrence (separated and co-located) shows maxima of more than 20 % in summer or late summer. On average, front occurrence in June, July and August is 24 % compared to 10 % during the other months of the year. This enhanced frontal activity in summer might be related to the differential heating of the Arctic Ocean and the snow-free land as well as coastal orography which supports baroclinicity (Serreze and Barry, 2014). At least for the 4 years considered, it seems that the yearly AR occurrence is more variable than the cyclone or front occurrence. However, a longer time series needs to be analyzed to draw a conclusion here.
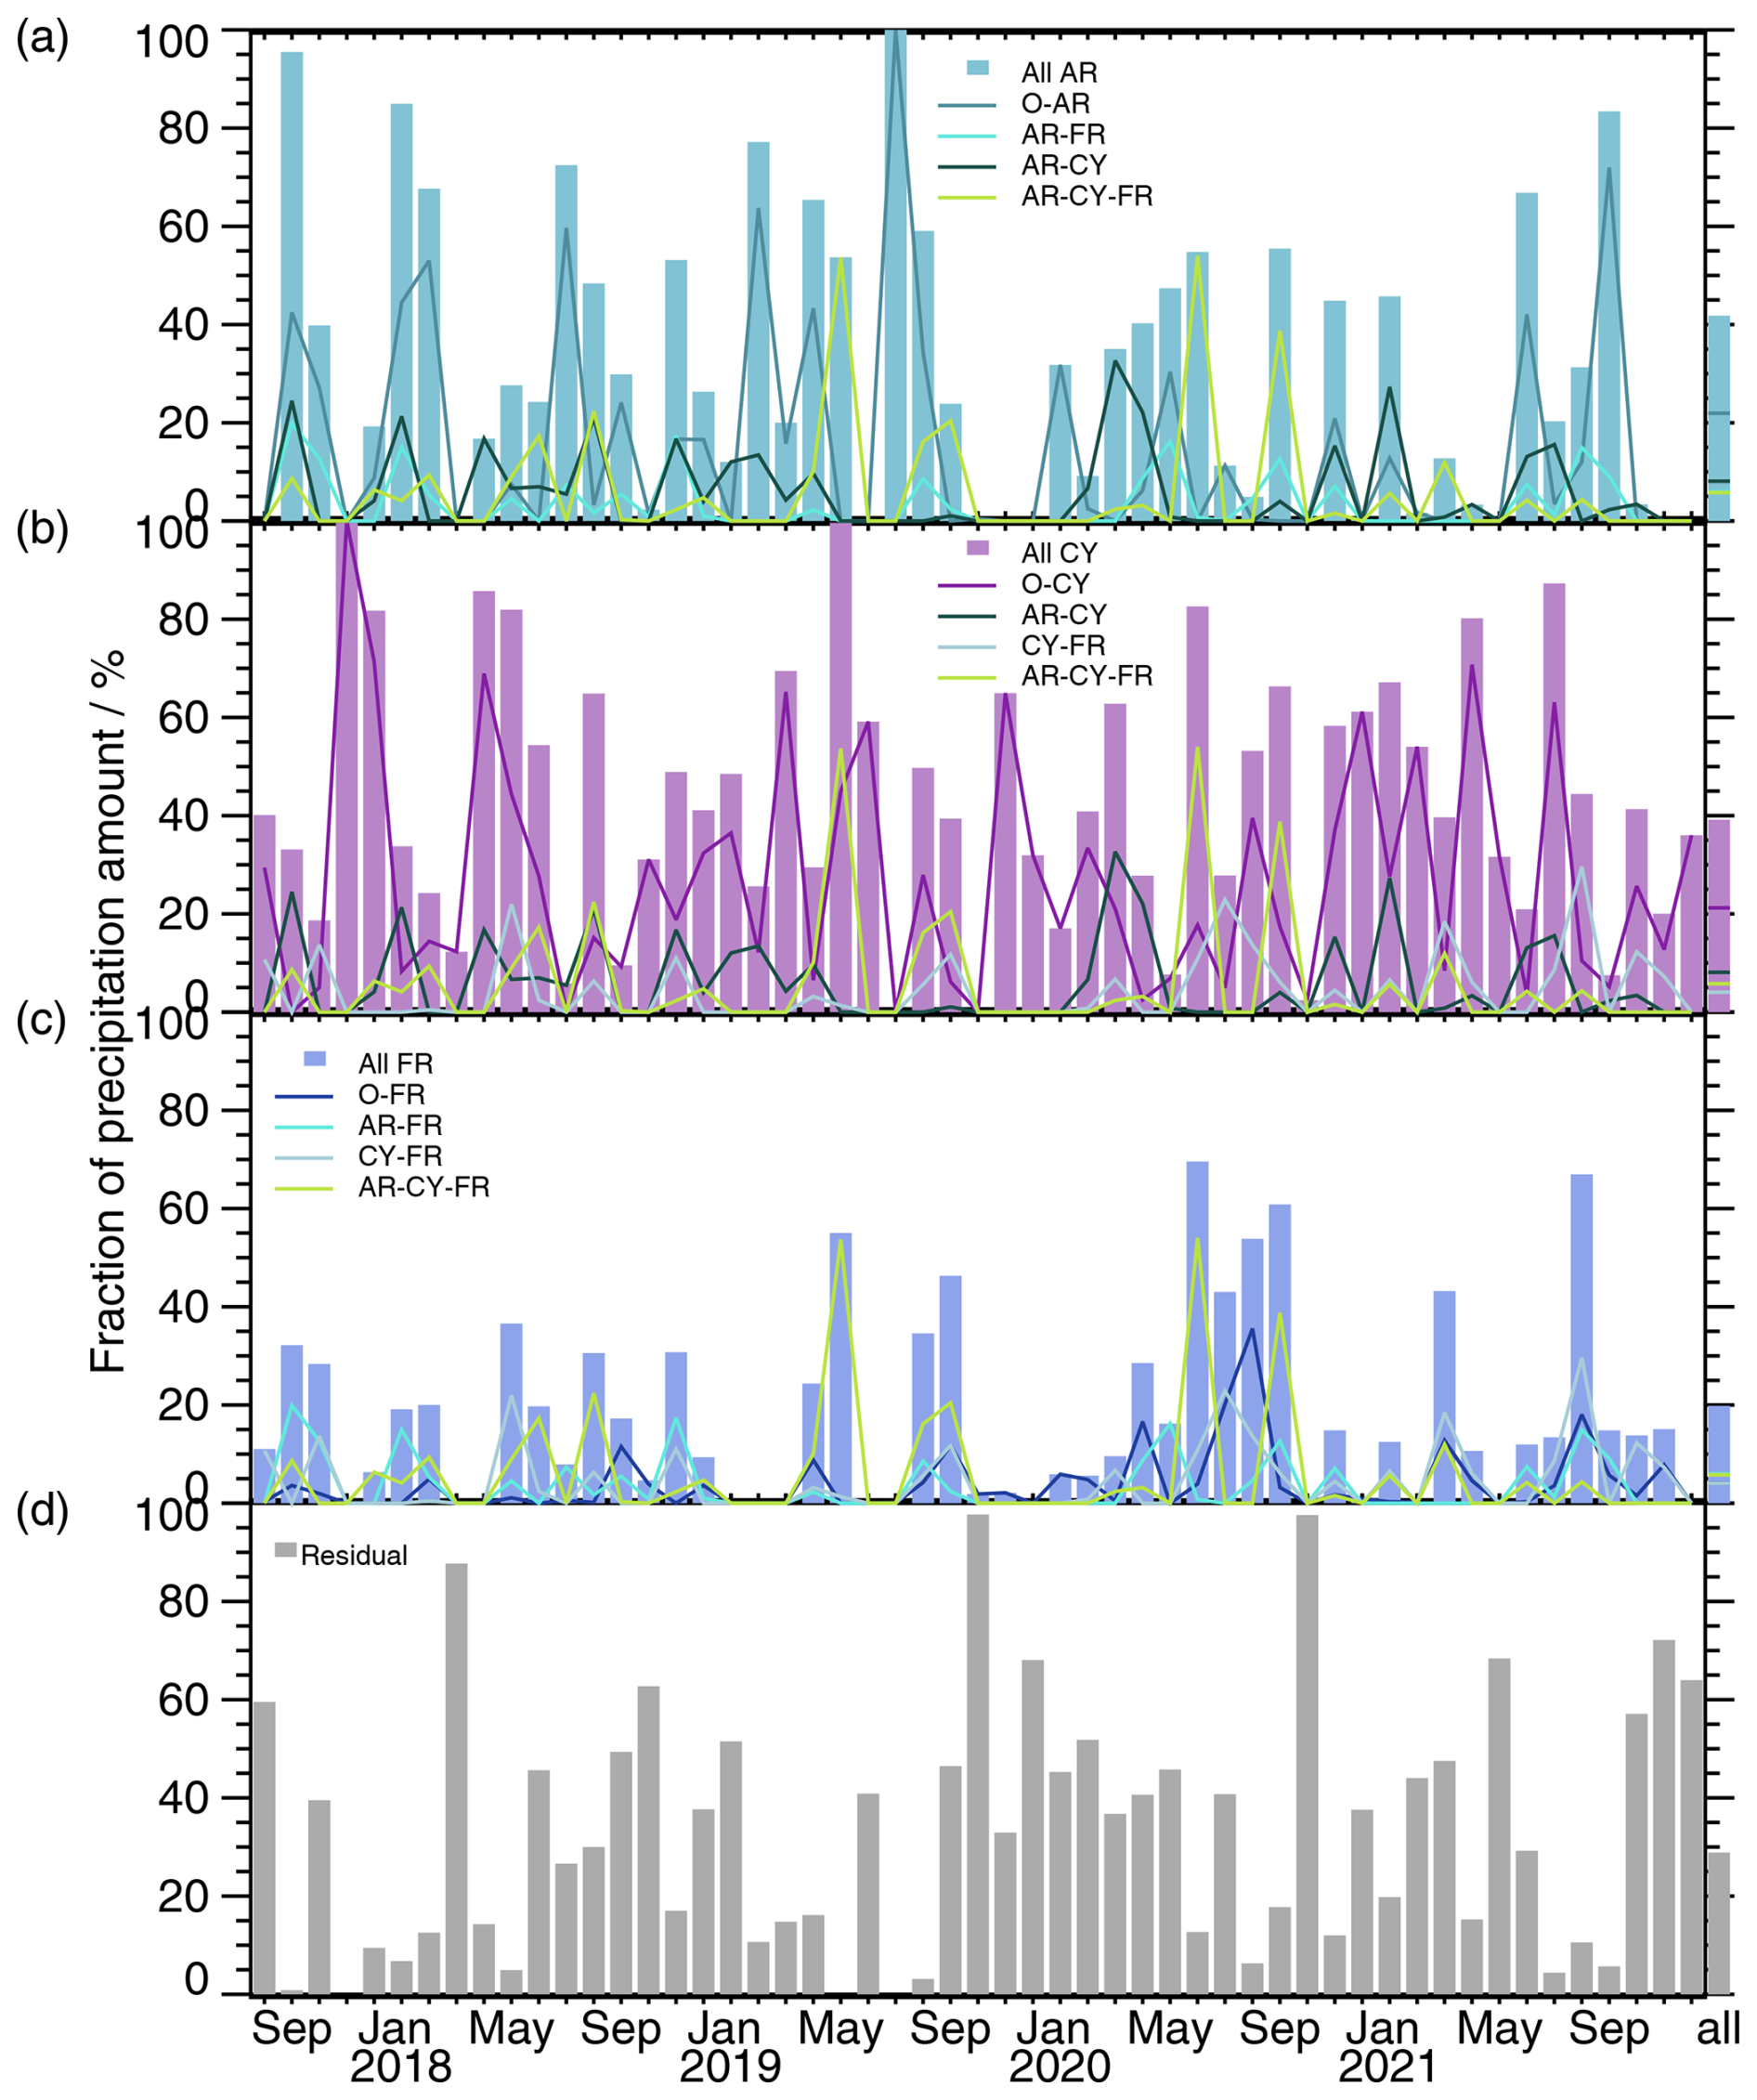
Figure 8Relative contribution (in %) of (a) atmospheric rivers (AR), (b) cyclones (CY) and (c) fronts (FR) to monthly precipitation amount from corrected Pluvio data. Weather systems can occur separately (O-AR, O-CY, O-FR) or at the same time in different combinations (colored lines; see legends). Label “all” (colored bars) includes all cases with a certain system regardless of whether the other two systems are present or not. Precipitation that can not be attributed to any of these systems is denoted as “Residual” (see panel d). The last column shows the relative contribution to the total precipitation amount of the whole period considered (1 August 2017–31 December 2021).
By combining the corrected Pluvio measurements with the detected weather systems over Ny-Ålesund, we can assess how much of the precipitation is related to ARs, cyclones or fronts. Precipitation that can not be attributed to any of these systems is denoted as “residual”. The monthly absolute and relative precipitation amounts are summarized in Figs. A5 and 8, respectively, and the yearly and whole-time contributions are in Table 4. The largest contributions to monthly and yearly precipitation can be found for the AR and cyclone classes. Even if the occurrence of ARs is rather low on average (4 % for O-AR, 8 % for all ARs), they contribute 22 % (O-AR) and 42 % (all AR) to the total precipitation amount from August 2017 to December 2021, respectively. The relatively rare combined classes AR-FR (2 %), AR-CY (1 %) and AR-CY-FR (1 %) contribute together 20 % of the total precipitation amount. However, the year-to-year and month-to-month variability of the precipitation fraction associated with ARs is large, with only 25 % in 2021 and even 50 % in 2018. In particular, in the very wet month of September 2017, almost all precipitation, i.e., 145 mm (Fig. A5), can be related to the (co-)occurrence of ARs. For the month with the highest precipitation amount, i.e., November 2020, both AR and cyclone classes contribute together to about 80 % of the total precipitation amount, with the O-CY class even dominating. Cyclones, which occur more often (20 %) than ARs, contribute similarly to the total precipitation amount, i.e., 21 % for O-CY and 39 % for all CY. Fronts seem to play a minor role in the precipitation amount at Ny-Ålesund: a distinct contribution of separated fronts (O-FR) to monthly precipitation amount can only be found in a few months, e.g., August 2020 (O-FR: 35 %). Regarding the whole-time period, separated fronts contribute only about 4 % to the total precipitation. The value increases to 20 % only in combination with ARs and cyclones. Quite some precipitation cannot be attributed to any of these weather patterns with an overall value of 29 %. This residual is generally larger from early autumn to early spring, both in terms of absolute (Fig. A5d) and relative precipitation amounts (Fig. 8d).
These results are not directly comparable to the study by Lauer et al. (2023), as they focused on four months only (May/June 2017, March/April 2019) and on the Arctic North Atlantic and Kara and Barents Seas. However, they also found that fronts were of higher importance for precipitation in the summer period and that residual precipitation made up about 30 % of the total precipitation.
Table 5Fraction of liquid precipitation (in %) relative to the total precipitation amount for the different weather systems for different years and the whole-time period considered (1 August 2017–31 December 2021). Atmospheric rivers (AR), cyclones (CY) and fronts (FR) can occur separately (O-AR, O-CY, O-FR) or at the same time in different combinations. Label “all” includes all cases with a certain system regardless of whether the other two systems are present or not. Precipitation that can not be attributed to any of these systems is denoted as “residual”. The precipitation amount is taken from the corrected Pluvio data, and phase information is obtained using the combined Parsivel/temperature-based method.
With the combined Parsivel/temperature-based mass separation method (Sect. 3.2), we also analyzed the phase partitioning for the different weather systems (Table 5). Regarding the precipitation of all ARs from 1 August 2017–31 December 2021, 72 % of the precipitation amount is liquid. For all fronts and all cyclones, the liquid fraction is 63 % and 38 %, respectively. The corresponding values for the different years vary, but the tendency of a higher liquid fraction for ARs and fronts is visible. The highest liquid fraction occurs when ARs and fronts are co-located (86 %). The high liquid fraction of precipitation related to ARs and fronts is also due to the fact that a substantial amount of precipitation associated with these weather systems, i.e., 49 % for ARs and 56 % for fronts, falls in the warmer months May to September. Residual precipitation, which predominantly occurs in autumn and winter, consists mainly of solid precipitation (79 %) with yearly values ranging from 63 % to 89 %. The importance of ARs for rain was also found by Lauer et al. (2023), as well as the higher contribution to snowfall of the residual precipitation class.
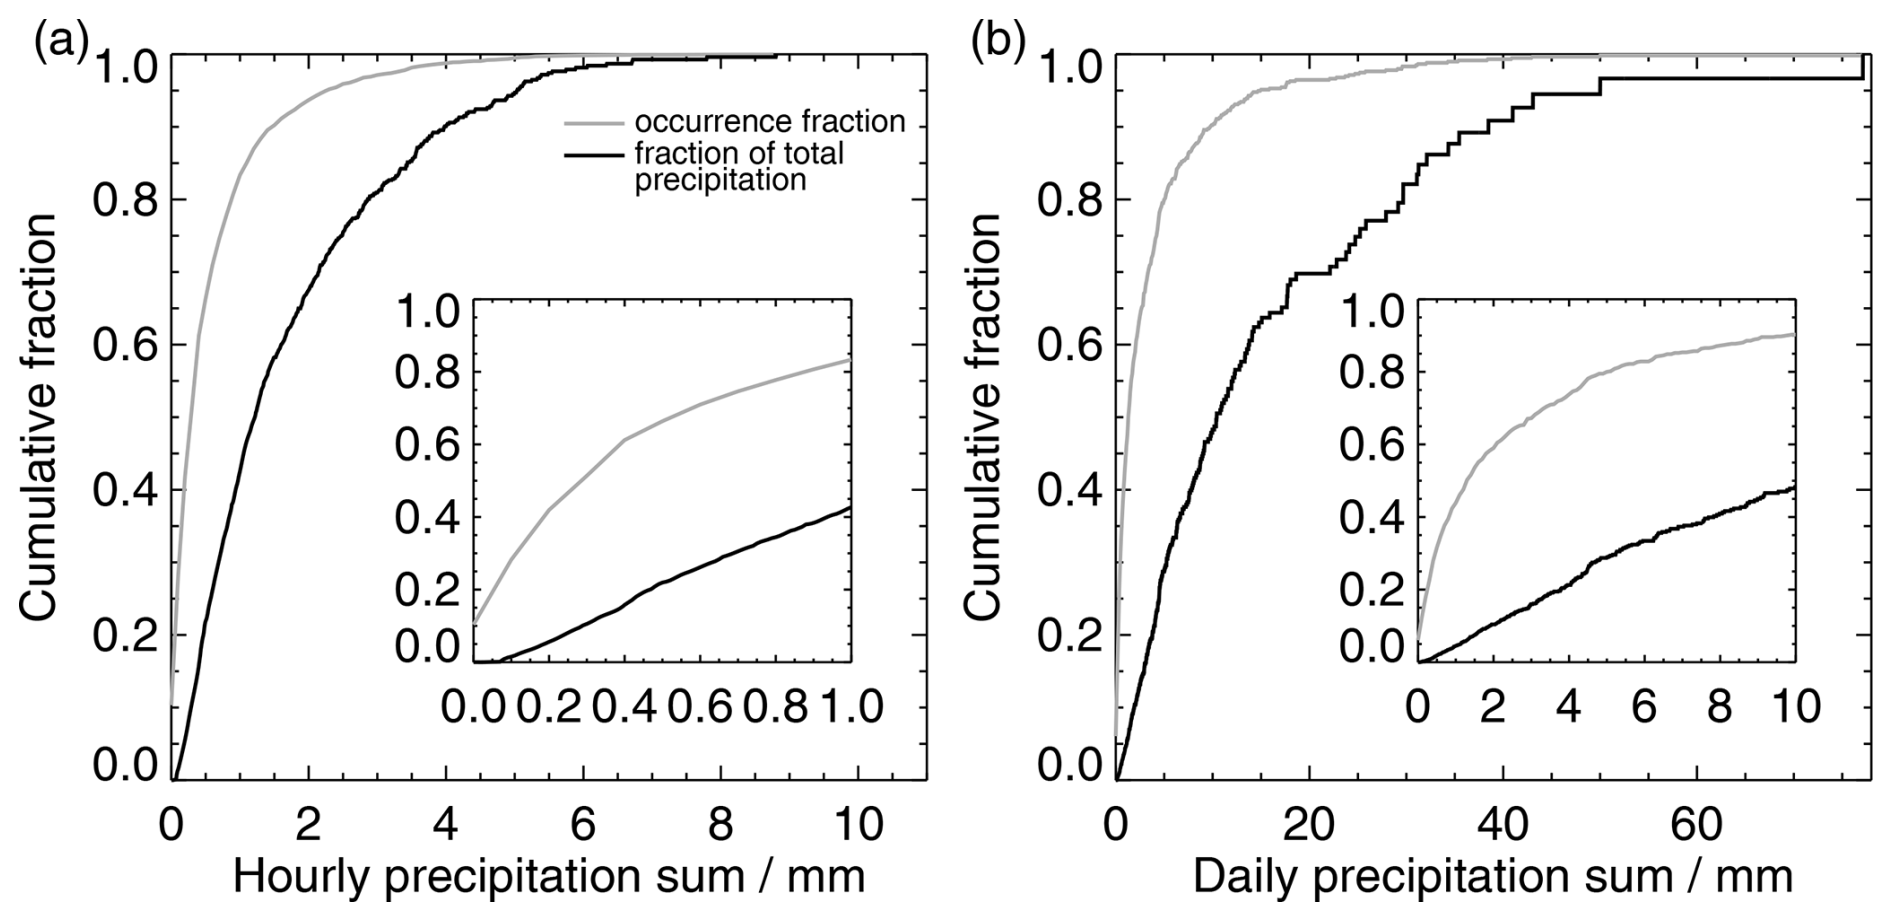
Figure 9Cumulative relative occurrence of (a) hourly and (b) daily precipitation sums (gray) and cumulative relative contribution of these precipitation sums to total precipitation amount (black) based on the corrected Pluvio data for the time period 1 August 2017 to 31 December 2021. The insets are zoom-in views for hourly (daily) precipitation sums below 1 mm (10 mm).
The high temporal resolution of the Pluvio and Parsivel measurements allows precipitation rates to be analyzed for shorter time intervals. When looking at the hourly precipitation sums (Fig. 9a), 50 % of the sums have values lower than 0.4 mm and 90 % lower than 1.5 mm. The latter contributes only about 57 % to the total precipitation at Ny-Ålesund. Hourly precipitation amounts larger than 3.6 mm make up only 2 % of all non-zero hourly precipitation sums.
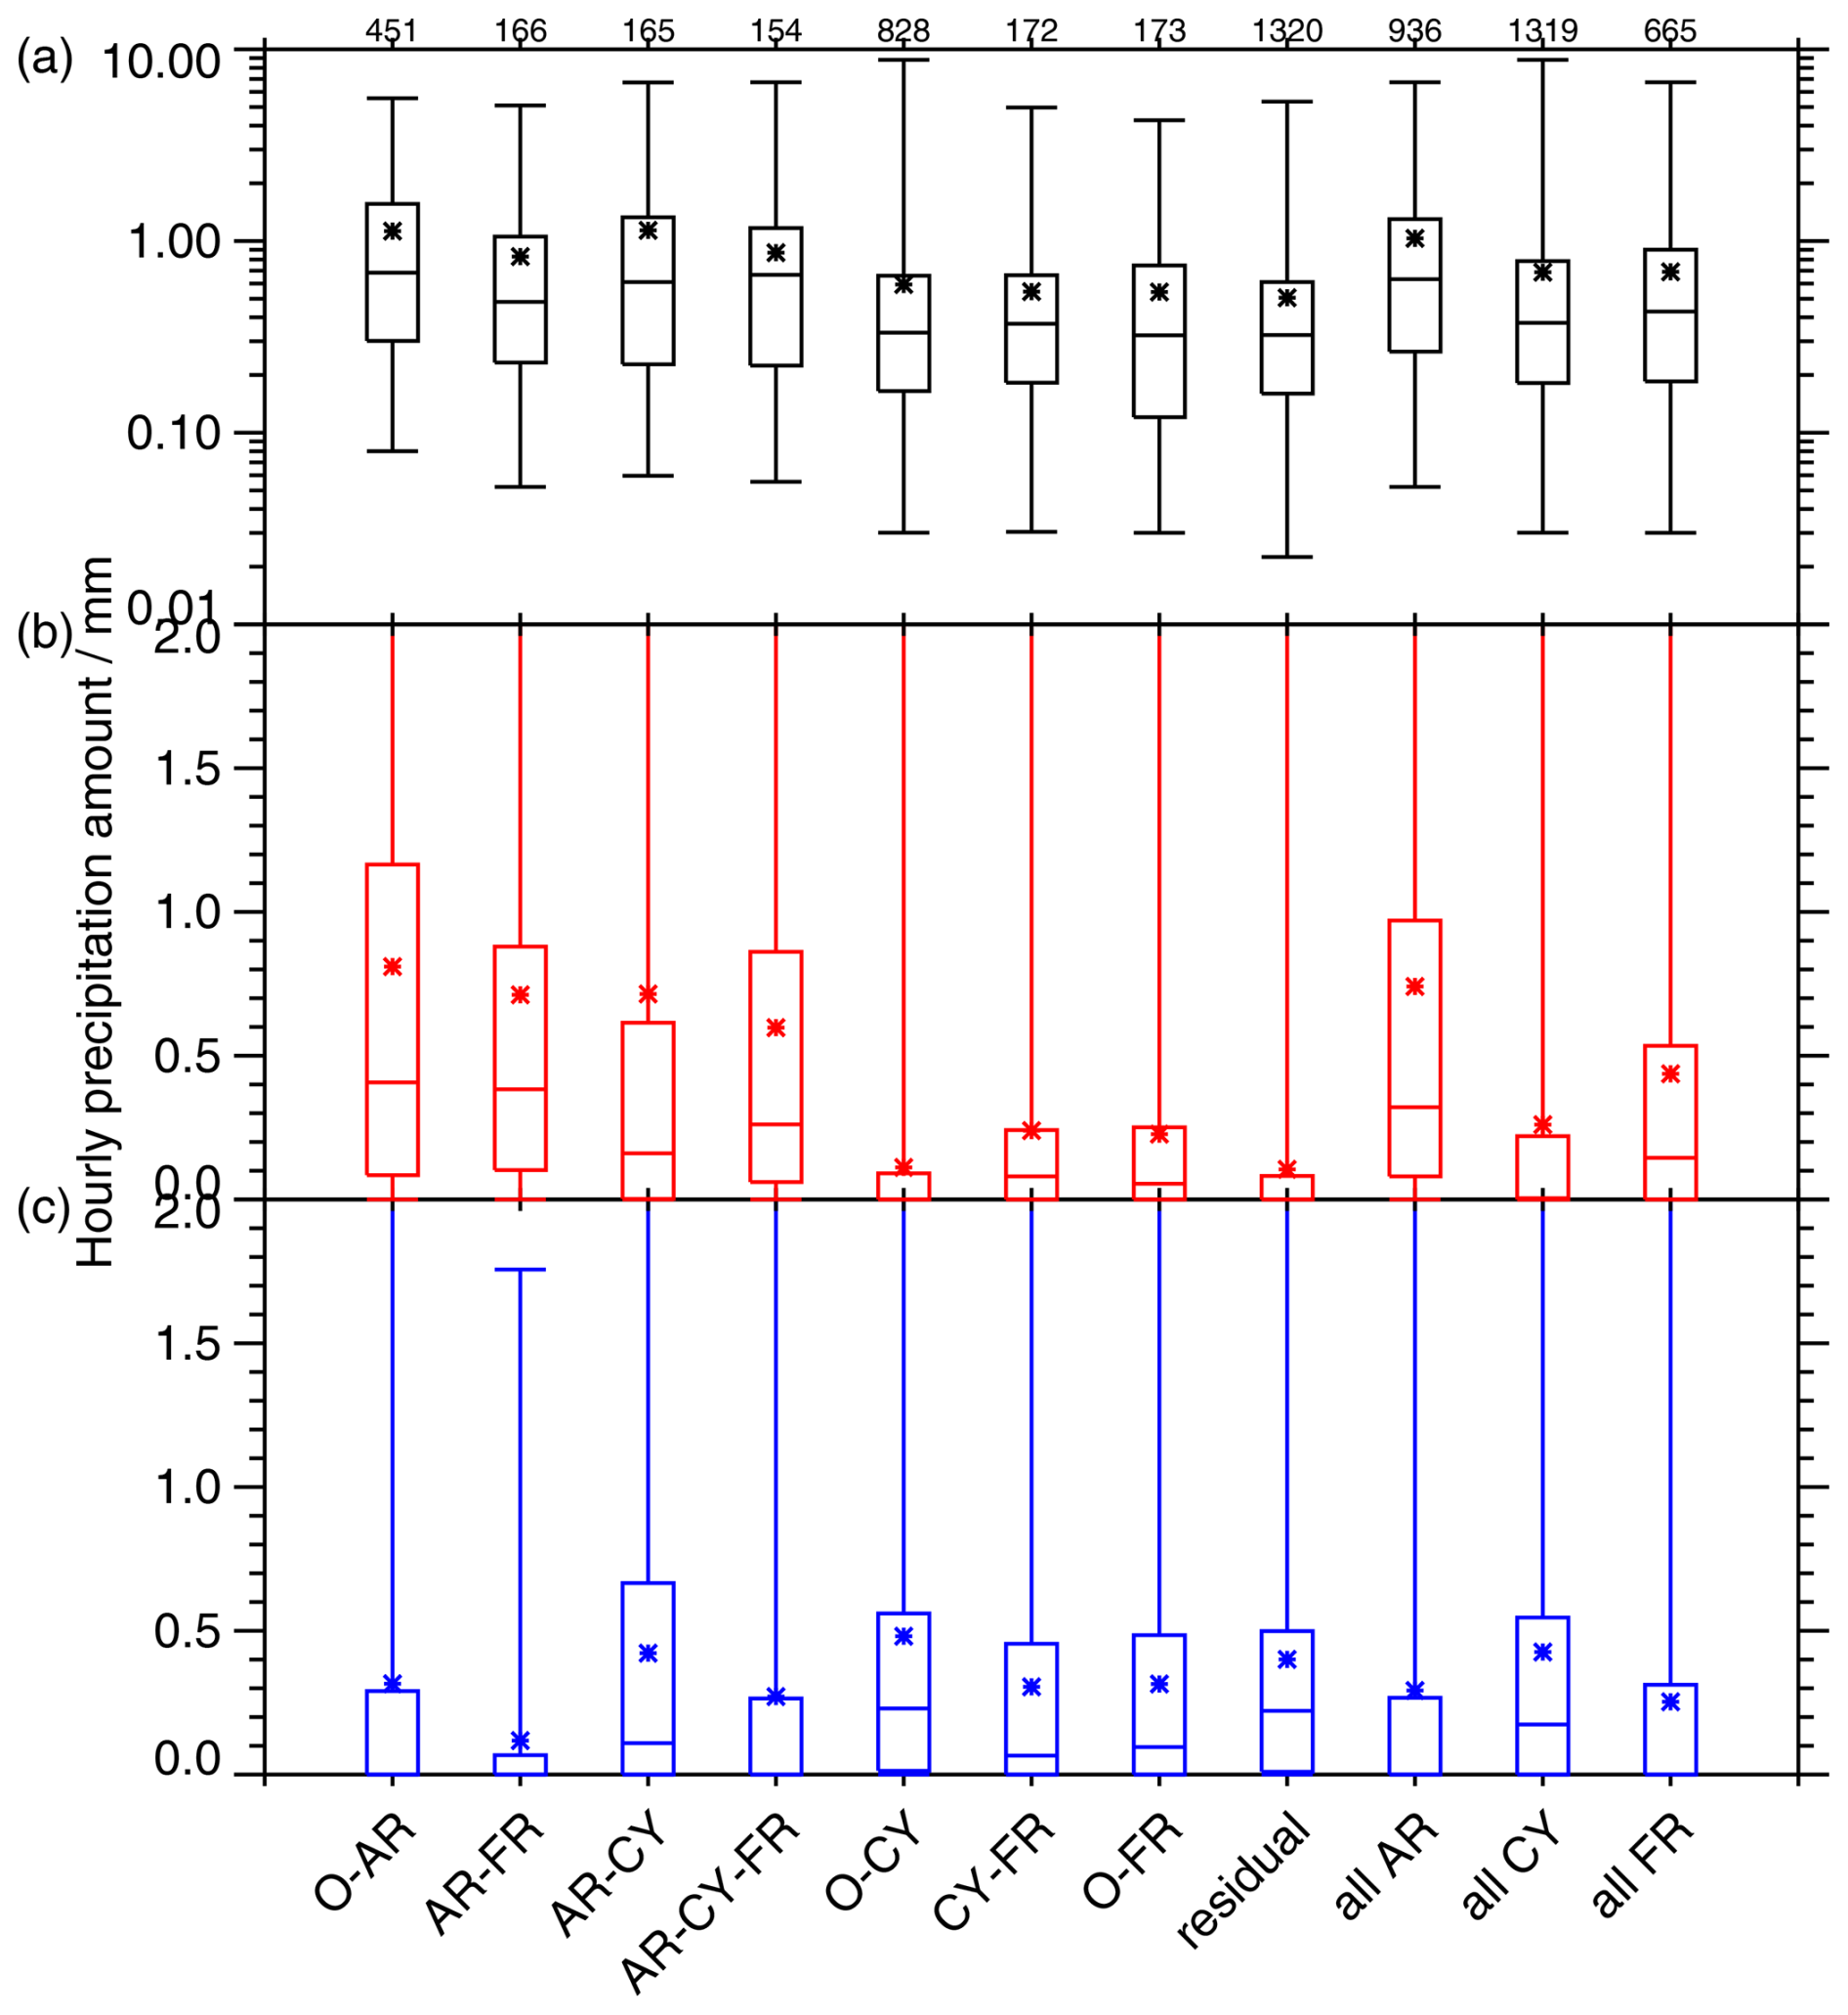
Figure 10Boxplots of hourly precipitation amounts of the different weather systems during 1 August 2017 to 31 December 2021. (a) Total (black), (b) liquid (red) and (c) solid (blue) precipitation. Atmospheric rivers (denoted AR), cyclones (denoted CY) and fronts (denoted FR) can occur separately (O-AR, O-CY, O-FR) or at the same time in different combinations. Label “all” includes all cases with a certain system regardless of whether the other two systems are present or not. Precipitation that can not be attributed to any of these systems is denoted as “residual”. Precipitation amount is taken from the corrected Pluvio data, and phase information is obtained from the combined Parsivel/temperature-based method. The whiskers indicate the maximum/minimum value, and the star indicates the mean value. The numbers on top show the sample size.
Differentiating between different weather systems (Fig. 10) reveals that the largest hourly precipitation amounts are associated with the occurrence of ARs with median hourly values between 0.5 and 0.7 mm. In 85 % of the hours with ARs, liquid precipitation occurs. Hourly liquid precipitation amounts are typically between 0.1–1.0 mm (25th and 75th percentiles). At the same time, hourly solid precipitation amounts during ARs are relatively small since solid precipitation occurs only in 42 % of all hours with ARs. Only for the AR-CY class are both liquid and solid precipitation common with median values of 0.2 and 0.1 mm, respectively. Apart from this, cyclones (all CY) are rather associated with solid precipitation (median hourly solid precipitation sum of 0.2 mm), while the opposite is found for fronts (median hourly liquid precipitation sum of 0.1 mm). However, a closer look reveals that liquid precipitation during fronts mainly occurs when they are co-located with ARs. As mentioned earlier, the residual precipitation is rather related to solid precipitation, which is also reflected in the hourly precipitation amounts with a median value of 0.2 for solid and 0 mm for liquid.
Moving to daily temporal scales (Fig. 9b), we find that 50 % (90 %) of the daily precipitation sums have values lower than 1.3 mm (10 mm) and contribute only about 5 % (47 %) to the total precipitation at Ny-Ålesund. Very small precipitation amounts or trace precipitation, i.e., small but immeasurable daily precipitation events, are still challenging for observations and models. Boisvert et al. (2018), who defined trace precipitation as days with less than 1 mm precipitation, showed large differences in the occurrence and annual amount of trace precipitation over the Arctic Ocean between eight reanalyses. However, trace precipitation can make up a substantial proportion of the total precipitation amount over the central Arctic Ocean (Boisvert et al., 2018; Barrett et al., 2020). The question of whether these small amounts of precipitation that numerical models frequently generate occur also in reality has not yet been completely answered. This is also due to missing accurate reference observations. At Ny-Ålesund, trace precipitation (i.e., non-zero daily precipitation amount <1 mm) is reported from the corrected Pluvio data for about 16 % of the time of the analyzed period. It accounts for 44 % of days with precipitation recorded. Trace precipitation is thus a common feature of the atmospheric state at Ny-Ålesund. The annual trace precipitation amounts for 2018–2021 are between 20 and 30 mm. Compared to the annual precipitation amount, these values are rather small. For example, for 2021, the annual trace precipitation amount is 5.5 % of the total precipitation amount at Ny-Ålesund. Days with trace precipitation can be mainly related to the residual class (43 %) followed by cyclone-related events, in particular with the O-CY class (18 %). Focusing more on processes at the local scale, trace precipitation could also be associated with the frequent occurrence of low-level mixed-phase clouds in conjunction with katabatic winds (Gierens et al., 2020), with the dry katabatic flow leading to the sublimation of a large portion of the precipitating mass.
Table 6Upper 2 % of the days between 1 August 2017 and 31 December 2021 with the highest precipitation amount ranked in descending order. In addition to the daily precipitation amount from the corrected Pluvio data, the liquid fractions based on the combined Parsivel/temperature-based method and the weather systems detected at least once during the event are reported, i.e., atmospheric river (AR), cyclone (CY) and front (FR).
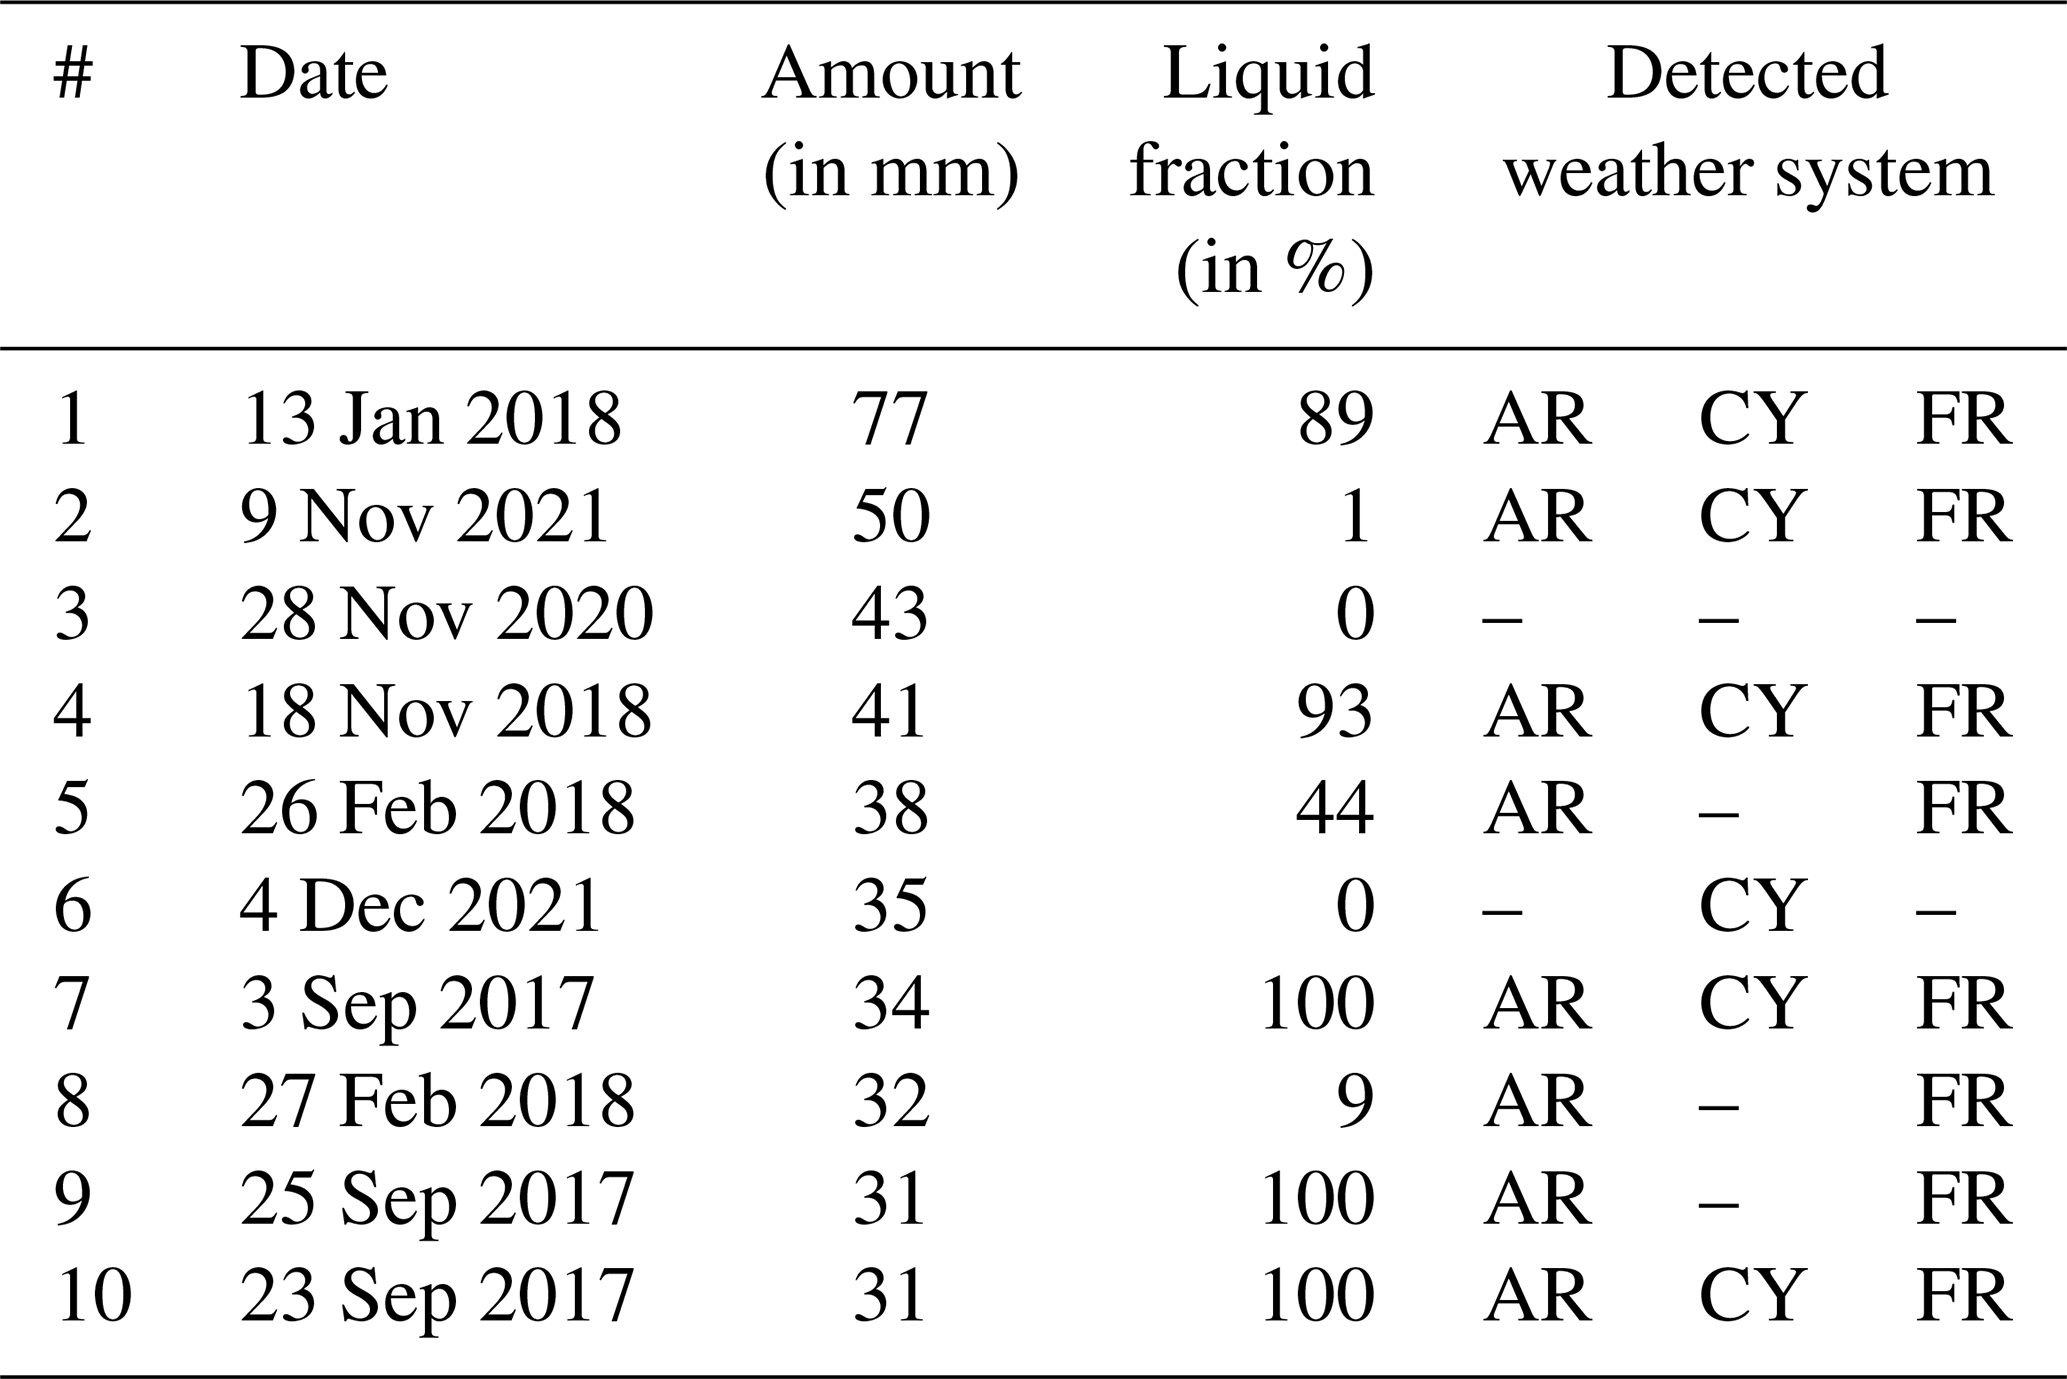
When focusing on the right tail of the distribution of the daily precipitation amounts, in particular on the 2 % of the days with the highest precipitation amounts (Table 6), we find from inspection of ERA5 reanalysis data (not shown) that all of these events are related to enhanced water vapor transport from the North Atlantic or Eurasia, often in the form of ARs and in combination with fronts (Table 6). In these situations, the liquid fraction is also often high. Exemplarily, the ERA5-integrated water vapor and the detected AR for the day with the highest precipitation sum, 13 January 2018, is shown in Fig. 3. Visual inspection of the ERA5 output for the other days with extreme precipitation revealed that the prevailing general circulation patterns are a high-surface-pressure system over Scandinavia/the Barents Sea and/or a low-surface-pressure system located over the North Atlantic near Iceland (not shown). In the case of a (blocking) high-pressure system over Scandinavia, enhanced water vapor transport into the Arctic is realized along its western flank. In the majority of the extreme precipitation cases, cyclones also developed in the Fram Strait or off the coast of northeastern Greenland, which also drive the water vapor transport from the North Atlantic to Ny-Ålesund: water vapor is then advected along the eastern flank, resulting in enhanced precipitation at the site. Additional precipitation might also occur when polar air that is advected on the backside of these cyclones hits the warm and humid North Atlantic air. These findings are generally consistent with the composite analysis of extreme precipitation events at Svalbard by Serreze et al. (2015), who showed that pressure patterns in these cases typically favor a southerly flow and positive anomalies in integrated water vapor (see also Sect. 1).
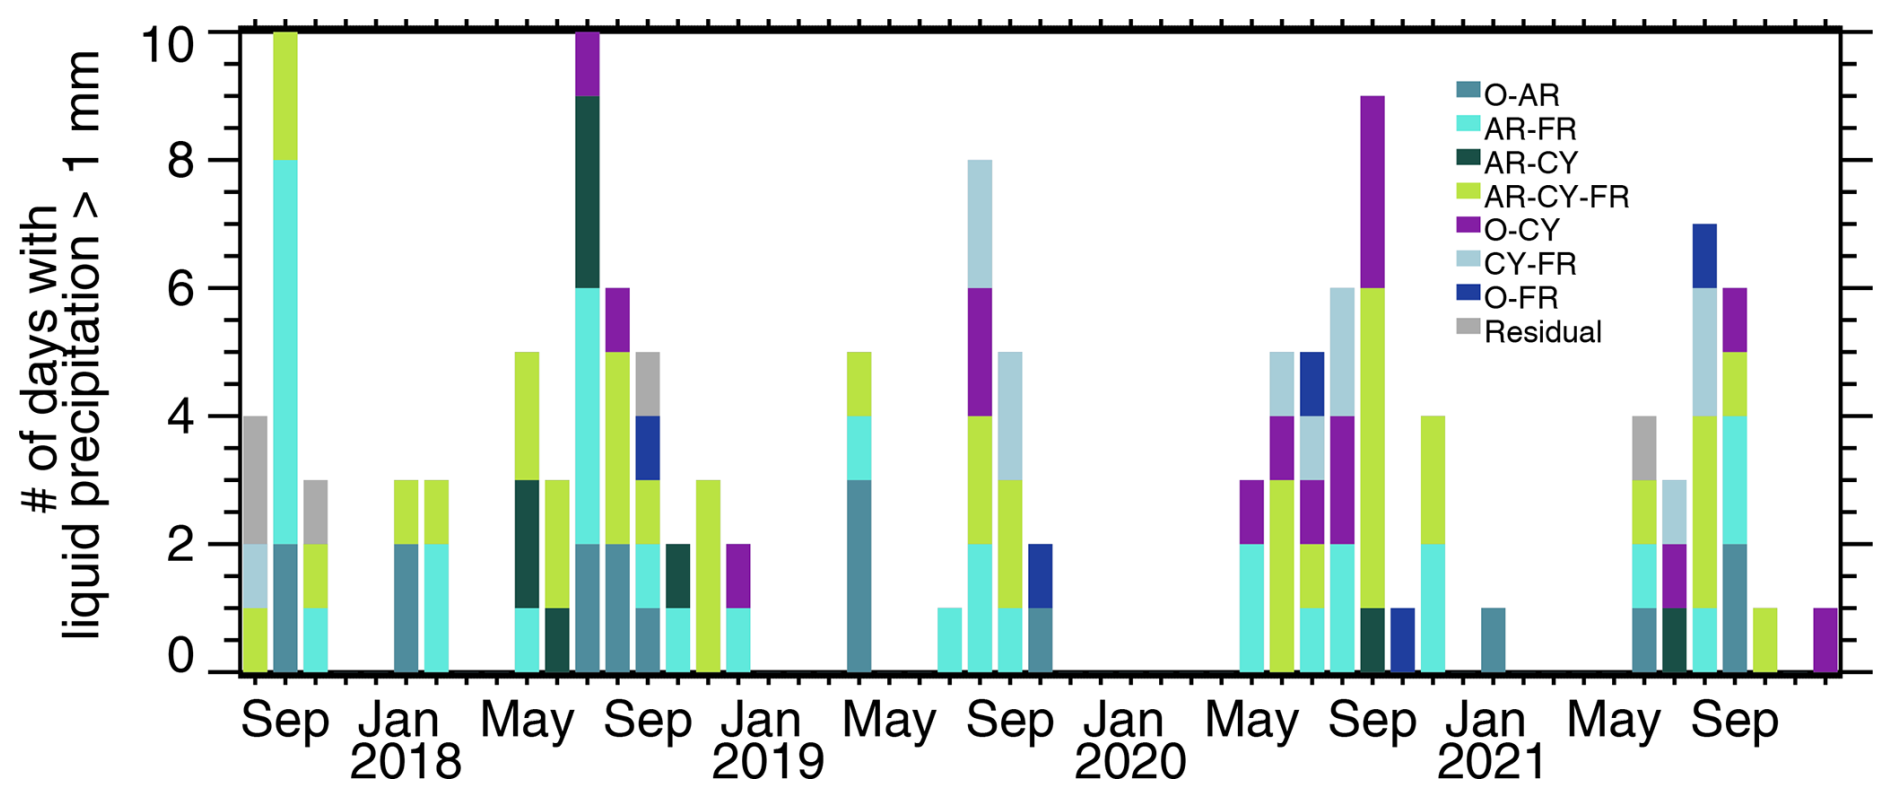
Figure 11Number of days with liquid precipitation >1 mm as detected from the corrected Pluvio data and relation to atmospheric rivers (AR), cyclones (CY) and fronts (FR). Weather systems can occur separately (O-AR, O-CY, O-FR) or at the same time in different combinations.
Another type of “extreme” precipitation event is liquid precipitation during the cold season. As mentioned before, rain-on-snow events are of particular interest since they can have severe implications for wildlife and Arctic communities. We investigated the number of days with liquid precipitation >1 mm in each month and connected it to the occurrence of the different weather systems (Fig. 11). As expected, most of these days can be found from May to September when temperatures are predominantly above 0 °C (Fig. A2). However, except for the relatively cold 2019/2020 winter (Fig. A2), liquid precipitation days also occur from November to April. Almost all liquid precipitation days are connected to at least one of the weather systems and all liquid precipitation days from November to April (22 in total). 91 % of these days are connected to ARs with a median liquid precipitation amount of 5 mm. 64 % and 45 % of these days are related to fronts and cyclones, respectively.
Surface observations of precipitation are very scarce in the Arctic. This makes the few locations where continuous precipitation measurements are available even more important. In mid-2017, a Parsivel and a Pluvio were added to the instrument suite at AWIPEV, Ny-Ålesund, providing temporally highly resolved (1 min) information on precipitation amount and type. Their measurements thus complement the existing precipitation observations at Ny-Ålesund, e.g., the long-term precipitation records by MET Norway with the 12-hourly manual precipitation gauge and hourly Geonor observations. In particular, with the new automatic measurements on precipitation phase, another important variable linked to precipitation is now available. This study has addressed the potential of these new observations for discrimination of the precipitation phase and the corresponding mass separation. By combining the precipitation observations of more than 4 years (1 August 2017–31 December 2021) with ERA5 reanalysis data, we also assessed the impact of synoptic-scale weather systems, namely, ARs, cyclones and fronts, on precipitation characteristics at Ny-Ålesund.
Based on the Parsivel precipitation type classification, we found that almost all precipitation is solid below 0.4 °C and liquid above 3.6 °C. In-between, liquid precipitation occurrence increases with increasing temperature with a 50 % occurrence at 1.8 °C. The temperature dependence of liquid/solid mass separation is similar to the temperature dependence of liquid/solid precipitation occurrence. This mass separation–temperature relation does not change when moving from minute to hourly accumulated/averaged data and can also be used if Parsivel data are not available. To discriminate liquid and solid precipitation amounts for the whole period considered, we used the Parsivel precipitation type information in combination with the derived temperature-based mass separation (when no Parsivel information was available). Differences in liquid (and correspondingly solid) precipitation sums of corrected Pluvio data can be quite large compared to a simple temperature threshold method of 1 °C. The latter leads to increased annual liquid precipitation sums of 6 to 15 percentage points, highlighting the importance of more precise phase discrimination.
Since no reference precipitation phase measurements are available at high temporal resolution, the Parsivel classification could only be checked for consistency with 2 m temperature data. Some inconsistencies could be identified with an increased liquid precipitation frequency at −2 °C and an increased solid precipitation frequency at around 5 °C. While the latter is related to cases with higher wind speeds affecting the assumption of the fall speed of the particles, the liquid occurrence at low temperatures could not be explained completely. With the measurements of the video in situ snowfall sensor, which was installed in September 2021, these cases can be analyzed in more detail in the future. This might allow for a more detailed evaluation of precipitation type from Parsivel or even help to establish an improved (and open-source) retrieval method for precipitation type, which could also directly incorporate temperature information as a further constraint. In February 2025, a Thies disdrometer was operated by the University of Leipzig close to the balloon hall about 30 m away from the Parsivel. A comparison of the detected precipitation and precipitation phase will shed further light on the accuracy of the disdrometer-derived precipitation phase classification. The observed precipitation phase–temperature dependency can subsequently also be used to assess the phase partitioning in numerical models.
The occurrence of ARs, cyclones and fronts has a distinct impact on the precipitation characteristics at Ny-Ålesund. Although ARs occurred only 8 % of the time at Ny-Ålesund, they contributed about 42 % to the total precipitation amount of the corrected Pluvio measurements in the time period 1 August 2017 to 31 December 2021 when considering all cases, i.e., with or without co-located cyclones and fronts. Even for the low values for the presence of ARs only (O-AR; 4 % of the time), their contribution to total precipitation is 20 %. Similar precipitation fractions can be found for cyclone (CY)-related classes with 21 % for O-CY and 39 % for all cyclones. However, cyclones are in general more frequent than ARs (20 %). Except for a few months in summer, precipitation associated with fronts seems to play a minor role at Ny-Ålesund. In general, a higher liquid mass fraction is found for precipitation during ARs and fronts (72 % and 63 %, respectively) than for cyclones (38 %). Residual precipitation, i.e., precipitation that is not associated with any of the weather systems, is mainly solid (79 %). Consistently, hourly precipitation rates are generally larger for precipitation during AR-related weather types with the highest hourly liquid precipitation sums. Both large liquid and solid hourly precipitation sums can only be found when ARs and cyclones occur at the same time. If cyclones and fronts occur separately, solid hourly precipitation rates dominate. For fronts, hourly liquid precipitation sums are notably larger if ARs are present as well.
Daily precipitation amounts at Ny-Ålesund are typically very low with 50 % of the daily sums being smaller than 1.3 mm. While trace precipitation with daily precipitation amounts <1 mm can make up a substantial proportion of the total precipitation amount in the central Arctic, it plays a minor role in the total precipitation at Ny-Ålesund, where it is mainly related to the residual and O-CY classes. 50 % of the total precipitation in the analysis period is attributed to daily precipitation amounts of >10 mm. The days with the highest 2 % of daily precipitation sums (10 d in total) contribute 18 % of the total precipitation. All of these extreme precipitation events are related to enhanced water vapor transport from the North Atlantic or Eurasia, often in the form of ARs and in combination with fronts. In these situations, the liquid fraction is also often high. Almost all days with liquid precipitation >1 mm are associated with at least one of the three weather systems. In the months of November to April, 91 % of these days are connected to ARs.
Still, a few points should be noted regarding the presented analysis. The absolute values of the precipitation amount are still uncertain. As seen from the comparison with the uncorrected MET Norway data, the corrected Pluvio measurements (using the algorithm by Wolff et al., 2015) are likely still underestimated. The comparison with the MET Norway gauge has shown that quantitative precipitation estimates from precipitation gauges remain uncertain due to differences in how wind affects the measurements, uncertainties in the input data for the correction, the effect of different temporal resolutions of the data sets and averaging times, and the assumed correction function itself. Aside from the absence of reference measurements, it is difficult to determine which precipitation estimate best represents the true precipitation. To better account for the uncertainties of the Pluvio data record, different correction functions (following Champagne et al., 2024) will be applied in the future, and the impact of averaging times will be assessed further. An extended comparison with the processed Geonor precipitation data will provide further insight into the measurement uncertainties. Since the hourly resolved Geonor data have been available since 1997, the study could be expanded to a longer time series to also look into potential changes in precipitation characteristics and their relation to the weather systems. The precipitation measurements from the Bayelva site about 3 km southwest of Ny-Ålesund (Boike et al., 2018) could also be incorporated to better understand the local precipitation variability at this complex location. This is also relevant when setting the measurements in context with simulation results of numerical models. As these models often produce a lot of small, potentially artificial, precipitation amounts, it would be interesting to look more into the trace precipitation events. While these events are probably the most challenging ones for precipitation gauge observations, in particular for classical manual gauges, the higher sensitivity of the Parsivel might be beneficial. Also, additional observations from the cloud and micro rain radar will be helpful in identifying blowing-snow events that might be falsely interpreted as precipitation.
To connect precipitation at Ny-Ålesund to ARs, cyclones and fronts, we applied a very straightforward approach following Lauer et al. (2023). One criterion was that the weather systems have to be detected over the Ny-Ålesund model grid box. This excludes cases when Ny-Ålesund is already under the influence of a certain weather system that is not directly located above the site. Also, the occurrence and shape of a weather system depend very much on the applied definition and thresholds used (Lauer et al., 2023). We have seen that enhanced water vapor, as highlighted already in other studies, is important for the precipitation at Ny-Ålesund. Instead of using very strict geometric criteria as applied for the detection of ARs, percentiles of water vapor amount or transport might be a more suitable variable to look at. At Ny-Ålesund, the long-term, temporally highly resolved (2–3 s) microwave radiometer observations of water vapor can be exploited here (Nomokonova et al., 2019). Also, combining the temporally highly resolved precipitation measurements with the additional remote sensing observations at AWIPEV will further shed light on the precipitation processes, e.g., precipitation formation, sublimation and evaporation. Here, the combination with the cloud radar and micro rain radar will be exploited further in the future so that precipitation characteristics can be described in more detail and also be linked to cloud microphysics (e.g., with dual-frequency and polarimetry approaches; Chellini et al., 2023).
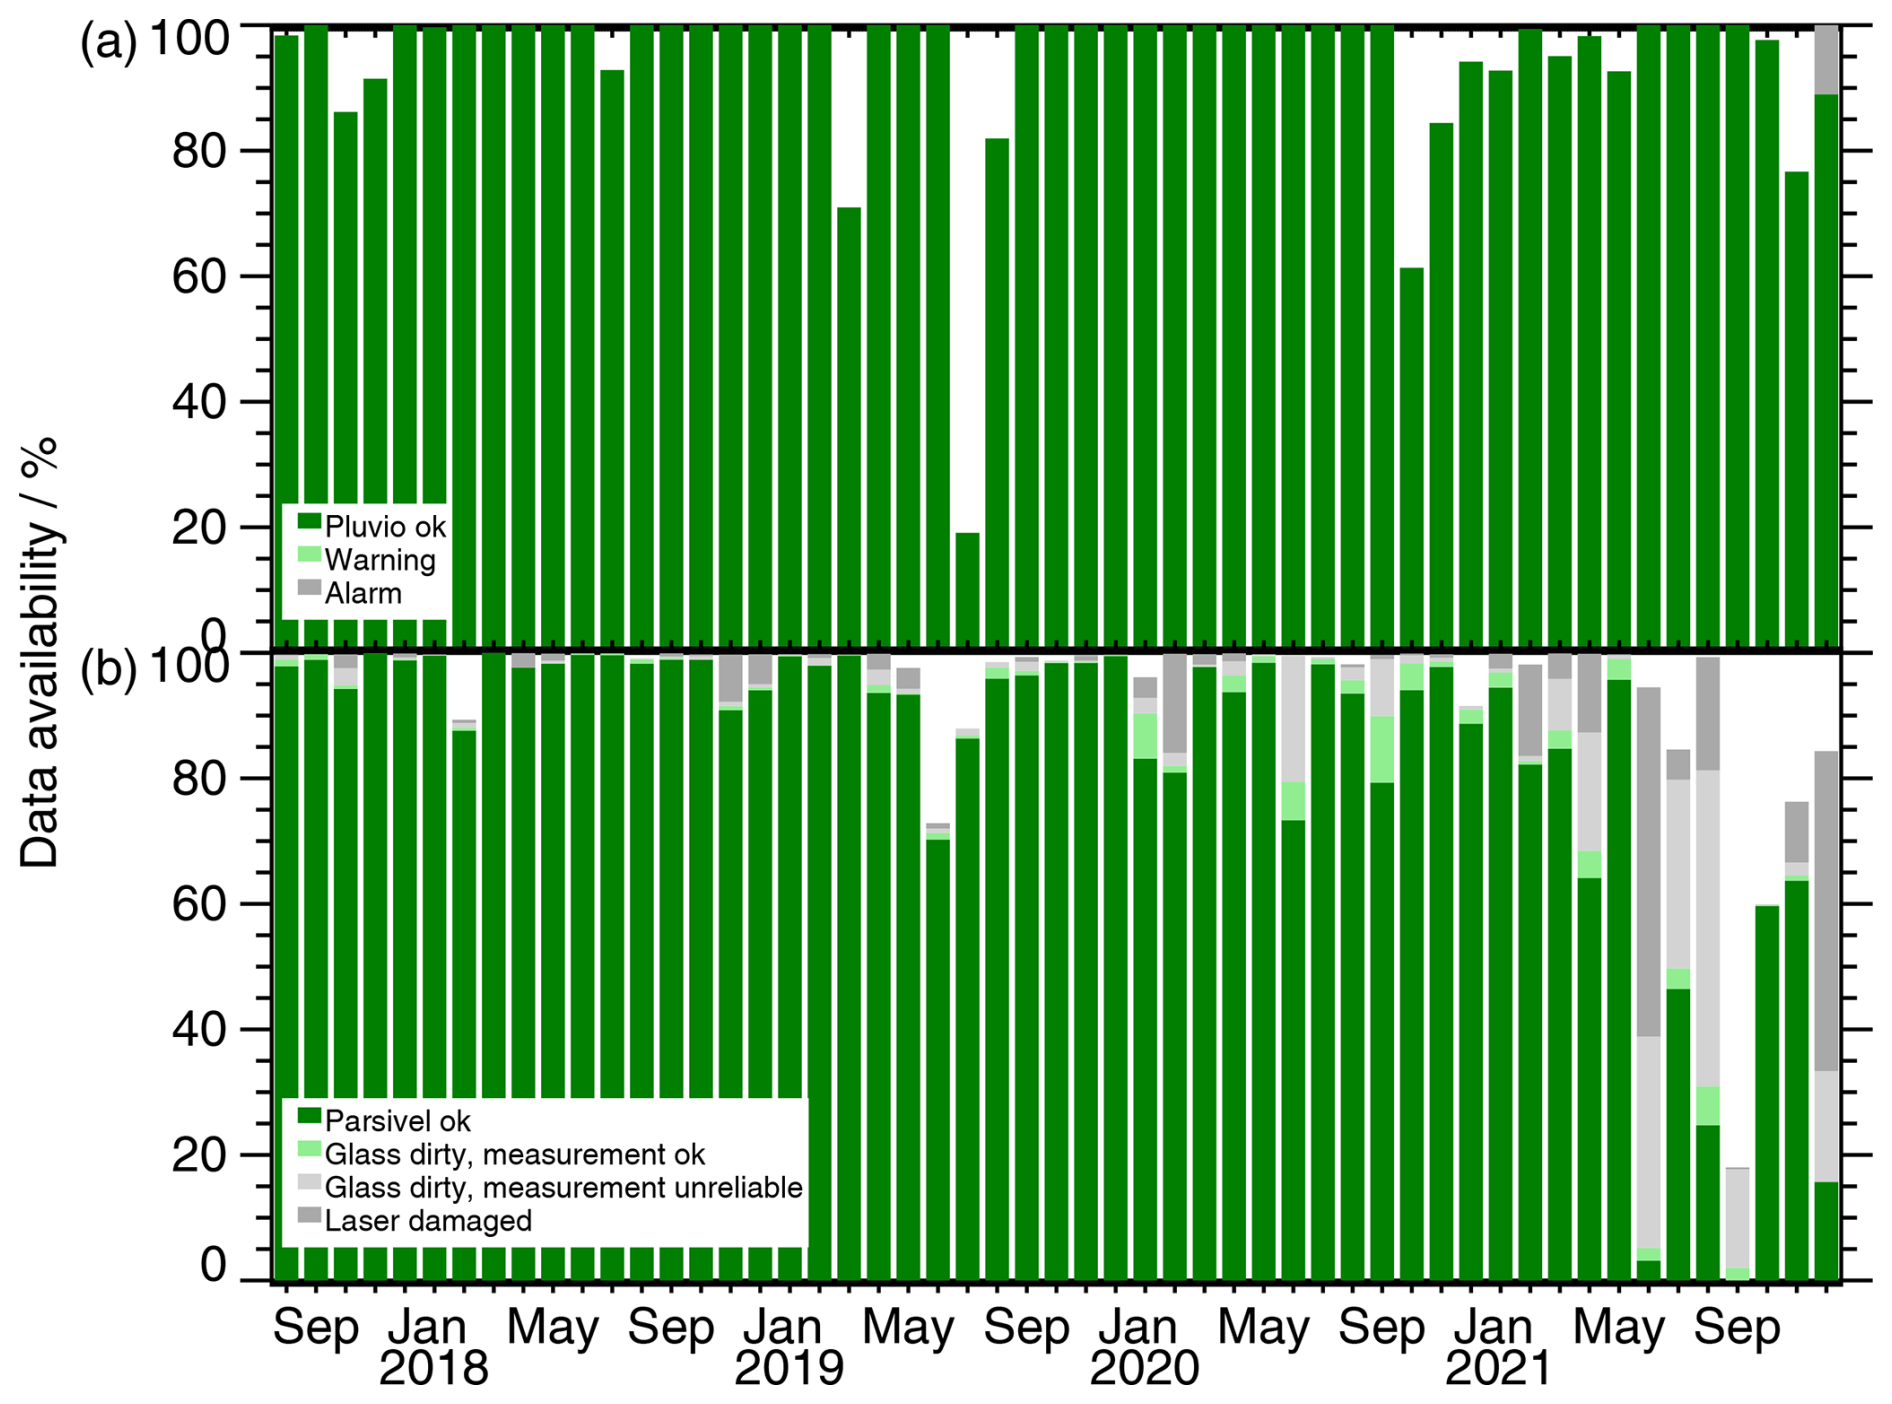
Figure A1Data availability and status of (a) Pluvio and (b) Parsivel from May 2017 to December 2021. Green (gray) colors indicate data that should (not) be used. See the legend for more details.
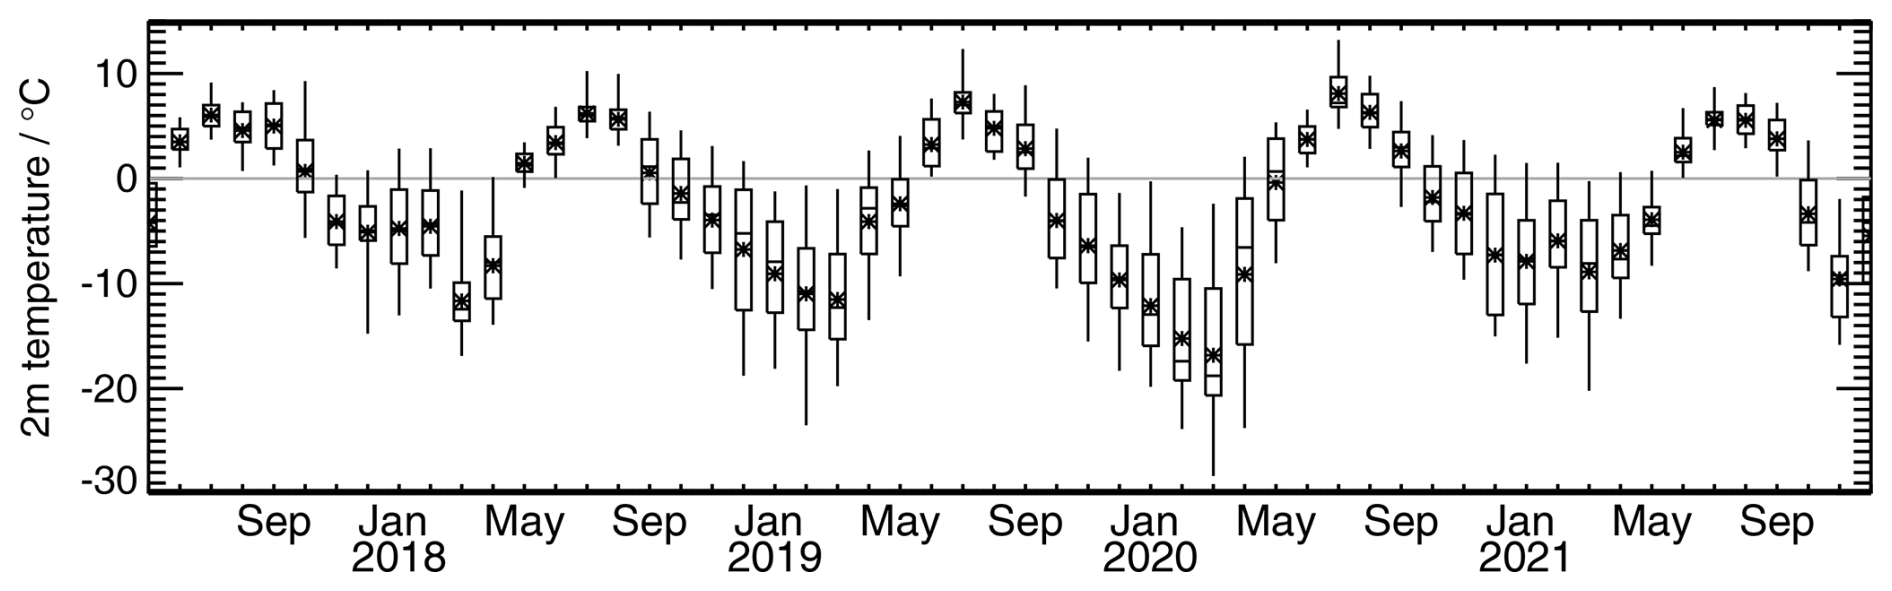
Figure A2Monthly boxplots of daily mean 2 m temperature at Ny-Ålesund. The extent of the whiskers indicates the minimum/maximum value. A star indicates the mean value.
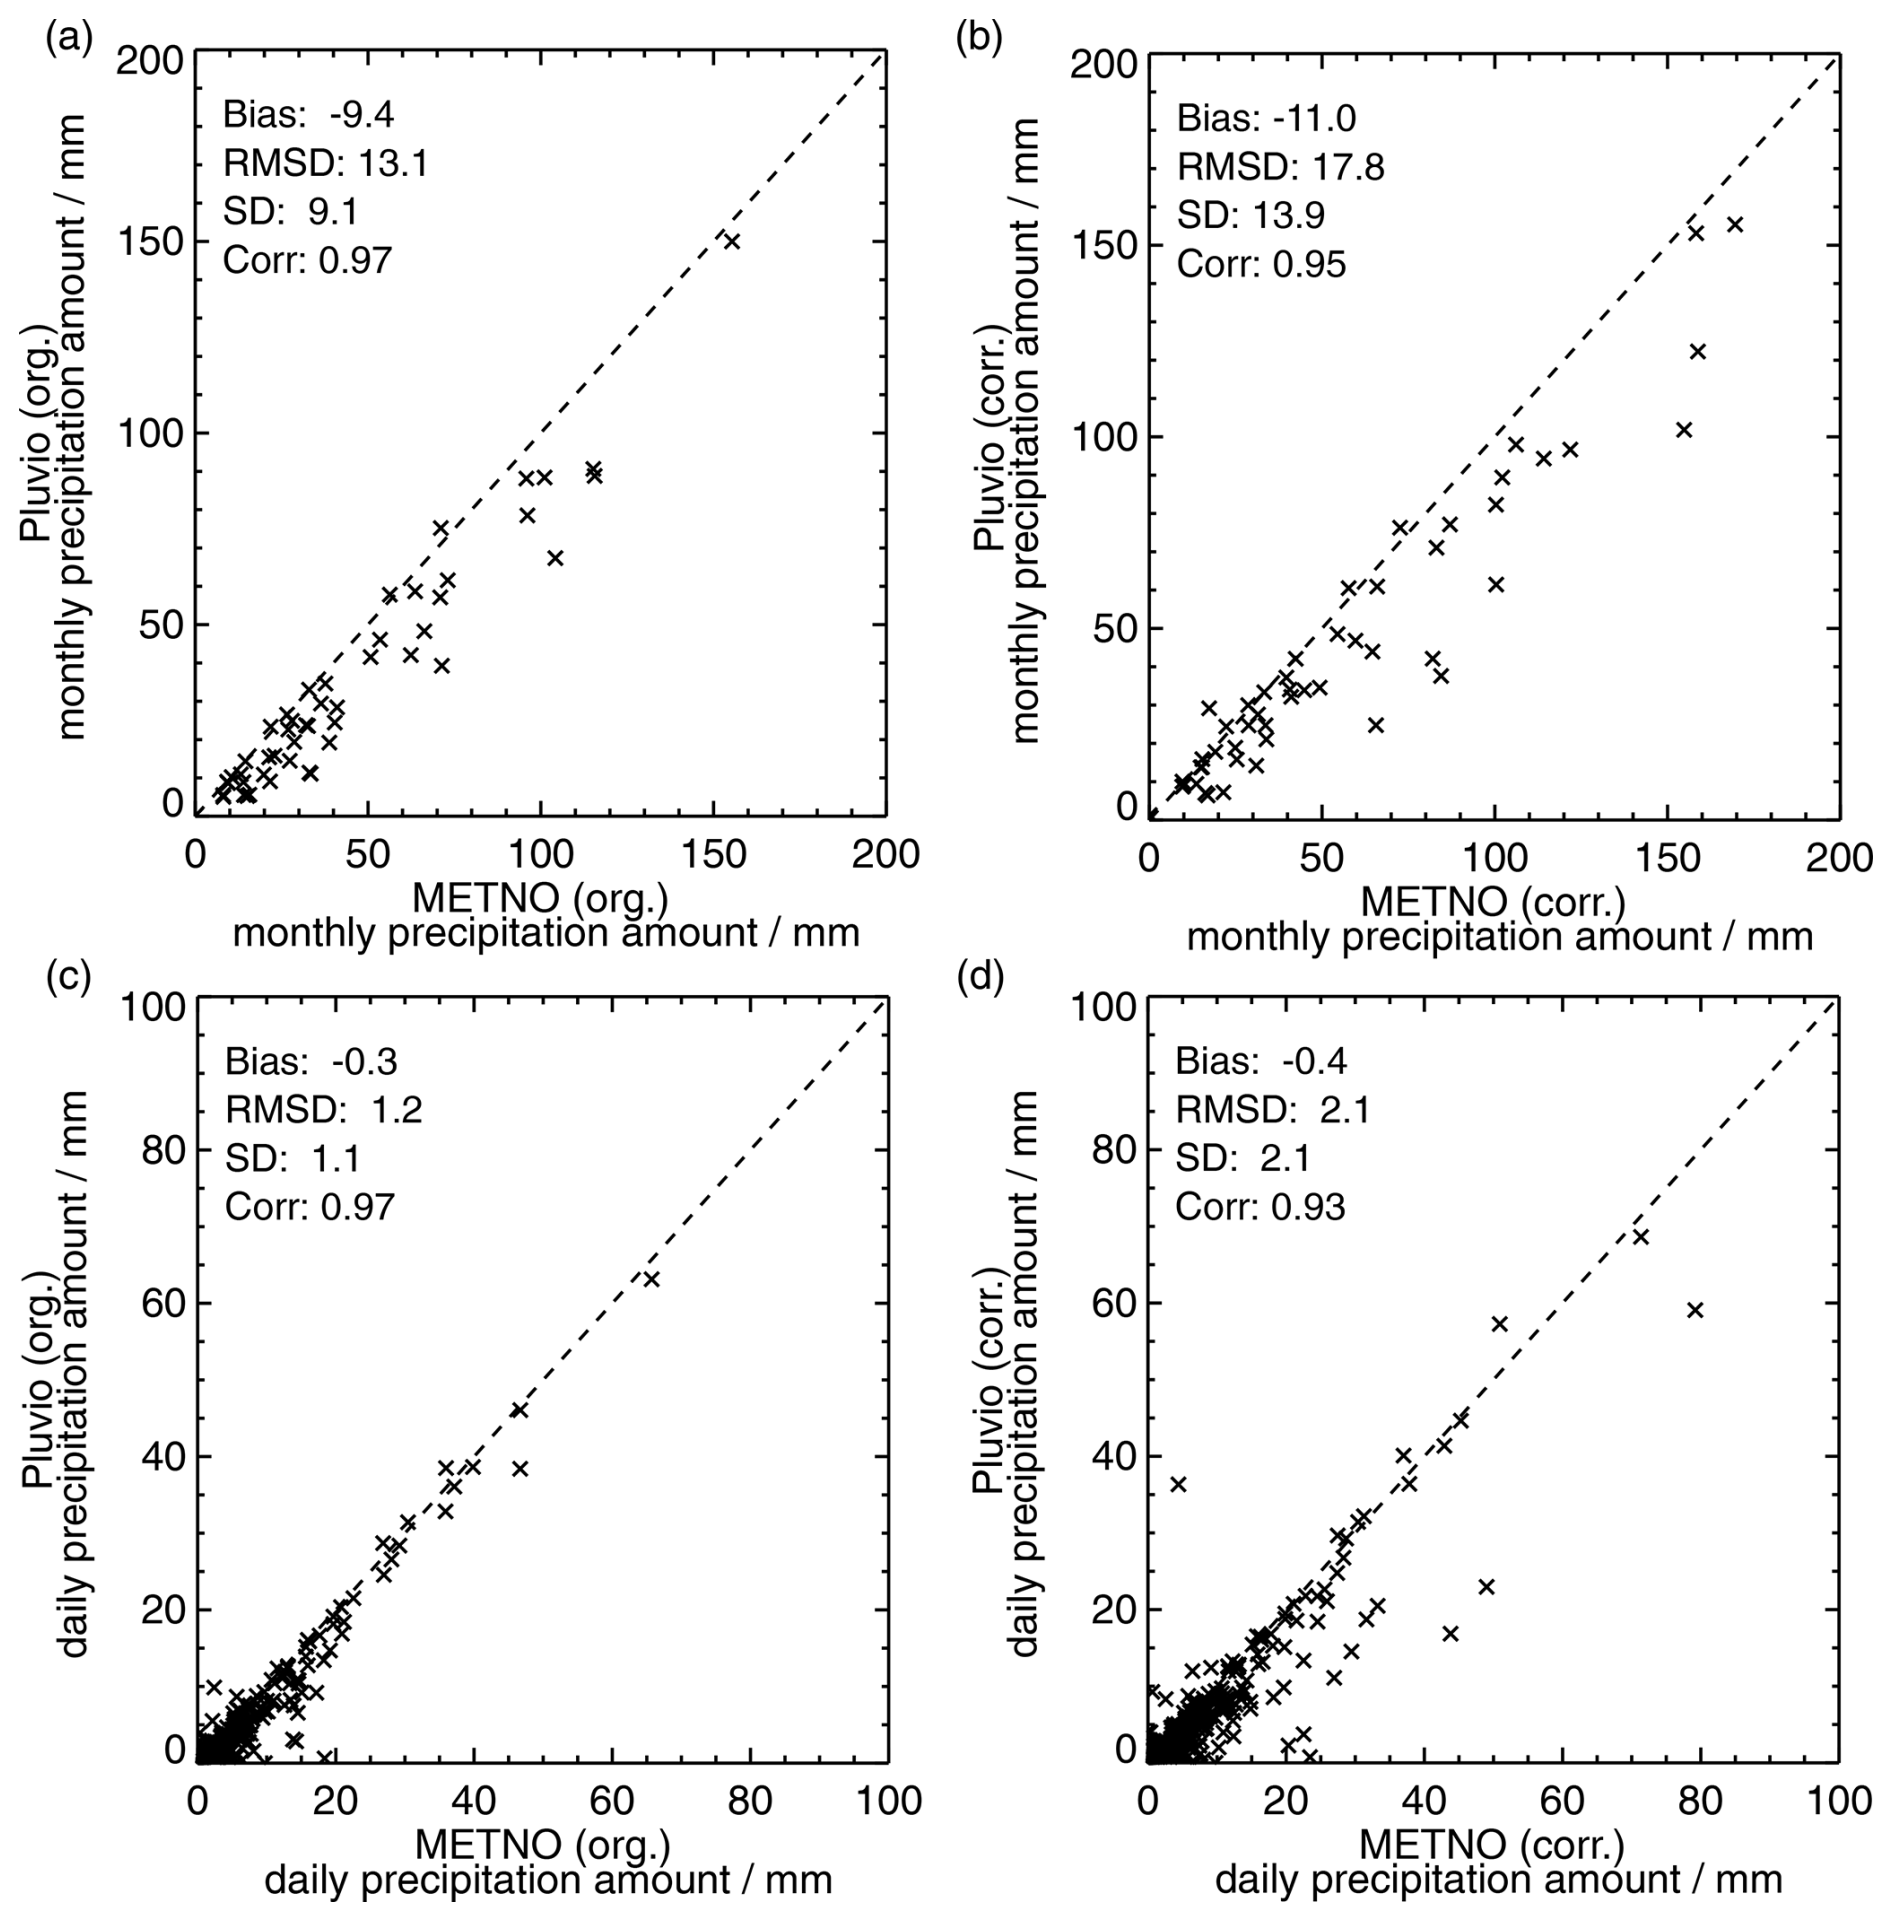
Figure A3Scatter plots of monthly and daily precipitation sums at Ny-Ålesund for 1 August 2017–31 December 2021. (a) Monthly uncorrected precipitation amount of MET Norway precipitation gauge vs. Pluvio. (b) Corrected monthly precipitation amount of MET Norway precipitation gauge (ensemble mean correction by Champagne et al., 2024) vs. Pluvio (with correction from Wolff et al., 2015). (c) Same as (a) but for daily data. (d) Same as (b) but for daily data. The bias, root-mean-squared difference, standard deviation and correlation are shown as well.
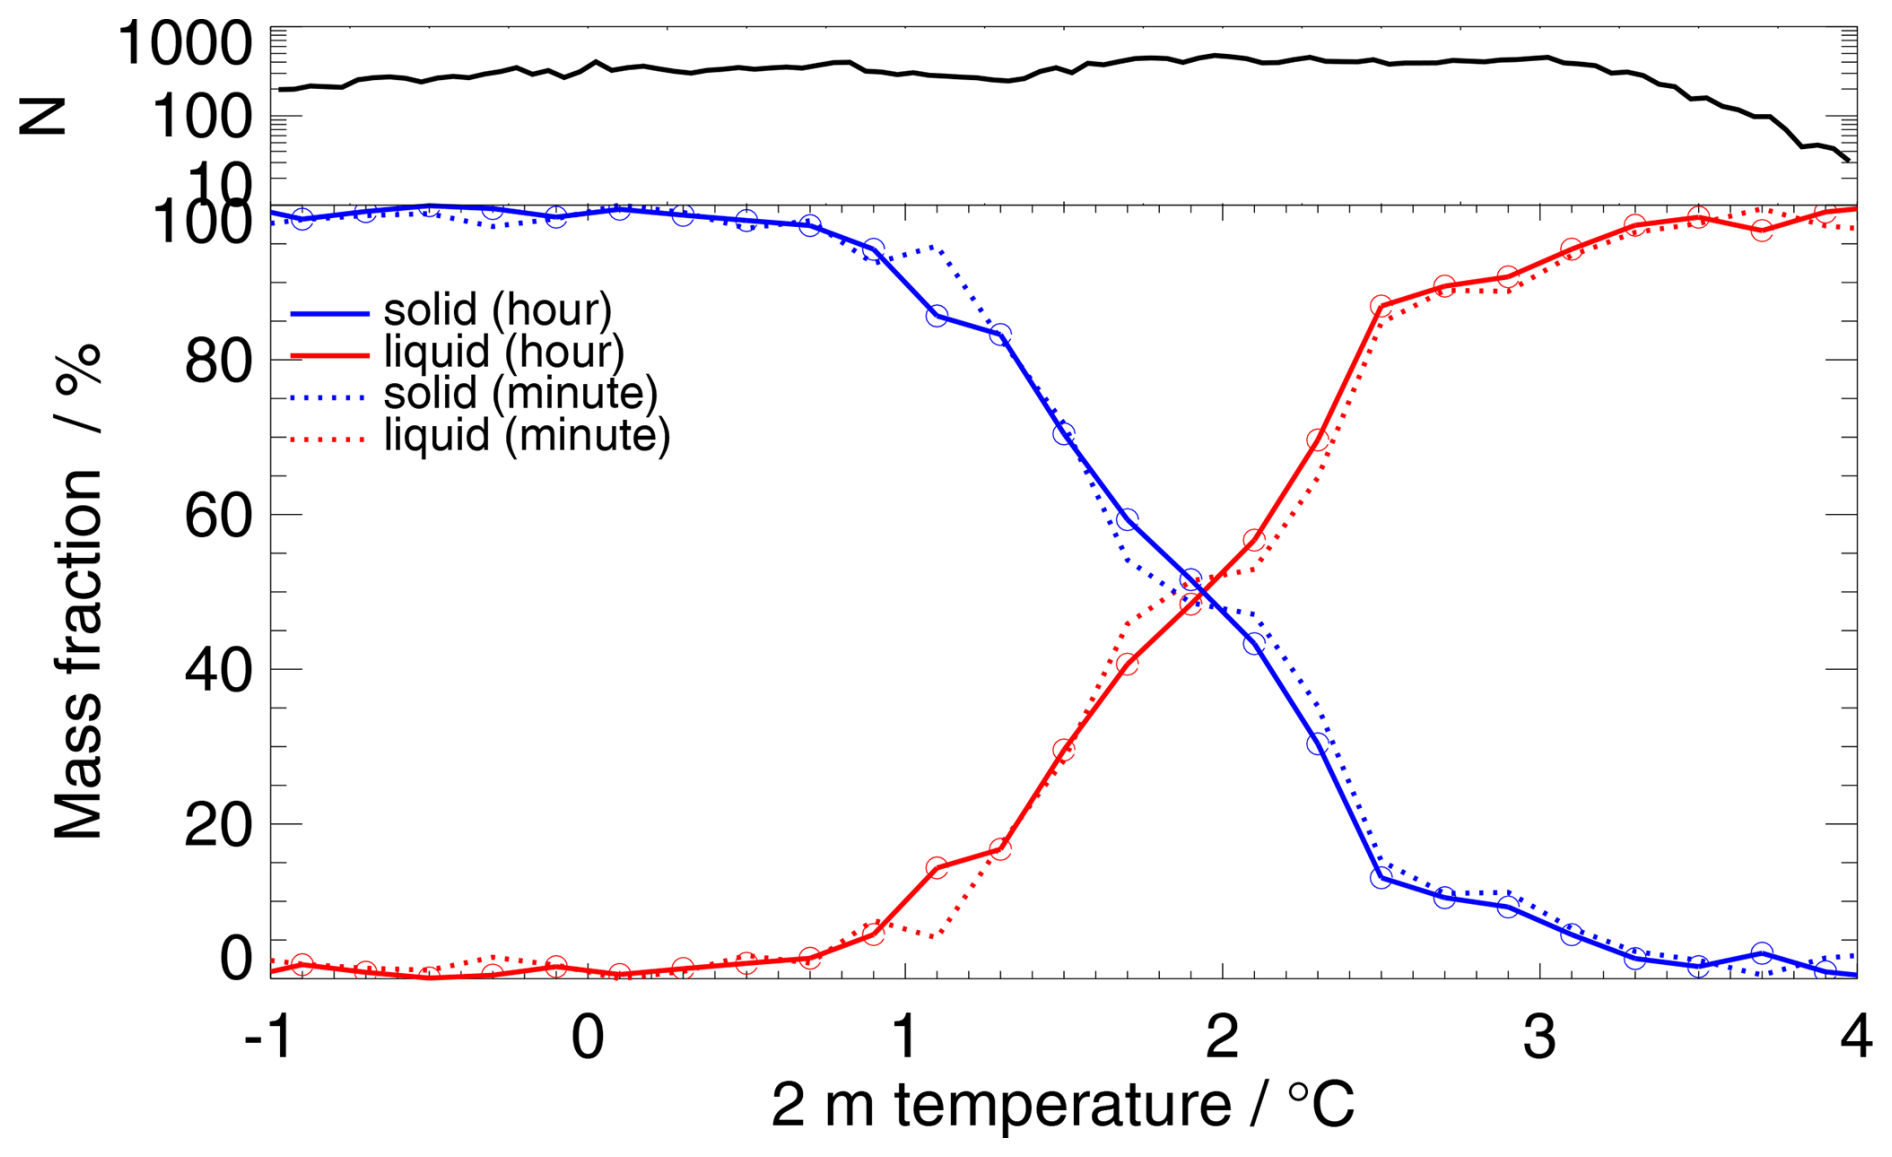
Figure A4Solid (blue) and liquid (red) mass fractions (in %) as a function of 2 m temperature (in °C) based on the 1 min resolved data (dotted lines, same as in Fig. 5b) and the hourly averaged 2 m temperature and hourly accumulated liquid and solid precipitation values (solid lines), respectively. The hourly precipitation values are derived from the 1 min resolved corrected Pluvio measurements together with the combined Parsivel/temperature-based mass separation method. See the main text for more details. Temperature bin size is 0.2 °C: [0.2,0.4), [0.4,0.6), etc., with N being the number of cases within a temperature class.
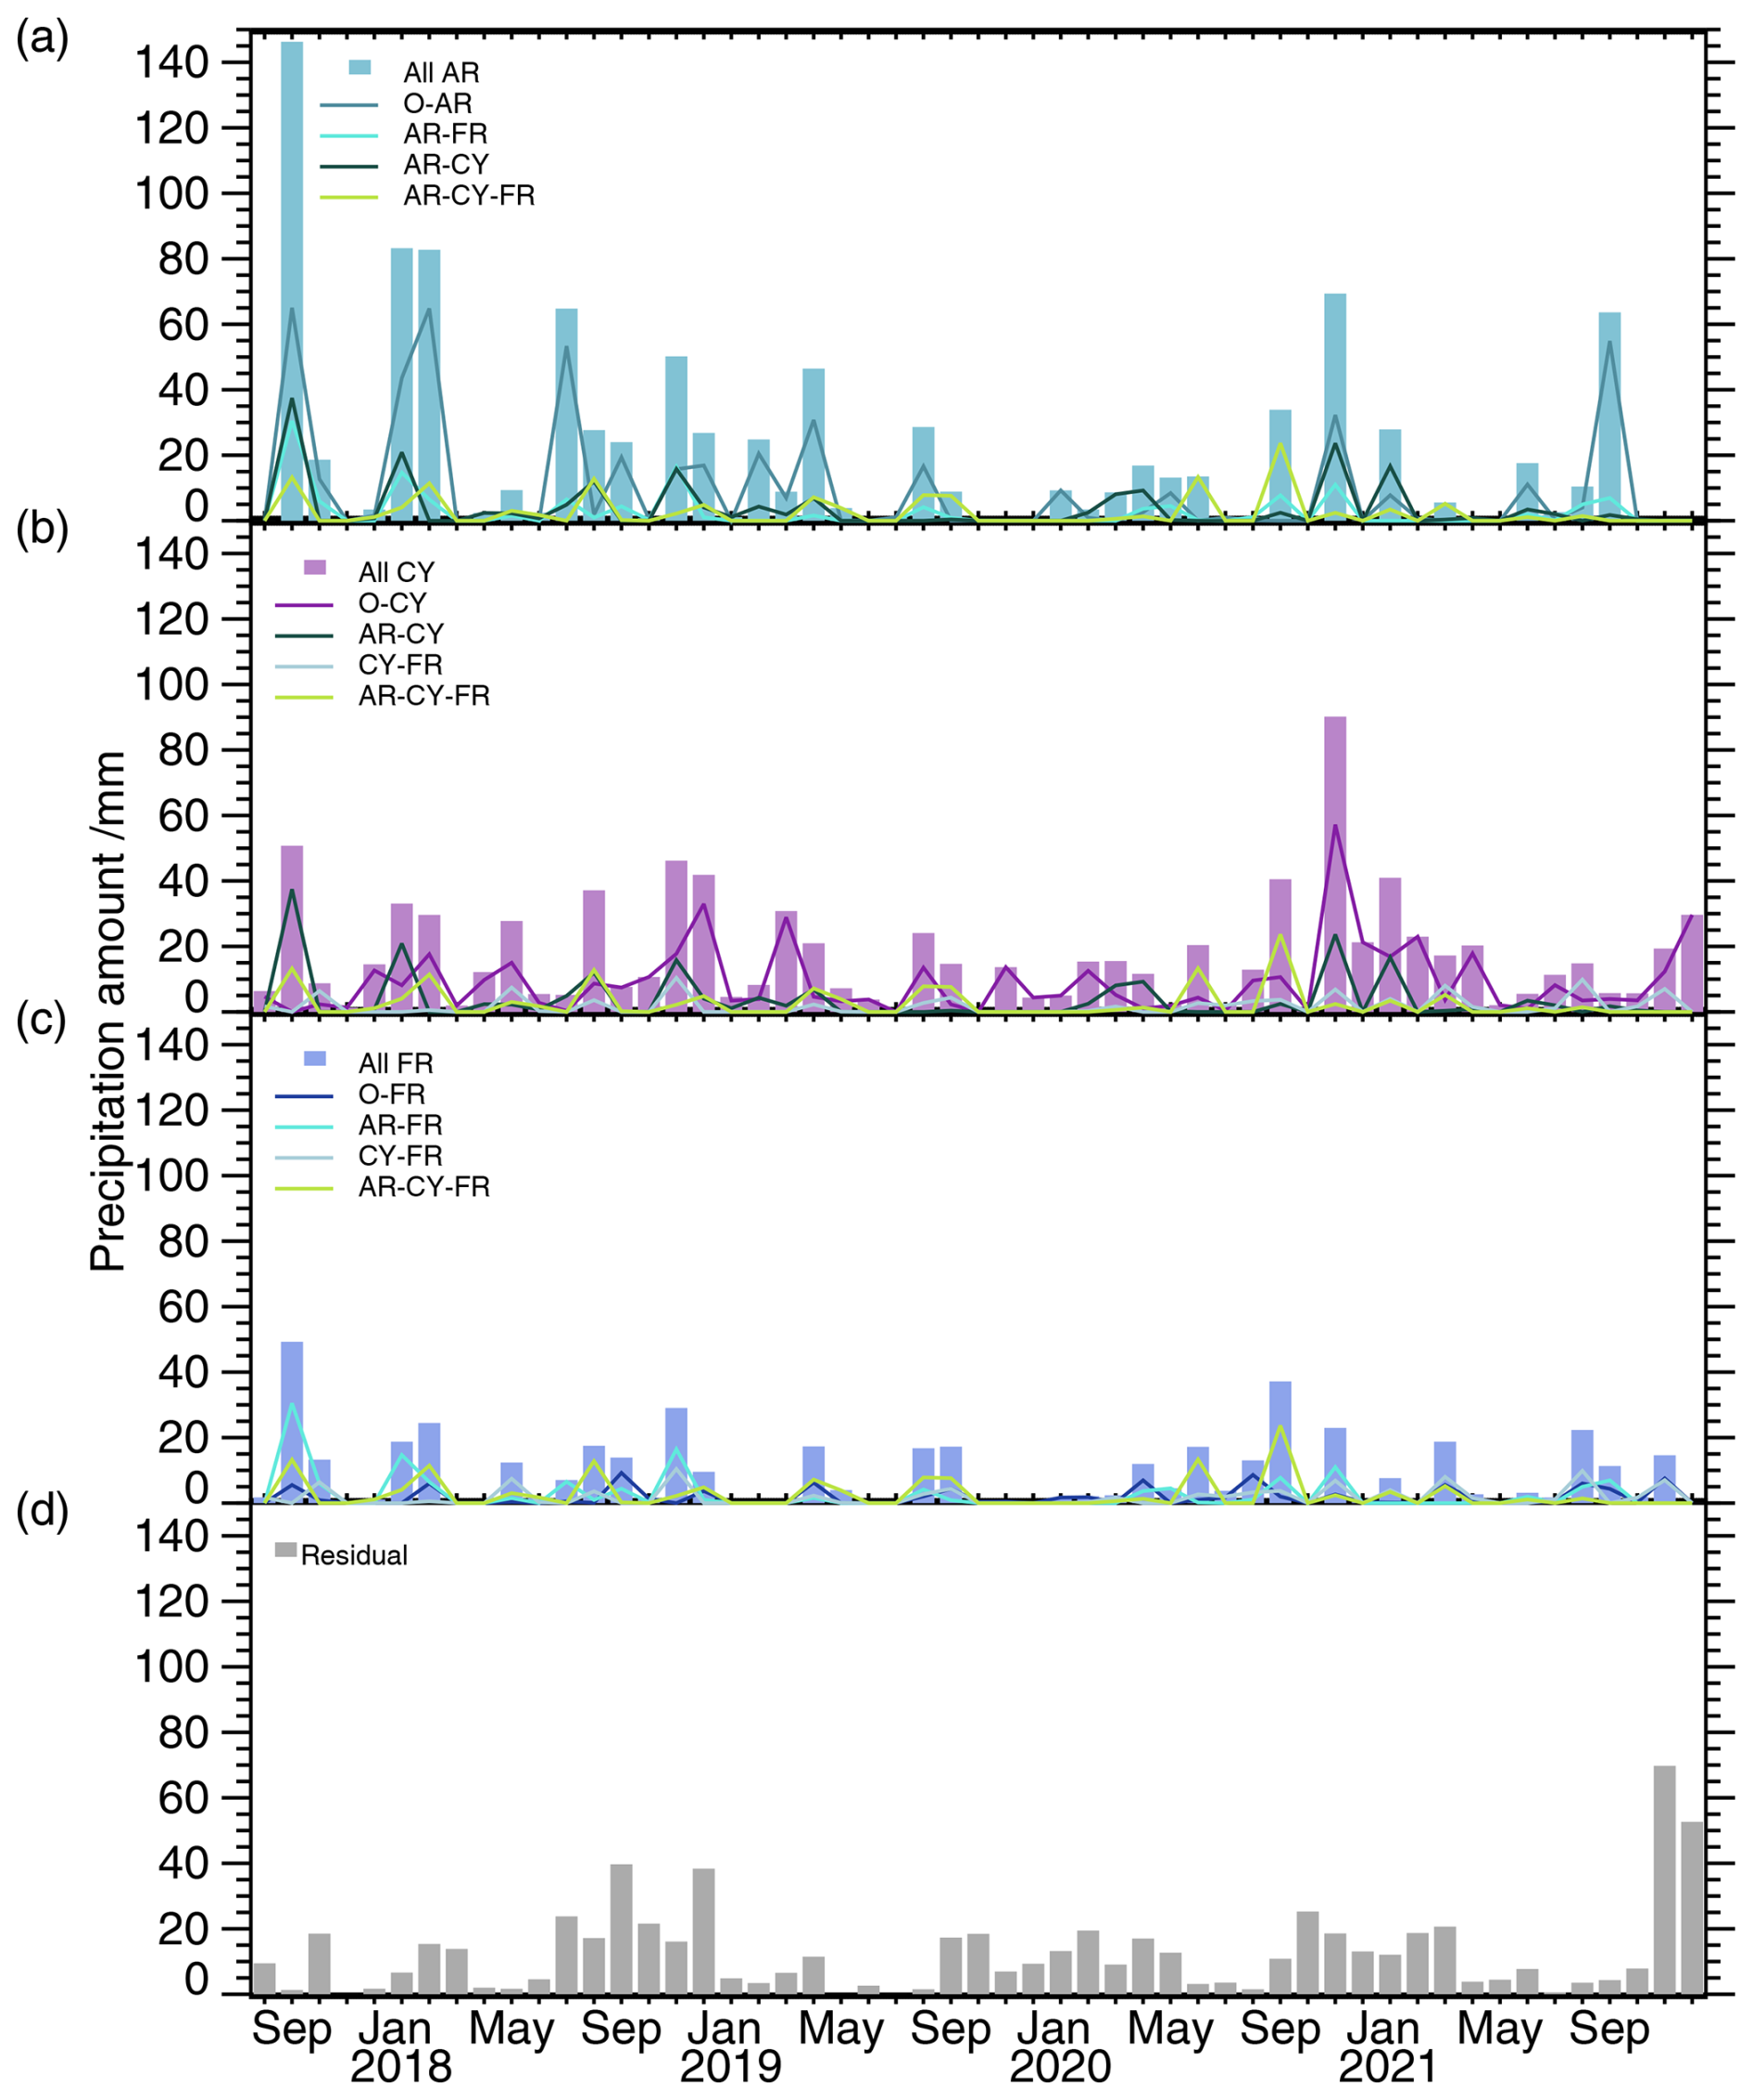
Figure A5Monthly precipitation amount (in mm) related to (a) atmospheric rivers (AR), (b) cyclones (CY) and (c) fronts (FR). Weather systems can occur separately (O-AR, O-CY, O-FR) or at the same time in different combinations (colored lines; see legends). “All” (colored bars) includes all cases with a certain system regardless of whether the other two systems are present or not.
The Pluvio (https://doi.org/10.1594/PANGAEA.957612, Ebell et al., 2023b) and Parsivel data (https://doi.org/10.1594/PANGAEA.958395, Ebell et al., 2023a) have been published on PANGAEA. The 12-hourly precipitation sums of the precipitation gauge of the Norwegian Meteorological Institute (MET Norway) and the corrected precipitation estimates have been taken from Jacobi and Champagne (2024) (https://doi.org/10.57932/86e7a148-54cf-4d02-af11-39eb1ab417fe). 2 m temperature and wind observations at AWIPEV are from Maturilli (2020) (https://doi.org/10.1594/PANGAEA.914927). The ERA5 reanalysis data sets were provided by ECMWF (Hersbach et al., 2023b, a) (https://doi.org/10.24381/cds.adbb2d47, https://doi.org/10.24381/cds.bd0915c6). The global atmospheric rivers catalog for ERA5 reanalysis is available on PANGAEA (https://doi.org/10.1594/PANGAEA.957161, Lauer et al., 2023). The detected weather systems (atmospheric rivers, cyclones, fronts) at Ny-Ålesund for 2017–2021 are available in Lauer (2024) (https://doi.org/10.5281/zenodo.13768032).
KE, RG and MM conceptualized the manuscript. KE and CB analyzed data and prepared the plots. GC and AW worked on processing instrument data. PK took care of the instrument operation, data collection and basic processing. ML provided the atmospheric river, cyclone and front detection and helped interpret the results. SD provided visualizations of the reanalysis data and analyzed the figures. KE is the main author of this paper. All co-authors contributed to discussions and reviewed the manuscript.
The contact author has declared that none of the authors has any competing interests.
Publisher’s note: Copernicus Publications remains neutral with regard to jurisdictional claims made in the text, published maps, institutional affiliations, or any other geographical representation in this paper. While Copernicus Publications makes every effort to include appropriate place names, the final responsibility lies with the authors.
We gratefully acknowledge the funding by the Deutsche Forschungsgemeinschaft DFG (German Research Foundation) – project number 268020496 – TRR 172, within the Transregional Collaborative Research Center “ArctiC Amplification: Climate Relevant Atmospheric and SurfaCe Processes and Feedback Mechanisms (AC)3”. We thank the AWIPEV team for their support in the operation of our instruments at AWIPEV within the project AWIPEV_0016. We thank Bernhard Pospichal and Tatiana Nomokonova for installing the Pluvio, Sabrina Schnitt for her support in the data processing, and Susanne Crewell and Hans-Werner Jacobi for the very enlightening discussions. We very much appreciate the comments by the two anonymous reviewers.
This research has been supported by the Deutsche Forschungsgemeinschaft (grant no. 268020496).
This open-access publication was funded by Universität zu Köln.
This paper was edited by Matthias Tesche and reviewed by two anonymous referees.
Adam, J. C. and Lettenmaier, D. P.: Adjustment of global gridded precipitation for systematic bias, J. Geophys. Res.-Atmos., 108, https://doi.org/10.1029/2002JD002499, 2003. a
Barrett, A. P., Stroeve, J. C., and Serreze, M. C.: Arctic Ocean Precipitation From Atmospheric Reanalyses and Comparisons With North Pole Drifting Station Records, J. Geophys. Res.-Oceans, 125, e2019JC015415, https://doi.org/10.1029/2019JC015415, 2020. a
Bengtsson, L., Hodges, K. I., Koumoutsaris, S., Zahn, M., and Keenlyside, N.: The changing atmospheric water cycle in Polar Regions in a warmer climate, Tellus A, 63, 907–920, https://doi.org/10.1111/j.1600-0870.2011.00534.x, 2011. a
Bintanja, R.: The impact of Arctic warming on increased rainfall, Sci. Rep., 8, 16001, https://doi.org/10.1038/s41598-018-34450-3, 2018. a
Bintanja, R. and Andry, O.: Towards a rain-dominated Arctic, Nat. Clim. Change, 7, 263–267, https://doi.org/10.1038/nclimate3240, 2017. a, b, c
Bintanja, R. and Selten, F. M.: Future increases in Arctic precipitation linked to local evaporation and sea-ice retreat, Nature, 509, 479–482, https://doi.org/10.1038/nature13259, 2014. a
Bintanja, R., van der Wiel, K., van der Linden, E. C., Reusen, J., Bogerd, L., Krikken, F., and Selten, F. M.: Strong future increases in Arctic precipitation variability linked to poleward moisture transport, Sci. Adv., 6, eaax6869, https://doi.org/10.1126/sciadv.aax6869, 2020. a, b, c
Boike, J., Juszak, I., Lange, S., Chadburn, S., Burke, E., Overduin, P. P., Roth, K., Ippisch, O., Bornemann, N., Stern, L., Gouttevin, I., Hauber, E., and Westermann, S.: A 20-year record (1998–2017) of permafrost, active layer and meteorological conditions at a high Arctic permafrost research site (Bayelva, Spitsbergen), Earth Syst. Sci. Data, 10, 355–390, https://doi.org/10.5194/essd-10-355-2018, 2018. a
Boisvert, L. N., Webster, M. A., Petty, A. A., Markus, T., Bromwich, D. H., and Cullather, R. I.: Intercomparison of Precipitation Estimates over the Arctic Ocean and Its Peripheral Seas from Reanalyses, J. Climate, 31, 8441–8462, https://doi.org/10.1175/JCLI-D-18-0125.1, 2018. a, b
Box, J. E., Fettweis, X., Stroeve, J. C., Tedesco, M., Hall, D. K., and Steffen, K.: Greenland ice sheet albedo feedback: thermodynamics and atmospheric drivers, The Cryosphere, 6, 821–839, https://doi.org/10.5194/tc-6-821-2012, 2012. a
Bresson, H., Rinke, A., Mech, M., Reinert, D., Schemann, V., Ebell, K., Maturilli, M., Viceto, C., Gorodetskaya, I., and Crewell, S.: Case study of a moisture intrusion over the Arctic with the ICOsahedral Non-hydrostatic (ICON) model: resolution dependence of its representation, Atmos. Chem. Phys., 22, 173–196, https://doi.org/10.5194/acp-22-173-2022, 2022. a
Bring, A., Fedorova, I., Dibike, Y., Hinzman, L., Mård, J., Mernild, S. H., Prowse, T., Semenova, O., Stuefer, S. L., and Woo, M.-K.: Arctic terrestrial hydrology: A synthesis of processes, regional effects, and research challenges, J. Geophys. Res.-Biogeo., 121, 621–649, https://doi.org/10.1002/2015JG003131, 2016. a
Cai, Z., You, Q., Chen, H. W., Zhang, R., Zuo, Z., Chen, D., Cohen, J., and Screen, J. A.: Assessing Arctic wetting: Performances of CMIP6 models and projections of precipitation changes, Atmos. Res., 297, 107124, https://doi.org/10.1016/j.atmosres.2023.107124, 2024. a, b
Champagne, O., Zolina, O., Dedieu, J.-P., Wolff, M., and Jacobi, H.-W.: Artificial Trends or Real Changes? Investigating Precipitation Records in Ny-Ålesund, Svalbard, J. Hydrometeorol., 25, 809–825, https://doi.org/10.1175/JHM-D-23-0182.1, 2024. a, b, c, d, e, f, g, h, i, j, k, l, m, n, o, p, q, r, s, t, u, v, w, x
Chellini, G., Gierens, R., and Kneifel, S.: Ice Aggregation in Low-Level Mixed-Phase Clouds at a High Arctic Site: Enhanced by Dendritic Growth and Absent Close to the Melting Level, J. Geophys. Res.-Atmos., 127, e2022JD036860, https://doi.org/10.1029/2022JD036860, 2022. a
Chellini, G., Gierens, R., Ebell, K., Kiszler, T., Krobot, P., Myagkov, A., Schemann, V., and Kneifel, S.: Low-level mixed-phase clouds at the high Arctic site of Ny-Ålesund: a comprehensive long-term dataset of remote sensing observations, Earth Syst. Sci. Data, 15, 5427–5448, https://doi.org/10.5194/essd-15-5427-2023, 2023. a, b
Cullather, R. I., Bromwich, D. H., and Serreze, M. C.: The Atmospheric Hydrologic Cycle over the Arctic Basin from Reanalyses. Part I: Comparison with Observations and Previous Studies, J. Climate, 13, 923–937, https://doi.org/10.1175/1520-0442(2000)013<0923:TAHCOT>2.0.CO;2, 2000. a
Dahlke, S. and Maturilli, M.: Contribution of Atmospheric Advection to the Amplified Winter Warming in the Arctic North Atlantic Region, Adv. Meteorol., 2017, 4928620, https://doi.org/10.1155/2017/4928620, 2017. a
Dahlke, S., Hughes, N. E., Wagner, P. M., Gerland, S., Wawrzyniak, T., Ivanov, B., and Maturilli, M.: The observed recent surface air temperature development across Svalbard and concurring footprints in local sea ice cover, Int. J. Climatol., 40, 5246–5265, https://doi.org/10.1002/joc.6517, 2020. a
Dobler, A., Lutz, J., Landgren, O., and Haugen, J. E.: Circulation Specific Precipitation Patterns over Svalbard and Projected Future Changes, Atmosphere, 11, 1378, https://doi.org/10.3390/atmos11121378, 2020. a
Dou, T. F., Pan, S. F., Bintanja, R., and Xiao, C. D.: More Frequent, Intense, and Extensive Rainfall Events in a Strongly Warming Arctic, Earth's Future, 10, e2021EF002378, https://doi.org/10.1029/2021EF002378, 2022. a
Ebell, K., Schnitt, S., and Krobot, K.: Parsivel disdrometer measurements at AWIPEV, Ny-Ålesund (2017–2021), PANGAEA [data set], https://doi.org/10.1594/PANGAEA.958395, 2023a. a, b
Ebell, K., Schnitt, S., and Krobot, K.: Precipitation amount of Pluvio rain gauge at AWIPEV, Ny-Ålesund (2017–2021), PANGAEA [data set], https://doi.org/10.1594/PANGAEA.957612, 2023b. a, b
ECMWF: IFS Documentation CY41R2 – Part IV: Physical Processes, IFS Documentation, https://doi.org/10.21957/tr5rv27xu, 2016. a
Feiccabrino, J., Graff, W., Lundberg, A., Sandström, N., and Gustafsson, D.: Meteorological Knowledge Useful for the Improvement of Snow Rain Separation in Surface Based Models, Hydrology, 2, 266–288, https://doi.org/10.3390/hydrology2040266, 2015. a
Førland, E. J. and Hanssen-Bauer, I.: Increased Precipitation in the Norwegian Arctic: True or False?, Clim. Change, 46, 485–509, https://doi.org/10.1023/A:1005613304674, 2000. a
Førland, E. J., Allerup, P., Dahlström, B., Elomaa, E., Jónsson, T., Madsen, H., Perälä, J., Rissanen, P., Vedin, H., and Vejen, F.: Manual for operational correction of nordic precipitation data, Norwegian Meteorological Institute KLIMA Report 24/96, 72 pp., https://www.met.no/publikasjoner/met-report/met-report-1996/_/attachment/download/ea2cb006-688a-408f-a60c-9f6306843cc0:e16a138129a1d1896cff764ab3eb2cc42aefb160/MET-report-24-1996.pdf (last access: 16 April 2025), 1996. a
Gierens, R., Kneifel, S., Shupe, M. D., Ebell, K., Maturilli, M., and Löhnert, U.: Low-level mixed-phase clouds in a complex Arctic environment, Atmos. Chem. Phys., 20, 3459–3481, https://doi.org/10.5194/acp-20-3459-2020, 2020. a
Goosse, H., Kay, J. E., Armour, K. C., Bodas-Salcedo, A., Chepfer, H., Docquier, D., Jonko, A., Kushner, P. J., Lecomte, O., Massonnet, F., Park, H.-S., Pithan, F., Svensson, G., and Vancoppenolle, M.: Quantifying climate feedbacks in polar regions, Nat. Commun., 9, 1919, https://doi.org/10.1038/s41467-018-04173-0, 2018. a
Guan, B. and Waliser, D. E.: Detection of atmospheric rivers: Evaluation and application of an algorithm for global studies, J. Geophys. Res.-Atmos., 120, 12514–12535, https://doi.org/10.1002/2015JD024257, 2015. a, b
Guan, B., Waliser, D. E., and Ralph, F. M.: An Intercomparison between Reanalysis and Dropsonde Observations of the Total Water Vapor Transport in Individual Atmospheric Rivers, J. Hydrometeorol., 19, 321–337, https://doi.org/10.1175/JHM-D-17-0114.1, 2018. a
Hansen, B. B., Isaksen, K., Benestad, R. E., Kohler, J., Pedersen, A. O., Loe, L. E., Coulson, S. J., Larsen, J. O., and Varpe, O.: Warmer and wetter winters: characteristics and implications of an extreme weather event in the High Arctic, Environ. Res. Lett., 9, 114021, https://doi.org/10.1088/1748-9326/9/11/114021, 2014. a
Hansen, B. B., Gamelon, M., Albon, S. D., Lee, A. M., Stien, A., Irvine, R. J., Sæther, B.-E., Loe, L. E., Ropstad, E., Veiberg, V., and Grøtan, V.: More frequent extreme climate events stabilize reindeer population dynamics, Nat. Commun., 10, 1616, https://doi.org/10.1038/s41467-019-09332-5, 2019. a
Hanssen-Bauer, I., Førland, E. J., and Nordli, P. O.: Measured and true precipitations at Svalbard, Norwegian Meteorological Institute KLIMA Report 31/96, 50 pp., https://www.met.no/publikasjoner/met-report/met-report-1996/_/attachment/download/384542de-1466-4987-b3ff-8c69767b9f2c:016c399a34d2c64618f450ba4819241e0759057e/MET-report-31-1996.pdf (last access: 16 April 2025), 1996. a
Hanssen-Bauer, I., Førland, E. J., Hisdal, H., Mayer, S., Sandø, A. B., and Sorteberg, A.: Climate in Svalbard 2100 – a knowledge base for climate adaptation, NCCS Report no. 1/2019, https://klimaservicesenter.no (last access: 16 April 2025), 2019. a, b, c, d
Harpold, A. A., Kaplan, M. L., Klos, P. Z., Link, T., McNamara, J. P., Rajagopal, S., Schumer, R., and Steele, C. M.: Rain or snow: hydrologic processes, observations, prediction, and research needs, Hydrol. Earth Syst. Sci., 21, 1–22, https://doi.org/10.5194/hess-21-1-2017, 2017. a
Hartmuth, K., Papritz, L., Boettcher, M., and Wernli, H.: Arctic Seasonal Variability and Extremes, and the Role of Weather Systems in a Changing Climate, Geophys. Res. Lett., 50, e2022GL102349, https://doi.org/10.1029/2022GL102349, 2023. a
Hersbach, H., Bell, B., Berrisford, P., Hirahara, S., Horányi, A., Muñoz Sabater, J., Nicolas, J., Peubey, C., Radu, R., Schepers, D., Simmons, A., Soci, C., Abdalla, S., Abellan, X., Balsamo, G., Bechtold, P., Biavati, G., Bidlot, J., Bonavita, M., De Chiara, G., Dahlgren, P., Dee, D., Diamantakis, M., Dragani, R., Flemming, J., Forbes, R., Fuentes, M., Geer, A., Haimberger, L., Healy, S., Hogan, R. J., Hólm, E., Janisková, M., Keeley, S., Laloyaux, P., Lopez, P., Lupu, C., Radnoti, G., de Rosnay, P., Rozum, I., Vamborg, F., Villaume, S., and Thépaut, J.-N.: The ERA5 global reanalysis, Q. J. Roy. Meteor. Soc., 146, 1999–2049, https://doi.org/10.1002/qj.3803, 2020. a
Hersbach, H., Bell, B., Berrisford, P., Biavati, G., Horányi, A., Muñoz Sabater, J., Nicolas, J., Peubey, C., Radu, R., Rozum, I., Schepers, D., Simmons, A., Soci, C., Dee, D., and Thépaut, J.-N.: ERA5 hourly data on pressure levels from 1940 to present, Copernicus Climate Change Service (C3S) Climate Data Store (CDS) [data set], https://doi.org/10.24381/cds.bd0915c6, 2023a. a
Hersbach, H., Bell, B., Berrisford, P., Biavati, G., Horányi, A., Sabater, J. M., Nicolas, J., Peubey, C., Radu, R., Rozum, I., Schepers, D., Simmons, A., Soci, C., Dee, D., and Thépaut, J.-N.: ERA5 hourly data on single levels from 1940 to present, Copernicus Climate Change Service (C3S) Climate Data Store (CDS) [data set], https://doi.org/10.24381/cds.adbb2d47, 2023b. a
Jacobi, H.-W. and Champagne, O.: Observed and corrected precipitation at Ny-Alesund, Earth System Data Repository EaSy Data [data set], https://doi.org/10.57932/86e7a148-54cf-4d02-af11-39eb1ab417fe, 2024. a, b, c
Jacobi, H.-W., Ebell, K., Schoger, S., and Wolff, M. A.: Multi-instrument approach for the correction of observed precipitation in the Arctic, Svalbard Science Conference 2019, 6–7 November 2019, Presentation No. 1024, https://www.forskningsradet.no/contentassets/f464e19d364c40b (last access: 10 July 2025), 2019. a, b, c, d
Jenkner, J., Sprenger, M., Schwenk, I., Schwierz, C., Dierer, S., and Leuenberger, D.: Detection and climatology of fronts in a high-resolution model reanalysis over the Alps, Meteorol. Appl., 17, 1–18, https://doi.org/10.1002/met.142, 2010. a
Jennings, K. S., Winchell, T. S., Livneh, B., and Molotch, N. P.: Spatial variation of the rain-snow temperature threshold across the Northern Hemisphere, Nat. Commun., 9, 1148, https://doi.org/10.1038/s41467-018-03629-7, 2018. a
Kneifel, S., Pospichal, B., von Terzi, L., Zinner, T., Puh, M., Hagen, M., Mayer, B., Löhnert, U., and Crewell, S.: Multi-year cloud and precipitation statistics observed with remote sensors at the high-altitude Environmental Research Station Schneefernerhaus in the German Alps, Meteorol. Z., 31, 69–86, https://doi.org/10.1127/metz/2021/1099, 2022. a
Kochendorfer, J., Nitu, R., Wolff, M., Mekis, E., Rasmussen, R., Baker, B., Earle, M. E., Reverdin, A., Wong, K., Smith, C. D., Yang, D., Roulet, Y.-A., Buisan, S., Laine, T., Lee, G., Aceituno, J. L. C., Alastrué, J., Isaksen, K., Meyers, T., Brækkan, R., Landolt, S., Jachcik, A., and Poikonen, A.: Analysis of single-Alter-shielded and unshielded measurements of mixed and solid precipitation from WMO-SPICE, Hydrol. Earth Syst. Sci., 21, 3525–3542, https://doi.org/10.5194/hess-21-3525-2017, 2017. a, b, c
Kopec, B. G., Feng, X., Michel, F. A., and Posmentier, E. S.: Influence of sea ice on Arctic precipitation, P. Natl. Acad. Sci. USA, 113, 46–51, https://doi.org/10.1073/pnas.1504633113, 2016. a
Lauer, M.: Data set of detected atmospheric rivers, cyclones, and fronts within the region of 75°N–82.5°N, 0°E–30°E and at Ny-Ålesund (Svalbard) for 2017–2021, Zenodo [data set], https://doi.org/10.5281/zenodo.13768032, 2024. a
Lauer, M., Mech, M., and Guan, B.: Global Atmospheric Rivers catalog for ERA5 reanalysis, PANGAEA [data set], https://doi.org/10.1594/PANGAEA.957161, 2023. a
Lauer, M., Rinke, A., Gorodetskaya, I., Sprenger, M., Mech, M., and Crewell, S.: Influence of atmospheric rivers and associated weather systems on precipitation in the Arctic, Atmos. Chem. Phys., 23, 8705–8726, https://doi.org/10.5194/acp-23-8705-2023, 2023. a, b, c, d, e, f, g, h, i
Maahn, M., Moisseev, D., Steinke, I., Maherndl, N., and Shupe, M. D.: Introducing the Video In Situ Snowfall Sensor (VISSS), Atmos. Meas. Tech., 17, 899–919, https://doi.org/10.5194/amt-17-899-2024, 2024. a
Mattingly, K. S., Mote, T. L., and Fettweis, X.: Atmospheric River Impacts on Greenland Ice Sheet Surface Mass Balance, J. Geophys. Res.-Atmos., 123, 8538–8560, https://doi.org/10.1029/2018JD028714, 2018. a
Mattingly, K. S., Mote, T. L., Fettweis, X., van As, D., Tricht, K. V., Lhermitte, S., Pettersen, C., and Fausto, R. S.: Strong Summer Atmospheric Rivers Trigger Greenland Ice Sheet Melt through Spatially Varying Surface Energy Balance and Cloud Regimes, J. Climate, 33, 6809–6832, https://doi.org/10.1175/JCLI-D-19-0835.1, 2020. a
Maturilli, M.: Basic and other measurements of radiation at station Ny-Ålesund (2006-05 et seq), PANGAEA [data set], https://doi.org/10.1594/PANGAEA.914927, 2020. a, b
Maturilli, M., Herber, A., and König-Langlo, G.: Climatology and time series of surface meteorology in Ny-Ålesund, Svalbard, Earth Syst. Sci. Data, 5, 155–163, https://doi.org/10.5194/essd-5-155-2013, 2013. a
McCrystall, M. R., Stroeve, J., Serreze, M., Forbes, B. C., and Screen, J. A.: New climate models reveal faster and larger increases in Arctic precipitation than previously projected, Nat. Commun., 12, 6765, https://doi.org/10.1038/s41467-021-27031-y, 2021. a, b
Mewes, D. and Jacobi, C.: Heat transport pathways into the Arctic and their connections to surface air temperatures, Atmos. Chem. Phys., 19, 3927–3937, https://doi.org/10.5194/acp-19-3927-2019, 2019. a
Nitu, R., Roulet, Y.-A., Wolff, M., Earle, M., Reverdin, A., Smith, C., Kochendorfer, J., Morin, S., Rasmussen, R., Wong, K., Alastrué, J., Arnold, L., Baker, B., Buisán, S., Collado, J., Colli, M., Collins, B., Gaydos, A., Hannula, H.-R., Hoover, J., Joe, P., Kontu, A., Laine, T., Lanza, L., Lanzinger, E., Lee, G., Lejeune, Y., Leppänen, L., Mekis, E., Panel, J.-M., Poikonen, A., Ryu, S., Sabatini, F., Theriault, J., Yang, D., Genthon, C., van den Heuvel, F., Hirasawa, N., Konishi, H., Motoyoshi, H., Nakai, S., Nishimura, K., Senese, A., and Yamashita, K.: WMO Solid Precipitation Intercomparison Experiment (SPICE) (2012–2015), Instruments and Observing Methods Report No. 131, https://library.wmo.int/idurl/4/56317 (last access: 16 April 2025), 2018. a
Nomokonova, T., Ebell, K., Löhnert, U., Maturilli, M., Ritter, C., and O'Connor, E.: Statistics on clouds and their relation to thermodynamic conditions at Ny-Ålesund using ground-based sensor synergy, Atmos. Chem. Phys., 19, 4105–4126, https://doi.org/10.5194/acp-19-4105-2019, 2019. a
OTT: Operating Instructions Present Weaather Sensor OTT Parsivel2, document number: 70.210.001.B.E. 12-1016, https://www.ott.com/download/operating-instructions-present-weather-sensor-ott-parsivel2-without-screen-heating-1/ (last access: 5 May 2023), 2016a. a, b
OTT: Operating Instructions Precipitation gauge OTT Pluvio2 L, document number: 70.040.000.B.E. 01-0116, https://www.ott.com/download/operating-instructions-precipitation-gauge-ott-pluvio2-l-1/ (last access: 5 May 2023), 2016b. a, b
Peeters, B., Pedersen, A. O., Loe, L. E., Isaksen, K., Veiberg, V., Stien, A., Kohler, J., Gallet, J.-C., Aanes, R., and Hansen, B. B.: Spatiotemporal patterns of rain-on-snow and basal ice in high Arctic Svalbard: detection of a climate-cryosphere regime shift, Environ. Res. Lett., 14, 015002, https://doi.org/10.1088/1748-9326/aaefb3, 2019. a
Pettersen, C., Henderson, S. A., Mattingly, K. S., Bennartz, R., and Breeden, M. L.: The Critical Role of Euro-Atlantic Blocking in Promoting Snowfall in Central Greenland, J. Geophys. Res.-Atmos., 127, e2021JD035776, https://doi.org/10.1029/2021JD035776, 2022. a
Pithan, F. and Jung, T.: Arctic Amplification of Precipitation Changes – The Energy Hypothesis, Geophys. Res. Lett., 48, e2021GL094977, https://doi.org/10.1029/2021GL094977, 2021. a
Pithan, F. and Mauritsen, T.: Arctic amplification dominated by temperature feedbacks in contemporary climate models, Nat. Geosci., 7, 181–184, https://doi.org/10.1038/ngeo2071, 2014. a
Prowse, T., Bring, A., Mård, J., Carmack, E., Holland, M., Instanes, A., Vihma, T., and Wrona, F. J.: Arctic Freshwater Synthesis: Summary of key emerging issues, J. Geophys. Res.-Biogeo., 120, 1887–1893, https://doi.org/10.1002/2015JG003128, 2015. a
Ralph, F. M., Dettinger, M. D., Schick, L. J., and Anderson, M. L.: Atmospheric Rivers, chap. Introduction to Atmospheric Rivers, Springer International Publishing, Cham, 1–13, ISBN 978-3-030-28906-5, https://doi.org/10.1007/978-3-030-28906-5_1, 2020. a
Rantanen, M., Karpechko, A. Y., Lipponen, A., Nordling, K., Hyvärinen, O., Ruosteenoja, K., Vihma, T., and Laaksonen, A.: The Arctic has warmed nearly four times faster than the globe since 1979, Commun. Earth Environ., 3, 168, https://doi.org/10.1038/s43247-022-00498-3, 2022. a
Riihelä, A., King, M. D., and Anttila, K.: The surface albedo of the Greenland Ice Sheet between 1982 and 2015 from the CLARA-A2 dataset and its relationship to the ice sheet's surface mass balance, The Cryosphere, 13, 2597–2614, https://doi.org/10.5194/tc-13-2597-2019, 2019. a
Rinke, A., Maturilli, M., Graham, R. M., Matthes, H., Handorf, D., Cohen, L., Hudson, S. R., and Moore, J. C.: Extreme cyclone events in the Arctic: Wintertime variability and trends, Environ. Res. Lett., 12, 094006, https://doi.org/10.1088/1748-9326/aa7def, 2017. a
Schemm, S., Rudeva, I., and Simmonds, I.: Extratropical fronts in the lower troposphere – global perspectives obtained from two automated methods, Q. J. Roy. Meteor. Soc., 141, 1686–1698, https://doi.org/10.1002/qj.2471, 2015. a
Seifert, A. and Beheng, K. D.: A two-moment cloud microphysics parameterization for mixed-phase clouds. Part 1: Model description, Meteorol. Atmos. Phys., 92, 45–66, https://doi.org/10.1007/s00703-005-0112-4, 2005. a
Serreze, M. C. and Barry, R. G.: Processes and impacts of Arctic amplification: A research synthesis, Global Planet. Change, 77, 85–96, https://doi.org/10.1016/j.gloplacha.2011.03.004, 2011. a
Serreze, M. C. and Barry, R. G.: The Arctic Climate System, Cambridge Atmospheric and Space Science Series, Cambridge University Press, 2 edn., https://doi.org/10.1017/CBO9781139583817, 2014. a
Serreze, M. C. and Francis, J. A.: The Arctic Amplification Debate, Climatic Change, 76, 241–264, https://doi.org/10.1007/s10584-005-9017-y, 2006. a
Serreze, M. C. and Hurst, C. M.: Representation of Mean Arctic Precipitation from NCEP-NCAR and ERA Reanalyses, J. Climate, 13, 182–201, https://doi.org/10.1175/1520-0442(2000)013<0182:ROMAPF>2.0.CO;2, 2000. a
Serreze, M. C., Barry, R. G., and Walsh, J. E.: Atmospheric Water Vapor Characteristics at 70°N, J. Climate, 8, 719–731, https://doi.org/10.1175/1520-0442(1995)008<0719:AWVCA>2.0.CO;2, 1995. a
Serreze, M. C., Crawford, A. D., and Barrett, A. P.: Extreme daily precipitation events at Spitsbergen, an Arctic Island, Int. J. Climatol., 35, 4574–4588, https://doi.org/10.1002/joc.4308, 2015. a, b, c, d
Serreze, M. C., Bigalke, S., Lader, R., Crawford, A., and Ballinger, T. J.: NOAA Arctic Report Card 2024 : Precipitation, NOAA technical report OAR ARC, 24-03 (Arctic Report Card), https://doi.org/10.25923/xf7c-p592, 2024. a, b
Sprenger, M., Fragkoulidis, G., Binder, H., Croci-Maspoli, M., Graf, P., Grams, C. M., Knippertz, P., Madonna, E., Schemm, S., Škerlak, B., and Wernli, H.: Global Climatologies of Eulerian and Lagrangian Flow Features based on ERA-Interim, B. Am. Meteor. Soc., 98, 1739–1748, https://doi.org/10.1175/BAMS-D-15-00299.1, 2017. a
van den Broeke, M., Bamber, J., Ettema, J., Rignot, E., Schrama, E., van de Berg, W. J., van Meijgaard, E., Velicogna, I., and Wouters, B.: Partitioning Recent Greenland Mass Loss, Science, 326, 984–986, https://doi.org/10.1126/science.1178176, 2009. a
Vihma, T., Screen, J., Tjernström, M., Newton, B., Zhang, X., Popova, V., Deser, C., Holland, M., and Prowse, T.: The atmospheric role in the Arctic water cycle: A review on processes, past and future changes, and their impacts, J. Geophys. Res.-Biogeo., 121, 586–620, https://doi.org/10.1002/2015JG003132, 2016. a
Vikhamar-Schuler, D., Isaksen, K., Haugen, J. E., Tømmervik, H., Luks, B., Schuler, T. V., and Bjerke, J. W.: Changes in Winter Warming Events in the Nordic Arctic Region, J. Climate, 29, 6223–6244, https://doi.org/10.1175/JCLI-D-15-0763.1, 2016. a, b, c
Wendisch, M., Brückner, M., Burrows, J. P., Crewell, S., Dethloff, K., Ebell, K., Lüpkes, C., Macke, A., Notholt, J., Quaas, J., Rinke, A., and Tegen, I.: Understanding causes and effects of rapid warming in the Arctic, Eos, 98, 22–26, https://doi.org/10.1029/2017EO064803, 2017. a
Wendisch, M., Brückner, M., Crewell, S., Ehrlich, A., Notholt, J., Lüpkes, C., Macke, A., Burrows, J. P., Rinke, A., Quaas, J., Maturilli, M., Schemann, V., Shupe, M. D., Akansu, E. F., Barrientos-Velasco, C., Bärfuss, K., Blechschmidt, A.-M., Block, K., Bougoudis, I., Bozem, H., Böckmann, C., Bracher, A., Bresson, H., Bretschneider, L., Buschmann, M., Chechin, D. G., Chylik, J., Dahlke, S., Deneke, H., Dethloff, K., Donth, T., Dorn, W., Dupuy, R., Ebell, K., Egerer, U., Engelmann, R., Eppers, O., Gerdes, R., Gierens, R., Gorodetskaya, I. V., Gottschalk, M., Griesche, H., Gryanik, V. M., Handorf, D., Harm-Altstädter, B., Hartmann, J., Hartmann, M., Heinold, B., Herber, A., Herrmann, H., Heygster, G., Höschel, I., Hofmann, Z., Hölemann, J., Hünerbein, A., Jafariserajehlou, S., Jäkel, E., Jacobi, C., Janout, M., Jansen, F., Jourdan, O., Jurányi, Z., Kalesse-Los, H., Kanzow, T., Käthner, R., Kliesch, L. L., Klingebiel, M., Knudsen, E. M., Kovács, T., Körtke, W., Krampe, D., Kretzschmar, J., Kreyling, D., Kulla, B., Kunkel, D., Lampert, A., Lauer, M., Lelli, L., von Lerber, A., Linke, O., Löhnert, U., Lonardi, M., Losa, S. N., Losch, M., Maahn, M., Mech, M., Mei, L., Mertes, S., Metzner, E., Mewes, D., Michaelis, J., Mioche, G., Moser, M., Nakoudi, K., Neggers, R., Neuber, R., Nomokonova, T., Oelker, J., Papakonstantinou-Presvelou, I., Pätzold, F., Pefanis, V., Pohl, C., van Pinxteren, M., Radovan, A., Rhein, M., Rex, M., Richter, A., Risse, N., Ritter, C., Rostosky, P., Rozanov, V. V., Donoso, E. R., Garfias, P. S., Salzmann, M., Schacht, J., Schäfer, M., Schneider, J., Schnierstein, N., Seifert, P., Seo, S., Siebert, H., Soppa, M. A., Spreen, G., Stachlewska, I. S., Stapf, J., Stratmann, F., Tegen, I., Viceto, C., Voigt, C., Vountas, M., Walbröl, A., Walter, M., Wehner, B., Wex, H., Willmes, S., Zanatta, M., and Zeppenfeld, S.: Atmospheric and Surface Processes, and Feedback Mechanisms Determining Arctic Amplification: A Review of First Results and Prospects of the (AC)3 Project, B. Am. Meteor. Soc., 104, E208–E242, https://doi.org/10.1175/BAMS-D-21-0218.1, 2023. a, b, c
Wernli, H. and Schwierz, C.: Surface Cyclones in the ERA-40 Dataset (1958–2001). Part I: Novel Identification Method and Global Climatology, Journal of the Atmospheric Sciences, 63, 2486 Р2507, https://doi.org/10.1175/JAS3766.1, 2006. a
Wickström, S., Jonassen, M. O., Vihma, T., and Uotila, P.: Trends in cyclones in the high-latitude North Atlantic during 1979-2016, Q. J. Roy. Meteor. Soc., 146, 762–779, https://doi.org/10.1002/qj.3707, 2020. a
Wolff, M. A., Isaksen, K., Petersen-Øverleir, A., Ødemark, K., Reitan, T., and Brækkan, R.: Derivation of a new continuous adjustment function for correcting wind-induced loss of solid precipitation: results of a Norwegian field study, Hydrol. Earth Syst. Sci., 19, 951–967, https://doi.org/10.5194/hess-19-951-2015, 2015. a, b, c, d, e, f, g, h, i, j, k
Xie, Y., Pettersen, C., Flanner, M., and Shates, J.: Ground-Observed Snow Albedo Changes During Rain-On-Snow Events in Northern Alaska, J. Geophys. Res.-Atmos., 129, e2024JD040975, https://doi.org/10.1029/2024JD040975, 2024. a
Zhou, W., Leung, L., and Lu, J.: Steady threefold Arctic amplification of externally forced warming masked by natural variability, Nat. Geosci., 17, 508–515, https://doi.org/10.1038/s41561-024-01441-1, 2024. a
- Abstract
- Introduction
- Data and methods
- Instrument and method assessment
- Impact of atmospheric rivers, cyclones and fronts on precipitation at Ny-Ålesund
- Summary and conclusions
- Appendix A
- Data availability
- Author contributions
- Competing interests
- Disclaimer
- Acknowledgements
- Financial support
- Review statement
- References