the Creative Commons Attribution 4.0 License.
the Creative Commons Attribution 4.0 License.
 | 14 Jul 2025
Cirrus formation regimes – data-driven identification and quantification of mineral dust effect
David Neubauer
Hanin Binder
Ulrike Lohmann
The microphysical and radiative properties of cirrus clouds are strongly dependent on the ice nucleation mechanism and origin of the ice crystals. Due to sparse temporal coverage of satellite data and limited observations of ice-nucleating particles (INPs) at cirrus levels, it is notoriously hard to determine the origin of the ice and the nucleation mechanism of cirrus clouds in satellite observations. In this work we combine 3 years of satellite observations of cirrus clouds from the DARDAR-Nice retrieval product with Lagrangian trajectories of reanalysis data of meteorological and aerosol variables calculated 12 h backward in time for each observed cirrus cloud. In a first step, we identify typical cirrus cloud formation regimes by clustering the Lagrangian trajectories and characterize observed microphysical properties for in situ and liquid origin cirrus clouds in mid-latitudes and the tropics. On average, in situ cirrus clouds have smaller ice water content (IWC) and lower ice crystal number concentration (Nice) and a strong negative temperature dependence of Nice, while liquid origin cirrus have a larger IWC, higher Nice and a strong positive temperature dependence of IWC. In a second step, we use MERRA2 reanalysis data to quantify the sensitivity of cirrus cloud microphysical properties to a change in the concentration of dust particles that may act as INPs. By identifying similar cirrus cloud formation pathways, we can condition on ice origin, region, and meteorological dependencies, and quantify the impact of dust particles for different formation regimes. We find that at cloud-top median Nice decreases with increasing dust concentrations for liquid origin cirrus. Specifically, the sensitivities are between 6 % and 7 % per order of magnitude increase in dust in the tropics and between 15 % in the mid-latitudes. The decrease in Nice can be explained by increased heterogeneous ice nucleation in the mixed-phase regime, leading to fewer cloud droplets freezing homogeneously once the cloud enters the cirrus temperatures and glaciates. The resulting fewer, but larger, ice crystals are more likely to sediment, leading to reduced IWC, as for example observed for liquid origin cirrus in the mid-latitudes. In contrast, for high-altitude in situ cirrus in the tropics, we find an increase of Nice median values of 11 % and IWC median values of 17 % per unit increase of dust aerosol in logarithmic space. We assume that this is caused by heterogeneous nucleation of ice initiated by dust INPs in INP-limited conditions with supersaturations between the heterogeneous and homogeneous freezing thresholds. Such conditions frequently occur at high altitudes, especially in tropical regions at temperatures below 200 K.
Our results provide an observational line of evidence that the climate intervention method of seeding cirrus clouds with potent INPs may potentially result in an undesired positive cloud radiative effect (CRE), i.e., a warming effect. Instead of producing fewer but larger ice crystals, we show that additional INPs can lead to an increase in Nice and IWC, an effect called overseeding.
- Article
(5899 KB) - Full-text XML
- BibTeX
- EndNote


Cirrus clouds have a region-dependent occurrence of between 10 % and 50 %. When analyzing the zonal distribution from the poles towards the Equator, occurrence peaks in the mid-latitude storm tracks, followed by a decrease in the subtropics. The occurrence then increases again towards the intertropical convergence zone (ITCZ), with a particularly pronounced increase over the warm pool region (Heymsfield et al., 2017). Despite the high cirrus cloud cover and the resulting climatological relevance, cirrus are a source of large uncertainties in climate projections (Forster et al., 2021). Cirrus clouds occur primarily in the upper troposphere at temperatures below −38 °C and consist purely of ice crystals. Clouds modulate the Earth's radiative budget via the reflection of short-wave radiation (cloud albedo effect) and the absorption and emission of infrared radiation into space (cloud greenhouse effect). Global climate model (GCM) and observational studies show that the greenhouse effect dominates in cirrus clouds, resulting in a positive CRE, meaning a net warming of the atmosphere (Gasparini and Lohmann, 2016; Hong et al., 2016). However, depending on the cloud microphysical properties (CMPs) of cirrus, the magnitude of the CRE varies significantly and can even change to a negative CRE for lower-level optically thick cirrus (DeMott et al., 2010; Hong et al., 2016; Krämer et al., 2016; Heymsfield et al., 2017). Cirrus CMPs, namely the IWC and Nice, are in turn controlled by the competition between homogeneous and heterogeneous ice nucleation (e.g., Kärcher et al., 2006), ice origin (Krämer et al., 2016), geographical location (Heymsfield et al., 2017), environmental variables, mainly temperature and updraft velocities, and the aerosol environment (Gryspeerdt et al., 2018). Other studies like Muhlbauer et al. (2014) and Sassen and Comstock (2001) use a dynamical regime for the classification of cirrus. The heterogeneity of cirrus CMPs and subsequent CRE require a better understanding of the formation pathways and their influence on cirrus CMPs to reduce the uncertainties in CRE estimates and cirrus cloud representations in GCMs used for climate change projections. In recent years there have been significant advances in the understanding of cirrus cloud formation and the resulting CMPs using in situ aircraft data, global satellite data, and model simulations. Krämer et al. (2016) and Luebke et al. (2016) introduced a cirrus classification based on the origin of ice crystals in cirrus clouds. Cirrus that form directly from the gas phase at temperatures °C are termed in situ cirrus. In contrast, liquid origin cirrus evolve from mixed-phase clouds, where cloud droplets freeze heterogeneously via ice-nucleating particles (INP; Kanji et al., 2017) at temperatures °C. Once the cloud is lifted to temperatures °C it glaciates spontaneously by homogeneous freezing of the remaining cloud droplets. Krämer et al. (2016) combined in situ aircraft observations with model simulations to study the CMPs associated with the two ice-origin regimes. The authors find that in situ cirrus form at higher altitudes, are optically thinner, and consist of fewer ice crystals. Liquid origin cirrus, on the other hand, are thicker clouds found at lower altitudes consisting of many ice crystals. Their study suggests that liquid origin clouds have a cooling and in situ a warming effect on the atmosphere.
Multiple other studies have adopted the classification of cirrus with respect to ice origin. For instance, Wernli et al. (2016) analyzed 12 years of ERA-Interim trajectories in the North Atlantic to identify the relative occurrence of liquid origin and in situ cirrus; Gasparini et al. (2018) compared satellite observations from the CALIPSO satellite (Hunt et al., 2009) with simulation data from GCMs to study CMPs of in situ and liquid origin cirrus. While data from active satellite instruments like CALIPSO's lidar provide an unprecedented vertically resolved global view on real cirrus clouds, the observations suffer from the long revisiting time of the satellite of 16 d, which only allows for a temporal snapshot perspective on cirrus clouds. To still approximate the ice origin of satellite-observed cirrus, Gasparini et al. (2018) used a heuristic approach to determine ice origin, in which cirrus are considered liquid origin if they extend to temperatures warmer than −35 °C. However, due to the temporal snapshot perspective, anvil cirrus and frontal cirrus are falsely classified as in situ cirrus in this approach. The above-mentioned studies all agree that liquid origin cirrus clouds occur at lower altitudes and contain more IWC and higher Nice than in situ cirrus clouds, which occur at higher altitudes and are typically thinner with less IWC and lower Nice.
Apart from studying cirrus ice origin, the relationships between meteorological and aerosol cirrus drivers and CMPs have also been studied extensively using observational data. Gryspeerdt et al. (2018) found that next to ice origin, mainly temperature, updraft by controlling supersaturation, and the aerosol environment determine the CMPs. Aerosols can influence CMPs by acting as INPs for heterogeneous freezing. In addition to temperature and particle morphology, the ability of INPs to initiate heterogeneous freezing in cirrus clouds is strongly dependent on ambient supersaturations. Recent analysis of 65 airborne relative humidity measurements at cirrus levels have shown that, both in mid-latitudes and the tropics, regions with supersaturations between the homogeneous and heterogeneous freezing thresholds exist both in cloudy and cloud-free regions (Krämer et al., 2020; Dekoutsidis et al., 2023). We refer to these conditions as INP limited, as the availability of (additional) INPs could induce heterogeneous freezing and hence increase Nice in existing clouds and also form new clouds. The frequency of such conditions is more prevalent in tropical regions below 200 K. Mineral dust is considered the most important INP in the atmosphere (Kanji et al., 2017). Kuebbeler et al. (2014) found in a GCM-based study that an increase in dust INP leads to a global reduction of ice mass and an increase of crystal size, caused by a partial switch from homogeneous to heterogeneous nucleation. The exact effect of INPs on cirrus in observed cirrus is still uncertain and difficult to study in observational data as INPs generally only represent a small subset of the overall aerosol population (Lacher et al., 2018; Forster et al., 2021), and the INP effect may be masked by other dependencies such as regional influences, meteorological conditions, and ice origin.
An additional motivation to study the impact of INPs on cirrus cloud properties is the assessment of the climate intervention method of cirrus cloud thinning (CCT), which aims at altering the radiative properties of cirrus clouds to counteract global warming. CCT was first proposed by Mitchell and Finnegan (2009), building on results by Lohmann et al. (2008) who found in a modeling study that a change of the dominant ice nucleation mechanism from homogeneous to heterogeneous nucleation leads to a large reduction of the cirrus CRE by −2.0 W m−2. The idea behind CCT is to induce a shift of the dominant nucleation mechanism by injecting INPs into cirrus regimes with the aim of producing fewer but larger ice crystals, which reflect less short-wave radiation, but more importantly trap less long-wave radiation. Storelvmo et al. (2013) simulated CCT in a global climate model and found two opposing effects. A substantial cooling effect was achieved when injecting the optimal amount of INPs into cirrus regimes, namely 18 L−1. However, at higher concentrations of injected INPs more and smaller ice crystals were observed, which resulted in a substantial warming effect. This undesirable response to CCT is termed overseeding. Multiple other studies with different global climate models and seeding strategies report a negligible cooling potential of CCT, but confirm an overseeding effect at high seeding concentrations (Penner et al., 2015; Gasparini and Lohmann, 2016; Gasparini et al., 2017; Tully et al., 2022).
Due to uncertainties in parameterizing subgrid processes, modeling studies have inherent uncertainty. Studies based on observational data can provide additional evidence to support and validate the outcome of these model studies. In this study we combine instantaneous satellite observations with Lagrangian backward trajectories of meteorological and aerosol reanalysis data on a large regional and temporal scale. With this approach, we extend the temporal snapshots obtained by satellite observations with an evolutionary perspective on cloud formation and development. Our goal is to classify observed cirrus clouds by means of their trajectories and to investigate the influence of typical formation pathways on observed cirrus CMPs. We follow a data-driven approach by using k-means clustering of Lagrangian trajectories with dynamic time warping (DTW) as a distance metric to identify typical cirrus formation regimes. Our second objective is to quantify the effect of mineral dust particle concentrations on cirrus CMPs. By identifying cirrus clouds that have formed in similar meteorological environments in mid-latitudinal and tropical regions in the first step, we are able to disentangle the influence of ice origin, meteorological conditions, and regional occurrence from the dust effect.
2.1 Data
In this work, 3 years of satellite observations of cirrus clouds is extended with Lagrangian backward trajectories of meteorological variables and aerosol properties. DARDAR (Delanoë and Hogan, 2008) and its extension DARDAR-Nice (Sourdeval et al., 2018) are widely used satellite products that provide vertically resolved retrievals for IWC and Nice. DARDAR is a synergistic product combining CloudSat's radar with CALIPSO's lidar and is hence able to penetrate through deep convective clouds, while still being sensitive to optically thin cirrus clouds. Due to the long 16 d revisiting times, DARDAR only provides temporal snapshots along its narrow satellite overpass. The locations of observed cirrus for 10 000 randomly sampled cirrus clouds, representing approximately 1 % of the dataset used in this study, are visualized as red dots in Fig. 1. The satellite overpasses are clearly detectable in the figure.
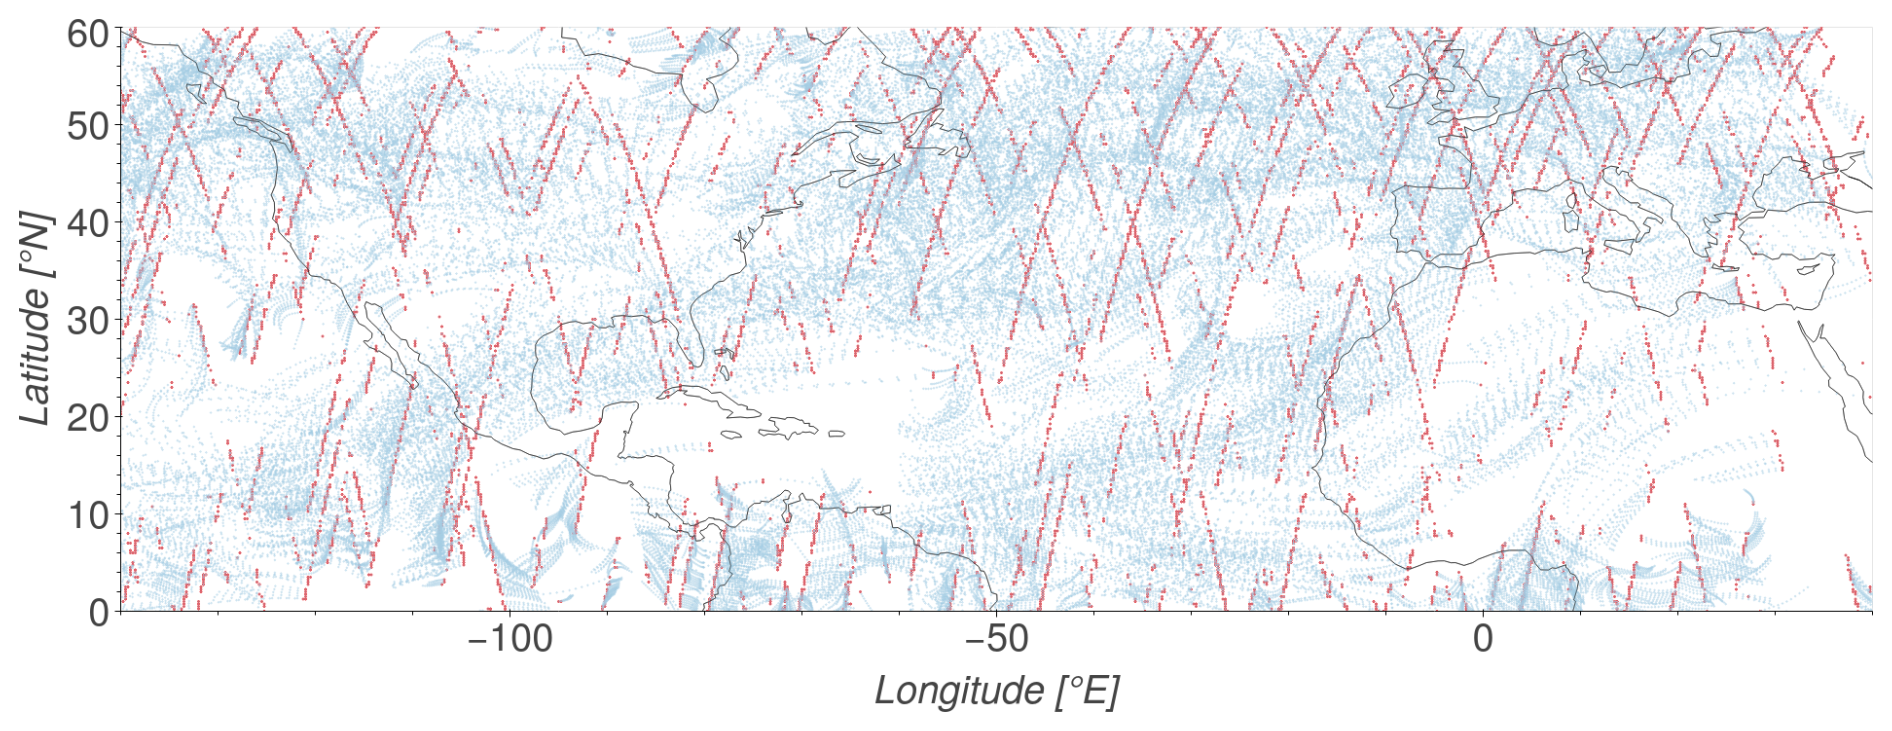
Figure 1Visualization of 10 000 randomly sampled cirrus cloud observations in the study domain (red dots) with their corresponding 12 h Lagrangian backward trajectories (blue dots). For visualization purposes only the trajectories of the cloud top layers are shown.
To add a notion of temporal development to observed cirrus clouds, Lagrangian trajectories are calculated 12 h back in time based on hourly wind fields using LAGRANTO (Sprenger and Wernli, 2015) for each grid point containing an observed cirrus cloud. Hereby, a grid point is considered to contain a cirrus cloud if IWC >0 and °C. Since LAGRANTO calculates trajectories based on ERA5 wind fields (Hersbach et al., 2018), DARDAR cirrus observations are first regridded onto the ERA5 grid of 0.25° × 0.25° and a vertical resolution of 300 m, which approximately corresponds to the model layer thickness in ERA5 at cirrus altitudes. After regridding, only grid points with a fractional cloud cover >0.1 are considered to be cirrus cloud observations. Blue dots in Fig. 1 mark the trajectories for 10 000 randomly sampled cirrus (red dots). We trace temperature from ERA5 along the trajectories. Cloud properties available from ERA5 are intentionally omitted in this work, since IWC is substantially underestimated compared to DARDAR, especially in the cirrus regime (Duncan and Eriksson, 2018). The data source for dust concentration is the MERRA2 (Buchard et al., 2017; Gelaro et al., 2017) reanalysis product, which contains data for dust aerosols in five size bins. For this study we aggregate the four size bins with radii >1 µm into a single super-micron size bin. Given that larger particles are more likely to act as INPs (Kanji et al., 2017), we use the super-micron dust bin as proxy for dust particle concentration for this study. In order to trace MERRA2 data along the ERA5 trajectory, the data is regridded to the spatiotemporal resolution of ERA5 data. MERRA2 was chosen as a data source for aerosol concentration in this study as it has been shown to better represent aerosol properties than the CAMS reanalysis product (Benedetti et al., 2009; Inness et al., 2019) when compared to remote sensing observations (Gueymard and Yang, 2020; Gandham et al., 2022).
In this study, we define cirrus clouds as all clouds with a cloud-top temperature colder than −38 °C. This definition includes, for example, the top part of deep convective cores, which are not classified as cirrus clouds in some other studies. However, our clustering approach, based on backward trajectory reanalysis data, aims to capture all evolutionary stages of cirrus clouds. Therefore, we adopt this broad definition. For the remainder of this study, we refer to a cirrus cloud as all consecutive vertical layers in a DARDAR observation containing IWC >0 mg m−3 and located at °C, instead of considering each vertical level separately. This approach enables a more holistic view on the whole cloud. In order to also get a holistic view of the history for each cloud, while ensuring comparability between clouds, we define the meteorological history of a cloud by its 12 h temperature evolution along the trajectories starting at cloud top and cloud base. Correspondingly, we consider the dust particle concentration along the trajectory starting at cloud center. Figure 2 visualizes these trajectories for seven randomly sampled cirrus clouds.
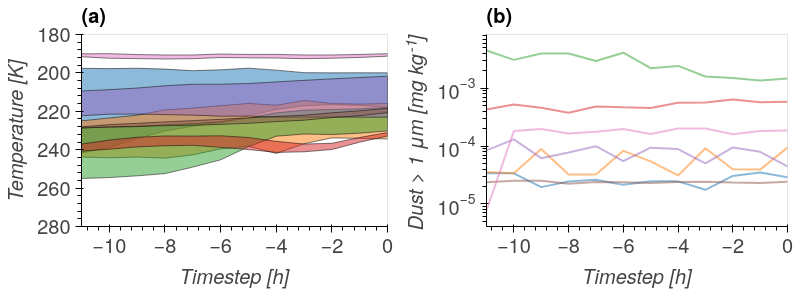
Figure 2Lagrangian backward trajectories of seven randomly sampled cirrus clouds. The clouds are observed at time step t=0, from which the Lagrangian trajectories are calculated backwards in time. Each color represents trajectories for a single cloud across the three panels. Panel (a) shows temperature along trajectories starting from cloud top and cloud base of observed cirrus; panel (b) shows concentration of dust particles with radii >1 µm along the trajectory at the cloud center. Note that for clouds extending to °C, the cloud base is defined as the last layer with °C at t=0.
The domain of this study is defined from 140° W to 40° E and 0 to 60° N, and contains data from 2007–2009. The chosen domain covers a wide range of climatological regimes and surface types, and can be considered representative for tropical and mid-latitudinal regions, where cirrus clouds occurring at latitudes ≤30° N are considered tropical and cirrus clouds occurring at latitudes >30° N are considered mid-latitudinal. The dataset contains 1.1 million cirrus cloud observations with 7.2 million separate cloud layers, for each of which a 12 h Lagrangian backward trajectory has been calculated. As cirrus clouds typically do not persist more than 12 h (Lohmann et al., 2016), it can be assumed that the observed cirrus clouds have formed within the time frame of the 12 h trajectories. This is also in line with Jeggle et al. (2023), who found that the last 15 h of a trajectory contain all the information for predicting cirrus cloud properties.
2.2 Trajectory clustering
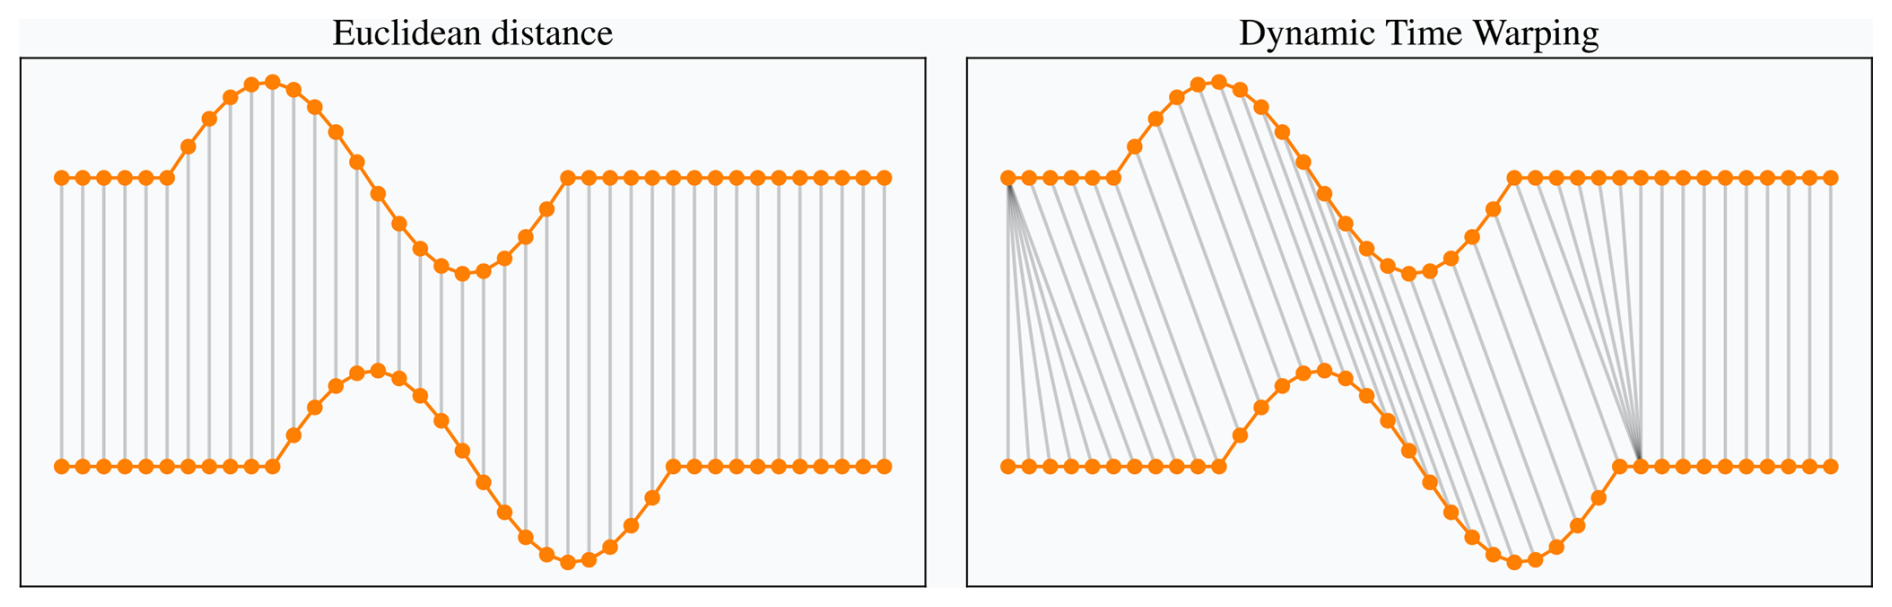
To identify different formation regimes of cirrus clouds in our dataset, we follow a data-driven approach by applying k-means clustering using dynamic time warping (DTW) as a distance metric (Sakoe and Chiba, 1978). The algorithm separates time series (i.e., Lagrangian backward trajectories) into k clusters, where similar trajectories are grouped together in the same cluster. Instead of using point-to-point comparisons to calculate the similarity between time series using Euclidean distance, we apply DTW to account for time shifts in the backward trajectories. DTW is a similarity measure that calculates the Euclidean distance on temporally aligned time series, aiming at an improved similarity assessment compared to a point-to-point comparison. Figure 3 visualizes the differences between standard Euclidean distance and DTW. In both cases the calculated similarity is the sum of distances between matched points. It can be seen that DTW is invariant to the temporal shift of the two time series by aligning the sinusoidal pattern of the two time series along the temporal axis. We use the Python library tslearn (Tavenard et al., 2020) for the k-means clustering of time series with DTW and refer to its documentation for further details.
To improve the readability of this paper, the following nomenclature is defined:
-
Temperature trajectory. This is the ERA5 temperature along a Lagrangian trajectory (as shown in Fig. 2a).
-
Dust trajectory. This is the MERRA2 dust concentration along a Lagrangian trajectory (as shown in Fig. 2b).
-
Trajectory start. This is the starting point of a Lagrangian backward trajectory, i.e., t=0. At this point a DARDAR cirrus cloud observation is available.
In a first step, temperature trajectories starting at cloud top and cloud base are clustered, resulting in kT clusters per region, which are associated with respect to their ice origin. For instance, if both cloud top and cloud base trajectories remain at temperatures below −38 °C, the cluster can be considered to be formed in situ in the ice phase. Given the assumption that an air parcel's history containing a cirrus cloud provides information about the cloud formation and development mechanisms, our approach allows an analysis of observed cloud snapshots with respect to their formation history, which was formerly only possible for model and reanalysis data. Cirrus formation regimes may differ depending on the region in which they occur, and we analyze the results of the clustering for tropical cirrus and mid-latitudinal cirrus separately. By grouping cirrus of similar temperature pathways, the meteorological dependence of cirrus CMPs (IWC, Nice) can be disentangled from aerosol–cloud interactions.
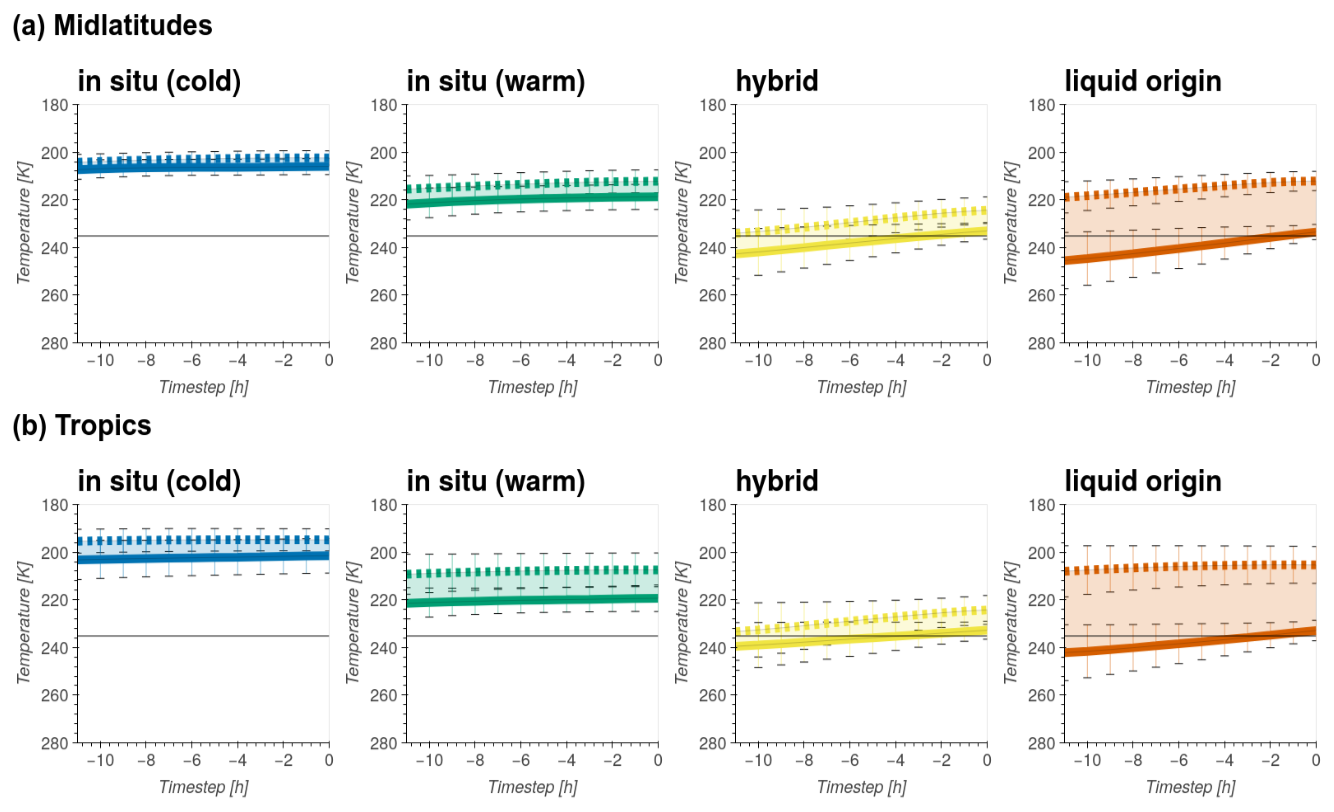
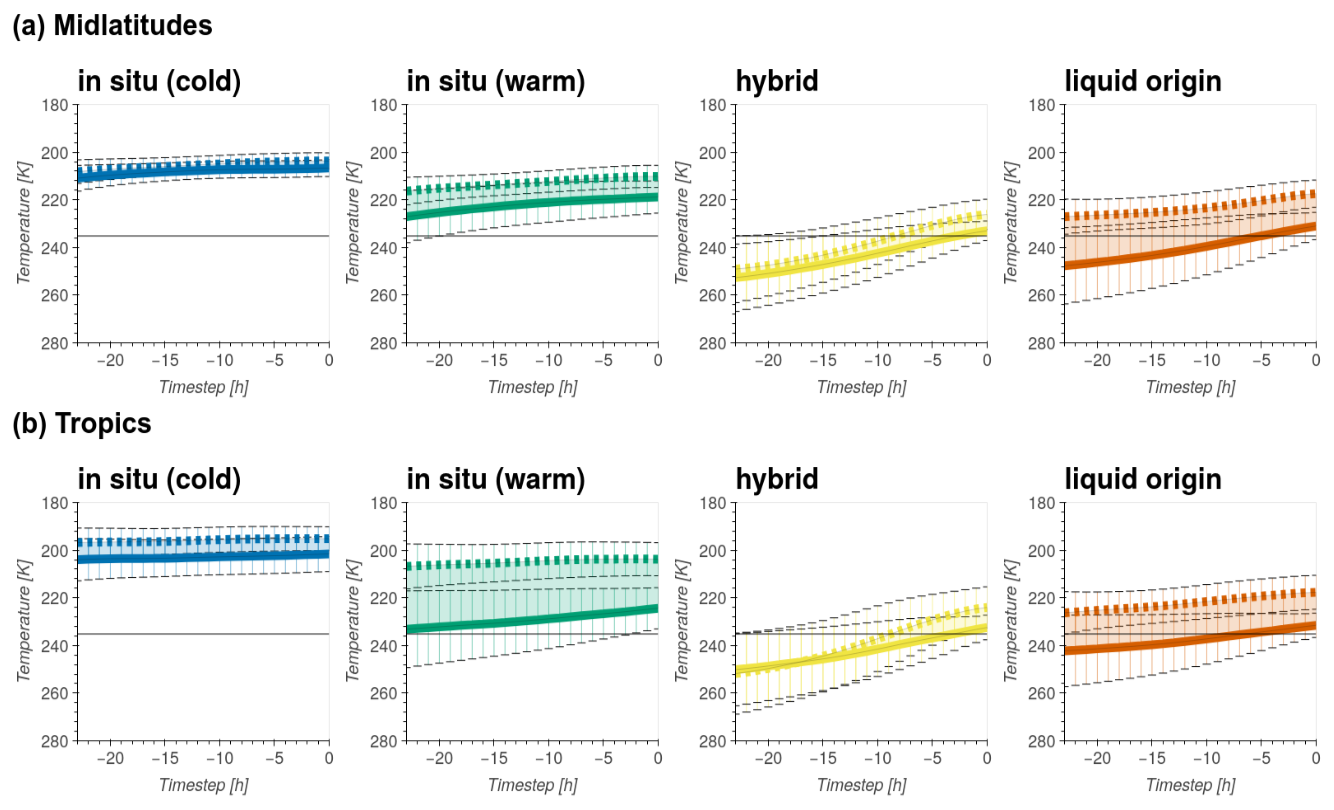
Figure 4Mean temperatures along 12 h backward trajectories for four identified clusters of cirrus clouds in the (a) mid-latitudes and (b) tropics; t=0 indicates the starting point of the backward trajectories, that is, the DARDAR-observed cirrus clouds. Dashed lines indicate trajectories at cloud top and solid lines trajectories at cloud base. The error bars represent the standard deviations at each time step. The horizontal black line at 235 K marks the homogeneous freezing threshold, and hence the shift from the mixed-phase to the cirrus regime.
2.3 Dust effect quantification
To estimate the sensitivity of IWC and Nice in the identified formation regimes, a multivariate linear regression model is fitted for both variables in each formation regime. The required input to a linear regression is a single data point rather than a time series (i.e., dust along trajectory), which is why we take the dust particle concentration at the time of cirrus cloud observation (t=0) as a proxy for the dust concentration along the trajectory. The small mean standard deviation of 0.14 log mg kg−1 along trajectories supports the validity of this simplifying assumption. We are interested in analyzing possible distribution shifts of cirrus CMPs caused by varying dust particle concentrations, rather than the effect of dust on individual clouds. Hence, we create dust concentration bins with a width of of an order of magnitude and calculate median IWC and Nice values, which are used as target variables for the regression. The width of the dust concentration bins is chosen to account for relatively small variations in dust concentrations while guaranteeing a sufficient number of cirrus observations per bin.
Despite having reduced the dependence of cloud ice properties on the formation regime and meteorological conditions through the trajectory clustering, it is still necessary to adjust for meteorological dependencies within each cluster. Therefore, in addition to dust concentration as a regressor, temperature (T) and large-scale vertical velocity (ω) at the time of the observation (t=0) are also used as regressors, resulting in the following multivariate linear regression equations:
Once fitted and the significance of the regression coefficients is tested (p<0.05), the coefficients for “Dust” can be interpreted as the sensitivity of IWC and Nice to a unit change in the concentration of dust. Note that throughout this study a unit change in dust concentration corresponds to a change of one order of magnitude, as we use log-transformed concentrations.
By clustering the temperature trajectories as described in Sect. 2.2, four distinct trajectory pathways can be identified. We refer to Appendix A for a discussion on the choice of k clusters. Each cirrus cloud in the dataset is assigned to the cluster with the minimum distance of its temperature trajectory at cloud top and cloud base. Figure 4 shows the mean temperature trajectories of cirrus clouds belonging to the four clusters for cirrus clouds in the mid-latitudes (Fig. 4a) and tropics (Fig. 4b). Given the characteristics of the trajectories, the clusters are named according to their ice origin. We identify two clusters for which the temperatures remain below 235 K along the whole 12 h trajectory. Assuming that the observed cirrus at t=0 formed at any point in the 12 h prior to its observation, we are confident that cirrus belonging to these clusters formed directly in the ice phase, i.e. in situ. Based on the temperature differences, the clusters are named in situ (cold) (blue color) and in situ (warm) (green color). Both in situ clusters are characterized by a negligible temperature decrease along the trajectory with cloud top temperatures ∼190 K for cirrus clouds of the in situ (cold) cluster and ∼205 K for cirrus clouds of the in situ cluster in the tropics. Due to the increased height of the tropopause in the tropics, in situ origin cirrus can occur at higher altitudes, resulting in a shift to colder temperatures of the mean cloud top temperatures of approximately 15 K compared to the mid-latitudes. The third cluster (yellow color) may contain both in situ and liquid origin cirrus, given that its trajectory is gradually surpassing the homogeneous freezing temperature threshold of 235 K. Whether clouds belonging to this cluster have formed in situ or have ascended from the mixed phase depends on the time of cloud formation. Since the moment of cloud formation is unknown, and hence the ice origin is ambiguous, this cluster is named hybrid. The temperature trajectories and cloud vertical extent of the remaining cluster suggest that cirrus clouds belonging to this formation regime are likely to have formed in the mixed-phase regime. Thus, this cluster is named liquid origin (orange color). Figure 5 visualizes the absolute occurrence of cirrus clouds in the dataset that belong to each cluster for both mid-latitudes and tropics. In the tropics, cirrus clouds are fairly equally distributed between the four clusters, whereas in the mid-latitudes there are almost no in situ (cold) (2 %) cirrus and half of the cirrus clouds belong to the hybrid regime.
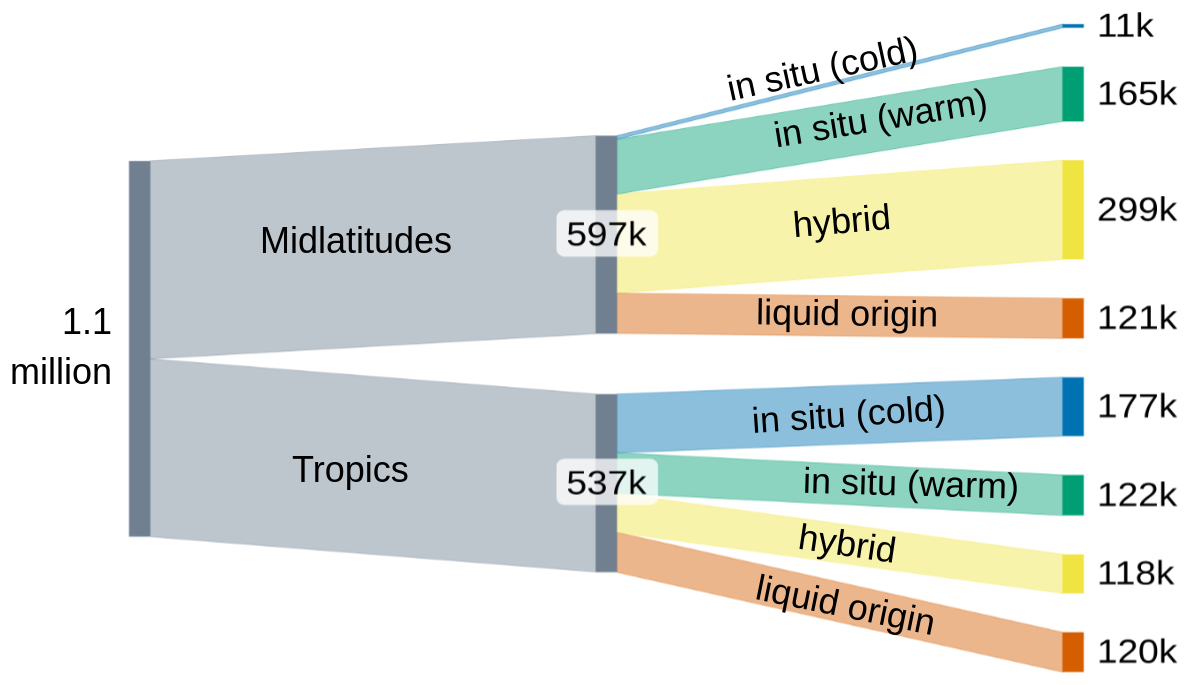
Figure 5Sankey plot visualizing the classification of 1 134 000 cirrus cloud observations into formation regimes based on k-means clustering of Lagrangian trajectories. The number of clouds contained in each cluster is proportional to the thickness of each link in the Sankey diagram and is also displayed at each node. In a first step cirrus clouds are divided by region; next, reanalysis trajectories are clustered by temperature pathways. Temperature trajectories are named with respect to the ice origin of the corresponding cirrus clouds.
Figure 6 visualizes the spatial distribution of cirrus clouds belonging to each cluster in the study domain. Cirrus clouds of the in situ (cold) cluster occur almost exclusively in the ITCZ, cirrus in the in situ (warm) and liquid origin clusters also occur often in the ITCZ, but also in the northern Atlantic and Europe. A majority of cirrus belonging to the hybrid cluster occur at latitudes 40–60° N.
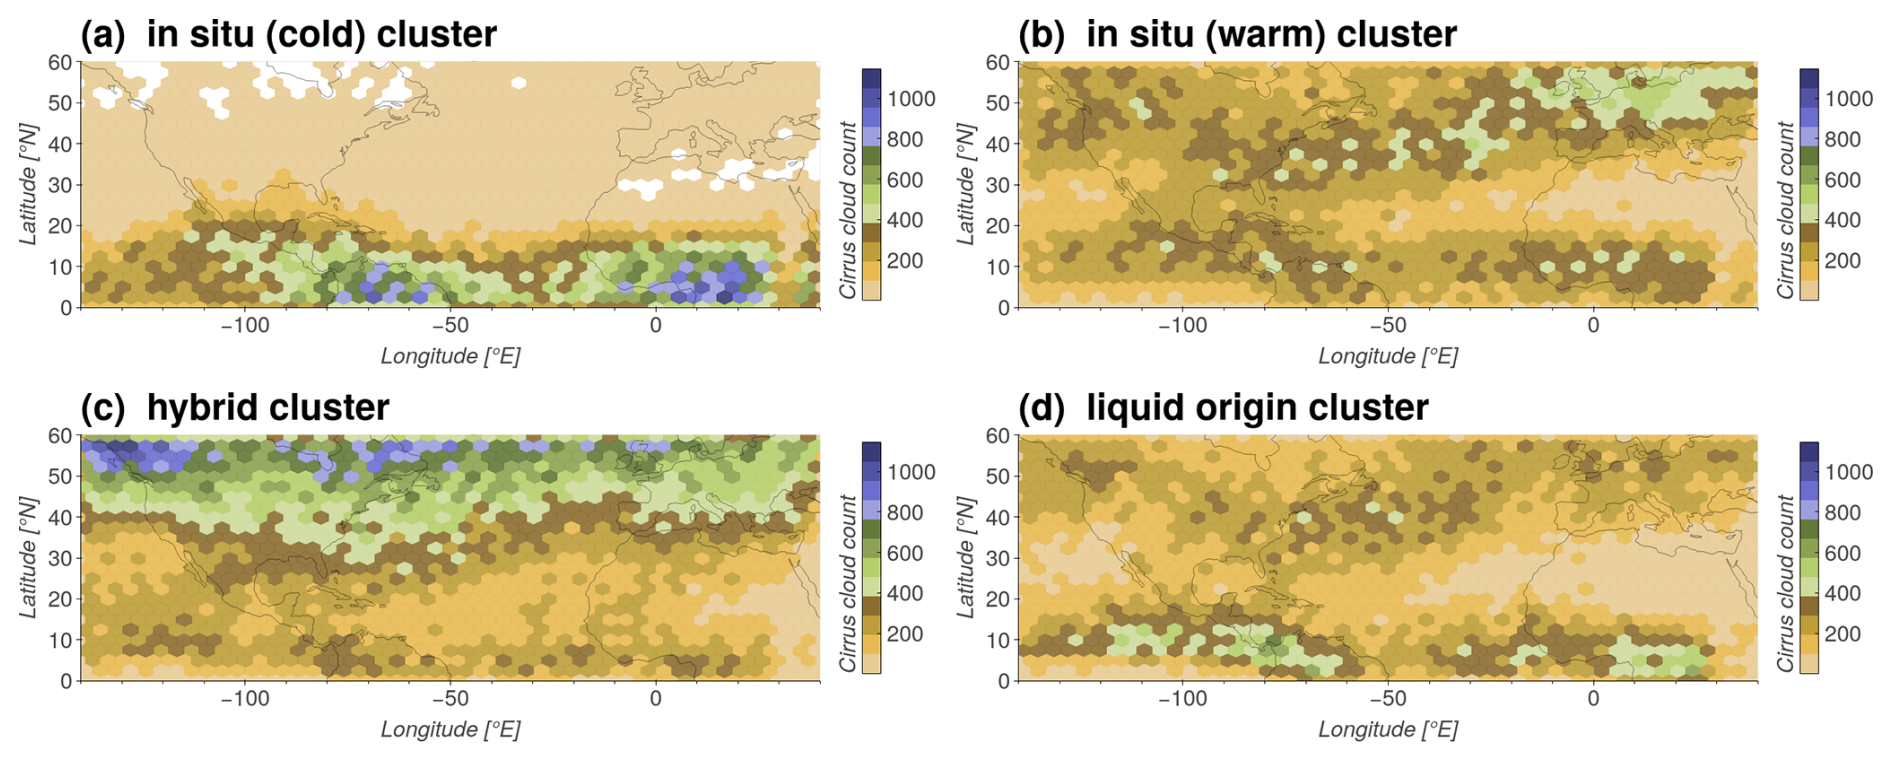
Figure 6Occurrence of observed cirrus clouds for each temperature trajectory cluster on a 2.5° × 2.5° grid for the years 2007–2009.
Cirrus cloud properties are typically characterized as a function of temperature, hence we analyze and compare the temperature dependence of the observed cloud ice properties for the identified temperature trajectory clusters. Figure 7 shows the median values of IWC (Fig. 7a, c) and Nice (Fig. 7b, d) for 1 K temperature bins for each cluster as well as the median values for all clouds (dashed black line). Consistent with Krämer et al. (2016), we observe higher IWC for liquid origin cirrus compared to in situ cirrus with an increasing spread at higher temperatures, which means that the effect of ice origin on cirrus CMPs decreases with temperature and therefore altitude. At 220 K, for instance, liquid origin cirrus have a median IWC that is twice as large compared to median in situ cirrus, in both the tropics and mid-latitudes. Notably, median IWC values are decreasing for in situ cirrus at temperatures >215 K in the mid-latitudes. We assume that updrafts for cirrus in this temperature regime are too small to nucleate new ice crystals, leading to the reversal of the normally positive IWC–temperature dependence. Low median Nice values (<0.05 cm−3; Fig. 7b) support this hypothesis.
The same effect can be observed in a weaker form in the tropics. Generally, a stronger positive IWC–temperature dependence can be observed for cirrus of liquid origin, while in situ cirrus exhibit a stronger negative Nice–temperature dependence. The relative temperature dependence is quantified in Table 1 as the relative change in median IWC and Nice values for cirrus occurring at 210 K compared to cirrus occurring at 220 K. Nice decreases by 52 % (43 %) between 210 and 220 K for in situ (warm) cirrus in the mid-latitudes (tropics), probably due to a scarcity of INPs at higher temperatures. Liquid origin cirrus clouds have a 5 (10) times lower dependency of Nice on temperature compared to in situ cirrus clouds. As liquid origin cirrus clouds form by glaciating cloud droplets of mixed-phase clouds that are lifted to the cirrus temperature regime, it cannot necessarily be expected to observe larger ice crystal concentrations with decreasing temperatures. The fact that Nice is increasing with decreasing temperatures for liquid origin clouds (although only slightly) suggests that the nucleation of new ice crystals through INPs enabled heterogeneous or homogeneous freezing of solution droplets triggered by cloud top cooling (Hartmann et al., 2018) or gravity waves (Kim et al., 2016; Chang and L'Ecuyer, 2020; Atlas and Bretherton, 2023). Another possible explanation for the negative temperature dependence of Nice for liquid origin cirrus clouds is that clouds observed at warmer temperatures are aged clouds (e.g., aged anvil cirrus) that have sedimented to lower (i.e., warmer) altitudes (Doswell, 1985). Since we do not have information about the time of cloud formation, it is impossible to disentangle the effects described.
Cirrus clouds belonging to the in situ (cold) cluster occur in a narrow temperature band below ∼210 K. Cirrus clouds of this cluster are characterized by the lowest IWC and Nice median values at any given temperature. Clouds belonging to the hybrid cluster sit in the middle between liquid origin and in situ clusters, supporting the hypothesis that both in situ and liquid origin cirrus clouds belong to this cluster.
Table 1Relative change of IWC and Nice median values from 210 to 220 K for in situ (warm) and liquid origin clusters for cirrus in tropics and mid-latitudes.
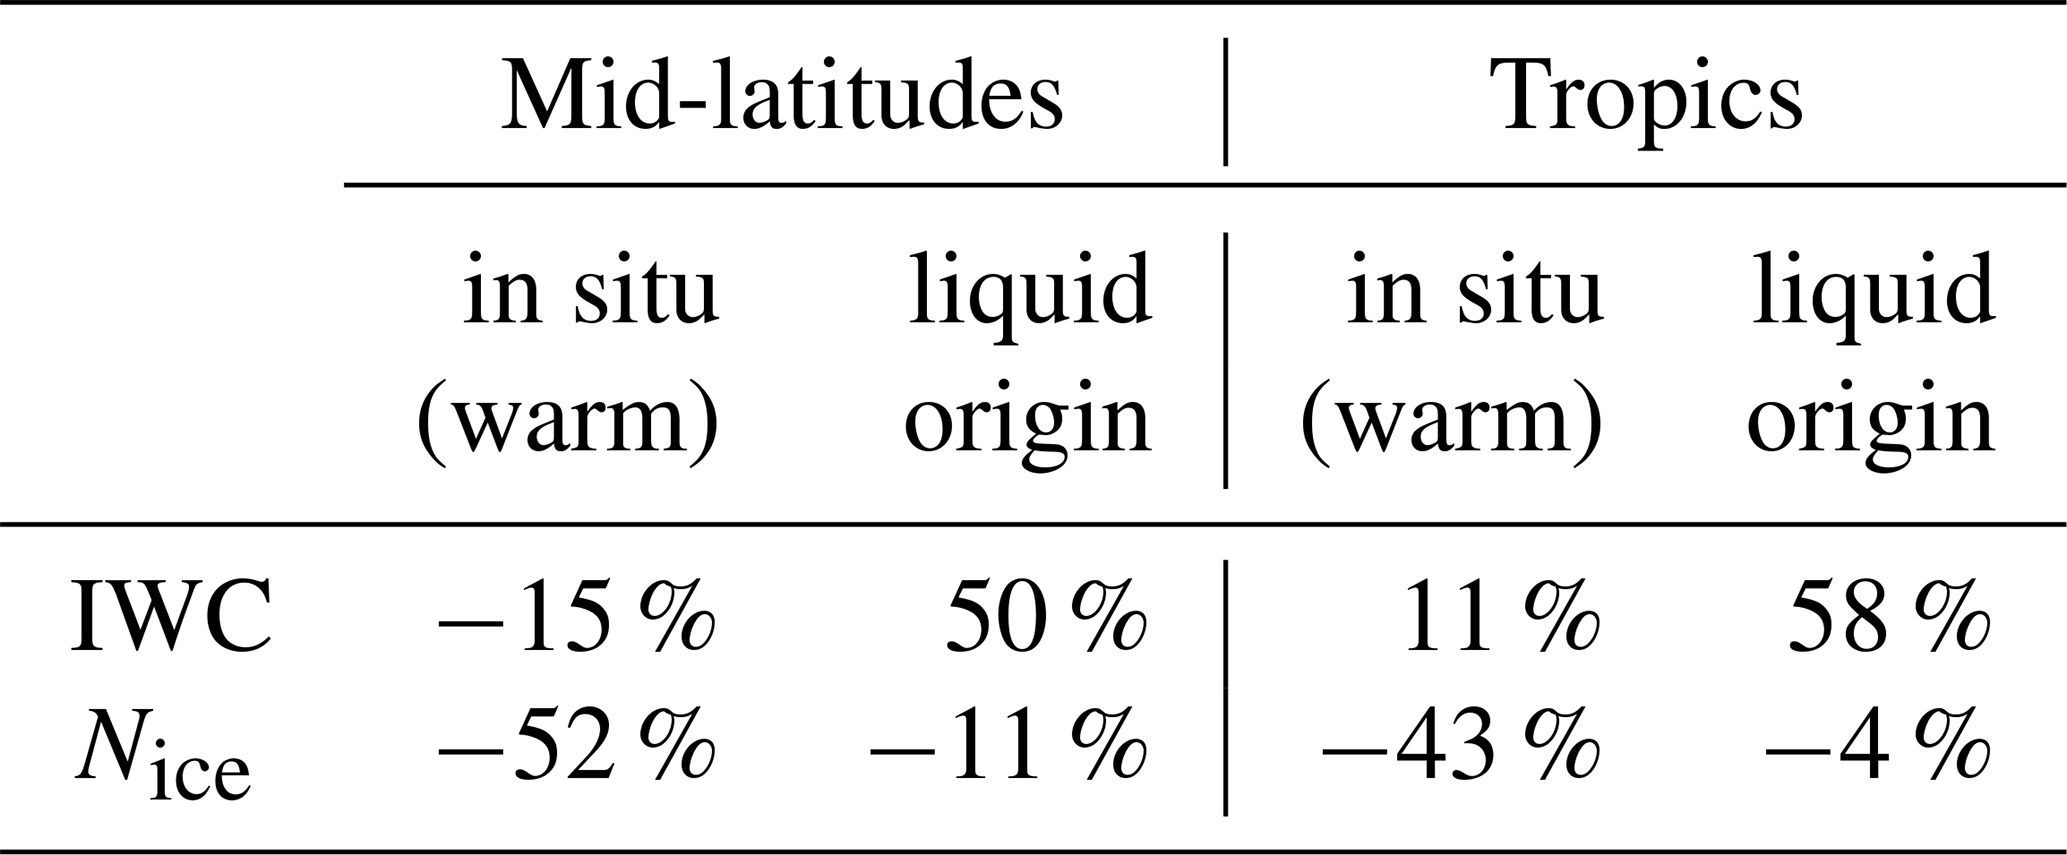
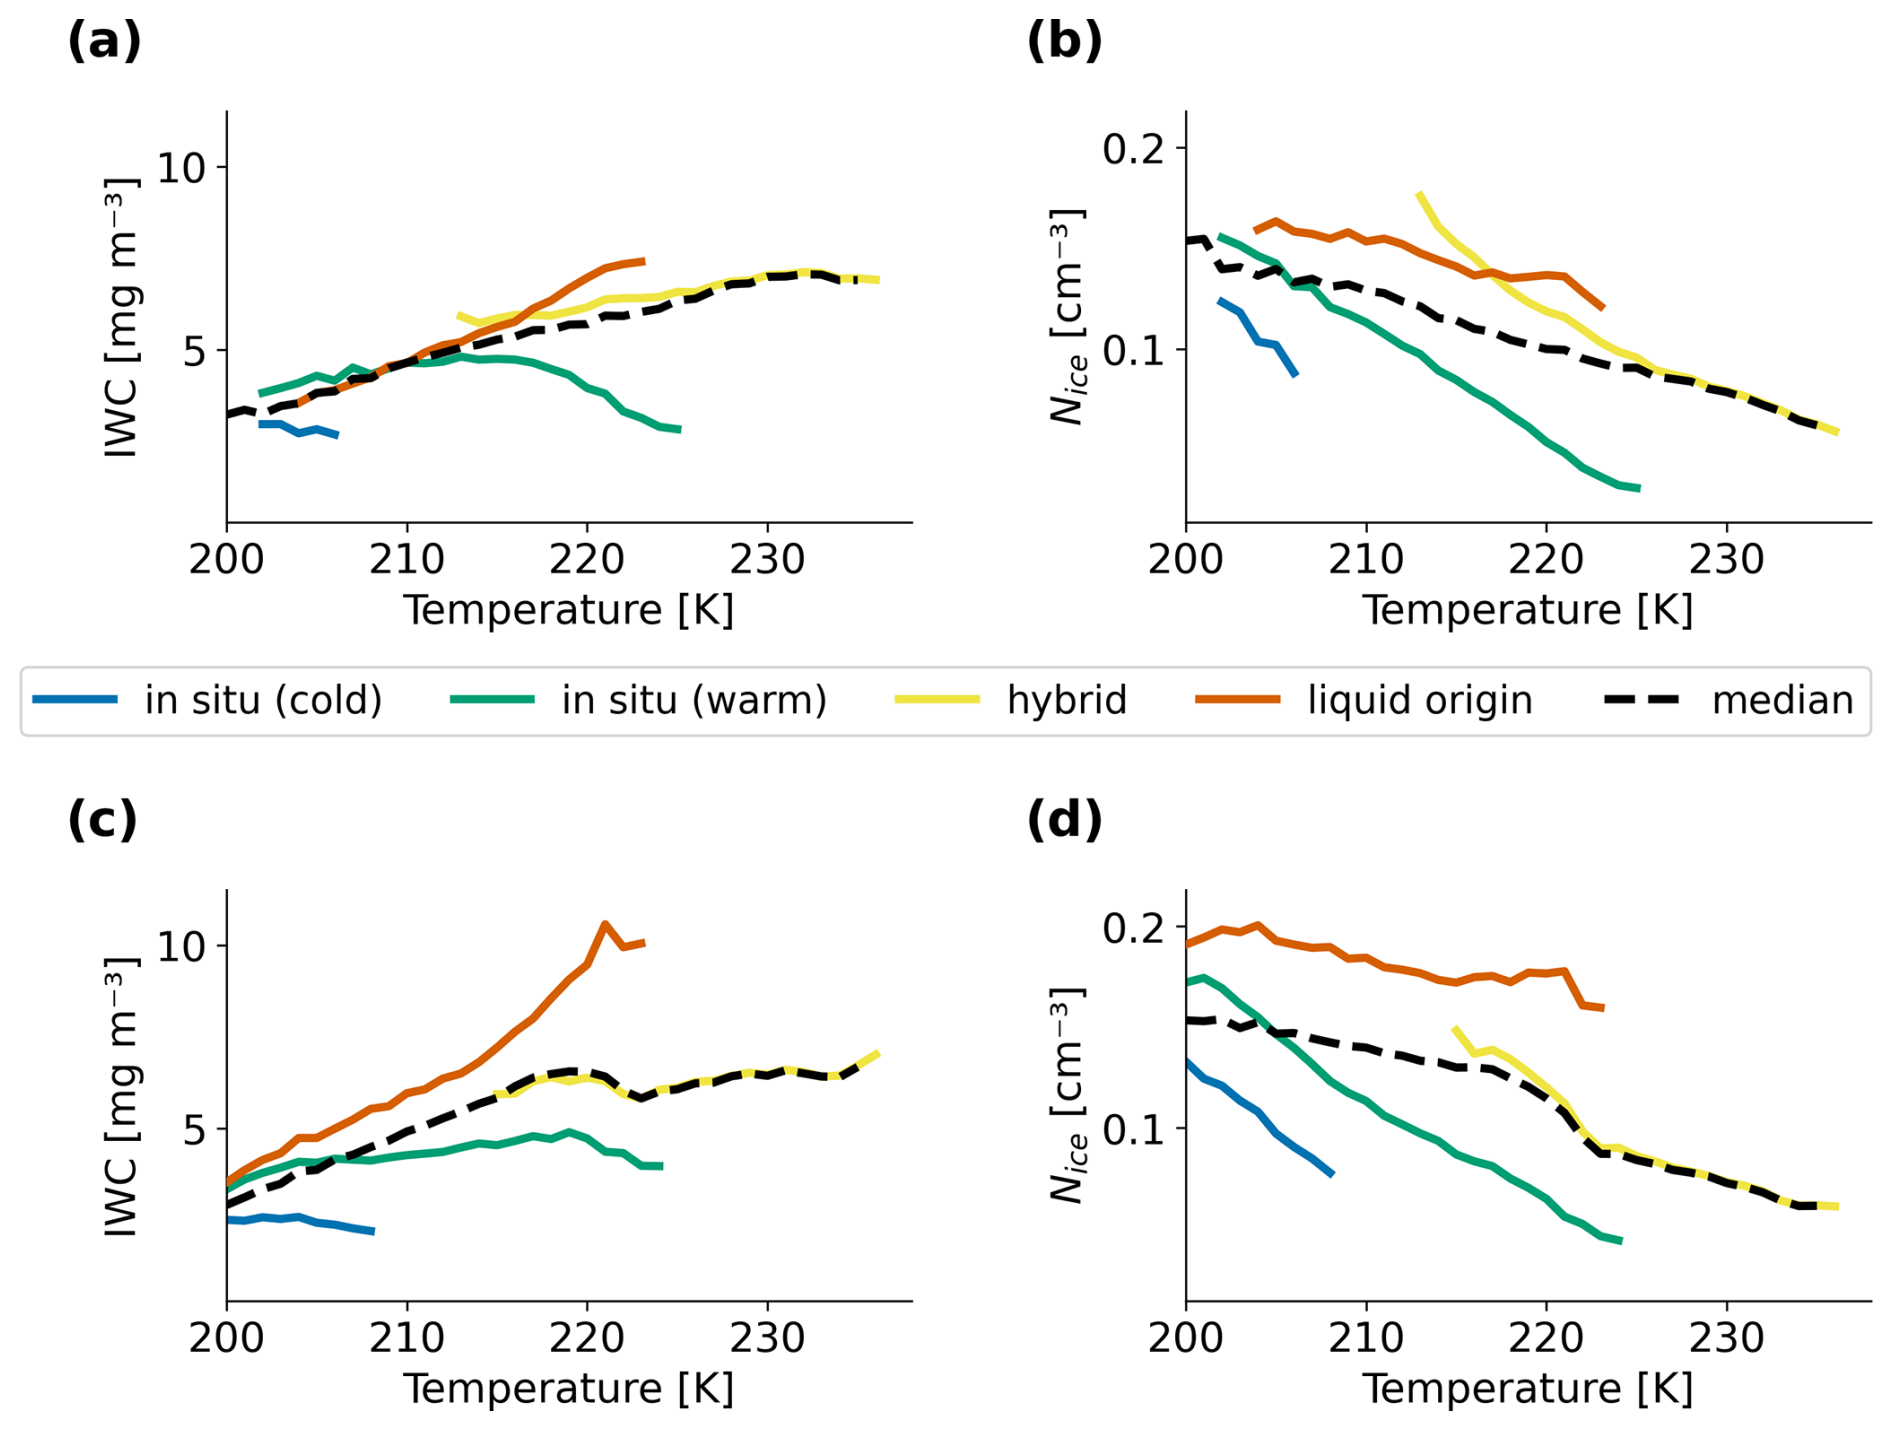
Figure 7Median IWC (a) and Nice (b) in cloud layers with a distance to cloud top < 600 m of temperature trajectory clusters calculated for 1 K temperature bins in the mid-latitudes. (c) and (d) are analogous for the tropics. The dashed black lines represent the median value for cirrus clouds in a given region. Median values are shown for 1 K temperature bins containing > 2500 cirrus cloud observations. The temperatures represent the ERA5 temperature at the trajectory start points (t=0).
Our goal is to isolate the effect of dust on cirrus cloud properties from other dependencies such as temperature and formation regime. By classifying cirrus into different trajectory clusters, we can analyze the effect of dust on cirrus clouds for different cloud regimes and at the same time reduce the effect of ice origin on IWC and Nice. Figure 8d and h show the distributions of dust particle concentration for the different temperature trajectory clusters for mid-latitudes and tropics, respectively. It can be seen that the dust concentration distributions span four orders of magnitude. Figure 8a, b, e, and f show median IWC and Nice as a function of dust particle concentration. Following the approach described in Sect. 2.3, we analyze whether the amount of available dust has an influence on observed cirrus CMPs. While clouds in the same regime occur at similar meteorological conditions, there is still a spread in both temperature and vertical velocity. As dust concentrations generally decrease with height, and therefore temperature (Fig. 8c, g), and cloud ice properties are functions of temperature (Fig. 7), the remaining meteorological effect must be taken into account when considering the influence of dust on the CMPs of cirrus.
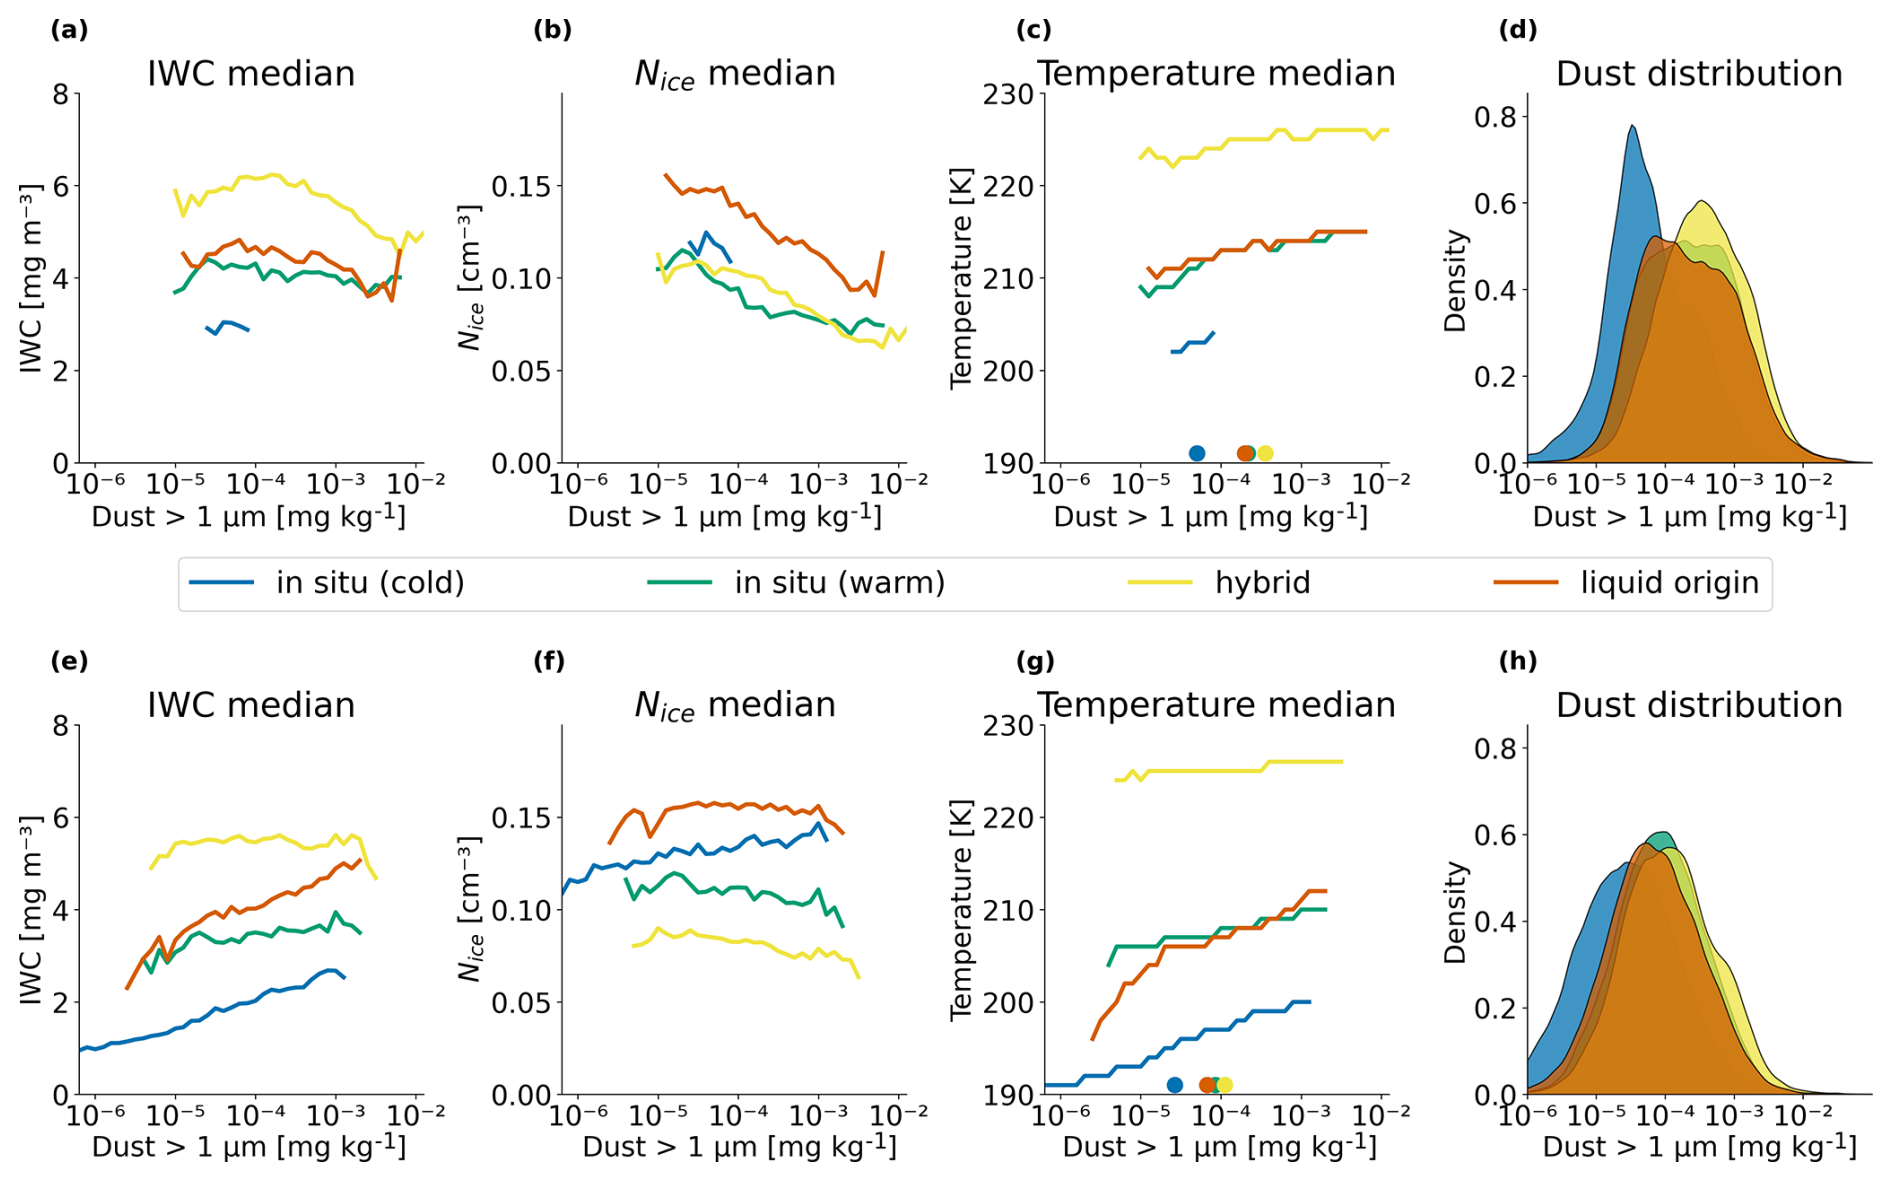
Figure 8Median IWC (a), Nice (b), and temperature values (c) for given dust bins in the mid-latitudes in cloud layers within 325 m of cloud top. Each dust concentration bin represents of an order of magnitude. Median values are shown for data points with > 1000 cirrus cloud observations per dust bin. Filled circles in panel (c) mark the median dust particle concentration per cirrus cluster. Panel (d) shows the density plot of dust particle concentration for different cirrus clusters in the mid-latitudes. Panels (e)–(h) are the same plots for tropical cirrus clouds.
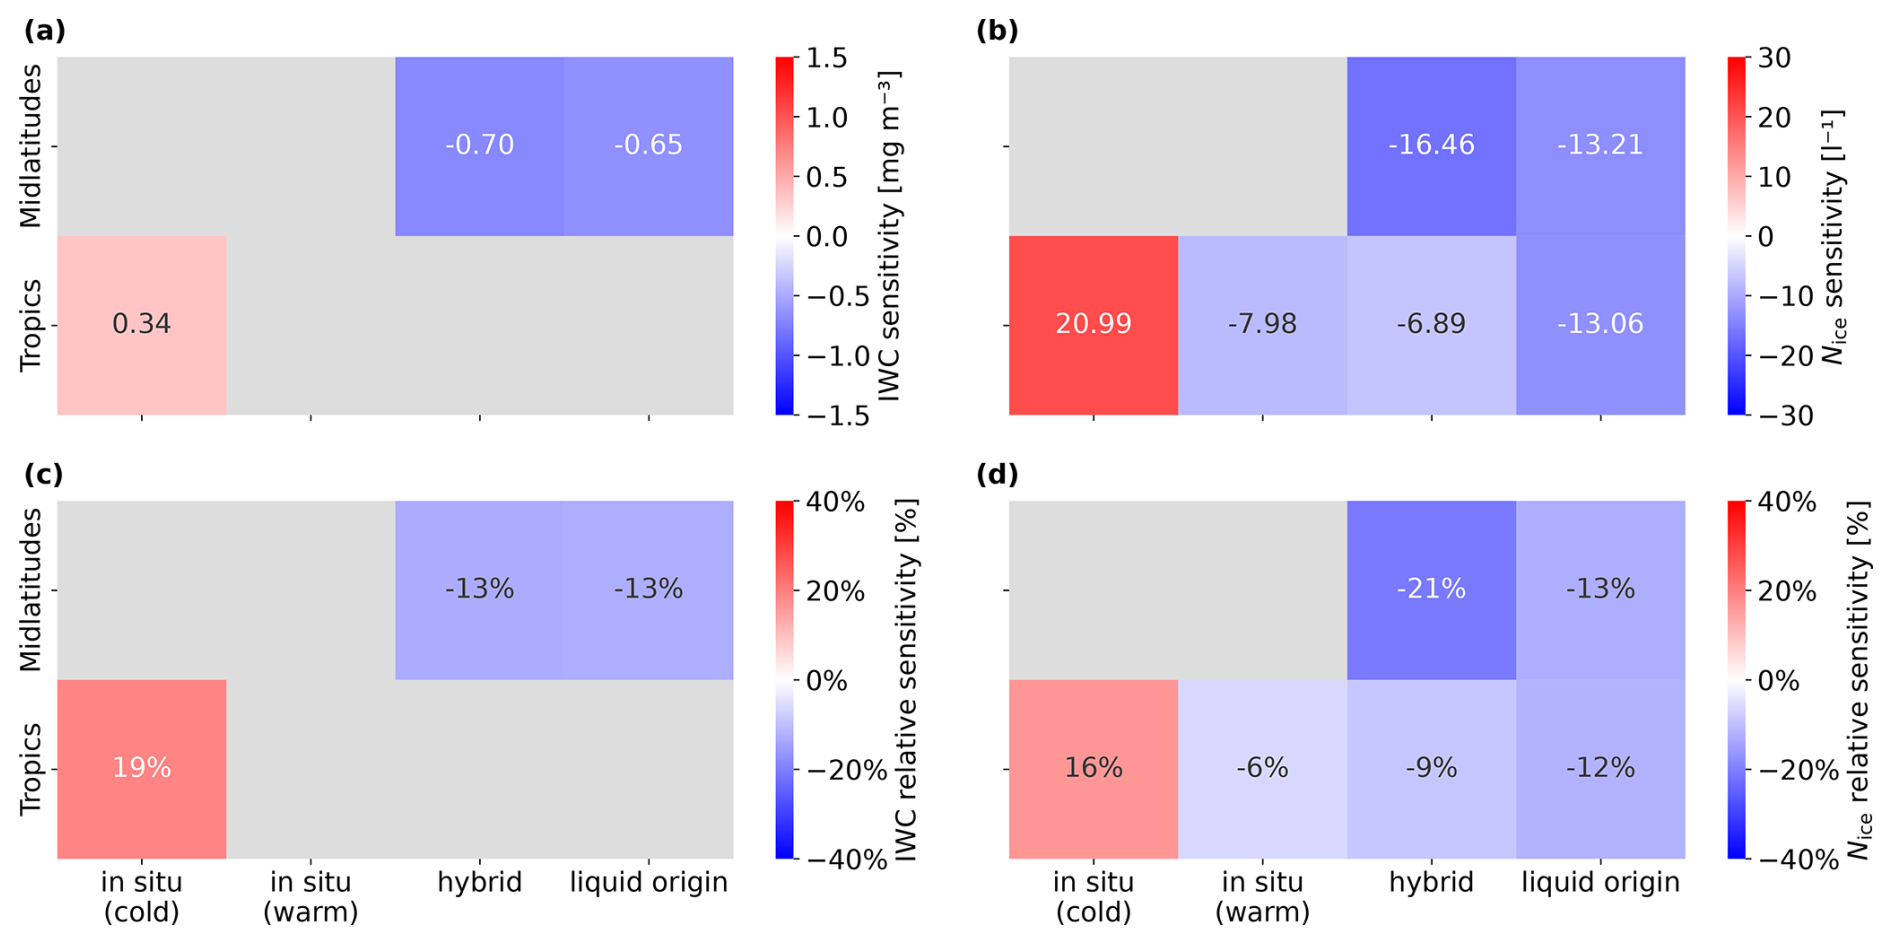
To account for the remaining dependency of cirrus properties on temperature and vertical velocity, we conduct a multivariate regression onto median IWC and Nice values with temperature, vertical velocity, and dust concentration as regressors (see Eqs. 1 and 2). Since ice nucleation occurs at cloud top, we expect the largest effect of dust acting as INPs close to cloud top and hence use data from the cloud top layer in the regression. Figure 9a and b show the regression coefficient for dust (β3 in Eq. 2) in the regression onto IWC and Nice, respectively. The regression coefficients can be interpreted as the sensitivity of the median values of IWC and Nice to a unit change in dust particle concentration. Gray fields in Fig. 9 indicate that the dust concentration did not have a significant effect on the target variable (p<0.05). Panels c and d show the sensitivity of IWC and Nice to dust as a percentage of the median IWC and Nice values.
As expected, Nice is generally more sensitive to the amount of dust aerosol than IWC, with all regression coefficients except for the two in situ cirrus clusters in the mid-latitudes being significant. An increased availability of dust aerosols can lead to a regime shift from homogeneous freezing of solution droplets or cloud droplets to heterogeneous freezing catalyzed by the availability of INPs in the form of dust aerosols. Depending on the region and formation regime, this regime shift leads to a decrease in Nice of between 6 % and 15 %, which results in an increase in ice crystal size. The effect is strongest in the mid-latitudes for cirrus clouds of the hybrid and liquid origin regimes. Due to the sedimentation of larger ice crystals, the regime shift in the ice nucleation mechanism can lead to a reduction of IWC, as can be observed for cirrus clouds in the hybrid and liquid origin regimes in the mid-latitudes. For liquid origin cirrus the suppression of homogeneous ice nucleation by heterogeneous ice nucleation occurs with a temporal delay. Increased availability of INPs leads to an increase of heterogeneous ice nucleation while the cloud is still in the mixed-phase regime. This leads to a growth of ice crystals at the expense of cloud droplets via the Wegener–Bergeron–Findeisen process (Wegener, 1911), or even full glaciation of the cloud at temperatures °C and ultimately resulting in less homogeneous ice nucleation and thus fewer ice crystals at cirrus temperatures ( °C).
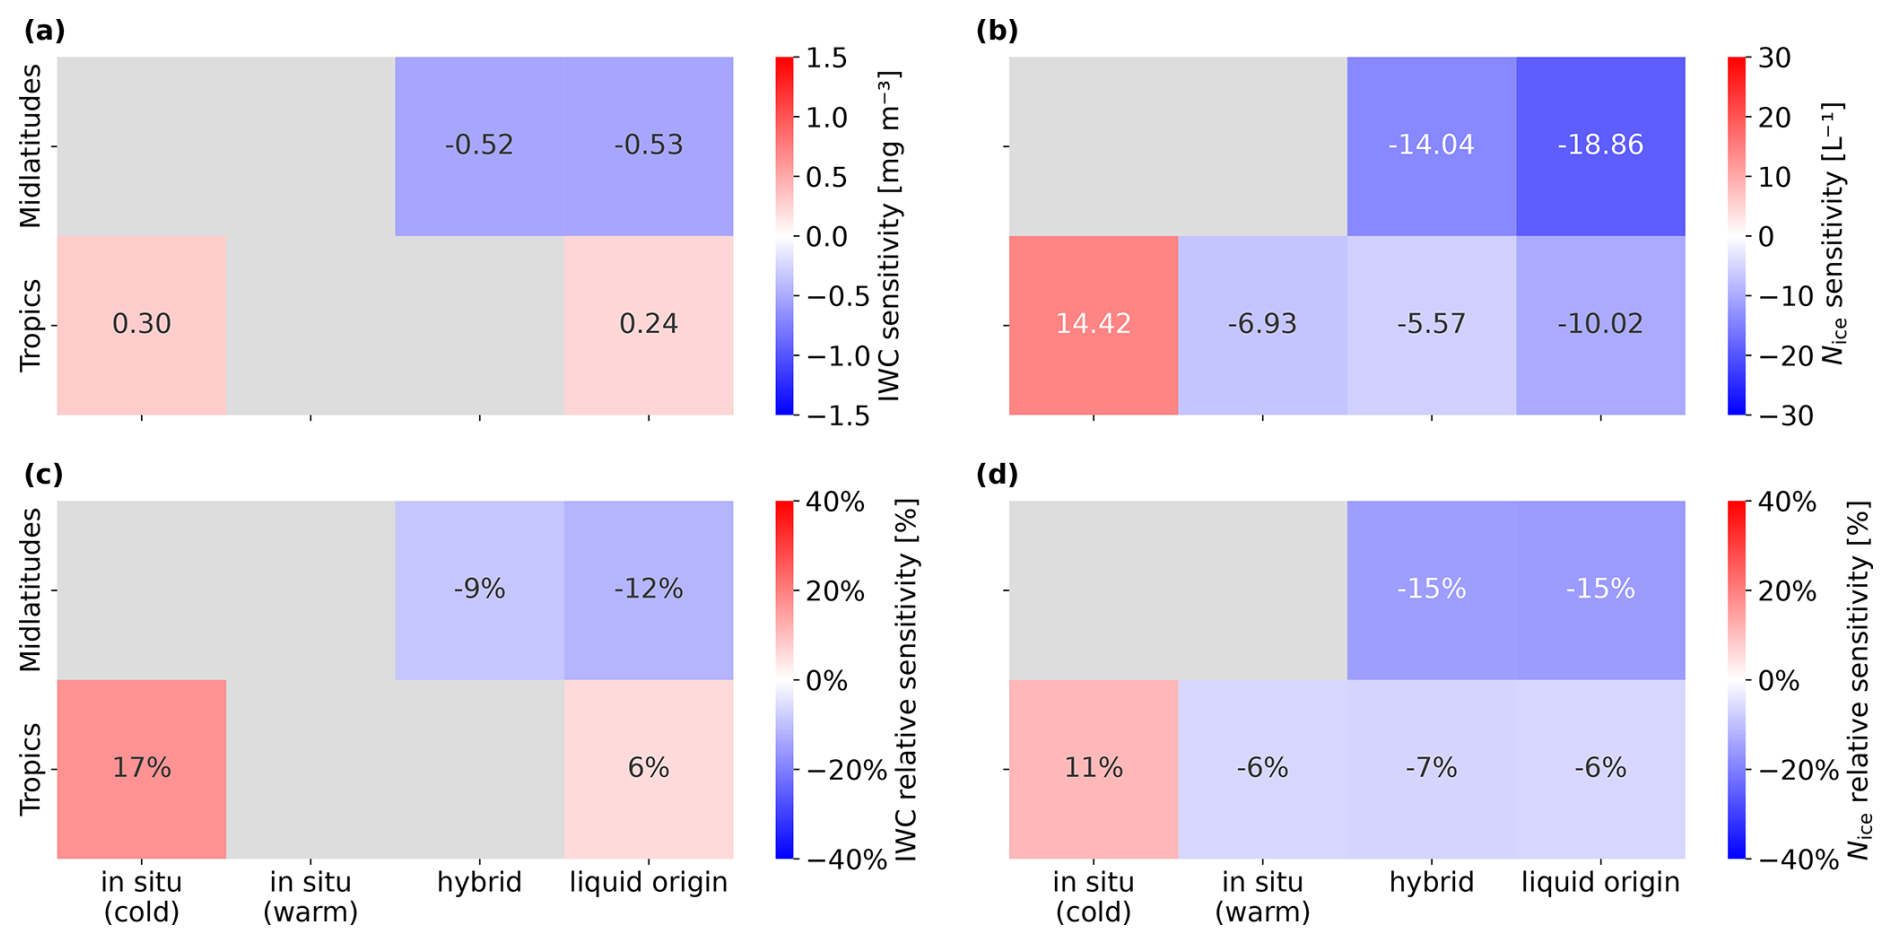
Figure 9Regression coefficients β3 in Eq. (1) (a) and Eq. (2) (b) representing the sensitivity of IWC and Nice to a unit change of dust aerosol in logarithmic space. Panels (c) and (d) represent the sensitivity as a percentage of the median IWC and Nice values, respectively, for each region/cirrus cluster combination. The gray fields indicate that β3 has a p-value >0.05, and is therefore considered statistically insignificant.
For cirrus clouds of the in situ (cold) cluster in the tropics, a substantial positive sensitivity of 11 % for Nice and 17 % for IWC can be observed, in contrast to the negative dust aerosol sensitivities discussed so far. We assume that this effect is caused by heterogeneous nucleation of ice in regions with supersaturations between the heterogeneous and homogeneous freezing thresholds and low updraft velocities, i.e., in conditions that are INP limited and in which ice nucleation would not have happened homogeneously. Aircraft-based in situ measurements of relative humidities in fact show that these conditions occur frequently at high altitudes, especially in the tropics at temperatures below 200 K (Krämer et al., 2020).
Our findings provide observational evidence that an increased abundance of INPs in cirrus regimes can lead to an overseeding effect for CCT. This means that instead of an INP-induced shift from homogeneous to heterogeneous ice nucleation, more numerous ice crystals form heterogeneously in conditions where homogeneous ice nucleation would not have occurred. Our results confirm findings from studies with global climate models that have found an overseeding effect (Storelvmo et al., 2013; Penner et al., 2015; Gasparini and Lohmann, 2016; Gasparini et al., 2017; Tully et al., 2022).
Also, for cirrus clouds of liquid origin, a positive IWC dependence of 6 % is detected, while the Nice dependence remains negative at −6 %. We assume that an increased availability of INPs induces a shift from homogeneous to heterogeneous freezing, leading to a decrease in Nice. At the same time, additional INPs may facilitate new freezing events that would not have occurred otherwise. These two effects partially offset each other, influencing the overall cloud properties.
We note that with our simplified assumption of linearity between median IWC and Nice values and the regressors we might miss non-linear effects, and are also only able to retrieve a noisy estimate given different microphysical processes with opposing effects. For example, despite the overall positive dust sensitivity for in situ (cold) cirrus in the tropics, there may still be some in situ (cold) cirrus in the tropics that are subject to a regime shift from homogeneous to heterogeneous nucleation due to an increase of dust concentration leading to a reduction of Nice. While being able to explain the observed sensitivities with our theoretical understanding of microphysical processes, the identified sensitivities do not necessarily constitute causal effects and could also be confounded by other factors.
As some cirrus clouds persist for more than 12 h, we repeated the trajectory clustering and dust sensitivity analysis using 24 h backward trajectories. The median temperature trajectories of the identified clusters and their corresponding dust sensitivities are presented in Appendix A. The longer trajectories allow for the identification of more dynamic regimes; for example, the hybrid regime exhibits a stronger ascent of air parcels along the trajectory. To ensure comparability, the cluster names remain consistent with those used for the 12 h clustering. The sensitivity of cirrus cloud properties to dust aerosol exposure largely aligns with the 12 h clustering results, except for the positive IWC sensitivity of liquid origin cirrus in the tropics, which is not detected, suggesting that this result is less robust.
Cloud-scale updrafts are a core driver of cirrus cloud formation and have a substantial influence on their CMPs. Like all other studies working with satellite and reanalysis data, this work is limited to the use of proxies for cloud-scale updrafts. While ERA5 can represent large-scale vertical velocity, small-scale updrafts like gravity waves and cloud-scale convection are not resolved. Additionally, uncertainties in ERA5 are higher in the tropics due to the frequent occurrence of convection, which, in turn, increases the uncertainty of our findings in the tropics. It is likely that a portion of cirrus clouds that we have classified as in situ cirrus in the tropics are in fact liquid origin cirrus formed by convection that is not resolved in ERA5. Analogous to uncertainties in meteorological variables, aerosol concentrations obtained from MERRA2 are associated with region-dependent uncertainties and may not necessarily represent the actual occurrence of dust. The study domain is a region with the highest annual mean atmospheric dust concentrations (Gavrouzou et al., 2021) and may therefore be less representative for the Southern Hemisphere or more remote regions. While DARDAR IWC and Nice agree well with co-located in situ observations of cirrus clouds (Krämer et al., 2016; Sourdeval et al., 2018; Krämer et al., 2020), uncertainties associated with measurement errors of the satellite instruments as well as the retrieval algorithms remain. Due to the absence of observational information about the time of cloud formation, cirrus clouds that have recently formed and cirrus clouds that are in a dissolving stage may belong to the same formation regime identified in this work, resulting in noisier results. If we were able to accurately determine the time of cloud formation, a more fine-grained classification of cirrus clouds could be conducted, leading also to an increase of the signal-to-noise ratio in the dust effect quantification. Knowledge about cloud age would also allow us to estimate the effect of gravitational size sorting by ice crystal sedimentation. Since we focus on cloud top data, large ice crystals may have already sedimented from cloud top, reducing IWC compared to younger clouds. Nice should be less affected by this unquantifiable effect of gravitational size sorting as Nice is dominated by the more numerous small ice crystals, which will remain at cloud top for several hours (Jensen et al., 2018).
In this study, we combined 3 years (2007–2009) of vertically resolved satellite retrievals from DARDAR-Nice of cirrus clouds in the domain from 140° W to 40° E and 0 to 60° N with Lagrangian 12 h backward trajectories of meteorological and aerosol variables from reanalysis data, resulting in 1.1 million cirrus clouds and their corresponding trajectories. Extending satellite data with trajectories enables an evolutionary perspective on observed cirrus clouds in contrast to the usual snapshot perspective studied with satellite data.
By clustering cirrus trajectories with k-means and DTW as distance metric, we identified four main formation regimes (in situ (cold), in situ (warm), hybrid, liquid origin). Consistent with existing studies, we confirm increased IWC and Nice values for liquid origin cirrus compared to in situ cirrus. However, in contrast to existing research that classified cirrus cloud ice origin in reanalysis data or in situ observations of single case studies, our method enables the classification of cirrus clouds based on their formation pathway in a large-scale satellite dataset. Furthermore, we find that IWC of liquid origin cirrus has a strong positive temperature dependence, whereas in situ cirrus have a strong negative temperature dependence on Nice.
The identification of cirrus formation regimes helps to disentangle the effect of dust particle concentration on cirrus cloud IWC and Nice from other dependencies. In line with recent evidence showing that mineral dust plays a dominant role in cirrus cloud formation in the Northern Hemisphere (Froyd et al., 2022), we find significant sensitivities of satellite-observed cirrus cloud properties, i.e., IWC and Nice, to dust particle concentrations from MERRA2 reanalysis data. We find that increasing dust concentrations can induce sensitivities of opposing signs caused by varying dominant microphysical processes for different cirrus cloud formation regimes. Except for tropical in situ (cold) cirrus, we detect a decrease in median Nice with increasing dust concentrations, with sensitivities ranging from 6 % to 7 % in the tropics and 15 % in mid-latitudinal regions per unit increase of dust concentration in logarithmic space. We attribute this decrease to a shift from homogeneous to heterogeneous ice nucleation, resulting in fewer, but larger, ice crystals. Conversely, in situ (cold) cirrus in the tropics show an 11 % increase in median Nice per dust aerosol unit increase in logarithmic space. We assume this is caused by heterogeneous ice nucleation initiated by dust INPs in INP-limited conditions with supersaturations between heterogeneous and homogeneous freezing thresholds, which are frequently found at high altitudes, especially in tropical regions. Cold, thin cirrus have on average a net positive CRE due to their stronger long-wave CRE compared to their short-wave CRE. An increase in these clouds could contribute to additional warming. However, their CRE may be relatively small because these clouds remain quite thin (Krämer et al., 2020). These results add observational evidence towards the ineffectiveness and potential undesired warming effects due to overseeding of CCT as a climate intervention strategy.
IWC is generally less sensitive to the ice nucleation mechanism than Nice, and hence to a change in the concentration of dust aerosol. At mid-latitudes, we find a negative sensitivity of IWC of 9 % and 12 % to dust particle concentrations for hybrid and liquid origin cirrus, likely caused by the faster sedimentation of larger ice crystals produced by heterogeneous freezing. Faster updraft velocities in the tropics may counteract this effect. An IWC sensitivity to dust of 17 % for in situ (cold) cirrus and 6 % sensitivity for liquid origin cirrus is detected in the tropics, suggesting that the effect of new nucleation events is dominating here.
To validate the effects of formation regime and dust aerosol on cirrus cloud properties, we suggest extending the study to the Southern Hemisphere and additionally conducting both modeling studies and further studies exploring satellite data.
A core limitation of this work is the absence of knowledge about when an observed cloud was initially formed and where in the cloud development life cycle it was observed by the satellite. Aircraft observations show that the impact of large aerosol particles like dust on IWC and Nice depends on the evolutionary phase of cirrus clouds (Patnaude and Diao, 2020; Maciel et al., 2023). Modeling studies would enable a full evolutionary view but are limited by assumptions about cloud microphysics schemes and coarse resolutions. Studies with satellite data could include the use of geostationary data, with its high temporal resolution but with the limitation of only integrated retrievals, in contrast to vertically resolved data. Recent advancements in combining multiple satellite sources with machine learning have enabled the creation of a fully 3D-resolved dataset of cloud ice properties with the spatiotemporal coverage of geostationary satellites (Jeggle et al., 2024), enabling future studies to track cloud trajectories, analyze cloud properties, and study dust sensitivity using observation-based data.
The clustering approach applied to a dataset that combines backward trajectories of reanalysis data with vertically resolved satellite observations introduced in this paper may provide insights about formation regimes and aerosol–cloud interactions beyond cirrus clouds. This method could be applied to liquid and mixed-phase clouds in a similar fashion.
The choice of the number of clusters k is crucial for the efficacy of k-means clustering. Ideally, k is chosen such that the algorithm maximizes the homogeneity of samples within a cluster and the separation of samples of different clusters. Various methods such as the “elbow” (Kodinariya and Makwana, 2013) and the silhouette method (Rousseeuw, 1987) can be used to heuristically determine k. The elbow method involves plotting the sum of squared distances of samples to their nearest cluster center as a function of the number of clusters k. The point where the plot bends or makes an elbow typically suggests a good value for k, indicating a balance between compactness and separation of clusters.
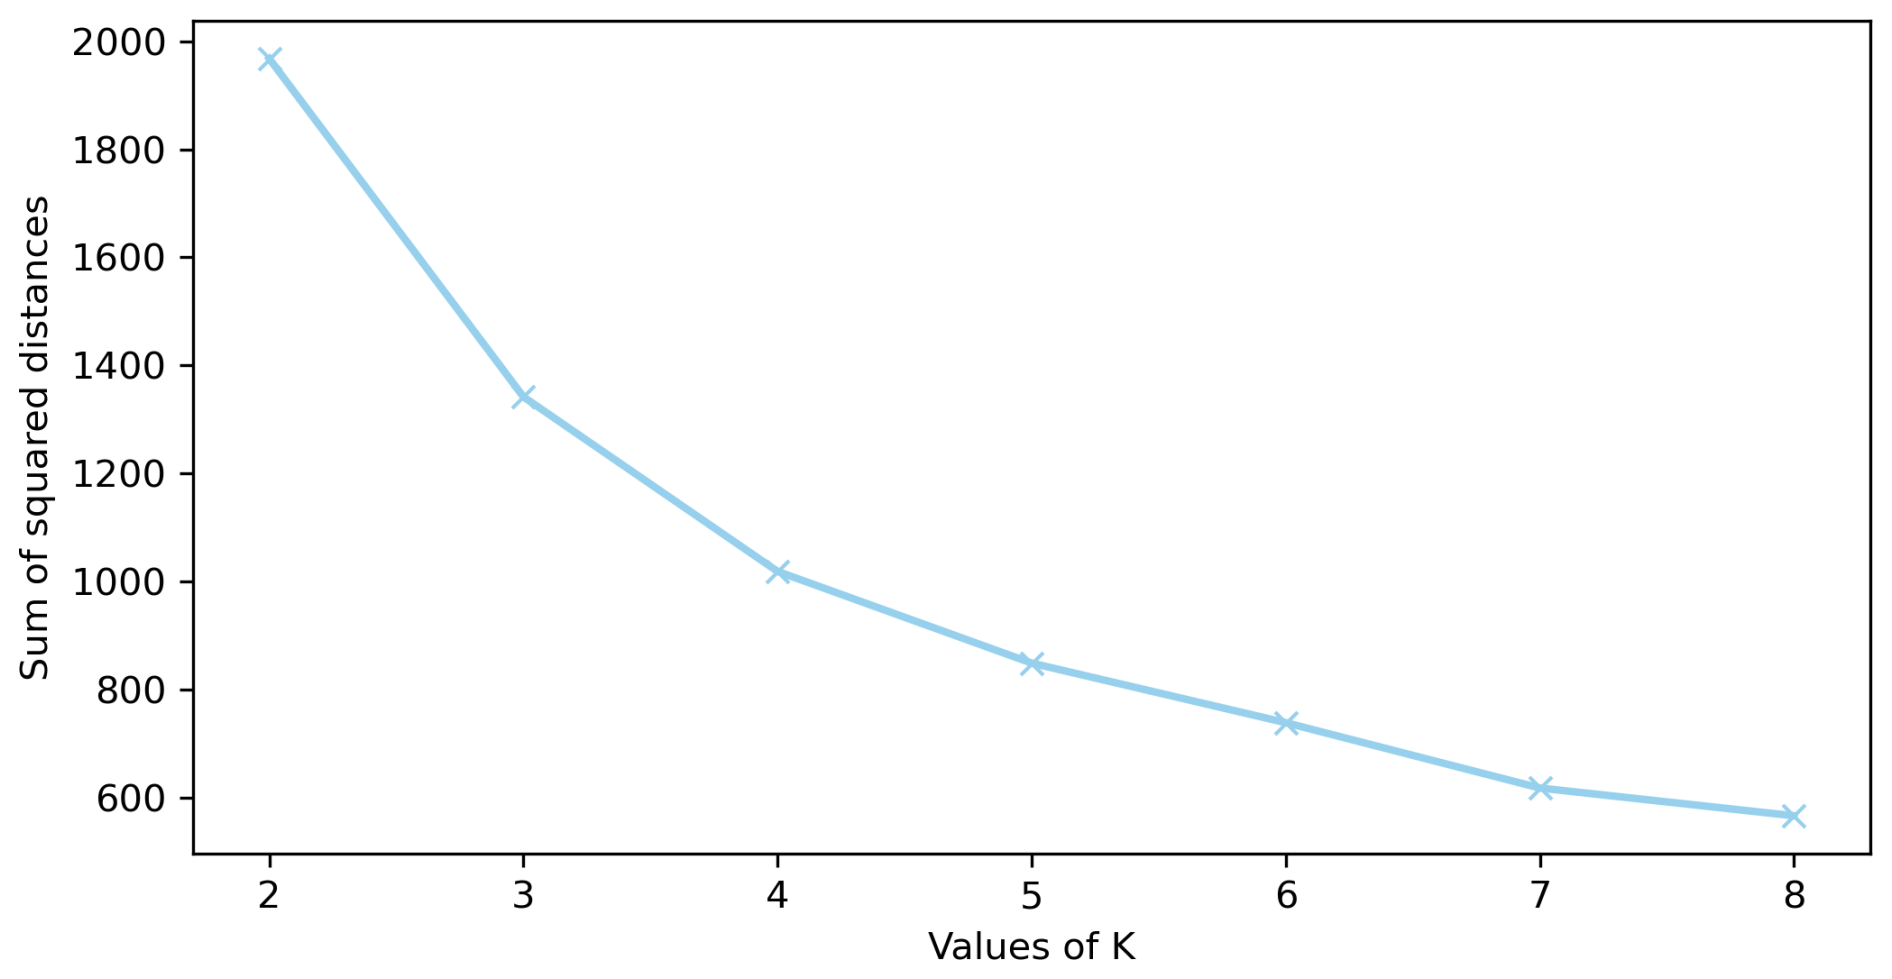
Figure A1Sum of squared distances of samples (cirrus trajectories) to their nearest cluster center as a function of the number of clusters k.
The silhouette method measures the quality of clustering by calculating the silhouette score for each sample, which is the difference between the intra-cluster distance and the nearest-cluster distance normalized by the maximum of these distances. Beyond these quantitative heuristics, domain knowledge is a key factor when determining k. Understanding the specific context and characteristics of the data can guide the selection of k, ensuring that the clusters are meaningful and relevant to the task at hand (Jain, 2010). The computation of the silhouette scores scales quadratically with the number of samples and time steps and is thus computationally prohibitive for our setting. To determine k, we combine the elbow method with visual interpretation and domain knowledge. Figure A1 visualizes the sum of squared distances of samples (cirrus cloud trajectories) to their nearest cluster centers as a function of k.
The optimal choice of k is not unambiguously identifiable according to the elbow method, but can be restricted to values between four and six. We finalize the choice of k by visually interpreting the identified clusters. Figure A2 shows the identified cluster centers for k=4 (a), k=5 (b), and k=6 (c). It can be seen that the differentiation of additional clusters in the k=5 and k=6 setting does not provide much additional insight for the task of identifying cirrus formation regimes. Thus, k=4 is chosen for the analysis presented in this study.
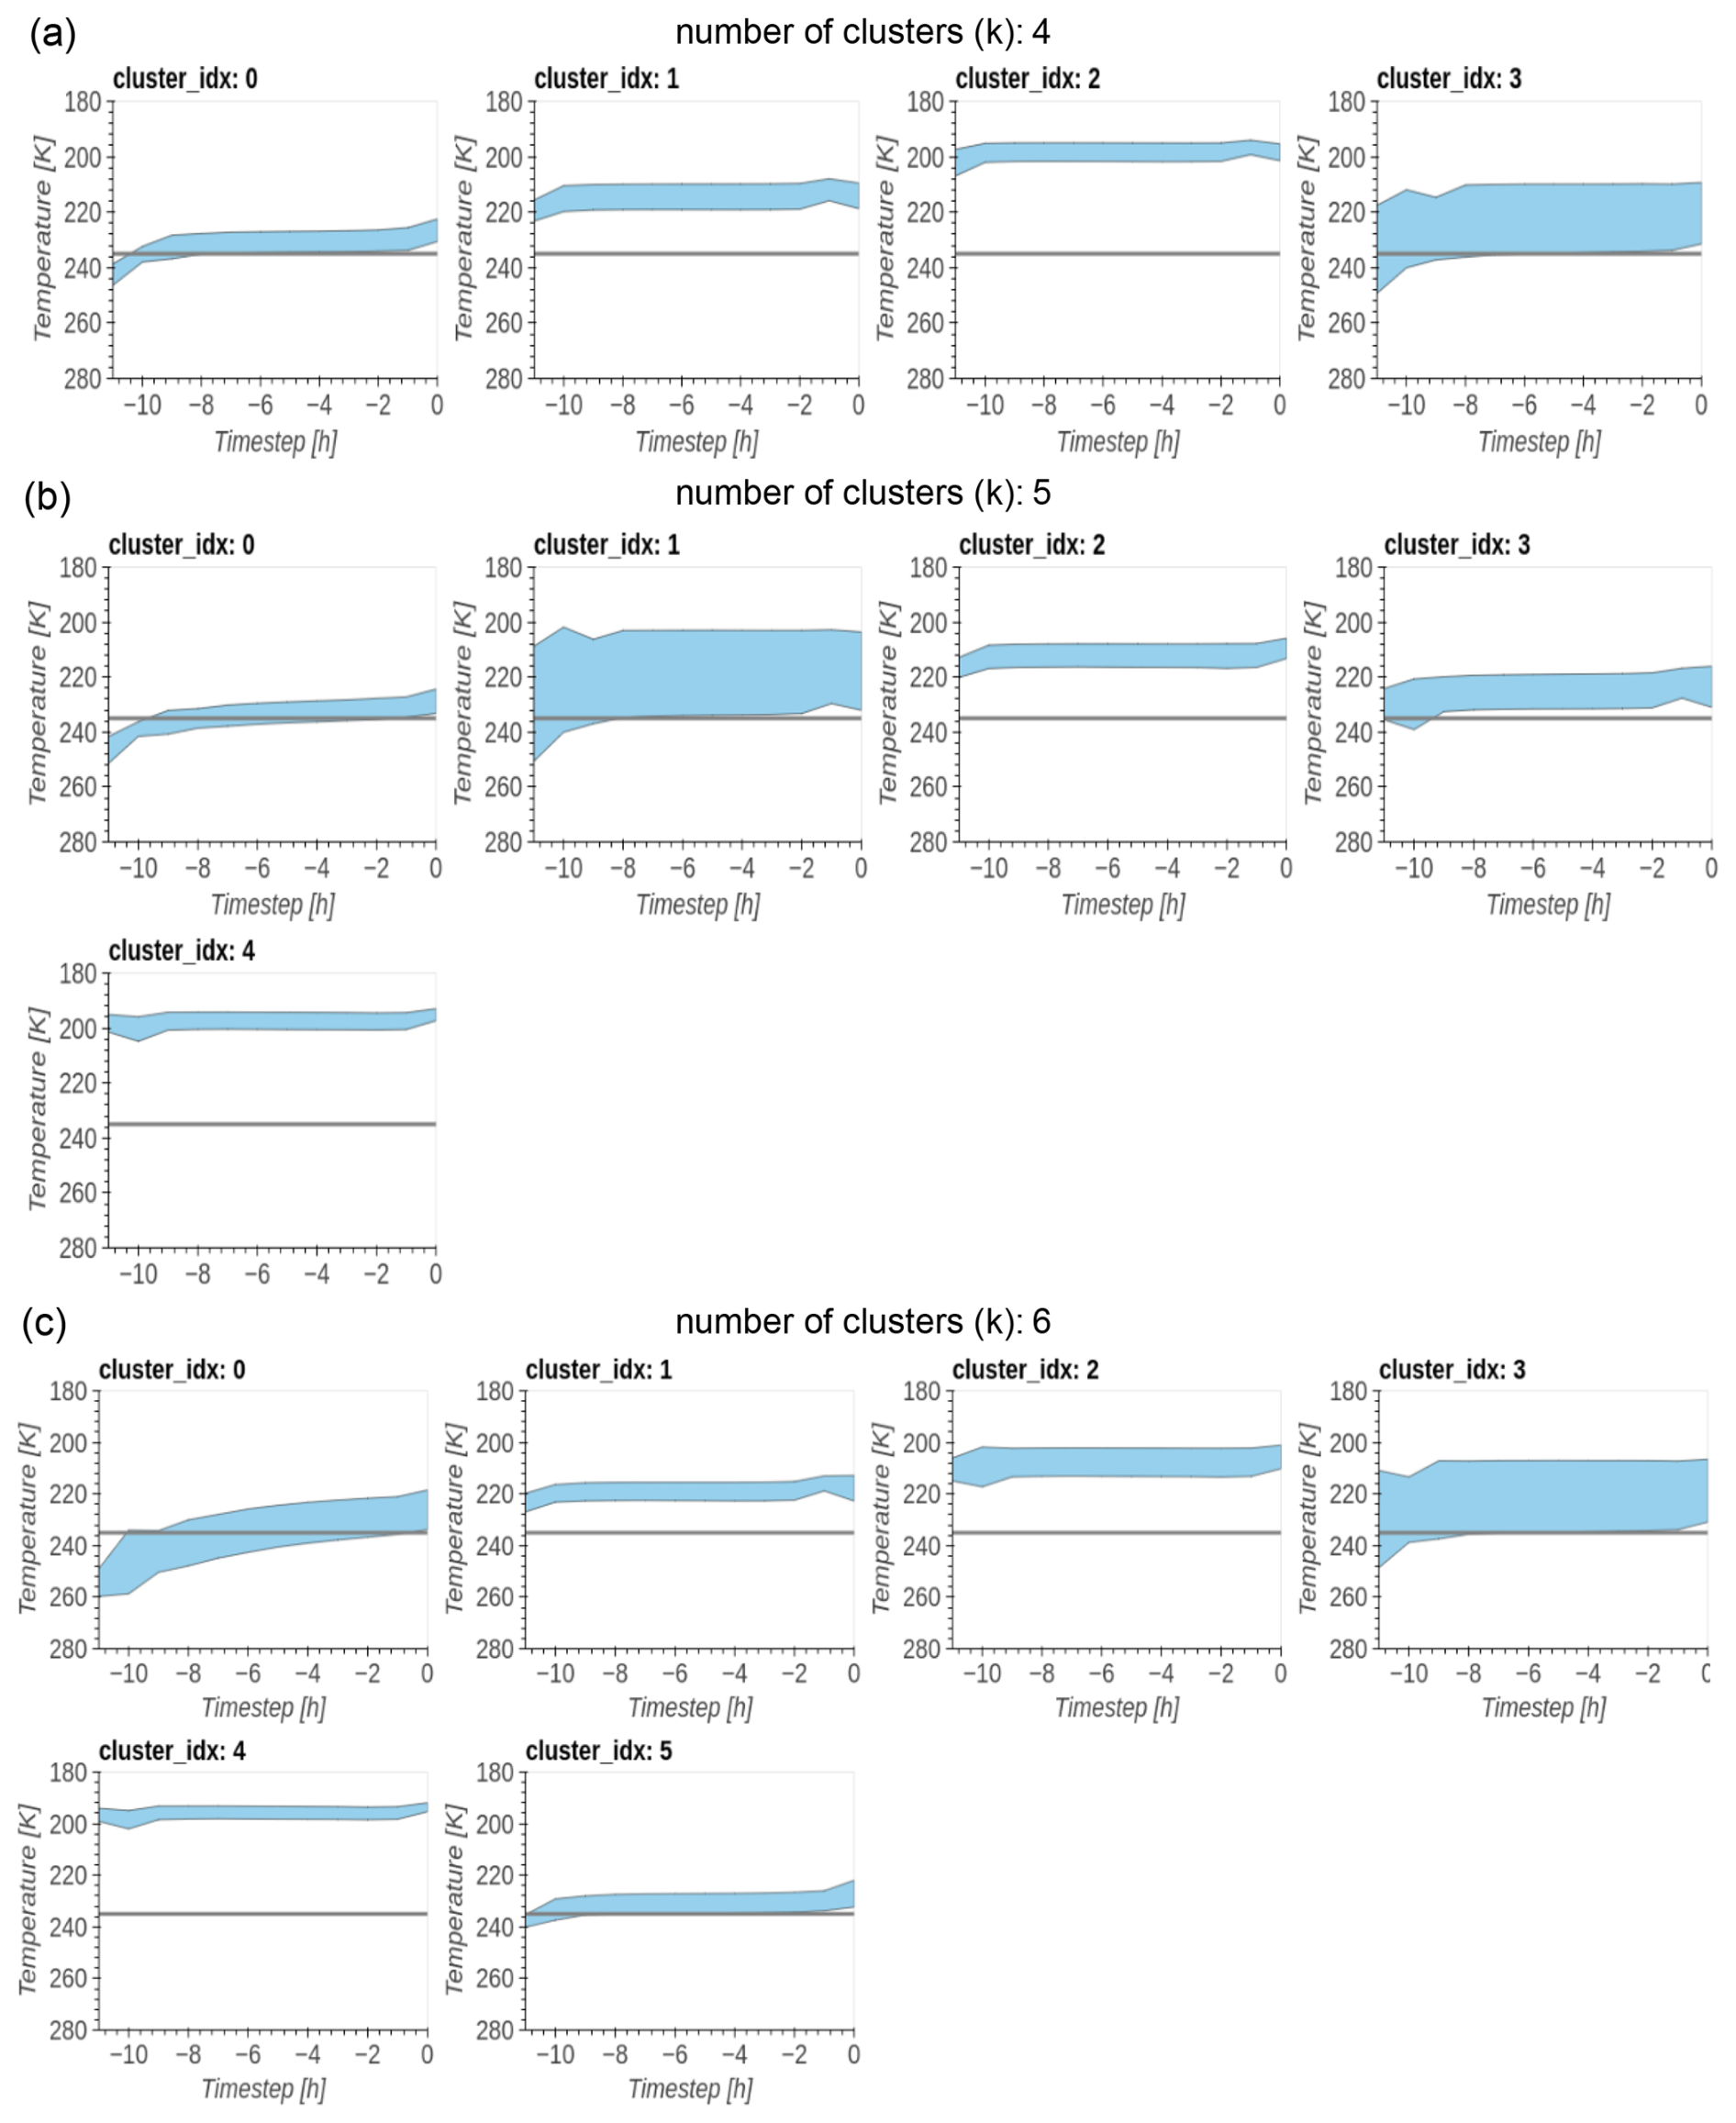
Figure A2Cluster centers computed by k-means for 1.1 million cirrus cloud trajectories for k=4 (a), k=5 (b), k=6 (c) clusters.
The co-located datasets containing cirrus cloud and trajectory data used for the analysis conducted in this paper can be downloaded from https://doi.org/10.5281/zenodo.15102965 (Jeggle et al., 2025). The raw data can be provided by the corresponding authors upon request. The code containing the time series clustering routine and data analysis is hosted at https://doi.org/10.5281/zenodo.15102965 (Jeggle et al., 2025).
KJ had the initial research idea, created the dataset, developed the method, and conducted the data analysis; DN and UL supported and guided the data analysis and method development; HB provided expertise and training to calculate the trajectory data; KJ wrote the manuscript draft; UL, DN, and HB reviewed and edited the manuscript.
The contact author has declared that none of the authors has any competing interests.
Publisher's note: Copernicus Publications remains neutral with regard to jurisdictional claims made in the text, published maps, institutional affiliations, or any other geographical representation in this paper. While Copernicus Publications makes every effort to include appropriate place names, the final responsibility lies with the authors.
We are grateful for the funding from the European Union’s Horizon 2020 research and innovation program iMIRACLI under Marie Skłodowska-Curie grant agreement no. 860100. The authors thank Heini Wernli, Michael Sprenger, and Martina Krämer for insightful discussions; Tom Beucler for his comments on the manuscript; and Odran Sourdeval for the DARDAR-Nice data. We sincerely thank Blaž Gasparini and an anonymous reviewer for their valuable feedback, which helped us improve the manuscript.
This research has been supported by the EU Horizon 2020 (grant no. 860100).
This paper was edited by Sergio Rodríguez and reviewed by Blaž Gasparini and one anonymous referee.
Atlas, R. and Bretherton, C. S.: Aircraft observations of gravity wave activity and turbulence in the tropical tropopause layer: prevalence, influence on cirrus clouds, and comparison with global storm-resolving models, Atmos. Chem. Phys., 23, 4009–4030, https://doi.org/10.5194/acp-23-4009-2023, 2023. a
Benedetti, A., Morcrette, J.-J., Boucher, O., Dethof, A., Engelen, R. J., Fisher, M., Flentje, H., Huneeus, N., Jones, L., Kaiser, J. W., Kinne, S., Mangold, A., Razinger, M., Simmons, A. J., and Suttie, M.: Aerosol analysis and forecast in the European Centre for Medium-Range Weather Forecasts Integrated Forecast System: 2. Data assimilation, J. Geophys. Res.-Atmos., 114, D13, https://doi.org/10.1029/2008JD011115, 2009. a
Buchard, V., Randles, C. A., Silva, A. M. d., Darmenov, A., Colarco, P. R., Govindaraju, R., Ferrare, R., Hair, J., Beyersdorf, A. J., Ziemba, L. D., and Yu, H.: The MERRA-2 Aerosol Reanalysis, 1980 Onward. Part II: Evaluation and Case Studies, J. Climate, 30, 6851–6872, https://doi.org/10.1175/JCLI-D-16-0613.1, 2017. a
Chang, K.-W. and L'Ecuyer, T.: Influence of gravity wave temperature anomalies and their vertical gradients on cirrus clouds in the tropical tropopause layer – a satellite-based view, Atmos. Chem. Phys., 20, 12499–12514, https://doi.org/10.5194/acp-20-12499-2020, 2020. a
Dekoutsidis, G., Groß, S., Wirth, M., Krämer, M., and Rolf, C.: Characteristics of supersaturation in midlatitude cirrus clouds and their adjacent cloud-free air, Atmos. Chem. Phys., 23, 3103–3117, https://doi.org/10.5194/acp-23-3103-2023, 2023. a
Delanoë, J. and Hogan, R. J.: A variational scheme for retrieving ice cloud properties from combined radar, lidar, and infrared radiometer, J. Geophys. Res.-Atmos., 113, D7, https://doi.org/10.1029/2007JD009000, 2008. a
DeMott, P. J., Prenni, A. J., Liu, X., Kreidenweis, S. M., Petters, M. D., Twohy, C. H., Richardson, M. S., Eidhammer, T., and Rogers, D. C.: Predicting global atmospheric ice nuclei distributions and their impacts on climate, P. Natl. Acad. Sci. USA, 107, 11217–11222, https://doi.org/10.1073/pnas.0910818107, 2010. a
Doswell, C. A.: The operational meteorology of convective weather: Storm scale analysis, Report, National Oceanic and Atmospheric Administration (NOAA), Tech. rep., Environ. Res. Lab. (U.S.), https://repository.library.noaa.gov/view/noaa/11215 (last access: 1 March 2025), 1985. a
Duncan, D. I. and Eriksson, P.: An update on global atmospheric ice estimates from satellite observations and reanalyses, Atmos. Chem. Phys., 18, 11205–11219, https://doi.org/10.5194/acp-18-11205-2018, 2018. a
Forster, P., Storelvmo, T., Armour, K., Collins, W., Dufresne, J.-L., Frame, D., Lunt, D., Mauritsen, T., Palmer, M., Watanabe, M., Wild, M., and Zhang, H.: The Earth’s Energy Budget, Climate Feedbacks, and Climate Sensitivity, in: Climate Change 2021: The Physical Science Basis. Contribution of Working Group I to the Sixth Assessment Report of the Intergovernmental Panel on Climate Change, edited by: Masson-Delmotte, V., Zhai, P., Pirani, A., Connors, S. L., Péan, C., Berger, S., Caud, N., Chen, Y., Goldfarb, L., Gomis, M. I., Huang, M., Leitzell, K., Lonnoy, E., Matthews, J. B. R., Maycock, T. K., Waterfield, T., Yelekçi, O., Yu, R., and Zhou, B.: 923–1054 pp., Cambridge University Press, Cambridge, United Kingdom and New York, NY, USA, https://doi.org/10.1017/9781009157896.009, 2021. a, b
Froyd, K. D., Yu, P., Schill, G. P., Brock, C. A., Kupc, A., Williamson, C. J., Jensen, E. J., Ray, E., Rosenlof, K. H., Bian, H., Darmenov, A. S., Colarco, P. R., Diskin, G. S., Bui, T., and Murphy, D. M.: Dominant role of mineral dust in cirrus cloud formation revealed by global-scale measurements, Nat. Geosci., 15, 177–183, https://doi.org/10.1038/s41561-022-00901-w, 2022. a
Gandham, H., Dasari, H. P., Karumuri, A., Ravuri, P. M. K., and Hoteit, I.: Three-dimensional structure and transport pathways of dust aerosols over West Asia, Clim. Atmos. Sci., 5, 1–15, https://doi.org/10.1038/s41612-022-00266-2, 2022. a
Gasparini, B. and Lohmann, U.: Why cirrus cloud seeding cannot substantially cool the planet, J. Geophys. Res.-Atmos., 121, 4877–4893, https://doi.org/10.1002/2015JD024666, 2016. a, b, c
Gasparini, B., Münch, S., Poncet, L., Feldmann, M., and Lohmann, U.: Is increasing ice crystal sedimentation velocity in geoengineering simulations a good proxy for cirrus cloud seeding?, Atmos. Chem. Phys., 17, 4871–4885, https://doi.org/10.5194/acp-17-4871-2017, 2017. a, b
Gasparini, B., Meyer, A., Neubauer, D., Münch, S., and Lohmann, U.: Cirrus Cloud Properties as Seen by the CALIPSO Satellite and ECHAM-HAM Global Climate Model, J. Climate, 31, 1983–2003, https://doi.org/10.1175/JCLI-D-16-0608.1, 2018. a, b
Gavrouzou, M., Hatzianastassiou, N., Gkikas, A., Korras-Carraca, M.-B., and Mihalopoulos, N.: A Global Climatology of Dust Aerosols Based on Satellite Data: Spatial, Seasonal and Inter-Annual Patterns over the Period 2005–2019, Remote Sens., 13, 359, https://doi.org/10.3390/rs13030359, 2021. a
Gelaro, R., McCarty, W., Suárez, M. J., Todling, R., Molod, A., Takacs, L., Randles, C. A., Darmenov, A., Bosilovich, M. G., Reichle, R., Wargan, K., Coy, L., Cullather, R., Draper, C., Akella, S., Buchard, V., Conaty, A., Silva, A. M. d., Gu, W., Kim, G.-K., Koster, R., Lucchesi, R., Merkova, D., Nielsen, J. E., Partyka, G., Pawson, S., Putman, W., Rienecker, M., Schubert, S. D., Sienkiewicz, M., and Zhao, B.: The Modern-Era Retrospective Analysis for Research and Applications, Version 2 (MERRA-2), J. Climate, 30, 5419–5454, https://doi.org/10.1175/JCLI-D-16-0758.1, 2017. a
Gryspeerdt, E., Sourdeval, O., Quaas, J., Delanoë, J., Krämer, M., and Kühne, P.: Ice crystal number concentration estimates from lidar–radar satellite remote sensing – Part 2: Controls on the ice crystal number concentration, Atmos. Chem. Phys., 18, 14351–14370, https://doi.org/10.5194/acp-18-14351-2018, 2018. a, b
Gueymard, C. A. and Yang, D.: Worldwide validation of CAMS and MERRA-2 reanalysis aerosol optical depth products using 15 years of AERONET observations, Atmos. Environ., 225, 117216, https://doi.org/10.1016/j.atmosenv.2019.117216, 2020. a
Hartmann, D. L., Gasparini, B., Berry, S. E., and Blossey, P. N.: The Life Cycle and Net Radiative Effect of Tropical Anvil Clouds, J. Adv. Model. Earth Syst., 10, 3012–3029, https://doi.org/10.1029/2018MS001484, 2018. a
Hersbach, H., Bell, B., Berrisford, P., Horányi, A., Muñoz‐Sabater, J., Nicolas, J., Peubey, C., Radu, R., Schepers, D., Simmons, A., Soci, C., Biavati, G., Dee, D., and Thépaut, J.: ERA5 hourly data on pressure levels from 1959 to present, Copernicus Climate Change Service (C3S) Climate Data Store (CDS), https://doi.org/10.24381/cds.bd0915c6, 2018. a
Heymsfield, A. J., Krämer, M., Luebke, A., Brown, P., Cziczo, D. J., Franklin, C., Lawson, P., Lohmann, U., McFarquhar, G., Ulanowski, Z., and Van Tricht, K.: Cirrus Clouds, Meteor. Mon., 58, 2.1–2.26, https://doi.org/10.1175/AMSMONOGRAPHS-D-16-0010.1, 2017. a, b, c
Hong, Y., Liu, G., and Li, J.-L. F.: Assessing the Radiative Effects of Global Ice Clouds Based on CloudSat and CALIPSO Measurements, J. Climate, 29, 7651–7674, https://doi.org/10.1175/JCLI-D-15-0799.1, 2016. a, b
Hunt, W. H., Winker, D. M., Vaughan, M. A., Powell, K. A., Lucker, P. L., and Weimer, C.: CALIPSO Lidar Description and Performance Assessment, J. Atmos. Ocean. Technol., 26, 1214–1228, https://doi.org/10.1175/2009JTECHA1223.1, 2009. a
Inness, A., Ades, M., Agustí-Panareda, A., Barré, J., Benedictow, A., Blechschmidt, A.-M., Dominguez, J. J., Engelen, R., Eskes, H., Flemming, J., Huijnen, V., Jones, L., Kipling, Z., Massart, S., Parrington, M., Peuch, V.-H., Razinger, M., Remy, S., Schulz, M., and Suttie, M.: The CAMS reanalysis of atmospheric composition, Atmos. Chem. Phys., 19, 3515–3556, https://doi.org/10.5194/acp-19-3515-2019, 2019. a
Jain, A. K.: Data clustering: 50 years beyond K-means, Pattern Recogn. Lett., 31, 651–666, https://doi.org/10.1016/j.patrec.2009.09.011, 2010. a
Jeggle, K., Neubauer, D., Camps-Valls, G., and Lohmann, U.: Understanding cirrus clouds using explainable machine learning, Environ. Data Sci., 2, e19, https://doi.org/10.1017/eds.2023.14, 2023. a
Jeggle, K., Czerkawski, M., Serva, F., Saux, B. L., Neubauer, D., and Lohmann, U.: IceCloudNet: 3D reconstruction of cloud ice from Meteosat SEVIRI, arXiv:2410.04135, physics.ao-ph, https://doi.org/10.48550/arXiv.2410.04135, 2024. a
Jeggle, K., Neubauer, D., Binder, H. V., and Lohmann, U.: Cirrus Formation Regimes – Data Driven Identification and Quantification of Mineral Dust Effect, Zenodo [data set, code], https://doi.org/10.5281/zenodo.15102965, 2025. a, b
Jensen, E. J., van den Heever, S. C., and Grant, L. D.: The Life Cycles of Ice Crystals Detrained From the Tops of Deep Convection, J. Geophys. Res.-Atmos., 123, 9624–9634, https://doi.org/10.1029/2018JD028832, 2018. a
Kanji, Z. A., Ladino, L. A., Wex, H., Boose, Y., Burkert-Kohn, M., Cziczo, D. J., and Krämer, M.: Overview of Ice Nucleating Particles, Meteorol. Mon., 58, 1.1–1.33, https://doi.org/10.1175/AMSMONOGRAPHS-D-16-0006.1, 2017. a, b, c
Kärcher, B., Hendricks, J., and Lohmann, U.: Physically based parameterization of cirrus cloud formation for use in global atmospheric models, J. Geophys. Res.-Atmos., 111, D1, https://doi.org/10.1029/2005JD006219, 2006. a
Kim, J.-E., Alexander, M. J., Bui, T. P., Dean-Day, J. M., Lawson, R. P., Woods, S., Hlavka, D., Pfister, L., and Jensen, E. J.: Ubiquitous influence of waves on tropical high cirrus clouds, Geophys. Res. Lett., 43, 5895–5901, https://doi.org/10.1002/2016GL069293, 2016. a
Kodinariya, T. and Makwana, P.: Review on Determining of Cluster in K-means Clustering, Int. J. Adv. Res. Comput. Sci. Manage. Stud., 1, 90–95, 2013. a
Krämer, M., Rolf, C., Luebke, A., Afchine, A., Spelten, N., Costa, A., Meyer, J., Zöger, M., Smith, J., Herman, R. L., Buchholz, B., Ebert, V., Baumgardner, D., Borrmann, S., Klingebiel, M., and Avallone, L.: A microphysics guide to cirrus clouds – Part 1: Cirrus types, Atmos. Chem. Phys., 16, 3463–3483, https://doi.org/10.5194/acp-16-3463-2016, 2016. a, b, c, d, e, f
Krämer, M., Rolf, C., Spelten, N., Afchine, A., Fahey, D., Jensen, E., Khaykin, S., Kuhn, T., Lawson, P., Lykov, A., Pan, L. L., Riese, M., Rollins, A., Stroh, F., Thornberry, T., Wolf, V., Woods, S., Spichtinger, P., Quaas, J., and Sourdeval, O.: A microphysics guide to cirrus – Part 2: Climatologies of clouds and humidity from observations, Atmos. Chem. Phys., 20, 12569–12608, https://doi.org/10.5194/acp-20-12569-2020, 2020. a, b, c, d
Kuebbeler, M., Lohmann, U., Hendricks, J., and Kärcher, B.: Dust ice nuclei effects on cirrus clouds, Atmos. Chem. Phys., 14, 3027–3046, https://doi.org/10.5194/acp-14-3027-2014, 2014. a
Lacher, L., DeMott, P. J., Levin, E. J. T., Suski, K. J., Boose, Y., Zipori, A., Herrmann, E., Bukowiecki, N., Steinbacher, M., Gute, E., Abbatt, J. P. D., Lohmann, U., and Kanji, Z. A.: Background Free-Tropospheric Ice Nucleating Particle Concentrations at Mixed-Phase Cloud Conditions, J. Geophys. Res.-Atmos., 123, 10506–10525, https://doi.org/10.1029/2018JD028338, 2018. a
Lohmann, U., Spichtinger, P., Jess, S., Peter, T., and Smit, H.: Cirrus cloud formation and ice supersaturated regions in a global climate model, Environ. Res. Lett., 3, 045022, https://doi.org/10.1088/1748-9326/3/4/045022, 2008. a
Lohmann, U., Lüönd, F., and Mahrt, F.: An Introduction to Clouds: From the Microscale to Climate, Cambridge University Press, Cambridge, ISBN 978-1-107-01822-8, https://doi.org/10.1017/CBO9781139087513, 2016. a
Luebke, A. E., Afchine, A., Costa, A., Grooß, J.-U., Meyer, J., Rolf, C., Spelten, N., Avallone, L. M., Baumgardner, D., and Krämer, M.: The origin of midlatitude ice clouds and the resulting influence on their microphysical properties, Atmos. Chem. Phys., 16, 5793–5809, https://doi.org/10.5194/acp-16-5793-2016, 2016. a
Maciel, F. V., Diao, M., and Patnaude, R.: Examination of aerosol indirect effects during cirrus cloud evolution, Atmos. Chem. Phys., 23, 1103–1129, https://doi.org/10.5194/acp-23-1103-2023, 2023. a
Mitchell, D. L. and Finnegan, W.: Modification of cirrus clouds to reduce global warming, Environ. Res. Lett., 4, 045102, https://doi.org/10.1088/1748-9326/4/4/045102, 2009. a
Muhlbauer, A., Ackerman, T. P., Comstock, J. M., Diskin, G. S., Evans, S. M., Lawson, R. P., and Marchand, R. T.: Impact of large-scale dynamics on the microphysical properties of midlatitude cirrus, J. Geophys. Res.-Atmos., 119, 3976–3996, https://doi.org/10.1002/2013JD020035, 2014. a
Patnaude, R. and Diao, M.: Aerosol Indirect Effects on Cirrus Clouds Based on Global Aircraft Observations, Geophys. Res. Lett., 47, e2019GL086550, https://doi.org/10.1029/2019GL086550, 2020. a
Penner, J. E., Zhou, C., and Liu, X.: Can cirrus cloud seeding be used for geoengineering?, Geophys. Res. Lett., 42, 8775–8782, https://doi.org/10.1002/2015GL065992, 2015. a, b
Rousseeuw, P. J.: Silhouettes: A graphical aid to the interpretation and validation of cluster analysis, J. Comput. Appl. Mathe., 20, 53–65, https://doi.org/10.1016/0377-0427(87)90125-7, 1987. a
Sakoe, H. and Chiba, S.: Dynamic programming algorithm optimization for spoken word recognition, IEEE T. Acoust. Speech Sig. Process., 26, 43–49, https://doi.org/10.1109/TASSP.1978.1163055, 1978. a
Sassen, K. and Comstock, J. M.: A Midlatitude Cirrus Cloud Climatology from the Facility for Atmospheric Remote Sensing. Part III: Radiative Properties, https://journals.ametsoc.org/view/journals/atsc/58/15/1520-0469_2001_058_2113_amcccf_2.0.co_2.xml (last access: 27 March 2025), 2001. a
Sourdeval, O., Gryspeerdt, E., Krämer, M., Goren, T., Delanoë, J., Afchine, A., Hemmer, F., and Quaas, J.: Ice crystal number concentration estimates from lidar–radar satellite remote sensing – Part 1: Method and evaluation, Atmos. Chem. Phys., 18, 14327–14350, https://doi.org/10.5194/acp-18-14327-2018, 2018. a, b
Sprenger, M. and Wernli, H.: The LAGRANTO Lagrangian analysis tool – version 2.0, Geosci. Model Dev., 8, 2569–2586, https://doi.org/10.5194/gmd-8-2569-2015, 2015. a
Storelvmo, T., Kristjansson, J. E., Muri, H., Pfeffer, M., Barahona, D., and Nenes, A.: Cirrus cloud seeding has potential to cool climate, Geophys. Res. Lett., 40, 178–182, https://doi.org/10.1029/2012GL054201, 2013. a, b
Tavenard, R.: An introduction to Dynamic Time Warping, GitHub, https://rtavenar.github.io/blog/dtw.html (last access: 27 March 2025), 2021. a
Tavenard, R., Faouzi, J., Vandewiele, G., Divo, F., Androz, G., Holtz, C., Payne, M., Yurchak, R., Rußwurm, M., Kolar, K., and Woods, E.: Tslearn, A Machine Learning Toolkit for Time Series Data, J. Mach. Learn. Res., 21, 1–6, 2020. a
Tully, C., Neubauer, D., Omanovic, N., and Lohmann, U.: Cirrus cloud thinning using a more physically based ice microphysics scheme in the ECHAM-HAM general circulation model, Atmos. Chem. Phys., 22, 11455–11484, https://doi.org/10.5194/acp-22-11455-2022, 2022. a, b
Wegener, A.: Thermodynamik der atmosphäre, JA Barth, 331 pp., 1911. a
Wernli, H., Boettcher, M., Joos, H., Miltenberger, A. K., and Spichtinger, P.: A trajectory-based classification of ERA-Interim ice clouds in the region of the North Atlantic storm track, Geophys. Res. Lett., 43, 6657–6664, https://doi.org/10.1002/2016GL068922, 2016. a
- Abstract
- Introduction
- Methods
- Data-driven formation regime identification
- Quantification of dust aerosol effect
- Limitations
- Conclusions
- Appendix A: Determining number of clusters k
- Appendix B: Analysis with 24 h trajectories
- Code and data availability
- Author contributions
- Competing interests
- Disclaimer
- Acknowledgements
- Financial support
- Review statement
- References