the Creative Commons Attribution 4.0 License.
the Creative Commons Attribution 4.0 License.
 | 04 Jul 2025
Quantifying transboundary transport flux of CO over the Tibetan Plateau: variabilities and drivers
Zhenda Sun
Hao Yin
Zhongfeng Pan
Chongyang Li
Ke Liu
The Tibetan Plateau significantly impacts regional and global climate systems due to its unique geographical location and complex environmental processes. This study investigates the variability and driving force of transboundary transport flux of carbon monoxide (CO) over the Tibetan Plateau from May 2018–April 2024. The CO fluxes were calculated with a closed-loop integral method using the TROPOMI, ERA5, and GEOS-CF data products. The results show that the external influx and internal efflux of CO over the Tibetan Plateau in each year are relatively close and have similar seasonal characteristics. High levels of CO flux occur in late autumn to winter, and low levels occur in summer. In most cases, CO flux maximizes in November, December, or January and minimizes in July or August. The month-to-month variability during late autumn to winter is greater than that in summer. The Tibetan Plateau has experienced an increase of 2.86 Tg CO yr−1 in external influx, while the internal efflux has slightly decreased by . The magnitude of the increase in external influx in the southwestern segment is greater than in the northeastern segment. Conversely, the magnitude of the decrease in internal efflux in the northeastern segment is greater than in the southwestern segment. The source attribution results reveal that the external input of CO into the Tibetan Plateau mainly comes from South Asia. The increase in external influx of CO in recent years over the Tibetan Plateau is potentially linked to the rapid rise in CO concentrations from South Asia.
- Article
(9741 KB) - Full-text XML
-
Supplement
(3419 KB) - BibTeX
- EndNote


The Tibetan Plateau, often referred to as the “Third Pole of the Earth”, is characterized by its extensive snow, glaciers, permafrost, and seasonal frozen ground. Due to the complex interactions among atmospheric, cryospheric, hydrological, geological, and environmental processes, this region profoundly impacts global climate and water cycle systems. The Tibetan Plateau plays a crucial role in the global climate system and serves as a critical indicator of regional and global climate change (Qian et al., 2011; Li et al., 2017; Bibi et al., 2018; Gao et al., 2019). This plateau and its surrounding regions experience various atmospheric circulation patterns, including the Indian summer monsoon, winter westerlies, and the East Asian monsoon (Yao et al., 2012; Chen et al., 2020). These circulation patterns are essential in shaping regional climate and pollutant transport. In particular, the southwestern Tibetan Plateau is influenced by the South Asian monsoon. During summer, the intensified monsoon transports warm, moist air masses and pollutants, such as aerosols and particulate matter, from the South Asian subcontinent to the Tibetan Plateau. Owing to the uplift effect of the plateau's topography, these airflows descend into the southern and southwestern regions after crossing the Himalayas, delivering rainfall and accumulating pollutants. Conversely, the northeastern Tibetan Plateau is impacted by the East Asian monsoon. In winter, cold air from central and northern Asia flows into the plateau, carrying pollutants from these areas. In summer, the East Asian monsoon brings moist air and pollutants from the East Asian coast into the eastern Tibetan Plateau, affecting local air quality (Ramanathan et al., 2005; Xu et al., 2009; Kaspari et al., 2011; Qian et al., 2011; Lüthi et al., 2015; Cong et al., 2015; Zhang et al., 2015; Wang et al., 2019; Wu et al., 2020; Li et al., 2021; Sun et al., 2021). Surrounding the Tibetan Plateau, densely populated Eurasian countries are experiencing rapid economic development, leading to increased emissions of air pollutants. Consequently, these regions have become some of the most polluted areas globally, and the pollutants can be transported over long distances to the Tibetan Plateau via the Asian monsoon and westerly circulation (Lawrence and Lelieveld, 2010). In addition to the rising industrial and agricultural emissions within the Tibetan Plateau, these external pollutants can also significantly impact its ecosystem and climate (Ji et al., 2015; Sun et al., 2021; Yin et al., 2022).
Carbon monoxide (CO) is one of the most significant atmospheric pollutants, primarily resulting from incomplete combustion of fossil fuels, biomass burning, and the oxidation of methane and non-methane hydrocarbons. This pollutant can indirectly exacerbate global warming by participating in the formation and reactions of other greenhouse gases in the atmosphere. CO is predominantly removed from the atmosphere through reactions with hydroxyl radicals (OH) (Holloway et al., 2000; Heald et al., 2003; Luo et al., 2013; Martínez-Alonso et al., 2020). With a lifetime ranging from several weeks to months, CO can persist in the atmosphere for extended periods, undergoing both horizontal and vertical transport. Consequently, CO is frequently employed as a tracer for studying pollutant transport dynamics (Holloway et al., 2000; Gloudemans et al., 2006; Jeong and Hong, 2021). Given its unique chemical properties and significant climatic effects, studying the CO flux, variability, and driving factors offers valuable insights into the atmospheric conditions over the Tibetan Plateau. Furthermore, CO sources may vary across different regions, understanding their contributions to the variability of CO flux over the Tibetan Plateau is essential for developing effective management strategies.
To investigate transboundary transport flux of CO over the Tibetan Plateau, this study employs a comprehensive array of data products, including the TROPOspheric Monitoring Instrument (TROPOMI), the fifth-generation European Centre for Medium-Range Weather Forecasts Reanalysis (ERA5), and the Goddard Earth Observing System Composition Forecast (GEOS-CF). By integrating a closed-loop integral method with a regression model, we elaborate a top-down approach based on satellite remote sensing to estimate the CO flux across the Tibetan Plateau. This quantitative analysis encompasses transport flux of CO along the Tibetan Plateau boundary (hereafter the closed-loop flux), spanning the surface at 1000 hPa to the stratosphere at 50 hPa, over a nearly 6-year time series from May 2018–April 2024. Our analysis emphasizes seasonal and inter-annual variabilities of the closed-loop CO flux. We further split the closed-loop CO flux into sub-fluxes arising from southwestern and northeastern segments, enabling us to quantify the impacts of surrounding areas on the Tibetan Plateau. This study aims to elucidate the spatiotemporal variabilities and the driving forces of the CO transport flux over the Tibetan Plateau, thereby providing scientific evidence for a deeper understanding of the Tibetan Plateau's role in global climate and environmental dynamics.
In the subsequent section, we present an overview of the Tibetan Plateau territory, providing a concise description of the dataset utilized, along with the methodologies employed for the closed-loop integral calculation and trend regression model. The third section delves into the spatiotemporal dynamics of the CO total column and transport flux over the Tibetan Plateau, highlighting the trend fitting outcomes. The fourth section elucidates the driving forces behind the variability of transboundary transport CO flux. The study culminates in the fifth section with a synthesis of our findings and conclusions.
This section introduces a geographical description of the Tibetan Plateau, the closed-loop integral method used to derive external influx and internal efflux of CO, the regression model used for trend analysis, and the dataset involved. Figure 1 provides a visual representation of the specific steps involved in applying different data products for the closed-loop integral flux calculation and regression model fitting, with further details elaborated in Sects. 2.2–2.5.
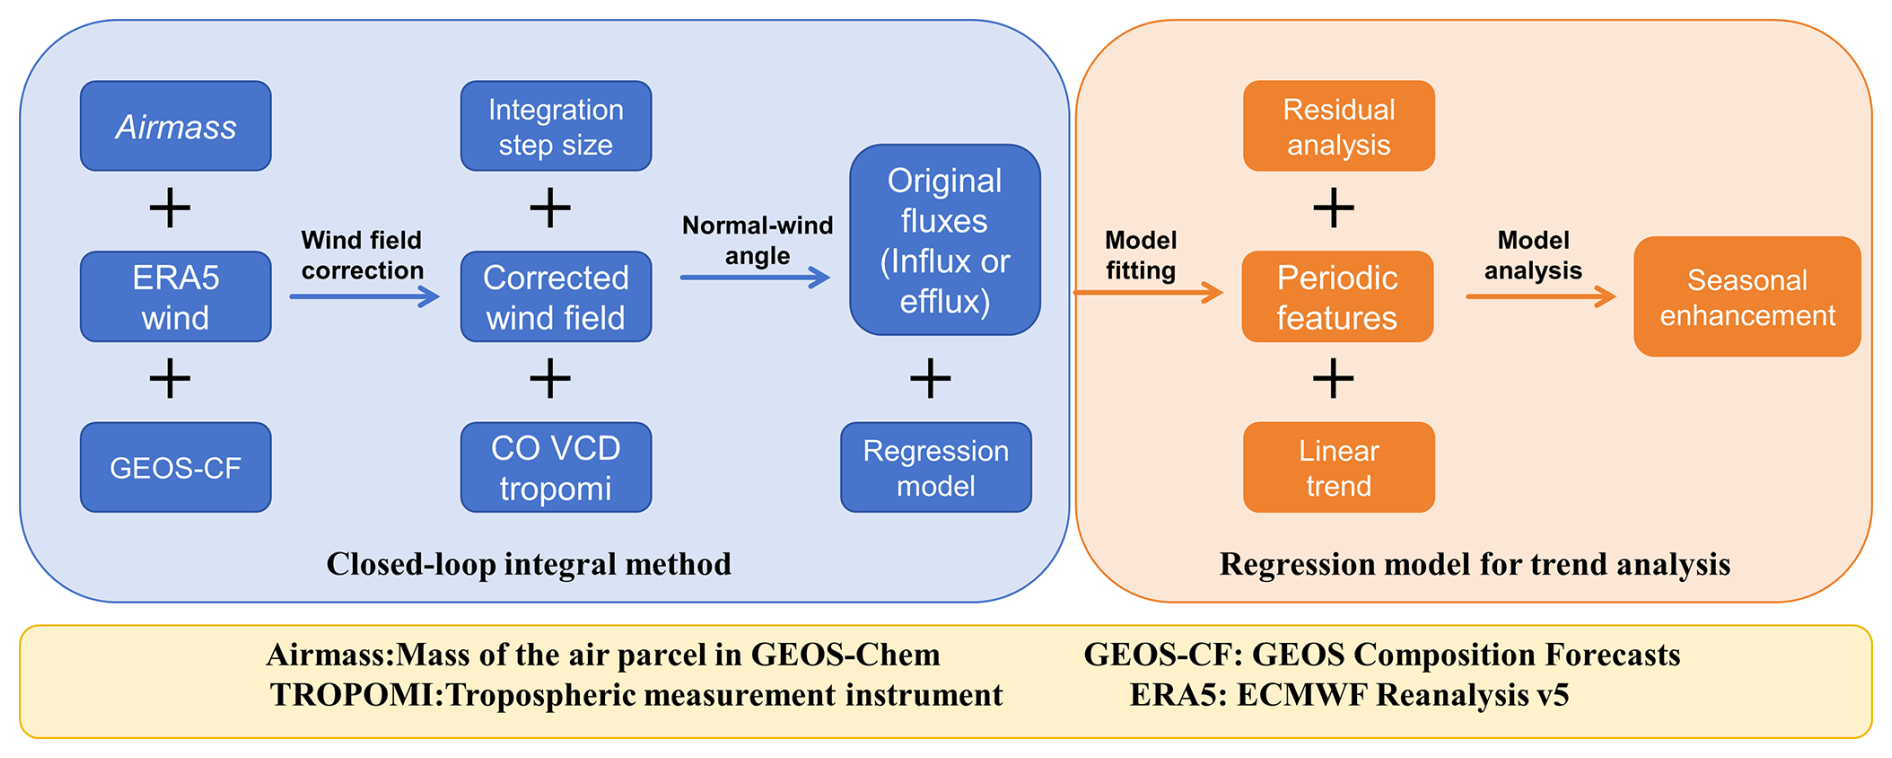
Figure 1Schematic illustrating the closed-loop integral method for calculating input–output fluxes using different data products and the regression model fitting method. The different data products, closed-loop integral method, and regression model are discussed in Sects. 2.2–2.6, respectively.
2.1 Geographical description of the Tibetan Plateau
We have conducted an analysis of both the external influx and internal efflux of CO across the Tibetan Plateau. The external influx refers to the quantity of CO that is transported from regions outside the Tibetan Plateau into its boundaries. Conversely, the internal efflux denotes the amount of CO that is generated within the Tibetan Plateau and dispersed to areas beyond its confines. As shown in Fig. 2, we bifurcated the Tibetan Plateau's geographical boundary into two segments. The first segment encompasses the southwestern Tibetan Plateau, which is significantly influenced by the South Asian monsoon. The substantial topographic rise in this area intensifies the monsoon's impact (Huang et al., 2023). The second segment is situated in the northeastern Tibetan Plateau, where the westerlies and the East Asian monsoon play a pivotal role. There is a marked geographical disparity between these two segments.
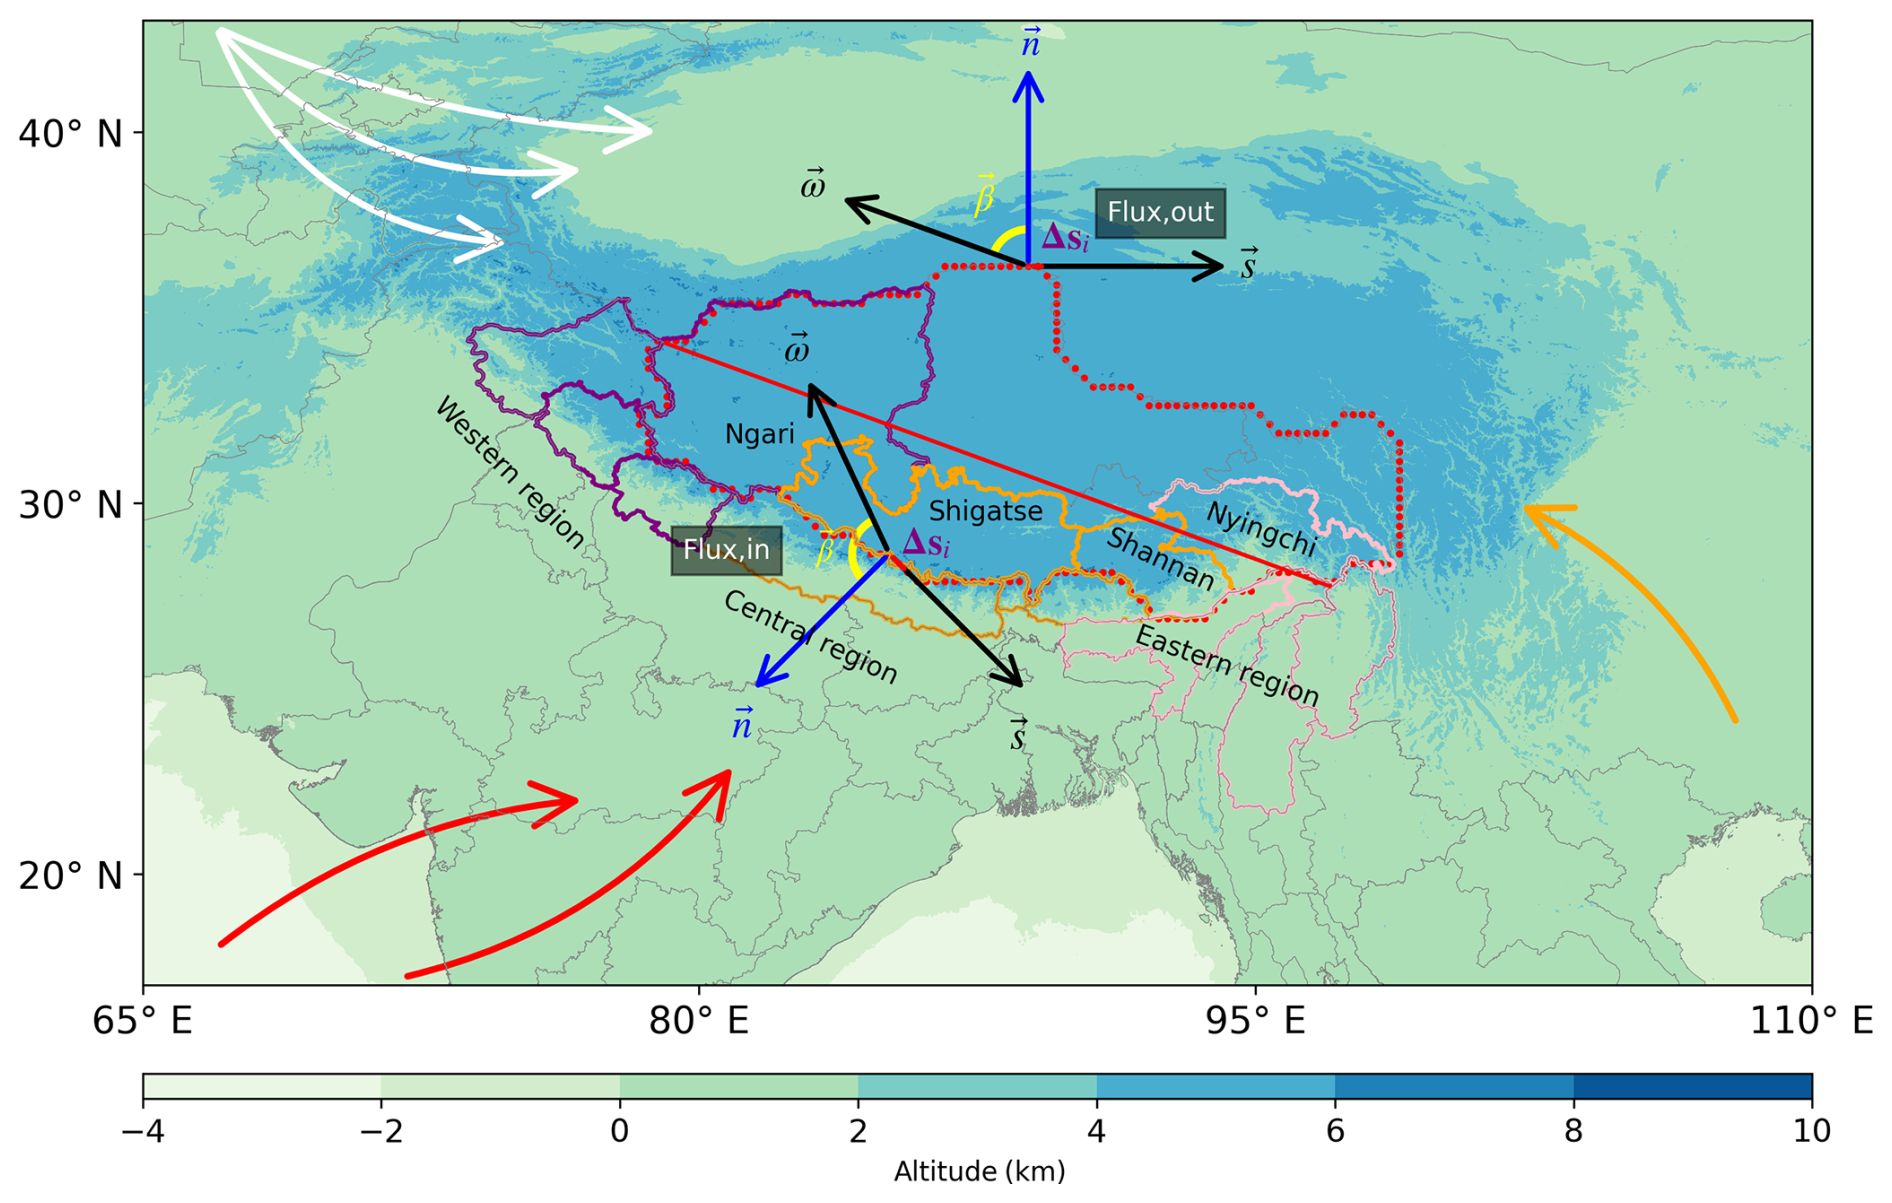
Figure 2Geographical description of the Tibetan Plateau and demonstration of the closed-loop integral method for CO flux calculation, with red points indicating the closed loop. The black arrow ω represents the wind field vector, s is the step vector for integration, and the blue arrow n denotes the boundary normal vector. β is the angle between the wind field vector ω and the boundary normal vector n, while Δs represents the integration step length. White arrows indicate the westerly circulation over the plateau, red arrows represent the South Asian monsoon, and orange arrows indicate the East Asian monsoon. Surrounding areas are categorized into western (in purple), central (in orange), and eastern (in pink) regions. Within the Tibetan Plateau, highlighted areas include Ngari Prefecture, Shigatse, Shannan, and Nyingchi. Elevation data are sourced from NOAA NCEI. The bold red line splits the closed loop of the Tibetan Plateau into southeastern and northeastern segments.
For comparison, we annotate the adjacent regions around the Tibetan Plateau. We categorize these regions into three broad zones: the western, central, and eastern zones. The western zone predominantly comprises Himachal Pradesh, Uttarakhand, and Ladakh. The central zone is characterized by Nepal, Sikkim, and Bhutan, while the eastern zone includes Assam, Sagaing, and Kachin State. A visual representation of these regional demarcations is presented in Fig. 2.
2.2 Dataset description
We utilize a comprehensive dataset encompassing the total column of CO measured by the TROPOMI instrument, the vertical profile of CO from the GEOS-CF system, meteorological data extracted from the ERA5 reanalysis, and atmospheric air mass simulated by the GEOS-Chem model.
TROPOMI is a push broom imaging spectrometer on the ESA Sentinel-5 platform, providing daily global coverage of CO total column at 13:30 local time (LT) (Veefkind et al., 2012; Landgraf et al., 2020). We used TROPOMI Level 2 CO and filtered the TROPOMI data according to the method of Landgraf et al. (2020); i.e., we removed all pixels with a TROPOMI quality mark below 0.5, leaving only data with no clouds or only low-altitude clouds. For convenience of calculation, we resampled the CO data product in space and time to match the spatiotemporal resolution of the meteorological field.
ERA5 is the fifth generation of atmospheric reanalysis dataset for global climate from ECMWF (European Centre for Medium-Range Weather Forecasts). It has provided hourly global atmospheric, land surface, and ocean wave estimates since 1950 and is produced by the Copernicus Climate Change Service (C3S) of ECMWF (Hersbach et al., 2020). We extracted the wind vectors that are coincident with the Sentinel-5's overpass time with a vertical resolution of 50 hPa from 50–900 hPa and 25 hPa from 900–1000 hPa.
Since a measurement-based CO profile is not available, the vertical CO profile from the GEOS-CF system is used to correct the vertically non-uniform distribution of the CO concentration and wind field. The GEOS-CF system is a near-real-time high-resolution (0.25°×0.25°) global 3D coupled chemical and meteorological modelling system developed by NASA's Global Modeling and Assimilation Office (GMAO) (Keller et al., 2021). Since 2018, GEOS-CF has provided global CO vertical profiles at 23 pressure levels (from 1000–10 hPa) on an hourly basis.
The air-mass dataset used for calculating CO flux comes from the simulations of GEOS-Chem model version 12.2.1 (https://doi.org/10.5281/zenodo.2580198, International GEOS-Chem Community, 2019) (Long et al., 2015). The model is driven by assimilated meteorological data obtained from the Goddard Earth Observing System (GEOS) of NASA's Global Modeling and Assimilation Office (GMAO) (Bey et al., 2001). The GEOS-FP dataset has a horizontal resolution of 0.25° latitude × 0.3125° longitude and includes 47 vertical levels from the surface to 0.01 hPa. Surface meteorological variables and planetary boundary layer height (PBLH) are provided with a 1 h interval. We used a nested grid version of GEOS-Chem with a horizontal resolution covering the East Asia region (70–140° E, 15–55° N), with boundary conditions derived from a global simulation at a resolution of 2° latitude × 2.5° longitude (Lee and Park, 2022).
2.3 The closed-loop integral method for CO flux calculation
We use the closed-loop integral method from Shaiganfar et al. (2017) to calculate the CO flux along the Tibetan Plateau boundary. With this closed-loop integral method, the external influx (“Flux, in”) and internal efflux (“Flux, out”) of CO across the Tibetan Plateau can be calculated as Eqs. (1) and (2), respectively. The calculation flow is shown in Fig. 1, and the calculation methodology diagram is in Fig. 2.
where VCD(Si) represents the CO total column located at the path Si, which represents the ith segment of the path S. βi is the angle between the wind field vector ω and the boundary normal vector n. If βi>90°, it indicates an external influx, representing the quantity of CO that is transported from regions outside the Tibetan Plateau into its boundaries. If βi<90°, it indicates an internal efflux, representing the amount of CO that is generated within the Tibetan Plateau but dispersed to areas beyond its confines. ΔSi represents the integration step size. “Flux, net”, calculated as the difference between Flux, in and Flux, out, represents the net CO flux across the Tibetan Plateau boundary. If Flux, net>0, it means that the portion transported from outside regions into the Tibetan Plateau is larger than the portion transported from the Tibetan Plateau to the outside regions and vice versa for Flux, net<0.
2.4 Wind field correction and uncertainty
ERA5 provides wind field components u and v along with their uncertainties σu and σv. Therefore, the wind speed ωspd and wind direction wdir can be calculated as
The uncertainty in the wind field can be calculated using the following error propagation formulas:
where σwspd and σwdir are the uncertainties in wind speed and wind direction, respectively. σu(zi) and σv(zi) are the uncertainties in u(zi) and v(zi), and are the partial derivatives of wspd(zi) with respect to u(zi) and v(zi), and and are the partial derivatives of wdir(zi) with respect to u(zi) and v(zi), respectively. The zi represents the height of the wind field.
Since CO concentration and wind field are distributed non-uniformly along with the vertical height, a vertically averaged wind field is needed for flux calculation to minimize errors caused by these non-uniformities. In order to do so, we first convert the volume mixing ratio (VMR) of CO at each altitude into mass concentration (the product of vertical profile and atmospheric air mass) via Eq. (7). We then take it as the weighting function to correct the original wind field via Eq. (8) (Shaiganfar et al., 2017; Huang et al., 2020). Meanwhile, we calculate the uncertainty in the wind field following the method of Huang et al. (2020).
where ω(zi), θ(zi), xj(zj), and air massj(zj) represent the wind field vector, the wind direction, CO VMR concentration, and air mass at height zj along the j segment of the integration path, respectively. ωj,avg is the weighting averaged wind field along the j segment of the integration path, and σωz and σθz are the uncertainties in the corrected wind field and wind direction, respectively.
2.5 Regression model for trend analysis
We establish a regression model expressed as Eqs. (10) and (11) to simulate the seasonal and inter-annual variabilities of transboundary transport CO flux along the Tibetan Plateau boundary. This model consists of a third-order Fourier series and a linear function. We refer to Sun et al. (2021) for a detailed description of its resampling methodology. The fitting process steps are detailed in Fig. 1.
where Yorg(t) and Ymod(t) are the original and the fitted time series of CO flux, respectively. A0 is the intercept, A1 is the annual growth rate, and t represents the number of days since May 2018. The ε(t) is the residual between the original and the fitted results. The coefficients A2−A5 describe the seasonal cycle, and is the inter-annual trend. Deviations of CO fluxes from their average seasonal values, known as seasonal enhancements, are calculated according to Eq. (12).
3.1 CO Variability over the Tibetan Plateau
The CO total column over the Tibetan Plateau and its surrounding regions, derived from TROPOMI observations (Figs. S2 and S3 in the Supplement), was analysed to investigate the diurnal, seasonal, and inter-annual variations along the Tibetan Plateau boundary. Additionally, fire data from the Moderate Resolution Imaging Spectroradiometer (MODIS) for 2019–2023 (Figs. S5–S9 in the Supplement) were incorporated to investigate potential influencing factors. The results show that the daily mean CO total column ranges from , while the seasonal mean ranges from . A severe CO pollution event was identified in the spring of 2021, which may be associated with the post-COVID-19 rebound in emissions (Madineni et al., 2021; Davis et al., 2022). Meanwhile, MODIS active fire counts in 2021 indicate a significant increase in fire activity in northern India, Nepal, and surrounding regions. The combined effect of heightened CO concentrations and intensified fire activity likely contributed to the anomalous enhancement of the CO total column in the southeastern segment of the Tibetan Plateau boundary from January to June 2021. As shown in Fig. 3, high levels of CO total column in all seasons are observed in the southeastern segment of the Tibetan Plateau boundary, which is adjacent to southeastern Asia. We employ the regression model to fit the CO total columns averaged along the closed-loop, the southwestern, and the northeastern segments of the Tibetan Plateau boundary. The fitting results in Fig. 4 show that the model is capable of accurately capturing and replicating the seasonal and inter-annual variabilities of CO total column. The correlation coefficient (r) values achieved are 0.84, 0.90, and 0.75, while the root mean square error (RMSE) is 0.54×10¹⁷, 0.41×10¹⁷, and for the closed-loop, the southwestern, and the northeastern segments, respectively. Satellite observations and the fitted results show distinct seasonal characteristics. Elevated levels of CO total column are observed along the closed-loop, northeastern, and southwestern segments from late spring to summer, while lower levels occur during autumn and winter. The closed-loop, southwestern, and northeastern segments all exhibit a bimodal seasonal cycle. The closed-loop and southwestern segments have a pronounced peak in late spring and a minor peak in early autumn, whereas the northeastern segment has a minor peak in late spring and a pronounced peak in early autumn. Notably, significant fluctuations in the CO total column averaged along the closed-loop, southwestern, and northeastern segments occur in autumn and winter, with more substantial fluctuations in autumn than in winter. Over the past 6 years, the CO total column averaged along the closed-loop, southwestern, and northeastern segments has shown an upward annual trends of 0.95×10¹⁶, 0.77×10¹⁶, and , respectively.
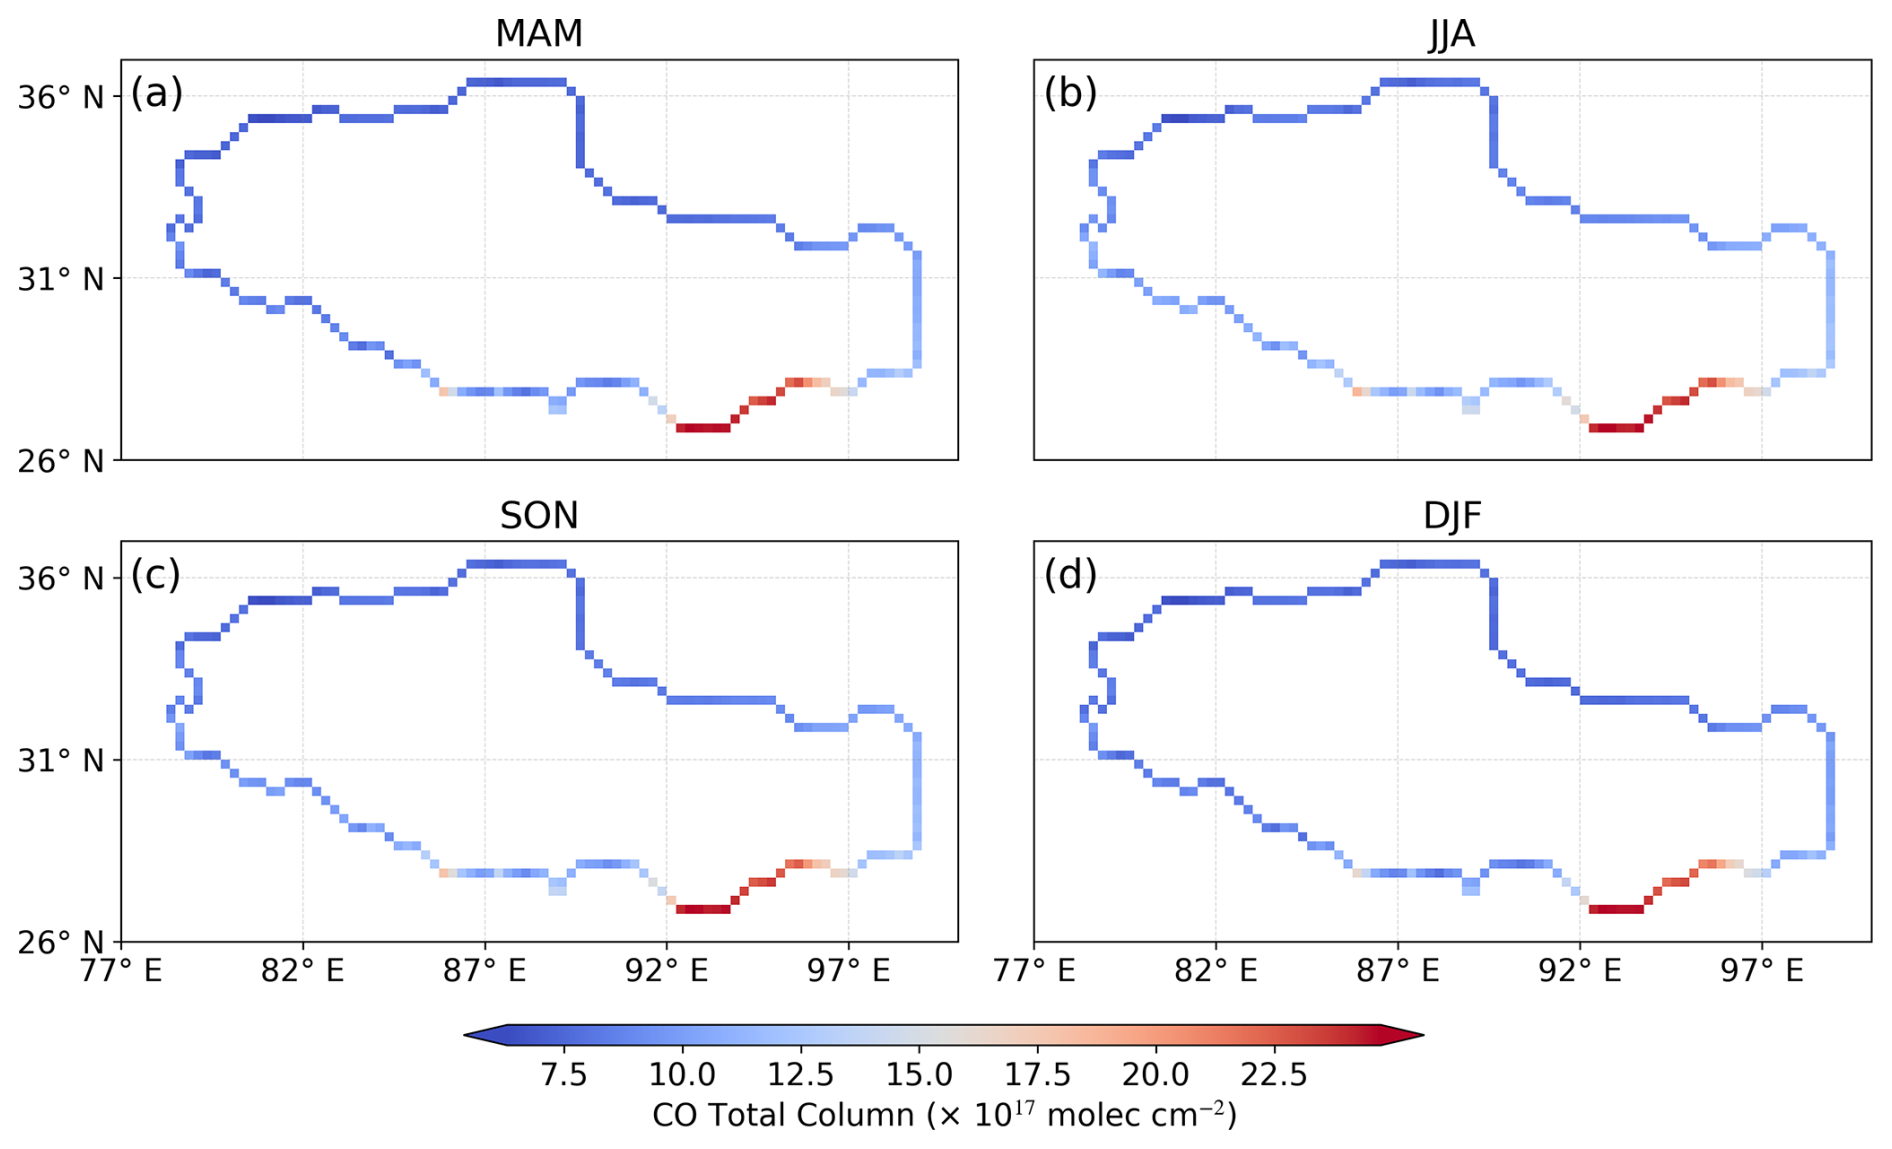
Figure 3Seasonal average of CO total column over the Tibetan Plateau, which is derived from data collected across all days from May 2018–April 2024 and is categorized by spring, summer, autumn, and winter.
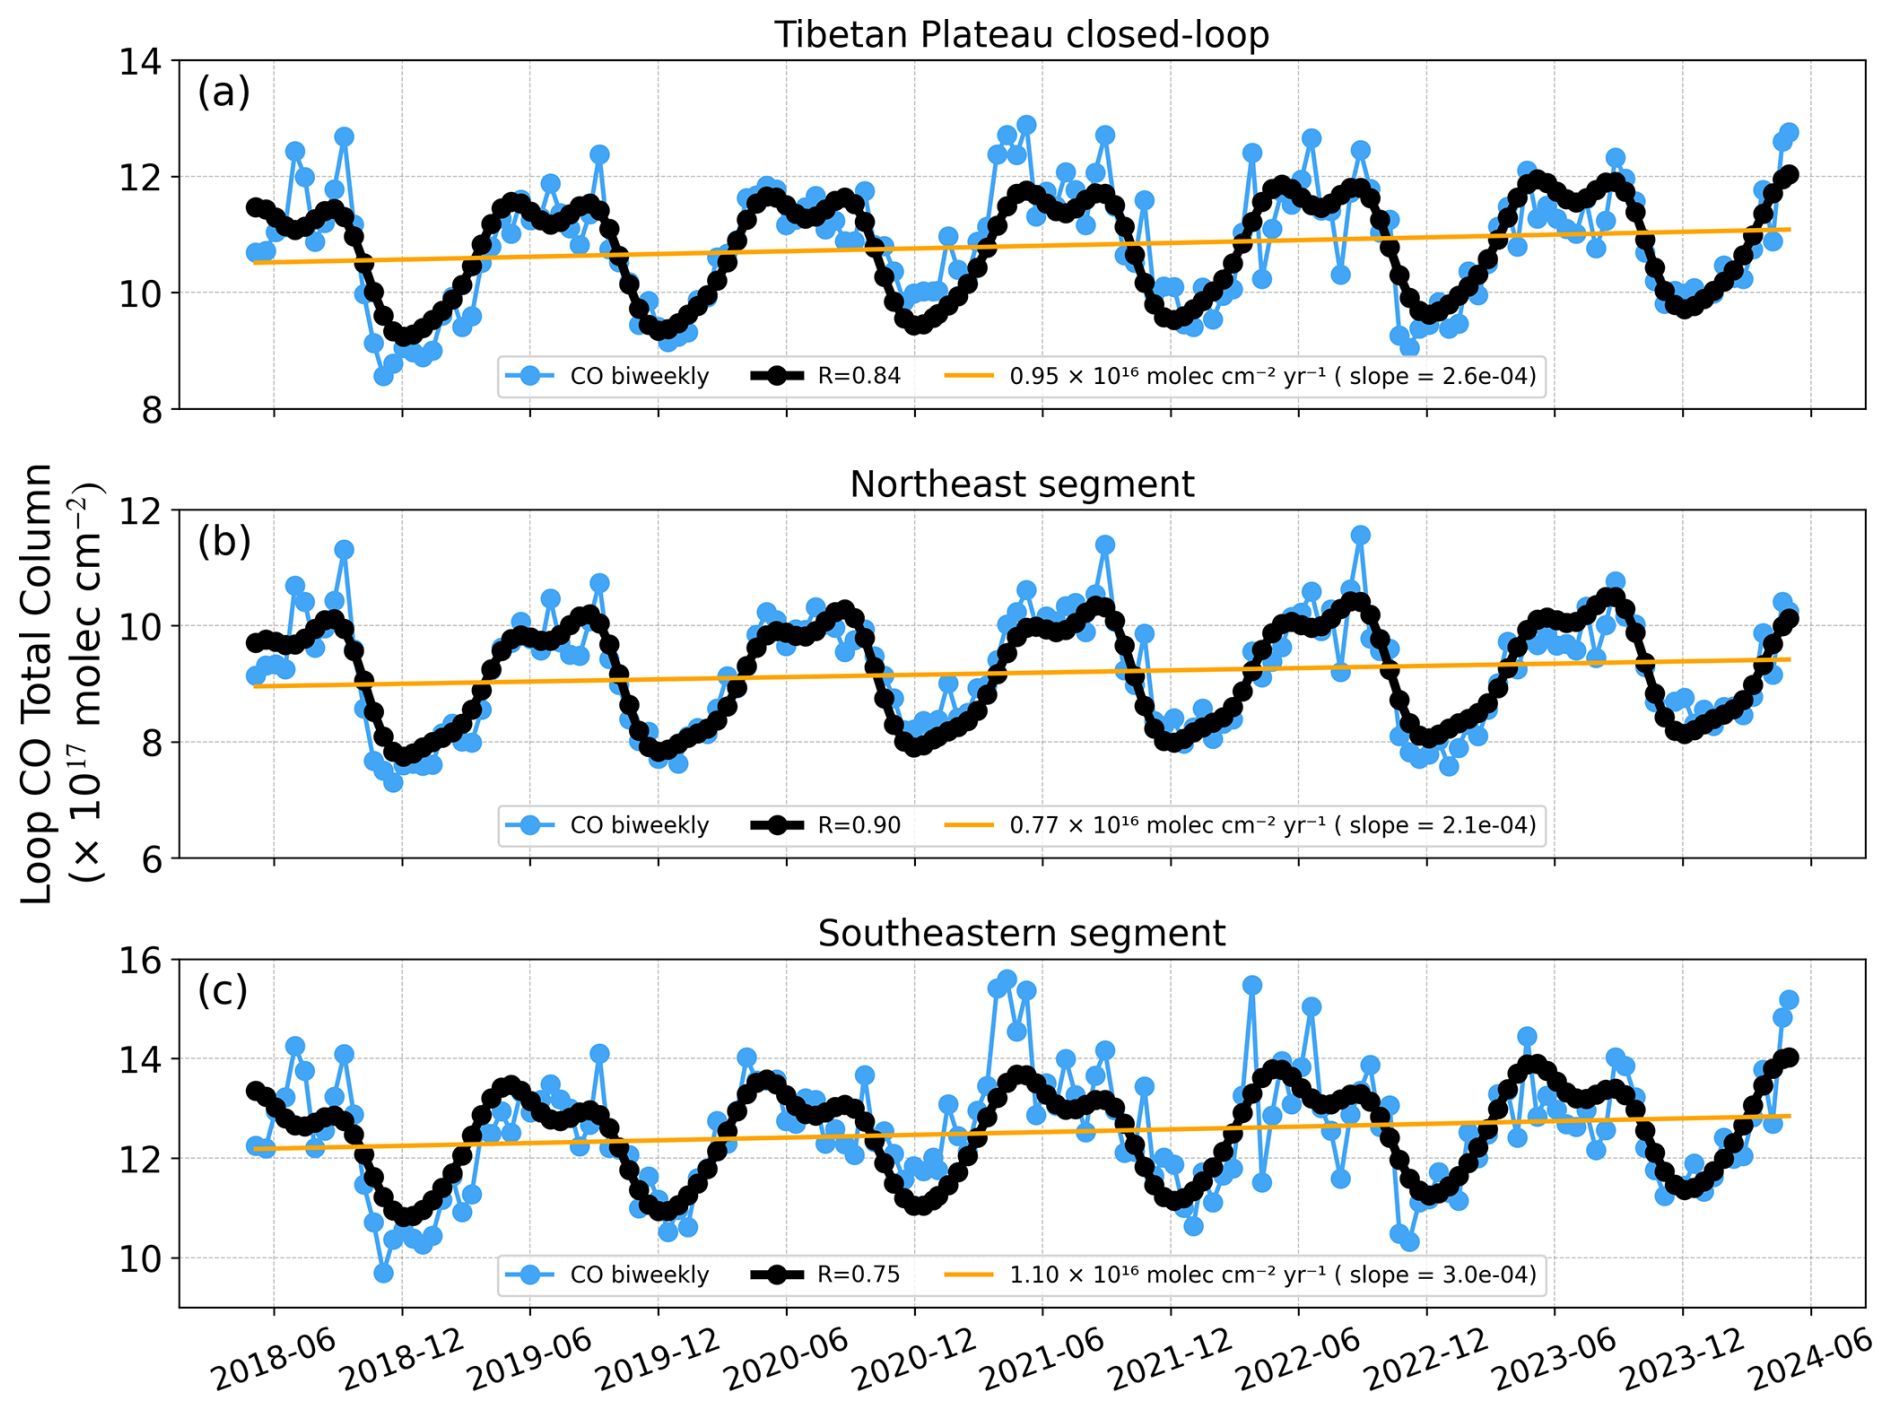
Figure 4Panels (a)–(c) depict the inter-annual variabilities of CO concentrations in the closed loop of the Tibetan Plateau, as well as the northeastern and southwestern segments, from May 2018–April 2024. Blue dots represent biweekly averaged CO total column. The panels illustrate the seasonal trend (black line) and inter-annual trend (orange line) fitted by the seasonal cycle model.
It is noteworthy that the seasonal variation of surface CO concentrations monitored by CNEMC in Tibet differs from that of the CO total column. Surface CO concentrations peak in winter and spring, while they are at their lowest in autumn. Among all cities in Tibet, except for Shigatse and Nyingchi, where the surface CO concentrations increase by 0.2 , the remaining five cities (Ali, Lhasa, Shannan, Nagqu, and Chamdo) show a decrease of 0.03–0.09 . Shigatse and Nyingchi are located near regions such as Nepal and Assam in India, where CO concentrations are relatively high, which may explain the observed increase in surface CO levels in these areas.
The seasonal variation patterns of surface CO concentration and total column CO differ due to multiple influencing factors. Surface CO concentration is primarily governed by local emission sources such as combustion and industrial activities, whereas total column CO reflects the overall atmospheric CO distribution, including contributions from long-range transport. During winter and spring, increased combustion from heating and agricultural activities leads to elevated surface CO levels, while lower temperatures and reduced surface emissions in autumn contribute to a decline.
The total column CO over the Tibetan Plateau exhibits peak concentrations in late spring and early autumn, likely driven by monsoon transitions, local air mass convergence, seasonal shifts in atmospheric transport, and fluctuations in biomass burning activity. Overall, the distinct seasonal variation patterns of surface CO and total column CO highlight the complex interplay between local emissions and large-scale atmospheric transport processes.
3.2 Variability of transboundary transport CO flux
Figure 5 illustrates the seasonal variations in CO total flux across the grid points along the Tibetan Plateau boundary from May 2018–April 2024, revealing distinct differences between the southwestern and northeastern segments. The southwestern segment is predominantly characterized by CO influx throughout the year, with the strongest influx occurring in winter, while the northeastern segment primarily experiences CO efflux. These spatial differences are closely tied to geographic factors and reflect the influence of distinct atmospheric circulation systems on the southeastern and northwestern segments of the Tibetan Plateau, leading to divergent seasonal CO exchange patterns.
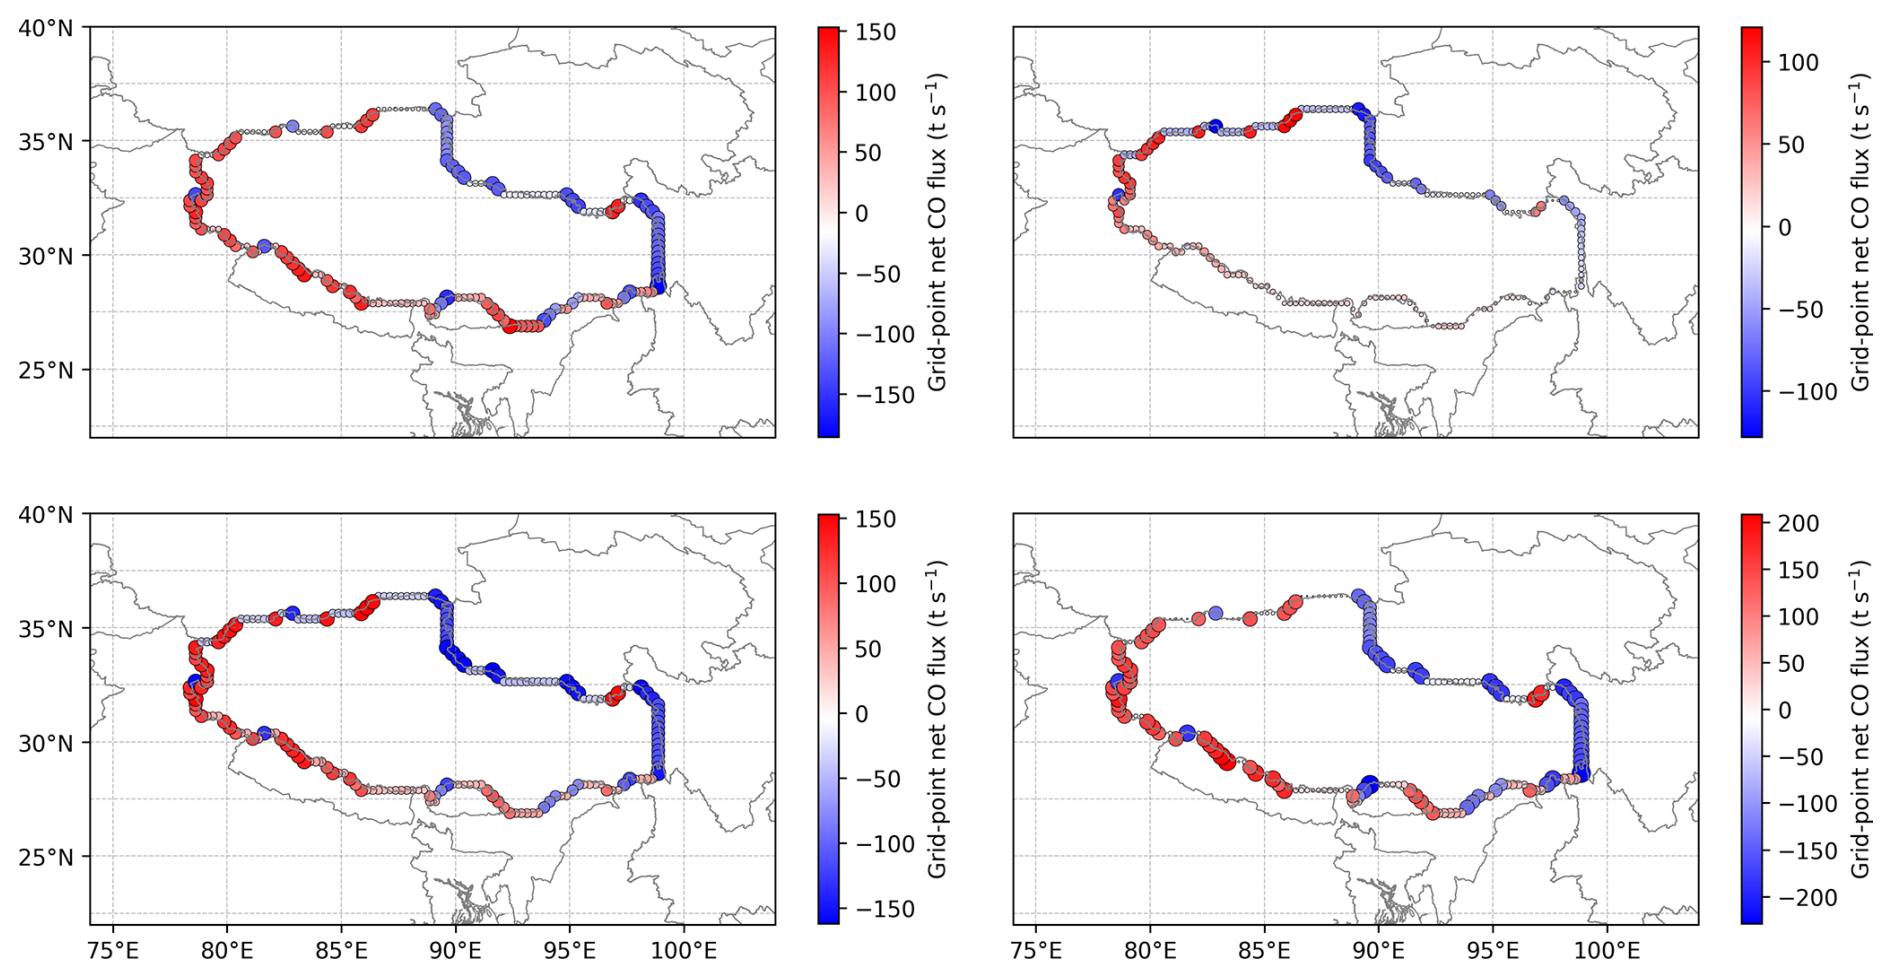
Figure 5The total CO flux for each grid across different seasons, based on data from May 2018–April 2024, categorized into spring, summer, autumn, and winter. Red indicates external influx to the Tibetan Plateau, while blue represents internal efflux. Bubble size is proportional to flux magnitude, with positive and negative values denoting influx and efflux, respectively.
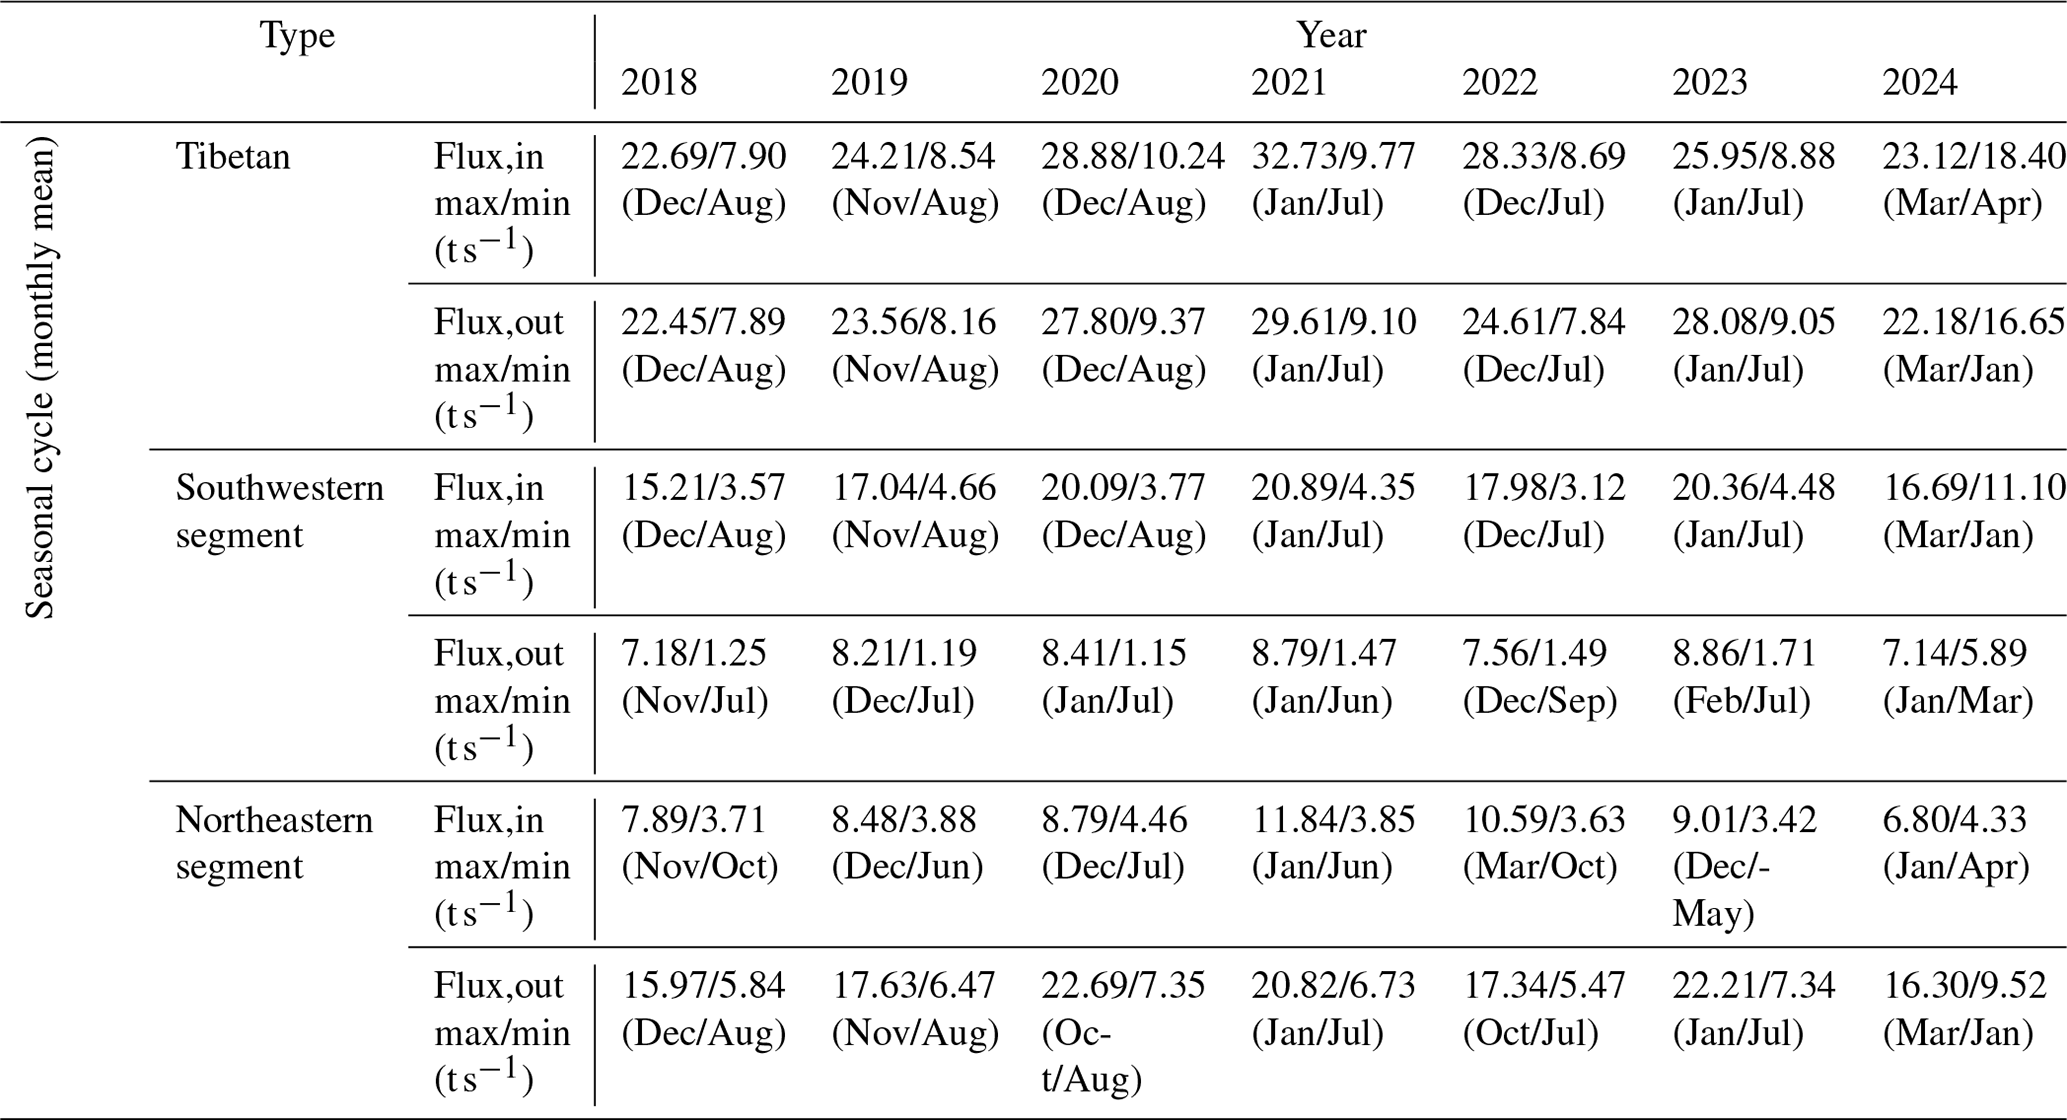
Building upon this, Fig. 6 shows the seasonal cycles of both external influx and internal efflux of CO across the closed-loop, southwestern, and northeastern segments of the Tibetan Plateau. Summary of the corresponding statistics are tabulated in Table 1. The results show that the external influx and internal efflux of CO across the closed-loop, southwestern, and northeastern segments in each year are relatively close and have similar seasonal characteristics. High levels of CO flux occur in late autumn to winter, and low levels occur in summer. In most cases, CO flux maximizes in November, December, or January and minimizes in July or August. The month-to-month variability during late autumn to winter is greater than that in summer. For the closed loop of the Tibetan Plateau, the CO external influx varies between 7.90–32.73 t s−1, and the internal efflux varies between 7.84–29.61 t s−1. In comparison, the external influx in the southwestern segment fluctuates between 3.12 and 20.89 t s−1, while the internal efflux ranges from 1.15–8.86 t s−1. In the northeastern segment, the external influx varies between 3.42 and 11.84 t s−1, and the internal efflux spans 5.47–22.69 t s−1 (Table 1).
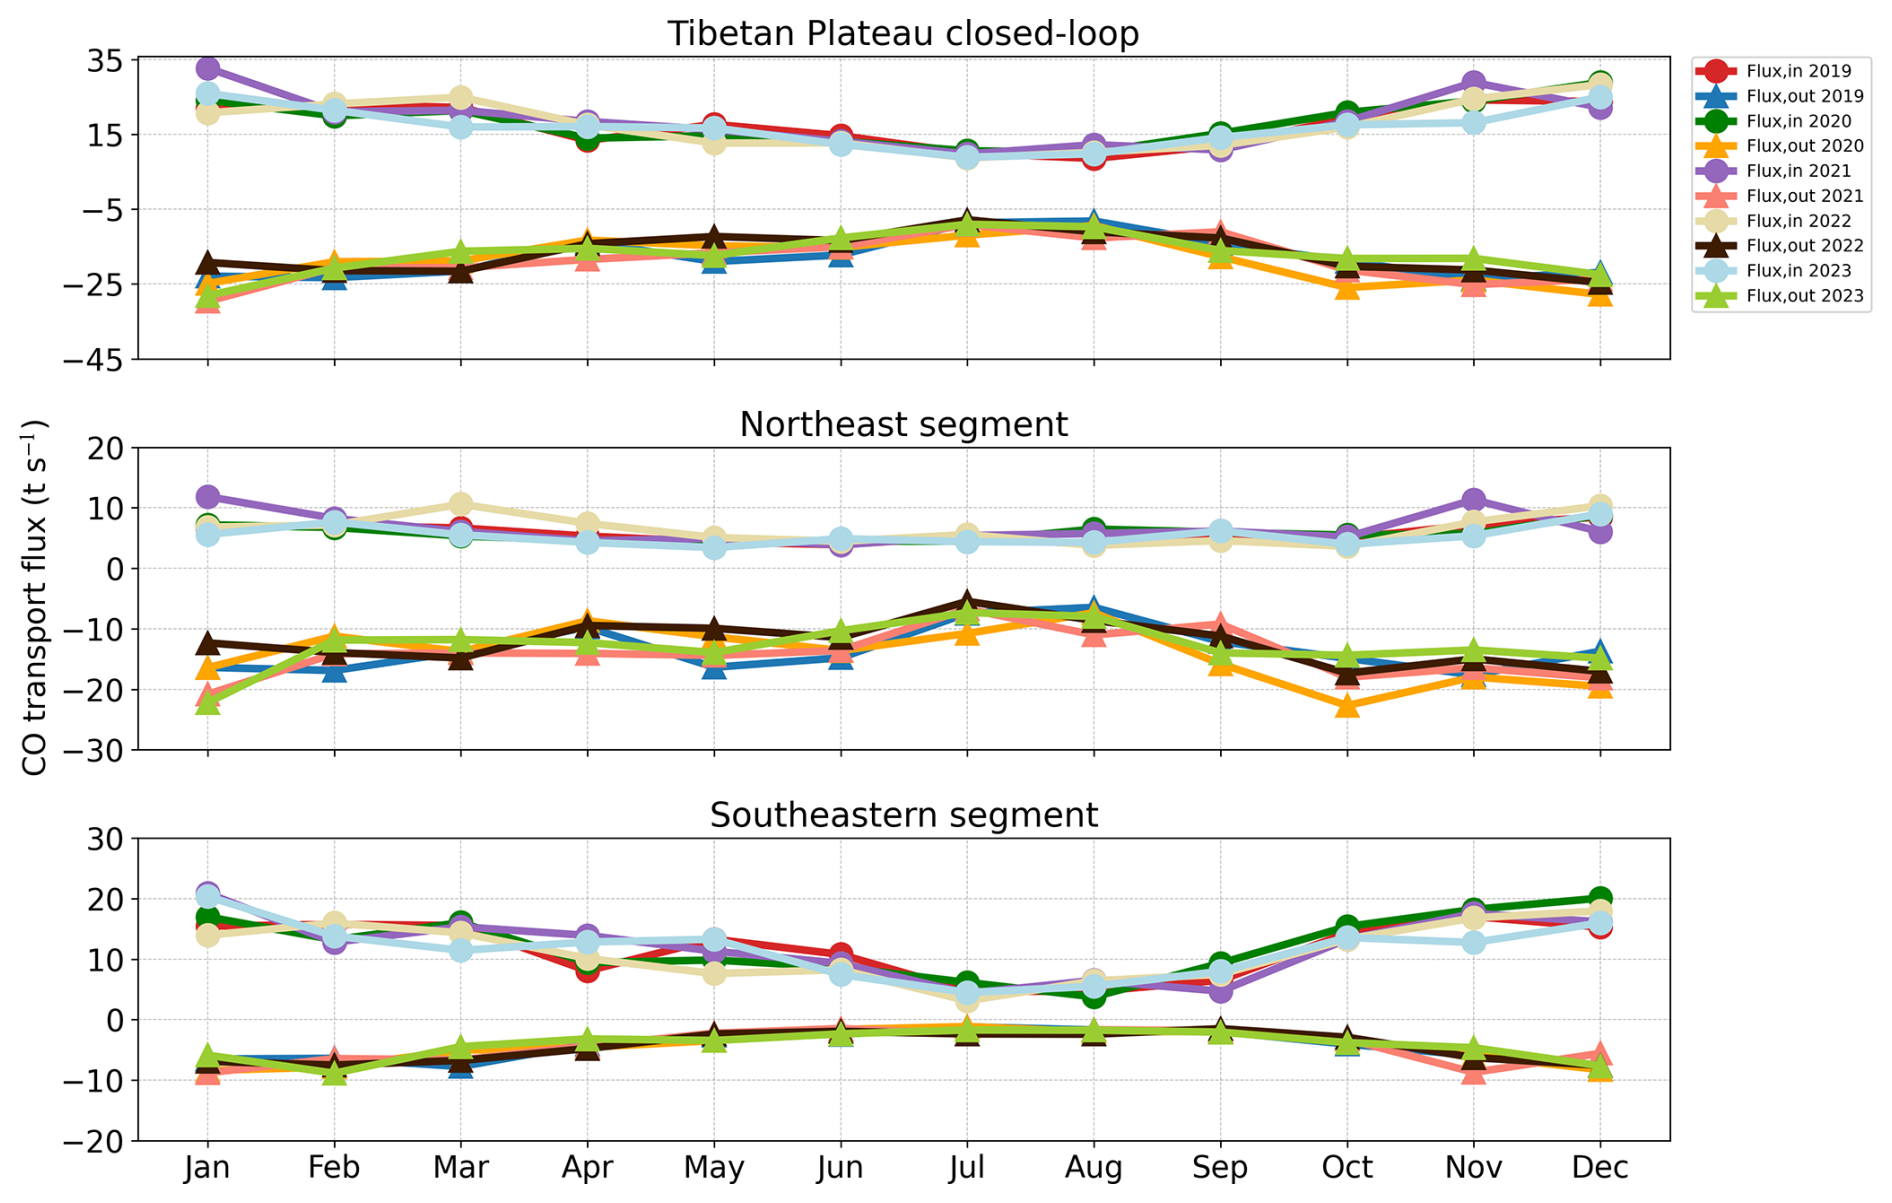
Figure 6Monthly averaged external influx and internal efflux of CO over the closed-loop, the southwestern, and the northeastern segments of the Tibetan Plateau. Results are presented based on 5 complete years (2019–2023).
Table 1Statistics of the external influx and internal efflux of CO across the closed-loop, the southwestern, and the northeastern segments of the Tibetan Plateau from May 2018–April 2024.
To quantify these trends, we applied an inter-annual regression model to fit the external influx, internal efflux, and net flux of CO averaged along the closed-loop, southwestern, and northeastern segments of the Tibetan Plateau. The fitting results in Fig. 7 show that the model is capable of accurately capturing and replicating the seasonal and inter-annual variabilities of all kinds of fluxes, yielding high correlation coefficients (r) and low root mean square errors (RMSEs). For the closed-loop CO flux, the external influx and net flux show slight positive trends, with inter-annual growth rates of 2.86 and 4.56 Tg CO yr−1, respectively. In contrast, the internal efflux displays a slight negative trend of . In the southwestern segment, the external influx and internal efflux exhibit similar variabilities, with annual mean values of 11.76 and 4.41 t s−1, respectively. The annual growth rates for external influx and internal efflux are 2.31 and , respectively. In comparison, the external influx and internal efflux in the northeastern segment exhibit notable differences, with average values of 5.94 and 13.17 t s−1 and annual growth rates of 0.64 and , respectively. The annual growth rates for net fluxes in the southwestern and northeastern segments are 2.59 and 1.86 Tg CO yr−1, respectively.
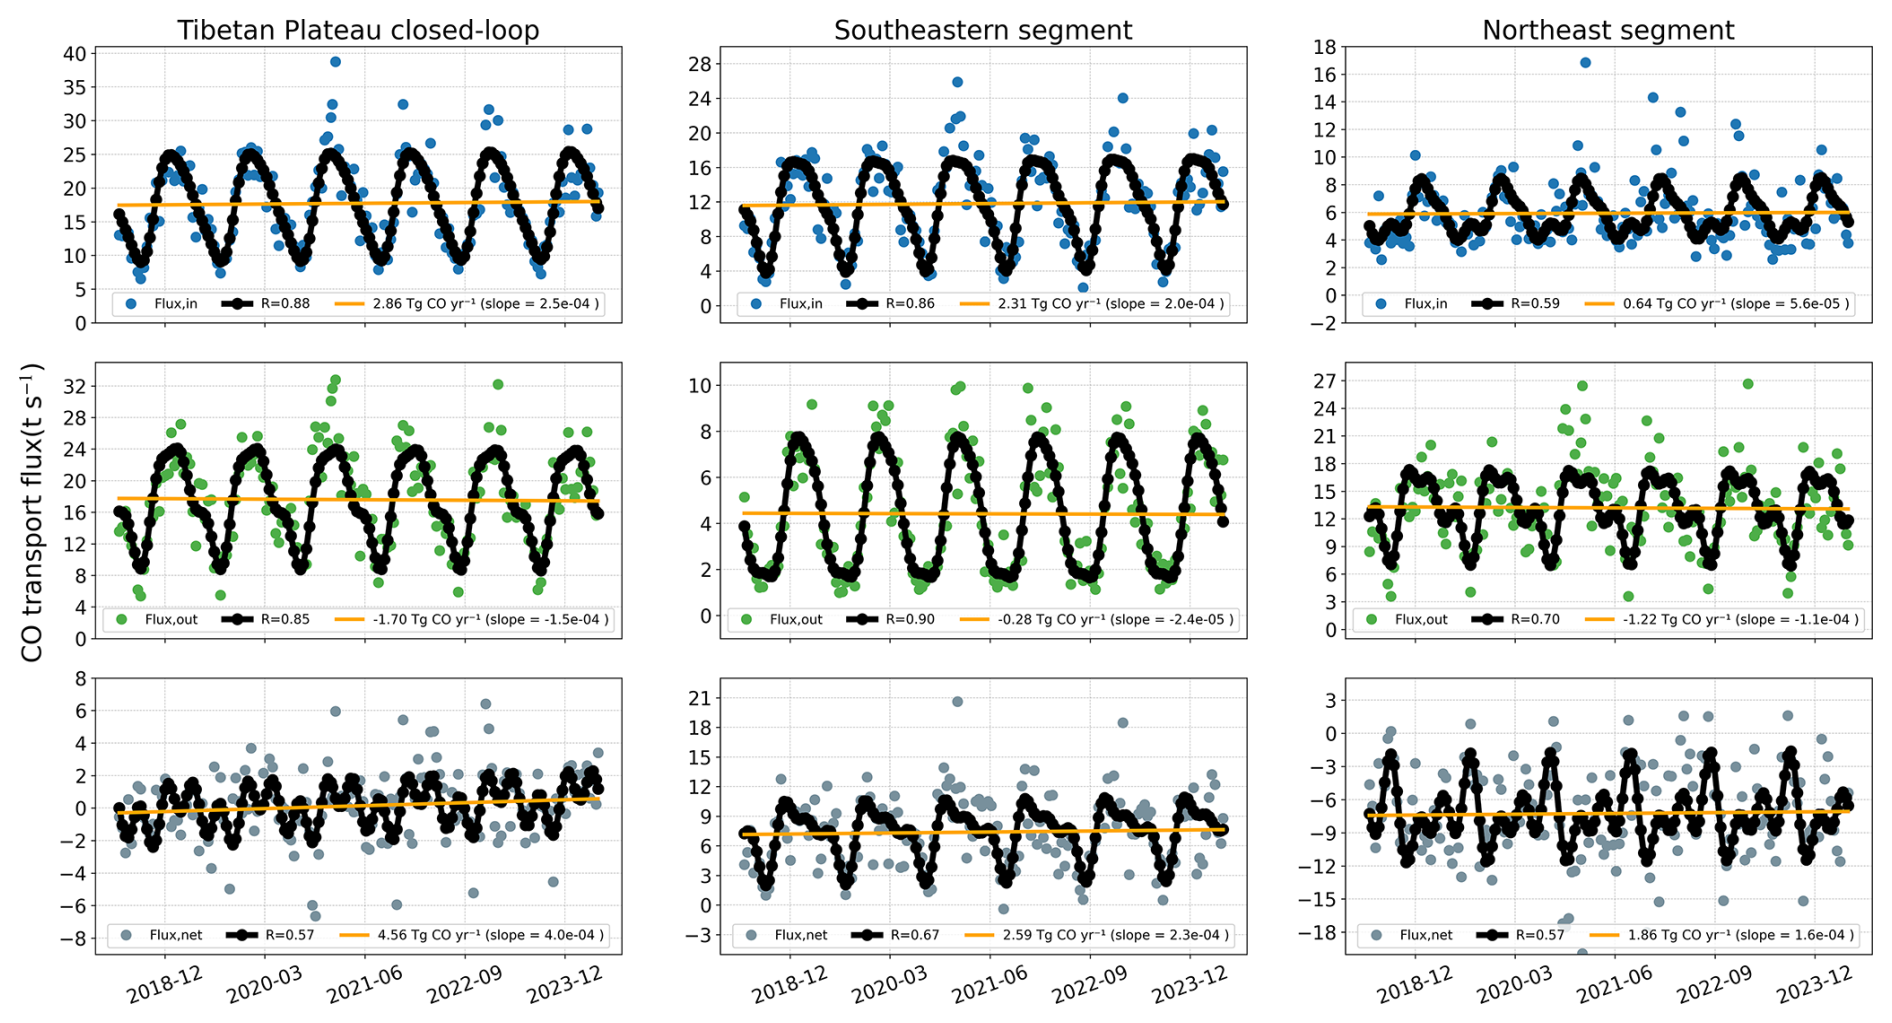
Figure 7Inter-annual variabilities of external influx, internal efflux, and net flux of CO over the closed-loop, the southwestern, and the northeastern segments of the Tibetan Plateau from May 2018–April 2024. Blue dots represent external influx, green dots indicate internal efflux, and grey dots show net flux. The seasonal trend (black line) and inter-annual trend (orange line) are fitted using the seasonal cycle model.
This suggests that in recent years, the Tibetan Plateau has experienced an increase in external influx, while the internal efflux has slightly decreased. The magnitude of the increase in external influx in the southwestern segment is greater than in the northeastern segment. Conversely, the magnitude of the decrease in internal efflux in the northeastern segment is greater than in the southwestern segment.
3.3 Uncertainty of CO flux calculation
From May 2018–April 2024, the external influx and internal efflux of CO averaged along the Tibetan Plateau were 17.70 and 17.56 t s−1, respectively, resulting in a net influx of 0.13 t s−1. These estimates are based on TROPOMI overpasses (13:30 LT). Extrapolating to a full year, the external influx, internal efflux, and net influx are estimated to be 558.19, 553.77, and 4.10 Tg CO yr−1, respectively. These values are comparable to CO emissions estimated by Borsdorff et al. (2020) for Mexico and Leguijt et al. (2023) for African cities (Borsdorff et al., 2020; Leguijt et al., 2023).
The complex terrain of Tibetan Plateau, with its significant fluctuations in elevation and ground albedo, coupled with the variable mixture of the Asian monsoon and local valley winds, greatly increases the uncertainty of calculating CO flux over the Tibetan Plateau. TROPOMI-based CO flux calculations over the Tibetan Plateau are influenced by various factors (Shaiganfar et al., 2011, 2017; Tan et al., 2019; Huang et al., 2020). Here we identify two primary sources of uncertainty: CO total column and the closed-loop wind field.
From May 2018–April 2024, the daily CO total column over the Tibetan Plateau varied from . The averaged standard deviation varied from , corresponding to error margins from 0.81 % to 17.89 %. The average error in CO total column along the Tibetan Plateau's closed loop was 4.27 %.
Wind speed and direction uncertainties significantly affect CO flux calculations. The Tibetan Plateau's complex terrain exacerbates wind variability. Using formulas (5), (6), and (9), in Sect. 2.3, we calculated the uncertainties from the corrected wind field across 22 levels from 1000–50 hPa. The averaged wind speed and direction uncertainties were 3.39 m s−1 and 54.55°, respectively. Wind speed uncertainty exhibited clear seasonal fluctuations. In spring (MAM), uncertainties ranged from 0.65–0.84 m s−1, while summer (JJA) saw a wider range of 0.90–1.15 m s−1. The lowest uncertainties were observed in autumn (SON), ranging from 0.53–0.65 m s−1. In winter (DJF), uncertainty values were slightly higher, between 0.65 and 0.71 m s−1. Wind direction uncertainty also varied seasonally, with values between 18.10° and 26.41° in spring, increasing to 24.17°–34.09° in summer. Autumn presented the lowest directional uncertainty, ranging from 16.50°–20.62°, while winter values were comparable to spring, at 19.07°–23.91° (Table 2).
Table 2Uncertainties in the corrected mean wind speed and direction for the wind field used for calculating the closed-loop flux of CO over the Tibetan Plateau.
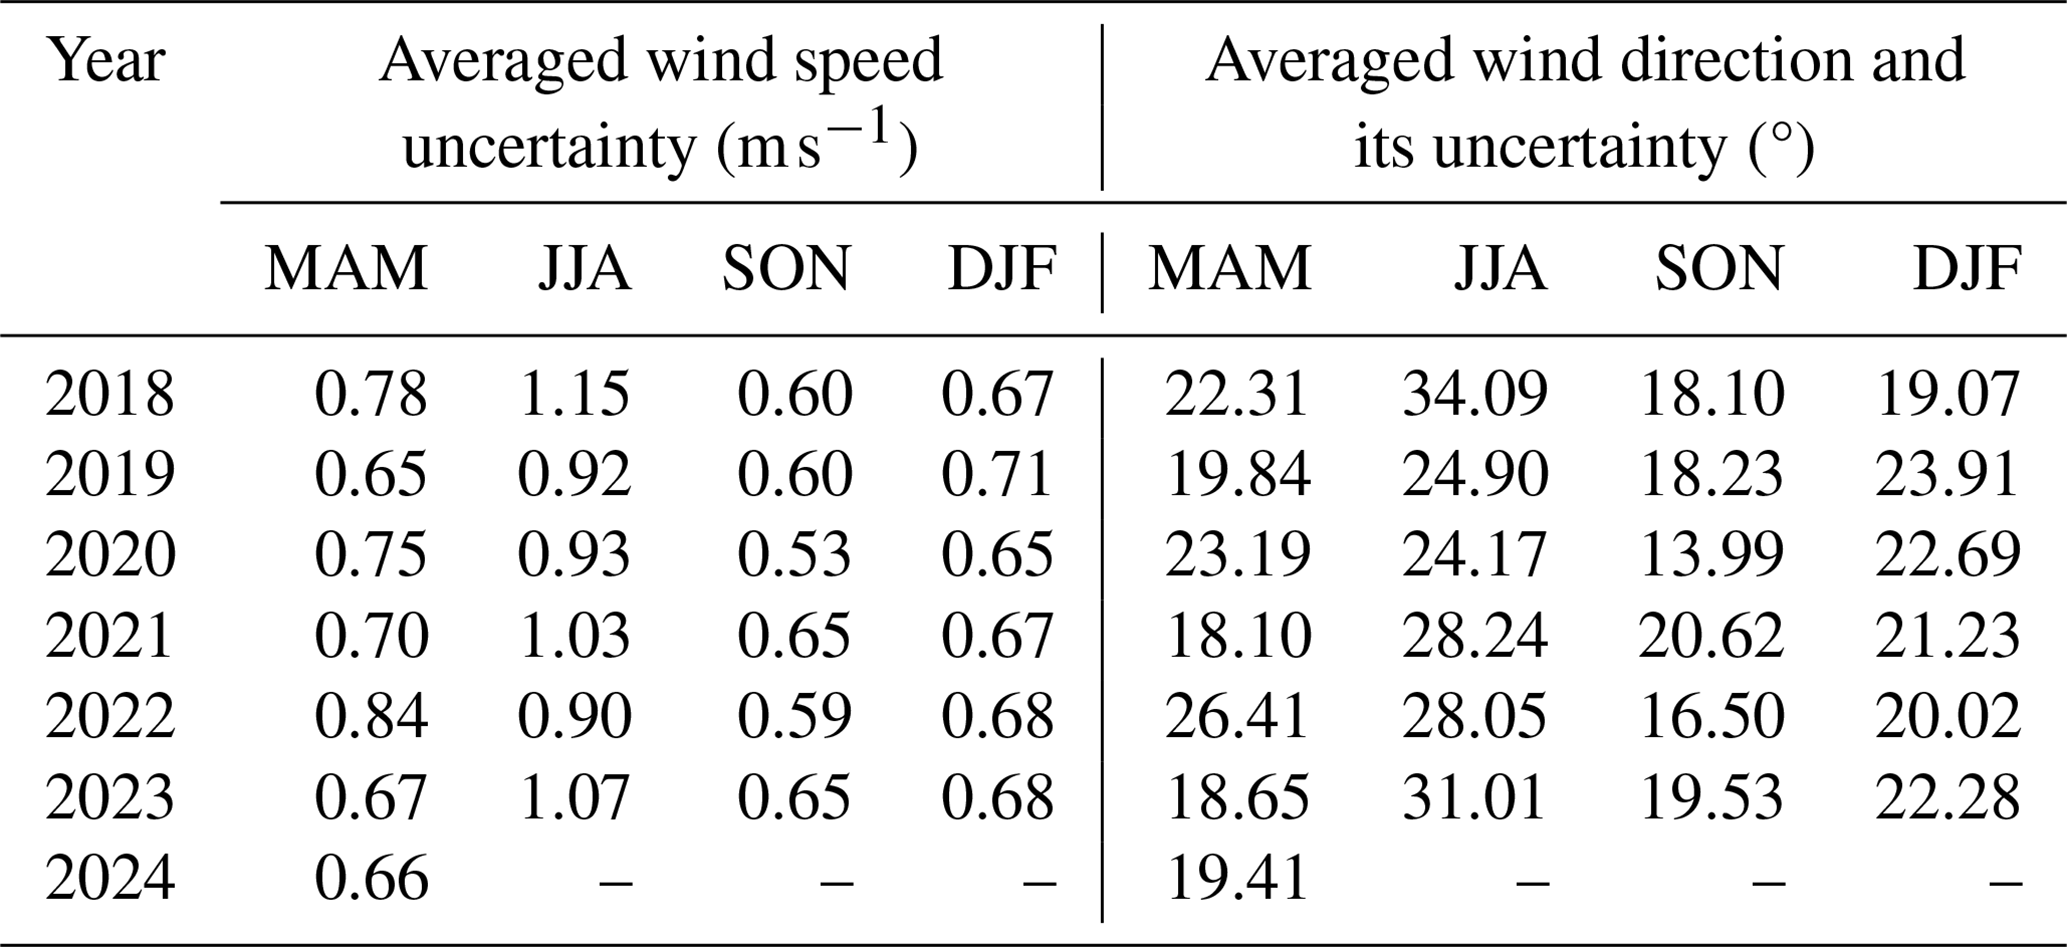
The average uncertainties for the corrected wind speed and direction were 0.78 m s−1 and 22.15°. In calculation of the closed-loop CO flux, considering only the uncertainty in wind speed results in an average error of 6.99 % in CO flux while accounting solely for wind direction uncertainty leads to an average error of 11.03 %. The total error induced by both the wind field and CO total column can be calculated using the error propagation equation. The uncertainty in CO flux caused by these factors amounts to 13.81 %.
The uncertainty in CO flux estimation significantly affects the interpretation of cross-border CO exchange. Seasonal variations in the uncertainty of wind speed and direction notably influence CO flux calculations, with higher uncertainties in spring and summer, potentially leading to greater fluctuation in flux estimates. In contrast, uncertainty is lower in autumn, making the results from this season more reliable. Regionally, the southeastern boundary of the Tibetan Plateau experiences more pronounced wind field changes due to the Asian monsoon, leading to higher uncertainty compared to the more stable northwestern region. These uncertainties may also impact the interpretation of key pollution events, such as the significant CO pollution event observed from January to June 2021. During this period, the uncertainties in wind speed (0.67–1.03 m s−1) and wind direction (18.10–28.24°) were considerable, meaning the actual CO net input could differ significantly from current estimates. While uncertainties do affect the precise values of CO flux, the overall trend remains robust. Therefore, when analysing seasonal and regional flux variations, particularly during the monsoon-influenced spring and summer, it is crucial to account for the impact of uncertainty.
4.1 Differences between southwestern and northeastern segments
For the closed-loop flux, both external influx and internal efflux exhibit significant fluctuations in winter from 2020–2023, followed by a rapid decline. Although the net flux also exhibited considerable fluctuations during this period, its seasonal variability was less pronounced compared to the external influx and internal efflux. The net flux is positive from January to May and in August and December but turns negative in June, in July, and from September to November. Specifically, the external influx in the southwestern segment consistently exceeds the internal efflux, whereas in the northeastern segment, the external influx is lower than the internal efflux. Furthermore, the external influx in the southwestern segment closely resembles that of the internal efflux in the northeastern segment, particularly during summer and early autumn when the rates of decline and increase are most pronounced. Conversely, during winter and early spring, the internal efflux in the southwestern segment aligns closely with the external influx in the northeastern segment. Additionally, in summer, the external influx in the northeastern segment surpasses the internal efflux in the southwestern segment.
In the southwestern segment, a significant increase in flux is noted during autumn, followed by a marked decline in late winter. The net flux variations are more intricate, yet they generally remain positive. The averaged net CO flux is recorded at 7.36 t s−1, with an annual growth rate of 2.59 Tg CO yr−1, typically exhibiting low values during the summer. Notably, from December to June in each year, the net flux experiences three distinct peaks. The first peak is observed during late autumn and winter, attributed to increased burning activities, such as winter heating and agricultural burning, alongside the enhanced transport of strong westerly airflow. These conditions contribute to elevated flux levels. Furthermore, cold winter temperatures inhibit the diffusion and dilution of pollutants, facilitating their accumulation in localized areas (Kunhikrishnan et al., 2004). The second peak occurs in spring, likely due to pollutant resuspension and enhanced photochemical production driven by rising temperatures and atmospheric changes (Assessment, 2004; Hung et al., 2022). The third peak is observed around June, coinciding with the strengthening of the South Asian monsoon. This seasonal shift brings increased moisture and airflow, which aids in diluting pollutants and facilitating their transport over long distances (Yu et al., 2017; Bian et al., 2020; Huang et al., 2023).
In the northeastern segment, the external influx peaks in both summer and winter. In winter, there is a marked increase in external influx, followed by two declines in early and late spring. This behaviour is likely influenced by the dynamics of the East Asian monsoon across different seasons and varying intensities of burning activities throughout the year. The internal efflux displays a more complex pattern, featuring three peaks and subsequent declines in winter, March, and June, which correspond to the three peaks of net flux observed in the southwestern segment. Similarly, the net flux variabilities in the northeastern segment are quite intricate. The average net CO flux is , with an annual growth rate of 1.86 Tg CO yr−1. The peak and trough values occur around autumn, specifically in late autumn to early winter for peaks and late autumn for troughs. This downward trend mirrors that of the internal efflux. Additionally, we observed the following points:
-
The CO flux transported through the southwestern segment into the Tibetan Plateau, along with its annual growth rate over the past 6 years, accounted for approximately 66.44 % and 77.61 % of the total CO flux within the Tibetan Plateau. This indicates that the external influx to the Tibetan Plateau and its changing trend are predominantly influenced by the southwestern segment. While CO transported through the southwestern segment into the Tibetan Plateau is on the rise, the CO flux transported outward through the northeastern segment is declining. In addition, based on the EDGAR CO emission inventory (https://edgar.jrc.ec.europa.eu/, last access: 31 January 2025) and MODIS fire data (Figs. S5–S9), several urban hotspots in South Asia were identified. In India, CO emissions in regions such as Assam, Bihar, Delhi, Haryana, Punjab, Uttar Pradesh, and West Bengal are primarily driven by transportation and industrial activities, particularly in large cities and industrial corridors. In Bangladesh, traffic congestion and industrial areas, especially in the capital Dhaka, also significantly contribute to CO emissions. In Pakistan, the Khyber Pakhtunkhwa region exhibits elevated CO emissions, which are closely linked to transportation, industrial activities, and seasonal agricultural biomass burning. During the autumn and winter months, the practice of burning crop residue exacerbates the rise in CO concentrations.
-
Around June each year, we observe minor seasonal peaks in the external influx and net flux across the southwestern segment, as well as in the internal efflux across the northeastern segment. This phenomenon may result from the combined effects of atmospheric circulation and the South Asian summer monsoon mechanism. The atmospheric flow prior to the onset of the South Asian monsoon transports pollutants such as CO from South Asia to the Tibetan Plateau, leading to increased CO concentrations and fluxes in the region (Yu et al., 2017; Huang et al., 2023). This seasonal peak also highlights the intricate interactions between atmospheric circulation and the monsoon system in South Asia during the pollutant transmission process.
-
The southwestern segment exhibits distinct pollutant transport differences compared to the northeastern segment. For example, the averaged external influx across the southwestern segment reaches as high as 11.99 t s−1, while the averaged internal efflux across the northeastern segment is only 4.60 t s−1. This is primarily attributed to a higher level of rapid industrialization and urbanization in Southeast Asia than in Tibetan Plateau, resulting in higher pollutant emissions (including CO) in the region.
Eastern China is predominantly downwind of the Tibetan Plateau, where the wind flow and atmospheric stability in the upper atmosphere predispose the eastern region to act as a receiving area for pollutants from the Tibetan Plateau. The Tibetan Plateau functions as a high-altitude natural barrier, effectively limiting the in-depth spread of pollutants (Ji et al., 2015). However, rapid industrialization and urbanization in East China have led to high local pollutant emissions. Influenced by atmospheric circulation patterns and complex topography, East China experiences strong convection and large-scale circulatory systems. While most pollutants are recirculated and deposited within the region, significant transport occurs towards South Korea, Japan, and the North Pacific. A smaller fraction may also reach the eastern edge of the Tibetan Plateau. (Zhang et al., 2015; Yan and Bian, 2015).
4.2 Spatiotemporal distribution of CO
We have analysed the spatiotemporal distribution of the CO total column from May 2018–April 2024 over the Tibetan Plateau and its surrounding regions. CO total columns were averaged on both annual and seasonal timescales. Specifically, we estimated the average of CO total column for winter (December–February), the pre-monsoon period (March–May), the monsoon period (June–September), and the post-monsoon period (October–November). Seasonal variations were assessed by subtracting the mean annual CO total column from their seasonal averages. The resulting data are presented in Fig. 8. Additionally, we analysed the 6-year average spatial distribution and correlation of CO total column concentrations across the Indian states of Himachal Pradesh, Uttarakhand, and Ladakh, as well as Nepal and Assam. The corresponding results are presented in Fig. 9.
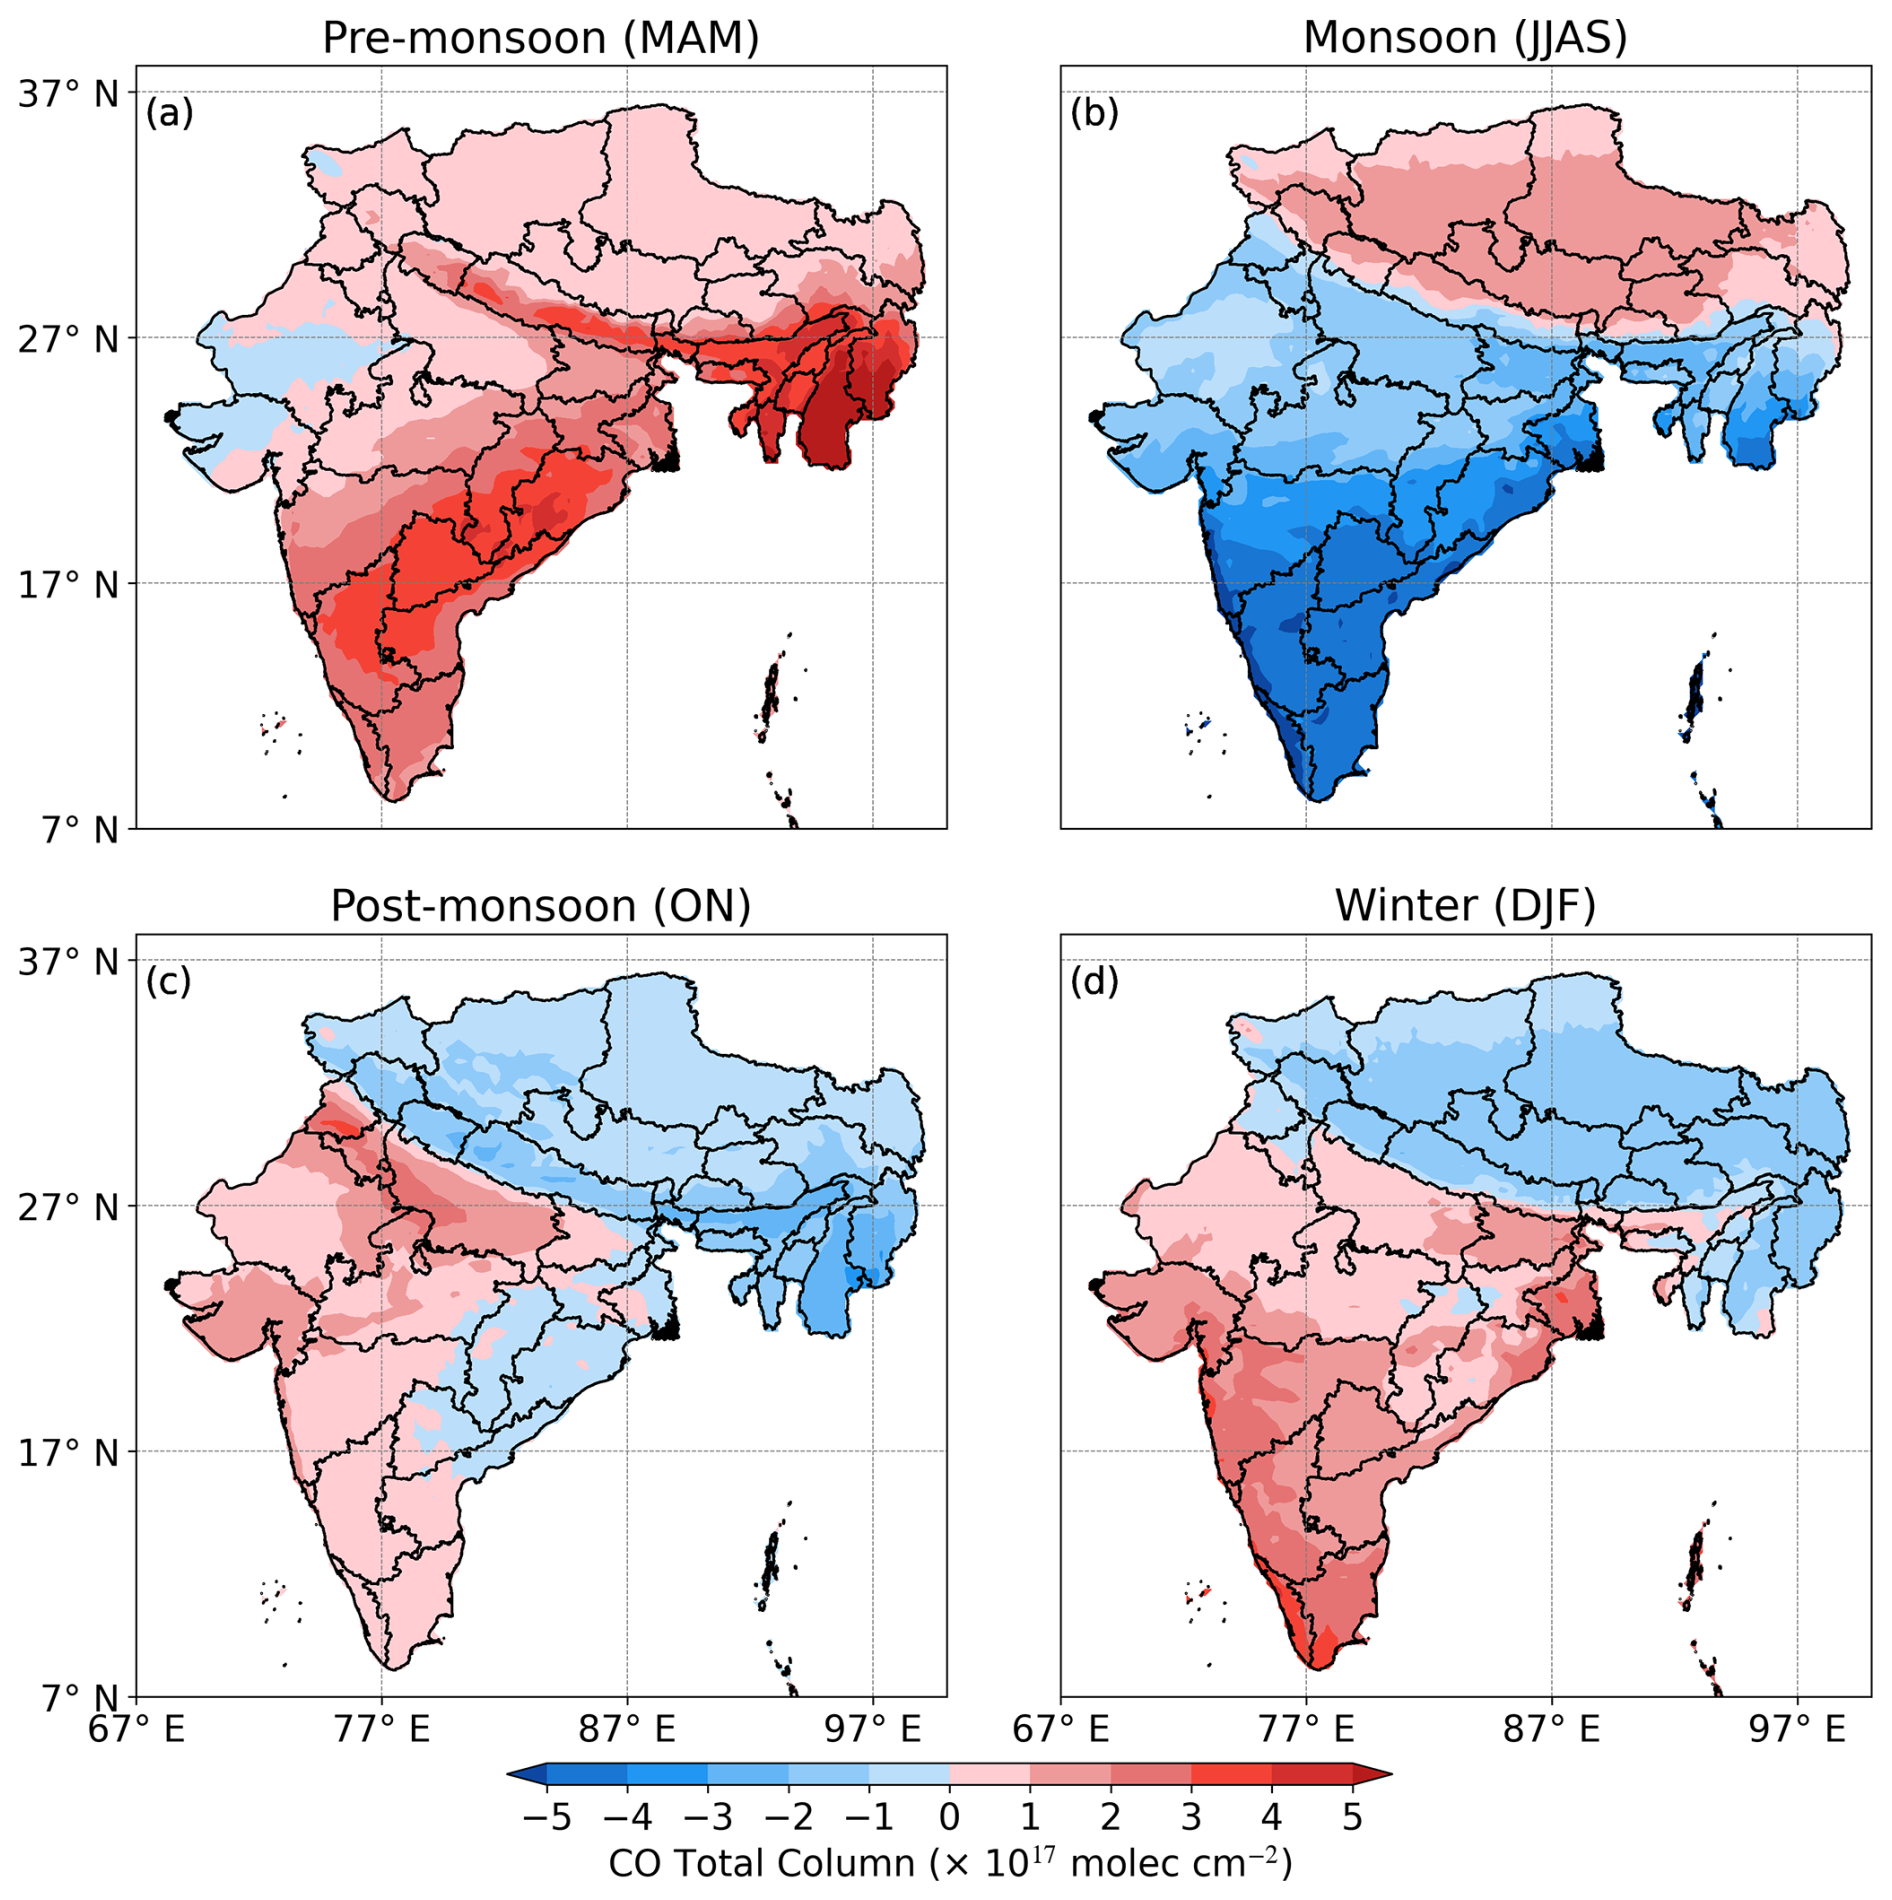
Figure 8The seasonal averages of CO columns over the Tibetan Plateau and South Asia during the pre-monsoon (MAM), monsoon (JJAS), post-monsoon (ON), and winter (DJF) periods have been adjusted by removing the annual mean CO columns. The data were collected from May 2018–April 2024.
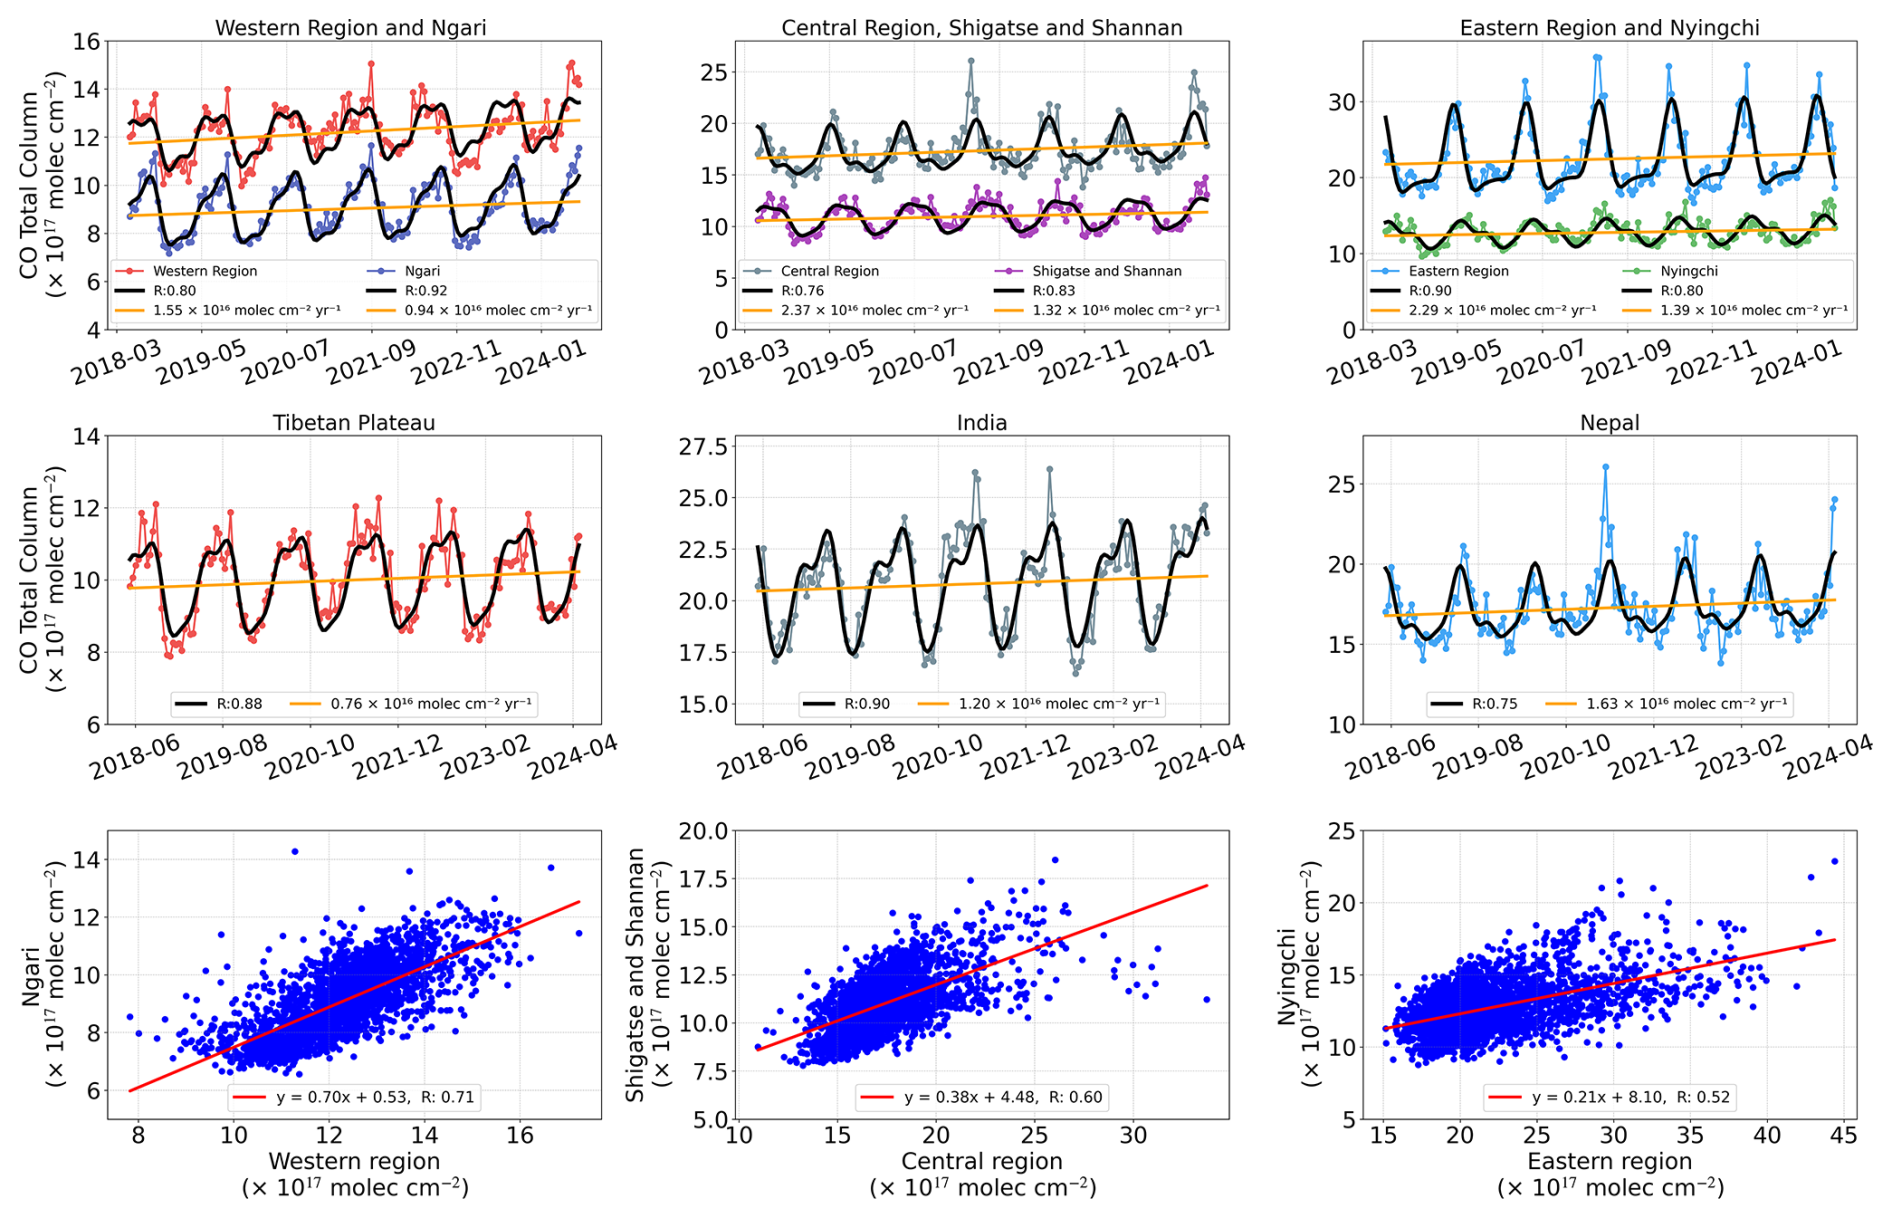
Figure 9Seasonal, inter-annual variabilities and correlation analysis of CO concentrations over the western, central, and eastern regions outside the Tibetan Plateau and over Ngari, Shigatse, Shannan, and Nyingchi within the Tibetan Plateau. The red, dark-blue, grey, purple, blue, and green dots in the figure represent CO concentrations in the western region outside the Tibetan Plateau and Ngari; the central region outside the Tibetan Plateau, Shigatse, and Shannan; and the eastern region outside the Tibetan Plateau and Nyingchi, respectively.
The results indicate that CO concentrations over the Tibetan Plateau are consistently lower than those in South Asia throughout the year. CO concentrations in South Asia are particularly elevated, especially during winter and spring, when the disparity is most pronounced. In summer, CO over the Tibetan Plateau disperses across a broader area. Notably, we observed that CO concentrations over the Tibetan Plateau are significantly higher than the annual average during the monsoon season. Specifically, the average CO concentration over the Tibetan Plateau increased by compared to the annual mean, whereas in India and Nepal, CO concentrations decreased by and , respectively. These findings suggest that CO pollutants from South Asia are transported into the Tibetan Plateau during the South Asian monsoon. Over the past 6 years, the CO total column in northwestern India, Nepal, and Assam has exhibited relatively high growth rates, with annual increases of 1.55×10¹⁶, 2.37×10¹⁶, and , respectively.
The increase of CO over the Tibetan Plateau during summer may be influenced by CO influx driven by the South Asian monsoon, as well as various meteorological factors. High temperatures and intense solar radiation in summer raise the atmospheric mixing layer height, facilitating the easier dispersion of pollutants in the atmosphere (Yang et al., 2004; Huang et al., 2023). Additionally, summer precipitation and wind speed affect the spatial distribution and transport pathways of pollutants. Elevated temperatures and strong convective conditions enhance vertical mixing and horizontal transport, resulting in more extensive and rapid diffusion of pollutants across the Tibetan Plateau (Zhang et al., 2020; Sun et al., 2021).
During winter and spring, CO concentrations rise significantly in South Asian regions, including Nepal, Bhutan, Assam in India, and parts of Myanmar. This increase is likely driven by intensified human activities, such as biomass burning, which is common in these areas during these seasons for heating and agricultural waste disposal, leading to substantial CO emissions. The southern Tibetan region, bordering northern Assam, serves as a key pathway for pollutant transport due to its distinct plain topography. Studies have confirmed that persistent organic pollutants, HCHO, and other contaminants are transported along the Yarlung Tsangpo River valley into the Tibetan Plateau (Sheng et al., 2013; Xu et al., 2024). TROPOMI remote sensing data further show that CO pollutants infiltrate the Tibetan Plateau through this region.
Despite the varying geographical, climatic conditions, and emission sources in these regions, the changes in CO concentrations are interrelated. CO concentrations tend to be lower in high-altitude areas, such as Himachal Pradesh, Uttarakhand, and Ladakh. Nepal, particularly the Kathmandu Valley, faces unique geographic and climatic challenges due to its dense population and concentration of industrial activities, exacerbating air pollution in the region (Islam et al., 2020). The Kathmandu Valley's encirclement by high mountains makes it especially vulnerable to pollution. In contrast, Assam's plains are heavily influenced by the monsoon and high humidity, which promotes the diffusion and deposition of pollutants. Despite these regional differences, CO concentrations in these areas show strong correlations with data from the Ali region, Nyingchi City, Shannan City, and Shigatse City on the Tibetan Plateau, with correlation coefficients (r) ranging from 0.52–0.71. These correlations suggest that long-distance pollutant transport, influenced by meteorological conditions such as monsoons, may link these regions to similar or shared pollution sources (Carrico et al., 2003).
The rapid increase in CO concentrations from South Asia, particularly India and Nepal, is closely linked to the rise in flux over the southwestern Tibetan Plateau, driven primarily by industrialization, agricultural activities, and population growth in the region. The topography of the Tibetan Plateau, combined with the monsoon system, facilitates the transport of pollutants from South Asia to the plateau. At the same time, the Tibetan Plateau's natural ability to regulate CO is critical. Furthermore, China's domestic CO emissions have significantly decreased due to policy controls and economic restructuring. The Tibetan Plateau has long been regarded as an atmospheric background, with local anthropogenic emissions deemed negligible (Yao et al., 2012; Zheng et al., 2018; Kang et al., 2019; Sun et al., 2021). Overall, there is a dual trend of increasing external influx and decreasing internal efflux, with the concentration of CO received by the Tibetan Plateau from South Asia exceeding the influence of emissions from inland China.
4.3 Transboundary transport pathway
The spatial distribution of CO across four seasons around the Tibetan Plateau is shown in Fig. 10, and Fig. 11 presents the atmospheric circulation patterns at 200 and 500 hPa, including mean horizontal wind vectors and latitude–height and longitude–height distributions. Significant seasonal variations in CO concentration are observed in the Tibetan Plateau and surrounding areas, primarily influenced by atmospheric circulation patterns, pollutant source strength, and deep convection activities. The interplay among these factors contributes to the complex dynamics of CO distribution, revealing the intricate relationship between local emissions and regional meteorological conditions.
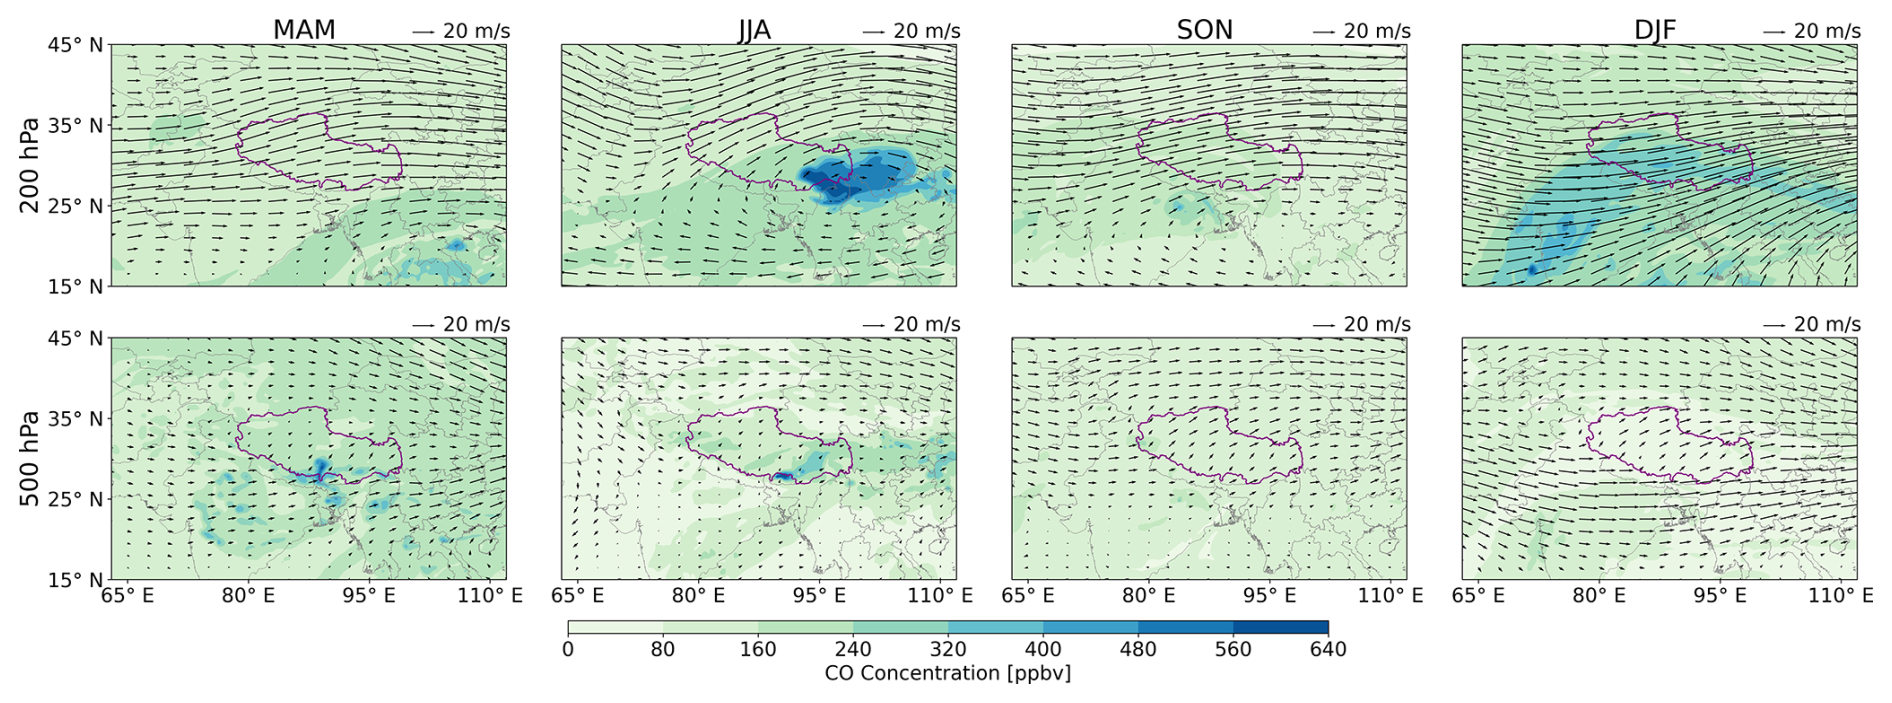
Figure 10Spatial distribution of CO concentration surrounding the Tibetan Plateau across different seasons, alongside mean horizontal wind vectors at 200 and 500 hPa, represented by arrows. The study area is outlined in purple. The CO spatial distribution data are available from GEOS-CF, while the meteorological fields are derived from ERA5.
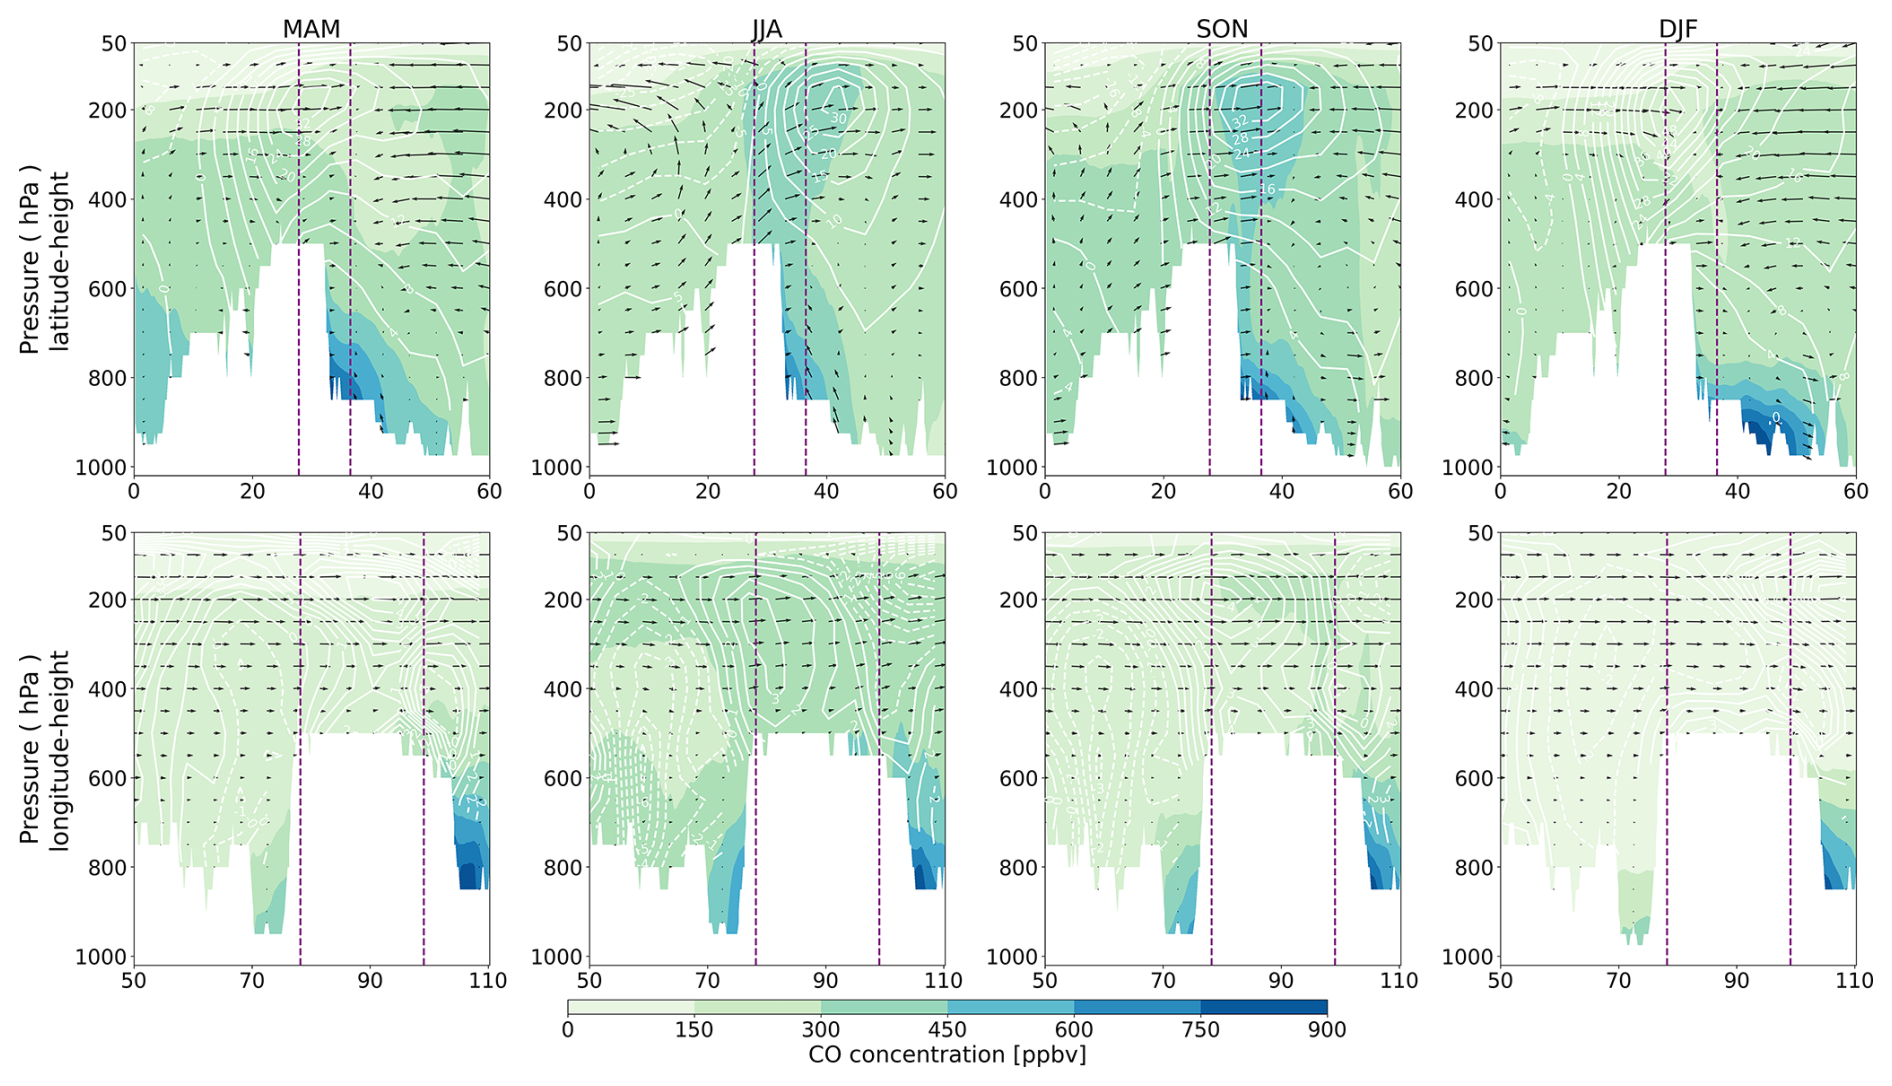
Figure 11The first row shows the latitudinal–altitude distribution of CO concentrations in different seasons averaged over the range 50–110° E (positions correspond to different columns). The white contours at intervals of 18 m s−1 represent the westerly (solid) and easterly (dashed) mean meridional winds, the white areas represent the terrain, and the arrows represent the wind vectors (vertical speed units are , zonal wind units are m s−1). The study area is marked by the dashed purple line. The second row is calculated from the longitude–altitude angles, averaged over the range 27–33° N. Here the white contours represent the southerly (solid) and northerly (dashed) mean zonal winds, and the horizontal component of the wind vector is the meridional wind (m s−1). The meteorological fields are from ERA5.
The South Asian summer monsoon transports a substantial amount of air from the surface to the stratosphere, characterized by southwesterly winds in the lower troposphere and an anticyclonic circulation in the upper troposphere (Abe et al., 2013). This anticyclonic system, dominant in the upper troposphere and lower stratosphere, significantly affects CO distribution in the Tibetan Plateau by enhancing the transport of tropospheric pollutants into the stratosphere (Huang et al., 2023). The high-altitude terrain of the Tibetan Plateau amplifies this process, facilitating vertical lifting of air. Surface pollutants are transported to the upper troposphere through the Asian summer monsoon anticyclone and become confined within the South Asian High's anticyclonic system (Randel et al., 2010; Bian et al., 2012, 2020; Huang et al., 2023). This dynamic leads to a significant increase in CO concentration in the upper troposphere and lower stratosphere. During the summer monsoon season, the southwesterly monsoon winds carry substantial pollutants into the plateau, strongly influenced by intense deep convection. These winds uplift CO from the southern plateau and disperse it across the region (Fu et al., 2006). Large-scale deep convection plays a crucial role in lifting CO from upwind source regions to higher altitudes. While some CO returns to the source region, a portion is transported to the Tibetan Plateau by upper-level southwesterly winds.
In contrast, under dry winter monsoon conditions, CO can be transported to the Himalayan–Tibetan Plateau via the westerlies. The northwesterly flow rapidly conveys CO pollutants from the Northern Hemisphere to the Tibetan Plateau and its surrounding regions (Zhang et al., 2015; Sun et al., 2021). This winter flow typically introduces strong cold air, causing intense surface cooling upon entering the plateau and resulting in descending air currents. This process enhances local circulation, exacerbating CO accumulation (Liu et al., 2003; Zhang et al., 2015). Additionally, the plateau's topographical features influence CO distribution, as stable atmospheric stratification limits vertical dispersion, leading to accumulation in the lower troposphere.
However, the amount of CO transported to the plateau is also influenced by the location and intensity of sources, air mass trajectories, and transport timing (Yao et al., 2012; Zhang et al., 2015; Kang et al., 2019; Sun et al., 2021). Variations in CO concentration depend not only on seasonal atmospheric circulation patterns but also on the distribution and intensity of pollution sources and the frequency and strength of deep convection activity. These complex interactions lead to significant seasonal changes in CO concentrations.
In this study, we utilized data products of TROPOMI, ERA5, and GEOS-CF, along with the closed-loop integral method, to quantify transboundary transport flux of CO over the Tibetan Plateau. The variabilities and driving forces of external influx, internal efflux, and net flux of CO over the closed-loop, southwestern, and northeastern segments of Tibetan Plateau were analysed.
The closed-loop CO concentration along the Tibetan Plateau boundary showed significant spatiotemporal variations, with daily means ranging from and seasonal means from and with high densities in the southeastern segment adjacent to southeastern Asia. The closed-loop, southwestern, and northeastern segments exhibit a bimodal cycle, peaking in late spring and early autumn, with significant autumn fluctuations and less variability in winter. During the South Asian monsoon, CO concentrations increased by in the Tibetan Plateau, decreased by in India, and decreased by in Nepal compared to the annual average. A strong correlation and synchronization of CO concentrations were observed between the South Asian border region and the Tibetan Plateau. Over the past 6 years, CO total columns in Tibet, India, and Nepal exhibited growth trends of 0.76×10¹⁶, 1.20×10¹⁶, and , respectively. These trends are notably higher than the growth observed in Tibet. Over 6 years, growth trends of 0.94×10¹⁶, 0.77×10¹⁶, and were observed for each segment.
Transboundary transport flux of CO in the Tibetan Plateau is high in late autumn and winter, and low in summer. The 6-year averaged external influx, internal efflux, and net flux are 17.70 and 17.56, 0.13 t s−1, respectively. The external influx shows a slight positive trend of 2.86 Tg CO yr−1, while the net flux increases at , contrasted by a minor decline in internal efflux of . In the southwestern segment, external influx and internal efflux show comparable variability, with annual means of 11.76 and 4.41 t s−1 and growth rates of 2.31 and , respectively. Conversely, the northeastern segment exhibits significant differences, with average influx and efflux of 5.94 and 13.17 t s−1 and growth rates of 0.64 and , respectively. In summary, these trends indicate an increase in external influx and a slight decrease in internal efflux across the Tibetan Plateau, with significant regional differences in CO fluxes; the southwestern segment serves as the primary contributor to external influx, exhibiting considerable seasonal changes, while the eastern segment shows lower external influx than internal efflux, indicating a net efflux.
We assessed the uncertainties of wind speed and direction across 22 layers from 1000–50 hPa, obtaining average uncertainties of 3.39 m s−1 for wind speed and 54.55° for wind direction, with corrected averages of 0.78 m s−1 and 22.15°, respectively. The uncertainty in wind speed accounts for an average error of 6.99 %, while the uncertainty in wind direction contributes an average error of 11.03 %. The average error in CO total column along the Tibetan Plateau's closed-loop was 4.27 %. Using the error propagation equation, the total uncertainty in CO flux from both factors is calculated to be 13.81 %.
In conclusion, we quantified the CO flux over the Tibetan Plateau and found a significant seasonal trend, with an increasing external influx in recent years. Specifically, the southwestern segments of the Tibetan Plateau represent the primary source of CO, demonstrating an upward trend potentially associated with the rapid increase in CO concentrations from South Asia. Conversely, CO transmission to the eastern segments is declining, likely due to decreased emissions and the plateau's natural ability to regulate CO. The unique geographical position of the Tibetan Plateau makes it crucial for observing and investigating transboundary transport of regional atmospheric pollutants, providing a scientific basis for understanding global pollutant transport mechanisms and informing environmental protection policies.
This study faces some limitations due to the lack of cross-validation with ground-based measurements. However, datasets such as TROPOMI, ERA5, and GEOS-CF, which are generally reliable, provide a solid foundation for the research. To address these limitations, future research will incorporate both ground-based remote sensing and in situ measurements for validation. Furthermore, the ongoing third scientific expedition to the Tibetan Plateau, led by the Chinese government, is expected to improve data availability, offering valuable opportunities to refine our findings.
The TROPOMI CO dataset of this study is available for download at https://doi.org/10.5270/S5P-bj3nry0 (Copernicus Sentinel-5P, 2024). ERA5 hourly wind data are available for download at https://doi.org/10.24381/cds.bd0915c6 (Hersbach et al., 2024). GEOS-CF simulations are available for download at https://gmao.gsfc.nasa.gov/weather_prediction/GEOS-CF/data_access/ (Keller et al., 2021) (last access: 12 April 2024). The EDGAR CO emission inventory is available at https://edgar.jrc.ec.europa.eu/dataset_ap81 (European Commission, Joint Research Centre (JRC), 2025) (last access: 31 January 2025). GEOS-Chem simulations in this study are available on request from Youwen Sun (ywsun@aiofm.ac.cn)
The supplement related to this article is available online at https://doi.org/10.5194/acp-25-6823-2025-supplement.
ZS carried out the data analysis and prepared the paper with input from all coauthors. YS designed the study. HY conducted the GEOS-Chem simulations and, along with XL, YS, ZP, CYL, KL, and CL, provided constructive comments. HY also offered valuable insights into the data analysis.
The contact author has declared that none of the authors has any competing interests.
Publisher's note: Copernicus Publications remains neutral with regard to jurisdictional claims made in the text, published maps, institutional affiliations, or any other geographical representation in this paper. While Copernicus Publications makes every effort to include appropriate place names, the final responsibility lies with the authors.
We thank the NASA Global Modeling and Assimilation Office (GMAO) for providing the GEOS-CF simulations and the Copernicus Climate Change Service (C3S) for providing the ERA5 reanalysis data. We also express our gratitude to the GEOS-Chem team for sharing the model and NOAA for providing the GEOS-FP meteorological files. Additionally, we thank the European Space Agency (ESA) for providing the Sentinel-5P TROPOMI CO data.
This work is jointly supported by the National Science Fund for Excellent Young Scholars (grant nos. 62322514 and 62322513), the National Science Foundation of China (12174367), the Anhui Science Fund for Distinguished Young Scholars (grant no. 2308085J25), and the National Key Research and Development Program of China (grant no. 2023YFC3709502).
This paper was edited by Suvarna Fadnavis and reviewed by three anonymous referees.
Abe, M., Hori, M., Yasunari, T., and Kitoh, A.: Effects of the Tibetan Plateau on the onsetof the summer monsoon in South Asia: The role of the air–sea interaction, J. Geophys. Res.-Atmos., 118, 1760–1776, https://doi.org/10.1002/jgrd.50210, 2013.
Assessment, A. C. I.: Impacts of a warming Arctic-Arctic climate impact assessment, Cambridge Univ. Press, 2004.
Bey, I., Jacob, D. J., Yantosca, R. M., Logan, J. A., Field, B. D., Fiore, A. M., Li, Q., Liu, H. Y., Mickley, L. J., and Schultz, M. G.: Global modeling of tropospheric chemistry with assimilated meteorology: Model description and evaluation, J. Geophys. Res.-Atmos., 106, 23073–23095, https://doi.org/10.1029/2001jd000807, 2001.
Bian, J., Li, D., Bai, Z., Li, Q., Lyu, D., and Zhou, X.: Transport of Asian surface pollutants to the global stratosphere from the Tibetan Plateau region during the Asian summer monsoon, Natl. Sci. Rev., 7, 516–533, https://doi.org/10.1093/nsr/nwaa005, 2020.
Bian, J., Pan, L. L., Paulik, L., Vömel, H., Chen, H., and Lu, D.: In situ water vapor and ozone measurements in Lhasa and Kunming during the Asian summer monsoon, Geophys. Res. Lett., 39, L19808, https://doi.org/10.1029/2012gl052996, 2012.
Bibi, S., Wang, L., Li, X., Zhou, J., Chen, D., and Yao, T.: Climatic and associated cryospheric, biospheric, and hydrological changes on the Tibetan Plateau: a review, Int. J. Climatol., 38, e1–e17, https://doi.org/10.1002/joc.5411, 2018.
Borsdorff, T., García Reynoso, A., Maldonado, G., Mar-Morales, B., Stremme, W., Grutter, M., and Landgraf, J.: Monitoring CO emissions of the metropolis Mexico City using TROPOMI CO observations, Atmos. Chem. Phys., 20, 15761–15774, https://doi.org/10.5194/acp-20-15761-2020, 2020.
Carrico, C. M., Bergin, M. H., Shrestha, A. B., Dibb, J. E., Gomes, L., and Harris, J. M.: The importance of carbon and mineral dust to seasonal aerosol properties in the Nepal Himalaya, Atmos. Environ., 37, 2811–2824, https://doi.org/10.1016/s1352-2310(03)00197-3, 2003.
Chen, F., Zhang, J., Liu, J., Cao, X., Hou, J., Zhu, L., Xu, X., Liu, X., Wang, M., Wu, D., Huang, L., Zeng, T., Zhang, S., Huang, W., Zhang, X., and Yang, K.: Climate change, vegetation history, and landscape responses on the Tibetan Plateau during the Holocene: A comprehensive review, Quaternary Sci. Rev., 243, 106444, https://doi.org/10.1016/j.quascirev.2020.106444, 2020.
Cong, Z., Kang, S., Kawamura, K., Liu, B., Wan, X., Wang, Z., Gao, S., and Fu, P.: Carbonaceous aerosols on the south edge of the Tibetan Plateau: concentrations, seasonality and sources, Atmos. Chem. Phys., 15, 1573–1584, https://doi.org/10.5194/acp-15-1573-2015, 2015.
Copernicus Sentinel-5P: processed by ESA, TROPOMI Level 2 Carbon Monoxide total column products, Version 02, European Space Agency [data set], https://doi.org/10.5270/S5P-bj3nry0, 2024.
Davis, S. J., Liu, Z., Deng, Z., Zhu, B., Ke, P., Sun, T., Guo, R., Hong, C., Zheng, B., Wang, Y., Boucher, O., Gentine, P., and Ciais, P.: Emissions rebound from the COVID-19 pandemic, Nat. Clim. Change, 12, 412–414, https://doi.org/10.1038/s41558-022-01332-6, 2022.
European Commission, Joint Research Centre (JRC): Emission Database for Global Atmospheric Research (EDGAR), version 8.1 [data set], https://edgar.jrc.ec.europa.eu/dataset_ap81, last access: 31 January 2025.
Fu, R., Hu, Y., Wright, J. S., Jiang, J. H., Dickinson, R. E., Chen, M., Filipiak, M., Read, W. G., Waters, J. W., and Wu, D. L.: Short circuit of water vapor and polluted air to the global stratosphere by convective transport over the Tibetan Plateau, P. Natl. Acad. Sci. USA, 103, 5664–5669, https://doi.org/10.1073/pnas.0601584103, 2006.
Gao, J., Yao, T., Masson-Delmotte, V., Steen-Larsen, H. C., and Wang, W.: Collapsing glaciers threaten Asia's water supplies, Nature, 565, 19–21, https://doi.org/10.1038/d41586-018-07838-4, 2019.
Gloudemans, A. M. S., Krol, M. C., Meirink, J. F., de Laat, A. T. J., van der Werf, G. R., Schrijver, H., van den Broek, M. M. P., and Aben, I.: Evidence for long-range transport of carbon monoxide in the Southern Hemisphere from SCIAMACHY observations, Geophys. Res. Lett., 33, L16807, https://doi.org/10.1029/2006gl026804, 2006.
Heald, C. L., Jacob, D. J., Fiore, A. M., Emmons, L. K., Gille, J. C., Deeter, M. N., Warner, J., Edwards, D. P., Crawford, J. H., Hamlin, A. J., Sachse, G. W., Browell, E. V., Avery, M. A., Vay, S. A., Westberg, D. J., Blake, D. R., Singh, H. B., Sandholm, S. T., Talbot, R. W., and Fuelberg, H. E.: Asian outflow and trans-Pacific transport of carbon monoxide and ozone pollution: An integrated satellite, aircraft, and model perspective, J. Geophys. Res.-Atmos., 108, 4804, https://doi.org/10.1029/2003jd003507, 2003.
Hersbach, H., Bell, B., Berrisford, P., Hirahara, S., Horányi, A., Muñoz-Sabater, J., Nicolas, J., Peubey, C., Radu, R., Schepers, D., Simmons, A., Soci, C., Abdalla, S., Abellan, X., Balsamo, G., Bechtold, P., Biavati, G., Bidlot, J., Bonavita, M., De Chiara, G., Dahlgren, P., Dee, D., Diamantakis, M., Dragani, R., Flemming, J., Forbes, R., Fuentes, M., Geer, A., Haimberger, L., Healy, S., Hogan, R. J., Hólm, E., Janisková, M., Keeley, S., Laloyaux, P., Lopez, P., Lupu, C., Radnoti, G., de Rosnay, P., Rozum, I., Vamborg, F., Villaume, S., and Thépaut, J. N.: The ERA5 global reanalysis, Q. J. Roy. Meteor. Soc., 146, 1999–2049, https://doi.org/10.1002/qj.3803, 2020.
Hersbach, H., Bell, B., Berrisford, P., Biavati, G., Horányi, A., Muñoz Sabater, J., Nicolas, J., Peubey, C., Radu, R., Rozum, I., Schepers, D., Simmons, A., Soci, C., Dee, D., and Thépaut, J.-N.: ERA5 hourly data on pressure levels from 1940 to present, Copernicus Climate Change Service (C3S) Climate Data Store (CDS) [data set],https://doi.org/10.24381/cds.bd0915c6, 2024.
Holloway, T., Levy, H., and Kasibhatla, P.: Global distribution of carbon monoxide, J. Geophys. Res.-Atmos., 105, 12123–12147, https://doi.org/10.1029/1999jd901173, 2000.
Huang, J., Zhou, X., Wu, G., Xu, X., Zhao, Q., Liu, Y., Duan, A., Xie, Y., Ma, Y., Zhao, P., Yang, S., Yang, K., Yang, H., Bian, J., Fu, Y., Ge, J., Liu, Y., Wu, Q., Yu, H., Wang, B., Bao, Q., and Qie, K.: Global Climate Impacts of Land-Surface and Atmospheric Processes Over the Tibetan Plateau, Rev. Geophys., 61, e2022rg000771, https://doi.org/10.1029/2022rg000771, 2023.
Huang, Y., Li, A., Xie, P., Hu, Z., Xu, J., Fang, X., Ren, H., Li, X., and Dang, B.: NOx Emission Flux Measurements with Multiple Mobile-DOAS Instruments in Beijing, Remote Sens.-Basel, 12, 2527, https://doi.org/10.3390/rs12162527, 2020.
Hung, H., Halsall, C., Ball, H., Bidleman, T., Dachs, J., De Silva, A., Hermanson, M., Kallenborn, R., Muir, D., Suhring, R., Wang, X., and Wilson, S.: Climate change influence on the levels and trends of persistent organic pollutants (POPs) and chemicals of emerging Arctic concern (CEACs) in the Arctic physical environment – a review, Environ. Sci.-Proc. Imp., 24, 1577–1615, https://doi.org/10.1039/d1em00485a, 2022.
Islam, Md. R., Jayarathne, T., Simpson, I. J., Werden, B., Maben, J., Gilbert, A., Praveen, P. S., Adhikari, S., Panday, A. K., Rupakheti, M., Blake, D. R., Yokelson, R. J., DeCarlo, P. F., Keene, W. C., and Stone, E. A.: Ambient air quality in the Kathmandu Valley, Nepal, during the pre-monsoon: concentrations and sources of particulate matter and trace gases, Atmos. Chem. Phys., 20, 2927–2951, https://doi.org/10.5194/acp-20-2927-2020, 2020.
Jeong, U. and Hong, H.: Comparison of Total Column and Surface Mixing Ratio of Carbon Monoxide Derived from the TROPOMI/Sentinel-5 Precursor with In-Situ Measurements from Extensive Ground-Based Network over South Korea, Remote Sens.-Basel, 13, 3987, https://doi.org/10.3390/rs13193987, 2021.
Ji, Z., Kang, S., Cong, Z., Zhang, Q., and Yao, T.: Simulation of carbonaceous aerosols over the Third Pole and adjacent regions: distribution, transportation, deposition, and climatic effects, Clim. Dynam., 45, 2831–2846, https://doi.org/10.1007/s00382-015-2509-1, 2015.
Kang, S., Zhang, Q., Qian, Y., Ji, Z., Li, C., Cong, Z., Zhang, Y., Guo, J., Du, W., Huang, J., You, Q., Panday, A. K., Rupakheti, M., Chen, D., Gustafsson, O., Thiemens, M. H., and Qin, D.: Linking atmospheric pollution to cryospheric change in the Third Pole region: current progress and future prospects, Natl. Sci. Rev., 6, 796–809, https://doi.org/10.1093/nsr/nwz031, 2019.
Kaspari, S. D., Schwikowski, M., Gysel, M., Flanner, M. G., Kang, S., Hou, S., and Mayewski, P. A.: Recent increase in black carbon concentrations from a Mt. Everest ice core spanning 1860–2000 AD, Geophys. Res. Lett., 38, L04703, https://doi.org/10.1029/2010gl046096, 2011.
Keller, C. A., Knowland, K. E., Duncan, B. N., Liu, J., Anderson, D. C., Das, S., Lucchesi, R. A., Lundgren, E. W., Nicely, J. M., Nielsen, E., Ott, L. E., Saunders, E., Strode, S. A., Wales, P. A., Jacob, D. J., and Pawson, S.: Description of the NASA GEOS Composition Forecast Modeling System GEOS-CF v1.0, J. Adv. Model. Earth. Sy., 13, e2020MS002413, https://doi.org/10.1029/2020MS002413, 2021.
Kunhikrishnan, T., Lawrence, M. G., von Kuhlmann, R., Richter, A., Ladstätter-Weißenmayer, A., and Burrows, J. P.: Analysis of tropospheric NOx over Asia using the model of atmospheric transport and chemistry (MATCH-MPIC) and GOME-satellite observations, Atmos. Environ., 38, 581–596, https://doi.org/10.1016/j.atmosenv.2003.09.074, 2004.
Landgraf, J., Borsdorff, T., Langerock, B., and Keppens, A.: S5P mission performance centre carbon monoxide (L2 CO) readme, S5P-MPC-SRON-PRF-CO, 1.5, SRON Netherlands Institute for Space Research, Utrecht, The Netherlands, https://sentinels.copernicus.eu/web/sentinel/technical-guides/sentinel-5p/products-algorithms (last access: 16 June 2024), 2020.
Lawrence, M. G. and Lelieveld, J.: Atmospheric pollutant outflow from southern Asia: a review, Atmos. Chem. Phys., 10, 11017–11096, https://doi.org/10.5194/acp-10-11017-2010, 2010.
Lee, H. M. and Park, R. J.: Factors determining the seasonal variation of ozone air quality in South Korea: Regional background versus domestic emission contributions, Environ. Pollut., 308, 119645, https://doi.org/10.1016/j.envpol.2022.119645, 2022.
Leguijt, G., Maasakkers, J. D., Denier van der Gon, H. A. C., Segers, A. J., Borsdorff, T., and Aben, I.: Quantification of carbon monoxide emissions from African cities using TROPOMI, Atmos. Chem. Phys., 23, 8899–8919, https://doi.org/10.5194/acp-23-8899-2023, 2023.
Li, C., Su, F., Yang, D., Tong, K., Meng, F., and Kan, B.: Spatiotemporal variation of snow cover over the Tibetan Plateau based on MODIS snow product, 2001–2014, Int. J. Climatol., 38, 708–728, https://doi.org/10.1002/joc.5204, 2017.
Li, C., Yan, F., Kang, S., Yan, C., Hu, Z., Chen, P., Gao, S., Zhang, C., He, C., Kaspari, S., and Stubbins, A.: Carbonaceous matter in the atmosphere and glaciers of the Himalayas and the Tibetan plateau: An investigative review, Environ. Int., 146, 106281, https://doi.org/10.1016/j.envint.2020.106281, 2021.
Liu, H., Jacob, D. J., Bey, I., Yantosca, R. M., Duncan, B. N., and Sachse, G. W.: Transport pathways for Asian pollution outflow over the Pacific: Interannual and seasonal variations, J. Geophys. Res.-Atmos., 108, GTE7.1–GTE7.18, https://doi.org/10.1029/2002jd003102, 2003.
Long, M. S., Yantosca, R., Nielsen, J. E., Keller, C. A., da Silva, A., Sulprizio, M. P., Pawson, S., and Jacob, D. J.: Development of a grid-independent GEOS-Chem chemical transport model (v9-02) as an atmospheric chemistry module for Earth system models, Geosci. Model Dev., 8, 595–602, https://doi.org/10.5194/gmd-8-595-2015, 2015.
Luo, M., Read, W., Kulawik, S., Worden, J., Livesey, N., Bowman, K., and Herman, R.: Carbon monoxide (CO) vertical profiles derived from joined TES and MLS measurements, J. Geophys. Res.-Atmos., 118, 10601–10613, https://doi.org/10.1002/jgrd.50800, 2013.
Lüthi, Z. L., Škerlak, B., Kim, S.-W., Lauer, A., Mues, A., Rupakheti, M., and Kang, S.: Atmospheric brown clouds reach the Tibetan Plateau by crossing the Himalayas, Atmos. Chem. Phys., 15, 6007–6021, https://doi.org/10.5194/acp-15-6007-2015, 2015.
Madineni, V. R., Dasari, H. P., Karumuri, R., Viswanadhapalli, Y., Perumal, P., and Hoteit, I.: Natural processes dominate the pollution levels during COVID-19 lockdown over India, Sci. Rep.-UK, 11, 15110, https://doi.org/10.1038/s41598-021-94373-4, 2021.
Martínez-Alonso, S., Deeter, M., Worden, H., Borsdorff, T., Aben, I., Commane, R., Daube, B., Francis, G., George, M., Landgraf, J., Mao, D., McKain, K., and Wofsy, S.: 1.5 years of TROPOMI CO measurements: comparisons to MOPITT and ATom, Atmos. Meas. Tech., 13, 4841–4864, https://doi.org/10.5194/amt-13-4841-2020, 2020.
Qian, Y., Flanner, M. G., Leung, L. R., and Wang, W.: Sensitivity studies on the impacts of Tibetan Plateau snowpack pollution on the Asian hydrological cycle and monsoon climate, Atmos. Chem. Phys., 11, 1929–1948, https://doi.org/10.5194/acp-11-1929-2011, 2011.
Ramanathan, V., Chung, C., Kim, D., Bettge, T., Buja, L., Kiehl, J. T., Washington, W. M., Fu, Q., Sikka, D. R., and Wild, M.: Atmospheric brown clouds: impacts on South Asian climate and hydrological cycle, P. Natl. Acad. Sci. USA, 102, 5326–5333, https://doi.org/10.1073/pnas.0500656102, 2005.
Randel, W. J., Park, M., Emmons, L., Kinnison, D., Bernath, P., Walker, K. A., Boone, C., and Pumphrey, H.: Asian monsoon transport of pollution to the stratosphere, Science, 328, 611–613, https://doi.org/10.1126/science.1182274, 2010.
Shaiganfar, R., Beirle, S., Sharma, M., Chauhan, A., Singh, R. P., and Wagner, T.: Estimation of NOx emissions from Delhi using Car MAX-DOAS observations and comparison with OMI satellite data, Atmos. Chem. Phys., 11, 10871–10887, https://doi.org/10.5194/acp-11-10871-2011, 2011.
Shaiganfar, R., Beirle, S., Denier van der Gon, H., Jonkers, S., Kuenen, J., Petetin, H., Zhang, Q., Beekmann, M., and Wagner, T.: Estimation of the Paris NOx emissions from mobile MAX-DOAS observations and CHIMERE model simulations during the MEGAPOLI campaign using the closed integral method, Atmos. Chem. Phys., 17, 7853–7890, https://doi.org/10.5194/acp-17-7853-2017, 2017.
Sheng, J., Wang, X., Gong, P., Joswiak, D. R., Tian, L., Yao, T., and Jones, K. C.: Monsoon-driven transport of organochlorine pesticides and polychlorinated biphenyls to the Tibetan Plateau: three year atmospheric monitoring study, Environ. Sci. Technol., 47, 3199–3208, https://doi.org/10.1021/es305201s, 2013.
Sun, Y., Yin, H., Cheng, Y., Zhang, Q., Zheng, B., Notholt, J., Lu, X., Liu, C., Tian, Y., and Liu, J.: Quantifying variability, source, and transport of CO in the urban areas over the Himalayas and Tibetan Plateau, Atmos. Chem. Phys., 21, 9201–9222, https://doi.org/10.5194/acp-21-9201-2021, 2021.
Tan, W., Zhao, S., Liu, C., Chan, K. L., Xie, Z., Zhu, Y., Su, W., Zhang, C., Liu, H., Xing, C., and Liu, J.: Estimation of winter time NOx emissions in Hefei, a typical inland city of China, using mobile MAX-DOAS observations, Atmos. Environ., 200, 228–242, https://doi.org/10.1016/j.atmosenv.2018.12.009, 2019.
The International GEOS-Chem Community: geoschem/geos-chem: GEOS-Chem 12.2.1 (Version 12.2.1), Zenodo [code], https://doi.org/10.5281/zenodo.2580198, 2019.
Veefkind, J. P., Aben, I., McMullan, K., Förster, H., de Vries, J., Otter, G., Claas, J., Eskes, H. J., de Haan, J. F., Kleipool, Q., van Weele, M., Hasekamp, O., Hoogeveen, R., Landgraf, J., Snel, R., Tol, P., Ingmann, P., Voors, R., Kruizinga, B., Vink, R., Visser, H., and Levelt, P. F.: TROPOMI on the ESA Sentinel-5 Precursor: A GMES mission for global observations of the atmospheric composition for climate, air quality and ozone layer applications, Remote Sens. Environ., 120, 70–83, https://doi.org/10.1016/j.rse.2011.09.027, 2012.
Wang, X., Zhang, Q., Zhang, Y., Cong, Z., Xu, B., Ji, Z., and Kang, S.: The transboundary transport of air pollutants and their environmental impacts on Tibetan Plateau, Chinese Sci. Bull., 64, 2876–2884, https://doi.org/10.1360/tb-2019-0135, 2019.
Wu, G., Wan, X., Ram, K., Li, P., Liu, B., Yin, Y., Fu, P., Loewen, M., Gao, S., Kang, S., Kawamura, K., Wang, Y., and Cong, Z.: Light absorption, fluorescence properties and sources of brown carbon aerosols in the Southeast Tibetan Plateau, Environ. Pollut., 257, 113616, https://doi.org/10.1016/j.envpol.2019.113616, 2020.
Xu, B., Cao, J., Hansen, J., Yao, T., Joswia, D. R., Wang, N., Wu, G., Wang, M., Zhao, H., Yang, W., Liu, X., and He, J.: Black soot and the survival of Tibetan glaciers, P. Natl. Acad. Sci. USA, 106, 22114–22118, https://doi.org/10.1073/pnas.0910444106, 2009.
Xu, Y., Su, W., Hu, Q., Zhang, C., Javed, Z., Tian, Y., Hou, H., and Liu, C.: Unexpected HCHO transnational transport: influence on the temporal and spatial distribution of HCHO in Tibet from 2013 to 2021 based on satellite, npj Climate and Atmospheric Science, 7, 102, https://doi.org/10.1038/s41612-024-00639-9, 2024.
Yan, R. and Bian, J.: Tracing the boundary layer sources of carbon monoxide in the Asian summer monsoon anticyclone using WRF-Chem, Adv. Atmos. Sci., 32, 943–951, https://doi.org/10.1007/s00376-014-4130-3, 2015.
Yang, K., Koike, T., Fujii, H., Tamura, T., Xu, X., Bian, L., and Zhou, M.: The Daytime Evolution of the Atmospheric Boundary Layer and Convection over the Tibetan Plateau: Observations and Simulations, J. Meteorol. Soc. Jpn. Ser. II, 82, 1777–1792, https://doi.org/10.2151/jmsj.82.1777, 2004.
Yao, T., Thompson, L., Yang, W., Yu, W., Gao, Y., Guo, X., Yang, X., Duan, K., Zhao, H., Xu, B., Pu, J., Lu, A., Xiang, Y., Kattel, D. B., and Joswiak, D.: Different glacier status with atmospheric circulations in Tibetan Plateau and surroundings, Nat. Clim. Change, 2, 663–667, https://doi.org/10.1038/nclimate1580, 2012.
Yin, H., Sun, Y., Notholt, J., Palm, M., Ye, C., and Liu, C.: Quantifying the drivers of surface ozone anomalies in the urban areas over the Qinghai-Tibet Plateau, Atmos. Chem. Phys., 22, 14401–14419, https://doi.org/10.5194/acp-22-14401-2022, 2022.
Yu, P., Rosenlof, K. H., Liu, S., Telg, H., Thornberry, T. D., Rollins, A. W., Portmann, R. W., Bai, Z., Ray, E. A., Duan, Y., Pan, L. L., Toon, O. B., Bian, J., and Gao, R. S.: Efficient transport of tropospheric aerosol into the stratosphere via the Asian summer monsoon anticyclone, P. Natl. Acad. Sci. USA, 114, 6972–6977, https://doi.org/10.1073/pnas.1701170114, 2017.
Zhang, M., Zhao, C., Cong, Z., Du, Q., Xu, M., Chen, Y., Chen, M., Li, R., Fu, Y., Zhong, L., Kang, S., Zhao, D., and Yang, Y.: Impact of topography on black carbon transport to the southern Tibetan Plateau during the pre-monsoon season and its climatic implication, Atmos. Chem. Phys., 20, 5923–5943, https://doi.org/10.5194/acp-20-5923-2020, 2020.
Zhang, R., Wang, H., Qian, Y., Rasch, P. J., Easter, R. C., Ma, P.-L., Singh, B., Huang, J., and Fu, Q.: Quantifying sources, transport, deposition, and radiative forcing of black carbon over the Himalayas and Tibetan Plateau, Atmos. Chem. Phys., 15, 6205–6223, https://doi.org/10.5194/acp-15-6205-2015, 2015.
Zheng, B., Tong, D., Li, M., Liu, F., Hong, C., Geng, G., Li, H., Li, X., Peng, L., Qi, J., Yan, L., Zhang, Y., Zhao, H., Zheng, Y., He, K., and Zhang, Q.: Trends in China's anthropogenic emissions since 2010 as the consequence of clean air actions, Atmos. Chem. Phys., 18, 14095–14111, https://doi.org/10.5194/acp-18-14095-2018, 2018.
- Abstract
- Introduction
- Methodology and dataset
- Variability of CO and transboundary transport flux
- Factors driving the variability of transboundary transport CO flux
- Conclusions
- Data availability
- Author contributions
- Competing interests
- Disclaimer
- Acknowledgements
- Financial support
- Review statement
- References
- Supplement