the Creative Commons Attribution 4.0 License.
the Creative Commons Attribution 4.0 License.
 | 03 Jul 2025
Retrieval of microphysical properties of dust aerosols from extinction, backscattering and depolarization lidar measurements using various particle scattering models
Yuyang Chang
Qiaoyun Hu
Philippe Goloub
Thierry Podvin
Igor Veselovskii
Fabrice Ducos
Gaël Dubois
Masanori Saito
Anton Lopatin
Oleg Dubovik
Cheng Chen
Mineral dust is a key atmospheric aerosol agent that impacts the radiation budget and plays a significant role in cloud formation. However, studies on retrieving height-resolved microphysical properties of dust aerosols, which are crucial for understanding dust evolution, transport processes, and radiative effects, from lidar measurements are still insufficient. Here, we retrieve dust aerosol microphysical properties, including the volume size distribution (VSD), total volume concentration (Vt), effective radius (reff), complex refractive index (CRI), and single-scattering albedo (SSA), from spectral extinction (α), backscattering (β), and depolarization (δ) lidar measurements. We evaluate the performance of three particle scattering models, namely the spherical, spheroidal, and irregular–hexahedral (IH) models, in terms of mimicking dust optical properties and deriving retrieval results when different measurement combinations are inverted. Both simulations and inversions of real lidar measurements confirm the superiority of the IH model and the significance of spectral depolarization measurements to improve the retrieval accuracy. An increase in discrepancy in depolarization ratio produced by the IH and spheroid models is observed for reff>0.5 µm, resulting in larger retrieval difference between the two non-spherical models after the inclusion of 3δ. Comparisons of the real case retrievals with Aerosol Robotic Network (AERONET) retrievals and previous in situ results indicate relatively smaller reff and larger SSA derived from the lidar retrievals. A discussion of the possible reasons is presented.
- Article
(11470 KB) - Full-text XML
-
Supplement
(1573 KB) - BibTeX
- EndNote


Due to its annual emission and residence time, mineral dust dominates global aerosol by mass and impacts the Earth system in various aspects and scales (Kok et al., 2017). It directly modulates the Earth radiation budget by scattering and absorbing atmospheric radiation (Miller and Tegen, 1998) and in an indirect way by taking part in cloud formation (Ansmann et al., 2019; Bangert et al., 2012; DeMott et al., 2003; Rosenfeld et al., 2001; Seifert et al., 2010). Additionally, it contributes to ecosystem dynamics and biogeochemistry during cycling processes (Miller et al., 2004; Yu et al., 2015). Moreover, the occurrence of intense dust outbreaks reduces visibility, posing potential hazards for transportation and outdoor activities. Long-term exposure to dense dust aerosols harms human health, causing respiratory issues and cardiovascular diseases (Giannadaki et al., 2014). Therefore, it is crucial to monitor and retrieve the distribution and properties of dust aerosols so as to enhance our understanding of their role in the Earth system and their impact on human society.
The light detection and ranging (lidar) is a unique technique for obtaining vertically resolved information on dust aerosols. Optical properties measured by state-of-the-art lidars, such as lidar ratio (LR), particle linear depolarization ratio (PLDR), and fluorescence, have been used to identify and distinguish dust aerosols from others (Burton et al., 2012; Nicolae et al., 2018; Veselovskii et al., 2022). Nevertheless, quantitative retrievals of microphysical properties of dust aerosols, such as the volume size distribution (VSD) and complex refractive index (CRI) from lidar measurements, remain challenging and limited. This is partly due to the shortage of applicable particle scattering models that precisely describe the backscattering properties of large non-spherical particles. It has been revealed by a number of investigators that the Lorenz–Mie theory for spherical particles is unable to reproduce the laboratory-measured flat phase function of dust particles for sideward and quasi-backward directions (Nakajima et al., 1989; Volten et al., 2001). The spheroidal model, which approximates irregular dust particles such as spheroids and calculates the single-scattering properties with a combination of advanced numeric methods (Dubovik et al., 2006), might also encounter difficulties in simulating backscattering due to limited computational accuracy unable to consider the impact of complex morphology of highly irregular particles, although it performs well on simulating forward and side scattering (Huang et al., 2023; Saito and Yang, 2023).
To date, only a limited number of studies have been conducted to retrieve dust aerosols from lidar measurements. The initial work by Veselovskii et al. (2010) combined the spheroidal model with regularization inversion of 3β (backscattering coefficients at 355, 532, and 1064 nm) +2α (extinction coefficients at 355 and 532 nm) measurements. The authors also examined the impact of other factors on retrievals, such as the spectral dependence of the CRI and the inclusion of depolarization at 355 nm in the inversion dataset. Müller et al. (2013) utilized both the spherical and spheroidal models to invert measurements acquired during the Saharan Mineral Dust Experiment (SAMUM) campaign and subsequently compared the results with Aerosol Robotic Network AERONET retrievals and in situ measurements. Tesche et al. (2019) conducted case studies to investigate the effect of employing different combinations of depolarization measurements as input for the inversion of lidar optical data into dust aerosol microphysical properties. These studies highlight the significance of considering the non-sphericity of dust particles and the potential of acquiring height-resolved dust microphysical properties with lidar. However, there remains a lack of comprehensive simulation studies to better understand the limitations of different scattering models for lidar–aerosol retrieval, as well as the extent of improvement when incorporating depolarization data. The following issues are currently in need of further investigation:
-
Considering that the limited sensitivity of (3β+2α) measurements to the size distribution of large particles has been acknowledged in spherical aerosol retrieval (Chang et al., 2022), is this still the case for non-spherical dust retrieval? Can it be ameliorated by incorporating depolarization measurements?
-
If there are other non-spherical models applicable apart from the spheroidal model, how does one evaluate their performances in terms of the capability of reproducing real lidar measurements and the accuracy and stability of the retrieval process?
-
How do different particle scattering models and combinations of input measurements influence the retrievals, and consequently what do the differences in the retrievals imply to the estimation of dust radiative effects?
Recently, a new particle scattering model, known as the irregular–hexahedral (IH) model, aiming to mimic light scattering of large irregular-shaped particles such as mineral dust and volcanic ash has been proposed and developed (Saito et al., 2021; Saito and Yang, 2021). Compared to the spheroidal model, the IH model utilizes more realistic shapes to represent dust morphology and exploits advanced computational methods to improve the accuracy towards 180° scattering direction by, for example, accounting for the coherent backscattering enhancement effect (CBE; Borovoi et al., 2013). However, in spite of continuous callings for implementing the IH model in more lidar applications (Castellanos et al., 2024; Haarig et al., 2022; Saito et al., 2021), there is a lack of research that applies the IH model to lidar data inversion and compares the IH model with other applicable scattering models (such as the spherical and spheroidal models) in order to better understand its strengths and limitations in terms of lidar–aerosol retrieval.
To address these issues, we conducted comprehensive simulations and real case studies using the Basic Algorithm for Retrieval of Aerosol with Lidar (BOREAL) algorithm, which allows an investigation of different particle scattering models by using them to simulate aerosol optical properties (forward calculation) and retrieve aerosol microphysical properties (inverse process) (Chang et al., 2022). Specifically, we assess the spherical, spheroidal, and IH models, and particularly we focus on the performances of the latter two non-spherical models with regards to the capability of reproducing real lidar measurements as well as the retrieval accuracy different measurement combinations are inverted. Section 2 provides a brief overview of the BOREAL algorithm, the used scattering models, and the lidar system and a summary of dust properties reported in previous literature. Section 3 presents comparisons of optical properties simulated with the scattering models. Sections 4 and 5 showcase retrievals derived by inversion of synthetic optical data and real measurements, respectively. Discussions are presented in Sect. 6, followed by conclusions in Sect. 7.
2.1 BOREAL algorithm
Considering an ensemble of poly-dispersed, randomly orientated aerosol particles of which each single particle follows the independent scattering process (Mishchenko et al., 2002), the extinction coefficient (α) and the ij entry of the phase matrix (Pij) can be respectively expressed as
where signifies the VSD of the particle ensemble; and are the kernels corresponding to the extinction and phase matrix elements, respectively, which are functions of the wavelength (λ), the CRI consisting of the real part (mR) and the imaginary part (mI) and the particle radius (r). In addition, kij is also a function of the scattering angle (Θ). The σsca is the scattering coefficient derived in a similar way to α.
From Eqs. (1)–(2), the backscattering coefficient (β), which describes the scattering intensity in the backward direction, and the particle linear depolarization ratio (PLDR; δ), which describes the ratio of the perpendicular-to-parallel polarization components of the backscattered light, are given by
respectively. It is well-demonstrated that P11≥P22 and the equality hold for spherical particles (Mishchenko et al., 2002). Therefore, the PLDR is an indicator of particle sphericity, with δ=0 for spheres and for non-spherical particles that are beyond the Rayleigh scattering regime.
The total volume concentration (Vt), effective radius (reff), and single scattering albedo (SSA; ϖ) are defined as
Together with VSD and CRI, they characterize the microphysical state of an aerosol particle ensemble and are referred to as the state parameters. Note that another definition of reff for non-spherical particles is (Foot, 1988)
where v and a are the volume and average projected area of a single particle. Saito and Yang (2022) pointed out that these two definitions are identical for spherical particles, while a bias of ∼ 10 %–20 % between Eqs. (6) and (8) will arise for non-spherical particles depending on the extent of non-sphericity if the volume-equivalent radius (i.e. the radius of the sphere with the same volume of the represented non-spherical particle) is taken as the size descriptor. Throughout this study, we adopt the Eq. (6) to calculate reff, consistent with all the studies that are selected for comparisons (Sects. 2.2.1, 6.3).
To effectively retrieve aerosol state parameters from lidar measurements, the BOREAL algorithm was developed. Here we recap on its inversion principle and retrieval process, while more detailed description can be found in Chang et al. (2022). The inversion is achieved by making maximum likelihood estimation (MLE) of the state parameters, which can be converted to a non-linear optimization procedure. Compared to other retrieval methods based on constrained linear inversion (e.g. Müller et al., 1999, 2019; Veselovskii et al., 2002, 2010), this strategy allows one to conveniently account for a priori constraints and simultaneously consider the uncertainties in measurements and in a priori constraints. Furthermore, VSD and CRI are retrieved simultaneously, which greatly simplifies the determination of solution space and thus improves retrieval efficiency. The relationship between the generalized measurement vector (y) and the state vector (x) that is composed of VSD representation and CRI can be expressed as
where i from 1 to 3 denotes lidar measurements (i=1), virtual measurements for the smoothing constraint on VSD (i=2), and virtual measurements for the a priori constraint on CRI. Each measurement vector is the sum of the measurement error (εi) and the theoretical truth that is calculated from the state vector using the forward model (fi). The forward model mapping the state vector to optical properties (i.e. f1) is based on the particle scattering theory and is referred to as the particle scattering model. The MLE results in the minimization of the following objective function:
where Ci is the measurement covariance matrix corresponding to yi.
For the sake of clarity and completeness, we briefly introduce the retrieval process. The state vector has a size of 10, composed of the weights of 8 log-equidistance size bins representing the VSD, one for mR and one for mI. The retrieval is performed for a set of predefined inversion windows, [rmin,rmax]. Each inversion window does not necessarily have overlapped regions with others, and the union of all inversion windows covers a range of 0.05–15 µm where the measurements are considered to be sensitive to the state vector. For each inversion window, an individual solution to Eq. (10) is derived, and the corresponding Vt, reff, and SSA are successively calculated from Eqs. (5)–(7). After all the individual solutions are found, the qualified ones are selected by considering the fitting error and the shape of the VSD. The statistical quantities (mean and standard deviation) of the selected individual solutions are output as the final retrieved state parameters.
In this study, apart from the spherical model used in the preliminary version (Chang et al., 2022), two non-spherical models were integrated into BOREAL (Sect. 2.3). Furthermore, BOREAL is modified to be able to take into account the spectral variability of dust mI (Sect. 2.2.2).
2.2 A priori information on dust microphysical properties
This section reviews previous studies on dust microphysical properties including size, morphology, and mineralogy. It rationalizes the modification of BOREAL aiming at dust retrieval and provides bases for the choice of scattering models and the setup of sensitivity study.
2.2.1 Size and morphology
Dust aerosols are mostly generated by wind erosion from arid and semi-arid regions (Schuttlefield et al., 2007). Particles of around 100 µm in diameter directly lifted by wind (saltation) move in ballistic trajectories. When striking the soil bed, their impacts eject dust particles (∼ 0.1–50 µm) from loose soil aggregates; some saltating particles also fragment themselves into dust aerosols (Shao, 2008). Based on results of wind tunnel experiments, Alfaro and Gomes (2001) described dust size distribution at emission with three lognormal modes (geometric median diameters of 1.5 (fine mode), 6.7 (coarse mode), and 14.2 (giant mode) µm, respectively) of which the fractions depend on wind friction velocity. The higher the wind speed, the larger amount of emission of smaller dust particles due to the increasing kinetic energy of the saltating particles. Several studies have indicated the presence of fine-mode dust by in situ measurements (Gomes et al., 1990; Kaaden et al., 2009; Kandler et al., 2009) or remote sensing retrievals (Eck et al., 2008). On the other hand, a study on the dynamic of dust size over southwestern Asia by Reid et al. (2008) conversely showed no trace of the fine mode. Moreover, they concluded that the coarse mode is not influenced by production wind speed but rather soil properties such as geomorphology or roughness length, which was further supported by an emission size model inspired by the mechanism of fragmentation of brittle materials (Kok, 2011a, b). After emission, giant-mode particles are preferentially removed by gravitational settling, while the coarse-mode particles can steadily remain airborne and travel long distances (Tegen and Lacis, 1996). For example, particles with size 1 and 10 µm in diameter will have theoretical deposition velocities of and m s−1, respectively (Wallace and Hobbs, 2006). However, analysis of data from in situ measurements (Maring et al., 2003; Reid et al., 2008) as well as large-scale closure experiments like the Saharan Aerosol Long-Range Transport and Aerosol-Cloud-Interaction Experiment (SALTRACE; Weinzierl et al., 2017) and the Chemistry-Aerosol Mediterranean Experiment/Aerosol Direct Radiative Impact on the regional climate in the Mediterranean region (ChArMEx/ADRIMED; Denjean et al., 2016) showed the settling rate of large dust particles is slower than that predicted by gravitational settling. The underlying reasons impacting the transport capability can be the presence of strong horizontal winds (van der Does et al., 2018), turbulence (Denjean et al., 2016; Garcia-Carreras et al., 2015), particle non-sphericity (Huang et al., 2020; Mallios et al., 2020), and electrostatic forces between the charged dust particles (Toth III et al., 2020). Furthermore, dust size distribution could be reshaped by coating through cloud processing (Wurzler et al., 2000), chemical reactions with trace gases and pollutants (Matsuki et al., 2005), and in-cloud or below-cloud scavenging (Mahowald et al., 2014). Thus, there is wide tempo-spatial variability of the dust size spectrum.
Since fine-mode dust is less ubiquitous and easy to mix with anthropogenic fine-mode aerosols (e.g. Denjean et al., 2016; Kandler et al., 2009; Weinzierl et al., 2009), and lidar measurements are not sensitive to giant-mode dust due to the maximum wavelength of 1064 nm (Müller and Quenzel, 1985; Veselovskii et al., 2004), we summarized previous in situ measurements of coarse-mode dust in Table 1, where the volume median radius (rV), geometric standard deviation (Sg), and reff of the lognormal fit are presented. The rV, Sg, and reff in these studies show ranges of 0.78–9.97, 1.46–2.4, and 0.64–6.79 µm, respectively. The wide variations of the dust size from study to study are not only related to the differences in dust sources, transport, and ageing processes, but also attributed to the different nature of the measurement from each instrument. A further discussion of these measurements is presented in Sect. 6.2.
Table 1Compilation of mineral dust coarse-mode volume median radius (rV), geometric standard deviation (Sg), and effective radius (reff) reported in previous studies. The marker “NA” means “not available”.
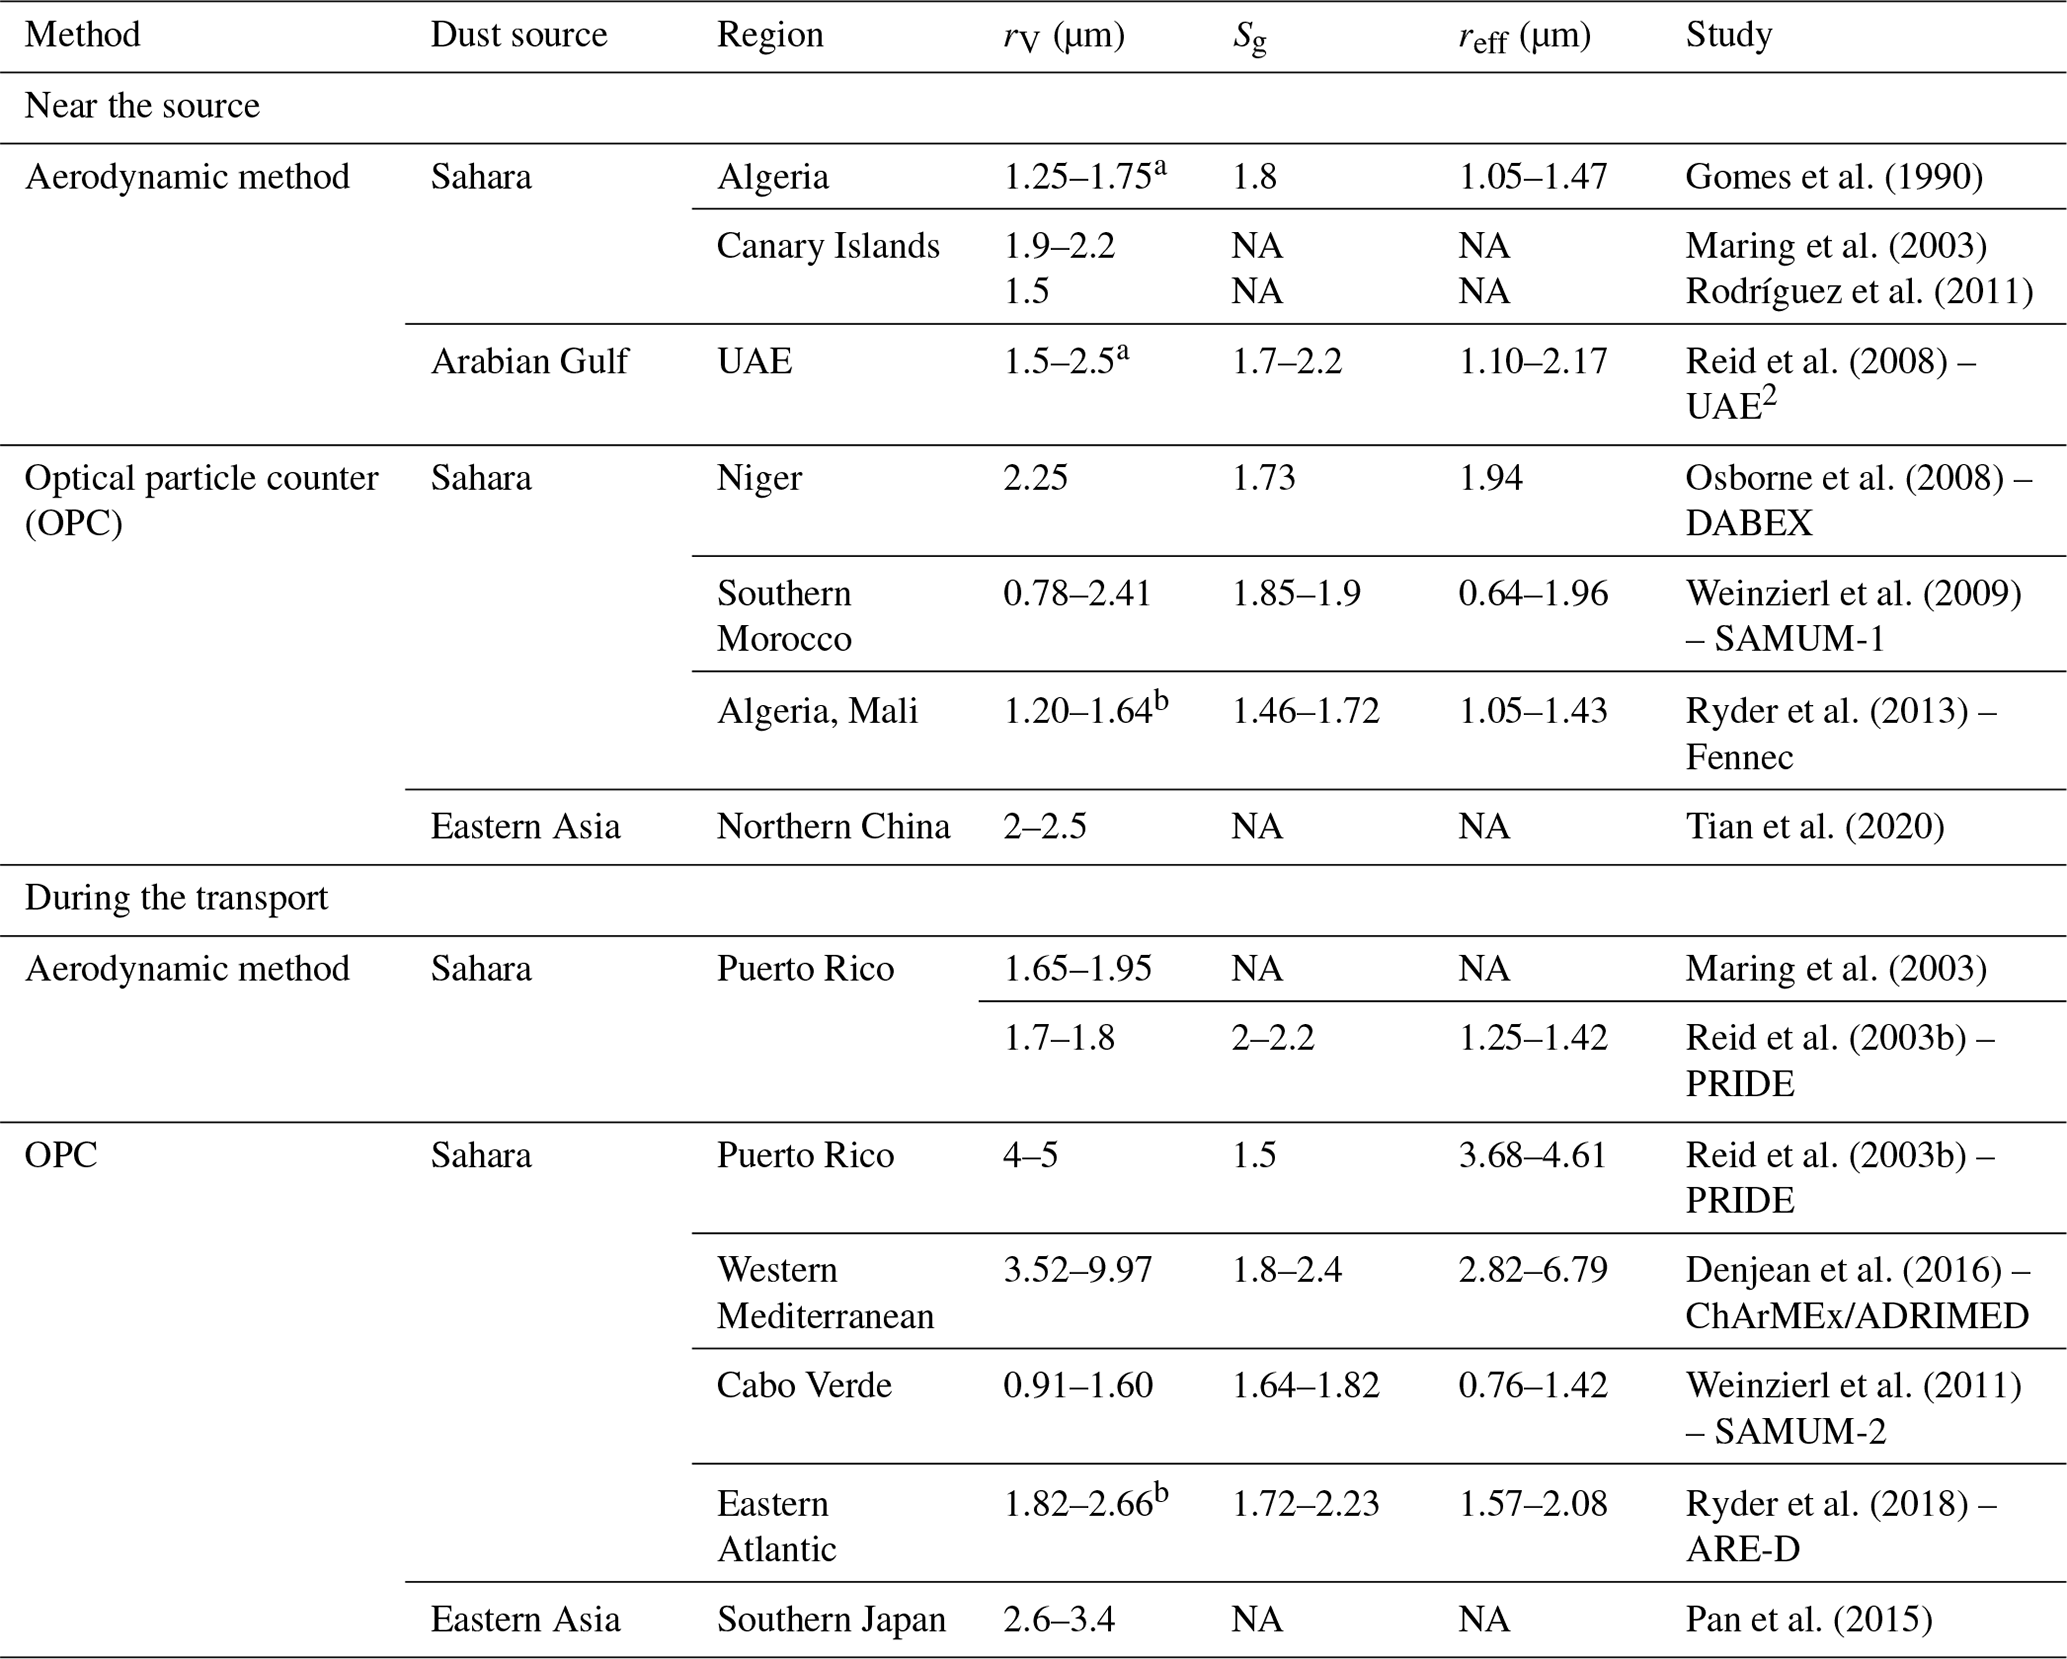
a Aerodynamic radius. b The values presented here represent the “equivalent” mode that have the same reff and effective variance with the “Mode 2 + Mode 3” in their studies. The definition of the effective variance can be found in Saito and Yang (2022).
Scanning electron microscopic images show that shapes of individual dust particles can be platelets, irregular polyhedrons, or the form of aggregates. One of the major morphological parameters characterizing dust non-sphericity is the aspect ratio (AR). There are different definitions of AR adopted in dust modelling and shape measurements (e.g. Bi et al., 2010; Kandler et al., 2011; Reid et al., 2003a). Huang et al. (2020) compared dozens of measurements of AR distributions after converting them to the same AR descriptor and found that the dependence of dust shape on particle size and source region is not statistically significant, while during transport, the overall non-sphericity could either increase because of the relatively higher gravitational settling of more spherical particles or decrease due to potential coating processes.
2.2.2 Complex refractive index
The complex refractive index (CRI) of mineral dust mainly depends on its chemical composition and therefore is related to the mineralogy of the source soil. The hematite and goethite, which are two main mineral compositions of dust particles, are light-absorbing at ultraviolet (UV) and visible (VIS) wavelengths (Sokolik and Toon, 1999). The dust CRI is also partly influenced by the mixing states with other aerosol species such as sulfate and sea salt (Kandler et al., 2009, 2011). Here we review two representative studies of Kandler et al. (2011) and Di Biagio et al. (2019), where spectral CRIs of dust samples from various sources were provided. Kandler et al. (2011) sampled Saharan dust aerosols at a ground station (4 m above the ground) in Praia, Cabo Verde, and calculated the spectral CRI based on the measured volume fractions of the chemical components using a homogeneous internal mixing rule (Ouimette and Flagan, 1982). In a wavelength range of 355–2000 nm, the results (denoted K11 and summarized in Table 4 of that paper) show spectrally independent real parts (mR) varying 1.56–1.58 and spectrally dependent imaginary parts (mI) varying –. Di Biagio et al. (2019) retrieved spectral CRIs for samples from global dust sources by fitting laboratory nephelometer (for scattering coefficients) and aethalometer (for absorption coefficients) measurements between 370 and 950 nm. Similarly, the results (denoted D19 and summarized in Table 4 of that paper) show spectrally independent mR varying 1.48–1.55 among different sources and spectrally dependent mI. A noticeable contrast between the two studies, however, is that the K11 also shows size-dependent mI, which is not seen in the D19. This may be because the mixing rule used for the calculation of K11 is based on size-dependent mineralogical composition, as discussed by Di Biagio et al. (2019).
The BOREAL's version depicted by Chang et al. (2022) did not consider the spectral dependence of dust mI, which could lead to a retrieval error of 17 %–25 % in Vt and consequently increasing retrieval uncertainty in other parameters as pointed out by Veselovskii et al. (2010). A sensitivity study on this issue will be presented in Sect. 3.2. To study the spectral relationship of dust mI at lidar wavelengths, we derived the values of mI,355, mI,532, and mI,1064 of K11 (linear interpolation for 1064 nm) and D19 (linear interpolation for 532 nm and linear extrapolation for 355 and 1064 nm). As shown in Fig. 1, the results from D19 presents a strong correlation between mI,355 and mI,532, whereas there is a relatively weak correlation between mI,355 and mI,1064. We infer that this is probably because, as shown by their study, the imaginary part in the UV and VIS is mostly dominated by iron oxide, whose spectral dependence of the imaginary part leads to the almost linear relationship between mI,355 and mI,532; on the contrary, the imaginary part in the near infrared (NIR) is affected by multiple components, and thus a weaker correlation between mI,1064 and mI,355 is observed. Similarly, they pointed out that the variation among the samples, even if they are collected from the same desert region, is mostly related to difference in the iron oxide and elemental iron content. Compared to D19, K11 has higher mI,355 and mI,532 but consistent mI,1064. In particular, the results at 355 and 532 nm perfectly verify the linear relationship between these two wavelengths. According to the results shown in Fig. 1, in the modified BOREAL that takes into account the spectral dependence of dust mI, mI,355 is retrieved as a state parameter, while mI,532 is calculated with the fitted linear function shown in Fig. 1a. As for mI,1064, it is simply fixed to 0.001 as it barely affects the measurements (see Sect. 3.2). The a priori mean and standard deviation are 1.5 and 0.5 for mR and 0.005 and 0.005 for mI,355, respectively, consistent with the setting in Chang et al. (2022).
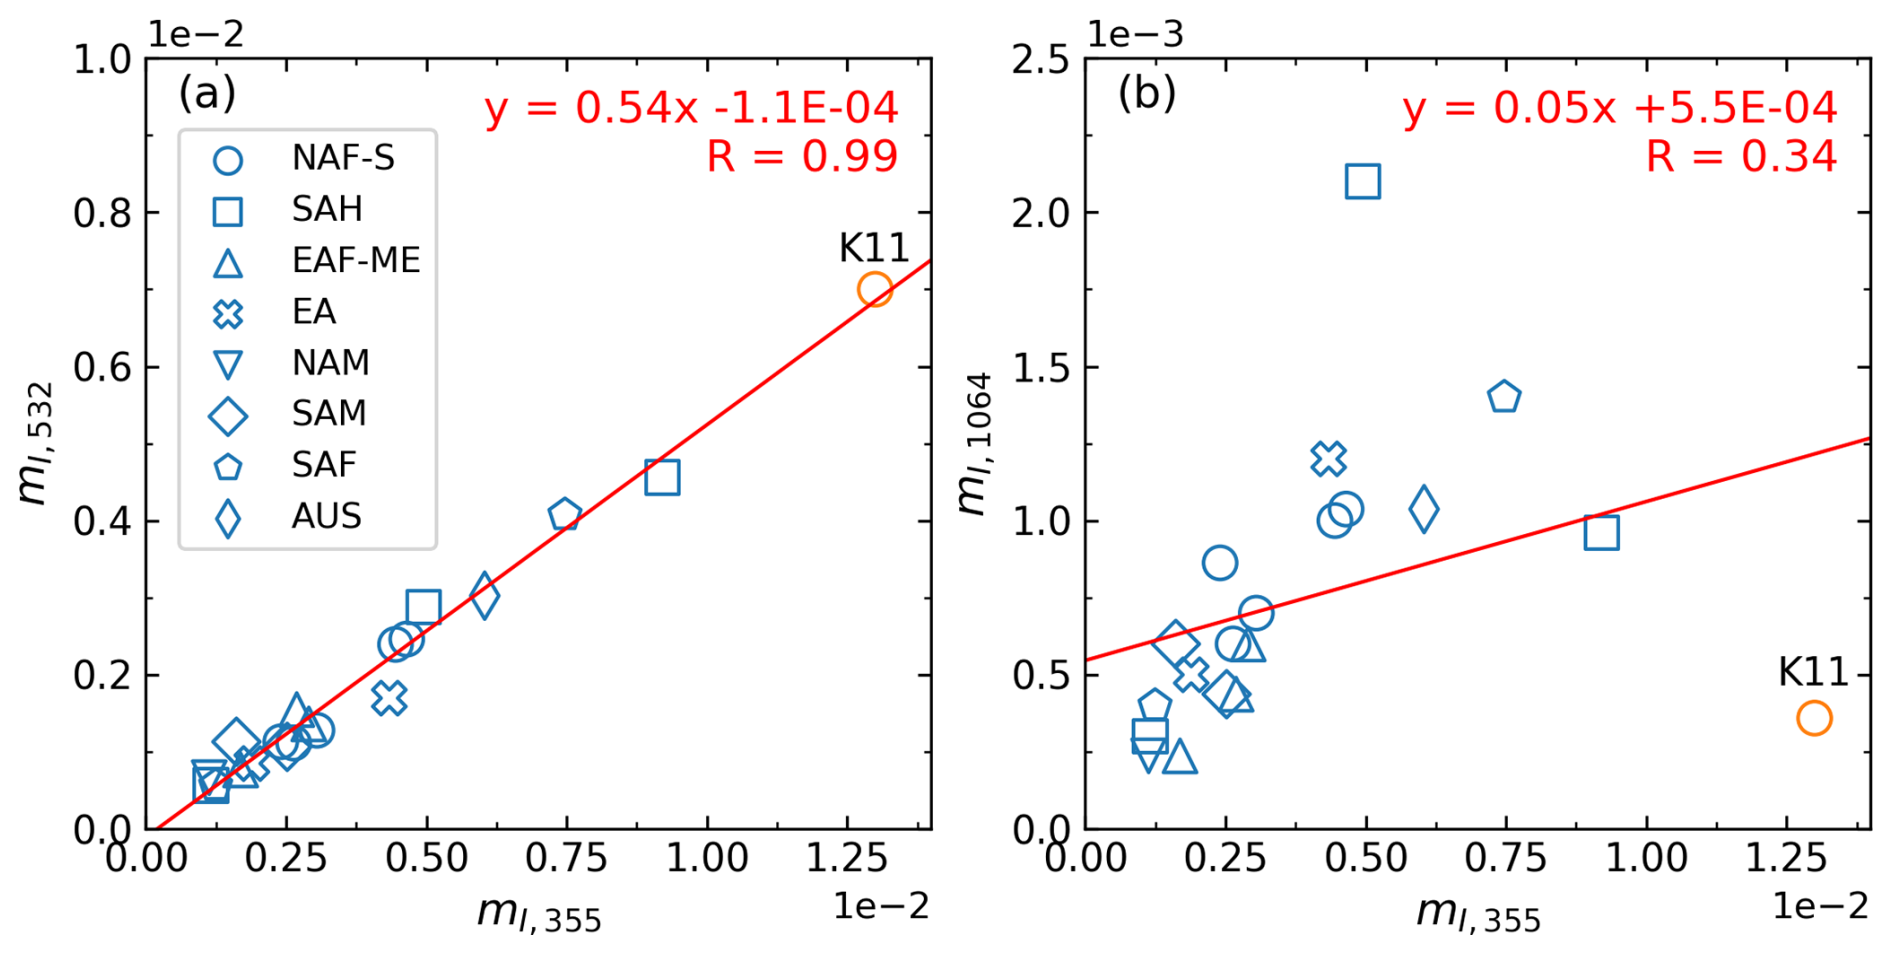
Figure 1Scatters of imaginary parts (mI) of the complex refractive index (CRI) at (a) 355 and 532 nm and (b) 355 and 1064 nm, derived from the results published by Kandler et al. (2011) (K11, orange) and Di Biagio et al. (2019) (D19, blue). The mI,355 and mI,1064 for D19 are derived by linear extrapolation of the original results; the mI,532 for D19 and the mI,1064 for K11 are derived by linear interpolation of the original results. Source-resolved results for D19 are presented with different markers representing northern Africa–Sahara (NAF-S), the Sahel (SAH), eastern Africa and Middle East (EAF-ME), eastern Asia (EA), North America (NAM), South America (SAM), southern Africa (SAF), and Australia (AUS). A linear fitting of all the results is also shown as red lines.
2.2.3 Mixture with other aerosol types
Dust particles could mix with other aerosol species internally or externally, which modifies both optical and microphysical properties from the pure dust (Matsuki et al., 2005; Ryder et al., 2015; Tesche et al., 2009; Weinzierl et al., 2009, 2011; Zhang and Iwasaka, 2004). Previous studies related to dust retrieval from lidar measurements assumed the observed ensemble is a mixture of spherical and non-spherical parts which are of the same VSD and CRI but of different volume fractions. As a result, an additional state parameter, the spherical volume fraction (SVF), is introduced and retrieved (Müller et al., 2013; Tesche et al., 2019; Veselovskii et al., 2010). Nevertheless, we have discovered that retrieving SVF greatly enlarges the system underdetermination, even when the spectral PLDR is incorporated into the inversion dataset. Moreover, we encounter difficulties in determining the a priori constraints on the CRI of the aerosol mixture. Therefore, in the following simulation sections, we do not consider mixing states and assume pure dust microphysical properties. In the analysis of real dust retrievals, we believe the uncertainty due to this assumption can be reduced by focusing on cases with relatively higher possibility to be pure, which can be identified by high δ532 and low fluorescence capacity (Veselovskii et al., 2022).
2.3 Scattering models considering particle shape
Dust non-sphericity evoked studies that model dust particles with more complex shapes rather than spheres, such as ellipsoids (Meng et al., 2010), nonsymmetric hexahedra (Bi et al., 2010), super ellipsoids (Bi et al., 2018), deformations of spheroids and ellipsoids (Gasteiger et al., 2011), and other evolved irregular shapes (Kalashnikova and Sokolik, 2002). To derive the related scattering properties for different domains of the size parameter (x), these studies exploited combinations of computational methods such as the discrete dipole approximation (DDA; Yurkin et al., 2007), the finite-difference time domain (Yang et al., 2000), the advanced T-matrix method (Mishchenko et al., 2002), the invariant-imbedding T-matrix method (Bi et al., 2013; Johnson, 1988), the improved geometric optics method (IGOM; Yang and Liou, 1996), and physical geometric optical method (PGOM; Yang and Liou, 1997). To some extent, these studies improve the characterization of dust particles compared to simply assuming dust shape as sphere. On the other hand, however, they suffer from different limitations which impede further application to lidar observations and retrievals. For instance, in Meng et al. (2010), the model failed to consider the coherent backscattering enhancement (CBE) due to the use of IGOM, resulting in an underestimation of β by up to a factor of 2 (Huang et al., 2023; Zhou, 2018). Others are of high complexity and lack a complete published database, so it is difficult to apply them to remote sensing retrievals. In this study, we evaluate the performance of the following two non-spherical scattering models. The spherical model is also tested as a comparison, given the fact that most global aerosol models approximate dust as spherical particles (Gliß et al., 2021).
2.3.1 Spheroidal model
The spheroidal model approximates an irregular aerosol particle to a spheroid of which the shape is described by two parameters: the volume-equivalent radius, rvol (the radius of the sphere having the same volume with the spheroid), and the axis ratio (the ratio of the spheroid rotational axis to the perpendicular axis). Thus, an ensemble of randomly orientated spheroids is characterized by the size and axis ratio distributions, which are thought of as independent of each other. The applicable spheroidal model was developed by Dubovik et al. (2006), and as stated by the authors, it is rationalized in remote sensing applications for the following reasons: (1) the spheroid is the simplest aspherical smooth shape with one more freedom (e.g. the length of the spinning axis) than the sphere, which means the least computational burden compared to other irregular shapes; (2) specific shape details of a single particle have insignificant influence on the bulk scattering properties of a particle ensemble due to averaging effect. To derive the optical properties, the model uses the advanced T-matrix method within the size limit and IGOM onward. The size limit depends on the axis ratio and CRI. The study of Dubovik et al. (2006) showed that the spheroidal model can well fit the laboratory measurements of dust scattering matrices (scattering angle range: 5° < Θ < 173°; Volten et al., 2001) and significantly improve dust retrievals from sun photometer measurements. However, some limitations of the spheroidal model regarding to lidar applications have been found. Dubovik et al. (2006) pointed out for large particles and scattering angles greater than 175°, the computational accuracy deteriorates due to the limitations of IGOM. Studies found that the use of IGOM for large particles underestimates the backscattering coefficient because it ignores the CBE effect (Saito et al., 2021; Zhou, 2018). This leads to overestimation of LR, particularly at 355 nm (Haarig et al., 2022; Huang et al., 2023). Furthermore, comparisons of model-produced with lidar-measured PLDRs show that the spheroidal model fails to present the spectral variation of dust PLDR and underestimates the value at 355 nm (Haarig et al., 2022; Müller et al., 2010; Noh et al., 2017; Shin et al., 2018; Tesche et al., 2019).
The database published by Dubovik et al. (2006) provides spheroidal kernels of extinction, absorption, and phase matrix elements for different rvol, axis ratio, Θ, mR, and mI. To reduce the underdetermination of the inversion of lidar measurements, we integrate the spheroidal model into BOREAL by fixing the axis ratio distribution to that of a feldspar sample (Volten et al., 2001) retrieved by Dubovik et al. (2006). Such a strategy has been adopted in the AERONET operational dust retrieval procedure (Holben et al., 2006), as well as some lidar dust retrievals (Müller et al., 2013; Tesche et al., 2019; Veselovskii et al., 2010). Consequently, compared to spherical particles, no extra state parameters are introduced. The size descriptor of the spheroidal model in BOREAL is rvol.
2.3.2 Irregular–hexahedral (IH) model
The IH model approximates dust particles as hexahedrons with randomly tilted faces to produce more realistic dust shapes (e.g. sharp corners) (Saito et al., 2021). An IH particle is characterized by its maximum diameter, Dmax (the diameter of the circumscribed sphere of the particle), and the degree of sphericity, ψ (determined by particle volume and surface area; Wadell, 1935). Assuming ψ is size-independent, the IH model defines 20 IH particles, each with its own ψ. The irregular particle ensemble is then composed of a mixture of the 20 types of irregular hexahedrons, and the ensemble-weighted degree of sphericity for the ensemble (ψ) can be determined from the ψ of each type of IH particle and the corresponding number mixing ratio. The model provides ψ from 0.695 (less spherical) to 0.785 (more spherical) depending on the user's choice. To calculate the scattering properties, from small to large size parameters (), the IH model exploits the Rayleigh scattering approximation (x≪1), IITM, and a combination of PGOM and IGOM, respectively. The range of x varies for different ψ and CRIs. Note that the difference between the advanced T-matrix methods and IITM is that the former provides numeric exact solutions of electromagnetic scattering only for randomly orientated spheroids and the latter for more general non-spherical particles. Compared to the spheroidal model, the IH model accounts for the CBE due to the use of PGOM and the sharp-corner characteristics of real dust particles. Thus, an improvement in backscattering calculation is expected (Saito et al., 2021; Saito and Yang, 2021).
The database published by Saito et al. (2021) provides the same optical properties as the spheroidal model for different Dmax, ψ, mR, and mI. But they are cross sections rather than kernels. To derive the corresponding kernels, we integrated the cross sections at three adjacent size grids using the trapezoidal approximation (Twomey, 1977). We also noticed that the ensemble-weighted degree of sphericity acts like the integral of axis ratio distribution in the spheroidal model. Thus, due to the same reason for not increasing the underdetermination, we fix the value of ψ to 0.71 to represent dust cases, a value employed by plentiful studies related to this model (Martikainen et al., 2025; Saito et al., 2021; Saito and Yang, 2021; Wang et al., 2024). Finally, to ensure the same size descriptor used in different scattering models throughout this study, we convert Dmax to rvol via
where v is the ensemble-weighted volume for given ψ and Dmax, which is provided in the look-up table of the database.
2.4 Lidar system
In this study, BOREAL combined with different scattering models is applied to invert real dust optical properties measured by LILAS (Lille Lidar Atmospheres) – a multi-wavelength Mie–Raman–polarization–fluorescence lidar system developed by the Laboratoire d'Optique Atmosphérique, Université de Lille. LILAS exploits the Nd:YAG crystal to emit laser pulses with a repetition rate of 20 Hz and pulse energy of 90, 100, and 100 mJ at 355, 532, and 1064 nm. Currently, the receiving channels are composed of the following: three pairs of parallel- and cross-polarized channels at 355, 532, and 1064 nm for the reception of elastic signals; two Raman channels at 387 and 530 nm; and a broad-band fluorescence channel centred at 466 nm. Such configuration allows simultaneous measurements of (PLDR at 355, 532, and 1064 nm) + 1βF (fluorescence backscattering coefficient centred at 466 nm). Detailed descriptions of data acquisition and error analysis can be found in Hu (2018), Hu et al. (2019), and Veselovskii et al. (2020). LILAS can be transferred as an individual lidar instrument to perform measurements in field campaigns (Hu et al., 2020; Veselovskii et al., 2016) as well as make stationary routine aerosol observations at the ATOLL (Atmospheric Observation in Lille) platform where various remote sensing and in situ instruments for atmospheric monitoring have been integrated into national and international observational networks such as the European Aerosol Research Lidar Network/Aerosols, Clouds, and Trace gases Research Infrastructure (EARLINET/ACTRIS) and PHOTONS/AERONET (Holben et al., 1998; Wandinger et al., 2016).
In this section, we first investigate how the optical properties simulated with the IH, spheroidal, and spherical models are different from each other, as well as from some real lidar measurements. Then, we use forward simulations to figure out the sensitivity of lidar measurements to some state parameters. The VSD of a particle ensemble is assumed to be lognormal:
where r represents the particle radius for a spherical particle and volume-equivalent radius (rvol) for a non-spherical particle; rV is the volume median radius, Sg the geometric standard deviation and Vt the total volume concentration. For convenience, Vt is fixed to 1 µm3 cm−3 throughout this section. The lognormal distribution has been widely used to represent the sizes of aerosols of different kinds in the fields of modelling, remote sensing, and in situ measurements (e.g. Di Biagio et al., 2019; Dubovik et al., 2002; Hess et al., 1998; Whitby, 1978).
3.1 Optical properties
We focus on the comparison of extinction, backscattering, and absorption properties. Figure 2 shows P11 and P22 at 180° as well as SSA simulated with the spheroidal, IH, and spherical models for different reff, mR, and mI at 532 nm. The reff varies from 0.1 to 5 µm with a fixed Sg of 1.95 (mean value of Table 1), corresponding to a rV from 0.12 to 6.25 µm. The range of the CRI coincides with the envelop of the measurements of Di Biagio et al. (2019), with mR between 1.4–1.6, in the first row (Fig. 2a–c) and mI,532 between 0.001–0.007, mR=1.5 in the second row (Fig. 2d–f). It can be seen that the P11(π) for non-spherical particles is smaller than that for spherical particles and presents less variability driven by the change in CRI. This contrast between spherical and non-spherical particles is caused by the surface wave (van de Hulst, 1958), of which the revision here indicates that the used non-spherical models are physically sound. On the other hand, IH and spheroidal particles in general produce similar P11(π), except for reff>1.5 µm, where the P11(π) for the IH particles is slightly larger. The magnitudes of P22 simulated with the two non-spherical models are similar for reff<0.5 µm; however, for reff>0.5 µm, the P22(π) of the IH particles is evidently smaller, which will consequently result in larger PLDR. The simulated SSA does not show much sensitivity to particle shape, as demonstrated by previous studies (Johnson and Osborne, 2011; Mishchenko et al., 2002; Müller et al., 2010); however, it decreases with the increase in reff or mI because that results in an increase in absorption (Bohren and Huffman, 1998; Tegen and Lacis, 1996).
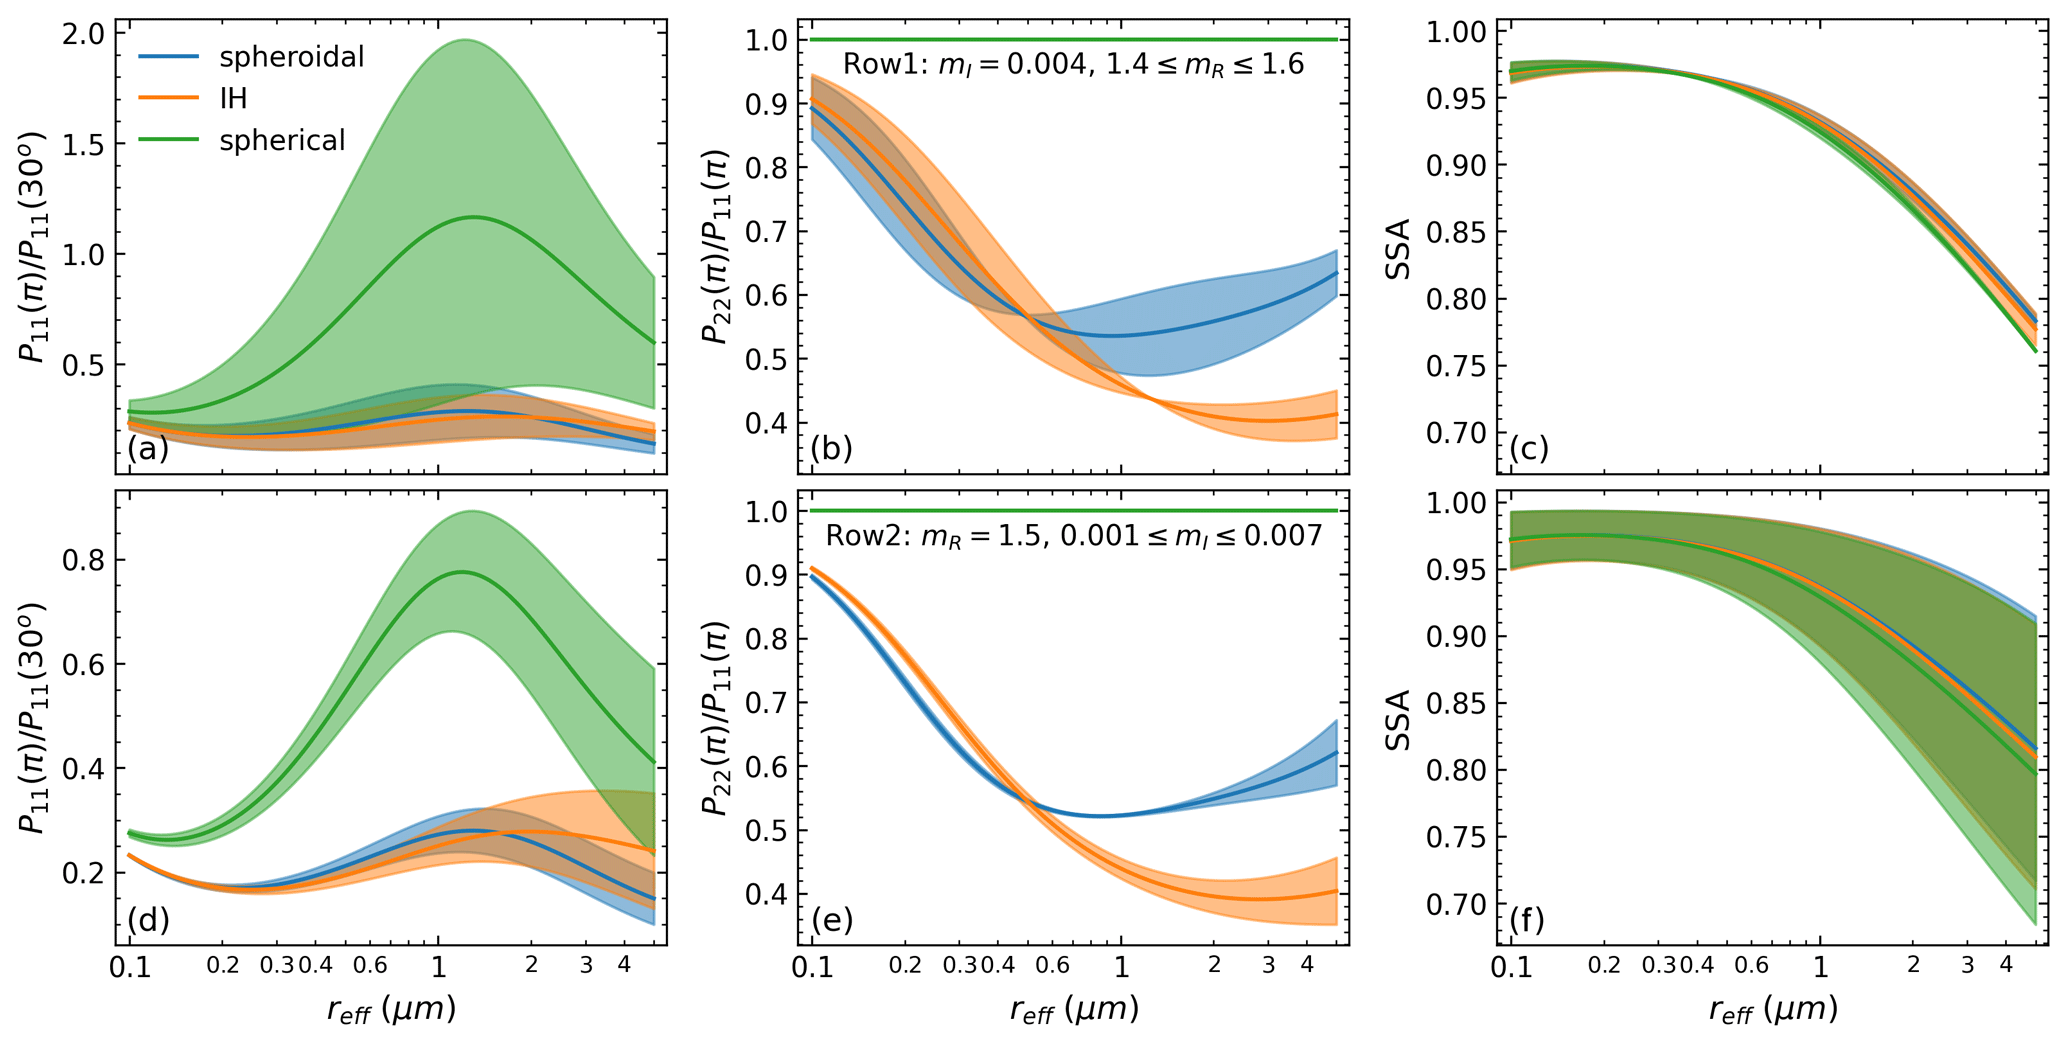
Figure 2Optical properties simulated with the spheroidal, IH, and spherical models for different effective radii (reff) and CRIs at 532 nm. (a, d) P11 at 180° (divided by P11 at 30°). (b, e) P22 at 180° (divided by P11 at 180°). (c, f) SSA. The geometric standard deviation (Sg) for generating the lognormal volume size distributions (VSDs; see Eq. 12) is 1.95. The mI is fixed to 0.004, and mR varies between 1.4–1.6 in the first row (a–c), while the mR is fixed to 1.5, and mI varies between 0.001–0.007 in the second row (d–f). The shaded areas imply the ranges of variability due to the change in CRI, and the solid lines are means of the lower and upper bounds.
Next, we compare the lidar-related properties. The size distribution range is selected the same as that in Fig. 2, while we utilize the values from D19 for the CRI (see Fig. 1). As a comprehensive database of the short-wave CRI of global dust samples, D19 has been used for sensitivity simulations by other studies (e.g. Ito et al., 2021). The simulated α and β at 532 nm, the extinction Ångström exponent (EAE), and backscattering Ångström exponent (BAE) over 355–532 nm are shown in Fig. 3. The solid lines and error bars represent the mean and 1 standard deviation of the spread results due to the variation of CRIs. It can be seen that the simulated extinction coefficient shows little sensitivity to CRI except at reff=0.1 µm. The magnitudes of α are always similar between IH and spheroidal particles, while those of spherical particles become lower with the increase of reff. This indicates the larger surface areas of the non-spherical particles than the spherical particles, which lead to higher mass extinction efficiency (Huang et al., 2023; Ito et al., 2021; Kok et al., 2017). The simulated backscattering coefficient presents dependence on both particle shape and CRI. In particular, spherical particles show considerably larger β than non-spherical particles, which is in line with the contrast of P11 shown in Fig. 2. A weaker backscattering is expected as particles become more aspheric and sharper (Kalashnikova and Sokolik, 2002; Mishchenko et al., 2002). Nevertheless, the β of the spheroidal particles is quite similar to that of the more aspheric and sharper IH particles. This is because the computational method used by the spheroidal model ignores the CBE effect (Sect. 2.3), resulting in a systematic underestimation of β. The EAEs simulated with all these models always show little sensitivity to CRI, and as reff increases, they first steadily decrease to zero and then show weak sensitivity to reff. The BAEs simulated with all these models also decrease with the increase in reff; nevertheless, they present increasing sensitivity to CRI as reff increases.
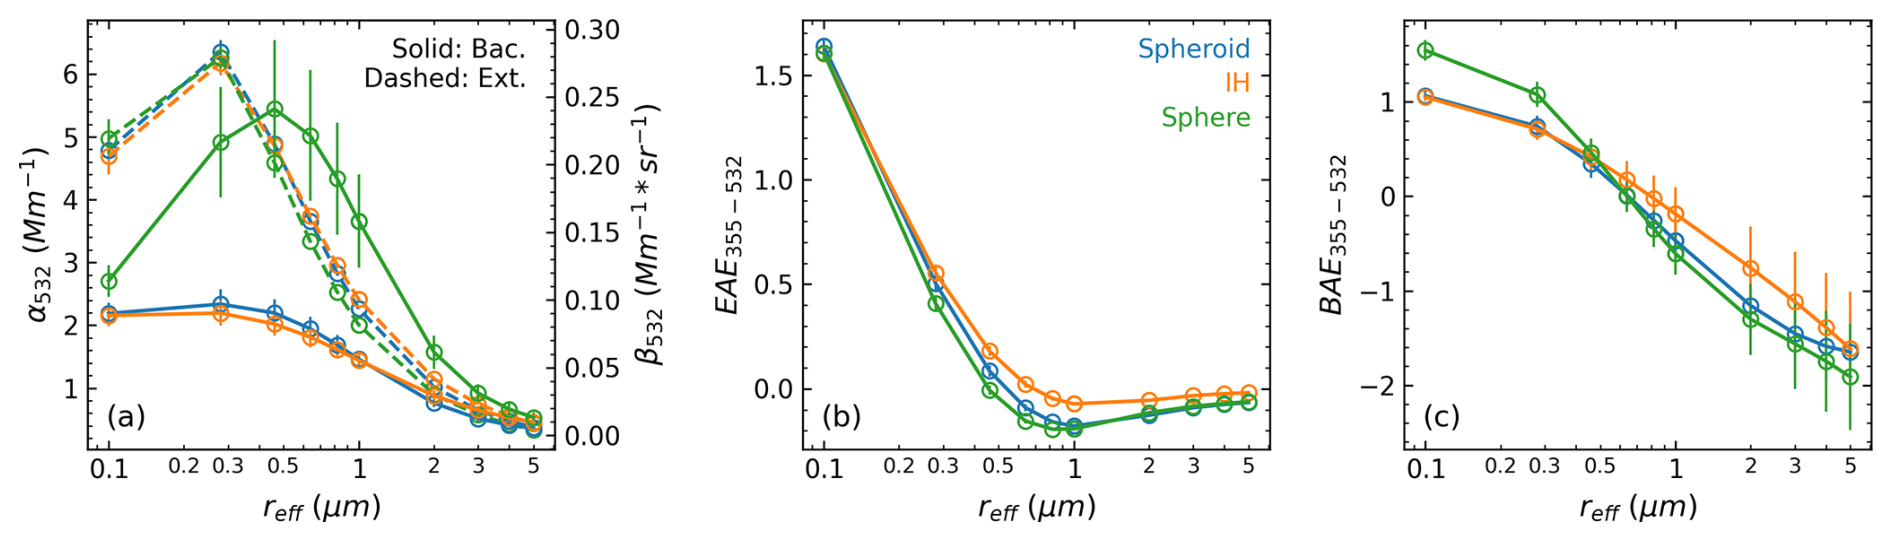
Figure 3Lidar-related optical properties simulated with the spheroidal (blue), IH (orange), and spherical (green) models as functions of reff for varying CRIs. (a) Extinction (α, dashed lines) and backscattering (β, solid lines) coefficients at 532 nm. (b) Extinction Ångström exponent over 355–532 nm (EAE355–532). (c) Backscattering Ångström exponent over 355–532 nm (BAE355–532). The Sg of the VSDs is the same as that in Fig. 2, while the CRIs are set to the results of 19 global samples reported in Di Biagio et al. (2019) (also see Fig. 1). The markers and error bars represent the mean and 1 standard deviation of the spread results due to the variation of the CRIs, respectively.
Figure 4 displays spectral LRs and PLDRs simulated with the spheroidal and IH models. The particle microphysical properties for the simulation are the same as those in Fig. 3. It can be seen that the LRs for the two particle types only show divergence at 355 and 532 nm for reff>1 µm, where the spheroidal particles have a larger LR. However, the LR variations against wavelength and particle size produced by the two non-spherical models are always consistent. For reff between 0.4–1 µm, the LRs slightly increase as the wavelength changes from 355 to 532 nm, while an obvious increase in the LRs is observed as the wavelength increases from 532 to 1064 nm. By contrast, for reff>1 µm, the LRs present a clear decreasing trend with the increase in the wavelength and, at the same time, are more affected by CRI. Furthermore, although it is not shown here, spherical particles have apparently lower LR than the non-spherical particles due to their stronger backscattering, as we have seen in Fig. 3a. The simulated PLDRs show strong size dependence varying with wavelength, indicating spectral PLDR contains useful information for particle size retrieval (Mishchenko et al., 2002). The influence of particle shape on PLDR seems to depend on the effective size parameter, : the PLDR of IH particles is obviously larger than that of spheroidal particles when xeff is greater than 5. The higher PLDR produced by the IH particles could result from the more irregular shape with asymmetric surfaces that cause more complex inner reflections and thus more significant change in the polarization state between the incident and backscattered light (Liou, 2002). However, when xeff is less than 5, the sensitivity of PLDR to surface deformation disappears, and the PLDRs of both types of particles rapidly decrease with the decrease in xeff, consistent with the variations of P22(π) shown in Fig. 2b and d and the simulations of Gasteiger et al. (2011). The spectral variation of PLDR when reff>1 µm is another significant contrast between the two models: as the wavelength increases, the spheroidal-produced PLDR monotonically increases, whereas the IH-produced PLDR peaks at 532 nm or monotonically decreases. Furthermore, this simulation suggests that PLDR is more sensitive to particle size than CRI: the influence of CRI on PLDR emerges only if reff>1 µm at 355 nm for both types of particles.
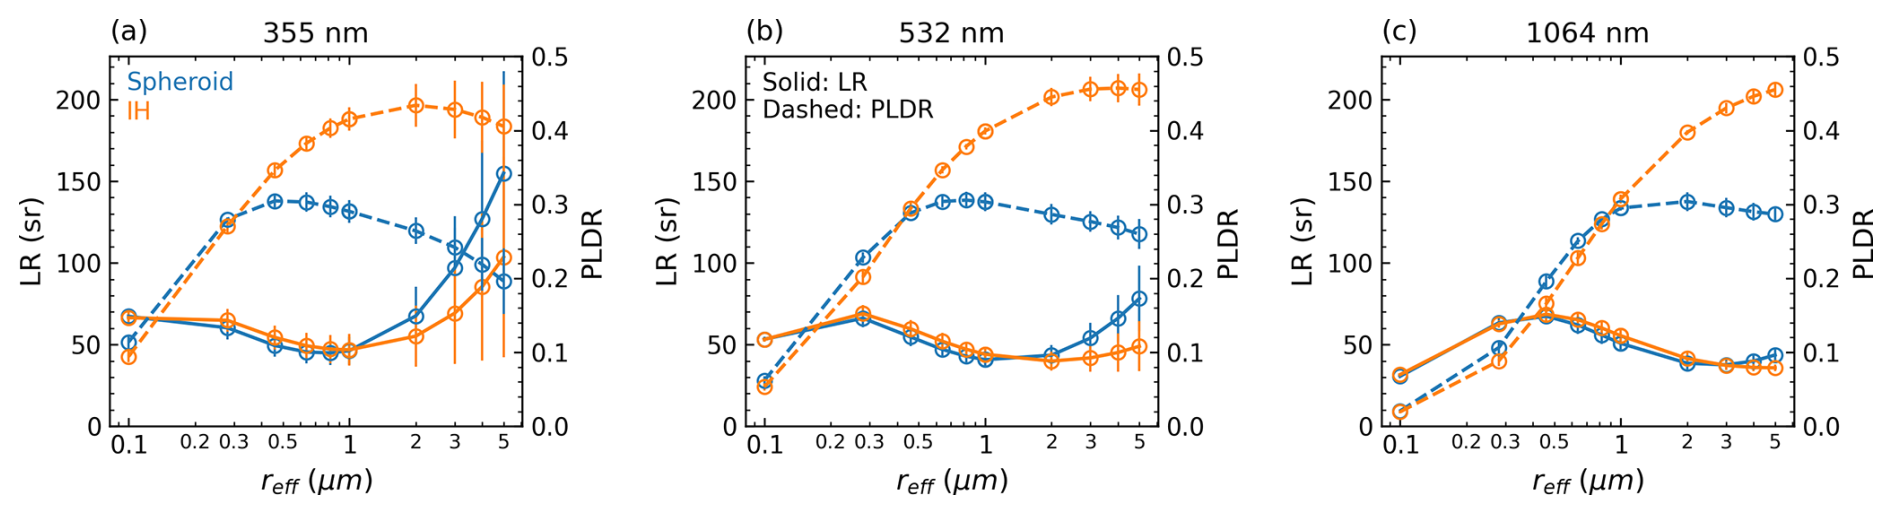
Figure 4LRs and PLDRs simulated with the spheroidal and IH models at (a) 355 nm, (b) 532 nm, and (c) 1064 nm. The VSDs and CRIs for the calculation are the same as those in Fig. 3.
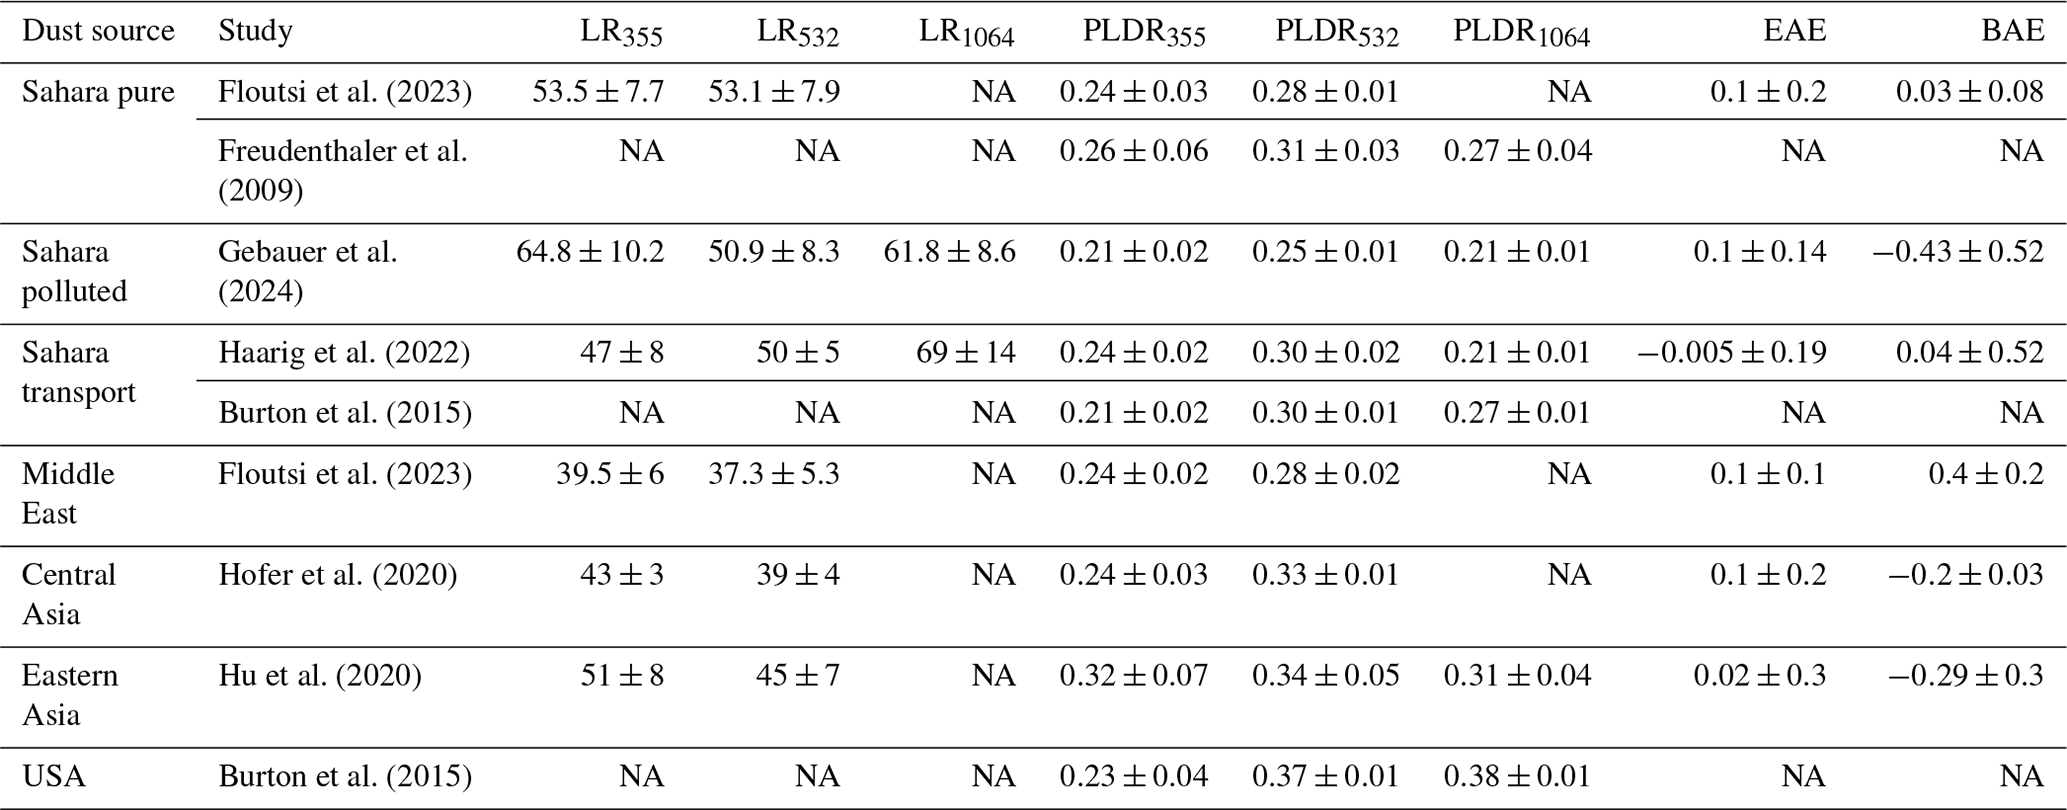
We compared model-simulated optical properties with some real lidar measurements, which are compiled in Table 2. In particular, it shows the comparison between two triple-wavelength LR and PLDR measurements of Saharan dust (Gebauer et al., 2024; Haarig et al., 2022). The two measurements present consistent spectral variation of PLDR between 355 and 1064 nm and spectral variation of LR between 532 and 1064 nm, verifying the same Saharan source. However, the measurement by Gebauer et al. (2024) shows an overall smaller spectral PLDR and a larger LR355 than those by Haarig et al. (2022), indicating the dust was polluted (Gebauer et al., 2024). Combining all these measurements, the measured EAEs vary in an overall range of ±0.3, showing no clear dependence on dust sources and transport processes. They can be reproduced by all the scattering models for reff>0.4 µm. The measured BAE varies in a larger range between −0.95 and 0.6 probably due to the variations of CRI. Except the polluted Saharan dust case, the measurements reveal a source dependence of dust BAE: Saharan dust has a systematically higher BAE than Asian dust, which might result from the difference in CRI induced by different mineralogic components in the source soil. In spite of the large range of the measured BAE, it can only be reproduced by the IH particles when reff is greater than 1 µm.
The measurements of LR generally decrease from 355 to 532 nm (except for the Saharan transported dust) and increase from 532 to 1064 nm. Such a spectral variation is well described by both spheroidal and IH models for the reff range 0.4–1 µm. When reff≥2 µm, the spheroidal model produces LR355 too high, whereas the IH model produces more reasonable values compared with the measurements. On the other hand, both spheroidal and IH models can well reproduce the measured LR355 when reff>0.4 µm. The measurements of PLDRs for Saharan and Middle East dust can be reproduced by spheroidal particles with reff between 0.4–1 µm, whereas it cannot be well reproduced by IH particles in this size range because the simulated values are either too high at 355 nm or too low at 532 nm. On the other hand, only the IH particles can reproduce the measurements of PLDRs for US and East Asia dust, of which the magnitudes and spectral variations are apparently distinct from those for Saharan and Middle East dust, probably because of the differences in dust purity and the fraction of larger particles (Gebauer et al., 2024; Hu et al., 2020).
Table 2Summary of representative lidar measurements of dust optical properties, including lidar ratio (LR), particle linear depolarization ratio (PLDR), extinction Ångström exponent (EAE, over 355 to 532 nm), and backscattering Ångström exponent (BAE, over 355 to 532 nm).
The above simulations illustrate the distinctions and resemblances among the spherical, spheroidal, and IH models in generating particle scattering properties. The backscattering coefficient is the most prominent contrast between the spherical and non-spherical models, whereas the main difference between the two non-spherical models is observed in the PLDR. They indicate that the IH model might be the preferable one in terms of mimicking optical properties more consistent with real lidar measurements. A further discussion is presented in Sect. 6.
3.2 Influence of ignoring spectral dependence of mI
Recall that in Sect. 2.2.2, in order to account for the spectral dependence of dust imaginary refractive index, we use the derived regression relation to link mI,355 and mI,532 and fix mI,1064 to 0.001. Following from this consideration, two questions arise: (1) what will be the influence if we ignore the mI spectral dependency? (2) Since a visible dispersion of mI,1064 (–) is observed in Fig. 1b, is a reasonable assumption for the retrieval? To this end, we calculated the difference in optical properties due to different treatments of mI. The same microphysical properties as those in Figs. 3–4 are used for the calculation. As illustrated in Fig. 5, the solid lines represent the variations in α, β, and δ after setting (λ=532 or 1064 nm), namely, dismissing the spectral dependence, while the dashed lines represent the variations after setting . For comparison, we set measurement uncertainties as one-third of the estimated maximum measurement errors for LILAS (2019). It can be seen that at 532 nm, the variability of α is much smaller than the corresponding measurement uncertainty all the time, which means that ignoring the spectral dependence of mI has no influence on α532. Nevertheless, the variation in β rapidly increases as reff grows and exceeds the measurement uncertainty for reff>0.2 µm (at 532 nm) and reff>0.4 µm (at 1064 nm), respectively. The influence on δ is only significant for reff>3 µm at 532 nm and reff > 4 µm at 1064 for both spheroidal and IH models. On the other hand, the assumption of makes no change in δ1064; however, the variation of β1064 exceeds the measurement uncertainty for reff>3 µm for the spherical and spheroidal models and reff>4 µm for the IH model, respectively.
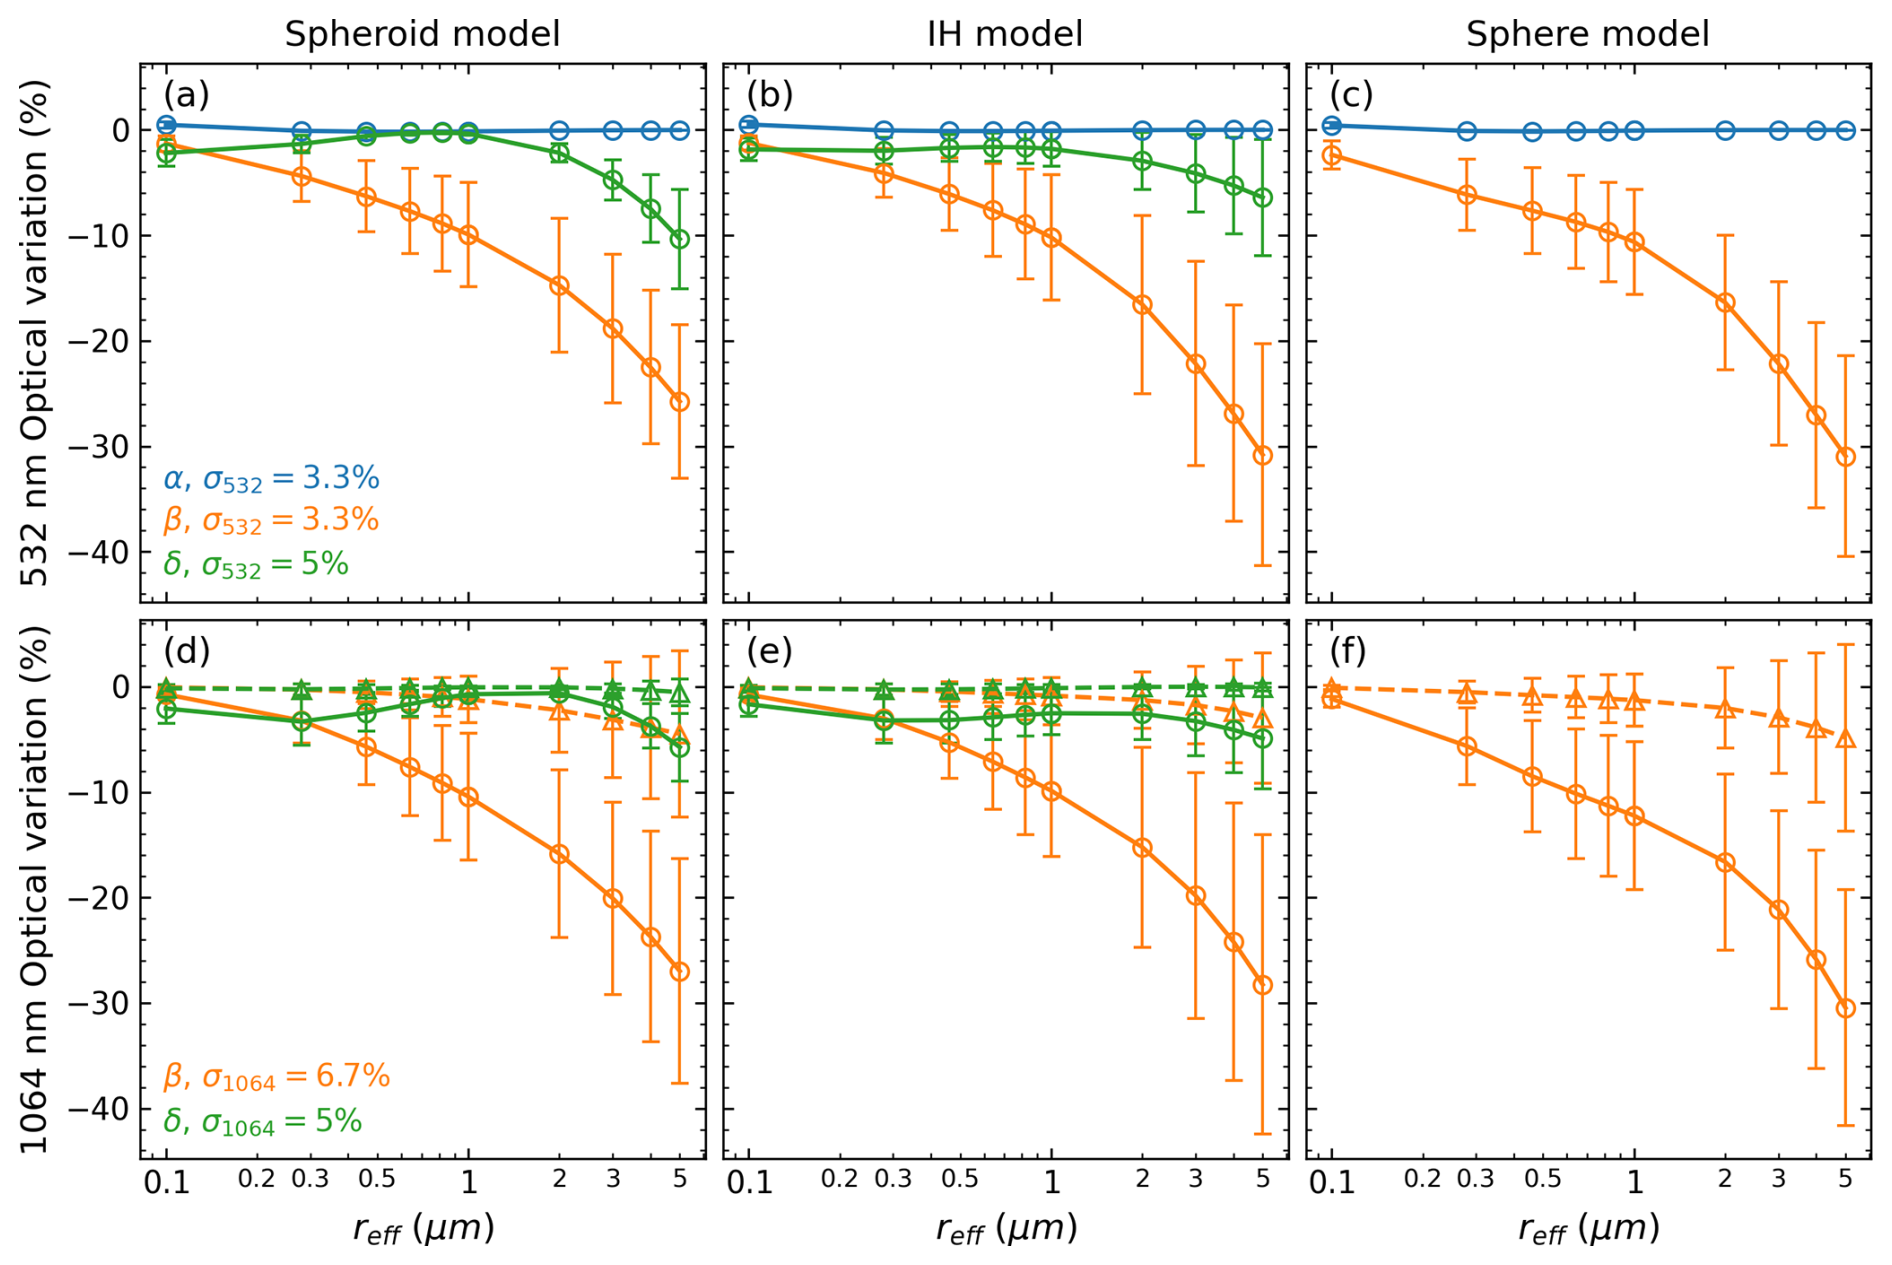
Figure 5Variations of optical properties due to different treatments of the imaginary part of CRI, simulated with the spheroidal (a, d), IH (b, e), and spherical (c, f) models. (a–c) Variations of α532, β532, and δ532 if we use rather than the exact value. Variations of β1064 and δ1064 if we use rather than the exact value (d–f, solid lines with circle markers). Variations of β1064 and δ1064 if we use rather than the exact value (d–f, dashed lines with triangle markers). The microphysical properties used for the calculation are the same as those in Figs. 3–4. The measurement uncertainty of each optical property is taken as one-third of the estimated maximum error for LILAS (Hu et al., 2019) and shown in the legend.
This simulation demonstrates that, on the one hand, it is necessary to consider the spectral dependency of mI in mineral dust retrievals, and on the other hand, the treatment presented in Sect. 2.2.2 is rational. Correspondingly, the retrieval of dust spectral imaginary part is converted to the retrieval of the monochromatic value at 355 nm. Hereinafter, unless explicitly stated, the imaginary part exclusively refers to mI,355, and we omit the subscript indicating the wavelength for simplicity.
3.3 Sensitivities of depolarization measurements
One of the objectives of this study is to figure out how the inclusion of spectral depolarization measurements influences the retrieval accuracy. To this end, we study their sensitivities to reff and CRI (note that the PLDR is independent of Vt) using the error-normalized Jacobian (ENJ) matrix (Rodgers, 2000; Xu and Wang, 2015), which is defined as
where J is the measurement Jacobian matrix for a specific state, Sε the measurement covariance, and Sa the a priori covariance of the state. The ENJ provides a direct comparison between measurement uncertainty and variability due to perturbations of the state vector. Accordingly, it is a measure of measurement sensitivity and tells whether the change in a state parameter is “detectable” by a measurement ( or submerged by noise (. In this study, the uncertainty in δ measurements is 5 % for all three lidar wavelengths (i.e. one-third of the estimated maximum error of δ for LILAS; cf. Hu et al., 2019). In practice, we set the a priori uncertainties of reff, mR, and mI to 20 %, 0.02, and 0.004, respectively.
Figure 6 displays the ENJ elements about spectral PLDR to reff, mR, and mI for the IH model (top row) and the spheroidal model (bottom row). The CRI used to generate is 1.52–0.0035 i (the mean value of D19), of which the real part is also used to generate , and the imaginary part is also used to generate . Furthermore, two effective radii, reff=0.5 µm (possible lower limit to allow both the IH and spheroidal models to reproduce most real lidar measurements) and reff=2 µm (near the median value in Table 1), are used to generate and to capture their behaviours under different sizes. It can be seen that both non-spherical models share some common features. The sensitivity of δ to reff decreases from positive to negative as reff increases, and δ1064 shows the highest sensitivity in both models when reff>0.2 µm. However, compared to the IH model, the PLDR sensitivity to reff decreases faster with particle size for spheroidal particles. The sensitivity of δ to mR decreases with the increase in reff, the increase in mR, and the decrease in λ. The sensitivity of δ to mI is overall negative, and its magnitude increases with the increase in reff and the decrease in λ, but it shows opposite variations with mI in different models. Also note that the mI here refers to mI,355, of which δ1064 is independent. The general findings from Fig. 6 are (1) δ1064 might be essential for size retrievals, while (2) δ355 could be helpful in imaginary refractive index retrievals. In addition, we point out that the accuracies of some state parameters, to which the incorporated δmeasurements do not have much sensitivity, can still be improved as a part of the integral retrieval. This will be further demonstrated in the next section.
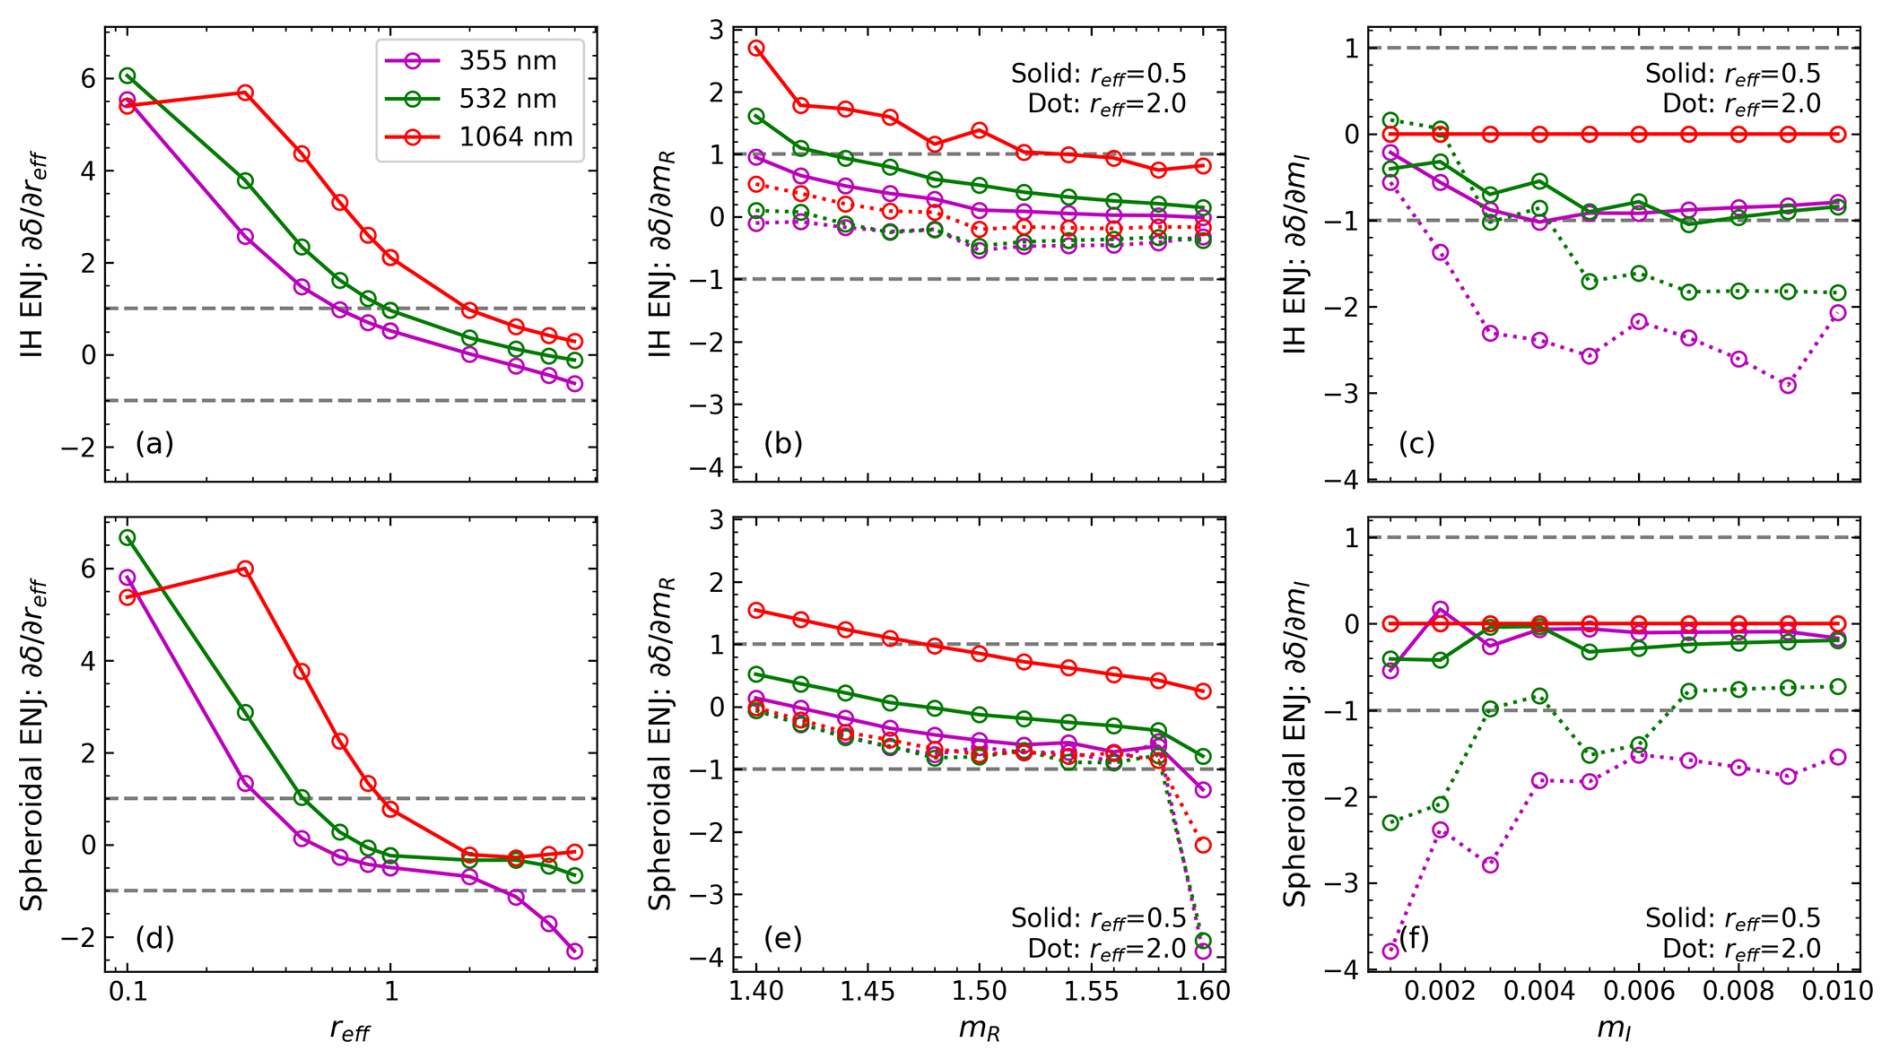
Figure 6Error-normalized Jacobian (ENJ; see Eq. 13) elements of (a, d) , (b, e) , and (c, f) for (a–c) the IH model and (d–f) the spheroidal model. The Sg used for VSD generation is 1.95, same as those used in Figs. 2–5; the CRI in (a) and (d) is 1.52–0.0035 i (the mean value of D19); the mI in (b) and (e) is 0.0035; the mR in (c) and (f) is 1.52.
If we assume the observations are of enough accuracy, the quality of aerosol microphysical property retrieval depends not only on the accuracy of the forward model (namely, how well the particle scattering model can reproduce the lidar measurements in this study) but also on the performance of inversion procedure. In this section, we assess the latter, which is related to the sensitivity of the measurement to the state parameter under different scattering models and can be investigated through simulation study. That is, synthetic measurements are generated from a set of pre-defined aerosol state parameters and then inverted back into these state parameters. The performance of the inversion procedure can be evaluated by comparing the “retrieved” with the “true” values (i.e. retrieval errors). Moreover, we use the fitting error as a metric to quantify how well the measurements are reproduced by a retrieval, which is defined as
where y and denote the exact measurement and the measurement recalculated from the retrieval; n is the number of inverted measurements in the retrieval. For example, if () data are inverted, then n is 8.
We noticed in Sect. 3 that there is a difference between the in situ-measured particle size and model-simulated particle size for fitting the ranges of real lidar measurements (not all but some of the measurements). Thus, we test the reff from 0.1 to 5 µm in order to cover the ranges of both in situ and model-simulated results. The geometric standard deviation is fixed to Sg=1.95, keeping the setting in Sect. 3. The Vt is normalized to 1 as many previous studies did (Müller et al., 2019; Veselovskii et al., 2002, 2004). For CRI, mR varies between 1.4–1.6 and mI between 0.001–0.009, based on D19; in addition, the mean value of D19 is also included. Table 3 lists the setup of the microphysical properties for the simulation.
Table 3Aerosol microphysical property (state parameter) setup for the retrieval simulation.
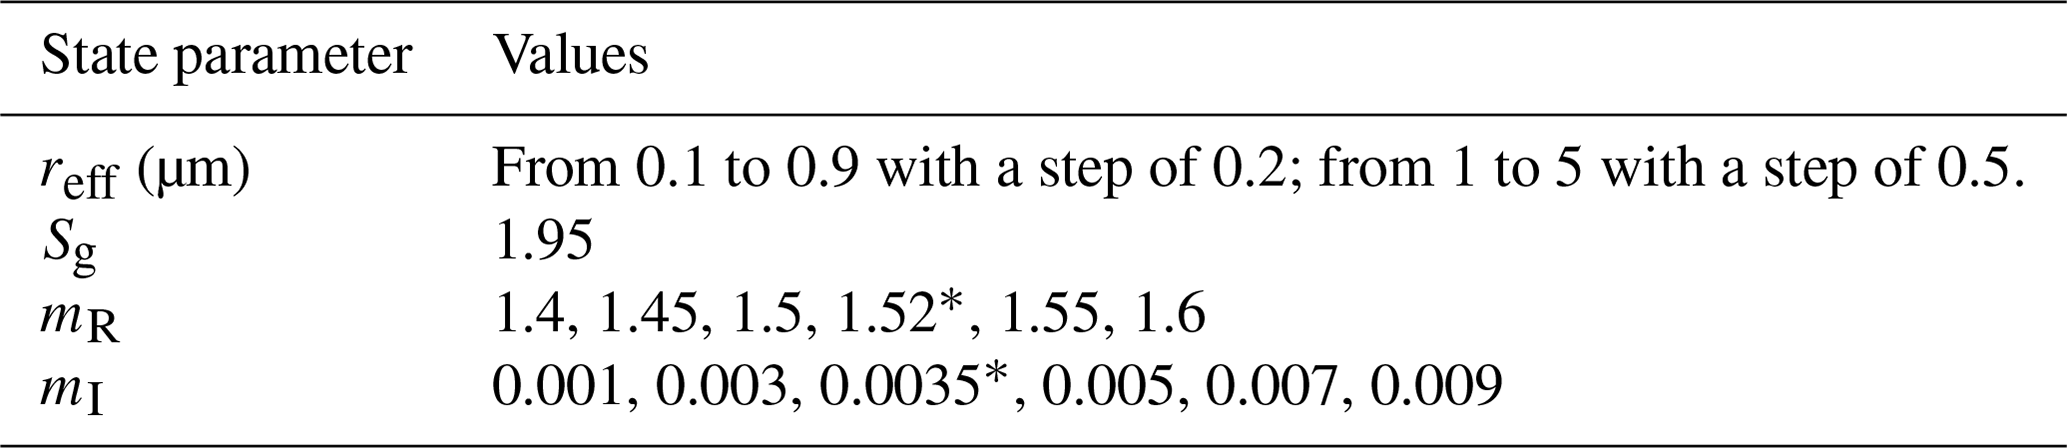
* Mean value of the D19 results.
We stress that such simulations cannot decide which non-spherical model derives a better result that is closer to the “true state” by using them to invert the same synthetic measurements. This is because, first, the generated measurements contain modelling errors and thus do not represent the “real” measurements; second, using a model to invert the synthetic measurements that are generated by another scattering model certainly will lead to a worse result due to the difference between the two models in simulating optical properties. The point here is, for different scattering models, to evaluate their retrieval sensitivities when the underlying microphysical properties change and to check whether the retrieval will be improved by incorporating different types of measurements (particularly the depolarization measurements) due to an improvement in information contents. From such simulations, we expect to better understand the part of the retrieval uncertainty related to model sensitivity, other than the part due to the model correctness.
4.1 Retrievals from error-free synthetic measurements
In this section, we invert synthetic measurements without measurement errors included (error-free). We focus on the comparison of the results derived from () measurements, where n varies from 0 to 3 so as to evaluate the influence of different depolarization measurements on the retrieval. Figure 7 shows the retrieval errors of Vt, reff, mR, and mI for the reff values in Table 3 and the CRI of 1.4–0.001 i. The optical data are simulated and inverted by the IH model. Overall, the Vt and reff (for reff>0.3 µm) are underestimated, whereas the mR and mI overestimated, and this trend exacerbates with the increase in particle size. This could result from the retrieval process of BOREAL. As described by Chang et al. (2022), the initial guess for the VSD is a uniform distribution with a Vt usually smaller than the truth. During the iteration, the state vector (composed of VSD bin and CRI) should gradually converge, making Vt increase to the exact value. However, as particles become bigger, (3β+2α) measurements lose the sensitivity to the state parameters rapidly because of the fast decreases in the magnitudes (see Fig. 3), which, in turn, increases the underdetermination of the system. As a result, Vt often stops at an underestimated value, and the consequent effect is compensated for by biases of other state parameters (e.g. reff, mR and mI). As discussed in other studies, this is one of the main challenges of retrieving coarse aerosol particles from the conventional (3β+2α) dataset (cf. Burton et al., 2016; Müller et al., 2019; Veselovskii et al., 2002). On the other hand, it reveals BOREAL fails to provide effective constraints on large particles when measurement sensitivity gets weak, which is a crucial point to improve in future studies. The incorporation of δ largely improves the retrieval accuracy, especially for the reff in 0.5–2 µm where the δ shows higher sensitivity to reff as indicated in Fig. 6. The results also highlight the significance of δ1064 to the retrieval accuracy: the inversions including δ1064 are in the cluster with the best quality. Indeed, compared to other wavelengths, PLDR at 1064 nm shows the highest sensitivity to reff and mR, as indicated by Fig. 6. However, as reff>2 µm, the accuracies of δ-included retrievals also decrease due to the decrease in δ sensitivity, but they are still better than those of the non-δ-included retrievals.
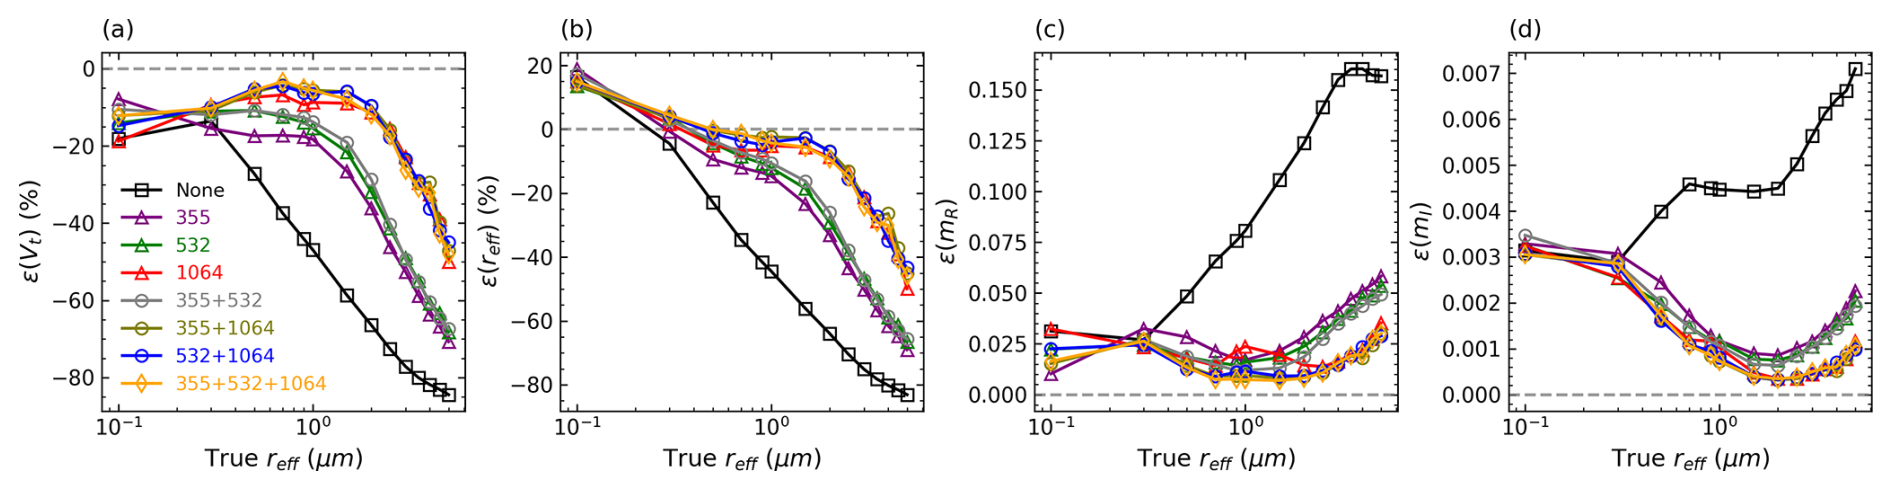
Figure 7Retrieval errors (ϵ) of (a) Vt, (b) reff, (c) mR, and (d) mI when inverting () synthetic measurements. The legends denote the number and wavelengths of the included δ, where “None” means no δ is included. The true reff varies from 0.1 to 5 µm, and true CRI is 1.4–0.001 i. The synthetic measurements are generated and inverted by the IH model.
Figure 8 is same as Fig. 7 except that the optical data are simulated and inverted by the spheroidal model. Some common features shared with Fig. 7 can be extracted. For instance, the envelops of retrieval errors show the same trend of variation with reff; the retrievals have the best accuracy when δ1064 is incorporated into the inversion set. Nevertheless, the most distinctive feature compared to the IH model is that for the spheroidal model, the incorporation of δ355 nearly makes no difference to the retrieval.
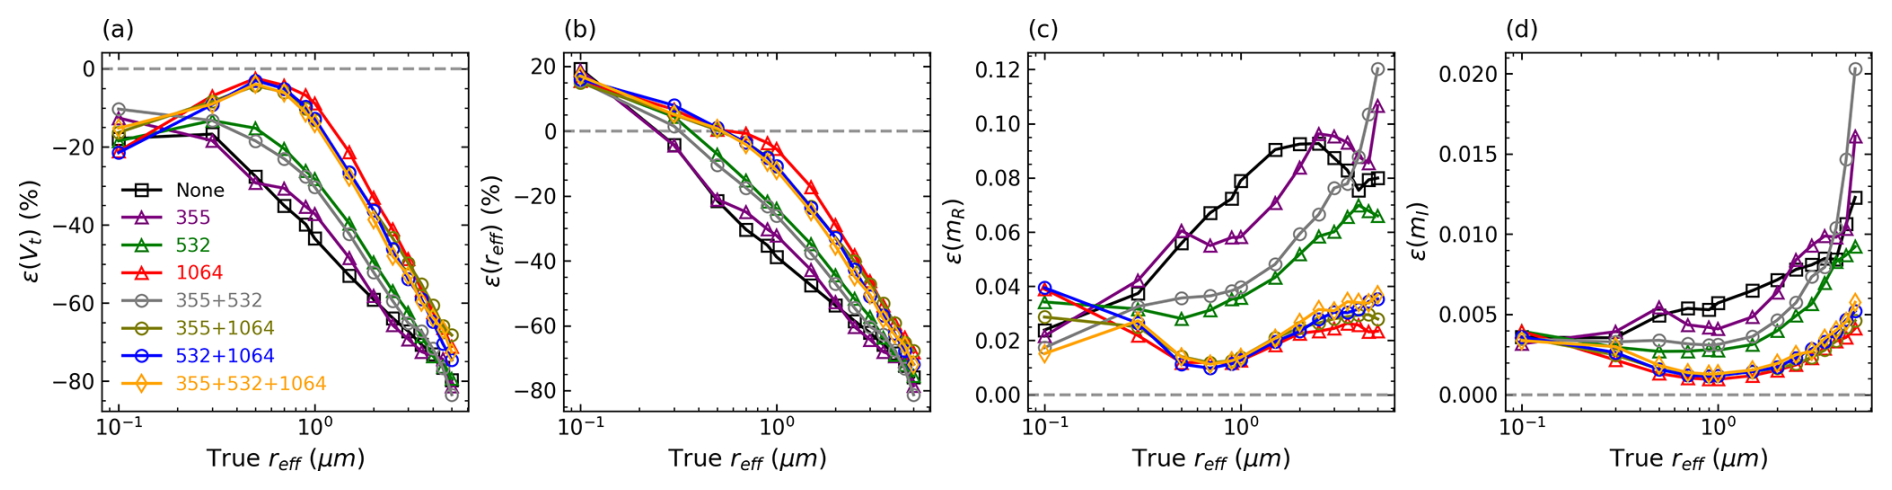
Figure 8Same as Fig. 7 but the synthetic measurements are generated and inverted by the spheroidal model.
We zoom in to check the retrieved VSDs at two effective radii: reff=0.5 and 2 µm. The reason for selecting these reff values is mentioned in Sect. 3.3. The results for the IH model and the spheroidal model are shown in Figs. 9–10, respectively. For both scattering models, the monomodal shape of the VSD is successfully retrieved. It can be seen that the VSD retrieval deteriorates as reff increases from 0.5 to 2 µm, and a conspicuous improvement in accuracy is observed for the IH model when δ1064 is incorporated. The underestimates of Vt are mainly caused by the underestimates of Sg and the maximum VSD, while the underestimates of reff are mainly due to the underestimates of Sg and rV.
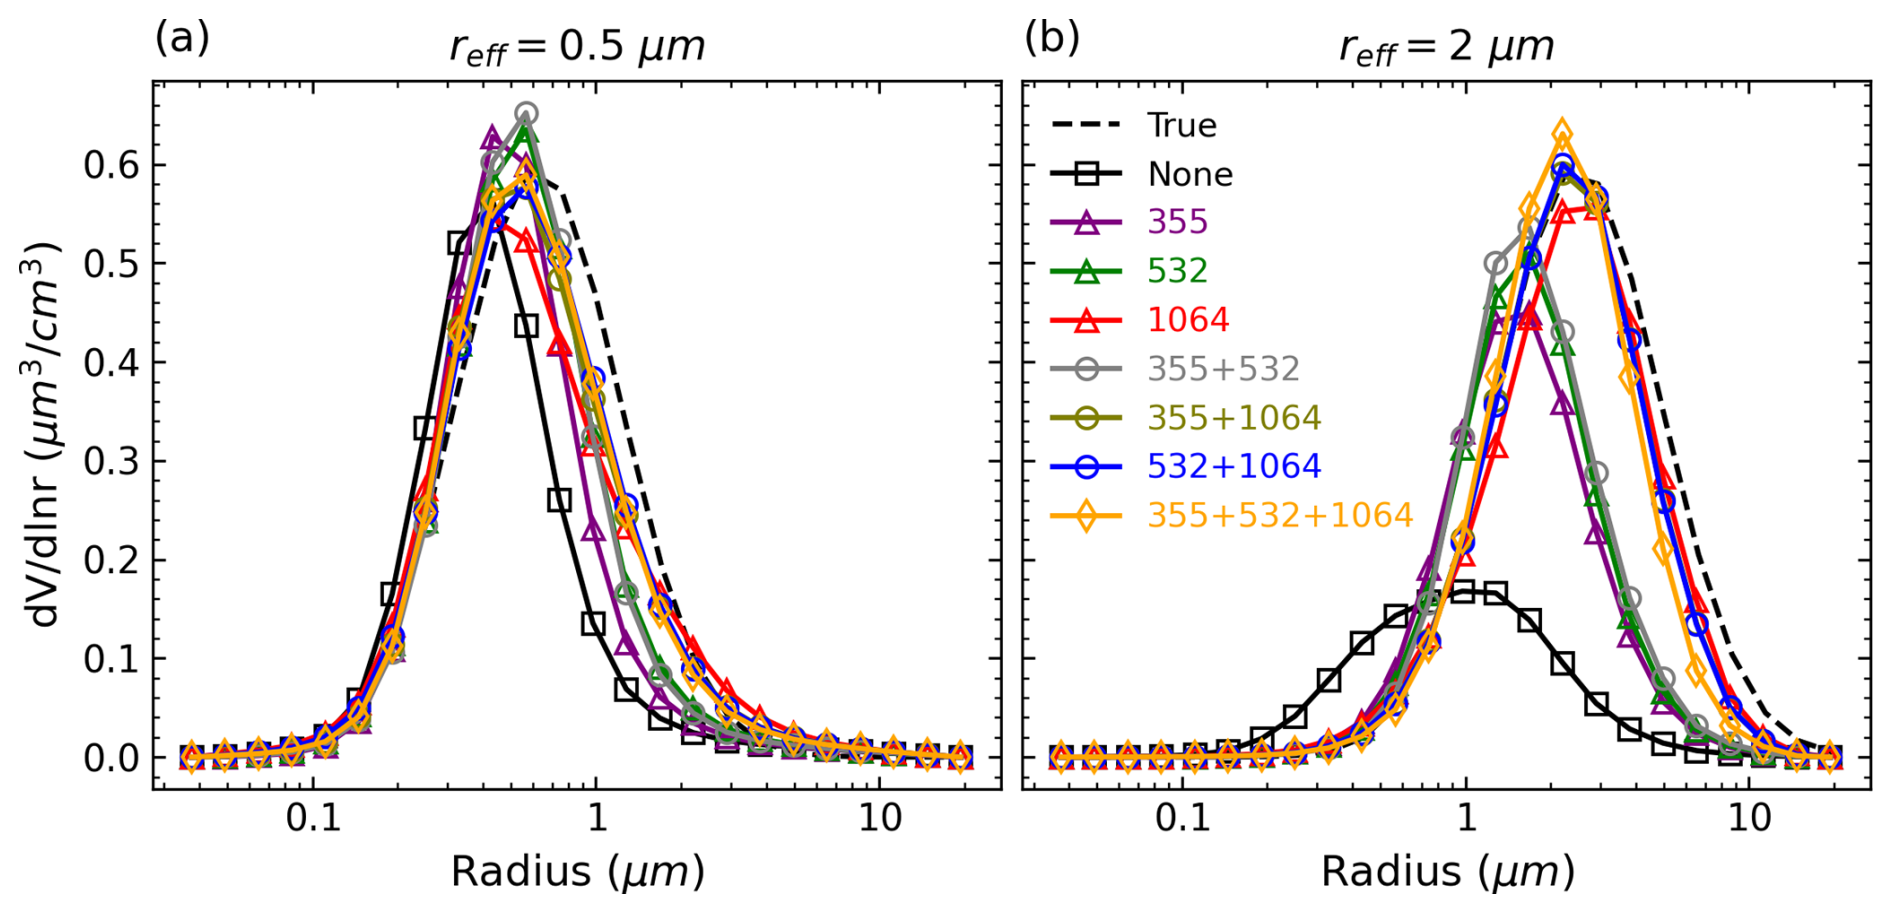
Figure 9VSD retrievals from () inversions at (a) reff=0.5 µm and (b) reff=2 µm. The CRI is 14−0.001 i. The synthetic measurements are generated and inverted by the IH model.
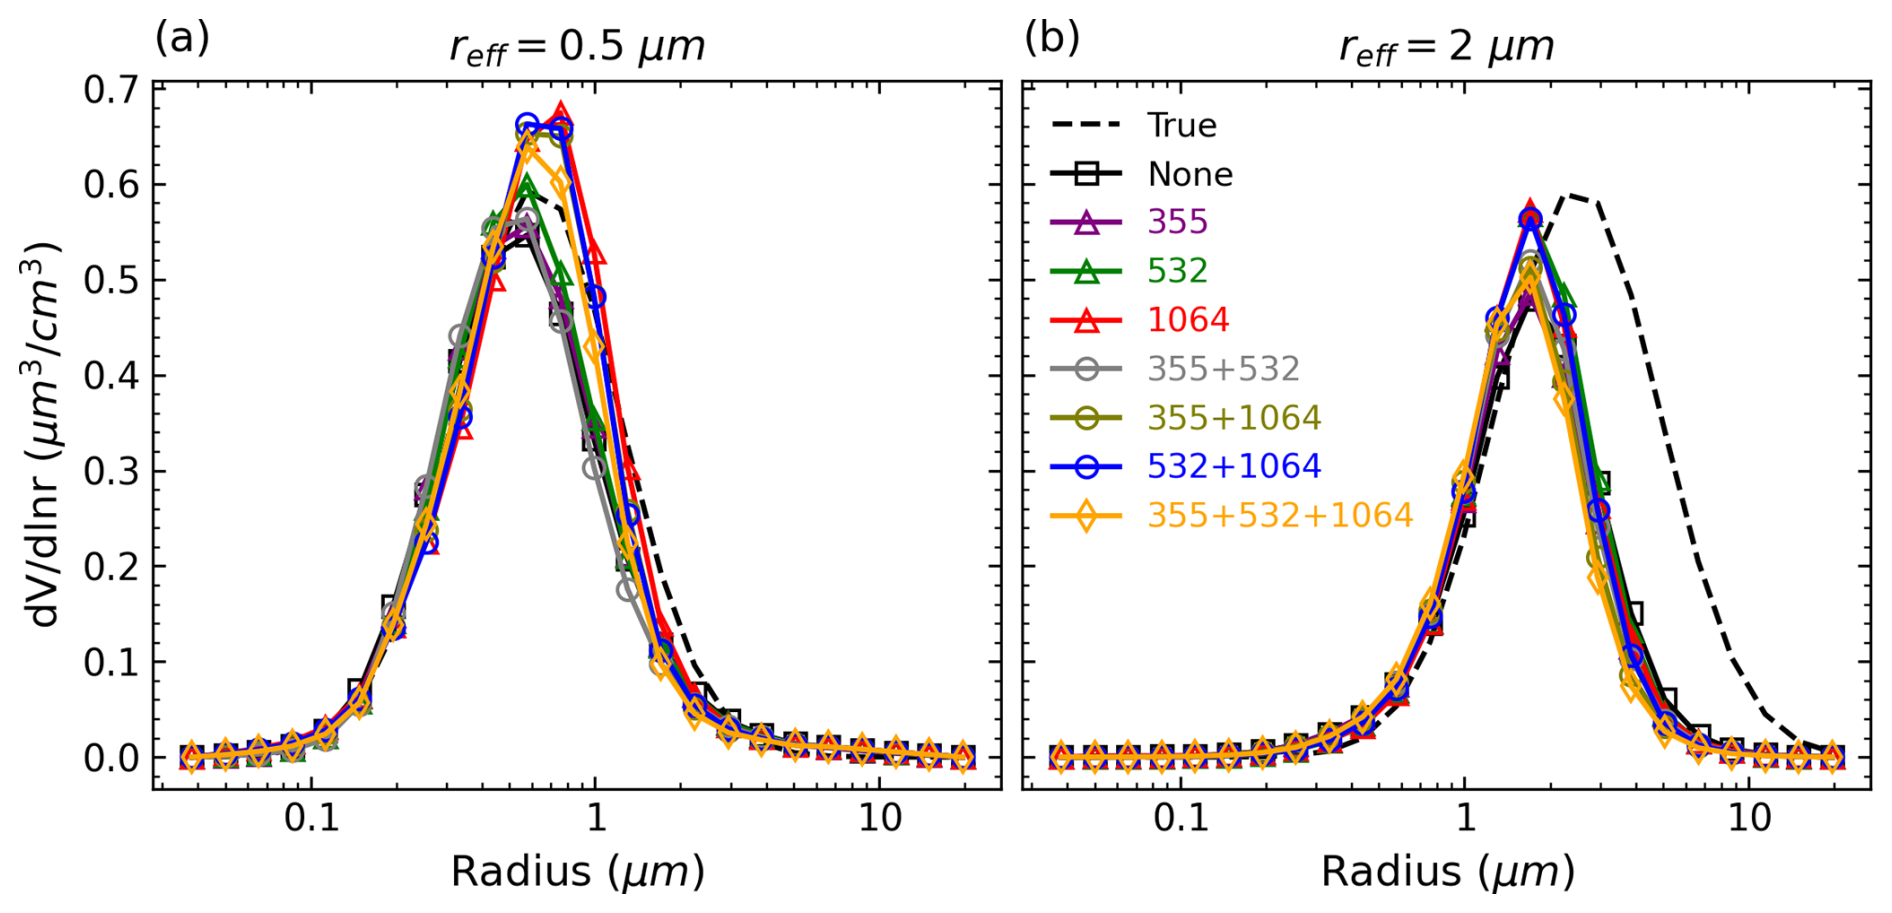
Figure 10Same as Fig. 9 but the synthetic measurements are generated and inverted by the spheroidal model.
Figure 11 displays variations of retrieval errors with respect to CRI when reff is 2 µm for the IH model (the synthetic measurements are generated and inverted by the IH model). Here we focus on some representative features. Firstly, as mR or mI increases, the accuracy of non-δ (i.e. 3β+2α) inversion is gradually improved. This is because as the true CRI becomes larger (e.g. 1.6–0.009 i), it is less likely to retrieve a highly overestimated CRI because of the a priori constraint (mRa=1.5, mIa=0.005). This also leads to improvement in Vt and reff retrievals due to the compensation effect. When different δ measurements are considered, the difference between the retrievals with and without δ1064 included becomes smaller as mR or mI increases. However, it is clear that the inversions with δ1064 included receive the best accuracy when both mR and mI are low (e.g. mR=1.4, mI=0.001), and compared to the (3β+2α) inversion, a conspicuous retrieval improvement is found for any δ-included inversions as long as mR>1.5 and mI=0.009 do not simultaneously happen. Similarly, Fig. 12 shows the results for the spheroidal model. The results show a larger dispersion and variability as CRI changes. Compared to the IH model, the contribution of δ1064 to retrieval accuracy is less significant, especially in terms of the mI retrieval. However, it can still be identified when the true CRI is 1.4–0.001 i. Another noticeable feature for the spheroidal model is that as mR or mI increases, accuracies of the inversions only including δ355 are significantly improved and even are better than the inversions only including δ1064 when mR>1.5. This might explain the somewhat contradictory finding by Tesche et al. (2019) that δ355 brings more retrieval improvement than δ1064 because they utilized the spheroidal model, and all the retrievals in their study show mR greater than 1.5. A further discussion is presented in Sect. 6.2.
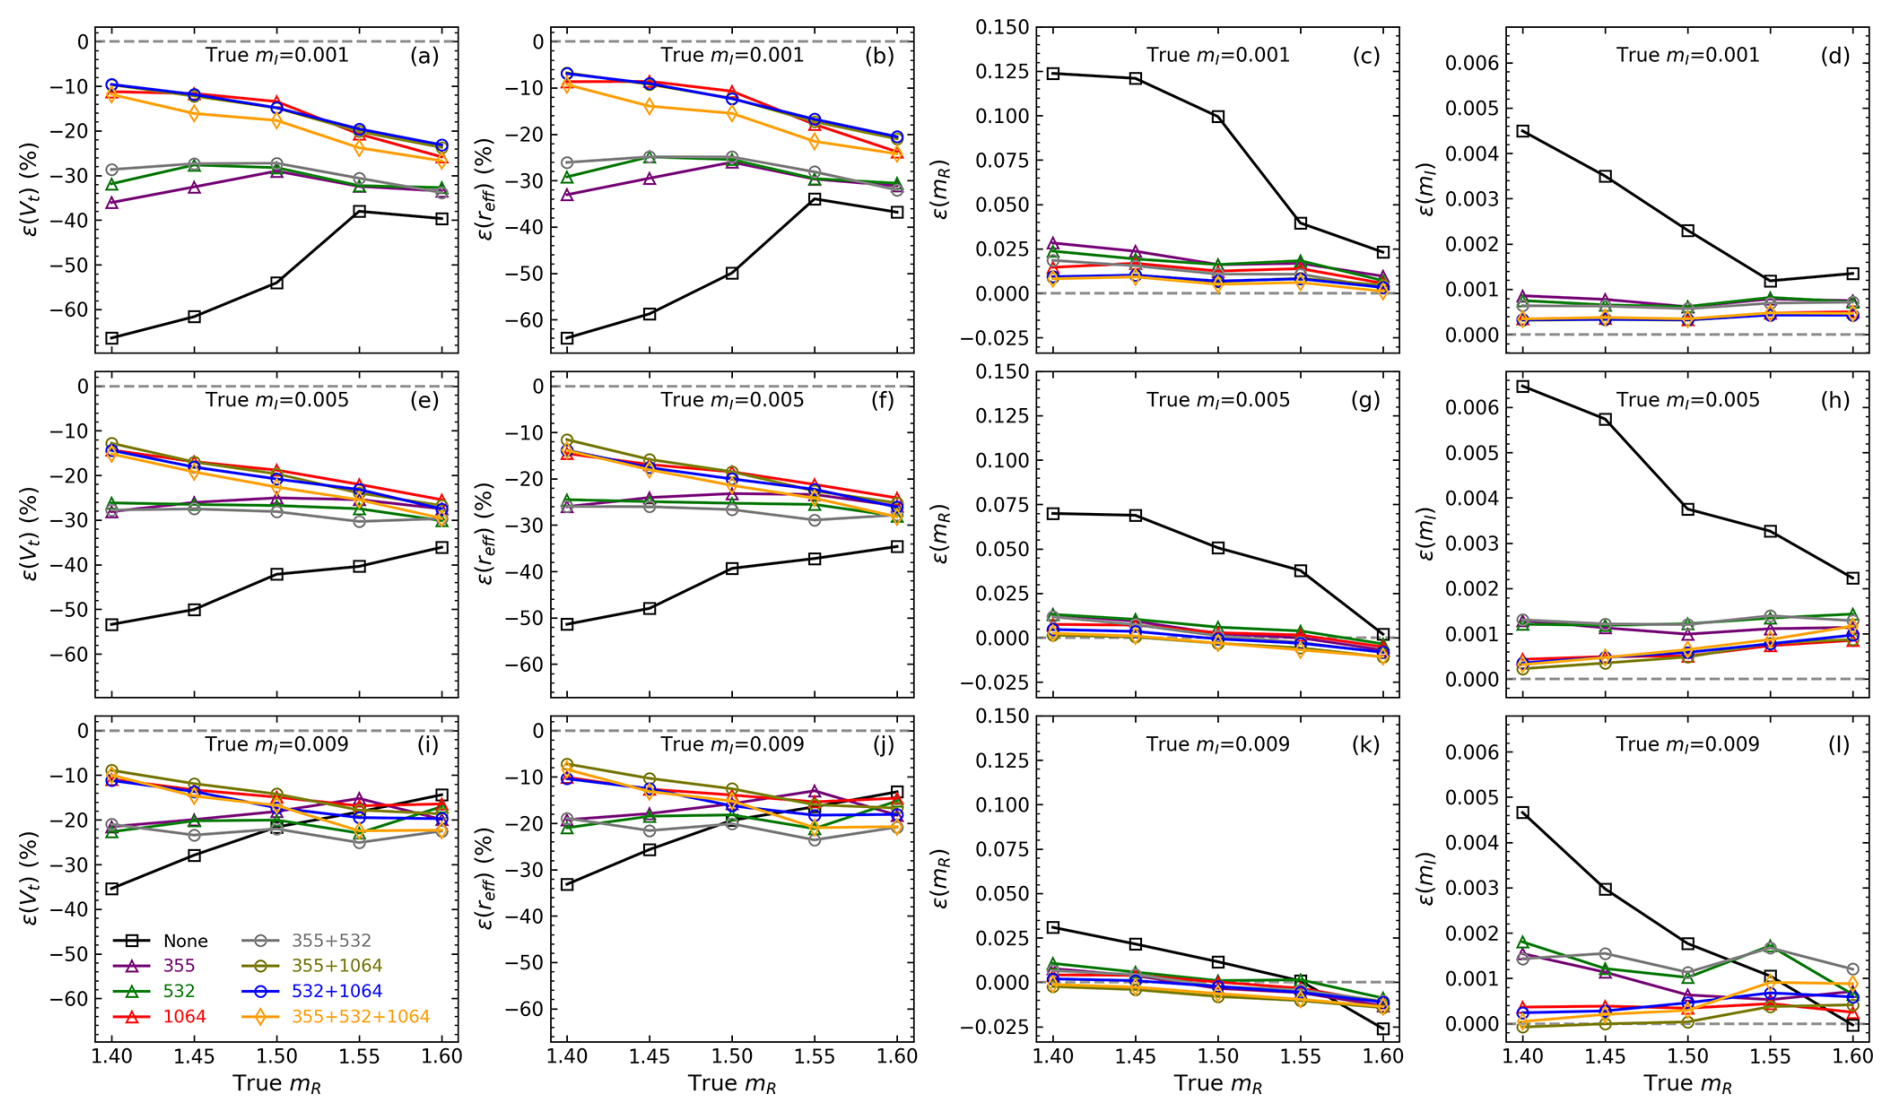
Figure 11Variations of retrieval errors against the true mR (x axis) and mI (rows) when the true reff is 2 µm. The () synthetic measurements are generated and inverted by the IH model.
For both IH and spheroidal models, a retrieval is often of higher accuracy by only including δ1064 rather than , which is contrary to the intuition that the more incorporated measurements, the better the retrieval accuracy. The explanation here could be that due to the limited sensitivity of δ355 or δ532 to the particles with reff=2 µm, the incorporation of δ355 or δ532 in fact contributes more to the ill-posedness than the information contents (Twomey, 1977). Furthermore, we notice a sudden rise of retrieval error happens to the spheroidal model for two cases: (1) (3β+2α) inversion when the true CRI is 1.6–0.005 i and (2) () inversion when the true CRI is 1.6–0.009 i. We found that their low retrieval qualities are accompanied by fitting errors (Eq. 14) greater than 5 %, which are large compared to most of the cases where the fitting errors do not exceed 2 %. The reason is still unknown, but it implies potential instability of the spheroidal model in the inversion of lidar measurements.
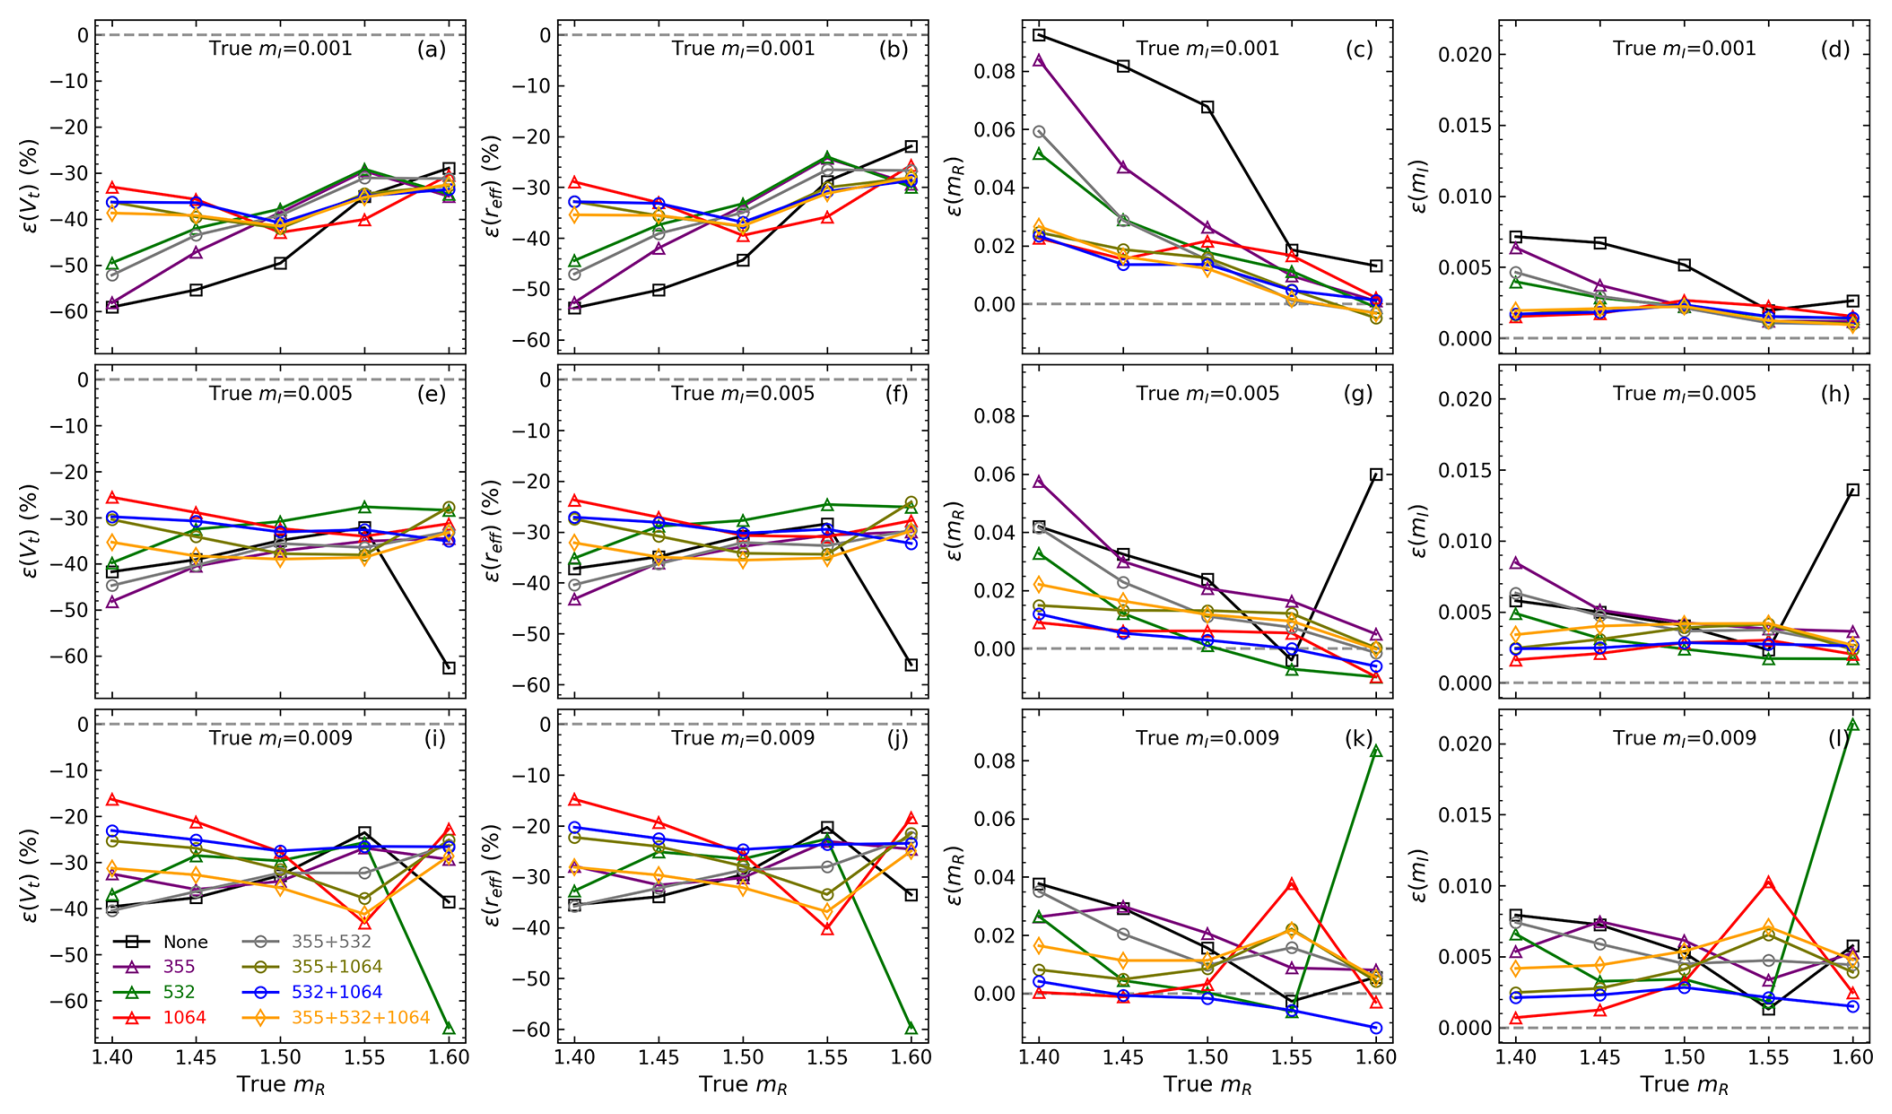
Figure 12Same as Fig. 11 but the synthetic measurements are generated and inverted by the spheroidal model.
As the reff gets lower (see Figs. S1–S2 in the Supplement for the case of true reff=0.5 µm), the variations of the retrievals against CRI generally keep the same trend for both IH and spheroidal models. However, it is noteworthy that due to the increase in sensitivity, there is a significant improvement in retrieval accuracy in the non-δ inversion. In addition, for the IH model, the accuracies of mI retrieved from δ-included inversions visibly decrease probably because of the reduction of δ sensitivity to mI as seen in Fig. 6c.
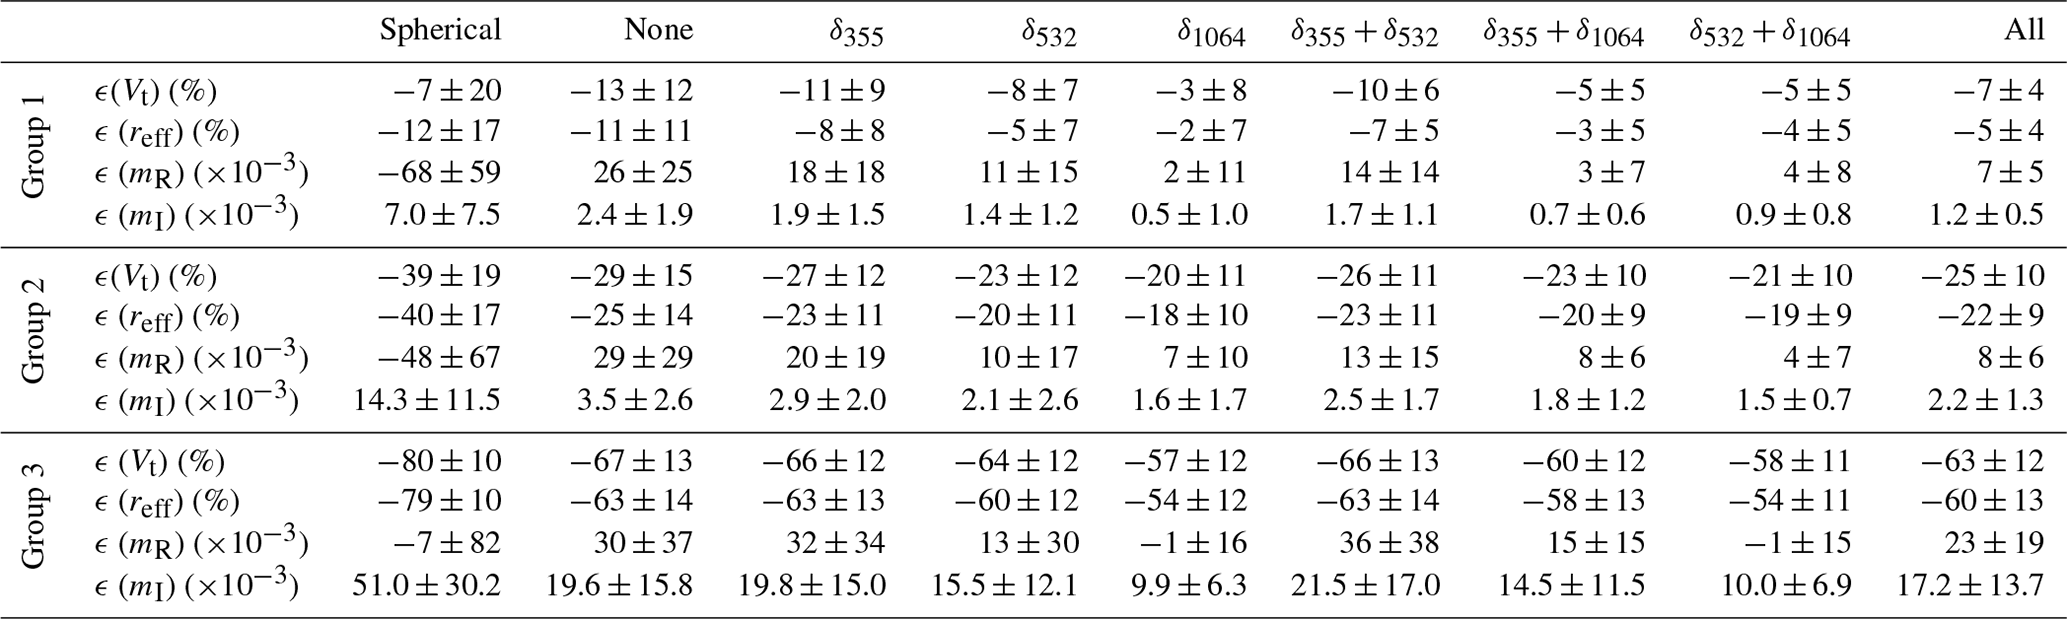
To have an overall point of view on these retrieval results, we grouped them by the reff range as Group 1 where 0.5 µm ≤ reff < 1 µm, allowing the scattering models to reproduce real lidar measurements for the submicron metre range (Figs. 3–4 and Table 2); Group 2 where 1 µm ≤ reff ≤ 2 µm, consistent with the reff ranges derived from most in situ results in Table 1 and lidar measurements are still sensitive to the state parameters to some extent; and Group 3 where 2 µm < µm, including the rest of the dataset. Tables 4–5 summarize the means ± standard deviations of the grouped retrieval errors when the () measurements are inverted with the IH (Table 4) and spheroidal (Table 5) model, respectively. We also list the results derived by inverting (3β+2α) with the spherical model in order to quantify the retrieval bias as ignoring particle non-sphericity. It can be clearly seen that the increase in particle size leads to an overall reduction of retrieval accuracy. Consistent with previous single-case comparisons, non-δ inversions result in underestimation of Vt and reff and overestimation of mR and mI due to the underdetermination and compensation effect. The incorporation of δ1064 largely improves the retrieval accuracy for all state parameters, especially for Group 2 and Group 3. Statistical results suggest that combining δ1064 with δ355 or δ532 could additionally improve the CRI retrieval for Group 1 and Group 2, while such an improvement cannot be achieved by singly using δ355 or δ532. Compared to the spheroidal model, the δ measurements represented by the IH model bring greater retrieval improvement, especially for CRI when reff belongs to Group 2. Finally, ignoring particle non-sphericity (i.e. inverting the synthetic measurements by the spherical model) severely underestimates mR and overestimates mI, which also leads to the largest retrieval bias for Vt and reff (both are underestimated). This is because the spherical assumption offsets β to higher values which have to be reduced by increasing mI or decreasing mR (see Figs. 2–3). Such a behaviour has been widely observed in previous studies (Müller et al., 2013; Veselovskii et al., 2010).
Table 4Means ± standard deviations of the retrieval errors for all the cases in Table 3 when different combinations of δ measurements are added to the (3β+2α) inversion (“none” means non-δ inversion, and “all” means () inversion). The results are separated into Group 1 (0.5 µm ≤ reff,true < 1 µm), Group 2 (1 µm ≤ reff,true ≤ 2 µm), and Group 3 (2 µm < reff,true ≤ 5 µm). The synthetic measurements are generated and inverted by the IH model except for the column “spherical”, where the (3β+2α) data are generated by the IH model but inverted by the spherical model.
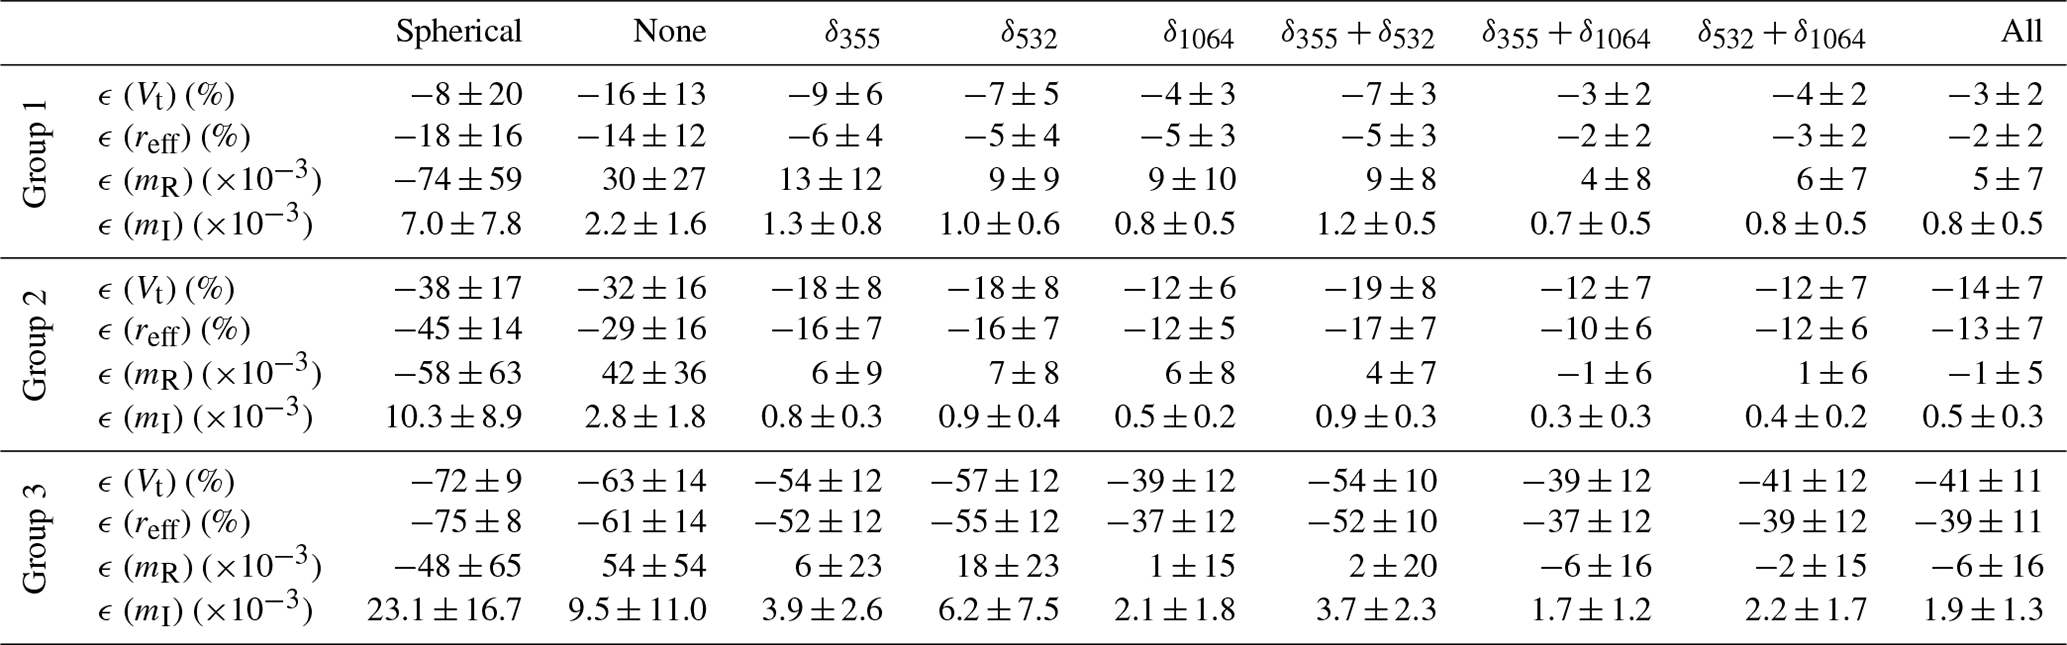
Table 5Same as Table 4 except that the synthetic measurements are generated and inverted by the spheroidal model except for the column “spherical”, where the (3β+2α) data are generated by the spheroidal model but inverted by the spherical model.
4.2 Influence of measurement noise
In this section, we investigate how well these scattering models work when inverting noise-contaminated measurements by adding simulated random noise to the synthetic measurements. We take the magnitudes of the maximum measurement errors of LILAS as references, which are 10 % for α355, α532, β355, and β532; 15 % for δ355, δ532, and δ1064; and 20 % for β1064 (Hu et al., 2019). We assume the independent Gaussian error for each measurement; thus, the corresponding standard deviations are 3.3 % for α355, α532, β355, and β532; 5 % for δ355, δ532, and δ1064; and 6.7 % for β1064. According to the results presented in Sect. 4.1, we dismiss the cases where reff>2 µm and the inversions using the spherical model as they do not have satisfying retrieval accuracy even for error-free measurements. Instead, we present the noise test results of two single but representative cases: (1) reff=0.5 µm, mR=1.52, and mI=0.0035 and (2) reff=2 µm, mR=1.52, and mI=0.0035. The span of reff covers the range allowing the scattering models to reproduce most real measurements in Table 2 (Figs. 3–4) and the range of most in situ measurements in Table 1. The selected mR and mI correspond to mean values of D19.
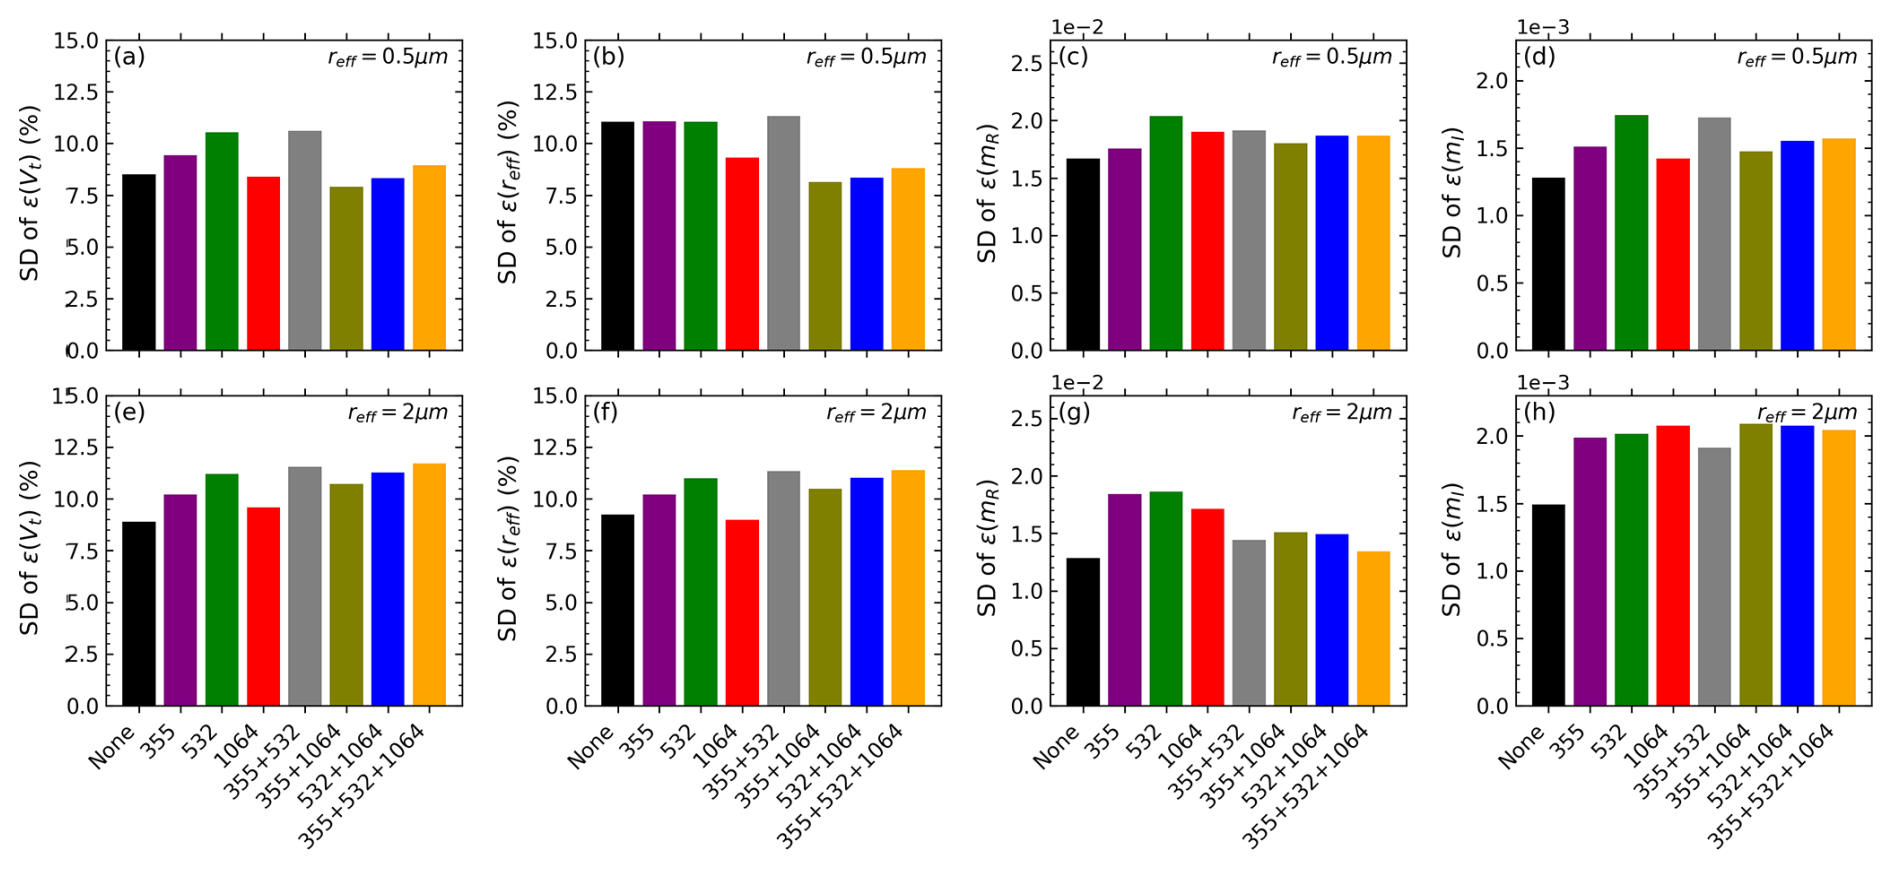
For each case and every possible δcombination as the input, Figs. 13 (for the IH model) and 14 (for the spheroidal model) show the standard deviations (SDs) of the retrieval errors derived from 1000 inversions of the noise-contaminated measurements. The SDs of ε(Vt), ε(reff), and ε(mR) for both models are comparable, but the spheroidal model shows a generally larger SD of ε(mI), particularly for reff=2 µm. Recall that we have demonstrated in Sect. 4.1 that compared to the IH model, the spheroidal model does not receive a significant retrieval improvement after the incorporation of δ measurements, especially for the mI retrieval. In this regard, we believe that the IH model works better in the retrieval process. In addition, for the IH model and reff=2 µm, measurement noise causes a larger retrieval dispersion if only δ1064 is included, while a combination of δ at other wavelengths can effectively reduce the retrieval dispersion. This could be related to the alteration of system ill-posedness due to changes in the measurement set and state parameters (Rodgers, 2000; Twomey, 1977). However, a clear suggestion is that it is important to combine measurements of both high and low sensitivities to suppress the influence of measurement noise. In this regard, we suggest using the IH model to invert at least () lidar measurements with one of the δ at 1064 nm in real applications.
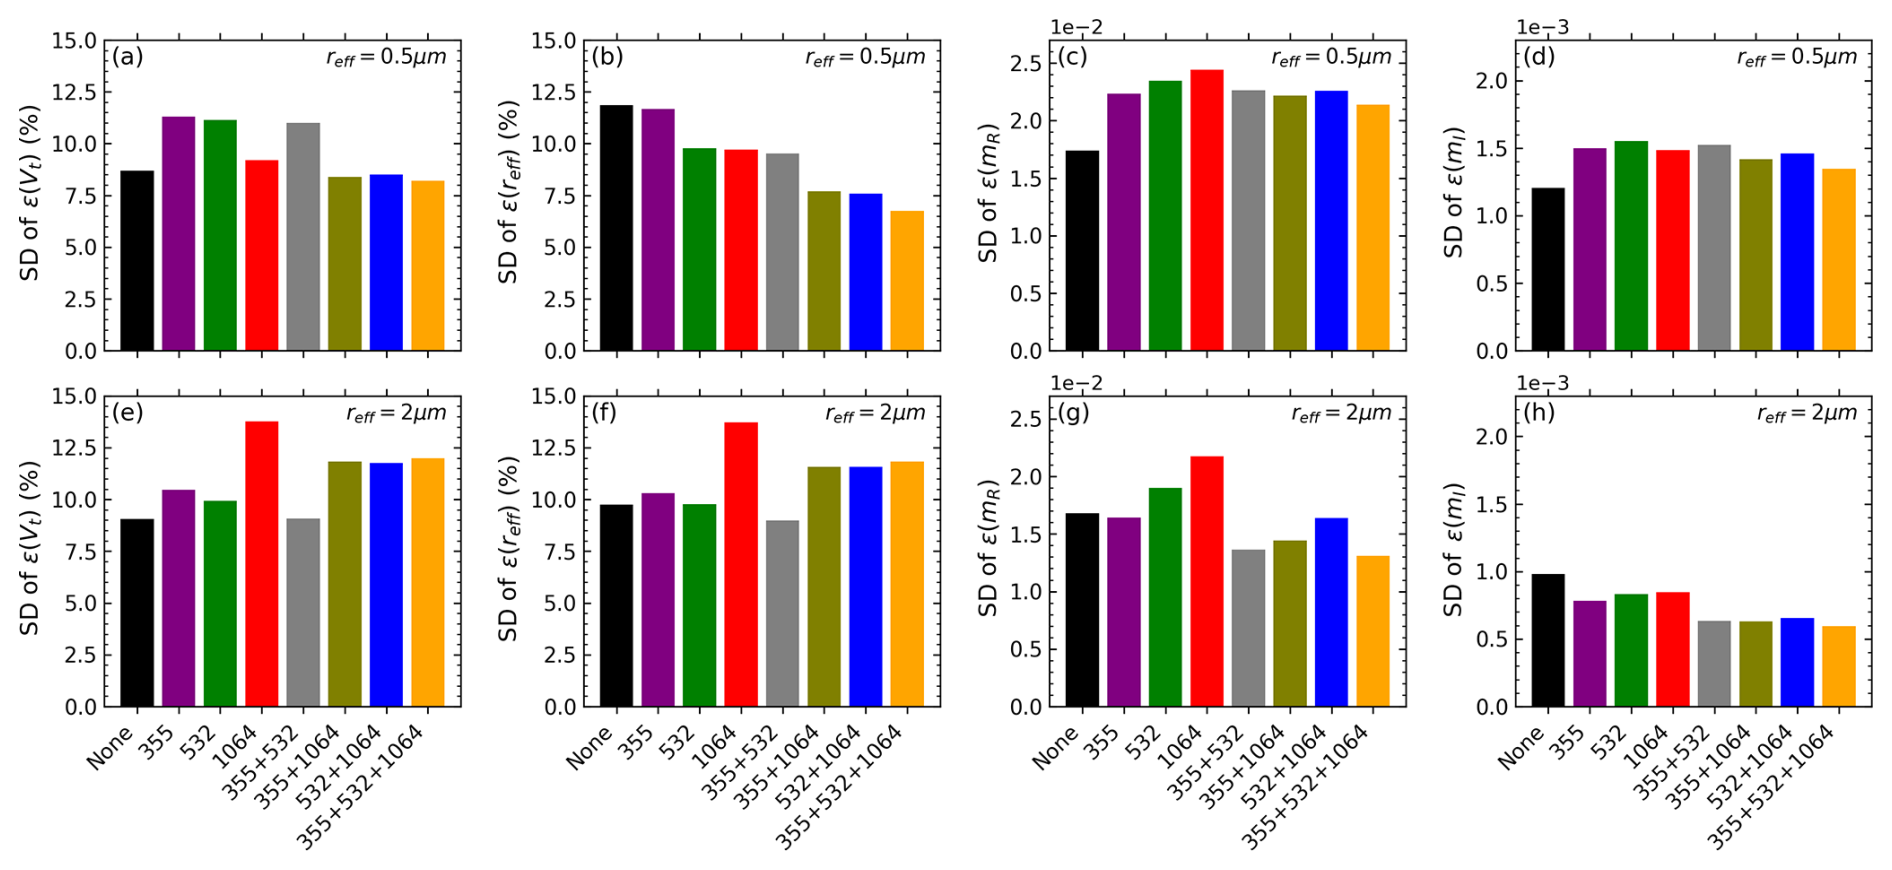
Figure 13Standard deviations (SDs) of the retrieval errors for two single case retrievals: (a–d) reff=0.5 µm, mR=1.52, and mI=0.0035; (e–h) reff=2 µm, mR=1.52, and mI=0.0035, derived by inverting error-free synthetic measurements perturbed with random noise for 1000 times. The measurement noise is assumed to be Gaussian and independent of each other, of which the standard deviation is 3.3 % for α355, α532, β355, and β532; 5 % for δ355, δ532, and δ1064; and 6.7 % for β1064. The related scattering model is the IH model.
In this section, different configurations (i.e. scattering model and inverted dataset) are applied to the retrievals of two representative dust cases observed by LILAS. In the first case, dust was freshly emitted with ageing no more than 2 d; the second case concerns a transported dust layer with ageing of around 1 week.
5.1 Case 1: fresh dust on 14 April 2019, Kashi
The first case is from the Dust Aerosol Observation (DAO) campaign, where intensive field measurements were taken at Kashi (39.50° N, 75.93° E) located on the western edge of the Taklamakan Desert, one of the main sources of dust in Asia (Hu et al., 2020). On 15 April 2019, LILAS detected continuous aerosol layers extending from the boundary layer (BL) to around 3.5 km (Fig. 15), resulting in an obvious increase in daily aerosol optical depth (AOD) and decrease in EAE. Back-trajectory analysis and satellite observations indicate the aerosol layers are related to a dust activity in the Taklamakan Desert during 13–15 April (Hu et al., 2020). Figure 16 displays the time-averaged optical profiles between 18:00 and 20:00 UTC on 15 April. Below 2.3 km, all the optical properties are stable, and a well-mixed structure can be identified: the PLDR is larger than 0.3 at all wavelengths and shows a typical dust-type spectral variation (Haarig et al., 2022; Hu et al., 2020), indicating the presence of homogeneous pure dust. Between 2.3 and 2.8 km, the decrease in PLDR and increase in EAE suggest an increase in fine-mode particles, and the variation of LR implies an alteration of aerosol components, although the extinction and backscattering coefficients are still stable. Above 2.8 km, the extinction and backscattering decline rapidly due to the decrease in aerosol loading.
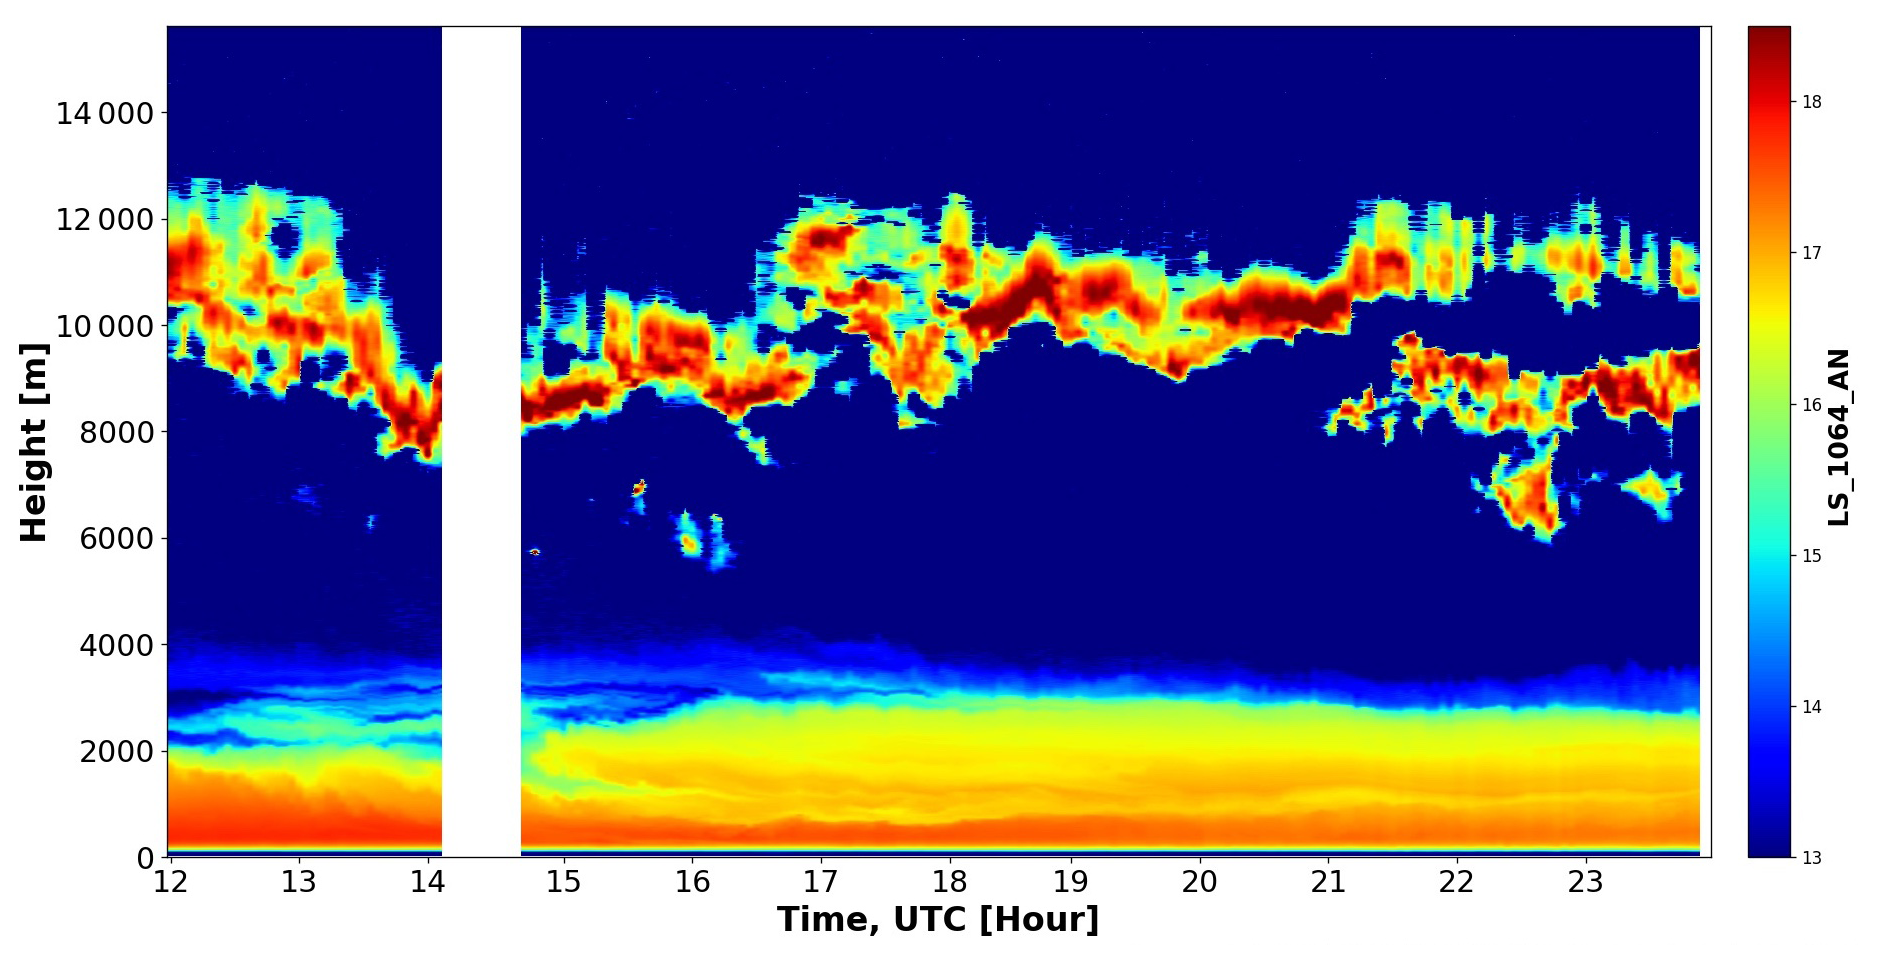
Figure 15LILAS range-corrected backscattered signals at 1064 nm between 12:00 UTC on 15 April 2019 and 00:00 UTC on 16 April 2019, at Kashi, China.
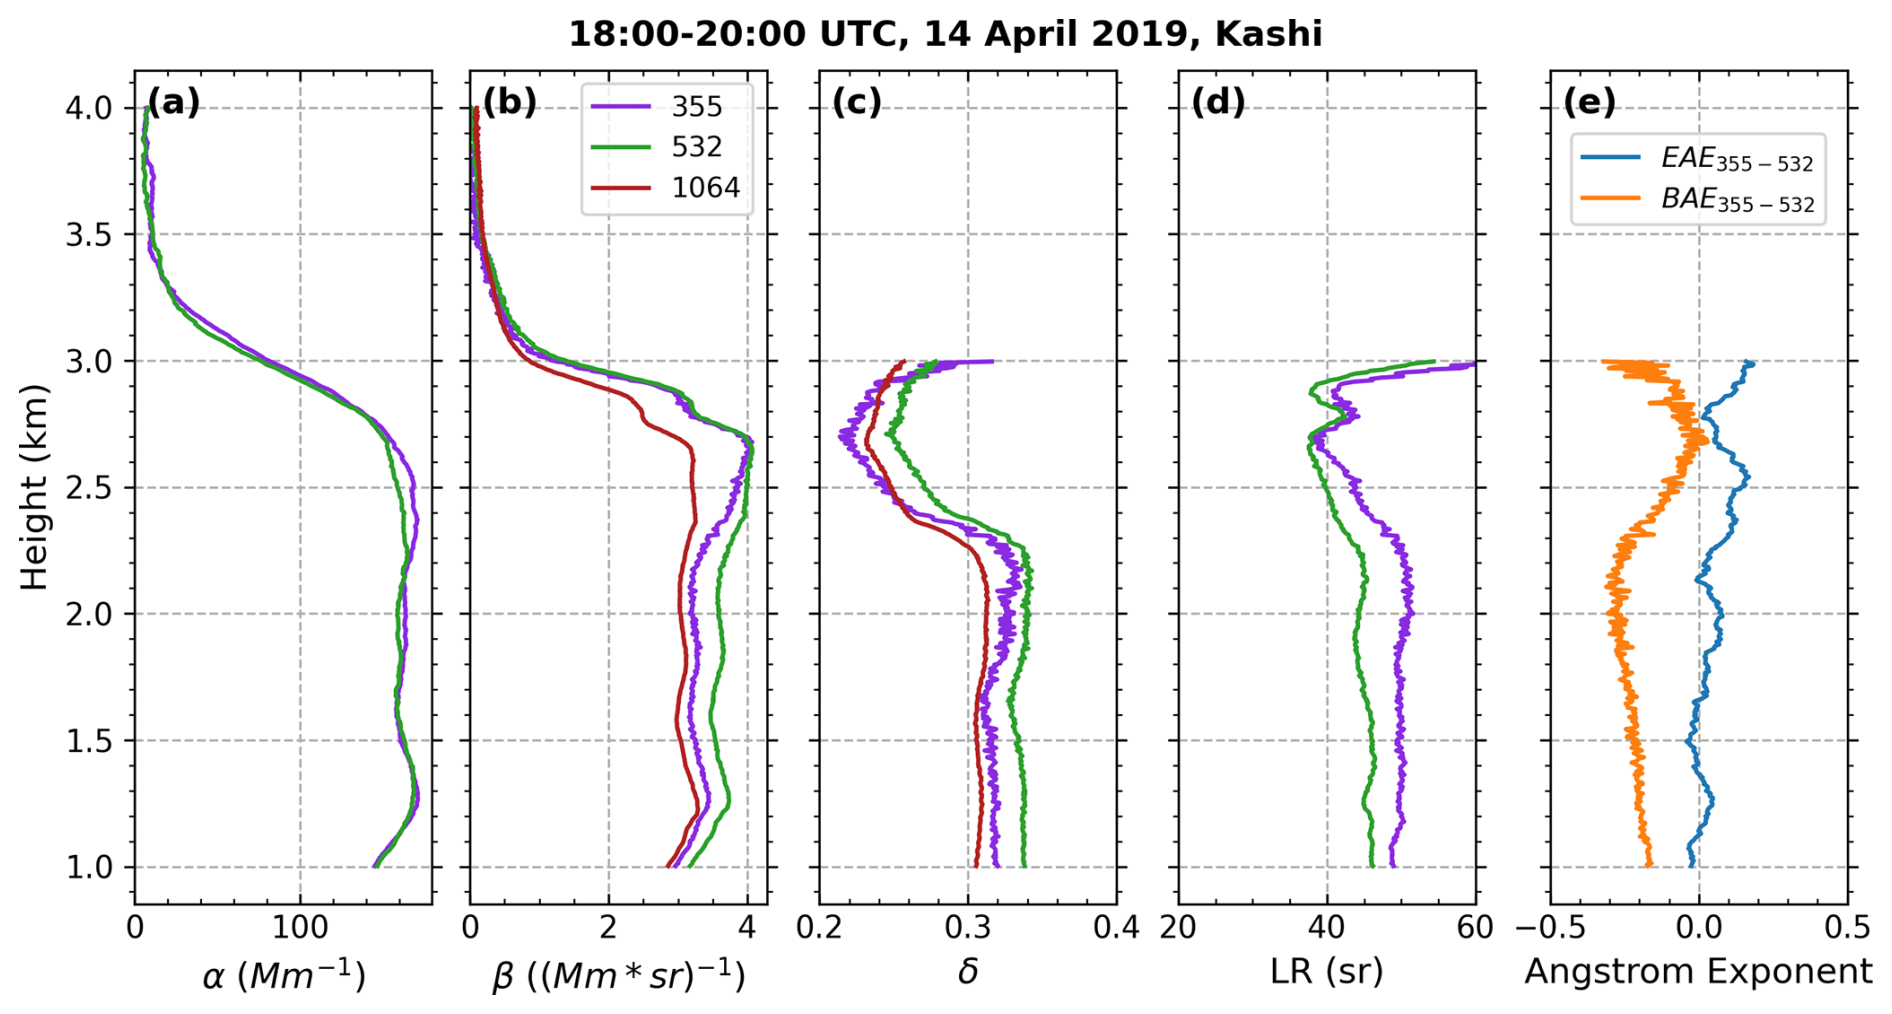
Figure 16Optical profiles at 355, 532, and 1064 nm, averaged for the period 18:00–20:00 UTC on 15 April 2019, at Kashi. This figure is adapted from Fig. 10 in Hu et al. (2020). The variations of δ, LR, and AE above 2.3 km indicate the alteration of aerosol components, and the rapid declinations of α and β above 2.8 km mark the upper boundary of the aerosol layer.
We averaged the optical properties every 200 m for the layer below 3 km and inverted the averaged optical properties with the IH, spheroidal, and spherical models, respectively. The (3β+2α) and () data are inverted, and the corresponding retrieved microphysical properties (Vt, reff, mR, mI) are shown in Fig. 17. The decrease followed by an increase in reff above 2.3 km, which is only reflected by () inversion, agrees with the variations of the δand EAE shown in Fig. 16. The stand-alone lidar observations cannot verify the exact involved aerosol species in that layer. Hu et al. (2020) pointed out the high possibility of the presence of anthropogenic aerosols that were lifted by convection and remained at higher altitudes as bigger dust particles settled down. Given that BOREAL is only developed for pure dust retrieval (Sect. 2.2.3) at the current stage, retrieval accuracy for this layer is therefore not guaranteed. For the retrievals below 2.2 km, when inverting () measurements, the two non-spherical models derive apparently distinct results so as to fit the input measurements: the spheroidal model derives smaller mR and mI, as well as larger Vt and reff. The influence of ruling out 3δ on the retrievals agrees with what we see in Sect. 4: on the one hand, the spheroidal-derived mR and mI become larger, accompanied by decreasing Vt and reff; on the other hand, the IH-derived result barely changes since the mR is retrieved close to 1.6 from the () inversion. Compared to the inversion of (3β+2α) using the non-spherical models, using the spherical model derives similar Vt and reff but evidently lower mR and higher mI. We also observed such a behaviour when mR is set to 1.6 in the simulation (not shown here). In a word, the variations of the inversions caused by different scattering models and input measurements are in line with our simulation results, indicating that the results from () inversion are least affected by retrieval uncertainty.
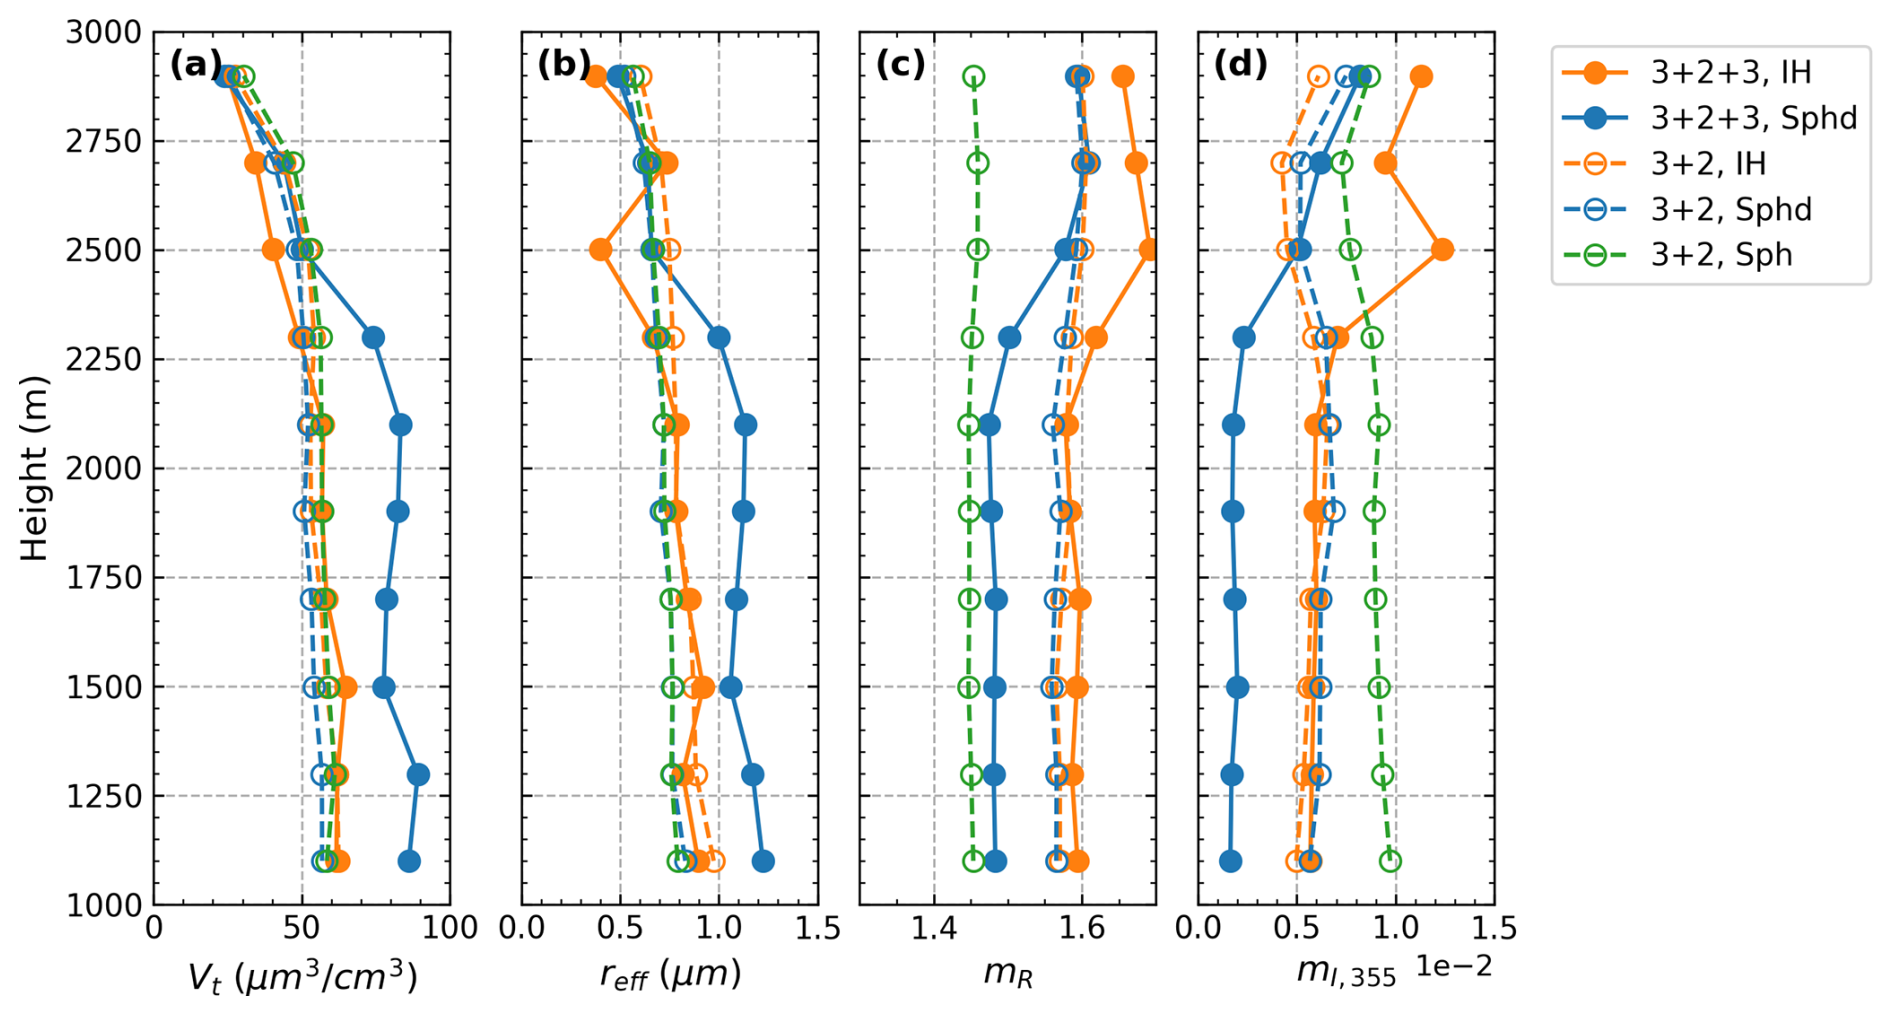
Figure 17Profiles of (a) Vt, (b) reff, (c) mR, and (d) mI,355 retrieved from the averaged optical data in Fig. 17 with different retrieval configurations: inversion of () with the IH model (, IH), inversion of () with the spheroid model (, Sphd), inversion of (3β+2α) with the IH model (3+2, IH), inversion of (3β+2α) with the spheroid model (3+2, Sphd), and inversion of (3β+2α) with the sphere (Sph) model (3+2, Sph).
Figure 18 displays for different configurations the retrieved VSDs, SSAs, and the comparisons between the real and reproduced measurements in the layer 1.5–2 km. The selected layer is far from the polluted layer and thus is attributed to purer dust. All retrieval configurations derive monomodal VSD located in the coarse-mode range, except for the spherical model, which obtains a second mode at 0.4–0.5 µm. When inverting the () measurements, the IH-derived VSD has a similar volume median radius (rV ∼ 1.3–1.7 µm) to the spheroidal-derived VSD but a larger Sg, resulting in a smaller reff. Because of the implemented spectral relationship of dust mI, the retrieved SSAs present a typical spectral dependency of dust aerosols (e.g. Di Biagio et al., 2019), and the highest SSA corresponds to the lowest mI retrieved with the configuration (, spheroidal). The error bars attached to the real measurements represent the corresponding maximum measurement errors. For all retrieval configurations, the difference between real and reproduced measurements is within the corresponding error bar as long as this measurement is incorporated into the inversion dataset. The inversion of () enables both IH and spheroidal models to reproduce the spectral variation of the measured PLDR. However, when it comes to the (3β+2α) inversion, the spheroidal model underestimates δ for all wavelengths, while the IH model performs much better: only a little overestimate of δ355 is observed.
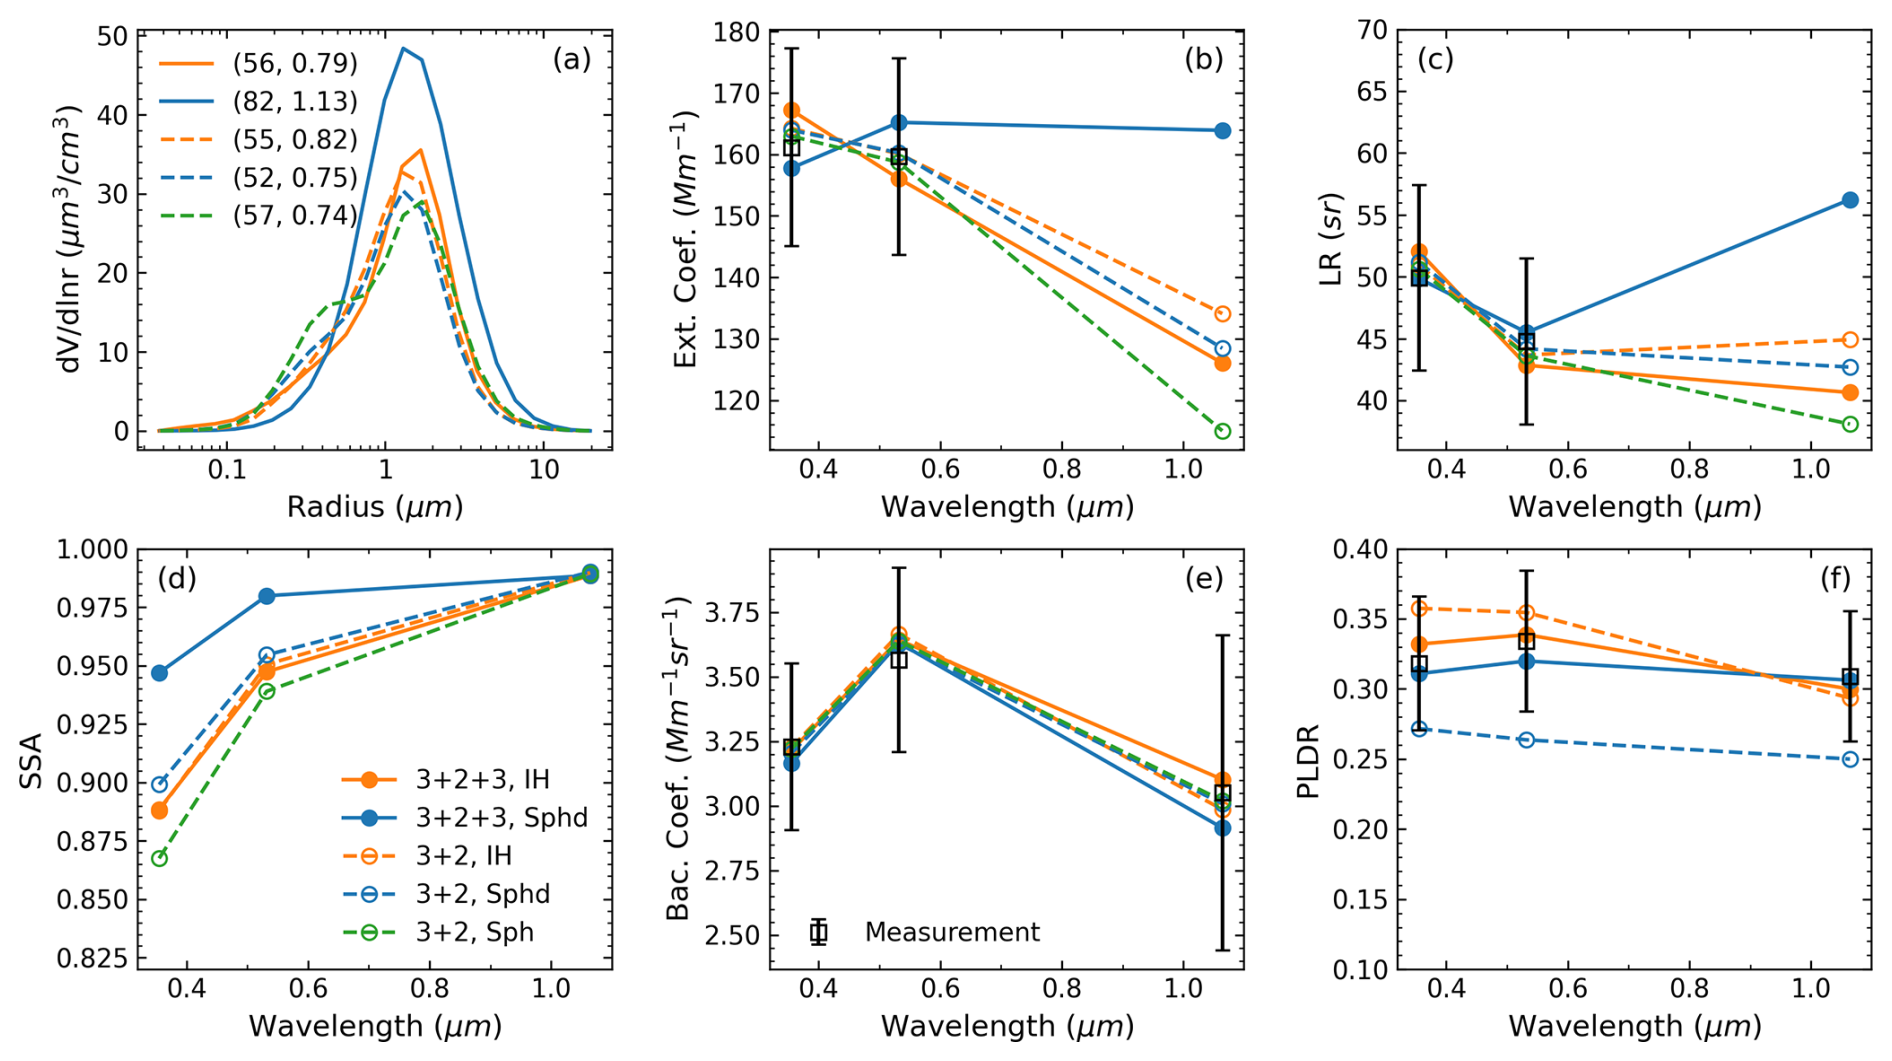
Figure 18Retrievals and reproduced measurements for the layer between 1.5 and 2 km in Case 1. The retrievals include (a) VSD and (d) SSA. The reproduced measurements include (b) extinction coefficient, (c) LR, (e) backscattering coefficient, and (f) PLDR. The legend in (a) refers to the (Vt, reff) (µm3 cm−3, µm) retrieved with the corresponding configuration.
5.2 Case 2: transported dust on 21 March 2022, Lille
An increase in aerosol activity above the BL was observed by LILAS operated at ATOLL/Lille since 14:00 UTC on 21 March 2022. The range-corrected signals and time-averaged optical profiles between 20:00 and 23:00 UTC are shown in Figs. 19 and 20. Different from Case 1, three stratified layers can be identified: Layer 1 below 2 km, Layer 2 centred at 4 km, and Layer 3 centred at 5.4 km. Dust could be abundant in the upper two layers (Layer 2 and Layer 3) due to their high PLDRs compared to the bottom layer (Layer 1). Figure 21 shows the HYSPLIT (Rolph et al., 2017) back trajectories of the three layers ending at 21:00 UTC on 21 March 2022 (2017). It can be seen that although the upper two layers both originated from the Saharan region, they went through different transporting pathways and times. The “dust RGB” products from the Spinning Enhanced Visible and Infrared Imager (SEVIRI) on board the Meteosat Second Generation (MSG) satellite (Lensky and Rosenfeld, 2008) (Fig. S3) reveal that the pathway of Layer 3 largely overlapped with that of dust lifted from northwestern Algeria between 14–15 March. The synoptic conditions (Kanamitsu et al., 2002) (Fig. S4) during these days show low-pressure cyclones over the region with daily averaged 10 m wind speed exceeding 7 m s−1, which are favourable for dust emission. Both the trajectory and satellite images indicate that after the emission, the dust layer was elevated up to ∼ 6 km, crossed the Mediterranean, and dispersed over western Europe. Meanwhile, thick ice clouds continuously existed with the dust, implying the dust might undergo cloud processing. The dust enriched in Layer 2 was emitted probably during the daytime of 17 March near the border between Tunisia and Libya and elevated by the easterly trade winds (Khan et al., 2015). Although ice clouds kept forming above, the dust was not likely to go through cloud processing due to its lower altitudes. However, given the main lifting procedure happening over the sea and the longer time remaining over the Mediterranean compared to Layer 3, Layer 2 could contain more sea salt (Denjean et al., 2016). The different transport and ageing processes of these two dust layers can lead to contrasts of their microphysical properties and, consequently, the optical properties. As can be seen in Fig. 20, compared to the upper layer, the lower layer has a larger δ355, a larger LR355, and a smaller BAE355–532. However, here we only perform retrievals for Layer 3 because the measurement quality of Layer 2 is not guaranteed due to the relatively low aerosol loading.
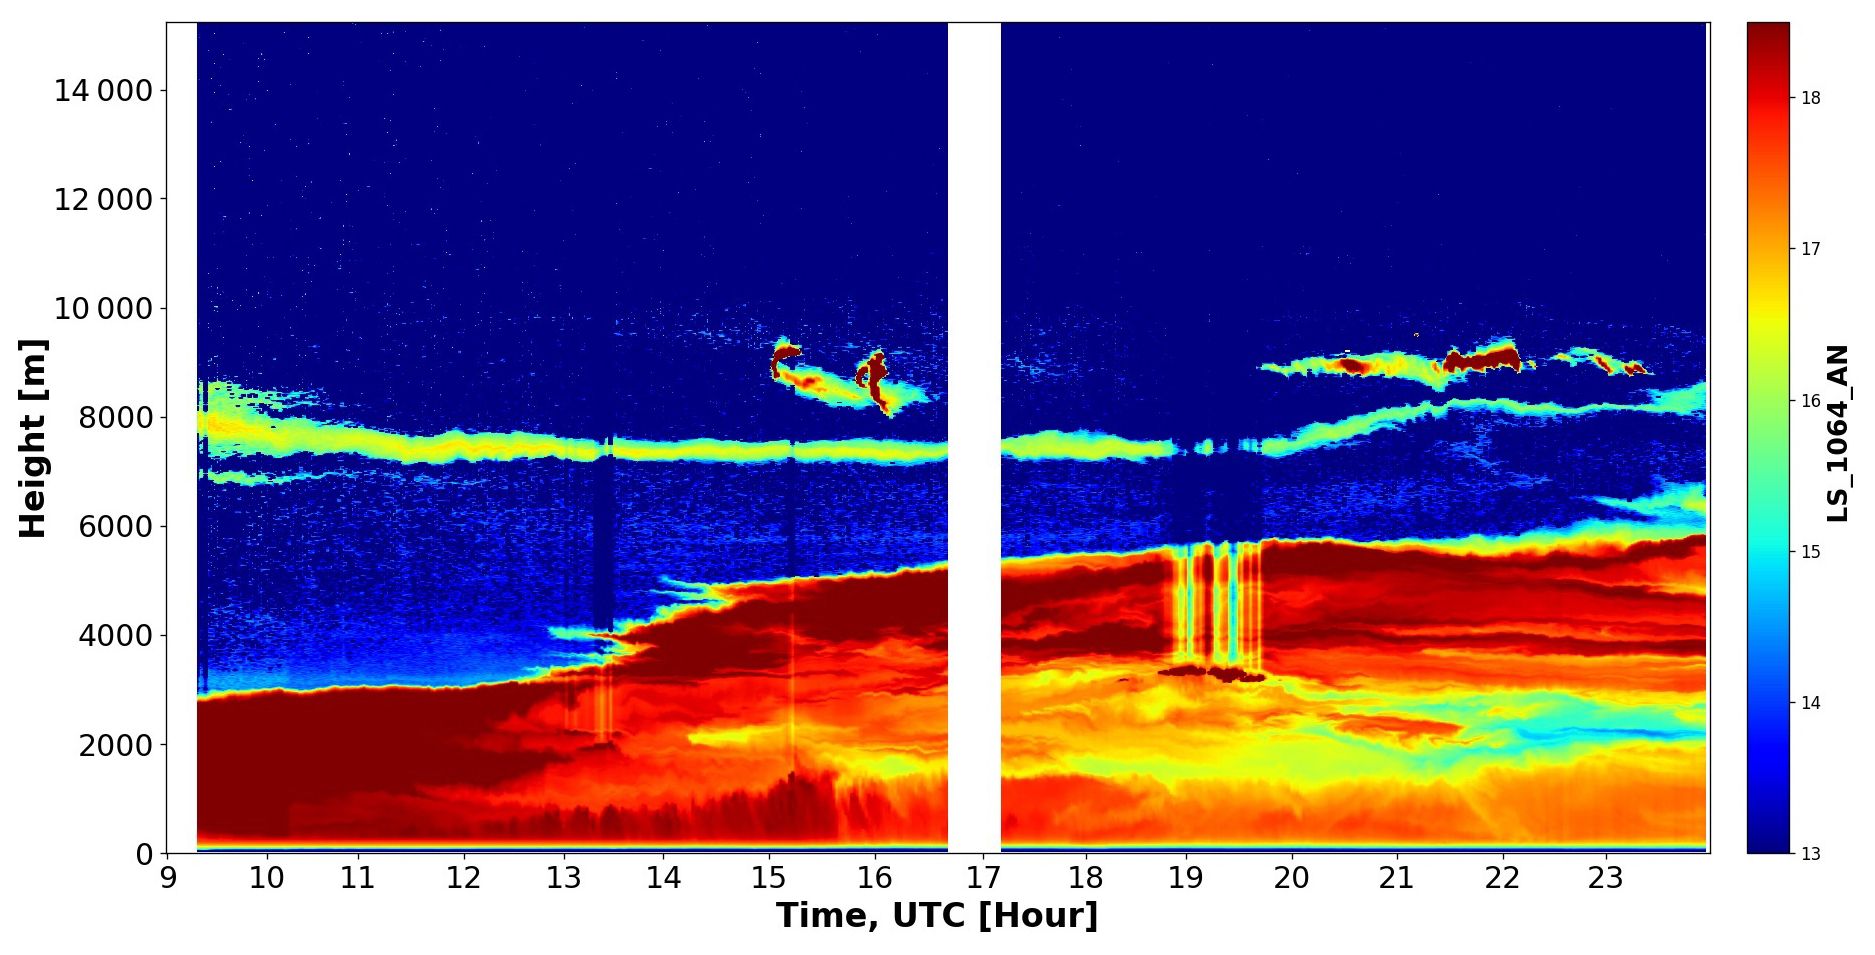
Figure 19LILAS range-corrected backscattered signals at 1064 nm since 09:00 UTC, 21 March 2022, at ATOLL/Lille, France.
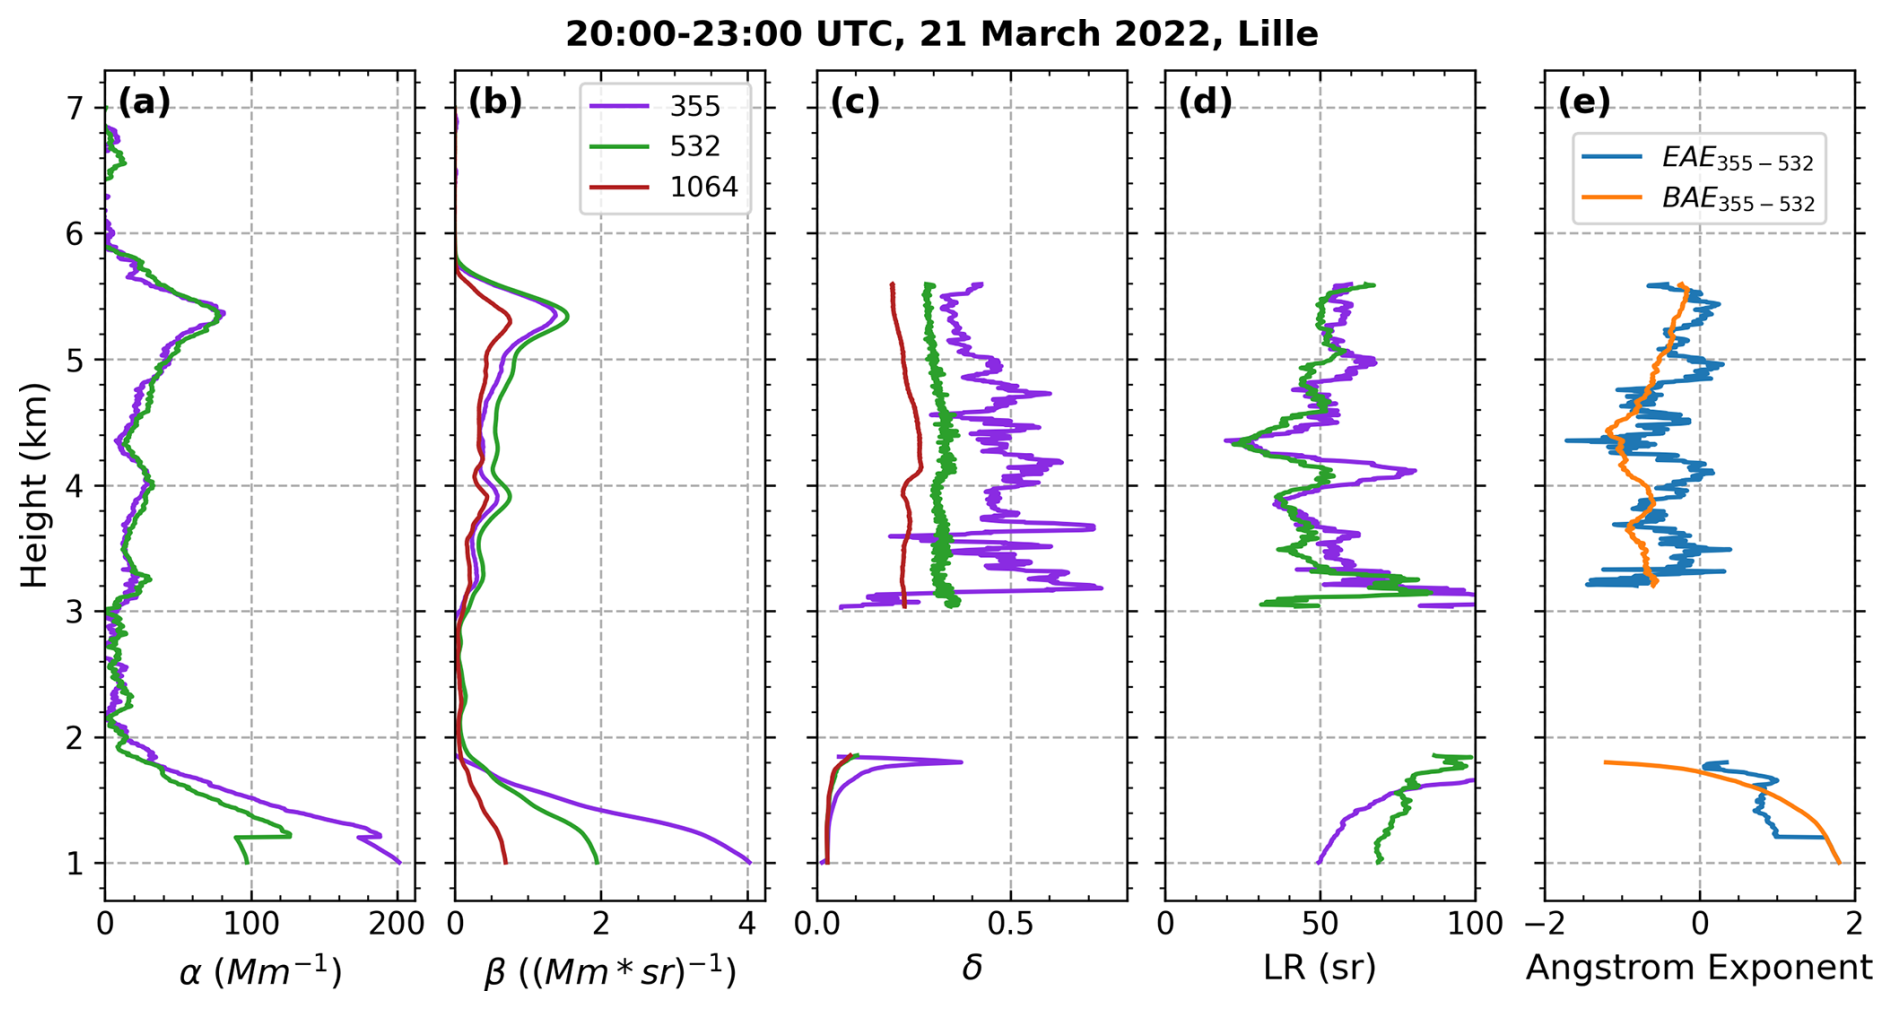
Figure 20Same as Fig. 16 but for Case 2, averaged for the period 20:00–23:00 UTC, 21 March 2022, at ATOLL/Lille.
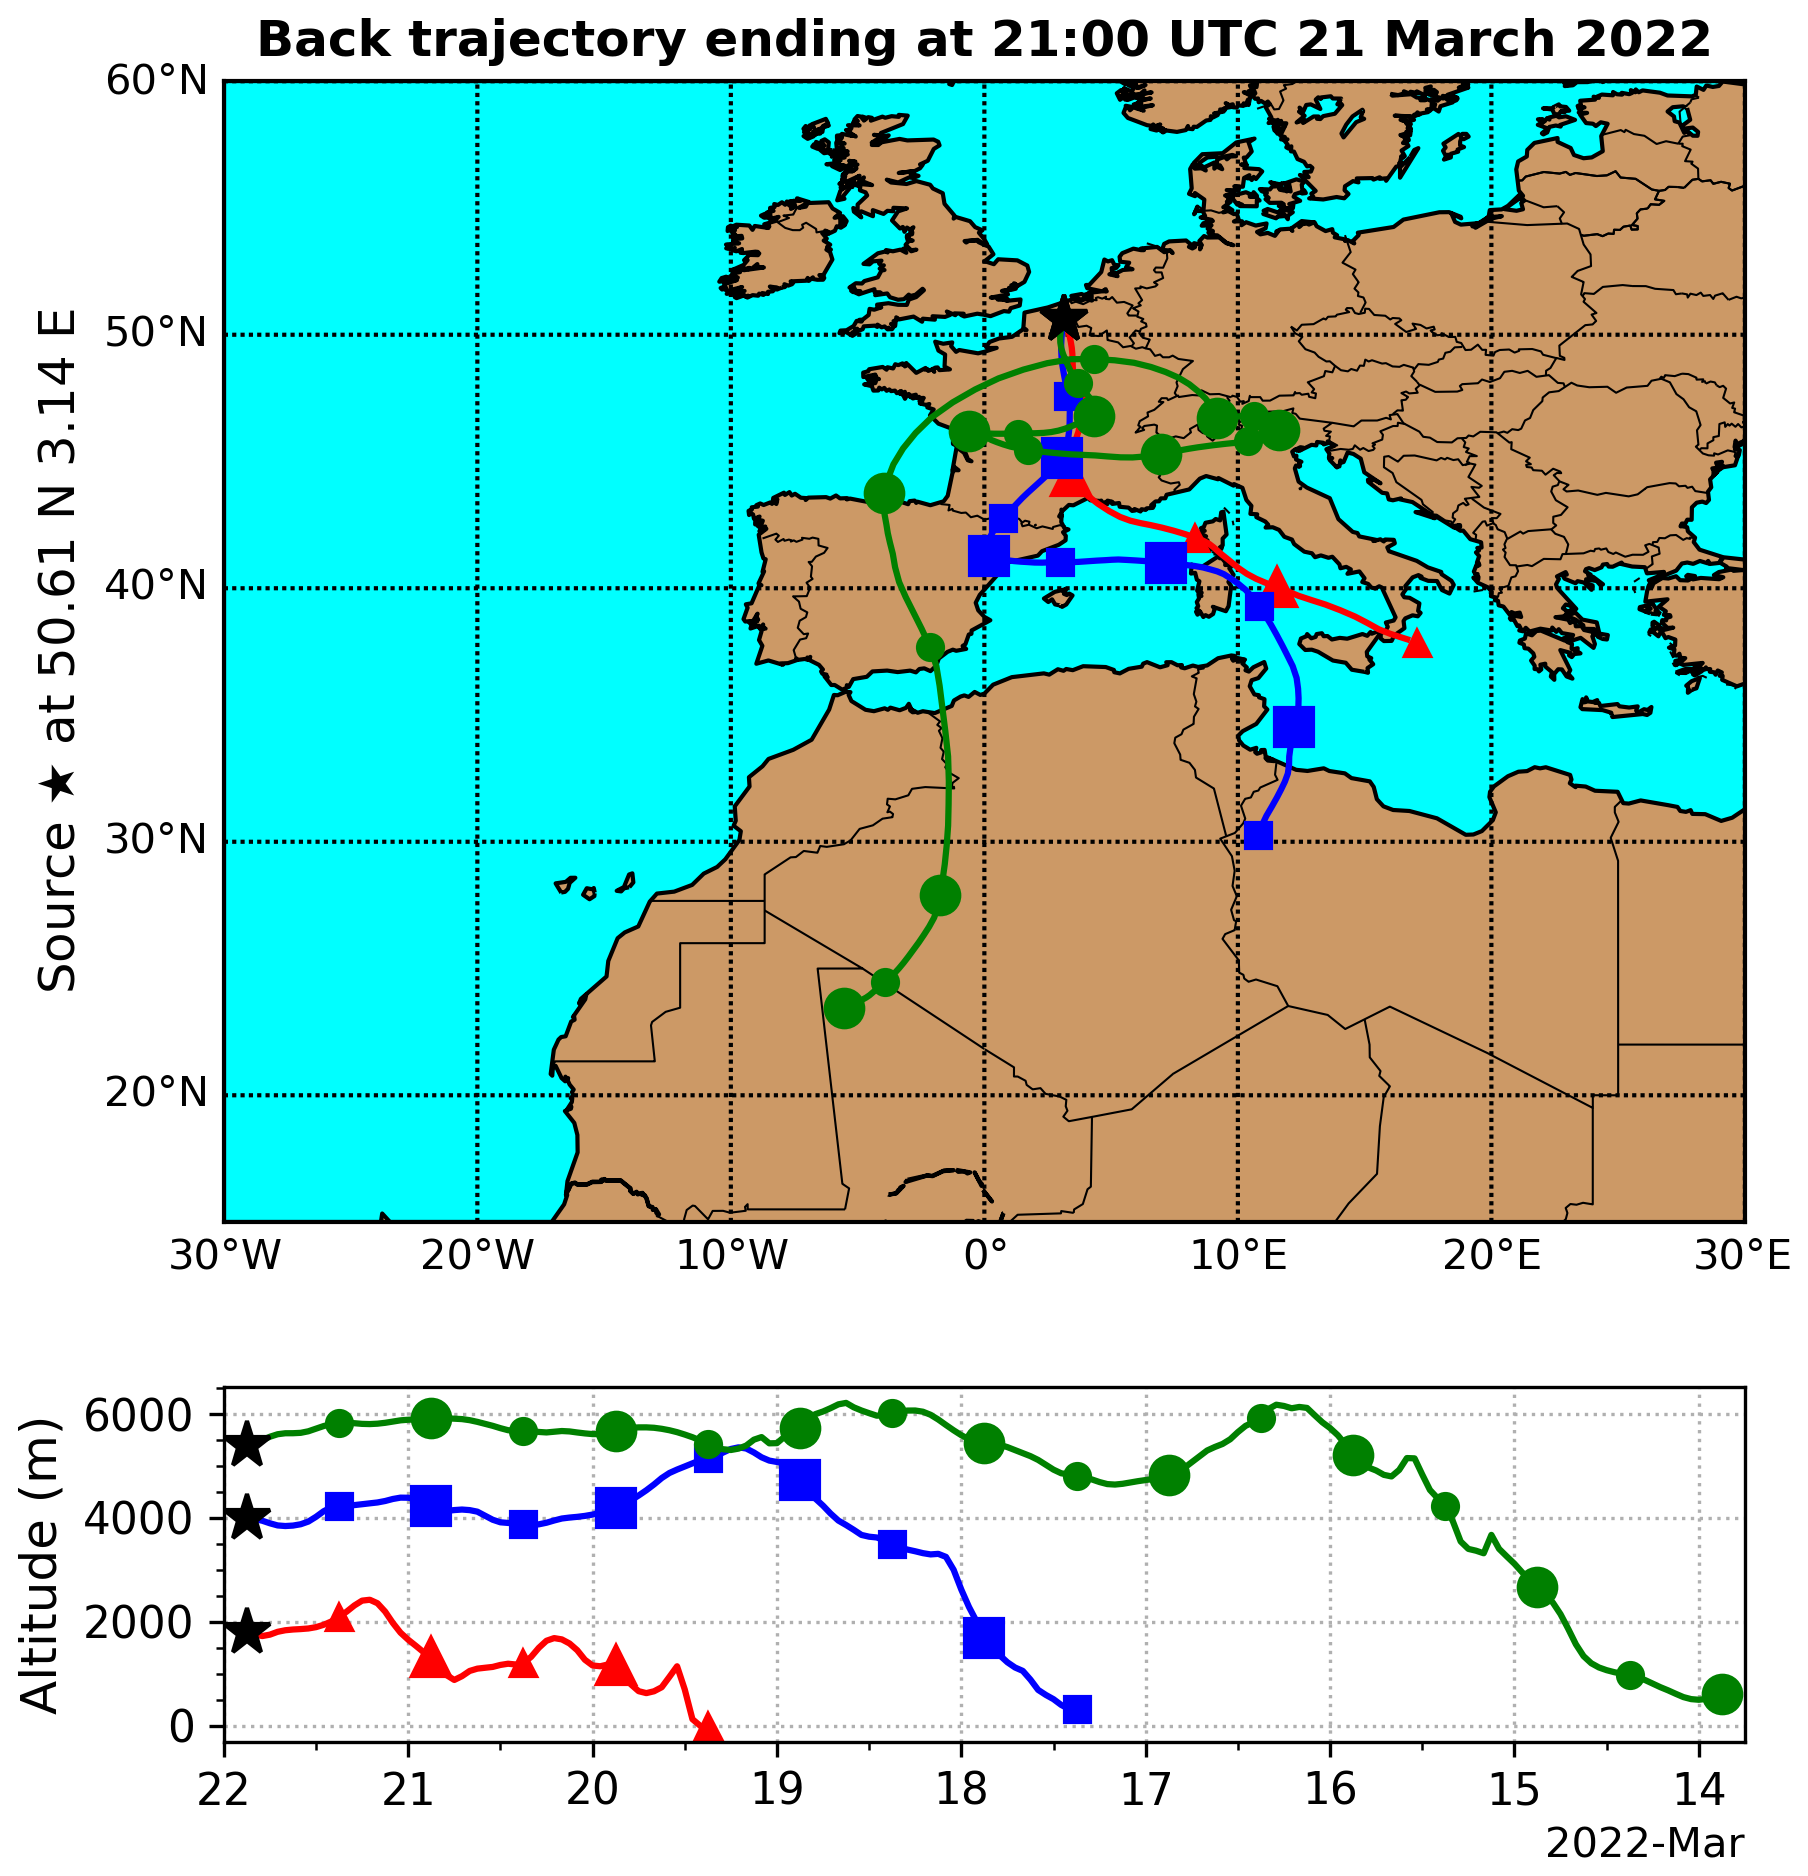
Figure 21Backward trajectories ending at 21:00 UTC, 21 March 2022, at ATOLL/Lille for 1.8 km (Layer 1), 4 km (Layer 2), and 5.4 km (Layer 3). The tracings were stopped once the air parcels touched the ground.
Figure 22 displays the microphysical property profiles retrieved with different configurations for Layer 3. Moving from () to (3β+2α) inversion, changes in the retrievals are still in accordance with the simulation results. When the () data are inverted, the retrieved effective radii slowly decrease from 0.7 to 0.5 µm as altitude increases, in accordance with the gradual increase in EAE. Compared to Case 1, the IH and spheroidal models obtain less divergent results, and both retrieve smaller reff and larger mI in Case 2 when the () data are inverted. Such contrasts could result from the distinct spectral PLDRs of the two cases. Moreover, the IH-obtained mR (1.5–1.55) in Case 2 is smaller than that (1.58–1.6) in Case 1, consistent with the higher LR in Case 2 than in Case 1. The differences in optical and microphysical properties between the two cases might be explained by the longer ageing process of dust particles in Case 2 than Case 1, particularly the persistent dust–cloud interactions in Case 2, which could considerably modify dust size (Mahowald et al., 2014; Ryder et al., 2015; Weinzierl et al., 2017; Wurzler et al., 2000).
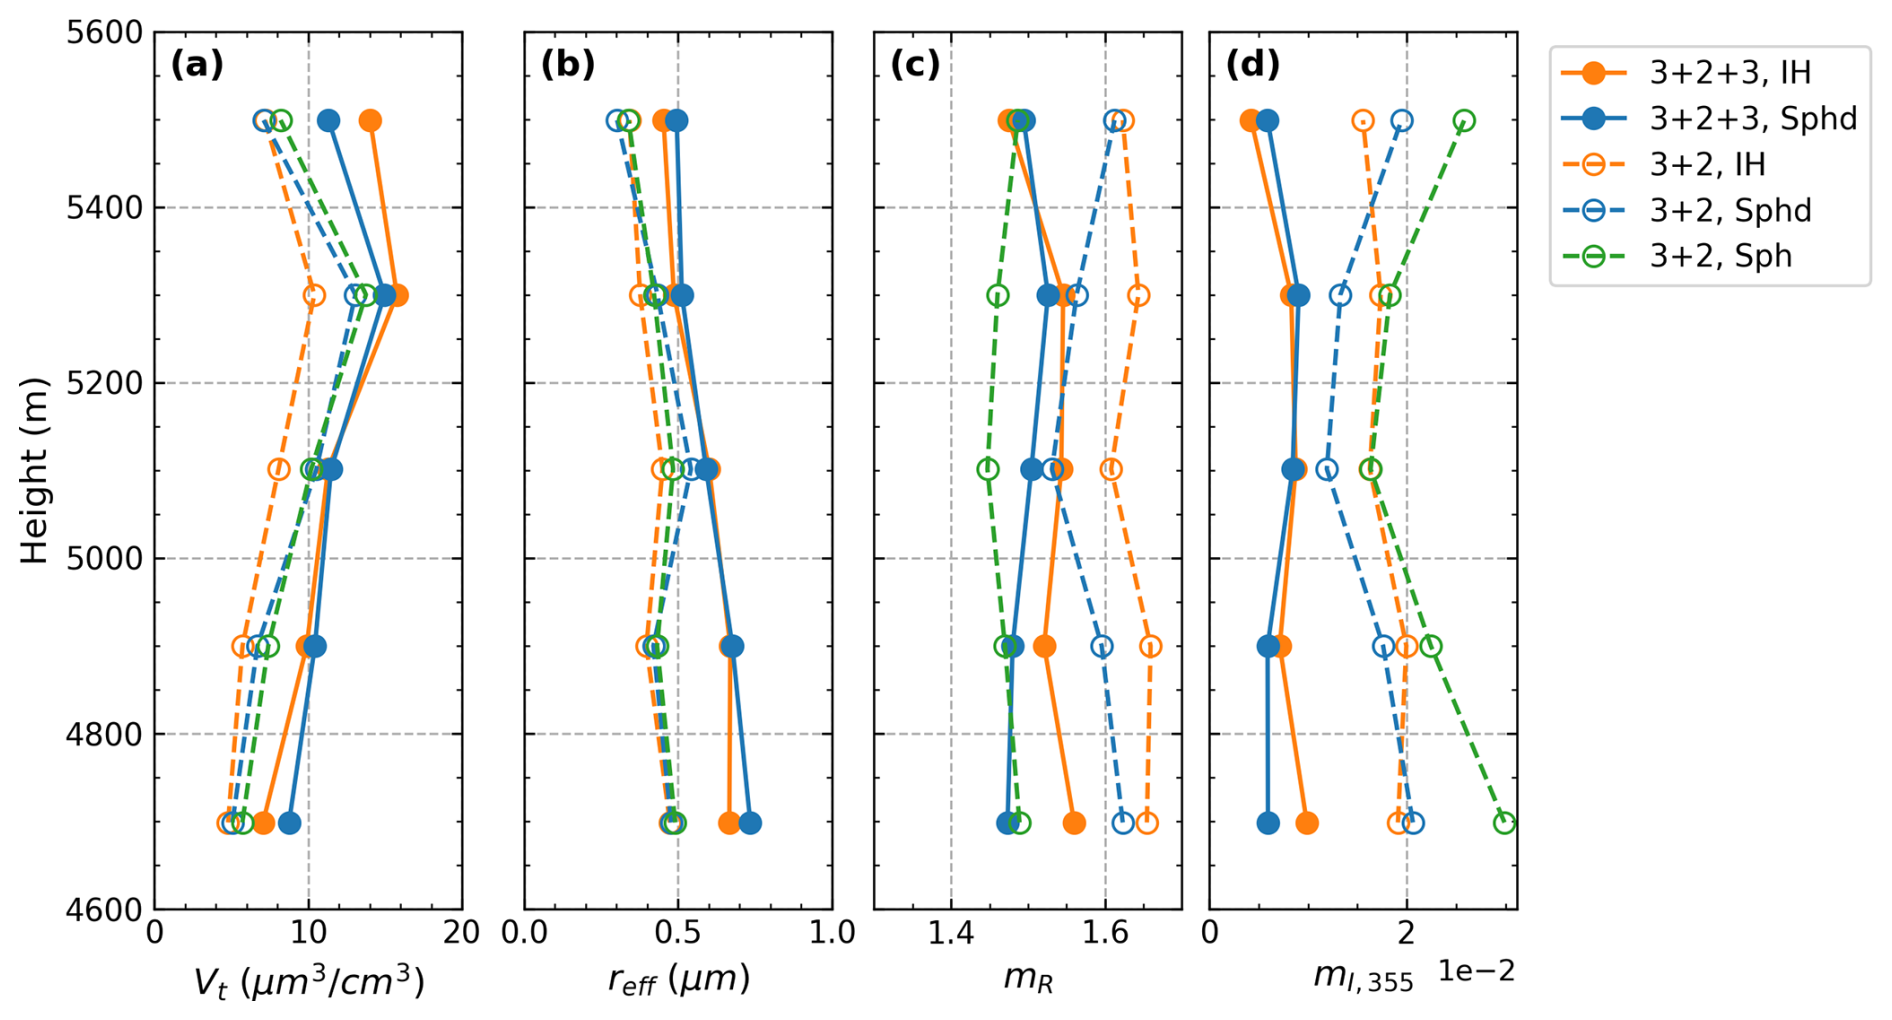
Figure 22Same as Fig. 17 but retrieved from the averaged optical data in Fig. 20, for the layer 4.6–5.6 km.
Figure 23 shows for different configurations the retrievals of VSD and SSA, as well as the comparisons between the real and reproduced measurements in the layer 5–5.5 km. Consistent with the change in mI, the retrieved SSAs are in general lower than those in Case 1. All the inverted measurements can be reproduced from the retrievals with biases smaller than their maximum errors. However, the IH model performs better in reproducing the intensive optical properties (LR and PLDR) than the spheroidal model. A more detailed discussion is given in Sect. 6.
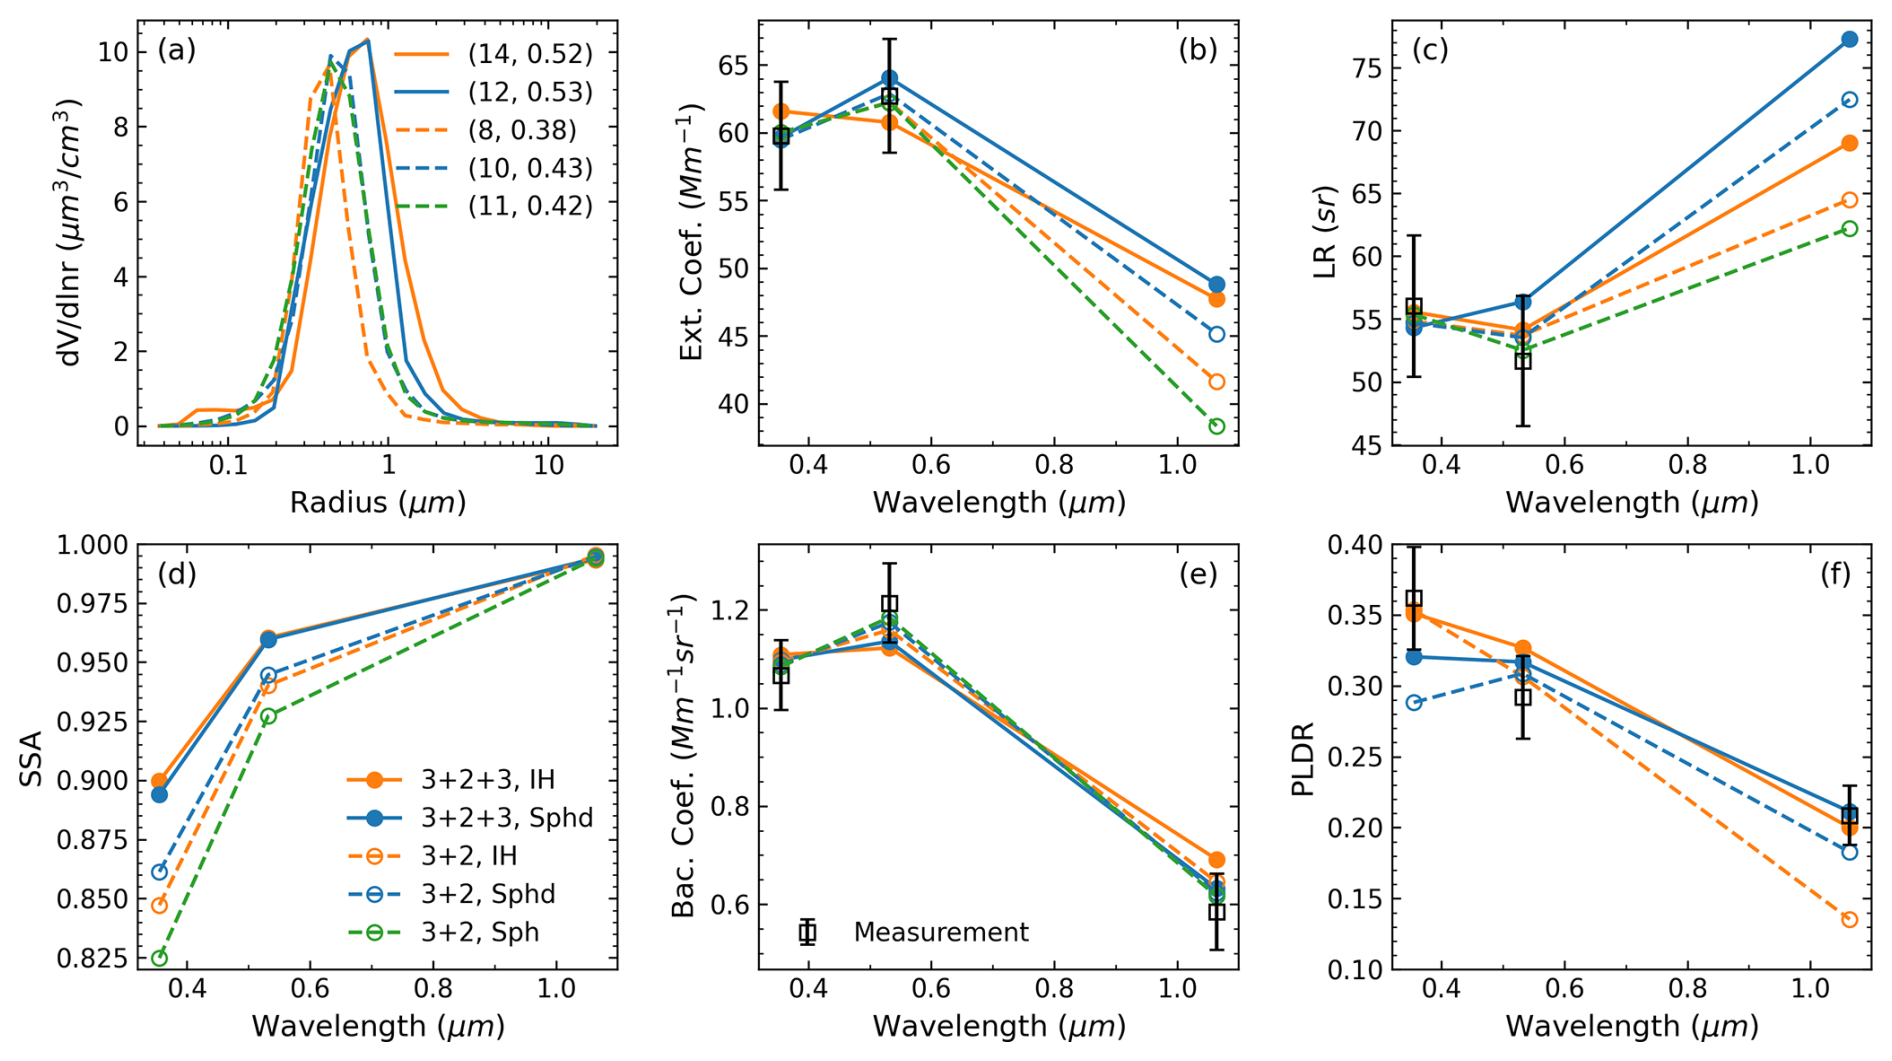
6.1 Capabilities of the IH and spheroid models to mimic measured optical properties
Both simulations and real dust retrievals in this study demonstrate the significance of considering dust non-sphericity in the retrieval from lidar measurements. The spherical model severely underestimates mR or overestimates mI as it considerably overestimates β of non-spherical particles. Therefore, it should be replaced with a proper non-spherical model. Comparing the spheroidal and IH models, we may argue that the latter is preferable because spheroids are too “smooth” and “spherical” to be like real dust particles. However, note that it is unrealistic to take the exact shape of every single dust particle for optical and radiative transfer calculations. In this regard, all applicable non-spherical models are kinds of optically equivalent approximation. We may also argue that compared to the IH model, the spheroidal model ignores the CBE effect, which results in underestimates of β (Huang et al., 2023; Zhou, 2018). However, this in turn cancels the enhancement of β due to the more spherical shape of spheroids than IH particles (Gasteiger et al., 2011; Kalashnikova and Sokolik, 2002; Mishchenko et al., 2002). In remote sensing applications, we should focus on which model is able to mimic dust optical properties that are more consistent with real measurements. As mentioned in Sect. 2.3.1, the deficiency of the spheroidal model in mimicking particle backscattering properties has been found in many previous studies (Haarig et al., 2022; Müller et al., 2010; Noh et al., 2017; Shin et al., 2018; Tesche et al., 2019). In addition, Kemppinen et al. (2015) found that the assumption of ellipsoids (a general case of spheroids) cannot fit the measured scattering matrix of irregular dust-like particles unless the CRI was largely biased from the true value. Huang et al. (2023) found that neither the spheroidal nor the ellipsoidal dust optics could reproduce the scattering matrix of the Amsterdam-Granada Light Scattering Database (AGLSD; Muñoz et al., 2012) samples well. Although there have been increasing calls for using the IH model in dust scattering calculation (e.g. Castellanos et al., 2024), we only found a very recent study where a simple conclusion (without details) that the IH model is superior to the ellipsoid model in mimicking the scattering pattern of Martian dust analogues was given (Martikainen et al., 2025). In this regard, our study provides a direct comparison of lidar-related optical properties simulated by the IH and spheroidal models.
Our simulations show the differences between the two non-spherical models in producing lidar-measured optical properties largely depend on particle size. For reff<0.5 µm, only EAEs show a slight difference within the measurement error; thus, the two models are optically equivalent in this size range. As particle size increases, BAEs, LRs, and PLDRs simulated with the two models start to be divergent, among which the PLDRs differ most (IH particles produce significantly larger values than spheroids). In addition, it seems that the differences in LR and PLDR also depend on the size parameter, which also leads to distinct spectral variations produced by the two models as reff increases. More significantly, for reff>1 µm, a size range that is in line with most published in situ and sun photometer retrieval results (Table 1), our simulations found that the IH model can better reproduce the real lidar measurements of BAE, spectral LR, and spectral PLDR (Table 2). Therefore, in this regard, we confirm that the IH model performs better than the spheroidal model.
However, we have to point out that although we tried to establish representative dust microphysical properties for the simulations based on previous studies, the settings are still limited and cannot cover all the situations. For example, the VSDs are described using the monomodal lognormal distribution with fixed Sg=1.95, a value near the middle of the Sg range in Table 1; situations when Sg varies or a narrow submicron mode close to the coarse mode simultaneously presents, as many optical particle counter (OPC) instruments show (Ryder et al., 2013, 2018; Weinzierl et al., 2009, 2011), are not included. In addition, the simulations did not account for other aerosol types like sea salt and anthropogenic pollutants that can either externally or internally (by coating or chemical reactions) mix with pure dust particles, making the aerosol ensemble more spherical and less depolarized (Kandler et al., 2009; Matsuki et al., 2005; Ryder et al., 2015; Weinzierl et al., 2009, 2011; Zhang and Iwasaka, 2004). These omissions might explain the discrepancy between some model-reproduced and real measurements. For instance, although the PLDR spectral variation of Saharan dust can be reproduced by the IH model using the setup for Sg=1.95, reff>1 µm, the magnitudes from the model are evidently higher, especially at 355 nm. A future study will further compare these two non-spherical models by considering these possibilities.
6.2 Retrieval performance and information of δ measurements
Apart from the capability of mimicking dust backscattering properties, it is also essential to assess the retrieval performance of the IH and spheroidal models. That is, the accuracy and stability of the retrieval as different measurement combinations are inverted and aerosol microphysical states vary. From the results of both synthetic and real optical measurement inversions, we are quite certain that the lack of δ measurements causes a trend of underestimating Vt and reff and overestimating mR, mI. Retrievals from synthetic optical data (Sect. 4) reveal that spectral PLDR plays a significant role for improving the retrieval accuracy of large particles (reff>1 µm) under both of the non-spherical models. Among the three wavelengths, δ1064 is most essential since it shows the highest sensitivities to reff and mR. Although it is independent of mI, one can think of that δ1064 brings an effective constraint on particle size to the (3β+2α) inversion and thus improves the retrieval accuracies of all state parameters. This result is in contrast to that presented by Tesche et al. (2019). They concluded that δ355 is the most indispensable input measurement in lidar inversion, while δ1064 does not improve the retrieval performance. The main reason could be the fact that they only used the spheroidal model and retrieved real parts of CRI greater than 1.5 (a detailed demonstration has been given in Sect. 4.1). Moreover, the quite different experimental setup and retrieval outputs between the studies could also explain it. First, Tesche et al. (2019) used the spheroidal model and the retrieval methods similar to that of Müller et al. (2013) and Veselovskii et al. (2010). Second, they mainly focused on the retrieval of “spheroid fraction”, a parameter to characterize the mixing state of polluted dust. Finally, they did not consider the spectral variability of dust mI. We have discussed the potential limitations of these configurations in detail (Sect. 2), which render us confident in our result. In addition, our result is in line with the findings of Gasteiger and Freudenthaler (2014) and Shin et al. (2018), who attributed the greatest informational value to δ1064 measurements.
We cannot directly compare the synthetic retrievals across the models as the two non-spherical models are used to invert the synthetic measurements generated by their own. Nevertheless, the retrieval simulations signify that compared to the spheroidal model, the improvement attributed to δmeasurements is more manifest if the IH model is used. In particular, significant improvement in mI retrieval for large particles (reff=2 µm) was observed in the IH model. We also noticed that the combination of δ1064 with either δ355 or δ532 or both δ355 and δ532 allows (1) an improvement in CRI retrievals from a statistical point of view and (2) an effective suppression of retrieval instability caused by measurement noise. Accordingly, we conclude that the IH model is more suitable for lidar-based dust retrieval and suggest using the IH model to invert at least () measurements with one of the δ at 1064 nm to assure retrieval quality.
Inverting the real dust observations allows for direct comparisons of the results retrieved with the two non-spherical models. The two case studies in Sect. 5 verify the finding in the simulation that significant retrieval difference between the IH and spheroidal models is not expected if reff is retrieved to be ∼ 0.5 µm. In addition, when inverting the () data, the IH model tends to derive higher mR and mI than the spheroidal model because of their difference in producing spectral PLDR. It is also interesting to look at the LR at 1064 nm predicted by the () retrievals. In Case 2, both IH and spheroidal models derive the increasing LR from 532 to 1064 nm, while the magnitude of LR1064 retrieved with the IH model is more consistent with the measurements of Saharan dust (Gebauer et al., 2024; Haarig et al., 2022). In Case 1, the IH model found a quite distinct LR1064 compared to the spheroidal model, leading to different spectral variations. Unfortunately, we are currently in short of LR1064 measurements of eastern Asian dust for validation.
6.3 Comparison of the real case retrievals with AERONET and previous studies
The lack of independent data (ideally collocated in situ measurements) to compare with the results retrieved from the real lidar measurements in Sect. 5 precludes a closure validation of this study. Alternatively, in this section we present the results of a comparison with corresponding AERONET retrievals and comparison with previous studies discussed in Sect. 2.2 for a preliminary verification.
Two AERONET retrievals closest to the places and times of the lidar measurements and passing the data quality check (Holben et al., 2006; Sinyuk et al., 2020) are selected for the comparison. However, we are aware that such comparison itself has many limitations. Firstly, in contrast to our lidar, which works at the night-time to ensure the quality of Raman signals, AERONET makes columnar measurements and works during the daytime. Given the high tempo-spatial variability of aerosol particles, they could target aerosols with different microphysical and optical properties. For example, the layer-averaged α532 from lidar measurements is 161 Mm−1 in Case 1 and 64 Mm−1 in Case 2, respectively, while the columnar-averaged α440 from corresponding AERONET measurements is 186 Mm−1 in Case 1 (0–3.2 km) and 56 Mm−1 in Case 2 (0–2 plus 3–6 km). Secondly, retrievals from AERONET are also based on optical inversion and obtained with the spheroidal model. This could render the lidar retrievals using the spheroidal model more consistent with the AERONET retrievals since they utilize the same scattering model. Accordingly, the comparison results must be interpreted with care. Table 6 lists state parameters retrieved with BOREAL under different configurations and those provided by AERONET retrievals for the two case studies. Figure 24 visualizes the VSDs and SSAs from the AERONET retrievals. In Case 1, AERONET derives a monomodal VSD with reff obviously larger than any BOREAL retrievals. As mentioned, it is no wonder that the (, spheroidal) configuration obtains Vt, reff, mR, and mI that are closest to the AERONET retrieval since both retrievals exploit the spheroidal model. However, the SSA retrieved with the IH model shows a better consistency with the AERONET counterpart because the enhancement of SSA due to a smaller reff is compensated for by the weakening due to a larger mI. Compared to Case 1, BOREAL and AERONET retrievals are less comparable in Case 2 because the vertical aerosol distribution was more heterogeneous (we have demonstrated that the aerosols in the BL were of different types than the dust layer). The AERONET retrieval in Case 2 shows a bimodal VSD with the fine-mode volume fraction comparable to the coarse-mode volume fraction and an mR value much lower than the BOREAL counterpart. Due to the influence of the BL aerosols, it is hard to evaluate how well the AERONET-derived coarse mode and CRI represent the microphysical properties of the dust layer, let alone the time difference between the lidar and sun photometer observations, which further increases the uncertainty of the comparison.
Table 6Comparison of the state parameters retrieved with BOREAL under different retrieval configurations and provided by AERONET retrievals for the two case studies in Sect. 5. The CRIs and SSAs from the study of Di Biagio et al. (2019) are also listed in the last column. Lidar observations are averaged between 1.5 and 2 km in Case 1 and between 5 and 5.5 km in Case 2. For AERONET retrievals, Vt is calculated as the columnar volume concentration divided by the aerosol layer thickness (0–3.2 km for Case 1; 0–2 plus 3–6 km for Case 2); reff includes the value for the total VSD and that for the coarse mode in the parentheses; mR is the spectrally averaged value; mI and SSA at lidar wavelengths are derived by linear interpolation or extrapolation.
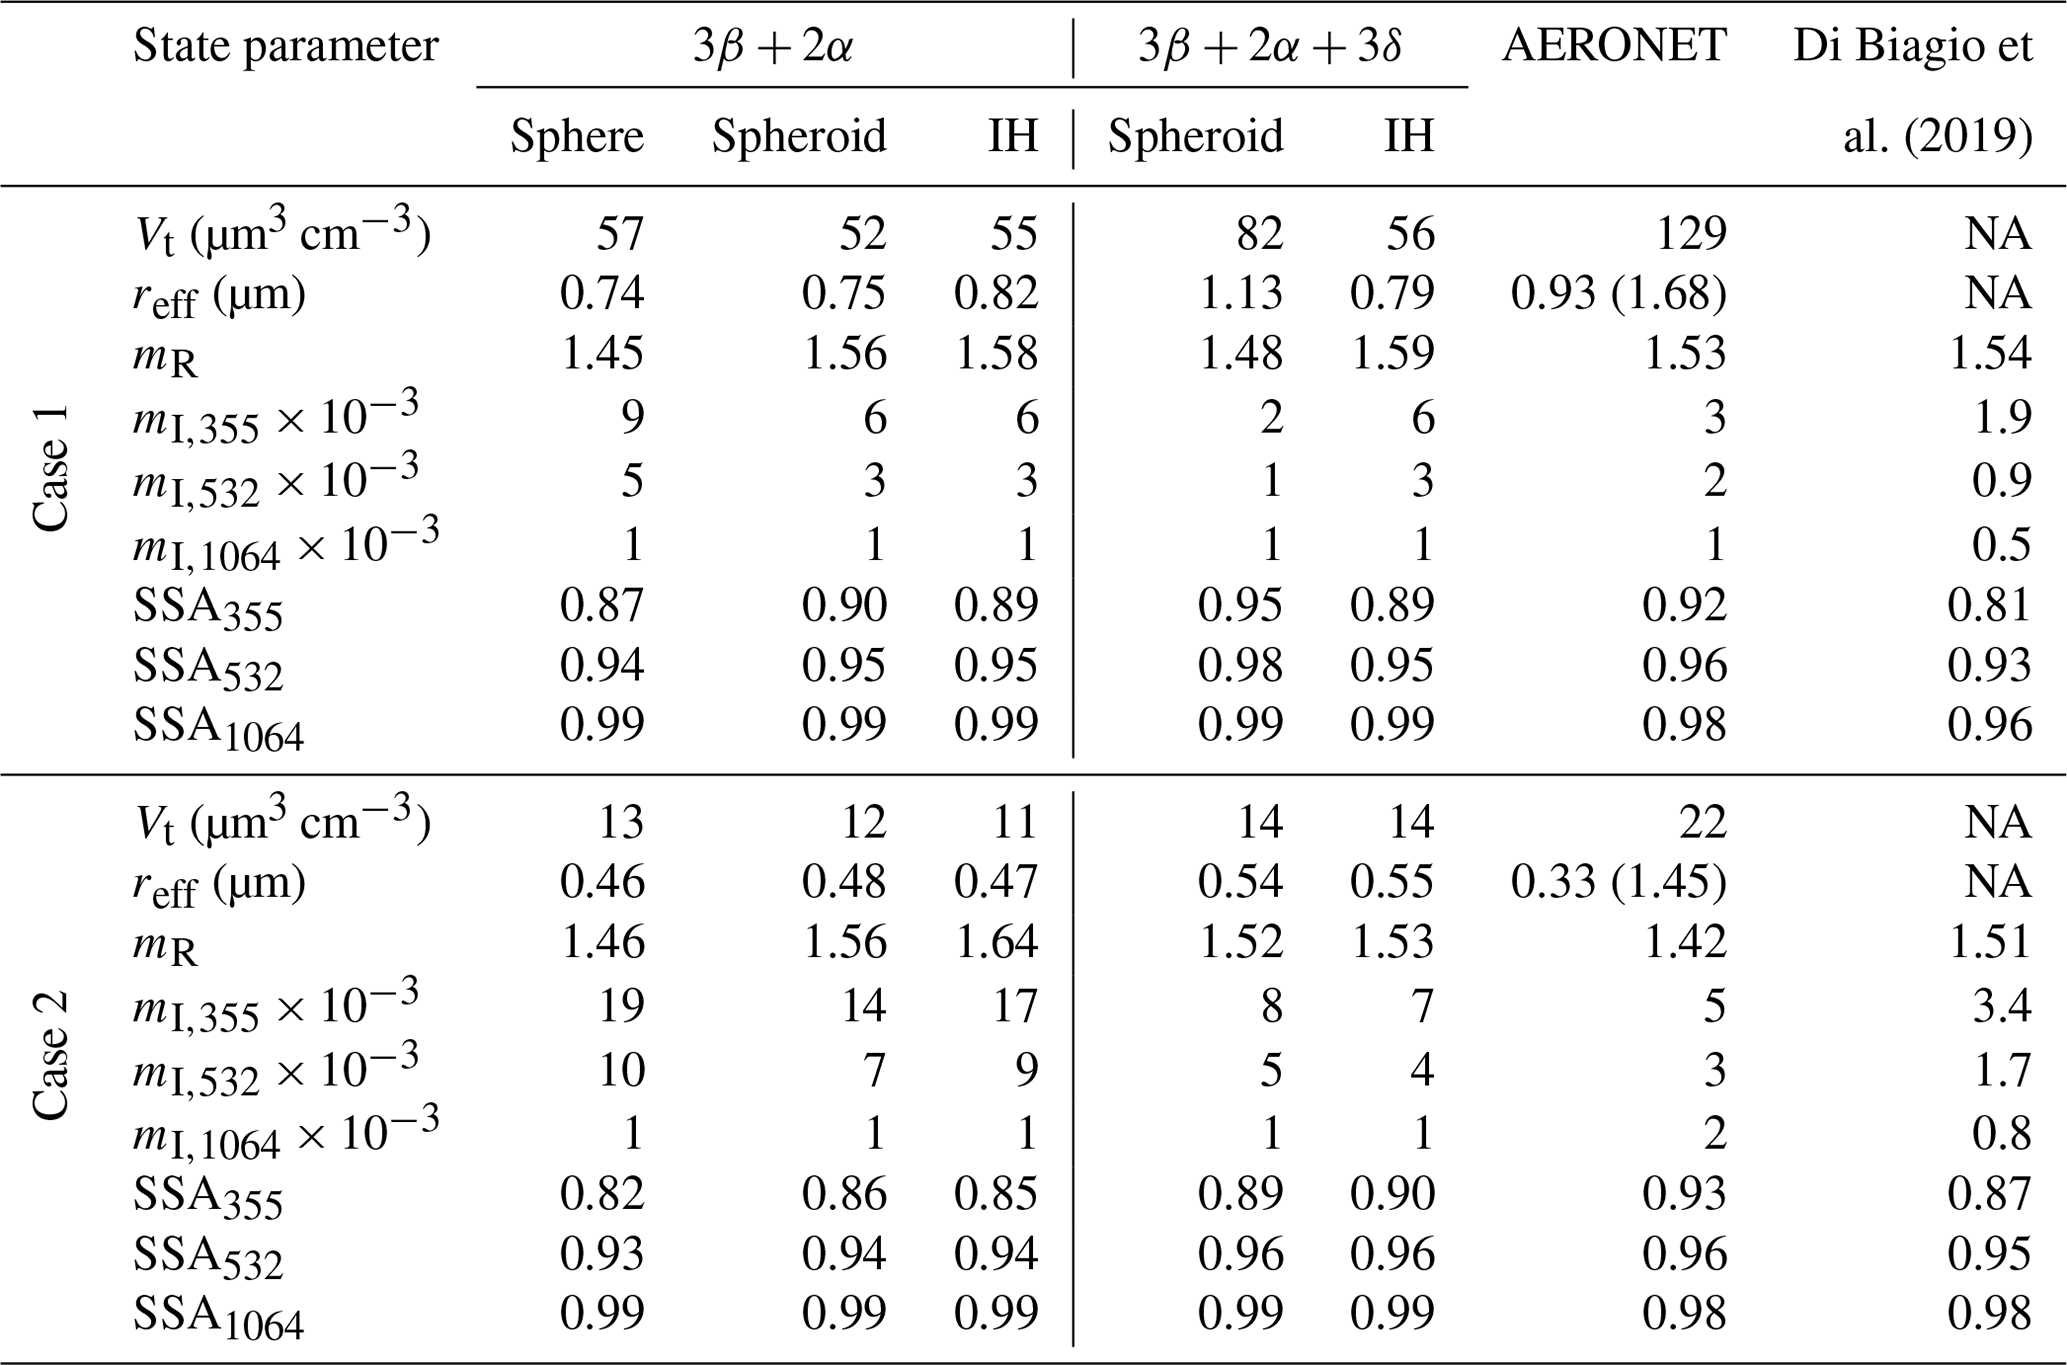
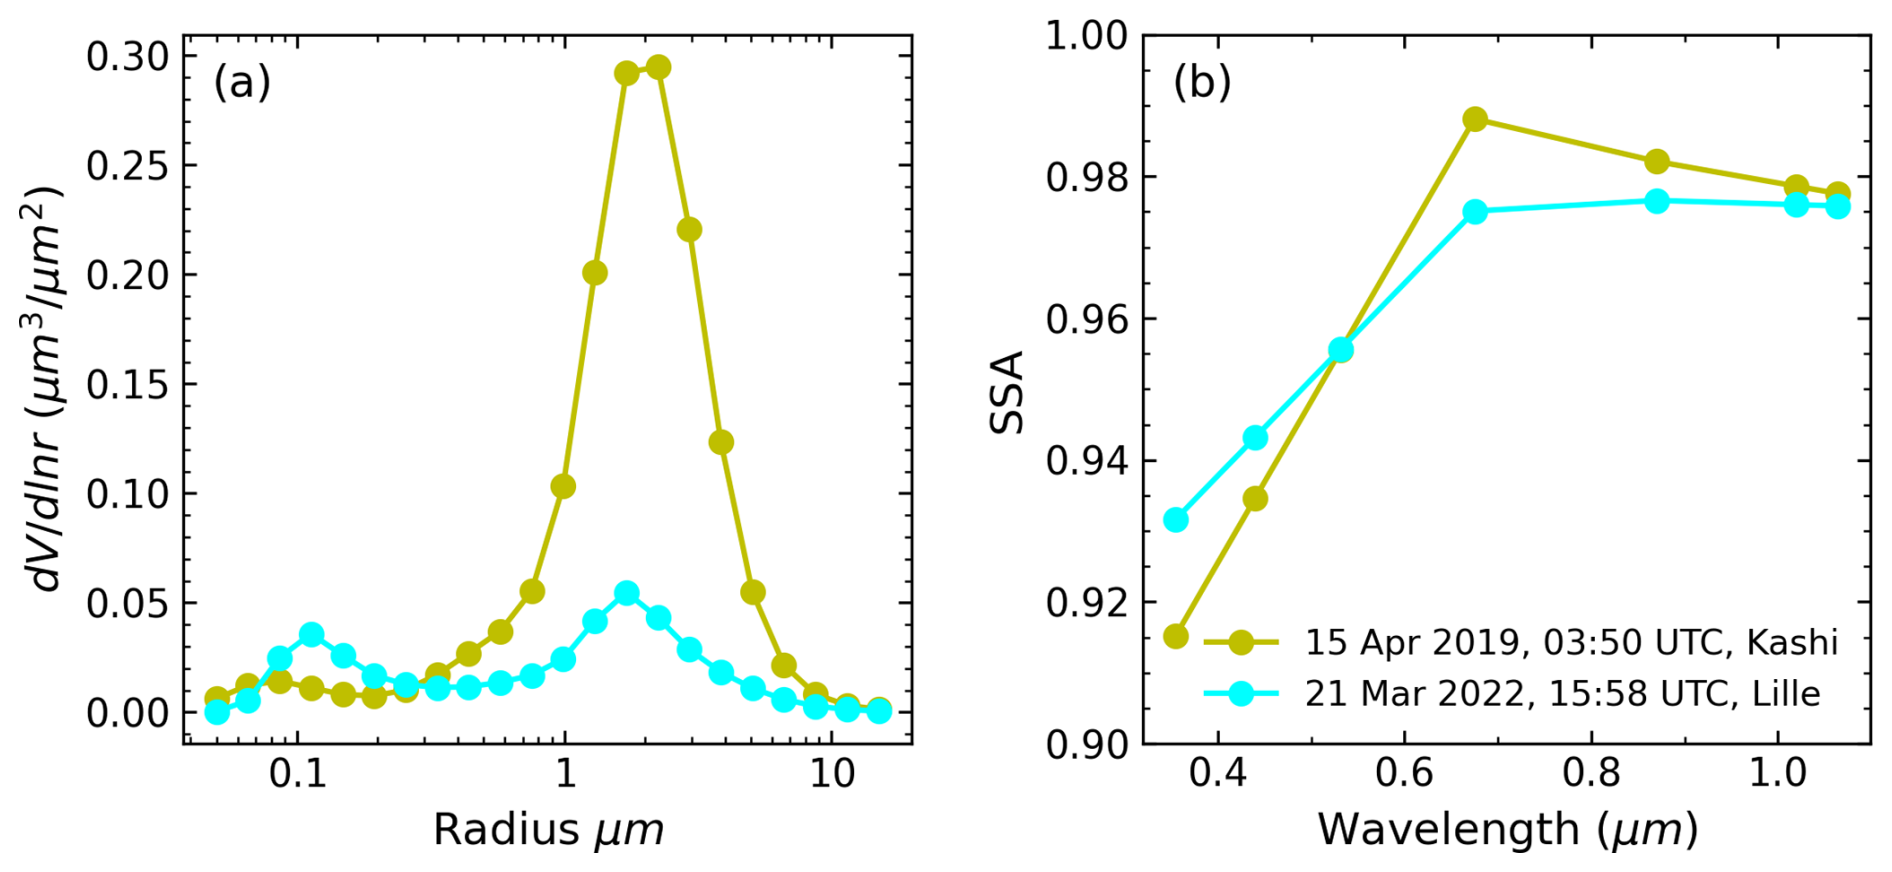
Figure 24AERONET retrievals selected for comparison with the BOREAL retrievals for the two real case studies: (a) VSD and (b) SSA. The SSA values at three lidar wavelengths are derived by linear interpolation or extrapolation.
The comparison with the historical results of dust VSD in Table 1 shows that the BOREAL-retrieved effective radii are smaller or comparable with the lower bound of those measurements. Studies have found that compared to in situ measurements, retrievals from both sun photometer and lidar measurements show systematically smaller reff (McConnell et al., 2008; Müller et al., 2012, 2013). As these studies pointed out, limitations of wavelengths restrain the measurement sensitivity to large particles, and moreover, the lack of angular information of the lidar measurements makes it worse (Eck et al., 2008). For the fresh dust in Case 1, it is likely that the BOREAL retrievals undersize the particles because as we have seen in Sect. 4, BOREAL tends to underestimate reff greater than 1 µm even if the 3δ are incorporated, let alone the giant-mode particles, which totally disappear from the retrievals due to the very little sensitivity, whereas they are actually ubiquitous for freshly emitted dust (Ryder et al., 2013, 2018). On the other hand, however, the BOREAL outputs are to some extent rational in terms of measurement fitting. Recall that the comparison between the model-simulated and measured LR and PLDR in Sect. 3.1 has shown that compared to real measurements, the IH model tends to overestimate the magnitude of PLDR using monomodal particles with reff>1 µm, in spite of the consistent spectral variations. Such a phenomenon was also observed by Saito and Yang (2021). Another study of Saito et al. (2021) shows the effective radius which is enabled to fit the Taklamakan dust (another observational case in Hu et al., 2020) to be 0.75 µm, a value quite close to our result. The situation could be more complicated in Case 2 since dust microphysical and optical properties can be deeply altered by cloud processing and scavenging (Mahowald et al., 2014; Wurzler et al., 2000). As can be seen in Fig. 23f, the spectral variation of PLDR in Case 2 is quite different from that in Case 1 and previous measurements of the Saharan dust (Table 2). The modification of dust size by dust–cloud interactions was also found during Fennec (Ryder et al., 2015) and SALTRACE (Weinzierl et al., 2017) campaigns.
It is also worth pointing out that different measuring principles and data processing of various in situ instruments can cause large uncertainty and even bias the results. For example, the uncertainty of aerosol microphysical property assumptions (e.g. shape, CRI) and issues of instrumental response and calibration can lead OPC instruments to oversizing and broadening size spectra (Reid et al., 2003b; Walser et al., 2017). The accuracy of aerodynamic measurement systems is affected by the ambiguity of the aerodynamic shape factor, as well as the cut-off and bouncing-off effects (Reid et al., 2003b; Ryder et al., 2015). In addition, as pointed out by Saito and Yang (2022), the use of maximum radius (, see Sect. 2.3.2) or projected area-equivalent radius as the size descriptor in aerodynamic methods can also lead to a systematic oversizing of irregular particles compared to the volume-equivalent radius used in this study. Similarly, systematic bias in VSD between using the optical-equivalent-spherical radius (for OPC methods) and the volume-equivalent radius is expected, although currently it is hard to be quantified. To sum up, the discrepancy between the effective radii retrieved from lidar inversion and measured by in situ measurements can result from the following: (1) the lack of measurement sensitivity due to the limitations of the maximum wavelength and measurement direction, (2) the drawbacks of BOREAL to better constraining the solution, (3) the limitations of the tested scattering models (both the IH and spheroidal models) in reproducing lidar measurements, and (4) the uncertainties in historical in situ measurements.
We also compared our retrieved CRIs and SSAs with the results provided by Di Biagio et al. (2019), as indicated in the last column of Table 6. It can be seen when the () data are inverted, for Case 1, the spheroidal model leads to more consistent mI, while the IH model leads to more consistent mR and SSA with the Di Biagio result; for Case 2, the two non-spherical models derive quite similar results, with higher mI and SSA, and slightly higher mR compared to the Di Biagio result. Note that the SSA was directly measured by the nephelometer and aethalometer, while the CRI was retrieved by fitting the scattering and absorption measurements under the spherical assumption in their study. Therefore, their results of SSA are of a higher confidence level than the CRI. In this regard, we may again announce the superiority of the IH model.
Finally, we briefly discuss the influence of using different configurations (scattering models + measurement sets) to retrieve dust microphysical properties on dust radiative effect (DRE) estimation. First of all, numbers of previous studies have demonstrated that ignoring dust non-sphericity, as many global aerosol models do (Gliß et al., 2021), can underestimate dust mass extinction efficiency because compared to a spherical particle, an irregular particle with the same volume-equivalent radius has a greater surface-to-volume ratio (Kalashnikova and Sokolik, 2004), as shown in Fig. 3. This, in turn, leads to overestimates of global dust mass loading (Huang et al., 2023; Kok et al., 2017). Second, diversity in retrieved VSD and CRI can also bias the estimates of DRE. If we adopt the retrievals obtained with the IH model since we have stated that it performs better than the other, the smaller retrieved reff compared to most of the in situ measurements means an increasing loading of finer particles and a decreasing loading of coarser particles. Consequently, the dust short-wave (SW) cooling could increase because the finer dust particles absorb less and scatter more SW radiation than the coarser dust particles (Miller et al., 2006), and this effect could last long given the longer lifetime of the finer dust particles. The lack of δ measurements leads to more underestimates of the coarse loading, but the influence on the finer particles becomes ambiguous since apart from reff, Vt is also underestimated. At the same time, inversions without δ measurements produce higher mI, resulting in underestimates of SSA, especially at UV wavelengths, which to some extent compensates for the increase in SW cooling.
In this study, we investigate the feasibility of retrieving microphysical properties (state parameters) of dust aerosols, including the VSD, volume concentration (Vt), effective radius (reff), complex refractive index (CRI = mR−imI), and SSA (ϖ) from combinations of spectral extinction (α), backscattering (β), and particle linear depolarization ratio (PLDR, δ) lidar measurements using a lidar–aerosol retrieval algorithm: BOREAL. For the first time, we assess the performances of three particle shape models, namely the spherical, spheroidal, and IH models, in terms of mimicking dust backscattering properties and retrieving dust microphysical properties. Based on both simulation and real case retrieval results, we conclude that compared to the other shape models, the IH model is preferable because it better reproduces real lidar measurements and leads to superior retrieval accuracy. Compared to the IH model, the use of the spherical model severely underestimates mR or overestimates mI to compensate for the enhancement of β due to the spherical assumption, which is consistent with the study of Veselovskii et al. (2010); the use of the spheroidal model, however, tends to produce lower mR and mI mainly due to the difference in the model-produced PLDR. The simulations also manifest great improvement in retrieval accuracy after incorporating spectral PLDR measurements into the conventional inversion of the 3β+2α measurements. Specifically, δ1064 brings the largest improvement when inverting the error-free optical data, especially for larger particles (reff>1 µm), whereas the combination of δ1064 with δ355 or δ532 greatly ameliorates the retrieval stability when measurement noise is present.
The retrievals from real lidar measurements substantiate the conclusions derived from the simulations. On the other hand, the comparison with AERONET retrievals and previous in situ measurement results implies a smaller effective radius from the BOREAL/lidar retrievals. The possible reasons are the following: (1) the lack of sensitivity of lidar measurements to larger particles, (2) the shortcomings of BOREAL to better constrain the VSD, (3) the biases of the AERONET and in situ results from ours due to the differences in measuring principles, and (4) the potential limitations of the tested shape models in reproducing backward lidar measurements. The smaller retrieved reff, sometimes accompanied by a larger mI if the δ measurements are absent, likely increases the dust SW cooling effect.
This study presents the prospect of retrieving height-resolved dust microphysical properties from lidar measurements using the IH model. At the same time, we are aware of the main weakness: the lack of coincident independent measurements (ideally in situ measurements), which precludes a closure validation of the results. Another limitation is that this study does not consider external or internal mixing with other species and only focuses on pure dust. Moreover, the influence of varying the shape factor (i.e. the axis ratio distribution in the spheroidal model and the degree of sphericity in the IH model) is not accounted for. Therefore, more future studies with regards to these issues are needed. Finally, more direct lidar measurements of dust extinction and backscattering coefficients at 1064 nm, like the study of Haarig et al. (2022), will be of great interest so as to further examine the model behaviour at longer wavelengths.
The data related to simulations, retrievals, and lidar observations in this study are available upon request to yuyang.chang@univ-lille.fr or qiaoyun.hu@univ-lille.fr.
The supplement related to this article is available online at https://doi.org/10.5194/acp-25-6787-2025-supplement.
YC developed the retrieval algorithm, performed simulations and real data applications, and wrote the manuscript. QH provided lidar optical measurements and helped with data analysis and manuscript revision. PG is the PI of the project, supervised the study, and improved the manuscript. IV helped in establishing the lidar system and scientific arguments. AL, OD, and CC provided the sphere and spheroid model and shared expertise in aerosol retrievals. MS developed and provided the IH model. FD helped with the programming. TP and GD took charge of the maintenance, automatization, and operation of the lidar system and provided raw data processing.
The contact author has declared that none of the authors has any competing interests.
Publisher's note: Copernicus Publications remains neutral with regard to jurisdictional claims made in the text, published maps, institutional affiliations, or any other geographical representation in this paper. While Copernicus Publications makes every effort to include appropriate place names, the final responsibility lies with the authors.
We acknowledge the Labex CaPPA (Chemical and Physical Properties of the Atmosphere) for supporting this research. We acknowledge funding from the “Hauts de France” Regional Council (project ECRIN) and the European Regional Development Fund (FEDER). The work of Qiaoyun Hu was supported by the ANR (ANR-21-ESRE-0013) through the OBS4CLIM project. We thank the NOAA Air Resources Laboratory (ARL) for sharing meteorology data and providing the HYSPLIT models. We also thank the NOAA PSL, Boulder, Colorado, USA, for providing the NCEP/DOE Reanalysis II data from their website at https://psl.noaa.gov (last access: 8 March 2025). We gratefully acknowledge the two anonymous reviewers and the editor, Geraint Vaughan, whose suggestions helped us improve and refine the manuscript.
This research has been supported by the French National Research Agency (ANR) through the PIA (Programme d'Investissement d'Avenir) under contract ANR-11-LABX-0005-01 and by the Hauts-de-France regional council and the European Funds for Regional Economic Development (FEDER).
This paper was edited by Geraint Vaughan and reviewed by two anonymous referees.
Alfaro, S. C. and Gomes, L.: Modeling mineral aerosol production by wind erosion: Emission intensities and aerosol size distributions in source areas, J. Geophys. Res.-Atmos., 106, 18075–18084, https://doi.org/10.1029/2000JD900339, 2001.
Ansmann, A., Mamouri, R.-E., Bühl, J., Seifert, P., Engelmann, R., Hofer, J., Nisantzi, A., Atkinson, J. D., Kanji, Z. A., Sierau, B., Vrekoussis, M., and Sciare, J.: Ice-nucleating particle versus ice crystal number concentrationin altocumulus and cirrus layers embedded in Saharan dust:a closure study, Atmos. Chem. Phys., 19, 15087–15115, https://doi.org/10.5194/acp-19-15087-2019, 2019.
Bangert, M., Nenes, A., Vogel, B., Vogel, H., Barahona, D., Karydis, V. A., Kumar, P., Kottmeier, C., and Blahak, U.: Saharan dust event impacts on cloud formation and radiation over Western Europe, Atmos. Chem. Phys., 12, 4045–4063, https://doi.org/10.5194/acp-12-4045-2012, 2012.
Bi, L., Yang, P., Kattawar, G. W., and Kahn, R.: Modeling optical properties of mineral aerosol particles by using nonsymmetric hexahedra, Appl. Optics, 49, 334–342, https://doi.org/10.1364/AO.49.000334, 2010.
Bi, L., Yang, P., Kattawar, G. W., and Mishchenko, M. I.: Efficient implementation of the invariant imbedding T-matrix method and the separation of variables method applied to large nonspherical inhomogeneous particles, J. Quant. Spectrosc. Ra., 116, 169–183, https://doi.org/10.1016/j.jqsrt.2012.11.014, 2013.
Bi, L., Lin, W., Wang, Z., Tang, X., Zhang, X., and Yi, B.: Optical Modeling of Sea Salt Aerosols: The Effects of Nonsphericity and Inhomogeneity, J. Geophys. Res.-Atmos., 123, 543–558, https://doi.org/10.1002/2017JD027869, 2018.
Bohren, C. F. and Huffman, D. R.: Absorption and Scattering of Light by Small Particles, 1st edn., Wiley, https://doi.org/10.1002/9783527618156, 1998.
Borovoi, A., Konoshonkin, A., and Kustova, N.: Backscattering reciprocity for large particles, Opt. Lett., 38, 1485–1487, https://doi.org/10.1364/OL.38.001485, 2013.
Burton, S. P., Ferrare, R. A., Hostetler, C. A., Hair, J. W., Rogers, R. R., Obland, M. D., Butler, C. F., Cook, A. L., Harper, D. B., and Froyd, K. D.: Aerosol classification using airborne High Spectral Resolution Lidar measurements – methodology and examples, Atmos. Meas. Tech., 5, 73–98, https://doi.org/10.5194/amt-5-73-2012, 2012.
Burton, S. P., Hair, J. W., Kahnert, M., Ferrare, R. A., Hostetler, C. A., Cook, A. L., Harper, D. B., Berkoff, T. A., Seaman, S. T., Collins, J. E., Fenn, M. A., and Rogers, R. R.: Observations of the spectral dependence of linear particle depolarization ratio of aerosols using NASA Langley airborne High Spectral Resolution Lidar, Atmos. Chem. Phys., 15, 13453–13473, https://doi.org/10.5194/acp-15-13453-2015, 2015.
Burton, S. P., Chemyakin, E., Liu, X., Knobelspiesse, K., Stamnes, S., Sawamura, P., Moore, R. H., Hostetler, C. A., and Ferrare, R. A.: Information content and sensitivity of the 3β + 2α lidar measurement system for aerosol microphysical retrievals, Atmos. Meas. Tech., 9, 5555–5574, https://doi.org/10.5194/amt-9-5555-2016, 2016.
Castellanos, P., Colarco, P., Espinosa, W. R., Guzewich, S. D., Levy, R. C., Miller, R. L., Chin, M., Kahn, R. A., Kemppinen, O., Moosmüller, H., Nowottnick, E. P., Rocha-Lima, A., Smith, M. D., Yorks, J. E., and Yu, H.: Mineral dust optical properties for remote sensing and global modeling: A review, Remote Sens. Environ., 303, 113982, https://doi.org/10.1016/j.rse.2023.113982, 2024.
Chang, Y., Hu, Q., Goloub, P., Veselovskii, I., and Podvin, T.: Retrieval of Aerosol Microphysical Properties from Multi-Wavelength Mie–Raman Lidar Using Maximum Likelihood Estimation: Algorithm, Performance, and Application, Remote Sens., 14, 6208, https://doi.org/10.3390/rs14246208, 2022.
DeMott, P. J., Sassen, K., Poellot, M. R., Baumgardner, D., Rogers, D. C., Brooks, S. D., Prenni, A. J., and Kreidenweis, S. M.: African dust aerosols as atmospheric ice nuclei, Geophys. Res. Lett., 30, 1732, https://doi.org/10.1029/2003GL017410, 2003.
Denjean, C., Cassola, F., Mazzino, A., Triquet, S., Chevaillier, S., Grand, N., Bourrianne, T., Momboisse, G., Sellegri, K., Schwarzenbock, A., Freney, E., Mallet, M., and Formenti, P.: Size distribution and optical properties of mineral dust aerosols transported in the western Mediterranean, Atmos. Chem. Phys., 16, 1081–1104, https://doi.org/10.5194/acp-16-1081-2016, 2016.
Di Biagio, C., Formenti, P., Balkanski, Y., Caponi, L., Cazaunau, M., Pangui, E., Journet, E., Nowak, S., Andreae, M. O., Kandler, K., Saeed, T., Piketh, S., Seibert, D., Williams, E., and Doussin, J.-F.: Complex refractive indices and single-scattering albedo of global dust aerosols in the shortwave spectrum and relationship to size and iron content, Atmos. Chem. Phys., 19, 15503–15531, https://doi.org/10.5194/acp-19-15503-2019, 2019.
Dubovik, O., Holben, B., Eck, T. F., Smirnov, A., Kaufman, Y. J., King, M. D., Tanré, D., and Slutsker, I.: Variability of Absorption and Optical Properties of Key Aerosol Types Observed in Worldwide Locations, J. Atmos. Sci., 59, 590–608, https://doi.org/10.1175/1520-0469(2002)059<0590:VOAAOP>2.0.CO;2, 2002.
Dubovik, O., Sinyuk, A., Lapyonok, T., Holben, B. N., Mishchenko, M., Yang, P., Eck, T. F., Volten, H., Muñoz, O., Veihelmann, B., van der Zande, W. J., Leon, J.-F., Sorokin, M., and Slutsker, I.: Application of spheroid models to account for aerosol particle nonsphericity in remote sensing of desert dust, J. Geophys. Res.-Atmos., 111, D11208, https://doi.org/10.1029/2005JD006619, 2006.
Eck, T. F., Holben, B. N., Reid, J. S., Sinyuk, A., Dubovik, O., Smirnov, A., Giles, D., O'Neill, N. T., Tsay, S.-C., Ji, Q., Al Mandoos, A., Ramzan Khan, M., Reid, E. A., Schafer, J. S., Sorokine, M., Newcomb, W., and Slutsker, I.: Spatial and temporal variability of column-integrated aerosol optical properties in the southern Arabian Gulf and United Arab Emirates in summer, J. Geophys. Res.-Atmos., 113, D01204, https://doi.org/10.1029/2007JD008944, 2008.
Floutsi, A. A., Baars, H., Engelmann, R., Althausen, D., Ansmann, A., Bohlmann, S., Heese, B., Hofer, J., Kanitz, T., Haarig, M., Ohneiser, K., Radenz, M., Seifert, P., Skupin, A., Yin, Z., Abdullaev, S. F., Komppula, M., Filioglou, M., Giannakaki, E., Stachlewska, I. S., Janicka, L., Bortoli, D., Marinou, E., Amiridis, V., Gialitaki, A., Mamouri, R.-E., Barja, B., and Wandinger, U.: DeLiAn – a growing collection of depolarization ratio, lidar ratio and Ångström exponent for different aerosol types and mixtures from ground-based lidar observations, Atmos. Meas. Tech., 16, 2353–2379, https://doi.org/10.5194/amt-16-2353-2023, 2023.
Foot, J. S.: Some observations of the optical properties of clouds. II: Cirrus, Q. J. Roy. Meteor. Soc., 114, 145–164, https://doi.org/10.1002/qj.49711447908, 1988.
Freudenthaler, V., Esselborn, M., Wiegner, M., Heese, B., Tesche, M., Ansmann, A., MüLLER, D., Althausen, D., Wirth, M., Fix, A., Ehret, G., Knippertz, P., Toledano, C., Gasteiger, J., Garhammer, M., and Seefeldner, M.: Depolarization ratio profiling at several wavelengths in pure Saharan dust during SAMUM 2006, Tellus B, 61, 165–179, https://doi.org/10.1111/j.1600-0889.2008.00396.x, 2009.
Garcia-Carreras, L., Parker, D. J., Marsham, J. H., Rosenberg, P. D., Brooks, I. M., Lock, A. P., Marenco, F., McQuaid, J. B., and Hobby, M.: The Turbulent Structure and Diurnal Growth of the Saharan Atmospheric Boundary Layer, J. Atmos. Sci., 72, 693–713, https://doi.org/10.1175/JAS-D-13-0384.1, 2015.
Gasteiger, J. and Freudenthaler, V.: Benefit of depolarization ratio at λ=1064 nm for the retrieval of the aerosol microphysics from lidar measurements, Atmos. Meas. Tech., 7, 3773–3781, https://doi.org/10.5194/amt-7-3773-2014, 2014.
Gasteiger, J., Wiegner, M., Groß, S., Freudenthaler, V., Toledano, C., Tesche, M., and Kandler, K.: Modelling lidar-relevant optical properties of complex mineral dust aerosols, Tellus B, 63, 725–741, https://doi.org/10.1111/j.1600-0889.2011.00559.x, 2011.
Gebauer, H., Floutsi, A. A., Haarig, M., Radenz, M., Engelmann, R., Althausen, D., Skupin, A., Ansmann, A., Zenk, C., and Baars, H.: Tropospheric sulfate from Cumbre Vieja (La Palma) observed over Cabo Verde contrasted with background conditions: a lidar case study of aerosol extinction, backscatter, depolarization and lidar ratio profiles at 355, 532 and 1064 nm, Atmos. Chem. Phys., 24, 5047–5067, https://doi.org/10.5194/acp-24-5047-2024, 2024.
Giannadaki, D., Pozzer, A., and Lelieveld, J.: Modeled global effects of airborne desert dust on air quality and premature mortality, Atmos. Chem. Phys., 14, 957–968, https://doi.org/10.5194/acp-14-957-2014, 2014.
Gliß, J., Mortier, A., Schulz, M., Andrews, E., Balkanski, Y., Bauer, S. E., Benedictow, A. M. K., Bian, H., Checa-Garcia, R., Chin, M., Ginoux, P., Griesfeller, J. J., Heckel, A., Kipling, Z., Kirkevåg, A., Kokkola, H., Laj, P., Le Sager, P., Lund, M. T., Lund Myhre, C., Matsui, H., Myhre, G., Neubauer, D., van Noije, T., North, P., Olivié, D. J. L., Rémy, S., Sogacheva, L., Takemura, T., Tsigaridis, K., and Tsyro, S. G.: AeroCom phase III multi-model evaluation of the aerosol life cycle and optical properties using ground- and space-based remote sensing as well as surface in situ observations, Atmos. Chem. Phys., 21, 87–128, https://doi.org/10.5194/acp-21-87-2021, 2021.
Gomes, L., Bergametti, G., Coudé-Gaussen, G., and Rognon, P.: Submicron desert dusts: A sandblasting process, J. Geophys. Res.-Atmos., 95, 13927–13935, https://doi.org/10.1029/JD095iD09p13927, 1990.
Haarig, M., Ansmann, A., Engelmann, R., Baars, H., Toledano, C., Torres, B., Althausen, D., Radenz, M., and Wandinger, U.: First triple-wavelength lidar observations of depolarization and extinction-to-backscatter ratios of Saharan dust, Atmos. Chem. Phys., 22, 355–369, https://doi.org/10.5194/acp-22-355-2022, 2022.
Hess, M., Koepke, P., and Schult, I.: Optical Properties of Aerosols and Clouds: The Software Package OPAC, B. Am. Meteorol. Soc., 79, 831–844, https://doi.org/10.1175/1520-0477(1998)079<0831:OPOAAC>2.0.CO;2, 1998.
Hofer, J., Ansmann, A., Althausen, D., Engelmann, R., Baars, H., Fomba, K. W., Wandinger, U., Abdullaev, S. F., and Makhmudov, A. N.: Optical properties of Central Asian aerosol relevant for spaceborne lidar applications and aerosol typing at 355 and 532 nm, Atmos. Chem. Phys., 20, 9265–9280, https://doi.org/10.5194/acp-20-9265-2020, 2020.
Holben, B. N., Eck, T. F., Slutsker, I., Tanré, D., Buis, J. P., Setzer, A., Vermote, E., Reagan, J. A., Kaufman, Y. J., Nakajima, T., Lavenu, F., Jankowiak, I., and Smirnov, A.: AERONET – A Federated Instrument Network and Data Archive for Aerosol Characterization, Remote Sens. Environ., 66, 1–16, https://doi.org/10.1016/S0034-4257(98)00031-5, 1998.
Holben, B. N., Eck, T. F., Slutsker, I., Smirnov, A., Sinyuk, A., Schafer, J., Giles, D., and Dubovik, O.: Aeronet's Version 2.0 quality assurance criteria, in: Remote Sensing of the Atmosphere and Clouds, Remote Sensing of the Atmosphere and Clouds, Proc. SPIE, 6408, 134–147, https://doi.org/10.1117/12.706524, 2006.
Hu, Q.: Advanced aerosol characterization using sun/sky photometer and multi-wavelength Mie-Raman lidar measurements, PhD thesis, École doctorale Sciences de la matière, du rayonnement et de l'environnement, Université de Lille, France, 212 pp., 2018.
Hu, Q., Goloub, P., Veselovskii, I., Bravo-Aranda, J.-A., Popovici, I. E., Podvin, T., Haeffelin, M., Lopatin, A., Dubovik, O., Pietras, C., Huang, X., Torres, B., and Chen, C.: Long-range-transported Canadian smoke plumes in the lower stratosphere over northern France, Atmos. Chem. Phys., 19, 1173–1193, https://doi.org/10.5194/acp-19-1173-2019, 2019.
Hu, Q., Wang, H., Goloub, P., Li, Z., Veselovskii, I., Podvin, T., Li, K., and Korenskiy, M.: The characterization of Taklamakan dust properties using a multiwavelength Raman polarization lidar in Kashi, China, Atmos. Chem. Phys., 20, 13817–13834, https://doi.org/10.5194/acp-20-13817-2020, 2020.
Huang, Y., Kok, J. F., Kandler, K., Lindqvist, H., Nousiainen, T., Sakai, T., Adebiyi, A., and Jokinen, O.: Climate Models and Remote Sensing Retrievals Neglect Substantial Desert Dust Asphericity, Geophys. Res. Lett., 47, e2019GL086592, https://doi.org/10.1029/2019GL086592, 2020.
Huang, Y., Kok, J. F., Saito, M., and Muñoz, O.: Single-scattering properties of ellipsoidal dust aerosols constrained by measured dust shape distributions, Atmos. Chem. Phys., 23, 2557–2577, https://doi.org/10.5194/acp-23-2557-2023, 2023.
Ito, A., Adebiyi, A. A., Huang, Y., and Kok, J. F.: Less atmospheric radiative heating by dust due to the synergy of coarser size and aspherical shape, Atmos. Chem. Phys., 21, 16869–16891, https://doi.org/10.5194/acp-21-16869-2021, 2021.
Johnson, B. R.: Invariant imbedding T matrix approach to electromagnetic scattering, Appl. Optics, 27, 4861–4873, https://doi.org/10.1364/AO.27.004861, 1988.
Johnson, B. T. and Osborne, S. R.: Physical and optical properties of mineral dust aerosol measured by aircraft during the GERBILS campaign, Q. J. Roy. Meteor. Soc., 137, 1117–1130, https://doi.org/10.1002/qj.777, 2011.
Kaaden, N., Massling, A., Schladitz, A., MüLLER, T., Kandler, K., SchüTZ, L., Weinzierl, B., Petzold, A., Tesche, M., Leinert, S., Deutscher, C., Ebert, M., Weinbruch, S., and Wiedensohler, A.: State of mixing, shape factor, number size distribution, and hygroscopic growth of the Saharan anthropogenic and mineral dust aerosol at Tinfou, Morocco, Tellus B, 61, 51–63, https://doi.org/10.1111/j.1600-0889.2008.00388.x, 2009.
Kalashnikova, O. V. and Sokolik, I. N.: Importance of shapes and compositions of wind-blown dust particles for remote sensing at solar wavelengths, Geophys. Res. Lett., 29, 38-1–38-4, https://doi.org/10.1029/2002GL014947, 2002.
Kalashnikova, O. V. and Sokolik, I. N.: Modeling the radiative properties of nonspherical soil-derived mineral aerosols, J. Quant. Spectrosc. Ra., 87, 137–166, https://doi.org/10.1016/j.jqsrt.2003.12.026, 2004.
Kanamitsu, M., Ebisuzaki, W., Woollen, J., Yang, S.-K., Hnilo, J. J., Fiorino, M., and Potter, G. L.: NCEP–DOE AMIP-II Reanalysis (R-2), B. Am. Meteorol. Soc., 83, 1631–1644, https://doi.org/10.1175/BAMS-83-11-1631, 2002.
Kandler, K., Schütz, L., Deutscher, C., Ebert, M., Hofmann, H., Jäckel, S., Jaenicke, R., Knippertz, P., Lieke, K., Massling, A., Petzold, A., Schladitz, A., Weinzierl, B., Wiedensohler, A., Zorn, S., and Weinbruch, S.: Size distribution, mass concentration, chemical and mineralogical composition and derived optical parameters of the boundary layer aerosol at Tinfou, Morocco, during SAMUM 2006, Tellus B, 61, 32–50, https://doi.org/10.1111/j.1600-0889.2008.00385.x, 2009.
Kandler, K., Lieke, K., Benker, N., Emmel, C., Küpper, M., Müller-Ebert, D., Ebert, M., Scheuvens, D., Schladitz, A., Schütz, L., and Weinbruch, S.: Electron microscopy of particles collected at Praia, Cape Verde, during the Saharan Mineral Dust Experiment: particle chemistry, shape, mixing state and complex refractive index, Tellus B, 63, 475, https://doi.org/10.1111/j.1600-0889.2011.00550.x, 2011.
Kemppinen, O., Nousiainen, T., Merikallio, S., and Räisänen, P.: Retrieving microphysical properties of dust-like particles using ellipsoids: the case of refractive index, Atmos. Chem. Phys., 15, 11117–11132, https://doi.org/10.5194/acp-15-11117-2015, 2015.
Khan, B., Stenchikov, G., Weinzierl, B., Kalenderski, S., and Osipov, S.: Dust plume formation in the free troposphere and aerosol size distribution during the Saharan Mineral Dust Experiment in North Africa, Tellus B, 67, 27170, https://doi.org/10.3402/tellusb.v67.27170, 2015.
Kok, J. F.: A scaling theory for the size distribution of emitted dust aerosols suggests climate models underestimate the size of the global dust cycle, P. Natl. Acad. Sci. USA, 108, 1016–1021, https://doi.org/10.1073/pnas.1014798108, 2011a.
Kok, J. F.: Does the size distribution of mineral dust aerosols depend on the wind speed at emission?, Atmos. Chem. Phys., 11, 10149–10156, https://doi.org/10.5194/acp-11-10149-2011, 2011b.
Kok, J. F., Ridley, D. A., Zhou, Q., Miller, R. L., Zhao, C., Heald, C. L., Ward, D. S., Albani, S., and Haustein, K.: Smaller desert dust cooling effect estimated from analysis of dust size and abundance, Nat. Geosci., 10, 274–278, https://doi.org/10.1038/ngeo2912, 2017.
Lensky, I. M. and Rosenfeld, D.: Clouds-Aerosols-Precipitation Satellite Analysis Tool (CAPSAT), Atmos. Chem. Phys., 8, 6739–6753, https://doi.org/10.5194/acp-8-6739-2008, 2008.
Liou, K.-N.: An introduction to atmospheric radiation, 2nd edn., Academic Press, Amsterdam, Boston, 583 pp., ISBN 9780124514515, 2002.
Mahowald, N., Albani, S., Kok, J. F., Engelstaeder, S., Scanza, R., Ward, D. S., and Flanner, M. G.: The size distribution of desert dust aerosols and its impact on the Earth system, Aeolian Res., 15, 53–71, https://doi.org/10.1016/j.aeolia.2013.09.002, 2014.
Mallios, S. A., Drakaki, E., and Amiridis, V.: Effects of dust particle sphericity and orientation on their gravitational settling in the earth's atmosphere, J. Aerosol Sci., 150, 105634, https://doi.org/10.1016/j.jaerosci.2020.105634, 2020.
Maring, H., Savoie, D. L., Izaguirre, M. A., Custals, L., and Reid, J. S.: Mineral dust aerosol size distribution change during atmospheric transport, J. Geophys. Res.-Atmos., 108, 8592, https://doi.org/10.1029/2002JD002536, 2003.
Martikainen, J., Muñoz, O., Gómez Martín, J. C., Passas Varo, M., Jardiel, T., Peiteado, M., Willame, Y., Neary, L., Becker, T., and Wurm, G.: Database of Martian dust optical properties in the UV-vis-NIR, Mon. Not. R. Astron. Soc., 537, 1489–1503, https://doi.org/10.1093/mnras/staf108, 2025.
Matsuki, A., Iwasaka, Y., Shi, G., Zhang, D., Trochkine, D., Yamada, M., Kim, Y.-S., Chen, B., Nagatani, T., Miyazawa, T., Nagatani, M., and Nakata, H.: Morphological and chemical modification of mineral dust: Observational insight into the heterogeneous uptake of acidic gases, Geophys. Res. Lett., 32, L22806, https://doi.org/10.1029/2005GL024176, 2005.
McConnell, C. L., Highwood, E. J., Coe, H., Formenti, P., Anderson, B., Osborne, S., Nava, S., Desboeufs, K., Chen, G., and Harrison, M. A. J.: Seasonal variations of the physical and optical characteristics of Saharan dust: Results from the Dust Outflow and Deposition to the Ocean (DODO) experiment, J. Geophys. Res.-Atmos., 113, D14S05, https://doi.org/10.1029/2007JD009606, 2008.
Meng, Z., Yang, P., Kattawar, G. W., Bi, L., Liou, K. N., and Laszlo, I.: Single-scattering properties of tri-axial ellipsoidal mineral dust aerosols: A database for application to radiative transfer calculations, J. Aerosol Sci., 41, 501–512, https://doi.org/10.1016/j.jaerosci.2010.02.008, 2010.
Miller, R. L. and Tegen, I.: Climate Response to Soil Dust Aerosols, J. Climate, 11, 3247–3267, https://doi.org/10.1175/1520-0442(1998)011<3247:CRTSDA>2.0.CO;2, 1998.
Miller, R. L., Tegen, I., and Perlwitz, J.: Surface radiative forcing by soil dust aerosols and the hydrologic cycle, J. Geophys. Res.-Atmos., 109, D04203, https://doi.org/10.1029/2003JD004085, 2004.
Miller, R. L., Cakmur, R. V., Perlwitz, J., Geogdzhayev, I. V., Ginoux, P., Koch, D., Kohfeld, K. E., Prigent, C., Ruedy, R., Schmidt, G. A., and Tegen, I.: Mineral dust aerosols in the NASA Goddard Institute for Space Sciences ModelE atmospheric general circulation model, J. Geophys. Res.-Atmos., 111, 2005JD005796, https://doi.org/10.1029/2005JD005796, 2006.
Mishchenko, M. I., Travis, L. D., and Lacis, A. A.: Scattering, Absorption, and Emission of Light by Small Particles, Cambridge University Press, Cambridge, UK, 445 pp., ISBN 9780521782524, 2002.
Müller, D., Wandinger, U., and Ansmann, A.: Microphysical particle parameters from extinction and backscatter lidar data by inversion with regularization: theory, Appl. Optics, 38, 2346–2357, https://doi.org/10.1364/AO.38.002346, 1999.
Müller, D., Ansmann, A., Freudenthaler, V., Kandler, K., Toledano, C., Hiebsch, A., Gasteiger, J., Esselborn, M., Tesche, M., Heese, B., Althausen, D., Weinzierl, B., Petzold, A., and von Hoyningen-Huene, W.: Mineral dust observed with AERONET Sun photometer, Raman lidar, and in situ instruments during SAMUM 2006: Shape-dependent particle properties, J. Geophys. Res.-Atmos., 115, D11207, https://doi.org/10.1029/2009JD012523, 2010.
Müller, D., Lee, K.-H., Gasteiger, J., Tesche, M., Weinzierl, B., Kandler, K., Müller, T., Toledano, C., Otto, S., Althausen, D., and Ansmann, A.: Comparison of optical and microphysical properties of pure Saharan mineral dust observed with AERONET Sun photometer, Raman lidar, and in situ instruments during SAMUM 2006, J. Geophys. Res.-Atmos., 117, D07211, https://doi.org/10.1029/2011JD016825, 2012.
Müller, D., Veselovskii, I., Kolgotin, A., Tesche, M., Ansmann, A., and Dubovik, O.: Vertical profiles of pure dust and mixed smoke-dust plumes inferred from inversion of multiwavelength Raman/polarization lidar data and comparison to AERONET retrievals and in situ observations, Appl. Optics, 52, 3178–3202, https://doi.org/10.1364/AO.52.003178, 2013.
Müller, D., Chemyakin, E., Kolgotin, A., Ferrare, R. A., Hostetler, C. A., and Romanov, A.: Automated, unsupervised inversion of multiwavelength lidar data with TiARA: assessment of retrieval performance of microphysical parameters using simulated data, Appl. Optics, 58, 4981–5008, https://doi.org/10.1364/AO.58.004981, 2019.
Müller, H. and Quenzel, H.: Information content of multispectral lidar measurements with respect to the aerosol size distribution, Appl. Optics, 24, 648–654, https://doi.org/10.1364/AO.24.000648, 1985.
Muñoz, O., Moreno, F., Guirado, D., Dabrowska, D. D., Volten, H., and Hovenier, J. W.: The Amsterdam–Granada Light Scattering Database, J. Quant. Spectrosc. Ra., 113, 565–574, https://doi.org/10.1016/j.jqsrt.2012.01.014, 2012.
Nakajima, T., Tanaka, M., Yamano, M., Shiobara, M., Arao, K., and Nakanishi, Y.: Aerosol Optical Characteristics in the Yellow Sand Events Observed in May, 1982 at Nagasaki-Part II Models, J. Meteorol. Soc. Jpn. Ser. II, 67, 279–291, https://doi.org/10.2151/jmsj1965.67.2_279, 1989.
Nicolae, D., Vasilescu, J., Talianu, C., Binietoglou, I., Nicolae, V., Andrei, S., and Antonescu, B.: A neural network aerosol-typing algorithm based on lidar data, Atmos. Chem. Phys., 18, 14511–14537, https://doi.org/10.5194/acp-18-14511-2018, 2018.
Noh, Y., Müller, D., Lee, K., Kim, K., Lee, K., Shimizu, A., Sano, I., and Park, C. B.: Depolarization ratios retrieved by AERONET sun–sky radiometer data and comparison to depolarization ratios measured with lidar, Atmos. Chem. Phys., 17, 6271–6290, https://doi.org/10.5194/acp-17-6271-2017, 2017.
Osborne, S. R., Johnson, B. T., Haywood, J. M., Baran, A. J., Harrison, M. A. J., and McConnell, C. L.: Physical and optical properties of mineral dust aerosol during the Dust and Biomass-burning Experiment, J. Geophys. Res.-Atmos., 113, D00C03, https://doi.org/10.1029/2007JD009551, 2008.
Ouimette, J. R. and Flagan, R. C.: The extinction coefficient of multicomponent aerosols, Atmos. Environ., 16, 2405–2419, https://doi.org/10.1016/0004-6981(82)90131-7, 1982.
Pan, X., Uno, I., Hara, Y., Kuribayashi, M., Kobayashi, H., Sugimoto, N., Yamamoto, S., Shimohara, T., and Wang, Z.: Observation of the simultaneous transport of Asian mineral dust aerosols with anthropogenic pollutants using a POPC during a long-lasting dust event in late spring 2014, Geophys. Res. Lett., 42, 1593–1598, https://doi.org/10.1002/2014GL062491, 2015.
Reid, E. A., Reid, J. S., Meier, M. M., Dunlap, M. R., Cliff, S. S., Broumas, A., Perry, K., and Maring, H.: Characterization of African dust transported to Puerto Rico by individual particle and size segregated bulk analysis, J. Geophys. Res.-Atmos., 108, 8591, https://doi.org/10.1029/2002JD002935, 2003a.
Reid, J. S., Jonsson, H. H., Maring, H. B., Smirnov, A., Savoie, D. L., Cliff, S. S., Reid, E. A., Livingston, J. M., Meier, M. M., Dubovik, O., and Tsay, S.: Comparison of size and morphological measurements of coarse mode dust particles from Africa, J. Geophys. Res.-Atmos., 108, 2002JD002485, https://doi.org/10.1029/2002JD002485, 2003b.
Reid, J. S., Reid, E. A., Walker, A., Piketh, S., Cliff, S., Al Mandoos, A., Tsay, S.-C., and Eck, T. F.: Dynamics of southwest Asian dust particle size characteristics with implications for global dust research, J. Geophys. Res.-Atmos., 113, D14212, https://doi.org/10.1029/2007JD009752, 2008.
Rodgers, C. D.: Inverse methods for atmospheric sounding: theory and practice, World Scientific, Singapore, River Edge, N.J., 256 pp., https://doi.org/10.1142/3171, 2000.
Rodríguez, S., Alastuey, A., Alonso-Pérez, S., Querol, X., Cuevas, E., Abreu-Afonso, J., Viana, M., Pérez, N., Pandolfi, M., and de la Rosa, J.: Transport of desert dust mixed with North African industrial pollutants in the subtropical Saharan Air Layer, Atmos. Chem. Phys., 11, 6663–6685, https://doi.org/10.5194/acp-11-6663-2011, 2011.
Rolph, G., Stein, A., and Stunder, B.: Real-time Environmental Applications and Display sYstem: READY, Environ. Model. Softw., 95, 210–228, https://doi.org/10.1016/j.envsoft.2017.06.025, 2017.
Rosenfeld, D., Rudich, Y., and Lahav, R.: Desert dust suppressing precipitation: A possible desertification feedback loop, P. Natl. Acad. Sci. USA, 98, 5975–5980, https://doi.org/10.1073/pnas.101122798, 2001.
Ryder, C. L., Highwood, E. J., Rosenberg, P. D., Trembath, J., Brooke, J. K., Bart, M., Dean, A., Crosier, J., Dorsey, J., Brindley, H., Banks, J., Marsham, J. H., McQuaid, J. B., Sodemann, H., and Washington, R.: Optical properties of Saharan dust aerosol and contribution from the coarse mode as measured during the Fennec 2011 aircraft campaign, Atmos. Chem. Phys., 13, 303–325, https://doi.org/10.5194/acp-13-303-2013, 2013.
Ryder, C. L., McQuaid, J. B., Flamant, C., Rosenberg, P. D., Washington, R., Brindley, H. E., Highwood, E. J., Marsham, J. H., Parker, D. J., Todd, M. C., Banks, J. R., Brooke, J. K., Engelstaedter, S., Estelles, V., Formenti, P., Garcia-Carreras, L., Kocha, C., Marenco, F., Sodemann, H., Allen, C. J. T., Bourdon, A., Bart, M., Cavazos-Guerra, C., Chevaillier, S., Crosier, J., Darbyshire, E., Dean, A. R., Dorsey, J. R., Kent, J., O'Sullivan, D., Schepanski, K., Szpek, K., Trembath, J., and Woolley, A.: Advances in understanding mineral dust and boundary layer processes over the Sahara from Fennec aircraft observations, Atmos. Chem. Phys., 15, 8479–8520, https://doi.org/10.5194/acp-15-8479-2015, 2015.
Ryder, C. L., Marenco, F., Brooke, J. K., Estelles, V., Cotton, R., Formenti, P., McQuaid, J. B., Price, H. C., Liu, D., Ausset, P., Rosenberg, P. D., Taylor, J. W., Choularton, T., Bower, K., Coe, H., Gallagher, M., Crosier, J., Lloyd, G., Highwood, E. J., and Murray, B. J.: Coarse-mode mineral dust size distributions, composition and optical properties from AER-D aircraft measurements over the tropical eastern Atlantic, Atmos. Chem. Phys., 18, 17225–17257, https://doi.org/10.5194/acp-18-17225-2018, 2018.
Saito, M. and Yang, P.: Advanced Bulk Optical Models Linking the Backscattering and Microphysical Properties of Mineral Dust Aerosol, Geophys. Res. Lett., 48, e2021GL095121, https://doi.org/10.1029/2021GL095121, 2021.
Saito, M. and Yang, P.: Generalization of Atmospheric Nonspherical Particle Size: Interconversions of Size Distributions and Optical Equivalence, J. Atmos. Sci., 79, 3333–3349, https://doi.org/10.1175/JAS-D-22-0086.1, 2022.
Saito, M. and Yang, P.: Quantifying the Impact of the Surface Roughness of Hexagonal Ice Crystals on Backscattering Properties for Lidar-Based Remote Sensing Applications, Geophys. Res. Lett., 50, e2023GL104175, https://doi.org/10.1029/2023GL104175, 2023.
Saito, M., Yang, P., Ding, J., and Liu, X.: A Comprehensive Database of the Optical Properties of Irregular Aerosol Particles for Radiative Transfer Simulations, J. Atmos. Sci., 78, 2089–2111, https://doi.org/10.1175/JAS-D-20-0338.1, 2021.
Schuttlefield, J. D., Cox, D., and Grassian, V. H.: An investigation of water uptake on clays minerals using ATR-FTIR spectroscopy coupled with quartz crystal microbalance measurements, J. Geophys. Res.-Atmos., 112, D21303, https://doi.org/10.1029/2007JD008973, 2007.
Seifert, P., Ansmann, A., Mattis, I., Wandinger, U., Tesche, M., Engelmann, R., Müller, D., Pérez, C., and Haustein, K.: Saharan dust and heterogeneous ice formation: Eleven years of cloud observations at a central European EARLINET site, J. Geophys. Res.-Atmos., 115, D20201, https://doi.org/10.1029/2009JD013222, 2010.
Shao, Y.: Physics and modelling of wind erosion, Springer, Cambridge, 452 pp., ISBN 978-1-402-08894-0, 2008.
Shin, S.-K., Tesche, M., Kim, K., Kezoudi, M., Tatarov, B., Müller, D., and Noh, Y.: On the spectral depolarisation and lidar ratio of mineral dust provided in the AERONET version 3 inversion product, Atmos. Chem. Phys., 18, 12735–12746, https://doi.org/10.5194/acp-18-12735-2018, 2018.
Sinyuk, A., Holben, B. N., Eck, T. F., Giles, D. M., Slutsker, I., Korkin, S., Schafer, J. S., Smirnov, A., Sorokin, M., and Lyapustin, A.: The AERONET Version 3 aerosol retrieval algorithm, associated uncertainties and comparisons to Version 2, Atmos. Meas. Tech., 13, 3375–3411, https://doi.org/10.5194/amt-13-3375-2020, 2020.
Sokolik, I. N. and Toon, O. B.: Incorporation of mineralogical composition into models of the radiative properties of mineral aerosol from UV to IR wavelengths, J. Geophys. Res.-Atmos., 104, 9423–9444, https://doi.org/10.1029/1998JD200048, 1999.
Tegen, I. and Lacis, A. A.: Modeling of particle size distribution and its influence on the radiative properties of mineral dust aerosol, J. Geophys. Res.-Atmos., 101, 19237–19244, https://doi.org/10.1029/95JD03610, 1996.
Tesche, M., Ansmann, A., Müller, D., Althausen, D., Engelmann, R., Freudenthaler, V., and Groß, S.: Vertically resolved separation of dust and smoke over Cape Verde using multiwavelength Raman and polarization lidars during Saharan Mineral Dust Experiment 2008, J. Geophys. Res.-Atmos., 114, D13202, https://doi.org/10.1029/2009JD011862, 2009.
Tesche, M., Kolgotin, A., Haarig, M., Burton, S. P., Ferrare, R. A., Hostetler, C. A., and Müller, D.: : what is the most useful depolarization input for retrieving microphysical properties of non-spherical particles from lidar measurements using the spheroid model of Dubovik et al. (2006)?, Atmos. Meas. Tech., 12, 4421–4437, https://doi.org/10.5194/amt-12-4421-2019, 2019.
Tian, Y., Pan, X., Wang, Z., Wang, D., Ge, B., Liu, X., Zhang, Y., Liu, H., Lei, S., Yang, T., Fu, P., Sun, Y., and Wang, Z.: Transport Patterns, Size Distributions, and Depolarization Characteristics of Dust Particles in East Asia in Spring 2018, J. Geophys. Res.-Atmos., 125, e2019JD031752, https://doi.org/10.1029/2019JD031752, 2020.
Toth III, J. R., Rajupet, S., Squire, H., Volbers, B., Zhou, J., Xie, L., Sankaran, R. M., and Lacks, D. J.: Electrostatic forces alter particle size distributions in atmospheric dust, Atmos. Chem. Phys., 20, 3181–3190, https://doi.org/10.5194/acp-20-3181-2020, 2020.
Twomey, S.: Introduction to the Mathematics of Inversion in Remote Sensing and Indirect Measurements, Elsevier Sci., New York, 243 pp., ISBN 9781483289564, 1977.
van der Does, M., Knippertz, P., Zschenderlein, P., Giles Harrison, R., and Stuut, J.-B. W.: The mysterious long-range transport of giant mineral dust particles, Sci. Adv., 4, eaau2768, https://doi.org/10.1126/sciadv.aau2768, 2018.
van de Hulst, H. C.: Light scattering by small particles. By H. C. van de Hulst. New York (John Wiley and Sons), London (Chapman and Hall), 1957. Pp. xiii, 470; 103 Figs.; 46 Tables. 96s, Q. J. Roy. Meteor. Soc. 1958, 84, 198–199, https://doi.org/10.1002/qj.49708436025, 1958.
Veselovskii, I., Kolgotin, A., Griaznov, V., Müller, D., Wandinger, U., and Whiteman, D. N.: Inversion with regularization for the retrieval of tropospheric aerosol parameters from multiwavelength lidar sounding, Appl. Optics, 41, 3685–3699, https://doi.org/10.1364/AO.41.003685, 2002.
Veselovskii, I., Kolgotin, A., Griaznov, V., Müller, D., Franke, K., and Whiteman, D. N.: Inversion of multiwavelength Raman lidar data for retrieval of bimodal aerosol size distribution, Appl. Optics, 43, 1180–1195, https://doi.org/10.1364/AO.43.001180, 2004.
Veselovskii, I., Dubovik, O., Kolgotin, A., Lapyonok, T., Di Girolamo, P., Summa, D., Whiteman, D. N., Mishchenko, M., and Tanré, D.: Application of randomly oriented spheroids for retrieval of dust particle parameters from multiwavelength lidar measurements, J. Geophys. Res.-Atmos., 115, D21203, https://doi.org/10.1029/2010JD014139, 2010.
Veselovskii, I., Goloub, P., Podvin, T., Bovchaliuk, V., Derimian, Y., Augustin, P., Fourmentin, M., Tanre, D., Korenskiy, M., Whiteman, D. N., Diallo, A., Ndiaye, T., Kolgotin, A., and Dubovik, O.: Retrieval of optical and physical properties of African dust from multiwavelength Raman lidar measurements during the SHADOW campaign in Senegal, Atmos. Chem. Phys., 16, 7013–7028, https://doi.org/10.5194/acp-16-7013-2016, 2016.
Veselovskii, I., Hu, Q., Goloub, P., Podvin, T., Korenskiy, M., Pujol, O., Dubovik, O., and Lopatin, A.: Combined use of Mie–Raman and fluorescence lidar observations for improving aerosol characterization: feasibility experiment, Atmos. Meas. Tech., 13, 6691–6701, https://doi.org/10.5194/amt-13-6691-2020, 2020.
Veselovskii, I., Hu, Q., Goloub, P., Podvin, T., Barchunov, B., and Korenskii, M.: Combining Mie–Raman and fluorescence observations: a step forward in aerosol classification with lidar technology, Atmos. Meas. Tech., 15, 4881–4900, https://doi.org/10.5194/amt-15-4881-2022, 2022.
Volten, H., Muñoz, O., Rol, E., de Haan, J. F., Vassen, W., Hovenier, J. W., Muinonen, K., and Nousiainen, T.: Scattering matrices of mineral aerosol particles at 441.6 nm and 632.8 nm, J. Geophys. Res.-Atmos., 106, 17375–17401, https://doi.org/10.1029/2001JD900068, 2001.
Wadell, H.: Volume, Shape, and Roundness of Quartz Particles, J. Geol., 43, 250–280, https://doi.org/10.1086/624298, 1935.
Wallace, J. M. and Hobbs, P. V.: Atmospheric science: an introductory survey, 2nd edn., Academic press, Amsterdam, Paris, https://doi.org/10.1016/C2009-0-00034-8, 2006.
Walser, A., Sauer, D., Spanu, A., Gasteiger, J., and Weinzierl, B.: On the parametrization of optical particle counter response including instrument-induced broadening of size spectra and a self-consistent evaluation of calibration measurements, Atmos. Meas. Tech., 10, 4341–4361, https://doi.org/10.5194/amt-10-4341-2017, 2017.
Wandinger, U., Freudenthaler, V., Baars, H., Amodeo, A., Engelmann, R., Mattis, I., Groß, S., Pappalardo, G., Giunta, A., D'Amico, G., Chaikovsky, A., Osipenko, F., Slesar, A., Nicolae, D., Belegante, L., Talianu, C., Serikov, I., Linné, H., Jansen, F., Apituley, A., Wilson, K. M., de Graaf, M., Trickl, T., Giehl, H., Adam, M., Comerón, A., Muñoz-Porcar, C., Rocadenbosch, F., Sicard, M., Tomás, S., Lange, D., Kumar, D., Pujadas, M., Molero, F., Fernández, A. J., Alados-Arboledas, L., Bravo-Aranda, J. A., Navas-Guzmán, F., Guerrero-Rascado, J. L., Granados-Muñoz, M. J., Preißler, J., Wagner, F., Gausa, M., Grigorov, I., Stoyanov, D., Iarlori, M., Rizi, V., Spinelli, N., Boselli, A., Wang, X., Lo Feudo, T., Perrone, M. R., De Tomasi, F., and Burlizzi, P.: EARLINET instrument intercomparison campaigns: overview on strategy and results, Atmos. Meas. Tech., 9, 1001–1023, https://doi.org/10.5194/amt-9-1001-2016, 2016.
Wang, X., Zhai, S., and Shen, L.: Cooling from aerosol–radiation interaction of anthropogenic coarse particles in China, Npj Clim. Atmospheric Sci., 7, 1–9, https://doi.org/10.1038/s41612-024-00773-4, 2024.
Weinzierl, B., Petzold, A., Esselborn, M., Wirth, M., Rasp, K., Kandler, K., Schütz, L., Koepke, P., and Fiebig, M.: Airborne measurements of dust layer properties, particle size distribution and mixing state of Saharan dust during SAMUM 2006, Tellus B, 61, 96–117, https://doi.org/10.1111/j.1600-0889.2008.00392.x, 2009.
Weinzierl, B., Sauer, D., Esselborn, M., Petzold, A., Veira, A., Rose, M., Mund, S., Wirth, M., Ansmann, A., Tesche, M., Gross, S., and Freudenthaler, V.: Microphysical and optical properties of dust and tropical biomass burning aerosol layers in the Cape Verde region – an overview of the airborne in situ and lidar measurements during SAMUM-2, Tellus B, 63, 589, https://doi.org/10.1111/j.1600-0889.2011.00566.x, 2011.
Weinzierl, B., Ansmann, A., Prospero, J. M., Althausen, D., Benker, N., Chouza, F., Dollner, M., Farrell, D., Fomba, W. K., Freudenthaler, V., Gasteiger, J., Groß, S., Haarig, M., Heinold, B., Kandler, K., Kristensen, T. B., Mayol-Bracero, O. L., Müller, T., Reitebuch, O., Sauer, D., Schäfler, A., Schepanski, K., Spanu, A., Tegen, I., Toledano, C., and Walser, A.: The Saharan Aerosol Long-Range Transport and Aerosol–Cloud-Interaction Experiment: Overview and Selected Highlights, B. Am. Meteorol. Soc., 98, 1427–1451, https://doi.org/10.1175/BAMS-D-15-00142.1, 2017.
Whitby, K. T.: THE PHYSICAL CHARACTERISTICS OF SULFUR AEROSOLS, in: Sulfur in the Atmosphere, edited by: Husar, R. B., Lodge, J. P., and Moore, D. J., Pergamon, 135–159, https://doi.org/10.1016/B978-0-08-022932-4.50018-5, 1978.
Wurzler, S., Reisin, T. G., and Levin, Z.: Modification of mineral dust particles by cloud processing and subsequent effects on drop size distributions, J. Geophys. Res.-Atmos., 105, 4501–4512, https://doi.org/10.1029/1999JD900980, 2000.
Xu, X. and Wang, J.: Retrieval of aerosol microphysical properties from AERONET photopolarimetric measurements: 1. Information content analysis, J. Geophys. Res.-Atmos., 120, 7059–7078, https://doi.org/10.1002/2015JD023108, 2015.
Yang, P. and Liou, K. N.: Geometric-optics–integral-equation method for light scattering by nonspherical ice crystals, Appl. Optics, 35, 6568–6584, https://doi.org/10.1364/AO.35.006568, 1996.
Yang, P. and Liou, K. N.: Light scattering by hexagonal ice crystals: solutions by a ray-by-ray integration algorithm, JOSA A, 14, 2278–2289, https://doi.org/10.1364/JOSAA.14.002278, 1997.
Yang, P., Liou, K. N., Mishchenko, M. I., and Gao, B.-C.: Efficient finite-difference time-domain scheme for light scattering by dielectric particles: application to aerosols, Appl. Optics, 39, 3727–3737, https://doi.org/10.1364/AO.39.003727, 2000.
Yu, H., Chin, M., Yuan, T., Bian, H., Remer, L. A., Prospero, J. M., Omar, A., Winker, D., Yang, Y., Zhang, Y., Zhang, Z., and Zhao, C.: The fertilizing role of African dust in the Amazon rainforest: A first multiyear assessment based on data from Cloud-Aerosol Lidar and Infrared Pathfinder Satellite Observations, Geophys. Res. Lett., 42, 1984–1991, https://doi.org/10.1002/2015GL063040, 2015.
Yurkin, M. A., Maltsev, V. P., and Hoekstra, A. G.: The discrete dipole approximation for simulation of light scattering by particles much larger than the wavelength, J. Quant. Spectrosc. Ra., 106, 546–557, https://doi.org/10.1016/j.jqsrt.2007.01.033, 2007.
Zhang, D. and Iwasaka, Y.: Size change of Asian dust particles caused by sea salt interaction: Measurements in southwestern Japan, Geophys. Res. Lett., 31, L15102, https://doi.org/10.1029/2004GL020087, 2004.
Zhou, C.: Coherent backscatter enhancement in single scattering, Opt. Express, 26, A508–A519, https://doi.org/10.1364/OE.26.00A508, 2018.