the Creative Commons Attribution 4.0 License.
the Creative Commons Attribution 4.0 License.
 | 02 Jul 2025
Pollution affects Arabian and Saharan dust optical properties in the eastern Mediterranean
Marilena Teri
Josef Gasteiger
Katharina Heimerl
Maximilian Dollner
Manuel Schöberl
Petra Seibert
Anne Tipka
Thomas Müller
Sudharaj Aryasree
Konrad Kandler
Bernadett Weinzierl
Uncertainties in the direct radiative effect of mineral dust result from the variability in its optical properties but are also influenced by mixing with anthropogenic aerosols (“pollution”), e.g., black carbon or sulfates. This study investigates the effect of mixing pollution with mineral dust from different source regions on the intensive optical properties. The Ångström exponents of scattering and absorption, the single-scattering albedo, and the asymmetry parameter are determined from in situ measurements during the A-LIFE aircraft field experiment over the eastern Mediterranean, where Arabian and Saharan dust mixed with pollution. Our results show that all intensive dust optical properties change significantly with increasing pollution content, while differences between Arabian and Saharan dust are not statistically significant. We discuss the implications of these results for the identification of mineral dust events and for their direct radiative effects. The pollution masks the mineral dust signal, which calls for caution when using Ångström exponents to identify mineral dust events. Furthermore, the asymmetry parameter and single-scattering albedo change from pure to polluted mineral dust layers (e.g., at 525 nm, median values decrease from 0.67 to 0.56 and from 0.96 to 0.89, respectively). These changes have opposing effects on the shortwave direct radiative effect efficiency (i.e., the direct radiative effect per unit of aerosol optical depth), potentially canceling each other out. Still, the effect can be significant depending on surface albedo. In conclusion, quantifying pollution content in mineral dust layers is essential for accurately assessing their local direct radiative effect.
- Article
(5671 KB) - Full-text XML
-
Supplement
(2239 KB) - BibTeX
- EndNote


Large amounts of mineral dust particles are emitted into the atmosphere by winds blowing over arid regions worldwide (Choobari et al., 2014). Once in the atmosphere, they can form layers at high altitudes and travel long distances (Weinzierl et al., 2017; Adebiyi et al., 2023). Mineral dust particles interact directly with solar and terrestrial radiation via scattering and absorption, as well as indirectly by altering the cloud properties. Consequently, mineral dust particles affect the Earth's energy budget and its climate system. The direct radiative effect of mineral dust is still uncertain due to significant uncertainties in its microphysical and optical properties (Kok et al., 2017; Li et al., 2021). This uncertainty contributes significantly to the overall uncertainty of the effective radiative effect of mineral dust (Kok et al., 2023).
The properties of mineral dust layers may be modified through aging and mixing processes (Riemer et al., 2019). For example, the mineral dust size distribution can change (e.g., Weinzierl et al., 2011) or the mineral dust layer can mix (e.g., Petzold et al., 2011; Denjean et al., 2016) with anthropogenic aerosol such as black carbon or fine particles (which we will refer to as “pollution” in this study). Black carbon particles, emitted from fossil and biomass fuel combustion, in particular, exhibit a higher absorption efficiency and different spectral behavior than mineral dust particles (Bond et al., 2013; Caponi et al., 2017). Hence, black carbon particles within mineral dust layers can play a critical role in enhancing the mineral dust absorption properties, resulting in a relatively greater impact on atmospheric heating compared to low-altitude black carbon particles, since their residence time at higher altitudes is longer (Seinfeld et al., 2004).
The aerosol direct radiative effect depends on the aerosol optical properties, in particular the particle extinction coefficient σep (the sum of the particle scattering and absorption coefficients), the asymmetry parameter g (i.e., the cosine-weighted average of the angular distribution of the scattered light; Andrews et al., 2006), and the single-scattering albedo (SSA) (the fraction of light extinction due to scattering). These aerosol optical properties are generally derived from remote sensing retrievals (e.g., Granados-Muñoz et al., 2019) or from in situ measurements of the particle size distribution via optical modeling (e.g., Kok et al., 2017). These methods require assumptions about aerosol types, refractive indices, and mixing states.
Direct in situ measurements of the particle scattering and absorption coefficients in the visible spectrum can be used to calculate intensive aerosol optical properties that allow a better understanding of the optical signature and the direct radiative effect of aerosol mixtures. These intensive aerosol optical properties include the wavelength dependence of the particle scattering and absorption coefficients and of the single-scattering albedo, known as the scattering, absorption, and single-scattering albedo Ångström exponents (SAE, AAE, and SSAAE), which provide near-real-time information on the aerosol types that impact the aerosol optical properties (e.g., Costabile et al., 2013; Cazorla et al., 2013; Cappa et al., 2016). Additionally, the asymmetry parameter (g) and the single-scattering albedo (SSA) are crucial for determining the intrinsic shortwave direct radiative effect of the aerosol mixture (e.g., Sherman et al., 2015).
These intensive aerosol optical properties are sensitive to different aerosol characteristics. The SAE is primarily related to the particle size (Ångström, 1929), with SAE <1 found for the predominance of coarse particles and SAE >2 for the predominance of fine particles (e.g., Schuster et al., 2006; Gyawali et al., 2012). The AAE is mainly linked to the particle composition (e.g., Liu et al., 2018), with AAE ∼1 for pure black carbon particles, since they absorb efficiently through the complete solar spectrum (e.g., Bond, 2001). Higher AAE values correspond to absorbing aerosol particles whose absorption increases with decreasing wavelength, such as mineral dust and organic matter (called brown carbon) aerosols (e.g., Petzold et al., 2009; Sandradewi et al., 2008; Russell et al., 2010; Valentini et al., 2020). The single-scattering albedo Ångström exponent (SSAAE) is sensitive to both aerosol size and composition. Thus, it has been proposed as an additional parameter indicating the presence of mineral dust particles (Collaud Coen et al., 2004). The asymmetry parameter g indicates the asymmetry of the angular distribution of scattered light, varying from 1 in the extreme case of light scattered exclusively in the forward direction to 0 for symmetric scattering. For atmospheric aerosol particles, g is typically in the range of about 0.4 to 0.8 and decreases with decreasing particle size (e.g., Horvath et al., 2018; Pandolfi et al., 2018). The SSA equals 1 if only purely scattering aerosols (e.g., sulfate) are present and decreases as more absorbing aerosols are present. Therefore, g considers the effect of particle sizes, and the SSA takes into account the effect of aerosol absorption on the direct radiative effect.
Several intensive field experiments, including airborne and ground-based measurements, have been performed to study the properties of mineral dust. The main focus so far has been on the properties of pure mineral dust layers close to the source region and after transport (e.g., Formenti et al., 2003, 2011a; Ryder et al., 2013; Denjean et al., 2016; Weinzierl et al., 2017; Adebiyi et al., 2023). The most comprehensive field experiment on the properties of Saharan dust was the Saharan Mineral Dust experiment (SAMUM). The first part of the field campaign (SAMUM-1; Heintzenberg, 2009) studied the properties of pure mineral dust in Morocco, whereas SAMUM-2 investigated far-transported, aged dust as well as its mixture with marine, urban, and biomass burning aerosols, pointing out the importance of further studies on mixtures of aerosols (Ansmann et al., 2011).
Meanwhile, several studies investigated the feasibility of using the Ångström exponents (SAE, AAE, and SSAAE) to detect mineral dust events in near-real time using ground-based in situ measurements (e.g., Collaud Coen et al., 2004; Valenzuela et al., 2015; Ealo et al., 2016). They found that the presence of mixtures may mask the signal of mineral dust particles and only strong mineral dust events can be detected. Therefore, for detecting mineral dust events at specific places, the intensive aerosol optical properties need to be evaluated and calibrated with previous sensitivity tests (Ealo et al., 2016).
Studies on mineral dust–pollution mixtures are sparse and conducted mainly in Asia (e.g., Clarke et al., 2004; Seinfeld et al., 2004; Yang et al., 2009), but a few field campaigns were also conducted in western Africa (Petzold et al., 2011; Denjean et al., 2020) and in the western Mediterranean (Mallet et al., 2016; Denjean et al., 2016). Large variability in the obtained results from different studies indicates that internal (Clarke et al., 2004; Quinn et al., 2004) or external (Shi et al., 2003; Song et al., 2005) mixtures of black carbon and mineral dust may significantly change the optical properties of mineral dust layers. Additionally, different source regions may be affected differently by the mixing with pollution. Petzold et al. (2011) showed that a pollution plume from the city of Dakar had a significant influence on the particle size distribution and absorption properties of mineral dust particles, whereas the absorption Ångström exponent was still dominated by the mineral dust fraction. In Casablanca, a different scenario was observed with an AAE value of ∼1 despite the high mineral dust concentrations (Petzold et al., 2009). In Asia, Seinfeld et al. (2004) found that carbonaceous components in the mineral dust layers changed the SSA from 0.97 to 0.85 at 550 nm. Similarly, in West Africa, Denjean et al. (2020) measured enhanced aerosol light absorption in mineral dust layers due to mixing with pollution, leading to a decrease in SSA from 0.92 to 0.81. On the contrary, in the western Mediterranean, Denjean et al. (2016) observed moderately absorbing mineral dust layers with SSA values between 0.90 and 1.00 at 530 nm, indicating that the Saharan dust optical properties were not significantly affected by mixing with pollution. In proximity to Arabian and Saharan dust source regions, Kim et al. (2011) investigated aerosol optical properties based on AERONET observations, finding no systematic difference in the optical properties of pure Arabian and Saharan dust. Nevertheless, their analysis suggests that the optical properties of mineral dust mixtures may be affected differently depending on the source regions.
In conclusion, mixtures of black carbon and mineral dust may significantly change the optical properties of mineral dust layers. These changes can have consequences for identifying mineral dust layers by using the Ångström exponents (SAE, AAE, and SSAAE) (e.g., Collaud Coen et al., 2004; Valenzuela et al., 2015; Ealo et al., 2016) and for the direct radiative effect by influencing g and SSA (e.g., Seinfeld et al., 2004; Denjean et al., 2020). However, optical properties of mineral dust from various source regions may be affected differently by mixing with pollution (Seinfeld et al., 2004; Denjean et al., 2016; Kok et al., 2023) and this influence needs to be further investigated.
In April 2017, the A-LIFE (2017) (Absorbing aerosol layers in a changing climate: aging, lifetime, and dynamics, https://www.a-life.at, last access: 3 February 2025) aircraft field experiment investigated the aerosol properties in the eastern Mediterranean (Weinzierl et al., 2025). The region is an atmospheric crossroad and a pollution hot spot (Zittis et al., 2022), where aerosols of different origins (natural vs anthropogenic) co-exist, including mineral dust from the two nearby deserts (the Arabian Peninsula and the Saharan desert) as well as local and transported pollution (e.g., Dayan et al., 2017). We focus on the intensive aerosol optical properties measured airborne during the A-LIFE field experiment.
The main goal of this paper is to analyze how the mixing of mineral dust and pollution impacts the intensive optical properties of mineral dust and whether these impacts vary depending on the source region of mineral dust. Specifically, we aim to investigate how mineral dust–pollution mixtures affect existing aerosol classification schemes and modify the direct radiative effect of the mineral dust. Thus, we investigate intensive aerosol optical properties that are relevant for the identification of aerosol types, i.e., the scattering, absorption, and single-scattering albedo Ångström exponents (SAE, AAE, SSAAE). We also study intensive aerosol optical properties that are relevant for the understanding of the aerosol radiative effect, i.e., the asymmetry parameter and the single-scattering albedo (g and SSA). In addition, we use a simple formula by Haywood and Shine (1995) to estimate the change in the shortwave direct radiative effect efficiency (SW DREE) at the top of the atmosphere due to increasing pollution content in the mineral dust layer.
To investigate the influence of mixing mineral dust and pollution on the intensive aerosol optical properties, we analyzed data collected in spring 2017 on board the DLR Falcon 20 E-5 aircraft during the field experiment of the ERC-funded A-LIFE (2017) project (Absorbing aerosol layers in a changing climate: aging, lifetime, and dynamics, https://www.a-life.at, last access: 3 February 2025). The particle scattering and absorption coefficients measured directly in Arabian and Saharan dust layers were used to derive intensive aerosol optical properties, including the scattering, absorption, and single-scattering albedo Ångström exponents (SAE, AAE, and SSAAE), the single-scattering albedo (SSA), the asymmetry parameter (g), and the shortwave direct radiative effect efficiency (SW DREE). Since data with different relative contributions of mineral dust and black carbon are available, we used the microphysical properties to quantify the pollution content within mineral dust layers. Thus, we investigated the relationships between each intensive aerosol optical property and the aerosol microphysical properties. Additionally, we investigated the differences in these relationships for two different source regions of mineral dust (namely, the Arabian Peninsula and the Saharan desert). The following subsections describe the A-LIFE aircraft field experiment, the instrumentation relevant for this study, and how the data were analyzed.
2.1 The A-LIFE aircraft field experiment in the eastern Mediterranean
The A-LIFE aircraft field experiment conducted ground-based and airborne measurements with the aim of investigating the properties of absorbing aerosol mixtures, with a focus on mineral dust–black carbon mixtures. The airborne measurements were carried out on board the Deutsches Zentrum für Luft- und Raumfahrt (DLR) research aircraft Falcon 20-E5, and the aircraft was based at the Paphos airport in the southwest of Cyprus (34.7° N, 32.5° E). This location allowed access to the eastern Mediterranean region and to mineral dust layers originating from the two nearby deserts, the Arabian Peninsula in the Middle East and the Saharan desert in northern Africa, as well as to anthropogenic pollution (Weinzierl et al., 2025).
Figure 1 shows the flight paths of the 22 research flights. Apart from the two test flights in central Europe and the transfer flights from the DLR airport to the Paphos aircraft base in Cyprus, most of the flights were conducted over the eastern Mediterranean, close to Cyprus, but also in the area of Crete and Malta. The background of Fig. 1 is a natural-color satellite image from 27 April 2017, showing the influence of the regional aerosol loading by mineral dust from the two nearby deserts. Mineral dust from the Arabian Peninsula impacts the eastern parts of the Mediterranean basin, while mineral dust from the Sahara influences the central part of the Mediterranean basin.
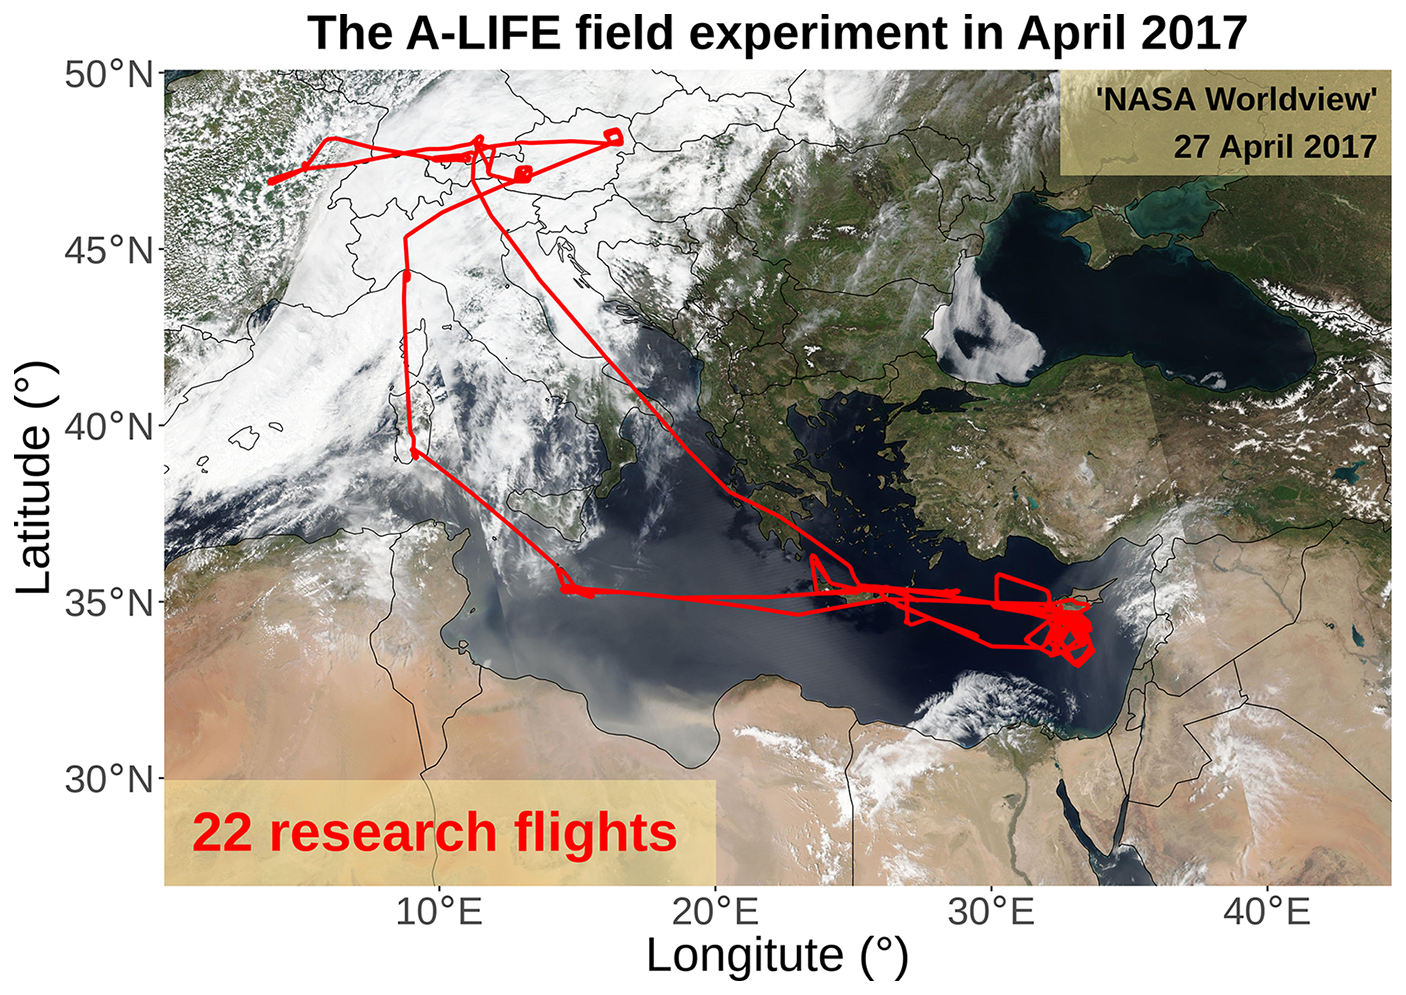
Figure 1The A-LIFE field experiment in April 2017. The red line indicates the flight path of the 22 research flights performed during the A-LIFE field experiment on board the Deutsches Zentrum Luft- und Raumfahrt (DLR) research aircraft Falcon 20 E-5. The background is a natural-color satellite image (26.9–50.1° N, 0.0–44.5° E) from 27 April 2017 (source: NASA Worldview, https://worldview.earthdata.nasa.gov/, last access: 3 February 2025).
During the field experiment, several outbreaks of Arabian and Saharan dust occurred and the elevated mineral dust layers were also mixed with local and transported anthropogenic pollution, allowing the investigation of mineral dust–pollution mixtures. A detailed description of the field experiment and the meteorological conditions influencing the measurements can be found in the A-LIFE overview paper (Weinzierl et al., 2025).
2.2 Instrumentation
For the A-LIFE field experiment, the DLR aircraft Falcon 20 E-5 was equipped with comprehensive in situ aerosol instrumentation, a wind lidar, and impactors for subsequent chemical analysis of the filter samples. Most in situ aerosol instruments were deployed in the Falcon aircraft cabin behind an aerosol inlet and transport system (in-cabin). The cut-off diameter of the Falcon aerosol sampling system ranges between 2.4 and 6.4 µm, as characterized in detail in Schöberl et al. (2024). A list of the in-cabin and wing-mounted instruments is available in the Supplement of (Schöberl et al., 2024).
Instrumentation relevant for this study includes an in-cabin polar integrating nephelometer (Aurora 4000 nephelometer, Ecotech – now Aecom, Australia) and the in-cabin Tricolor Absorption Photometer (TAP, Brechtel Manufacturing Inc., Hayward, USA), which measured the particle scattering and absorption coefficients at three wavelengths. An in-cabin single-particle soot photometer (SP2, Droplet Measurement Technologies Inc. – DMT, Longmont, CO, USA) measured the mass and size of individual refractory black carbon particles and provides the mass concentration of refractory black carbon.
The particle size distribution was determined from a combination of instruments with overlapping size ranges: the total number concentration of particles was measured with an in-cabin condensation particle counter (TSI CPC, model 3760a, TSI Inc.). Size-resolved particle number concentration was measured with an in-cabin optical particle counter (SkyOPC, model 1.129, GRIMM Aerosol Technik, Ainring, Germany) and two wing-mounted optical spectrometers, the Ultra High Sensitivity Aerosol Spectrometer-Airborne (UHSAS-A, DMT) and the Cloud and Aerosol Spectrometer (UNIVIE CAS), which is part of University of Vienna's second-generation Cloud, Aerosol, and Precipitation Spectrometer (UNIVIE CAPS, DMT).
In situ aerosol samples were collected in the Falcon aircraft cabin on transmission electron microscope (TEM) grids and boron substrates using a micro-inertial impactor (MINI), sampling particles with aerodynamic diameters above and below 1 µm (Kandler et al., 2007). The morphology and elemental composition of individual particles, with a projected area diameter ranging from 0.5 to 3.0 µm, were analyzed using an environmental scanning electron microscope (FEI ESEM Quanta 400 FEG, Eindhoven, the Netherlands) coupled with an X-Max 150 energy-dispersive X-ray spectroscopy (EDX) detector (Oxford). For selected samples, the mixing state of particles with projected area diameter smaller than 0.5 µm was obtained using a transmission electron microscope (CM20 TEM, Philips, Eindhoven, the Netherlands).
2.3 Data analysis
For consistent analysis of the A-LIFE dataset, flight time series were divided into 262 sequences, corresponding to flying periods at constant altitude, in the same air mass, and out of clouds (Murphy et al., 2004; Dollner et al., 2024). All data were averaged along these sequences and converted to standard temperature and pressure conditions (STP; 273.15 K, 1013.25 hPa). Data analysis for each instrument is described in the following sections.
2.3.1 Directly measured aerosol optical properties
This work focuses on understanding the aerosol optical properties measured directly on board the Falcon research aircraft during A-LIFE by the Aurora 4000 nephelometer and the TAP, both installed in-cabin. Therefore, the measured aerosol optical properties are the optical properties of the aerosol passing through the Falcon sampling system (Schöberl et al., 2024). Details on the operation and data analysis of the Aurora 4000 nephelometer and the TAP are reported in the Supplement (Sects. S1 and S2).
The Aurora 4000 nephelometer measured the in-cabin particle scattering coefficients of four angular sectors (from α to 180°, with ) at three wavelengths λ: blue (450 nm), green (525 nm), and red (635 nm). Several calibrations with particle-free air and CO2 were performed, and the data were corrected following Anderson and Ogren (1998). The total particle scattering coefficients (σsp,λ) were obtained by correcting for angular truncation and illumination as indicated in Teri et al. (2022). The overall uncertainty in σsp,λ was calculated to be within ∼ 13 %–30 % for sequence averages considered in this work.
The TAP measured the in-cabin particle absorption coefficient (σap,λ) at three different wavelengths: blue (465 nm), green (520 nm), and red (640 nm). σap,λ was corrected for filter loading and scattering effects with the Virkkula et al. (2005) and Virkkula (2010) correction scheme for the widely used glass-fiber Pallflex E70-2075W filters. According to Davies et al. (2019), we assumed an uncertainty in σap,λ of 40 % for all three wavelengths.
To ensure the accuracy of the data we performed calibrations and data quality controls as reported in Sect. S2. In particular, a strong correlation (R2>0.92 for all three wavelengths) was found between the particle absorption coefficient and the mass concentration of refractory black carbon (Fig. S1). The slopes obtained from the linear regression analysis (19.4, 15.9, and 10 m2 g−1 for the blue, green, and red wavelength, respectively) are consistent with the literature values of the black carbon mass absorption coefficient (e.g., Ohata et al., 2021). The slightly higher values obtained from our measurements and the observed wavelength dependence are consistent with the presence of the additional contribution of mineral dust absorption. This comparison indicates good quality of the particle absorption coefficient measurements.
2.3.2 Intensive aerosol optical properties calculated from direct measurements
Our investigation focused on the intensive aerosol optical properties derived from the Aurora 4000 nephelometer and TAP measurements. In particular, we calculated intensive aerosol optical properties that have been extensively used in the literature (e.g., Cappa et al., 2016) to distinguish between different aerosol types, such as the scattering, absorption, and single-scattering albedo Ångström exponent (SAE, AAE, SSAE), and intensive aerosol optical properties that are important for understanding and estimating the aerosol direct radiative effect (e.g., Haywood and Shine, 1995; Sherman et al., 2015), such as the asymmetry parameter (g) and the single-scattering albedo (SSA), as well as the shortwave direct radiative effect efficiency (SW DREE). An overview of the optical properties used in this study is given in Table A1 in the Appendix.
The scattering Ångström exponent (SAE), which represents the wavelength dependence of the particle scattering coefficient (Ångström, 1929), was calculated by using the total particle scattering coefficients σsp,λ measured by the Aurora 4000 nephelometer at blue and red wavelengths (i.e., λB=450 nm and λR=635 nm) as
The absorption Ångström exponent (AAE), which represents the wavelength dependence of the particle absorption coefficient, was calculated by using the particle absorption coefficients σap,λ measured by the TAP at blue and red wavelengths (i.e., λB=465 nm and λR=640 nm) as
The single-scattering albedo Ångström exponent (SSAAE), which represents the wavelength dependence of the single-scattering albedo, was calculated according to Moosmüller and Chakrabarty (2011) as
where EAE is the extinction Ångström exponent calculated at blue and red wavelengths of the Aurora 4000 nephelometer (i.e., λB=450 nm and λR=635 nm) by using a formula analogous to Eq. (1). The extinction coefficient σep,λ was calculated as the sum of σsp,λ and σap,λ measured by the Aurora 4000 nephelometer and by the TAP, respectively.
We did not apply any correction for the small difference in the wavelengths of the two instruments, since the centroid wavelengths differ less than the full width at half maximum (FWHM) specified by the manufacturer, and we assumed the correction to be negligible.
The asymmetry parameter g, which is the cosine-weighted average of the angular distribution of scattered light (Andrews et al., 2006), was calculated at wavelength λ using the particle scattering coefficients measured by the Aurora 4000 nephelometer at different angular sectors (, with ) following the method developed by Müller et al. (2012):
The first part of the function is analogous to the definition of the asymmetry parameter. The parameters were found by comparison with the result from scattering theory considering different aerosol types including different sizes and shapes (Müller et al., 2012).
The single-scattering albedo (SSA), which is the fraction of the light extinction that is due to scattering, was calculated at wavelength λ using the total particle scattering coefficient measured by the Aurora 4000 nephelometer σsp,λ and the particle absorption coefficient σap,λ measured by the TAP as
The asymmetry parameter (g) and the single-scattering albedo (SSA) are key parameters for understanding the aerosol direct radiative effect. We used the g and SSA values measured during A-LIFE for a first estimation of the aerosol direct radiative effect. We used a simple formula derived by Charlson et al. (1991) and Haywood and Shine (1995) for calculating the aerosol shortwave direct radiative effect efficiency (SW DREE) at the top of the atmosphere for an optically thin, partially absorbing atmosphere.1
The SW DREE is the shortwave direct radiative effect (SW DRE) per unit aerosol optical depth (AOD) and is to the first order independent of AOD:
where D is the fractional day length, S0 is the solar constant, Tatm is the atmospheric transmission, Ac is the cloud fraction, Rs is the spectrally averaged surface albedo, SSA is the particle single-scattering albedo, and β is the particle average upscatter fraction, i.e., the fraction of the incident solar radiation that is scattered upward to space. β can be obtained from g by using the relationship (Wiscombe and Grams, 1976).
For the non-aerosol-related parameters we used D=0.50, , Tatm=0.76, Ac=0.60, and Rs=0.15 as suggested by Haywood and Shine (1995). Since the values of gλ and SSAλ calculated via Eqs. (4) and (5) are the values measured for the aerosol passing through the Falcon sampling system, they are representative of the in-cabin particle number size distributions (NSDs; see section 2.3.3). We applied a correction factor to obtain the values of gλ,ambient and SSAλ,ambient representative of the ambient NSDs. We used gλ,ambient and SSAλ,ambient at the green wavelength λ=525 nm to calculate the SW DREE. A detailed description of the method used to extend the optical properties is in Sect. S3.
Although the values obtained from this simplified formula have large uncertainties compared to more advanced radiative transfer calculations, as reported by Wendisch et al. (2001) and Yu et al. (2006), its functional relationship though the SW DREE dependence on SSA and g remains valid. If all other parameters are kept constant, this equation can be used to compare the intrinsic radiative effect efficiency of aerosol at the top of the atmosphere (TOA), as widely done in the literature (e.g., Sheridan and Ogren, 1999; Virkkula et al., 2011; Sherman et al., 2015; Shen et al., 2018; Hu et al., 2023).
2.3.3 Aerosol microphysical properties
In this work, we use the microphysical aerosol properties measured during A-LIFE on board the Falcon research aircraft. An overview of the microphysical properties used for the analysis of this study is given in Table A2 in the Appendix.
The mass concentration of refractory black carbon (MrBC) and the mixing state of rBC were measured by the SP2 installed in the cabin of the DLR Falcon research aircraft. The SP2 calibration was performed with fullerene soot as recommended by Schwarz et al. (2010), and the detection range for rBC particles was 70–980 nm mass equivalent diameter, assuming void-free spheres with a bulk density of 1.8 g cm−3 (Moteki et al., 2010) for rBC particles. Although the uncertainty of the calibration fit was found to be about 10 %, we assumed an MrBC uncertainty of 25 % as recommended by Schwarz et al. (2008). Additionally, rBC particles with a heavy coating were identified by comparing the delay time between the incandescent light signals and the scattering light signal.
The number concentration of coarse-mode aerosol (Ncoarse) as well as the coarse-mode size distribution was measured in the nominal size range 0.5–50 µm by the wing-mounted UNIVIE CAS. Details of the calibration and data analysis for this instrument are provided in Dollner et al. (2024) and Spanu et al. (2020).
For each A-LIFE flight sequence, the particle number size distribution representing the size range passing through the inlet system (in-cabin NSD) was derived from a combination of measurements with TSI CPC, UHSAS-A, and SkyOPC and parameterized with a combination of three lognormal distributions. The size distribution of the ambient aerosol (ambient NSD) additionally includes measurements from the UNIVIE CAS and covers full the size range from 10 nm to 50 µm. For details see Table A2 in the Appendix.
Mass concentrations for various size ranges were derived from these two sets of NSDs by assuming particles with a spherical shape and density based on the modeled aerosol composition. In particular, we calculated the mass concentration of sub-µm particles (Msub-µm), the mass concentration of super-µm particles passing through the inlet system (Msuper-µm in-cabin), and the mass concentration of super-µm particles including the measurements of the wing-mounted CAS instrument (Msuper-µm ambient).
The chemical composition of single particles was obtained from the offline analysis of in situ samples collected during the A-LIFE research flights. Particles with projected area diameter ranging from 0.5 to 3 µm were analyzed using the environmental scanning electron microscope (ESEM), obtaining their morphology and elemental composition. Particles with projected area diameter smaller than 0.5 µm were analyzed using the transmission electron microscope (TEM), obtaining the mixing state of particles for a few selected samples. The composition and mixing state of aerosol particles during A-LIFE are discussed in Sect. 2.3.6. The composition of individual mineral dust particles with projected area diameter ranging from 0.5 to 3 µm was derived using the ESEM coupled with the energy-dispersive X-ray spectroscopy (EDX) detector, and the mineral dust optical properties for each sample were derived using an empirical approach (Di Biagio et al., 2019; Aryasree et al., 2024). Details and results of this analysis are provided in Sect. S4.
2.3.4 A-LIFE aerosol classification
During the A-LIFE field experiment, all research flights followed a similar pattern: first, the Falcon aircraft climbed to high altitude to probe the structure of the atmosphere with a wind lidar, and then the aircraft descended to lower altitudes with a step profile, followed by further stepwise ascents and descents. With this approach, 262 measurement sequences at constant altitude outside of clouds were defined. For the investigation of the aerosol properties of different aerosol types, the 262 flight sequences were classified into four main aerosol types, each with three subtypes, using the A-LIFE classification scheme (Weinzierl et al., 2025). First, the A-LIFE classification scheme distinguishes measurement periods inside mineral dust layers from other aerosol layers based on the presence of coarse-mode particles measured with UNIVIE CAS and on model results from the Lagrangian dispersion model FLEXPART, which was run in backward mode (Stohl et al., 1998; Seibert and Frank, 2004; Pisso et al., 2019) with emission data from the Copernicus Atmospheric Monitoring Service (CAMS; Morcrette et al., 2009; CAMS, 2019). Mineral dust layers are further classified as Saharan or Arabian dust depending on the origin of the majority of the mineral dust mass modeled with FLEXPART. This classification resulted in 174 sequences with and 88 sequences without a major contribution of mineral dust. Sequences without a major mineral dust contribution are separated into mixtures with an enhanced and low coarse-mode contribution based on observations of the UNIVIE CAS instrument. Additional distinctions for all four main types (Saharan dust, Arabian dust, mixture with coarse mode, and mixture with a low or no coarse mode) are made to study the aerosol properties for different pollution contents. The mass concentration of refractory black carbon (MrBC), as measured by the SP2, is chosen as a proxy for pollution. The degree of pollution is established based on the ratio between the coarse-mode aerosol number concentration (Ncoarse), as measured by the UNIVIE CAS, and MrBC. Thus, based on the pollution degree , each sequence is assigned to a pollution subtype (pure, moderately polluted, polluted). The A-LIFE aerosol classification was validated by comparison with the single-particle chemical composition obtained from the offline analysis of in situ samples collected during the A-LIFE research flights. Details about the A-LIFE aerosol classification can be found in Weinzierl et al. (2025).
2.3.5 Statistical analysis approach
For this study, the A-LIFE dataset was restricted to sequences in the eastern Mediterranean with a major mineral dust contribution according to the A-LIFE aerosol classification and with available intensive aerosol optical properties. Thus, we could investigate the intensive aerosol optical properties for a total of 87 sequences, among which 37, 40, and 10 sequences are classified as pure mineral dust, moderately polluted mineral dust, and polluted mineral dust, respectively. The sequences classified as Saharan dust and Arabian dust are not evenly distributed among subgroups: 35 (2) sequences are classified as pure Saharan (Arabian) dust and pure Arabian dust, 32 (8) as moderately polluted Saharan (Arabian) dust and moderately polluted Arabian dust, and 10 as polluted Arabian dust, while no sequence classified as polluted Saharan dust was available. Due to the uneven distribution of available sequences among the three subgroups from the A-LIFE classifications scheme, it was necessary to analyze the change rate of each property with increasing pollution content not only for the three subtypes, but also with a continuum variable. For this continuum variable, we chose a mass ratio which is a dimensionless quantity. Since the mass concentration of refractory black carbon (MrBC) is a tracer for pollution, we used the ratio between MrBC and the mass of super-µm aerosol particles as a measure of the pollution contribution within the mineral dust layer. We used the mass of super-µm aerosol particles that pass the aerosol inlet system (Msuper-µm in-cabin) because the intensive aerosol optical properties were also measured inside the aircraft cabin. For the analysis of change rates of the intensive aerosol optical properties representative of the ambient NSDs in the full size range (i.e., gλ,ambient, SSAλ,ambient, and SW DREE; see Sect. S3), we used the mass of super-µm aerosol particles in the diameter size range 1–50 µm (Msuper-µm ambient).
Figure 2 shows the relationship between the pollution content in terms of mass and the A-LIFE aerosol classification scheme. Sequences classified as pure mineral dust have low values of (see panel a) and (see panel b). In contrast, both ratios have higher values for sequences classified as moderately polluted and polluted mineral dust. Thus, the pollution content increases as these ratios increase.
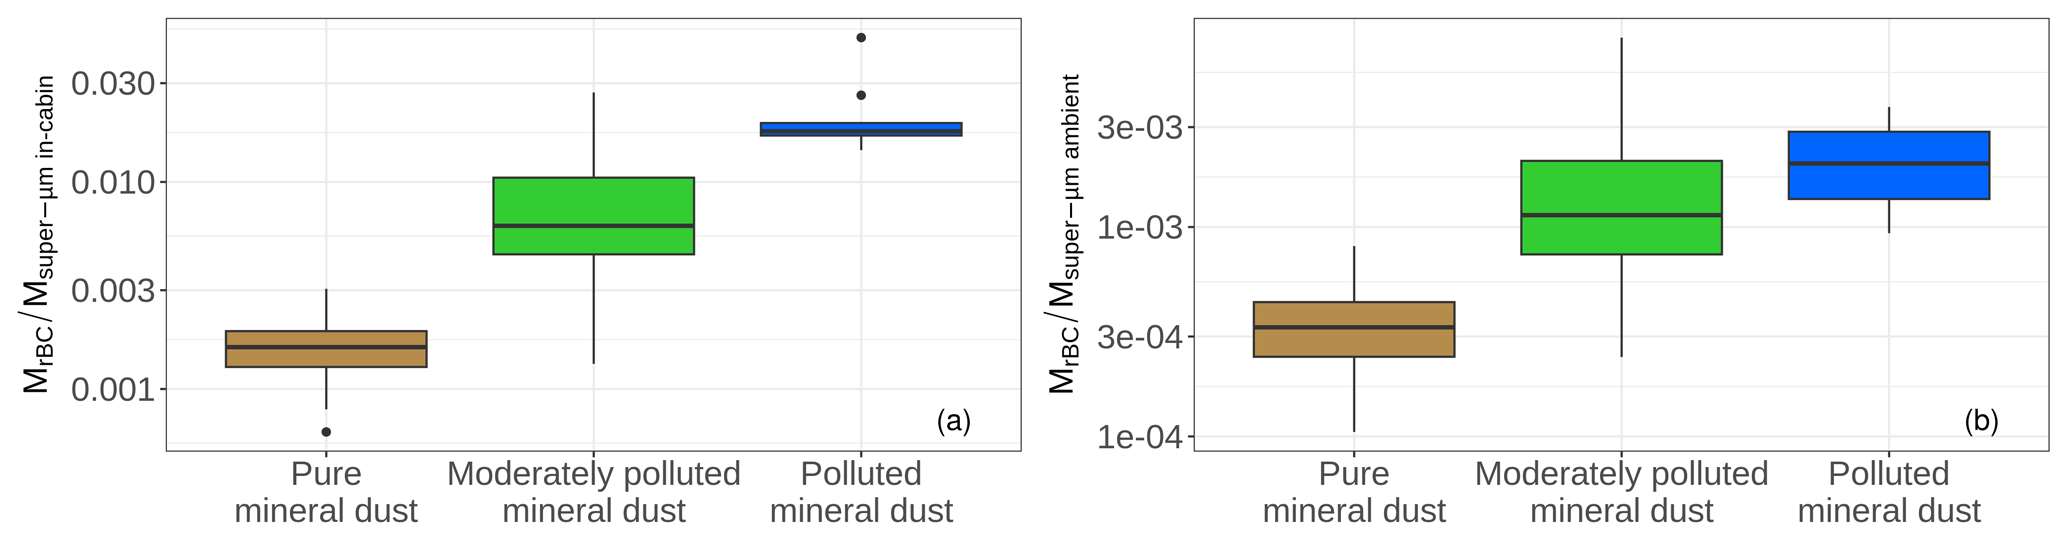
Figure 2Box plot of the pollution contribution in terms of mass for the three subtypes: pure dust (brown), moderately polluted dust (green), and polluted dust (blue) according to the A-LIFE aerosol classification. Panel (a) shows the pollution contribution in terms of mass for aerosol particles passing the Falcon aerosol sampling system (). Panel (b) shows the pollution contribution in terms of mass for the ambient NSD. The plots show results for 87 sequences, among which 37, 40, and 10 are classified as pure mineral dust, moderately polluted mineral dust, and polluted mineral dust, respectively. The boxes indicate the interquartile range (IQR 25th–75th), the horizontal lines the median, and the whiskers the largest value that is not greater than 1.5 ⋅ IQR; data points outside this range are shown as single dots.
A higher pollution content also corresponds to a higher relative mass contribution of fine-mode aerosols (sub-µm particles). Figure 3 shows the comparison between the mass of the sub-µm aerosols (Msub-µm) and MrBC in panel (a) and between their contributions relative to the mass of super-µm aerosol on a log–log scale in panel (b). Msub-µm is almost 2 orders of magnitude larger than MrBC, indicating the presence of a large number of small particles other than black carbon. These sub-µm particles can be other anthropogenic particles, such as sulfate, nitrates, or organics, as suggested by the relatively high correlation (r=0.59) between the mass concentration of particles and MrBC. However, a fraction of these sub-µm particles also likely includes mineral dust (see also Fig. 5a). The slope of the linear regression line for pure mineral dust is significantly higher than those for moderately polluted and polluted mineral dust. The correlation coefficients for each subtype are also higher: r=0.91 for pure, 0.79 for moderately polluted, and 0.97 for polluted mineral dust compared to the grouped value. This difference can be due to the impact of sub-µm mineral dust particles, which influence the ratio more in the case of pure mineral dust than in the polluted case.
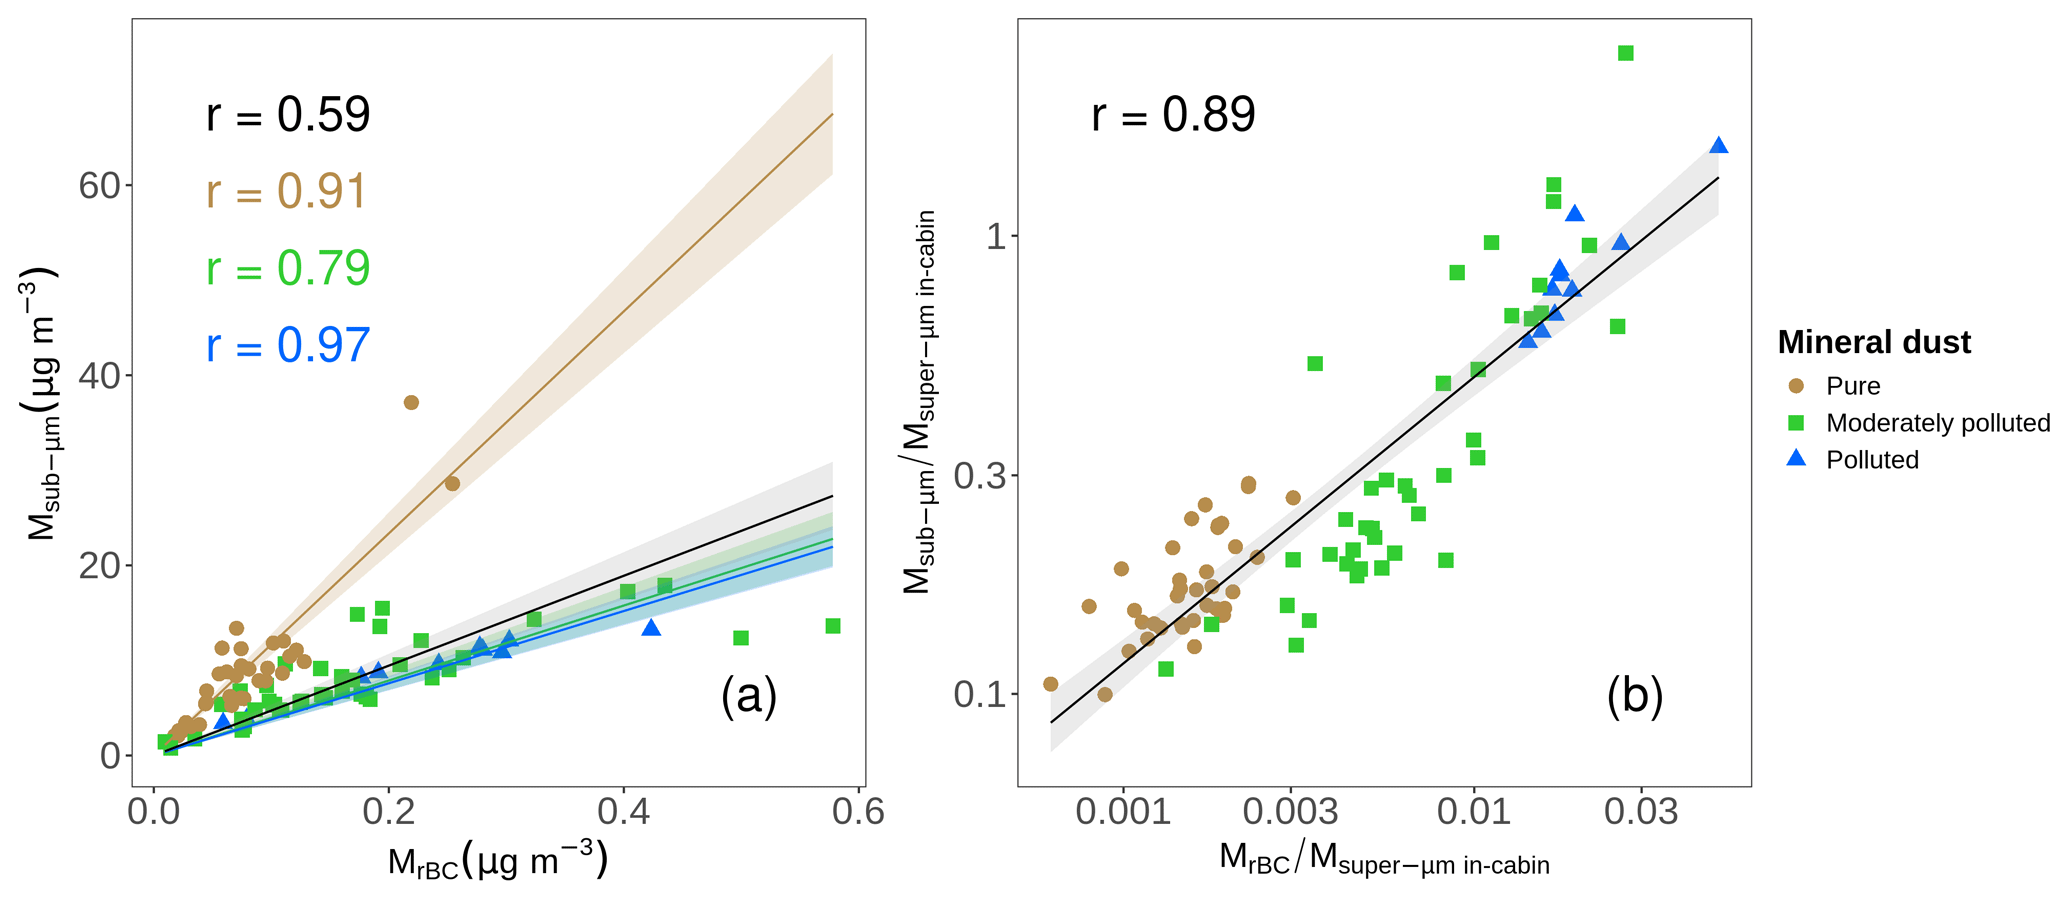
Figure 3Mass of sub-µm particles and mass of refractory black carbon. Panel (a) shows the comparison between the mass of sub-µm particles (Msub-µm) and the mass of refractory black carbon (MrBC). Panel (b) shows the comparison on a log–log scale between the contribution of particle size in terms of mass () and the pollution contribution in terms of mass (), where Msuper-µm in-cabin is the mass of super-µm particles passing through the aerosol inlet of the DLR Falcon aircraft (Schöberl et al., 2024). The plots show results for 87 sequences, among which 37, 40, and 10 are classified as pure mineral dust, moderately polluted mineral dust, and polluted mineral dust, respectively, following the A-LIFE aerosol classification as indicated by the color code. Pearson's correlation coefficients r and correlation lines are provided in each panel, in black considering all the points and following the color code when considering the pollution subtypes individually.
Nevertheless, the high correlation coefficient between the ratios and (r=0.89) indicates the equivalence of choosing one of these two ratios as a measure of the pollution contribution in terms of mass within the mineral dust layer. Due to the skewed distribution of the data, a log transformation is performed and log is used to evaluate the change rate of aerosol properties for increasing pollution content within the mineral dust layer.
2.3.6 Composition and mixing state of aerosol particles during the A-LIFE field experiment
Not only the pollution content within a mineral dust layer can affect its optical properties, but also the mixing state of the aerosol (internal versus external mixture), might have an influence. For example, the absorption of BC particles is enhanced when a coating is present on them (e.g., Liu et al., 2015). In addition, the use of a simplified mixing state in model simulations can lead to significant uncertainties in the derived optical properties (Yao et al., 2022). Thus, the particle morphology and elemental composition were investigated using electron microscopy techniques.
Figure 4 shows examples of images of different aerosol particle types collected during the A-LIFE field experiment for three randomly selected samples, collected in pure, moderately polluted, and polluted mineral dust. The images were obtained with the transmission electron microscope (TEM) for particles with projected area diameter smaller than 0.5 µm (on the left) and with the environmental scanning electron microscope (ESEM) for particles with projected area diameters ranging from 0.5 to 3 µm (on the right). TEM images reveal individual and mixed particles, i.e., sulfate, soot, and mineral dust particles, but also soot with a sulfate coating in core–shell structures, while ESEM images primarily show mineral dust particles.
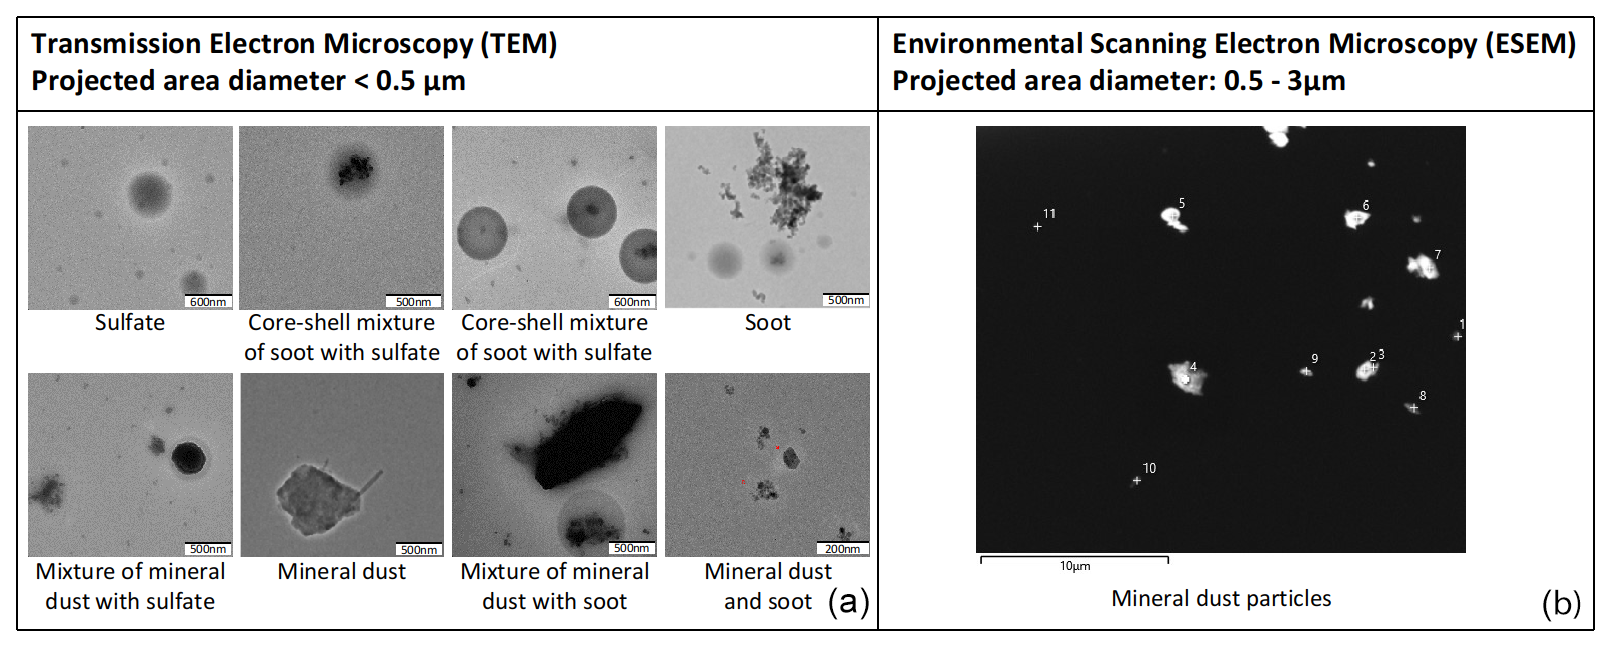
Figure 4Examples of images of different aerosol particle types and their mixing state from three randomly selected samples, collected during measurements in pure, moderately polluted, and polluted mineral dust. The figure shows images of particles collected during the A-LIFE field experiment and observed with the transmission electron microscope for particles with projected area diameter smaller than 0.5 µm (a) and with the environmental scanning electron microscope for particles with projected area diameter in the range 0.5–3.0 µm (b).
Figure 5 shows a quantitative analysis of the different particle types and mixing states for the same three samples shown in Fig. 4. The two graphs report values obtained for projected area diameter smaller than 0.5 µm and in the range 0.5–3 µm, respectively. In the larger diameter range, mineral dust is the predominant particle type observed in all three samples. This result is consistent with observations from other samples collected during the A-LIFE field experiment. Additionally, the analysis revealed that between 2 % and 10 % of the collected mineral dust particles were found in internal mixtures with sulfate. Previous studies conducted on Saharan dust in near-source and outflow regions (Usher et al., 2002; Kandler et al., 2011, 2020) demonstrated that internal mixtures of mineral dust with sulfate particles are frequently observed in polluted environments and they are often due to heterogeneous reactions. In the smaller diameter range, mineral dust particles mixed with soot, sulfate, or other components were less than 1 %, and the particle composition varied notably across the three samples. The pure mineral dust sample contained over 80 % of mineral dust particles, with minor amounts of soot and sulfate particles. In contrast, the polluted mineral dust sample had over 60 % of soot particles and around 3 % in a core–shell structure of soot coated with sulfate. The moderately polluted sample contained approximately 70 % spherical sulfate particles, along with around 20 % of soot particles coated with sulfate in a core–shell structure. The core–shell particle amounts observed in transmission electron microscope images align with SP2 results. Figure 6 shows the fraction of rBC particles with a heavy coating across the 87 sequences considered in this study. The coated fraction is less than ∼ 5 % in half of the sequences and below ∼ 20 % in all, making the three samples representative of rBC mixing states across all sequences.
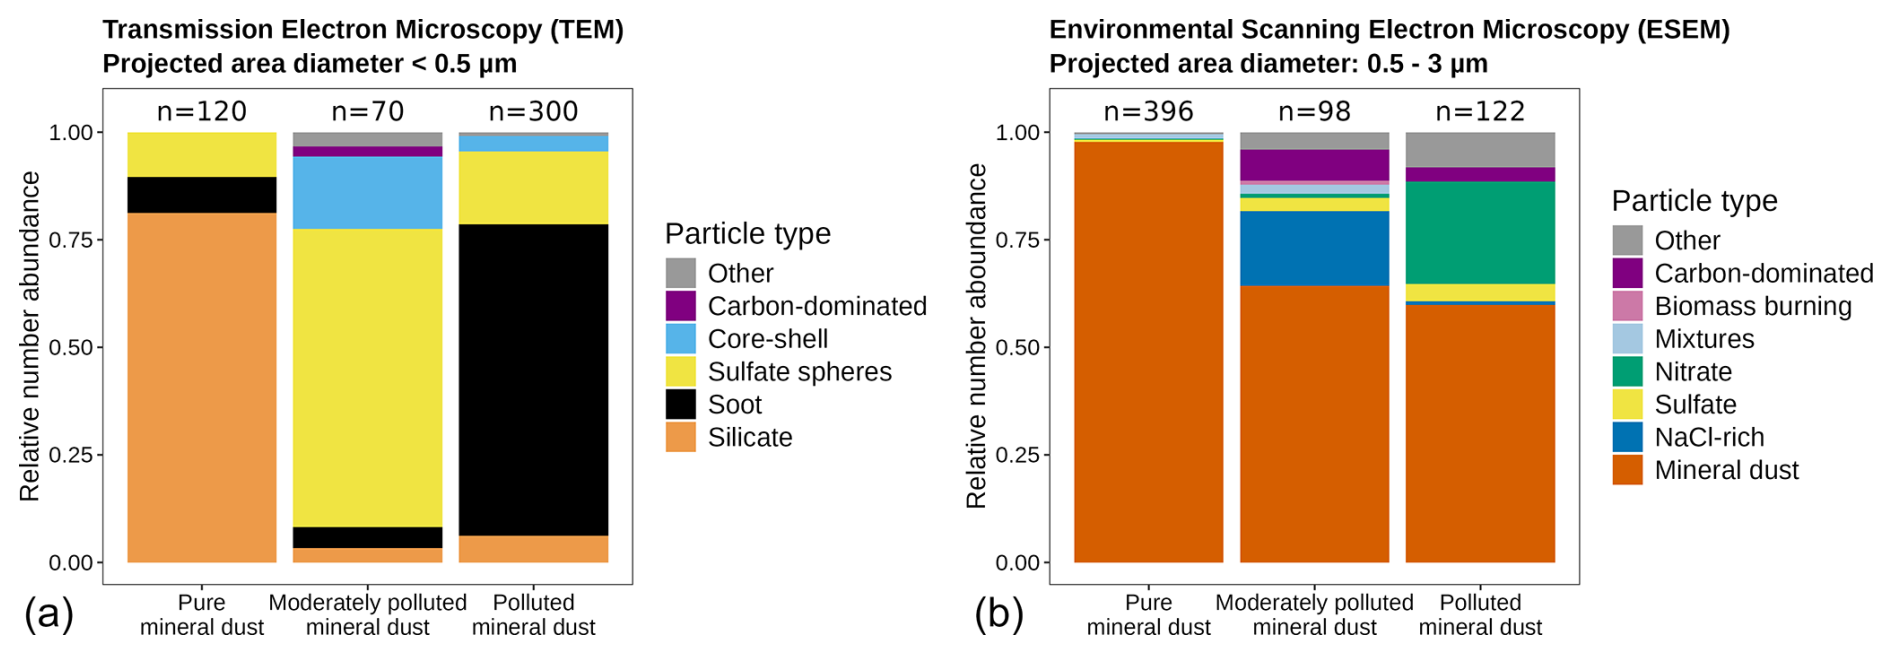
Figure 5Chemical composition and mixing state of particles. The graphs show the relative number abundance of various aerosol particle types and their mixing state for the same three samples shown in Fig. 4. Panel (a) shows the observations with the transmission electron microscope (TEM) for particles with a projected area diameter smaller than 0.5 µm, and panel (b) shows the observations with the environmental scanning electron microscope (ESEM) for particles with a projected area diameter in the range 0.5–3 µm. The number of particles (n) analyzed for each sample is provided above the corresponding bar. Note that “silicate” in (a) is a subset of mineral dust in (b).
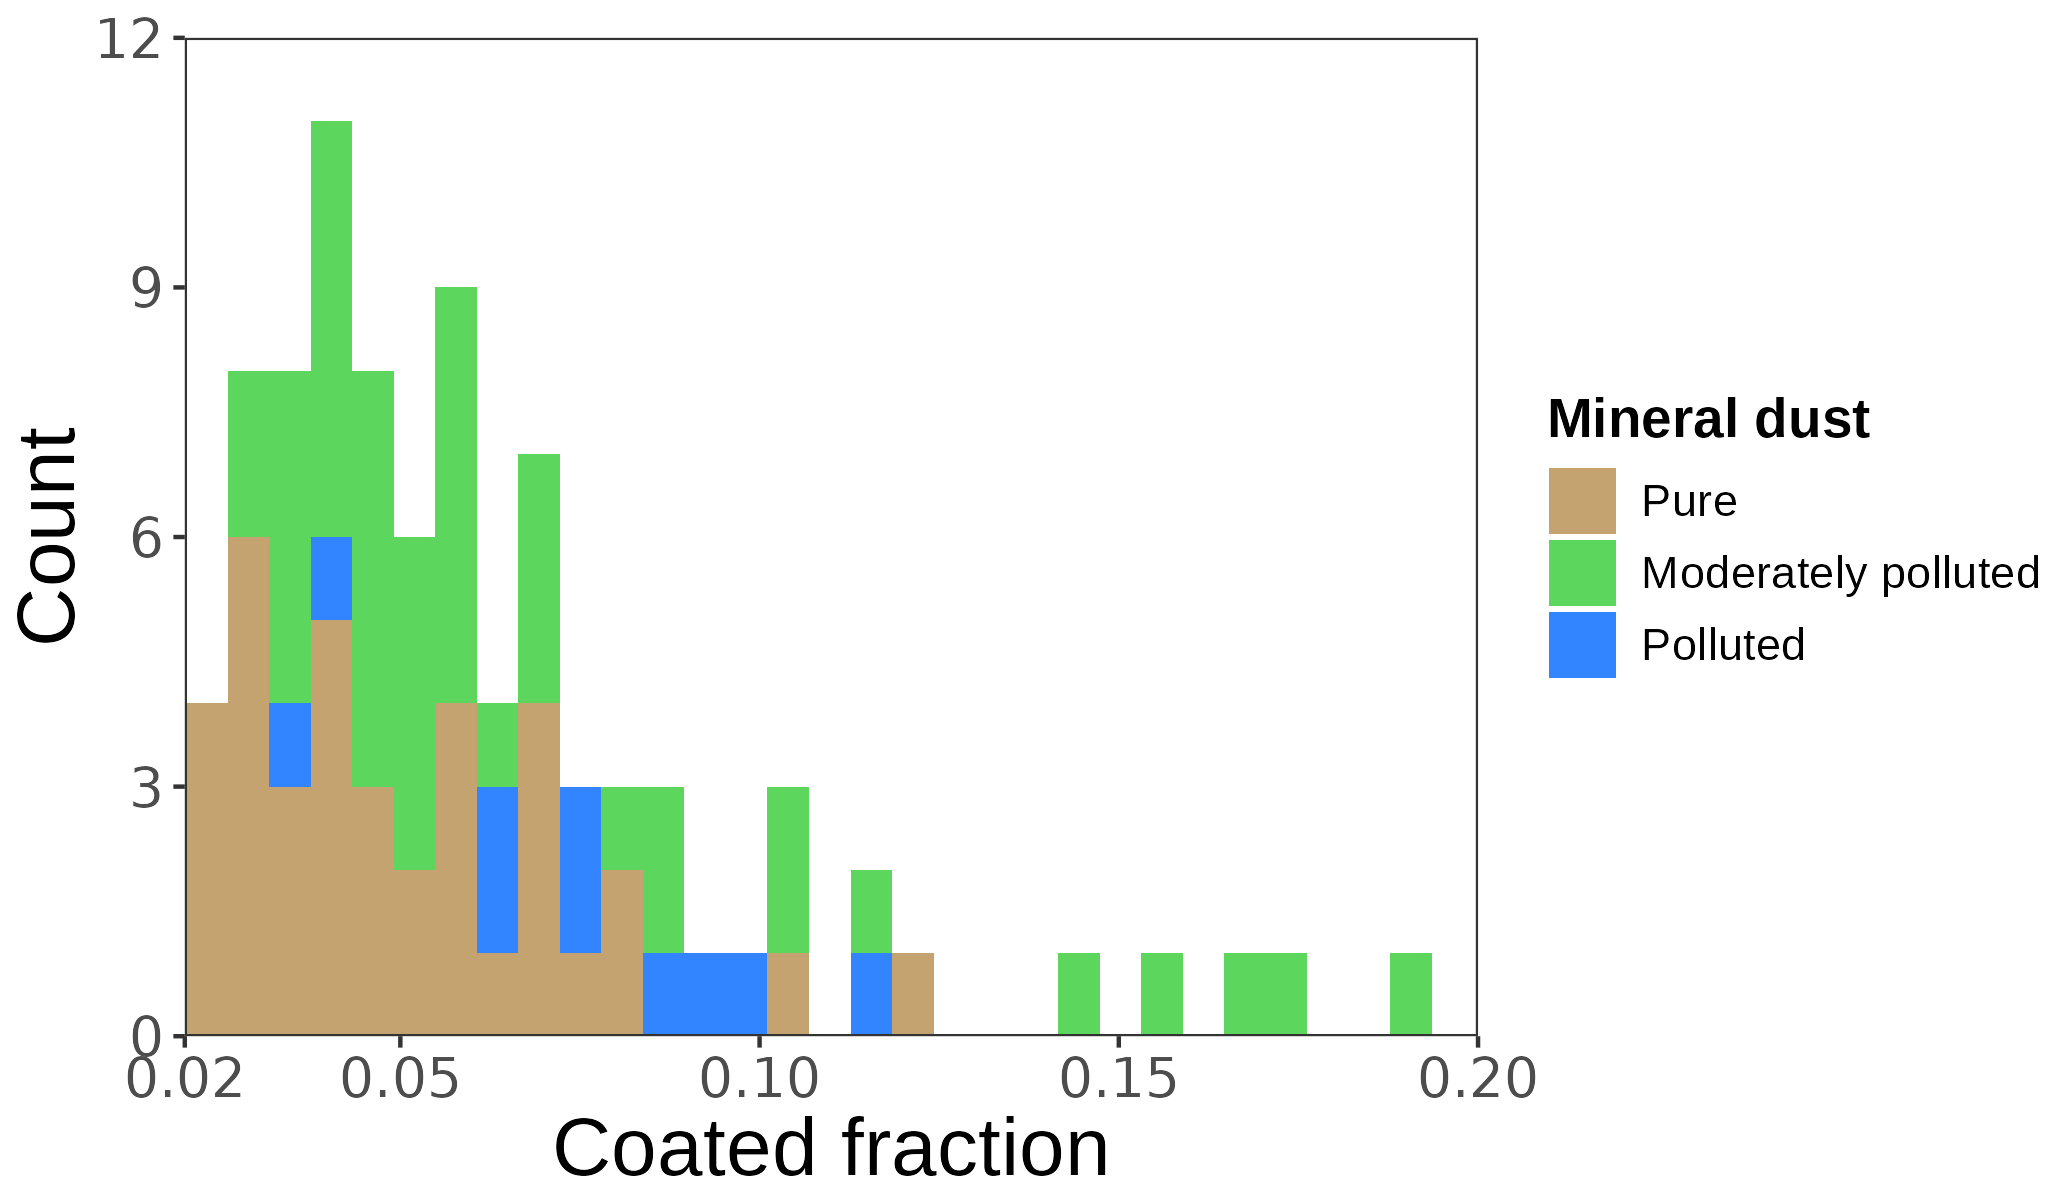
Figure 6Coated fraction of rBC particles derived from SP2 measurements. The plot shows results for 87 sequences, among which 37, 40, and 10 are classified as pure, moderately polluted, and polluted mineral dust, respectively, following the A-LIFE aerosol classification as indicated by the color code.
We would like to emphasize that the particle morphology and mixing state information based on TEM and ESEM analysis in this study is limited to three samples. The impact of particle mixing state on the aerosol optical properties should be investigated in a future study with additional data on particle mixing state.
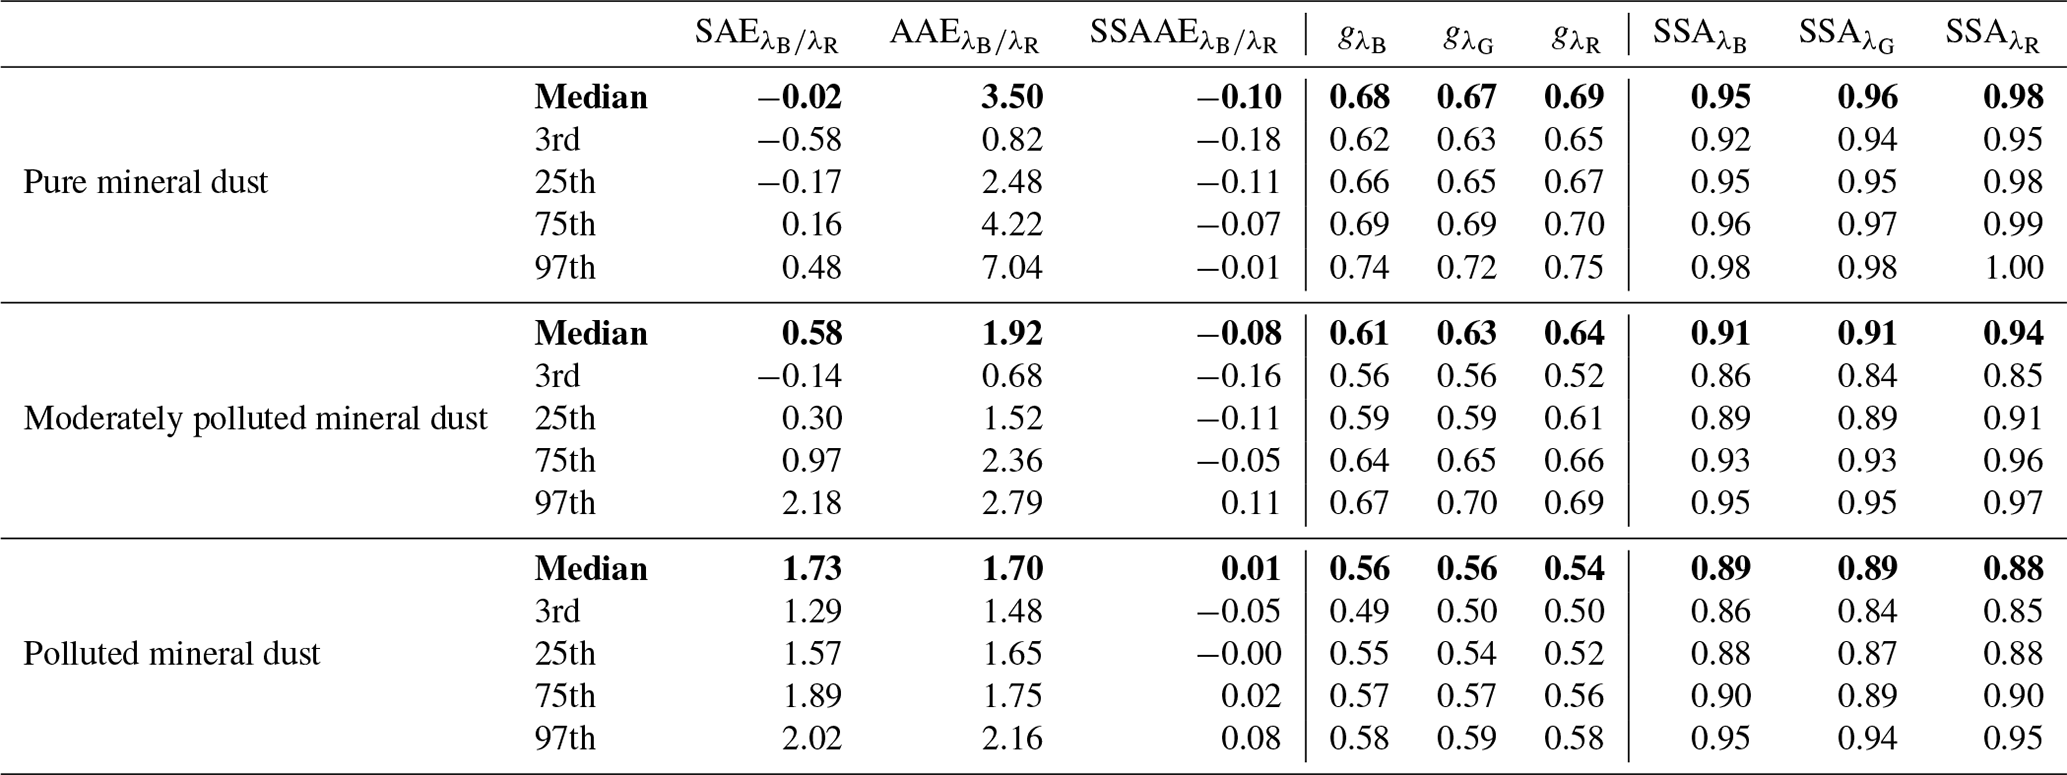
To evaluate the impact of mixing pollution and mineral dust from different source regions on the intensive aerosol optical properties, we investigated the intensive aerosol optical properties of sequences measured in the cabin of the Falcon aircraft classified as pure, moderately polluted, and polluted mineral dust. Table 1 shows the summary statistics for the intensive aerosol optical properties (SAE, AAE, SSAAE, g, and SSA) for pure, moderately polluted, and polluted mineral dust sequences. The intensive aerosol optical properties of pure and polluted mineral dust show significantly different values, as confirmed by the analysis of variance 2. However, moderately polluted mineral dust presents a more complex picture. It exhibits significant differences from the other two groups in SAE, g at all wavelengths, and SSA at the red wavelength. Nevertheless, it shows non-statistically significant differences from polluted mineral dust in AAE and SSA at blue and green wavelengths or from pure mineral dust in SSAAE.
Table 1Summary statistics (median and four percentiles) for each aerosol type of the intensive aerosol optical properties measured inside the cabin of the Falcon research aircraft behind an aerosol sampling system during A-LIFE for 87 measurement sequences, among which 37, 40, and 10 are classified as pure, moderately polluted, and polluted mineral dust by the A-LIFE aerosol classification scheme. For gλ, data were only available for 66 sequences, among which 29, 29, and 8 are classified as pure, moderately polluted, and polluted mineral dust, respectively. Median values are reported in bold.
In addition, we investigated the relationship between the intensive aerosol optical properties and , which expresses the pollution contribution in terms of mass in the mineral dust layer. Figure 7 shows each intensive aerosol optical property (SAE, AAE, SSAAE, g, SSA, and SW DREE) as a function of the pollution contribution in terms of mass on a log scale. The relationships between the intensive aerosol optical properties and are close to linear. Least-squares linear regression analysis was performed for all mineral dust sequences and for the mineral dust from the two source regions (the Arabian Peninsula and the Saharan desert) individually. Results for the linear regression analysis are reported in Table 2.
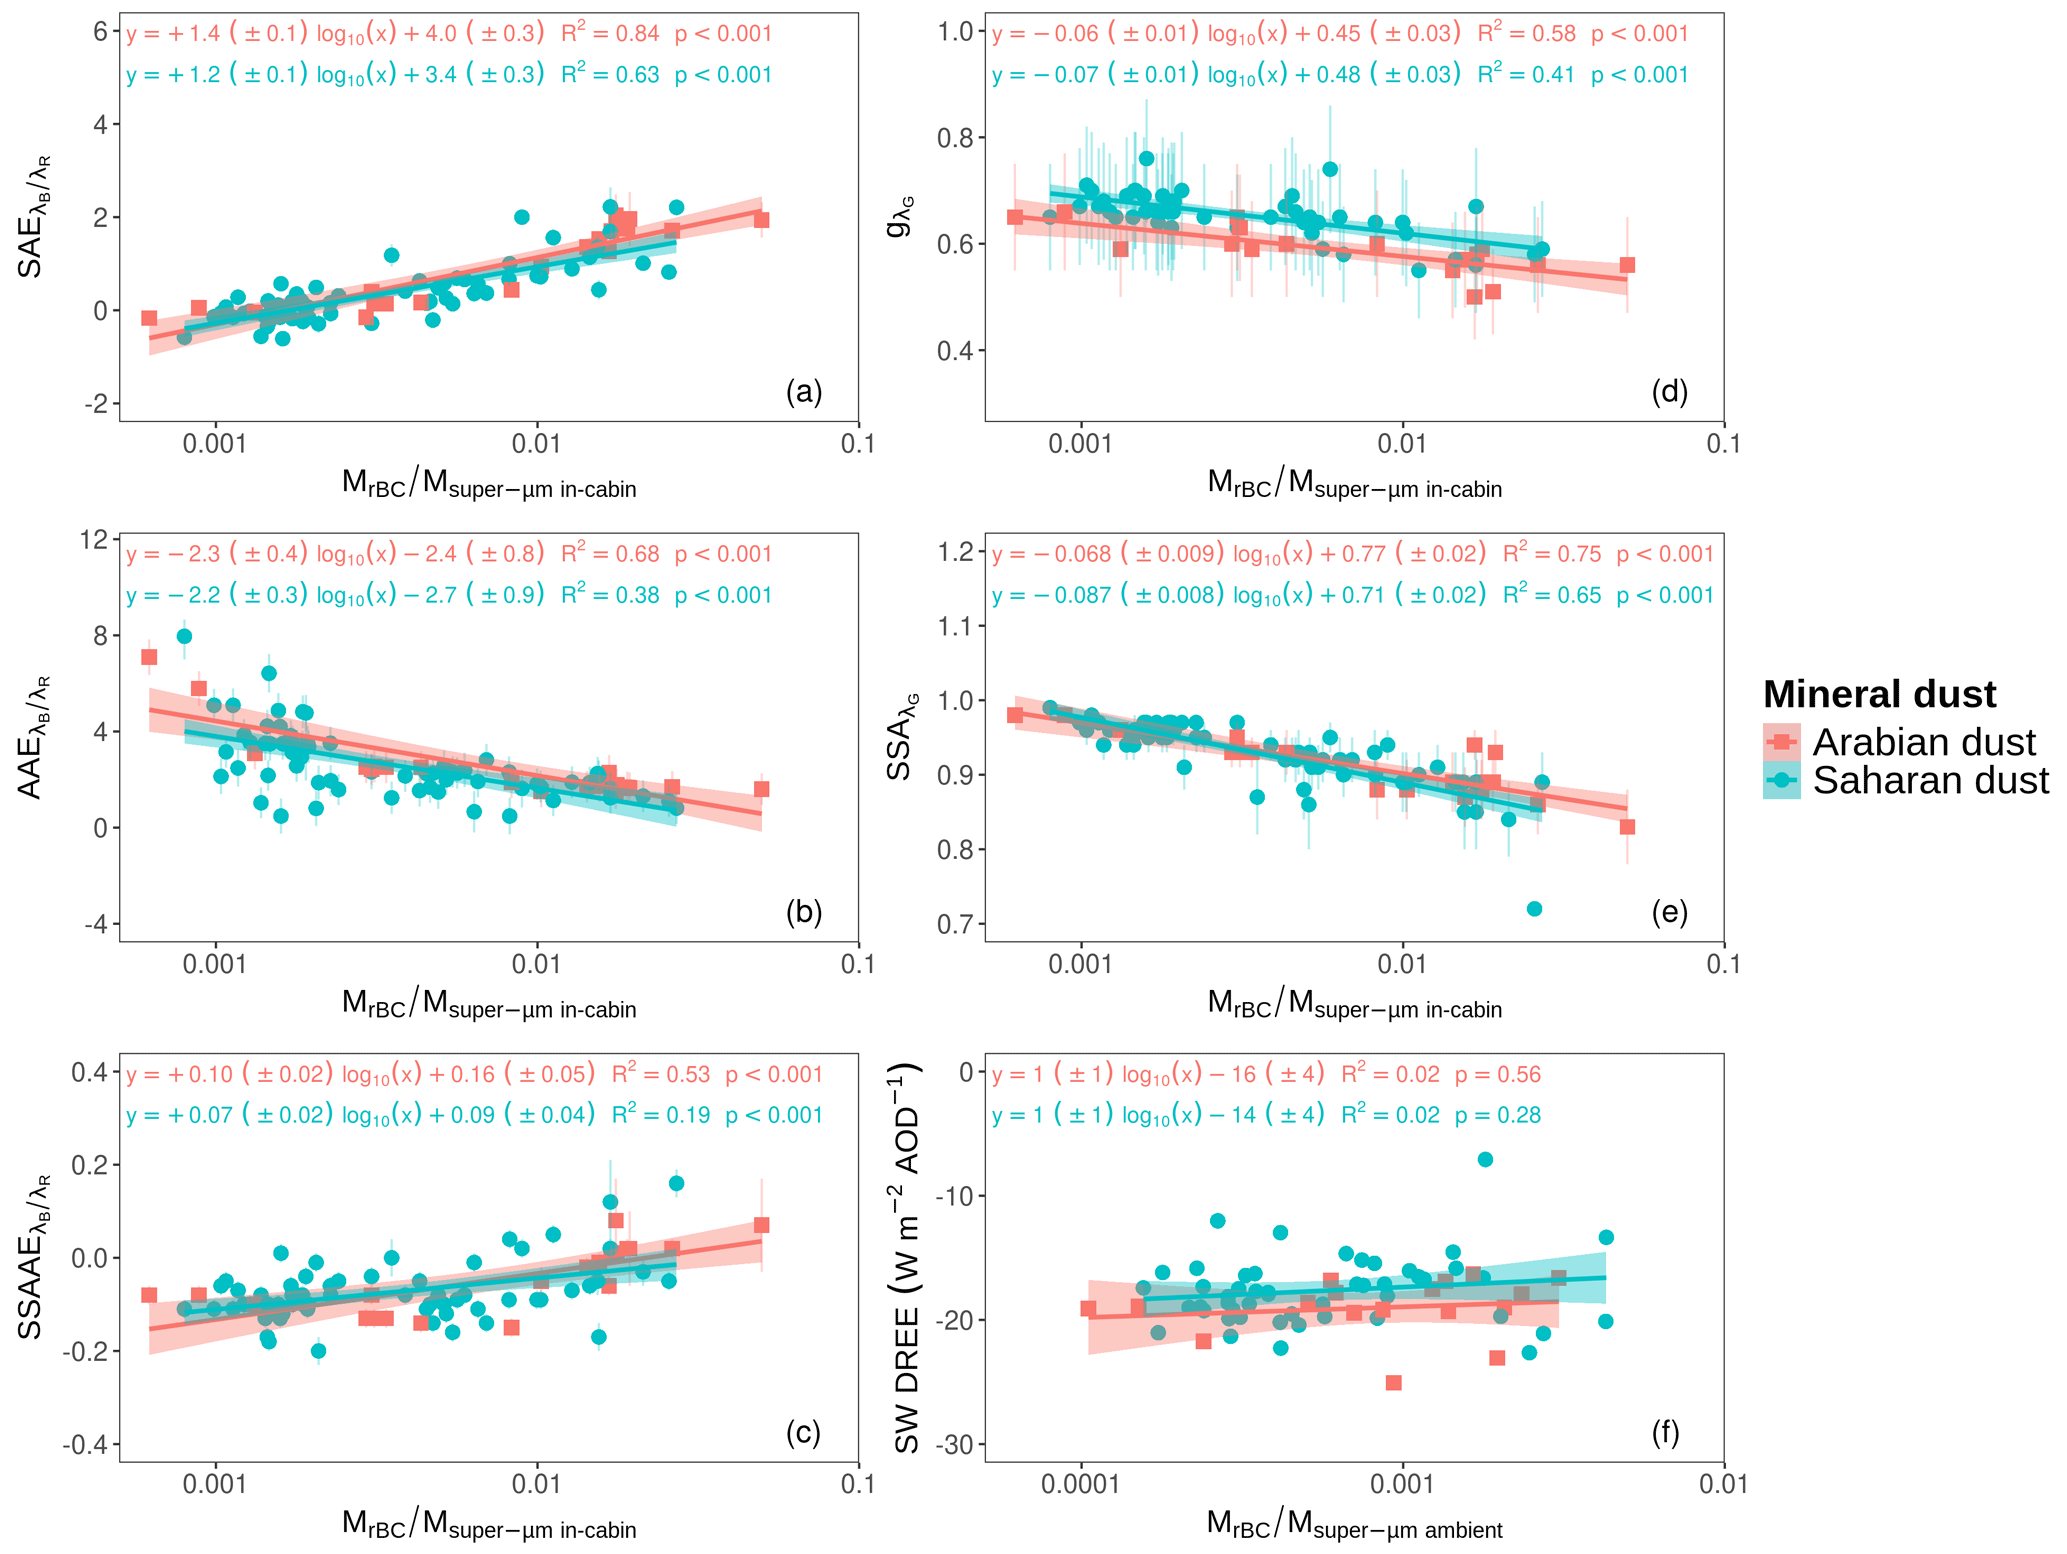
Figure 7Intensive aerosol optical properties of mixtures of pollution and mineral dust from different source origins. Each panel shows a different intensive optical property as a function of the pollution contribution in terms of mass (): (a) wavelength dependence of the scattering coefficient at λ=450 and 635 nm (SAE); (b) wavelength dependence of the absorption coefficient at λ=465 and 640 nm (AAE); (c) wavelength dependence of the single-scattering albedo (SSAAE); (d) asymmetry parameter (g) at λ=525 nm; (e) single-scattering albedo (SSA) at λ=525 nm; and (f) shortwave direct radiative effect efficiency (SW DREE) calculated with a simplified formula (Haywood and Shine, 1995), the measured values of g and SSA at λ=525 nm, and global average parameters. g and SSA were extended to the ambient particle size distribution (see Sect. S3). Thus, the SW DREE is plotted as a function of ), where Msuper-µm ambient is the mass of the ambient super-µm particles.
The plots show results for 67 (20) Saharan (Arabian) dust sequences. Results for gλ and SW DREE are based on based on 49 (17) Saharan (Arabian) dust sequences. The color code indicates the mineral dust type. Least-squares regression results, including a regression line and equation, determination coefficient, and p value, are shown in the corresponding mineral dust type color.
Table 2Results of the linear regression analysis of each intensive aerosol optical property vs. the pollution contribution in terms of mass . These results were derived from 87 sequences classified as mineral dust (67 Saharan and 20 Arabian dust sequences; results for gλ and SW DREE are based on 66 sequences – 49 Saharan and 17 Arabian dust sequences). The data used for the analysis are shown in Fig. 7.
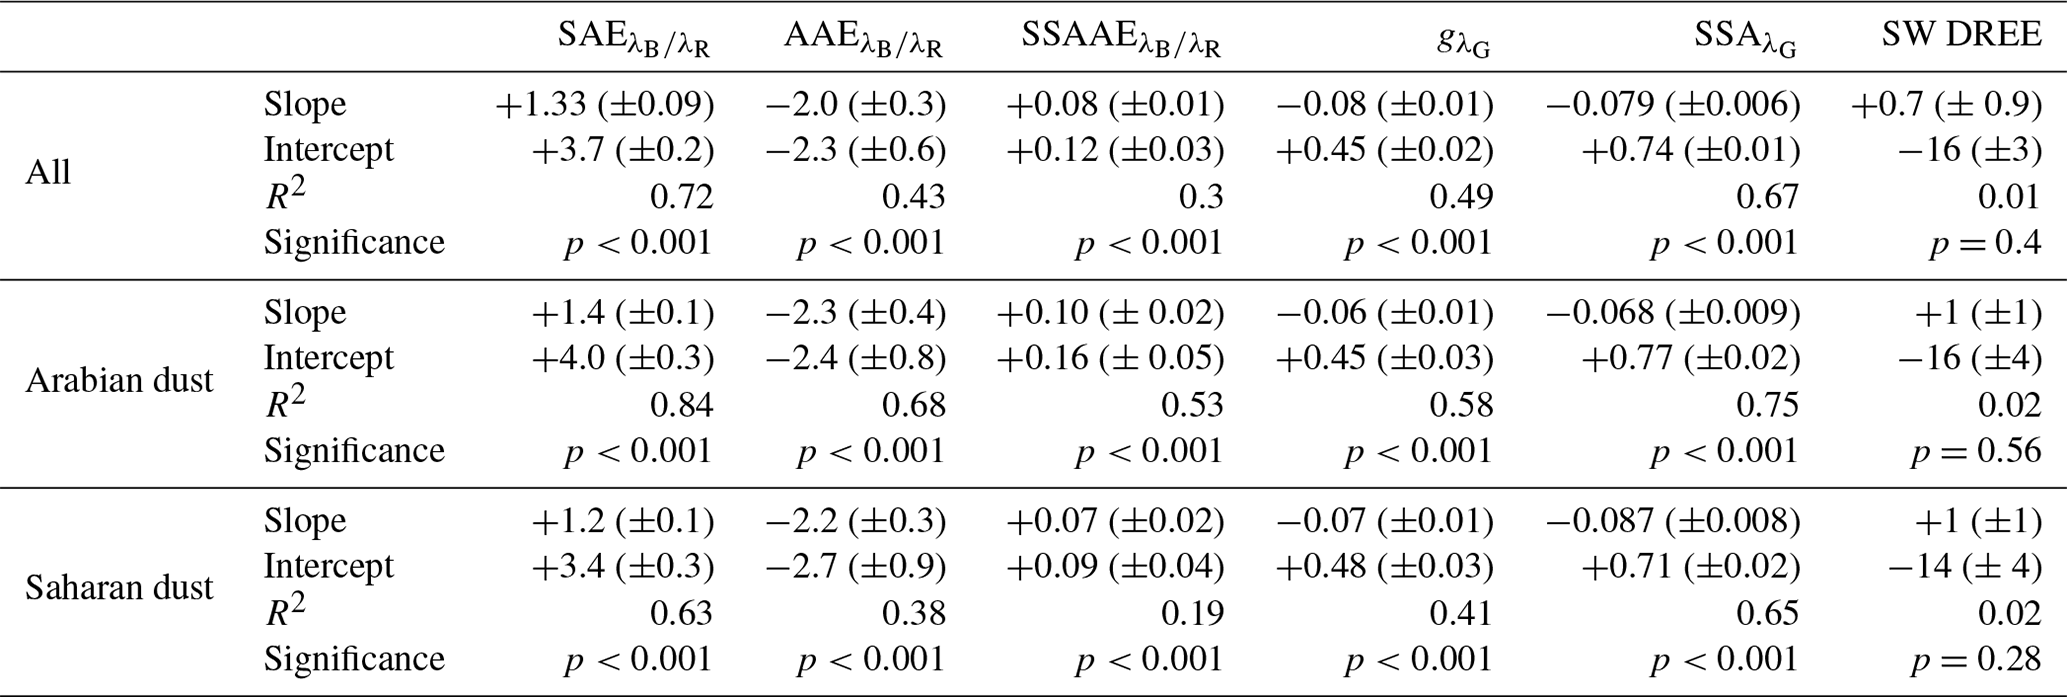
The Ångström exponents (SAE, AAE, and SSAAE), which are intensive aerosol optical properties often used for identifying aerosol types, change significantly with increasing pollution contribution in the mineral dust layer. The relationships between each Ångström exponent and the pollution contribution are statistically significant, as indicated by the p values well below the threshold of 0.05. For a unit increase in , SAE increases by 1.33 ± 0.09, AAE decreases by 2.0 ± 0.3, and SSAAE increases by . The determination coefficient R2 values suggest that the pollution contribution accounts for 72 % of the variability in SAE, while it explains 43 % and 30 % of the variability in AAE, and SSAAE, respectively.
The asymmetry parameter and single-scattering albedo (g and SSA) also change significantly (p<0.001) with increasing pollution contribution in the mineral dust layer. When increases by a unit, decreases by 0.08 ± 0.01 and SSA decreases by 0.079 ± 0.006. The pollution contribution is responsible for 49 % and 67 % of the variability in g and SSA, respectively. Median values of g and SSA measured at the wavelength λG change from 0.67 to 0.56 and from 0.96 to 0.89, respectively, from pure mineral dust to polluted mineral dust.
For the intensive aerosol optical properties representative of the ambient NSD (see Fig. B1 and Table B1 in the Appendix), the effect of increasing the pollution contribution is also significant, as indicated by the p value <0.001. When increases by a unit, decreases by 0.05 ± 0.01 and SSA decreases by 0.044 ± 0.007. From pure mineral dust to polluted mineral dust, the median value of SSA changes from 0.93 to 0.89; the median value of changes from 0.71 to 0.56.
These results suggest that the direct radiative effect of mineral dust layers might also be affected by the increase in pollution content. For the estimation of this impact, the shortwave direct radiative effect efficiency (SW DREE) was calculated for our data. However, the result of the linear regression analysis between SW DREE and the pollution contribution indicates that the relationship is not statistically significant (p>0.05). The SW DREE increases only slightly by 0.7 ± 0.9 W m−2 AOD−1 for a unit increase in . Thus, our data do not provide enough evidence to conclude that the SW DREE changes with increasing pollution content when considering the global average surface albedo.
The results for the mineral dust from the two source regions (the Arabian Peninsula and the Saharan desert) are similar. The slopes and intercepts obtained from the linear regression analysis are in agreement within the error bars for all intensive aerosol optical properties. Thus, the change rates of the intensive aerosol optical properties (SAE, AAE, SSAAE, g, and SW DREE) for increasing pollution contribution in terms of mass agree within error bars for the mineral dust from the two different source regions.
4.1 Comparison of mineral dust's optical properties from Arabian and Saharan source regions
Differences in the optical properties of mineral dust particles from different source regions can arise due to differences in the mineralogical compositions (Sokolik and Toon, 1999; Di Biagio et al., 2019), but also due to differences in the mixing processes with pollution (Kok et al., 2023; Denjean et al., 2016; Seinfeld et al., 2004). We investigated the differences in mineral dust layers' intensive aerosol optical properties (SAE, AAE, SSAAE, g, SSA, and SW DREE) from two different source regions (the Arabian Peninsula and the Saharan desert) in the eastern Mediterranean. We found that the intensive aerosol optical properties change significantly with the increase in pollution content within the mineral dust layer. On the contrary, the differences between Arabian and Saharan dust are not statistically significant (see Fig. 7) for all intensive aerosol optical properties except for the SSA, where minor differences are found. These results suggest that there is no major intrinsic difference in the mineral dust from Arabian and Saharan dust source regions that causes a statistically significant difference in the intensive aerosol optical properties.
Our findings align with observations of other in situ aerosol properties measured during the A-LIFE field experiment, such as the single-particle chemistry analysis and the particle volume size distributions, and are also consistent with previous research. For instance, Kim et al. (2011) analyzed the mineral dust optical properties using sun photometers at 14 AERONET sites. Their study found no systematic difference in the Ångström exponent, single-scattering albedo, and asymmetry parameter for pure mineral dust layers from Arabian and Saharan source regions.
Single-particle chemistry analysis of mineral dust particles reveals comparable features with only slight variations between Arabian and Saharan dust samples (see Figs. S4 and S5). Both exhibit a high percentage (∼ 60 %–62 %) of silicate-like particles, while Saharan dust samples contain more clay-like minerals (illite and kaolinite), and Arabian dust samples show higher carbonate content. These observations align with previous Saharan dust studies (Kandler et al., 2009; Formenti et al., 2011b). Limited studies on Arabian dust (Attiya and Jones, 2020; Engelbrecht et al., 2009, 2016) reveal significant variability in mineralogy across the Arabian Peninsula. Thus, identifying specific characteristics of Arabian dust remains challenging, but studies consistently note higher carbonate and lower clay content compared to Saharan dust.
Small differences between Saharan and Arabian dust samples were found in the amounts of iron oxides and hydroxides from single-particle chemistry analysis. Saharan dust consists of about 3 % of these compounds, whereas Arabian dust samples exhibit roughly half that amount. This difference results in minor variations in the imaginary part of the refractive index, as shown in Fig. S6. For instance, the imaginary part of the refractive index, at the green wavelength of 520 nm, has a value of 0.006 for Saharan dust and 0.005 for Arabian dust. Consequently, the calculated SSA values of mineral dust particles indicate a 4 % increase for Arabian dust compared to Saharan dust. The observed imaginary refractive index values are higher than those of Saharan dust measured in other locations, such as over the northwest Sahara or the Atlantic (Kandler et al., 2007, 2011; Aryasree et al., 2024).
On the contrary, differences between Arabian and Saharan dust were observed in the lidar ratio by several past studies (e.g., Schuster et al., 2012; Mamouri et al., 2016; Nisantzi et al., 2015), as well as during the A-LIFE field experiment (Groß et al., 2024). Higher values are reported for the lidar ratio of Saharan dust compared to the one of Arabian dust. The lidar ratio is an important intensive aerosol optical property in the framework of aerosol typing effort. It is obtained as the ratio of the extinction coefficient and the backscattering coefficient at 180° measured by a lidar, and it is sensitive to the particle composition, particle size distribution, and particle shape. According to Groß et al. (2013), the lidar ratio decreases with increasing particle size and increases with increasing light absorption. In addition, the lidar ratio decreases with an increasing real part of the refractive index (Gasteiger et al., 2011).
The reason for the differences in Arabian and Saharan dust's lidar ratio is unknown. Most of the authors attribute the lidar ratio difference to the different geochemical characteristics of the source region soil, with different illite concentrations for the two source regions, which influence the real part of the refractive index (e.g., Schuster et al., 2012; Filioglou et al., 2020). However, the lidar ratio can be influenced for various reasons. For example, Hu et al. (2020) pointed out that the lidar ratios can also be influenced by the presence of coarse-mode and giant (d>40 µm) particles, for example, when measured close to the source region. Nisantzi et al. (2015) acknowledge that the retrieval of the mineral dust lidar ratio may be affected by pollution if present in the boundary layer or mixed into the mineral dust layer.
Understanding the reason for the differences in the lidar ratios of Arabian and Saharan dust is out of the scope of this paper. However, we highlight that care is needed when retrieving the optical properties of pure mineral dust because they may contain mixtures of other components, such as black carbon or other small anthropogenic particles. In particular, when analyzing the differences between different dust types, evaluating the pollution content and comparing only measurements with similar pollution content is essential. While the pollution content has been shown to have a statistically significant effect on the mineral dust intensive optical properties, the mineral dust source region (the Arabian Peninsula or the Saharan desert) does not appear to have a statistically significant effect on these properties.
4.2 Implications for the identification of aerosol types
The scattering, absorption, and single-scattering albedo Ångström exponents (SAE, AAE, and SSAAE) are sensitive to different aerosol characteristics. Thus, different aerosol classification schemes deploying these properties exist in the literature (e.g., Russell et al., 2010; Lee et al., 2012; Costabile et al., 2013; Cazorla et al., 2013; Cappa et al., 2016). Most studies agree that high SAE values suggest the presence of fine-mode aerosols (e.g., BC, sulfates, or nitrates) and low SAE values indicate large aerosols (e.g., sea salt and mineral dust). Furthermore, they indicate that AAE values around 1 are associated with BC and higher AAE values suggest the presence of mineral dust and/or brown carbon. In addition, negative SSAAE values have been associated with mineral dust outbreaks (e.g., Collaud Coen et al., 2004). However, different studies report slightly different threshold values for different aerosol types, likely due to differences in the particle size distribution measured at different sites and with different techniques as well as to different wavelength pairs used to calculate the intensive aerosol optical properties. Different classification schemes and the respective threshold values are reviewed in Schmeisser et al. (2017) and Valentini et al. (2020).
We compared our measurements with the classification scheme proposed by Cappa et al. (2016). Figure 8 shows the classification matrix (AAE vs. SAE) for the sequences classified as mineral dust by the A-LIFE aerosol classification scheme. In the upper panel, the points are color-coded by the SSAAE. In the lower panel, the color indicates the aerosol type according to the A-LIFE aerosol classification scheme.
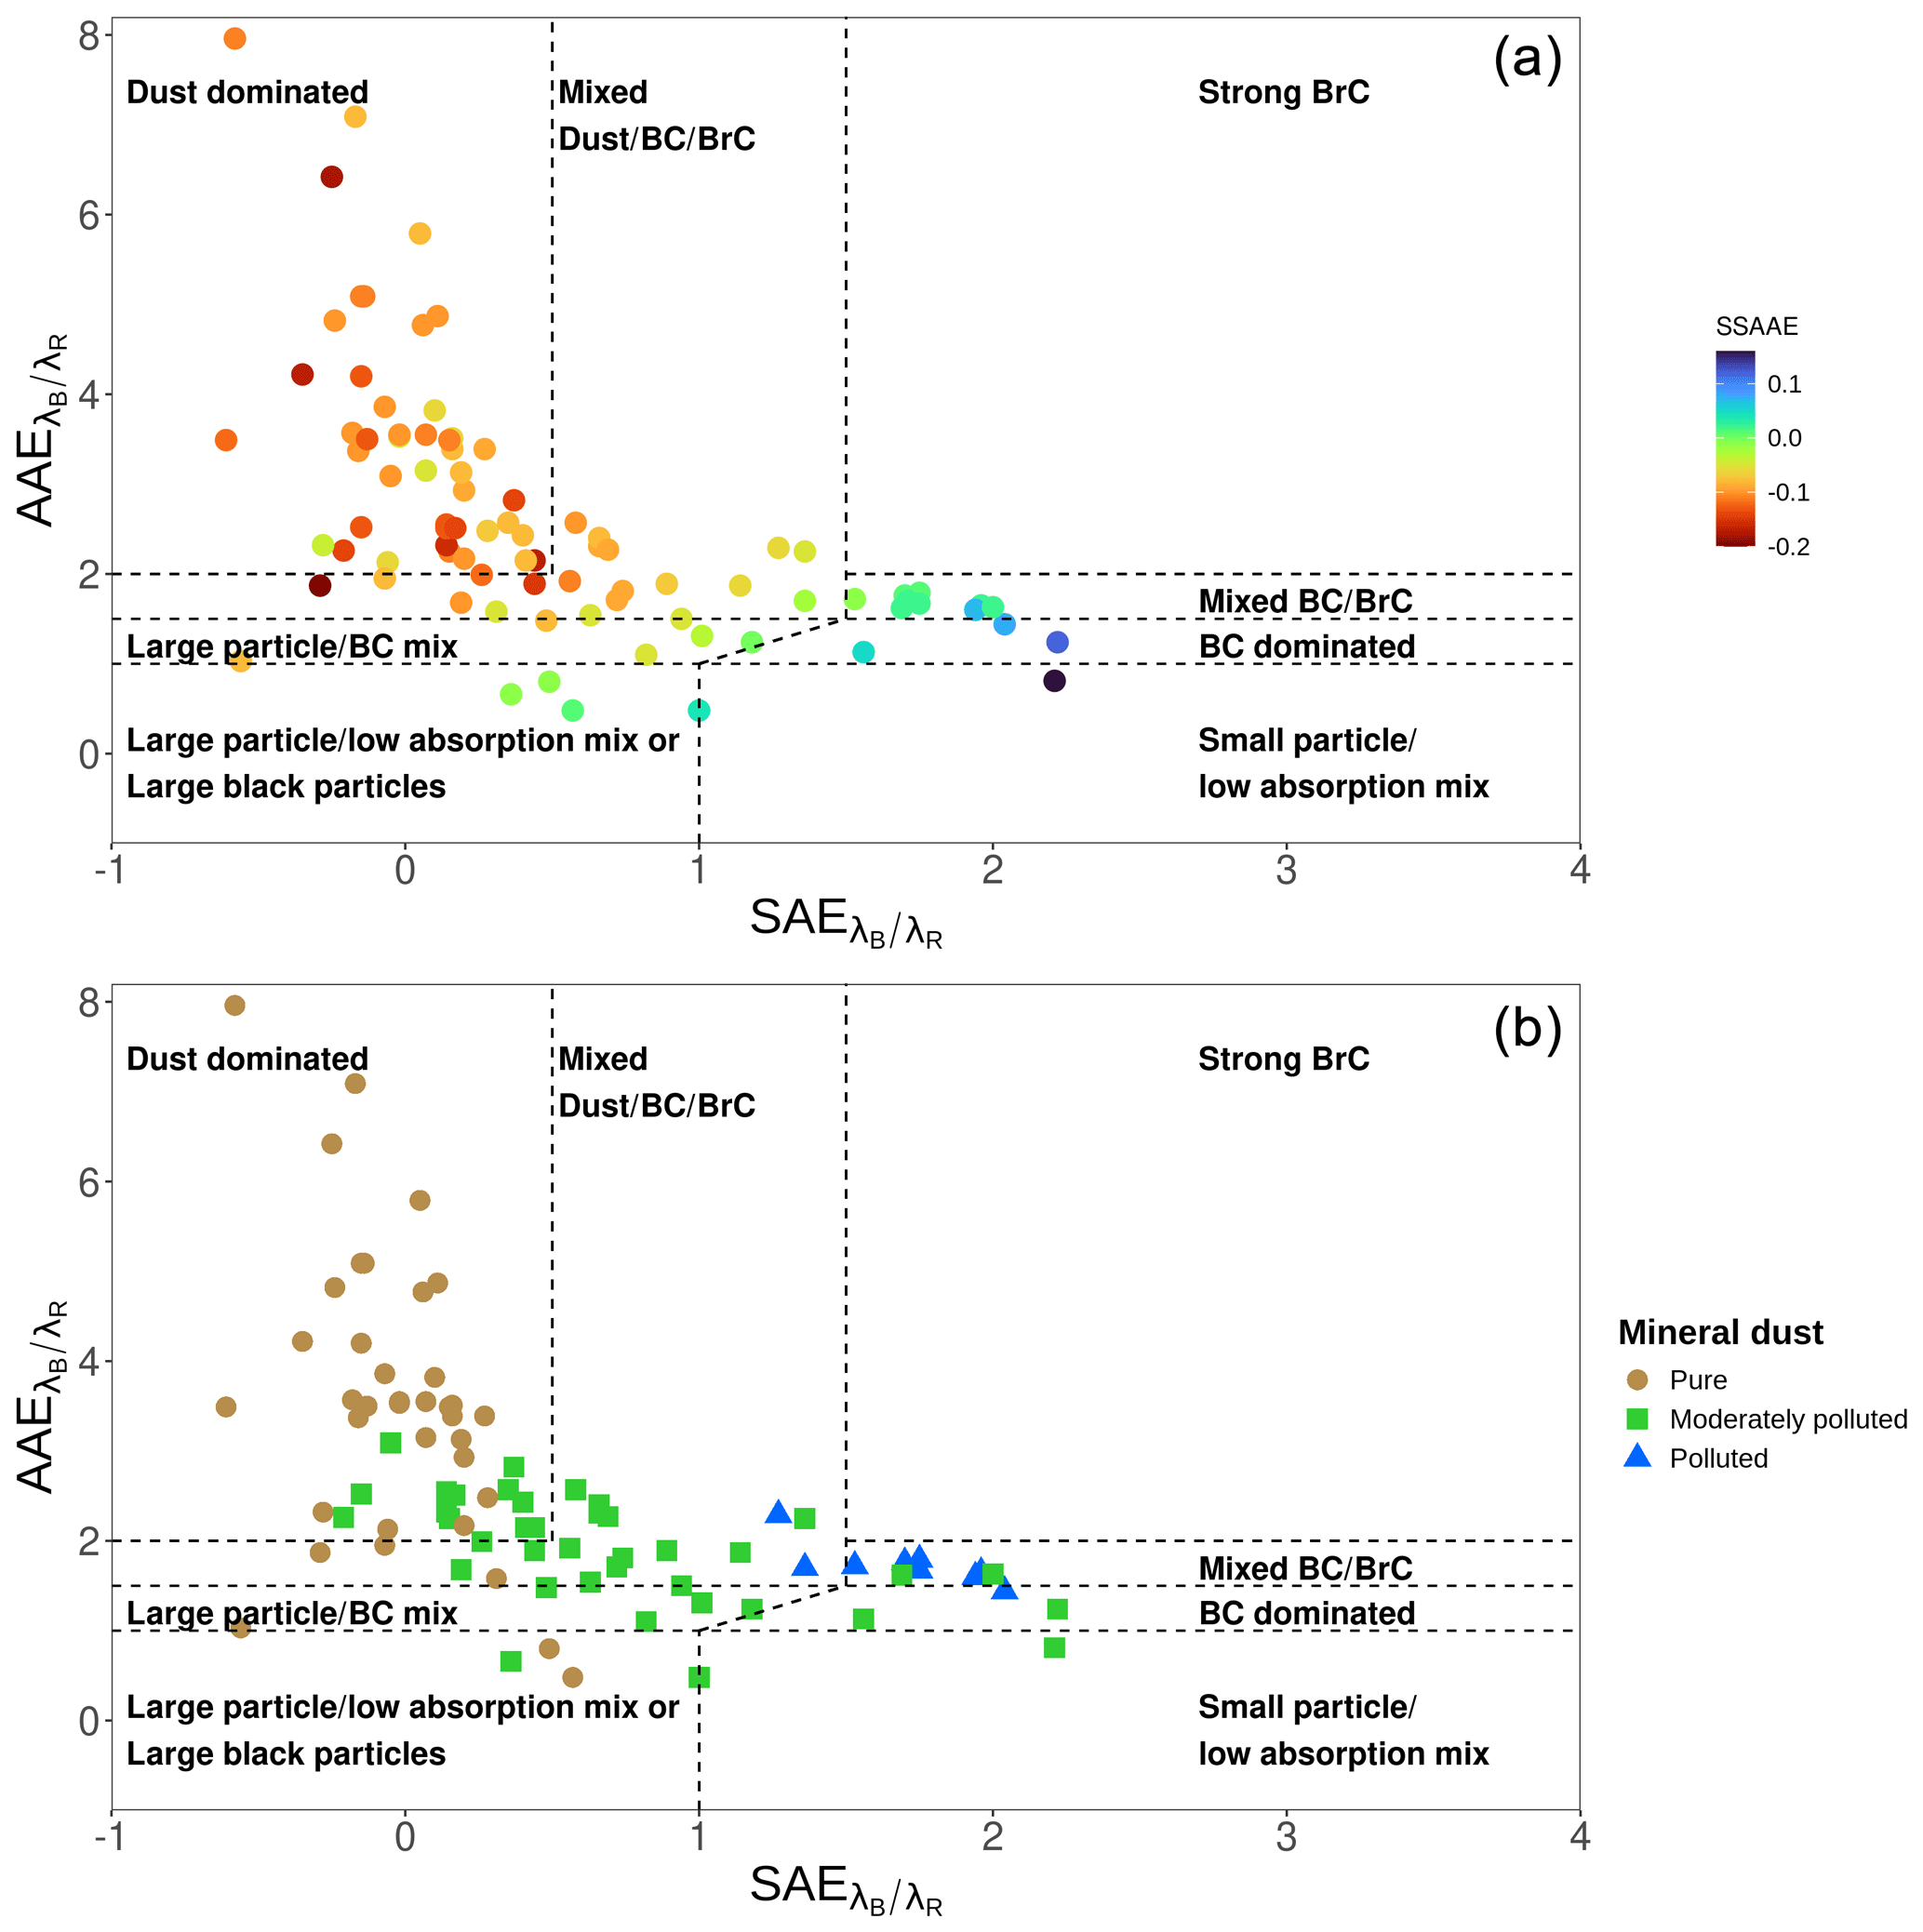
Figure 8Aerosol classification schemes using intensive aerosol optical properties. Both panels show the absorption vs. scattering Ångström exponent matrix (AAE vs. SAE) overlaid with the Cappa et al. (2016) aerosol classification scheme: aerosol types are reported in black, and the thresholds are indicated with dashed black lines. In the upper panel, the color code indicates the single-scattering albedo Ångström exponent (SSAAE). In the lower panel, the colors and shapes indicate the aerosol types following the A-LIFE aerosol classification scheme.
For pure mineral dust sequences, our measurements align with observations of previous studies. Measured median values for pure mineral dust sequences are −0.02, 3.50, and −0.10 for SAE, AAE, and SSAAE, respectively (see Table 1). Most sequences classified as pure mineral dust fall in the “dust-dominated region” of the AAE vs. SAE plot according to the classification scheme proposed by Cappa et al. (2016) (SAE <0.5, and AAE >2). In addition, all pure mineral dust cases have SSAAE < 0, consistent with values reported by Collaud Coen et al. (2004) and Kaskaoutis et al. (2021).
However, our results show that the Ångström exponents change significantly for increasing pollution content within the mineral dust layer (Fig. 7 and Table 2). Median values for polluted mineral dust sequences are 1.73, 1.70, and 0.01 for SAE, AAE, and SSAAE, respectively (see Table 1). These values are more similar to values measured for anthropogenic aerosols (e.g., Lee et al., 2012, SAE = 0.8–1.8, AAE = 1.0–1.5). Indeed, polluted mineral dust sequences are mainly in the “mixed BC–BrC region” of the AAE vs. SAE according to the Cappa et al. (2016) classification scheme (Fig. 8). Moderately polluted mineral dust sequences have SAE, AAE, and SSAAE values with a larger variability. Thus, these sequences fall in different regions according to the Cappa et al. (2016) classification scheme, including “dust-dominated”, “mixed dust–BC–BrC”, and “BC-dominated” regions. Thus, mineral dust can be present for several combinations of the optical properties SAE, AAE, and SSAAE.
This result indicates that the Ångström exponents (SAE, AAE, and SSAAE) should not be used as sole indicators to detect the presence of mineral dust in the case of mixing with pollution because the optical properties shift towards values associated with anthropogenic aerosols as the presence of pollution increases within the mineral dust layer. A few authors already pointed out that the presence of pollution may mask the mineral dust signal (Esteve et al., 2012; Ealo et al., 2016; Pandolfi et al., 2018). Therefore, independent methods are needed to identify mineral dust events in mixtures with pollution.
Once the presence of mineral dust is already elucidated, the Ångström exponents (SAE, AAE, and SSAAE) can be useful parameters to estimate the amount of pollution mixed into the mineral dust layer. Indeed, a relationship between all the three Ångström exponents (SAE, AAE, and SSAAE) and the pollution contribution in terms of mass exists (Fig. 7, Table 2). Therefore, the Ångström exponents (SAE, AAE, and SSAAE) can be used to select cases where non-dust aerosols have a minimal impact on the aerosol optical properties and study the properties of pure mineral dust. For example, Müller et al. (2011), Kim et al. (2011), Horvath et al. (2018), and Tian et al. (2018) used SAE and/or AAE to select pure mineral dust cases and study other optical and microphysical properties. In addition, among the three Ångström exponents (SAE, AAE, and SSAAE), the pollution contribution in terms of mass seems to better account for the variability in SAE (72 %), while for AAE and SSAAE, the pollution contribution in terms of mass explains 43 % and 30 % of the variability (see Table 2). This result suggests that SAE might be the most reliable intensive aerosol optical property for estimating the amount of pollution in a mineral dust layer. However, it is crucial to confirm the presence of mineral dust using additional independent methods.
4.3 Asymmetry parameter and single-scattering albedo of pure mineral dust layers
The asymmetry parameter (g) and the single-scattering albedo (SSA) are key intensive aerosol optical properties to understand the direct radiative effect of mineral dust. The large variability of these optical properties for mineral dust in the atmosphere may be due to differences in the mineralogical composition and mixture with other aerosol types. Still, it can also arise from differences in the measurement methods or retrieval technique and the measured particle diameter size range.
For pure mineral dust layers, the values of g and SSA measured during A-LIFE are mainly consistent with literature values measured during different field campaigns. We consider the values of g and SSA measured in the aircraft cabin to be representative of the in-cabin NSDs, as well as the values obtained by extending these values to the ambient NSDs (0.01–50 µm), which are thus representative of the ambient NSD.
Figure 9 shows the spectral values of g for sequences classified as pure mineral dust directly measured in the cabin of the Falcon aircraft and extended to the ambient NSD, as well as values from other field campaigns. Values of g from our measurements are in the range of values from other measurement campaigns, and better agreement is shown for values extended to the ambient NSD (Fig. 9). The value of g at the green wavelength (525 nm) extended to the ambient size distribution (0.01–50 µm) is in excellent agreement with the value () measured directly with a polar nephelometer by Horvath et al. (2018) in Sierra Nevada (Spain). Values of g for pure mineral dust obtained from other aircraft measurements performed close to Saharan dust source regions (e.g., Formenti et al., 2011a; Ryder et al., 2018; Denjean et al., 2020) or after transport through the Mediterranean (Denjean et al., 2016) agree with our measurement values extended to the ambient NSD. These studies calculated the intensive optical properties through an inversion closure study combining the particle number size distribution in various size ranges, as indicated in Figs. 9 and 10, with direct measurements of the optical properties and Mie theory.
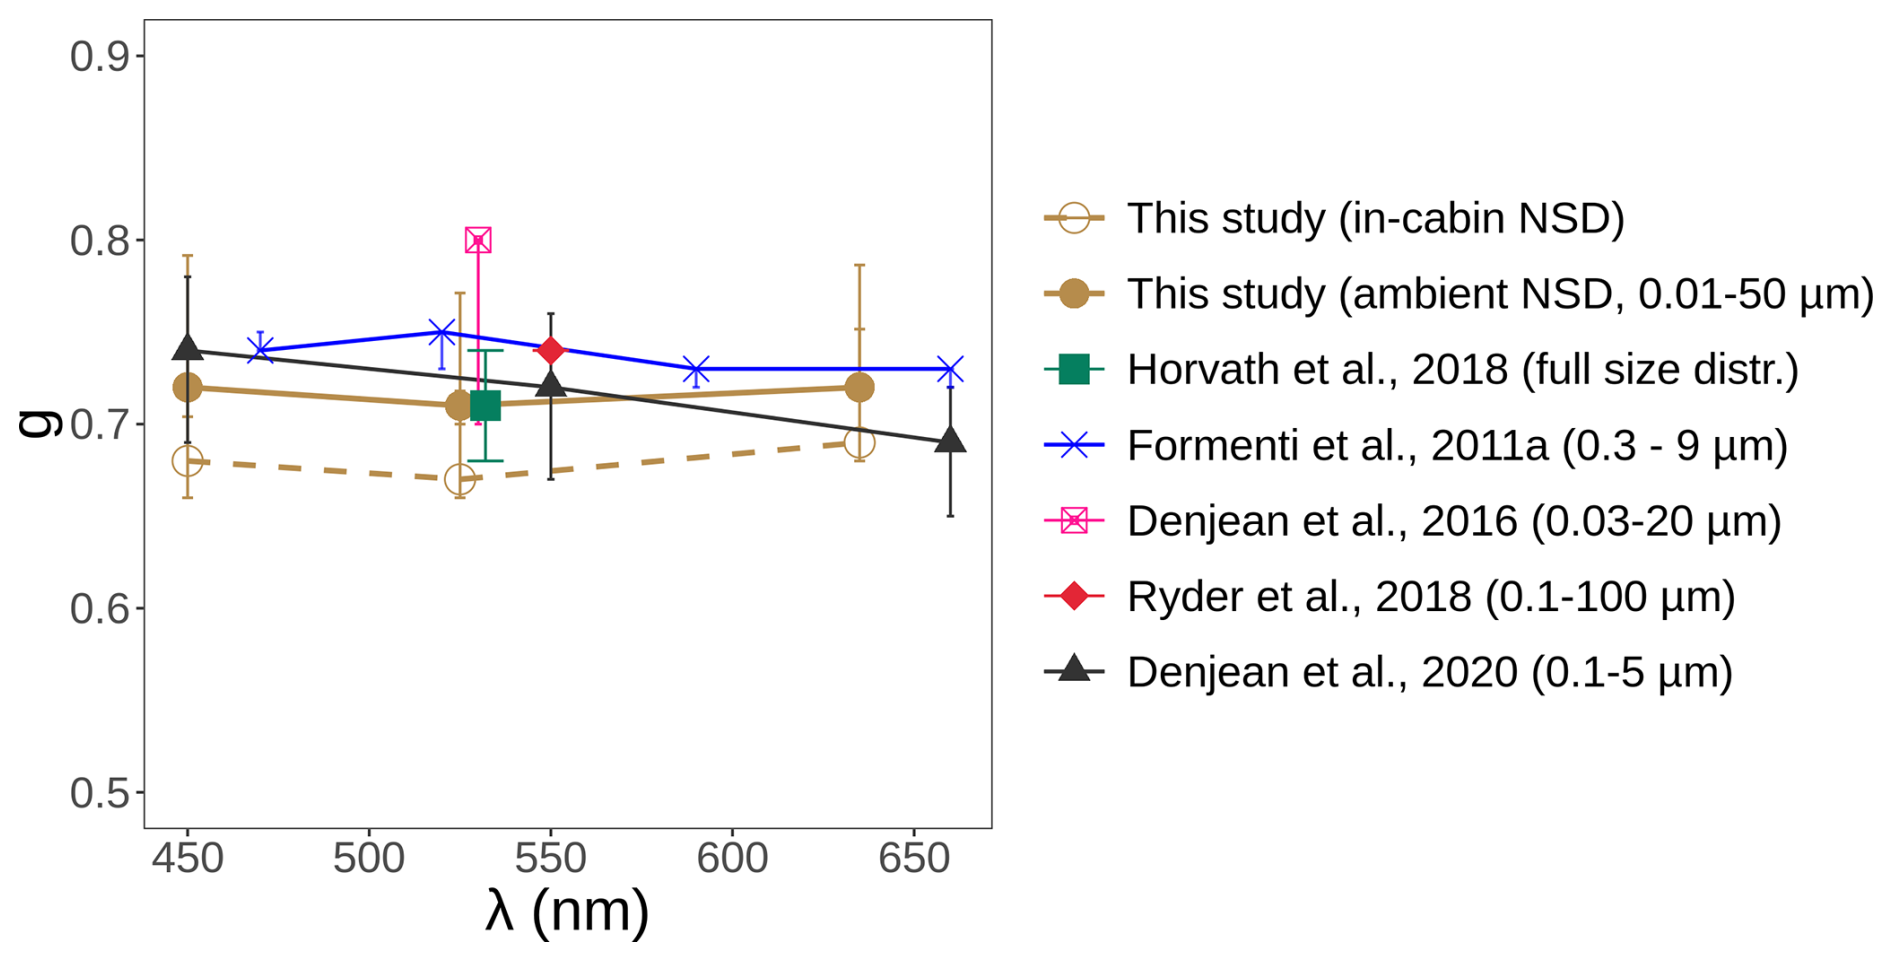
Figure 9Spectral asymmetry parameter (g) for pure mineral dust layers. Data from this study are reported in brown. Empty circles indicate values measured in the cabin of the Falcon aircraft with the Aurora 4000 nephelometer, while full circles indicate values extended to the ambient NSD. Error bars indicate the variability obtained as the 3rd and 97th percentiles. For comparison, values issued from the AMMA (Formenti et al., 2011a), CHARMEX/ADRIMED (Denjean et al., 2016), AER-D (Ryder et al., 2018), and DACCIWA (Denjean et al., 2020) field campaigns, as well as direct measurements performed with a polar nephelometer in the Sierra Nevada (Spain) by Horvath et al. (2018), are shown. The measured diameter size range for each field experiment is given in the legend. Error bars correspond to the range of variability reported in the publications from which data are taken.
Figure 10 shows the spectral single-scattering albedo (SSA) for pure mineral dust layers in this work in comparison with the results of other studies. Our measurements of SSA are consistent with most values from other measurement campaigns using inversion closure study (e.g., Formenti et al., 2011a; Ryder et al., 2018; Denjean et al., 2016), but also from direct measurements (e.g., Schladitz et al., 2009; Müller et al., 2011). However, most mean values from other campaigns fall within the range between the values of our in-cabin and ambient SSA values. For example, the SSA at λ=525 nm changes from a value measured in-cabin of 0.96±0.02 to a value representative for the ambient NSD of 0.93±0.03 (see Tables 1 and B1). Ryder et al. (2013) reported optical properties measured inside the aircraft cabin and Mie-simulated values from the number particle size distribution in the range 0.1–930 µm and show that direct measurements overestimate SSA by up to 0.11 due to inlet efficiencies. Ryder et al. (2018) showed comparable outcomes, suggesting that the variability in the observed SSA values may also be due to discrepancies in the measured diameter size range of different studies.
The values reported by Denjean et al. (2020) deviate significantly from our measurements but are still within the variability range. Their intensive aerosol optical properties were derived from an optical closure study combining size distributions and optical properties measured for an aerosol particle passing through a PM5 isokinetic inlet. This difference might also be due to the unidentified presence of pollution mixed with the mineral dust.
Differences in the observed intensive aerosol optical properties (g and SSA) of pure mineral dust layers may be due to variations in the measured particle diameter size range, distinct measurement or retrieval techniques, and different methods used to classify pure mineral dust layers.
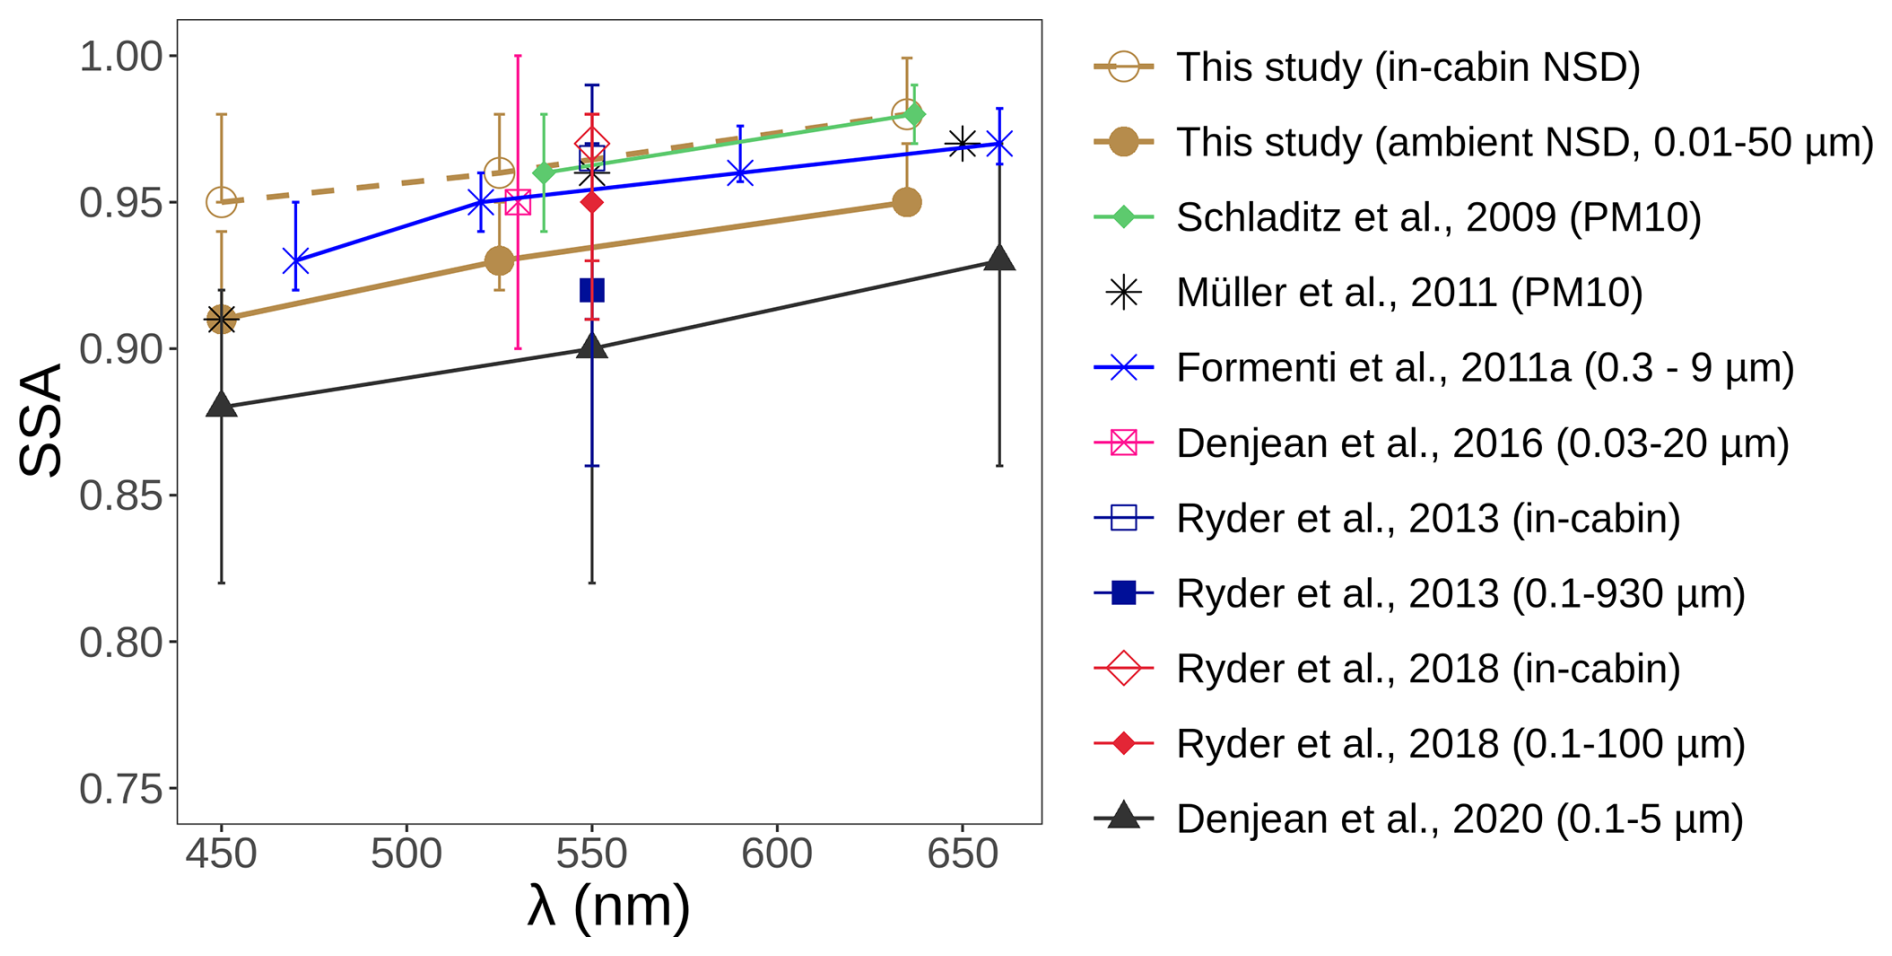
Figure 10Spectral single-scattering albedo (SSA) for pure mineral dust layers. Data from this study are reported in brown. Empty circles indicate values measured in the cabin of the falcon aircraft with the Aurora 4000 nephelometer and TAP, while full circles indicate values extended to the ambient NSD. Error bars indicate the variability obtained as the 3rd and 97th percentiles. For comparison, values issued from the SAMUM (Schladitz et al., 2009), SAMUM-2 (Müller et al., 2011), AMMA (Formenti et al., 2011a), CHARMEX/ADRIMED (Denjean et al., 2016), Fennec 2011 (Ryder et al., 2013), AER-D (Ryder et al., 2018), and DACCIWA (Denjean et al., 2020) field campaigns are shown. The measured diameter size range for each field experiment is given in the legend. Error bars correspond to the range of variability reported in the publications from which data are taken.
4.4 Implications for the direct radiative effect
The asymmetry parameter (g) and the single-scattering albedo (SSA) are two intensive aerosol optical properties essential for estimating the aerosol direct radiative effect. While the asymmetry parameter is affected by the particle size, the single-scattering albedo reflects the particle absorption effect.
Our results show that both properties g and SSA decrease significantly for increasing pollution content within the mineral dust layer (Fig. 7). g median values change from 0.67 to 0.56 for pure to polluted mineral dust at 525 nm, while SSA median values change from 0.96 to 0.89 (Table 1). Similar results were obtained, for example, by Seinfeld et al. (2004) in Asia and by Denjean et al. (2020) in West Africa. However, slightly different numbers can be due to the different diameter size ranges measured and the different methods to identify the presence of pollution.
Since the changes in g and SSA are significant with increasing pollution within a mineral dust layer, the direct radiative effect efficiency may also be significantly affected. Indeed, a decrease in g indicates that less light is scattered in the forward direction and less energy reaches the Earth's surface, and thus the surface cooling effect may be enhanced compared to a pure mineral dust layer with the same aerosol optical depth (AOD). Conversely, a decrease in SSA indicates that more energy is absorbed in the aerosol layer. Thus, the surface cooling effect may be reduced (or the atmospheric warming effect may be enhanced) compared to a pure mineral dust layer with the same AOD. These two opposing effects are due to the reduced particle size and the increased black carbon concentration associated with the increased pollution in the mineral dust layer. Indeed, the pollution includes not only black carbon particles, but also fine-mode anthropogenic particles (see Fig. 3).
The simple formula, developed by Charlson et al. (1991) and Haywood and Shine (1995), can be used to evaluate the impact of the mixing of pollution and mineral dust on the shortwave direct radiative effect efficiency (SW DREE) at the top of the atmosphere by investigating which of the two opposing effects (decrease in particle size vs. decrease in absorption) dominates in our measurements.
Several studies have highlighted the limitation of this formula (e.g., Yu et al., 2006). First, the aerosol properties are assumed for a single wavelength considered representative of the visible range of the solar spectrum (i.e., 525 nm in our case). Second, multiple-scattering effects are neglected, and this formula is adequate only for thin atmospheres (Haywood and Shine, 1995). Third, the vertical profile of constituents is not considered. Fourth, the dependence on the solar zenith angle is not considered. Wendisch et al. (2001) showed that these simplifications caused large uncertainties, especially neglecting the multiple scattering. Hassan et al. (2015) compared this equation with the output of a more sophisticated model and found it erroneous for the all-sky radiative effect but adequate for cloud-free conditions. Thus, despite the large uncertainties, the functional relationship between the SW DREE, g, and SSA remains valid. In conclusion, the Haywood and Shine (1995) formula can be used to compare the intrinsic forcing efficiency of different aerosols, as used, for example, by Sherman et al. (2015). Therefore, we focus not on the absolute number obtained with this formula but on its change rate for increasing pollution within the mineral dust layer. We believe that important conclusions might be drawn by considering the slopes of the relationship between the SW DREE and the pollution contribution in terms of mass in a mineral dust layer.
When considering a global average surface albedo, the pollution increase in a mineral dust layer does not seem to affect the shortwave direct radiative effect of the aerosol layer. Our results (Table 2) show that the SW DREE, calculated considering global average surface albedo and cloud fraction (Rs=0.15 and Ac=0.60), increases by 0.7 (±0.9) W m−2 AOD−1 per unit change of . This change is not statistically significant given the wide confidence interval and the high p value of 0.4. This result suggests that the direct radiative effect of a mineral dust layer with more pollution content does not change significantly compared to a pure mineral dust layer with the same AOD because the decreased size and increased absorption counteract each other.
However, the direct radiative effect of a mineral dust layer can strongly differ depending on the underlying surface albedo and also on the fraction of sky covered by clouds. The simple formula from Haywood and Shine (1995) (Eq. 6) allows calculating the SW DREE by taking into account variation of the surface albedo Rs and of the cloud fraction Ac. For the latter, only the case of clouds above the aerosol layer, i.e., no aerosol effect when the sky is covered by clouds, is considered.
We considered different surface albedo and cloud fraction values associated with different regions according to the Copernicus Climate Change Service (C3S) to assess the local change in the SW DREE due to the increase in pollution in a mineral dust layer. Figure 11 shows how the SW DREE changes for increasing pollution content in the mineral dust layer for different surface albedos ( for ocean, global average, desert, and snow, respectively) in the case of cloud-free conditions: Ac=0. Figure 12 shows how the SW DREE changes for increasing pollution content in the mineral dust layer for different regions with specific surface albedo and cloud fraction values.
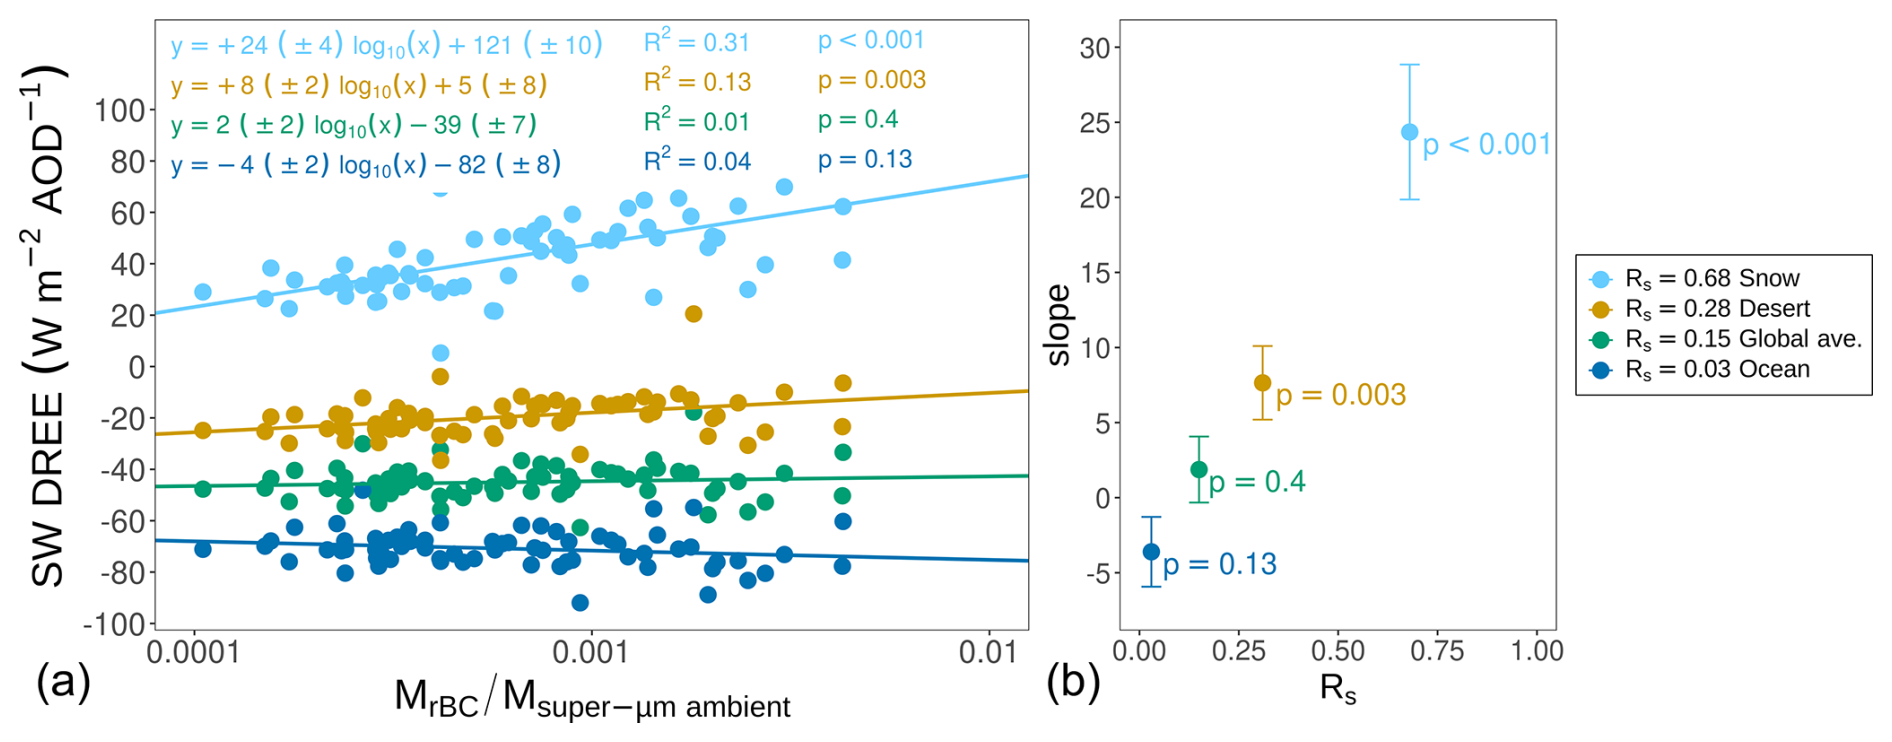
Figure 11Change in the shortwave direct radiative effect efficiency (SW DREE) for increasing pollution in the mineral dust layer for different surface albedos in cloud-free conditions. Panel (a) shows the shortwave direct radiative effect efficiency (SW DREE), calculated using a simplified formula (Haywood and Shine, 1995), the measured values of g and SSA at λ=525 nm, and global average parameters as in Sherman et al. (2015) as a function of the pollution contribution in terms of mass (). Msuper-µm ambient is the mass of the ambient super-µm particles, since the values of g and SSA used to calculate the SW DREE were extended to the ambient particle size distribution (see Sect. S3). Different colors indicate the SW DREE calculated for different surface albedos (Rs). The calculations are done for cloud-free conditions (Ac=0). Respective least-squares regression results, including a regression line and equation, determination coefficient, and p value, are shown in the corresponding color. Panel (b) shows the slope obtained for each linear regression as a function of the surface albedo.
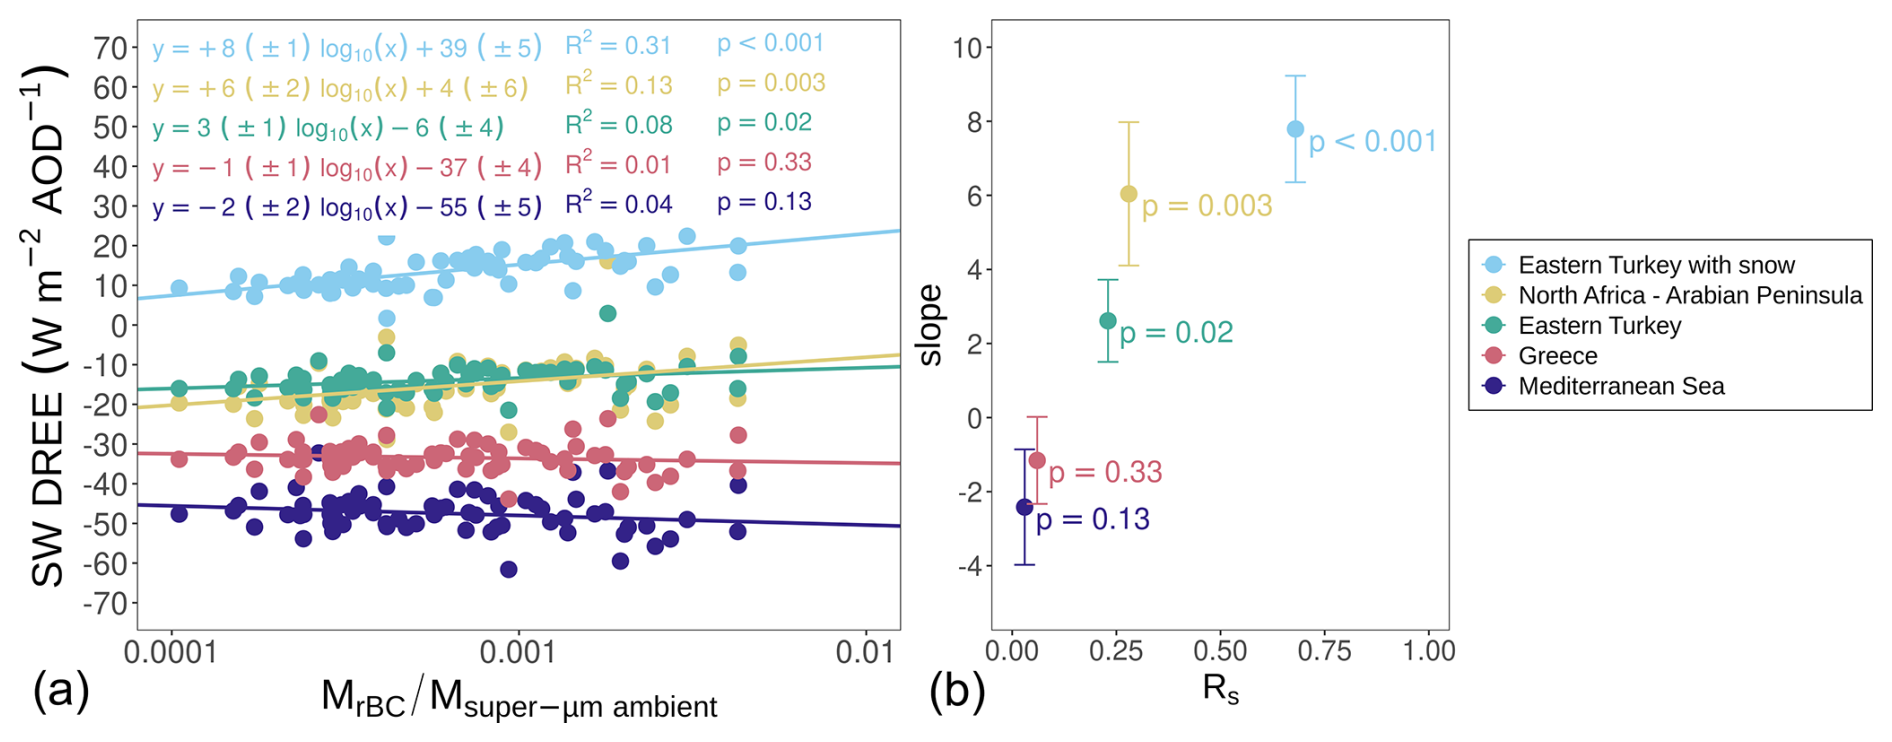
Figure 12Change in the shortwave direct radiative effect efficiency (SW DREE) for increasing pollution in the mineral dust layer for different regions. Panel (a) shows the shortwave direct radiative effect efficiency (SW DREE), calculated using a simplified formula (Haywood and Shine, 1995), the measured values of g and SSA at λ=525 nm, and global average parameters as in Sherman et al. (2015) as a function of the pollution contribution in terms of mass (). Msuper-µm ambient is the mass of the ambient super-µm particles, since the values of g and SSA used to calculate the SW DREE were extended to the ambient particle size distribution (see Sect. S3). Different colors indicate the SW DREE calculated for different regions by considering different surface albedo (Rs) and cloud fraction (Ac) combinations. Annual average Rs and Ac were identified for each region using data from the Copernicus Climate Change Service (C3S): Rs=0.03 and Ac=0.33 for the Mediterranean Sea, Rs=0.06 and Ac=0.48 for Greece, Rs=0.28 and Ac=0.21 for Saharan desert and Arabian Peninsula, Rs=0.23 and Ac=0.52 for eastern Türkiye, and Rs=0.68 and Ac=0.68 for eastern Türkiye when covered by snow. Respective least-squares regression results, including a regression line and equation, determination coefficient, and p value, are shown in the corresponding color. Panel (b) shows the slope obtained for each linear regression as a function of the surface albedo.
When the mineral dust layer is above a surface with high surface albedo, such as a desert or snow, the SW DREE increases for increasing pollution content. Thus, the cooling effect decreases (or the warming effect increases) for increasing pollution content compared to the case of a pure mineral dust layer. The results of the linear regression analysis between the SW DREE and the pollution contribution in terms of mass shows that the relationship between the two variables is statistically significant for cases with high surface albedo (Rs≥0.23), as indicated by the p values below the threshold of 0.05.
When the mineral dust layer is above a surface with low surface albedo, such as the ocean, the SW DREE decreases slightly for increasing pollution content. Thus, the cooling effect may increase for increasing pollution compared to the case of a pure mineral dust layer. However, the relationship is not statistically significant, as indicated by the p values above the threshold of 0.05 and also by the wide confidence interval of the regression parameters. Thus, our data do not provide enough evidence to conclude that the SW DREE changes with increasing pollution content within the mineral dust layer. However, the relationship may become statistically significant if more pollution is present in the mineral dust layer.
The presence of clouds does not modify the significance of the relationship; it changes the magnitude of the SW DREE and of the slope (Fig. 12). Regions close to the eastern Mediterranean that have high surface albedo are the Saharan desert and the Arabian Peninsula. These regions have a relatively low cloud fraction (Ac=0.21), which leads to an increase by +6 (±2) W m−2 AOD−1 of the SW DREE per unit increase in . Türkiye has several mountain chains for which surface albedo presents a strong annual cycle due to changes in vegetation and snow coverage. We considered in particular the eastern part of Türkiye in the Aras Mountains. The annual average surface albedo of 0.23 and the cloud fraction of 0.52 lead to absolute numbers of the SW DREE similar to those of the Saharan desert and the Arabian Peninsula as well as a slope of +3 (±1) W m−2 AOD−1. During winter when the mountains are covered by snow the SW DREE increases by +8 (±1) W m−2 AOD−1 per unit increase in . This slope is considerably smaller than the value of +24 (±4) W m−2 AOD−1 obtained without considering the effect of clouds (Fig. 11). Regions with low surface albedo of interest for our measurements are the Mediterranean Sea and the territory of Greece. The SW DREE in these regions changes by −2 (±2) W m−2 AOD−1 and −1 (±1) W m−2 AOD−1, respectively, per unit change of .
These results suggest that for regions with a high surface albedo, quantifying the pollution within a mineral dust layer is very important to correctly estimate the local direct radiative effect of the mineral dust layer. Further studies are needed on the impact of mixing pollution and mineral dust, especially above surfaces with low surface albedo. In addition, the limitations and uncertainties of the SW DREE relationships do not allow further considerations. The generalization of these results requires calculations with a more sophisticated radiative transfer model, which is beyond the scope of this study.
During the A-LIFE aircraft field experiment in April 2017, we measured the properties of mineral dust and mineral dust–pollution mixtures in the eastern Mediterranean. In this study, we analyzed the intensive aerosol optical properties directly measured during A-LIFE with an Aurora 4000 nephelometer and a Tricolor Absorption Photometer (TAP), such as the scattering, absorption, and single-scattering albedo Ångström exponent (SAE, AAE, and SSAAE), as well as the asymmetry parameter and the single-scattering albedo (g and SSA). We investigated how these intensive aerosol optical properties change when mineral dust layers are mixed with anthropogenic aerosols/pollution in different quantities. In addition, we compared these results for mineral dust from the two source regions that affect the eastern Mediterranean: the Arabian Peninsula and the Saharan desert.
Our data show that all intensive aerosol optical properties (SAE, AAE, SSAAE, g, and SSA) change significantly with increasing pollution in the mineral dust layer, while the differences between the optical properties of mineral dust from the two different source regions are not statistically significant. The values of the intensive aerosol optical properties of Saharan and Arabian dust are similar (within error bars) when comparing data with similar pollution content.
These findings have different implications (i) for the retrieval of mineral dust properties, (ii) for the identification of mineral dust episodes in the atmosphere, and (iii) for the direct radiative effect of mineral dust layers when mixed with pollution.
We highlight that care is needed when retrieving the optical properties of mineral dust because mineral dust layers often contain mixtures of other aerosol components. In particular, when analyzing the differences between mineral dust from different source regions, evaluating the pollution content and comparing only measurements with similar pollution content is essential.
The presence of pollution masks the mineral dust signal because the Ångström exponents (SAE, AAE, and SSAAE) are significantly affected by the presence of pollution. As a result, the identification of mineral dust cases using the Ångström exponents fails in the case of mixtures with pollution particles. Once the presence of mineral dust has been established by independent methods, the Ångström exponents may be helpful in estimating the amount of pollution mixed into the mineral dust layer. Thus, the Ångström exponents can be used to select cases where non-dust aerosols have a minimal effect on the optical properties of mineral dust. Among the Ångström exponents (SAE, AAE, and SSAAE), SAE is the best parameter for estimating the amount of pollution mixed into a mineral dust layer.
Climate-relevant intensive aerosol optical properties (g and SSA) measured in pure mineral dust layers are in agreement with values reported by previous studies. However, differences in the values measured in the Falcon aircraft cabin and values extended to the ambient particle number size distribution point out that differences in the observed intensive aerosol optical properties in various studies may also be attributed to discrepancies in the measured particle diameter size range.
The pollution in a mineral dust layer significantly impacts the climate-relevant intensive aerosol optical properties. The asymmetry parameter and the single-scattering albedo (g and SSA) decrease significantly for increasing pollution content; e.g., from pure mineral dust to polluted mineral dust median measured values decreased from 0.67 (0.63–0.72) to 0.56 (0.50–0.59) and from 0.96 (0.94–0.98) to 0.89 (0.84–0.94), respectively, at 525 nm. We would like to remind the reader that an increase in pollution indicates not only an increase in black carbon particles, but also an increase in other fine-mode anthropogenic aerosol particles, although we quantified the pollution using the refractory black carbon mass. Thus, the changes in g and SSA have two opposite impacts on the shortwave direct radiative effect of the mineral dust layer. The decrease in g due to a decrease in the particle size leads to an increase in the cooling effect at the top of the atmosphere. The decrease in SSA due to increased absorption leads to a decrease in the cooling effect at the top of the atmosphere (or increase in the warming effect).
Based on a simple calculation of the shortwave direct radiative effect efficiency (SW DREE), these two effects are expected to counteract each other over a global average surface albedo. However, the SW DREE can have a significant change for increasing pollution content if the calculation is done considering different surface albedos. For instance, if the mineral dust layer is above a surface with high surface albedo, such as desert or snow, the increase in pollution leads to a reduction of the cooling effect (or an increase in the warming effect). On the contrary, if the mineral dust layer is above a surface with low surface albedo, such as the ocean, an increase in pollution may result in an increase in the cooling effect. Thus, in this case, the effect of decreasing particle size is greater than the effect of increased absorption. However, it is important to note that this latter effect was not statistically significant in our data.
Further studies on the impact of mixing pollution and mineral dust are required to generalize these results. A more sophisticated radiative transfer model may be used to assess the impact of mixing pollution and mineral dust on the direct radiative effect efficiency. Additionally, particles in the mineral dust layer can be found in different mixing states. For example, mineral dust and rBC particles can be found in mixtures with sulfate, while internal mixtures between mineral dust and rBC seem rare. Thus, future studies should also focus on investigating the impact of different mixing states of aerosol particles on the measured optical properties.
In conclusion, we would like to emphasize that an accurate quantification of the pollution content mixed in mineral dust layers is necessary because the presence of pollution has major consequences for the identification of mineral dust episodes and the retrieval of mineral dust optical properties and their direct radiative effect.
Table A1Summary of optical aerosol properties used for the analysis of this study.
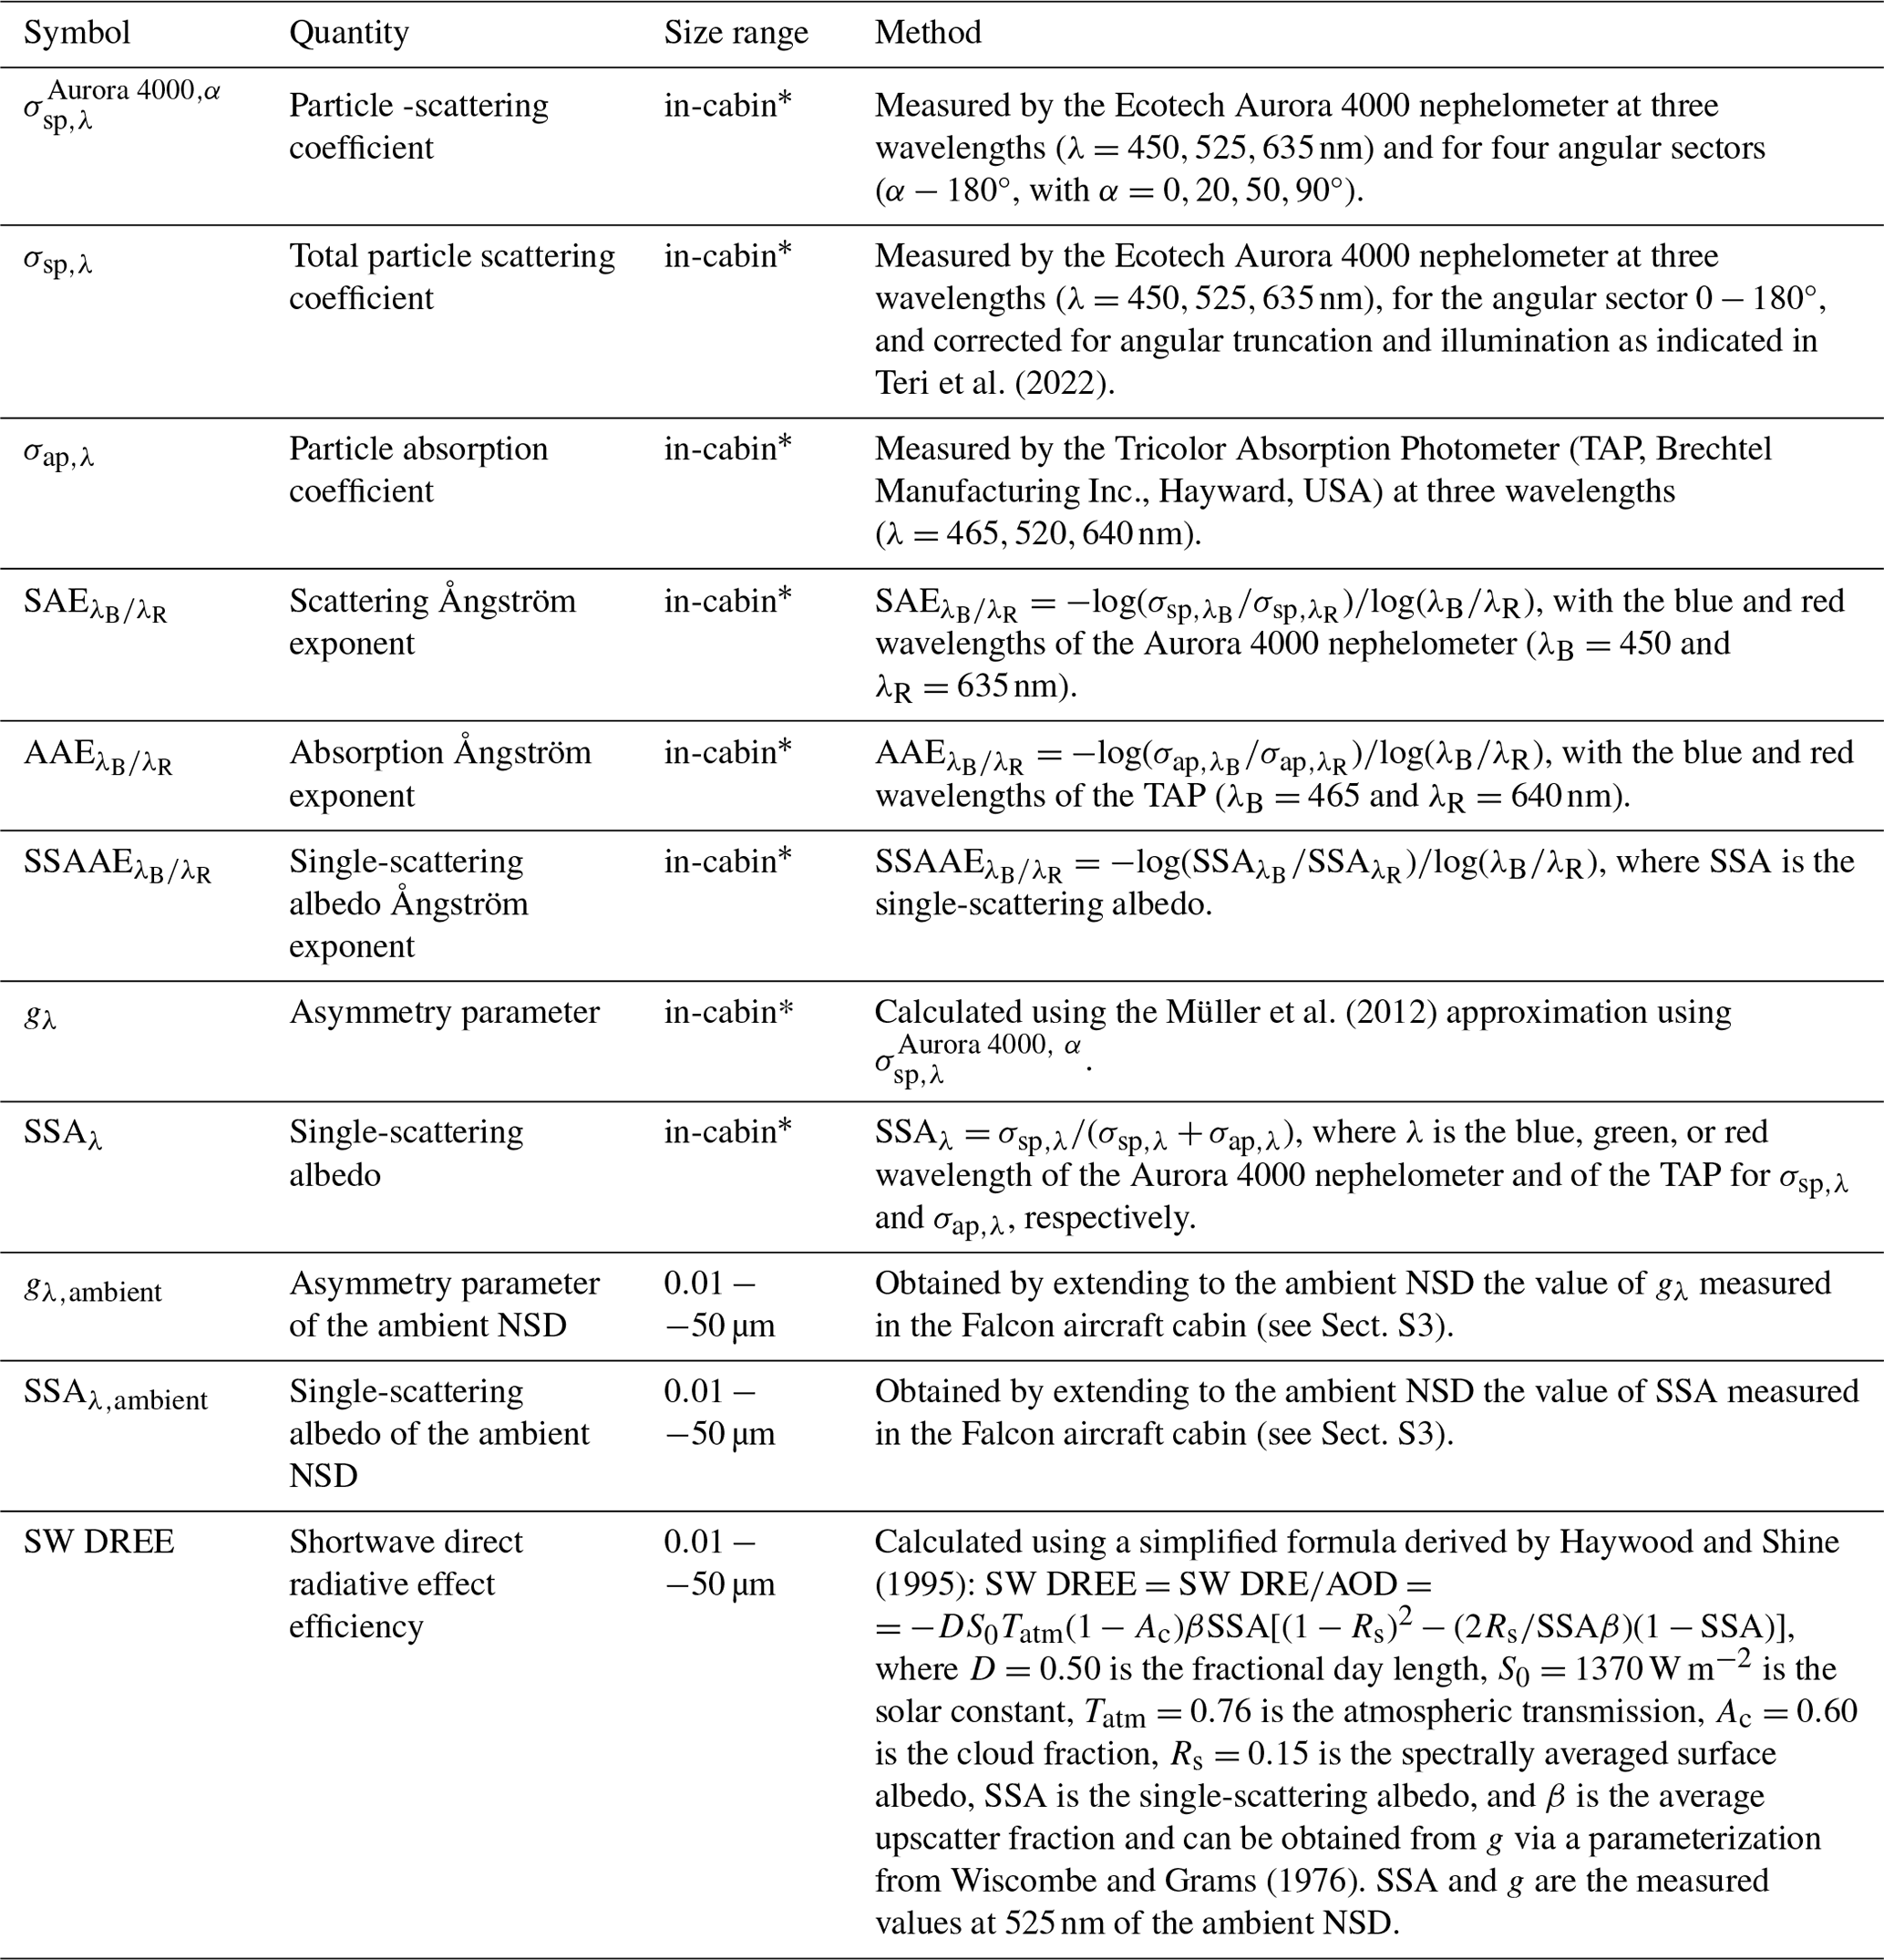
* Size range of aerosol particles passing through the Falcon sampling system. The Falcon inlet and sampling system has a cut-off diameter (i.e., the diameter at which 50 % of the particles pass the inlet and the sampling system) between 2.4 and 6.4 µm for flight altitudes between 2 and 8 km depending on the particle's density (see Table 2 and Fig. 6 in Schöberl et al., 2024).
Table A2Summary of microphysical aerosol properties used for the analysis of this study.
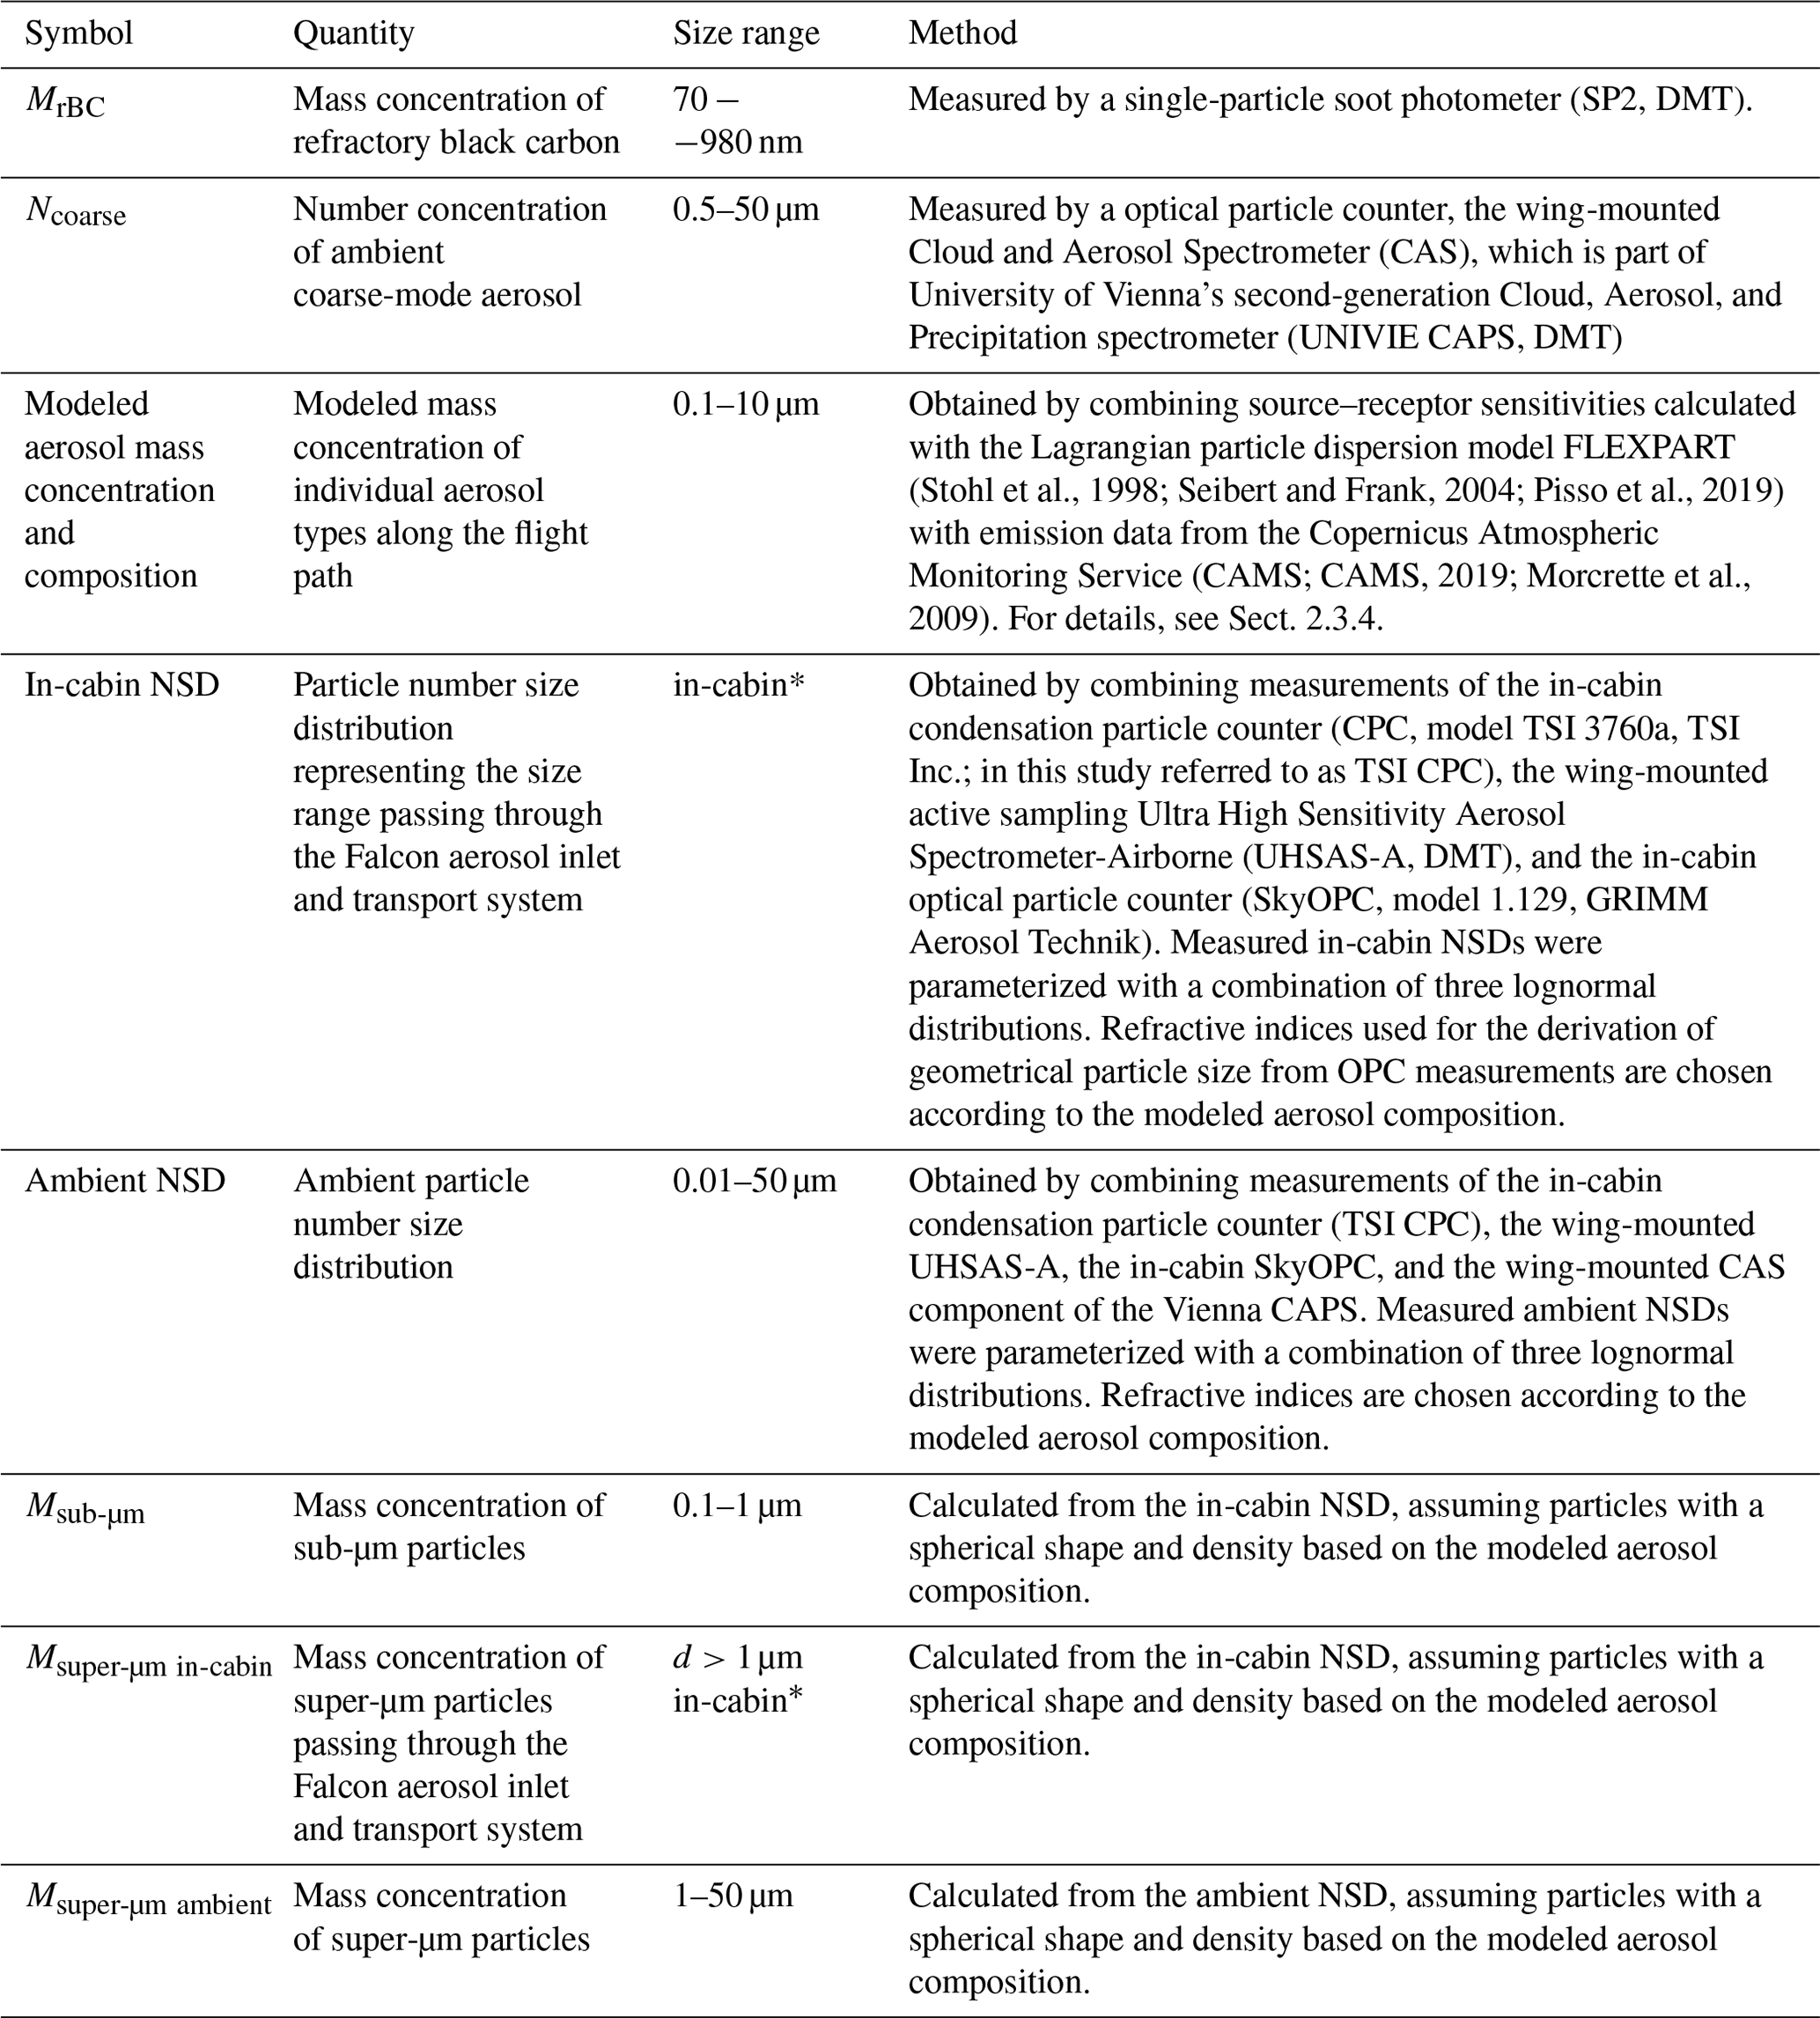
* Size range of aerosol particles passing through the Falcon sampling system. The Falcon inlet and sampling system has a cut-off diameter (i.e., the diameter at which 50 % of the particles pass the inlet and the sampling system) between 2.4 and 6.4 µm for flight altitudes between 2 and 8 km depending on the particle's density (see Table 2 and Fig. 6 in Schöberl et al., 2024).
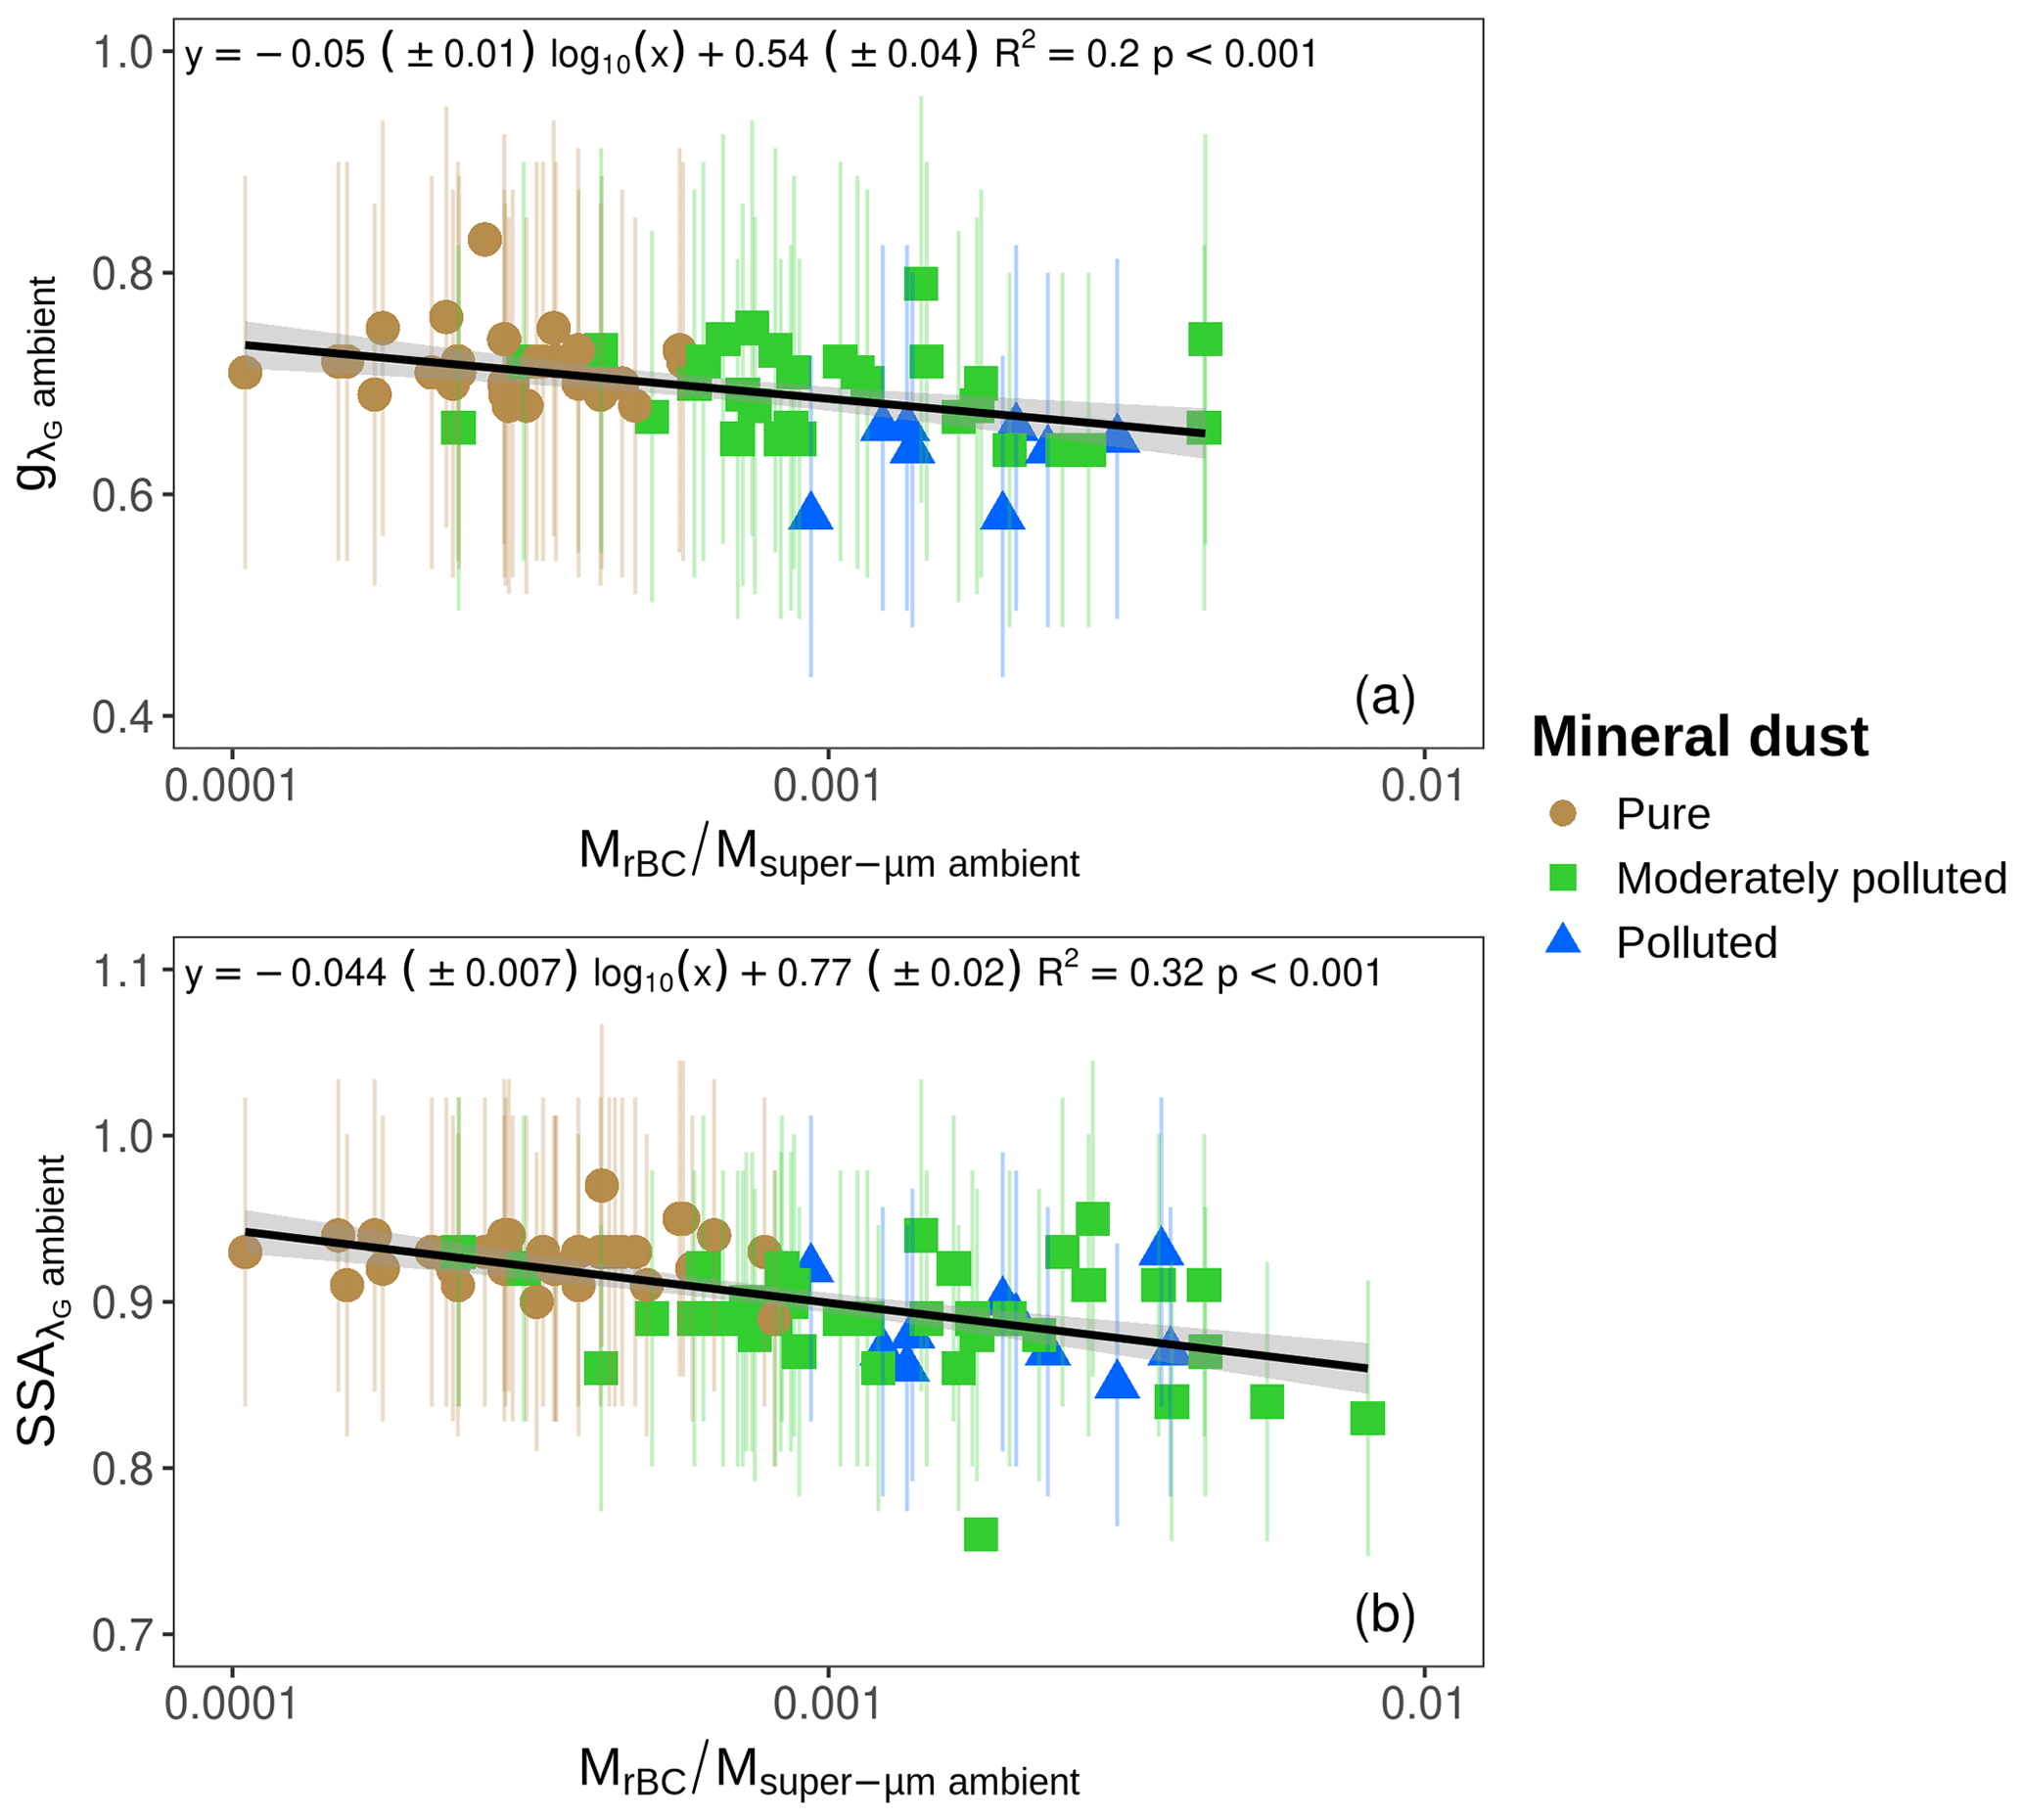
Figure B1Intensive aerosol optical properties (g, and SSA) representative of the ambient NSD (0.01–50 µm). Each panel shows a different intensive optical property as a function of the pollution contribution in terms of mass (MrBC/Msuper-µm ambient). Panel (a) shows the asymmetry parameter (g) at λ=525 nm, and panel (b) shows the single-scattering albedo (SSA) at λ=525 nm. Least-squares regression results, including a regression line and equation, determination coefficient, and p value, are shown in black. The colors and shapes indicate the aerosol types following the A-LIFE aerosol classification scheme. The figure reports results for 87 sequences, among which 37, 40, and 10 are classified as pure, moderately polluted, and polluted mineral dust, respectively. Results for gλ were only available for 66 sequences, among which 29, 29, and 8 are classified as pure, moderately polluted, and polluted mineral dust, respectively.
Table B1Summary statistics for each aerosol type of gλ,ambient and SSAλ,ambient at three wavelengths (λB=450 nm, λG=525 nm, λB=635 nm) representative of the ambient NSD (0.01–50 µm) measured outside the cabin of the Falcon aircraft during A-LIFE for sequences classified as mineral dust by the A-LIFE aerosol classification scheme. The table reports results for 87 sequences, among which 37, 40, and 10 are classified as pure, moderately polluted, and polluted mineral dust, respectively. Results for gλ were only available for 66 sequences, among which 29, 29, and 8 are classified as pure, moderately polluted, and polluted mineral dust, respectively. Median values are reported in bold.
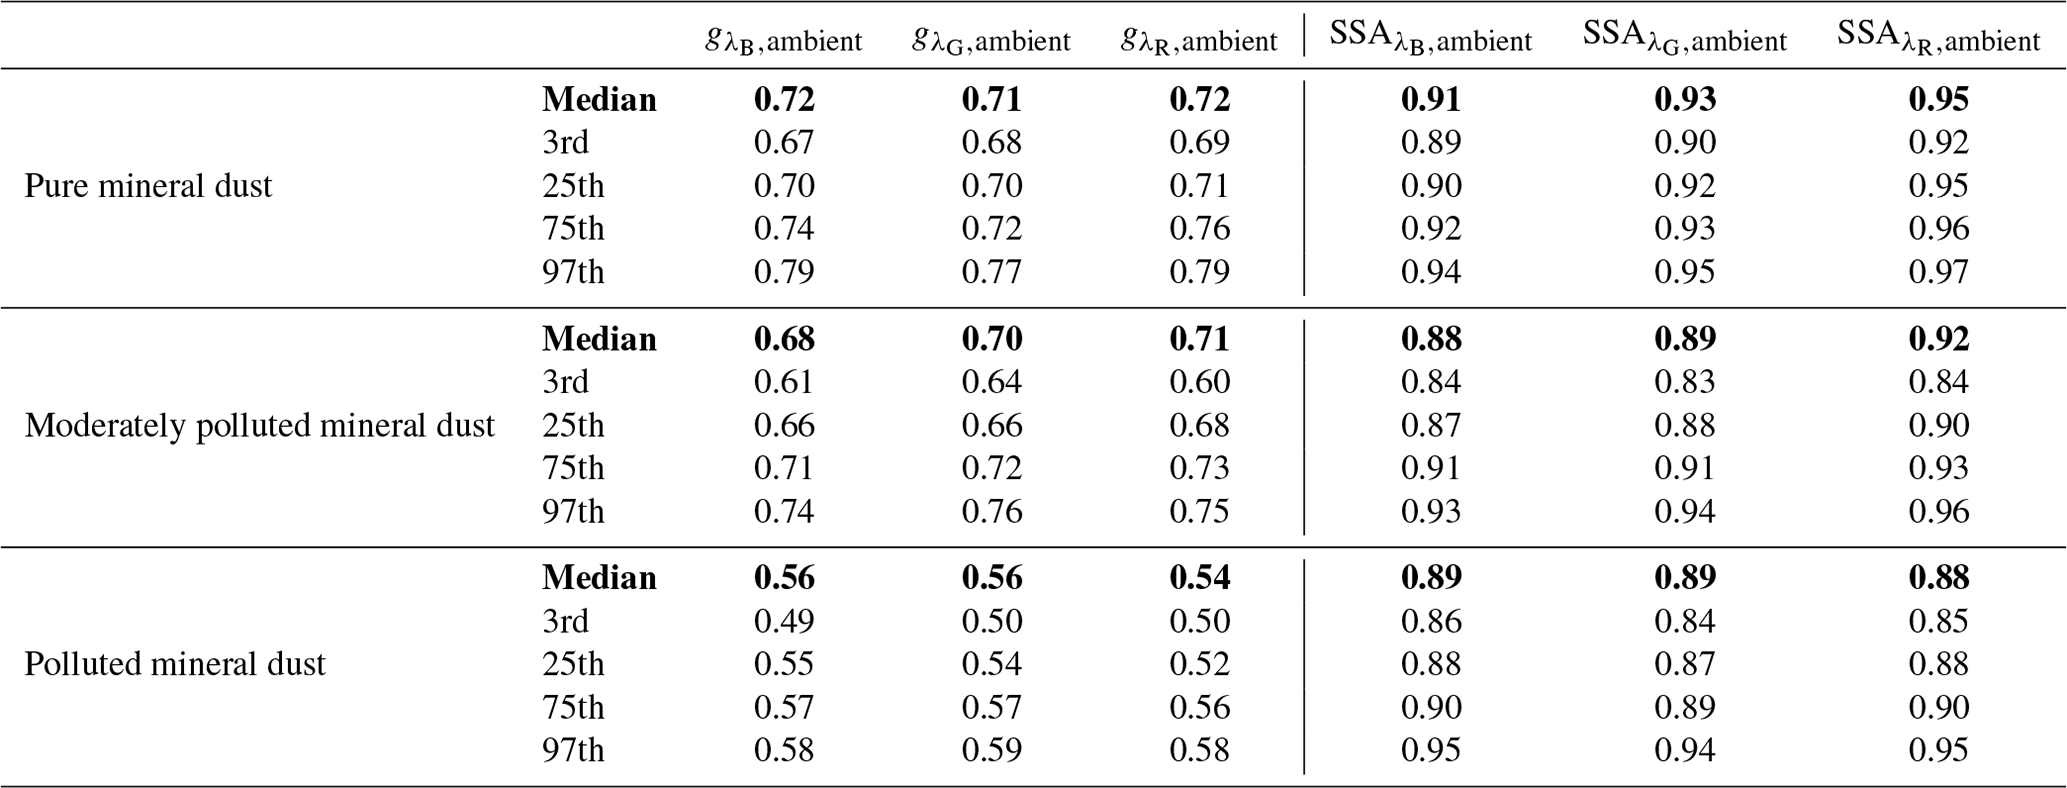
The data used to obtain the results in this paper will be made publicly available in the University of Vienna data archive, Phaidra (https://doi.org/10.25365/phaidra.454, Teri et al., 2025).
The supplement related to this article is available online at https://doi.org/10.5194/acp-25-6633-2025-supplement.
MT and BW conceptualized the study. MT performed the data analysis and wrote the manuscript with the support of BW. BW coordinated the A-LIFE project. BW and MT performed the aerosol optical property measurements during A-LIFE with the support of TM. MT performed the data quality assurance of the aerosol optical properties with the support of JG and BW. JG and MT calculated the simulated aerosol optical properties. BW, MD, and KH performed the aerosol microphysical property measurements during the A-LIFE field campaign. MD, MS, and JG calculated the combined particle number size distribution. KK and SuA performed the single-particle chemistry analysis of samples collected during A-LIFE. AT and PS performed the simulations with the Lagrangian particle dispersion model FLEXPART. All co-authors participated in the scientific discussion and reviewed the manuscript.
The contact author has declared that none of the authors has any competing interests.
The views expressed in this study are those of the authors and do not necessarily represent the views of the CTBTO Preparatory Commission. Neither the European Commission nor the ECMWF or CAMS are responsible for any use and interpretation that may be made of the information.
Publisher’s note: Copernicus Publications remains neutral with regard to jurisdictional claims made in the text, published maps, institutional affiliations, or any other geographical representation in this paper. While Copernicus Publications makes every effort to include appropriate place names, the final responsibility lies with the authors.
We thank the A-LIFE science team for their support and great collaboration. We thank ZAMG (now Geosphere) for providing access to ECMWF data and the CAMS user support team for their support and data provision. We acknowledge the use of imagery from the NASA Worldview application (https://worldview.earthdata.nasa.gov, last access: 3 February 2025), part of the NASA Earth Observing System Data and Information System (EOSDIS). We would like to thank the two reviewers, François Dulac and Darrel Baumgardner; the editor, Andreas Petzold; and Martin Gysel-Beer for their valuable comments and suggestions which helped us to improve the quality of this paper.
The research leading to these results has received funding from the European Research Council (ERC) under the European Union's Horizon 2020 research and innovation program (grant agreement no. 640458, A-LIFE). Konrad Kandler was funded by the Deutsche Forschungsgemeinschaft (DFG, German Research Foundation) under grant nos. 264912134, 378741973, and 416816480. The University of Vienna provided a significant amount of funding for instrumentation, aircraft certification, and personnel for the A-LIFE project. The German Aerospace Center (DLR) funded a significant number of flight hours and aircraft allocation days for the A-LIFE aircraft field experiment. The European Space Agency (ESA; contract no. 4000125810/18/NL/CT/gp (A-CARE)) funded 10 Falcon flight hours to perform EarthCARE-related vertical profiling above or in the vicinity of ground measurement stations. Two EUFAR (EUropean Facility for Airborne Research) projects clustered with A-LIFE funded 16 flight hours. This research has also been supported by the Vienna Doctoral School in Physics (VDSP). Open-access funding was provided by the University of Vienna.
This paper was edited by Andreas Petzold and reviewed by Darrel Baumgardner and François Dulac.
A-LIFE: Absorbing aerosol layers in a changing climate: aging, lifetime and dynamics, Universität Wien, https://www.a-life.at (last access: 3 February 2025), 2017. a, b
Adebiyi, A., Kok, J. F., Murray, B. J., Ryder, C. L., Stuut, J.-B. W., Kahn, R. A., Knippertz, P., Formenti, P., Mahowald, N. M., Pérez García-Pando, C., Klose, M., Ansmann, A., Samset, B. H., Ito, A., Balkanski, Y., Di Biagio, C., Romanias, M. N., Huang, Y., and Meng, J.: A Review of Coarse Mineral Dust in the Earth System, Aeolian Res., 60, 100849, https://doi.org/10.1016/j.aeolia.2022.100849, 2023. a, b
Anderson, T. L. and Ogren, J. A.: Determining Aerosol Radiative Properties Using the TSI 3563 Integrating Nephelometer, Aerosol Sci. Tech., 29, 57–69, https://doi.org/10.1080/02786829808965551, 1998. a
Andrews, E., Sheridan, P. J., Fiebig, M., McComiskey, A., Ogren, J. A., Arnott, P., Covert, D., Elleman, R., Gasparini, R., Collins, D., Jonsson, H., Schmid, B., and Wang, J.: Comparison of Methods for Deriving Aerosol Asymmetry Parameter, J. Geophys. Res.-Atmos., 111, D05S04, https://doi.org/10.1029/2004JD005734, 2006. a, b
Ångström, A.: On the Atmospheric Transmission of Sun Radiation and on Dust in the Air, Geogr. Ann., 11, 156–166, https://doi.org/10.2307/519399, 1929. a, b
Ansmann, A., Petzold, A., Kandler, K., Tegen, I., Wendisch, M., Müller, D., Weinzierl, B., Müller, T., and Heintzenberg, J.: Saharan Mineral Dust Experiments SAMUM–1 and SAMUM–2: What Have We Learned?, Tellus B, 63, 403–429, https://doi.org/10.1111/j.1600-0889.2011.00555.x, 2011. a
Aryasree, S., Kandler, K., Benker, N., Walser, A., Tipka, A., Dollner, M., Seibert, P., and Weinzierl, B.: Vertical Variability in Morphology, Chemistry and Optical Properties of the Transported Saharan Air Layer Measured from Cape Verde and the Caribbean, Roy. Soc. Open Sci., 11, 231433, https://doi.org/10.1098/rsos.231433, 2024. a, b
Attiya, Ali. A. and Jones, B. G.: Assessment of Mineralogical and Chemical Properties of Airborne Dust in Iraq, SN Applied Sciences, 2, 1614, https://doi.org/10.1007/s42452-020-03326-5, 2020. a
Bevans, R.: ANOVA in R | A complete step-by-step guide with examples, Scribbr, https://www.scribbr.com/statistics/anova-in-r/ (last accessed: 13 September 2024), 2023. a
Bond, T. C.: Spectral Dependence of Visible Light Absorption by Carbonaceous Particles Emitted from Coal Combustion, Geophys. Res. Lett., 28, 4075–4078, https://doi.org/10.1029/2001GL013652, 2001. a
Bond, T. C., Doherty, S. J., Fahey, D. W., Forster, P. M., Berntsen, T., DeAngelo, B. J., Flanner, M. G., Ghan, S., Kärcher, B., Koch, D., Kinne, S., Kondo, Y., Quinn, P. K., Sarofim, M. C., Schultz, M. G., Schulz, M., Venkataraman, C., Zhang, H., Zhang, S., Bellouin, N., Guttikunda, S. K., Hopke, P. K., Jacobson, M. Z., Kaiser, J. W., Klimont, Z., Lohmann, U., Schwarz, J. P., Shindell, D., Storelvmo, T., Warren, S. G., and Zender, C. S.: Bounding the Role of Black Carbon in the Climate System: A Scientific Assessment, J. Geophys. Res.-Atmos., 118, 5380–5552, https://doi.org/10.1002/jgrd.50171, 2013. a
CAMS: What are the changes from the MACC Reanalysis to the CAMS interim Reanalysis, to the CAMS Reanalysis?, https://confluence.ecmwf.int/pages/viewpage.action?pageId=83396018, (last access: 9 December 2019), 2019. a, b
Caponi, L., Formenti, P., Massabó, D., Di Biagio, C., Cazaunau, M., Pangui, E., Chevaillier, S., Landrot, G., Andreae, M. O., Kandler, K., Piketh, S., Saeed, T., Seibert, D., Williams, E., Balkanski, Y., Prati, P., and Doussin, J.-F.: Spectral- and size-resolved mass absorption efficiency of mineral dust aerosols in the shortwave spectrum: a simulation chamber study, Atmos. Chem. Phys., 17, 7175–7191, https://doi.org/10.5194/acp-17-7175-2017, 2017. a
Cappa, C. D., Kolesar, K. R., Zhang, X., Atkinson, D. B., Pekour, M. S., Zaveri, R. A., Zelenyuk, A., and Zhang, Q.: Understanding the optical properties of ambient sub- and supermicron particulate matter: results from the CARES 2010 field study in northern California, Atmos. Chem. Phys., 16, 6511–6535, https://doi.org/10.5194/acp-16-6511-2016, 2016. a, b, c, d, e, f, g, h
Cazorla, A., Bahadur, R., Suski, K. J., Cahill, J. F., Chand, D., Schmid, B., Ramanathan, V., and Prather, K. A.: Relating aerosol absorption due to soot, organic carbon, and dust to emission sources determined from in-situ chemical measurements, Atmos. Chem. Phys., 13, 9337–9350, https://doi.org/10.5194/acp-13-9337-2013, 2013. a, b
Charlson, R. J., Langner, J., Rodhe, H., Leovy, C. B., and Warren, S. G.: Perturbation of the Northern Hemisphere Radiative Balance by Backscattering from Anthropogenic Sulfate Aerosols, Tellus A, 43, 152–163, https://doi.org/10.1034/j.1600-0870.1991.00013.x, 1991. a, b, c
Choobari, O. A., Zawar-Reza, P., and Sturman, A.: The Global Distribution of Mineral Dust and Its Impacts on the Climate System: A Review, Atmos. Res., 138, 152–165, https://doi.org/10.1016/j.atmosres.2013.11.007, 2014. a
Clarke, A. D., Shinozuka, Y., Kapustin, V. N., Howell, S., Huebert, B., Doherty, S., Anderson, T., Covert, D., Anderson, J., Hua, X., Moore, K. G., McNaughton, C., Carmichael, G., and Weber, R.: Size Distributions and Mixtures of Dust and Black Carbon Aerosol in Asian Outflow: Physiochemistry and Optical Properties, J. Geophys. Res.-Atmos., 109, D15S09, https://doi.org/10.1029/2003JD004378, 2004. a, b
Collaud Coen, M., Weingartner, E., Schaub, D., Hueglin, C., Corrigan, C., Henning, S., Schwikowski, M., and Baltensperger, U.: Saharan dust events at the Jungfraujoch: detection by wavelength dependence of the single scattering albedo and first climatology analysis, Atmos. Chem. Phys., 4, 2465–2480, https://doi.org/10.5194/acp-4-2465-2004, 2004. a, b, c, d, e
Costabile, F., Barnaba, F., Angelini, F., and Gobbi, G. P.: Identification of key aerosol populations through their size and composition resolved spectral scattering and absorption, Atmos. Chem. Phys., 13, 2455–2470, https://doi.org/10.5194/acp-13-2455-2013, 2013. a, b
Davies, N. W., Fox, C., Szpek, K., Cotterell, M. I., Taylor, J. W., Allan, J. D., Williams, P. I., Trembath, J., Haywood, J. M., and Langridge, J. M.: Evaluating biases in filter-based aerosol absorption measurements using photoacoustic spectroscopy, Atmos. Meas. Tech., 12, 3417–3434, https://doi.org/10.5194/amt-12-3417-2019, 2019. a
Dayan, U., Ricaud, P., Zbinden, R., and Dulac, F.: Atmospheric pollution over the eastern Mediterranean during summer – a review, Atmos. Chem. Phys., 17, 13233–13263, https://doi.org/10.5194/acp-17-13233-2017, 2017. a
Denjean, C., Cassola, F., Mazzino, A., Triquet, S., Chevaillier, S., Grand, N., Bourrianne, T., Momboisse, G., Sellegri, K., Schwarzenbock, A., Freney, E., Mallet, M., and Formenti, P.: Size distribution and optical properties of mineral dust aerosols transported in the western Mediterranean, Atmos. Chem. Phys., 16, 1081–1104, https://doi.org/10.5194/acp-16-1081-2016, 2016. a, b, c, d, e, f, g, h, i, j
Denjean, C., Bourrianne, T., Burnet, F., Mallet, M., Maury, N., Colomb, A., Dominutti, P., Brito, J., Dupuy, R., Sellegri, K., Schwarzenboeck, A., Flamant, C., and Knippertz, P.: Overview of aerosol optical properties over southern West Africa from DACCIWA aircraft measurements, Atmos. Chem. Phys., 20, 4735–4756, https://doi.org/10.5194/acp-20-4735-2020, 2020. a, b, c, d, e, f, g, h
Di Biagio, C., Formenti, P., Balkanski, Y., Caponi, L., Cazaunau, M., Pangui, E., Journet, E., Nowak, S., Andreae, M. O., Kandler, K., Saeed, T., Piketh, S., Seibert, D., Williams, E., and Doussin, J.-F.: Complex refractive indices and single-scattering albedo of global dust aerosols in the shortwave spectrum and relationship to size and iron content, Atmos. Chem. Phys., 19, 15503–15531, https://doi.org/10.5194/acp-19-15503-2019, 2019. a, b
Dollner, M., Gasteiger, J., Schöberl, M., Gattringer, A., Beres, N. D., Bui, T. P., Diskin, G., and Weinzierl, B.: The Cloud Indicator: A Novel Algorithm for Automatic Detection and Classification of Clouds Using Airborne in Situ Observations, Atmos. Res., 308, 107504, https://doi.org/10.1016/j.atmosres.2024.107504, 2024. a, b
Ealo, M., Alastuey, A., Ripoll, A., Pérez, N., Minguillón, M. C., Querol, X., and Pandolfi, M.: Detection of Saharan dust and biomass burning events using near-real-time intensive aerosol optical properties in the north-western Mediterranean, Atmos. Chem. Phys., 16, 12567–12586, https://doi.org/10.5194/acp-16-12567-2016, 2016. a, b, c, d
Engelbrecht, J. P., McDonald, E. V., Gillies, J. A., “Jay” Jayanty, R. K., Casuccio, G., and Gertler, A. W.: Characterizing Mineral Dusts and Other Aerosols from the Middle East – Part 2: Grab Samples and Re-Suspensions, Inhal. Toxicol., 21, 327–336, https://doi.org/10.1080/08958370802464299, 2009. a
Engelbrecht, J. P., Moosmüller, H., Pincock, S., Jayanty, R. K. M., Lersch, T., and Casuccio, G.: Technical note: Mineralogical, chemical, morphological, and optical interrelationships of mineral dust re-suspensions, Atmos. Chem. Phys., 16, 10809–10830, https://doi.org/10.5194/acp-16-10809-2016, 2016. a
Esteve, A., Estellés, V., Utrillas, M., and Martínez-Lozano, J.: In-Situ Integrating Nephelometer Measurements of the Scattering Properties of Atmospheric Aerosols at an Urban Coastal Site in Western Mediterranean, Atmos. Environ., 47, 43–50, https://doi.org/10.1016/j.atmosenv.2011.11.043, 2012. a
Filioglou, M., Giannakaki, E., Backman, J., Kesti, J., Hirsikko, A., Engelmann, R., O'Connor, E., Leskinen, J. T. T., Shang, X., Korhonen, H., Lihavainen, H., Romakkaniemi, S., and Komppula, M.: Optical and geometrical aerosol particle properties over the United Arab Emirates, Atmos. Chem. Phys., 20, 8909–8922, https://doi.org/10.5194/acp-20-8909-2020, 2020. a
Formenti, P., Elbert, W., Maenhaut, W., Haywood, J., and Andreae, M. O.: Chemical Composition of Mineral Dust Aerosol during the Saharan Dust Experiment (SHADE) Airborne Campaign in the Cape Verde Region, September 2000, J. Geophys. Res.-Atmos., 108, 8576, https://doi.org/10.1029/2002JD002648, 2003. a
Formenti, P., Rajot, J. L., Desboeufs, K., Saïd, F., Grand, N., Chevaillier, S., and Schmechtig, C.: Airborne observations of mineral dust over western Africa in the summer Monsoon season: spatial and vertical variability of physico-chemical and optical properties, Atmos. Chem. Phys., 11, 6387–6410, https://doi.org/10.5194/acp-11-6387-2011, 2011a. a, b, c, d, e
Formenti, P., Schütz, L., Balkanski, Y., Desboeufs, K., Ebert, M., Kandler, K., Petzold, A., Scheuvens, D., Weinbruch, S., and Zhang, D.: Recent progress in understanding physical and chemical properties of African and Asian mineral dust, Atmos. Chem. Phys., 11, 8231–8256, https://doi.org/10.5194/acp-11-8231-2011, 2011b. a
Gasteiger, J., Wiegner, M., GROß, S., Freudenthaler, V., Toledano, C., Tesche, M., and Kandler, K.: Modelling Lidar-Relevant Optical Properties of Complex Mineral Dust Aerosols, Tellus B, 63, 725–741, https://doi.org/10.1111/j.1600-0889.2011.00559.x, 2011. a
Granados-Muñoz, M. J., Sicard, M., Papagiannopoulos, N., Barragán, R., Bravo-Aranda, J. A., and Nicolae, D.: Two-dimensional mineral dust radiative effect calculations from CALIPSO observations over Europe, Atmos. Chem. Phys., 19, 13157–13173, https://doi.org/10.5194/acp-19-13157-2019, 2019. a
Groß, S., Esselborn, M., Weinzierl, B., Wirth, M., Fix, A., and Petzold, A.: Aerosol classification by airborne high spectral resolution lidar observations, Atmos. Chem. Phys., 13, 2487–2505, https://doi.org/10.5194/acp-13-2487-2013, 2013. a
Groß, S., Freudenthaler, V., Haarig, M., Ansmann, A., Toledano, C., Mateos, D., Seibert, P., Mamouri, R.-E., Nisantzi, A., Gasteiger, J., Dollner, M., Tipka, A., Schöberl, M., Teri, M., and Weinzierl, B.: Characterization of aerosol over the Eastern Mediterranean by polarization sensitive Raman lidar measurements during A-LIFE – aerosol type classification and type separation, EGUsphere [preprint], https://doi.org/10.5194/egusphere-2024-140, 2024. a
Gyawali, M., Arnott, W. P., Zaveri, R. A., Song, C., Moosmüller, H., Liu, L., Mishchenko, M. I., Chen, L.-W. A., Green, M. C., Watson, J. G., and Chow, J. C.: Photoacoustic optical properties at UV, VIS, and near IR wavelengths for laboratory generated and winter time ambient urban aerosols, Atmos. Chem. Phys., 12, 2587–2601, https://doi.org/10.5194/acp-12-2587-2012, 2012. a
Hassan, T., Moosmüller, H., and Chung, C. E.: Coefficients of an Analytical Aerosol Forcing Equation Determined with a Monte-Carlo Radiation Model, J. Quant. Spectrosc. Ra., 164, 129–136, https://doi.org/10.1016/j.jqsrt.2015.05.015, 2015. a
Haywood, J. M. and Shine, K. P.: The Effect of Anthropogenic Sulfate and Soot Aerosol on the Clear Sky Planetary Radiation Budget, Geophys. Res. Lett., 22, 603–606, https://doi.org/10.1029/95GL00075, 1995. a, b, c, d, e, f, g, h, i, j, k, l, m
Heintzenberg, J.: The SAMUM-1 Experiment over Southern Morocco: Overview and Introduction, Tellus B, 61, 2–11, https://doi.org/10.1111/j.1600-0889.2008.00403.x, 2009. a
Horvath, H., Alados Arboledas, L., and Olmo Reyes, F. J.: Angular scattering of the Sahara dust aerosol, Atmos. Chem. Phys., 18, 17735–17744, https://doi.org/10.5194/acp-18-17735-2018, 2018. a, b, c, d
Hu, Q., Wang, H., Goloub, P., Li, Z., Veselovskii, I., Podvin, T., Li, K., and Korenskiy, M.: The characterization of Taklamakan dust properties using a multiwavelength Raman polarization lidar in Kashi, China, Atmos. Chem. Phys., 20, 13817–13834, https://doi.org/10.5194/acp-20-13817-2020, 2020. a
Hu, X., Sun, J., Xia, C., Shen, X., Zhang, Y., Liu, Q., Liu, Z., Zhang, S., Wang, J., Yu, A., Lu, J., Liu, S., and Zhang, X.: Measurement report: Rapid decline of aerosol absorption coefficient and aerosol optical property effects on radiative forcing in an urban area of Beijing from 2018 to 2021, Atmos. Chem. Phys., 23, 5517–5531, https://doi.org/10.5194/acp-23-5517-2023, 2023. a
Kandler, K., Benker, N., Bundke, U., Cuevas, E., Ebert, M., Knippertz, P., Rodríguez, S., Schütz, L., and Weinbruch, S.: Chemical Composition and Complex Refractive Index of Saharan Mineral Dust at Izaña, Tenerife (Spain) Derived by Electron Microscopy, Atmos. Environ., 41, 8058–8074, https://doi.org/10.1016/j.atmosenv.2007.06.047, 2007. a, b
Kandler, K., SchüTZ, L., Deutscher, C., Ebert, M., Hofmann, H., JäCKEL, S., Jaenicke, R., Knippertz, P., Lieke, K., Massling, A., Petzold, A., Schladitz, A., Weinzierl, B., Wiedensohler, A., Zorn, S., and Weinbruch, S.: Size Distribution, Mass Concentration, Chemical and Mineralogical Composition and Derived Optical Parameters of the Boundary Layer Aerosol at Tinfou, Morocco, during SAMUM 2006, Tellus B, 61, 32–50, https://doi.org/10.1111/j.1600-0889.2008.00385.x, 2009. a
Kandler, K., Lieke, K., Benker, N., Emmel, C., Küpper, M., Müller-Ebert, D., Ebert, M., Scheuvens, D., Schladitz, A., Schütz, L., and Weinbruch, S.: Electron Microscopy of Particles Collected at Praia, Cape Verde, during the Saharan Mineral Dust Experiment: Particle Chemistry, Shape, Mixing State and Complex Refractive Index, Tellus B, 63, 475–496, https://doi.org/10.1111/j.1600-0889.2011.00550.x, 2011. a, b
Kandler, K., Schneiders, K., Heuser, J., Waza, A., Aryasree, S., Althausen, D., Hofer, J., Abdullaev, S. F., and Makhmudov, A. N.: Differences and Similarities of Central Asian, African, and Arctic Dust Composition from a Single Particle Perspective, Atmosphere, 11, 269, https://doi.org/10.3390/atmos11030269, 2020. a
Kaskaoutis, D., Grivas, G., Stavroulas, I., Bougiatioti, A., Liakakou, E., Dumka, U., Gerasopoulos, E., and Mihalopoulos, N.: Apportionment of Black and Brown Carbon Spectral Absorption Sources in the Urban Environment of Athens, Greece, during Winter, Sci. Total Environ., 801, 149739, https://doi.org/10.1016/j.scitotenv.2021.149739, 2021. a
Kim, D., Chin, M., Yu, H., Eck, T. F., Sinyuk, A., Smirnov, A., and Holben, B. N.: Dust optical properties over North Africa and Arabian Peninsula derived from the AERONET dataset, Atmos. Chem. Phys., 11, 10733–10741, https://doi.org/10.5194/acp-11-10733-2011, 2011. a, b, c
Kok, J. F., Ridley, D. A., Zhou, Q., Miller, R. L., Zhao, C., Heald, C. L., Ward, D. S., Albani, S., and Haustein, K.: Smaller Desert Dust Cooling Effect Estimated from Analysis of Dust Size and Abundance, Nat. Geosci., 10, 274–278, https://doi.org/10.1038/ngeo2912, 2017. a, b
Kok, J. F., Storelvmo, T., Karydis, V. A., Adebiyi, A. A., Mahowald, N. M., Evan, A. T., He, C., and Leung, D. M.: Mineral Dust Aerosol Impacts on Global Climate and Climate Change, Nature Reviews Earth & Environment, 4, 71–86, https://doi.org/10.1038/s43017-022-00379-5, 2023. a, b, c
Lee, S., Yoon, S.-C., Kim, S.-W., Kim, Y. P., Ghim, Y. S., Kim, J.-H., Kang, C.-H., Kim, Y. J., Chang, L.-S., and Lee, S.-J.: Spectral Dependency of Light Scattering/Absorption and Hygroscopicity of Pollution and Dust Aerosols in Northeast Asia, Atmos. Environ. 50, 246–254, https://doi.org/10.1016/j.atmosenv.2011.12.026, 2012. a, b
Li, L., Mahowald, N. M., Miller, R. L., Pérez García-Pando, C., Klose, M., Hamilton, D. S., Gonçalves Ageitos, M., Ginoux, P., Balkanski, Y., Green, R. O., Kalashnikova, O., Kok, J. F., Obiso, V., Paynter, D., and Thompson, D. R.: Quantifying the range of the dust direct radiative effect due to source mineralogy uncertainty, Atmos. Chem. Phys., 21, 3973–4005, https://doi.org/10.5194/acp-21-3973-2021, 2021. a
Liu, C., Chung, C. E., Yin, Y., and Schnaiter, M.: The absorption Ångström exponent of black carbon: from numerical aspects, Atmos. Chem. Phys., 18, 6259–6273, https://doi.org/10.5194/acp-18-6259-2018, 2018. a
Liu, S., Aiken, A. C., Gorkowski, K., Dubey, M. K., Cappa, C. D., Williams, L. R., Herndon, S. C., Massoli, P., Fortner, E. C., Chhabra, P. S., Brooks, W. A., Onasch, T. B., Jayne, J. T., Worsnop, D. R., China, S., Sharma, N., Mazzoleni, C., Xu, L., Ng, N. L., Liu, D., Allan, J. D., Lee, J. D., Fleming, Z. L., Mohr, C., Zotter, P., Szidat, S., and Prévôt, A. S. H.: Enhanced Light Absorption by Mixed Source Black and Brown Carbon Particles in UK Winter, Nat. Commun., 6, 8435, https://doi.org/10.1038/ncomms9435, 2015. a
Mallet, M., Dulac, F., Formenti, P., Nabat, P., Sciare, J., Roberts, G., Pelon, J., Ancellet, G., Tanré, D., Parol, F., Denjean, C., Brogniez, G., di Sarra, A., Alados-Arboledas, L., Arndt, J., Auriol, F., Blarel, L., Bourrianne, T., Chazette, P., Chevaillier, S., Claeys, M., D'Anna, B., Derimian, Y., Desboeufs, K., Di Iorio, T., Doussin, J.-F., Durand, P., Féron, A., Freney, E., Gaimoz, C., Goloub, P., Gómez-Amo, J. L., Granados-Muñoz, M. J., Grand, N., Hamonou, E., Jankowiak, I., Jeannot, M., Léon, J.-F., Maillé, M., Mailler, S., Meloni, D., Menut, L., Momboisse, G., Nicolas, J., Podvin, T., Pont, V., Rea, G., Renard, J.-B., Roblou, L., Schepanski, K., Schwarzenboeck, A., Sellegri, K., Sicard, M., Solmon, F., Somot, S., Torres, B., Totems, J., Triquet, S., Verdier, N., Verwaerde, C., Waquet, F., Wenger, J., and Zapf, P.: Overview of the Chemistry-Aerosol Mediterranean Experiment/Aerosol Direct Radiative Forcing on the Mediterranean Climate (ChArMEx/ADRIMED) summer 2013 campaign, Atmos. Chem. Phys., 16, 455–504, https://doi.org/10.5194/acp-16-455-2016, 2016. a
Mamouri, R.-E., Ansmann, A., Nisantzi, A., Solomos, S., Kallos, G., and Hadjimitsis, D. G.: Extreme dust storm over the eastern Mediterranean in September 2015: satellite, lidar, and surface observations in the Cyprus region, Atmos. Chem. Phys., 16, 13711–13724, https://doi.org/10.5194/acp-16-13711-2016, 2016. a
Moosmüller, H. and Chakrabarty, R. K.: Technical Note: Simple analytical relationships between Ångström coefficients of aerosol extinction, scattering, absorption, and single scattering albedo, Atmos. Chem. Phys., 11, 10677–10680, https://doi.org/10.5194/acp-11-10677-2011, 2011. a
Morcrette, J.-J., Boucher, O., Jones, L., Salmond, D., Bechtold, P., Beljaars, A., Benedetti, A., Bonet, A., Kaiser, J. W., Razinger, M., Schulz, M., Serrar, S., Simmons, A. J., Sofiev, M., Suttie, M., Tompkins, A. M., and Untch, A.: Aerosol Analysis and Forecast in the European Centre for Medium-Range Weather Forecasts Integrated Forecast System: Forward Modeling, J. Geophys. Res.-Atmos., 114, D06206, https://doi.org/10.1029/2008JD011235, 2009. a, b
Moteki, N., Kondo, Y., and Nakamura, S.-I.: Method to Measure Refractive Indices of Small Nonspherical Particles: Application to Black Carbon Particles, J. Aerosol Sci., 41, 513–521, https://doi.org/10.1016/j.jaerosci.2010.02.013, 2010. a
Müller, T., Schladitz, A., Kandler, K., and Wiedensohler, A.: Spectral Particle Absorption Coefficients, Single Scattering Albedos and Imaginary Parts of Refractive Indices from Ground Based in Situ Measurements at Cape Verde Island during SAMUM-2, Tellus B, 63, 573–588, https://doi.org/10.1111/j.1600-0889.2011.00572.x, 2011. a, b, c
Müller, T., Paixão, M., Pfeifer, S., and Wiedensohler, A.: Scattering Coefficients and Asymmetry Parameters derived from the Polar Nephelometer Aurora4000, in: European Aerosol Conference EAC 2012, Granada, Zenodo, https://doi.org/10.5281/zenodo.5588445, 2012. a, b, c
Murphy, D. M., Cziczo, D. J., Hudson, P. K., Thomson, D. S., Wilson, J. C., Kojima, T., and Buseck, P. R.: Particle Generation and Resuspension in Aircraft Inlets When Flying in Clouds, Aerosol Sci. Tech., 38, 401–409, https://doi.org/10.1080/02786820490443094, 2004. a
Nisantzi, A., Mamouri, R. E., Ansmann, A., Schuster, G. L., and Hadjimitsis, D. G.: Middle East versus Saharan dust extinction-to-backscatter ratios, Atmos. Chem. Phys., 15, 7071–7084, https://doi.org/10.5194/acp-15-7071-2015, 2015. a, b
Ohata, S., Mori, T., Kondo, Y., Sharma, S., Hyvärinen, A., Andrews, E., Tunved, P., Asmi, E., Backman, J., Servomaa, H., Veber, D., Eleftheriadis, K., Vratolis, S., Krejci, R., Zieger, P., Koike, M., Kanaya, Y., Yoshida, A., Moteki, N., Zhao, Y., Tobo, Y., Matsushita, J., and Oshima, N.: Estimates of mass absorption cross sections of black carbon for filter-based absorption photometers in the Arctic, Atmos. Meas. Tech., 14, 6723–6748, https://doi.org/10.5194/amt-14-6723-2021, 2021. a
Pandolfi, M., Alados-Arboledas, L., Alastuey, A., Andrade, M., Angelov, C., Artiñano, B., Backman, J., Baltensperger, U., Bonasoni, P., Bukowiecki, N., Collaud Coen, M., Conil, S., Coz, E., Crenn, V., Dudoitis, V., Ealo, M., Eleftheriadis, K., Favez, O., Fetfatzis, P., Fiebig, M., Flentje, H., Ginot, P., Gysel, M., Henzing, B., Hoffer, A., Holubova Smejkalova, A., Kalapov, I., Kalivitis, N., Kouvarakis, G., Kristensson, A., Kulmala, M., Lihavainen, H., Lunder, C., Luoma, K., Lyamani, H., Marinoni, A., Mihalopoulos, N., Moerman, M., Nicolas, J., O'Dowd, C., Petäjä, T., Petit, J.-E., Pichon, J. M., Prokopciuk, N., Putaud, J.-P., Rodríguez, S., Sciare, J., Sellegri, K., Swietlicki, E., Titos, G., Tuch, T., Tunved, P., Ulevicius, V., Vaishya, A., Vana, M., Virkkula, A., Vratolis, S., Weingartner, E., Wiedensohler, A., and Laj, P.: A European aerosol phenomenology – 6: scattering properties of atmospheric aerosol particles from 28 ACTRIS sites, Atmos. Chem. Phys., 18, 7877–7911, https://doi.org/10.5194/acp-18-7877-2018, 2018. a, b
Petzold, A., Rasp, K., Weinzierl, B., Esselborn, M., Hamburger, T., Dörnbrack, A., Kandler, K., Schütz, L., Knippertz, P., Fiebig, M., and Virkkula, A.: Saharan Dust Absorption and Refractive Index from Aircraft-Based Observations during SAMUM 2006, Tellus B, 61, 118–130, https://doi.org/10.1111/j.1600-0889.2008.00383.x, 2009. a, b
Petzold, A., Veira, A., Mund, S., Esselborn, M., Kiemle, C., Weinzierl, B., Hamburger, T., Ehret, G., Lieke, K., and Kandler, K.: Mixing of Mineral Dust with Urban Pollution Aerosol over Dakar (Senegal): Impact on Dust Physico-Chemical and Radiative Properties, Tellus B, 63, 619–634, https://doi.org/10.1111/j.1600-0889.2011.00547.x, 2011. a, b, c
Pisso, I., Sollum, E., Grythe, H., Kristiansen, N. I., Cassiani, M., Eckhardt, S., Arnold, D., Morton, D., Thompson, R. L., Groot Zwaaftink, C. D., Evangeliou, N., Sodemann, H., Haimberger, L., Henne, S., Brunner, D., Burkhart, J. F., Fouilloux, A., Brioude, J., Philipp, A., Seibert, P., and Stohl, A.: The Lagrangian particle dispersion model FLEXPART version 10.4, Geosci. Model Dev., 12, 4955–4997, https://doi.org/10.5194/gmd-12-4955-2019, 2019. a, b
Quinn, P. K., Coffman, D. J., Bates, T. S., Welton, E. J., Covert, D. S., Miller, T. L., Johnson, J. E., Maria, S., Russell, L., Arimoto, R., Carrico, C. M., Rood, M. J., and Anderson, J.: Aerosol Optical Properties Measured on Board the Ronald H. Brown during ACE-Asia as a Function of Aerosol Chemical Composition and Source Region, J. Geophys. Res.-Atmos., 109, D19S01, https://doi.org/10.1029/2003JD004010, 2004. a
R Core Team: R: A Language and Environment for Statistical Computing, R Foundation for Statistical Computing, Vienna, Austria, https://www.R-project.org/ (last access: 3 February 2025), 2021. a
Riemer, N., Ault, A. P., West, M., Craig, R. L., and Curtis, J. H.: Aerosol Mixing State: Measurements, Modeling, and Impacts, Rev. Geophys., 57, 187–249, https://doi.org/10.1029/2018RG000615, 2019. a
Russell, P. B., Bergstrom, R. W., Shinozuka, Y., Clarke, A. D., DeCarlo, P. F., Jimenez, J. L., Livingston, J. M., Redemann, J., Dubovik, O., and Strawa, A.: Absorption Angstrom Exponent in AERONET and related data as an indicator of aerosol composition, Atmos. Chem. Phys., 10, 1155–1169, https://doi.org/10.5194/acp-10-1155-2010, 2010. a, b
Ryder, C. L., Highwood, E. J., Rosenberg, P. D., Trembath, J., Brooke, J. K., Bart, M., Dean, A., Crosier, J., Dorsey, J., Brindley, H., Banks, J., Marsham, J. H., McQuaid, J. B., Sodemann, H., and Washington, R.: Optical properties of Saharan dust aerosol and contribution from the coarse mode as measured during the Fennec 2011 aircraft campaign, Atmos. Chem. Phys., 13, 303–325, https://doi.org/10.5194/acp-13-303-2013, 2013. a, b, c
Ryder, C. L., Marenco, F., Brooke, J. K., Estelles, V., Cotton, R., Formenti, P., McQuaid, J. B., Price, H. C., Liu, D., Ausset, P., Rosenberg, P. D., Taylor, J. W., Choularton, T., Bower, K., Coe, H., Gallagher, M., Crosier, J., Lloyd, G., Highwood, E. J., and Murray, B. J.: Coarse-mode mineral dust size distributions, composition and optical properties from AER-D aircraft measurements over the tropical eastern Atlantic, Atmos. Chem. Phys., 18, 17225–17257, https://doi.org/10.5194/acp-18-17225-2018, 2018. a, b, c, d, e
Sandradewi, J., Prévôt, A. S. H., Szidat, S., Perron, N., Alfarra, M. R., Lanz, V. A., Weingartner, E., and Baltensperger, U.: Using Aerosol Light Absorption Measurements for the Quantitative Determination of Wood Burning and Traffic Emission Contributions to Particulate Matter, Environ. Sci. Technol., 42, 3316–3323, https://doi.org/10.1021/es702253m, 2008. a
Schladitz, A., MüLLER, T., Kaaden, N., Massling, A., Kandler, K., Ebert, M., Weinbruch, S., Deutscher, C., and Wiedensohler, A.: In Situ Measurements of Optical Properties at Tinfou (Morocco) during the Saharan Mineral Dust Experiment SAMUM 2006, Tellus B, 61, 64–78, https://doi.org/10.1111/j.1600-0889.2008.00397.x, 2009. a, b
Schmeisser, L., Andrews, E., Ogren, J. A., Sheridan, P., Jefferson, A., Sharma, S., Kim, J. E., Sherman, J. P., Sorribas, M., Kalapov, I., Arsov, T., Angelov, C., Mayol-Bracero, O. L., Labuschagne, C., Kim, S.-W., Hoffer, A., Lin, N.-H., Chia, H.-P., Bergin, M., Sun, J., Liu, P., and Wu, H.: Classifying aerosol type using in situ surface spectral aerosol optical properties, Atmos. Chem. Phys., 17, 12097–12120, https://doi.org/10.5194/acp-17-12097-2017, 2017. a
Schöberl, M., Dollner, M., Gasteiger, J., Seibert, P., Tipka, A., and Weinzierl, B.: Characterization of the airborne aerosol inlet and transport system used during the A-LIFE aircraft field experiment, Atmos. Meas. Tech., 17, 2761–2776, https://doi.org/10.5194/amt-17-2761-2024, 2024. a, b, c, d, e, f
Schuster, G. L., Dubovik, O., and Holben, B. N.: Angstrom Exponent and Bimodal Aerosol Size Distributions, J. Geophys. Res.-Atmos., 111, D07207, https://doi.org/10.1029/2005JD006328, 2006. a
Schuster, G. L., Vaughan, M., MacDonnell, D., Su, W., Winker, D., Dubovik, O., Lapyonok, T., and Trepte, C.: Comparison of CALIPSO aerosol optical depth retrievals to AERONET measurements, and a climatology for the lidar ratio of dust, Atmos. Chem. Phys., 12, 7431–7452, https://doi.org/10.5194/acp-12-7431-2012, 2012. a, b
Schwarz, J. P., Gao, R. S., Spackman, J. R., Watts, L. A., Thomson, D. S., Fahey, D. W., Ryerson, T. B., Peischl, J., Holloway, J. S., Trainer, M., Frost, G. J., Baynard, T., Lack, D. A., de Gouw, J. A., Warneke, C., and Del Negro, L. A.: Measurement of the Mixing State, Mass, and Optical Size of Individual Black Carbon Particles in Urban and Biomass Burning Emissions, Geophys. Res. Lett., 35, L13810, https://doi.org/10.1029/2008GL033968, 2008. a
Schwarz, J. P., Spackman, J. R., Gao, R. S., Perring, A. E., Cross, E., Onasch, T. B., Ahern, A., Wrobel, W., Davidovits, P., Olfert, J., Dubey, M. K., Mazzoleni, C., and Fahey, D. W.: The Detection Efficiency of the Single Particle Soot Photometer, Aerosol Sci. Tech., 44, 612–628, https://doi.org/10.1080/02786826.2010.481298, 2010. a
Seibert, P. and Frank, A.: Source-receptor matrix calculation with a Lagrangian particle dispersion model in backward mode, Atmos. Chem. Phys., 4, 51–63, https://doi.org/10.5194/acp-4-51-2004, 2004. a, b
Seinfeld, J. H., Carmichael, G. R., Arimoto, R., Conant, W. C., Brechtel, F. J., Bates, T. S., Cahill, T. A., Clarke, A. D., Doherty, S. J., Flatau, P. J., Huebert, B. J., Kim, J., Markowicz, K. M., Quinn, P. K., Russell, L. M., Russell, P. B., Shimizu, A., Shinozuka, Y., Song, C. H., Tang, Y., Uno, I., Vogelmann, A. M., Weber, R. J., Woo, J.-H., and Zhang, X. Y.: ACE-ASIA: Regional Climatic and Atmospheric Chemical Effects of Asian Dust and Pollution, B. Am. Meteorol. Soc., 85, 367–380, https://doi.org/10.1175/BAMS-85-3-367, 2004. a, b, c, d, e, f, g
Shen, Y., Virkkula, A., Ding, A., Wang, J., Chi, X., Nie, W., Qi, X., Huang, X., Liu, Q., Zheng, L., Xu, Z., Petäjä, T., Aalto, P. P., Fu, C., and Kulmala, M.: Aerosol optical properties at SORPES in Nanjing, east China, Atmos. Chem. Phys., 18, 5265–5292, https://doi.org/10.5194/acp-18-5265-2018, 2018. a
Sheridan, P. J. and Ogren, J. A.: Observations of the Vertical and Regional Variability of Aerosol Optical Properties over Central and Eastern North America, J. Geophys. Res.-Atmos., 104, 16793–16805, https://doi.org/10.1029/1999JD900241, 1999. a
Sherman, J. P., Sheridan, P. J., Ogren, J. A., Andrews, E., Hageman, D., Schmeisser, L., Jefferson, A., and Sharma, S.: A multi-year study of lower tropospheric aerosol variability and systematic relationships from four North American regions, Atmos. Chem. Phys., 15, 12487–12517, https://doi.org/10.5194/acp-15-12487-2015, 2015. a, b, c, d, e, f, g
Shi, Z., Shao, L., Jones, T. P., Whittaker, A. G., Lu, S., Bérubé, K. A., He, T., and Richards, R. J.: Characterization of Airborne Individual Particles Collected in an Urban Area, a Satellite City and a Clean Air Area in Beijing, 2001, Atmos. Environ., 37, 4097–4108, https://doi.org/10.1016/S1352-2310(03)00531-4, 2003. a
Sokolik, I. N. and Toon, O. B.: Incorporation of Mineralogical Composition into Models of the Radiative Properties of Mineral Aerosol from UV to IR Wavelengths, J. Geophys. Res.-Atmos., 104, 9423–9444, https://doi.org/10.1029/1998JD200048, 1999. a
Song, C. H., Maxwell-Meier, K., Weber, R. J., Kapustin, V., and Clarke, A.: Dust Composition and Mixing State Inferred from Airborne Composition Measurements during ACE-Asia C130 Flight #6, Atmos. Environ., 39, 359–369, https://doi.org/10.1016/j.atmosenv.2004.08.046, 2005. a
Spanu, A., Dollner, M., Gasteiger, J., Bui, T. P., and Weinzierl, B.: Flow-induced errors in airborne in situ measurements of aerosols and clouds, Atmos. Meas. Tech., 13, 1963–1987, https://doi.org/10.5194/amt-13-1963-2020, 2020. a
Stohl, A., Hittenberger, M., and Wotawa, G.: Validation of the Lagrangian Particle Dispersion Model FLEXPART against Large-Scale Tracer Experiment Data, Atmos. Environ., 32, 4245–4264, https://doi.org/10.1016/S1352-2310(98)00184-8, 1998. a, b
Teri, M., Müller, T., Gasteiger, J., Valentini, S., Horvath, H., Vecchi, R., Bauer, P., Walser, A., and Weinzierl, B.: Impact of particle size, refractive index, and shape on the determination of the particle scattering coefficient – an optical closure study evaluating different nephelometer angular truncation and illumination corrections, Atmos. Meas. Tech., 15, 3161–3187, https://doi.org/10.5194/amt-15-3161-2022, 2022. a, b
Teri, M., Gasteiger, J., Heimerl, K., Dollner, M., Schöberl, M., Seibert, P., Tipka, A., and Müller, T., Aryasree, S., Kandler, K., and Weinzierl, B.: Data of Pollution affects Arabian and Saharan dust optical properties in the Eastern Mediterranean, Universität Wien [data set], https://doi.org/10.25365/phaidra.454, 2025. a
Tian, P., Zhang, L., Ma, J., Tang, K., Xu, L., Wang, Y., Cao, X., Liang, J., Ji, Y., Jiang, J. H., Yung, Y. L., and Zhang, R.: Radiative absorption enhancement of dust mixed with anthropogenic pollution over East Asia, Atmos. Chem. Phys., 18, 7815–7825, https://doi.org/10.5194/acp-18-7815-2018, 2018. a
Usher, C. R., Al-Hosney, H., Carlos-Cuellar, S., and Grassian, V. H.: A Laboratory Study of the Heterogeneous Uptake and Oxidation of Sulfur Dioxide on Mineral Dust Particles, J. Geophys. Res.-Atmos., 107, ACH 16–1–ACH 16–9, https://doi.org/10.1029/2002JD002051, 2002. a
Valentini, S., Barnaba, F., Bernardoni, V., Calzolai, G., Costabile, F., Di Liberto, L., Forello, A. C., Gobbi, G. P., Gualtieri, M., Lucarelli, F., Nava, S., Petralia, E., Valli, G., Wiedensohler, A., and Vecchi, R.: Classifying Aerosol Particles through the Combination of Optical and Physical-Chemical Properties: Results from a Wintertime Campaign in Rome (Italy), Atmos. Res., 235, 104799, https://doi.org/10.1016/j.atmosres.2019.104799, 2020. a, b
Valenzuela, A., Olmo, F., Lyamani, H., Antón, M., Titos, G., Cazorla, A., and Alados-Arboledas, L.: Aerosol Scattering and Absorption Angström Exponents as Indicators of Dust and Dust-Free Days over Granada (Spain), Atmos. Res., 154, 1–13, https://doi.org/10.1016/j.atmosres.2014.10.015, 2015. a, b
Virkkula, A.: Correction of the Calibration of the 3-Wavelength Particle Soot Absorption Photometer (3λ PSAP), Aerosol Sci. Tech., 44, 706–712, https://doi.org/10.1080/02786826.2010.482110, 2010. a
Virkkula, A., Ahlquist, N. C., Covert, D. S., Arnott, W. P., Sheridan, P. J., Quinn, P. K., and Coffman, D. J.: Modification, Calibration and a Field Test of an Instrument for Measuring Light Absorption by Particles, Aerosol Sci. Tech., 39, 68–83, https://doi.org/10.1080/027868290901963, 2005. a
Virkkula, A., Backman, J., Aalto, P. P., Hulkkonen, M., Riuttanen, L., Nieminen, T., dal Maso, M., Sogacheva, L., de Leeuw, G., and Kulmala, M.: Seasonal cycle, size dependencies, and source analyses of aerosol optical properties at the SMEAR II measurement station in Hyytiälä, Finland, Atmos. Chem. Phys., 11, 4445–4468, https://doi.org/10.5194/acp-11-4445-2011, 2011. a
Weinzierl, B., Sauer, D., Esselborn, M., Petzold, A., Veira, A., Rose, M., Mund, S., Wirth, M., Ansmann, A., Tesche, M., Gross, S., and Freudenthaler, V.: Microphysical and Optical Properties of Dust and Tropical Biomass Burning Aerosol Layers in the Cape Verde Region – an Overview of the Airborne in Situ and Lidar Measurements during SAMUM-2, Tellus B, 63, 589–618, https://doi.org/10.1111/j.1600-0889.2011.00566.x, 2011. a
Weinzierl, B., Ansmann, A., Prospero, J. M., Althausen, D., Benker, N., Chouza, F., Dollner, M., Farrell, D., Fomba, W. K., Freudenthaler, V., Gasteiger, J., Groß, S., Haarig, M., Heinold, B., Kandler, K., Kristensen, T. B., Mayol-Bracero, O. L., Müller, T., Reitebuch, O., Sauer, D., Schäfler, A., Schepanski, K., Spanu, A., Tegen, I., Toledano, C., and Walser, A.: The Saharan Aerosol Long-Range Transport and Aerosol–Cloud-Interaction Experiment: Overview and Selected Highlights, B. Am. Meteorol. Soc., 98, 1427–1451, https://doi.org/10.1175/BAMS-D-15-00142.1, 2017. a, b
Weinzierl, B., Dollner, M., Gasteiger, J., Teri, M., Schöberl, M., Heimerl, K., Kupc, A., Tipka, A., Seibert, P., Huntrieser, H., Wagner, R., Kandler, K., Sudharaj, A., Müller, T., Brilke, S., Fölker, N., Sauer, D., Reitebuch, O., Groß, S., Freudenthaler, V., Toledano, C., Haarig, M., Mamouri, R., Amiridis, V., Ansmann, A., and the A-LIFE Science Team: Mineral dust mixtures in the Eastern Mediterranean: overview and selected highlights of the A-LIFE aircraft field experiment, in preparation, 2025. a, b, c, d, e
Wendisch, M., Heintzenberg, J., and Bussemer, M.: Measurement-Based Aerosol Forcing Calculations: The Influence of Model Complexity, Meteorol. Z., 10, 45–60, https://doi.org/10.1127/0941-2948/2001/0010-0045, 2001. a, b
Wiscombe, W. J. and Grams, G. W.: The Backscattered Fraction in Two-Stream Approximations, J. Atmos. Sci., 33, 2440–2451, https://doi.org/10.1175/1520-0469(1976)033<2440:TBFITS>2.0.CO;2, 1976. a, b
Yang, M., Howell, S. G., Zhuang, J., and Huebert, B. J.: Attribution of aerosol light absorption to black carbon, brown carbon, and dust in China – interpretations of atmospheric measurements during EAST-AIRE, Atmos. Chem. Phys., 9, 2035–2050, https://doi.org/10.5194/acp-9-2035-2009, 2009. a
Yao, Y., Curtis, J. H., Ching, J., Zheng, Z., and Riemer, N.: Quantifying the effects of mixing state on aerosol optical properties, Atmos. Chem. Phys., 22, 9265–9282, https://doi.org/10.5194/acp-22-9265-2022, 2022. a
Yu, H., Kaufman, Y. J., Chin, M., Feingold, G., Remer, L. A., Anderson, T. L., Balkanski, Y., Bellouin, N., Boucher, O., Christopher, S., DeCola, P., Kahn, R., Koch, D., Loeb, N., Reddy, M. S., Schulz, M., Takemura, T., and Zhou, M.: A review of measurement-based assessments of the aerosol direct radiative effect and forcing, Atmos. Chem. Phys., 6, 613–666, https://doi.org/10.5194/acp-6-613-2006, 2006. a, b
Zittis, G., Almazroui, M., Alpert, P., Ciais, P., Cramer, W., Dahdal, Y., Fnais, M., Francis, D., Hadjinicolaou, P., Howari, F., Jrrar, A., Kaskaoutis, D. G., Kulmala, M., Lazoglou, G., Mihalopoulos, N., Lin, X., Rudich, Y., Sciare, J., Stenchikov, G., Xoplaki, E., and Lelieveld, J.: Climate Change and Weather Extremes in the Eastern Mediterranean and Middle East, Rev. Geophys., 60, e2021RG000762, https://doi.org/10.1029/2021RG000762, 2022. a
Other publications (e.g., Sherman et al., 2015) refer to this quantity as the shortwave direct radiative forcing efficiency (SW DRFE), adopting the same terminology used by the original authors (Charlson et al., 1991; Haywood and Shine, 1995). However, the term “radiative forcing” is defined as the TOA net radiative flux change due to the change in a climate change driver relative to a pre-industrial reference period (e.g., the year 1750 in the IPCC report AR5). Thus, we used the term “radiative effect”, defined as the TOA net radiative flux change resulting from the presence of an atmospheric component.
Statistical tests were conducted using R (R Core Team, 2021) and following the methodology outlined in Bevans (2023) to assess significant differences between group means (analysis of variance, ANOVA) and locate specific differences (Tukey's HSD, honestly significant difference post hoc test).
- Abstract
- Introduction
- Methodology
- Results
- Discussion
- Conclusions
- Appendix A: Summary of aerosol properties used in this study
- Appendix B: Asymmetry parameter and single-scattering albedo representative of the ambient NSD
- Data availability
- Author contributions
- Competing interests
- Disclaimer
- Acknowledgements
- Financial support
- Review statement
- References
- Supplement