the Creative Commons Attribution 4.0 License.
the Creative Commons Attribution 4.0 License.
 | 27 Jun 2025
Water vapor transport and its influence on water stable isotopes in the Dongting Lake basin
Xiong Xiao
Xinping Zhang
Zhuoyong Xiao
Zhongli Liu
Dizhou Wang
Cicheng Zhang
Zhiguo Rao
Xinguang He
Huade Guan
Understanding water vapor sources and transport paths is essential for assessing the water cycle and predicting precipitation accurately. Utilizing water vapor diagnosis and calculations, this study determined the water vapor sources and transport paths leading to precipitation in the Dongting Lake basin in four seasons (represented by January, April, June, and October). In January, the water-vapor-generating precipitation originated from the Arabian Peninsula, driven by the southern branch of the westerlies over the southern side of the Tibetan Plateau, along the northern side of the Indian Peninsula through southwestern China to reach the Dongting Lake basin. In April, two transport paths emerged: one aligned closely with the January transport path but with the location shifted slightly northward by 1° of latitude and another driven by the weak subtropical high over the southwestern Pacific, bringing moist air from the western Pacific via the South China Sea and Indochinese Peninsula. In June, the vapor sourced from the northern branch of the southern Indian Ocean subtropical high crossed the Equator and transported through various waterbodies to southwestern China, finally reaching the basin. October saw a water vapor transport path from the western Pacific, crossing the South China Sea and entering the Dongting Lake basin, influenced by the East Asian monsoon system. In different seasons, the variations in water stable isotopes along water vapor transport paths show some agreement with Rayleigh fractionation and water balance principles, as reflected in the model simulations and observations. These findings highlight the impact of atmospheric circulation on precipitation and isotopes, providing a framework for understanding water vapor isotope mechanisms and reconstructing past atmospheric conditions. This research explored how water vapor transports influenced the precipitation isotopes in the Dongting Lake basin in representative months of different seasons. By tracking water vapor from its source regions, we revealed the influence of large-scale atmospheric circulation on the transportation of water vapor to the Dongting Lake basin. The changes in water stable isotopes along the water vapor transport paths highlighted the isotopic fractionation and water vapor exchange that occurred along these paths, while the isotopic changes in the precipitation reflect the cumulative influences of water vapor transport on the local precipitation. These comprehensive insights have clarified the influences of atmospheric circulation on water vapor transport and precipitation isotopes and are thus essential for predicting regional precipitation patterns.
- Article
(12652 KB) - Full-text XML
- BibTeX
- EndNote


Diagnosing water vapor sources and analyzing water vapor transport are routine and foundational tasks, particularly within hydrometeorological services (Gimeno et al., 2020; Xu et al., 2020). A correct understanding of water vapor sources and transport is crucial for accurately evaluating the hydrological cycle and effectively predicting precipitation. For instance, in weather forecasting for the East Asian region, an essential condition for the occurrence of precipitation is the presence of sufficiently warm and moist air from low latitudes (Baker et al., 2015; Tang et al., 2015; Hu et al., 2021). Moreover, the primary cause of meteorological drought in the East Asian monsoon region is often attributed to an anomalous decrease in water vapor sourced from the Bay of Bengal (He et al., 2022; Liu et al., 2023).
Over the past few decades, the employment of diverse mathematical models has been a crucial approach for tracking and deducing atmospheric water vapor sources and transport paths (Gimeno et al., 2020; Xu et al., 2020; Pranindita et al., 2022; Lekshmy et al., 2022). For instance, Pranindita et al. (2022) employed the water vapor tracking model WAM2layers to trace back water vapor sources during heat waves in northern, western, and southern Europe; the reasons for the reduction in the local precipitation can be attributed to a significant reduction in water vapor supply from the North Atlantic due to anticyclonic patterns, along with the increased water vapor fluxes from eastern Eurasia and local regions. Utilizing the Lagrangian model FLEXPART v9.0, Pérez-Alarcón et al. (2023) identified precipitation water vapor sources associated with the development of Indian Ocean tropical cyclones. Results showed that the water vapor sources and transport mechanisms were different during different life cycle stages of tropical cyclones. Among numerous methods, the use of HYSPLIT for tracking water vapor sources is widespread, which employs backward trajectory calculations and atmospheric wind field information to derive water vapor transport trajectories at given heights during a precipitation event, making it commonly used for tracing water vapor during short-duration precipitation events (Draxler and Hess, 1998; Esquivel-Hernández et al., 2019; Nie and Sun, 2022). However, due to inherent model structure and tracking principles, derived water vapor transport paths at different heights may vary or even be opposite. Moreover, this method cannot ascertain whether the tracked water vapor indeed causes precipitation, nor can it provide information on the magnitude of water vapor transport (Wu et al., 2015, 2022; Deng et al., 2024).
With the continuous improvement of observational techniques and analytical methods, utilizing reanalysis data to determine the water vapor sources that cause precipitation has become a common practice (Sun et al., 2011; Hoffmann et al., 2019; Guo et al., 2019; Shi et al., 2022). For instance, Sun et al. (2011) investigated the climatic characteristics and decadal variations in water vapor transport in eastern China based on NCEP/NCAR Reanalysis data from 1979–2009. The results revealed that the variability in water vapor transport in the region is attributed to the combined influences of the Indian summer monsoon and the East Asian summer monsoon. Zhou et al. (2018) analyzed the correlation between precipitation δ18O and water vapor transport during the warm half-year (April–September) in China using GNIP (Global Network of Isotopes in Precipitation) data and NCEP/NCAR Reanalysis datasets. Their study found a significant negative correlation between precipitation δ18O and water vapor transport from the southwest direction, indicating that the southwest monsoon, which brings water vapor from the Indian Ocean, plays a crucial role in precipitation formation. In contrast, the relationship between precipitation and water vapor transport from the northwest direction is not significant and even shows an inverse relationship in some cases. This suggests that water vapor transport from the northwest has a minimal direct influence on precipitation in the Changsha region. Since the direction of water vapor transport has an important influence on regional precipitation, it is necessary to reveal the influences of atmospheric circulation, such as the water vapor source regions and water vapor transport paths, which determine the water vapor transport direction.
Water vapor transport controlled by atmospheric circulation not only determines precipitation events but also directly influences the precipitation isotopes; thus analyzing the water vapor sources and water vapor transport paths, as well as their influences on stable isotopes under different seasons, can elucidate the mechanisms influencing the atmospheric stable isotopes (Zhou et al., 2019; Dahinden et al., 2021; Zhan et al., 2023). For instance, Risi et al. (2010) conducted an analysis of water vapor and precipitation isotopes in the Sahelian region by combining water vapor budget and water vapor transport calculations, revealing that the isotopic composition of precipitation and atmospheric water vapor in the region is controlled by the intensity of air dehydration and changes in convection. Similarly, Sengupta and Sarkar (2006) quantified the influences of different water vapor source regions on precipitation in the northern Indian monsoon region, finding that the isotopic composition of precipitation in the region is influenced by changes in water vapor source and atmospheric circulations over India. Moreover, Zhou et al. (2019) separately computed the correlations between δ18O values of precipitation at different sites and found that during the prevalence of the summer monsoon (April–September) and winter monsoon (October–March), the key upstream regions influencing the precipitation isotopes in the Dongting Lake basin located in south-central China were the Bay of Bengal and southwestern China, respectively. However, as the critical regions influencing regional precipitation isotopes may not necessarily be the water vapor source regions, these studies have yet to definitively determine the water vapor source regions and water vapor transport paths.
Assessing whether the stable isotopic composition of water vapor shows changes consistent with Rayleigh distillation during transport and evaluating the impact of this transport on the isotopic composition of regional precipitation are important research objectives. Existing studies indicate that in the East Asian monsoon region, including the Dongting Lake basin, differences in the water vapor sources and transport direction during different seasons are the primary drivers of seasonal variations in precipitation isotopes (Araguás-Araguás et al., 1998; Zhang et al., 2016; Wei et al., 2018; Chiang et al., 2020b). Typically, during the summer monsoon, prevailing southeast or southwest winds dominate the East Asian monsoon region, with water vapor for precipitation originating from low-latitude oceans (Baker et al., 2015; Wu et al., 2015; Tang et al., 2015), while precipitation isotopes are significantly depleted and influenced by intense rainout effects along the water vapor transport paths during this period (Zhou et al., 2019; Wu et al., 2022). Conversely, during the winter monsoon, northwest or northeast winds prevail in the East Asian monsoon region; the precipitation isotopes should be more enriched if water vapor for precipitation is carried by westerlies or originates from the evaporation of inland regions (e.g., Liu et al., 2011; Wu et al., 2015; Shi et al., 2021). However, both actual observations from the Global Network of Isotopes in Precipitation (GNIP) and simulations from isotope-enabled general circulation models (isoGCMs) consistently demonstrate that, whether during the summer or winter monsoon, the spatial distribution of precipitation isotopes in the East Asian monsoon region exhibits significant latitudinal and continental effects – that is, the precipitation isotopes become more depleted with increases in latitude or distance from the ocean (Feng et al., 2009; Zhang et al., 2012, 2016). Consequently, the observed water vapor transport during the summer monsoon aligns with the spatial distribution of precipitation isotopes under the influence of latitudinal and continental effects and is consistent with the Rayleigh distillation principle for water stable isotopes; however, water vapor transport during the winter monsoon does not follow the above spatial distribution and Rayleigh distillation principle (Tang et al., 2015; Zhou et al., 2019; Wu et al., 2022).
Based on the understanding outlined above, a thorough investigation into the seasonal variations in water vapor sources and transport paths for precipitation amount and isotopes in the East Asian monsoon region is necessary, which may provide a significant benefit for accurately understanding regional hydrological mechanisms and elucidating regional climate characteristics. Focusing on the Dongting Lake basin within the East Asian monsoon area and drawing upon fundamental theories of meteorology, water vapor diagnostics, and water vapor calculations, a broader spatial understanding of the scientific issues surrounding water vapor transport can be achieved. This study aims to (1) identify the water vapor sources and transport paths contributing to the Dongting Lake basin, (2) analyze the variations in meteorological factors and water stable isotopes along the water vapor transport paths, and (3) determine the influences of different water vapor sources and transport paths on the regional precipitation amounts.
2.1 Study site
The Dongting Lake basin, situated in the south-central region of China (Fig. 1), is a basin characterized by a subtropical monsoon climate, marked by four distinct seasons and moderate humidity. Winters are wet and cold, while summers are warm and moist. Based on historical meteorological data from 1960–2017, the Dongting Lake basin experiences an average annual precipitation of 1375.6 mm. During the colder months (October–March of the following year), precipitation is relatively low due to the influence of continental air masses. However, from late April onward, influenced by oceanic monsoons, precipitation increases significantly, accompanied by a notable rise in temperature, with precipitation predominantly occurring from April–June (Liu et al., 2023; Xiao et al., 2024).
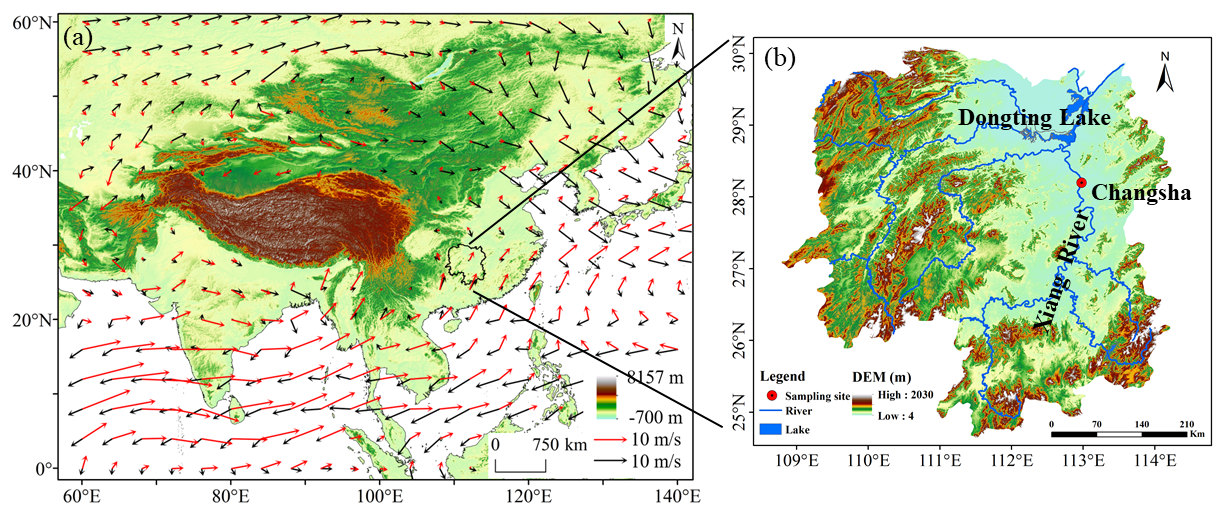
Figure 1Map showing the location of the Dongting Lake basin (a) and the Changsha sampling site in the East Asian monsoon region (b). Note that the black arrow and red arrow in panel (a) represent the average wind field at 850 hPa in January and June, respectively.
The prevailing wind refers to the wind or wind direction that appears most frequently in a region during a specific period. Its occurrence is closely related to the changes in the average atmospheric circulation conditions due to the thermal differences between land and sea. In the East Asian monsoon region, which includes the Dongting Lake basin, the strong cold high-pressure system influences the winter season, resulting in prevailing northerly winds in the lower troposphere, with northwesterly winds prevailing in the basin as shown by the average wind field at the 850 hPa in January, i.e., the black arrow in Fig. 1a. In the summer, influenced by the western Pacific subtropical high and the Indian low, the winds in the lower troposphere are predominantly southerly in the East Asian monsoon region, with southwesterly winds prevailing in the Dongting Lake basin as shown by the average wind field at 850 hPa in June, i.e., the red arrow in Fig. 1a. Positioned at the convergence of the prevailing northerly winds, prevailing southerly winds, and westerly winds, the Dongting Lake basin experiences complex precipitation processes and different precipitation amounts in different seasons and water vapor transport directions. This complexity results in high variability in the precipitation isotope (Zhou et al., 2019; Xiao et al., 2024).
2.2 Water sample collection and measurement
From 1 January 2010–31 December 2022, precipitation sampling has been conducted at the Meteorological Garden of Hunan Normal University in Changsha (28°11′ N, 112°56′ E). The sampling protocol followed the meteorological observation standards of China's meteorological departments, with samples being collected at 08:00 and 20:00 Beijing time on precipitation days. Liquid precipitation was directly collected in sealed 30 mL polyethylene bottles after measuring the precipitation amount, while solid precipitation was collected in airtight plastic bags, measured for meltwater volume after natural melting, and transferred to polyethylene bottles of the same size. All the collected water samples were stored in a refrigerator at 0 °C before testing.
Precipitation sample analysis from 2010–2013 was conducted using a liquid water isotope analyzer (DLT-100, model 908-0008) from Los Gatos Research, USA; subsequently, a next-generation liquid and gas dual-mode stable isotope analyzer (IWA-35EP, model 912-0026-1000) from the same company was used from 2014–2022. The oxygen and hydrogen stable isotope ratio in the water samples were expressed in per mil (‰) deviations relative to the Vienna Standard Mean Ocean Water (V-SMOW), calculated using the following equation:
In the equation, Rs and RV-SMOW represent the oxygen (or hydrogen) stable isotope ratios of (or ) in the water sample and in Vienna Standard Mean Ocean Water (V-SMOW), respectively. The testing precision averaged δ18O ≤ 0.3 ‰ and δ2H ≤ 2 ‰ during 2010–2013 and δ18O ≤ 0.2 ‰ and δ2H ≤ 0.6 ‰ during 2014–2022. If there were two precipitation samples in 1 d, the precipitation stable isotope values for that day were represented by the volume-weighted average. In total, 1668 precipitation days' worth of δ18O (δ2H) data were obtained over the past 13 years.
2.3 Ancillary data
ERA5, produced and released by the European Centre for Medium-Range Weather Forecasts (ECMWF), is the fifth-generation global atmospheric reanalysis data product from the center. Compared to its predecessor ERA-Interim, ERA5 incorporates a state-of-the-art integrated forecasting system, integrates more historical observational data, and reprocesses a large amount of assimilation data, resulting in significantly improved accuracy (Albergel et al., 2018; Hoffmann et al., 2019). Additionally, ERA5 features substantial improvements in temporal and spatial resolution. The temporal resolution has increased from 6 h in ERA-Interim to 1 h, while the horizontal resolution has improved from 79 to 31 km and the highest vertical extension reaches 0.01 hPa level. These enhancements enable ERA5 to capture finer atmospheric details. Moreover, the number of variables provided by ERA5 has increased from over 100 in ERA-Interim to the current 240, and the release delay days of ERA5 have been reduced from 2–3 months in ERA-Interim to 5 d (Albergel et al., 2018; Hoffmann et al., 2019). The reanalysis data (January 1979–December 2017, totaling 468 months) used in this study include surface pressure (ps, hPa), the potential height of 500 hPa (H500, m), specific humidity (q, kg kg−1), latitudinal wind (m s−1), and meridional wind (m s−1) at 1000, 850, 700, 600, 500, 400, and 300 hPa. The horizontal resolution is 1°×1°, with a temporal step of 1 h. This dataset was used to calculate the vertical integral of water vapor fluxes into a specified region, introduced in Sect. 2.4.
Since the direct observation of the isotopic fractionation process in the atmosphere is extremely challenging, analyzing the variations in atmospheric stable isotopes requires the application of stable isotope fractionation theory along with the fundamental principles and methods of meteorology. In terms of research methods, the introduction of atmospheric circulation models for water stable isotope cycling, such as isoGCMs, provides a unique and effective tool. Among numerous isoGCMs, isoGSM (Isotope-incorporated Global Spectral Model) exhibits relatively good simulation performance in the East Asian region (Zhang et al., 2020; Kathayat et al., 2021). isoGSM is a stable isotope GCM developed by Yoshimura et al. (2008) which integrated water isotope cycling and fractionation processes into the Global Spectral Model at the Scripps Experimental Climate Prediction Center. The driving data include sea surface temperature, sea ice, and temperature and horizontal wind fields in 28 vertical layers. This model addresses the Gibbs phenomenon in atmospheric circulation models and performs better in simulating water vapor transport processes in arid and high-altitude regions (Yoshimura et al., 2008; Bong et al., 2024). The second-generation isoGSM2 has a higher temporal and spatial resolution for simulating water vapor and precipitation isotopes compared to the first-generation model (Chiang et al., 2020b). It utilizes the NECP-R2 (National Centers for Environmental Prediction Reanalysis 2) reanalysis dataset and abandons the NDSL (non-iteration dimensional-split semi-Lagrangian) advection scheme used in the previous generation. By dynamically correcting the model output using reanalysis data, isoGSM2's simulation results are closer to actual atmospheric conditions, thereby improving the accuracy of water vapor and precipitation isotope simulations (Bong et al., 2024).
The water stable isotope simulation data used in this study are from isoGSM2 (January 1979–December 2017, totaling 468 months), including the monthly precipitation amount (P, mm), stable isotopes (δ2H and δ18O) in the precipitation (δ2Hp and δ18Op), the vertical integral of water vapor isotopes (δ2Hv and δ18Ov) of 17 pressure levels from 1000–10 hPa, and the calculated deuterium excess in water vapor and precipitation (dv and dp). The spatial scale ranges from 30° S–70° N and 0–280° E, with a horizontal resolution of 1° × 1° (Chiang et al., 2020b; Liu et al., 2023).
2.4 Calculation of the vertical integral of water vapor flux Q
The water vapor transport flux serves as a metric for both the magnitude and direction of water vapor transport, representing the mass of water vapor passing through a unit cross-section per unit of time (Sun et al., 2011). The specific calculation equation is as follows:
where the meridional component Qλ and the latitudinal component Qφ of the water vapor transport flux are given by
where Q represents the vertical integral of water vapor flux (), including the meridional component Qλ and the latitudinal component Qφ; V denotes the vector wind speed (m s−1), including the latitudinal wind speed (v) and meridional wind (u); q represents specific humidity (kg kg−1); g is the acceleration due to gravity (m s−2); ps is the lower boundary pressure (hPa); and pt is the upper boundary pressure (hPa). In the actual atmosphere, water vapor content above 300 hPa is minimal; thus pt is set to 300 hPa when calculating the vertical integral of water vapor flux through the entire atmospheric column.
3.1 Seasonal variation characteristics of precipitation isotopes in the Changsha region
The monthly weighted-average and total monthly calculations were performed on the daily δ18Op, daily dp, and daily P collected from the Hunan Normal University and the Changsha National Meteorological Reference Station, yielding the seasonal variations in multi-year monthly weighted-average δ18Op, monthly weighted-average dp, and monthly average P in the Changsha region (Fig. 2a). The δ18Op, dp, and P in Changsha exhibited significant seasonal variations – that is, the maximum value of δ18Op appeared in March and April, both at −3.6 ‰, but did not correspond to the months with the lowest precipitation amounts. The three lowest values of δ18Op occurred in July, August, and September, respectively at −9.5 ‰, −8.9 ‰, and −9.4 ‰, with a simple arithmetic average of −9.3 ‰, which also did not correspond to the months with the highest precipitation amounts. The maximum value of dp (20.1 ‰) appeared in January, and the minimum value (9.3 ‰) appeared in August, both of which were months with relatively low precipitation. Due to these significant differences in the phases of precipitation isotopes and amounts, it is apparent that explaining the variations in local precipitation stable isotopes solely based on the seasonal variations in local precipitation amounts is insufficient.
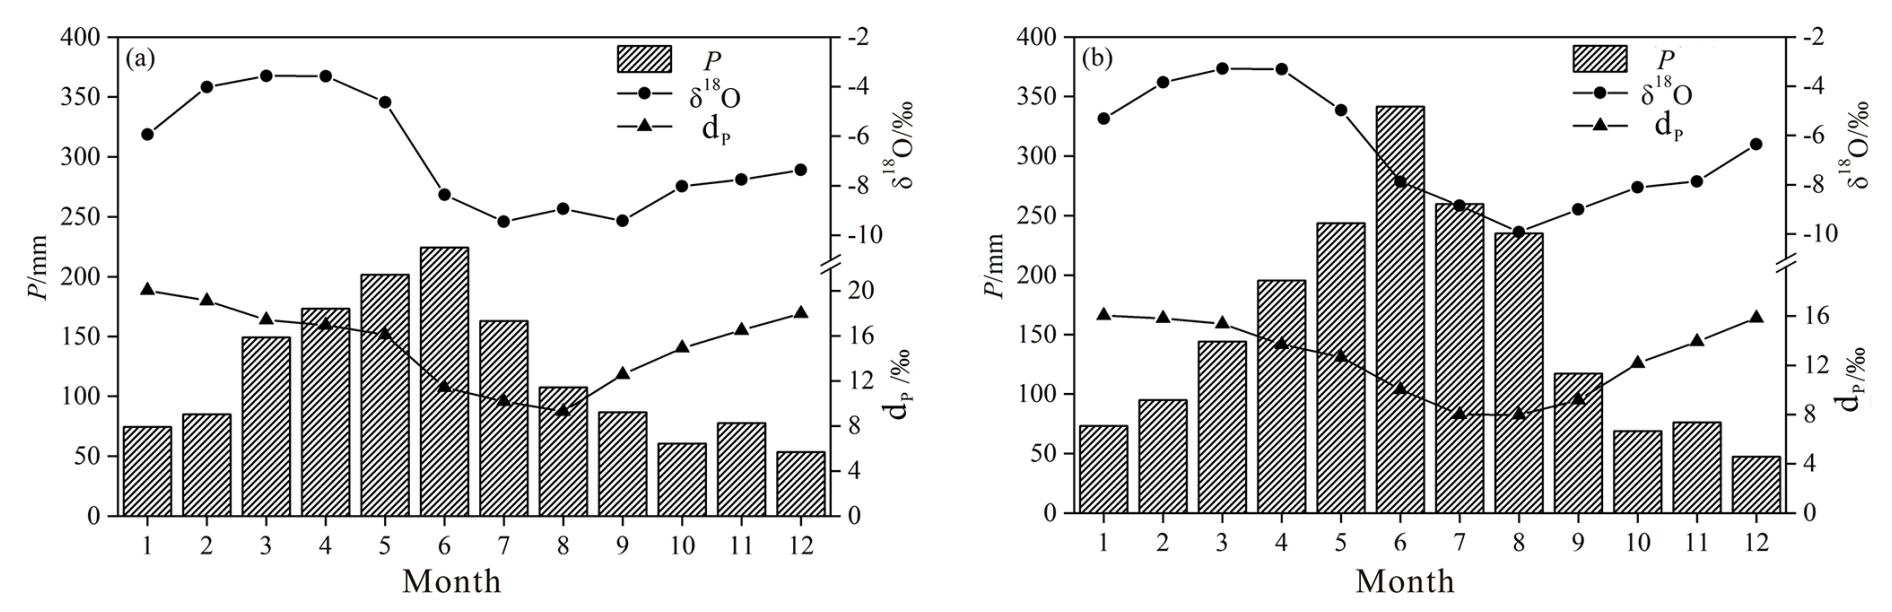
Figure 2Comparisons between seasonal variations in precipitation δ18O (δ18Op), precipitation deuterium excess (dp), and the precipitation amount (P) measured at the Changsha station (a) and simulated by isoGSM2 or driven from the ERA5 reanalysis dataset at the corresponding grid (b).
The monthly weighted-average calculation was performed on the monthly δ18Op and dp simulated by isoGSM2 at the Changsha grid, and the monthly average calculation was performed on the P from ERA5, yielding the seasonal variations in simulated monthly weighted-average δ18Op and dp and ERA5 monthly average P for the Changsha grid (Fig. 2b). The simulated and calculated δ18Op, dp, and P in Changsha all effectively reproduced the seasonal variations in the corresponding observations. The root mean square error (RMSE) values between simulated and observed values were 0.5 ‰, 2.8 ‰, and 59.7 mm, respectively. Corresponding to the observed seasonal variations, the two maximum values of the simulated δ18Op occurred in March and April, at −3.3 ‰ and −3.3 ‰, respectively, with very small differences from the observed values. The three lowest values of simulated δ18Op also occurred in July, August, and September, at −8.8 ‰, −9.9 ‰, and −9.0 ‰, respectively, with a simple arithmetic average of −9.3 ‰, which was consistent with the observed values. The maximum value of simulated dp (16.1 ‰) appeared in January, and the minimum value (8.0 ‰) appeared in August (Fig. 2b), both consistent with the observed values (Fig. 2a). These comparisons indicated that isoGSM2 exhibited strong capabilities in simulating the temporal variations in atmospheric water stable isotopes.
To analyze the seasonal variation in the atmospheric water vapor transport and its influences on the regional precipitation isotopes and taking into account the hydro-climatic characteristics of the study region (Fig. 2), 4 representative months including January, April, June, and October were selected as the study seasons. Among these representative months, January in the Changsha region represents winter, characterized by the lowest temperatures and relatively low precipitation throughout the year. April signifies spring, with rapidly increasing precipitation amounts and frequent fluctuations between warm and cold air masses. June represents the peak of the summer monsoon season, with the highest monthly precipitation amount of the year. October represents autumn, characterized by clear and cool weather and the second-lowest precipitation throughout the year under the influence of the western Pacific subtropical high.
3.2 Water vapor transport in the Dongting Lake basin in different seasons
3.2.1 Average water vapor transport path in the Dongting Lake basin in January
Based on the ERA5 reanalysis data, we calculated and plotted the spatial distribution of the 500 hPa average geopotential height (H500), average Q (Fig. 3a), and multi-year average P (Fig. 3b) in January. Moreover, based on the isoGSM2 simulation data, we plotted the spatial distributions of the average δ18Ov (Fig. 3c), δ18Op (Fig. 3d), dv (Fig. 3e), and dp (Fig. 3f) in January.
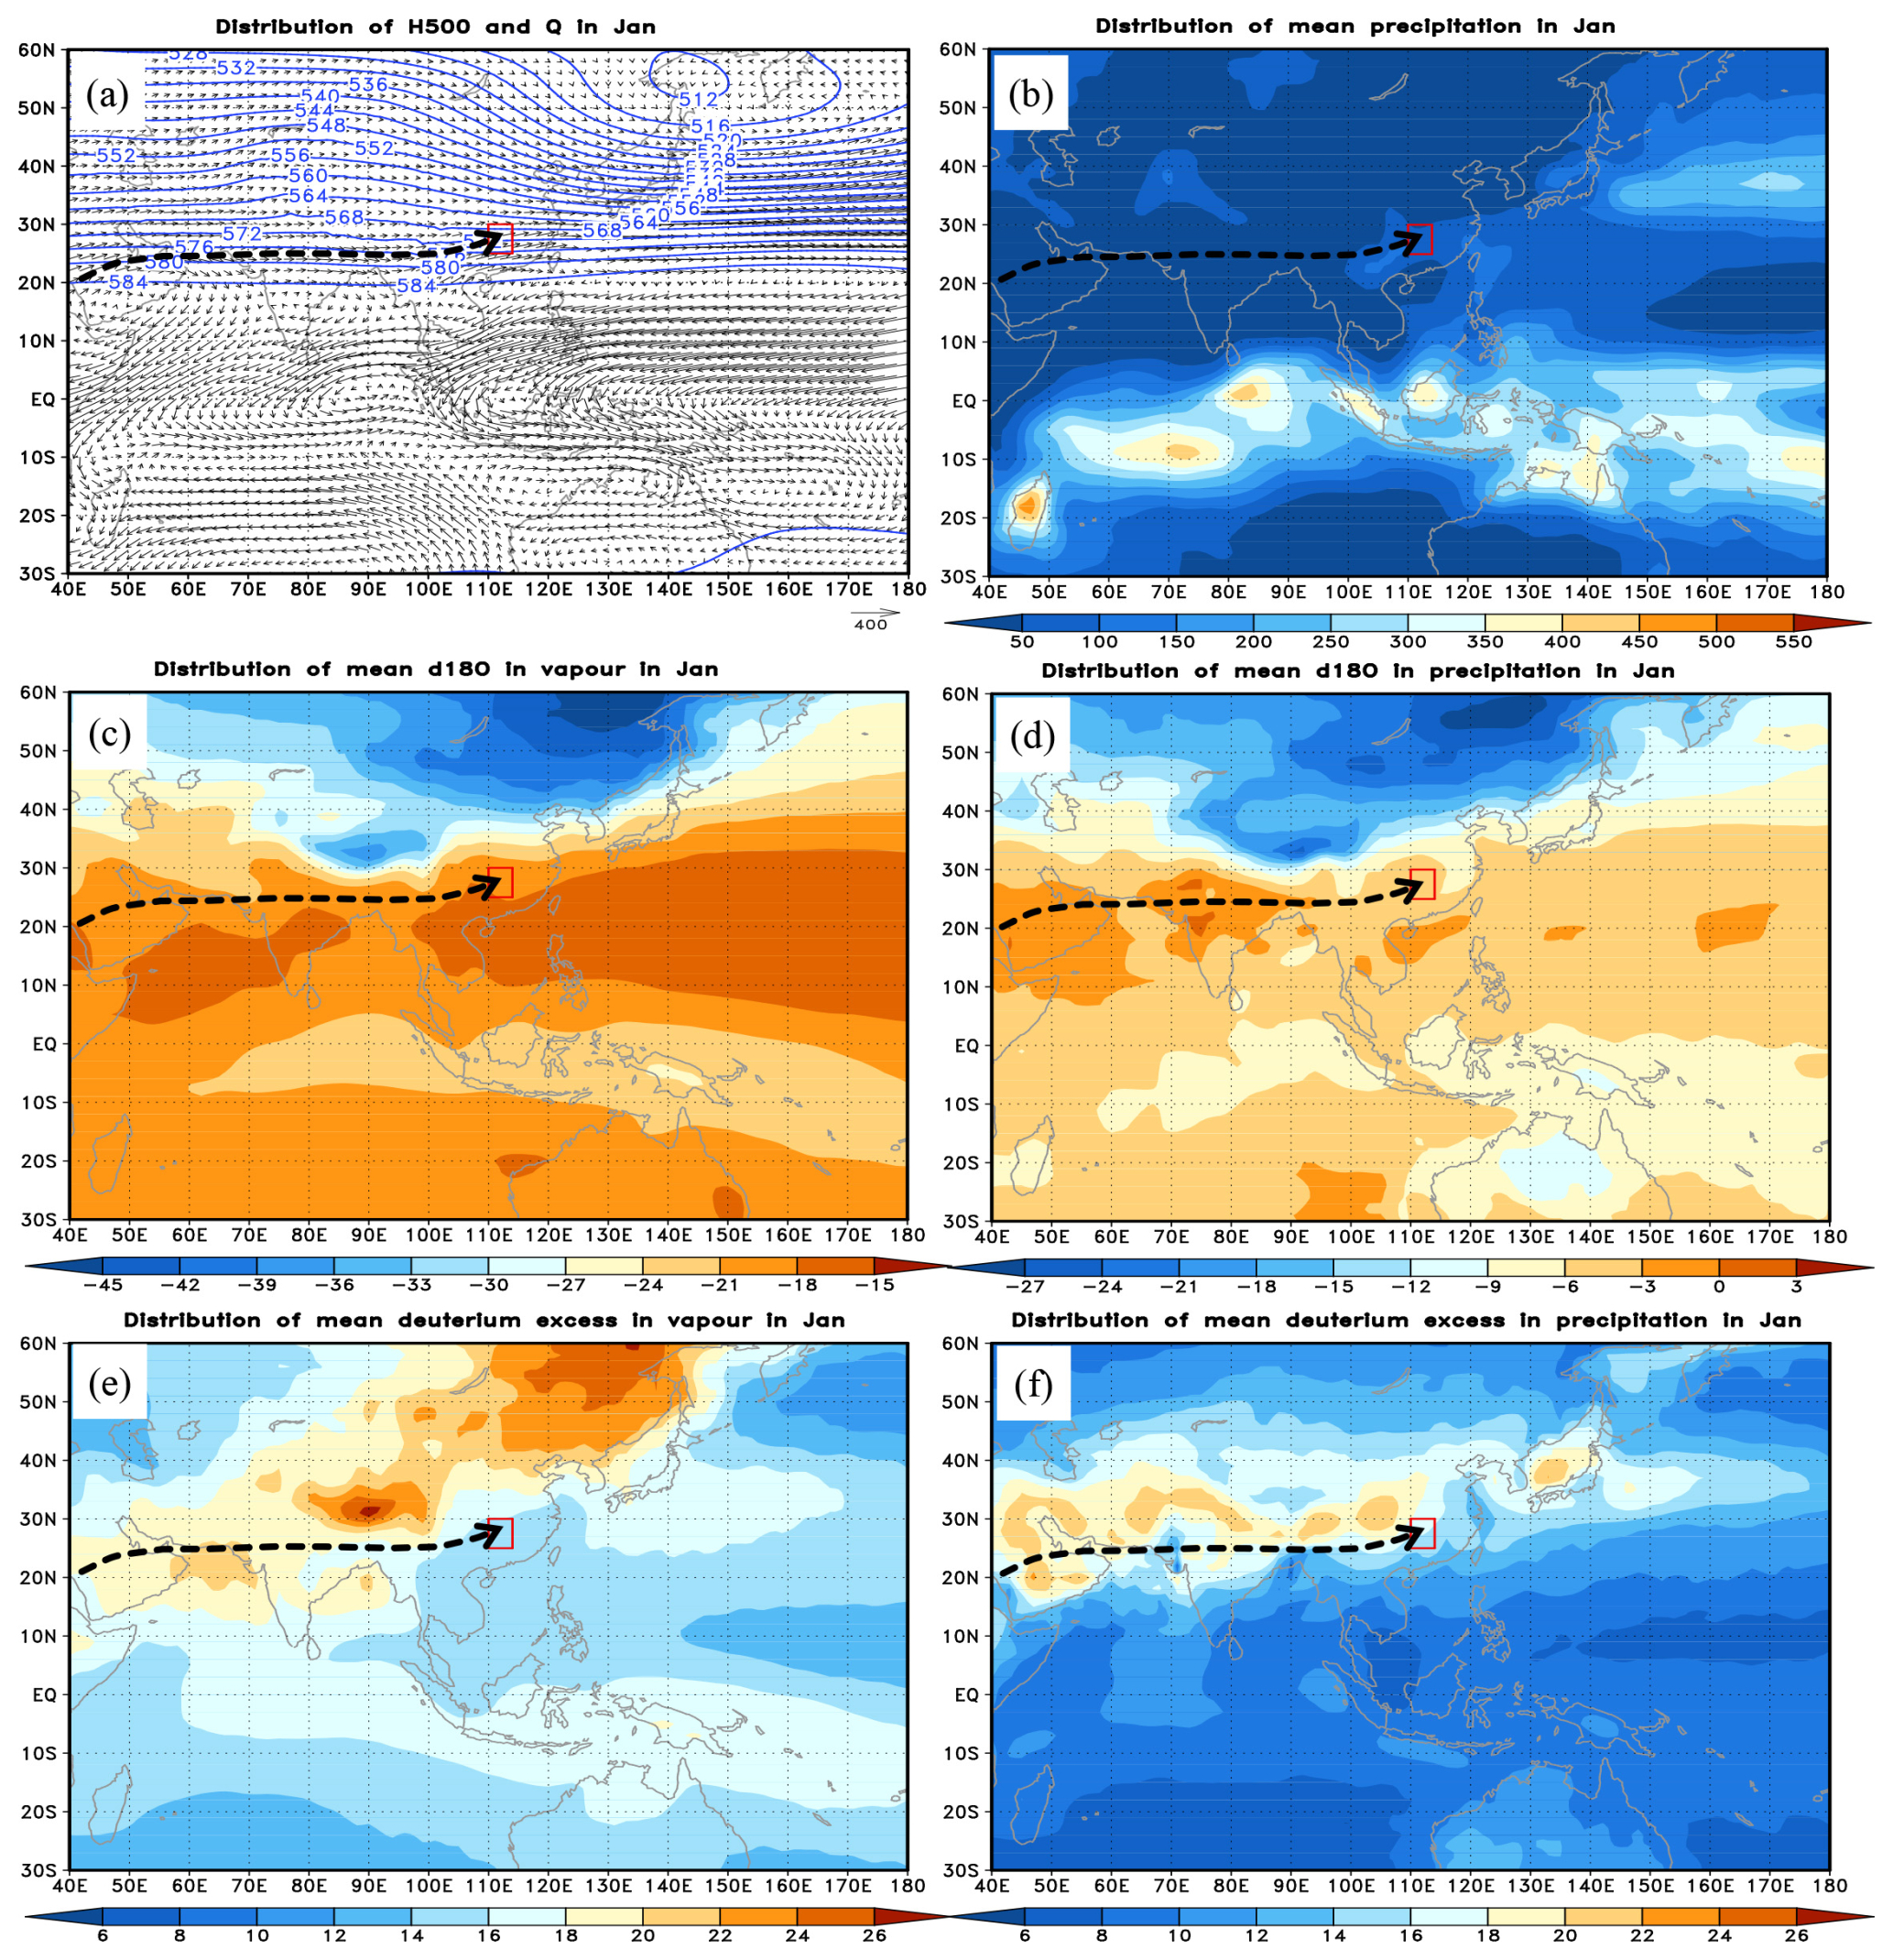
Figure 3Mean vapor transport path to the Dongting Lake basin and the spatial distributions of Q with H500 (a), P (b), δ18Ov (c), δ18Op (d), dv (e), and dp (f) in January. Q, H500, P, δ18Ov, δ18Op, dv, and dp represent the vertical integral of water vapor flux, 500 hPa average geopotential height, precipitation amount, δ18O in atmospheric water vapor and precipitation, and deuterium excess in atmospheric water vapor and precipitation, respectively (the same applies to Figs. 5, 7, and 9).
At the H500 field of East Asia, the deep East Asian trough was stably located along the eastern coast, and the strong Ural ridge was in the middle to high latitudes of 70–90° E (Fig. 3a). Influenced by the northwestern airflow behind the trough and ahead of the ridge, the northwest winds prevailed in most parts of East Asia. In the Dongting Lake basin (highlighted in the red box in Fig. 3), influenced by the middle-latitude westerly belt, water vapor transport mainly was from west to east. Under the control of the cold continental high, precipitation was relatively low over the whole of East Asia and South Asia, while the regions with high P values were mainly distributed in the equatorial convergence zone and the North Pacific was located ahead of the East Asian trough (Fig. 3b). Unlike most regions of East Asia, the Dongting Lake basin was situated on a wet tongue, benefiting from the southwest vortex in the eastern Tibetan Plateau (Lai et al., 2023; Huang and Li, 2023). This southwest vortex is a cyclonic bypass flow of westerlies from the southern branch of the Tibetan Plateau; as this vortex moves eastward with the westerly belt, it brings precipitation to the downstream areas.
The δ18Ov and δ18Op in January exhibited significant continental effects (Fig. 3c and d). Under the control of continental cold air masses, the centers of minimum δ18Ov and δ18Op values were located in the middle to high latitudes of eastern Siberia. Due to the influence of topography, the δ18Ov tended to be negative over the Tibetan Plateau. These two low-value regions correspond to the cold pole of Eurasia and Earth's third pole, respectively. Regions enriched in atmospheric water isotopes were mainly distributed over vast oceans and western Asia. In the equatorial convergence zone, due to the rainout effects, both water vapor isotopes and precipitation isotopes were depleted to some extent. Along with the surrounding the Dongting Lake basin, the abundance of water vapor isotopes and precipitation isotopes in the Dongting Lake basin was comparable to that of the middle- to low-latitude oceans in January.
The spatial distributions of the dv and dp exhibited the characteristic of being low in the ocean and high on land, but the regions where their maximum values occurred did not completely correspond (Fig. 3e and f). The maximum value of the dv mainly appeared in eastern Siberia and the Tibetan Plateau, showing a meridional distribution from northeast to southwest, while the high values of the dp mainly occurred in middle-latitude inland regions, showing a latitudinal distribution from west to east. The dv and dp values in the Dongting Lake basin lay exactly in the transition region from low to high values. Typically, the dp largely depended on the dv, but processes such as condensation and super-saturation in ice–water-mixed clouds, secondary evaporation below clouds, evaporation from underlying surfaces, and the exchange and diffusion of water vapor isotopes could cause precipitation isotopes to deviate to varying degrees from atmospheric water vapor isotopes (Zhang et al., 2016).
In the Q field (Fig. 3a), regarding the Dongting Lake basin (represented by the red box) as the endpoint, the vector cluster of the vertical integral of water vapor flux (i.e., the Q) directed towards the Dongting Lake basin delineates the path of water vapor transport in January (black arrow lines in Fig. 3). The water vapor transport paths were determined by identifying systematic vapor currents in the Q field, which need to have the same directionality and draw the path along the central axis of the vapor currents. Our identified water vapor transport paths are conceptually similar to atmospheric rivers, which are long, narrow corridors of strong horizontal water vapor transport typically associated with low-level jets (Ralph et al., 2018; Payne et al., 2020). However, our paths are derived from the climatological mean state (multi-year monthly averages) rather than short-term events, which is a key distinction from atmospheric rivers that generally last for a few days to a week (Dettinger, 2013). The source regions of water vapor were determined based on the conditions for the formation of air masses, which need to form on a uniform underlying surface and possess stability and similarity in terms of isotopic, thermodynamic, and dynamic properties as well as circulation conditions (Smirnov and Moore, 1999). These regions are typically located over vast land and ocean areas and serve as the starting points of the water vapor transport paths. Although there is some empiricism and subjectivity in this approach, given the information available, it is adopted in the absence of any algorithm for uniquely determining the water vapor transport path and the source regions of water vapor. The approach is based on criteria that are as concrete as possible and ensure that we capture the systematic vapor currents that have the most significant influence on the local precipitation and its isotopic composition, and it provides a reasonable basis for identifying the dominant vapor transport directions and the primary sources of water vapor contributing to precipitation in the Dongting Lake basin.
The westerly path is considered dominant because it represents the primary direction of water vapor convergence towards the Dongting Lake basin, as indicated by the strongest and most consistent flux vectors in the Q field. The selection of this path is based on the physical significance of the Q field, which integrates both the magnitude and direction of water vapor transport and reflects the dominant atmospheric circulation pattern influencing the region in this season. This transport path originated near the Arabian Peninsula. Driven by the southern branch of the westerly stream jet on the southern side of the Tibetan Plateau, water vapor transported along the southern side of the Tibetan Plateau passed through southwestern China via the northern part of the Indian Peninsula and reached the Dongting Lake basin. Moreover, it can be seen that this water vapor transport path was not consistent with the prevailing wind direction in January as shown in Fig. 1a, which was represented by the black arrows with northwesterly winds prevailing in the Dongting Lake basin as shown by the average wind field at 850 hPa.
In analyzing the variations along the water vapor transport paths, we selected several points along the path from the source region to the Dongting Lake basin, spaced at nearly equal intervals (Fig. 4). Six series of factors at the grid points along the water vapor transport path were derived from each factor field in January, including the variations in Q, P, δ18Ov, δ18Op, dv, and dp; these points allow us to examine the changes in these factors along the transport path. Moreover, the grid points along the water vapor transport path were identified on the central axis of the path and based on the principle of the uniform distribution of scatter points, and the factors at the grid points were obtained from these scatter points. Besides, the factors at the grid points along the water vapor transport path exhibit, in spatial terms, average characteristics of conditions over multiple years, and, in temporal terms, sequential characteristics of these factors along the water vapor transport path. As shown in Fig. 4, both the Q and P were relatively low, while they increased to some extent due to the converging effect of the southwest vortex after entering the Dongting Lake basin (Fig. 4a and b). Under the weak atmospheric meridional disturbances in January, the changes in δ18Ov and dv were minor, fluctuating slightly around −19.1 ‰ and 18.2 ‰, respectively (Fig. 4c and e). Due to the low precipitation amount, the δ18Op values were higher in the first half of the water vapor transport path and then became more negative in the latter half with the enhanced rainout effect, while the dp became more positive (Fig. 4d and f).
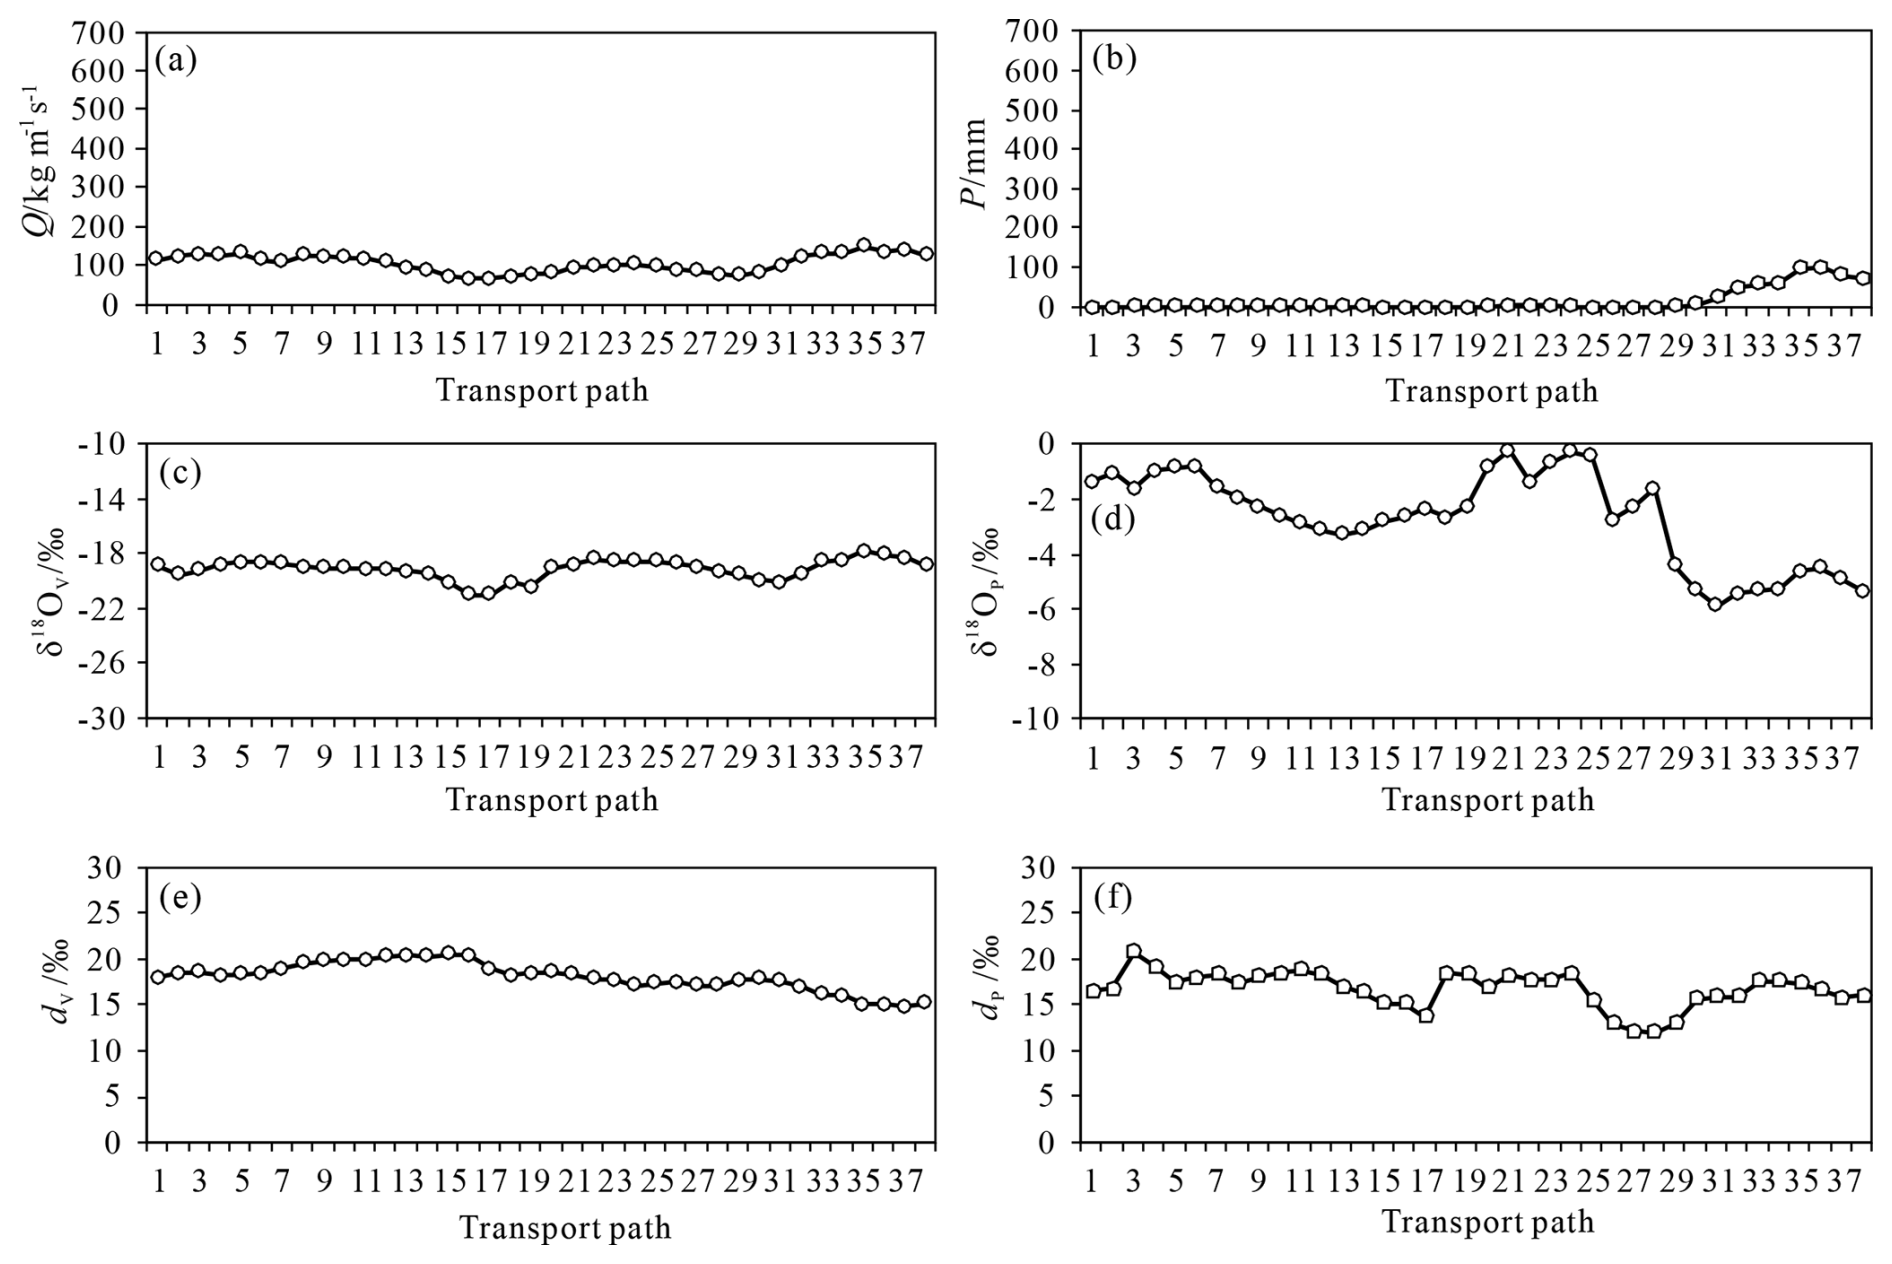
Figure 4Mean variations in Q (a), P (b), δ18Ov (c), δ18Op (d), dv (e), and dp (f) along the vapor transport path in January. The numbers on the lower axis represent the serial numbers corresponding to the grid points along the water vapor transport path from the source region to the Dongting Lake basin, and the points along the path were selected at almost equal intervals to capture the variations in each factor (the same applies to Figs. 6, 8, and 10).
3.2.2 Average water vapor transport path in the Dongting Lake basin in April
Based on the ERA5 reanalysis data and the isoGSM2 simulation data, the spatial distributions of H500, Q, P, δ18Ov, δ18Op, dv, and dp were calculated and plotted in April (Fig. 5). At the H500 field (Fig. 5a), the East Asian trough and Ural ridge were still present in the middle to high latitudes. The middle- to high-latitude regions of East Asia were still influenced by the winter monsoon, while its intensity was significantly weakened. In the middle to low latitudes, the western Pacific subtropical high strengthened and expanded northward, with the ridge line located near 15° N. A shallow trough appeared in the northern part of the Bay of Bengal, indicating the beginning of tropical systems influencing the middle- to low-latitude regions of East Asia. In the Dongting Lake basin, influenced by the westerlies and low-latitude atmospheric systems, the water vapor transport shifted to domination by the southwestward direction. Most continental regions of East Asia and South Asia experienced a certain degree of precipitation increase, with the rainy band caused by the intertropical convergence zone, previously located in the Southern Hemisphere, moving to the Northern Hemisphere (Fig. 5b). The Dongting Lake basin also entered the spring flood season in April, while the Changsha region was situated in a center with an above-average spring precipitation amount compared to the surrounding regions in this period (Fig. 5b).
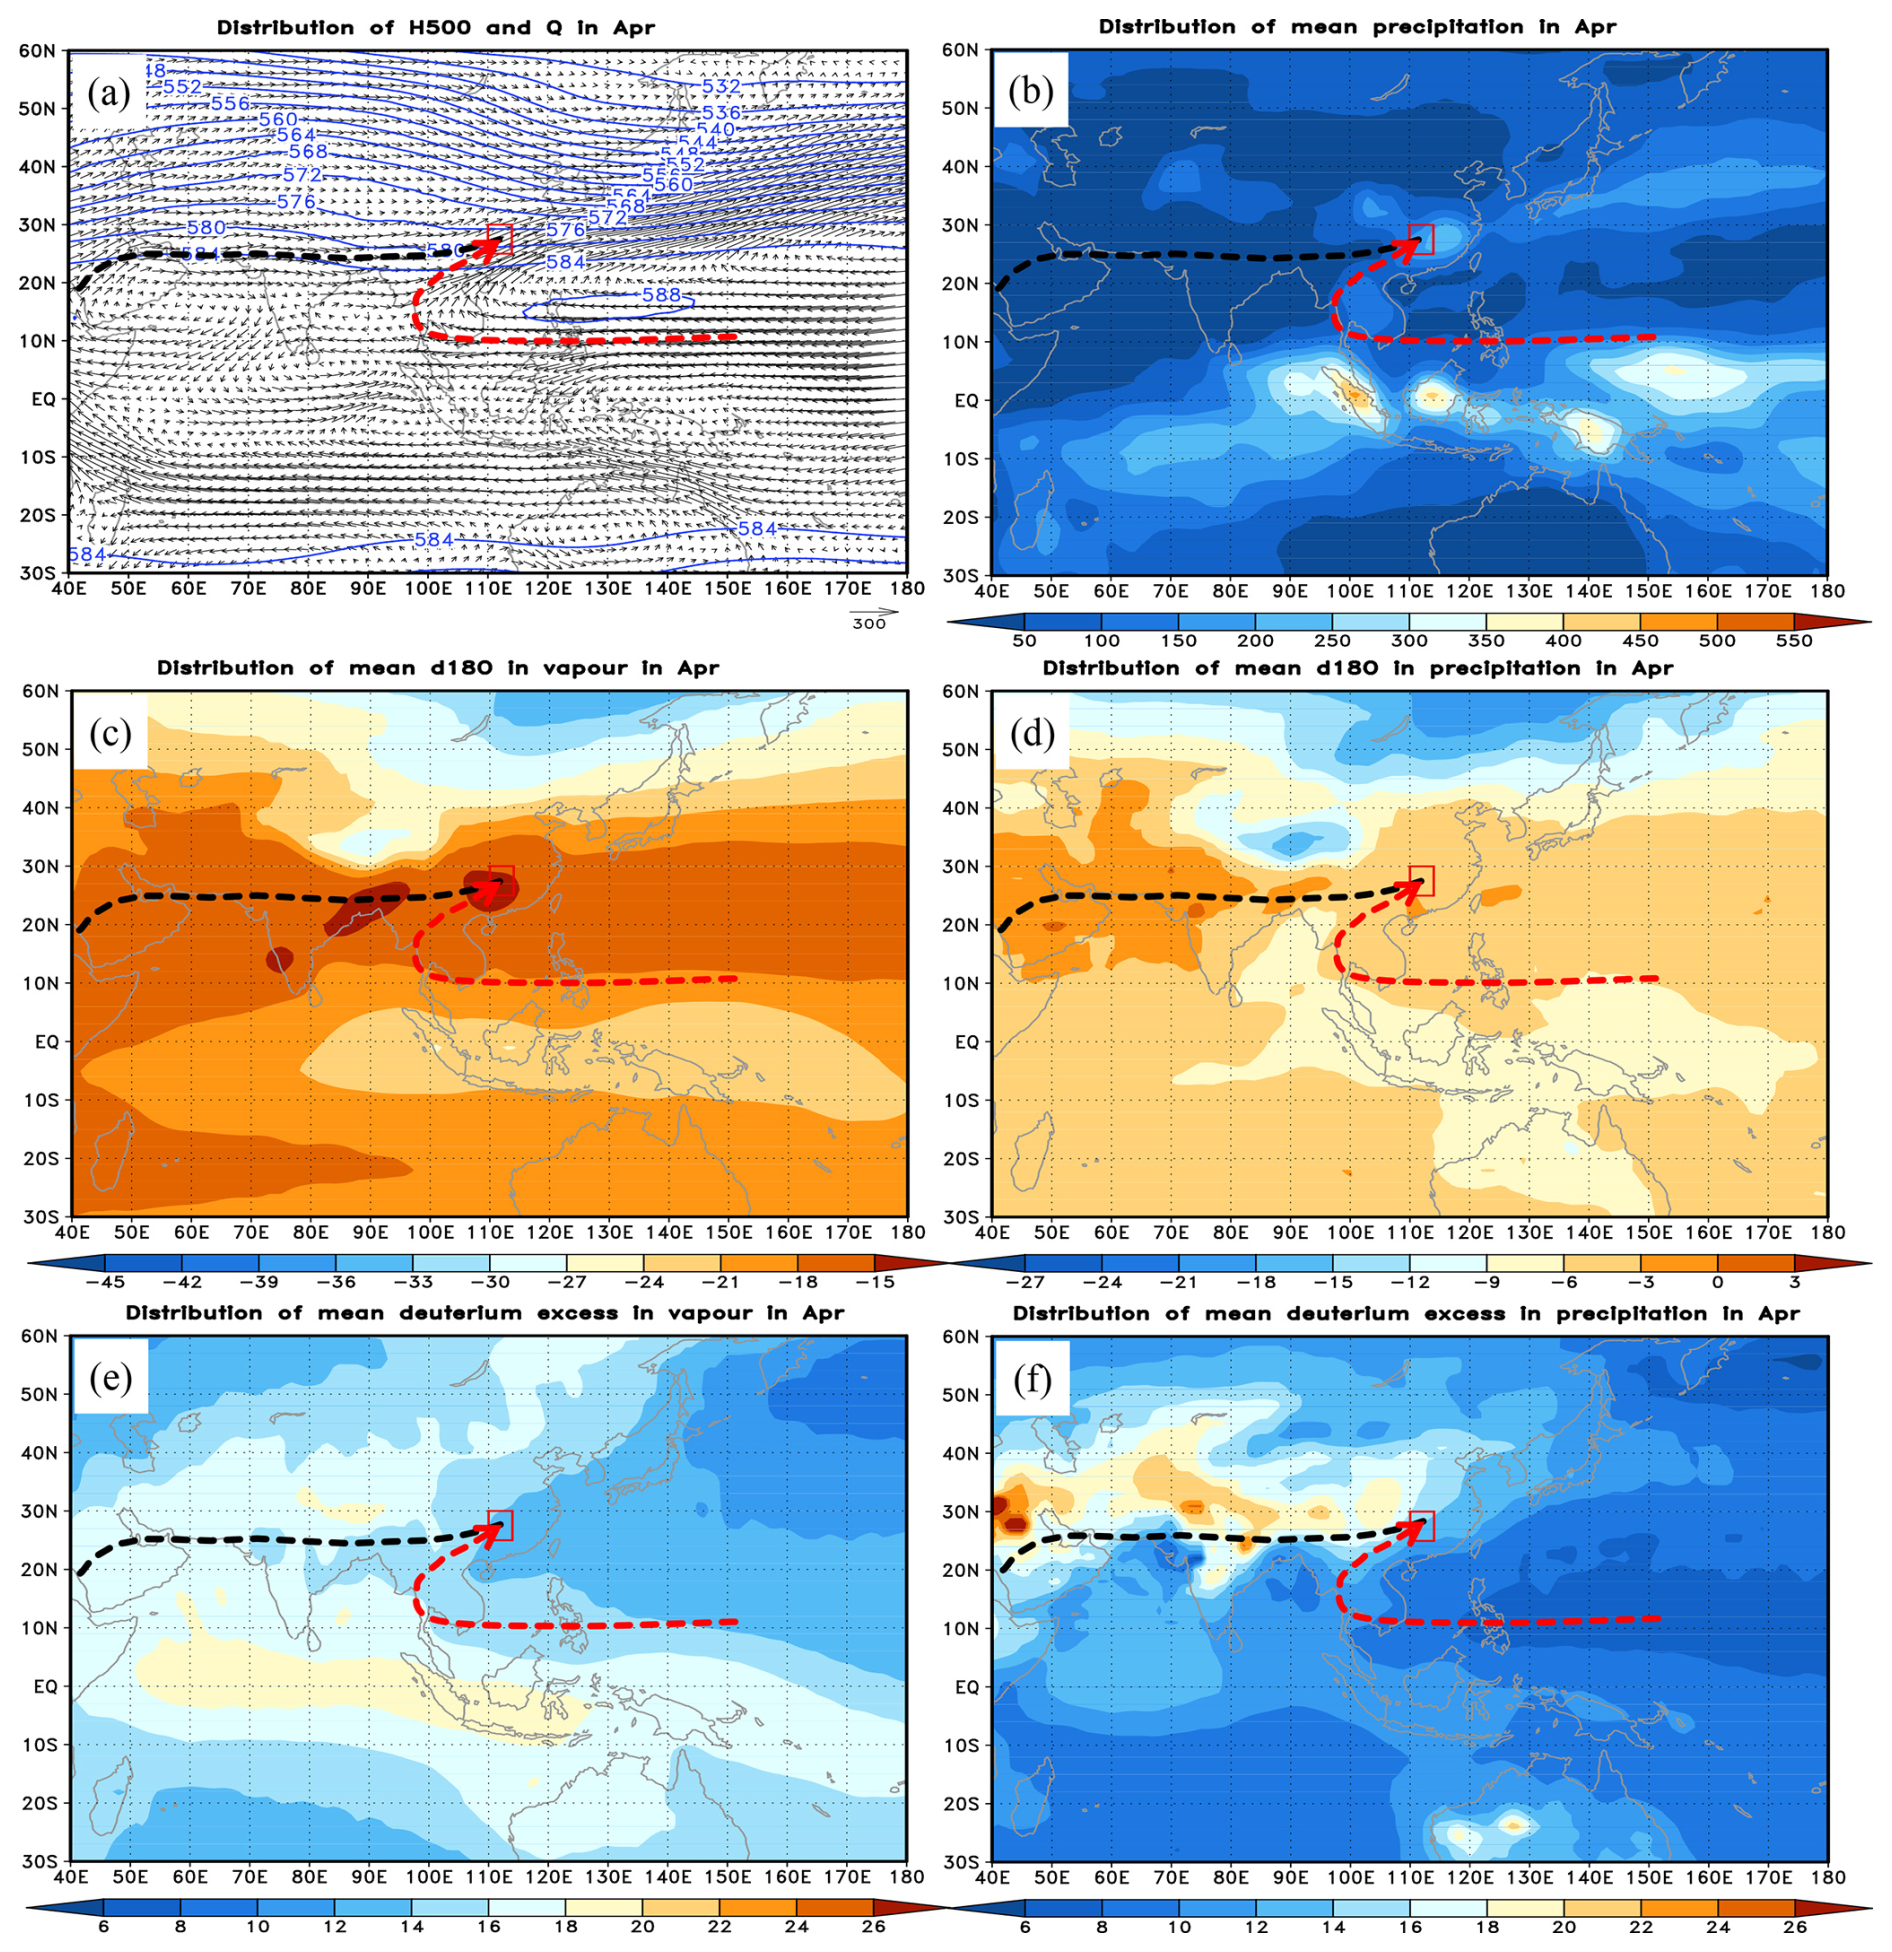
Figure 5Mean vapor transport paths to the Dongting Lake basin and the spatial distributions of Q with H500 (a), P (b), δ18Ov (c), δ18Op (d), dv (e), and dp (f) in April.
Compared to the situations in January, there were no major changes in the spatial distributions of δ18Ov and δ18Op in April (Fig. 5c and d). In the regions with low δ18Ov and δ18Op values, previously located in eastern Siberia and the Tibetan Plateau, atmospheric stable isotopes were significantly enriched. Due to temperature rise and enhanced evaporation, the regions with high levels of δ18Ov and δ18Op in the middle to low latitudes showed continual increases in δ18Ov and δ18Op values. With the strengthening of water vapor convergence in the Dongting Lake basin, the δ18Ov in the Dongting Lake basin showed significant increases in April, leading to an isotopic enrichment in precipitation. Compared to the large-scale region, the water isotope composition in the Dongting Lake basin was not significantly different from that of the middle- to low-latitude ocean, indicating the controls by the oceanic air masses (Fig. 5c and d).
In April, the spatial distributions of dv and dp were comparable to the situations in January (Fig. 5e and f). The regions with high-value dv, previously located in eastern Siberia and the Tibetan Plateau, respectively, showed significant reductions in range and intensity, but the regions with low-value dv in the western Pacific expanded, thereby reducing the differences between land and sea. With the continuous inland influx of oceanic water vapor from the western Pacific Ocean, the range of low-value regions of the dp expanded. Influenced by the increasing precipitation, the range of high-value regions of the dp in middle-latitude inland regions narrowed, but the intensity increased by varying degrees, especially in West Asia. Finally, both the dv and dp in the Dongting Lake basin showed decreases, which were influenced by the gradually strengthening summer monsoon and the water vapor transport situation (Fig. 5e and f).
Two water vapor transport paths were obtained according to the vector interpolation method introduced in Sect. 3.2.1 (Fig. 5a). The first water vapor transport path – that is, Path I (represented by black arrow lines in Fig. 5) – was essentially consistent with the water vapor transport path in January, but it is slightly shifted northward by 1° of latitude. The second water vapor transport path – that is, Path II (represented by red arrow lines in Fig. 5) – driven by the weak western Pacific subtropical high, guided warm and moist water vapor from the low latitudes of the western Pacific along the outer edge of the subtropical high, passing through the South China Sea and the Indochinese Peninsula and finally reaching into the Dongting Lake basin. Corresponding data at the grid points along two water vapor transport paths were extracted and plotted for the Q, P, δ18Ov, δ18Op, dv, and dp (Fig. 6).
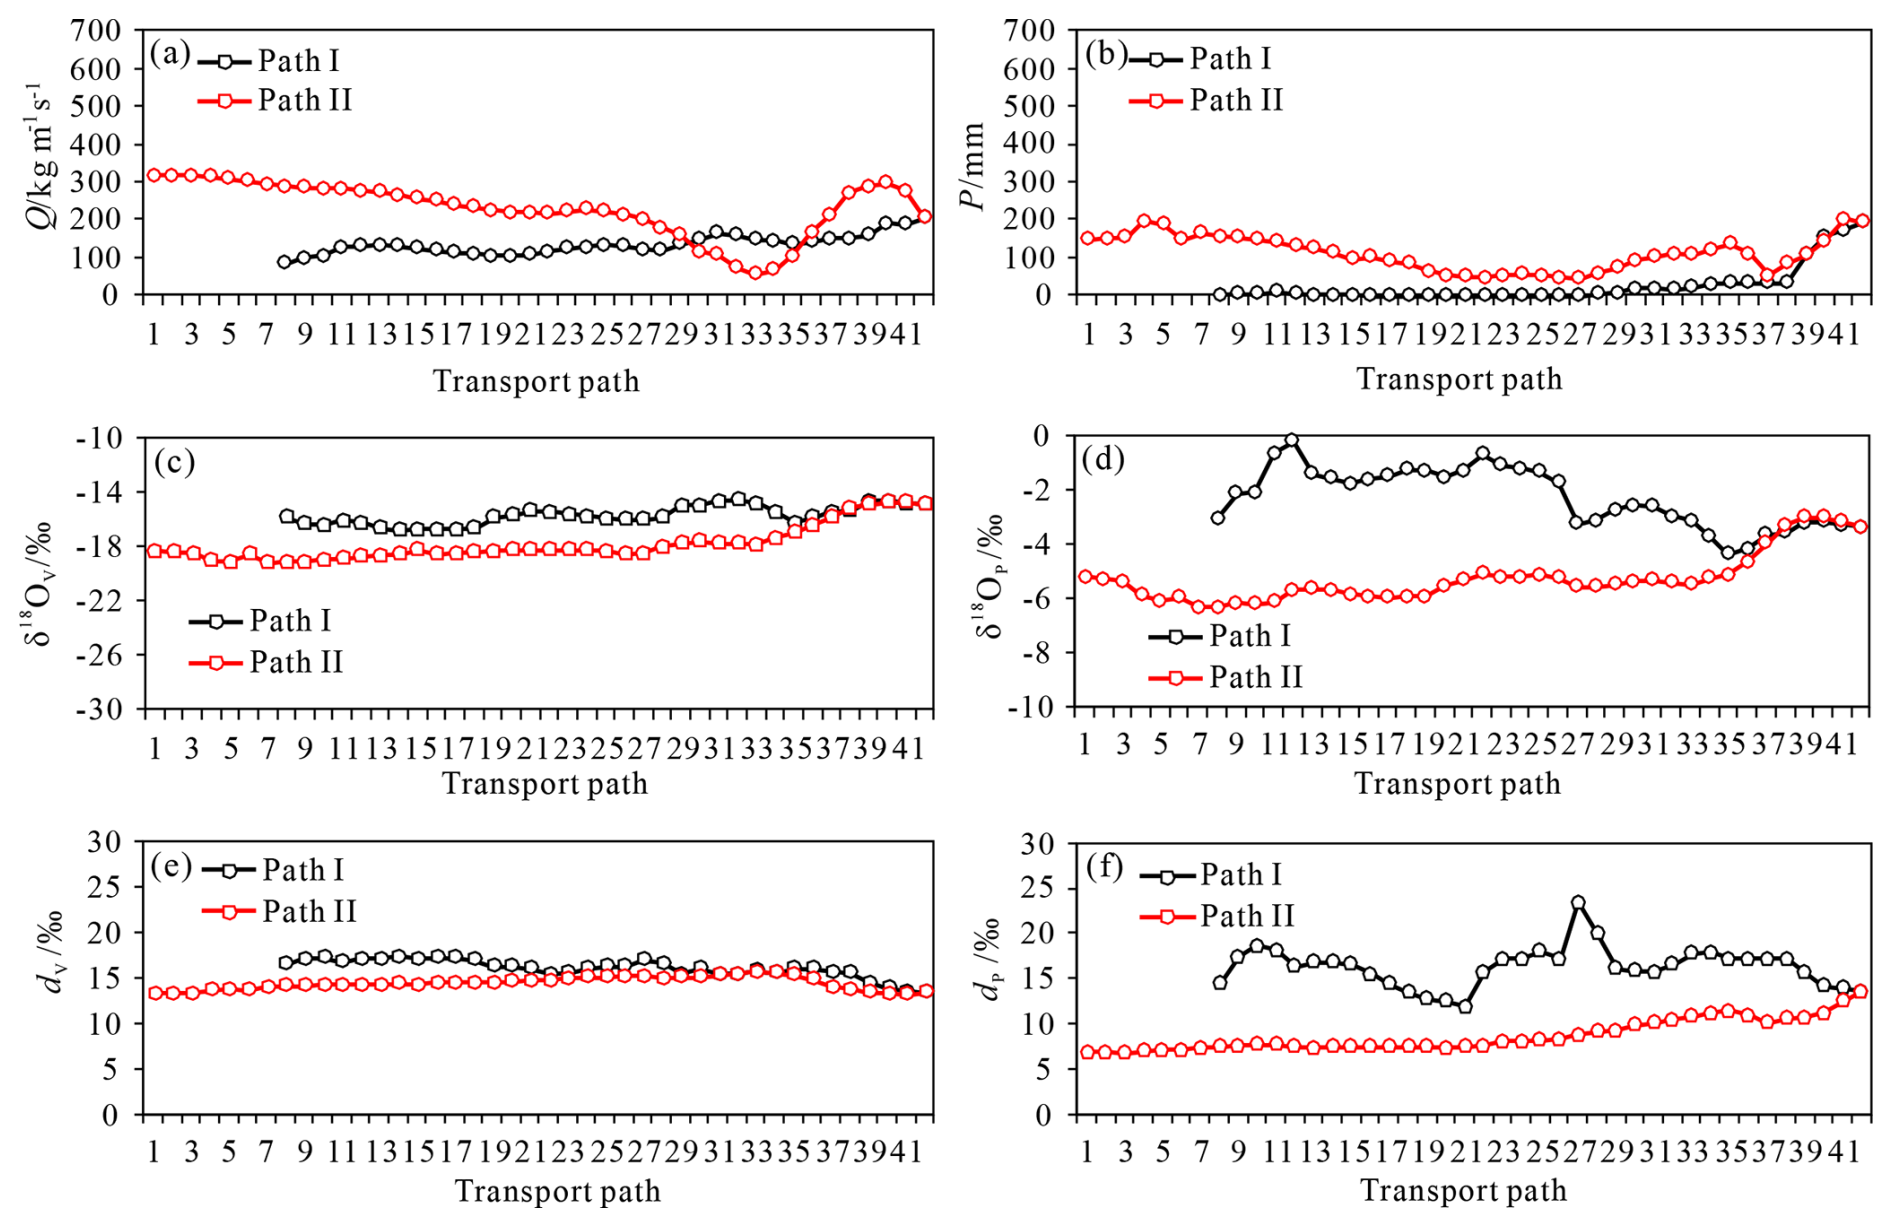
Figure 6Mean variations in Q (a), P (b), δ18Ov (c), δ18Op (d), dv (e), and dp (f) along the vapor transport paths in April.
Along Path I, both the Q and P showed slight increases compared to the situations in January (Fig. 6a and b); the average values in the first half of the water vapor transport path before entering the Dongting Lake basin were 128.2 and 10.5 mm, respectively, and were still at relatively low levels. After entering the Dongting Lake basin, the average Q and P increased to 180.1 and 135.0 mm, respectively. Under the transport of latitudinal water vapor, the δ18Ov increased slightly from −15.8 ‰ to −14.9 ‰, while the δ18Op decreased slightly from −2.1 ‰ to −3.3 ‰ (Fig. 6c and d). The corresponding dv decreased from 16.5 ‰ to 14.3 ‰, and the dp decreased from 16.6 ‰ to 15.0 ‰, indicating the input of oceanic water vapor (Fig. 6e and f).
Along Path II, both the Q and P were significantly larger than those along the latitudinal Path I (Fig. 6a and b), with the average values before entering the Dongting Lake basin being 226.6 and 108.2 mm, respectively. After entering the Dongting Lake basin, these values increased to 269.2 and 148.6 mm, respectively. The area where Q decreased significantly corresponds to a water vapor divergence region at the southwestern corner of the Indochinese Peninsula. Under the meridional water vapor transport, the δ18Ov increased from −18.2 ‰ to −14.9 ‰, while the δ18Op changed from −5.5 ‰ to −3.2 ‰ (Fig. 6c and d). Correspondingly, the dv decreased from 14.6 ‰ to 13.5 ‰, while the dp increased from 8.3 ‰ to 11.8 ‰ (Fig. 6e and f), following the variation rule of deuterium excess during water vapor transport – that is, as the rainout effect progressed, the heavier isotopes preferentially left the water vapor parcel or cloud during the water vapor transport processes and generated precipitation, thus resulting in subsequent precipitation having increasingly higher deuterium excess values (Vasil'chuk, 2014). Moreover, there was a large increase in both the Q and P before entering the Dongting Lake basin along Path II, and the increase in the isotope ratio of precipitation may seem inconsistent with the rainout effect, which typically leads to the depletion of heavier isotopes in the remaining water vapor. However, this increase can be attributed to the horizontal convergence of more enriched water vapor. Path II showed a significant increase in both the Q and P before entering the Dongting Lake basin (Fig. 6a). This suggested that the enriched water vapor from the surrounding water vapor contributed to the overall increase in the δ18Ov and δ18Op. The influx of this enriched water vapor counteracts the depletion effect caused by rainout, resulting in the observed increase in precipitation isotope values.
3.2.3 Average water vapor transport path in the Dongting Lake basin in June
Based on the ERA5 reanalysis data and isoGSM2 simulation data, the spatial distributions of the average H500, Q, P, δ18Ov, δ18Op, dv, and dp were, respectively, calculated and plotted for June (Fig. 7). For the H500 field (Fig. 7a), the East Asian trough continues to stably exist in June, but the position of the trough line shifted eastward over the North Pacific Ocean. The high-pressure ridge in the eastern part of the Ural Mountains weakened and shifted eastward over Lake Baikal. The rapidly intensifying western Pacific subtropical high expanded westward and northward, with its ridge line located at approximately 22–23° N, while the India–Myanmar trough in the northern Bay of Bengal strengthened continuously. The atmospheric circulation conditions indicated that most of East Asia, including the area south of the Yangtze River, has entered the prevailing period of the summer monsoon (Fig. 7a). The warm and moist water vapor from the Arabian Sea and the Bay of Bengal driven by the India–Myanmar trough as well as along the outer edge of the subtropical high from the western Pacific met the cold air moving southward behind the East Asian trough and thus generated an extremely long rain belt spanning 20° of latitude and 70° of longitude from India through the Indochinese Peninsula via southern China to central Japan (Fig. 7b). In this rain belt, the three largest precipitation centers were located on the western coast of India, the Thai–Myanmar border region, and the Jiangnan region of China. The formation of the first two precipitation centers was related to terrain, while the formation of the precipitation center in the Jiangnan region of China was related to the convergence of warm and moist water vapor from low latitudes to this region (Fig. 7b).
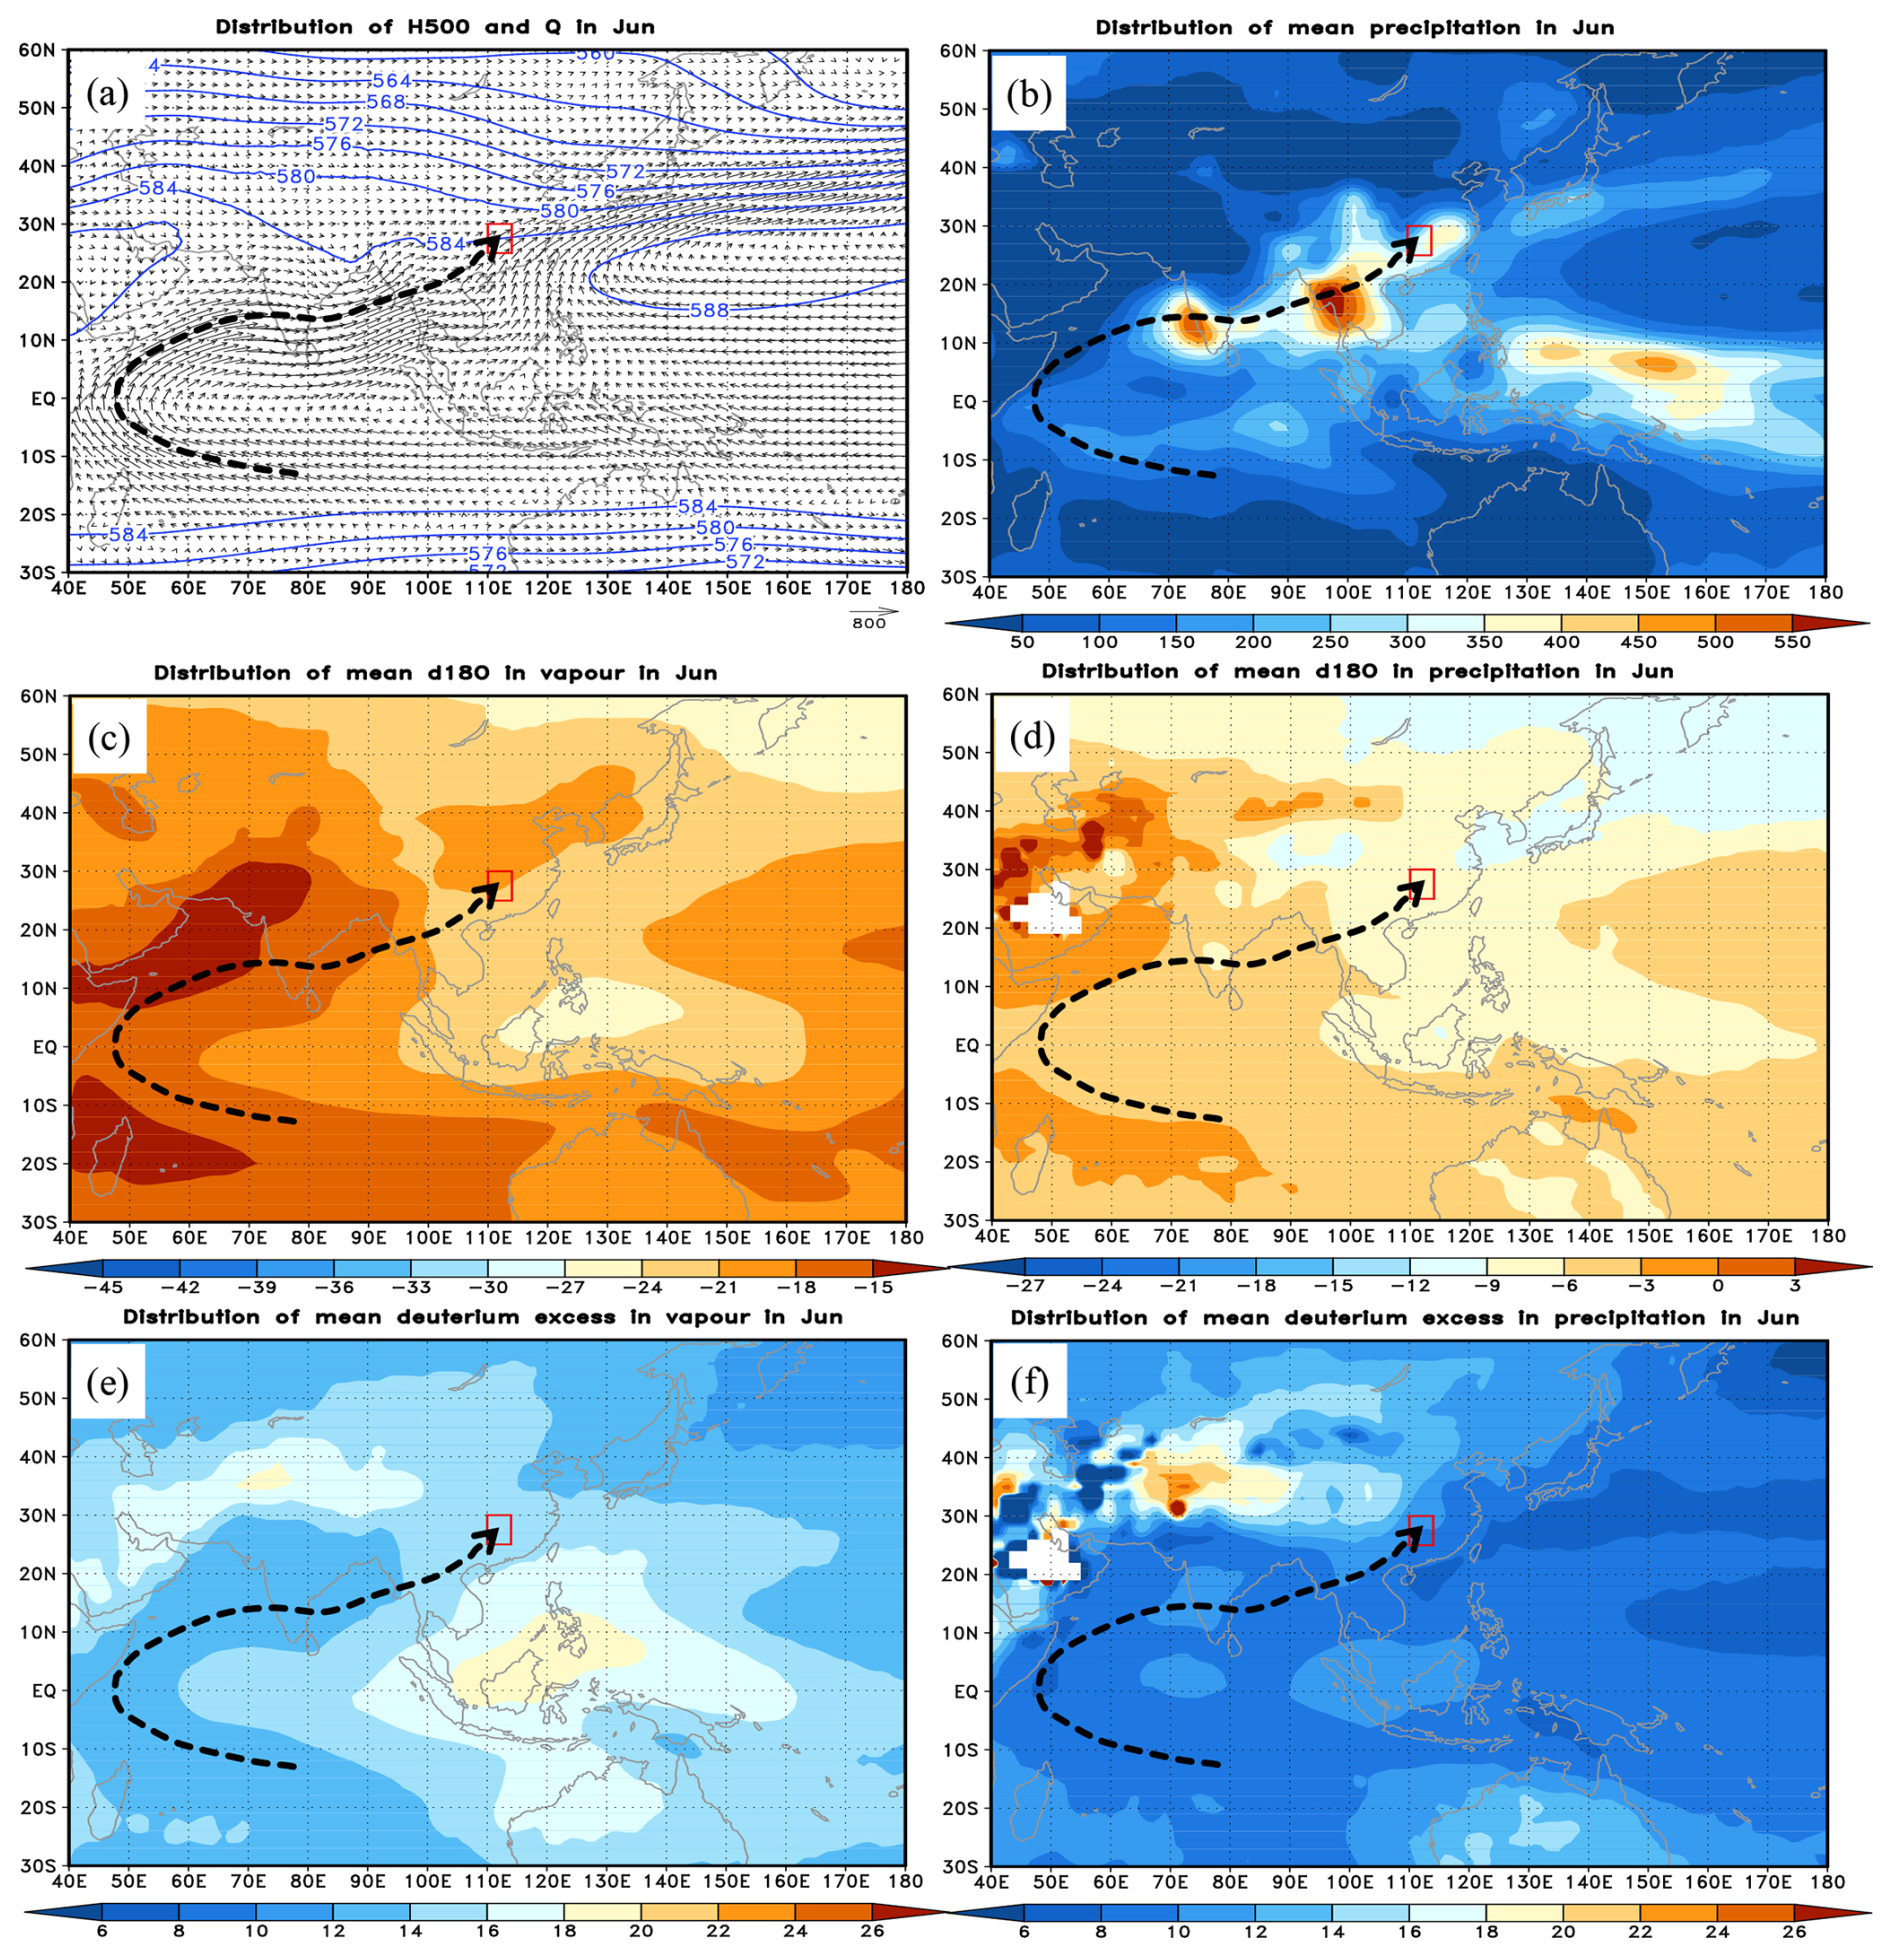
Figure 7Mean vapor transport path to the Dongting Lake basin and the spatial distributions of Q with H500 (a), P (b), δ18Ov (c), δ18Op (d), dv (e), and dp (f) in June.
With the change in the circulation condition, the distributions of the δ18Ov and δ18Op in June changed accordingly (Fig. 7c and d). The stable isotopes in both water vapor and precipitation at middle to high latitudes were significantly enriched, with reduced spatial differences. The δ18Ov and δ18Op values remained high in the Arabian Sea, the Bay of Bengal, and the Southern Ocean; the region with high δ18O in the western Pacific narrowed; and the low δ18O values in the Indonesia–Philippines region in the western equatorial Pacific were associated with enhanced water vapor convergence (Fig. 7a, c, and d). The regional low-δ18O center previously present in the cold season over the Tibetan Plateau disappeared. In the Jiangnan region of China, the convergence of water vapor from low-latitude oceans led to isotopic enrichment in water vapor, but the strong rainout effects caused isotopic depletion in precipitation (Fig. 7c and d). The spatial distributions of dv and dp in June showed no significant differences compared to the situations in April (Figs. 5e, 5f, 7e, and 7f). The high-value regions for the dv and dp were located in the region stretching from western Asia through the Tibetan Plateau to southwestern China, as well as in the vast oceanic region centered around the Philippines and Indonesia. Under the influence of the summer monsoon, the difference in deuterium excess between East Asia and its water vapor source – that is, the low-latitude ocean – remained relatively small (Fig. 7e and f).
Based on the vector interpolation of the Q field (Fig. 7a), the water vapor transport path was determined in June according to the vector interpolation method introduced in Sect. 3.2.1 (shown by the black arrow lines in Fig. 7). This water vapor transport path originated from the northern branch of the southern Indian Ocean subtropical high; crossed the Equator; was transported through the Somali Sea, the Arabian Sea, the Indian Peninsula, the Bay of Bengal, and the Indochinese Peninsula; and entered the southwestern region of China before finally reaching the Dongting Lake basin. It can be seen that this water vapor transport path was consistent with the prevailing wind direction in June as shown in Fig. 1a. The corresponding Q, P, δ18Ov, δ18Op, dv, and dp along the water vapor transport path were extracted and plotted in Fig. 8.
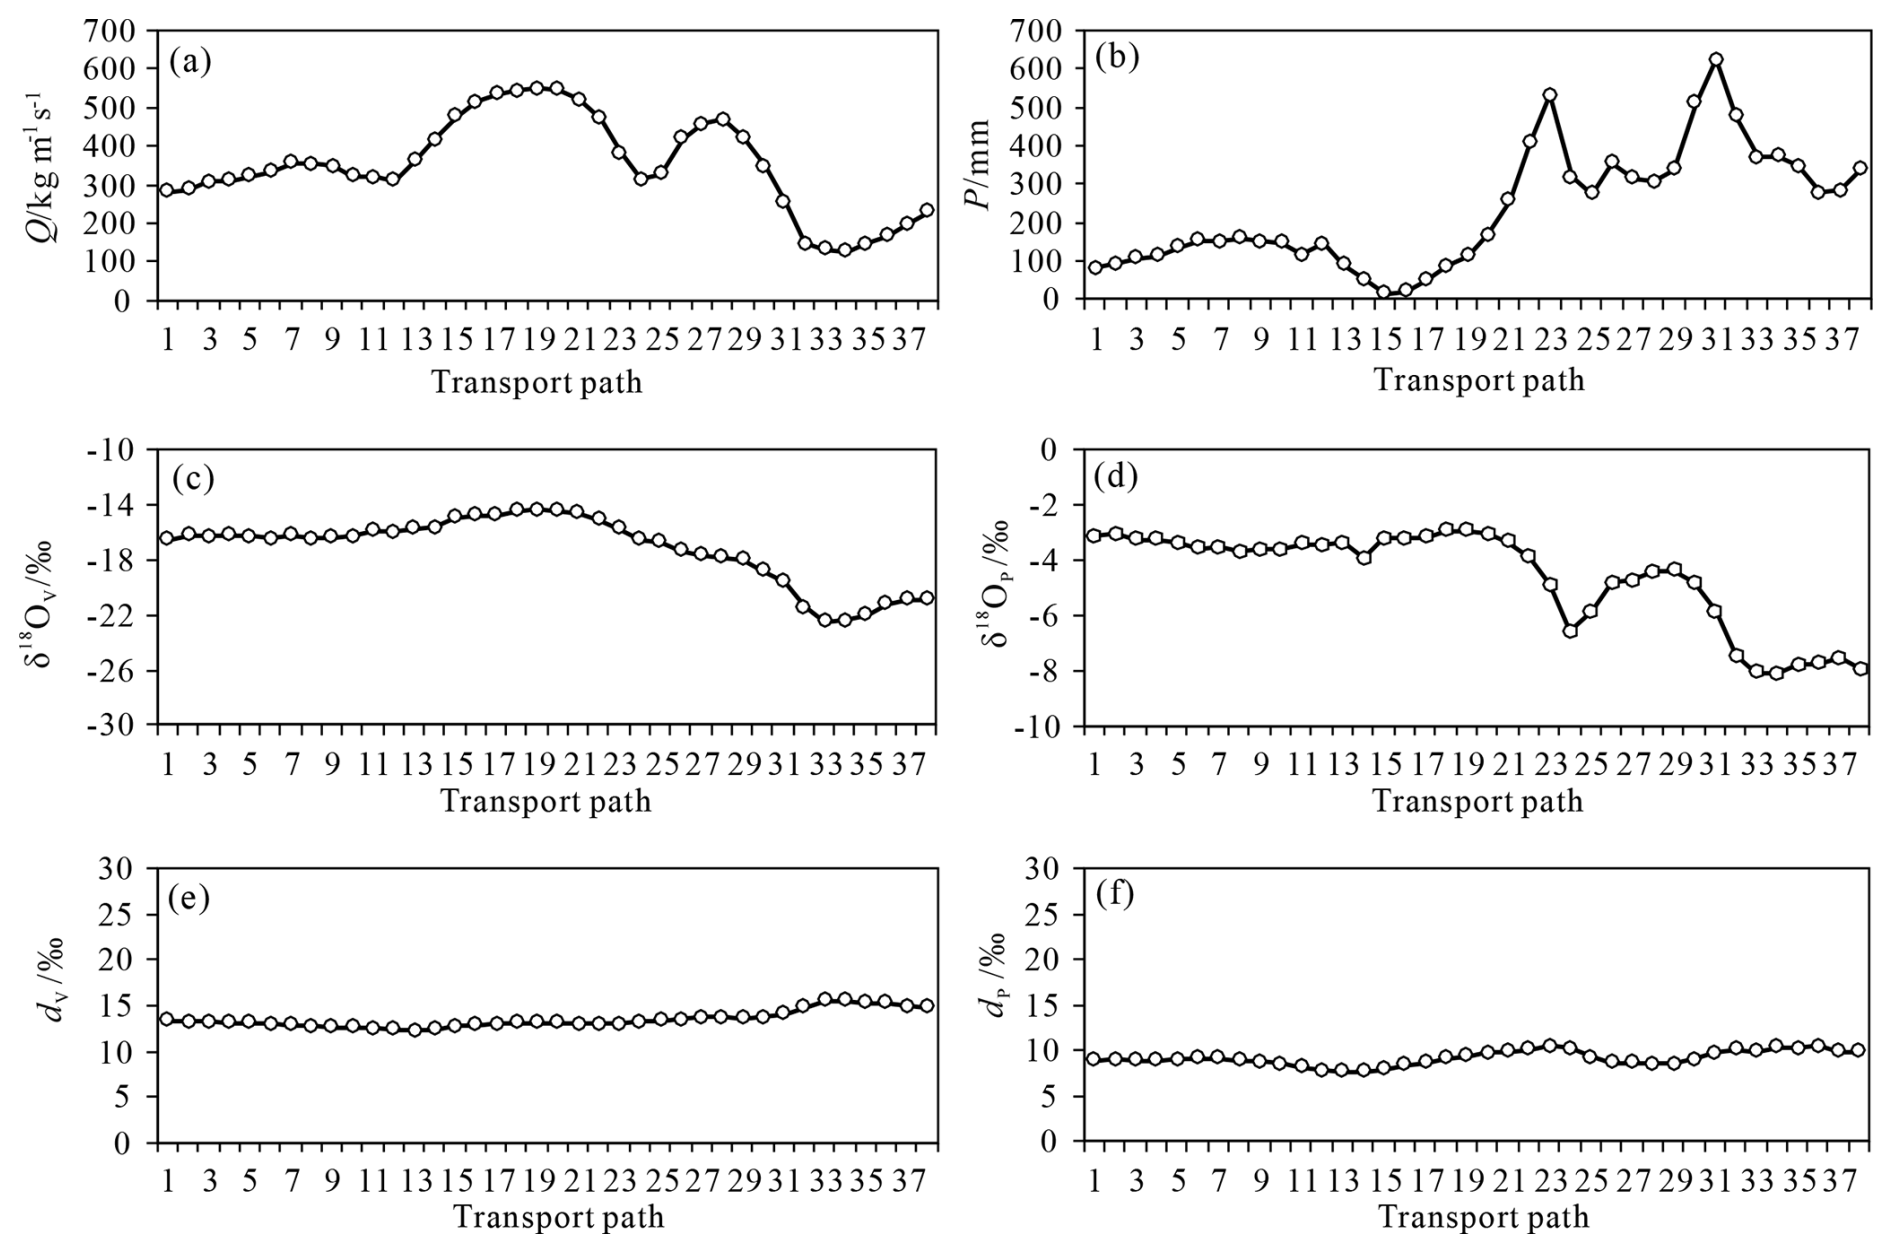
Figure 8Mean variations in Q (a), P (b), δ18Ov (c), δ18Op (d), dv (e), and dp (f) along the vapor transport path in June.
Along the water vapor transport path, the average Q and P were at their maximum throughout the year, reaching 353.9 and 236.5 mm, respectively (Fig. 8a and b). The three extreme values of the Q along the transport path or in the process of transitioning from the maximum to minimum values correspond to three P extremes located on the western coast of the Indian Peninsula, in the border region between Thailand and Myanmar, and in the region around the Dongting Lake basin (Fig. 7b), with values of 535.1, 627.8, and 341.5 mm, respectively (Fig. 8b). With continuous precipitation especially after experiencing heavy precipitation and the simultaneous persistent rainout processes, the stable isotopes in both water vapor and precipitation exhibit a trend of continuous depletion (Fig. 8c and d). However, there were no significant changes in both the dv and dp (Fig. 8e and f); the reasons may be due to the continuous water vapor supply from low-latitude oceans, similar advective paths between the grid points, and the similar degrees of sub-cloud evaporation.
3.2.4 Average water vapor transport path in the Dongting Lake basin in October
The spatial distributions of the average H500, Q, P, δ18Ov, δ18Op, dv, and dp in October were shown in Fig. 9. A notable feature at the H500 field in October was the expansion of the latitudinal westerlies toward lower latitudes (Fig. 9a). In East Asia, westerly winds prevail in the inland regions north of approximately 30° N, while much of the regions south of 30° N were still influenced by the subtropical high-pressure system. Compared to the peak period, the western Pacific subtropical high had significantly weakened in autumn, and its main body had also retreated to the open sea. However, a mesoscale anticyclone split from the high still controlled the Jiangnan region of China including the Dongting Lake basin, creating a climate characterized by a clear and crisp autumn (Fig. 9a). Due to the disappearance of the India–Myanmar trough and influenced by the anticyclone circulation, the water vapor transport from the southwestern low-latitude oceans decreased significantly. In the Dongting Lake basin, both the meridional and latitudinal water vapor transport were even less than the values in January (Figs. 3a and 9a). Apart from the autumn rains in western China, precipitation was generally scarce in East Asia in this period, with the rain belt shifting southward to lower latitudes, corresponding to the convergence zone near the Equator, with the largest precipitation regions located, respectively, south of the Equator in the Indian Ocean, on the Malay Peninsula, and north of the Equator in the western Pacific (Fig. 9b).
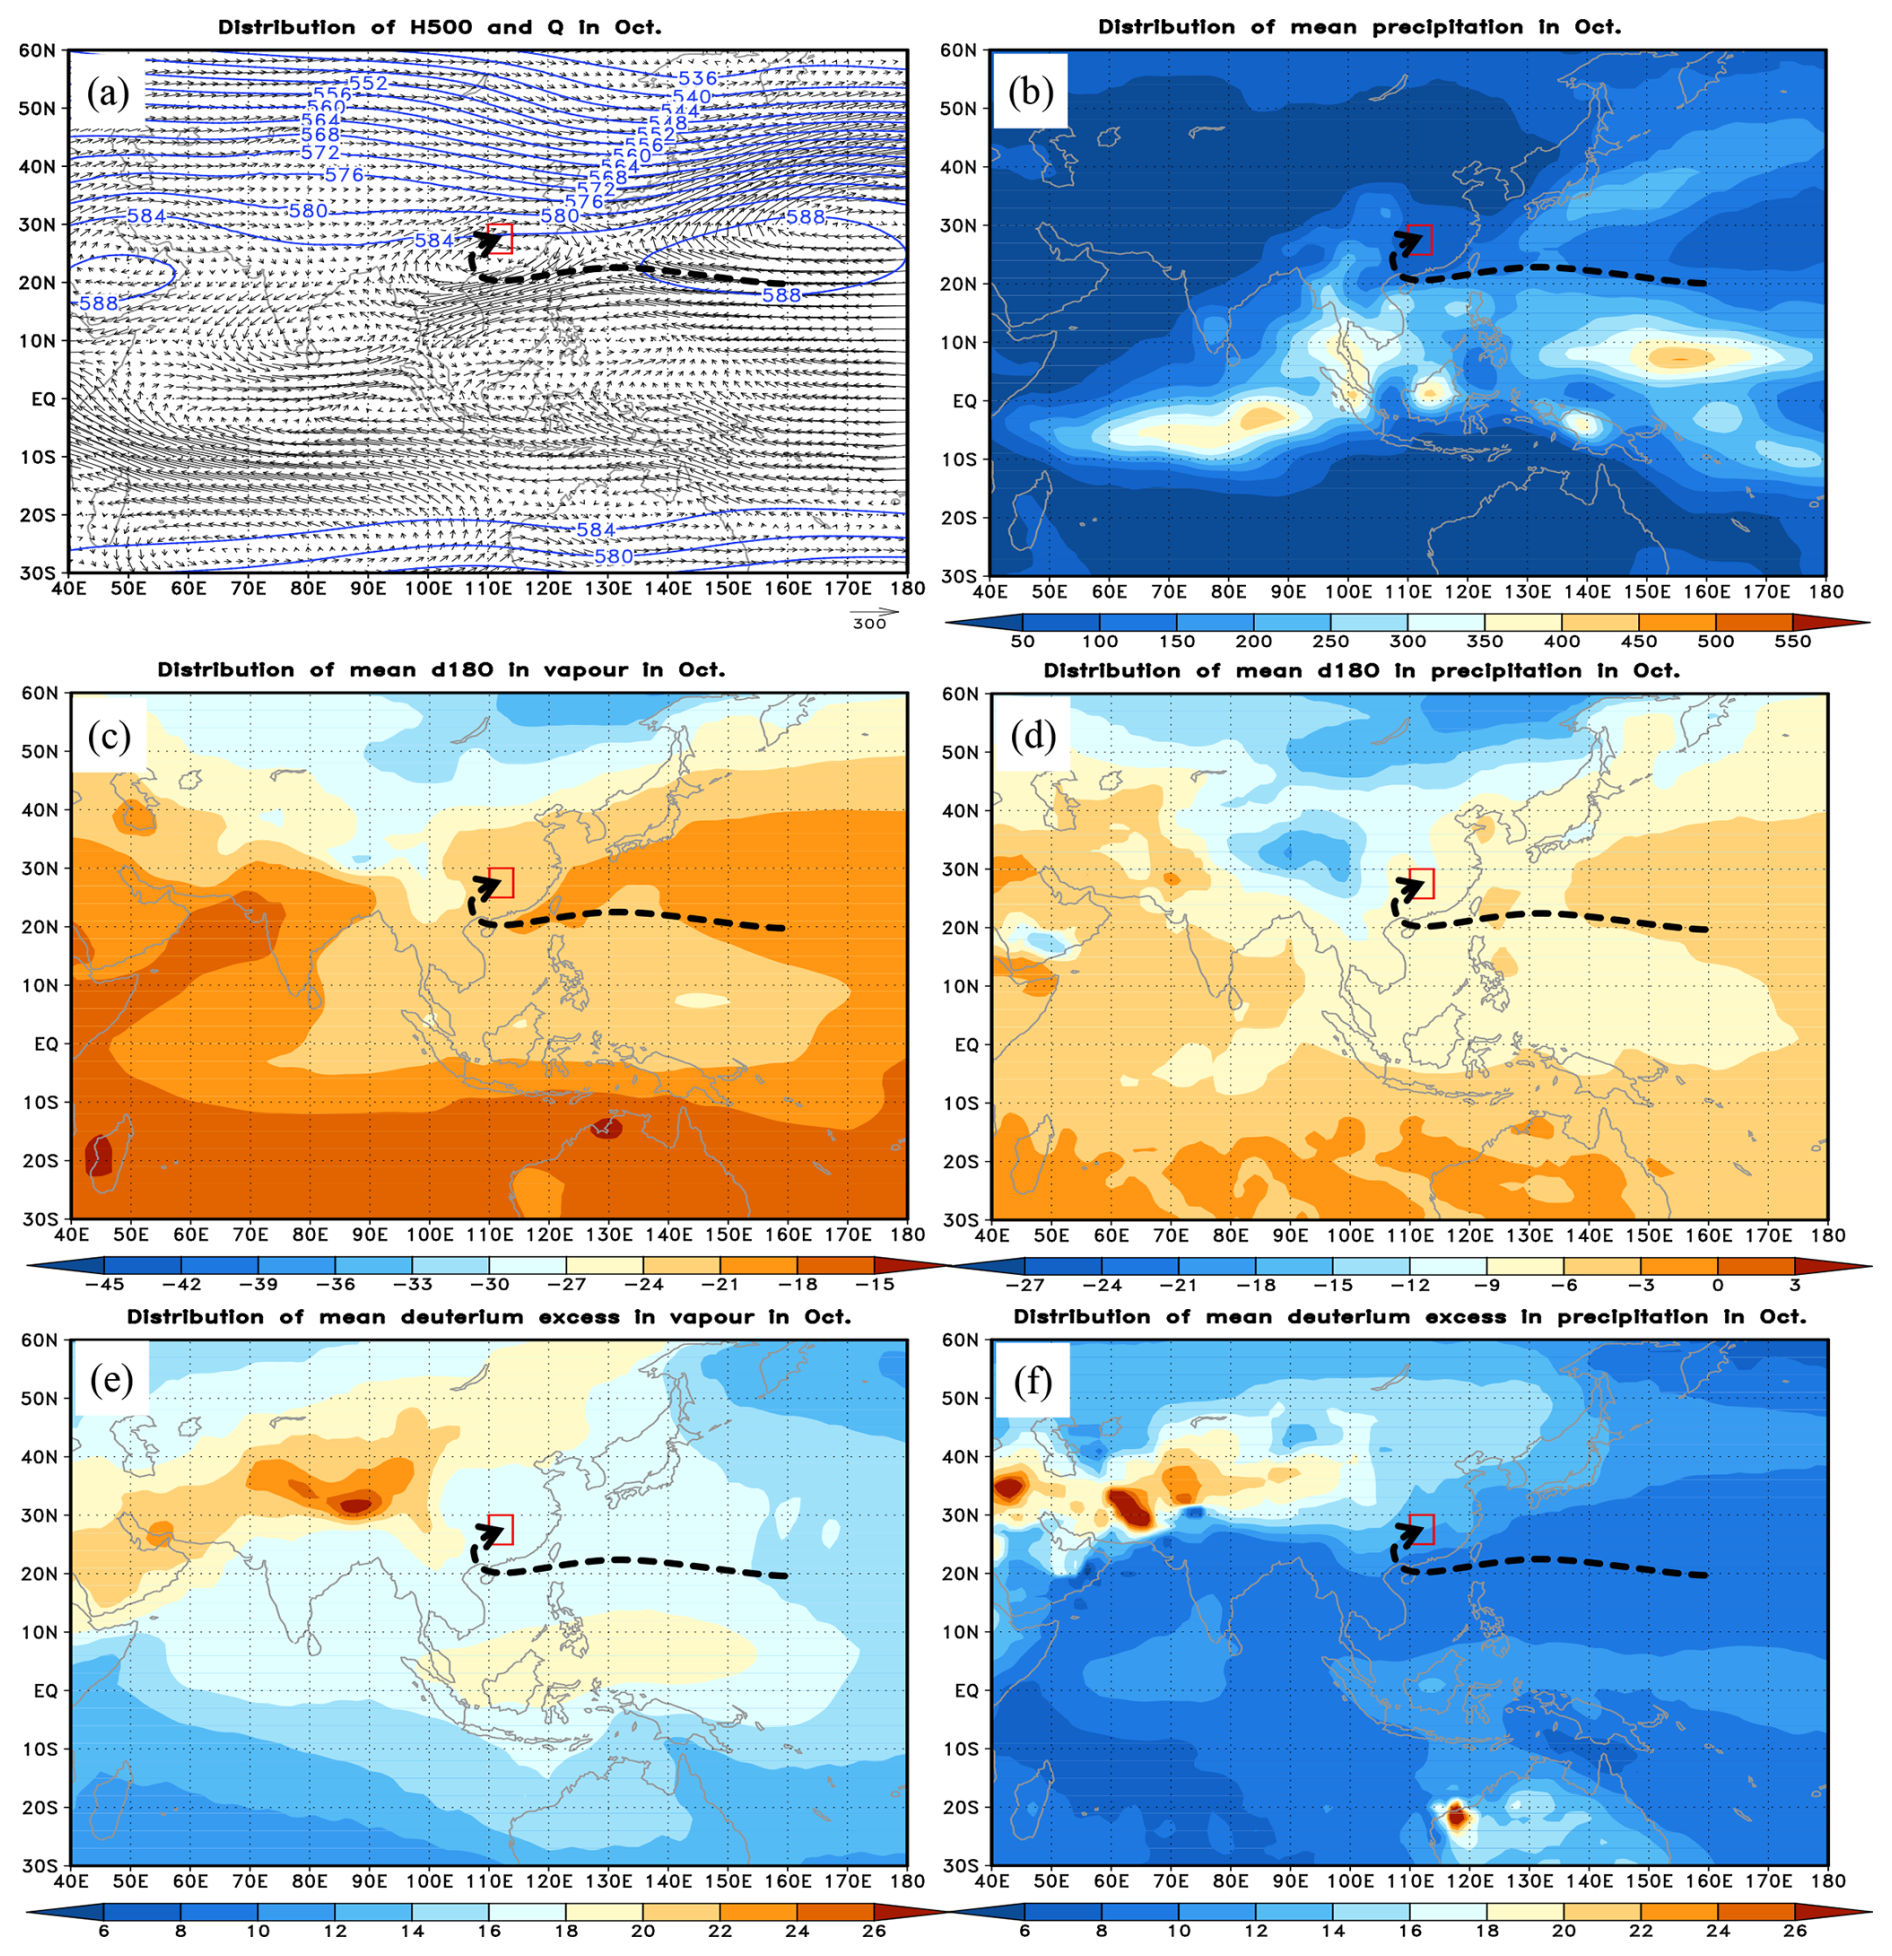
Figure 9Mean vapor transport path to the Dongting Lake basin and the spatial distributions of Q with H500 (a), P (b), δ18Ov (c), δ18Op (d), dv (e), and dp (f) in October.
Compared to the situations in June, there were no significant changes in the spatial distribution of the δ18Ov and δ18Op in October, but their differences between land and sea as well as between high and low latitudes increased largely (Fig. 9c and d). The stable isotopes in water vapor and precipitation were significantly depleted in eastern Siberia and the Tibetan Plateau and accompanied by the expansion of ranges. As a result, the δ18Ov and δ18Op showed a significant decrease in the inland regions north of approximately 30° N but were unchanging in most regions south of 30° N. From the spatial distributions in October, both the dv and dp over the ocean or on land showed increases with varying degrees (Fig. 9e and f). The high-value regions of the dv were distributed along a line from the Arabian Peninsula, West Asia, and the Tibetan Plateau to eastern Siberia, with the maximum value being located in the Tibetan Plateau. The high-value region of dp was distributed from the Arabian Peninsula, West Asia, and the Tibetan Plateau to the Yunnan–Guizhou Plateau. With the weakening of the summer monsoon, the dv and dp were not significantly different in East Asia including the Dongting Lake basin from those in the surrounding oceans.
Based on the vector interpolation of the Q field (Fig. 9a), the water vapor transport path was determined in October according to the method introduced in Sect. 3.2.1 (indicated by the black arrow line in Fig. 9). This water vapor transport path originated from the western Pacific, passed through the South China Sea, flowed westward along the easterly jet located in the south of the western Pacific subtropical high and of the anticyclonic circulation over the Jiangnan region in China, and finally entered the Dongting Lake basin while bypassing the southwest of the anticyclone. Although this water vapor path belonged to the latitudinal transport, the water vapor source originated from the low-latitude oceans of the western Pacific.
The corresponding Q, P, δ18Op, δ18Ov, dv, and dp along the water vapor transport path were derived in October (Fig. 10). Under the stable atmospheric circulation conditions, the average water vapor flux steadily decreased from approximately 299.0 in the source region to 168.0 along the water vapor transport path and further below 100.0 after entering the Dongting Lake basin (Fig. 10a). The P values changed gradually along the water vapor transport path, decreasing from the initial value of approximately 145 mm to below 100 mm in the Dongting Lake basin and further to 60.5 mm in the Changsha region (Fig. 10b). Both the δ18Ov and δ18Op values showed slow decreases as the ranges within 2.0 ‰ and 1.0 ‰, respectively (Fig. 10c and d). The dv showed minor fluctuation, stabilizing at approximately 16.8 ‰, while the corresponding dp remained around 8.6 ‰ before entering the Dongting Lake basin. Due to the replenishment from the surface evaporation, the dp values increased to 11.6 ‰ after entering the Dongting Lake basin (Fig. 10e and f).
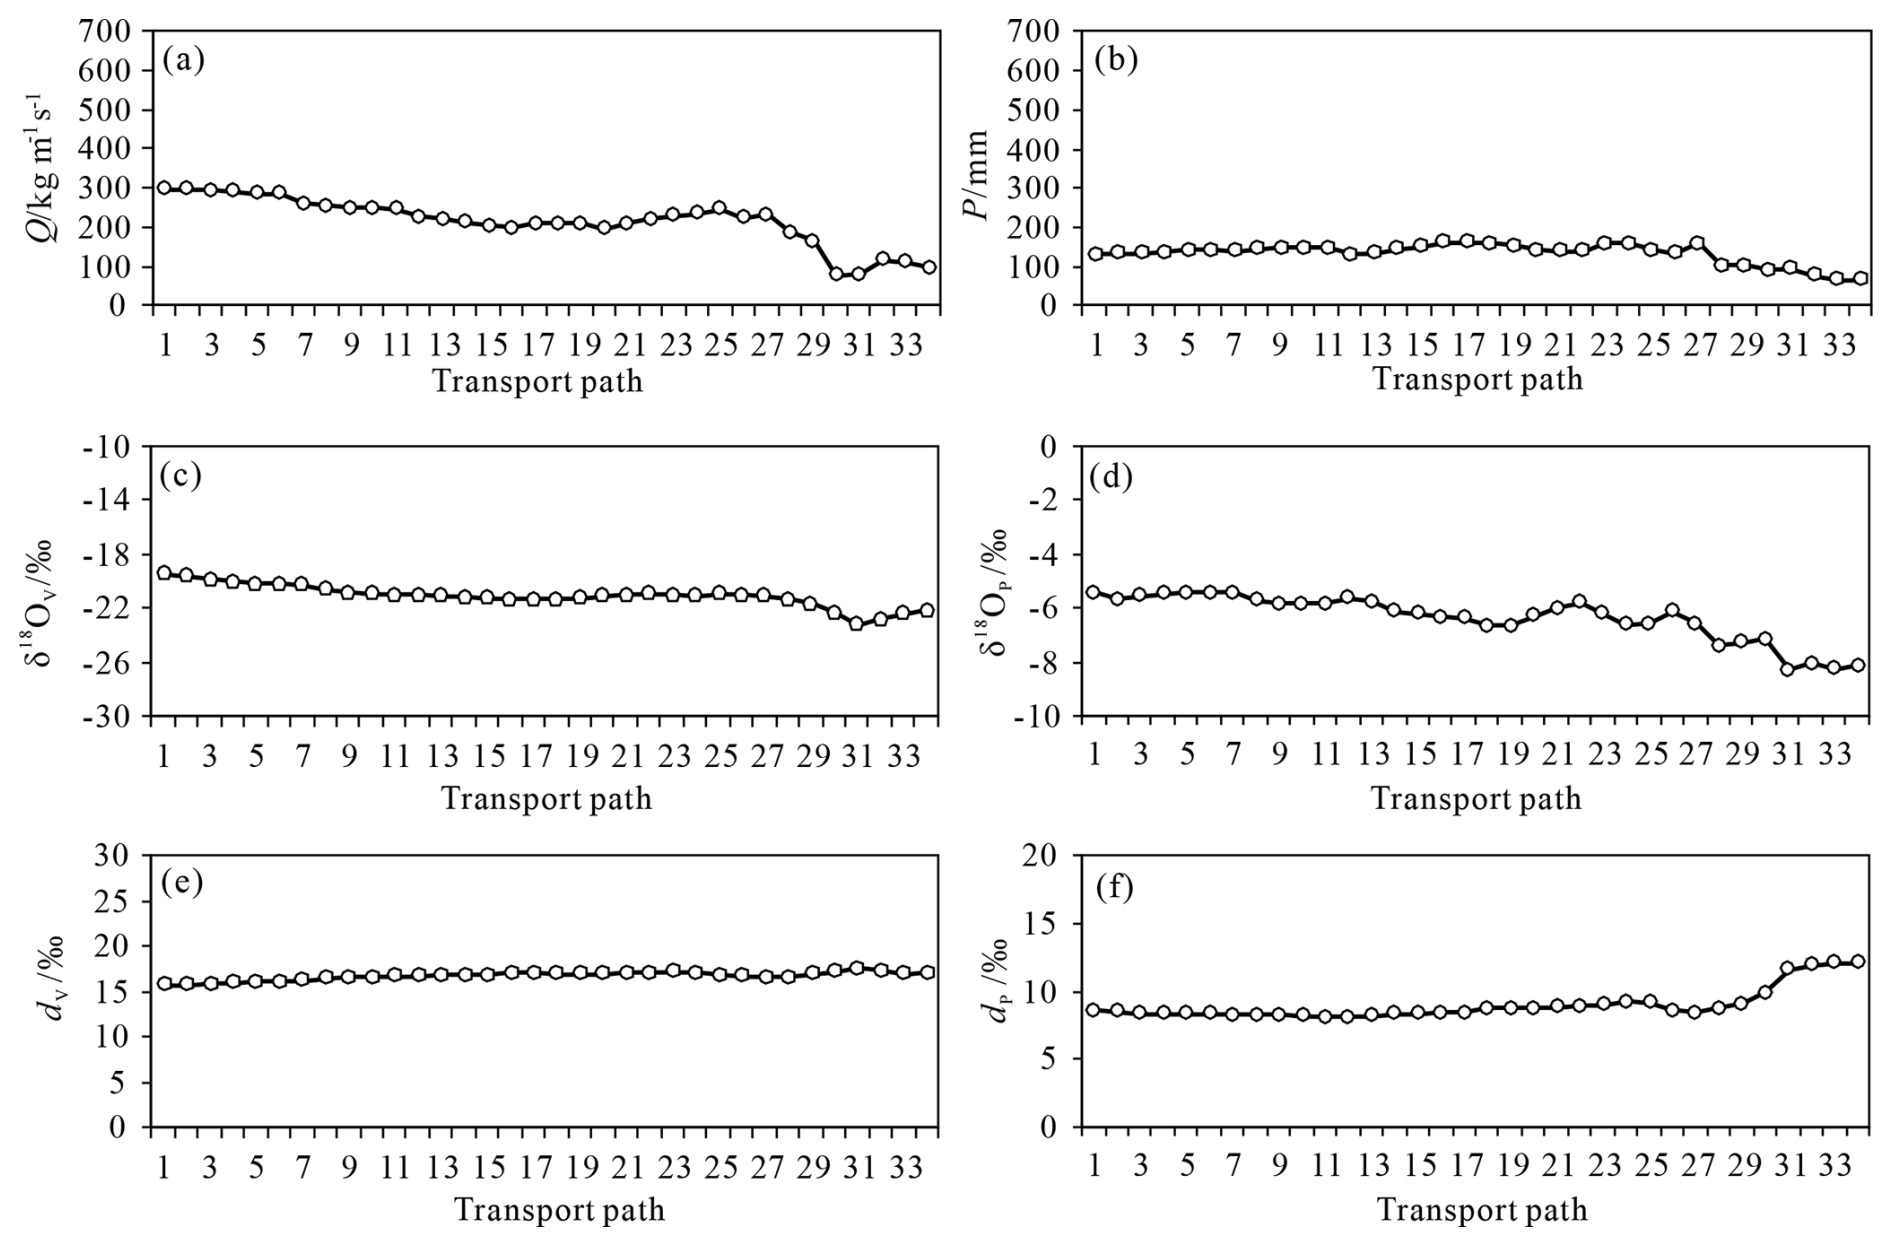
Figure 10Mean variations in Q (a), P (b), δ18Ov (c), δ18Op (d), dv (e), and dp (f) along the vapor transport path in October.
4.1 The influence of seasonality in water vapor sources on precipitation isotopes
The comparisons between the Q and δ18Op in the representative months indicated that there seems to be no obvious correspondence between these two factors: the months with low Q would exhibit either high or low δ18Op, e.g., January and October, respectively (Figs. 3 and 9). Similarly, the months with high Q would exhibit either low or high δ18Op, for example, June and April, respectively (Figs. 5 and 7). It has been found that regardless of the season, the precipitation in the Dongting Lake basin mainly originated from warm and moist water vapor in low latitudes (Figs. 3, 5, 7, and 9). Therefore, the question remains as to whether the water vapor isotopes in the source regions and along the transport path influence the downstream isotopes of precipitation or water vapor. To reveal this causality, after considering the water vapor transport paths and the air mass properties of water vapor in the representative months, the water vapor regions corresponding to the Arabian Peninsula (40–56° E, 16–28° N), the Arabian Sea (56–74° E, 10–20° N), the Bay of Bengal (80–98° E, 8–18° N), and the western Pacific Ocean (120–160° E, 6–20° N), along with the inland regions of the Dongting Lake basin (110–114° E, 25–30° N) and East Asian monsoon region (110–135° E, 42–55° N), were labeled as Regions I, II, III, IV, V, and VI, respectively (Fig. 11). The average δ18O and deuterium excess of water vapor and precipitation for each representative region were calculated in January, April, June, and October, respectively. Since the seasonal variations in the δ18Ov were similar to that in δ18Op, Table 1 only provides the average δ18O and deuterium excess of water vapor for each representative region.
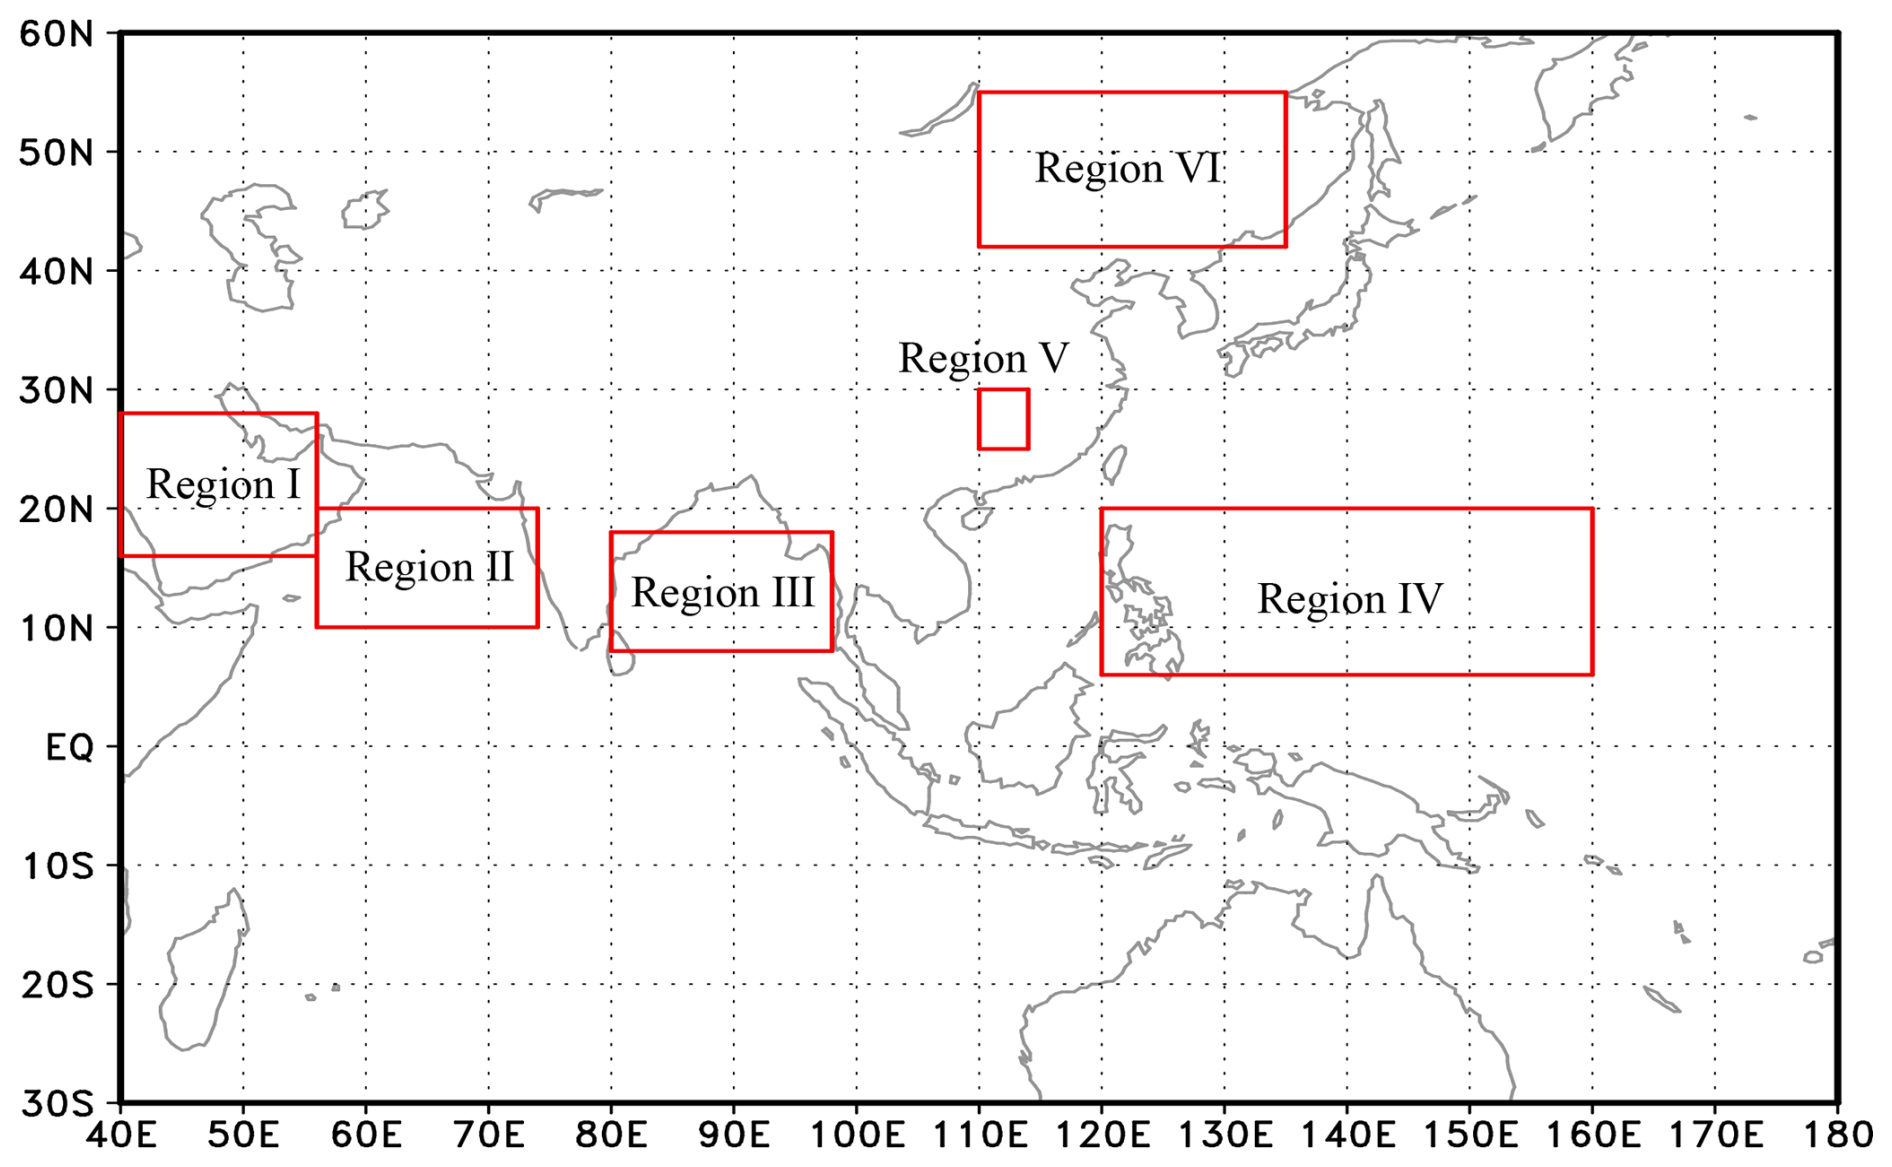
Figure 11Geographical distribution of representative regions. (Region I: Arabian Peninsula, Region II: Arabian Sea, Region III: Bay of Bengal, Region IV: western Pacific, Region V: Dongting Lake basin, Region VI: inland of the East Asian monsoon region at middle and high latitudes).
Not only in Regions I to V located in middle to low latitudes but also in Region VI located in the middle- to high-latitude inland regions was there significant seasonality in the average δ18Ov and dv (Table 1). The seasonal ranges in the δ18Ov (the differences between the monthly maximum and minimum values) in these six representative regions were 2.9 ‰, 3.3 ‰, 4.2 ‰, 5.1 ‰, 7.2 ‰, and 18.9 ‰, respectively, with the largest seasonal range in δ18Ov appearing in Region VI (Table 1). Except for Region VI, the minimum values of the monthly δ18Ov in other representative regions all occurred in October, while the maximum or second-highest values occurred in April. The seasonal ranges in the dv in these six representative regions were 4.7 ‰, 5.4 ‰, 3.6 ‰, 3.8 ‰, 3.6 ‰, and 9.3 ‰, respectively, with the largest seasonal range in the dv still being in Region VI. Except for Region VI, the maximum values of monthly dv in other representative regions mostly occurred in October, while the minimum or second-lowest values occurred in April or June (Table 1). These results indicated significant differences in water vapor isotopes between Region VI and other oceanic or continentally representative regions; simultaneously, it can be found that oceanic water vapor had varying degrees of impact on the isotopic composition of water vapor and precipitation in Region VI and Region V, both located within the East Asian monsoon region, across different seasons. Emphasizing this point, the numeric comparisons above can also be used to determine whether the major source of water vapor is oceanic or continental, especially based on the judgment of excess deuterium values (i.e., dv), because the water vapor coming from the Arabian Peninsula in winter (Fig. 3) had relatively high dv values (Table 1, Region I), while the large amount of water vapor coming from the oceanically representative regions in summer (Fig. 7) had very low dv values (Table 1, Region III). These different sources of water vapor were ultimately reflected in their impact on the isotopic composition of precipitation in the Dongting Lake basin.
Table 1Mean δ18Ov and dv for representative regions in the representative months.
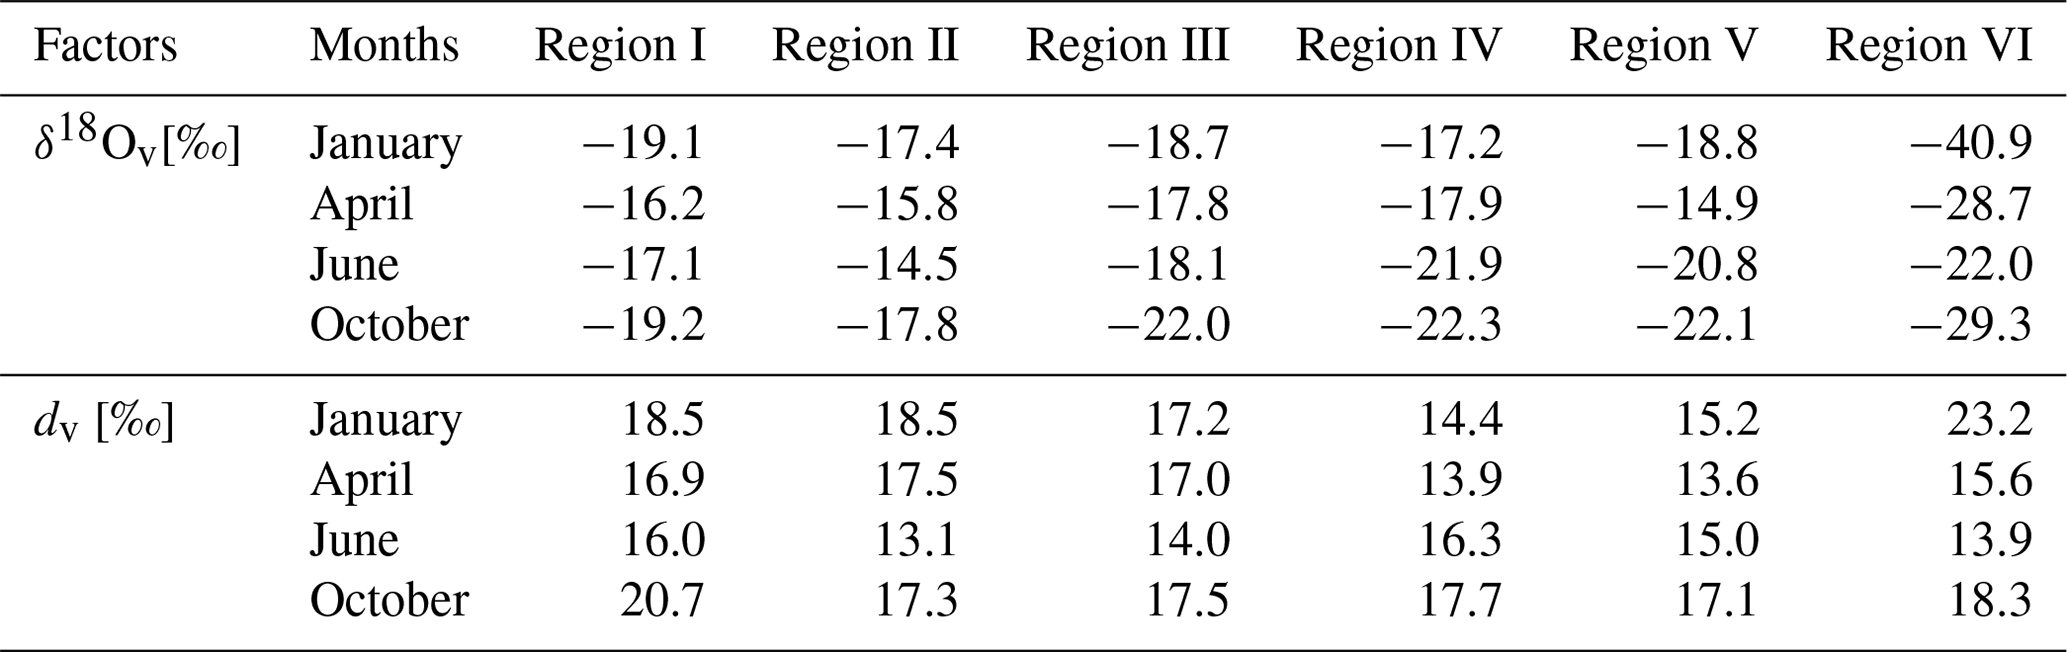
Furthermore, by comparing the water vapor isotopes in Region V with those in Region VI, it can be found that although both regions were located in the East Asian monsoon region, there were differences in the seasonal variations in water vapor isotopes (Table 1; Fig. 11). For instance, the average δ18Ov in Regions V and VI in all of the representative months was −19.2 ‰ and −30.2 ‰, respectively, with a difference of 11.1 ‰. Moreover, the average δ18Ov of these two regions showed the largest differences, with a value of 22.1 ‰ in January representing the peak of the winter monsoon and the June value representing the peak of the summer monsoon, with a difference of only 1.2 ‰. The water vapor isotopes in Region V were consistently enriched compared to those in Region VI. The average dv in Regions V and VI in all of the representative months was 15.2 ‰ and 17.8 ‰, respectively, with a difference of −2.5 ‰, which was not too large. The difference was largest in January, reaching −8.0 ‰, while in June, the difference was only 1.14 ‰, indicating that the water vapor sources during the summer monsoon were similar in these two regions (Table 1).
The above results about the differences in water stable isotopes between the representative regions conform to the latitudinal and continental effects of water stable isotopes and follow the law of material migration, which states that the composition of water stable isotopes becomes more depleted with increasing latitude and water vapor transport from high- to low-value regions (Feng et al., 2009; Zhang et al., 2012, 2016). Emphasizing this point, for the water vapor source of precipitation in the Dongting Lake basin, the oceanically representative regions located at low latitudes may not necessarily be the initial water vapor source regions and the relationship between upstream and downstream regions may not entirely be point to point, as there were continuous water recycling and rainout processes along the water vapor transport path (Pokam et al., 2012; Risi et al., 2013; Christner et al., 2018).
However, through the comparisons above, it can be observed that the influences of upstream regions on the water vapor amount and water vapor isotopes in downstream regions during water vapor transport were significant. For instance, two distinct water vapor transport paths were identified in April (Fig. 5); thus it is crucial to assess which path exerted a more significant influence on the isotopic composition of precipitation in the Dongting Lake basin, with priority given to the path whose air parcel isotopic signature most closely matches the precipitation isotopes in the basin before entry. According to this principle and referring to Table 1, we observed that in April, the average δ18Ov and dv values of the Dongting Lake basin (i.e., Region V) were −14.9 ‰ and 13.6 ‰, respectively. Moreover, before entering the Dongting Lake basin, the δ18Ov and dv values of the air parcel on the first water vapor transport path – that is, Path I – were −14.9 ‰ and 14.3 ‰, respectively (Fig. 6c and e). For the second transport path – that is, Path II – these values were −14.9 ‰ and 13.5 ‰, respectively (Fig. 6c and e). Besides this, it is worth noting the complexity of isotopic variations along the water vapor transport paths, where numerous processes can influence the isotopic composition of air masses over long distances, and such variations are a continuous process with cumulative effects. These processes include rainout, evaporation recharge, mixing with other air vapor masses, and changes in temperature and humidity, all of which contribute to the cumulative isotopic variations along the transport paths. Therefore, the primary criterion for determining the relative impact of these paths is the water vapor flux Q. As shown in Fig. 6a, the water vapor flux Q associated with Path II is significantly higher than that of Path I before reaching the Dongting Lake basin. This larger flux indicated that Path II contributed more water vapor to the Dongting Lake basin, thereby having a more substantial influence on the local precipitation isotopes. Clearly, the oceanic air mass with low deuterium excess had a relatively more significant impact on the precipitation isotopes in April in the Dongting Lake basin region.
In this study, we focus on the climatological mean state of water vapor transport and its influence on precipitation in the Dongting Lake basin over 4 representative months (January, April, June, and October, which represent winter, spring, summer, and autumn, respectively) from 1979–2017. Our analysis is based on the monthly average values of vertical integral water vapor flux Q, precipitation amount P, and isotopic compositions of water vapor and precipitation. This approach reflects the general characteristics of water vapor transport paths and their influence on precipitation for each month, rather than focusing on individual precipitation events. The magnitude of water vapor flux Q is directly related to precipitation amount P, and thus, our analysis does not require differentiation between precipitating and non-precipitating days. For example, low values of water vapor flux Q in January and October correspond to low precipitation amounts, indicating that the overall transport conditions are less conducive to precipitation.
4.2 Isotopic properties of air masses
According to the definition in meteorology, air mass refers to a large-scale body of air over land or sea with relatively uniform horizontal physical properties such as temperature, humidity, and atmospheric stability. The horizontal extent of an air mass ranges from 102 to 103 km, and the vertical extent ranges from 100 to 101 km, while within the same air mass, there is little variation in temperature gradients, atmospheric vertical stability, and weather phenomena (Zhou, 1997). Under large-scale and relatively uniform underlying surfaces and stable atmospheric circulation conditions, water vapor and its transport belong to the characteristics of air masses or have the properties of the air mass origin regions (Dettinger, 2013; Lavers et al., 2013). Considering the sources and sinks of water vapor, the spatial distribution of water vapor isotopes is relatively similar within an air mass. In oceanic air masses, the isotopic values of water vapor are relatively higher compared to those in continental air masses, while the deuterium excess of water vapor is typically lower. Conversely, in continental air masses, water vapor isotopes are relatively depleted but the deuterium excess can be higher (Rozanski et al., 1993; Araguás-Araguás et al., 1998).
With the seasonal variation in the position of the Sun's orbit, the atmospheric circulation conditions undergo seasonal variations and thus lead to the seasonality of the air mass properties (Qian et al., 2009; Parding et al., 2016). The abundance of water vapor isotopes at a fixed location varies due to variations in circulation conditions (Lacour et al., 2018; Dee et al., 2018; Gou et al., 2022). In this study, the isotopic compositions of water vapor in oceanic Regions II and IV at low latitudes and in inland Region VI at high latitudes exhibited significant seasonal variations due to interactions between tropical continental air masses (located in southern West Asia) and tropical oceanic air masses, between tropical oceanic air masses and equatorial air masses, and between temperate continental air masses and temperate oceanic air masses, respectively (Table 1; Fig. 11). In the process of seasonal changes, as air masses move out of their source regions, their physical and weather characteristics also change with the variations in underlying surface properties and large-scale vertical motion conditions.
East Asia is primarily controlled by the “modified” air masses, which were commonly used to describe the properties (e.g., temperature, pressure, and humidity) of air masses that have changed as they move through different regions (Ding, 1990; Chang et al., 2012). For instance, as an air mass moves from a warm and moist region to a cooler and drier region, its temperature and humidity can change significantly. Similarly, interactions with topography and varying surface conditions can lead to modifications in the air mass properties. This concept is particularly relevant in regions like East Asia, where air masses can be significantly altered as they pass through different climatic zones. Whether cold and dry air masses moving southward or warm and moist air masses moving northward, the isotopic composition of water vapor in the modified air mass continues to become more negative, while the deuterium excess of water vapor continues to become more positive than the original air mass, following the variation rule of stable isotopes and deuterium excess during water vapor transport (Vasil'chuk, 2014; Zhou et al., 2019; Xu et al., 2019; Jackisch et al., 2022). In this study, interactions between a modified oceanic air mass and a modified continental air mass result in the water vapor isotope in Region V that differed from oceanic air masses and continental air masses (Table 1; Fig. 11). In summary, based on the comparison of stable isotopes of water vapor and precipitation in different seasons and representative regions presented in this study, it can be observed that, as an integral component of the climate system, air masses in various regions not only exhibit differences in thermodynamic, dynamic, hydrous, and static properties but also are influenced by interactions between air masses, the underlying surface, and the intensity of convection, among others.
4.3 The difference between the water vapor field and wind field
The water vapor flux Q reflects the direction and magnitude of water vapor transport in the atmosphere, while wind V reflects the direction and magnitude of the movement of air particles in the atmosphere (Feng et al., 2009; Zhang et al., 2012, 2016). There are both differences and connections between the two factors. Water vapor is transported by wind; the wind carries water vapor from one place to another; and the directions of water vapor and wind may be consistent, inconsistent, or even opposite. In the East Asian monsoon region, the prevailing wind direction during the summer monsoon period is generally consistent with the average water vapor transport direction, both being the southwest or southeast direction (Baker et al., 2015; Wu et al., 2015; Tang et al., 2015). In this study, the water vapor transport path was consistent with the prevailing wind direction in June (Figs. 1a and 9). However, during the winter monsoon period, the prevailing wind direction may not be consistent with the average transport direction of water vapor – that is, the prevailing wind direction in January was the northwest or northeast direction, while the average transport direction of water vapor in this period was the southwest or southeast direction (Figs. 1a and 3).
Previous studies have shown that the most common weather systems and most precipitation events in the East Asian monsoon region are caused by cold fronts resulting from the interaction of warm and cold air masses (Chen et al., 2020). According to classical meteorological theory (Zhou, 1997), in a cold-front system, the wind from the southwest direction blows ahead of the front and a northwest wind blows behind the front, as shown in the schematic diagram in Fig. 12a. Warm and moist air from low latitudes lifts along the front and leads to rainfall, while cold and dry air from high latitudes moves southward beneath the front and lifts the warm and moist air. At different heights and positions, the directions of air particle movement and water vapor transport are different. For example, at Point A, located above the warm and moist air side of the cold-front surface, both air particles and water vapor are transported by a southwest wind. At Point C, located below the side with cold, dry air of the cold-front surface, both air particles and water vapor are transported by a northwest wind. However, at Point B, located within the front zone, the wind direction and speed are uncertain (Fig. 12b). Specifically, this front zone marked the transition from a warm air mass to a cold one, or vice versa, where meteorological factors have undergone rapid changes. Mixing between cold and warm advected air could occur within this zone, manifesting as a shear zone in wind fields or as alternating southerly and northerly winds. Therefore, the dominant wind directions may not always align with the average water vapor transport direction, especially in frontal weather systems that dominate precipitation in the East Asian monsoon region. Our study focuses on the Q field (the vertical integral of water vapor flux) to determine water vapor transport paths, which directly reflect the direction and magnitude of water vapor transport in the atmosphere. This method is distinct from particle dispersion models or back-trajectory models, which are based on the movement of air particles (wind direction). As discussed earlier, water vapor is transported by wind, but the directions of water vapor transport and wind may not always align, especially in complex weather systems such as cold fronts.
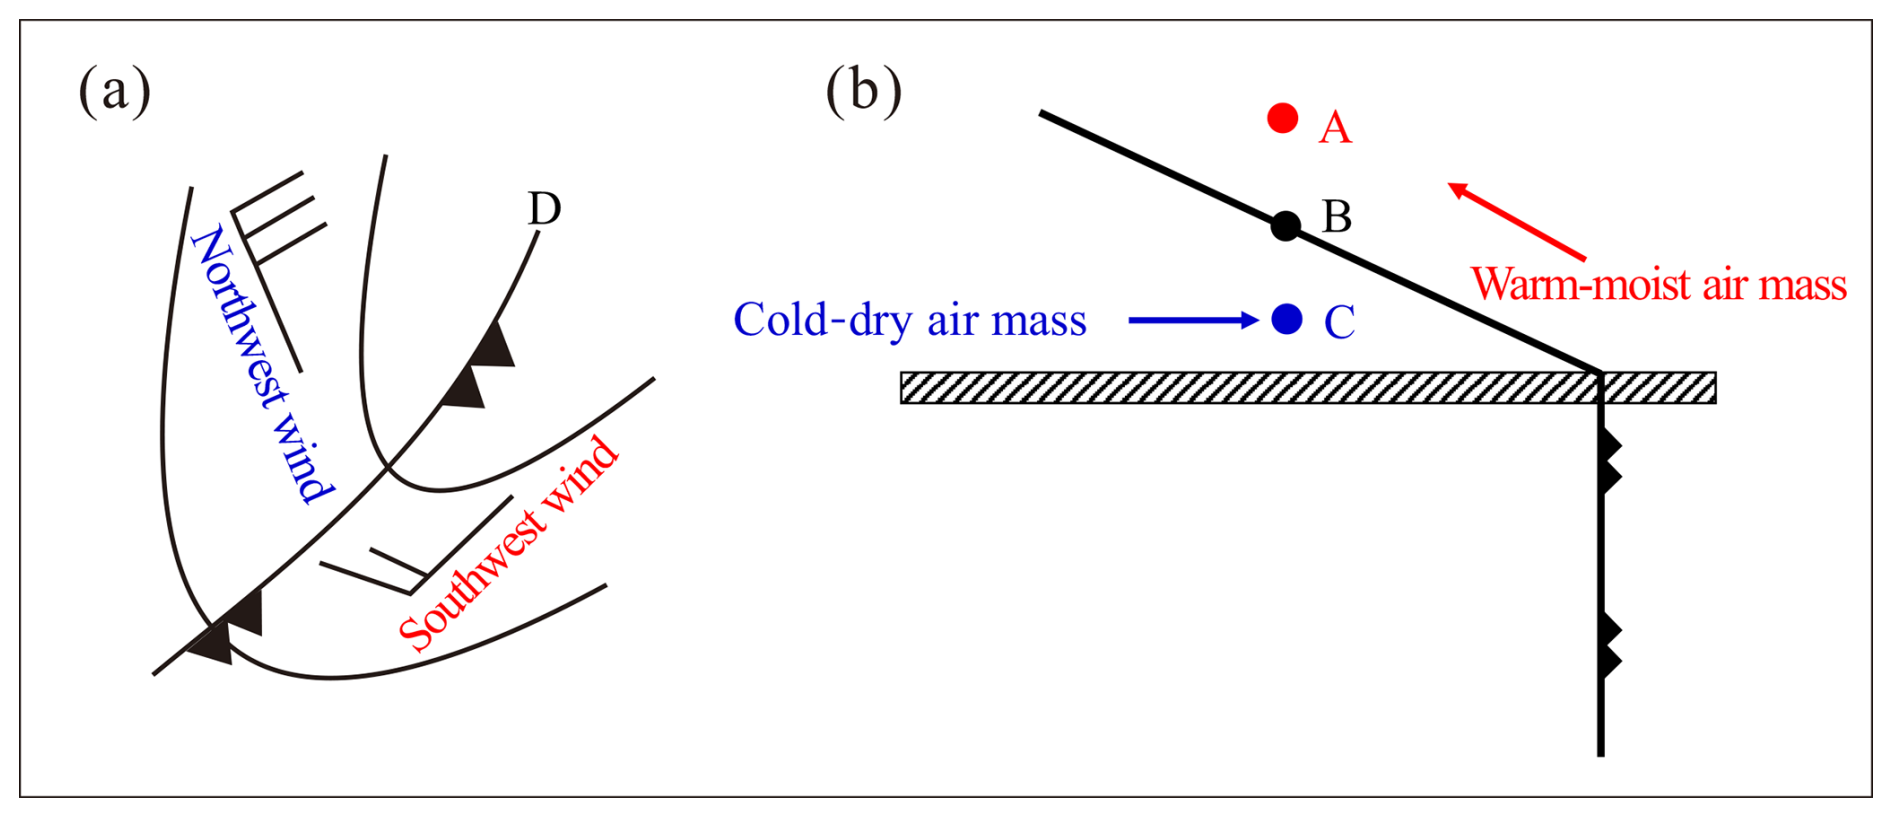
Figure 12Schematic diagram of a cold-front system in East Asia (based on Zhou, 1997).
Our findings revealed significant influences of the water vapor source and transport on precipitation isotopes in the Dongting Lake basin. Specifically, in January, water vapor contributing to the Dongting precipitation originated near the Arabian Peninsula and was driven by the southern branch of the westerly stream jet on the southern side of the Tibetan Plateau, was transported along the southern side of the Tibetan Plateau, passed through southwestern China via the northern part of the Indian Peninsula, and reached the Dongting Lake basin. In April, two distinct water vapor transport paths contributed to the Dongting precipitation: the first followed a trajectory similar to the average water vapor transport path in January, albeit shifted slightly northward by 1° of latitude. The second transport path, driven by the weak western Pacific subtropical high, guided warm and moist water vapor from the low latitudes of the western Pacific along the outer edge of the subtropical high, passing through the South China Sea and the Indochinese Peninsula and finally reaching into the Dongting Lake basin. In June, the precipitation in the Dongting Lake basin was influenced by a water vapor transport path originating from the northern branch of the southern Indian Ocean subtropical high, which crossed the Equator; was transported over the Somali Sea, the Arabian Sea, the Indian Peninsula, the Bay of Bengal, and the Indochinese Peninsula; and entered the southwestern region of China before finally reaching the Dongting Lake basin. In October, the average water vapor transport path originated from the western Pacific, passed through the South China Sea, flowed westward along the easterly jet located in the south of the western Pacific subtropical high and of the anticyclonic circulation over the Jiangnan region in China, and finally entered the Dongting Lake basin while bypassing the southwest of the anticyclone. Although this water vapor path belonged to the latitudinal transport, the water vapor source originated from the low-latitude oceans of the western Pacific. In these 4 months representing different seasons, variations in the δ18O and deuterium excess of precipitation and water vapor along these water vapor transport paths show some agreement with Rayleigh fractionation and water balance principles. This highlights the complex transport paths and processes that influence isotopic variations in precipitation in the Dongting Lake basin. However, the prevailing wind direction may not be consistent with the average transport direction of water vapor, especially during the winter monsoon, which can be explained by the water vapor field and wind field in frontal weather systems that dominate precipitation in the East Asian monsoon region.
Overall, the approach utilized in this study is grounded in fundamental meteorological theories, specifically involving water vapor diagnosis and calculations (including source regions, transport paths, and transport quantities); this analytical method is robust and has a clear physical basis. The scientific question addressed by this study is not centered on the spatial and temporal variations in water isotopes but rather on how the seasonal variations in regional precipitation and precipitation isotopes respond to the seasonal variations in water vapor sources and transport. A potential direction for future research could be to investigate the intra-seasonal variations in composite differences across various factors, rather than focusing on inter-seasonal comparisons.
The global atmospheric reanalysis data and water stable isotope simulation data were sourced from the ECMWF fifth-generation atmospheric reanalysis (ERA5; https://doi.org/10.24381/cds.6860a573, Hersbach et al., 2023) and second-generation isoGSM2 dataset (https://doi.org/10.6078/D1MM6B, Chiang et al., 2020a), respectively. The stable isotopic precipitation data and meteorological data at the Changsha station are accessible by emailing the corresponding author (zxp@hunnu.edu.cn) with a reasonable request.
XX: methodology, software, writing (original draft preparation), and reviewing and editing. XZ: supervision, guidance, data curation, methodology, software, writing (original draft preparation), and reviewing and editing. ZX: methodology and writing (original draft preparation). ZL, DW, CZ, ZR, XH, and HG: methodology and reviewing and editing. All authors made substantial contributions to the discussion of the content.
The contact author has declared that none of the authors has any competing interests.
Publisher's note: Copernicus Publications remains neutral with regard to jurisdictional claims made in the text, published maps, institutional affiliations, or any other geographical representation in this paper. While Copernicus Publications makes every effort to include appropriate place names, the final responsibility lies with the authors.
This study was supported by the Natural Science Foundation of Hunan Province, China (grant no. 2023JJ40445); the National Natural Science Foundation of China (grant no. 42101130); and the Aid Program for the Science and Technology Innovative Research Team in Higher Educational Institutions of Hunan Province (grant no. 0531120-4944). We are grateful to the graduate students who laboriously sampled water samples without interruption and tested water stable isotopes for 13 years.
This research has been supported by the Natural Science Foundation of Hunan Province (grant no. 2023JJ40445), the National Natural Science Foundation of China (grant no. 42101130), and the Science and Technology Innovative Research Team in Higher Educational Institutions of Hunan Province (grant no. 0531120-4944).
This paper was edited by Peter Haynes and reviewed by two anonymous referees.
Albergel, C., Dutra, E., Munier, S., Calvet, J.-C., Munoz-Sabater, J., de Rosnay, P., and Balsamo, G.: ERA-5 and ERA-Interim driven ISBA land surface model simulations: which one performs better?, Hydrol. Earth Syst. Sci., 22, 3515–3532, https://doi.org/10.5194/hess-22-3515-2018, 2018.
Araguás-Araguás, L., Froehlich, K., and Rozanski, K.: Stable isotope composition of precipitation over southeast Asia, J. Geophys. Res.-Atmos., 103, 28721–28742, https://doi.org/10.1029/98JD02582, 1998.
Baker, A. J., Sodemann, H., Baldini, J. U., Breitenbach, S. F., Johnson, K. R., van Hunen, J., and Zhang, P.: Seasonality of westerly moisture transport in the East Asian summer monsoon and its implications for interpreting precipitation δ18O, J. Geophys. Res.-Atmos., 120, 5850–5862, https://doi.org/10.1002/2014JD022919, 2015.
Bong, H., Cauquoin, A., Okazaki, A., Chang, E. C., Werner, M., Wei, Z., and Yoshimura, K.: Process-Based Intercomparison of Water Isotope-Enabled Models and Reanalysis Nudging Effects, J. Geophys. Res.-Atmos., 129, 1–28, https://doi.org/10.1029/2023JD038719, 2024.
Chang, C. P., Lei, Y., Sui, C. H., Lin, X., and Ren, F.: Tropical cyclone and extreme rainfall trends in East Asian summer monsoon since mid-20th century, Geophys. Res. Lett., 39, 1–7, https://doi.org/10.1029/2012GL052945, 2012.
Chen, X., Zhang, X. Z., Zhang, X. P., and Long, X.: Long-term Variation of Regional Extreme Precipitation in Jiangnan Area and its Possible Cause, Resour. Environ. Yangtze Basin, 29, 1757–1767, https://doi.org/10.11870/cjlyzyyhj202008008, 2020 (in Chinese with English abstract).
Chiang, J., Herman, M., Yoshimura, K., and Fung, I.: Enriched East Asian oxygen isotope of precipitation indicates reduced summer seasonality in regional climate and westerlies, Dryad [data set], https://doi.org/10.6078/D1MM6B, 2020a.
Chiang, J. C., Herman, M. J., Yoshimura, K., and Fung, I. Y.: Enriched East Asian oxygen isotope of precipitation indicates reduced summer seasonality in regional climate and westerlies, P. Natl. Acad. Sci. USA, 117, 14745–14750, https://doi.org/10.1073/pnas.1922602117, 2020b.
Christner, E., Aemisegger, F., Pfahl, S., Werner, M., Cauquoin, A., Schneider, M., and Schädler, G.: The climatological impacts of continental surface evaporation, rainout, and subcloud processes on δD of water vapor and precipitation in Europe, J. Geophys. Res.-Atmos., 123, 4390–4409, https://doi.org/10.1002/2017JD027260, 2018.
Dahinden, F., Aemisegger, F., Wernli, H., Schneider, M., Diekmann, C. J., Ertl, B., Knippertz, P., Werner, M., and Pfahl, S.: Disentangling different moisture transport pathways over the eastern subtropical North Atlantic using multi-platform isotope observations and high-resolution numerical modelling, Atmos. Chem. Phys., 21, 16319–16347, https://doi.org/10.5194/acp-21-16319-2021, 2021.
Dee, S. G., Nusbaumer, J., Bailey, A., Russell, J. M., Lee, J. E., Konecky, B., and Noone, D. C.: Tracking the strength of the Walker circulation with stable isotopes in water vapor, J. Geophys. Res.-Atmos., 123, 7254–7270, https://doi.org/10.1029/2017JD027915, 2018.
Deng, H., Wang, Q., Zhao, Y., Zhai, J., Zhu, Y., Gui, Y., and Liu, K.: Effect of water vapor transport and budget on precipitation in the Yangtze–Huang–Huai–Hai River Basin, J. Hydrol. Reg. Stud., 53, 101787, https://doi.org/10.1016/j.ejrh.2024.101787, 2024.
Dettinger, M. D.: Atmospheric rivers as drought busters on the US West Coast, J. Hydrometeorol., 14, 1721–1732, https://doi.org/10.1175/JHM-D-13-02.1, 2013.
Ding, Y.: Build-up, air mass transformation and propagation of Siberian high and its relations to cold surge in East Asia, Meteorol. Atmos. Phys., 44, 281–292, https://doi.org/10.1007/BF01026822, 1990.
Draxler, R. R. and Hess, G. D: An overview of the HYSPLIT_4 modelling system for trajectories, Aust. Meteor. Mag., 47, 295–308, https://doi.org/10.1029/2018jd029257, 1998.
Esquivel-Hernández, G., Mosquera, G. M., Sánchez-Murillo, R., Quesada-Román, A., Birkel, C., Crespo, P., and Boll, J.: Moisture transport and seasonal variations in the stable isotopic composition of rainfall in Central American and Andean Páramo during El Niño conditions (2015–2016), Hydrol. Process., 33, 1802–1817, https://doi.org/10.1002/hyp.13438, 2019.
Feng, X., Faiia, A. M., and Posmentier, E. S.: Seasonality of isotopes in precipitation: A global perspective, J. Geophys. Res.-Atmos., 114, 1–13, https://doi.org/10.1029/2008JD011279, 2009.
Gimeno, L., Vázquez, M., Eiras-Barca, J., Sorí, R., Stojanovic, M., Algarra, I., and Dominguez, F.: Recent progress on the sources of continental precipitation as revealed by moisture transport analysis, Earth-Sci. Rev., 201, 103070, https://doi.org/10.1016/j.earscirev.2019.103070, 2020.
Gou, J., Qu, S., Guan, H., Shi, P., Su, Z., Lin, Z., and Zhu, J.: Relationship between precipitation isotopic compositions and synoptic atmospheric circulation patterns in the lower reach of the Yangtze River, J. Hydrol., 605, 127289, https://doi.org/10.1016/j.jhydrol.2021.127289, 2022.
Guo, L., Van Der Ent, R. J., Klingaman, N. P., Demory, M. E., Vidale, P. L., Turner, A. G., and Chevuturi, A.: Moisture sources for East Asian precipitation: Mean seasonal cycle and interannual variability, J. Hydrometeorol., 20, 657–672, https://doi.org/10.1175/JHM-D-18-0188.1, 2019.
He, H., Cao, R., Wu, Z. Y., Li, Y., Yin, H., and Yuan, F.: Diagnosing anomalous characteristics of atmospheric water cycle structure during seasonal-scale drought events: A case study in middle and lower reaches of Yangtze River, Water Sci. Eng., 15, 103–113, https://doi.org/10.1016/j.wse.2022.01.001, 2022.
Hersbach, H., Bell, B., Berrisford, P., Biavati, G., Horányi, A., Muñoz Sabater, J., Nicolas, J., Peubey, C., Radu, R., Rozum, I., Schepers, D., Simmons, A., Soci, C., Dee, D., and Thépaut, J.-N.: ERA5 monthly averaged data on pressure levels from 1940 to present, Copernicus Climate Change Service (C3S) Climate Data Store (CDS) [data set], https://doi.org/10.24381/cds.6860a573, 2023.
Hoffmann, L., Günther, G., Li, D., Stein, O., Wu, X., Griessbach, S., Heng, Y., Konopka, P., Müller, R., Vogel, B., and Wright, J. S.: From ERA-Interim to ERA5: the considerable impact of ECMWF's next-generation reanalysis on Lagrangian transport simulations, Atmos. Chem. Phys., 19, 3097–3124, https://doi.org/10.5194/acp-19-3097-2019, 2019.
Hu, Q., Jiang, D., Lang, X., and Yao, S.: Moisture sources of summer precipitation over eastern China during 1979–2009: A Lagrangian transient simulation, Int. J. Climatol., 41, 1162–1178, https://doi.org/10.1002/joc.6781, 2021.
Huang, H. and Li, L.: A Synchronous Variation Process of Tibetan Plateau Vortex and Southwest Vortex, J. Appl. Meteorol. Sci., 34, 451–462, https://doi.org/10.11898/1001-7313.20230406, 2023 (in Chinese with English abstract).
Jackisch, D., Yeo, B. X., Switzer, A. D., He, S., Cantarero, D. L. M., Siringan, F. P., and Goodkin, N. F.: Precipitation stable isotopic signatures of tropical cyclones in Metropolitan Manila, Philippines, show significant negative isotopic excursions, Nat. Hazards Earth Syst. Sci., 22, 213–226, https://doi.org/10.5194/nhess-22-213-2022, 2022. .
Kathayat, G., Sinha, A., Tanoue, M., Yoshimura, K., Li, H., Zhang, H., and Cheng, H.: Interannual oxygen isotope variability in Indian summer monsoon precipitation reflects changes in moisture sources, Commun. Earth Environ., 2, 1–10, https://doi.org/10.1038/s43247-021-00165-z, 2021.
Lacour, J. L., Risi, C., Worden, J., Clerbaux, C., and Coheur, P. F.: Importance of depth and intensity of convection on the isotopic composition of water vapor as seen from IASI and TES δD observations, Earth Planet. Sc. Lett., 481, 387–394, https://doi.org/10.1016/j.epsl.2017.10.048, 2018.
Lai, X., Wang, Q., Huangfu, J., Jiang, X., Wang, L., Chen, W., and Tang, Y.: Progress in Climatological Research on the Southwest China Vortex, Chinese J. Atmos. Sci., 47, 1983–2000, https://doi.org/10.3878/j.issn.1006-9895.2304.23021, 2023 (in Chinese with English abstract).
Lavers, D. A., Allan, R. P., Villarini, G., Lloyd-Hughes, B., Brayshaw, D. J., and Wade, A. J.: Future changes in atmospheric rivers and their implications for winter flooding in Britain, Environ. Res. Lett., 8, 034010, https://doi.org/10.1088/1748-9326/8/3/034010, 2013.
Lekshmy, P. R., Midhun, M., and Ramesh, R.: Role of moisture transport from Western Pacific region on water vapor isotopes over the Bay of Bengal, Atmos. Res., 265, 105895, https://doi.org/10.1016/j.atmosres.2021.105895, 2022.
Liu, J., Song, X., Fu, G., Liu, X., Zhang, Y., and Han, D.: Precipitation isotope characteristics and climatic controls at a continental and an island site in Northeast Asia, Clim. Res., 49, 29–44, https://doi.org/10.3354/cr01013, 2011.
Liu, Z., Zhang, X., Xiao, Z., He, X., Rao, Z., and Guan, H.: The relations between summer droughts/floods and oxygen isotope composition of precipitation in the Dongting Lake basin, Int. J. Climatol., 43, 3590–3604, https://doi.org/10.1002/joc.8047, 2023.
Nie, Y. and Sun, J.: Moisture sources and transport for extreme precipitation over Henan in July 2021, Geophys. Res. Lett., 49, 1–10, https://doi.org/10.1029/2021GL097446, 2022.
Parding, K., Olseth, J. A., Liepert, B. G., and Dagestad, K. F.: Influence of atmospheric circulation patterns on local cloud and solar variability in Bergen, Norway, Theor. Appl. Climatol., 125, 625–639, https://doi.org/10.1007/s00704-015-1517-8, 2016.
Payne, A. E., Demory, M. E., Leung, L. R., Ramos, A. M., Shields, C. A., Rutz, J. J., and Ralph, F. M.: Responses and impacts of atmospheric rivers to climate change, Nat. Rev. Earth Environ., 1, 143–157, https://doi.org/10.1038/s43017-020-0030-5, 2020.
Pérez-Alarcón, A., Fernández-Alvarez, J. C., Sorí, R., Nieto, R., and Gimeno, L.: Moisture source identification for precipitation associated with tropical cyclone development over the Indian Ocean: a Lagrangian approach, Clim. Dynam., 60, 2735–2758, https://doi.org/10.1007/s00382-022-06429-4, 2023.
Pokam, W. M., Djiotang, L. A. T., and Mkankam, F. K.: Atmospheric water vapor transport and recycling in Equatorial Central Africa through NCEP/NCAR reanalysis data, Clim. Dynam., 38, 1715–1729, https://doi.org/10.1007/s00382-011-1242-7, 2012.
Pranindita, A., Wang-Erlandsson, L., Fetzer, I., and Teuling, A. J.: Moisture recycling and the potential role of forests as moisture source during European heatwaves, Clim. Dynam., 58, 609–624, https://doi.org/10.1007/s00382-021-05921-7, 2022.
Qian, L., Solomon, S. C., and Kane, T. J.: Seasonal variation of thermospheric density and composition, J. Geophys. Res.-Space, 114, 1–15, https://doi.org/10.1029/2008JA013643, 2009.
Ralph, F. M., Dettinger, M. D., Cairns, M. M., Galarneau, T. J., and Eylander, J.: Defining “atmospheric river”: How the Glossary of Meteorology helped resolve a debate, B. Am. Meteorol. Soc., 99, 837–839, https://doi.org/10.1175/BAMS-D-17-0157.1, 2018.
Risi, C., Bony, S., Vimeux, F., Frankenberg, C., Noone, D., and Worden, J.: Understanding the Sahelian water budget through the isotopic composition of water vapor and precipitation, J. Geophys. Res.-Atmos., 115, 1–23, https://doi.org/10.1029/2010JD014690, 2010.
Risi, C., Noone, D., Frankenberg, C., and Worden, J.: Role of continental recycling in intraseasonal variations of continental moisture as deduced from model simulations and water vapor isotopic measurements, Water Resour. Res., 49, 4136–4156, https://doi.org/10.1002/wrcr.20312, 2013.
Rozanski, K., Araguás-Araguás, L., and Gonfiantini, R.: Isotopic patterns in modern global precipitation, in: Climate change in continental isotopic records, edited by: Swart, P. K., Lohmann, K. C., Mckenzie, J., and Savin, S., Geophysical Monograph Serie, American Geophysical Union, 78, 1–36, https://doi.org/10.1029/GM078p0001, 1993.
Sengupta, S. and Sarkar, A.: Stable isotope evidence of dual (Arabian Sea and Bay of Bengal) vapour sources in monsoonal precipitation over north India, Earth Planet. Sc. Lett., 250, 511–521, https://doi.org/10.1016/j.epsl.2006.08.011, 2006.
Shi, X., Risi, C., Li, L., Wang, X., Pu, T., Zhang, G., and Kong, Y.: What controls the skill of general circulation models to simulate the seasonal cycle in water isotopic composition in the Tibetan Plateau region?, J. Geophys. Res.-Atmos., 127, e2022JD037048, https://doi.org/10.1029/2022JD037048, 2022.
Shi, Y., Jin, Z., Wu, A., Li, G., and Li, F.: Stable isotopic characteristics of precipitation related to the environmental controlling factors in Ningbo, East China, Environ. Sci. Pollut. R., 28, 10696–10706, https://doi.org/10.1007/s11356-020-11332-8, 2021.
Smirnov, V. V. and Moore, G. W. K.: Spatial and temporal structure of atmospheric water vapor transport in the Mackenzie River basin, J. Climate, 12, 681–696, https://doi.org/10.1175/1520-0442(1999)012<0681:SATSOA>2.0.CO;2, 1999.
Sun, B., Zhu, Y., and Wang, H.: The recent interdecadal and interannual variation of water vapor transport over eastern China, Adv. Atmos. Sci., 28, 1039–1048, https://doi.org/10.1007/s00376-010-0093-1, 2011.
Tang, Y., Pang, H., Zhang, W., Li, Y., Wu, S., and Hou, S.: Effects of changes in moisture source and the upstream rainout on stable isotopes in precipitation – a case study in Nanjing, eastern China, Hydrol. Earth Syst. Sci., 19, 4293–4306, https://doi.org/10.5194/hess-19-4293-2015, 2015. .
Vasil'chuk, Y. K.: New data on the tendency and causes of deuterium excess variations during one snowfall, Dokl. Earth Sci., 459, 1400–1403, https://doi.org/10.1134/S1028334X14110105, 2014.
Wei, Z., Lee, X., Liu, Z., Seeboonruang, U., Koike, M., and Yoshimura, K.: Influences of large-scale convection and moisture source on monthly precipitation isotope ratios observed in Thailand, Southeast Asia, Earth Planet. Sc. Lett., 488, 181–192, https://doi.org/10.1016/j.epsl.2018.02.015, 2018.
Wu, H., Zhang, X., Xiaoyan, L., Li, G., and Huang, Y.: Seasonal variations of deuterium and oxygen-18 isotopes and their response to moisture source for precipitation events in the subtropical monsoon region, Hydrol. Process., 29, 90–102, https://doi.org/10.1002/hyp.10132, 2015.
Wu, H., Fu, C., Zhang, C., Zhang, J., Wei, Z., and Zhang, X.: Temporal variations of stable isotopes in precipitation from Yungui Plateau: insights from moisture source and rainout effect, J. Hydrometeorol., 23, 39–51, https://doi.org/10.1175/JHM-D-21-0098.1, 2022.
Xiao, Z., Zhang, X., Xiao, X., Chang, X., and He, X.: The Effect of Convective/Advective Precipitation Partitions on the Precipitation Isotopes in the Monsoon Regions of China: A Case Study of Changsha, J. Hydrometeorol., 23, 581–590, https://doi.org/10.1175/JHM-D-23-0084.1, 2024.
Xu, K., Zhong, L., Ma, Y., Zou, M., and Huang, Z.: A study on the water vapor transport trend and water vapor source of the Tibetan Plateau, Theor. Appl. Climatol., 140, 1031–1042, https://doi.org/10.1007/s00704-020-03142-2, 2020.
Xu, T., Sun, X., Hong, H., Wang, X., Cui, M., Lei, G., and Jiang, X.: Stable isotope ratios of typhoon rains in Fuzhou, Southeast China, during 2013–2017, J. Hydrol., 570, 445–453, https://doi.org/10.1016/j.jhydrol.2019.01.017, 2019.
Yoshimura, K., Kanamitsu, M., Noone, D., and Oki, T.: Historical isotope simulation using reanalysis atmospheric data, J. Geophys. Res.-Atmos., 113, D19101, https://doi.org/10.1029/2008JD010074, 2008.
Zhan, Z., Pang, H., Wu, S., Liu, Z., Zhang, W., Xu, T., and Hou, S.: Determining key upstream convection and rainout zones affecting δ18O in water vapor and precipitation based on 10 year continuous observations in the East Asian Monsoon region, Earth Planet. Sc. Lett., 601, 117912, https://doi.org/10.1016/j.epsl.2022.117912, 2023.
Zhang, H., Cheng, H., Cai, Y., Spötl, C., Sinha, A., Kathayat, G., and Li, H.: Effect of precipitation seasonality on annual oxygen isotopic composition in the area of spring persistent rain in southeastern China and its paleoclimatic implication, Clim. Past, 16, 211–225, https://doi.org/10.5194/cp-16-211-2020, 2020.
Zhang, X., Sun, Z., Guan, H., Zhang, X., Wu, H., and Huang, Y.: GCM simulations of stable isotopes in the water cycle in comparison with GNIP observations over East Asia, Acta Meteorol. Sin., 26, 420–437, https://doi.org/10.1007/s13351-012-0403-x, 2012.
Zhang, X., Guan, H., Zhang, X., He, X., Zhang, W., Wang, X., and Yao, T.: Comparisons and assessment on stable isotopic effects in precipitation simulated by different models, Quat. Sci., 36, 1343–1357, https://doi.org/10.11928/j.issn.1001-7410.2016.06.01, 2016 (in Chinese with English abstract).
Zhou, H., Zhang, X., Yao, T., Luo, Z., Hua, M., and Sun, H.: δ18O in precipitation and water vapor transfer in the summer half year in China, Quat. Sci., 38, 314–326, https://doi.org/10.11928/j.issn.1001-7410.2018.02.04, 2018 (in Chinese with English abstract).
Zhou, H., Zhang, X., Yao, T., Hua, M., Wang, X., Rao, Z., and He, X.: Variation of δ18O in precipitation and its response to upstream atmospheric convection and rainout: A case study of Changsha station, south-central China, Sci. Total Environ., 659, 1199–1208, https://doi.org/10.1016/j.scitotenv.2018.12.396, 2019.
Zhou, S. Z. (Ed.): Meteorology and Climatology, Higher Education Press, Beijing, China, 118–222, ISBN 9787040060164, 1997 (in Chinese).