the Creative Commons Attribution 4.0 License.
the Creative Commons Attribution 4.0 License.
 | 27 Jun 2025
Spectral optical properties of soot: laboratory investigation of propane flame particles and their link to composition
Johannes Heuser
Claudia Di Biagio
Jérôme Yon
Mathieu Cazaunau
Antonin Bergé
Edouard Pangui
Marco Zanatta
Laura Renzi
Angela Marinoni
Satoshi Inomata
Chenjie Yu
Vera Bernardoni
Servanne Chevaillier
Daniel Ferry
Paolo Laj
Michel Maillé
Dario Massabò
Federico Mazzei
Gael Noyalet
Hiroshi Tanimoto
Brice Temime-Roussel
Roberta Vecchi
Virginia Vernocchi
Paola Formenti
Bénédicte Picquet-Varrault
Jean-François Doussin
Soot aerosol generated from the incomplete combustion of biomass and fossil fuels is a major light-absorber; however its spectral optical properties for varying black carbon (BC) and brown carbon (BrC) content remain uncertain. In this study, soot aerosols with varying maturity and composition, i.e. elemental-to-total-carbon ratio (), have been studied systematically in a large simulation chamber to determine their mass absorption, scattering, and extinction cross sections (MAC, MSC, MEC); single-scattering albedo (SSA); and absorption and scattering Ångström exponents (AAE, SAE). The MAC, MEC, SSA, and AAE show a variability between the different types of soot with varying ratios. The MAC (MEC) at 550 nm increases for increasing , with values of 1.0 (1.4) m2 g−1 for = 0.0 (BrC-dominated soot) and 4.6 (5.1) m2 g−1 for = 0.79 (BC-dominated soot). The AAE and SSA (550 nm) decrease from 3.79 and 0.29 ( = 0.0) to 1.27 and 0.10 ( = 0.79). Combining present results for soot from propane combustion with literature data for flame soot from diverse fuels supports a generalised exponential relationship between particle and its MAC and AAE values ; , which represents the optical continuum of spectral absorption for soot with varying maturity. From this, it is possible to extrapolate a MAC of 7.9 and 1.3 m2 g−1 (550 nm) and an AAE (375–870 nm) of 1.05 and 4.02 for pure EC (BC-like) and pure OC (BrC-like) soot. The established relationship can provide a useful parameterisation for models to estimate the absorption from combustion aerosols and their BC and BrC contributions.
- Article
(4163 KB) - Full-text XML
-
Supplement
(1988 KB) - BibTeX
- EndNote


Carbonaceous soot aerosol produced during the incomplete combustion of biomass and fossil fuels directly affects the Earth's radiative balance due to the absorption and scattering of atmospheric radiation, making it the largest non-gaseous contributor to anthropogenic climate forcing (Bond et al., 2013; IPCC, 2023; Jacobson, 2004). Soot is observed in urban environments, downwind of wildfires, and in remote areas, and it is distributed from the surface to the upper atmospheric layers (Liu et al., 2020a; Pang et al., 2023). Soot aerosol forms in flames from nucleated gaseous combustion by-products (Haynes and Wagner, 1981; Smith, 1981; Tree and Svensson, 2007) and displays a characteristic fractal-like structure made by the aggregation of primary spheres with a diameter typically between 5 and 40 nm (Forrest and Witten, 1979; Dastanpour and Rogak, 2014; Rissler et al., 2013). Soot lies in the submicron range and contains the two light-absorbing fractions of black carbon (BC) and brown carbon (BrC), composed of more ordered graphite-like and more disordered molecular structures, the occurrence of which depends on the maturity of the soot (Johansson et al., 2017; Michelsen, 2017). The term BC is used to refer to a low wavelength-dependent and highly light-absorbing fraction of carbonaceous aerosols and is often synonymously used with elemental carbon (EC, the more thermally stable carbonaceous fraction as obtained from thermo-optical measurements), refractory BC (rBC, the refractory fraction as obtained from laser incandescence techniques), or equivalent BC (eBC, an optically active absorbing species from filter-based absorption measurements) (Lack et al., 2014; Petzold et al., 2013). The non-refractory/thermally unstable organic carbon (OC) fraction of carbonaceous aerosols can contain a large number of organic species of which the light-absorbing ones constitute the BrC (Andreae and Gelencsér, 2006). Differently from BC, the BrC fraction shows a highly wavelength-dependent absorption, strongly increasing towards the UV (Kirchstetter et al., 2004; Saleh et al., 2013). When emitted in the atmosphere, the fractal soot rapidly undergoes physico-chemical processing, including coagulation, wetting, photo-ageing, and coating formation, which modifies the particle composition, size, mixing state, and morphology (e.g. Liu et al., 2023; Colbeck et al., 1990; Wang et al., 2017).
Soot spectral optical properties are necessary inputs for radiative transfer calculations used in both climate modelling and remote sensing retrieval algorithms. The single-scattering albedo (SSA; i.e. the ratio of the scattering over extinction) and the mass (absorption, scattering, extinction) cross sections (MAC, MSC, MEC, units of m2 g−1) are key properties for this as they relate modelled mass concentrations to the aerosol spectral optical properties. The MAC (and similarly the MSC and the MEC) at a specific wavelength is defined as the ratio of the absorption coefficient at that wavelength (babs(λ), units of m−1) to the aerosol mass concentration (m, units of g m−3) as
In models soot is commonly represented by its BC and BrC components, and the evolution of optical properties with atmospheric ageing is parameterised using the properties of freshly emitted aerosols as baseline values (e.g. Samset et al., 2018; Sand et al., 2021). Therefore, knowledge of the spectral optical properties of fresh soot aggregates, despite those representing only the initial stages of the particle's lifetime, is relevant to modelling the impact of soot along its whole life cycle, from emission to deposition. For BC a commonly accepted value for the MAC is 7.5±1.2 m2 g−1 at 550 nm, as proposed by Bond and Bergstrom (2006); further discussed by Bond et al. (2013); and more recently confirmed by Liu et al. (2020b), who evaluated a value of 8.0±0.7 m2 g−1 at 550 nm as a representative value for BC-dominated mature fresh soot. Conversely, lower scientific consensus is established for the spectral optical properties of primary combustion BrC (Saleh, 2020). The BC and BrC are co-emitted in different proportions and with different properties for varying fuels and combustion conditions, which reflects differences in particle maturity (e.g. Schnaiter et al., 2006; Mamakos et al., 2013; Török et al., 2018; Cheng et al., 2019; Ess et al., 2021; Malmborg et al., 2021). Higher proportions of BrC are emitted from biomass or low-quality fuels that burn at lower temperatures and fuel-rich conditions, while lower proportions of BrC are emitted from the combustion of fossil fuels at high temperatures in internal combustion engines (Chen and Bond, 2010; Cheng et al., 2019; Corbin et al., 2019; Saleh et al., 2018). The variable BC–BrC mixture in soot aerosols is commonly expressed via ratios of proxies for BC or BrC such as the elemental-to-total-carbon ratio (), the elemental-to-organic-carbon ratio (), or the -to-organic-aerosol-mass ratio (). This variable composition is accompanied by changes in the soot's physical and optical properties, including the intensity of interaction with light (absolute values of MAC, MSC, MEC, and SSA) and its spectral dependence, represented by the absorption and scattering Ångström exponents (e.g. Cheng et al., 2019; Ess et al., 2021; Ess and Vasilatou, 2019; Kelesidis et al., 2021). Notably, it is observed that the BrC spectral absorption changes with particle maturity (Saleh et al., 2014), which means that the BrC contribution to soot optical properties differs for changing combustion conditions and the maturity of soot. In consequence, as discussed in Saleh (2020), for combustion emissions containing both BC and BrC, it can be more convenient to parameterise the effective optical properties of the BC–BrC mixture instead of its single BC and BrC component alone. As of today, a robust relationship linking soot optical properties to particle composition is missing, which prevents accurate representation of combustion aerosols in models. This is additionally amplified due to the fact that neither standard reference materials nor standard instrumentation exists for the quantification of these components (e.g. Baumgardner et al., 2012; Gysel et al., 2011; Sipkens et al., 2023).
In this work, we investigate the variability in spectral MAC, MSC, MEC, and SSA of soot aerosols and the link between spectral optical properties and composition for aerosol generated under different combustion conditions. To do so, systematic experiments were performed in a large simulation chamber using laboratory-generated flame soot with diverse physico-chemical properties and varying BC and BrC fractions.
Experiments were performed in the 4.2 m3 stainless steel CESAM chamber (Experimental Multiphasic Atmospheric Simulation Chamber; Wang et al., 2011; https://cesam.cnrs.fr/, last access: 11 June 2025), widely used in past years to investigate the formation processes and the physico-chemical and spectral optical properties of several aerosol types, including primary and secondary species (Caponi et al., 2017; De Haan et al., 2017, 2023; Denjean et al., 2014, 2015; Di Biagio et al., 2014, 2017, 2019). CESAM is a controlled and steady environment designed to allow multiphase atmospheric (photo-)chemistry. Temperature, pressure, and humidity, as well as the gaseous and aerosol content, can be varied in CESAM to reproduce atmospherically relevant conditions. Realistic solar irradiation is provided by three xenon arc lamps. The homogeneity of the mixture is ensured by a stainless steel fan placed at the bottom of the reactor which allows a mixing time of around 1 min. The particle lifetime in the chamber (i.e. the time necessary to get a particle number concentration reduction by a factor e) was estimated by previous studies to vary from 6 to more than 24 h for particles between 50 and 200 nm (Lamkaddam et al., 2017). CESAM is a multi-instrumented platform: it is equipped with 12 circular flanges to allow a large panel of instruments to be connected to measure online and offline the thermodynamic state of the volume, its gaseous composition, and the aerosol concentration and properties. At the end of each experiment, the CESAM chamber is evacuated to around hPa to avoid carryover contaminations and stays evacuated between subsequent experiments. The chamber is also additionally cleaned manually at the beginning of each campaign.
A total of 22 soot experiments were performed in CESAM to investigate the properties of fresh soot, as summarised in Table S1 in the Supplement. A wide range of state-of-the-art online and offline techniques were combined to measure the physical, chemical, and spectral optical properties of soot and its BC and BrC components, as well as the gas phase and the chamber's thermodynamic state. A summary of instrumentation together with information on measurement uncertainties is given in Tables S2 and S3. Only the main aerosol measurements used in this study are described in Sect. 2.3.
2.1 Generation of combustion soot
The combustion soot aerosol used in the experiments was generated using a miniCAST (miniature combustion aerosol standard) diffusion flame soot generator (model 6204 Type C, Jing Ltd., Switzerland). The miniCAST is a reference instrument providing repeatable and controllable soot generation, allowing for both fuel-lean to fuel-rich conditions (Moore et al., 2014). This has been proven to produce soot particles with varying composition, morphological properties, size distributions, and absorption behaviour (Bescond et al., 2016; Ess et al., 2021; Ess and Vasilatou, 2019; Mamakos et al., 2013; Moore et al., 2014; Schnaiter et al., 2006). MiniCAST fuel-lean soot is often considered to be comparable to diesel and aircraft (kerosene-type) emissions (Ess et al., 2021; Moore et al., 2014; Saffaripour et al., 2017).
The miniCAST produces air-diluted soot with an N2-quenched co-flow propane–air diffusion flame. The combustion conditions of the miniCAST can be varied by adjusting the mass flow rates of the employed gases, which are the fuel (propane, Air Liquide, purity > 99,95 %), the mixing gas, the quench gas (both evaporated from liquid N2, Messer, purity > 99.995 %), the oxidation air, and the dilution air (both ALPHAGAZ 2 Air, Air Liquide, ≥ 99,9999 %). Computer-controlled mass flowmeters are used to precisely set the flow rates of the different gases in the miniCAST. In the present study, five burning conditions were selected from the predefined miniCAST operation points (OPs, from OP1 to OP5; Table 1) to generate soot with varying properties. The different OP points correspond to different flow rates varying most importantly the fuel-to-air ratio . The global equivalence ratio (φ) is defined as
with as the stoichiometric fuel-to-air ratio of complete combustion, which varies for the selected points between 0.88 and 1.2. φ<1 represents fuel-lean combustion (OP1 to OP4), and φ>1 represents fuel-rich combustion (OP5). Hereafter the generated soot from the five OP points of the miniCAST will be referred to as CAST (combustion aerosol standard) soot (CS) and numbered based upon the selected OP (CS1 to CS5).
2.2 Experimental protocol
At the beginning of each experiment, the CESAM chamber was filled with a mixture of 80 % N2 (Messer, evaporated from liquid, purity > 99.995 %), generated by evaporation from liquid nitrogen out of a pressurised liquid nitrogen tank, and 20 % bottled O2 (Linde 5.0, purity ≥ 99,999 %). The chamber pressure was set at a slight overpressure (+ 5 hPa compared to ambient conditions) to avoid external contaminations. Before CS injection, the aerosol background and the instrumental baselines were verified. The aerosol background concentration never exceeded 0.05 µg m−3 and 200 particles cm−3, corresponding to about 0.4 % at the lowest injected CS mass concentration. A particle-free N2 and O2 airflow was continuously injected into CESAM to compensate for the sampling flow rate of the different instruments to maintain stable pressure in the chamber throughout the experiments. The CS was injected into the CESAM chamber by connecting the miniCAST generator output to the chamber through an activated carbon denuder (details in Sect. S1). Injections lasted from 30 to 390 s, resulting in a concentration range in CESAM between 14 and 200 µg m−3 (as derived from size distribution and effective density measurements; Sect. 2.3.1).
Once injected in CESAM, the soot aerosols were left in suspension for time frames varying between 2 and 27 h in order to investigate the evolution of particle physico-chemical and optical properties under different controlled ageing conditions. In this study, we consider only measurements done under dry (0 % relative humidity) and dark conditions to characterise the soot, look at the effect of lifetime in an O2+ N2 atmosphere, and test the reproducibility of results. All data considered in the present study were acquired at ambient temperature (T=288–299 K).
Control experiments were performed with submicron ammonium sulfate and sulfuric acid aerosols with the aim of validating the performances and consistency of optical and physico-chemical observations. The results of control experiments are presented and discussed in Sect. S5.
2.3 Online and offline aerosol measurements
2.3.1 Physico-chemical aerosol properties
The number size distribution between 19.5 and 881.7 nm over 64 channels (dN/dlogDm; Dm, mobility diameter) was measured at 3 min resolution by means of a scanning mobility particle sizer (TSI SMPS) equipped with an 85Kr neutraliser, a DMA 3080, and a CPC 3772, operated at 2.0/0.2 L min−1 sheath and aerosol flow rates. Measurements were corrected for diffusion losses and multiple charge effects with the instrument software.
Mass-selected size distribution measurements were performed using an SMPS (TSI, X-ray neutraliser 3087, DMA 3080, CPC 3775 high) and centrifugal particle mass analyser (CPMA, Cambustion; Olfert and Collings, 2005) in a DMA–CPMA–CPC set-up as described in Yon et al. (2015). For these measurements, the CPMA is used to select particles according to their mass-to-charge ratio, while the DMA–CPC in SMPS mode measures the number distributions of the CPMA-selected single-particle mass (mp). An effective density (ρeff) of the aerosol was calculated for each selected mp as (Kasper, 1982; Park et al., 2003)
where Dm,fit is the median diameter from the lognormal fit of the measured size distribution of the mp-corresponding SMPS scan. Measurements of ρeff were performed, if particle abundance allowed it, for 10 values of mp from 0.03 to 6 fg (selected with the CPMA) in order to characterise the relation between ρeff and Dm over the full soot size range. On average a complete acquisition corresponded to about 35 min of measurements including scan and CPMA stabilisation periods. The DMA–CPMA–CPC scans were performed after soot injection in the chamber, at selected points during the experiment, and at the end of each experiment. Combining SMPS (dN/dlogDm) online number distribution measurements with ρeff (Dm) from the measurements allows the calculation of the total aerosol mass concentration (mtotal) as
with the subscript i indicating the channels of the SMPS. The ρeff (Dm,i) is the effective density extrapolated over the range of the SMPS Dm,i channels calculated based on the power-law relation of effective density and diameter of the aggregates (Park et al., 2003; Rissler et al., 2013):
In Eq. (5) a is a constant term and Dfm is the mass–mobility exponent, a parameter describing the morphology of the aerosols (Dfm=3 for spherical particles, around Dfm=2.2 for soot particles (e.g. Sorensen, 2011; Mamakos et al., 2013; Maricq and Xu, 2004)). Additional measurements of the aerosol mass concentration were performed online at 5 min resolution by means of a tapered element oscillating microbalance (TEOM 1400a, Thermo Scientific). Further, a single-particle soot photometer (SP2, Droplet Measurement Technologies; Stephens et al., 2003) and a time-of-flight aerosol chemical speciation monitor (TOF-ACSM, Aerodyne) monitored online the mass concentration of refractory BC (rBC) and non-refractory species (see Sect. S2).
Aerosol filter samples were taken for offline measurements. Thermo-optical analysis (Sunset analyser, Sunset Laboratory Inc.) was performed to retrieve the soot EC and OC content using the EUSAAR_2 protocol (Cavalli et al., 2010). Soot particles for measurements were collected on pre-baked (550 °C for 8 h) quartz-fibre filters (47 mm diameter, Pall Tissuquartz™, 2500 QAT-UP) using a custom-made stainless-steel filter holder. The sampling started when the soot concentration was stable. Particles were sampled at flow rates between 2 and 10 L min−1 for 60 to 240 min. Unfortunately, the sampling conditions, technical constraints, and particle concentrations in the chamber led multiple experiments to collect masses below the quantification limit (QL = 0.42 µg cm−2). Thus additional soot sampling was performed directly out of the miniCAST to complement the chamber experiments. In this case, the sampler was directly connected to the output of the soot generator through a charcoal denuder, the charcoal sheets of which were changed after each sampling. This sampling configuration is equivalent to sampling soot directly after the injection into the CESAM chamber. The flow rate used for direct sampling was varied between 4 and 6.5 L min−1, and the sampling lasted between 6 and 360 s. For each CS, different filter samples were therefore obtained by combining chamber and direct sampling. The ensemble of results was averaged to obtain for each CS an average and standard deviation of , , and ratios representative of each soot type. Tests were performed by adding a backup filter behind the aerosol filter during the sampling in order to determine the volatile fraction of OC. Results indicate no presence of any notable quantities of volatile fractions. Blank filters were collected during chamber and direct sampling experiments and show OC and EC values below the detection limit (DL = 0.25 µg cm−2). In between sampling and analyses, all filters were stored in a freezer at −20 °C.
Soot particles for transmission electron microscopy (TEM) analyses were collected on TEM grids (200 mesh copper grid with a formvar/carbon film, Agar Scientific) placed on a 47 mm Teflon filter (Nuclepore, Whatman, 0.8 µm nominal pore size) using a custom-made stainless-steel filter holder. A layout of three grids per filter was used. Sampling was performed at 2–4 L min−1. Samples were taken over different moments of the experiments to determine the morphology of soot. Sampling time was set based on number concentration to ensure that similar area loadings would be sampled. The TEM images were acquired with a JEOL® 100CXII microscope. The pictures were processed to isolate the soot via Fiji (Schindelin et al., 2012), an open-access image-processing package of ImageJ (Schneider et al., 2012), using the Trainable Weka Segmentation plugin (Arganda-Carreras et al., 2017) with the FastRandomForest classifier. The software was used to generate two class images, namely soot particles and background. Pixel groupings of less than 0.04 % of pixels were filtered out as they could be attributed to noise. An automated method based on Euclidean distance mapping, described in Bescond et al. (2014), was applied to these two class images to determine the average diameter of the primary particles composing the soot aggregate (Dpp) and its fractal dimension (Df). The primary particle size and the fractal dimension enable the approximated description of the soot particles over their self-similar structure as
in which N is the number of spheres in the aggregate and Dg the particle's gyration diameter (Sorensen, 2011).
2.3.2 Spectral aerosol optical properties
The extinction coefficient (bext) at 450 and 630 nm was measured online at a 1 s resolution by two cavity attenuated phase shift monitors (CAPSs, CAPS PMex, Aerodyne Research, sampling flow rate 0.85 L min−1; Kebabian et al., 2007; Massoli et al., 2010). Additionally, in some experiments, two CAPS single-scattering albedo monitors (CAPS PMSSA, Aerodyne Research, sampling flow rate 0.85 L min−1; Onasch et al., 2015) were deployed to provide further measurements of extinction at 450 and 630 nm (scattering coefficient data from the CAPS PMSSA were not considered for the present experiments). The bext by the CAPS PMex and PMSSA agreed within uncertainty.
The aerosol scattering coefficients (bscat) at 450, 550, and 700 nm at angles between 7 and 170° were measured at 1 s time resolution by a nephelometer (TSI Model 3563 Integrating Nephelometer, sampling flow rate 2 L min−1; Anderson et al., 1996; Anderson and Ogren, 1998) connected online to the chamber. To account for the limited field of view of the instrument the truncation correction factor (Ctrunc), i.e. the ratio of bscat at 0–180° and 7–170°, needs to be estimated. To this aim, the formulation proposed by Massoli et al. (2009) for light-absorbing sub-micrometre particles was applied. The Massoli et al. (2009) correction requires as input the real part of the complex refractive index (n) of the aerosol. A default value of 1.95 for n through all wavelengths was assumed for the calculations based on the commonly used value proposed by Bond and Bergstrom (2006). The resulting Ctrunc varies between 1 and 1.044. Potential artefacts caused by this fixed value of n were estimated and are considered in the uncertainty of the total scattering signal (see Table S2). The truncation-corrected bscat values were used to interpolate the scattering at 630 nm based on the scattering Ångström exponent (SAE) calculated as the power-law fit of bscat versus the wavelength ().
The absorption coefficient (babs) at 450 and 630 nm was derived from online measurements throughout each experiment as the difference between bext and bscat (extinction-minus-scattering approach, EMS) from the CAPS monitors and the nephelometer. Three filter-based techniques for absorption measurements were applied in order to spectrally extend and validate the babs retrieved online by EMS: a multi-angle absorption photometer (MAAP, 637 nm; Petzold et al., 2005; Petzold and Schönlinner, 2004) and the multi-wavelength absorbance analyser (MWAA, 375, 405, 532, 635, 850 nm; Massabò et al., 2013, 2015), as well as the polar photometer of the University of Milan (PP_UniMI, 405, 448, 532, 635, 780 nm; Bernardoni et al., 2017; Vecchi et al., 2014). The MAAP measures online at a 1 min resolution. Due to its high flow rate (typically of 16.7 L min−1 but reduced to 8 L min−1 for these experiments), it was used to measure soot absorption only at specific moments, i.e. shortly after injection in CESAM and towards the end of each experiment. The MWAA and the PP_UniMI work offline with aerosol collected on filter samples. The filter tape from the MAAP (glass fibre filter GF 10) was cut and removed after each measurement interval in CESAM and used for the MWAA and PP_UniMI measurements. Full details on the data acquisition and analysis for offline filter-based techniques are provided in Sect. S3.
In addition to chamber measurements on the total aerosol fraction, measurements of the spectral absorption for CS1 to CS5 were also performed in the 190 to 640 nm wavelength range at 2 nm resolution for the soluble extracts of the soot. The aim of these additional measurements is to determine the signature of the soluble BrC in order to better identify the contribution of BC and BrC to the total absorption. For these analyses, the CS aerosols were sampled directly out of the miniCAST on 47 mm pre-baked quartz-fibre filters (Pall Tissuquartz™, 2500 QAT-UP) and extracted in acetonitrile (Fujifilm Wako Pure Chemical Industries). The extracts were analysed using a combination of high-performance liquid chromatography (HPLC; Agilent 1260 Infinity) for the separation of different constituents, a UV–VIS photodiode array detector measuring the spectral absorbance of compounds eluting from the HPLC column, and an electrospray ionisation high-resolution mass spectrometer (ESI/HRMS; JEOL JMS-T100LP AccuTOF LC-plus). The absorbance in these measurements is defined as , where I0 and I are the intensity of the incident and transmitted light. The absorbance spectra, integrated across elution time, are the only measurements used in the present work. Details on measurements and signal treatment are provided in Sect. S4.
3.1 Data homogenisation
An example of a timeline for a typical experiment analysed in this work is shown in Fig. 1. Online data were taken from about 15 min after the injection in CESAM and averaged over common base time intervals of 3 min corresponding to the time resolution of the SMPS used to derive the total aerosol mass concentration. All volumetric quantities were converted into standard temperature and pressure (STP) conditions assuming 1013.25 mbar and 273.15 K and considering the measured temperature and pressure for each instrument acquisition.
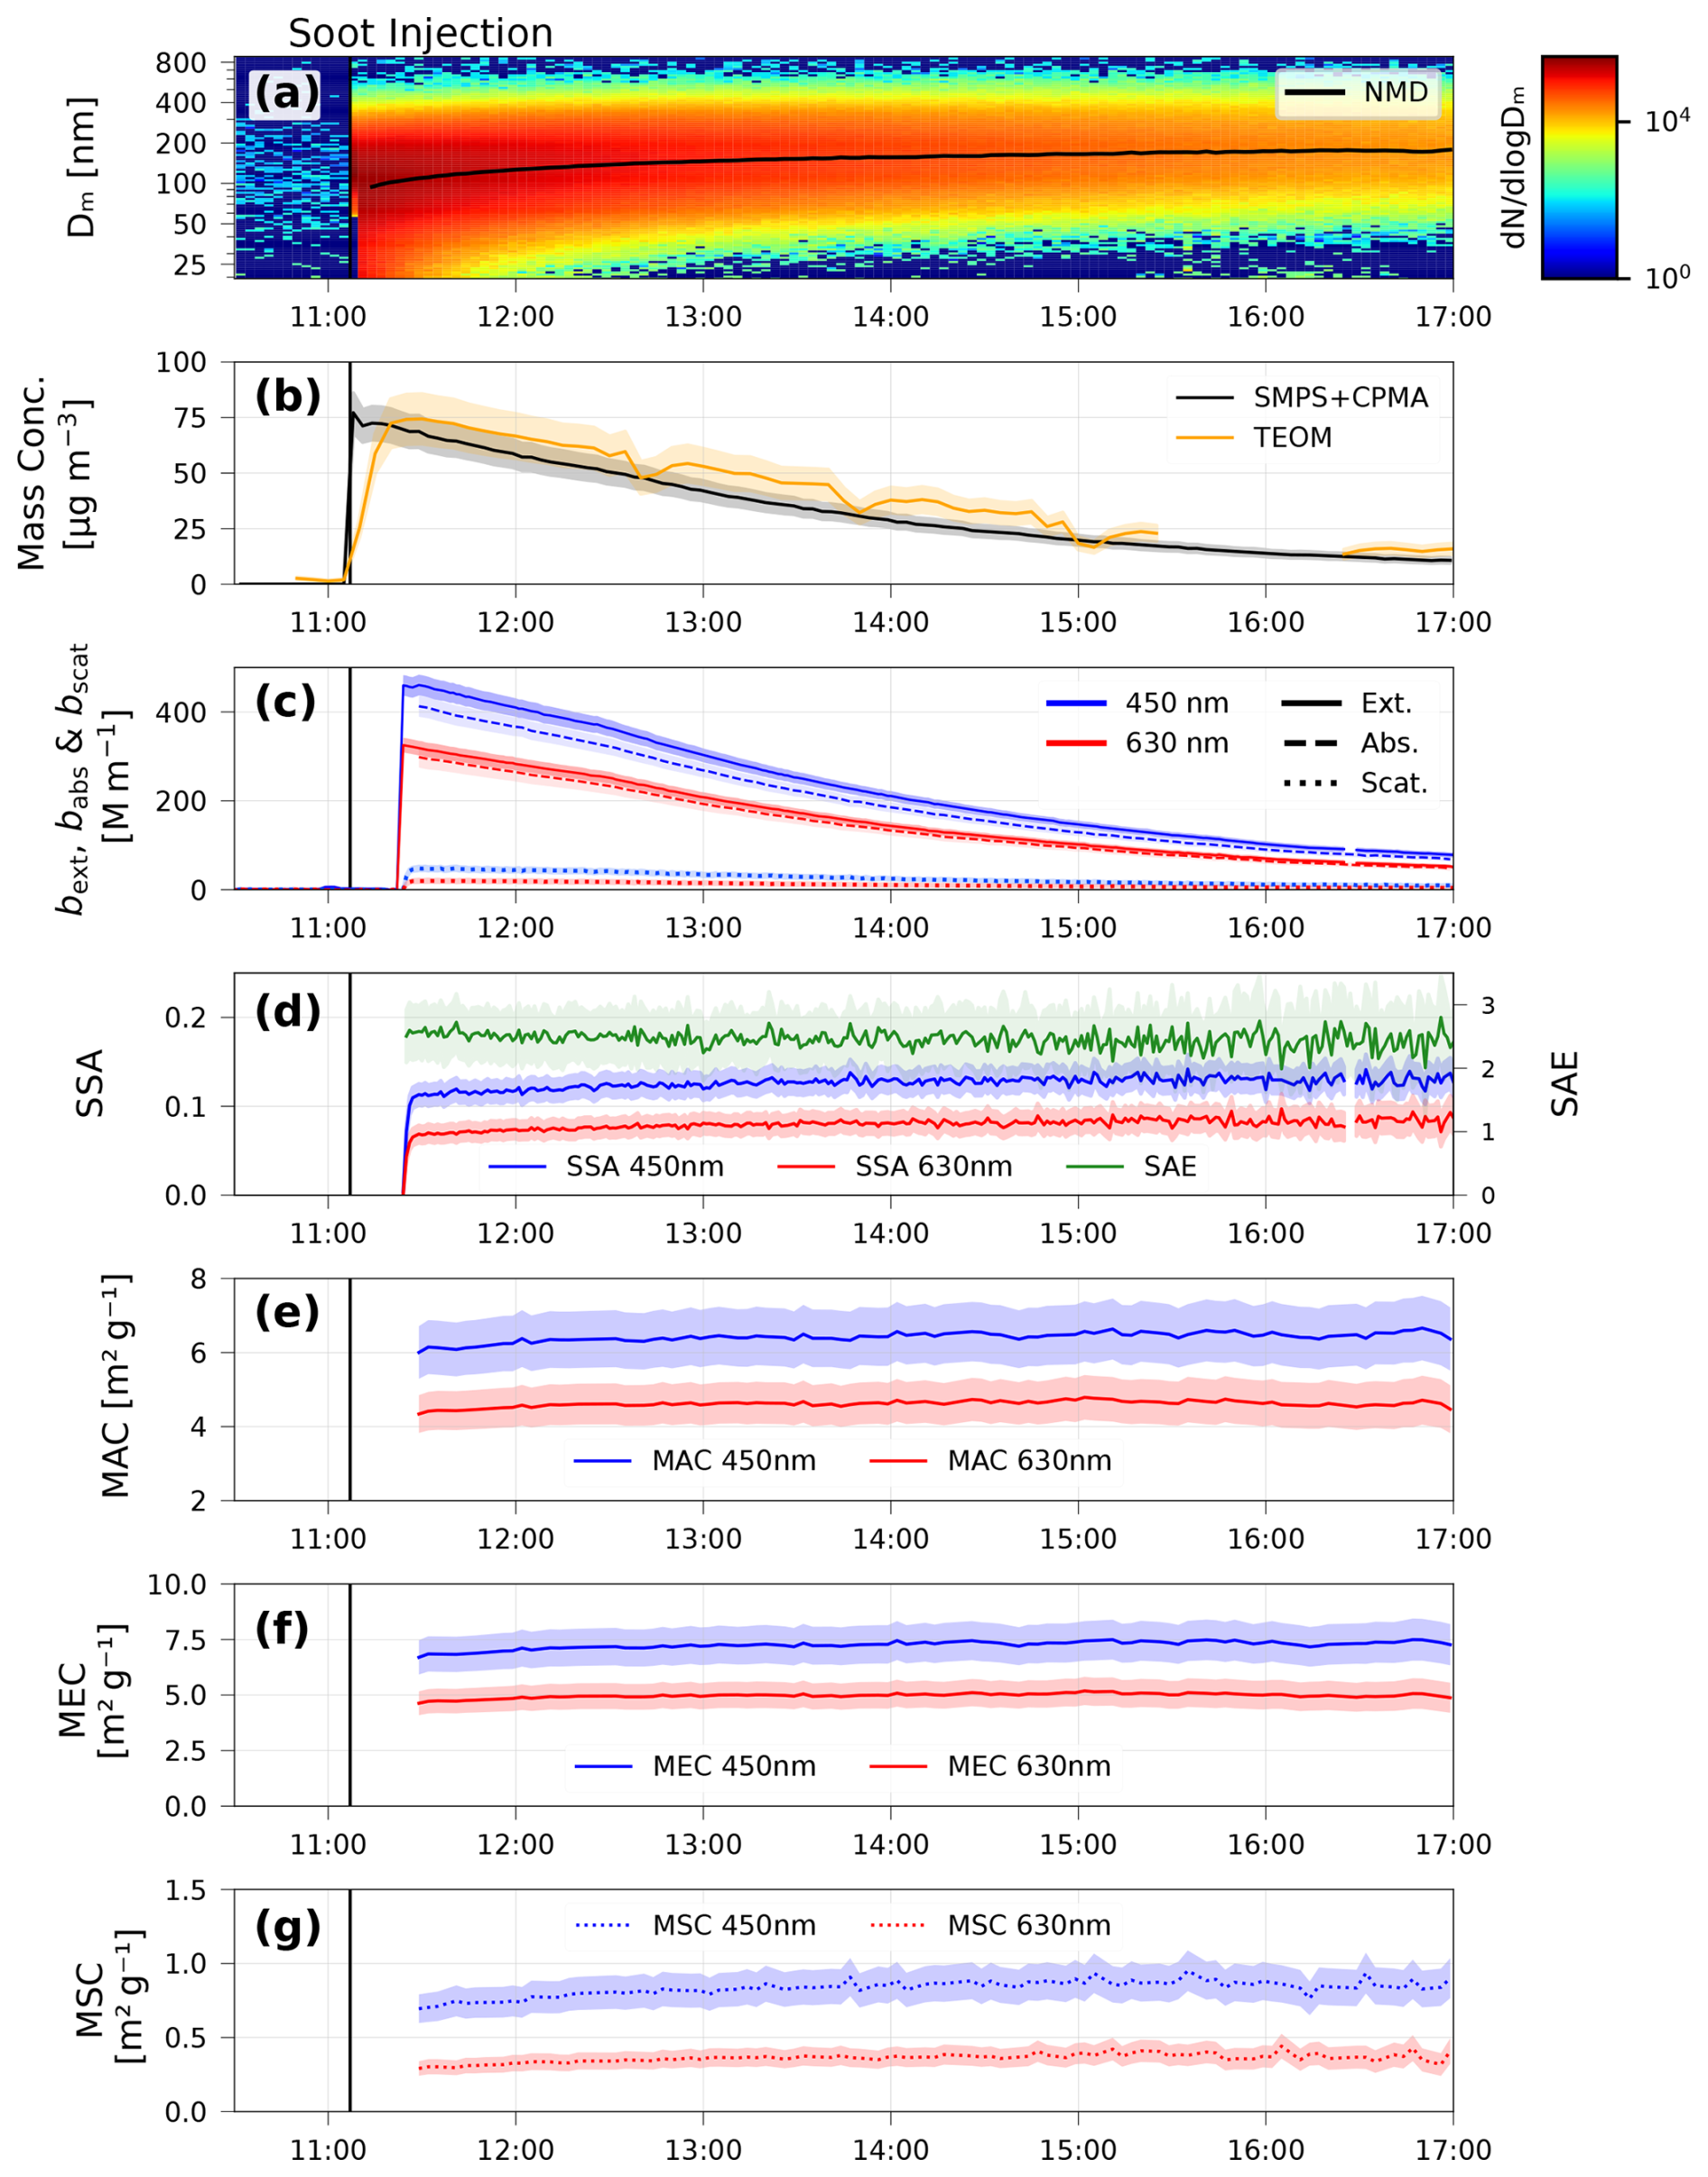
Figure 1Timeline of a typical CS experiment. The plot shows (from top to bottom) (a) the contour plot of the number size distribution in mobility diameter (dN/dlogDm) obtained from the SMPS. The number median diameter (NMD), or count median diameter (CMD) as also referred to in the text, obtained from lognormal fitting of the size distribution is plotted over the contour plot (black line); (b) the mass concentration (mtotal) obtained from SMPS and ρeff (Dm) data based on Eq. (4) and directly measured by a TEOM microbalance; (c) the extinction and scattering coefficients (bext, bscat) at 450 and 630 nm measured by CAPS PMex and the nephelometer (extrapolated based on the SAE); (d) the single-scattering albedo (SSA) at 450 and 630 derived from bext and bscat measurements and the SAE (from bscat 3-λ data); (e) the calculated MAC and (f) MSC and MEC at 450 and 630 nm. The data are at a 3 min resolution with the exception of the TEOM that is at a 5 min resolution. Data reported in this figure correspond to the experiment CS1 performed on 19 October 2021.
3.2 Data validation of total aerosol mass concentration and absorption coefficient
The mtotal retrieved by combining SMPS and CPMA data (Eq. 4) was validated against online measurements with the TEOM microbalance (Fig. 1b). The two masses show a good agreement in particular under consideration of their respective uncertainties.
The absorption coefficients measured with the EMS method (filter-free) (Fig. 1c) were compared to the filter-based techniques (MAAP, MWAA, PP_UniMI) at 450 and 630 nm for the ensemble of CS experiments (Fig. S1). The comparison indicates an excellent correlation (R2=0.94) and an average 7 % difference between EMS and filter-based techniques, well within measurement uncertainties, therefore supporting the consistency of the different absorption measurements. Higher data dispersion is observed at absorption intensities below 10 Mm−1, where lower values of the absorption are measured by the offline MWAA and PP_UniMI compared to the online MAAP and the EMS technique. This can be explained as a combination of low loading and limited sensitivity for low soot concentrations for the offline techniques. Data below 10 Mm−1 from MWAA and PP_UniMI were removed from any further analyses.
3.3 Retrieval of aerosol mass cross sections at 450 and 630 nm
The MAC, MSC, and MEC were calculated at 450 and 630 nm at 3 min resolution for each experiment based on Eq. (1) considering the babs (from EMS), bscat (from nephelometer), and bext (from CAPS PMex) and using the total aerosol mass (mtotal) from SMPS ((dN/dlogDm) and ρeff (Dm) (Eq. 4; Fig. 1e–g). The mtotal was used for the mass cross-section calculations with the aim of describing the properties of the entire soot particles and taking both absorbing fractions of BC and BrC into account. The ρeff (Dm) used in the mtotal calculation is the value measured in correspondence to each CS experiment. When a dedicated ρeff (Dm) measurement was not performed for the specific experiment, the average and standard deviation of the ρeff (Dm) for the closest condition was used. The uncertainty on the 3 min derived MAC, MSC, and MEC was estimated to average at 12 %, 14 %, and 11 %, respectively, as calculated from the statistical error propagation formula based on the uncertainty of optical coefficients and mass concentration. The ensembles of the 3 min resolution MAC, MSC, and MEC of all experiments were combined for each CS point to get a best-guess statistical synthesis of those parameters and their uncertainty at 450 and 630 nm. For this, each measured value with its mean measurement uncertainty was represented as a Gaussian distribution using
where μ is the measured value, σ the mean measurement uncertainty of μ, and c the number of times the mass cross-section value was measured normalised by the total measurements for the CS point. Then, the sum of all MAC, MSC, and MEC probability distribution functions was calculated and fitted with a Gaussian distribution. The μ and σ from the summed Gaussian function are the resulting best-guess estimate and 1σ uncertainty of the MAC, MSC, and MEC for each CS condition. An illustrative example of the statistical analysis performed on cross-section measurements is shown in Fig. S2.
3.4 Retrieval of the aerosol absorption and scattering Ångström exponent and the cross sections at 550 nm
For each CS point, an average value of the absorption Ångström exponent (AAE) between 375 and 870 nm was derived as the power-law fit of the multi-wavelength MAC estimated over the visible range by combining all available babs datasets (from MWAA, PP_UniMI, EMS, and MAAP) normalised using mtotal. The AAE was then used to calculate the MAC at 550 nm from the value at 450 nm as MAC550= MAC450 (450/550)AAE.
The AAE of the acetonitrile-soluble soot fraction (AAE BrCACN) was calculated for each CS point as the power-law fit between the integrated absorbance and the wavelength, measured from HPLC–UV–VIS within the two spectral ranges of 300–450 nm and 370–450 nm. The ranges are limited by the intensity of the absorbance which prohibits the extension of the calculation above 450 nm.
For each CS point the SAE was derived as the average of SAE values obtained from the power-law fit of the bscat versus λ from nephelometer observations over 3 min resolution. The values were averaged for all relevant fresh soot conditions on the same principle as the MAC (Eq. 7) assuming a normal distribution of the SAE values to consider both statistical variability and the measurement uncertainty. The SAE was used to calculate the MSC at 550 nm from the value at 450 nm as MSC550= MSC450 (450/550)SAE. The MEC at 550 nm was obtained as the sum of MAC550 and MSC550, with an average uncertainty of around 19 %.
3.5 Retrieval of the aerosol single-scattering albedo (SSA)
The SSA at 450 and 630 nm was calculated at 3 min resolution as the ratio of bscat and bext along the experiments (Fig. 1d). The CS average values at 450, 550, and 630 nm were estimated as MSC (MAC + MSC), taking the statistical synthesis values for each soot. The propagated uncertainty on the SSA varies between 12 % and 25 %.
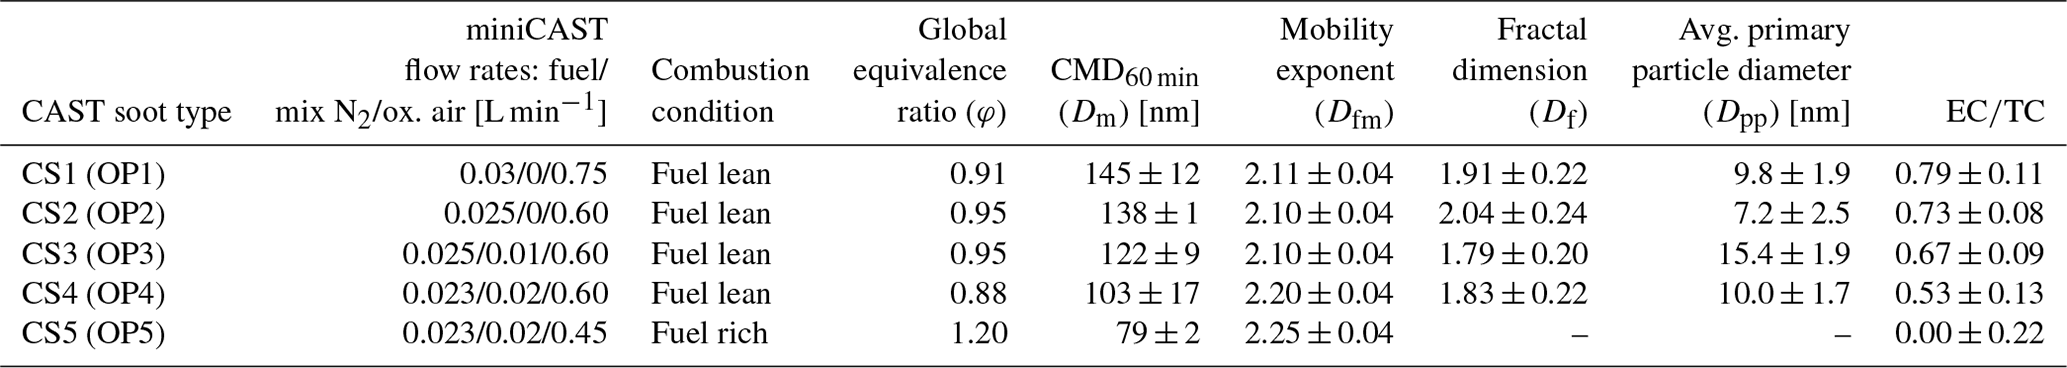
A summary of miniCAST operating conditions and average CS physico-chemical properties is reported in Table 1. Information in Table 1 includes the flow rates of the different gases used in the miniCAST, the combustion conditions (fuel lean/rich), the global equivalence ratio (φ) estimated from Eq. (2), the count median diameter (CMD, Dm) estimated from the lognormal fitting of the SMPS number distribution for soot after 60 min of injection in CESAM (with their standard deviation), the mobility exponent (Dfm) retrieved from fitting effective density measurements with Eq. (5), the fractal dimension (Df) and primary particle diameter (Dpp) retrieved from TEM images analysis, and the elemental versus total carbon ratio () as obtained from thermo-optical analyses.
4.1 Physico-chemical properties of generated soot
The composition of the CS varies between the combustion conditions, in agreement with observations with other miniCAST models (i.e. Török et al., 2018; Schnaiter et al., 2006; Ess and Vasilatou, 2019). The soot's OC fraction increases and the particle size decreases with the reduction in the oxidation air and the addition of the mixing air from CS1 to CS5, suggesting the generation of more mature (CS1) to less mature (CS5) soot. The is within 10 % (0.79, 0.73) for CS1 and CS2, reducing to 0.67 and 0.53 for CS3 and CS4, respectively. The fuel-rich condition of CS5 produces soot dominated by OC, with EC concentrations under the quantification limit for thermo-optical measurements, resulting in an ratio that therefore we assume to be equal to 0. For all CSs a significant part of the OC detected in thermo-optical analyses is associated with pyrolytic carbon. It is noteworthy that ACSM detected a significantly lower amount of organic aerosol compared to thermo-optical analyses (going from around 1.5 % of the total soot mass for CS1 to about 2.3 % for CS5; not shown). This low organic content in the ACSM can be due to the particle bouncing off from the vaporiser and/or can be linked to the nature of the organic material itself (Mamakos et al., 2013; Maricq, 2014; Török et al., 2018).
Table 1Physico-chemical properties of the CAST soot (CS) aerosols for the five combustion conditions considered in this study (CS1 to CS5) corresponding to the first five predefined miniCAST operation points (OP1 to OP5).
The size distributions of the generated aerosols show specific features for the different CSs, and they evolve during chamber experiments, as illustrated in Fig. 1a. Figure 2 shows the comparison of the number size distribution for the five CSs for the first SMPS scan after injection in CESAM (Fig. 2a) and 60 min later (Fig. 2b). For the fresh soot right after injection in CESAM the size distributions of all EC-dominated soot (CS1 to CS4) show bimodal lognormal distributions. They display a main peak between roughly 95 and 120 nm and an additional smaller peak ranging from 25 to 40 nm. The organic-dominated CS5 on the other hand is the only mono-modal aerosol in the first scan displaying a peak at around 40 nm. It has to be noted that the number of particles smaller than 50 nm is increasing from CS1 to CS5, following the decrease in fuel and oxidation air. The lifetime of the small peak is rather short, and the mode is only distinctively identifiable for the first few minutes of the chamber lifetime as the particles coagulate rapidly to form within around 10 to 30 min a mono-modal size distribution. At 60 min after generation, all soot aerosols show mono-modal size distributions spanning a range of median diameters varying between 130 and 150 nm for EC-rich CS1 and CS2; 95 and 125 nm for OC-richer CS3 and CS4; and 75 and 80 nm for the organic-dominated CS5, which is also showing a narrow size distribution.
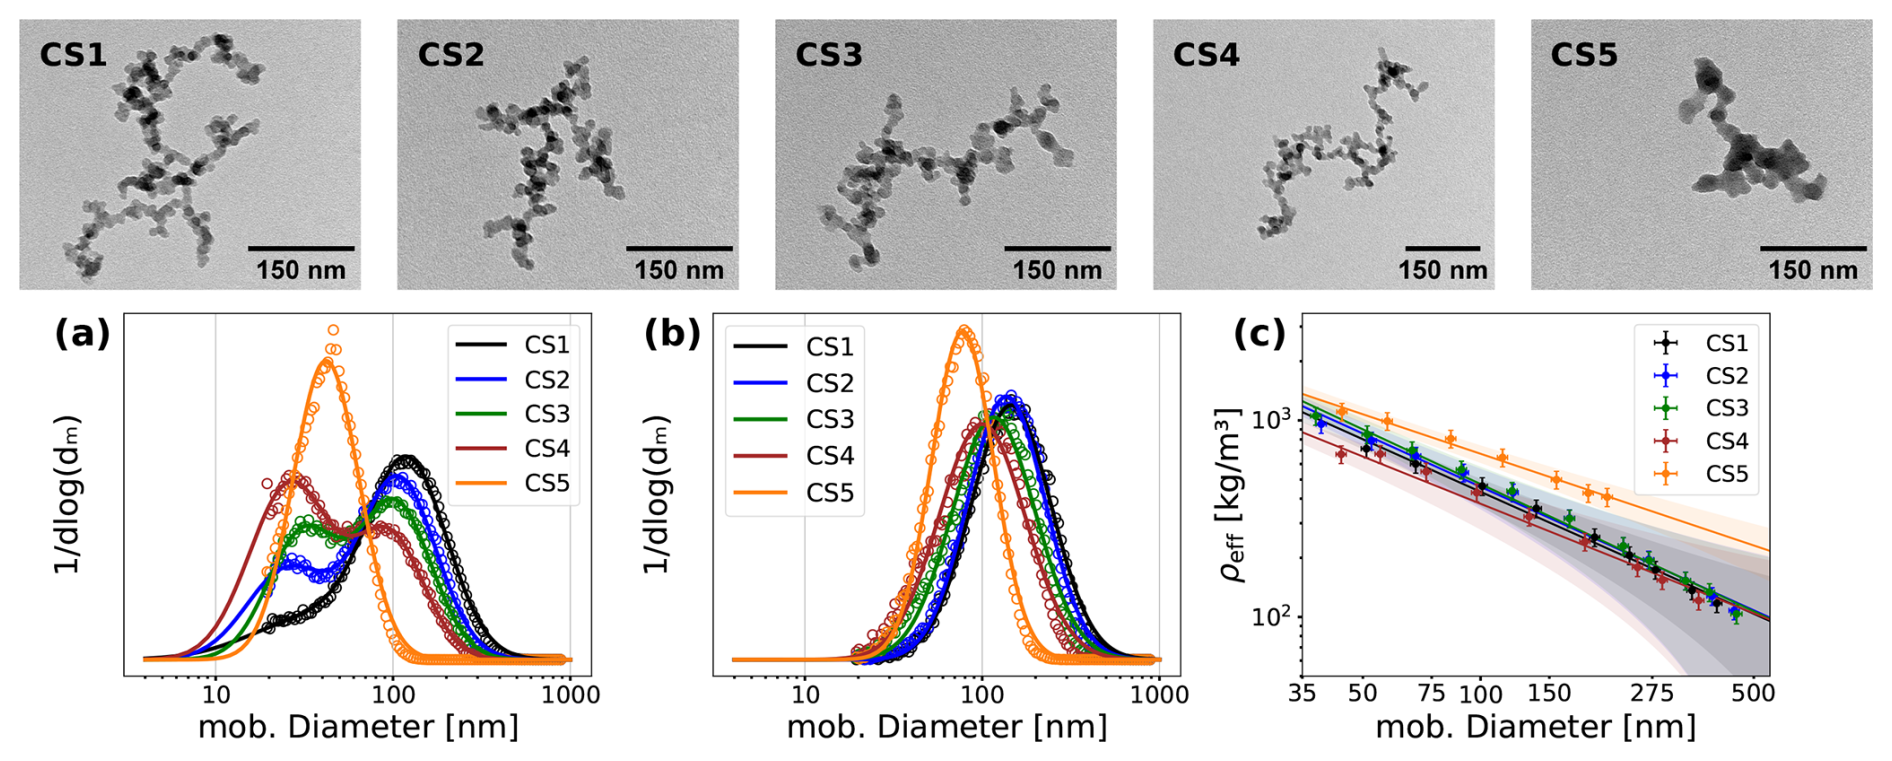
Figure 2Top panels show pictures illustrating the morphology of the five CSs as obtained from TEM imaging for samples collected 20 to 45 min after injection in CESAM. Bottom panels (a–c): number (dN/dlogDm) size distribution measured (open circles) and fit-extrapolated lognormal size distribution (lines) of generated CS just after completion of the injection in CESAM (a) and 60 min later (b). Size data are normalised by the total number for each distribution. (c) Effective density (ρeff) as a function of mobility diameter (Dm) for the five CSs as measured between a few minutes and 30 min after injection. The power-law fit (Eq. 5) is also plotted with its fitting uncertainty (shaded area).
Pictures of the five CSs as obtained from TEM imaging for aerosol sampled about 20–45 min after injection are shown in Fig. 2. For CS1 a total of 11 sets of about 100 images from different experiments are available and individually analysed. For CS2 to CS4 the statistics are reduced to 1 set of 100 images for each CS point, while for CS5 the number of images was 85. The different CSs show the typical fractal aggregate structure of soot and a lacy morphology. While CS1 to CS4 do not show directly visible structural differences, CS5 displays a lower number of large aggregates as well as more rounded/collapsed structures. Formal statistical analysis of TEM pictures confirms limited variability for the fractal dimension (Df) and primary particle diameter (Dpp) for CS1 to CS4 (Df=1.79–2.04, Dpp=7.2–15.4 nm); conversely, no information is available for CS5 due to a lack of statistics. For CS1 the range of measured Dpp and Df is in the range of values observed for CS2 to CS4, suggesting that the variability in Dpp and Df for the different CSs is within the range of measurement variability in a single CS. Therefore, the TEM measurements do not allow for differentiation of CS1 to CS4, which have to be considered similar in particle size and aggregate fractal dimension. For CS1–CS4 an average size of around 10 nm for Dpp is proposed based on the results of all measurements performed. This diameter sits at the lower end of the range for the primary spheres observed in combustion aerosol, spanning generally 10 and 50 nm (e.g. Bescond et al., 2016; Hu and Koylu, 2004; Köylü and Faeth, 1992; Lee et al., 2002; Mamakos et al., 2013). Similarly, a fractal dimension Df of around 1.86 is proposed for the ensemble of CS1 to CS4. This value is at the upper end of observed values for fresh soot (i.e. 1.61 to 1.83; Bescond et al., 2016; Köylü and Faeth, 1992; Wang et al., 2017) and the diffusion-limited cluster aggregate (DLCA) regime which with a fractal dimension of about 1.75–1.8 is considered to represent soot well (Sorensen, 2011).
The measured effective density ρeff (Dm) (Fig. 2c), taken 15 to 45 min after soot injection into CESAM, decreases with size as measured for Dm between 40 and 450 nm. The ρeff varies in the range 0.95–0.12 g cm−3 for CS1 to CS4 and 1.22 and 0.2 g cm−3 for CS5, as retrieved from fitting curves (Eq. 5). The fractal mobility exponent (Dfm) is 2.10 for CS1–CS3, increasing to 2.20 and 2.25 for CS4 and CS5, a range of values that following Sorensen (2011) is typical of the DLCA soot. The Dfm in our study is in line with previous studies on propane miniCAST and ethylene soot with Dfm between 2.0 and 2.3 (Ess et al., 2021; Mamakos et al., 2013; Maricq and Xu, 2004; Moore et al., 2014), while it is on the low end for values observed for diesel and aircraft turbine engine soot, which span 2.2 to 2.6 (Durdina et al., 2014; Maricq and Xu, 2004; Olfert et al., 2007; Park et al., 2003; Rissler et al., 2013). The slight differences in Dfm indicate a slight change in the morphology between the CSs. The observed higher values of ρeff and Dfm for fuel-rich CS5 suggest a change in composition and slightly more compact morphology (less elongated, more rounded aggregates) for this soot, in agreement with TEM images. Knowledge of the primary particle size together with the effective density measurement enables the estimation of a density for the primary particles following Yon et al. (2015). For CS1, for which the most robust TEM statistics are available, an average density for the primary particles of 1.73±0.14 g cm−3 is retrieved, close to the value of 1.8 g cm−3 reported and associated with BC in the literature (Bond and Bergstrom, 2006; Park et al., 2004; Wu et al., 1997).
4.2 Spectral optical properties of generated soot
Measured cross sections and SSA values are found to be stable throughout the aerosol lifetime (varying between 2 and 27 h) in the isolated CESAM volume and to be independent of injected mass and number concentrations (Fig. 1e–g). The only exception is found for a slight increase in the values in the first hour of measurements that stabilised around 60 to 90 min after soot injection. These changes are generally less than 10 % and considered not significant. Stability in values, in consideration of uncertainties, is also observed in the further measurements over the aerosol lifetime, in dark and dry (0 % relative humidity) conditions, for the SAE (Fig. 1d) as well as the AAE and the effective density (not shown), supporting the conclusion that coagulation and the resulting particle growth have limited impact on the soot aerosol chemical, morphological, and optical properties.
The results of the statistical analysis taking into account the ensemble of CS experiments for MAC, MSC, and MEC at 450 nm are shown in Fig. 3 (630 nm shown in Fig. S3) and summarised in Table 2. The measured cross-section values are generally well represented by normal distributions despite observed deviations especially in the MSC, likely associated with limited statistics. The fitting parameters indicate that the relative standard deviation determined for the cross sections is fairly similar to the relative measurement uncertainty indicating good repeatability in the combustion aerosol generation and measurements. For all CSs the MAC is dominating over the MSC and the SSA is within 0.12–0.29 at 450 nm and 0.07–0.27 at 630 nm. Retrieved MSC values seem rather independent of CS type and decrease with wavelength, spanning the range 0.7–0.9 and 0.2–0.4 m2 g−1 at 450 and 630 nm. The SAE increases from 2.43 for CS1 to 3.81 for CS5. The MAC decreases in the order of CS2, CS1, CS3, CS4, and CS5 from 6.3 to 2.2 m2 g−1 at 450 nm and from 4.5 to 0.8 m2 g−1 at 630 nm. The MEC absolute value and variability mainly follow MAC tendencies, with values in the range 7.2–3.1 m2 g−1 (450 nm) and 4.8–1.1 m2 g−1 (630 nm). Marked differences in MAC and MEC are identified when comparing the fuel-rich CS5 against the fuel-lean CS1–CS4, showing a narrower range of variability.
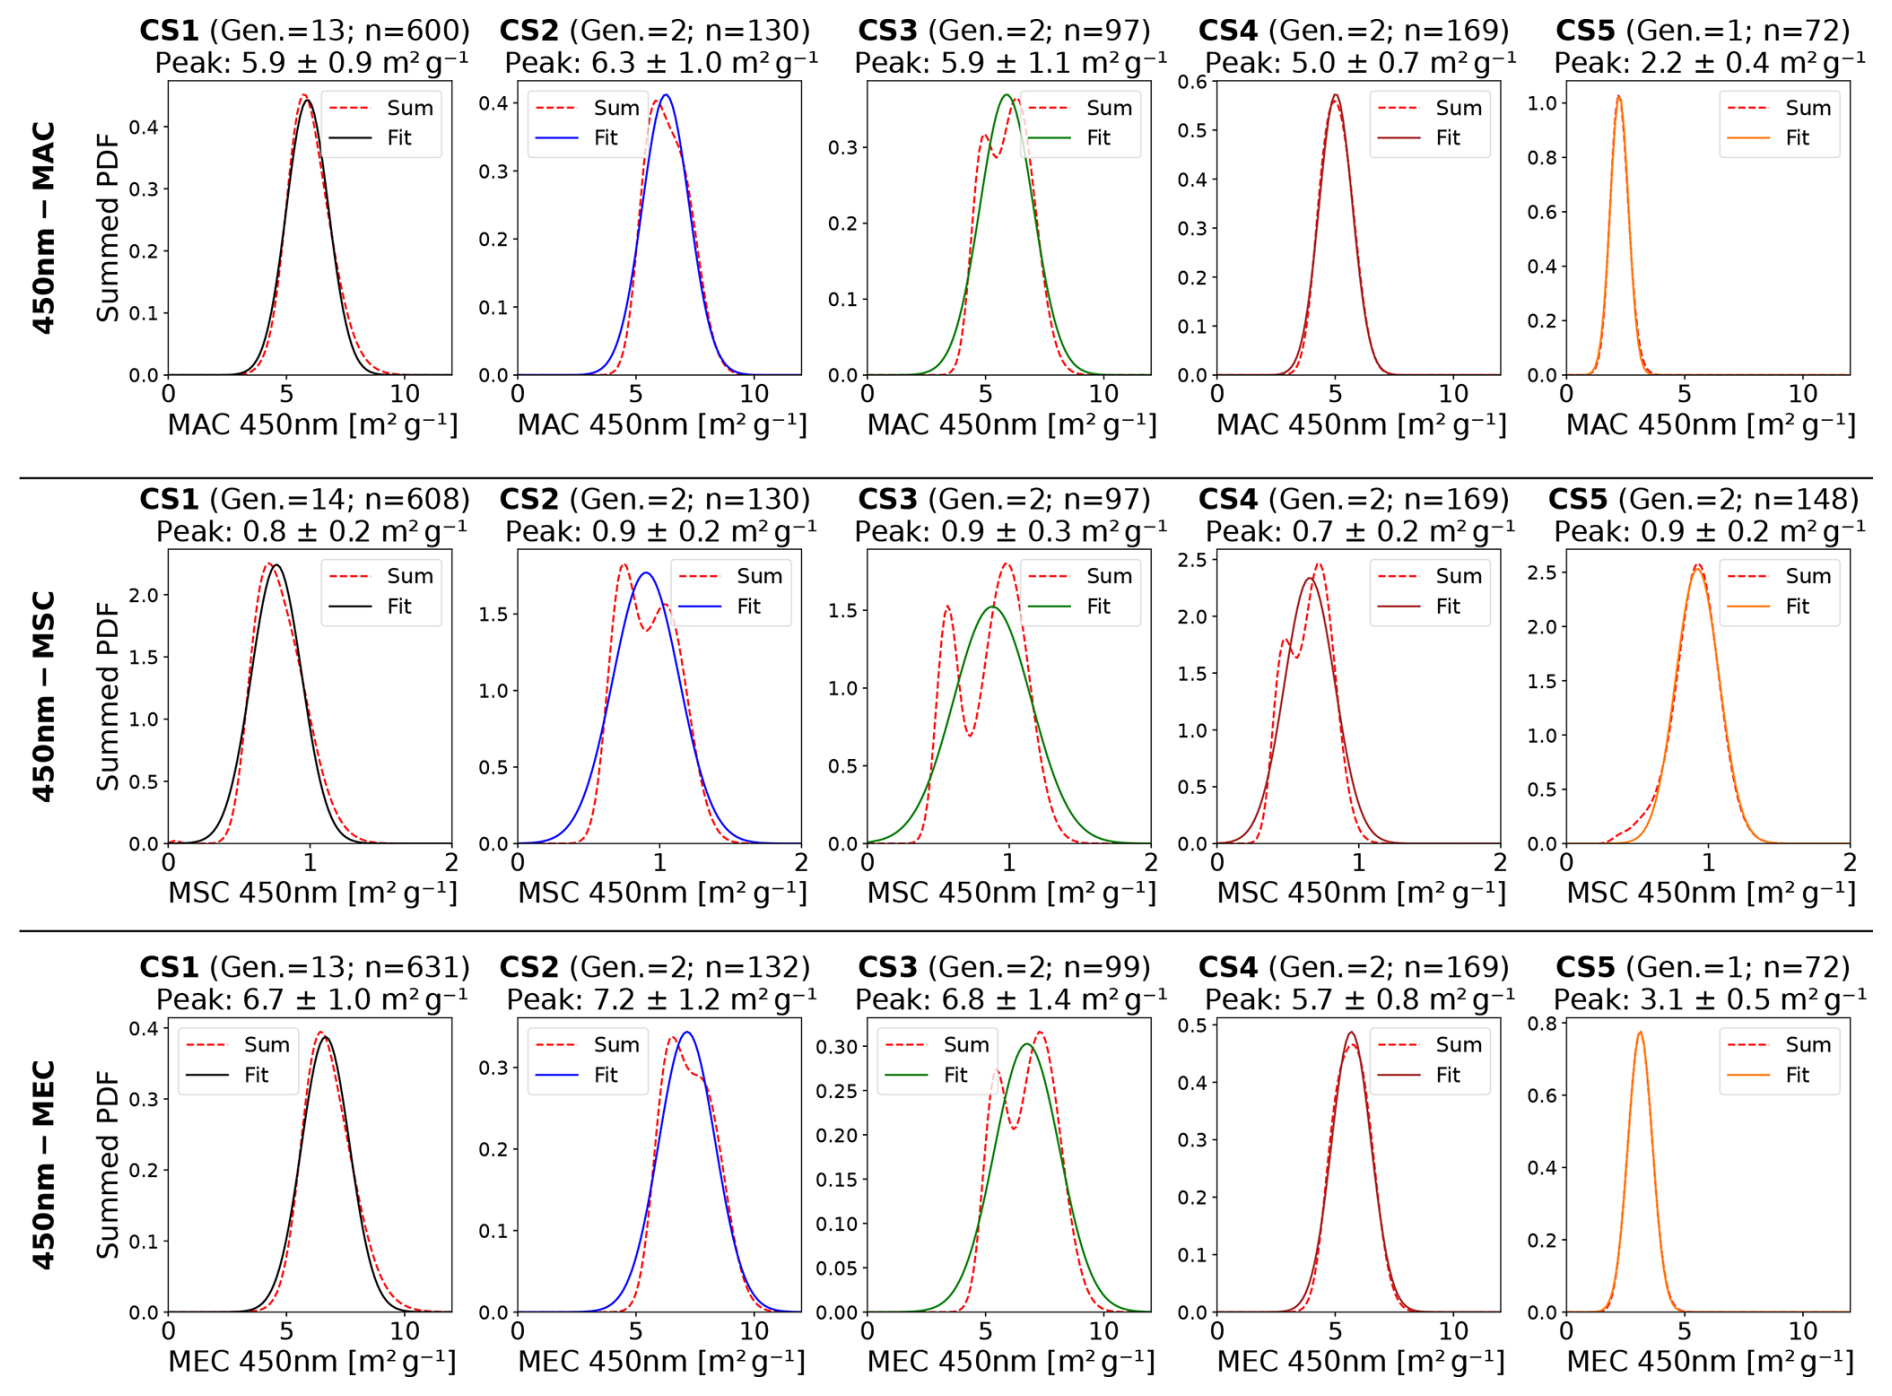
Figure 3The sum of Gaussians of MAC, MSC, and MEC values and fitted Gaussians distribution of the sum for CS1 to CS5 at 450 nm. For each plot the soot type, together with its number of generations and data points used (n), is given. Further, the mean value from the fit together with its standard deviation is provided, determined from the fit of Eq. (7).
The wavelength-dependent MAC values obtained for the different CSs from combining all experimental data from both EMS and filter-based techniques and the power-law fitting to retrieve the AAE values are shown in Fig. 4. The retrieved AAE is 1.26 for CS1 and increases to 1.34, 1.59, 1.88, and 3.8 for CS2 to CS5, respectively, indicating stronger wavelength dependence of absorption going from EC-rich to OC-rich soot. The increasing wavelength dependency of absorption with increasing OC content suggests the BrC nature of the organic material composing the soot.
Table 2Mean of the MAC, MSC, MEC, and SSA estimated from normal distribution summation and fitting at 450 and 630 nm for the five CAST soot types (CS1–CS5) and extrapolated at 550 nm from 450 nm based on the AAE. The mean of the AAE and SAE is also indicated. Provided uncertainties represent the combination of statistical and measurement uncertainties for the MAC, MSC, MEC, and SSA parameters, while for the AAE and SAE uncertainties are related to the fitting procedure.
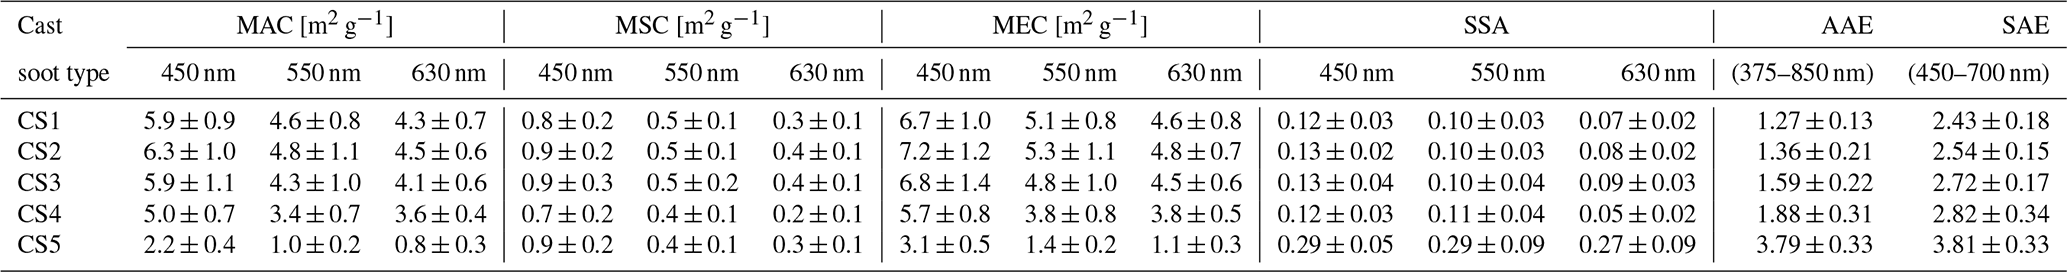
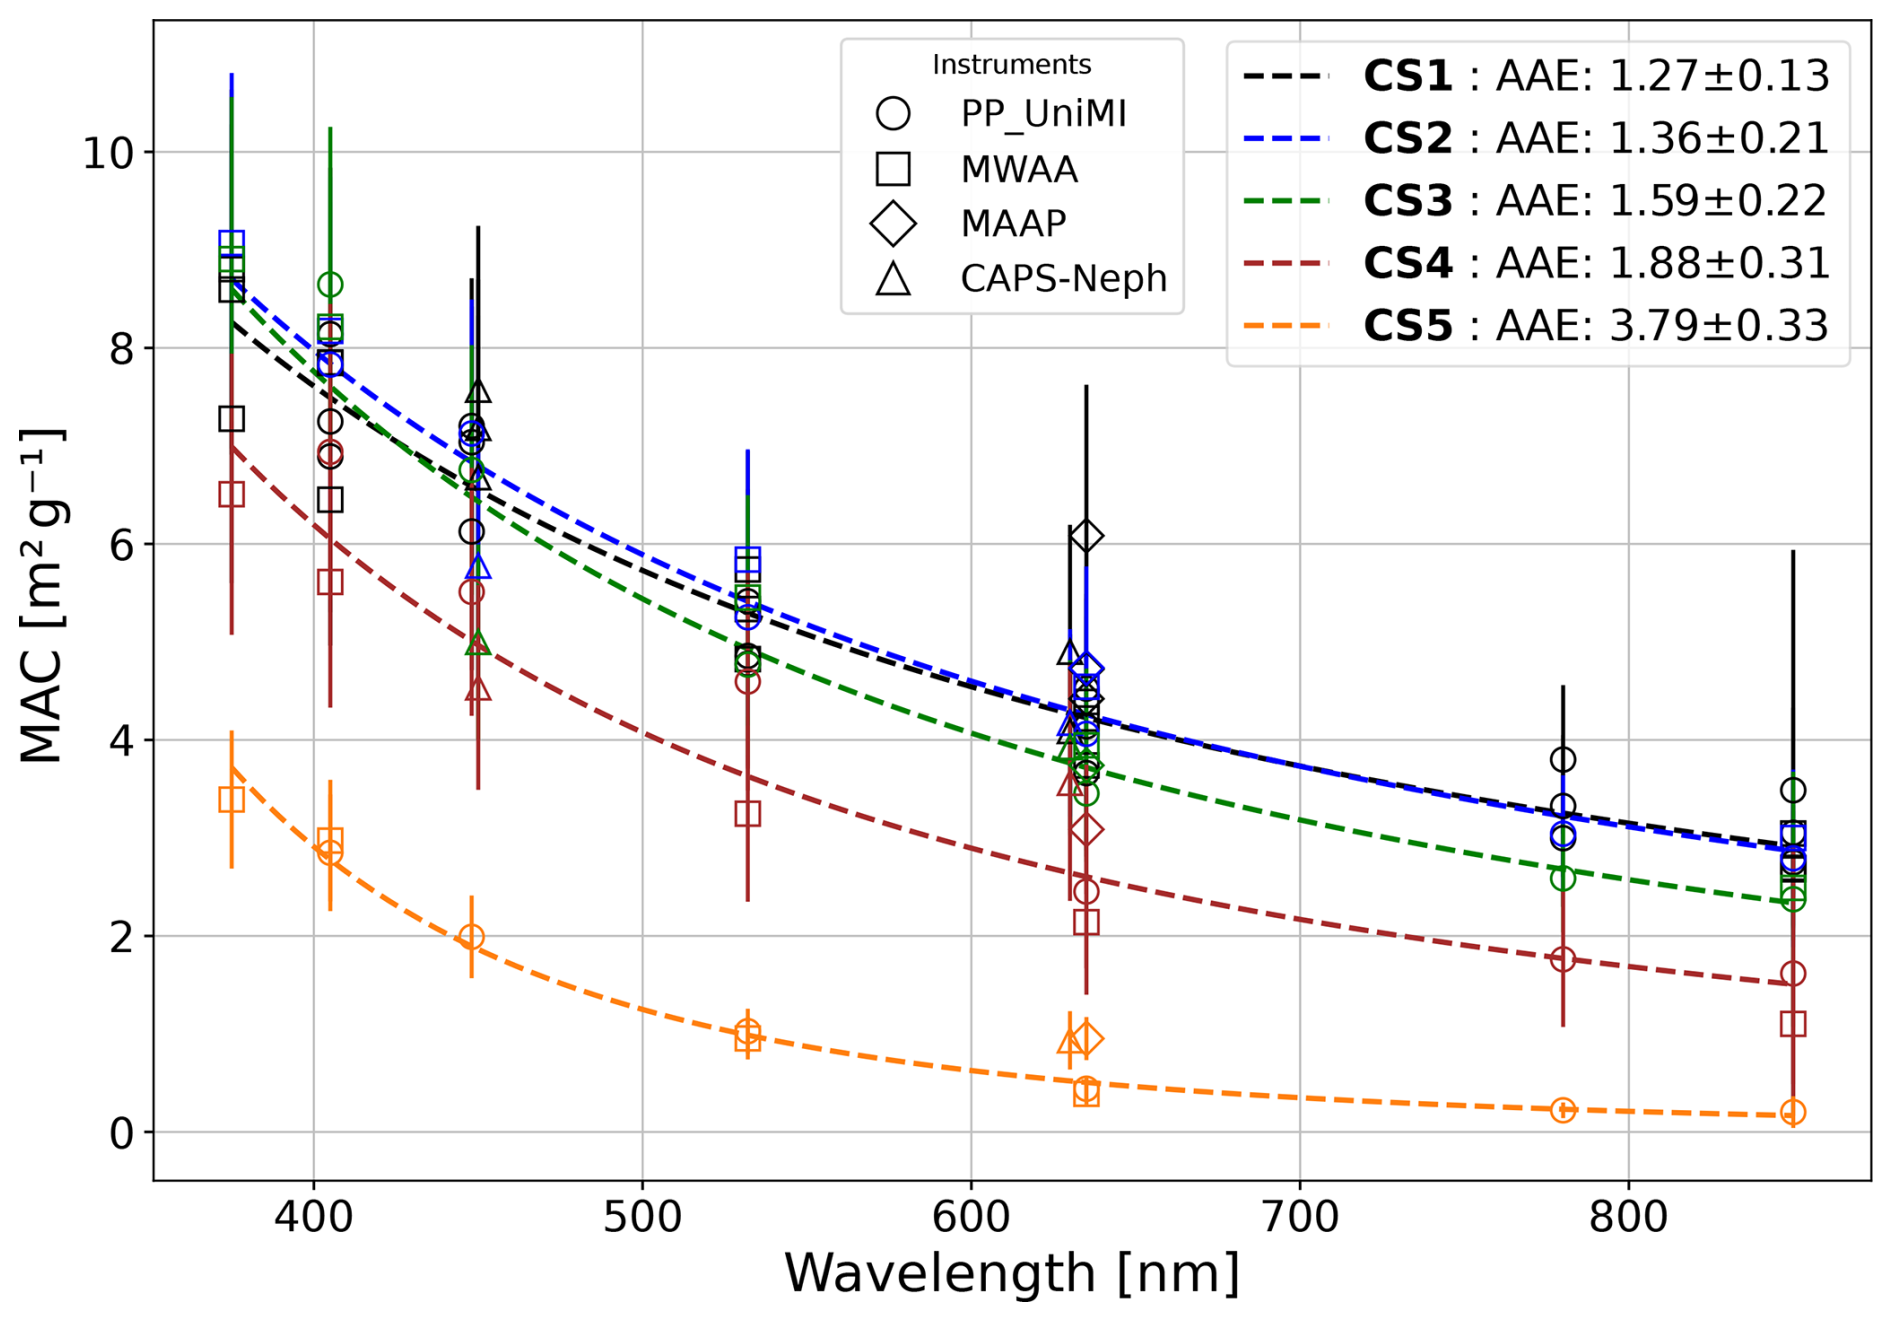
Figure 4Wavelength-dependent MAC values from combining the data from both filter-based (MWAA, MAAP, PP_UniMI) and EMS techniques for fresh soot CS experiments. The EMS and MAAP data are averaged over the same intervals of MWAA and PP_UniMI filter-based measurements. Vertical error bars represent the cross-section uncertainties consisting of both the uncertainty of the measurement of mass and absorption coefficient, the latter being the measurement uncertainties for the offline techniques and for the online techniques (MAAP and EMS) the averaged measurement uncertainty over the filter sampling period. The power-law fit line (MAC ∼ λ−AAE) and the retrieved AAE values (± fit uncertainty) for each CS are indicated. To note is that the offline techniques proved sensitive to low filter sample loadings and were not able to measure significant absorption values at high wavelength (870 nm) for CS3–CS5.
Extractive measurements are used to provide an independent evaluation of the absorbing capacity of the soot organic material, further extending the spectral range down to 200 nm. Figure 5a shows the absorbance spectra measured for acetonitrile extracts for CS1 to CS5 soot, where data are normalised at the peak to allow a direct comparison between the CS spectra. The absorbance decreases steadily with wavelength, showing a similar behaviour for CS1 to CS4, and there are noisy data above 450 nm. A significantly higher absorbance signal in the whole spectral range up to 600 nm is obtained for the OC-dominated CS5. The AAE of the acetonitrile-soluble soot fraction (AAE BrCACN) estimated from 300 to 450 nm and from 370 to 450 nm is shown in Fig. 5b in comparison to the AAE for the bulk soot. The AAE BrCACN values range from 4.8 to 6.0, indicating a strong wavelength dependence of absorption in the 300–450 nm range for the acetonitrile extracts. The AAE BrCACN does not show a clear dependence on the CS type, i.e. on sampled combustion conditions.
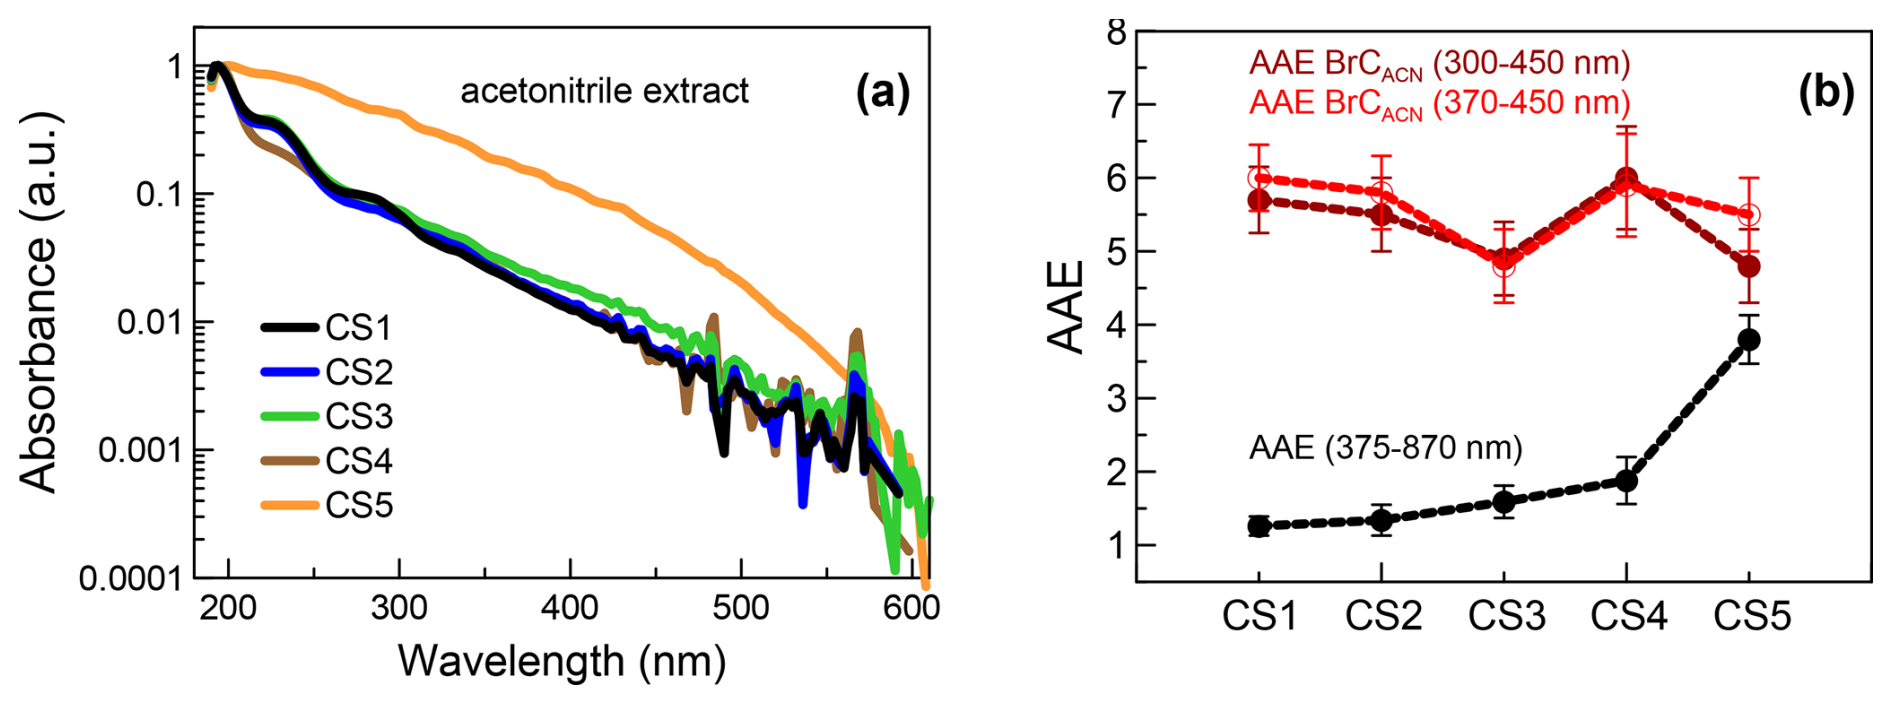
Figure 5(a) Wavelength-dependent absorbance for acetonitrile-soluble CS1–CS5 soot fraction. Absorbance data are normalised at the peak. (b) Comparison of the AAE obtained in the 300–450 nm and 370–450 ranges for the acetonitrile extracts and the AAE obtained for the soot aerosol within the 375–870 nm range.
5.1 Soot composition and combustion conditions
The composition, and to a lesser extent also the size distribution, of the CSs vary between the generation conditions. The thermo-optical OC increases, going from fuel-lean to fuel-rich conditions (CS1 to CS5), correlating with an increase in particles emitted in the size range smaller than 50 nm that coagulate to form a mono-modal aerosol during the time in suspension. Different publications on miniCAST soot (e.g. Schnaiter et al., 2006; Moore et al., 2014) report similar bi-modal size distributions and attribute the smaller mode to spherical condensed organics from polycyclic aromatic hydrocarbons (PAHs). These PAH nucleation mode particles coagulate over their lifetime with themselves and with soot aggregates forming larger aggregates. The analysis of TEM pictures taken after coagulation in the mono-modal state shows that all particles in our experiments consistently display the soot-typical agglomerate morphology, with no statistically significant evidence for the presence of spherical particles in the nucleation mode size (30 nm and larger). Morphological, thermo-optical, and ACSM measurements also show that the semi-volatile organic fraction increases for the different OP points, but the majority of the OC is only volatilised at high temperatures or is pyrolytic carbon and does not indicate the presence of high amounts of condensed organic species. These observations correspond to the results of Mamakos et al. (2013), Maricq (2014), and Török et al. (2018) that indicate that the miniCAST soot contains a significant amount of refractory organic carbon that is not volatilised by a catalytic stripper, a thermodenuder, or a furnace and shows as pyrolytic carbon in the thermo-optical analysis. They propose that this fraction could be identified as less mature soot. At the same time, extractive measurements performed in the present study show that the organic material, or at least a fraction of it, is soluble in common solvents (i.e. acetonitrile) and confirm its absorbing nature, particularly evident for the OC-rich CS5.
The coagulated mono-modal batch soot aerosol is therefore a mixture of two groups of combustion particulate matter with different maturity (EC-rich and OC-rich), both light-absorbing. Changing the proportion of these fractions would explain the differences between the EC-rich mature CS1 and the OC-rich less mature CS5 that is more or less purely organic and made up, based on this interpretation, of a large fraction of less mature soot and a condensed semi-volatile organic fraction.
Mature EC-dominated soot, like the CS1 in the present study, is found in diesel and aircraft (kerosene-type) emissions in the real atmosphere (Ess et al., 2021; Moore et al., 2014; Saffaripour et al., 2017), while less-mature OC-richer combustion particles, like the CS5, are observed with low-temperature diesel combustion (Jung and Bae, 2015; Jiaqiang et al., 2022) and the combustion of low-quality fuels (Corbin et al., 2019).
5.2 Spectral optical properties versus soot composition
The optical properties of soot are found to be influenced by the combustion condition. While the MSC values do not vary significantly between CSs, the MAC values, and therefore also the MEC values, as well as the spectral dependence of absorption (and scattering), vary strongly between fuel-lean conditions (CS1 to CS4) and the fuel-rich condition (CS5), whereas there are limited differences between CS1, CS2, CS3, and CS4.
The spectral dependence of the light absorption and scattering, expressed as the AAE and SAE, varies with the changing fuel, oxidation air, and mixing N2 flows. The change correlates well with the combustion-dependent change in the size, the relative presence of the organic fraction, and thus also the presence of the potentially less mature soot fraction. The AAE slowly increased from close to 1 for the EC-rich and mature-dominated CS1, the value generally associated with pure BC (Bond and Bergstrom, 2006; Moosmüller et al., 2011), up to an AAE close to 4 for the dominantly organic CS5, a value that falls into the range more commonly associated with moderately absorbing BrC (Lack and Cappa, 2010; Moosmüller et al., 2011; Saleh, 2020). This indicates varying absorbing properties in the differently matured soot and likely varying amounts of condensed volatile organic compounds, in agreement with the literature (Mamakos et al., 2013; Maricq, 2014; Török et al., 2018; Malmborg et al., 2021).
Based on these observations we investigated the relationship between the AAE and ratio, similar to Malmborg et al. (2021). In order to supplement our work with additional observations and also compensate for the lack of values for ratios between 0.1 and 0.5, we added data from various studies in the literature that generated soot using propane miniCASTs, from similar combustion systems using ethylene, and from diesel and kerosene experiments (Ess et al., 2021; Moore et al., 2014; Saffaripour et al., 2017). In particular, the work of Ess and Vasilatou (2019) which tested different miniCAST combustion conditions for the miniCAST type 5201 Type BC, provided an extensive set of soot measurements with AAE and ratios. Other literature studies, such as the one by Cheng et al. (2019), provided AAE values against ratios. In this case, the ratios were mathematically adjusted to based on the relationship EC + OC = TC and the assumption that the absolute majority of the soot is carbonaceous, allowing us to use TC as an approximation of the total aerosol mass. Figure 6a shows the AAE values of the soot from our work and the literature plotted against their ratio. The AAE values cover a seemingly continuous spectrum of ratios and show a continuous increase from about 1 (and even lower) for high values to values of 4 and higher at low EC content. These results agree well with observations by Malmborg et al. (2021) and Cheng et al. (2019) (the latter added in grey in Fig. 6), who observed a power-law relation between the AAE and EC/refractory carbon ratio for diesel and miniCAST aerosol and the values for aerosols from the combustion of toluene and benzene, respectively. The key difference between our observations and the ones by Cheng et al. (2019) is found at really low EC content, which is not available in Malmborg et al. (2021). For values of < 20 %, the values observed by Cheng et al. (2019) follow an asymptotic power-law behaviour and continue to increase at high organic carbon content, while our values approach a maximal value, for CS5, with an EC content of effectively zero and are thus not described well by a true power law. While the power-law fit is also able to describe our data under the consideration of the uncertainties, we propose as an alternative an approximation of the trends using the exponential function AAE = . The fit of this function displayed in Fig. 6a is only performed on the propane-combustion-like soot and thus does not include the values by Cheng et al. (2019). This exponential formulation allows us to extrapolate the values for pure EC and OC, which would be 1.05±0.28 ( = 1) and 4.02±0.29 ( = 0) for propane-combustion-like soot. The AAE estimated from the independent extractive measurements (AAE BrCACN in the range 4.8 to 6 (±0.5)) is higher but comparable within uncertainties with the estimated value for pure OC based on the relationship against the particle ratio (4.02).
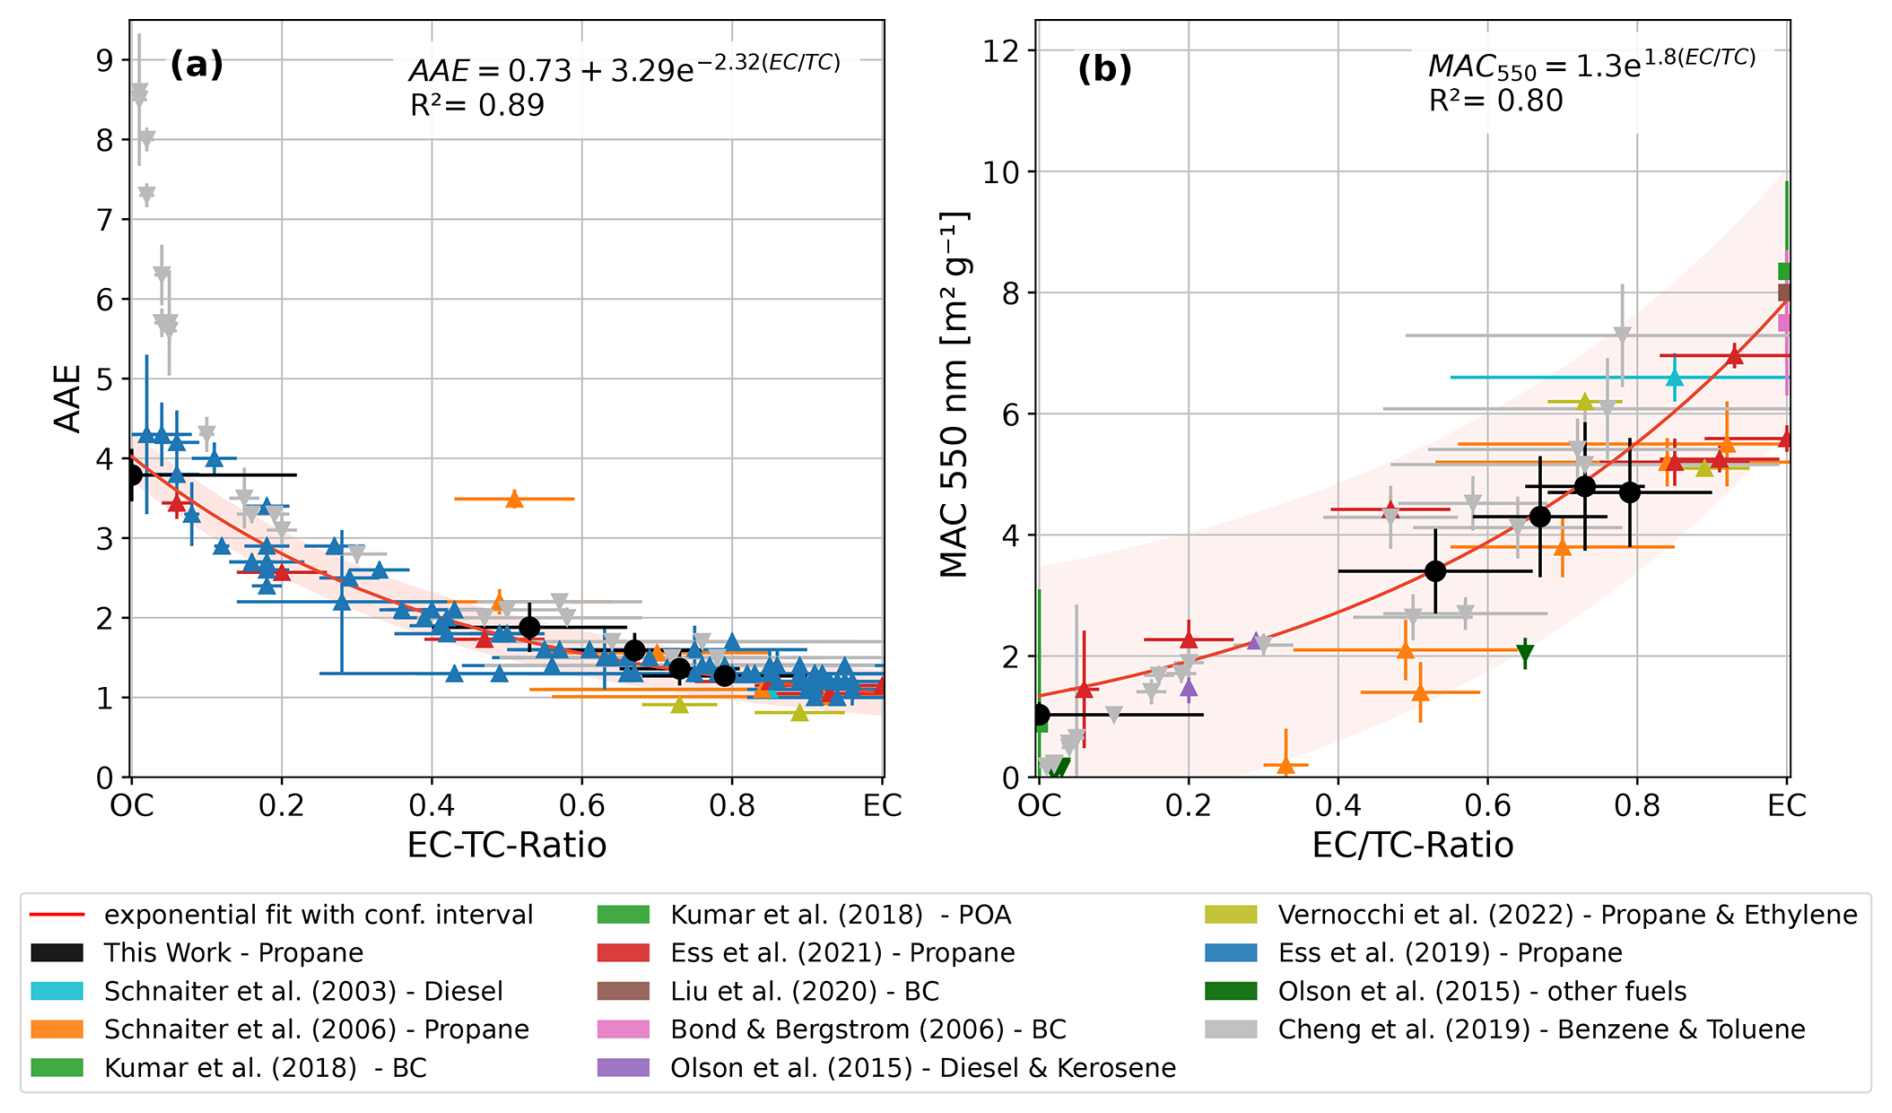
Figure 6Compositional-dependent absorption mass absorption cross sections (MACs, b) and their spectral variability represented by the absorption Ångström exponents (AAEs, a). The MAC data obtained in the present study at 550 nm (black points) are combined with observations from past literature studies and put in relation to the soot content. Data are fitted with the equation . Due to their fuel type, the soot produced in Cheng et al. (2019) (grey) and the other fuels in Olson et al. (2015), as well as values for pure BC and primary organic aerosols (POAs) (Bond and Bergstrom, 2006; Kumar et al., 2018; Liu et al., 2020b), are not considered in the fits. In order to account for error bars in the fit, an arbitrary minimal error of 10−3 was applied for ratios when these were not provided in their respective source studies. Any other uncertainty in the retrieved values was propagated according to the used calculation. The resulting equations for the absorbing properties are provided in Sect. 5.2 and in the Supplement in Table S4.
Cheng et al. (2019) further propose a relationship between the MAC and composition, expressed via the ratio, and so do other works (e.g. Olson et al., 2015; Bocchicchio et al., 2022). The same plot as for the AAE was tested for the MAC at 550 nm. Figure 6b shows the -resolved MAC values at 550 nm supplemented by additional MAC data points from propane, diesel, and kerosene soot from the literature. Literature data include MAC values for both total particle populations and size-selected measurements (e.g. Ess et al., 2021). The values from works not supplying the 550 nm values were extrapolated using the AAE via (where λ is the closest wavelength measured to 550 nm). If the AAE was not directly supplied in the literature works, but multiple MAC values at different wavelengths were provided, those were used to inter- or extrapolate the MAC at 550 nm. The MAC values reported in the literature, expressed alternatively as MACEC, MACrBC, or MACBC, were transformed into MAC MACTC (i.e. against total soot mass as in our calculations) using the approximations EC = rBC = BC, EC + OC = TC, and TC = total mass. The retrieved data points in Fig. 6b again were complemented by MAC data from “other fuels” including the toluene and benzene from Cheng et al. (2019) but also values from Olson et al. (2015), who burned in addition to kerosene and propane also leaf litter, peat, wood pellets, and coal. Data points for pure BC (assuming = 0), as well as MAC values proposed for pure primary organic aerosol (assuming = 1), were added to allow a comparison of the extreme values in the full range of potential values. Similar to the “other fuels” these are not considered when fitting MAC versus . Supplemented with these literature values, we can observe a seemingly continuous spectrum of the MAC values as a function of the ratio. While the MAC values show a larger scattering (compared to the AAE), most data points are well described by an exponential function. Thus we propose that the relationship between MAC and ratio is well described by . The fit-retrieved function again permits the extrapolation of the MAC values for pure EC and OC, which would be 7.9±2.2 m2 g−1 ( = 1) and 1.3±2.2 m2 g−1 ( = 0) at 550 nm, respectively. The extrapolated MAC value is in line with the one proposed by Bond and Bergstrom (2006) (7.5±1.3 m2 g−1) for pure BC and with the more recent literature synthesis by Liu et al. (2020b) (8.0±0.7 m2 g−1) for mature EC-dominated soot. The global models used in AeroCom have an average MAC of 8 m2 g−1 at 550 nm and assume an AAE of 1 (Samset et al., 2018; Sand et al., 2021), values that we confirm for pure BC particles from our analysis.
Similar to the observation on the AAE, the MAC values of alternative fuels (Cheng et al., 2019; Olson et al., 2015) show different behaviour for low EC content. While the MAC values of propane combustion aerosol (this work; Ess et al., 2021) remain high at low values, the MAC values from the “other fuels” decrease towards zero with decreasing values. We conclude that we describe, as Cheng et al. (2019), a relationship between the spectral optical properties (AAE and MAC/MEC) that shows that the optical properties of soot can be displayed on a continuum. However, the agreement between the miniCAST, ethylene, kerosene, and diesel soot and soot from additional sources only works well for larger than 10 %. In cases where the organic fraction dominates the total carbon ( > 90 %) and potentially also dominates the light absorption, we observed differences between the optical properties of propane-generated soot and soot from what we categorised as “other fuels”. Either this is caused by measurement uncertainties/precision or it indicates a potential dependence on the fuel type affecting the nature of the BrC fraction.
An alternative plot relating the MAC and AAE to the, also commonly used, ratio can be found in the Supplement (Fig. S4). For completeness, also plots for the MSC and the SAE versus and are shown in Fig. S5 and S6 despite scattering properties depending primarily on size, and their relation to composition has limited significance.
In this study, we used the controlled environment of the CESAM simulation chamber to acquire further experimental evidence that the changes in soot optical properties with varying BC and BrC content are systematic. A propane diffusion flame was used to generate soot particles under varying combustion conditions with a miniCAST generator. We produced five types of fractal soot aerosols with different degrees of maturity, composed of varying mixtures of EC (BC-like) and OC (BrC-like), and with slightly different size distributions. The soot organic fraction was found to be a combination of refractory organic carbon and condensed semi-volatile organic fraction.
For the five generated soot aerosols, the dependence of the MAC, MSC, MEC, and SSA as well as their spectral variability, represented by the AAE and SAE, on the soot composition was analysed. While the MSC appears independent of the soot type (0.4–0.5 m2 g−1 at 550 nm), all other parameters show a variability associated with the soot and its composition. The MAC (MEC) at 550 nm increases for increasing , with values of 1.0 (1.4) m2 g−1 for = 0.0 and 4.6 (5.1) m2 g−1 for = 0.79. The AAE decreases from 3.79 for = 0.0 to 1.27 for = 0.79. The SSA at 550 nm varies between 0.1 and 0.29 for decreasing . By combining the results from this study for soot from propane combustion with literature data for unprocessed fresh laboratory flame soot using diverse fuels, we identified a generalised exponential relationship between the soot's MAC, its spectral variability AAE, and the soot's content, representing well the variability in absorption in particular for > 15 %–20 %. We support therefore the interpretation that the MAC and AAE of fresh soot aerosols lie in an optical continuum, which mirrors the continuum of , or continuum of graphitisation for soot of varying maturity.
From the exponential fitting, we extrapolate a MAC value of 7.9 m2 g−1 at 550 nm and AAE (375–870 nm) of 1.05 for pure EC (BC-like) and a MAC of 1.3 m2 g−1 and an AAE of 4.02 for pure OC (BrC-like) propane soot. The generalised relations between MAC and AAE and can provide a useful tool for models, where EC is generally used as a proxy for BC, while can be traced from emission inventories. The relationship between and soot absolute absorption efficiency and spectral variability, as provided in this analysis, is also important for monitoring near emission sources or remote sensing applications, in particular, to develop techniques to differentiate the BC-like and BrC-like absorbing components in smoke and pollution plumes. The possibility to have access to compositional information from these observations is a key development to support the representation of absorbing aerosol components in models. Since the presented values however are only retrieved for fresh combustion aerosol, such applications need to consider the variability in the soot aerosol properties in the atmosphere.
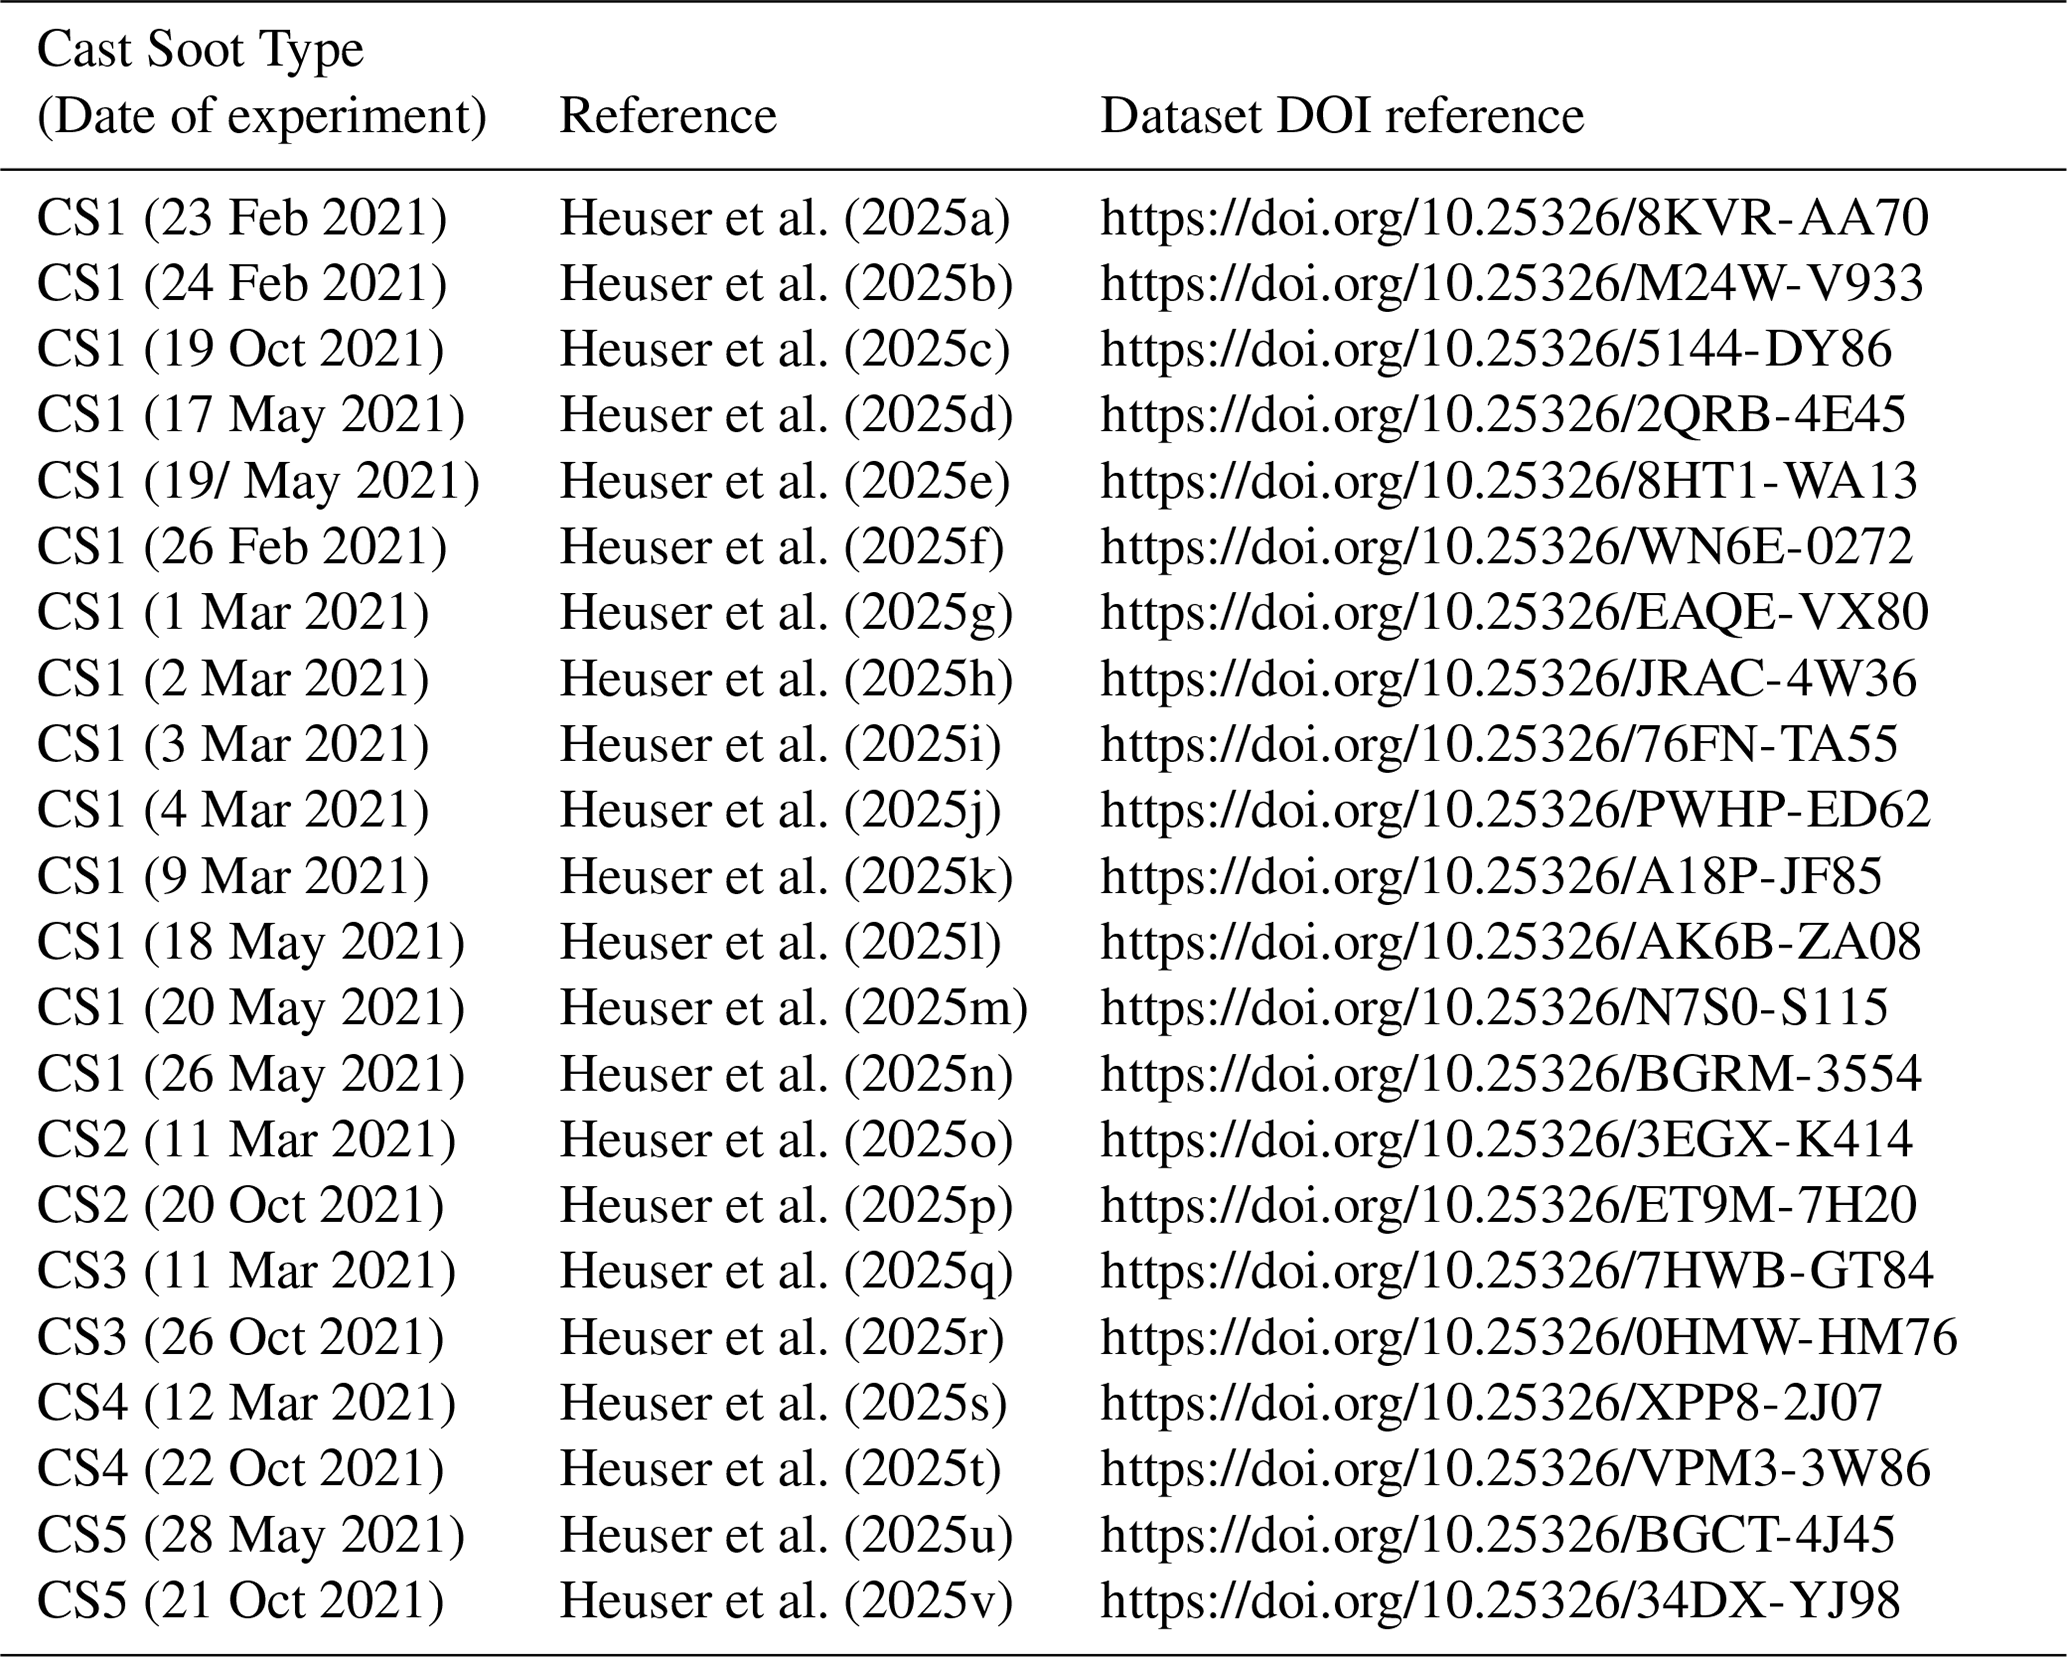
Table A1List of digital object identifiers (DOIs) for the experimental data supporting the findings of this study. Those data are available through the Database of Atmospheric Simulation Chamber Studies (DASCS) of the EUROCHAMP Data Centre (https://data.eurochamp.org/data-access/chamber-experiments, last access: 25 June 2025).
The retrieved MAC, MSC, MEC, and SSA from this study are available within the Library of Advanced Data Products (LADP) of the EUROCHAMP Data Centre (https://data.eurochamp.org/data-access/optical-properties/, last access: 11 June 2025, Heuser et al., 2024a, b, c, d). The CESAM data used in this study are available through the Database of Atmospheric Simulation Chamber Studies (DASCS) of the EUROCHAMP Data Centre (https://data.eurochamp.org/data-access/chamber-experiments/, last access: 11 June 2025) with the identifiers listed in Appendix Table A1.
The supplement related to this article is available online at https://doi.org/10.5194/acp-25-6407-2025-supplement.
CDB and JFD conceived the study. JH, CDB, and JFD designed the experiments and discussed the results. JH conducted the experiments with contributions from CDB, MC, AB, EP, JY, AM, LR, MZ, CY, MM, PF, BPV, and JFD. DM, FM, and VV performed the MWAA measurements. RV and VB performed the PP_UniMI measurements. SC and GN performed the thermo-optical measurements. MM and DF performed transmission microscopy measurements. CDB and SI performed the extractive measurements. HT contributed to funding acquisition and supervision for extractive measurements. JH performed the full data analysis under the supervision of CDB and JFD and with contributions from JY, MZ, CY, LR, AM, MC, DF, DM, VV, and VB. BPV, as PI of the CESAM facility, contributed to full experiment realisation and management. PL provided the SP2 used in the experiments. JY provided the CPMA used in the experiments. BTR and AM provided the MAAP used in the experiments. CDB provided funding acquisition and project administration. JH, CDB, and JFD wrote the manuscript. All authors reviewed and commented on the paper.
The contact author has declared that none of the authors has any competing interests.
Publisher’s note: Copernicus Publications remains neutral with regard to jurisdictional claims made in the text, published maps, institutional affiliations, or any other geographical representation in this paper. While Copernicus Publications makes every effort to include appropriate place names, the final responsibility lies with the authors.
The CNRS-INSU is gratefully acknowledged for supporting the CESAM chamber as a national facility included in the ACTRIS-France Research Infrastructure, as well as AERIS (https://www.aeris-data.fr/, last access: 11 June 2025) for curing and distributing the data through the EUROCHAMP Data Centre (https://data.eurochamp.org/, last access: 11 June 2025). Patrick Ginot is acknowledged for logistic support with SP2 operations. Contributions by Patrick Ausset, Mouad Essani, Paolo Prati, and Masahiro Hayashi to TEM analyses, MWAA, and extractive measurements are gratefully acknowledged. Helpful comments by two anonymous reviewers are gratefully acknowledged.
This study has been supported by the French National Research Agency (ANR) through the B2C project (contract ANR-19-CE01-0024-01) and by the French National program LEFE-CHAT (Les Enveloppes Fluides et l'Environnement – Chimie Atmosphérique) through the BACON project. This work has received funding from the TNA activity of the European Union's Horizon 2020 research and innovation programme through the EUROCHAMP-2020 Infrastructure Activity (grant agreement no. 730997). It has been also supported by DIM Qi2 and Paris Ile-de-France Region. This work has been performed with the support of the Canon Foundation through a Canon Foundation Fellowship to Claudia Di Biagio, Laura Renzi, and Marco Zanatta were partially supported by ITINERIS project (IR0000032), the Italian Integrated Environmental Research Infrastructures System (D.D. no. 130/2022 – CUP B53C22002150006) funded by NextGenerationEU PNRR – Mission 4 “Education and Research”.
This paper was edited by Eija Asmi and reviewed by two anonymous referees.
Anderson, T. L. and Ogren, J. A.: Determining Aerosol Radiative Properties Using the TSI 3563 Integrating Nephelometer, Aerosol Sci. Technol., 29, 57–69, https://doi.org/10.1080/02786829808965551, 1998.
Anderson, T. L., Covert, D. S., Marshall, S. F., Laucks, M. L., Charlson, R. J., Waggoner, A. P., Ogren, J. A., Caldow, R., Holm, R. L., Quant, F. R., Sem, G. J., Wiedensohler, A., Ahlquist, N. A., and Bates, T. S.: Performance Characteristics of a High-Sensitivity, Three-Wavelength, Total Scatter/Backscatter Nephelometer, J. Atmos. Ocean. Technol., 13, 967–986, https://doi.org/10.1175/1520-0426(1996)013<0967:PCOAHS>2.0.CO;2, 1996.
Andreae, M. O. and Gelencsér, A.: Black carbon or brown carbon? The nature of light-absorbing carbonaceous aerosols, Atmos. Chem. Phys., 6, 3131–3148, https://doi.org/10.5194/acp-6-3131-2006, 2006.
Arganda-Carreras, I., Kaynig, V., Rueden, C., Eliceiri, K. W., Schindelin, J., Cardona, A., and Sebastian Seung, H.: Trainable Weka Segmentation: a machine learning tool for microscopy pixel classification, Bioinformatics, 33, 2424–2426, https://doi.org/10.1093/bioinformatics/btx180, 2017.
Baumgardner, D., Popovicheva, O., Allan, J., Bernardoni, V., Cao, J., Cavalli, F., Cozic, J., Diapouli, E., Eleftheriadis, K., Genberg, P. J., Gonzalez, C., Gysel, M., John, A., Kirchstetter, T. W., Kuhlbusch, T. A. J., Laborde, M., Lack, D., Müller, T., Niessner, R., Petzold, A., Piazzalunga, A., Putaud, J. P., Schwarz, J., Sheridan, P., Subramanian, R., Swietlicki, E., Valli, G., Vecchi, R., and Viana, M.: Soot reference materials for instrument calibration and intercomparisons: a workshop summary with recommendations, Atmos. Meas. Tech., 5, 1869–1887, https://doi.org/10.5194/amt-5-1869-2012, 2012.
Bernardoni, V., Valli, G., and Vecchi, R.: Set-up of a multi wavelength polar photometer for off-line absorption coefficient measurements on 1-h resolved aerosol samples, J. Aerosol Sci., 107, 84–93, https://doi.org/10.1016/j.jaerosci.2017.02.009, 2017.
Bescond, A., Yon, J., Ouf, F. X., Ferry, D., Delhaye, D., Gaffié, D., Coppalle, A., and Rozé, C.: Automated Determination of Aggregate Primary Particle Size Distribution by TEM Image Analysis: Application to Soot, Aerosol Sci. Technol., 48, 831–841, https://doi.org/10.1080/02786826.2014.932896, 2014.
Bescond, A., Yon, J., Ouf, F.-X., Rozé, C., Coppalle, A., Parent, P., Ferry, D., and Laffon, C.: Soot optical properties determined by analyzing extinction spectra in the visible near-UV: Toward an optical speciation according to constituents and structure, J. Aerosol Sci., 101, 118–132, https://doi.org/10.1016/j.jaerosci.2016.08.001, 2016.
Bocchicchio, S., Commodo, M., Sgro, L. A., Chiari, M., D'Anna, A., and Minutolo, P.: Thermo-optical-transmission OC/EC and Raman spectroscopy analyses of flame-generated carbonaceous nanoparticles, Fuel, 310, 122308, https://doi.org/10.1016/j.fuel.2021.122308, 2022.
Bond, T. C. and Bergstrom, R. W.: Light Absorption by Carbonaceous Particles: An Investigative Review, Aerosol Sci. Technol., 40, 27–67, https://doi.org/10.1080/02786820500421521, 2006.
Bond, T. C., Doherty, S. J., Fahey, D. W., Forster, P. M., Berntsen, T., DeAngelo, B. J., Flanner, M. G., Ghan, S., Kärcher, B., Koch, D., Kinne, S., Kondo, Y., Quinn, P. K., Sarofim, M. C., Schultz, M. G., Schulz, M., Venkataraman, C., Zhang, H., Zhang, S., Bellouin, N., Guttikunda, S. K., Hopke, P. K., Jacobson, M. Z., Kaiser, J. W., Klimont, Z., Lohmann, U., Schwarz, J. P., Shindell, D., Storelvmo, T., Warren, S. G., and Zender, C. S.: Bounding the role of black carbon in the climate system: A scientific assessment: BLACK CARBON IN THE CLIMATE SYSTEM, J. Geophys. Res.-Atmos., 118, 5380–5552, https://doi.org/10.1002/jgrd.50171, 2013.
Caponi, L., Formenti, P., Massabó, D., Di Biagio, C., Cazaunau, M., Pangui, E., Chevaillier, S., Landrot, G., Andreae, M. O., Kandler, K., Piketh, S., Saeed, T., Seibert, D., Williams, E., Balkanski, Y., Prati, P., and Doussin, J.-F.: Spectral- and size-resolved mass absorption efficiency of mineral dust aerosols in the shortwave spectrum: a simulation chamber study, Atmos. Chem. Phys., 17, 7175–7191, https://doi.org/10.5194/acp-17-7175-2017, 2017.
Cavalli, F., Viana, M., Yttri, K. E., Genberg, J., and Putaud, J.-P.: Toward a standardised thermal-optical protocol for measuring atmospheric organic and elemental carbon: the EUSAAR protocol, Atmos. Meas. Tech., 3, 79–89, https://doi.org/10.5194/amt-3-79-2010, 2010.
Chen, Y. and Bond, T. C.: Light absorption by organic carbon from wood combustion, Atmos. Chem. Phys., 10, 1773–1787, https://doi.org/10.5194/acp-10-1773-2010, 2010.
Cheng, Z., Atwi, K., Onyima, T., and Saleh, R.: Investigating the dependence of light-absorption properties of combustion carbonaceous aerosols on combustion conditions, Aerosol Sci. Technol., 53, 419–434, https://doi.org/10.1080/02786826.2019.1566593, 2019.
Colbeck, I., Appleby, L., Hardman, E. J., and Harrison, R. M.: The optical properties and morphology of cloud-processed carbonaceous smoke, J. Aerosol Sci., 21, 527–538, https://doi.org/10.1016/0021-8502(90)90129-L, 1990.
Corbin, J. C., Czech, H., Massabò, D., De Mongeot, F. B., Jakobi, G., Liu, F., Lobo, P., Mennucci, C., Mensah, A. A., Orasche, J., Pieber, S. M., Prévôt, A. S. H., Stengel, B., Tay, L.-L., Zanatta, M., Zimmermann, R., El Haddad, I., and Gysel, M.: Infrared-absorbing carbonaceous tar can dominate light absorption by marine-engine exhaust, Npj Clim. Atmos. Sci., 2, 12, https://doi.org/10.1038/s41612-019-0069-5, 2019.
Dastanpour, R. and Rogak, S. N.: Observations of a Correlation Between Primary Particle and Aggregate Size for Soot Particles, Aerosol Sci. Technol., 48, 1043–1049, https://doi.org/10.1080/02786826.2014.955565, 2014.
De Haan, D. O., Hawkins, L. N., Welsh, H. G., Pednekar, R., Casar, J. R., Pennington, E. A., De Loera, A., Jimenez, N. G., Symons, M. A., Zauscher, M., Pajunoja, A., Caponi, L., Cazaunau, M., Formenti, P., Gratien, A., Pangui, E., and Doussin, J.-F.: Brown Carbon Production in Ammonium- or Amine-Containing Aerosol Particles by Reactive Uptake of Methylglyoxal and Photolytic Cloud Cycling, Environ. Sci. Technol., 51, 7458–7466, https://doi.org/10.1021/acs.est.7b00159, 2017.
De Haan, D. O., Hawkins, L. N., Wickremasinghe, P. D., Andretta, A. D., Dignum, J. R., De Haan, A. C., Welsh, H. G., Pennington, E. A., Cui, T., Surratt, J. D., Cazaunau, M., Pangui, E., and Doussin, J.-F.: Brown Carbon from Photo-Oxidation of Glyoxal and SO2 in Aqueous Aerosol, ACS Earth Space Chem., 7, 1131–1140, https://doi.org/10.1021/acsearthspacechem.3c00035, 2023.
Denjean, C., Formenti, P., Picquet-Varrault, B., Katrib, Y., Pangui, E., Zapf, P., and Doussin, J. F.: A new experimental approach to study the hygroscopic and optical properties of aerosols: application to ammonium sulfate particles, Atmos. Meas. Tech., 7, 183–197, https://doi.org/10.5194/amt-7-183-2014, 2014.
Denjean, C., Formenti, P., Picquet-Varrault, B., Pangui, E., Zapf, P., Katrib, Y., Giorio, C., Tapparo, A., Monod, A., Temime-Roussel, B., Decorse, P., Mangeney, C., and Doussin, J. F.: Relating hygroscopicity and optical properties to chemical composition and structure of secondary organic aerosol particles generated from the ozonolysis of α-pinene, Atmos. Chem. Phys., 15, 3339–3358, https://doi.org/10.5194/acp-15-3339-2015, 2015.
Di Biagio, C., Formenti, P., Styler, S. A., Pangui, E., and Doussin, J. -F.: Laboratory chamber measurements of the longwave extinction spectra and complex refractive indices of African and Asian mineral dusts, Geophys. Res. Lett., 41, 6289–6297, https://doi.org/10.1002/2014GL060213, 2014.
Di Biagio, C., Formenti, P., Balkanski, Y., Caponi, L., Cazaunau, M., Pangui, E., Journet, E., Nowak, S., Caquineau, S., Andreae, M. O., Kandler, K., Saeed, T., Piketh, S., Seibert, D., Williams, E., and Doussin, J.-F.: Global scale variability of the mineral dust long-wave refractive index: a new dataset of in situ measurements for climate modeling and remote sensing, Atmos. Chem. Phys., 17, 1901–1929, https://doi.org/10.5194/acp-17-1901-2017, 2017.
Di Biagio, C., Formenti, P., Balkanski, Y., Caponi, L., Cazaunau, M., Pangui, E., Journet, E., Nowak, S., Andreae, M. O., Kandler, K., Saeed, T., Piketh, S., Seibert, D., Williams, E., and Doussin, J.-F.: Complex refractive indices and single-scattering albedo of global dust aerosols in the shortwave spectrum and relationship to size and iron content, Atmos. Chem. Phys., 19, 15503–15531, https://doi.org/10.5194/acp-19-15503-2019, 2019.
Durdina, L., Brem, B. T., Abegglen, M., Lobo, P., Rindlisbacher, T., Thomson, K. A., Smallwood, G. J., Hagen, D. E., Sierau, B., and Wang, J.: Determination of PM mass emissions from an aircraft turbine engine using particle effective density, Atmos. Environ., 99, 500–507, https://doi.org/10.1016/j.atmosenv.2014.10.018, 2014.
Ess, M. N. and Vasilatou, K.: Characterization of a new miniCAST with diffusion flame and premixed flame options: Generation of particles with high EC content in the size range 30 nm to 200 nm, Aerosol Sci. Technol., 53, 29–44, https://doi.org/10.1080/02786826.2018.1536818, 2019.
Ess, M. N., Bertò, M., Irwin, M., Modini, R. L., Gysel-Beer, M., and Vasilatou, K.: Optical and morphological properties of soot particles generated by the miniCAST 5201 BC generator, Aerosol Sci. Technol., 55, 1–25, https://doi.org/10.1080/02786826.2021.1901847, 2021.
Forrest, S. R. and Witten, T. A.: Long-range correlations in smoke-particle aggregates, J. Phys. Math. Gen., 12, L109–L117, https://doi.org/10.1088/0305-4470/12/5/008, 1979.
Gysel, M., Laborde, M., Olfert, J. S., Subramanian, R., and Gröhn, A. J.: Effective density of Aquadag and fullerene soot black carbon reference materials used for SP2 calibration, Atmos. Meas. Tech., 4, 2851–2858, https://doi.org/10.5194/amt-4-2851-2011, 2011.
Haynes, B. S. and Wagner, H. Gg.: Soot formation, Prog. Energy Combust. Sci., 7, 229–273, https://doi.org/10.1016/0360-1285(81)90001-0, 1981.
Heuser, J., Di Biagio, C., Yon, J., Cazaunau, M., Berge, A., Pangui, E., Zanatta, M., Renzi, L., Marinoni, A., Inomata, S., Yu, C., Bernardoni, V., Chevallier, S., Ferry, D., Laj, P., Maille, M., Massabo, D., Mazzei, F., Noyalet, G., Tanimoto, H., Temime-Roussel, B., Vecchi, R., Vernocchi, V., Formenti, P., Picquet-Varrault, B., and Doussin, J.-F.: Mass absorption coefficient: Soot from miniCAST 6204 Type C soot Generator – 19.5:881.7 nm (size) – 450:630 nm (wavelength) (1.0), AERIS [data set], https://doi.org/10.25326/ANVB-RN96, 2024a (data available at: https://data.eurochamp.org/data-access/optical-properties/, last access: 11 June 2025).
Heuser, J., Di Biagio, C., Yon, J., Cazaunau, M., Berge, A., Pangui, E., Zanatta, M., Renzi, L., Marinoni, A., Inomata, S., Yu, C., Bernardoni, V., Chevallier, S., Ferry, D., Laj, P., Maille, M., Massabo, D., Mazzei, F., Noyalet, G., Tanimoto, H., Temime-Roussel, B., Vecchi, R., Vernocchi, V., Formenti, P., Picquet-Varrault, B., and Doussin, J.-F.: Mass extinction coefficient: Soot from miniCAST 6204 Type C soot Generator – 19.5:881.7 nm (size) – 450:630 nm (wavelength) (1.0), AERIS [data set], https://doi.org/10.25326/PZ7X-KZ31, 2024b (data available at: https://data.eurochamp.org/data-access/optical-properties/, last access: 11 June 2025).
Heuser, J., Di Biagio, C., Yon, J., Cazaunau, M., Berge, A., Pangui, E., Zanatta, M., Renzi, L., Marinoni, A., Inomata, S., Yu, C., Bernardoni, V., Chevallier, S., Ferry, D., Laj, P., Maille, M., Massabo, D., Mazzei, F., Noyalet, G., Tanimoto, H., Temime-Roussel, B., Vecchi, R., Vernocchi, V., Formenti, P., Picquet-Varrault, B., and Doussin, J.-F.: Mass scattering coefficient: Soot from miniCAST 6204 Type C soot Generator – 19.5:881.7 nm (size) – 450:630 nm (wavelength) (1.0), AERIS [data set], https://doi.org/10.25326/G6VD-PY49, 2024c (data available at: https://data.eurochamp.org/data-access/optical-properties/, last access: 11 June 2025).
Heuser, J., Di Biagio, C., Yon, J., Cazaunau, M., Berge, A., Pangui, E., Zanatta, M., Renzi, L., Marinoni, A., Inomata, S., Yu, C., Bernardoni, V., Chevallier, S., Ferry, D., Laj, P., Maille, M., Massabo, D., Mazzei, F., Noyalet, G., Tanimoto, H., Temime-Roussel, B., Vecchi, R., Vernocchi, V., Formenti, P., Picquet-Varrault, B., and Doussin, J.-F.: Single scattering albedo: Soot from miniCAST 6204 Type C soot Generator – 19.5:881.7 nm (size) – 450:630 nm (wavelength) (1.0), AERIS [data set], https://doi.org/10.25326/KJ5Q-6C88, 2024d (data available at: https://data.eurochamp.org/data-access/optical-properties/, last access: 11 June 2025).
Heuser, J., Di Biagio, C., Cazaunau, M., Berge, A., Pangui, E., Yon, J., Zanatta, M., Renzi, L., Marinoni, A., Laj, P., Temime-Roussel, B., Formenti, P., Picquet-Varrault, B., and Doussin, J.-F.: Atmospheric simulation chamber study: Soot + None – Aerosol study – optical properties – 2021-02-23 (1.1), AERIS [data set], https://doi.org/10.25326/8KVR-AA70, 2025a.
Heuser, J., Di Biagio, C., Cazaunau, M., Berge, A., Pangui, E., Yon, J., Zanatta, M., Renzi, L., Marinoni, A., Laj, P., Temime-Roussel, B., Formenti, P., Picquet-Varrault, B., and Doussin, J.-F.: Atmospheric simulation chamber study: Soot + None – Aerosol study – optical properties – 2021-02-24 (1.1), AERIS [data set], https://doi.org/10.25326/M24W-V933, 2025b.
Heuser, J., Di Biagio, C., Cazaunau, M., Berge, A., Pangui, E., Formenti, P., Picquet-Varrault, B., and Doussin, J.-F.: Atmospheric simulation chamber study: Soot + None – Aerosol study – optical properties – 2021-10-19 (1.1), AERIS [data set], https://doi.org/10.25326/5144-DY86, 2025c.
Heuser, J., Di Biagio, C., Cazaunau, M., Berge, A., Pangui, E., Yon, J., Zanatta, M., Renzi, L., Marinoni, A., Laj, P., Formenti, P., Picquet-Varrault, B., and Doussin, J.-F.: Atmospheric simulation chamber study: Soot + None – Aerosol study – optical properties – 2021-05-17 (1.1), AERIS [data set], https://doi.org/10.25326/2QRB-4E45, 2025d.
Heuser, J., Di Biagio, C., Cazaunau, M., Berge, A., Pangui, E., Yon, J., Zanatta, M., Renzi, L., Marinoni, A., Laj, P., Formenti, P., Picquet-Varrault, B., and Doussin, J.-F.: Atmospheric simulation chamber study: Soot + None – Aerosol study – optical properties – 2021-05-19 (1.1), AERIS [data set], https://doi.org/10.25326/8HT1-WA13, 2025e.
Heuser, J., Di Biagio, C., Cazaunau, M., Berge, A., Pangui, E., Yon, J., Zanatta, M., Renzi, L., Marinoni, A., Laj, P., Temime-Roussel, B., Formenti, P., Picquet-Varrault, B., and Doussin, J.-F.: Atmospheric simulation chamber study: Soot + None – Aerosol study – optical properties – 2021-02-26 (1.1), AERIS [data set], https://doi.org/10.25326/WN6E-0272, 2025f.
Heuser, J., Di Biagio, C., Cazaunau, M., Berge, A., Pangui, E., Yon, J., Zanatta, M., Renzi, L., Marinoni, A., Laj, P., Temime-Roussel, B., Formenti, P., Picquet-Varrault, B., and Doussin, J.-F.: Atmospheric simulation chamber study: Soot + None – Aerosol study – optical properties – 2021-03-01 (1.1), AERIS [data set], https://doi.org/10.25326/EAQE-VX80, 2025g.
Heuser, J., Di Biagio, C., Cazaunau, M., Berge, A., Pangui, E., Yon, J., Zanatta, M., Renzi, L., Marinoni, A., Laj, P., Temime-Roussel, B., Formenti, P., Picquet-Varrault, B., and Doussin, J.-F.: Atmospheric simulation chamber study: Soot + O3 – Aerosol study – optical properties – 2021-03-02 (1.1), AERIS [data set], https://doi.org/10.25326/JRAC-4W36, 2025h.
Heuser, J., Di Biagio, C., Cazaunau, M., Berge, A., Pangui, E., Yon, J., Zanatta, M., Renzi, L., Marinoni, A., Laj, P., Temime-Roussel, B., Formenti, P., Picquet-Varrault, B., and Doussin, J.-F.: Atmospheric simulation chamber study: Soot + sulfuric acid + None – Aerosol study – optical properties – 2021-03-03 (1.1), AERIS [data set], https://doi.org/10.25326/76FN-TA55, 2025i.
Heuser, J., Di Biagio, C., Cazaunau, M., Berge, A., Pangui, E., Yon, J., Zanatta, M., Renzi, L., Marinoni, A., Laj, P., Temime-Roussel, B., Formenti, P., Picquet-Varrault, B., and Doussin, J.-F.: Atmospheric simulation chamber study: Soot + sulfuric acid + O3 – Aerosol study – optical properties – 2021-03-04 (1.1), AERIS [data set], https://doi.org/10.25326/PWHP-ED62, 2025j.
Heuser, J., Di Biagio, C., Cazaunau, M., Berge, A., Pangui, E., Yon, J., Zanatta, M., Renzi, L., Marinoni, A., Laj, P., Temime-Roussel, B., Formenti, P., Picquet-Varrault, B., and Doussin, J.-F.: Atmospheric simulation chamber study: Soot + sulfuric acid + O3 – Aerosol study – optical properties – 2021-03-09 (1.3), AERIS [data set], https://doi.org/10.25326/A18P-JF85, 2025k.
Heuser, J., Di Biagio, C., Cazaunau, M., Berge, A., Pangui, E., Yon, J., Zanatta, M., Renzi, L., Marinoni, A., Laj, P., Formenti, P., Picquet-Varrault, B., and Doussin, J.-F.: Atmospheric simulation chamber study: Soot + alpha-pinene + O3 – Aerosol study – optical properties – 2021-05-18 (1.1), AERIS [data set], https://doi.org/10.25326/AK6B-ZA08, 2025l.
Heuser, J., Di Biagio, C., Cazaunau, M., Berge, A., Pangui, E., Yon, J., Zanatta, M., Renzi, L., Marinoni, A., Laj, P., Formenti, P., Picquet-Varrault, B., and Doussin, J.-F.: Atmospheric simulation chamber study: Soot + alpha-pinene + O3 – Aerosol study – optical properties – 2021-05-20 (1.1), AERIS [data set], https://doi.org/10.25326/N7S0-S115, 2025m.
Heuser, J., Di Biagio, C., Cazaunau, M., Berge, A., Pangui, E., Yon, J., Zanatta, M., Renzi, L., Marinoni, A., Laj, P., Formenti, P., Picquet-Varrault, B., and Doussin, J.-F.: Atmospheric simulation chamber study: Soot + alpha-pinene + O3 – Aerosol study - optical properties – 2021-05-26 (1.1), AERIS [data set], https://doi.org/10.25326/BGRM-3554, 2025n.
Heuser, J., Di Biagio, C., Cazaunau, M., Berge, A., Pangui, E., Yon, J., Zanatta, M., Renzi, L., Marinoni, A., Laj, P., Temime-Roussel, B., Formenti, P., Picquet-Varrault, B., and Doussin, J.-F.: Atmospheric simulation chamber study: Soot + None – Aerosol study – optical properties – 2021-03-11 (1.1), AERIS [data set], https://doi.org/10.25326/3EGX-K414, 2025o.
Heuser, J., Di Biagio, C., Cazaunau, M., Berge, A., Pangui, E., Formenti, P., Picquet-Varrault, B., and Doussin, J.-F.: Atmospheric simulation chamber study: Soot + None – Aerosol study – optical properties – 2021-10-20 (1.1), AERIS [data set], https://doi.org/10.25326/ET9M-7H20, 2025p.
Heuser, J., Di Biagio, C., Cazaunau, M., Berge, A., Pangui, E., Yon, J., Zanatta, M., Renzi, L., Marinoni, A., Laj, P., Temime-Roussel, B., Formenti, P., Picquet-Varrault, B., and Doussin, J.-F.: Atmospheric simulation chamber study: Soot + None – Aerosol study – optical properties – 2021-03-11 (1.1), AERIS [data set], https://doi.org/10.25326/7HWB-GT84, 2025q.
Heuser, J., Di Biagio, C., Cazaunau, M., Berge, A., Pangui, E., Formenti, P., Picquet-Varrault, B., and Doussin, J.-F.: Atmospheric simulation chamber study: Soot + None – Aerosol study – optical properties – 2021-10-26 (1.1), AERIS [data set], https://doi.org/10.25326/0HMW-HM76, 2025r.
Heuser, J., Di Biagio, C., Cazaunau, M., Berge, A., Pangui, E., Yon, J., Zanatta, M., Renzi, L., Marinoni, A., Laj, P., Temime-Roussel, B., Formenti, P., Picquet-Varrault, B., and Doussin, J.-F.: Atmospheric simulation chamber study: Soot + None – Aerosol study – optical properties – 2021-03-12 (1.1), AERIS [data set], https://doi.org/10.25326/XPP8-2J07, 2025s.
Heuser, J., Di Biagio, C., Cazaunau, M., Berge, A., Pangui, E., Formenti, P., Picquet-Varrault, B., and Doussin, J.-F.: Atmospheric simulation chamber study: Soot + None – Aerosol study – optical properties – 2021-10-22 (1.1), AERIS [data set], https://doi.org/10.25326/VPM3-3W86, 2025t.
Heuser, J., Di Biagio, C., Cazaunau, M., Berge, A., Pangui, E., Yon, J., Zanatta, M., Renzi, L., Marinoni, A., Laj, P., Formenti, P., Picquet-Varrault, B., and Doussin, J.-F.: Atmospheric simulation chamber study: Soot + None – Aerosol study – optical properties – 2021-05-28 (1.1), AERIS [data set], https://doi.org/10.25326/BGCT-4J45, 2025u.
Heuser, J., Di Biagio, C., Cazaunau, M., Berge, A., Pangui, E., Formenti, P., Picquet-Varrault, B., and Doussin, J.-F.: Atmospheric simulation chamber study: Soot + None – Aerosol study – optical properties – 2021-10-21 (1.1), AERIS [data set], https://doi.org/10.25326/34DX-YJ98, 2025v.
Hu, B. and Koylu, U.: Size and Morphology of Soot Particulates Sampled from a Turbulent Nonpremixed Acetylene Flame, Aerosol Sci. Technol., 38, 1009–1018, https://doi.org/10.1080/027868290519111, 2004.
IPCC: Climate Change 2023: Synthesis Report. Contribution of Working Groups I, II and III to the Sixth Assessment Report of the Intergovernmental Panel on Climate Change, edited by: Core Writing Team, Lee, H., and Romero, J., https://doi.org/10.59327/IPCC/AR6-9789291691647, 2023.
Jacobson, M. Z.: Climate response of fossil fuel and biofuel soot, accounting for soot's feedback to snow and sea ice albedo and emissivity, J. Geophys. Res.-Atmos., 109, 2004JD004945, https://doi.org/10.1029/2004JD004945, 2004.
Jiaqiang, E., Xu, W., Ma, Y., Tan, D., Peng, Q., Tan, Y., and Chen, L.: Soot formation mechanism of modern automobile engines and methods of reducing soot emissions: A review, Fuel Process. Technol., 235, 107373, https://doi.org/10.1016/j.fuproc.2022.107373, 2022.
Johansson, K. O., El Gabaly, F., Schrader, P. E., Campbell, M. F., and Michelsen, H. A.: Evolution of maturity levels of the particle surface and bulk during soot growth and oxidation in a flame, Aerosol Sci. Technol., 51, 1333–1344, https://doi.org/10.1080/02786826.2017.1355047, 2017.
Jung, Y. and Bae, C.: Immaturity of soot particles in exhaust gas for low temperature diesel combustion in a direct injection compression ignition engine, Fuel, 161, 312–322, https://doi.org/10.1016/j.fuel.2015.08.068, 2015.
Kasper, G.: Dynamics and Measurement of Smokes. I Size Characterization of Nonspherical Particles, Aerosol Sci. Technol., 1, 187–199, https://doi.org/10.1080/02786828208958587, 1982.
Kebabian, P. L., Robinson, W. A., and Freedman, A.: Optical extinction monitor using cw cavity enhanced detection, Rev. Sci. Instrum., 78, 063102, https://doi.org/10.1063/1.2744223, 2007.
Kelesidis, G. A., Bruun, C. A., and Pratsinis, S. E.: The impact of organic carbon on soot light absorption, Carbon, 172, 742–749, https://doi.org/10.1016/j.carbon.2020.10.032, 2021.
Kirchstetter, T. W., Novakov, T., and Hobbs, P. V.: Evidence that the spectral dependence of light absorption by aerosols is affected by organic carbon, J. Geophys. Res.-Atmos., 109, 2004JD004999, https://doi.org/10.1029/2004JD004999, 2004.
Köylü, Ü. Ö. and Faeth, G. M.: Structure of overfire soot in buoyant turbulent diffusion flames at long residence times, Combust. Flame, 89, 140–156, https://doi.org/10.1016/0010-2180(92)90024-J, 1992.
Kumar, N. K., Corbin, J. C., Bruns, E. A., Massabó, D., Slowik, J. G., Drinovec, L., Močnik, G., Prati, P., Vlachou, A., Baltensperger, U., Gysel, M., El-Haddad, I., and Prévôt, A. S. H.: Production of particulate brown carbon during atmospheric aging of residential wood-burning emissions, Atmos. Chem. Phys., 18, 17843–17861, https://doi.org/10.5194/acp-18-17843-2018, 2018.
Lack, D. A. and Cappa, C. D.: Impact of brown and clear carbon on light absorption enhancement, single scatter albedo and absorption wavelength dependence of black carbon, Atmos. Chem. Phys., 10, 4207–4220, https://doi.org/10.5194/acp-10-4207-2010, 2010.
Lack, D. A., Moosmüller, H., McMeeking, G. R., Chakrabarty, R. K., and Baumgardner, D.: Characterizing elemental, equivalent black, and refractory black carbon aerosol particles: a review of techniques, their limitations and uncertainties, Anal. Bioanal. Chem., 406, 99–122, https://doi.org/10.1007/s00216-013-7402-3, 2014.
Lamkaddam, H., Gratien, A., Pangui, E., Cazaunau, M., Picquet-Varrault, B., and Doussin, J.-F.: High-NOx Photooxidation of n-Dodecane: Temperature Dependence of SOA Formation, Environ. Sci. Technol., 51, 192–201, https://doi.org/10.1021/acs.est.6b03821, 2017.
Lee, K. O., Cole, R., Sekar, R., Choi, M. Y., Kang, J. S., Bae, C. S., and Shin, H. D.: Morphological investigation of the microstructure, dimensions, and fractal geometry of diesel particulates, Proc. Combust. Inst., 29, 647–653, https://doi.org/10.1016/S1540-7489(02)80083-9, 2002.
Liu, D., He, C., Schwarz, J. P., and Wang, X.: Lifecycle of light-absorbing carbonaceous aerosols in the atmosphere, Npj Clim. Atmos. Sci., 3, 40, https://doi.org/10.1038/s41612-020-00145-8, 2020a.
Liu, F., Yon, J., Fuentes, A., Lobo, P., Smallwood, G. J., and Corbin, J. C.: Review of recent literature on the light absorption properties of black carbon: Refractive index, mass absorption cross section, and absorption function, Aerosol Sci. Technol., 54, 33–51, https://doi.org/10.1080/02786826.2019.1676878, 2020b.
Liu, Y., He, G., Chu, B., Ma, Q., and He, H.: Atmospheric heterogeneous reactions on soot: A review, Fundamental Res., 3, 579–591, https://doi.org/10.1016/j.fmre.2022.02.012, 2023.
Malmborg, V., Eriksson, A., Gren, L., Török, S., Shamun, S., Novakovic, M., Zhang, Y., Kook, S., Tunér, M., Bengtsson, P.-E., and Pagels, J.: Characteristics of BrC and BC emissions from controlled diffusion flame and diesel engine combustion, Aerosol Sci. Technol., 55, 769–784, https://doi.org/10.1080/02786826.2021.1896674, 2021.
Mamakos, A., Khalek, I., Giannelli, R., and Spears, M.: Characterization of Combustion Aerosol Produced by a Mini-CAST and Treated in a Catalytic Stripper, Aerosol Sci. Technol., 47, 927–936, https://doi.org/10.1080/02786826.2013.802762, 2013.
Maricq, M. M.: Examining the Relationship Between Black Carbon and Soot in Flames and Engine Exhaust, Aerosol Sci. Technol., 48, 620–629, https://doi.org/10.1080/02786826.2014.904961, 2014.
Maricq, M. M. and Xu, N.: The effective density and fractal dimension of soot particles from premixed flames and motor vehicle exhaust, J. Aerosol Sci., 35, 1251–1274, https://doi.org/10.1016/j.jaerosci.2004.05.002, 2004.
Massabò, D., Bernardoni, V., Bove, M. C., Brunengo, A., Cuccia, E., Piazzalunga, A., Prati, P., Valli, G., and Vecchi, R.: A multi-wavelength optical set-up for the characterization of carbonaceous particulate matter, J. Aerosol Sci., 60, 34–46, https://doi.org/10.1016/j.jaerosci.2013.02.006, 2013.
Massabò, D., Caponi, L., Bernardoni, V., Bove, M. C., Brotto, P., Calzolai, G., Cassola, F., Chiari, M., Fedi, M. E., Fermo, P., Giannoni, M., Lucarelli, F., Nava, S., Piazzalunga, A., Valli, G., Vecchi, R., and Prati, P.: Multi-wavelength optical determination of black and brown carbon in atmospheric aerosols, Atmos. Environ., 108, 1–12, https://doi.org/10.1016/j.atmosenv.2015.02.058, 2015.
Massoli, P., Murphy, D. M., Lack, D. A., Baynard, T., Brock, C. A., and Lovejoy, E. R.: Uncertainty in Light Scattering Measurements by TSI Nephelometer: Results from Laboratory Studies and Implications for Ambient Measurements, Aerosol Sci. Technol., 43, 1064–1074, https://doi.org/10.1080/02786820903156542, 2009.
Massoli, P., Kebabian, P. L., Onasch, T. B., Hills, F. B., and Freedman, A.: Aerosol Light Extinction Measurements by Cavity Attenuated Phase Shift (CAPS) Spectroscopy: Laboratory Validation and Field Deployment of a Compact Aerosol Particle Extinction Monitor, Aerosol Sci. Technol., 44, 428–435, https://doi.org/10.1080/02786821003716599, 2010.
Michelsen, H. A.: Probing soot formation, chemical and physical evolution, and oxidation: A review of in situ diagnostic techniques and needs, Proc. Combust. Inst., 36, 717–735, https://doi.org/10.1016/j.proci.2016.08.027, 2017.
Moore, R. H., Ziemba, L. D., Dutcher, D., Beyersdorf, A. J., Chan, K., Crumeyrolle, S., Raymond, T. M., Thornhill, K. L., Winstead, E. L., and Anderson, B. E.: Mapping the Operation of the Miniature Combustion Aerosol Standard (Mini-CAST) Soot Generator, Aerosol Sci. Technol., 48, 467–479, https://doi.org/10.1080/02786826.2014.890694, 2014.
Moosmüller, H., Chakrabarty, R. K., Ehlers, K. M., and Arnott, W. P.: Absorption Ångström coefficient, brown carbon, and aerosols: basic concepts, bulk matter, and spherical particles, Atmos. Chem. Phys., 11, 1217–1225, https://doi.org/10.5194/acp-11-1217-2011, 2011.
Olfert, J. S. and Collings, N.: New method for particle mass classification – the Couette centrifugal particle mass analyzer, J. Aerosol Sci., 36, 1338–1352, https://doi.org/10.1016/j.jaerosci.2005.03.006, 2005.
Olfert, J. S., Symonds, J. P. R., and Collings, N.: The effective density and fractal dimension of particles emitted from a light-duty diesel vehicle with a diesel oxidation catalyst, J. Aerosol Sci., 38, 69–82, https://doi.org/10.1016/j.jaerosci.2006.10.002, 2007.
Olson, M. R., Victoria Garcia, M., Robinson, M. A., Van Rooy, P., Dietenberger, M. A., Bergin, M., and Schauer, J. J.: Investigation of black and brown carbon multiple-wavelength-dependent light absorption from biomass and fossil fuel combustion source emissions, J. Geophys. Res.-Atmos., 120, 6682–6697, https://doi.org/10.1002/2014JD022970, 2015.
Onasch, T. B., Massoli, P., Kebabian, P. L., Hills, F. B., Bacon, F. W., and Freedman, A.: Single Scattering Albedo Monitor for Airborne Particulates, Aerosol Sci. Technol., 49, 267–279, https://doi.org/10.1080/02786826.2015.1022248, 2015.
Pang, Y., Chen, M., Wang, Y., Chen, X., Teng, X., Kong, S., Zheng, Z., and Li, W.: Morphology and Fractal Dimension of Size-Resolved Soot Particles Emitted From Combustion Sources, J. Geophys. Res.-Atmos., 128, e2022JD037711, https://doi.org/10.1029/2022JD037711, 2023.
Park, K., Cao, F., Kittelson, D. B., and McMurry, P. H.: Relationship between Particle Mass and Mobility for Diesel Exhaust Particles, Environ. Sci. Technol., 37, 577–583, https://doi.org/10.1021/es025960v, 2003.
Park, K., Kittelson, D. B., Zachariah, M. R., and McMurry, P. H.: Measurement of Inherent Material Density of Nanoparticle Agglomerates, J. Nanoparticle Res., 6, 267–272, https://doi.org/10.1023/B:NANO.0000034657.71309.e6, 2004.
Petzold, A. and Schönlinner, M.: Multi-angle absorption photometry – a new method for the measurement of aerosol light absorption and atmospheric black carbon, J. Aerosol Sci., 35, 421–441, https://doi.org/10.1016/j.jaerosci.2003.09.005, 2004.
Petzold, A., Schloesser, H., Sheridan, P. J., Arnott, W. P., Ogren, J. A., and Virkkula, A.: Evaluation of Multiangle Absorption Photometry for Measuring Aerosol Light Absorption, Aerosol Sci. Technol., 39, 40–51, https://doi.org/10.1080/027868290901945, 2005.
Petzold, A., Ogren, J. A., Fiebig, M., Laj, P., Li, S.-M., Baltensperger, U., Holzer-Popp, T., Kinne, S., Pappalardo, G., Sugimoto, N., Wehrli, C., Wiedensohler, A., and Zhang, X.-Y.: Recommendations for reporting ”black carbon” measurements, Atmos. Chem. Phys., 13, 8365–8379, https://doi.org/10.5194/acp-13-8365-2013, 2013.
Rissler, J., Messing, M. E., Malik, A. I., Nilsson, P. T., Nordin, E. Z., Bohgard, M., Sanati, M., and Pagels, J. H.: Effective Density Characterization of Soot Agglomerates from Various Sources and Comparison to Aggregation Theory, Aerosol Sci. Technol., 47, 792–805, https://doi.org/10.1080/02786826.2013.791381, 2013.
Saffaripour, M., Tay, L.-L., Thomson, K. A., Smallwood, G. J., Brem, B. T., Durdina, L., and Johnson, M.: Raman spectroscopy and TEM characterization of solid particulate matter emitted from soot generators and aircraft turbine engines, Aerosol Sci. Technol., 51, 518–531, https://doi.org/10.1080/02786826.2016.1274368, 2017.
Saleh, R.: From Measurements to Models: Toward Accurate Representation of Brown Carbon in Climate Calculations, Curr. Pollut. Rep., 6, 90–104, https://doi.org/10.1007/s40726-020-00139-3, 2020.
Saleh, R., Hennigan, C. J., McMeeking, G. R., Chuang, W. K., Robinson, E. S., Coe, H., Donahue, N. M., and Robinson, A. L.: Absorptivity of brown carbon in fresh and photo-chemically aged biomass-burning emissions, Atmos. Chem. Phys., 13, 7683–7693, https://doi.org/10.5194/acp-13-7683-2013, 2013.
Saleh, R., Robinson, E. S., Tkacik, D. S., Ahern, A. T., Liu, S., Aiken, A. C., Sullivan, R. C., Presto, A. A., Dubey, M. K., Yokelson, R. J., Donahue, N. M., and Robinson, A. L.: Brownness of organics in aerosols from biomass burning linked to their black carbon content, Nat. Geosci., 7, 647–650, https://doi.org/10.1038/ngeo2220, 2014.
Saleh, R., Cheng, Z., and Atwi, K.: The Brown–Black Continuum of Light-Absorbing Combustion Aerosols, Environ. Sci. Technol. Lett., 5, 508–513, https://doi.org/10.1021/acs.estlett.8b00305, 2018.
Samset, B. H., Stjern, C. W., Andrews, E., Kahn, R. A., Myhre, G., Schulz, M., and Schuster, G. L.: Aerosol Absorption: Progress Towards Global and Regional Constraints, Curr. Clim. Change Rep., 4, 65–83, https://doi.org/10.1007/s40641-018-0091-4, 2018.
Sand, M., Samset, B. H., Myhre, G., Gliß, J., Bauer, S. E., Bian, H., Chin, M., Checa-Garcia, R., Ginoux, P., Kipling, Z., Kirkevåg, A., Kokkola, H., Le Sager, P., Lund, M. T., Matsui, H., van Noije, T., Olivié, D. J. L., Remy, S., Schulz, M., Stier, P., Stjern, C. W., Takemura, T., Tsigaridis, K., Tsyro, S. G., and Watson-Parris, D.: Aerosol absorption in global models from AeroCom phase III, Atmos. Chem. Phys., 21, 15929–15947, https://doi.org/10.5194/acp-21-15929-2021, 2021.
Schindelin, J., Arganda-Carreras, I., Frise, E., Kaynig, V., Longair, M., Pietzsch, T., Preibisch, S., Rueden, C., Saalfeld, S., Schmid, B., Tinevez, J.-Y., White, D. J., Hartenstein, V., Eliceiri, K., Tomancak, P., and Cardona, A.: Fiji: an open-source platform for biological-image analysis, Nat. Methods, 9, 676–682, https://doi.org/10.1038/nmeth.2019, 2012.
Schnaiter, M., Horvath, H., Möhler, O., Naumann, K.-H., Saathoff, H., and Schöck, O. W.: UV-VIS-NIR spectral optical properties of soot and soot-containing aerosols, J. Aerosol Sci., 34, 1421–1444, https://doi.org/10.1016/S0021-8502(03)00361-6, 2003.
Schnaiter, M., Gimmler, M., Llamas, I., Linke, C., Jäger, C., and Mutschke, H.: Strong spectral dependence of light absorption by organic carbon particles formed by propane combustion, Atmos. Chem. Phys., 6, 2981–2990, https://doi.org/10.5194/acp-6-2981-2006, 2006.
Schneider, C. A., Rasband, W. S., and Eliceiri, K. W.: NIH Image to ImageJ: 25 years of image analysis, Nat. Methods, 9, 671–675, https://doi.org/10.1038/nmeth.2089, 2012.
Sipkens, T. A., Boies, A., Corbin, J. C., Chakrabarty, R. K., Olfert, J., and Rogak, S. N.: Overview of methods to characterize the mass, size, and morphology of soot, J. Aerosol Sci., 173, 106211, https://doi.org/10.1016/j.jaerosci.2023.106211, 2023.
Smith, O. I.: Fundamentals of soot formation in flames with application to diesel engine particulate emissions, Prog. Energy Combust. Sci., 7, 275–291, https://doi.org/10.1016/0360-1285(81)90002-2, 1981.
Sorensen, C. M.: The Mobility of Fractal Aggregates: A Review, Aerosol Sci. Technol., 45, 765–779, https://doi.org/10.1080/02786826.2011.560909, 2011.
Stephens, M., Turner, N., and Sandberg, J.: Particle identification by laser-induced incandescence in a solid-state laser cavity, Appl. Opt., 42, 3726, https://doi.org/10.1364/AO.42.003726, 2003.
Török, S., Malmborg, V. B., Simonsson, J., Eriksson, A., Martinsson, J., Mannazhi, M., Pagels, J., and Bengtsson, P.-E.: Investigation of the absorption Ångström exponent and its relation to physicochemical properties for mini-CAST soot, Aerosol Sci. Technol., 52, 757–767, https://doi.org/10.1080/02786826.2018.1457767, 2018.
Tree, D. R. and Svensson, K. I.: Soot processes in compression ignition engines, Prog. Energy Combust. Sci., 33, 272–309, https://doi.org/10.1016/j.pecs.2006.03.002, 2007.
Vecchi, R., Bernardoni, V., Paganelli, C., and Valli, G.: A filter-based light-absorption measurement with polar photometer: Effects of sampling artefacts from organic carbon, J. Aerosol Sci., 70, 15–25, https://doi.org/10.1016/j.jaerosci.2013.12.012, 2014.
Vernocchi, V., Brunoldi, M., Danelli, S. G., Parodi, F., Prati, P., and Massabò, D.: Characterization of soot produced by the mini inverted soot generator with an atmospheric simulation chamber, Atmos. Meas. Tech., 15, 2159–2175, https://doi.org/10.5194/amt-15-2159-2022, 2022.
Wang, J., Doussin, J. F., Perrier, S., Perraudin, E., Katrib, Y., Pangui, E., and Picquet-Varrault, B.: Design of a new multi-phase experimental simulation chamber for atmospheric photosmog, aerosol and cloud chemistry research, Atmos. Meas. Tech., 4, 2465–2494, https://doi.org/10.5194/amt-4-2465-2011, 2011.
Wang, Y., Liu, F., He, C., Bi, L., Cheng, T., Wang, Z., Zhang, H., Zhang, X., Shi, Z., and Li, W.: Fractal Dimensions and Mixing Structures of Soot Particles during Atmospheric Processing, Environ. Sci. Technol. Lett., 4, 487–493, https://doi.org/10.1021/acs.estlett.7b00418, 2017.
Wu, J.-S., Krishnan, S. S., and Faeth, G. M.: Refractive Indices at Visible Wavelengths of Soot Emitted From Buoyant Turbulent Diffusion Flames, J. Heat Transf., 119, 230–237, https://doi.org/10.1115/1.2824213, 1997.
Yon, J., Bescond, A., and Ouf, F.-X.: A simple semi-empirical model for effective density measurements of fractal aggregates, J. Aerosol Sci., 87, 28–37, https://doi.org/10.1016/j.jaerosci.2015.05.003, 2015.