the Creative Commons Attribution 4.0 License.
the Creative Commons Attribution 4.0 License.
 | 25 Jun 2025
Determination of the atmospheric volatility of pesticides using Filter Inlet for Gases and AEROsols–chemical ionisation mass spectrometry
Olivia M. Jackson
Aristeidis Voliotis
Thomas J. Bannan
Simon P. O'Meara
Gordon McFiggans
Dave Johnson
Pesticides have been found to be transported through the atmosphere away from fields after application. A key indicator of a pesticide's likelihood to reside in the atmosphere is its vapour pressure. Within this study we evaluate a novel method, the Filter Inlet for Gases and AEROsols (FIGAERO) coupled with a chemical ionisation mass spectrometer, using a set of calibration compounds, polyethylene glycols (PEGs). Two methods of compound delivery onto the filter have been tested: atomisation and syringe deposition. Delivery results are consistent with previous studies, highlighting the lack of suitability of the syringe method. The successful calibration using the atomisation method was then used to determine the vapour pressure of six pesticides. This is the first time particle-phase pesticides have been measured with particle-phase chemical ionisation mass spectrometry (CIMS). The pesticide volatilities were compared with widely accepted standard literature values used in industry, as well as values derived from a common environmental model frequently employed in industrial applications. Results showed that measurements from the FIGAERO-CIMS were consistent with reported literature values for some compounds, while others differed by up to 2 orders of magnitude. Determinations of dicamba, MCPA, and MCPP volatility using the FIGAERO-CIMS showed them to be semi-volatile, in agreement with literature values within 1 order of magnitude. Mesotrione exhibited the largest difference in volatility, with the FIGAERO-CIMS measuring a low volatility of at 298 K (compared to a literature value of ). The difference for 2,4-D of 1 order of magnitude can be explained by the smaller particles deposited on the FIGAERO filter compared to the aerosolised PEG calibration particles, leading to evaporation at higher Tmax values and a lower measured vapour pressure and thus further supporting the conclusion that a calibration using the same particle size is required. The atmospheric implications of the pesticide volatilities are also discussed. A pesticide's volatility is often a key indicator of the likelihood of the potential for short- or long-range transport occurring, thus determining a pesticide's fate in the atmosphere and potential for environmental pollution from transportation in the air.
- Article
(1151 KB) - Full-text XML
-
Supplement
(1094 KB) - BibTeX
- EndNote


Pesticides are a group of compounds whose fate and behaviour in the atmosphere are less well studied and characterised in comparison to soil, surface water, and groundwater environments (Socorro et al., 2016). The Food and Agriculture Organization (FAO), a specialist body of the United Nations, defines pesticides as follows: “Pesticides refer to insecticides, mineral oils, herbicides, fungicides and bactericides, fungicides, plant growth regulators … and any other substance … for preventing, destroying or controlling any pest, including vectors of human or animal disease, unwanted species of plants or animals causing harm during … the production, processing, storage, transport or marketing of food, agricultural commodities … or animal feedstuffs”.
An important subset of pesticides is formulated plant protection products (PPPs) containing the active substance (or ingredient) which may be applied – e.g. sprayed as a water solution or emulsion – onto growing crops at different stages of development of the plant. On application, there is direct exposure of environmental compartments – soil, water, and air – in the vicinity of agricultural activity in e.g. fields and orchards. Pesticides are stringently “regulated” chemicals. In the EU, for example, regulation (EC) no. 1107/2009 specifies requirements and conditions for approval, including that a pesticide “shall have no immediate or delayed harmful effect on human health” and “shall have no unacceptable effects on the environment”. Concerning the latter, the regulation further specifies that consideration should be taken of “(i) its fate and distribution in the environment, particularly contamination of surface waters … groundwater, air and soil, taking into account locations distant from its use following long-range environmental transportation; (ii) its impact on non-target species …; (iii) its impact on biodiversity and the ecosystem”. These regulatory legal requirements must be met, and the safety and risk profile of a pesticide must be deemed acceptable in order for a product to be sold on the market.
Many active substances in pesticides are relatively large molecules (molecular weights of 100 s g mol−1, which is typically large for most atmospheric compounds), with low measured vapour pressures, and as such are commonly considered to be of negligible or low volatility, with a small selection deemed as semi-volatile (as defined by Donahue et al., 2012a). For a small number of pesticide products, airborne transport has been shown to be significant, with observations in the Arctic being measured (albeit with typical concentrations of a few pg m−3) (Balmer et al., 2019). The majority of these products are called “legacy” pesticides – i.e. they are no longer in use – and have been categorised as a persistent organic pollutant (POP) under the Stockholm Convention (UNEP, 2001) and are thus not permitted to be used, but concentrations are still measurable in the Arctic due to previous use, their persistence in the environment (e.g. soil), and often historical overuse. Small concentrations of currently used pesticides (CUPs) have been detected and continue to be monitored at Arctic stations (Kallenborn et al., 2012). In terms of the current EU regulatory context (regulation (EC) no. 1107/2009), pesticide active substances of non-negligible volatility must not have the potential to undergo significant atmospheric transport, defined in terms of an atmospheric half-life of less than 2 d – here atmospheric half-life is defined with respect to OH-radical-initiated (or O3-initiated) oxidation in the gas phase.
Where environmental exposure and risk assessment is well developed for surface water, groundwater, and soil environments – and the organisms and ecosystem services therein – there has been much less focus on the fate and behaviour of pesticides in the atmospheric environment (Brüggemann et al., 2024; Zaller et al., 2022; Butler Ellis et al., 2021; Kruse-Plaß et al., 2021). There is growing interest and activity regarding the measurement of pesticides in air. To properly interpret such data – including the potential for effects on humans, the environment, and agriculture due to significant air-mediated pesticide transport – it is important to understand volatility to assess potential emission into air. Reliable vapour pressure measurements are a key element of this, yet accurate measurements can be technically challenging for semi-volatile chemical compounds or those of low volatility at environmentally relevant temperatures.
Volatility underpins the prediction of how likely it is for a compound to reside in the air. It is then possible for a compound to partition between the gas and atmospheric particulate phases after volatilisation; this, in turn, allows for the estimation of aerosol lifetimes. This, for example, has recently been studied in the case of the active ingredient difenoconazole, which has a measured vapour pressure of ca. at 20 °C (Socorro et al., 2016). This would suggest that if present in air, difenoconazole is predominately expected to be in the particle phase. This is due to the very low vapour pressure of difenoconazole, making it practically involatile and thereby unable to react in the gas phase. This, in turn, allows for the possibility of long-range transport to occur by attaching to particles that, in principle, could be subject to atmospheric transport over significant distances.
Vapour pressure measurements can then be used to determine the volatility of a compound (i.e. how likely it is to be found in the gas phase). The measurement of a pesticide's active substance vapour pressure is a regulatory data requirement, and the measurement can be used as a physicochemical input parameter in regulatory environmental fate models.
Standardised validated methods have been developed to determine the vapour pressure of chemical substances. In the EU, for example, regulatory requirements specify that the vapour pressure of pesticide active substances should be determined in accordance with the OECD method 104 (OECD, 2006); this comprises eight different measurement methods and techniques that may be more or less suitable depending on the test compound, for example, the anticipated vapour pressure or the physical state of the sample. This includes a Knudsen effusion method (Booth et al., 2009) that has previously been demonstrated to be applicable to atmospherically relevant compounds in the temperature range from 15–40 °C. Another common method included in the OECD guideline is the gas saturation method (Widegren et al., 2015). Nevertheless, it is essential to recognise that there is not a single universally applicable approach capable of encompassing all vapour pressures and temperatures, mainly due to the challenges associated with validating vapour pressure measurements. In published pesticide regulatory literature, the specific method may not be stated, and measurements made at higher temperatures are commonly extrapolated to a more environmentally relevant reference temperature, e.g. 20 °C.
Values of vapour pressure (and other environmentally relevant properties) can be found in the University of Hertfordshire Pesticide Properties Database (Lewis et al., 2016).
Furthermore, there is particular difficulty in measuring vapour pressures of many atmospherically relevant compounds. Challenges faced include the requirement of measuring low pressures and the ability to measure at temperatures close to those representative of environmental conditions. Several reviews have previously been presented, in which the breadth of techniques and their subsequent challenges have been discussed in detail (Krieger et al., 2018; Bilde et al., 2015). Other measurement techniques have also been developed, and the vapour pressures of single-compound aerosolised droplets have been measured using electrodynamic balance (EDB) and optical tweezer methods (Davies, 2019; Cai et al., 2015). Most current methods measure volatility by considering single aerosols, but measurements of bulk particles may be important. One such approach is the Filter Inlet for Gases and AEROsols–chemical ionisation mass spectrometry (FIGAERO-CIMS) (Lopez-Hilfiker et al., 2014), in which the compound of interest is delivered onto a filter, which is then flushed with nitrogen and heated through an increasing temperature cycle to volatilise the compound. The volatilised substance is then detected by chemical ionisation mass spectrometry.
Previous volatility literature has commonly concluded that different vapour pressure measurement techniques do not agree, and often data span several orders of magnitude for the same compound (Bilde et al., 2015). This can be explained by the fact that each technique treats a substance differently in terms of pressure, temperature, and the phase state it is measured in, making comparison between different methods challenging and potentially erroneous. To begin mitigating this, a unified reference approach using a range of polyethylene glycol (PEG) () compounds of different chain lengths was proposed and measured with a range of measurement techniques that were then evaluated. The PEG series was chosen since different polymer chain lengths have different vapour pressures, from very volatile to largely involatile, and include the atmospherically relevant fraction (Krieger et al., 2018). Further work has also proposed the FIGAERO-CIMS (Bannan et al., 2019) to characterise the calibration of the PEG series with chain lengths from 1–8, which produced calibration curves in the atmospherically relevant vapour pressure range and provided comparisons to other studies. In this work a compound of interest was syringed onto the FIGAERO filter. However, subsequent work (Ylisirniö et al., 2021) has shown that atomising the compound gives a more uniform dispersion of smaller droplets on the filter, which are consequently evaporated more rapidly than larger syringed droplets, and so volatilisation occurs at lower temperatures than those observed using the syringe method, leading to lower retrieved vapour pressures (Schobesberger et al., 2018).
A pesticide's volatility commonly has C∗ values in the range of 0.3–300 µg m−3, typically classified as semi-volatile organic compounds (SVOCs) (Donahue et al., 2012a, 2006). However, due to the wide range of structures present in different pesticides, some may be characterised as being of lower or higher volatility. A compound with is considered a low-volatility organic compound (LVOC), whilst a compound with C∗ in the range is classified as an intermediate-volatility organic compound (i.e. IVOC) (Donahue et al., 2012b). This provides a basis for estimating whether a compound is likely to be present predominately in the gas or particle phase under atmospheric conditions. The consequence of a pesticide having a higher volatility gives rise to the higher likelihood of a pesticide residing predominantly in the gas phase and thus being less likely to undergo wet or dry deposition than a pesticide of lower volatility in the particle phase.
The object of this work is not to deliver a wide-ranging study of the vapour pressures of many pesticides but rather to select a number of important pesticides based on clear criteria to demonstrate that the experimental approach is a robust one and to compare with currently available literature.
The present study demonstrates a calibration of the standard procedure for the measurement of volatility using the FIGAERO-CIMS technique previously developed by Ylisirniö et al. (2021). This method is then applied to determine the vapour pressure of a set of chosen common pesticides, and the measurements are then compared to regulatory literature and modelled values.
2.1 Chemical ionisation mass spectrometry with FIGAERO
A high-resolution time-of-flight chemical ionisation mass spectrometer (HR-TOF-CIMS) was used with an iodide reagent ion source, a technique which has previously been used for both online and offline analysis of a range of oxidised organic compounds (Yatavelli et al., 2012; Mohr et al., 2013; Voliotis et al., 2021; Bannan et al., 2019).
In order to study the particle phase, the FIGAERO inlet (Lopez-Hilfiker et al., 2014) was used in this study, which allows for simultaneous gas and particle sampling using a dual-inlet system. The gas-phase sampling inlet port allows ambient air directly into the CIMS ion molecule region (IMR), where target molecules react with the iodide ions. The iodide reagent ions were produced by passing methyl iodide (CH3I) and nitrogen (N2) over a 210Po radioactive source (Lee et al., 2014). Simultaneously, atmospheric particles are collected via the aerosol inlet onto a polytetrafluoroethylene (PTFE) filter (Cobetter labs, 25 mm diameter and 2.0 µm pore size). After a period of gas sampling and particle collection, the filter is physically moved so that it is in line with the sampling line into the IMR. In this study only the particle phase is collected. The filter (and any particles on it) is flushed with nitrogen and continuously heated at a rate of 8.75 °C min−1 to a programmed set temperature of 200 °C. This is known as “the ramp”, after which the temperature is held for 30 min using heated N2 gas, known as “the soak”. The heat desorbs the particle-phase compounds from the filter into the vapour phase, depending on their volatility. The compounds are then transported via the nitrogen flow to be measured by the instrument. Analysis is performed by the manufacturer-supplied commercially available data-analysis software package Tofware (v3.2.3) in IGOR Pro, in which the of the analyte compound is selected and the ion count is plotted as a function of temperature to retrieve a thermogram. The temperature at which the peak signal for a given occurs is labelled Tmax for that ion peak, which can be related to the saturation vapour pressure provided that a suitable calibration peak is available to determine empirical constants. The relationship between Tmax and saturated vapour pressure is given by Eq. (2). In this study, poly(ethylene) glycols (PEGs) are used as a set of calibration compounds (Krieger et al., 2018; Bannan et al., 2019).
Two types of delivery of compounds onto the FIGAERO filter for introduction into the instrument were assessed: (1) syringe deposition and (2) atomisation (Ylisirniö et al., 2021; Bannan et al., 2019). The syringe method consists of dissolving the analyte into a volatile solvent (acetonitrile), then syringing 1–5 µL of solution on the PFTE filter. The second method follows the approach by Ylisirniö et al. (2021), which nebulises polydisperse particles of the analyte and solvent (acetonitrile) using an atomiser, with the setup shown in Fig. 1. The atomiser is connected to a 150 L steel drum, through which a flow of 20 L min−1 of compressed air is passed, allowing the solvent to evaporate. The sampling time is dependent on the concentration of particles determined by a scanning mobility particle sizer–condensation particle counter (SMPS-CPC) (Eq. 3). An SMPS-CPC (water based) sampling at 0.6 L min−1 was used to monitor the particle mass concentration in the drum to determine the total particle load. The SMPS was also used to monitor the sized distribution of the atomised particles. Previous work (Ylisirniö et al., 2021) has recommended that, although polydisperse particles may be used in the determination of vapour pressures using FIGAERO, the particle size distribution of the calibration particles should be matched to that of the sampled particles so that the evaporation times are well matched to those of the calibration particles.
Here t=sampling time, mfilter is the mass required on the filter (1 µg), Q is the flow rate in m3 min−1, and cSMPS is the average concentration of particles sampled by the SMPS in µg m−3. To ensure that 1 µg mass was delivered onto the filter during each experiment, the sample time was determined using Eq. (3) by monitoring the SMPS during the course of each experiment. Once sampling has taken place, the FIGAERO temperature ramp can begin. The aim of the present work is to better understand the fate of pesticide substances in the atmosphere; thus, the vapour pressures of several pesticide active substances were investigated. Firstly, a calibration method (Ylisirniö et al., 2021) using a PEG mixture was established. The calibration was then used to determine the vapour pressure of the chosen pesticides.
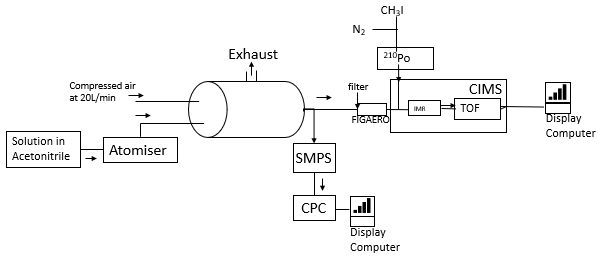
Figure 1Diagram of the atomisation setup used in these experiments using a 150 L spacing drum before introduction into the CIMS instrument for detection and analysis.
2.2 Structure activity relationships (SARs)
Estimation methods are required to predict the vapour pressure of atmospherically relevant compounds and are commonly achieved through equation-based estimation methods. Several reviews have highlighted the complexity and varying degrees of success of these methods (Barley and Mcfiggans, 2010; O'Meara et al., 2014). Structure activity relationship models are commonly used as a first prediction and screening tool for a compound's physiochemical properties (including vapour pressure) and thus environmental fate and behaviour (Dearden, 2003; Leistra, 2011). One such method used in this study is the Nannoolal et al. (2008) method, where the group contribution (dB) and Tr (, where T is the modelling temperature, and Tb is the normal boiling point) are both calculated and input into Eq. (4).
The Nannoolal model was chosen because the vapour pressure observations used as training data for the development of the model included a large number of aromatic compounds, with a wide range of functional groups (O'Meara et al., 2014; Barley and McFiggans, 2010).
The Estimation Program Interface (EPI) suite created by the US Environmental Protection Agency (EPA) is commonly used in industry to predict a compound's vapour pressure and is therefore an important tool to be compared against laboratory observations. Vapour pressure is calculated by inputting the compound structure through a SMILES string description. The software then searches a database to match known values (such as melting point) that are used to predict vapour pressure. The specific method used (within the EPI suite) was the modified grain method (MGM), a modified version of the Grain–Watson (GW) method (Vermeulen, 1991). MGM is commonly used for vapour pressures of solids. In this work, the pesticides are dissolved in acetonitrile before being nebulised, and the solvent then evaporates after aerosol is generated, assuming the remaining particles are in the solid phase.
2.3 Reference compounds
The vapour pressures of PEGs 1–8 () have been measured using multiple techniques, including FIGAERO-CIMS. Previously, liquid samples of one specific PEG of a defined chain length have either been measured individually or weighed out and added into a single solution containing a number of PEGs of different chain lengths. This is expensive and time-consuming. The FIGAERO-CIMS method has the benefit of being able to measure thermograms (and thus vapour pressure) of multiple compounds simultaneously at different values; therefore, analyte solutions can contain multiple compounds, assuming that no interaction occurs between them.
In this work, PEG 400, an analytical standard reference material comprising a mixture of PEGs, was procured from Sigma-Aldrich in order to eliminate the need for the individual solutions. PEG 400 contains a variety of chain length polymer units of poly(ethylene) glycol, with a weighted average molecular weight (Mw) of 400 g mol−1. A single nebulisation of this solution can produce a calibration curve containing polymer chain lengths beyond eight, and vapour pressures of LVOC compounds can thus be determined.
2.4 Selection of study pesticides
Initial screening of pesticides was carried out to ensure that there was a good response on the CIMS of the pesticide using the iodide regent. The iodide reagent ion has previously been found to be sensitive to organic compounds, including those which are highly oxygenated (Ye et al., 2021). Pesticides contain a variety of functional groups and inorganic species depending on their mode of activity (e.g. herbicidal, fungicidal, insecticidal), thus limiting and defining the scope of pesticides available to be studied.
Initial selection of pesticides was based on those previously measured in the literature using CIMS techniques. CIMS has previously been used in both the laboratory and the field to measure gas-phase pesticides, including trifluralin, 2.4-D, and MCPA (see Table 1 for chemical structures) (Murschell et al., 2017; Murschell and Farmer, 2019, 2018). This is the first time particle-phase pesticides have been measured with online particle-phase chemical ionisation mass spectrometry.
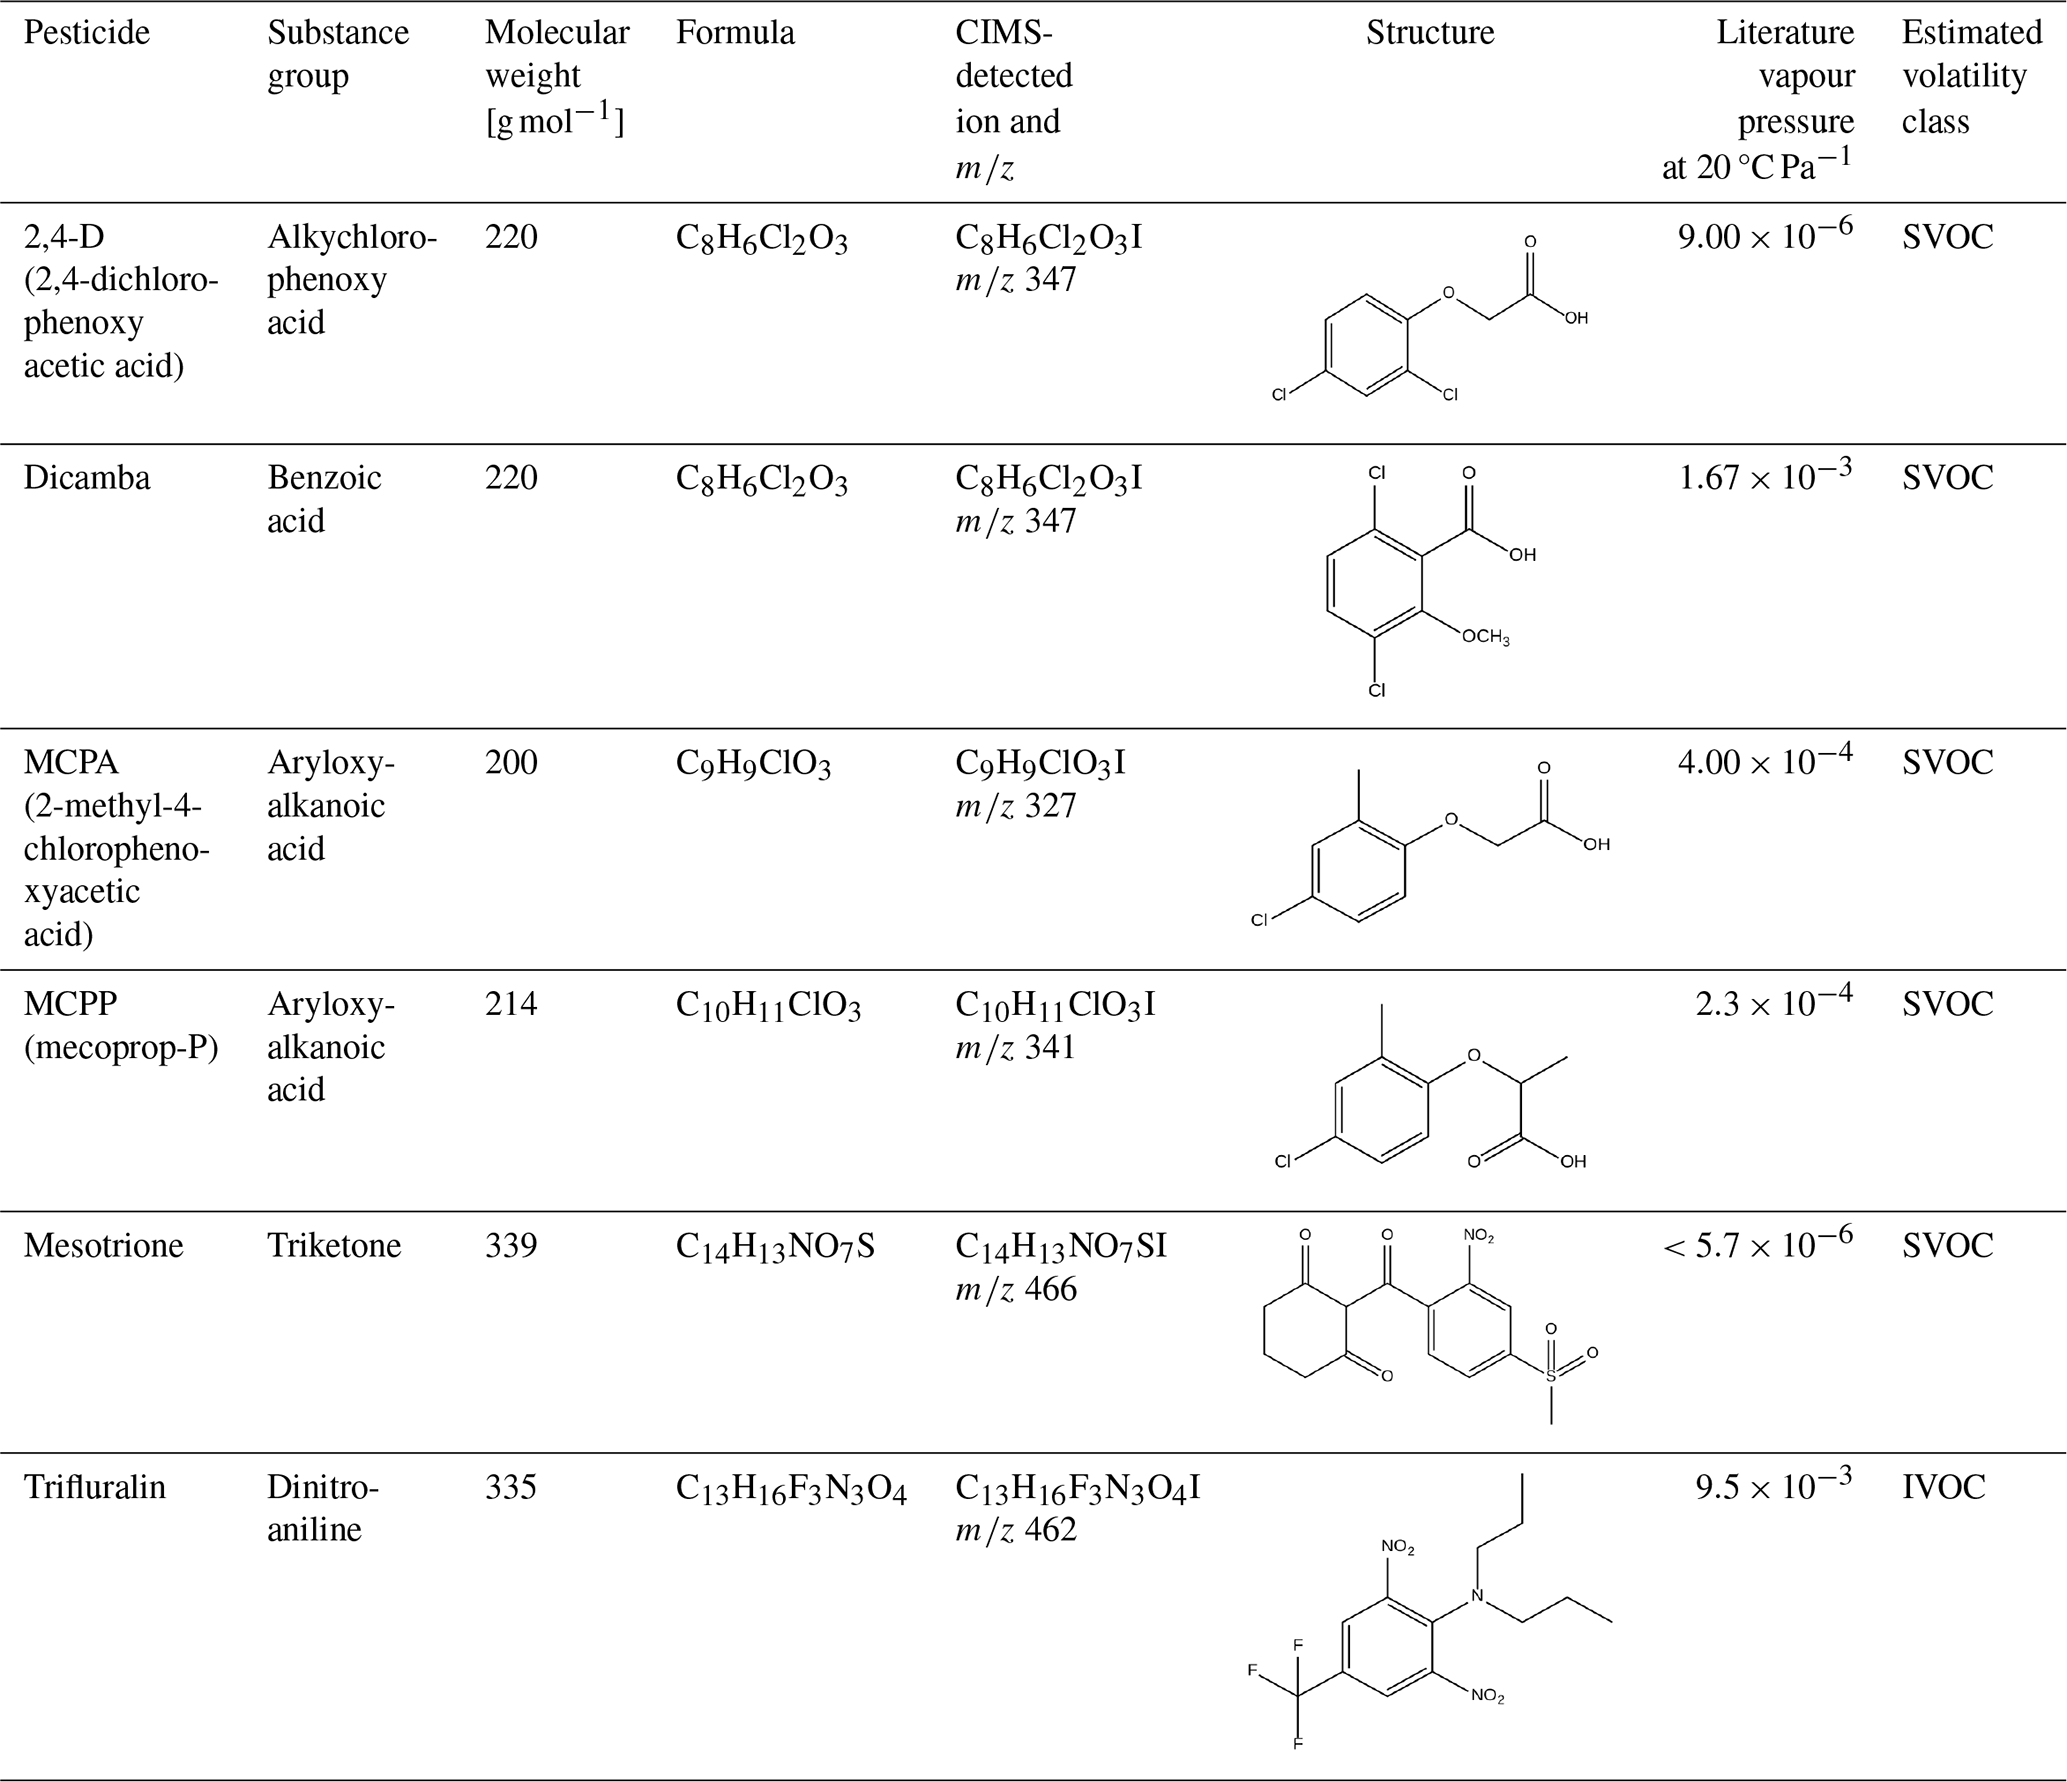
Table 1List of pesticides used in this study (literature vapour pressure values are taken from the University of Hertfordshire Pesticide Property Database; Lewis et al., 2016).
Further selection was made based on the following factors that consider the potential environmental and health impacts associated with pesticides (Jepson et al., 2020). A recent study (Hulin et al., 2021) highlighted 90 substances of potential concern to French populations in the air by categorising pesticides by their use, emission potential, persistence in the air, and chronic toxicity. Previous observations of the pesticide in the environment were also used as selection criteria, suggesting it has the possibility to be a persistent pollutant (Fuhrimann et al., 2020). For example, in the case of dicamba, a commonly used herbicide, reports of off-field drift have been speculated to lead to environmental contamination in the USA due to destruction of crops adjacent to the treated field (Galon et al., 2021) and therefore also motivated inclusion in the present study.
Conversely, it is also important to determine the volatility of pesticides thought to be involatile (i.e. no chance of volatilisation in the atmosphere as EU legislation states that if a pesticide's active ingredient is proven to be sufficiently involatile, then no further atmospheric risk assessment is considered, as the chance of volatilisation is negligible; thus, the environmental and health risks due to atmospheric transport are low (regulation (EC) no. 1107/2009)).
Table 1 shows the six pesticides selected in this study, all of which are pre-emergence herbicides, which specifically target weeds present in the field post-harvest or pre-planting. All six pesticides are still commonly used worldwide. Trifluralin is banned in the EU (but still widely used in the USA and Canada) due to concerns over its toxicity to aquatic organisms (EFSA, 2009; Waldbi, 1998), and previous reports have highlighted concerns relating to volatility – its vapour pressure of classifies it as an IVOC. On the other hand, mesotrione is much less volatile, with a literature vapour pressure of , indicating very low likelihood of appreciable atmospheric transport through volatilisation.
2,4-D, dicamba, MCPA, and MCPP all have similar structures. They contain chlorinated phenyl groups attached to an acid group and thus would be expected to have similar ranges of volatility, with the different structures leading to relatively small differences in their physiochemical properties. Current vapour pressure predictions classify these pesticides as SVOCs. However, it must be noted that in a PPP, 2,4-D may be present in different forms, acid, ester, or salt, in which the ester and salt forms are derivatives of the acid form, which is the active ingredient. The salt form is a strong acid (pKa=3.4; Lewis et al., 2016) and thus highly water soluble and will be present as the acid form in hydrated environments (e.g. when the PPP is mixed with water prior to application or in soil). Here, the vapour pressure is not expected to be impacted. 2,4-D has a reported vapour pressure of at 20 °C (Lewis et al., 2016), which is the same as the acid form. However, for 2,4-D in the ester form (2,4-D-ethylhexyl ester), the vapour pressure has been reported as at 25 °C. In this study the acid form was chosen due to being the actual active species. This is because, upon application, the ester form will cleave at the ester linkage. Hence, the pesticidal active chemical species is the anion of the acid.
3.1 Calibration of the FIGAERO-CIMS vapour pressures using poly(ethylene) glycols and comparisons to previous studies
The FIGAERO-CIMS vapour pressure calibration was determined using poly(ethylene) glycol-400 in acetonitrile by first determining the Tmax of the PEG compounds of various chain lengths (n) from 1–16. Calibrations were performed with both the syringe and the atomisation methods. The raw thermograms from the calibrations (with a normalised ion count) are shown in Fig. 2. It can be seen that Tmax increases with increasing PEG chain lengths. Since the volatility of PEG of a given chain length is well known, a calibration curve can be constructed. Figure 2 also shows the difference in resolution achieved by the syringe and atomisation methods. The atomisation method is unable to resolve PEG lower than C-5 as lower-weight PEGs are too volatile and may evaporate from the aerosolised acetonitrile solution in the drum and are thus not deposited on the filter as particles. A peak in the thermogram is not observed over the measured temperature range. This is not the case for the syringe method, in which the solution is injected in bulk. This observation is backed up by the Gaussian-fitted peaks shown in Fig. S1 in the Supplement (and complementary statistics in Tables S1–3 in the Supplement). Here, a Gaussian fit is performed at the low side of the curve and mirrored (using Tmax as the mirror line), thus assessing the Gaussian shape of the thermogram, which shows how the plot deviates from Gaussian after Tmax and is therefore not impacted by the tail before Tmax. Here, it can be seen that the thermograms in the syringe method exhibit longer tails after the Tmax peak due to the less uniform evaporation off the filter, meaning some of the compound evaporates off the filter at much higher temperatures than Tmax (Schobesberger et al., 2018). Conversely, the thermograms in the atomisation data are more uniform; thus a more representative Tmax can be extracted.
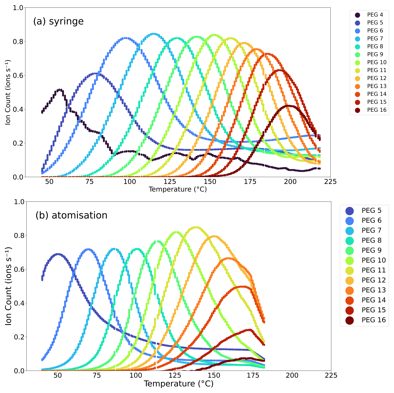
Figure 2Thermograms of the introduction of the PEG 400 calibration solution with normalised ion counts with the (a) syringe method and (b) atomisation method.
Figure 3 shows how the Tmax values vary as a function of PEG chain length for both the syringe and the atomisation injection methods. The values stated are an average of three measurements, with standard deviation presented as error bars. The Tmax of the atomisation values is lower than that of the syringe method, as previously shown by Ylisirniö et al. (2021), who suggested that an increase in concentration on the filter leads to higher Tmax values due to more energy required to evaporate off the filter. For the atomisation method, Eq. (3) was introduced to monitor the time required for the required mass to be deposited on the filter. This varies due to the output of the atomiser and is measured using the SMPS-CPC. Here, the integrated mass over the duration of the sampling period provided the total mass collected.
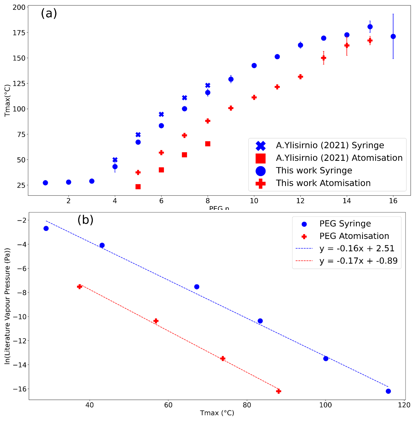
Figure 3(a) Tmax values of PEG of varying chain lengths from this work and also determined by Ylisirniö et al. (2021). Syringe concentrations were 0.1 g L−1 of the PEG mixture, whilst atomisation measurements used sampling of an approximate concentration of 0.5 g L−1. All values from both sets of data came from an average of three measurements. (b) The resulting calibration curves using both methods in this work using literature values from Krieger et al. (2018).
The Tmax values are compared with the literature vapour pressures of the PEG series (Krieger et al., 2018) and are shown in Fig. 3b. Here, the Tmax values from PEGs 3–8 are reported for the syringe method and PEGs 5–8 for the atomisation method, consistent with the available literature values presented by Krieger et al. (2018). As stated by Krieger et al. (2018), this range covers all atmospherically relevant compounds that partition between gas and particle phases. As a result, while we can demonstrate that our approach to determining the Tmax of PEGs with the aerosol method can extend to larger PEGs, we are unable to obtain a vapour pressure curve for these low volatilities at this stage. This analysis also demonstrates that since our thermograms closely resemble Gaussian distributions for PEGs 4–9, our results are representative across the whole range of relevant vapour pressures. Furthermore, vapour pressure values are only possible when injecting with the syringe due to the inability of FIGAERO to measure the smaller, more volatile droplets of PEGs 3 and 4 in the atomisation method due to rapid evaporation of the smaller droplets, whilst beyond PEG 8, the droplets are involatile and thus not atmospherically relevant.
The results are in line with and expand those of Ylisirniö et al. (2021): the Tmax values of the same PEGs derived from the syringe delivery method are substantially higher compared to when the aerosolised delivery method is used. The long evaporation rates observed when using the syringe method mean that the relationship between Tmax and reference volatility is strongly dependent on the size of the syringed droplets and will result in measurement bias unless the conditions of the test substance match those of the calibration compounds very closely. Given the approach is subject to operational uncertainty, we follow the recommendation of Ylisirniö et al. (2021) and use the aerosolisation method to determine pesticide vapour pressures on the basis that the atomisation method has a more robust repeatability and is more similar to atmospheric sampling conditions.
It can be seen in Fig. 3a that there is a slight difference in Tmax values for PEGs 5–8 between the previously reported observations and those in this work, which is most noticeable in the atomisation delivery method. This is explained by the larger particle sizes used in the nebulisation of the calibration particles in this work (mode diameter∼105 nm) compared to the previous work of Ylisirniö et al. (2021), which had a smaller modal diameter of 60 nm. It is therefore not possible to directly compare the calibration curves, but since the particles under investigation in both studies are similar in size to the calibration particles, both calibrations can be effectively applied to the relevant experiments. It is important to recreate the size distribution within the same investigation. To further understand the particle-size-dependent behaviour, previous work (Ylisirniö et al., 2021) explored evaporation times using different sizes of monodispersed particles and showed a small but consistent repeatable effect of particle size on the retrieved Tmax values for a given PEG compound. It was recommended that since the effect was modest, polydisperse particles could be used for both calibrating FIGAERO for vapour pressure and determining the vapour pressure of the sampled aerosol components. However, Ylisirniö et al. (2021) recommend that the size distribution of the calibration particles is matched to that of the sample particles whose vapour pressures are to be determined so that the evaporation rates of the sample material are similar to those of the calibration material, with a similar volatility. In these experiments, the particle distributions were measured with an SMPS to monitor any differences (Fig. 4), where the density of the particles is assumed to be uniform (1000 kg m−1).
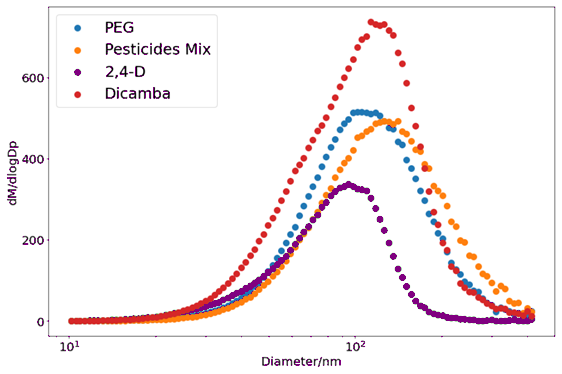
Figure 4Example set of size distributions for all the different solutions measured, taken from the SMPS-CPC measurements during the collection onto the FIGAERO filter, where the pesticide mix includes MCPP, MCPA, mesotrione, and trifluralin dissolved in acetonitrile. 2,4-D and dicamba are measured separately as they appear to have the same in the mass spectrum.
The PEG vapour pressures from this work are shown in Fig. 5 alongside the recommendation (Krieger et al., 2018) used to derive the FIGAERO-CIMS calibrations together with the estimate of uncertainty based on the range of different methods used over the range of PEGs 1–8. The FIGAERO-CIMS data in the overlap region (C5–8) are within the uncertainties of the Krieger et al. (2018) data, which is to be expected as this is the basis for the FIGAERO-CIMS calibration. In addition, a comparison with data from Knudsen effusion mass spectrometer measurements (Booth et al., 2017; Krieger et al., 2018) is also shown to be consistent with our data, though some deviation in the lower vapour pressures is seen, which is likely due to the KEMS being less sensitive to lower-vapour-pressure compounds. The experimental values from the present study significantly extend the range of PEG vapour pressure measurements in the literature to much lower values, with a logarithmic slope extending to vapour pressure measurements as low as 10−10 Pa (PEG 12). Beyond PEG 12 the variability in the data is likely because these compounds are not fully evaporated from the filter at 437 K (200 °C). On the other hand, chain lengths lower than PEG 4 are likely to be mostly predominant in the vapour phase, which is consistent with the observations that they fully evaporate off the filter prior to the beginning of its heating cycle.
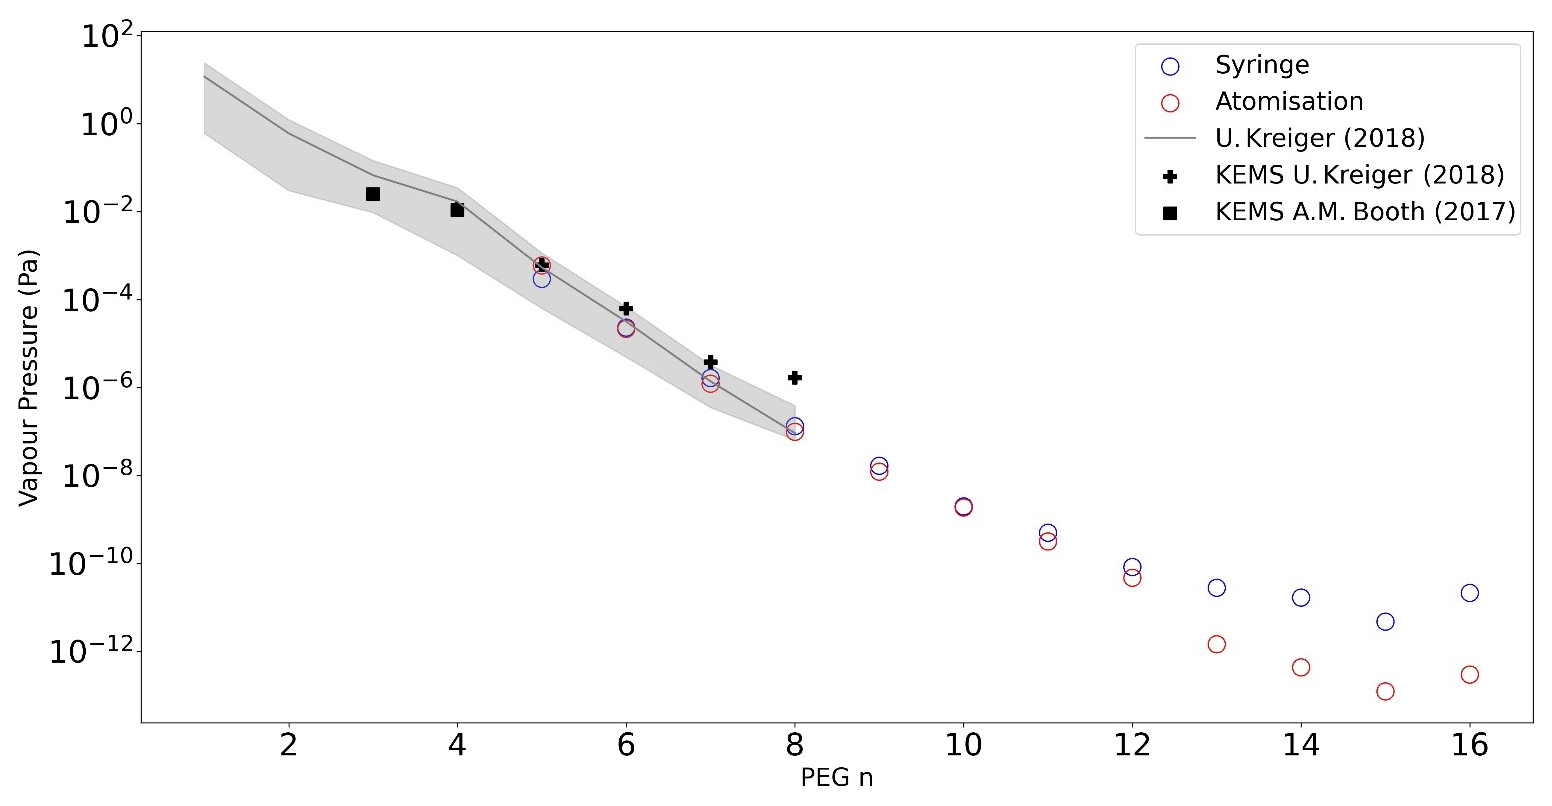
Figure 5Vapour pressures of PEGs 2–16 by PEG number from this work, Krieger et al. (2018), and Booth et al. (2017).
3.2 Determination of the volatility of a range of pesticides by FIGAERO-CIMS and comparison with other approaches
The PEG calibration data presented enabled the determination of the vapour pressure of a set of atmospherically relevant pesticide compounds. In the experiments, mesotrione, MCPA, MCPP, and trifluralin were measured in one solution dissolved in acetonitrile. However, 2,4-D and dicamba both have the same molecular formulae (thus the same parent ion value), making it impossible to separate the thermograms when used in the same solution, and therefore they were measured in separate solutions. Figure 6 (repeated in Fig. S2 in the Supplement) shows the raw thermogram data for each of the six pesticides. As the atomisation method has been demonstrated to be the most appropriate, only data from the atomisation delivery are shown. The tail observed in the trifluralin peak is due to the large concentration of pesticides injected into the mass spectrometer, leading to some residue being present in the IMR, which can then re-evaporate, creating a tail. This is not visible for the other compounds measured as they are of lower volatility, and therefore one would expect them to remain on the walls of the instrument for longer, potentially coming off in the background over time. Additionally, from the fitted Gaussian peaks (Fig. S1), it can be confirmed that the tail does not impact Tmax.
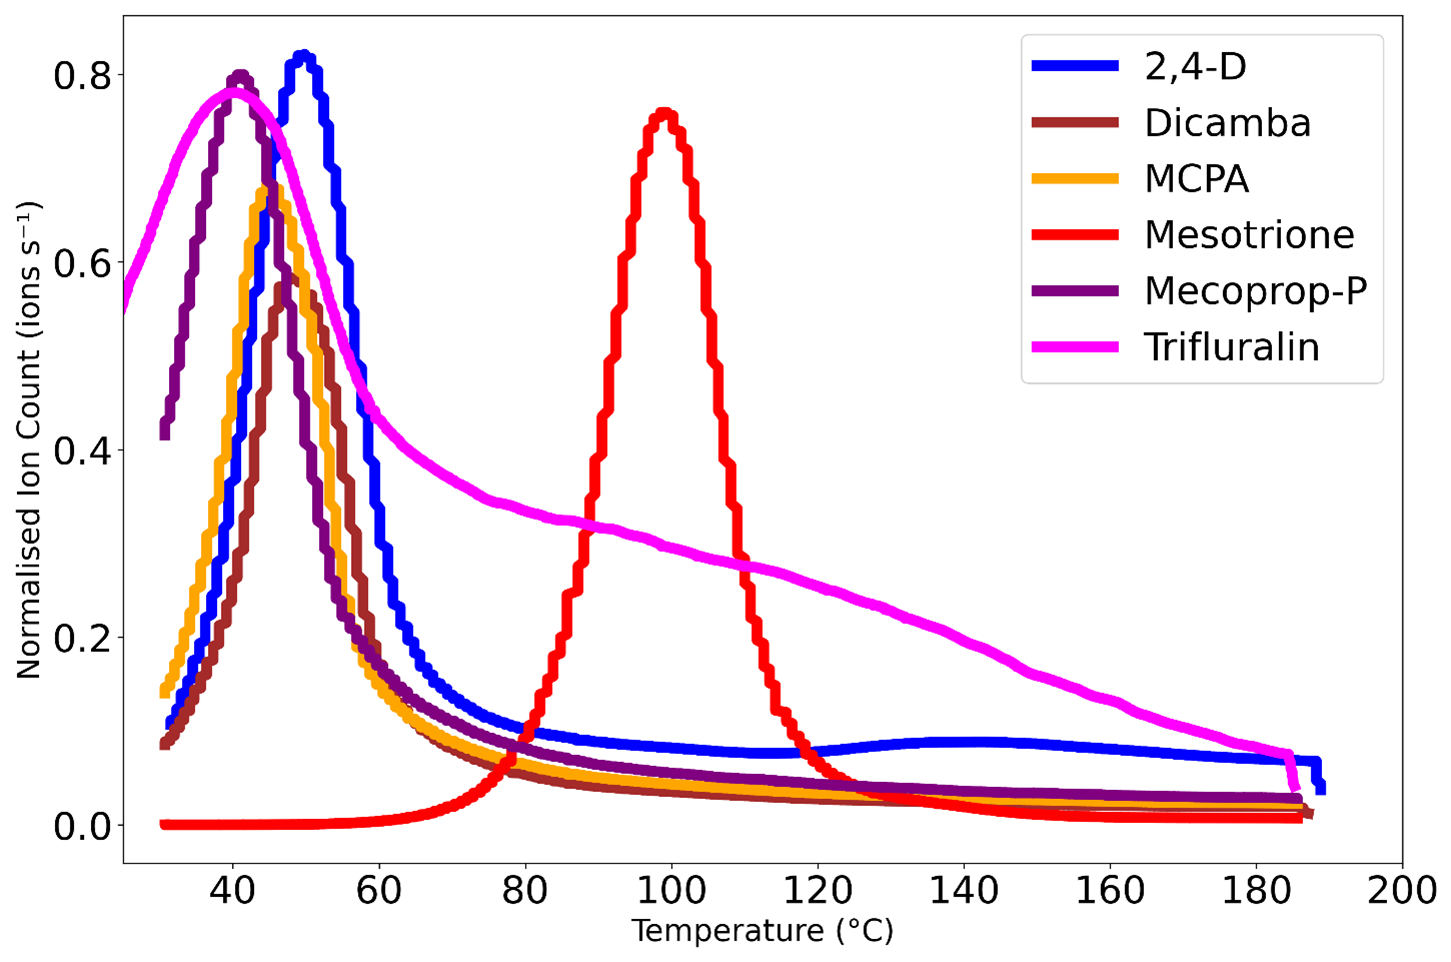
Figure 6Thermograms of the pesticides taken from the heating of the filters of the FIGAERO-CIMS measurements. The filters were collected using the atomisation delivery method, and the thermograms are normalised to 1.
The raw thermograms (Fig. 6) and Eq. (2) were used to calculate the Tmax values presented in Fig. 7, where the highest Tmax was for the least volatile pesticide, mesotrione, and the lowest Tmax was for the most volatile pesticide, trifluralin.
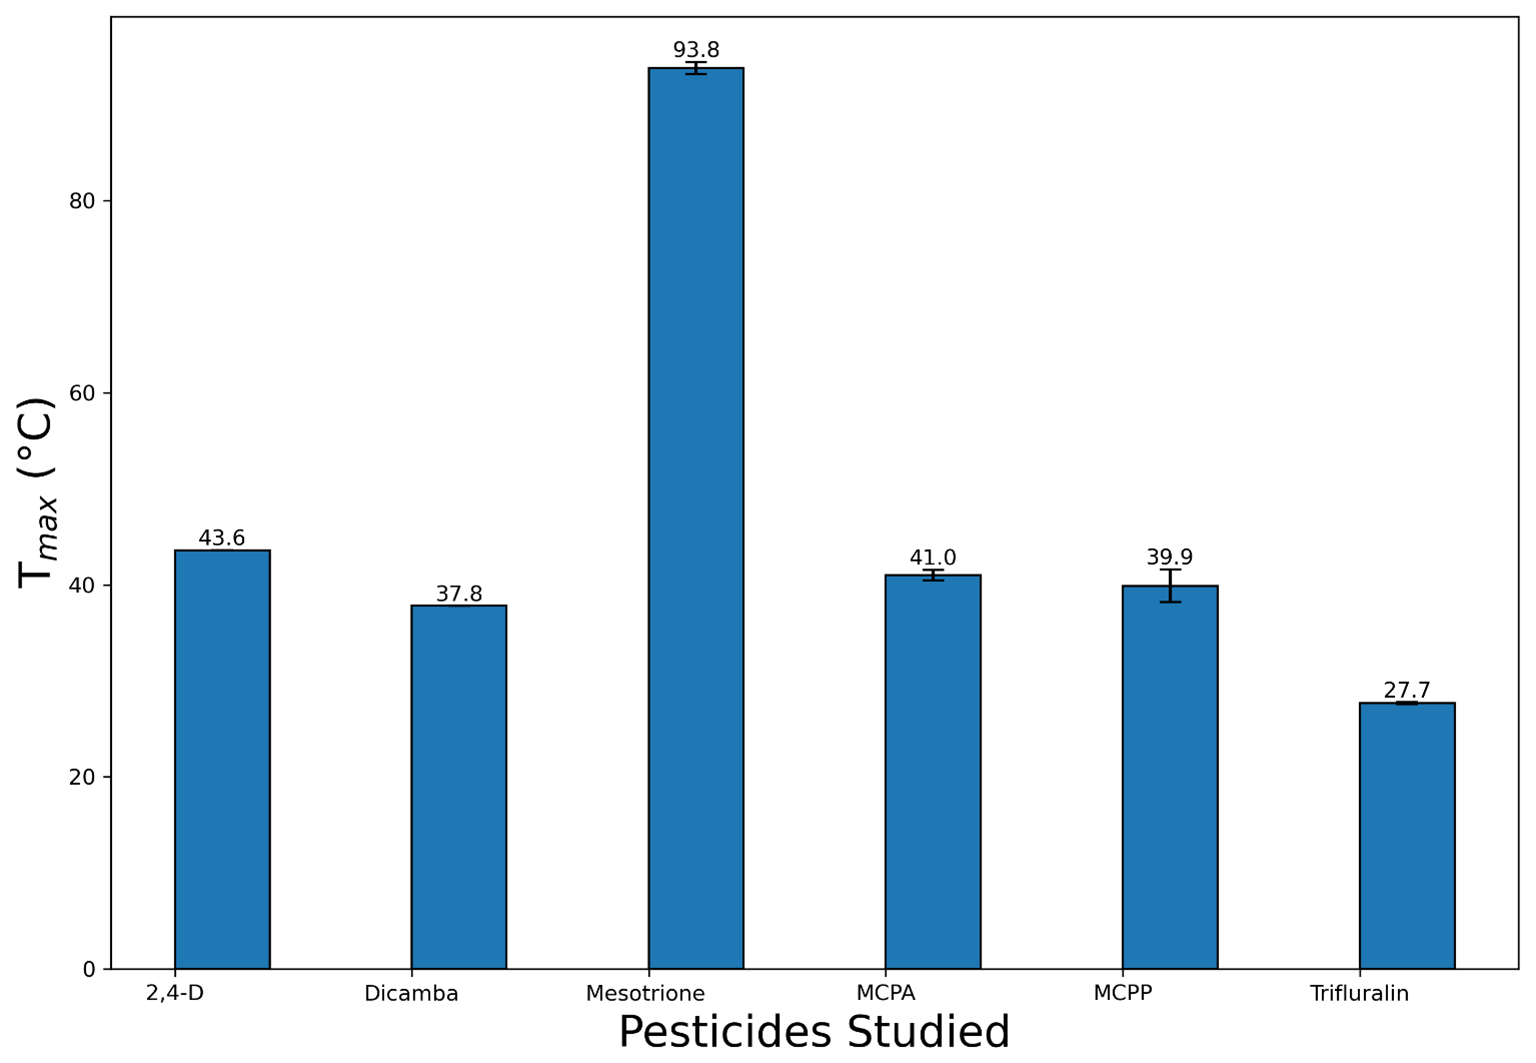
Figure 7Tmax values of the pesticides taken from the heating of the filters of the FIGAERO-CIMS measurements. The filters were collected using the atomisation delivery method. Error bars represent the spread of results from three runs, with the value shown on the bar being an average of the three runs.
As reported previously (Ylisirniö et al., 2021) and discussed above, it is important to match the size distributions of the calibration particles and those used in the vapour pressure experiments to minimise the influence of sample condition differences inducing changes in evaporation times and hence Tmax values. Figure 4 shows the particle size distribution for each of the solutions used in this work. Since evaporation times are faster for smaller particles deposited on the filter, Tmax values will increase as particle size increases for particles of the same volatility. Hence, if the nebulised pesticide particle distributions do not match those of the calibration size distribution, then biases in the vapour pressure determination are to be expected. This may well be the case for 2,4-D from Fig. 4, where the modal particle diameter is 90 nm compared to 105 nm for the other pesticides and the PEG calibration.
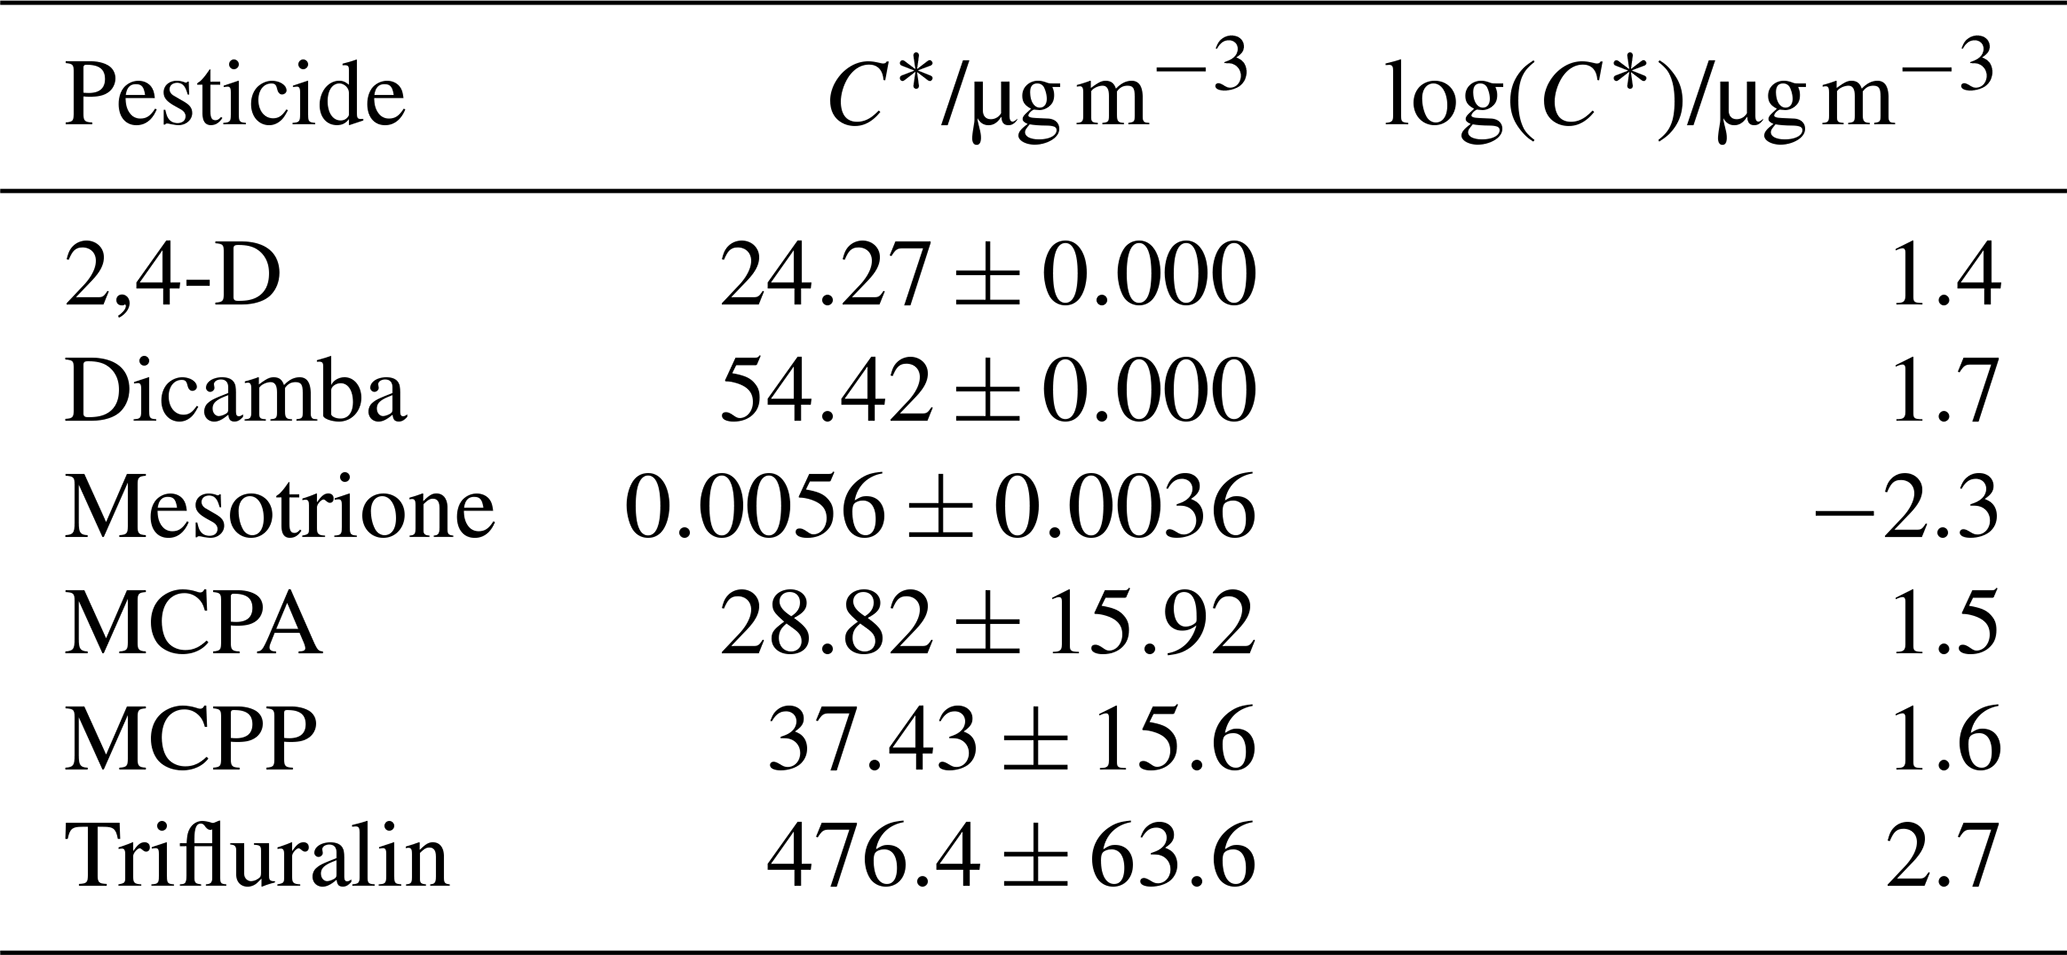
The Tmax values in Fig. 7 were then used to derive vapour pressure values for each compound using calibration constants determined using the aerosolisation approach (Fig. 3b). These vapour pressure values were then converted into C∗ values, shown in Fig. 8b and Table 2, in order to make predictions of equilibrium gas- and particle-phase partitioning behaviour. Figure 8 also compares the data obtained by the FIGAERO-CIMS with literature values. These include currently accepted regulatory endpoint values (e.g. as provided in the EU dossier for each pesticide); the modified grain method (MGM), a model that is commonly used to provide initial predictions of a pesticide's volatility based on SAR; and the Nannoolal model, which is another but newer SAR model.
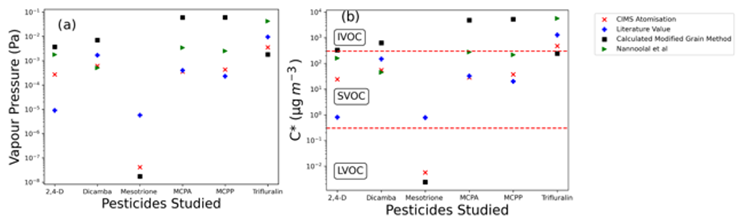
Figure 8Measurement-derived vapour pressure and C∗ values of pesticides determined from Tmax data using the calibrations reported in Sect. 3 and compared with accepted literature values from Lewis et al. (2016), the Nannoolal et al. method, and the modified grain method. The dotted red lines represent the boundaries between the indicative volatility basis (VBS) categories defined by Donahue et al. (2012b). The values come from the average of the three runs shown in Fig. 7. The error bars are shown in the figure; however, they are not visible due to the high repeatability.
Table 2Calculated C∗ values using the atomisation delivery method.
The FIGAERO-CIMS measurements show trifluralin to have the highest vapour pressure and mesotrione to have the lowest. 2,4-D acid, dicamba, MCPA, and MCPP, which have similar structures, all have similar measured vapour pressures (all within a magnitude of ). All four of these pesticides remain characterised as an SVOC (as seen in Fig. 8b). Broadly, these results are consistent with the MGM predictions. However, the MGM tool predicted these herbicide molecules to be more volatile than observed with the CIMS experiments and the stated literature values by between 1 and 2 orders of magnitude. This confirms the importance of measured vapour pressure data.
The vapour pressure value for mesotrione was determined at 373 K of Pa in previous studies (Lewis et al., 2016) and has therefore previously been considered to be an upper-limit value in regulatory framework literature (EFSA, 2016) since lower vapour pressures will occur at lower temperatures.
The observations at ambient temperatures presented in this work show mesotrione to be considerably less volatile than may be expected based on the upper-limit value. It can be seen that the reason for the difference in the EFSA document (EFSA, 2016) is that the method used observed some thermal decomposition of mesotrione (the melting point temperature is stated to be with some decomposition on melting). We calculate the vapour pressure at 293 K by extrapolating the Lewis et al. (2016) data included in EFSA (2016) to 298 K using a Clausius–Clapeyron relationship and compare it with our observation in Fig. 9 along with MGM model predictions and show consistency across both observations and models for mesotrione. However, mesotrione can still be considered involatile since, if a pesticide at the higher temperature (100 °C) is non-volatile, it will not become more volatile at 25 °C, and thus extrapolation to a lower temperature is not required.
No value from the Nannoolal model is reported for mesotrione as the sulfonyl group is not included in the model. This means any estimate using the Nannoolal model would not include the impact of the sulfonyl on vapour pressure (Nannoolal et al., 2008). On the other hand, MGM predictions gave a value of . This was calculated using theoretical melting point estimations and therefore represents a predicted vapour pressure at 20 °C. It is thus more likely to be a more representative value than the current literature value that is widely used based on a conservative 20 °C vapour pressure endpoint assumption since it was not measured at 20 °C. Data from the regulatory study, the present FIGAERO-CIMS study, and the MGM estimate are represented in the Clausius–Clapeyron plot (Fig. 9). Figure 9 plots each of the measured values (at 323, 373, and 383 K) taken from EFSA's list of endpoints and compares these values to the FIGAERO-CIMS measurement and the MGM-predicted value.
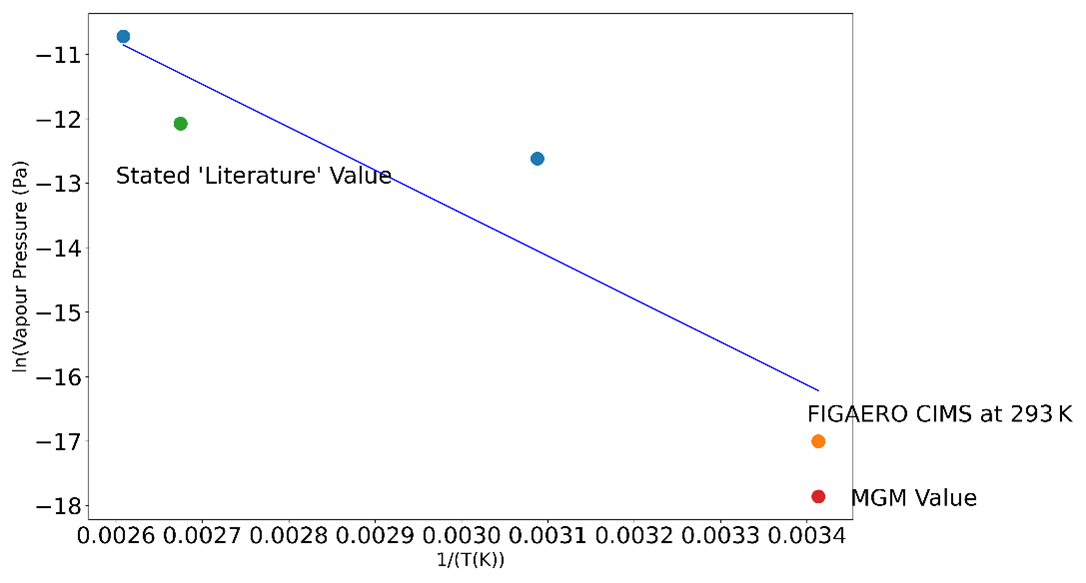
Figure 9Clausius–Clapeyron plot of mesotrione measurements from the EFSA endpoint report (EFSA, 2016) determined at varied temperatures (323, 373, 383 K). This is then compared with the CIMS atomisation measurement and the modified grain method (MGM). Points in blue are the values from the EFSA endpoints (EFSA, 2016).
The Clausius–Clapeyron relationship for mesotrione (Fig. 9) shows that the CIMS atomisation value obtained would fit well with the MGM predictions and strongly supports the value of at 293 K being more representative than the current literature value. Despite the current regulatory risk assessment that endpoint vapour pressure differs significantly from the value from the present study, it does still indicate that volatilisation of mesotrione is not expected to be significant in the context of the environmental fate and behaviour of this molecule.
Trifluralin is the most volatile of all the pesticide active substances investigated in the present study. A value of 27.7 °C was measured as the Tmax, which is close to the instrument limit due to the FIGAERO heating ramp starting at room temperature (approximately 25 °C), meaning a Tmax value of below 25 °C would not be measurable. This results in trifluralin having a low sensitivity in the particle-phase measurements of the CIMS due to potential volatilisation off the filter into the gas phase prior to heating. Despite these limitations, a vapour pressure of was measured, which is within 1 order of magnitude of the literature value (). Conversely, the MGM gives a prediction of ; this is a closer prediction to the literature and measured values compared to the other pesticides, possibly suggesting the model shows better agreement with higher-volatility compounds. Overall, both models may lead to misleading indications of the environmental fate of a pesticide. This is because the MGM and, to a lesser extent, Nannoolal predict the likely gas-phase presence of 2,4-D, dicamba, MCPA, and MCPP, whereas the measurements indicate a much stronger tendency to be present in the particle phase or to remain on the target application.
4.1 Assessment of the calibration method
A series of PEGs of different chain lengths and hence different volatilities was introduced onto the FIGAERO-CIMS filter. From this, Tmax was determined for each PEG length chain from the temperature at which the maximum mass spectrum signal was detected at the relevant . The regression of Tmax with the literature values of PEG vapour pressure provided a calibration for determining the vapour pressure of six representative pesticides. In this manner, the results of previous work were well verified (Bannan et al., 2019; Ylisirniö et al., 2021), demonstrating the effectiveness of using atomisation as the delivery mechanism for both the calibration and the measured compound on the FIGAERO filter.
In addition, this study supports the findings of Ylisirniö et al. (2021). The results show that the atomisation method is the most suitable to use due to the following factors. Firstly, the atomisation method presents a more relevant method compared to online sampling in the field and thus provides an opportunity to compare against results if required. Additionally, it has previously been observed that the sizes of the aerosols of the calibration droplets on the FIGAERO filter need to be similar to those of the material being sampled for the calibration to be representative. In order to control this, the atomisation method is required, in which a number of small droplets are deposited on the filter compared to one large droplet of varying size when the syringe method is used. As pointed out by Ylisirnio et al. (2021), this is due to complete evaporation of a single compound of a given volatility from the filter as a result of the thermal ramp being dependent on the size of the particle (due to a varying surfacevolume ratio). A molecule in the larger droplet from the syringe method takes more energy to evaporate in comparison to the smaller droplets on the filter in the atomisation method. This results in the Tmax compound of the same volatility being higher in the syringe method and the overall thermograms being broader (as observed in Fig. 2 and supported by Fig. S1 and Tables S1–3) due to the spread of energies required to evaporate the broader compound. Overall, this effect suggests that the atomisation method is more suitable. One additional point to highlight is that the concentrations on the filter were also replicated (0.1 g L−1 for the syringe and 0.5 g L−1 for the atomisation method). This was done as previous studies (Bannan et al., 2019) found that a change in concentration deposited on the filter produced a notably different volatility due to the evaporation rate differences in the analyte off the filter.
Additionally, other prior investigations relied on singular PEG 3–8 solutions or combined the individual PEGs into one solution and then dissolved them in a solvent. Previously, each PEG n had to be individually weighed from separate containers and added to the solvent. The PEG 400 mixture used in this work offers a wider spectrum of polymer chain lengths that provides a robust multi-point calibration mixture in a single solution. Additional benefits include substantial cost savings and reduction in wastage, increasing efficiency. Mass spectrometry detected PEG 1 to PEG 16+ within our analysis. However, vapour pressures from the 1–5 and 13–16 ranges were not presented due to reduced repeatability. The shorter-chain-length inconsistencies (in PEGs 1–5) are likely attributable to highly volatile substances that begin to evaporate at ambient temperatures prior to measurement, as the ramp phase initiates at approximately 25 °C, and thus would not be measured if the compound had already evaporated into the gas phase prior to the ramp phase. For compounds with lower volatility (beyond PEG 12), the temperatures reached during the FIGAERO ramp phase may not be sufficient to uniformly volatilise these compounds from the filter. It is important to note that these limitations are limited to volatility ranges, which means the phase of the compounds will predominantly be in either the gas phase or the particle phase and is unlikely to demonstrate significant partitioning behaviour.
Figure 5 additionally illustrates a logarithmic decrease in the vapour pressure of the PEG series, indicating the robustness of the FIGAERO-CIMS method in the atmospherically relevant pressure range of (i.e. for PEGs 5–12) without extrapolation.
4.2 Atmospheric implications of pesticide measurements
Each pesticide's volatility, determined using the FIGAERO-CIMS, was compared to the EU regulatory literature value and two models based on structure activity relationships (MGM and Nannoolal), whose accuracies have previously been compared (Barley and Mcfiggans, 2010). Both models clearly overestimate the vapour pressures of 2,4-D, MCPA, and MCPP, predicting more volatile vapour pressures than all of the literature values and CIMS measurements for these pesticides. This suggests that the chlorinated benzene or carboxylic acid function groups may have been poorly represented in the training data set used to develop the MGM and Nannoolal models. Conversely, trifluralin estimations were predicted to be less volatile in the MGM model and more volatile in the Nannoolal model in comparison to the other models, suggesting that the two models deal with the three functional groups (NO2, NR2, and CF3) differently.
Some of the literature values, sourced from the EU regulatory literature, exhibited disparities when compared to the FIGAERO-CIMS values. These regulatory literature values were extracted primarily from their risk assessment or risk assessment review of the compound. They are frequently employed in predictive models for estimating a compound's volatility. The regulatory document (e.g. EFSA, 2016, 2009) mentions the use of the OECD method 104, as previously described. However, it is important to note that OECD text guideline 104 encompasses several distinct methods for measuring vapour pressure. Unfortunately, the reports do not specify which particular method was utilised. This is because the value is based on the regulatory framework and is not readily traceable. It is based on an upper-limit value made at a higher temperature and is included for reference. Consequently, it cannot be assumed that the pesticide literature values can be completely reliably compared due to the substantial variations in these methods.
Mesotrione exhibited the lowest volatility among the tested pesticides, yielding a C∗ value of (from a vapour pressure of ). This value stands nearly 2 orders of magnitude apart from the upper limit of the reference value of . This would shift its classification from an SVOC to an LVOC. The significant difference in vapour pressures can be attributed to this cautious regulatory value (taken at 100.7 °C), which, from a regulatory assessment approach, allows for an absolute worst-case-scenario volatilisation prediction. This work then confirms mesotrione is not prone to volatilisation and that a larger portion of the sprayed compound will likely remain on plants and soil and undergo other pathways of degradation. For example, it is known that as a pesticide moves through the soil environment in particular, it is assumed that it will not volatilise. Consequently, it becomes imperative to prioritise measurements related to the movement of mesotrione in soil and water (Carles et al., 2017). From a regulatory standpoint, it is crucial to consider all potential pathways of environmental movement. It is also essential to clarify that this conclusion does not imply that mesotrione is entirely free of environmental risks. Rather, it suggests that it is very unlikely that volatilisation is a major mechanism of loss from the initial application site. It may however undergo atmospheric transport if present on resuspended soil particles (Socorro et al., 2016).
Among the tested pesticides, trifluralin was found to be the most volatile. The FIGAERO-CIMS analysis revealed only a 1 order of magnitude difference from the literature value, supporting its IVOC categorisation (in regard to the VBS scheme; Donahue et al., 2012a). This classification suggests that trifluralin is likely to quickly volatilise into the gas phase upon application; however, it is expected to quickly undergo chemical transformation, as reflected by the atmospheric lifetime of trifluralin being 0.45 d (with respect to OH-initiated photooxidation) (EFSA, 2009). Studies at Arctic monitoring stations have reported low levels of trifluralin in Arctic air (Balmer et al., 2019). At present, the mechanisms giving rise to such long-range transport are not clear; however the identification of trifluralin in such a remote environment was a major contributing factor to the removal of trifluralin's approved status for use in the EU (EFSA, 2009). This discussion on the potential for long-range transport contributed significantly to the removal of trifluralin's approved status for use in the EU (EFSA, 2009). It has also been consistently ranked high in assessments of inhalation exposure risks, including potential health issues such as cancer (Sugeng et al., 2013; Coleman et al., 2020), and is deemed extremely toxic to aquatic systems (EFSA, 2009). This resulted in trifluralin being considered for addition as a persistent organic (EFSA 2009). Despite these concerns, trifluralin is still used in the US, Canada, and Australia. It is consequently still important to understand the overall atmospheric fate of trifluralin once it is present in the atmosphere.
The measurements of the vapour pressure of 2,4-D acid () resulted in a factor of 30 compared to the regulatory literature value of . Comparatively, there is an even larger difference of nearly 3 orders of magnitude () in the predicted vapour pressure by the calculated MGM compared to the current regulatory literature value. The FIGAERO-CIMS measurements and MGM modelling would suggest 2,4-D is more volatile than previously stated. However, we note that the particle size distribution of 2,4-D particles deposited onto the FIGAERO filter (Fig. 4) was smaller than that of the PEG calibration particle size distribution, and unfortunately 2,4-D was unable to be delivered at a diameter that replicated that of the PEGS using the nebuliser equipment available. Other pesticides' size distributions had similarly shaped distributions, and peaks occurred at similar diameters compared to those of the calibration particles. Differences of this magnitude have previously been reported to impact the Tmax values and thus alter the vapour pressure by up to half an order of magnitude as a result of changing the evaporation times on the filter (Ylisirniö et al., 2021). This also supports the argument presented earlier for the requirement that to compare results across different experiments, a calibration using particles of the same size must be used.
In addition, it also must not be forgotten that in the field an applied formulation of 2,4-D is commonly prepared in acid, salt, or ester forms, with the acid and salt dissociating into the anion form in hydrated environments. In comparison to other methods, the FIGAERO-CIMS method prefers the acid form as the thermogram at the of 2,4-D is used to determine volatility, and therefore it is certain that the acid active substance is what is being measured. However, it is important to acknowledge that the different forms of 2,4-D will have different physiochemical properties. Further measurements of 2,4-D are required to fully understand 2,4-D's volatilisation potential in the field through the measurement of a commercial product containing the different 2,4-D forms. This is particularly important as the CIMS observations suggest 2,4-D is more volatile than literature values suggest and is therefore more likely to reside in the atmosphere and as such may impact environmental risk assessment.
This work highlighted differences in vapour pressure measurements compared to literature values and has shown that for some compounds observed values have the potential to alter predicted impacts due to differences in gas- and particle-phase partitioning. However, the latter is only relevant if there is a mechanism by which the pesticide substance can volatilise either during or after spraying. The importance of using the correct values of physiochemical properties in pesticide models has previously been highlighted by Couvidat et al. (2022), who included pesticides in the atmospheric chemical transport model CHIMERE.
It is recommended that future work expands on the range of pesticides studied using FIGAERO-CIMS to provide observed vapour pressure data for incorporation into realistic atmospheric transport and chemistry models and to improve the robustness of environmental assessments of pesticides' environmental impact via atmospheric pathways. It is also recognised that vapour pressure is just one section of a jigsaw to understand how a pesticide may be transported in the atmosphere. Further studies must also consider atmospheric reactions and secondary organic aerosol (SOA) formation in order to develop a fuller picture of the atmospheric fate and behaviour of pesticide substances.
It has been demonstrated that the FIGAERO-CIMS provides a robust and comparable method of volatility measurement based on a well-characterised set of calibration compounds, namely PEGs over a range of vapour pressures, incorporating those of atmospheric relevance. This approach has enabled the determination of the vapour pressures of six exemplar pesticides.
The calibration of the FIGAERO-CIMS to determine vapour pressures from the maximum signal of the target compound during evaporation from the filter in a temperature ramp (or thermogram, Tmax) replicated the atomisation approach described by Ylisirniö et al. (2021). The results of this present study validate those of the previous work and also demonstrate that earlier methods of syringing calibrant material onto the FIGAERO filter fail to take account of kinetic evaporation times of semi-volatile material and should not be used. The novel use of the PEG 400 mixture provides one pre-made bulk mixture that covers a wider range of vapour pressures compared to previous vapour pressure calibrations beyond atmospherically relevant vapour pressures.
Vapour pressures of a number of pesticides that were categorised as having intermediate to low volatility were then measured using the FIGAERO-CIMS. This paper reports vapour pressures and C∗ values along with the associated measurement uncertainty. Comparisons of the measured values with current literature values and a model based on structural activity relationships are broadly in agreement, suggesting that the CIMS values are an accurate alternative value to be used in future models. However, for some compounds, substantial differences were demonstrated, some of which are substantial enough to have significant implications for transport pathways through the atmosphere and hence potentially inform future development of regulatory compliance.
Future work should confirm the differences in pesticide vapour pressures measured using the FIGAERO-CIMS compared to the currently accepted literature values and extend the range of measurements over a wide range of pesticides. These values can then be used in environmental models and environmental assessments to support cases of contamination via volatilisation, a route that may previously not have been considered important for several compounds if literature values underestimate compound vapour pressures.
Data are available at https://doi.org/10.5281/zenodo.15525892 (Jackson, 2025).
The supplement related to this article is available online at https://doi.org/10.5194/acp-25-6257-2025-supplement.
Experimental planning and design were performed by OMJ, AV, TJB, and HC. The design and building of the calibration setup at Manchester were performed by OMJ, AV, and TJB; experiments were conducted by OMJ; and discussions of results occurred with OMJ, AV, GM, and HC. Modelling was carried out by OMJ and SPO'M, and expertise on pesticide legislation was provided by DJ. Data were plotted and analysed by OMJ. The paper was written by OMJ. All authors reviewed the paper before publication.
The contact author has declared that none of the authors has any competing interests.
Publisher's note: Copernicus Publications remains neutral with regard to jurisdictional claims made in the text, published maps, institutional affiliations, or any other geographical representation in this paper. While Copernicus Publications makes every effort to include appropriate place names, the final responsibility lies with the authors.
The study received funding from the EPSRC CDT in Aerosol Science and was partially funded by Syngenta Ltd. Aristeidis Voliotis also acknowledges the support of the TOX-PEST project.
This research has been supported by the Engineering and Physical Sciences Research Council (grant no. EP/S023593/1) and the Natural Environment Research Council (NERC) through the TOX-PEST project (grant no. NE/X010198/1).
This paper was edited by Ivan Kourtchev and reviewed by three anonymous referees.
Balmer, J. E., Morris, A. D., Hung, H., Jantunen, L., Vorkamp, K., Rigét, F., Evans, M., Houde, M., and Muir, D. C. G.: Levels and trends of current-use pesticides (CUPs) in the arctic: An updated review, 2010–2018, Emerging Contaminants, 5, 70–88, https://doi.org/10.1016/j.emcon.2019.02.002, 2019.
Bannan, T. J., Le Breton, M., Priestley, M., Worrall, S. D., Bacak, A., Marsden, N. A., Mehra, A., Hammes, J., Hallquist, M., Alfarra, M. R., Krieger, U. K., Reid, J. P., Jayne, J., Robinson, W., McFiggans, G., Coe, H., Percival, C. J., and Topping, D.: A method for extracting calibrated volatility information from the FIGAERO-HR-ToF-CIMS and its experimental application, Atmos. Meas. Tech., 12, 1429–1439, https://doi.org/10.5194/amt-12-1429-2019, 2019.
Barley, M. H. and McFiggans, G.: The critical assessment of vapour pressure estimation methods for use in modelling the formation of atmospheric organic aerosol, Atmos. Chem. Phys., 10, 749–767, https://doi.org/10.5194/acp-10-749-2010, 2010.
Bilde, M., Barsanti, K., Booth, M., Cappa, C. D., Donahue, N. M., Emanuelsson, E. U., Mcfiggans, G., Krieger, U. K., Marcolli, C., Topping, D., Ziemann, P., Barley, M., Clegg, S., Dennis-Smither, B., Hallquist, M., Hallquist, Å. M., Khlystov, A., Kulmala, M., Mogensen, D., Percival, C. J., Pope, F., Reid, J. P., Ribeiro Da Silva, M. A. V., Rosenoern, T., Salo, K., Soonsin, V. P., Yli-Juuti, T., Prisle, N. L., Pagels, J., Rarey, J., Zardini, A. A., and Riipinen, I.: Saturation Vapor Pressures and Transition Enthalpies of Low-Volatility Organic Molecules of Atmospheric Relevance: From Dicarboxylic Acids to Complex Mixtures, Chem. Rev., 115, 4115–4156, https://doi.org/10.1021/cr5005502, 2015.
Booth, A. M., Markus, T., McFiggans, G., Percival, C. J., Mcgillen, M. R., and Topping, D. O.: Design and construction of a simple Knudsen Effusion Mass Spectrometer (KEMS) system for vapour pressure measurements of low volatility organics, Atmos. Meas. Tech., 2, 355–361, https://doi.org/10.5194/amt-2-355-2009, 2009.
Booth, A. M., Bannan, T. J., Benyezzar, M., Bacak, A., Alfarra, M. R., Topping, D., and Percival, C. J.: Development of lithium attachment mass spectrometry – Knudsen effusion and chemical ionisation mass spectrometry (KEMS, CIMS), Analyst, 142, 3666–3673, https://doi.org/10.1039/c7an01161j, 2017.
Brüggemann, M., Mayer, S., Brown, D., Terry, A., Rüdiger, J., and Hoffmann, T.: Measuring pesticides in the atmosphere: current status, emerging trends and future perspectives, Environmental Sciences Europe, 36, 39, https://doi.org/10.1186/s12302-024-00870-4, 2024.
Butler Ellis, M. C., Lane, A. G., O'Sullivan, C. M., and Jones, S.: Wind tunnel investigation of the ability of drift-reducing nozzles to provide mitigation measures for bystander exposure to pesticides, Biosyst. Eng., 202, 152–164, https://doi.org/10.1016/j.biosystemseng.2020.12.008, 2021.
Cai, C., Stewart, D. J., Reid, J. P., Zhang, Y.-H., Ohm, P., Dutcher, C. S., and Clegg, S. L.: Organic Component Vapor Pressures and Hygroscopicities of Aqueous Aerosol Measured by Optical Tweezers, J. Phys. Chem. A, 119, 704–718, https://doi.org/10.1021/jp510525r, 2015.
Carles, L., Joly, M., and Joly, P.: Mesotrione Herbicide: Efficiency, Effects, and Fate in the Environment after 15 Years of Agricultural Use, CLEAN-Soil Air Water, 45, 1700011, https://doi.org/10.1002/clen.201700011, 2017.
Coleman, N. V., Rich, D. J., Tang, F. H. M., Vervoort, R. W., and Maggi, F.: Biodegradation and Abiotic Degradation of Trifluralin: A Commonly Used Herbicide with a Poorly Understood Environmental Fate, Environ. Sci. Technol., 54, 10399–10410, https://doi.org/10.1021/acs.est.0c02070, 2020.
Couvidat, F., Bedos, C., Gagnaire, N., Carra, M., Ruelle, B., Martin, P., Poméon, T., Alletto, L., Armengaud, A., and Quivet, E.: Simulating the impact of volatilization on atmospheric concentrations of pesticides with the 3D chemistry-transport model CHIMERE: Method development and application to S-metolachlor and folpet, J. Hazard. Mater., 424, 127497, https://doi.org/10.1016/j.jhazmat.2021.127497, 2022.
Davies, J. F.: Mass, charge, and radius of droplets in a linear quadrupole electrodynamic balance, Aerosol Sci. Tech., 53, 309–320, https://doi.org/10.1080/02786826.2018.1559921, 2019.
Dearden, J. C.: Quantitative structure – Property relationships for prediction of boiling point, vapor pressure, and melting point, Environ. Toxicol. Chem., 22, 1696, https://doi.org/10.1897/01-363, 2003.
Donahue, N. M., Robinson, A. L., Stanier, C. O., and Pandis, S. N.: Coupled Partitioning, Dilution, and Chemical Aging of Semivolatile Organics, Environ. Sci. Technol., 40, 2635–2643, https://doi.org/10.1021/es052297c, 2006.
Donahue, N. M., Kroll, J. H., Pandis, S. N., and Robinson, A. L.: A two-dimensional volatility basis set – Part 2: Diagnostics of organic-aerosol evolution, Atmos. Chem. Phys., 12, 615–634, https://doi.org/10.5194/acp-12-615-2012, 2012a.
Donahue, N. M., Robinson, A. L., Trump, E. R., Riipinen, I., and Kroll, J. H.: Volatility and Aging of Atmospheric Organic Aerosol, in: Topics in Current Chemistry, edited by: McNeill, V. and Ariya, P., Springer Berlin Heidelberg, 97–143, https://doi.org/10.1007/128_2012_355, 2012b.
EFSA: Conclusion on pesticide peer review regarding the risk assessment of the active substance trifluralin, EFSA Journal, 7, 327r, https://doi.org/10.2903/j.efsa.2009.327r, 2009.
EFSA: Peer review of the pesticide risk assessment of the active substance mesotrione, EFSA Journal, 14, 4419, https://doi.org/10.2903/j.efsa.2016.4419, 2016.
Fuhrimann, S., Klánová, J., Přibylová, P., Kohoutek, J., Dalvie, M. A., Röösli, M., and Degrendele, C.: Qualitative assessment of 27 current-use pesticides in air at 20 sampling sites across Africa, Chemosphere, 258, 127333, https://doi.org/10.1016/j.chemosphere.2020.127333, 2020.
Galon, L., Bragagnolo, L., Korf, E. P., Dos Santos, J. B., Barroso, G. M., and Ribeiro, V. H. V.: Mobility and environmental monitoring of pesticides in the atmosphere – a review, Environ. Sci. Pollut. R., 28, 32236–32255, https://doi.org/10.1007/s11356-021-14258-x, 2021.
Hulin, M., Leroux, C., Mathieu, A., Gouzy, A., Berthet, A., Boivin, A., Bonicelli, B., Chubilleau, C., Hulin, A., Leoz Garziandia, E., Mamy, L., Millet, M., Pernot, P., Quivet, E., Scelo, A.-L., Merlo, M., Ruelle, B., and Bedos, C.: Monitoring of pesticides in ambient air: Prioritization of substances, Sci. Total Environ., 753, 141722, https://doi.org/10.1016/j.scitotenv.2020.141722, 2021.
Jackson, O.: Data for Determination of the atmospheric volatility of pesticides using FIGAERO–chemical ionisation mass spectrometry, Version v1, Zenodo [data set], https://doi.org/10.5281/zenodo.15525892, 2025.
Jepson, P. C., Murray, K., Bach, O., Bonilla, M. A., and Neumeister, L.: Selection of pesticides to reduce human and environmental health risks: a global guideline and minimum pesticides list, The Lancet Planetary Health, 4, E56–E63, https://doi.org/10.1016/S2542-5196(19)30266-9, 2020.
Kallenborn, R., Reiersen, L.-O., and Olseng, C. D.: Long-term atmospheric monitoring of persistent organic pollutants (POPs) in the Arctic: a versatile tool for regulators and environmental science studies, Atmos. Pollut. Res., 3, 485–493, https://doi.org/10.5094/APR.2012.056, 2012.
Krieger, U. K., Siegrist, F., Marcolli, C., Emanuelsson, E. U., Gøbel, F. M., Bilde, M., Marsh, A., Reid, J. P., Huisman, A. J., Riipinen, I., Hyttinen, N., Myllys, N., Kurtén, T., Bannan, T., Percival, C. J., and Topping, D.: A reference data set for validating vapor pressure measurement techniques: homologous series of polyethylene glycols, Atmos. Meas. Tech., 11, 49–63, https://doi.org/10.5194/amt-11-49-2018, 2018.
Kruse-Plaß, M., Hofmann, F., Wosniok, W., Schlechtriemen, U., and Kohlschütter, N.: Pesticides and pesticide-related products in ambient air in Germany, Environmental Sciences Europe, 33, 114, https://doi.org/10.1186/s12302-021-00553-4, 2021.
Lee, B. H., Lopez-Hilfiker, F. D., Mohr, C., Kurtén, T., Worsnop, D. R., and Thornton, J. A.: An Iodide-Adduct High-Resolution Time-of-Flight Chemical-Ionization Mass Spectrometer: Application to Atmospheric Inorganic and Organic Compounds, Environ. Sci. Technol., 48, 6309–6317, https://doi.org/10.1021/es500362a, 2014.
Leistra, M.: Methods for estimating the vapour pressure of organic chemicals, Application to five pesticides, Wageningen, Alterra, ISSN: 1566-7197, 2011.
Lewis, K. A., Tzilivakis, J., Warner, D. J., and Green, A.: An international database for pesticide risk assessments and management, Hum. Ecol. Risk Assess., 22, 1050–1064, https://doi.org/10.1080/10807039.2015.1133242, 2016.
Lopez-Hilfiker, F. D., Mohr, C., Ehn, M., Rubach, F., Kleist, E., Wildt, J., Mentel, Th. F., Lutz, A., Hallquist, M., Worsnop, D., and Thornton, J. A.: A novel method for online analysis of gas and particle composition: description and evaluation of a Filter Inlet for Gases and AEROsols (FIGAERO), Atmos. Meas. Tech., 7, 983–1001, https://doi.org/10.5194/amt-7-983-2014, 2014.
Mohr, C., Lopez-Hilfiker, F. D., Zotter, P., Prévôt, A. S. H., Xu, L., Ng, N. L., Herndon, S. C., Williams, L. R., Franklin, J. P., Zahniser, M. S., Worsnop, D. R., Knighton, W. B., Aiken, A. C., Gorkowski, K. J., Dubey, M. K., Allan, J. D., and Thornton, J. A.: Contribution of Nitrated Phenols to Wood Burning Brown Carbon Light Absorption in Detling, United Kingdom during Winter Time, Environ. Sci. Technol., 47, 6316–6324, https://doi.org/10.1021/es400683v, 2013.
Murschell, T. and Farmer, D. K.: Atmospheric OH Oxidation of Three Chlorinated Aromatic Herbicides, Environ. Sci. Technol., 52, 4583–4591, https://doi.org/10.1021/acs.est.7b06025, 2018.
Murschell, T. and Farmer, D. K.: Real-Time Measurement of Herbicides in the Atmosphere: A Case Study of MCPA and 2,4-D during Field Application, Toxics, 7, 40, https://doi.org/10.3390/toxics7030040, 2019.
Murschell, T., Fulgham, S. R., and Farmer, D. K.: Gas-phase pesticide measurement using iodide ionization time-of-flight mass spectrometry, Atmos. Meas. Tech., 10, 2117–2127, https://doi.org/10.5194/amt-10-2117-2017, 2017.
Nannoolal, Y., Rarey, J., and Ramjugernath, D.: Estimation of pure component properties, Fluid phase equilibria, 269, 117–133, https://doi.org/10.1016/j.fluid.2008.04.020, 2008.
O'Meara, S., Booth, A. M., Barley, M. H., Topping, D., and Mcfiggans, G.: An assessment of vapour pressure estimation methods, Phys. Chem. Chem. Phys., 16, 19453–19469, https://doi.org/10.1039/c4cp00857j, 2014.
OECD: Test No. 104: Vapour Pressure, https://doi.org/10.1787/9789264069565-en, 2006.
Schobesberger, S., D'Ambro, E. L., Lopez-Hilfiker, F. D., Mohr, C., and Thornton, J. A.: A model framework to retrieve thermodynamic and kinetic properties of organic aerosol from composition-resolved thermal desorption measurements, Atmos. Chem. Phys., 18, 14757–14785, https://doi.org/10.5194/acp-18-14757-2018, 2018.
Socorro, J., Durand, A., Temime-Roussel, B., Gligorovski, S., Wortham, H., and Quivet, E.: The persistence of pesticides in atmospheric particulate phase: An emerging air quality issue, Sci. Rep.-UK, 6, 33456, https://doi.org/10.1038/srep33456, 2016.
Sugeng, A. J., Beamer, P. I., Lutz, E. A., and Rosales, C. B.: Hazard-ranking of agricultural pesticides for chronic health effects in Yuma County, Arizona, Sci. Total Environ., 463–464, 35–41, https://doi.org/10.1016/j.scitotenv.2013.05.051, 2013.
UNEP (United Nations Environment Program): Stockholm Convention on Persistent Organic Pollutants, in: Conference of Plenipotentiaries on the Stockholm Convention on Persistent Organic Pollutants, Stockholm, Sweden, 22 May 2001, UNEP, 2001.
Vermeulen, N. P. E.: Handbook of Chemical Property Estimation Methods. W. J. Lyman, W. F. Reehl and D. H. Rosenblatt. American Chemical Society, Washington DC, 960, 1990. US $49.95. ISBN 0-8412-1761-0, Recl. Trav. Chim. Pays-Bas, 110, 61–61, https://doi.org/10.1002/recl.19911100212, 1991.
Voliotis, A., Wang, Y., Shao, Y., Du, M., Bannan, T. J., Percival, C. J., Pandis, S. N., Alfarra, M. R., and McFiggans, G.: Exploring the composition and volatility of secondary organic aerosols in mixed anthropogenic and biogenic precursor systems, Atmos. Chem. Phys., 21, 14251–14273, https://doi.org/10.5194/acp-21-14251-2021, 2021.
Waldbi, N. C. R. S. J. C. D.: Effects of the pesticides carbofuran, chlorpyrifos, dimethoate, lindane, triallate, trifluralin, 2,4-D, and pentachlorophenol on the metabolic endocrine and reproductive endocrine system in EWES, J. Toxicol. Env. Heal. A, 54, 21–36, https://doi.org/10.1080/009841098159006, 1998.
Widegren, J. A., Harvey, A. H., Mclinden, M. O., and Bruno, T. J.: Vapor Pressure Measurements by the Gas Saturation Method: The Influence of the Carrier Gas, J. Chem. Eng. Data, 60, 1173–1180, https://doi.org/10.1021/je500865j, 2015.
Yatavelli, R. L. N., Lopez-Hilfiker, F., Wargo, J. D., Kimmel, J. R., Cubison, M. J., Bertram, T. H., Jimenez, J. L., Gonin, M., Worsnop, D. R., and Thornton, J. A.: A Chemical Ionization High-Resolution Time-of-Flight Mass Spectrometer Coupled to a Micro Orifice Volatilization Impactor (MOVI-HRToF-CIMS) for Analysis of Gas and Particle-Phase Organic Species, Aerosol Sci. Tech., 46, 1313–1327, https://doi.org/10.1080/02786826.2012.712236, 2012.
Ye, C., Yuan, B., Lin, Y., Wang, Z., Hu, W., Li, T., Chen, W., Wu, C., Wang, C., Huang, S., Qi, J., Wang, B., Wang, C., Song, W., Wang, X., Zheng, E., Krechmer, J. E., Ye, P., Zhang, Z., Wang, X., Worsnop, D. R., and Shao, M.: Chemical characterization of oxygenated organic compounds in the gas phase and particle phase using iodide CIMS with FIGAERO in urban air, Atmos. Chem. Phys., 21, 8455–8478, https://doi.org/10.5194/acp-21-8455-2021, 2021.
Ylisirniö, A., Barreira, L. M. F., Pullinen, I., Buchholz, A., Jayne, J., Krechmer, J. E., Worsnop, D. R., Virtanen, A., and Schobesberger, S.: On the calibration of FIGAERO-ToF-CIMS: importance and impact of calibrant delivery for the particle-phase calibration, Atmos. Meas. Tech., 14, 355–367, https://doi.org/10.5194/amt-14-355-2021, 2021.
Zaller, J. G., Kruse-Plaß, M., Schlechtriemen, U., Gruber, E., Peer, M., Nadeem, I., Formayer, H., Hutter, H.-P., and Landler, L.: Pesticides in ambient air, influenced by surrounding land use and weather, pose a potential threat to biodiversity and humans, Sci. Total Environ., 838, 156012, https://doi.org/10.1016/j.scitotenv.2022.156012, 2022.