the Creative Commons Attribution 4.0 License.
the Creative Commons Attribution 4.0 License.
Global seasonal urban, industrial, and background NO2 estimated from TROPOMI satellite observations
Vitali Fioletov
Chris A. McLinden
Debora Griffin
Xiaoyi Zhao
Henk Eskes
The tropospheric NO2 vertical column density (VCD) values measured by the Tropospheric Monitoring Instrument (TROPOMI) were used to study the NO2 variability and estimate urban NOx emissions for 261 major cities worldwide. The used algorithm isolated three components in tropospheric NO2 data – background NO2, NO2 from urban sources, and NO2 from industrial point sources – and then each of these components was analyzed separately. The method is based on fitting satellite data by a statistical model with empirical plume dispersion functions driven by a meteorological reanalysis. Unlike other similar studies that studied plumes from emission point sources, this study included the background component as a function of the elevation in the analysis and separated urban emissions from emissions from industrial point sources. Population density and surface elevation data as well as coordinates of industrial sources were used in the analysis. The largest per capita emissions were found in the Middle East, and the smallest were in India and southern Africa. The largest background component was observed over China and parts of Europe, while the smallest was over South America, Australia, and New Zealand. Differences between workday and weekend emissions were also studied. Urban emissions on Sundays (or Fridays for some countries) are typically 20 %–50 % less than workday emissions for all regions except China. The background component typically does not show any significant differences between workdays and weekends, suggesting that background NO2 has a substantially longer lifetime compared to that in the urban and industrial plumes.
- Article
(8738 KB) - Full-text XML
- BibTeX
- EndNote
The works published in this journal are distributed under the Creative Commons Attribution 4.0 License. This license does not affect the Crown copyright work, which is re-usable under the Open Government Licence (OGL). The Creative Commons Attribution 4.0 License and the OGL are interoperable and do not conflict with, reduce, or limit each other.
© Crown copyright 2025
Nitrogen oxides (NOx, taken here to be nitric oxide (NO) and nitrogen dioxide (NO2)) are major air pollutants whose emissions are regulated in many countries. They originate from various anthropogenic (fuel combustion) and natural (e.g., biomass burning, lightning) sources. NOx from the combustion of fossil fuels is generally in the form of NO but is oxidized rapidly, forming a pseudo-steady state with NO2. NO2 is linked to respiratory health issues (Health Canada, 2018) and has negative environmental impacts such as acid rain (Burns et al., 2016).
Satellite measurements of one component of NOx, NO2, have a long history. Satellite observations of tropospheric NO2 columns began with the nadir-viewing GOME (Global Ozone Monitoring Experiment) in 1996 (Martin et al., 2002) with several successors such as OMI (Ozone Monitoring Instrument) (Duncan et al., 2015; Krotkov et al., 2016; Lamsal et al., 2015, 2021; Levelt et al., 2018) and TROPOMI (Tropospheric Monitoring Instrument) (van Geffen et al., 2020, 2022; Veefkind et al., 2012). Most recently NO2 measurements become available from geostationary satellite missions such as the operational Geostationary Environment Monitoring Spectrometer (GEMS) (Kim et al., 2020; Seo et al., 2024) and Tropospheric Emissions: Monitoring of Pollution (TEMPO) (Zoogman et al., 2016). Another geostationary mission, Sentinel-4 (Stark et al., 2013), is scheduled for 2025.
These satellite instruments provide measurements of tropospheric NO2 vertical column density (VCD), a geophysical quantity representing the total number of molecules (or total mass) per unit of area in the troposphere. Due to its relatively short lifetime, a few hours within a plume during the day, NO2 is elevated near sources such as urban areas (Beirle et al., 2019; Lorente et al., 2019; Lu et al., 2015) and industrial locations such as power plants and oil refineries (Liu et al., 2016; McLinden et al., 2012). Satellite data have been used to better understand NOx sources, sinks, distributions, and trends (Beirle et al., 2011, 2019; Goldberg et al., 2021b; Liu et al., 2016; Lorente et al., 2019; Lu et al., 2015; Martin et al., 2002; McLinden et al., 2012; Stavrakou et al., 2020; Vîrghileanu et al., 2020) as well as to estimate NOx emissions. Several methods have been developed for such emission estimates (Streets et al., 2013): inverse modeling (Konovalov et al., 2006; Mijling and van Der A, 2012), flux divergence (Beirle et al., 2019; 2021), and methods based on a rotation of satellite NO2 pixels around the source and then fitting the plume by a one-dimensional (Beirle et al., 2011; Valin et al., 2013; Lange et al., 2022; Pommier et al., 2013) or two-dimensional exponentially modified Gaussian (EMG) function (Fioletov et al., 2022; McLinden et al., 2020).
Tropospheric VCDs, together with surface, in situ NO2 measurements, were both observed to decline during the COVID-19 lockdown, first in China and then worldwide (Bao and Zhang, 2020; Bauwens et al., 2020; Ding et al., 2020; Gkatzelis et al., 2021; Kanniah et al., 2020; Keller et al., 2021; Koukouli et al., 2021; Liu et al., 2020; Vadrevu et al., 2020; Vîrghileanu et al., 2020; Zhang et al., 2021). This decline was observed all over the world: in the United States and Canada (Bauwens et al., 2020; Goldberg et al., 2020; Griffin et al., 2020), Europe (e.g., Bar et al., 2021; Barré et al., 2021), India (Mirsa et al., 2021; Hassan et al., 2021), Pakistan (Ghaffar et al., 2021; Mehmood et al., 2021), Brazil (Dantas et al., 2020; Siciliano et al., 2020), and other countries (Ass et al., 2020; Aydin et al., 2020; Fu et al., 2020). More information about the COVID-19 restrictions on atmospheric pollutants can be found in overview papers (Gkatzelis et al., 2021; Levelt et al., 2021). Satellite data also demonstrated a decline in emissions by comparing the NOx emissions estimates before and after the lockdown started (Lange et al., 2022; Fioletov et al., 2022).
The concentration of air pollutants over large cities, including NO2, is different from weekends to weekdays due to reduced industrial activity and traffic (Cleveland et al., 1974; Elkus and Wilson, 1977). This is known as the “weekend effect”. This effect was intensively studied using ground-based (Butenhoff et al., 2015; Domínguez-López et al., 2014; Khoder, 2009; Nishanth et al., 2012) and satellite data (Beirle et al., 2003; Goldberg et al., 2021a; Jeong and Hong, 2021; Kaynak et al., 2009; Stavrakou et al., 2020). The estimated amplitude of the workday–weekend difference is about 20 %–40 % (Goldberg et al., 2021a; Murphy et al., 2007), although it is different from city to city (Lange et al., 2022). Unlike large cities, rural areas with other predominant sources of NOx (soil emissions, biomass burning, lightning) show no indication for a weekly NOx cycle. Satellite NO2 observations also do not show any weekly pattern in rural areas (Kaynak et al., 2009).
In this study, an algorithm previously developed to estimate the COVID-19 lockdown impact on tropospheric NO2 over major urban areas (Fioletov et al., 2022) was applied to the available 2018–2023 TROPOMI data to estimate urban and industrial emissions as well as the background NO2 distribution for four seasons. Emissions derived using this algorithm demonstrated good agreement with the reported industrial emissions from the US power plants (Fioletov et al., 2022) and urban emission estimates by Lange et al. (2022). Unlike other similar studies that studied plumes from emission point sources (e.g., Lange et al., 2022; Beirle et al., 2023), this study included the background component in the analysis and separated urban emissions from emissions from industrial point sources. The algorithm is based on a multisource dispersion function fitting approach, originally developed to estimate emissions from sulfur dioxide (SO2) point and area sources (Fioletov et al., 2017; McLinden et al., 2020). The approach is based on fitting TROPOMI measurements by statistical models with empirical plume dispersion functions driven by a meteorological reanalysis. The analysis was done using data over 3° by 4° areas around major cities. The statistical models included three components related to (1) plumes from urban sources, (2) plumes from industrial point sources, and (3) background NO2. The parameters of the statistical model link the satellite NO2 values to proxies related to elevation and population density as well as to locations of large industrial point sources. The algorithm estimates NO2 mass and derives emissions, while the actual emissions are typically in the form of NO that rapidly reacts with ozone-producing NO2. Although the emission estimates were done for NO2, they can be upscaled to derive total NOx emissions. We followed the approach used by Beirle et al. (2021) and Lange et al. (2022) for upscaling NO2 estimates to derive also total NOx emissions.
This paper is organized as follows: Sect. 2 describes various data sets used in the study; the statistical models used in this study are discussed in Sect. 3. In Sect. 4, emission estimates for individual urban areas and for large regions are discussed. The weekend effect is discussed in Sect. 5, and changes in NOx emissions are described in Sect. 6. Discussion and conclusions are given in Sect. 7. The upscaling of NO2 to NOx emissions is described in the Appendix.
2.1 TROPOMI NO2 VCD data
The TROPOMI instrument is a space-borne, nadir-viewing, imaging spectrometer, on board the European Space Agency (ESA) and EU Copernicus Sentinel-5 Precursor (S5p) satellite, was launched on 13 October 2017 (van Geffen et al., 2022; Veefkind et al., 2012). It measures in the ultraviolet and visible (270–500 nm), near-infrared (675–775 nm), and shortwave infrared (2305–2385 nm) spectral bands. The satellite is in a Sun-synchronous, low-Earth (825 km) orbit with a daily Equator crossing time of approximately 13:30 local solar time and the swath width of 2600 km (van Geffen et al., 2018). At nadir, the instrument has a high spatial resolution of 3.5×7 km2 at the beginning of operation that was further reduced to 3.5×5.6 km2 on 6 August 2019. To obtain tropospheric NO2 VCD, the stratospheric portion of the total NO2 column is subtracted using a global model estimate that is refined using data assimilation (Boersma et al. 2004). Our analysis is based on version 2 level 2 TROPOMI tropospheric NO2 VCD data that are available from the Copernicus Data Space Ecosystem (https://dataspace.copernicus.eu, last access: 22 June 2024). The NO2 data used were the reprocessed (RPRO) v2.4 (until July 2022) and offline mode (OFFL) v2.4 and 2.5 (end of July 2022–November 2023) data. These versions were available at the time of this study. Only data with the quality assurance value (qa_value) higher than 0.75 (van Geffen et al., 2018) were used. A qa_value of 0.75 removes problematic retrievals, errors, and partially snow-/ice-covered scenes. In addition, satellite pixels with a solar zenith angle greater than 75° and with a cloud radiance fraction above 0.3 were excluded from the analysis. TROPOMI NO2 VCD values represent the total number of molecules per unit area below the tropopause and are often given in molecules or moles (one mole is equal to 6.022×10²³ molecules) per square meter or centimeter as well as in Dobson units (DU, 1 DU = 2.69×10¹⁶ molec. cm−2). The specified random uncertainty of a single TROPOMI tropospheric NO2 VCD measurement is about 5×10¹⁴ molec. cm−2 (or 0.026 DU) (ESA EOP-GMQ, 2017; van Geffen et al., 2020). Since TROPOMI has only one daily overpass at most locations, diurnal NO2 variations may affect satellite-based emission estimates. Unlike surface concentrations, the diurnal variations in NO2 VCDs are relatively small (Herman et al., 2009; Chong et al., 2018). However, since we do not have information about nighttime NO2 VCDs, the presented results are limited to daytime emissions only.
2.2 Wind data
As in previous studies (Fioletov et al., 2022, 2015; McLinden et al., 2020; Zoogman et al., 2016), the emission estimation algorithm is based on the plume dispersion function that uses the wind speed and direction obtained from European Centre for Medium-Range Weather Forecasts (ECMWF) ERA5 reanalysis data (C3S, 2017; Dee et al., 2011; Hersbach et al., 2020). The wind speed and direction from the reanalysis data were merged with the tropospheric NO2 value for each TROPOMI pixel. The reanalysis wind data have a 1 h temporal resolution and are available on a 0.25° horizontal grid. U and V (west–east and south–north, respectively) wind-speed components were then linearly interpolated to the location of the center of each TROPOMI pixel and to overpass time. The ERA5 wind components at 1000, 950, and 900 hPa were averaged to obtain the used wind value (that approximately corresponds to the mean winds between 0 and 1 km). The results are not very sensitive to the wind profile within this range because the boundary layer wind is relatively constant (Beirle et al., 2011; Zhao et al., 2024) except close to the surface. Note that in ERA5 reanalysis in pressure coordinates, when the surface pressure is smaller than that at a given level (e.g., 1000 hPa), the values will simply duplicate the winds at the lowest pressure available.
2.3 Population density data, city selection, and elevation data
The Gridded Population of the World (GPW) data set (SEDAC, 2017) was used as a source for the population density data. GPW data are on a 0.042° (2.5 arcmin) grid and consist of estimates of the number of persons per square kilometer based on counts consistent with national censuses and population registers. When coarser-resolution data were required, they were obtained by averaging the original data within the new grid cells.
The analysis was performed for the same 261 urban areas around the world as in Fioletov et al. (2022). Information about large city locations and populations was obtained from the World Cities Database available from https://simplemaps.com/data/world-cities (last access: 10 May 2021). All cities with a population greater than 1 million were considered. As in the previous study (Fioletov et al., 2022), we also included several European national capitals with a population between 700 000 and 1 million. For China, we raised the limit and considered only cities with a population greater than 6 million to keep the number of analyzed areas similar to other regions. The cities were grouped into 14 regions, and regional characteristics were calculated by averaging estimates for individual cities within the region.
In the absence of major sources, tropospheric NO2 VCD depends on the thickness of the troposphere that is affected by the elevation. NO2 background concentrations decline nearly exponentially with altitude at a rate of about 50 % per kilometer (Dang et al., 2023). Thus, the higher the altitude, the lower the NO2 VCD over that location. Elevation data from the 2-minute Gridded Global Relief Data (ETOPO2v2) database (NOAA, 2006) were used as a proxy to estimate the background component in the statistical models. When lower-resolution data were required, they were obtained by averaging the original data within the new grid cells.
Information about workdays and weekends in different countries was obtained from the “Time and Date AS” web site (Thorsen, 2024; https://www.timeanddate.com/calendar/, last access: 15 March 2024).
2.4 Industrial point source locations
Coordinates of industrial point sources are required by the used algorithm. We used the same list of point sources as in Fioletov et al. (2022). For the United States, information about the sources was taken from the U.S. Environmental Protection Agency (EPA) National Emissions Inventory (NEI) (EPA, 2020) and from the eGRID database (https://www.epa.gov/egrid/download-data, last access: 5 April 2024) for 2018 and 2019. For Canada, the source coordinates were from the Canadian National Pollutant Release Inventory (NPRI, 2020) are used. Only Canadian and US sources with annual emissions greater than 0.5 kt of NOx per year were selected and used in this study. Coordinates of the European industrial point sources were obtained from the European Industrial Emissions Portal (https://industry.eea.europa.eu/, last access: 20 March 2024). Only sources that emitted more than 0.5 kt yr−1 of NOx are included in the analysis.
For other regions, three sources of information on industrial source locations were used. (1) The world power plant database (https://globalenergymonitor.org/projects/global-coal-plant-tracker/, last access: 20 March 2024) was used to find locations of power plants. (2) Oil- and gas-related industrial factories and other sources were also obtained from the SO2 emission source catalogue (Fioletov et al., 2023). (3) Missing sources were also added based on the analysis of the NO2 residuals maps and then confirmed using satellite imagery as discussed in Fioletov et al. (2022).
The technique used here is based on the approach from our previous study (Fioletov et al., 2022) that is briefly described below. All satellite measurements over a 3° by 4° area (roughly 330 km by 330 km at 42° N) around large cities taken during a certain period are linked to locations of industrial point sources as well as to population density and elevation-related proxies by a statistical (linear regression) model. The predictor functions of the statistical model represent plumes from the known industrial sources and population grid. Emission strengths are the unknown parameters of the model. In addition, the statistical model includes a term that links the elevation data with the background NO2 distribution. The parameters of the model were estimated by the least squares method using all data collected during 3-month periods in different years. The following statistical model was used by Fioletov et al. (2022):
where α0, αp, αi, β0, β1, and β2 are the unknown regression parameters of the statistical model; H is the elevation above sea level and the empirical scaling factor H0=1.0 km was introduced to make the exponential argument dimensionless and to account for altitudinal dependence better; and ε is the residual noise.
The α0 + (β0+β1 (θ−θ0) + β2(φ−φ0)) ⋅ exp() term (four fitted coefficients) represents the mean background tropospheric NO2 distribution around the location with coordinates θ0 and φ0. It is assumed that this term is declining exponentially with elevation; i.e., within the analyzed 3° by 4° area, the higher the elevation is, the lower the background tropospheric NO2 VCD is, as mentioned in Sect. 2.3. It was also assumed that this contribution from elevation depends on geographical coordinates only and not on the winds. The α0 parameter was added to the model to account for remaining free-tropospheric NO2 at high elevations where exp() is very close to 0.
Plumes are described by functions Ωp and Ωi for the population-density-related distributed source (or area source) and for industrial point sources, respectively. These plume functions Ω are two-dimensional EMG functions that are commonly used to approximate plumes of VCDs of trace gases such as NO2, SO2, and ammonia (Beirle et al., 2011, 2014; Dammers et al., 2019; Fioletov et al., 2017, 2015; de Foy et al., 2015; Liu et al., 2016; McLinden et al., 2020). See Fioletov et al. (2022), their Appendix A, for details. The plume function for an industrial source i has a form , where θ and φ are the satellite pixel coordinates, ω and s are the wind direction and speed for that pixel on that day and time, and θi and φi are the source coordinates. The ΣαiΩi term (variable number of coefficients αi from zero to few dozens) reflects contributions of plumes from individual industrial point sources. An unknown parameter (αi) represents the total NO2 mass emitted from the point source i. On a given day, Ωi is a contribution to tropospheric NO2 VCD over the location with coordinates θ and φ from a source that contributes one unit of NO2 mass to total NO2 around that source. It was restricted to αi≥0.
The ap Ωp term represents urban emissions, and the composite plume function Ωp is a sum of plume functions of all individual cell centers multiplied by the grid cell population. It was assumed that emissions from each grid cell are proportional to the cell population and the coefficient of proportionality is the same for the entire analyzed area. Thus, we just need to estimate one coefficient (αp) that is proportional to the annual emissions per capita. A 0.2° by 0.2° population density grid was used in the analysis, and original population density data were converted to that grid by averaging population density data within each grid cell.
Accounting for the industrial plume contribution makes estimates of urban emissions more accurate. Since this study is focused on urban emissions and since the contribution of industrial sources is very different from one urban area to another, industrial emissions are not discussed in detail. If an emission source is located within an urban area, it could be difficult to separate its emissions from urban emissions since the Ωp and Ωi functions would be correlated. For this reason, industrial point sources located in the 0.2° by 0.2° cells where the population is greater than 600 000 people were excluded. This is an empirically estimated limit, and, in a few cases of very large cities (New York, Moscow), it was manually adjusted. Note that for point sources located in close proximity, their plume functions Ωi could be highly correlated. In such cases, emissions from individual industrial sources often cannot be estimated. Fioletov et al. (2022) suggested an algorithm to group the sources into independent clusters so that total emissions from such clusters could be estimated. We used that algorithm in this study, although it is not necessary if only total emissions from all point sources in the area are estimated to separate them from urban emissions or if all industrial sources are isolated remote sources.
The plume functions Ω depends on two prescribed parameters: the lifetime (τ), which reflects the rate at which NO2 is removed from the plume due to the chemical conversion or physical removal such as deposition, and the plume width (w), which largely depends on the satellite pixel size. The same value of w=8 km as in Fioletov et al. (2022) is used, and the value of τ will be discussed later.
The parameters α0, αp, αi, β0, β1, and β2 were estimated from the fit of TROPOMI data using the statistical model of Eq. (1). The fitting was done for all satellite pixels centered within 3° by 4° areas around large cities and collected during the analyzed period by the minimization of the squares of the residuals (ε).
The model parameters αp and αi represent the total NO2 mass emitted from the population grid and from the source i, respectively. The lifetime τ determines the emission rate (E): for an industrial point source, i can be expressed as . Similarly, the urban emission rate is . Although seasonal emissions were calculated, emissions rates were expressed in kilotonnes per year (kt yr−1) to make it easier to compare with available annual emissions inventories.
In this study, three different variants of the statistical model discussed above were used. Model 1 was the model given by Eq. (1). The fitting was done for each season for the years from 2018 to 2023. This model was used to estimate the evolution of the urban and background components over time. Model 2 was developed to estimate the mean emissions and NO2 distribution and study the workday vs. weekend effect, and it had the form
where I1 is an indicator function for Friday: it equals 1 for Friday measurements and 0 otherwise. Similarly, I2 and I3 are indicator functions for Saturday and Sunday, and γ2j are the regression model parameters that represent the departure of Friday–Sunday characteristics from those on workdays. In other words, the urban component term is αpΩp when measurements taken on a workday are fit and αpΩp ⋅ (1+γ21) for measurements on Friday (and similar terms for Saturday and Sunday). The fitting was done for each month of the year using all available years; i.e., it has 12 sets of parameters. This model estimates the average urban and industrial emissions and background component and does not include terms that depend on individual years. As Model 2 is focused on typical (mean) characteristics, the period affected by the COVID-19 restriction (March–June 2020) was excluded from the analysis.
Model 3 was focused on estimating changes in urban emissions over time:
where I1, I2, and I3 are indicator functions for Friday, Saturday, and Sunday, respectively, and γ1, γ2, and γ3 are the corresponding regression model parameters; I2018–I2023 are indicator functions for the years 2018–2023 (e.g., I2018=1 for 2018 measurements and 0 otherwise); and δ2018–δ2023 are the corresponding regression parameters. As in the case of Model 2, the fitting was done separately for each month of the year, but unlike Model 2, it can be used to estimate urban emissions for individual years. We preferred to estimate emissions for each year rather than use a functional form for long-term changes (e.g., a linear or quadratic trend) because such a functional term could be different from area to area and because the measurement record is relatively short.
We used these three different statistical models instead of one model that included all possible parameters to reduce the number of parameters of the models and their uncertainties. That was particularly important for cities with relatively small urban emissions. As discussed below in Sect. 4, emissions from Model 2 demonstrated that the weekend effect is relatively small in the industrial and background components, which led to the introduction of Model 3.
Note that the plume functions Ω used in Eqs. (1)–(3) depend on the effective lifetime τ. While τ can be estimated from the observations, this would lead to larger uncertainties of all estimated parameters. Instead, we used a prescribed value of τ based on a parameterization for the seasonal and latitudinal dependence of τ that was derived from results of the study by Lange et al. (2022): (lat/ν), where τ is in hours; lat is the absolute value of the latitude in degrees; and ν=40, 50, 55, 50 for winter, spring, summer, and fall, respectively. This parameterization gives τ values of 1.8 h at the Equator and 5.5–8 h at 60° depending on the season. The parameterization suggests a slightly stronger increase in τ with the latitude than in Lange et al. (2022), but it better matches the estimates for cities in the USA and China (τ=3.9 h for May–September) by Liu et al. (2016). It should be noted that the uncertainties of τ estimates and the scattering of τ values as a function of the latitude are rather large. Moreover, the lifetime may be changing over time (Laughner and Cohen, 2019) as NO2 concentration declines, although other studies suggest that such changes are minor (Stavrakou et al., 2020). Liu et al. (2016) also found that the average NO2 lifetime for power plants (3.5 h) may be slightly shorter than for cities (3.9 h). We neglected that possible difference and used the same parameterization for the lifetime for industrial and urban sources.
TROPOMI measurements and all the coefficient estimates in Eqs. (1)–(3) as well as emission calculations are performed for NO2, while actual emissions are in the form of NOx. For NOx emission estimates, the ratio between NOx and NO2 is required. Beirle et al. (2021) suggested an algorithm to estimate the NOx to NO2 ratio for different parts of the world and found that the ratio is about 1.4 over the United States and typically between 1.2 and 1.6 elsewhere. The NO2 to NOx ratio was derived from surface temperature, surface ozone mixing ratio, and the solar zenith angle. We also the applied Beirle et al. (2021) upscaling algorithm, and some of the NOx emission estimates are presented in Appendix A.
4.1 Case studies
As an illustration of the method results, Fig. 1 shows mean TROPOMI tropospheric NO2, the fitting results (using Model 2), and three components for Houston, USA, and Guangzhou, China, for four seasons. The fitting results (Fig. 1, column b) are a sum of the background, population-density-related, and industrial-source-related components (Fig. 1, columns d, e, f, respectively). The residuals (Fig. 1, column c) are the difference between the mean TROPOMI NO2 and the fitting results. Maps of elevation and population density for both cities are shown in Appendix B (Fig. B1). The average characteristics of the background, urban, and industrial components were analyzed using Model 2, which did not contain any year-specific terms. The estimates were done for each month of the year, and the results are presented as seasonal values that were calculated as inverse-variance weighted averages of monthly values. For both cities, the fitting results can explain the complex NO2 distribution seen on the TROPOMI map rather well. The residuals are larger for Guangzhou than for Houston due to larger absolute NO2 values. For Houston, the range of the elevation values in the Houston area is small, between 0 and 150 m, and the background component reflects the gradient in NO2 that is caused by higher NO2 concentrations over the land and lower ones over the Gulf of Mexico. For the Guangzhou area, the range of elevations is between 0 and 900 m, and it is a case where topography is a substantial factor. In particular, the population density is very low in the northern and western half of the area, and the background NO2 distribution there comes from topography.
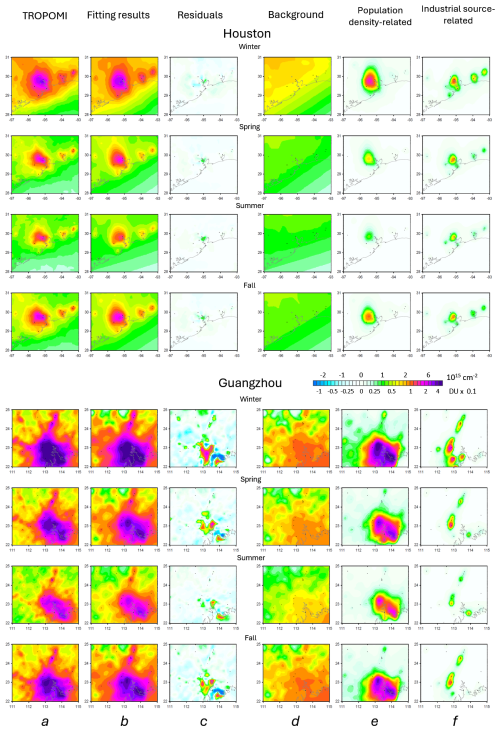
Figure 1Mean (2018–2023) TROPOMI NO2, the fitting results, and Model-2-based components for four seasons over two urban areas as indicated. The columns represent mean TROPOMI NO2 VCD values (a), the fitting results (b), the residuals (c), and individual components of the fitting: the background (elevation-related) (d), the urban (population-density-related) (e), and the industrial-source-related (f) components. The values are given in 1015 molecules per square centimeter and in 10ths of a Dobson unit.
Figure 1 (columns d, e, f) shows that there is a clear annual cycle in all three components for both cities. The values are higher in winter and lower in summer, which can be, at least, partially explained by a longer lifetime in winter and a shorter one in summer. The amplitude of this annual cycle is the smallest for the background component: average summer values are 63 % and 76 % of average winter values for Houston and Guangzhou, respectively. For the industrial component, these values are 42 % and 39 % of winter values. The seasonal changes in the urban component are the largest among all three components, and summer values are only 20 % and 32 % of winter values for Houston and Guangzhou, respectively, so they may be caused by a difference in emissions themselves.
4.2 Background levels
Model 1 was used to estimate the background component and urban emissions per capita. The estimates were done for individual seasons from June–August 2018 to September–November 2023. To illustrate the distribution of the background component for different urban areas, Fig. 2 shows the mean seasonal NO2 values of that component or, in other words, the mean value of )) ⋅ exp()) in DU. There are seasonal patterns in the background component: winter values are higher than summer values at the middle and high latitudes. The background component is particularly large (0.1–0.2 DU or 2.7×10¹⁵–5.4×10¹⁵ molec. cm−2) in winter over central Europe and China. Background values over India and China are higher than these over other regions at the same latitudes. In contrast, the background values over Ulaanbaatar, located in central Mongolia far away from large industrial regions, are lower than over Europe and North America at the same latitudes. Another region of high background values is southern Africa, where high values are caused by biomass burning that is particularly extensive in June–October, i.e., austral winter and spring, although the background values in other African regions and seasons without major biomass burning are low. Low background values can also be seen over South America, Australia, and New Zealand. Not surprisingly, these results suggest that high background values are related to the areas of large anthropogenic emissions and dense emission sources.
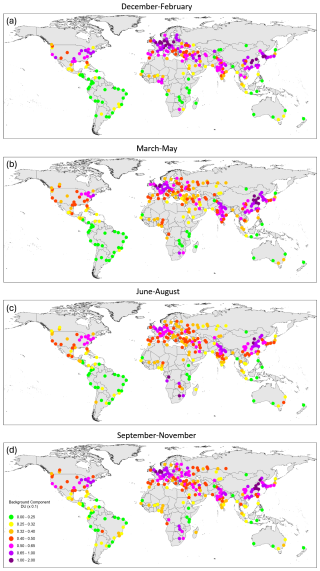
Figure 2The mean NO2 background component in 10ths of a Dobson unit for individual cities for (a) December–February, (b) March–May, (c) June–August, and (d) September–November. The background component represents the mean tropospheric NO2 VCD when a direct contribution from urban and industrial emissions is removed.
Individual cities were grouped into 14 large geographical regions with 10–20 areas in each: the USA and Canada, Europe-1 and Europe-2, China, India, Southeast Asia (also including Pakistan and Bangladesh), the Japan region (also including Taiwan and South Korea), northern Eurasia (former USSR countries and Mongolia), the Middle East, south and north Africa, Australia and New Zealand, Central America, and South America. Johannesburg (South Africa) and Pyongyang (North Korea) were not included in any particular region because their NOx emissions were very different from those from neighbouring countries and therefore may bias regional statistics. Note that there are two regions comprised of mostly European Union (EU) countries. Europe (EU)-1 includes Italy, France, Spain, Portugal, Belgium, Ireland, and the UK, and EU-2 includes all other EU countries plus a few other European cities. These two regions demonstrated very different changes in NO2 during the COVID-19 lockdown (Barré et al., 2021; Fioletov et al., 2022), and we decided to analyze them separately.
Regional mean background values are shown in Fig. 3a. The regional means further demonstrated that the highest background values were over China followed by Europe, the Japan region, and India. The background levels over the two European regions are very similar. The lowest background values can be seen in Australia and New Zealand, South America, and the summer and fall seasons in southern Africa. The spread of the mean background values between the regions is rather large: for example, the background levels over China are 3 times as high as over South America.
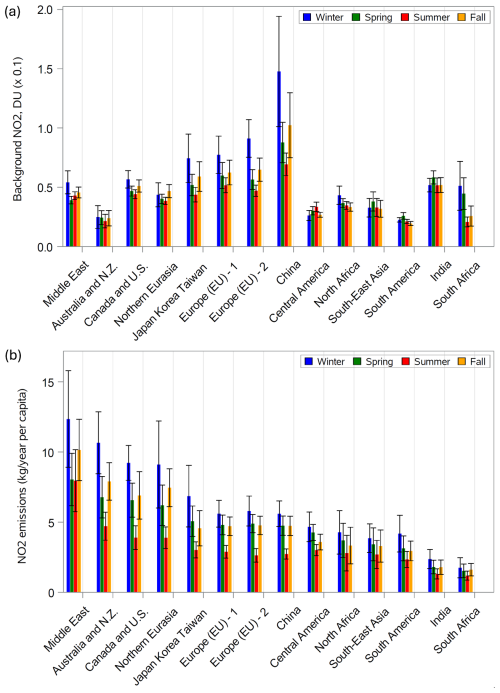
Figure 3(a) The mean background component in 10ths of a Dobson unit for 14 regions for four seasons. Mean values for each region were calculated as a mean of the values from all areas for that region. (b) The mean values of urban NOx emissions per capita reported as NO2 for the same regions. The uncertainty (σ) was calculated as a standard error of the mean. The error bars represent 2σ intervals.
4.3 Emissions per capita
As mentioned, the urban-emission-related term is based on the assumption that every population grid cell's emission is proportional to the cell population only. Therefore, it is natural to express urban emissions as emissions per capita, which also makes it possible to compare emissions in different regions.
Estimated seasonal urban NO2 emissions per capita (or to be precise, NOx emissions reported as NO2) for individual cities are shown in Fig. 4 and the regional means in Fig. 3b. The highest emissions per capita can be seen over the Middle East, while the lowest occur in India and southern Africa (except Johannesburg). The average annual emissions per capita are typically between 7 and 3 kg yr−1 and lower, about 2 kg yr−1, for India and southern Africa. There is also a clear seasonal cycle with a maximum in winter and a minimum in summer. Recall that the urban emission rate is and τ is larger in winter than in summer. Therefore, the seasonal cycle in the total mass αp is even greater than in the emission rate.
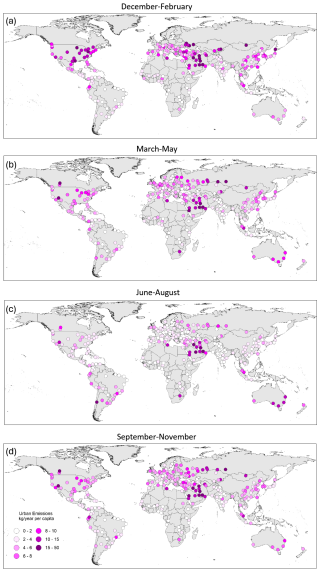
Figure 4NO2 emissions in kilotonnes per year (kt yr−1) per capita (i.e., NOx emissions reported as NO2) estimated from the urban component for (a) December–February, (b) March–May, (c) June–August, and (d) September–November.
According to the estimates in Fig. 3b for mid- and high-latitude regions, per capita emissions in winter are almost twice as high as in summer. Lifetimes depend on NOx, and volatile organic compound concentrations are different from city to city (Laughner and Cohen, 2019). Wintertime emissions could exceed summertime ones due to NOx from heating. Some studies indeed demonstrated that, at least for some types of fuel, NOx emissions during the cold seasons are higher than during the hot season (Tu et al., 2021; Zare et al., 2021).
Urban emissions and the background component often demonstrate very different seasonal behaviour. For example, the background component for Australia and New Zealand is almost the same in all seasons, while the estimated winter emissions are twice that of summer. The opposite is true for southern Africa, where background values for winter and spring are more than twice as large as these for summer and fall due to biomass burning, while urban emissions do not show a large seasonal dependence. Thus, although the background component is affected by urban emissions, these two characteristics are not identical.
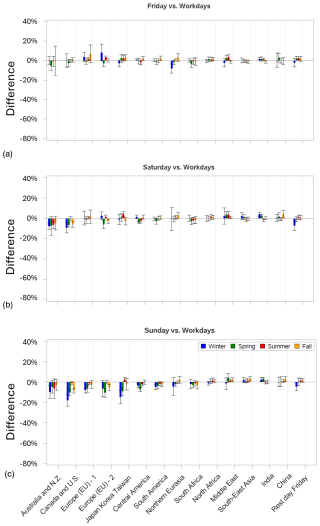
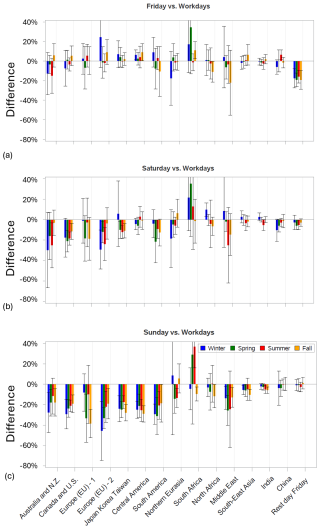
Terms responsible for the differences between NO2 on workdays and weekends were included in Model 2 to study the weekend effect in the urban, background, and industrial components separately. Please note that TROPOMI takes measurements in the early afternoon, and the weekend effect estimates presented in this section may not reflect the difference between workdays and weekends for mornings or evenings. The results for the background and urban components are shown in Figs. 5–8 in percent of weekday values. Most countries have a 5 d workweek with Saturday and Sunday as a 2 d weekend, although many Muslim countries have a 2 d weekend on Friday and Saturday. Lower, compared to workdays, NO2 values on Fridays were reported for Saudi Arabia (Butenhoff et al., 2015), Egypt (Khoder, 2009), and Iran (Yousefian et al., 2020). As Fig. 5a shows, a significant difference between the urban component values on Fridays vs. workdays is present in the countries where Friday is a rest day. We grouped all such countries in a special region and excluded them from all other regions when regional averages were calculated for Fig. 7. On average, for the region where Friday is a rest day, the difference is about 30 % with a 1σ uncertainty of about 5 % for all seasons (Fig. 7a). For all other regions, the difference between workdays and Fridays is not significant.
For Sundays, the difference for workdays is about 40 %–50 % for most of the developed countries and between 20 % and 40 % for the others except for the region with the rest day on Friday and China. The absence of the difference for the former region was expected. The lack of a weekend effect in China has been noticed before (Kuerban et al., 2020). Beirle et al. (2003) demonstrated the absence of the weekend effect in China and attributed it to the domination of emissions from power plants and industry in total NOx emissions. In our study, however, such emissions are largely separated from the urban emissions. Moreover, if industrial emissions are misinterpreted as urban emissions, this would inflate the emissions per capita. As Fig. 3b shows, Chinese emissions per capita are not very different from those in other regions. More likely, the lack of the difference is related to the traffic control measures, such as the license plate rationing system: first introduced in Beijing in the late 2000s, such measures on workdays allow cars that have an even last number on their license plates to be able to drive on roads one day, while the cars that have an odd last number on their license plates can go on the road the next day. The rule is now implemented in many Chinese cities including Beijing, Chengdu, Changchun, Shanghai, Guangzhou, Nanchang, and Wuhan used in our study (https://www.beijingesc.com/news/84-beijing-traffic-control-2012-tail-number-limits.html, last access: 12 March 2024). Such measures cut the number of cars on roads by as much as a half on workdays, but they do not limit the number of cars on weekends. Moreover, for major Chinese cities, trucks are not allowed to enter the cities during daytime on workdays to reduce traffic congestion (Wang et al., 2023). No weekend effect was found in North Korea.
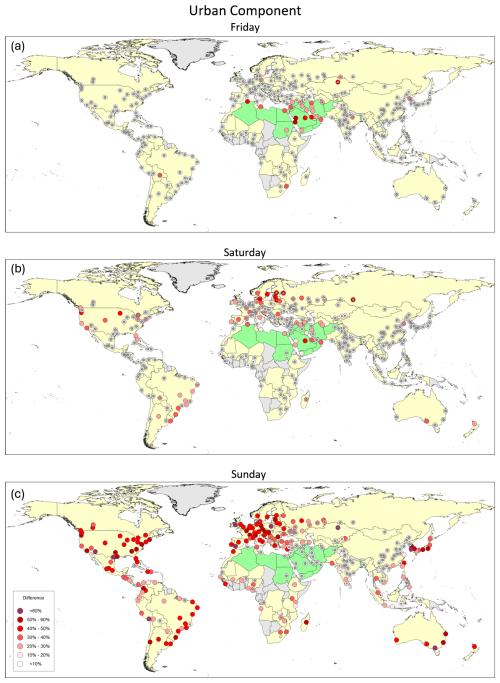
Figure 5The percentage difference between urban components on Monday–Thursday and those on (a) Friday, (b) Saturday, and (c) Sunday. Cities where the difference is below the 3σ level are marked by large gray dots and between the 3 and 5σ level by small gray dots. Countries where Sunday is a rest day are in yellow, and countries where Friday is a rest day are in green.
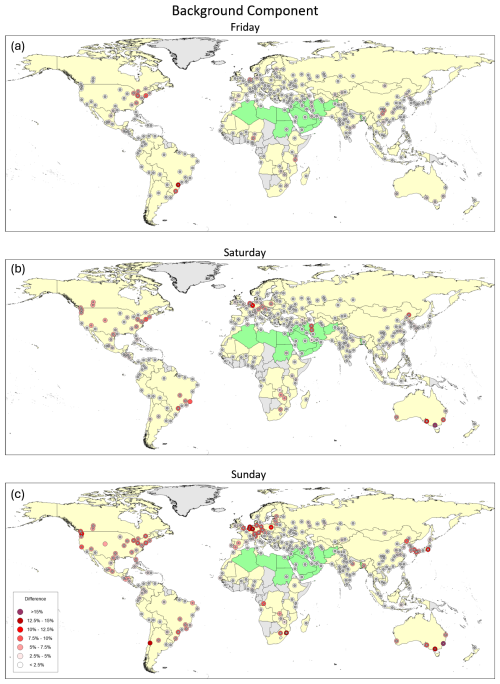
Figure 6The percentage difference between background components on Monday–Thursday and those on (a) Friday, (b) Saturday, and (c) Sunday. Cities where the difference is below the 3σ level are marked by large gray dots and between the 3 and 5σ level by small gray dots. Countries where Sunday is a rest day are in yellow, and countries where Friday is a rest day are in green. Note the difference in the scale from the previous figure.
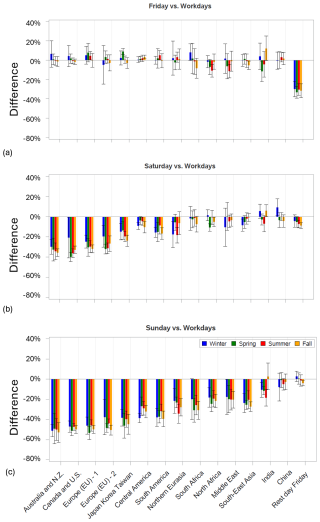
Figure 7The percentage difference between urban components on Monday–Thursday and those on (a) Friday, (b) Saturday, and (c) Sunday for different regions in different seasons. The uncertainty (σ) was calculated as a standard error of the mean. The error bars represent 2σ intervals.
The difference between emission estimates for workdays and Saturday, in general, shows the same pattern as for Sunday, although with a lower amplitude. The difference is about 15 %–30 % for the developed countries and under 20 % for the rest of the world. Saturdays are not always rest days (India), and the difference is not significant there. Saturday is also a rest day in many Muslim countries, and the difference for the region with Friday as a rest day is significant, although not very large (under 10 %).
The difference between workdays and weekends for the background component is very different from that for the urban component. It is under 10 % and not significant almost everywhere (Fig. 8). The only exception are the cities in the Canada and USA region, Europe, and the Japan region, where we can see a difference greater than 10 % in the winter–spring season. These regions and seasons correspond to the areas of the highest background-component values (Fig. 2). However, even in these regions, the difference is nearly zero in summer. This may suggest that even large changes, up to 50 %, in urban emissions over a time period of 1–2 d lead to a rather weak response in the background component even over the areas of its highest levels.
The industrial component is not the focus of this study. The study only includes industrial sources in the vicinity of major cities; the number of such sources and their emissions vary greatly from city to city and do not represent total industrial emissions for a particular country or large region. The plot of the difference between the industrial components on workdays and weekend is included in Appendix C (Fig. C1). It does show smaller emissions on Sundays in most of the regions, although the annual mean difference is typically under 20 % and the uncertainties are large. For the region where Friday is a rest day, the difference is about 15 %, i.e., about a half of that for the urban component.
The 5–6-year period of available TROPOMI observations is still too short to accurately estimate long-term trends, but the plots of NO2 emission changes over different regions during the TROPOMI period can be used to illustrate some regional differences in NO2 assuming that the lifetime is not changing with time. Two statistical models, Model 1 and Model 3, were used for such estimates. Model 1 can be used to estimate urban and industrial emissions as well as the background component for each season in 2018–2023. While the model was used to estimate the components for every city, in this study we focus on major features of the NO2 distribution, and results for large regions are presented here. Estimates for seasons (3-month period) were averaged for large regions, and the standard errors of these averages were calculated. Figure 9 shows the background NO2 estimates for the 14 regions described in Sect. 4.2.
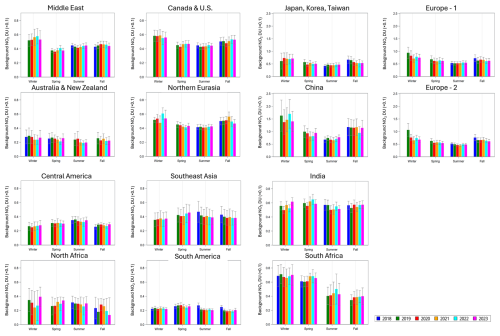
Figure 9The regional mean background component in 10ths of a Dobson unit for 2018–2023 for individual seasons. Note that the vertical scale on panels for China, the Japanese region, and the two European regions is different from the others. The error bars represent 2σ intervals).
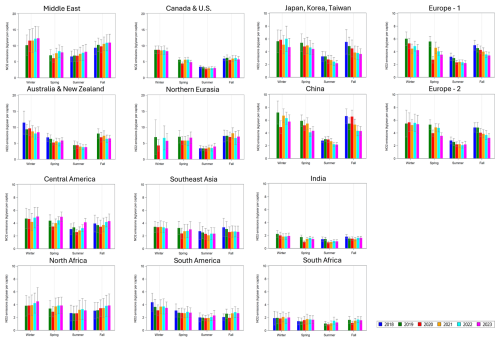
Figure 10The regional mean urban NO2 emissions in kilotonnes per year (kt yr−1) per capita (i.e., NOx emissions reported as NO2) by region for 2018–2023 for individual seasons estimated using Model 1. Note that the vertical scale for the four top-left panels is different from the others. The error bars represent 2σ intervals.
There are clear differences between seasons and between regions as already shown in Fig. 3a. However, the background component does not demonstrate any substantial changes during the analyzed period. Year-to-year variability is typically within the uncertainties with no clear trend. Note that the proxy functions for the urban and background components still can be correlated, which leads to the correlation of the parameter estimates: the urban component could be overestimated, and, at the same time, the background component would be underestimated and vice versa. That makes the interpretation of results more difficult: changes in the urban component could be partially attributed to the background-component changes. To avoid that problem, Model 3 was introduced. Model 3 assumes that there are no changes in the background and industrial emissions over time. This can potentially affect the urban emission estimates in the opposite side: if there are changes in background or industrial components, they could be misinterpreted as changes in the urban component. Model 3 also takes the weekend effect into account, which reduces the uncertainties of the parameters. We found that both models give very similar results. Changes in urban emissions are shown in Fig. 10 for Model 1, while the Model 3 results are available in Appendix D (Fig. D1). Note that there were not enough data to estimate wintertime urban emissions for some high-latitudinal cities, particularly in northern Eurasia. To calculate the regional average, estimates from at least four cities were required.
Urban emissions per capita estimated using Model 1 for 14 regions in different years and seasons are shown in Fig. 10. For the Middle East, the region with the highest emissions per capita, there is an overall increase in emissions. A positive trend in that region was also noticed by Goldberg et al. (2021b). The lowest emissions were seen in the spring and summer of 2020, and they are likely related to the emissions decline due to the COVID-19 restrictions. The region with the second-highest emissions per capita, Australia and New Zealand, demonstrates the opposite tendency: emissions there tend to decline in all seasons. The COVID-19 restriction apparently had some impact on urban emissions during the austral fall of 2020, and the values were lower than in the springs of 2019 and 2021, although 2022–2023 values were even lower. For the Canada and the US region and for northern Eurasia, there is no clear trend in all seasons. The 2020 values were the lowest in spring and summer for both regions.
Both European regions demonstrate nearly the same urban emission values and declining tendencies in all seasons except winter. Note that winter values have high uncertainties due to unfavourable measurement conditions and limited number of high-quality data. The spring 2020 values were about 40 % and 20 % lower than those of 2019 for the Europe-1 and Europe-2 regions. They were also lower than the 2021 values. It is interesting to note that springtime 2023 values for Europe-2 were even lower than the 2020 values. The Japan region also demonstrated some decline in urban emissions. The 2020 springtime values were also lower than those in 2019 and 2021. A decline in spring, summer, and fall can also be seen in China. In winter, the 2020 value are clearly an outlier that is almost 40 % lower than the values in 2019 and 2021. It is probably a result of the COVID-19 restrictions that started in January (Tian et al., 2020). All other regions do not demonstrate any clear tendencies in urban emissions. One interesting feature is a very large, about 50 %, decline in urban emissions from India in the spring and summer of 2020 that is likely also related to the COVID-19 restrictions.
Contributions from industrial sources, urban areas, and background levels to the observed satellite tropospheric NO2 VCDs were studied using statistical regression models. Three models were developed to analyze these three components, assess the weekend impact on each of them, and look at the changes during 2018–2023. The analysis was done for 261 major 3° by 4° urban areas around the world grouped into 14 large regions. The statistical models and estimation algorithms were based on our previous study (Fioletov et al., 2022). The background component was considered as a function of the elevation with the assumption of a linear gradient in tropospheric NO2 VCD within the analyzed 3° by 4° areas. It was assumed that urban emissions depend on the population density, and each population grid cell was considered as an emission source with the emissions proportional to the cell population. The industrial component was calculated as emissions from point sources with known locations.
The Middle East is the region of largest emissions per capita. In summer, they are nearly twice those from, for example, Europe. Moreover, there are indications that the emissions are growing there. It is the only region where a clear overall increase in emissions occurred. It is possible that per capita emissions for some cities in the Middle East are overestimated if some industrial sources are located in populated areas; however high per capita values for many cities in that region make this explanation unlikely. It is also possible that population density data in that region are not as accurate as, e.g., over Europe. We saw some examples that the population density data did not exactly match the maps of populated areas. However, again, it is not likely that such a problem exists for multiple cities located in different countries. Also, the upward trend in emissions per capita in that region and a downward trend or an absence of any trend elsewhere may suggest that per capita emissions in the Middle East would likely surpass emissions in other regions.
Emissions per capita for most regions show a clear annual cycle with the highest values in winter that are nearly twice lower in summer. The average annual emissions per capita are typically between 7 and 3 kg yr−1 at mid- and high latitudes and lower, about 2 kg yr−1, for India and southern Africa. Our emission estimates are based on a parameterization of average lifetime as a function of latitude and season (Lange et al., 2022). However, lifetimes for individual cities could be different from this parameterization. In some extreme cases, the difference could be as large as a factor of 2 (Lange et al., 2022, their Fig. 2d), resulting in a difference of a factor of 2 in the estimated emissions. A further investigation of the lifetime dependence on location and season is needed.
Emissions per capita and their changes over time in two European subregions are very similar probably because they were the subject of the same EU regulations. The spring 2020 (the COVID-19 restriction period) values appeared as an outlier with about 40 % lower emissions than in the previous year for Europe-1 and about 20 % lower for Europe-2. The 2023 spring values in Europe were almost as low as the 2020 values in the absence of any restriction measures probably due to an overall long-term decline in emissions.
TROPOMI data demonstrate a strong weekend effect in urban emissions. For cities where Sunday is a rest day, the average differences between Sunday and workday values are 40 %–50 % for developed countries and 20 %–40 % for other countries. China is an exception since it does not show any weekend effect. It may be related to the license plate rationing system that substantially decreases the number of cars on the streets on workdays. For countries where Friday is a rest day, the difference is about 30 %. The difference between emission estimates for workdays and Saturday, in general, shows the same pattern as for Sunday, although the difference is smaller, 15 %–30 % for the developed countries and under 20 % for the rest of the world. The industrial component only included industrial sources in the vicinity of major cities and did not represent total industrial emissions for a particular country or large region. It shows similar patterns to the urban component, although with amplitudes about twice lower.
This study further highlights the importance of the background-component isolation for studies that use satellite tropospheric NO2 VCD data. The distribution of background NO2 within the analyzed areas is modulated by the terrain. The background component includes NO2 from natural sources such as lightning, soil emissions, and wildfires (Hudman et al., 2012; Sha et al., 2021; Zhang et al., 2012), as well as NO2 from anthropogenic emissions that are not directly associated with urban and industrial plumes. The largest background values are seen over the regions of very high anthropogenic emissions such as China and parts of Europe. Nevertheless, the background component is very different from the urban component. The background component does not show the weekend effect, except for Sundays in the winter–spring season for some regions in mid- and high latitudes, but even there the difference is 3–4 times smaller than for the urban component. Note that the uncertainties in the difference estimates in winter are large due to unfavourable measurement conditions. A much smaller amplitude of the weekend effect for the background component suggests that large abrupt short-term changes in urban emissions on the timescale of 1–2 d do not immediately affect the background component. It means that the NO2 lifetime in the background component is much longer than the lifetime in the urban and industrial plumes, which is only a few hours.
The approach described in this study can be used to decompose the observed monthly or seasonal TROPOMI measurements into three components and then analyze them separately. For example, to study industrial sources, the two other components can be removed from TROPOMI data. Once the statistical model parameters are estimated, the background component can be calculated using elevation data and the urban component can be calculated using population density and wind data. Then these components are subtracted from the original TROPOMI measurements. This would make the plumes from remaining (industrial) sources more pronounced, and other conventional methods (e.g. Beirle et al., 2019; Ding et al., 2020; McLinden et al., 2016) can be used to detect the source locations. Long-term trends of the impact of the meteorological conditions could also be studied for individual components to make the result interpretation easier. Estimates of background NO2 and emissions per capita for large regions can also be used as a benchmark. Individual cities can be compared to their regional benchmarks to determine if NO2 levels for a particular city are different from average conditions of the region.
The separation of the background component from urban and industrial plumes could also be very valuable for interpreting data from geostationary satellite instruments such as TEMPO, GEMS, and Sentinel-4. The background component should have diurnal variations that are different from these in the plumes, or, perhaps, it has no diurnal variations at all. Estimating and then subtracting diurnal variations in the background-component geostationary satellite data would again make the urban and industrial plumes more pronounced, which would make it easier to study diurnal NO2 variations in such plumes.
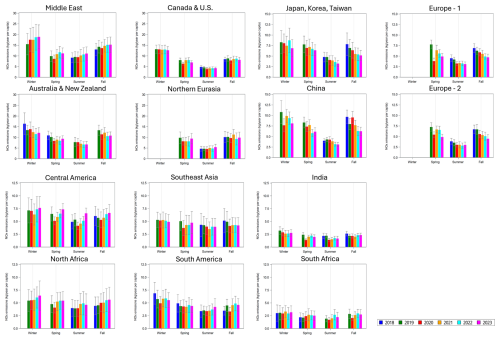
Figure A2Similar to Fig. 10 but for NOx emissions. The regional mean urban NOx emissions in kilotonnes per year (kt yr−1) per capita by region for 2018–2023 for individual seasons estimated using Model 1. The error bars represent 2σ intervals.
Beirle et al. (2021) suggested a way to scale tropospheric NO2 VCD to tropospheric NOx VCD using temperature and ozone mixing ratio reanalysis data. The same approach was also used by Lange et al. (2022). In this study we estimated the potential impact of such NO2 to NOx upscaling for the calculated emissions per capita.
where J is the photolysis frequency and k is the reaction rate constant for the reaction of NO with O3 (Dickerson et al., 1982; Atkinson et al., 2004):
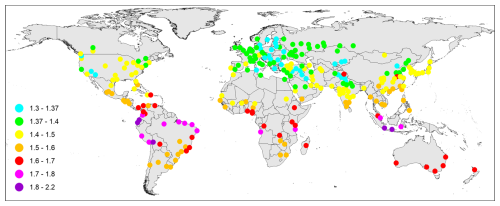
The ozone concentration and temperature profiles as well as surface pressure and geopotential height were obtained from Modern-Era Retrospective analysis for Research and Applications, Version 2 (MERRA-2), reanalysis (https://daac.gsfc.nasa.gov/datasets/M2I3NPASM_5.12.4/summary, last access: 25 June 2024). The reanalysis data have a 3 h temporal resolution, and only the data within solar zenith angle (SZA) < 65° are included in the ratio calculation. To match with TROPOMI observations, wintertime data have also been excluded (i.e., for cities with latitude > 40°, December, January, and February data have been removed; for cities with latitude 40°, June, July, and August data have been removed). The average estimated ratios are typically between 1.3 and 1.8 as shown in Fig. A1 with some seasonal dependence. Thus, the NOx emissions per capita are typically 30 %–80 % higher than NO2 emissions (Fig. A2).
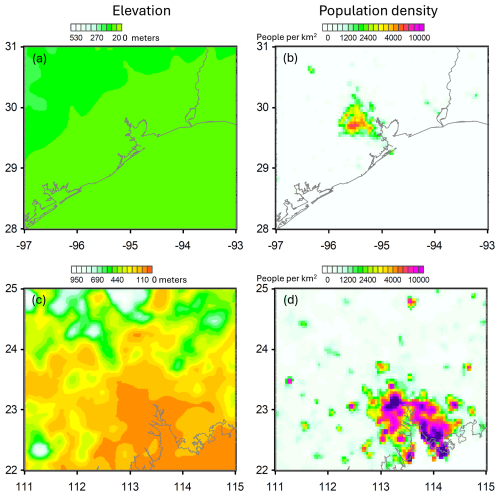
Figure B1Elevation (a, c) and population density (b, d) maps for Houston (a, b) and Guangzhou (c, d). The elevation map uses a colour scale that is similar to that for the elevation-related (“background”) component (Fig. 1). The elevation range is from 0 to 150 m for Houston and from 0 to 900 m for Guangzhou.
Changes in the urban component estimated using Model 1 could be partially attributed to the background and industrial component changes. To avoid that problem, Model 3 was introduced. Unlike Model 1, Model 3 assumes that there are no changes in the background and industrial emissions over time. Thus, all changes over time in NO2 would be attributed to the urban component. However, Fig. C1 shows that Model 3 results are similar to these for Model 1 (Fig. 10). Note that Model 3 also includes terms that account for the weekend effect in order to produce a better fit. Model 3 includes the ( term, and the total emissions can be calculated as αpΩp ⋅ ().
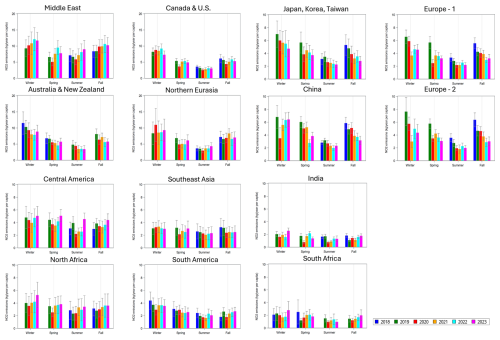
Figure D1Similar to Fig. 10 but for Model 3 outputs. The regional mean urban NO2 emissions in kilotonnes per year (kt yr−1) per capita (i.e., NOx emissions reported as NO2) by region for 2018–2023 for individual seasons estimated using Model 3. Note that the vertical scale for the four top-left panels is different from the others. The error bars represent 2σ intervals.
The TROPOMI NO2 product is publicly available on the Copernicus Sentinel-5P data hub (https://dataspace.copernicus.eu/explore-data/data-collections/sentinel-data/sentinel-5p, last access: 25 June 2024, https://doi.org/10.5270/S5P-9bnp8q8, CS5, 2021). The NO2 data used were the reprocessed (RPRO) v2.4 (until July 2022) and offline mode (OFFL) v2.4 and 2.5 (end of July 2022–November 2023) data. The Gridded Population of the World (GPW) data set is available from NASA Socioeconomic Data and Applications Center at https://sedac.ciesin.columbia.edu/data/collection/gpw-v4 (SEDAC, 2017) (last access: 25 June 2024). The European Centre for Medium-Range Weather Forecasts (ECMWF) ERA5 reanalysis data are available from https://cds.climate.copernicus.eu/cdsapp#!/dataset/reanalysis-era5-complete (C3S, 2017 last access: 25 June 2024). Elevation data are from the gridded global relief ETOPO2v2 database (https://www.ngdc.noaa.gov/mgg/global/etopo2.html NOAA, 2006), last access: 25 June 2024).
VF analyzed the data and prepared the paper with input and critical feedback from all the co-authors. CM and DG generated the TROPOMI data subsets for the analysis. XZ performed calculations for the NOx upscaling. HE provided the TROPOMI NO2 data product and related information. All authors read and agreed on the published version of the paper.
The contact author has declared that none of the authors has any competing interests.
Publisher's note: Copernicus Publications remains neutral with regard to jurisdictional claims made in the text, published maps, institutional affiliations, or any other geographical representation in this paper. While Copernicus Publications makes every effort to include appropriate place names, the final responsibility lies with the authors.
The Sentinel-5 Precursor is a European Space Agency (ESA) mission on behalf of the European Commission. The TROPOMI payload is a joint development by ESA and the Netherlands Space Office (NSO). The Sentinel-5 Precursor ground segment development has been funded by ESA and with national contributions from the Netherlands, Germany, and Belgium. The Sentinel-5 Precursor TROPOMI Level 2 product has been developed with funding from the NSO and processed with funding from ESA.
This paper was edited by Thomas Karl and reviewed by Josh Laughner and one anonymous referee.
Ass, K. E., Eddaif, A., Radey, O., Aitzaouit, O., Yakoubi, M. E., and Chelhaoui, Y.: Effect of restricted emissions during Covid-19 lockdown on air quality in Ra bat-Morocco, Global NEST J., 22, 348–353, https://doi.org/10.30955/gnj.003431, 2020.
Aydın, S., Nakiyingi, B. A., Esmen, C., Güneysu, S., and Ejjada, M.: Environmental impact of coronavirus (COVID-19) from Turkish perceptive, Environ. Dev. Sustain., 23, 7573–7580, https://doi.org/10.1007/s10668-020-00933-5, 2020.
Bao, R. and Zhang, A.: Does lockdown reduce air pollution? Evidence from 44 cities in northern China, Sci. Total Environ., 731, https://doi.org/10.1016/j.scitotenv.2020.139052, 2020.
Barré, J., Petetin, H., Colette, A., Guevara, M., Peuch, V.-H., Rouil, L., Engelen, R., Inness, A., Flemming, J., Pérez García-Pando, C., Bowdalo, D., Meleux, F., Geels, C., Christensen, J. H., Gauss, M., Benedictow, A., Tsyro, S., Friese, E., Struzewska, J., Kaminski, J. W., Douros, J., Timmermans, R., Robertson, L., Adani, M., Jorba, O., Joly, M., and Kouznetsov, R.: Estimating lockdown-induced European NO2 changes using satellite and surface observations and air quality models, Atmos. Chem. Phys., 21, 7373–7394, https://doi.org/10.5194/acp-21-7373-2021, 2021.
Bauwens, M., Compernolle, S., Stavrakou, T., Müller, J. F., van Gent, J., Eskes, H., Levelt, P. F., van der A, R., Veefkind, J. P., Vlietinck, J., Yu, H., and Zehner, C.: Impact of Coronavirus Outbreak on NO2 Pollution Assessed Using TROPOMI and OMI Observations, Geophys. Res. Lett., 47, 1–9, https://doi.org/10.1029/2020GL087978, 2020.
Beirle, S., Platt, U., Wenig, M., and Wagner, T.: Weekly cycle of NO2 by GOME measurements: a signature of anthropogenic sources, Atmos. Chem. Phys., 3, 2225–2232, https://doi.org/10.5194/acp-3-2225-2003, 2003.
Beirle, S., Boersma, K. F., Platt, U., Lawrence, M. G., and Wagner, T.: Megacity emissions and lifetimes of nitrogen oxides probed from space, Science, 80, 1737–1739, https://doi.org/10.1126/science.1207824, 2011.
Beirle, S., Hörmann, C., Penning de Vries, M., Dörner, S., Kern, C., and Wagner, T.: Estimating the volcanic emission rate and atmospheric lifetime of SO2 from space: a case study for Kilauea volcano, Hawai'i, Atmos. Chem. Phys., 14, 8309–8322, https://doi.org/10.5194/acp-14-8309-2014, 2014.
Beirle, S., Borger, C., Dörner, S., Li, A., Hu, Z., Liu, F., Wang, Y. and Wagner, T.: Pinpointing nitrogen oxide emissions from space, Sci. Adv., 5, 1–6, https://doi.org/10.1126/sciadv.aax9800, 2019.
Beirle, S., Borger, C., Dörner, S., Eskes, H., Kumar, V., de Laat, A., and Wagner, T.: Catalog of NOx emissions from point sources as derived from the divergence of the NO2 flux for TROPOMI, Earth Syst. Sci. Data, 13, 2995–3012, https://doi.org/10.5194/essd-13-2995-2021, 2021.
Boersma, K. F., Eskes, H. J., Brinksma, E. J.: Error analysis for tropospheric NO2 retrieval from space, J. Geophys. Res., 109, D04311, https://doi.org/10.1029/2003JD003962, 2004.
Burns, D. A., Gay, D. A., and Lehmann, C. M. B.: Acid rain and its environmental effects: Recent scientific advances, Atmos. Environ., 146, 1–4, https://doi.org/10.1016/J.ATMOSENV.2016.10.019, 2016.
Butenhoff, C. L., Khalil, M. A. K., Porter, W. C., Al-Sahafi, M. S., Almazroui, M., and Al-Khalaf, A.: Evaluation of ozone, nitrogen dioxide, and carbon monoxide at nine sites in Saudi Arabia during 2007, J. Air Waste Manag. Assoc., 65, 871–886, https://doi.org/10.1080/10962247.2015.1031921, 2015.
C3S: Copernicus Climate Change Service (C3S): ERA5: Fifth generation of ECMWF atmospheric reanalyses of the global climate, Copernicus Climate Change Service Climate Data Store (CDS) [data set], https://cds.climate.copernicus.eu/cdsapp#!/dataset/reanalysis-era5-complete (last access: 20 June 2020), 2017.
CS5: Copernicus Sentinel-5P (processed by ESA), TROPOMI Level 2 Nitrogen Dioxide total column products, Version 02, European Space Agency [data set], https://doi.org/10.5270/S5P-9bnp8q8, 2021.
Cleveland, W. S., Graedel, T. E., Kleiner, B., and Warner, J. L.: Sunday And workday variations in photochemical air pollutants in New-Jersey and New-York, Science, 186, 1037–1038, 1974.
Dammers, E., McLinden, C. A., Griffin, D., Shephard, M. W., Van Der Graaf, S., Lutsch, E., Schaap, M., Gainairu-Matz, Y., Fioletov, V., Van Damme, M., Whitburn, S., Clarisse, L., Cady-Pereira, K., Clerbaux, C., Coheur, P. F., and Erisman, J. W.: NH3 emissions from large point sources derived from CrIS and IASI satellite observations, Atmos. Chem. Phys., 19, 12261–12293, https://doi.org/10.5194/acp-19-12261-2019, 2019.
Dang, R., Jacob, D. J., Shah, V., Eastham, S. D., Fritz, T. M., Mickley, L. J., Liu, T., Wang, Y., and Wang, J.: Background nitrogen dioxide (NO2) over the United States and its implications for satellite observations and trends: effects of nitrate photolysis, aircraft, and open fires, Atmos. Chem. Phys., 23, 6271–6284, https://doi.org/10.5194/acp-23-6271-2023, 2023.
Dee, D. P., Uppala, S. M., Simmons, A. J., Berrisford, Poli, P., Kobayashi, S., Andrae, U., Balmaseda, M. A., Balsamo, G., Bauer, P., Bechtold, P., Beljaars, A. C. M., Berg, L. van de, Bidlot, J., Bormann, N., Delsol, C., Dragani, R., Fuentes, M., Geer, A. J., Haimberger, L., Healy, S. B., Hersbach, H., Hólm, E. V., Isaksen, L., Kållberg, P., Köhler, M., Matricardi, M., McNally, A. P., Monge-Sanz, B. M., Morcrette, J.-J., Park, B.-K., Peubey, C., Rosnay, P. de, Tavolato, C., Thépaut, J.-N., and Vitart, F.: The ERA-Interim reanalysis: Configuration and performance of the data assimilation system, Q. J. Roy. Meteorol. Soc., 137, 553–597, https://doi.org/10.1002/qj.828, 2011.
de Foy, B., Lu, Z., Streets, D. G., Lamsal, L. N., and Duncan, B. N.: Estimates of power plant NOx emissions and lifetimes from OMI NO2 satellite retrievals, Atmos. Environ., 116, 1–11, https://doi.org/10.1016/j.atmosenv.2015.05.056, 2015.
Ding, J., van der A, R. J., Eskes, H. J., Mijling, B., Stavrakou, T., van Geffen, J. H. G. M., and Veefkind, J. P.: NOx Emissions Reduction and Rebound in China Due to the COVID-19 Crisis, Geophys. Res. Lett., 47, e2020GL089912, https://doi.org/10.1029/2020GL089912, 2020.
Domínguez-López, D., Adame, J. A., Hernández-Ceballos, M. A., Vaca, F., La Morena, B. A. D., and Bolívar, J. P.: Spatial and temporal variation of surface ozone, NO and NO2 at urban, suburban, rural and industrial sites in the southwest of the Iberian Peninsula, Environ. Monit. Assess., 186, 5337–5351, https://doi.org/10.1007/s10661-014-3783-9, 2014.
Duncan, B. N., Lamsal, L. N., Thompson, A. M., Yoshida, Y., Lu, Z., Streets, D. G., Hurwitz, M. M., and Pickering, K. E.: A space-based, high-resolution view of notable changes in urban NOx pollution around the world (2005–2014), J. Geophys. Res.-Atmos., 121(X), 976–996, https://doi.org/10.1002/2015JD024121, 2015.
Elkus, B. and Wilson, K. R.: Photochemical air pollution – Week- end weekday differences, Atmos. Environ., 11, 509–515, 1977
EPA: U.S. Environmental Protection Agency (EPA) National Emissions Inventory, https://www.epa.gov/air-emissions-inventories (last access: 17 July 2020), 2020.
Fioletov, V., McLinden, C. A., Kharol, S. K., Krotkov, N. A., Li, C., Joiner, J., Moran, M. D., Vet, R., Visschedijk, A. J. H., and Denier van der Gon, H. A. C.: Multi-source SO2 emission retrievals and consistency of satellite and surface measurements with reported emissions, Atmos. Chem. Phys., 17, 12597–12616, https://doi.org/10.5194/acp-17-12597-2017, 2017.
Fioletov, V., McLinden, C. A., Griffin, D., Krotkov, N., Liu, F., and Eskes, H.: Quantifying urban, industrial, and background changes in NO2 during the COVID-19 lockdown period based on TROPOMI satellite observations, Atmos. Chem. Phys., 22, 4201–4236, https://doi.org/10.5194/acp-22-4201-2022, 2022.
Fioletov, V. E., McLinden, C. A., Krotkov, N. and Li, C.: Lifetimes and emissions of SO2 from point sources estimated from OMI, Geophys. Res. Lett., 42, 1969–1976, https://doi.org/10.1002/2015GL063148, 2015.
Fioletov, V. E., McLinden, C. A., Griffin, D., Abboud, I., Krotkov, N., Leonard, P. J. T., Li, C., Joiner, J., Theys, N., and Carn, S.: Version 2 of the global catalogue of large anthropogenic and volcanic SO2 sources and emissions derived from satellite measurements, Earth Syst. Sci. Data, 15, 75–93, https://doi.org/10.5194/essd-15-75-2023, 2023.
Gkatzelis, G. I., Gilman, J. B., Brown, S. S., Eskes, H., Gomes, A. R., Lange, A. C., McDonald, B. C., Peischl, J., Petzold, A., Thompson, C. R., and Kiendler-Scharr, A.: The global impacts of COVID-19 lockdowns on urban air pollution: A critical review and recommendations, Elementa, 9, 1, https://doi.org/10.1525/elementa.2021.00176, 2021.
Goldberg, D. L., Anenberg, S. C., Griffin, D., McLinden, C. A., Lu, Z., and Streets, D. G.: Disentangling the impact of the COVID-19 lockdowns on urban NO2 from natural variability, Geophys. Res. Lett., 47, e2020GL089269, https://doi.org/10.1029/2020GL089269, 2020.
Goldberg, D. L., Anenberg, S. C., Kerr, G. H., Mohegh, A., Lu, Z. and Streets, D. G.: TROPOMI NO2 in the United States: A Detailed Look at the Annual Averages, Weekly Cycles, Effects of Temperature, and Correlation With Surface NO2 Concentrations, Earth's Futur., 9, e2020EF001665, https://doi.org/10.1029/2020EF001665, 2021a.
Goldberg, D. L., Anenberg, S. C., Lu, Z., Streets, D. G., and Lamsal, L. N.: Urban NOx emissions around the world declined faster than anticipated between 2005 and 2019, Environ. Res. Lett., 16, 115004, https://doi.org/10.1088/1748-9326/ac2c3, 2021b.
Griffin, D., McLinden, C. A., Racine, J., Moran, M. D., Fioletov, V., Pavlovic, R., Mashayekhi, R., Zhao, X., and Eskes, H.: Assessing the impact of corona-virus-19 on nitrogen dioxide levels over southern Ontario, Canada, Remote Sens., 12, 1–13, https://doi.org/10.3390/rs12244112, 2020.
Health Canada: Human health risk assessment for ambient nitrogen dioxide, https://www.canada.ca/en/health-canada/services/publications/healthy-living/human-health-risk-assessment-ambient-nitrogen-dioxide.html (last access: 24 April 2024), 2018.
Hersbach, H., Bell, B., Berrisford, P., Hirahara, S., Horányi, A., Muñoz-Sabater, J., Nicolas, J., Peubey, C., Radu, R., Schepers, D., Simmons, A., Soci, C., Abdalla, S., Abellan, X., Balsamo, G., Bechtold, P., Biavati, G., Bidlot, J., Bonavita, M., De Chiara, G., Dahlgren, P., Dee, D., Diamantakis, M., Dragani, R., Flemming, J., Forbes, R., Fuentes, M., Geer, A., Haimberger, L., Healy, S., Hogan, R. J., Hólm, E., Janisková, M., Keeley, S., Laloyaux, P., Lopez, P., Lupu, C., Radnoti, G., de Rosnay, P., Rozum, I., Vamborg, F., Villaume, S., and Thépaut, J.-N.: The ERA5 global reanalysis, Q. J. Roy. Meteorol. Soc., 146, 1999–2049, https://doi.org/10.1002/qj.3803, 2020.
Hudman, R. C., Moore, N. E., Mebust, A. K., Martin, R. V., Russell, A. R., Valin, L. C., and Cohen, R. C.: Steps towards a mechanistic model of global soil nitric oxide emissions: implementation and space based-constraints, Atmos. Chem. Phys., 12, 7779–7795, https://doi.org/10.5194/acp-12-7779-2012, 2012.
Jeong, U. and Hong, H.: Assessment of Tropospheric Concentrations of NO2 from the TROPOMI/Sentinel-5 Precursor for the Estimation of Long-Term Exposure to Surface NO2 over South Korea, Remote Sens., 13, 1877, https://doi.org/10.3390/rs13101877, 2021.
Kanniah, K. D., Kamarul Zaman, N. A. F., Kaskaoutis, D. G., and Latif, M. T.: COVID-19's impact on the atmospheric environment in the Southeast Asia region, Sci. Total Environ., 736, 139658, https://doi.org/10.1016/j.scitotenv.2020.139658, 2020.
Kaynak, B., Hu, Y., Martin, R. V, Sioris, C. E., and Russell, A. G.: Comparison of weekly cycle of NO2 satellite retrievals and NOx emission inventories for the continental United States, J. Geophys. Res.-Atmos., 114, D05302, https://doi.org/10.1029/2008JD010714, 2009.
Keller, C. A., Evans, M. J., Knowland, K. E., Hasenkopf, C. A., Modekurty, S., Lucchesi, R. A., Oda, T., Franca, B. B., Mandarino, F. C., Díaz Suárez, M. V., Ryan, R. G., Fakes, L. H., and Pawson, S.: Global impact of COVID-19 restrictions on the surface concentrations of nitrogen dioxide and ozone, Atmos. Chem. Phys., 21, 3555–3592, https://doi.org/10.5194/acp-21-3555-2021, 2021.
Khoder, M. I.: Diurnal, seasonal and weekdays-weekends variations of ground level ozone concentrations in an urban area in greater Cairo, Environ. Monit. Assess., 149, 349–362, https://doi.org/10.1007/s10661-008-0208-7, 2009.
Kim, J., Jeong, U., Ahn, M.-H., Kim, J. H., Park, R. J., Lee, H., Song, C. H., Choi, Y.S., Lee, K.-J., Yoo, J.-M., Jeong, M.-J., Park, S. K., Lee, K.-M., Song, C.-K., Kim, S.-W., Kim, Y. J., Kim, S.-W., Kim, M., Go, S., Liu, X., Chance, K., Miller, C. C., Al-Saadi, J., Veihelmann, B., Bhartia, P. K., Torres, O., González Abad, G., Haffner, D. P., Ko, D. H., Lee, S. H., Woo, J.-H., Chong, H., Park, S. S., Nicks, D., Choi, W. J., Moon, K.-J., Cho, A., Yoon, J., Kim, S.-K., Hong, H., Lee, K., Lee, H., Lee, S., Choi, M., Veekfind, P., Levelt, P. F., Edwards, D. P., Kang, M., Eo, M., Bak, J., Baek, K., Kwon, H.-A., Yang, J., Park, J., Han, K. M., Kim, B.-R., Shin, H.-W., Choi, H., Lee, E., Chong, J., Cha, Y., Koo, J.-H., Irie, H., Hayashida, S., Kasai, Y., Kanaya, Y., Liu, C., Lin, J., Crawford, J. H., Carmichael, G. R., Newchurch, M. J., Lefer, B. L., Herman, J. R., Swap, R. J., Lau, A. K. H., Kurosu, T. P., Jaross, G., Ahlers, B., Dobber, M., McElroy, C. T., and Choi, Y.: New Era of Air Quality Monitoring from Space: Geostationary Environment Monitoring Spectrometer (GEMS), B. Am. Meteor. Soc., 101, E1–E22, https://doi.org/10.1175/BAMS-D-18-0013.1, 2020.
Konovalov, I. B., Beekmann, M., Richter, A., and Burrows, J. P.: Inverse modelling of the spatial distribution of NOx emissions on a continental scale using satellite data, Atmos. Chem. Phys., 6, 1747–1770, https://doi.org/10.5194/acp-6-1747-2006, 2006.
Koukouli, M.-E., Skoulidou, I., Karavias, A., Parcharidis, I., Balis, D., Manders, A., Segers, A., Eskes, H., and van Geffen, J.: Sudden changes in nitrogen dioxide emissions over Greece due to lockdown after the outbreak of COVID-19, Atmos. Chem. Phys., 21, 1759–1774, https://doi.org/10.5194/acp-21-1759-2021, 2021.
Krotkov, N. A., McLinden, C. A., Li, C., Lamsal, L. N., Celarier, E. A., Marchenko, S. V., Swartz, W. H., Bucsela, E. J., Joiner, J., Duncan, B. N., Boersma, K. F., Veefkind, J. P., Levelt, P. F., Fioletov, V. E., Dickerson, R. R., He, H., Lu, Z., and Streets, D. G.: Aura OMI observations of regional SO2 and NO2 pollution changes from 2005 to 2015, Atmos. Chem. Phys., 16, 4605–4629, https://doi.org/10.5194/acp-16-4605-2016, 2016.
Kuerban, M., Waili, Y., Fan, F., Liu, Y., Qin, W., Dore, A. J., Peng, J., Xu, W., and Zhang, F.: Spatio-temporal patterns of air pollution in China from 2015 to 2018 and implications for health risks, Environ. Pollut., 258, 113659, https://doi.org/10.1016/j.envpol.2019.113659, 2020.
Lamsal, L. N., Duncan, B. N., Yoshida, Y., Krotkov, N. a., Pickering, K. E., Streets, D. G. and Lu, Z.: U.S. NO2 trends (2005–2013): EPA Air Quality System (AQS) data versus improved observations from the Ozone Monitoring Instrument (OMI), Atmos. Environ., 110, 130–143, https://doi.org/10.1016/j.atmosenv.2015.03.055, 2015.
Lange, K., Richter, A., and Burrows, J. P.: Variability of nitrogen oxide emission fluxes and lifetimes estimated from Sentinel-5P TROPOMI observations, Atmos. Chem. Phys., 22, 2745–2767, https://doi.org/10.5194/acp-22-2745-2022, 2022.
Laughner, J. and Cohen, R. C.: Direct observation of changing NOx lifetime in North American cities, Science, 366, 723–727, 2019.
Levelt, P. F., Joiner, J., Tamminen, J., Veefkind, J. P., Bhartia, P. K., Stein Zweers, D. C., Duncan, B. N., Streets, D. G., Eskes, H., van der A, R., McLinden, C., Fioletov, V., Carn, S., de Laat, J., DeLand, M., Marchenko, S., McPeters, R., Ziemke, J., Fu, D., Liu, X., Pickering, K., Apituley, A., González Abad, G., Arola, A., Boersma, F., Chan Miller, C., Chance, K., de Graaf, M., Hakkarainen, J., Hassinen, S., Ialongo, I., Kleipool, Q., Krotkov, N., Li, C., Lamsal, L., Newman, P., Nowlan, C., Suleiman, R., Tilstra, L. G., Torres, O., Wang, H., and Wargan, K.: The Ozone Monitoring Instrument: overview of 14 years in space, Atmos. Chem. Phys., 18, 5699–5745, https://doi.org/10.5194/acp-18-5699-2018, 2018.
Liu, F., Beirle, S., Zhang, Q., Dörner, S., He, K., and Wagner, T.: NOx lifetimes and emissions of cities and power plants in polluted background estimated by satellite observations, Atmos. Chem. Phys., 16, 5283–5298, https://doi.org/10.5194/acp-16-5283-2016, 2016.
Liu, F., Page, A., Strode, S. A., Yoshida, Y., Choi, S., Zheng, B., Lamsal, L. N., Li, C., Krotkov, N. A., Eskes, H., Ronald Vander, A., Veefkind, P., Levelt, P., Joiner, J., and Hauser, O. P.: Abrupt declines in tropospheric nitrogen dioxide over China after the outbreak of COVID-19, arXiv, 2, 2–7, 2020.
Lorente, A., Boersma, K. F., Eskes, H. J., Veefkind, J. P., van Geffen, J. H. G. M., de Zeeuw, M. B., van der Gon, H. A. C. D., Beirle, S., and Krol, M. C.: Quantification of nitrogen oxides emissions from build-up of pollution over Paris with TROPOMI, Sci. Rep., 9, 20033, https://doi.org/10.1038/s41598-019-56428-5, 2019.
Lu, Z., Streets, D. G., de Foy, B., Lamsal, L. N., Duncan, B. N., and Xing, J.: Emissions of nitrogen oxides from US urban areas: estimation from Ozone Monitoring Instrument retrievals for 2005–2014, Atmos. Chem. Phys., 15, 10367–10383, https://doi.org/10.5194/acp-15-10367-2015, 2015.
Martin, R. V., Chance, K., Jacob, D. J., Kurosu, T. P., Spurr, R. J. D., Bucsela, E., Gleason, J. F., Palmer, P. I., Bey, I., Fiore, A. M., Li, Q., Yantosca, R. M., and Koelemeijer, R. B. A.: An improved retrieval of tropospheric nitrogen dioxide from GOME, J. Geophys. Res.-Atmos., 107, 4437, https://doi.org/10.1029/2001JD001027, 2002.
McLinden, C. A., Fioletov, V., Shephard, M. W., Krotkov, N., Li, C., Martin, R. V., Moran, M. D., and Joiner, J.: Space-based detection of missing sulfur dioxide sources of global air pollution, Nat. Geosci., 9, 496–500, https://doi.org/10.1038/ngeo2724, 2016.
McLinden, C. A., Adams, C. L. F., Fioletov, V., Griffin, D., Makar, P. A., Zhao, X., Kovachik, A., Dickson, N. M., Brown, C., Krotkov, N., Li, C., Theys, N., Hedelt, P., and Loyola, D. G.: Inconsistencies in sulphur dioxide emissions from the Canadian oil sands and potential implications, Environ. Res. Lett., 16, 014012, https://doi.org/10.1088/1748-9326/abcbbb, 2020.
McLinden, C. A. A., Fioletov, V., Boersma, K. F. F., Krotkov, N., Sioris, C. E. E., Veefkind, J. P. P., and Yang, K.: Air quality over the Canadian oil sands: A first assessment using satellite observations, Geophys. Res. Lett., 39, 1–8, https://doi.org/10.1029/2011GL050273, 2012.
Mijling, B. and Van Der A, R. J.: Using daily satellite observations to estimate emissions of short-lived air pollutants on a mesoscopic scale, J. Geophys. Res.-Atmos., 117, 17302, https://doi.org/10.1029/2012JD017817, 2012.
Murphy, J. G., Day, D. A., Cleary, P. A., Wooldridge, P. J., Millet, D. B., Goldstein, A. H., and Cohen, R. C.: The weekend effect within and downwind of Sacramento – Part 1: Observations of ozone, nitrogen oxides, and VOC reactivity, Atmos. Chem. Phys., 7, 5327–5339, https://doi.org/10.5194/acp-7-5327-2007, 2007.
Nishanth, T., Kumar, M. K. S., and Valsaraj, K. T.: Variations in surface ozone and NOx at Kannur: A tropical, coastal site in India, J. Atmos. Chem., 69, 101–126, https://doi.org/10.1007/s10874-012-9234-5, 2012.
NOAA: 2-Minute Gridded Global Relief Data (ETOPO2v2), NOAA [data set], https://www.ngdc.noaa.gov/mgg/global/etopo2.html (last access: 17 June 2020), 2006.
NPRI: National Pollutant Release Inventory (NPRI). Sulfur oxide emissions for Canada, https://www.canada.ca/en/services/environment/pollution-waste-management/national-pollutant-release-inventory.html (last access: 17 July 2020), 2020.
Pommier, M., McLinden, C. A., and Deeter, M.: Relative changes in CO emissions over megacities based on observations from space, Geophys. Res. Lett., 40, 3766–3771, https://doi.org/10.1002/grl.50704, 2013.
SEDAC: The Gridded Population of the World (GPW), https://sedac.ciesin.columbia.edu/data/collection/gpw-v4 (last access: 25 June 2024), 2017.
Seo, S., Kim, S.-W., Kim, K.-M., Richter, A., Lange, K., Burrows, J. P., Park, J., Hong, H., Lee, H., Jeong, U., and Kim, J.: Diurnal variations of NO2 tropospheric vertical column density over the Seoul Metropolitan Area from the Geostationary Environment Monitoring Spectrometer (GEMS): seasonal differences and impacts of varying a priori NO2 profile data, Atmos. Meas. Tech. Discuss. [preprint], https://doi.org/10.5194/amt-2024-33, in review, 2024.
Sha, T., Ma, X., Zhang, H., Janechek, N., Wang, Y., Wang, Y., Castro Garciá, L., Jenerette, G. D., and Wang, J.: Impacts of Soil NOx Emission on O3 Air Quality in Rural California, Environ. Sci. Technol., 55, 7113–7122, https://doi.org/10.1021/acs.est.0c06834, 2021.
Stark, H.R., Moeller, H., Courreges-Lacoste, G., Koopman, R., Mezzasoma, S., and Veihelmann, B.: The Sentinel-4 mission and its implementation, in: ESA Living Planet Symposium (Vol. 722, p. 139), Cham, Switzerland: Springer International Publishing, https://ui.adsabs.harvard.edu/abs/2013ESASP.722E.139S/abstract (last access: 4 January, 2025), 2013.
Stavrakou, T., Müller, J. F., Bauwens, M., Boersma, K. F., and van Geffen, J.: Satellite evidence for changes in the NO2 weekly cycle over large cities, Sci. Rep., 10, 1–9, https://doi.org/10.1038/s41598-020-66891-0, 2020.
Streets, D. G., Canty, T., Carmichael, G. R., De Foy, B., Dickerson, R. R., Duncan, B. N., Edwards, D. P., Haynes, J. A., Henze, D. K., Houyoux, M. R., Jacob, D. J., Krotkov, N. A., Lamsal, L. N., Liu, Y., Lu, Z., Martin, R. V., Pfister, G. G., Pinder, R. W., Salawitch, R. J., and Wecht, K. J.: Emissions estimation from satellite retrievals: A review of current capability, Atmos. Environ., 77, 1011–1042, https://doi.org/10.1016/j.atmosenv.2013.05.051, 2013.
Thorsen, S.: Time and Date AS web site, Time and Date AS, https://www.timeanddate.com/calendar/ (last access: 15 March 2024), 2024.
Tian, H., Liu, Y., Li, Y., Wu, C. H., Chen, B., Kraemer, M. U. G., Li, B., Cai, J., Xu, B., Yang, Q., Wang, B., Yang, P., Cui, Y., Song, Y., Zheng, P., Wang, Q., Bjornstad, O. N., Yang, R., Grenfell, B. T., Pybus, O. G., and Dye, C.: An investigation of transmission control measures during the first 50 days of the COVID-19 epidemic in China, Science 368, 638–642, https://doi.org/10.1126/science.abb6105, 2020.
Tu, R., Xu, J., Wang, A., Zhai, Z., and Hatzopoulou, M.: Effects of ambient temperature and cold starts on excess NOx emissions in a gasoline direct injection vehicle, Sci. Total Environ., 760, 143402, https://doi.org/10.1016/j.scitotenv.2020.143402, 2021.
Vadrevu, K. P., Eaturu, A., Biswas, S., Lasko, K., Sahu, S., Garg, J. K., and Justice, C.: Spatial and temporal variations of air pollution over 41 cities of India during the COVID-19 lockdown period, Sci. Rep., 10, 1–15, https://doi.org/10.1038/s41598-020-72271-5, 2020.
Veefkind, J. P. P., Aben, I., McMullan, K., Förster, H., de Vries, J., Otter, G., Claas, J., Eskes, H. J. J., de Haan, J. F. F., Kleipool, Q., van Weele, M., Hasekamp, O., Hoogeveen, R., Landgraf, J., Snel, R., Tol, P., Ingmann, P., Voors, R., Kruizinga, B., Vink, R., Visser, H., and Levelt, P. F. F.: TROPOMI on the ESA Sentinel-5 Precursor: A GMES mission for global observations of the atmospheric composition for climate, air quality and ozone layer applications, Remote Sens. Environ., 120, 70–83, https://doi.org/10.1016/j.rse.2011.09.027, 2012.
van Geffen, J., Boersma, K. F., Eskes, H., Sneep, M., ter Linden, M., Zara, M., and Veefkind, J. P.: S5P TROPOMI NO2 slant column retrieval: method, stability, uncertainties and comparisons with OMI, Atmos. Meas. Tech., 13, 1315–1335, https://doi.org/10.5194/amt-13-1315-2020, 2020.
van Geffen, J., Eskes, H., Compernolle, S., Pinardi, G., Verhoelst, T., Lambert, J.-C., Sneep, M., ter Linden, M., Ludewig, A., Boersma, K. F., and Veefkind, J. P.: Sentinel-5P TROPOMI NO2 retrieval: impact of version v2.2 improvements and comparisons with OMI and ground-based data, Atmos. Meas. Tech., 15, 2037–2060, https://doi.org/10.5194/amt-15-2037-2022, 2022.
van Geffen, J. H. G. M., Eskes, H. J., Boersma, K. F., Maasakkers, J. D., and Veefkind, J. P.: TROPOMI ATBD of the total and tropospheric NO2 data products., De Bilt, the Netherlands, s5P-KNMI-L2-0005-RP, http://www.tropomi.eu/sites/default/files/files/publicS5P-KNMI-L2-0005-RP-ATBD_NO2_data_products-20190206_v140.pdf (last access: 17 June 2020), 2018.
Valin, L. C., Russell, A. R., and Cohen, R. C.: Variations of OH radical in an urban plume inferred from NO2 column measurements, Geophys. Res. Lett., 40, 1856–1860, https://doi.org/10.1002/grl.50267, 2013.
Vîrghileanu, M., Săvulescu, I., Mihai, B. A., Nistor, C., and Dobre, R.: Nitrogen dioxide (NO2) pollution monitoring with sentinel-5p satellite imagery over europe during the coronavirus pandemic outbreak, Remote Sens., 12, 1–29, https://doi.org/10.3390/rs12213575, 2020.
Wang, H., Zhao, Z., Ma, Y., Wu, H., and Bao, F.: Sustainable RoadPlanning for Trucks in UrbanizedAreas of Chinese Cities Using DeepLearning Approaches, Sustainability, 15, 8763, https://doi.org/10.3390/su15118763, 2023.
Yousefian, F., Faridi, S., Azimi, F., Aghaei, M., Shamsipour, M., Yaghmaeian, K., and Hassanvand, M. S.: Temporal variations of ambient air pollutants and meteorological influences on their concentrations in Tehran during 2012–2017, Sci. Rep., 10, 292, https://doi.org/10.1038/s41598-019-56578-6, 2020.
Zare, A., Stevanovic, S., Jafari, M., Verma, P., Babaie, M., Yang, L., Rahman, M. M., Zoran, D. Ristovski, Z. D., Brown, R. J., and Bodisco, T. A.: Analysis of cold-start NO2 and NOx emissions, and the NO2/NOx ratio in a diesel engine powered with different diesel-biodiesel blends, Environ. Pollut., 290, 118052, https://doi.org/10.1016/j.envpol.2021.118052, 2021.
Zhang, H., Lin, Y., Wei, S., Loo, B. P. Y., Lai, P. C., Lam, Y. F., Wan, L., and Li, Y.: Global association between satellite-derived nitrogen dioxide (NO2) and lockdown policies under the COVID-19 pandemic, Sci. Total Environ., 761, 144148, https://doi.org/10.1016/j.scitotenv.2020.144148, 2021.
Zhang, L., Jacob, D. J., Knipping, E. M., Kumar, N., Munger, J. W., Carouge, C. C., van Donkelaar, A., Wang, Y. X., and Chen, D.: Nitrogen deposition to the United States: distribution, sources, and processes, Atmos. Chem. Phys., 12, 4539–4554, https://doi.org/10.5194/acp-12-4539-2012, 2012.
Zhao, X., Fioletov, V., Griffin, D., McLinden, C., Staebler, R., Mihele, C., Strawbridge, K., Davies, J., Abboud, I., Lee, S. C., Cede, A., Tiefengraber, M., and Swap, R.: The differences between remote sensing and in situ air pollutant measurements over the Canadian oil sands, Atmos. Meas. Tech., 17, 6889–6912, https://doi.org/10.5194/amt-17-6889-2024, 2024.
Zoogman, P., Liu, X., Suleiman, R. M., Pennington, W. F., Flittner, D. E., Al-Saadi, J. A., Hilton, B. B., Nicks, D. K., Newchurch, M. J., Carr, J. L., Janz, S. J., Andraschko, M. R., Arola, A., Baker, B. D., Canova, B. P., Chan Miller, C., Cohen, R. C., Davis, J. E., Dussault, M. E., Edwards, D. P., Fishman, J., Ghulam, A., González Abad, G., Grutter, M., Herman, J. R., Houck, J., Jacob, D. J., Joiner, J., Kerridge, B. J., Kim, J., Krotkov, N. A., Lamsal, L., Li, C., Lindfors, A., Martin, R. V., McElroy, C. T., McLinden, C., Natraj, V., Neil, D. O., Nowlan, C. R., O'Sullivan, E. J., Palmer, P. I., Pierce, R. B., Pippin, M. R., Saiz-Lopez, A., Spurr, R. J. D., Szykman, J. J., Torres, O., Veefkind, J. P., Veihelmann, B., Wang, H., Wang, J., and Chance, K.: Tropospheric emissions: Monitoring of pollution (TEMPO), J. Quant. Spectrosc. Ra., 186, 17–39, https://doi.org/10.1016/j.jqsrt.2016.05.008, 2016.
- Abstract
- Copyright statement
- Introduction
- Data sets
- The fitting algorithms and statistical models
- Emission estimates for individual urban areas and large regions
- The weekend effect
- Changes in NOx urban emissions
- Discussion and conclusion
- Appendix A: NO2 to NOx upscaling
- Appendix B: Elevation and population density maps
- Appendix C: The weekend effect for the industrial component
- Appendix D: Model 3 estimates
- Data availability
- Author contributions
- Competing interests
- Disclaimer
- Acknowledgements
- Review statement
- References


