the Creative Commons Attribution 4.0 License.
the Creative Commons Attribution 4.0 License.
 | 11 Jun 2025
A 60-year atmospheric nitrate isotope record from a southeastern Greenland ice core with minimal postdepositional alteration
Zhao Wei
Asuka Tsuruta
Zhuang Jiang
Sakiko Ishino
Koji Fujita
Sumito Matoba
Alexis Lamothe
Ryu Uemura
Naohiro Yoshida
Joel Savarino
Yoshinori Iizuka
Stable isotopes of atmospheric nitrate (NO) are valuable tools for tracing nitrogen sources and processes; however, their signals in ice core records are often disrupted by postdepositional processes. The ice core from the southeastern Dome (SE-Dome) in Greenland is a potential record of variations in atmospheric chemistry that has experienced a lower postdepositional effect owing to a high accumulation rate (∼1 m water equivalent per year). Herein, we report 60-year (1959–2014) δ15N(NO) and Δ17O(NO) records from the SE-Dome ice core. The δ15N(NO) decreased from 1960 to 1974 and exhibited clear seasonal changes (high in summer and low in winter). The Δ17O(NO) did not exhibit any significant long-term trends, but it did contain seasonal patterns. The mass-weighted annual average of δ15N(NO) values in the SE-Dome core were 4.2±2.8 ‰ lower than those in the Greenland Summit ice core between 1959 and 2006. The TRansfer of Atmospheric Nitrate Stable Isotopes To the Snow (TRANSITS) model under the SE-Dome condition estimated changes of only 0.9 ‰ for δ15N(NO) and −0.2 ‰ for Δ17O(NO) from the initial deposition. Although differences in the source of NO cannot be discounted, the lower δ15N(NO) values observed at SE-Dome compared to Summit were likely due to reduced postdepositional alteration. Therefore, the SE-Dome ice core NO record offers a precise reconstruction of nitrogen oxides (NOx) emissions from both North America and western Europe, as well as atmospheric oxidation chemistry and transport, thereby providing reliable insight into atmospheric nitrogen cycling.
- Article
(3372 KB) - Full-text XML
-
Supplement
(2233 KB) - BibTeX
- EndNote


Nitrate (NO) and its precursors (NOx= NO + NO2) play important roles in the atmosphere. Tropospheric NOx cycling produces ozone (O3), a key component of the atmospheric oxidative capacity (Finlayson-Pitts and Pitts, 2000). NOx emitted from various sources undergoes oxidation to form HNO3, which contributes to acid rain (Shammas et al., 2020) and particulate matter (as NO; Zhai et al., 2021); moreover, upon deposition, nitrate alters the nutrient balance in ecosystems (Duce et al., 2008). Owing to increasing fossil fuel and chemical fertilizer use since the beginning of the industrial revolution, NOx levels in the atmosphere have increased, which is reflected in the elevated NO concentrations in ice cores, including those collected from Greenland (Neftel et al., 1985; Mayewski et al., 1986). Despite efforts to curb NOx emissions through pollution mitigation measures and NOx removal techniques, including three-way catalytic converters, the decline in the ice core NO concentrations has been relatively gradual, as observed in Greenland (Iizuka et al., 2017) and in an Alpine ice core (Eichler et al., 2023). This underscores the necessity to understand atmospheric NO dynamics beyond just precursor NOx emissions, for which ice core NO can offer invaluable historical perspectives.
In addition to NO concentrations, NO stable isotopic compositions provide valuable information. Nitrogen isotopes (δ15N) differ among NOx sources and can be used to identify the origin of the NO (Hastings, 2010; Hastings et al., 2013). Previous studies of Greenland ice cores have identified decreases in the δ15N values of NO (δ15N(NO) as early as 1850 CE, which subsequently accelerated after 1950 CE (Hastings et al., 2009; Geng et al., 2014). These decreases in δ15N have been interpreted as a change in source: increased anthropogenic emissions of NOx from fossil fuel combustion (Hastings et al., 2009) and/or NOx derived from soil amended with fertilizer (Felix and Elliott, 2013). In addition, complex factors control δ15N(NO). Previous studies have shown that isotopic fractionation can occur during gas–particle partitioning and washout (Freyer, 1991), kinetic NO2 oxidation (Walters and Michalski, 2015a), and NOx cycle equilibrium in the atmosphere (Walters et al., 2015b; Walters and Michalski, 2016). Another interpretation of the decrease in δ15N in ice cores is related to changes in isotopic fractionation between gaseous HNO3 and particulate NO that resulted from acidity changes (Geng et al., 2014). The mass-independent oxygen isotope fractionation signals (Δ17O =δ17O O) of NOx and NO can reflect the oxygen source during oxidation (Michalski et al., 2003; Alexander et al., 2009). Positive Δ17O values of NO (Δ17O(NO) occur as a result of excess 17O (i.e., deviation from mass-dependent fractionation) transferred from O3 to NO during photochemical cycling of NO and NO2 and the oxidation of NO2 into HNO3. Thus, middle to high latitudes have Δ17O(NO) values of 22 ‰–34 ‰ for atmospheric deposition (Michalski et al., 2003, 2012). The Δ17O(NO) measurements in ice cores have also been used to investigate historical atmospheric processes (Geng et al., 2017).
However, postdepositional NO loss in snow or ice can reduce NO concentrations and change its isotopic compositions (Röthlisberger et al., 2000, 2002; Frey et al., 2009; Akers et al., 2022). Indeed, NO in snow can undergo photolysis by ultraviolet (UV) light (λ=290–350 nm; Berhanu et al., 2014), which produces NO2 that is released into the atmosphere via diffusion or wind pumping. Although NO2 can partially reoxidize into NO in the atmosphere, postdepositional processes can lead to decreases in the NO concentrations in ice cores (Meusinger et al., 2014; Erbland et al., 2015). In addition, postdepositional processes can also cause significant isotopic fractionation (from −47.9 ‰ to −55.8 ‰), and the remaining NO becomes enriched in 15N (Berhanu et al., 2015). In contrast, Δ17O(NO) is not directly affected by photolysis but, rather, by the cage effect, in which the intermediate photoproducts (NO2, NO, or ONOO−) undergo recombination reactions within snow grains to reform nitrate with exchange with water oxygen or react with radicals (e.g., OH) to regenerate NO after being emitted to the atmosphere (McCabe et al., 2005; Jiang et al., 2021). The alteration of Δ17O(NO) can also occur through the reoxidation of NO2 sourced from snow, which leads to nitrate formation in the overlying atmosphere (Erbland et al., 2013). Because NO photolysis in snow only occurs in the photic zone, the degree of postdepositional alteration is mostly controlled by the snow accumulation rate, as demonstrated in Antarctica (Akers et al., 2022). Even at the Greenland Summit ice core site, the δ15N(NO) values of the snowpack are higher than those of the surface snow and the overlying atmosphere (Jarvis et al., 2009; Geng et al., 2014; Fibiger et al., 2016). The Greenland Ice Sheet Project 2 (GISP2) ice core exhibits decreasing δ15N(NO) values from glacial to interglacial periods (Hastings et al., 2005; Geng et al., 2015), which has been interpreted as the result of two potential causes: (1) changes in the NOx source or (2) postdepositional effects related to the snow accumulation rate and dust concentrations. Overall, given the impacts of postdepositional processes, ice core records of NO and its isotopes require careful consideration.
Accurate understanding of atmospheric NO and its related nitrogen cycles can be more reliably obtained from ice core records with minimal postdepositional alterations. In this context, the southeastern Dome (SE-Dome) site in Greenland has distinct characteristics, including a snow accumulation rate of 1.01±0.22 m water equivalent per year (m w.e. a−1; for the period from 1960 to 2014; Iizuka et al., 2017), which is approximately 4 times greater than that at the Summit site (0.22±0.05 m w.e. a−1; Fig. 1c; Geng et al., 2014). The relatively high accumulation rate is expected to reduce the impact of postdepositional loss, preserving a more representative record of atmospheric NO deposition. Furthermore, statistical analysis using the Mann–Kendall test for monotonic trends (Kendall, 1975; Mann, 1945) revealed no significant decadal trends in snow accumulation at either the SE-Dome (Kawakami et al., 2023) or the Summit (p>0.05; data from Geng et al., 2014) site, suggesting that within-site accumulation variability does not strongly influence nitrate trends at these locations. The Summit and SE-Dome sites receive atmospheric inputs from similar source regions in North America and western Europe, based on Hybrid Single-Particle Lagrangian Integrated Trajectory (HYSPLIT) 7 d backward-trajectory modeling (Fig. 1b and c). However, the extent to which postdepositional processes affect NO isotopic compositions at these sites has not been systematically assessed. In this study, we present the δ15N(NO) and Δ17O(NO) records obtained from a 90.45 m ice core drilled at the SE-Dome site. By applying the TRansfer of Atmospheric Nitrate Stable Isotopes To the Snow (TRANSITS) model (Erbland et al., 2015; Jiang et al., 2021) with site-specific modifications, we evaluate the extent to which postdepositional processes influence NO at SE-Dome and assess its suitability for reconstructing past atmospheric NOx emissions. Our results demonstrate that SE-Dome preserves a robust NO isotopic signal with minimal postdepositional modification, making it a valuable archive for investigating anthropogenic changes in atmospheric NO over the Northern Hemisphere, particularly from eastern North America and western Europe.
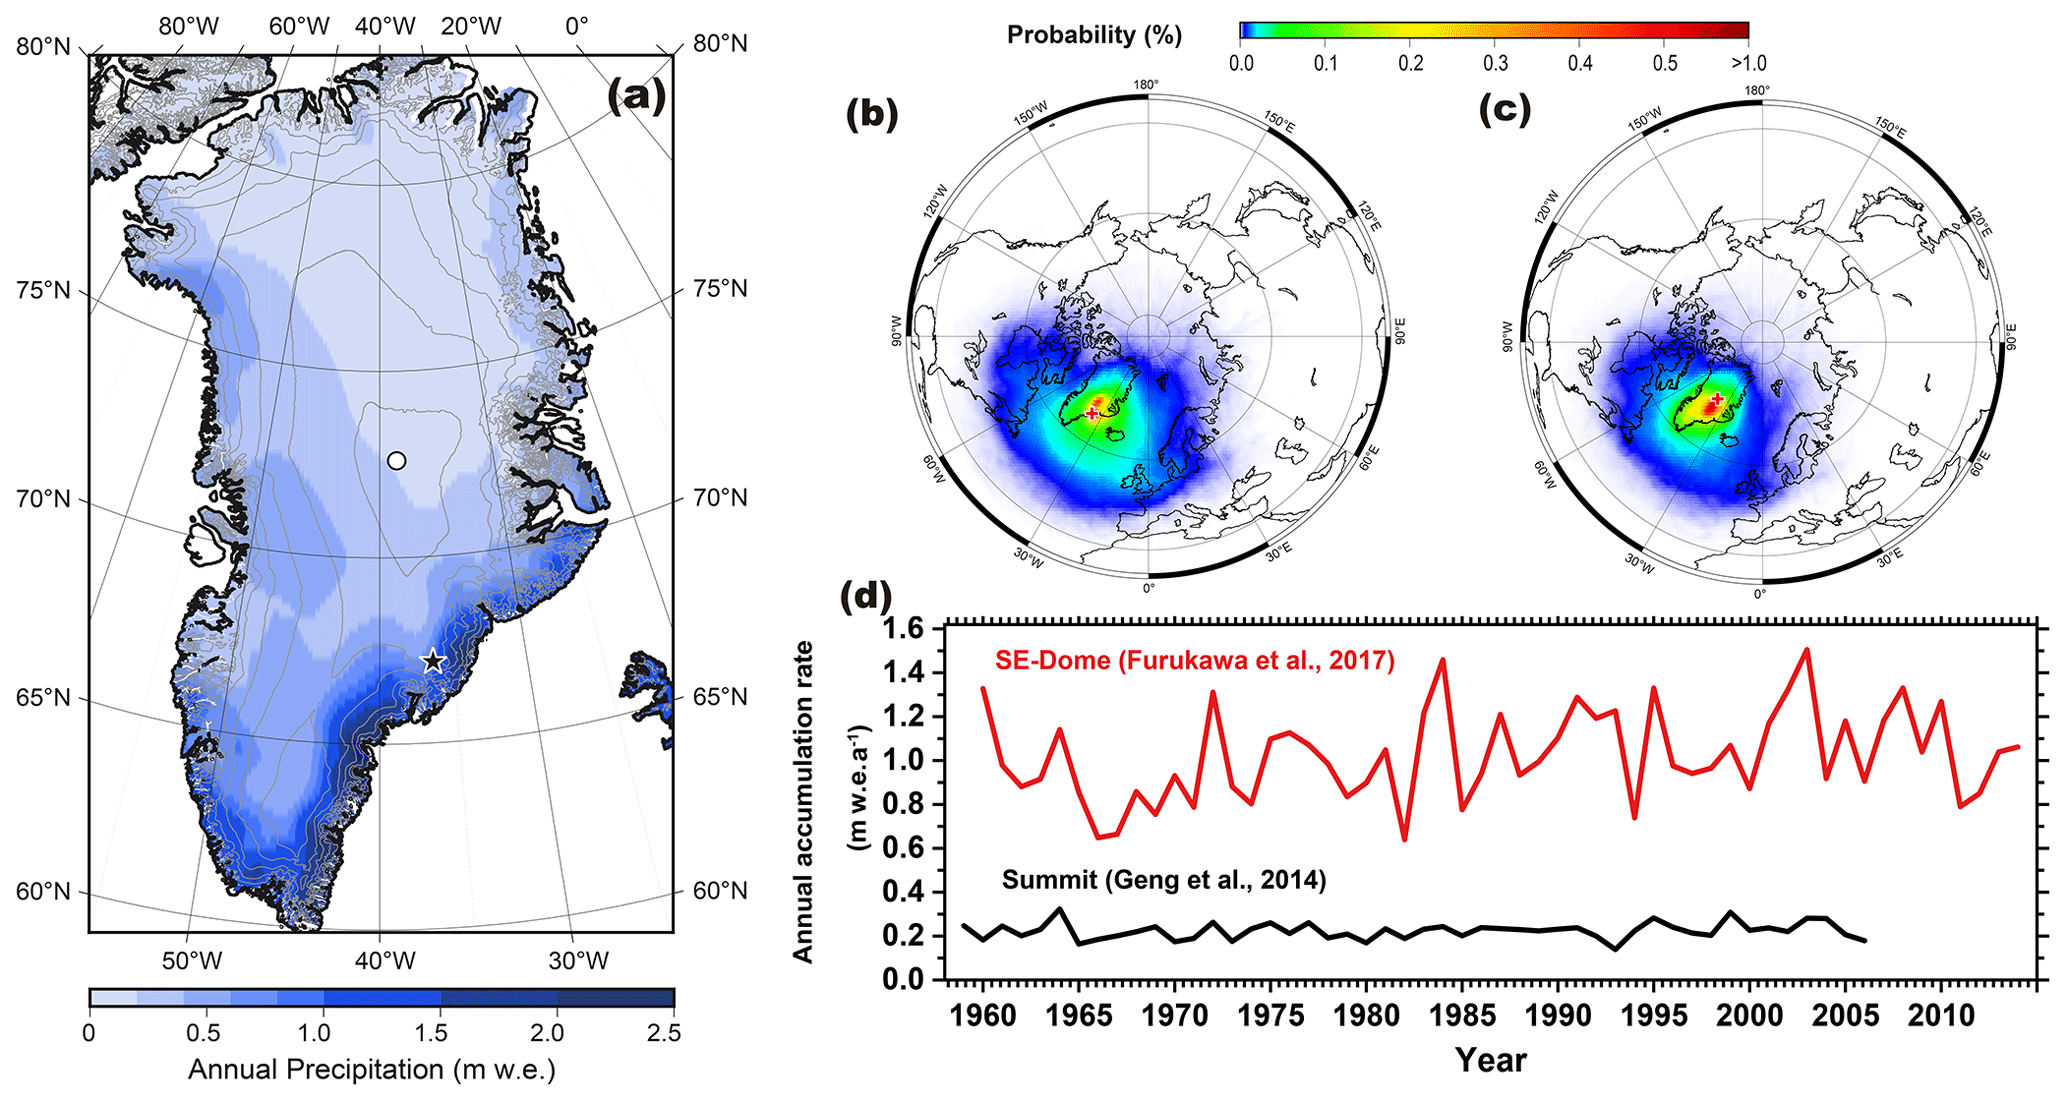
Figure 1(a) Map of the southeastern Dome (SE-Dome, star) and Summit (circle) sites in Greenland (annual precipitation from ERA5 reanalysis climate data; Hersbach et al., 2020). Probability distributions for the air masses overlying the (b) SE-Dome and (c) Summit sites from 7 d three-dimensional back-trajectory analysis based on HYSPLIT modeling (1960–2019). Detailed back-trajectory analysis procedures were the same as those in Iizuka et al. (2018). (d) Annual accumulation rate at the SE-Dome (Furukawa et al., 2017) and Summit (Geng et al., 2014) sites.
2.1 Samples
This study was based on a 90.45 m ice core drilled at the SE-Dome site (67.18° N, 36.37° W; 3170 m a.s.l., meters above sea level) in 2015 (Iizuka et al., 2016). The age–depth scale was determined using the oxygen isotope matching method, which matches the δ18O variations between ice core records and isotope-enabled climate model estimates, and indicated that this ice core covers the period from 1959 to 2014 (Furukawa et al., 2017). The reliability of this dating method generally falls within the 95 % confidence interval (typically around an average of ±0.9 months). The greatest uncertainty was reported at 2 months in some years (Furukawa et al., 2017). We divided the ice core samples into four seasons: spring (21 March–20 June), summer (21 June–20 September), fall (21 September–20 December), and winter (21 December–20 March). For samples analyzed at a two-season resolution (1959–1980 and 1995–2014), spring and summer were combined into summer, whereas fall and winter were combined into winter. This approach was adopted to ensure a consistent sample size and minimize analytical uncertainty for periods with lower temporal resolution, while still capturing seasonal variations relevant to NO deposition and atmospheric conditions.
All SE-Dome ice core samples used in this study were stored in a refrigerated room (−50 °C) at the Institute of Low Temperature Science (Hokkaido University, Sapporo, Japan). Each ice sample (3 cm × 4 cm cross-dimension) was cut using a band saw in a refrigerated room (−20 °C) and decontaminated by removing the outermost ∼5 mm of ice with a ceramic knife in a class 10 000 clean booth, resulting in a loss of approximately 30 % of the original sample weight. The remaining 70 % of the cleaned samples was shipped frozen ( °C) to the Tokyo Institute of Technology (Tokyo Tech, Yokohama, Japan). The samples were then stored in a freezer at −30 °C until analysis.
2.2 Sample analysis
The NO in each sample (n=136) was separated from other ions using ion chromatography (IC; Dionex Integrion, Thermo Fisher Scientific) according to the methods described by Noro et al. (2018). Changes in the isotopic compositions of NO during ion chromatographic separation were <0.4 ‰ for δ15N values and within the analytical error range for Δ17O values (Noro et al., 2018). After ion separation, NO in solution was converted and neutralized to the Na+ form by passing it through an ion exchange column. The isotopic compositions of NO were measured using a bacterial method that converts NO to N2O (Sigman et al., 2001; McIlvin et al., 2011), followed by N2O decomposition via microwave-induced plasma (MIP), a technique developed at Tokyo Tech (Hattori et al., 2016). Isotopic reference materials, as well as United States Geological Survey (USGS) standards 32, 34, 35, and their mixtures (prepared in 18.2 MΩ cm water), were also analyzed with the samples using the same analytical processes.
Stable isotopic compositions are reported as , where X denotes 15N, 17O, or 18O, while R denotes the isotope ratios, such as , , and , determined for both sample and standard materials. The δ15N, δ18O, and Δ17O values are reported in per mil (‰) notation. The δ15N values are relative to atmospheric N2 (air), while the δ18O and Δ17O values are relative to Vienna Standard Mean Ocean Water. By propagating the analytical uncertainties for the IC separation and replicating isotopic measurements of USGS standards 34, 35, and 32, the estimated combined uncertainties were ±0.4 ‰ for both δ15N(NO) and Δ17O(NO).
2.3 TRANSITS modeling
The TRANSITS model (Erbland et al., 2015), a multilayer one-dimensional isotopic model, was used to simulate NO recycling across the air–snow interface (i.e., UV photolysis of NO, NOx emission, local NO2 oxidation, and NO deposition) and its associated isotopic effects. The model is operated at a weekly resolution (52 time steps per year), and the default snow depth resolution is 1 mm. In each step, NO photolysis is calculated according to the depth-dependent photochemical flux and NO concentration. All generated NO2 enters the atmosphere and is reoxidized to NO, which is deposited on the surface snow with the primary NO from long-range transport in the next step. The original snow moves downward as snowfall continues, and newly deposited snow is divided into 1 mm layers. Once the NO is buried beneath the light transmission band, the layer is regarded as an archive. We adapted the parameters of the TRANSITS model, originally developed for the Summit site by Jiang et al. (2021). This model reproduces the seasonal variation pattern of δ15N(NO) in the surface snow at the Summit site reported by Jarvis et al. (2009), highlighting the importance of postdepositional processes at site. In addition, this model estimated the net loss of NO (4.1 %) and associated changes in δ15N(NO) (+2.6 ‰) and Δ17O(NO) (−0.9 ‰) between primary deposition and NO archived in the ice, under an estimate of the horizontal export fraction of locally reoxidized NO (fexp) of 35 % (Jiang et al., 2021). In this study, we applied the same model under the SE-Dome condition by adjusting the parameters to examine the effects of snow NO photolysis on the NO concentration and its isotopes.
The snow accumulation rate was set at 1.01 m w.e. a−1, based on the 1960–2014 average from SE-Dome ice core data (Iizuka et al., 2017), with additional tests conducted at rates of 0.25, 0.6, and 1.4 m w.e. a−1. The mass balance of NO between the snow and atmosphere depends on NO influxes and outfluxes. We expressed the NO flux as FY, which includes the primary NO flux from long-range transport (Fpri), NO flux from NO photolysis (FP), atmospheric NO deposition flux (FD), and ice core NO flux buried beneath the light band (FA). These fluxes reflect changes in NO and its isotopic compositions in the snow and atmosphere. The TRANSITS model considers that two processes can change δ15N(NO) as a result of isotope fractionation from UV photolysis and NO deposition (i.e., co-condensation and dry deposition). The nitrogen isotope fractionation constant during photolysis (15εp) was calculated using a ratio of the 14NO and 15NO photolysis rates (J −1, where J represents the photolysis rate constant) in each snow layer (Erbland et al., 2013). The J at different depths (z) (J(z)) was calculated according to Eq. (1):
where I is the actinic flux, while Φ and σ are the quantum yield and absorption cross-section of NO photolysis, respectively. The quantum yield of NO photolysis has significant uncertainties (Meusinger et al., 2014). However, it is unlikely that the quantum yield of NO photolysis would differ substantially between the SE-Dome and Summit sites. As this study compares the differences between these sites, which have notably different snow accumulation rates, the quantum yield of NO photolysis at the SE-Dome site was set to the same value (0.002) as that estimated for the Greenland Summit site by Jiang et al. (2021). The absorption cross-sections of 14NO () and 15NO () were derived from Berhanu et al. (2014). The nitrogen isotope fractionation constant during deposition (15εd) was set to +10 ‰ (Erbland et al., 2015). For the oxygen isotopes, only the mass-independent fractionation signal (Δ17O) was modeled. The cage effect (i.e., decrease in Δ17O of the snow NO owing to secondary chemistry during NO photolysis; McCabe et al., 2005) was set to 15 % according to Erbland et al. (2015), and the TRANSITS model calculated the exchange of oxygen atoms with water during UV photolysis and atmospheric NO–NO2 cycling, both of which alter Δ17O. The Δ17O(NO) fractionation mechanisms in the TRANSITS model during these processes are explained in detail in Jiang et al. (2021).
The atmospheric boundary layer at the SE-Dome site was assumed to be a zero-dimensional well-mixed box, and the snowpack was assumed to be a stack of snow layers deposited at different times. Weekly air temperatures (T), pressures (P), and average boundary layer heights (h) from 1950 to 2020 were obtained from the second-generation European Centre for Medium-Range Weather Forecasts atmospheric analysis of global climate (ERA5) (Hersbach et al., 2020; Khalzan et al., 2022). O3, OH, peroxyl radical (RO2 and HO2), and BrO concentrations were used to calculate the rates of NO–NO2 cycling and NO2 oxidation to HNO3. However, because these records were not available for the SE-Dome, they were extracted from the outputs of the v.12.9.3 (https://doi.org/10.5281/zenodo.3974569, The International GEOS-Chem User Community, 2020) GEOS-Chem atmospheric chemical transport model (http://www.geos-chem.org, last access: 7 January 2024) using the Modern-Era Retrospective analysis for Research and Applications, Version 2 (MERRA-2) meteorological field, with 4° latitudinal and 5° longitudinal resolutions. The GEOS-Chem model was run for the year 2017 after a 1-year spin-up run, and the monthly averages for the O3, OH, HO2, and BrO concentrations in the planetary boundary layer in the SE-Dome grid were used. We selected 2017 as the representative period, which should not vary significantly from other recent years and should ensure robust outcomes. Given that tropospheric O3 concentrations were comparable between the SE-Dome and Summit grids in the GEOS-Chem model, the total O3 column (TCO) was set to the same value (266–408 DU, Dobson units) as that used in a previous study of the Summit site (Jiang et al., 2021). Fpri was estimated to be 16.4, 23.6, 13.3, and 11.5 mg N m−2 a−1 for spring, summer, fall, and winter, respectively, based on the seasonal NO fluxes at the SE-Dome site from 1960 to 2014 (Iizuka et al., 2018).
An e-folding depth, which is the depth to which light enters the snow layer and attenuates to an initial intensity of (owing to absorption and scattering), for the SE-Dome site was calculated using the snow density (ρsnow), the calculated specific surface area (SSA), and fixed light-absorbing impurity concentrations (Jiang et al., 2021). The ρsnow of 400 kg m−3 for the SE-Dome site was obtained from an observation at the SE-Dome (Oyabu et al., 2016). The SSA for the SE-Dome site was determined to be 47.0 m2 kg−1 using the relationship between the SSA and ρsnow, according to a previous study (Domine et al., 2007):
where SSA is in units of square centimeters per gram (cm2 g−1) and the units for ρsnow were changed to grams per cubic centimeter (g cm−3). For the light-absorbing impurity concentrations, we established constant concentrations of the three main light-absorbing impurities in snow: dust, soot (BC), and organic humic-like substances (HULISs). The dust concentration was set to 33.94 ng g−1 according to an average concentration for the SE-Dome ice core from 1960 to 2014 (Amino et al., 2021). Owing to a lack of direct observations for BC and HULISs at the SE-Dome, we assumed these concentrations based on the Ca2+ concentration ratio between the Summit and SE-Dome sites. Here, [BC]Summit and [HULIS]Summit were set to 1.4 and 31 ng g−1, respectively, according to Jiang et al. (2021). Furthermore, [Ca2+] at the Summit site was set to 6.5 ng g−1 according to an average of the 2 m shallow snowpack observation (Geng et al., 2014); [Ca2+] at the SE-Dome site was set to 11.6 ng g−1 according to an average from the SE-Dome ice core from 1960 to 2014 (Iizuka et al., 2018). Thus, [BC]SE-Dome and [HULIS]SE-Dome were calculated as 2.2 and 47.6 ng g−1, respectively, and used for the model calculation. An e-folding depth of 10 cm was obtained based on the above inputs. The calculated e-folding depth for the SE-Dome site was consistent with previous estimates from the GEOS-Chem model investigating the impact of postdepositional effect in snow (Zatko et al., 2016).
The horizontal export fraction of locally reoxidized NO (fexp) under the SE-Dome condition was calculated with the same scheme described for the Antarctic Plateau (Erbland et al., 2015) and Greenland Summit (Jiang et al., 2021), as outlined in the following equations:
In these equations, τ1, τ2, and τ3 represent the lifetimes of horizontal transport, oxidation of NO2 by OH radicals, and vertical deposition, respectively. L and H denote the respective summer boundary layer height and horizontal characteristic, while Vh is the mean horizontal wind speed, k is the rate constant for the NO2+ OH reaction, and Vd is the dry deposition velocity of HNO3 (Jiang et al., 2021). The values used for the calculation are summarized in Table S2, and the same physicochemical values as those of Summit were used, while parameters such as temperature and boundary layer height were incorporated from ERA5 data. We obtained fexp to be 47 % under the SE-Dome condition, but the calculated fexp may oversimplify the processes governing NO deposition and the chemical loss pathways of NOx, as discussed previously (Jiang et al., 2021). Therefore, we considered the sensitivity of postdepositional alteration to variations in fexp between initial deposition and the point at which NO becomes archived in the ice.
At the initial time (t=0) in the TRANSITS model, the NO concentration was set to 71.12 ng g−1 based on the average NO concentration in the SE-Dome I ice core (Iizuka et al., 2018), while the δ15N(NO) and Δ17O(NO) values in the snowpack were set to 0 ‰ and 30 ‰, respectively, according to previous TRANSITS settings (Erbland et al., 2015; Jiang et al., 2021). This initial isotopic parameter does not affect the model interpretation of changes in δ15N(NO) and Δ17O(NO) due to postdepositional processing. The 3-year distributions of NO and its isotopes were simulated with and without NO photolysis scenarios under the SE-Dome condition, from which profiles of NO concentrations, δ15N(NO), and Δ17O(NO) were output. The parameters used in the TRANSITS model are summarized in Table 1 and Supplement data file 1.
Table 1Parameters used in the TRansfer of Atmospheric Nitrate Stable Isotopes To the Snow (TRANSITS) model for the SE-Dome ice core.
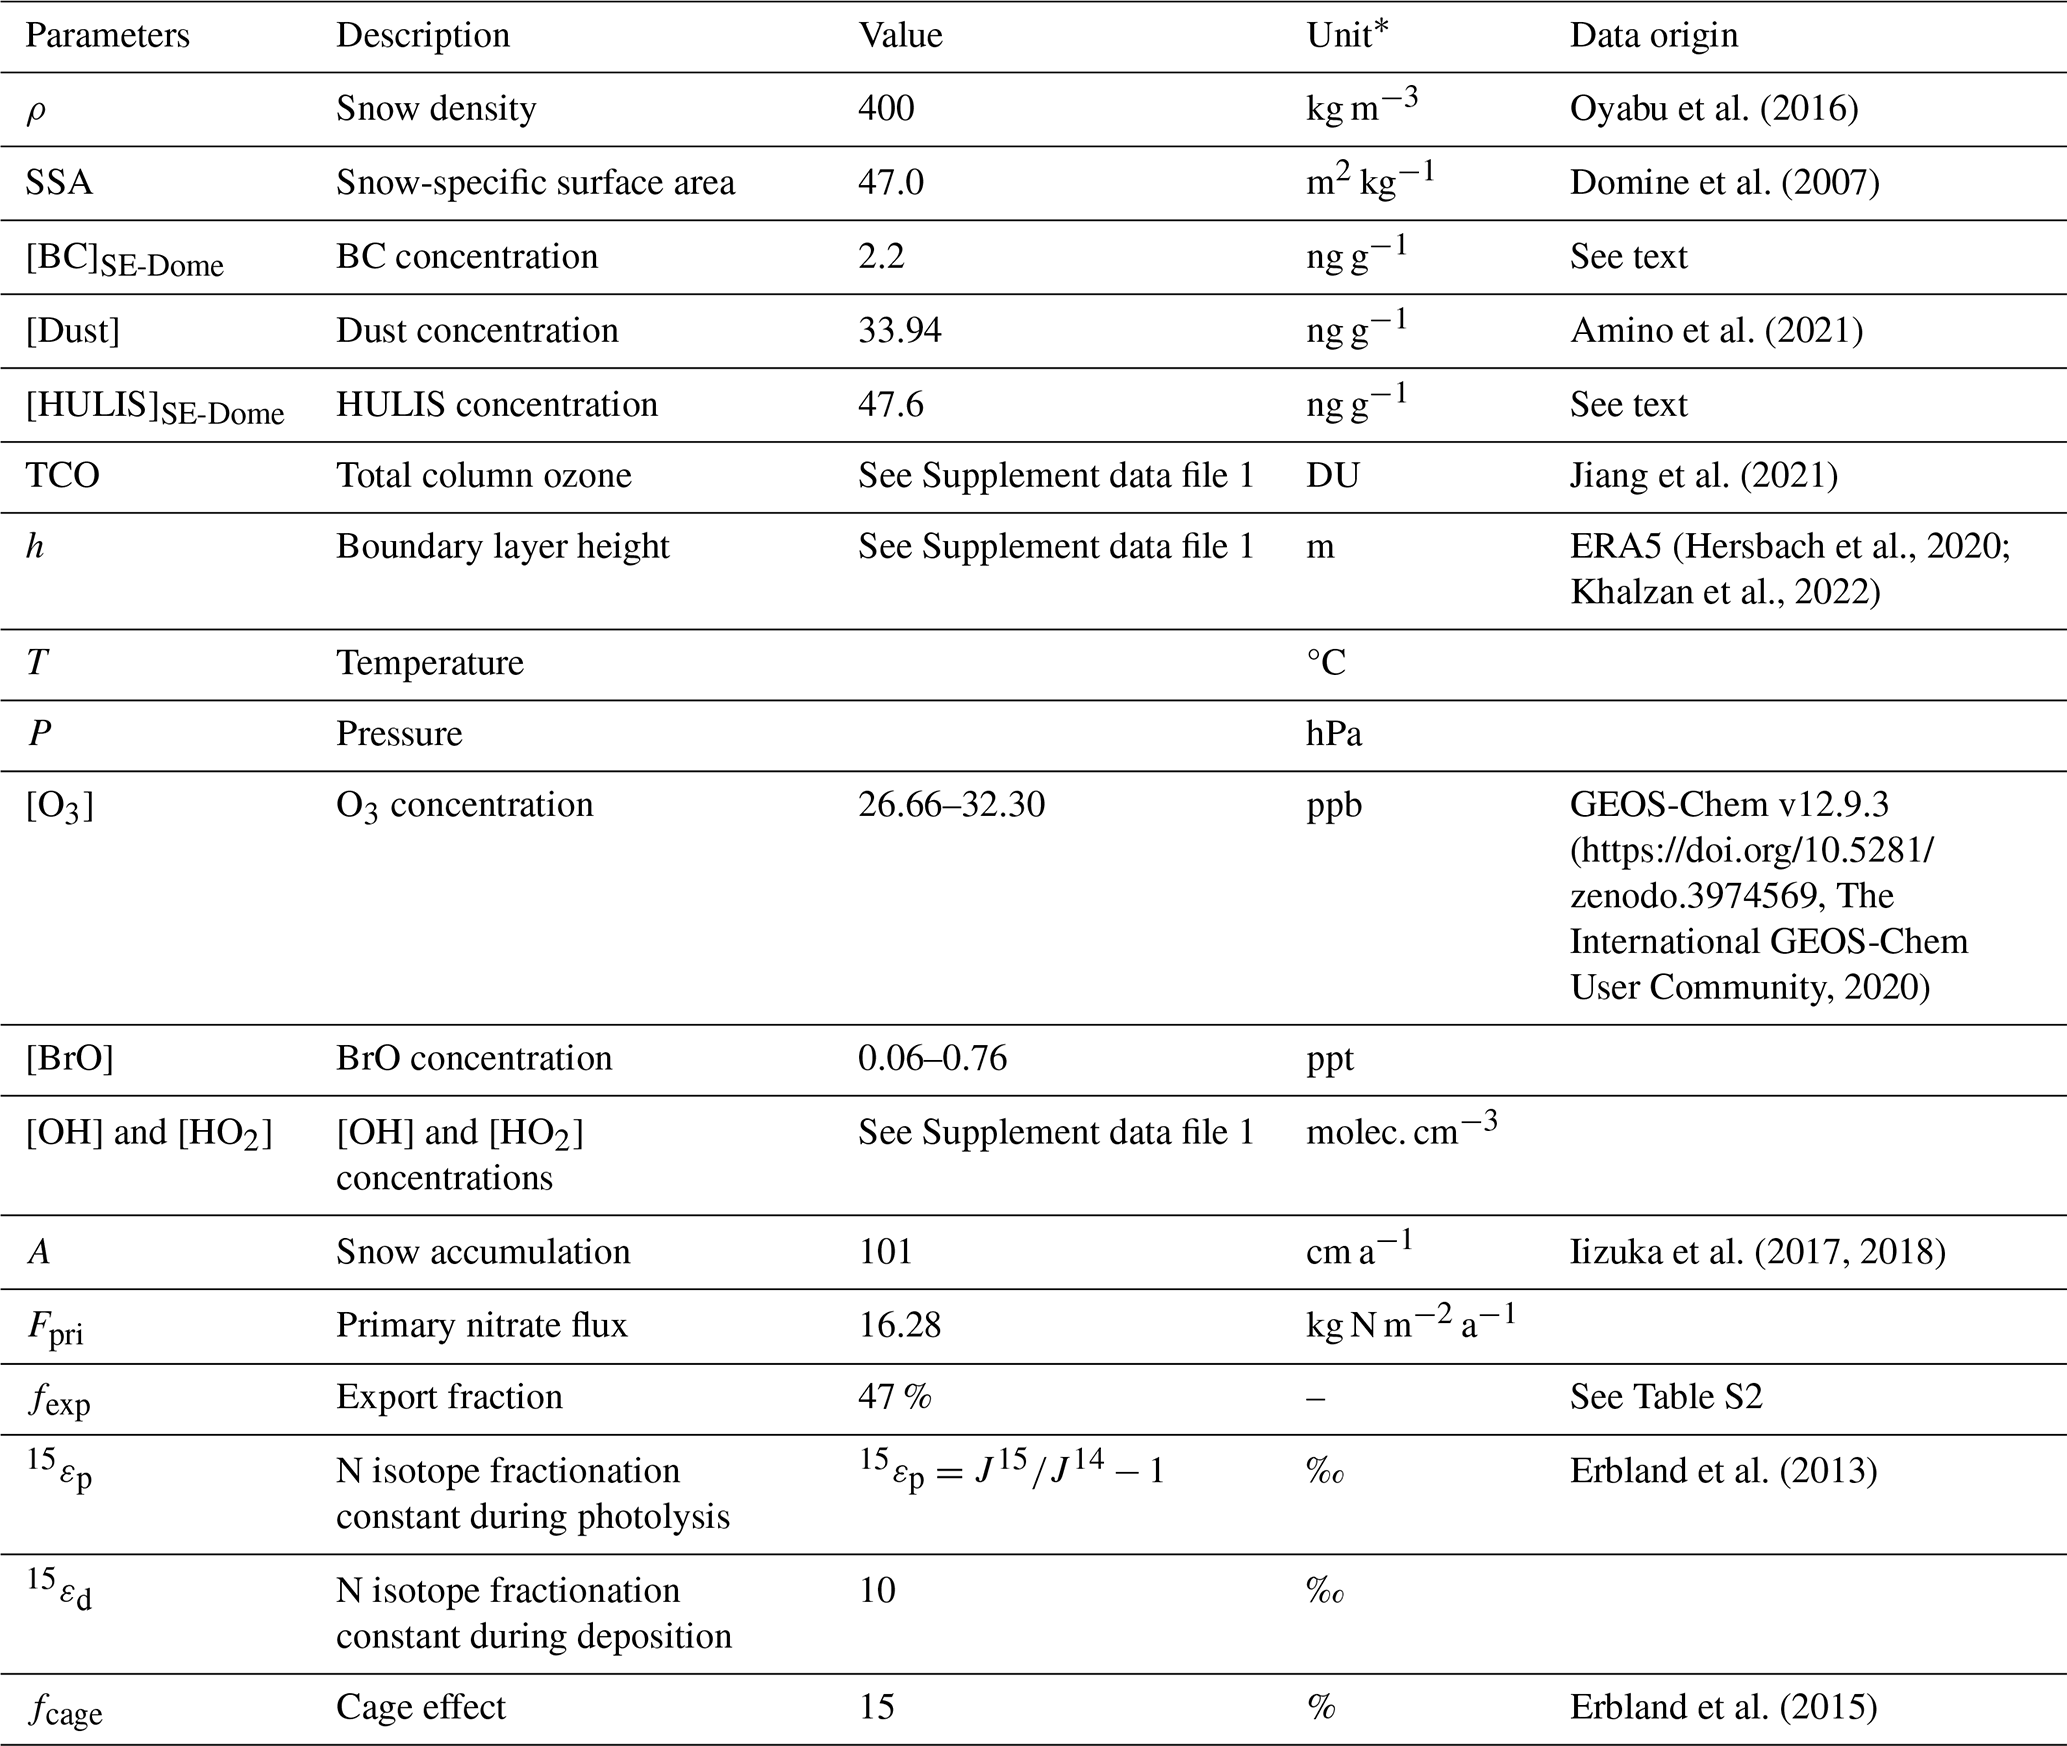
* Note that ppt denotes parts per trillion.
2.4 Statistical analysis
XLSTAT 2023 (Addinsoft, Paris, France) was used for the Mann–Kendall trend analysis over 1959–2014. SPSS Statistics 25 (IBM SPSS, Armonk, NY, USA) was used to perform the t tests of annual changes in the δ15N(NO) and NO concentrations. Statistical significance was set at p<0.05.
3.1 Nitrate isotope records from the SE-Dome ice core
The NO isotope data and fluxes obtained from the SE-Dome ice core are shown in Figs. 2 and S1. The seasonal variations were larger in the samples analyzed at a four-season resolution (1981–1994), which may have been caused by age errors (Furukawa et al., 2017). Accordingly, mass-weighted averages were calculated for the summer and winter fractions from the seasonal samples during 1981–1994. From 1959 to 2014, the δ15N(NO) values were generally higher in summer ( ‰) than in winter ( ‰) (Figs. 2a and S1a). To assess annual changes in δ15N(NO) over this period, we calculated the annual mass-weighted average δ15N(NO) values and found that they decreased from 1959 to 1974 and exhibited no significant (p>0.05) trends after 1975 (mean value of ‰) (Fig. 2a). No clear relationship was observed between the annual variations in the δ15N(NO) and NO concentrations (p=0.37).
Using a similar method to that employed for δ15N(NO), we also calculated the mass-weighted average and annual mass-weighted average for Δ17O(NO). The Δ17O(NO) also exhibited a seasonal pattern, with lower values in the summer (27.8±1.3 ‰) than those in the winter (31.3±1.9 ‰), yielding a mass-weighted average of 29.3±1.2 ‰ over the entire period (Figs. 2b and S1). The average annual Δ17O(NO) values were relatively high (∼33 ‰) in 1988, whereas low values were observed in 2013 and 2014 (Fig. 2b). Excluding these particular years, no significant annual increases or decreases (p>0.05) were observed in the Δ17O(NO) values.
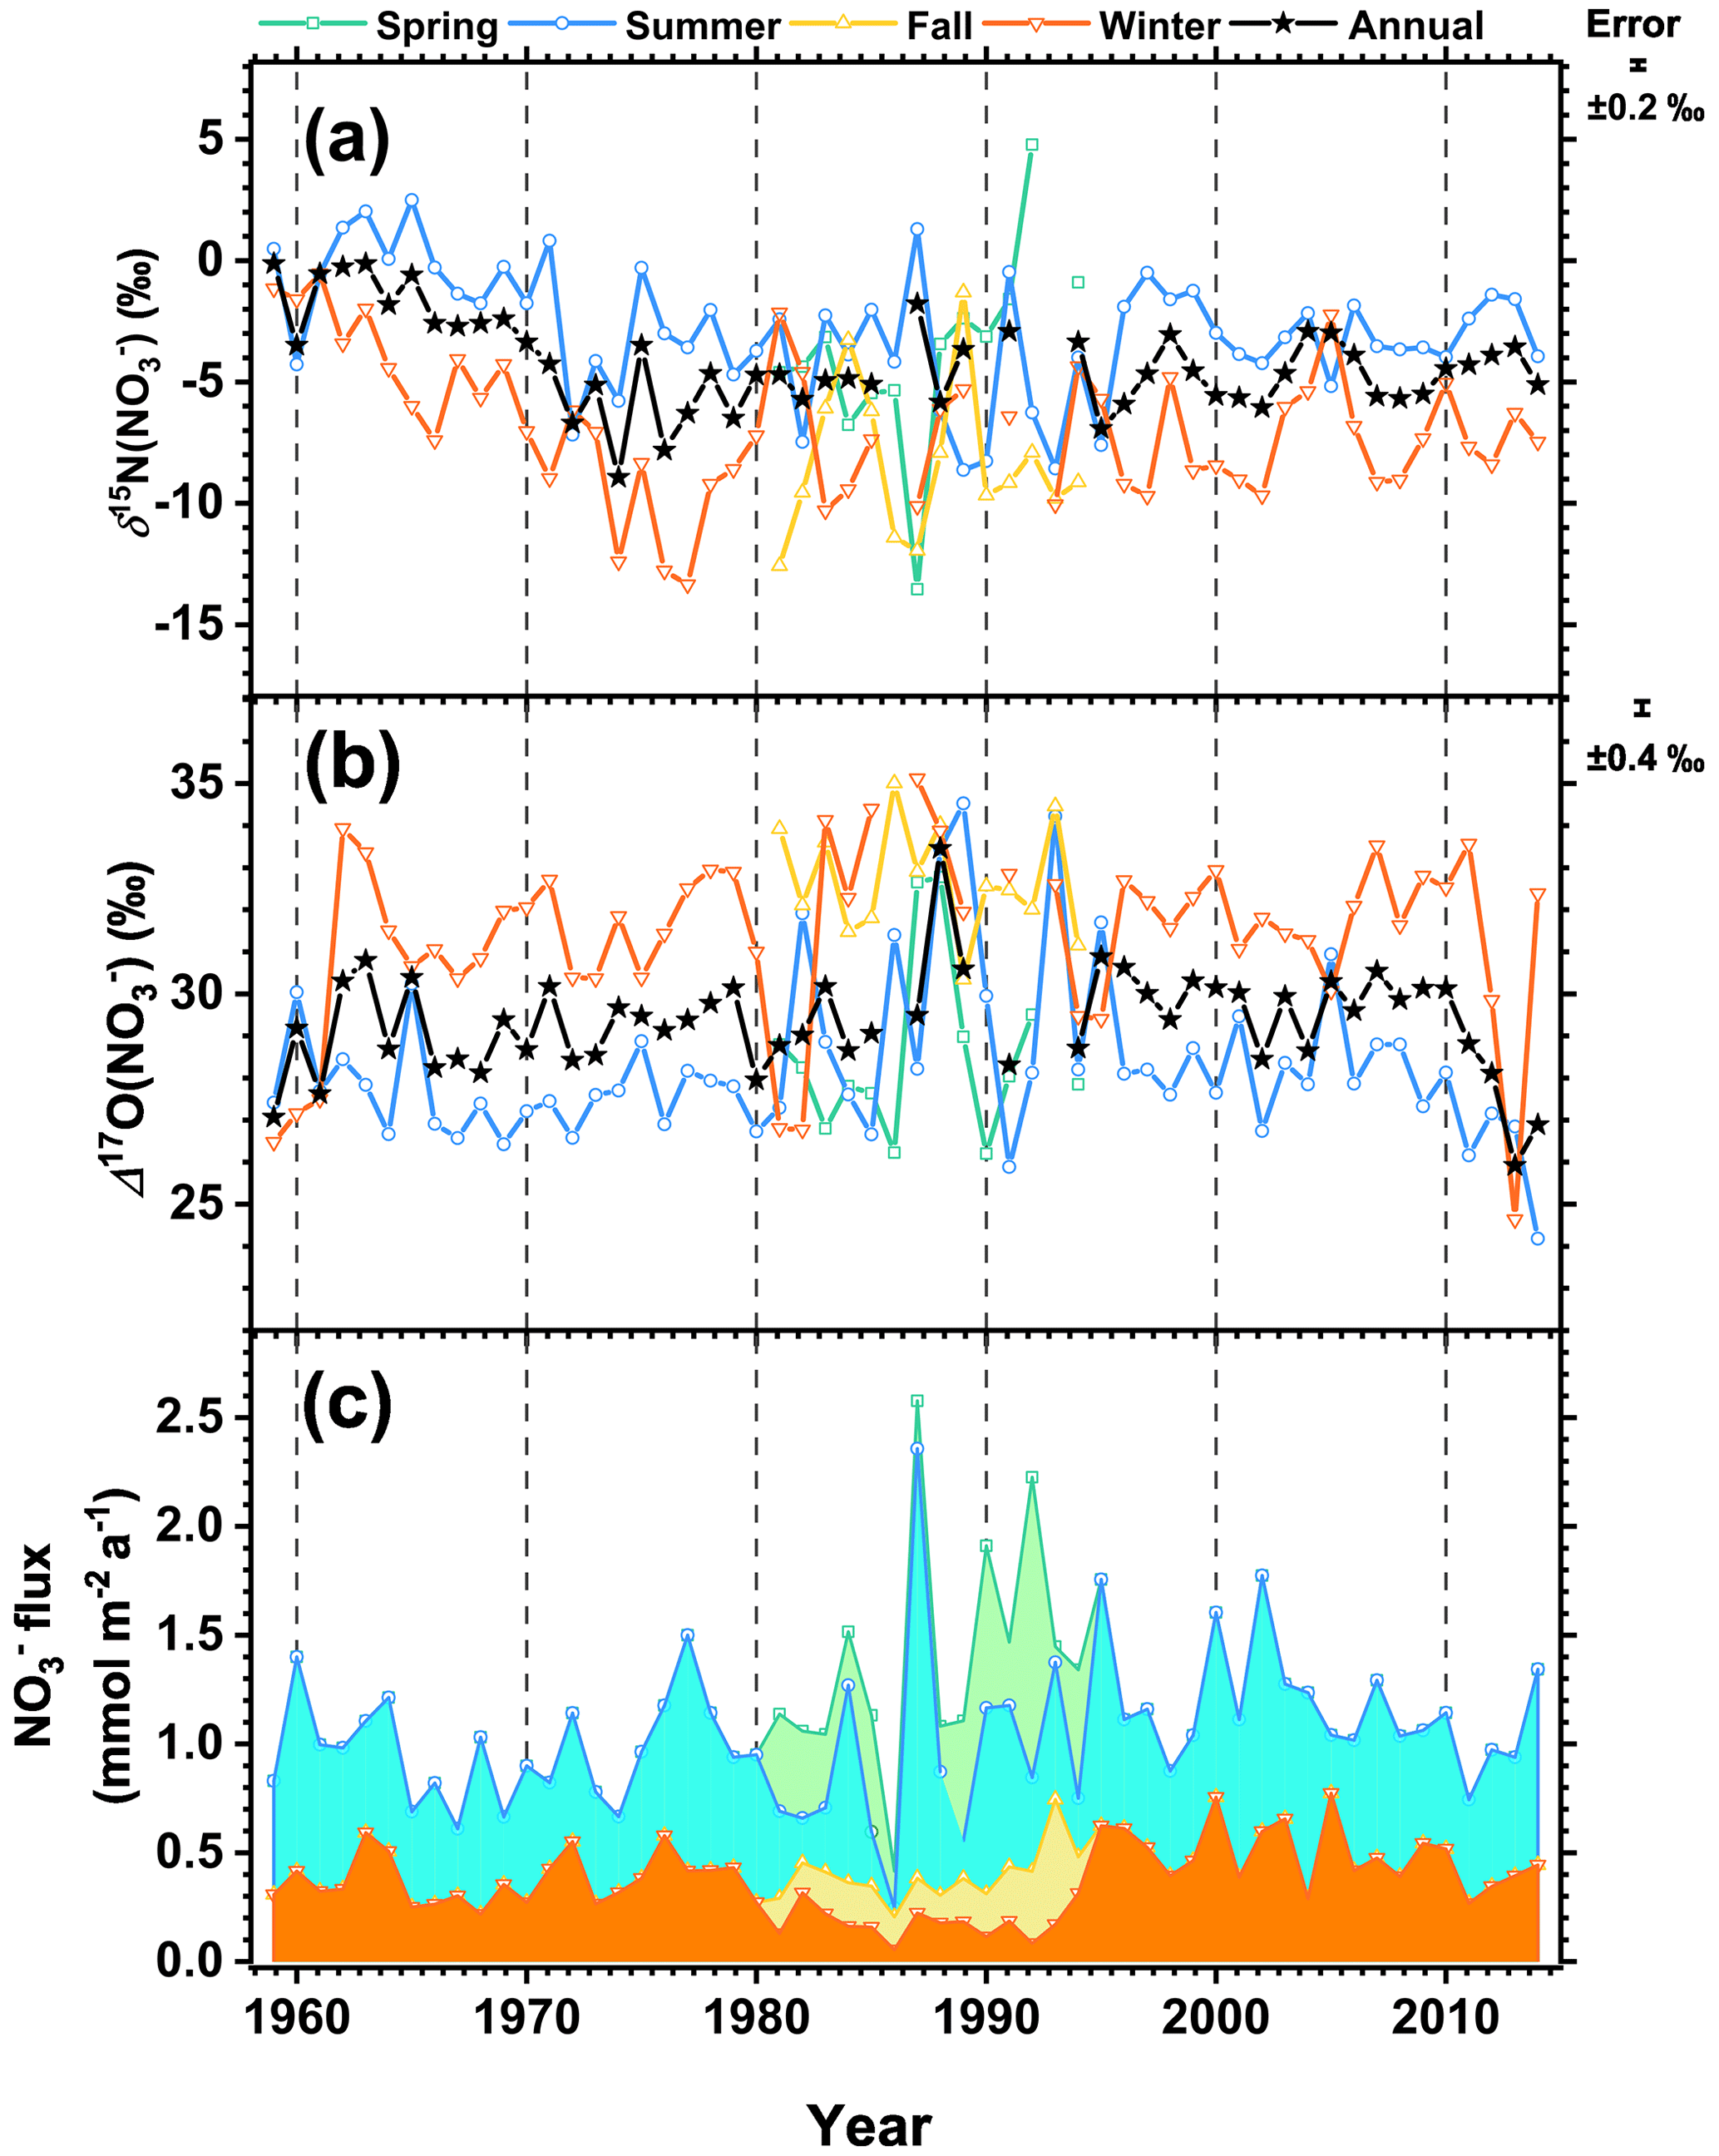
Figure 2The NO isotope data and fluxes from the SE-Dome ice core: (a) δ15N(NO), (b) Δ17O(NO), and (c) NO flux (mmol m−2 a−1).
3.2 TRANSITS model results
We aimed to know the changes in NO from primary deposition to the ice core archive. However, these changes primarily depend on the fexp value – the fraction of NO exported from the site of photolysis. Therefore, we calculated the dependency of the δ15N(NO) and Δ17O(NO) values on fexp at the SE-Dome using the same approach as Jiang et al. (2021) (Fig. 3). The postdepositional alterations in δ15N(NO) and Δ17O(NO) between initial deposition and the ice core NO concentration at the SE-Dome were dependent on fexp. As shown in Fig. 3, an inverse relationship was observed between fexp and δ15N(NO) and Δ17O(NO). In the case of δ15N, when fexp is high, a larger proportion of isotopically light NO is removed from the snowpack due to strong isotopic fractionation during photolysis. As a result, the remaining NO in the snow becomes isotopically enriched in 15N. In contrast, for Δ17O(NO), when fexp is high, the impact of photolysis-induced isotopic fractionation on Δ17O(NO) is minimal; thus, its value remains largely unchanged. Conversely, when fexp is low (i.e., a significant portion of the nitrogen species is emitted and subsequently redeposited), the NO with lower Δ17O(NO), originating from NO2+ OH reaction, dominates the signal, leading to a decrease in Δ17O(NO). These distinct mechanisms explain why δ15N(NO) and Δ17O(NO) exhibit opposite trends.
However, the degree to which the changes in δ15N(NO) and Δ17O(NO) were dependent on fexp was less evident at the SE-Dome site than at the Summit site (Fig. 3). Notably, even when the snow accumulation rate for SE-Dome is adjusted from the minimum (0.6 m w.e. a−1) to the maximum (1.4 m w.e. a−1) values, as shown in Fig. 1d, the results indicate that changes in δ15N(NO) and Δ17O(NO) are less sensitive to fexp compared to Summit. Furthermore, when a snow accumulation rate of 0.25 m w.e. a−1, equivalent to that used in the Summit study (Jiang et al., 2021), was applied, the variations were nearly identical to those observed at Summit (Fig. S2). This suggests that the differences in postdepositional alterations for δ15N(NO) and Δ17O(NO) are primarily caused by differences in accumulation rates.
Using the method of Erbland et al. (2015), fexp was calculated as 47 % at SE-Dome, reflecting an estimated net loss of 1.4 % due to postdepositional alteration in the NO concentration at the site, with corresponding changes in δ15N(NO) and Δ17O(NO) of +0.9 ‰ and −0.2 ‰, respectively (Fig. 3). In contrast, the estimated net loss of NO under the Summit condition showed higher values (4.1 %) and associated changes in δ15N(NO) (+2.6 ‰) and Δ17O(NO) (−0.9 ‰) when the fexp value was 35 %, as estimated previously (Jiang et al., 2021). Thus, even when using the same evaluation criteria, the postdepositional alteration in NO and its isotopic compositions at the SE-Dome site were smaller than those at the Summit site. We note that, under an extreme condition of fexp=100 %, the estimated changes in δ15N(NO) from initial deposition due to postdepositional processing under the SE-Dome condition were +1.8 ‰, which is significantly lower than that under the Summit condition of +6.8 ‰ (Fig. 3).
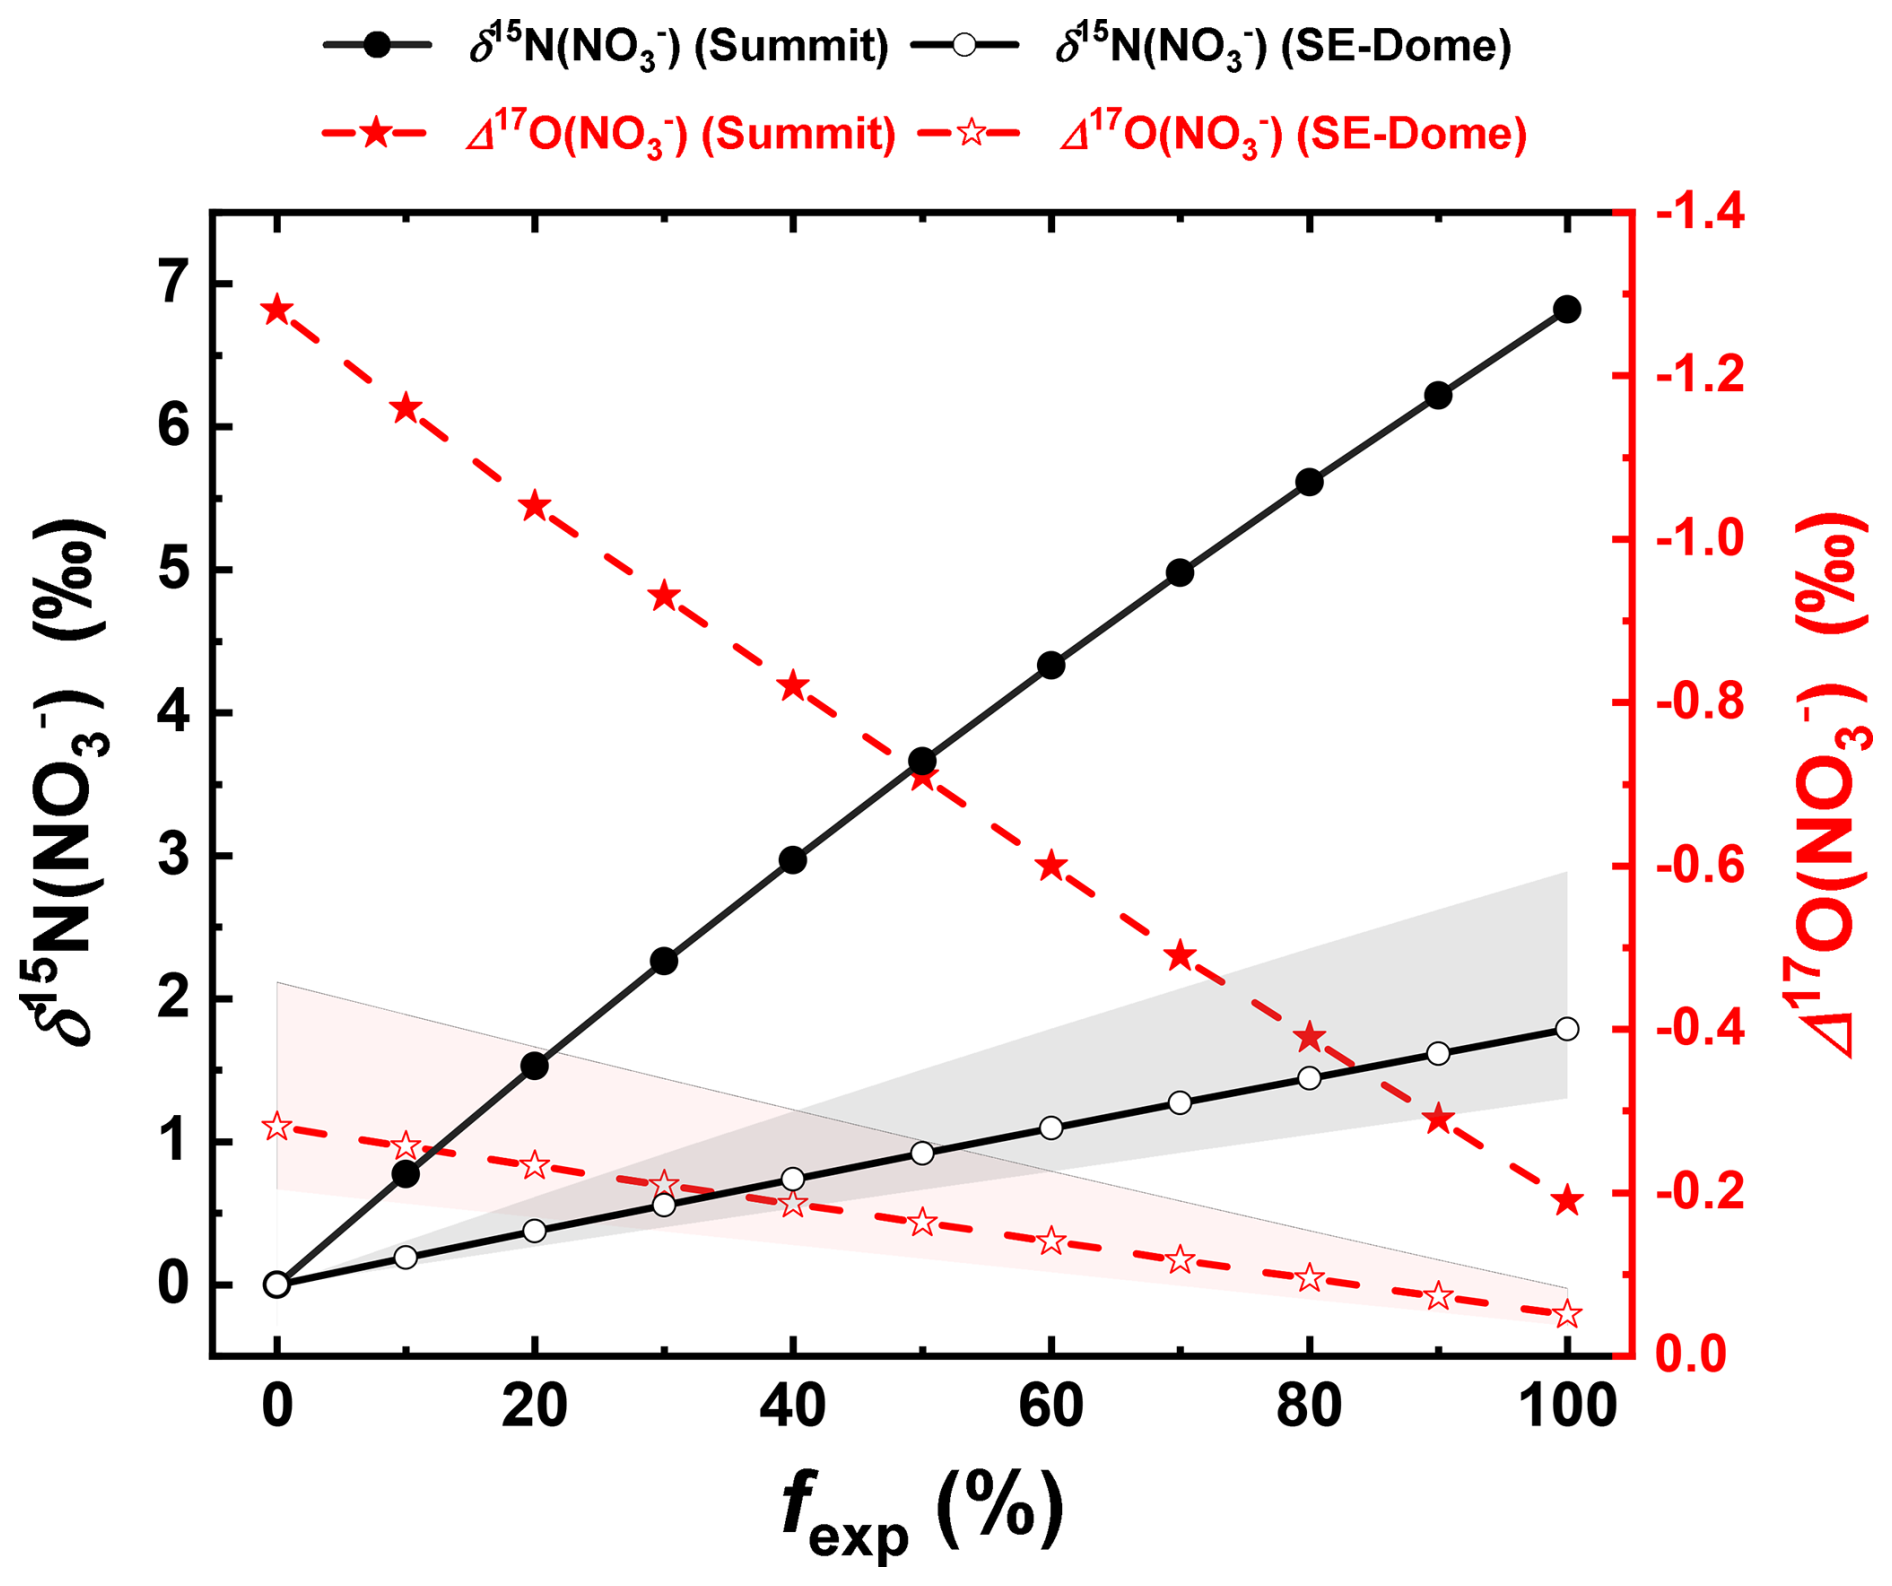
Figure 3Sensitivity of the changes in δ15N(NO) and Δ17O(NO) of the ice core nitrate to fexp. Positive or negative values indicate deviations from initial deposition. The shaded area in the SE-Dome calculations represents results obtained using snow accumulation rates of 0.6 and 1.4 m w.e. a−1.
Figure 4 shows the results obtained from the TRANSITS model for NO and its isotopic compositions for the SE-Dome site when considering an fexp value of 47 %. The model considering photolysis showed a maximum 6 % decrease in the annual NO concentrations during spring and early summer compared to the scenario without photolysis (Fig. 4a). The postdepositional effects (primarily due to photolytic isotopic fractionation) caused a fluctuation in δ15N(NO) of −1 ‰ to +2 ‰, with higher values in summer (1.3±0.7 ‰) and lower values in winter (0.2±0.2 ‰) (Fig. 4b). The variation in the Δ17O(NO) value, which was initially set at 30 ‰, is attributed to a slight decrease in the atmospheric NO concentration owing to its reoxidization during spring to summer. Thus, when photolysis is minimal in the fall and winter, the Δ17O(NO) values remained close to the initial value (30 ‰) (Fig. 4c). Conversely, during spring and summer, when δ15N(NO) values increase, a decreasing Δ17O(NO) trend was observed (Fig. 4c). However, the extent of this change is minimal, with values reaching a minimum of ∼29.6 ‰. The seasonality in the NO concentration and postdepositional alteration in its isotopic composition were less obvious at SE-Dome than that at Summit, where δ15N(NO) varied by >5 ‰ and Δ17O(NO) by ∼2 ‰ (Jiang et al., 2021).
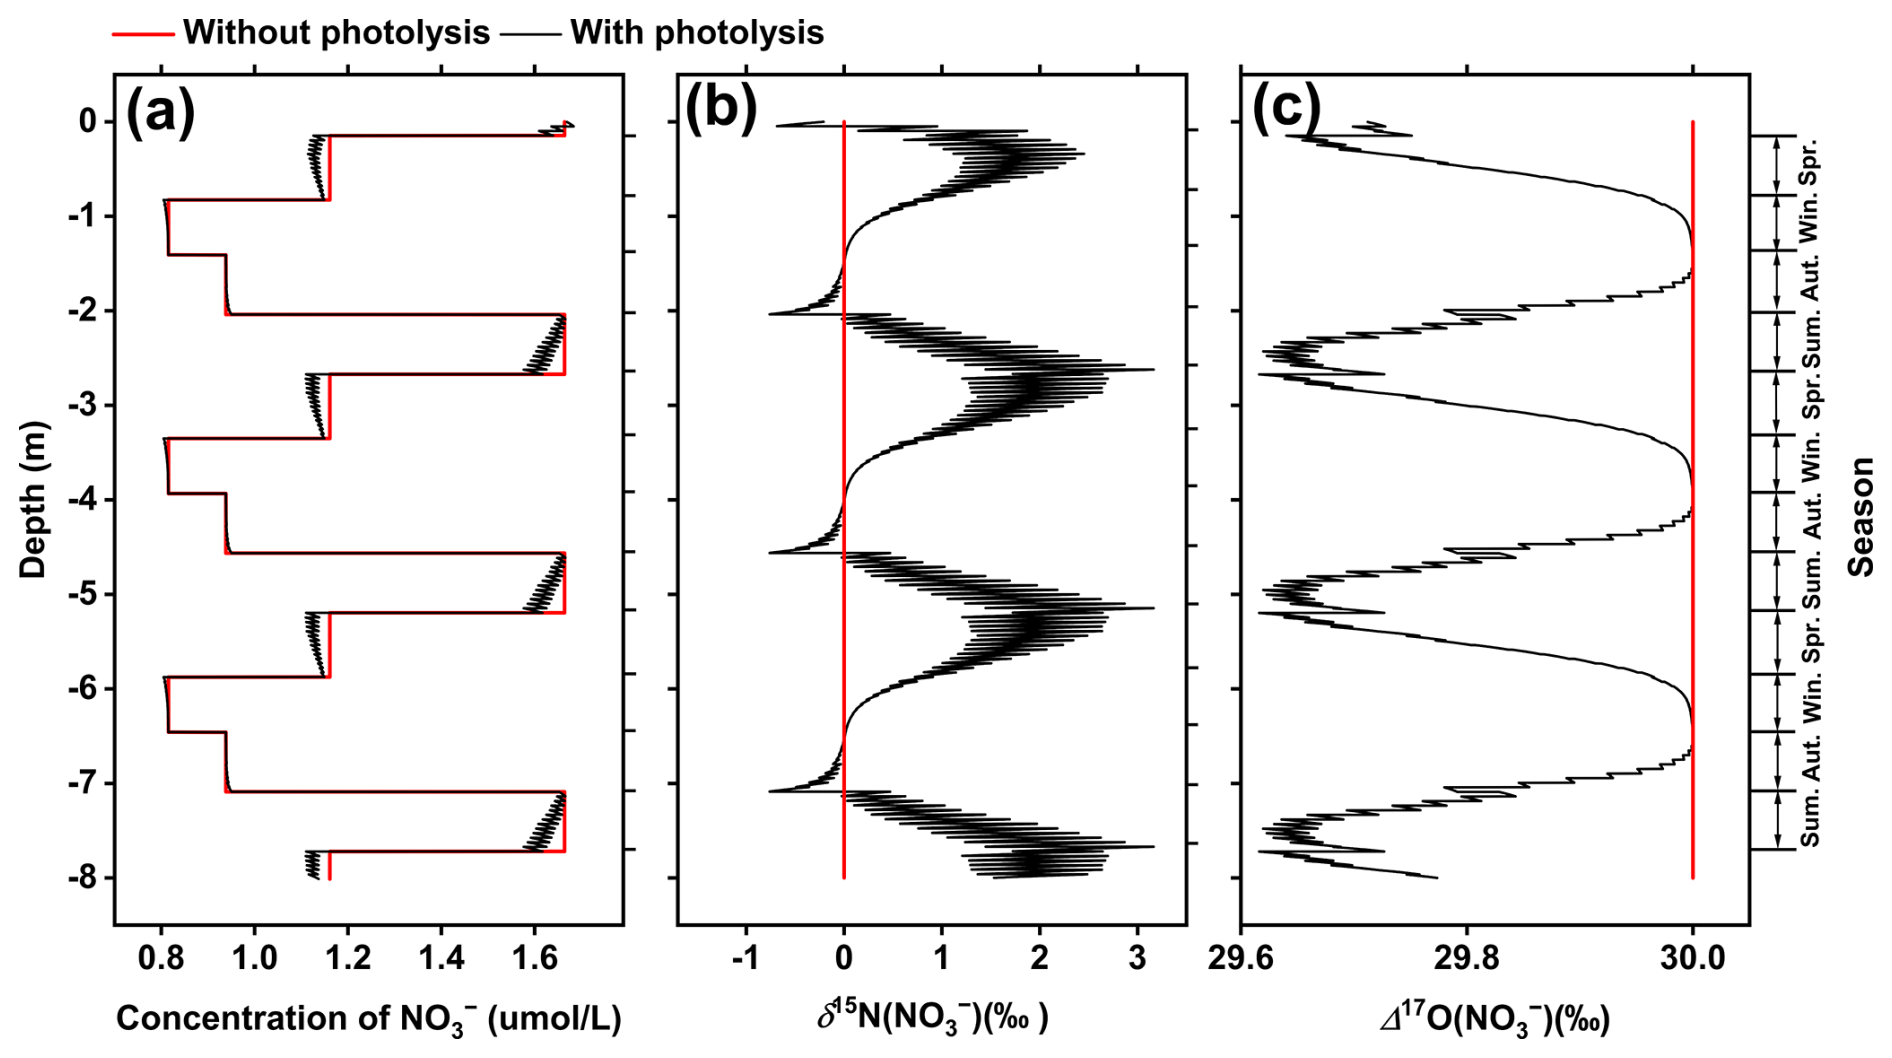
Figure 4TRANSITS model results for the SE-Dome site: (a) NO concentration, (b) δ15N(NO), and (c) Δ17O(NO). The black and red lines represent the variations calculated with and without NO photolysis, respectively.
4.1 The δ15N(NO) values from the SE-Dome and Summit sites
Figure 5 shows the annual average δ15N(NO) values obtained from the SE-Dome ice core and the previously published δ15N(NO) values from the Summit site (Hastings et al., 2009; Geng et al., 2014). Decreasing trends in δ15N(NO) were observed in both the Summit and SE-Dome ice cores until approximately 1974, after which no clear changes occurred (Fig. 5). Notably, based on the overlapping analysis period from 1959 to 2006 (n=44), the annual δ15N(NO) values in the SE-Dome ice core were found to be 4.2±2.8 ‰ lower than those in the Summit ice core (Fig. 5). The observed differences in δ15N(NO) values between the SE-Dome and Summit cores may be attributed to (1) variations in the δ15N values of NO deposited at the two sites and/or (2) variations in the degree of postdepositional alterations between the two sites. These two points are discussed in detail below.
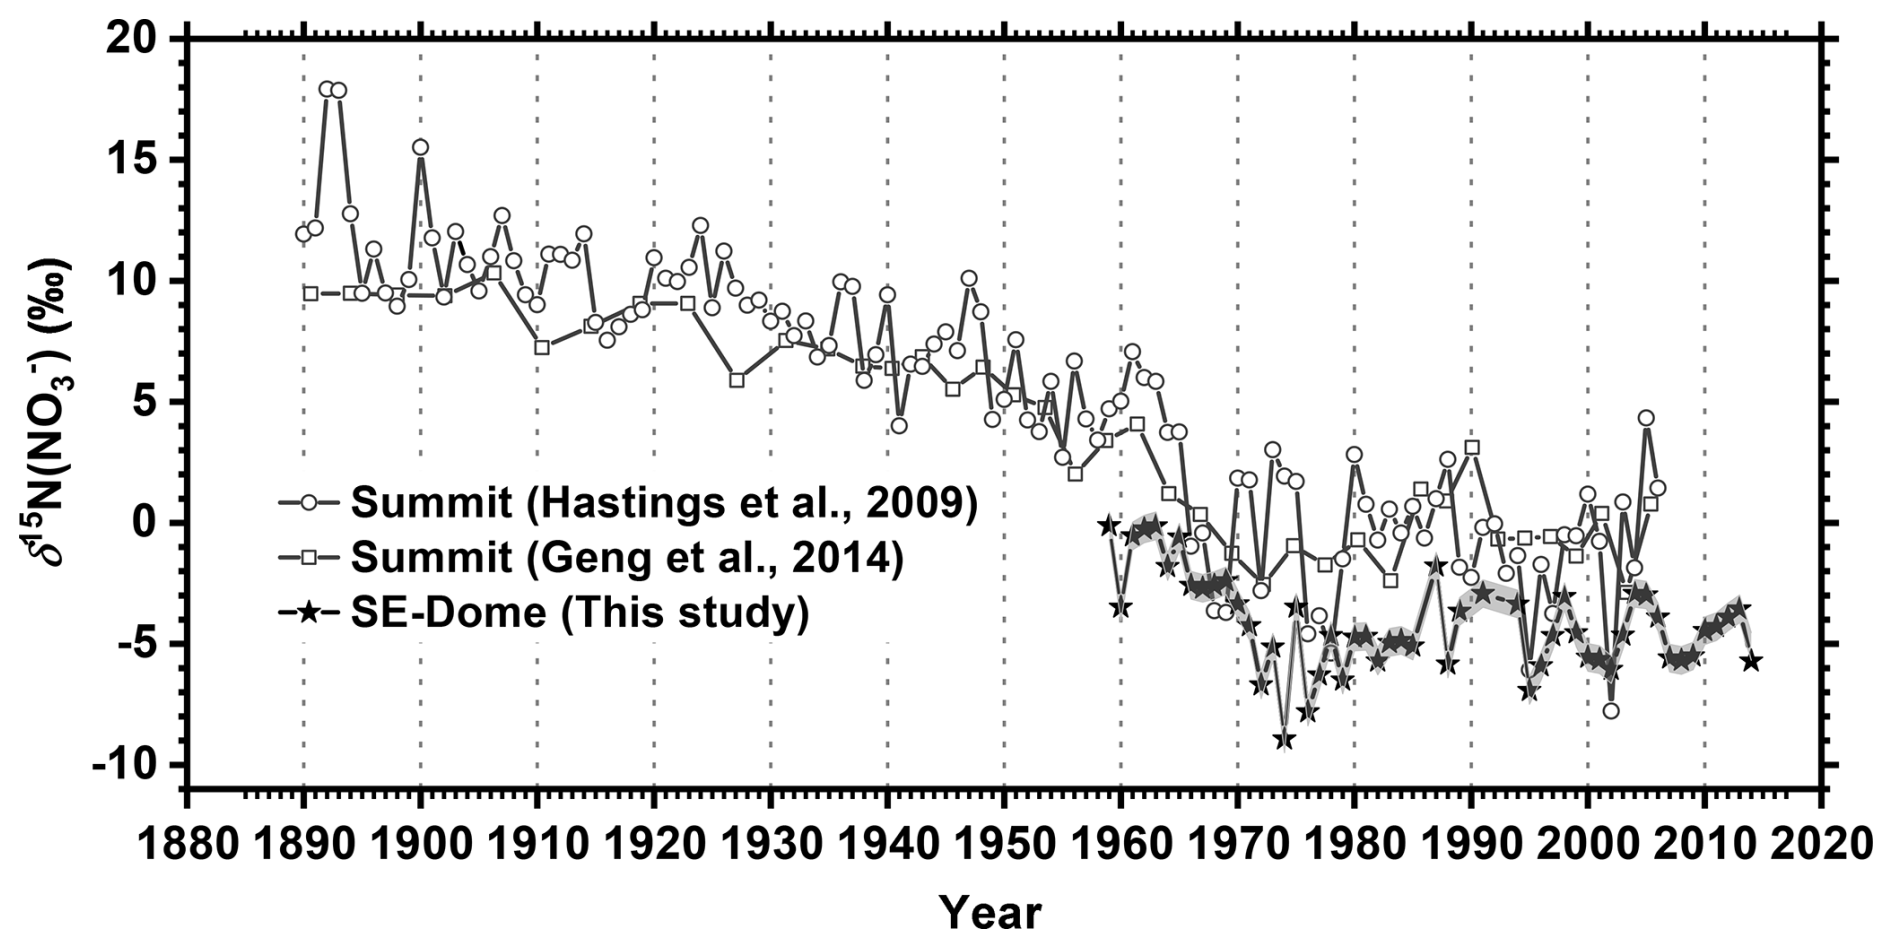
Figure 5The δ15N(NO) values obtained from the SE-Dome (this study) and Summit (Hastings et al., 2009; Geng et al., 2014) ice cores. The shaded area for δ15N(NO) values in SE-Dome represents the propagated errors of the annual average, based on the seasonal concentration and δ15N variations.
First, regarding the differences in the δ15N values of NO deposited at the two sites, there are two main sources of the NO deposited in the Greenland ice core. One long-range source is derived primarily from anthropogenic sources outside of Greenland. The other source involves NOx released from NO photolysis within the snowpack, which is then reoxidized and redeposited. Although the air masses at the SE-Dome and Summit sites have similar source regions – North America and western Europe (Fig. 1b and c) – the degree of influence from reactive nitrogen sources differed between sites (Fig. S3). At the SE-Dome site, the contributions from outside Greenland were relatively high, with nearly equal influence from North America and European Union (EU) countries (Fig. S3b). In contrast, the contributions from EU countries were relatively low at the Summit site, while the North American region (mostly Eastern Canada) and inner Greenland had greater contributions (Fig. S3c). The NOx sources from western Europe and North America are not necessarily similar; for example, differences in the relative contributions of various NOx sources are reflected in their δ15N values, with NOx from coal and biomass tending to have higher δ15N values, while NOx emissions from oil, natural gas, and soil tend to have lower δ15N values (e.g., Elliott et al., 2019). To date, there have been no studies comprehensively comparing the isotopic composition of atmospheric NO between Europe and North America. The limited available data show that δ15N values in total atmospheric NO (sum of gaseous HNO3 and particulate NO) in the northeastern USA range from −10 ‰ to +5 ‰ (Bekker et al., 2023), while those in rainwater NO (including both gaseous HNO3 and particulate NO) in Switzerland range from −12 to +6 ‰ (Freyer, 1991), which are indistinguishable. A recent study (Song et al., 2021) compiled the δ15N values of precipitated NO between urban and non-urban areas in Europe (n=8 and n=15, respectively) and North America (n=10 and n=73, respectively), showing no clear distinction between the two regions, although Europe exhibited slightly higher values. Hence, there is no clear evidence that the long-term δ15N trends in European countries consistently remain lower than those in the USA or Canada; thus, the ∼4 ‰ lower δ15N(NO) values observed at SE-Dome, which is relatively more influenced by air masses from Europe, cannot be explained solely by air mass origin differences.
Considering the potential impact of snow-sourced NOx and reoxidized NO, it is important to note that the extent of recycled NOx from NO photolysis in the Greenland ice sheet differed between these two sites. As modeled by Zatko et al. (2016), recycled NOx is typically more important at inland sites such as the Summit than coastal sites such as the SE-Dome. Additionally, the contribution of air masses from inside Greenland was higher at the Summit site than at the SE-Dome (Fig. S3). Nevertheless, the δ15N values of NOx and reoxidized NO are typically low due to isotopic fractionation during snow NO photolysis in the snow and ice, with δ15N(NO) in high-latitude air masses attributed to photochemical NOx production in snow, resulting in δ15N(NO) values of −10 ‰ to −43 ‰ in polar regions (e.g., Savarino et al., 2007; Morin et al., 2009; Shi et al., 2021). Thus, the contribution of locally recycled NO, which was greater at the Summit, cannot explain why δ15N(NO) values were lower at the SE-Dome than at the Summit site.
Finally, regarding the differences in postdepositional alterations between two sites, we applied parameters specific to the SE-Dome in the TRANSITS model (Figs. 3 and 4). The model results for the SE-Dome, accounting for postdepositional NO photolysis, showed a net NO loss of 1.3 % and a δ15N(NO) increase of +0.9 ‰ (see Sect. 3.2). In comparison, the Summit condition resulted in a ∼4 % net NO loss and a +2.6 ‰ δ15N(NO) increase (Jiang et al., 2021). Although the lower δ15N(NO) values at the SE-Dome can be partially explained by the model, they cannot be fully accounted for quantitatively. However, the estimated +2.6 ‰ increase in δ15N(NO) at the Summit site may be underestimated due to an underestimation of fexp (Jiang et al., 2021). Indeed, an observational study (Honrath et al., 2002) indicates that most of the NOx and/or HNO3 emitted from the snow at Summit is largely exported from the local boundary layer if no wet deposition occurs, suggesting that the fexp value can reach ∼1 under Summit conditions. Therefore, the actual net NO loss and δ15N(NO) variation at the Summit site may have been larger than the 4 % estimated by Jiang et al. (2021). Thus, when considering higher fexp values, the difference due to postdepositional alterations could be higher than the modeled difference between the SE-Dome (+0.9 ‰, this study) and Summit (+2.6 ‰, Jiang et al., 2021) sites. Indeed, when considering an extreme condition of fexp=100 %, the difference between the Summit and SE-Dome sites becomes ∼5 ‰ (Fig. 3). Overall, although there is some uncertainty in the model, it is likely that the SE-Dome experienced less postdepositional alteration, thus preserving the atmospheric δ15N(NO) values more effectively than at the Summit site.
Although the contribution of different NO sources cannot be entirely ruled out, our analysis shows that the observed δ15N(NO) value at SE-Dome, which is 4.2±2.8 ‰ lower than that at Summit, can largely be attributed to differences in postdepositional alterations.
4.2 Seasonal variations in NO isotopes
The postdepositional effect, as estimated from the TRANSITS model, yielded a summer–winter difference in δ15N(NO) of 1.1±0.7 ‰ and a difference smaller than 0.5 ‰ in Δ17O(NO), as described in Sect. 3.2 (Fig. 4b and c). In contrast, except for the anomalous years (1959–1961, 1972, 1995, 2005, and 2013), the observed summer–winter differences for respective years in the SE-Dome ice core were 5.3±2.4 ‰ (0.4 ‰–9.8 ‰) for δ15N(NO) and ‰ (from −8.2 ‰ to −0.4 ‰) for Δ17O(NO), respectively (Fig. 2a and b), which were larger than the differences estimated by the TRANSITS model. Thus, the observed differences between the summer and winter NO isotopes were not solely explained by postdepositional alteration. Consequently, seasonal differences in δ15N(NO) and Δ17O(NO) likely reflect atmospheric changes.
The observed seasonal δ15N(NO) trend (high in summer and low in winter) at the SE-Dome site was consistent with observations made at two coastal Arctic sites (Morin et al., 2008, 2012) but inconsistent with typical seasonal δ15N(NO) values of aerosols in midlatitude regions that are high in winter and low in summer (Freyer, 1991; Freyer et al., 1996; Lim et al., 2022). Although the specific process has yet to be identified, the factors controlling high δ15N(NO) values in the summer have been comprehensively reviewed (Jiang et al., 2024, and references therein). One possibility is that physicochemical transformations of NO related to temperature influence δ15N(NO) values, as suggested by a strong correlation between high δ15N(NO) values and summer air temperatures (Morin et al., 2008). Another possibility is the incursion of anthropogenic sources, as proposed by Morin et al. (2009), which is supported by indications that air parcels originating from regions with greater anthropogenic influence carry higher δ15N(NO) values. This is supported by observational studies on atmospheric δ15N(NO) (e.g., Vicars and Savarino, 2014) and the increased frequency of air masses originating from North America during summer compared to winter (Kahl et al., 1997). While definitive conclusions regarding these observations have not yet been determined, it is hypothesized that the observations may be influenced by a combination of factors, including NOx sources, gas–particle partitioning variability influenced by temperature (Freyer, 1991) and acidity (Geng et al., 2014), oxidation pathways (Walters et al., 2015a), and differences in transport efficiency and removal processes (Heaton, 1987; Beyn et al., 2014). Future studies should examine the differences in δ15N(NO) variations between both the source and remote regions. Such comparative analyses could enhance the current understanding of the underlying processes that influence isotopic compositions in different geographical contexts.
The observed seasonal changes in Δ17O(NO) (high in winter and low in summer; Fig. 2b) were consistent with typical seasonal variations in Δ17O(NO) (e.g., Michalski et al., 2003). In summer, increased sunlight promotes the formation of HNO3 via NO2+ OH reactions, leading to lower Δ17O(NO) values. Conversely, in winter, N2O5 hydrolytic or NO3 radical pathways forming HNO3 in the presence of O3 predominate and result in increased Δ17O(NO) levels. Although this kind of seasonal variation in Δ17O(NO) is well known, we confirmed the historic occurrence of similar seasonal variations in the atmosphere. Although the scope of the current study limits further discussion in this regard, future research should explore the differences in Δ17O(NO) between summer and winter during the preindustrial period, when anthropogenic contributions of NO were significantly lower.
4.3 Decadal variations in NO isotopes
As discussed in Sect. 4.1, the SE-Dome ice core recorded atmospheric NO deposition with minimal postdepositional effects. The decadal δ15N(NO) trend obtained from ice cores in Greenland has been interpreted to indicate changes in the NOx source (Hastings et al., 2009) and/or atmospheric acidity from the beginning of the industrial revolution to the present (Geng et al., 2014). In response to emission controls since 1975, reasonable changes in dominant NOx emissions and the adoption of NOx removal technology (such as three-way catalytic converters) are expected, which can affect the δ15N(NO) values (e.g., Walters et al., 2015b). As for acidity, if δ15N(NO) is primarily controlled by atmospheric acidity, as proposed by Geng et al. (2014), δ15N(NO) should have increased after approximately 1975 when the atmospheric acidity decreased (owing to SO2 emission controls; Hattori et al., 2021). However, the δ15N(NO) values obtained herein did not increase until 2014, indicating that there are multiple factors controlling ice core δ15N(NO) values. As this study only covers a relatively limited period (60 years), future studies should address and compare longer ice core records from different regions. Such comparisons would be beneficial for understanding the factors behind isotopic variations, thereby enabling more accurate interpretations of isotopic records reconstructed from ice cores.
The unusually high NO fluxes observed in the summer of 1987 (1.97 mmol m−2 a−1) and the spring of 1992 (1.38 mmol m−2 a−1) were also notable (Fig. 2c). The extent of forest fires in North America could be the primary driver of this phenomenon, based on coincident high NH fluxes during these periods (Iizuka et al., 2018). In 1992, the Mount Pinatubo eruption may have influenced the observations, considering the high SO concentration (13.7 µmol L−1; Iizuka et al., 2018). The δ15N(NO) values during the summer of 1987 (1.3 ‰) and the spring of 1992 (4.8 ‰) were relatively high compared with other years during which δ15N(NO) was less than 0 ‰. These higher δ15N(NO) values may be related to biomass burning associated with forest fires (−4.3 ‰ to +7.0 ‰; Chai et al., 2019). Stratospheric NO inputs may also have high δ15N values, as observed in Antarctic aerosols (Savarino et al., 2007). However, the Δ17O(NO) values in the summer of 1987 (28.2 ‰) and the spring of 1992 (29.5 ‰) were not clearly different from other years, which is not consistent with the high Δ17O(NO) trend during preindustrial biomass burning (i.e., forest fires) reported in the previous study (Alexander et al., 2004). We also note that no biomass-burning tracers were detected in 1987 or 1992 (Parvin et al., 2019). Further research is therefore required to link nitrate isotopes with specific events such as biomass burning.
The Δ17O(NO) record from the SE-Dome core did not exhibit clear trends over the past 60 years. During this period, changes in atmospheric oxidants have occurred, such as increases in tropospheric O3 over Arctic regions (Law et al., 2023). It is reasonable to estimate that higher O3 can induce increases in Δ17O(NO) by (1) promoting NO2 formation from NO + O3 reactions and (2) promoting NO2 oxidation to NO3 (and subsequently to HNO3) by O3. However, such changes were not recorded in the Δ17O(NO) data from the SE-Dome ice core. During this period, atmospheric sulfate formation was changed by the promotion of in-cloud S(IV) + O3 reactions, based on increases in Δ17O(SO) from the same SE-Dome ice core (Hattori et al., 2021). Thus, further research is required to determine the mechanism(s) behind the observed constant Δ17O(NO) values in ice cores after emission controls by comparing Δ17O(NO) values estimated using chemical transport models such as GEOS-Chem (Alexander et al., 2009, 2020). Based on the Δ17O(NO) values recorded in the GISP2 ice core, the variations have been attributed to the intricate BrONO2 hydrolysis mechanism, which extends beyond the small fluctuations in the ) ratio in the relatively colder climate of a glacial period (Geng et al., 2017). Thus, reactive-halogen chemistry may also be a factor that impacts changes in the atmospheric oxidation capacity, specifically in high-latitude regions in the Northern Hemisphere.
4.4 Comparison with other ice core data
The δ15N(NO) value of ice cores collected in Lomonosovfonna, Svalbard, was ‰ after 1950 (Vega et al., 2015), which is lower than that at the SE-Dome and Summit sites. Given that snow accumulation at Lomonosovfonna (0.55±0.1 m w.e. a−1; Vega et al., 2015) was higher than at Summit, these low δ15N(NO) values may reflect less postdepositional alteration. Notably, the relatively low δ15N(NO) values at Lomonosovfonna and the SE-Dome site were consistent with the low δ15N(NO) values in aerosols observed at two Arctic stations (Morin et al., 2008, 2012). Notably, the SE-Dome site and Svalbard both had lower δ15N(NO) values and higher accumulation rates than the Summit site. Additionally, Svalbard is closer to Europe than Greenland, which may indicate a regional source difference. Ice core δ15N(NO) records reported from Lomonosovfonna also exhibited decreasing trends until the 1970s, whereas an increase in δ15N(NO) was only observed at Lomonosovfonna after the 1990s (Vega et al., 2015). Such differences may be attributed to differences in NOx sources and spatial chemistries in the Arctic, although it is unclear whether this difference was caused by anthropogenic sources, natural sources, transport, or a combination of these factors.
The δ15N(NO) records in ice cores from the Tibetan Plateau also exhibit decreasing trends from 1955 to 2011 (Li et al., 2020). The δ15N(NO) of this Tibetan Plateau ice core (4.2±3.1 ‰ in 1951–2011) is also substantially higher than those of Arctic ice cores, indicating a different regional context. Comparing δ15N(NO) records from different locations would be beneficial for determining the regional physical or chemical behaviors of NO from emission to deposition. This would allow us to better assess the impacts of human activity on nitrogen cycling and take corresponding measures to reduce the adverse effects of NO on climate and biogeochemical cycles. However, in Antarctica (Akers et al., 2022), the ice core δ15N(NO) values varied significantly depending on the snow accumulation rate. It is therefore important to estimate postdepositional alteration for each ice core, refine models with recent information (Shi et al., 2023), and perform reverse calculations for atmospheric δ15N(NO) (Jiang et al., 2024). The TRANSITS model used in this study is effective for assessing the sensitivity of nitrate preservation and isotopic compositions to snow accumulation within the same environment. However, as discussed, the archived isotopic composition depends on the fexp value, which varies spatiotemporally. Therefore, efforts should be made to update models that account for the photolysis of snow NO and the recycling and redistribution of reactive nitrogen in boundary layer chemistry within a global chemical transport model (Zatko et al., 2016) by incorporating δ15N information. Additionally, a recent study emphasized the potential impact of microbial alterations on both NO concentrations and its isotopic compositions in an Asian glacier (Hattori et al., 2023); thus, interpretations of NO concentrations and δ15N(NO) records in ice cores should proceed with caution. We recommend that interpretations of NO concentrations and δ15N(NO) records in ice cores should be accompanied by Δ17O(NO) or δ18O(NO) records whenever possible to verify atmospheric NO preservation without postdepositional biological alteration.
In this study, we reported ∼60-year (1959–2014) records of NO isotopic compositions from the SE-Dome ice core in Greenland. The observed δ15N(NO) values in the SE-Dome ice core were consistently ∼4 ‰ lower than those in the Summit ice core record. The high snow accumulation rate at the SE-Dome site reduces the sensitivity of NO to postdepositional processes, which was supported by outputs from the TRANSITS model. Therefore, we concluded that the SE-Dome ice core, which exhibits superior NO preservation, is a promising tool for reconstructing changes in atmospheric nitrogen cycling driven by anthropogenic activity. This study was based on results from the SE-Dome I ice core (∼90 m), which covers the past 60 years. The SE-Dome II core (drilled in 2021) preserves records that extend back to 1800 CE (Iizuka et al., 2021; Kawakami et al., 2023). Thus, there is considerable potential for future research aimed at reconstructing NO aerosol dynamics from the beginning of the industrial revolution to the present. Additionally, while regional comparisons of ice core δ15N(NO) records are beneficial for describing the regional physicochemical behaviors of NO, it is necessary to account for regional differences in postdepositional alteration when analyzing the spatiotemporal variations in atmospheric NO isotopes.
The data used in this study are available from https://eprints.lib.hokudai.ac.jp/dspace/handle/2115/94240 (last access: 18 March 2025) or https://doi.org/10.14943/hu94240 (Wei et al., 2025).
The supplement related to this article is available online at https://doi.org/10.5194/acp-25-5727-2025-supplement.
SH conceptualized the study; ZW, SH, AT, SI, ZJ, SM, and YI curated the data; ZW, SH, AT, ZJ, SI, and YI performed the formal analysis; SH and YI acquired funding; SH, AT, NY, KF, SI, SM, and YI conducted the investigation; SH, ZJ, LG, and JS developed the methodology; SH managed the project; ZW and SH validated the results; ZW, KF, SH, and ZJ visualized the data; ZW and SH wrote the original draft; and KF, SI, ZJ, LG, JS, RU, AL, and YI reviewed and edited the manuscript.
The contact author has declared that none of the authors has any competing interests.
Publisher's note: Copernicus Publications remains neutral with regard to jurisdictional claims made in the text, published maps, institutional affiliations, or any other geographical representation in this paper. While Copernicus Publications makes every effort to include appropriate place names, the final responsibility lies with the authors.
The authors gratefully acknowledge the NOAA Air Resources Laboratory (ARL) for providing the HYSPLIT transport and dispersion model (Stein et al., 2015). We also wish to acknowledge Jihong Cole-Dai for providing data on the annual snow accumulation rate at the Summit site.
This study was supported by the National Natural Science Foundation of China (grant nos. 42484851, W2441015, and 42473011); the Fundamental Research Funds for the Central Universities, including the General Program (grant no. 0206/14380918), the International Collaboration Program (grant no. 0206/14380225), the Cemac “GeoX” Interdisciplinary Program (grant no. 0206/14380205), and additional grants (grant nos. 0206/14380232, 0206/14380204, 0206/14380150, 0206/14380185, and 0206/14380174); and start-up funding from Nanjing University. This study was also supported by MEXT/JSPS KAKENHI (grant nos. 18H05292, 23H00511, and 23K18516) and the Arctic Challenge for Sustainability (ArCS II) project (grant no. JPMXD1420318865). This study was performed under a cooperative research program of the Institute of Nature and Environmental Technology, Kanazawa University (project no. 22042, 23039). Shohei Hattori was supported by MEXT/JSPS KAKENHI (grant no. 20H04305), Lei Geng was supported by the National Natural Science Foundation of China (grant no. W2411030), and Zhuang Jiang received support from the Fundamental Research Funds for the Central Universities.
This paper was edited by Eliza Harris and reviewed by Matthew Johnson and one anonymous referee.
Akers, P. D., Savarino, J., Caillon, N., Servettaz, A. P. M., Le Meur, E., Magand, O., Martins, J., Agosta, C., Crockford, P., Kobayashi, K., Hattori, S., Curran, M., van Ommen, T., Jong, L., and Roberts, J. L.: Sunlight-driven nitrate loss records Antarctic surface mass balance, Nat. Commun., 13, 4274, https://doi.org/10.1038/s41467-022-31855-7, 2022.
Alexander, B., Savarino, J., Kreutz, K. J., and Thiemens, M. H.: Impact of preindustrial biomass-burning emissions on the oxidation pathways of tropospheric sulfur and nitrogen, J. Geophys. Res.-Atmos., 109, D08303, https://doi.org/10.1029/2003JD004218, 2004.
Alexander, B., Hastings, M. G., Allman, D. J., Dachs, J., Thornton, J. A., and Kunasek, S. A.: Quantifying atmospheric nitrate formation pathways based on a global model of the oxygen isotopic composition (Δ17O) of atmospheric nitrate, Atmos. Chem. Phys., 9, 5043–5056, https://doi.org/10.5194/acp-9-5043-2009, 2009.
Alexander, B., Sherwen, T., Holmes, C. D., Fisher, J. A., Chen, Q., Evans, M. J., and Kasibhatla, P.: Global inorganic nitrate production mechanisms: comparison of a global model with nitrate isotope observations, Atmos. Chem. Phys., 20, 3859–3877, https://doi.org/10.5194/acp-20-3859-2020, 2020.
Amino, T., Iizuka, Y., Matoba, S., Shimada, R., Oshima, N., Suzuki, T., Ando, T., Aoki, T., and Fujita, K.: Increasing dust emission from ice free terrain in southeastern Greenland since 2000, Polar Sci., 27, 100599, https://doi.org/10.1016/j.polar.2020.100599, 2021.
Bekker, C., Walters, W. W., Murray, L. T., and Hastings, M. G.: Nitrate chemistry in the northeast US – Part 1: Nitrogen isotope seasonality tracks nitrate formation chemistry, Atmos. Chem. Phys., 23, 4185–4201, https://doi.org/10.5194/acp-23-4185-2023, 2023.
Berhanu, T. A., Meusinger, C., Erbland, J., Jost, R., Bhattacharya, S. K., Johnson, M. S., and Savarino, J.: Laboratory study of nitrate photolysis in Antarctic snow. II. Isotopic effects and wavelength dependence, J. Chem. Phys., 140, 244306, https://doi.org/10.1063/1.4882899, 2014.
Berhanu, T. A., Savarino, J., Erbland, J., Vicars, W. C., Preunkert, S., Martins, J. F., and Johnson, M. S.: Isotopic effects of nitrate photochemistry in snow: a field study at Dome C, Antarctica, Atmos. Chem. Phys., 15, 11243–11256, https://doi.org/10.5194/acp-15-11243-2015, 2015.
Beyn, F., Matthias, V., and Dähnke, K.: Changes in atmospheric nitrate deposition in Germany – An isotopic perspective, Environ. Pollut., 194, 1–10, https://doi.org/10.1016/j.envpol.2014.06.043, 2014.
Chai, J., Miller, D. J., Scheuer, E., Dibb, J., Selimovic, V., Yokelson, R., Zarzana, K. J., Brown, S. S., Koss, A. R., Warneke, C., and Hastings, M.: Isotopic characterization of nitrogen oxides (NOx), nitrous acid (HONO), and nitrate (pNO) from laboratory biomass burning during FIREX, Atmos. Meas. Tech., 12, 6303–6317, https://doi.org/10.5194/amt-12-6303-2019, 2019.
Domine, F., Taillandier, A. S., and Simpson, W. R.: A parameterization of the specific surface area of seasonal snow for field use and for models of snowpack evolution, J. Geophys. Res.-Earth Surf., 112, F02031, https://doi.org/10.1029/2006JF000512, 2007.
Duce, R. A., LaRoche, J., Altieri, K., Arrigo, K. R., Baker, A. R., Capone, D. G., Cornell, S., Dentener, F., Galloway, J., Ganeshram, R. S., Geider, R. J., Jickells, T., Kuypers, M. M., Langlois, R., Liss, P. S., Liu, S. M., Middelburg, J. J., Moore, C. M., Nickovic, S., Oschlies, A., Pedersen, T., Prospero, J., Schlitzer, R., Seitzinger, S., Sorensen, L. L., Uematsu, M., Ulloa, O., Voss, M., Ward, B., and Zamora, L.: Impacts of atmospheric anthropogenic nitrogen on the open ocean, Science, 320, 893–897, https://doi.org/10.1126/science.1150369, 2008.
Eichler, A., Legrand, M., Jenk, T. M., Preunkert, S., Andersson, C., Eckhardt, S., Engardt, M., Plach, A., and Schwikowski, M.: Consistent histories of anthropogenic western European air pollution preserved in different Alpine ice cores, The Cryosphere, 17, 2119–2137, https://doi.org/10.5194/tc-17-2119-2023, 2023.
Elliott, E. M., Yu, Z., Cole, A. S., and Coughlin, J. G.: Isotopic advances in understanding reactive nitrogen deposition and atmospheric processing, Sci. Total Environ., 662, 393–403, https://doi.org/10.1016/j.scitotenv.2018.12.177, 2019.
Erbland, J., Vicars, W. C., Savarino, J., Morin, S., Frey, M. M., Frosini, D., Vince, E., and Martins, J. M. F.: Air–snow transfer of nitrate on the East Antarctic Plateau – Part 1: Isotopic evidence for a photolytically driven dynamic equilibrium in summer, Atmos. Chem. Phys., 13, 6403–6419, https://doi.org/10.5194/acp-13-6403-2013, 2013.
Erbland, J., Savarino, J., Morin, S., France, J. L., Frey, M. M., and King, M. D.: Air–snow transfer of nitrate on the East Antarctic Plateau – Part 2: An isotopic model for the interpretation of deep ice-core records, Atmos. Chem. Phys., 15, 12079–12113, https://doi.org/10.5194/acp-15-12079-2015, 2015.
Felix, J. D. and Elliott, E. M.: The agricultural history of human-nitrogen interactions as recorded in ice core δ15N-NO3−, Geophys. Res. Lett., 40, 1642–1646, https://doi.org/10.1002/grl.50209, 2013.
Freyer, H. D.: Seasonal variation of 15N/14N ratios in atmospheric nitrate species, Tellus B, 43, 30–44, https://doi.org/10.1034/j.1600-0889.1991.00003.x, 1991.
Freyer, H. D., Kobel, K., Delmas, R. J., Kley, D., and Legrand, M. R.: First results of 15N/14N ratios in nitrate from alpine and polar ice cores, Tellus B, 48, 93–105, https://doi.org/10.1034/j.1600-0889.1996.00009.x, 1996.
Fibiger, D. L., Dibb, J. E., Chen, D., Thomas, J. L., Burkhart, J. F., Huey, L. G., and Hastings, M. G.: Analysis of nitrate in the snow and atmosphere at Summit, Greenland: Chemistry and transport, J. Geophys. Res.-Atmos., 121, 5010–5030, https://doi.org/10.1002/2015JD024187, 2016.
Finlayson-Pitts, B. J. and Pitts, J. N.: Chemistry of the upper and lower atmosphere: Theory, experiments, and applications, Academic Press, San Diego, https://doi.org/10.1016/B978-0-12-257060-5.X5000-X, 2000.
Frey, M. M., Savarino, J., Morin, S., Erbland, J., and Martins, J. M. F.: Photolysis imprint in the nitrate stable isotope signal in snow and atmosphere of East Antarctica and implications for reactive nitrogen cycling, Atmos. Chem. Phys., 9, 8681–8696, https://doi.org/10.5194/acp-9-8681-2009, 2009.
Furukawa, R., Uemura, R., Fujita, K., Sjolte, J., Yoshimura, K., Matoba, S., and Iizuka, Y.: Seasonal-scale dating of a shallow ice core from Greenland using oxygen isotope matching between data and simulation, J. Geophys. Res.-Atmos., 122, 873–887, https://doi.org/10.1002/2017jd026716, 2017.
Geng, L., Alexander, B., Cole-Dai, J., Steig, E. J., Savarino, J., Sofen, E. D., and Schauer, A. J.: Nitrogen isotopes in ice core nitrate linked to anthropogenic atmospheric acidity change, P. Natl. Acad. Sci. USA, 111, 5808–5812, https://doi.org/10.1073/pnas.1319441111, 2014.
Geng, L., Zatko, M. C., Alexander, B., Fudge, T. J., Schauer, A. J., Murray, L. T., and Mickley, L. J.: Effects of post-depositional processing on nitrogen isotopes of nitrate in the Greenland Ice Sheet Project 2 ice core, Geophys. Res. Lett., 42, 5346–5354, https://doi.org/10.1002/2015gl064218, 2015.
Geng, L., Murray, L. T., Mickley, L. J., Lin, P., Fu, Q., Schauer, A. J., and Alexander, B.: Isotopic evidence of multiple controls on atmospheric oxidants over climate transitions, Nature, 546, 133–136, https://doi.org/10.1038/nature22340, 2017.
Hastings, M. G.: Evaluating source, chemistry and climate change based upon the isotopic composition of nitrate in ice cores, IOP Conf. Ser.: Earth Environ. Sci., 9, 012002, https://doi.org/10.1088/1755-1315/9/1/012002, 2010.
Hastings, M. G., Sigman, D. M., and Steig, E. J.: Glacial/interglacial changes in the isotopes of nitrate from the Greenland Ice Sheet Project 2 (GISP2) ice core, Global Biogeochem. Cycles, 19, GB4024, https://doi.org/10.1029/2005GB002502, 2005.
Hastings, M. G., Jarvis, J. C., and Steig, E. J.: Anthropogenic impacts on nitrogen isotopes of ice-core nitrate, Science, 324, 1288, https://doi.org/10.1126/science.1170510, 2009.
Hastings, M. G., Casciotti, K. L., and Elliott, E. M.: Stable isotopes as tracers of anthropogenic nitrogen sources, deposition, and impacts, Elements, 9, 339–344, https://doi.org/10.2113/gselements.9.5.339, 2013.
Hattori, S., Savarino, J., Kamezaki, K., Ishino, S., Dyckmans, J., Fujinawa, T., Caillon, N., Barbero, A., Mukotaka, A., Toyoda, S., Well, R., and Yoshida, N.: Automated system measuring triple oxygen and nitrogen isotope ratios in nitrate using the bacterial method and N2O decomposition by microwave discharge, Rapid Commun. Mass Spectrom., 30, 2635–2644, https://doi.org/10.1002/rcm.7747, 2016.
Hattori, S., Iizuka, Y., Alexander, B., Ishino, S., Fujita, K., Zhai, S., Sherwen, T., Oshima, N., Uemura, R., Yamada, A., Suzuki, N., Matoba, S., Tsuruta, A., Savarino, J., and Yoshida, N.: Isotopic evidence for acidity-driven enhancement of sulfate formation after SO2 emission control, Sci. Adv., 7, eabd4610, https://doi.org/10.1126/sciadv.abd4610, 2021.
Hattori, S., Li, Z. Q., Yoshida, N., and Takeuchi, N.: Isotopic evidence for microbial nitrogen cycling in a glacier interior of high-mountain Asia, Environ. Sci. Technol., 57, 15026–15036, https://doi.org/10.1021/acs.est.3c04757, 2023.
Heaton, T. H. E.: Ratios of nitrate and ammonium in rain at Pretoria, South Africa, Atmos. Environ., 21, 843–852, https://doi.org/10.1016/0004-6981(87)90080-1, 1987.
Hersbach, H., Bell, B., Berrisford, P., Hirahara, S., Horányi, A., Muñoz-Sabater, J., Nicolas, J., Peubey, C., Radu, R., Schepers, D., Simmons, A., Soci, C., Abdalla, S., Abellan, X., Balsamo, G., Bechtold, P., Biavati, G., Bidlot, J., Bonavita, M., De Chiara, G., Dahlgren, P., Dee, D., Diamantakis, M., Dragani, R., Flemming, J., Forbes, R., Fuentes, M., Geer, A., Haimberger, L., Healy, S., Hogan, R. J., Holm, E., Janisková, M., Keeley, S., Laloyaux, P., Lopez, P., Lupu, C., Radnoti, G., de Rosnay, P., Rozum, I., Vamborg, F., Villaume, S., and Thépaut, J.-N.: The ERA5 global reanalysis, Q. J. Roy. Meteor. Soc., 146, 1999–2049, https://doi.org/10.1002/qj.3803, 2020.
Honrath, R., Lu, Y., Peterson, M. C., Dibb, J. E., Arsenault, M., Cullen, N., and Steffen, K. J. A. E.: Vertical fluxes of NOx, HONO, and HNO3 above the snowpack at Summit, Greenland, Atmos. Environ., 36, 2629–2640, 2002.
Iizuka, Y., Matoba, S., Yamasaki, T., Oyabu, I., Kadota, M., and Aoki, T.: Glaciological and meteorological observations at the SE-Dome site, southeastern Greenland Ice Sheet, B. Glaciol. Res., 34, 1–10, https://doi.org/10.5331/bgr.15R03, 2016.
Iizuka, Y., Miyamoto, A., Hori, A., Matoba, S., Furukawa, R., Saito, T., Fujita, S., Hirabayashi, M., Yamaguchi, S., Fujita, K., and Takeuchi, N.: A firn densification process in the high accumulation dome of Southeastern Greenland, Arct. Antarct. Alp. Res., 49, 13–27, https://doi.org/10.1657/AAAR0016-034, 2017.
Iizuka, Y., Uemura, R., Fujita, K., Hattori, S., Seki, O., Miyamoto, C., Suzuki, T., Yoshida, N., Motoyama, H., and Matoba, S.: A 60 year record of atmospheric aerosol depositions preserved in a high-accumulation dome ice core, Southeast Greenland, J. Geophys. Res.-Atmos., 123, 574–589, https://doi.org/10.1002/2017JD026733, 2018.
Iizuka, Y., Matoba, S., Minowa, M., Yamasaki, T., Kawakami, K., Kakugo, A., Miyahara, M., Hashimoto, A., Niwano, M., Tanikawa, T., Fujita, K., and Aoki, T.: Ice core drilling and the related observations at SE-Dome site, Southeastern Greenland Ice Sheet, Bull. Glaciol. Res., 39, 1–12, https://doi.org/10.5331/bgr.21R01, 2021.
Jarvis, J. C., Hastings, M. G., Steig, E. J., and Kunasek, S. A.: Isotopic ratios in gas-phase HNO3 and snow nitrate at Summit, Greenland, J. Geophys. Res.-Atmos., 114, D17301, https://doi.org/10.1029/2009JD012134, 2009.
Jiang, Z., Alexander, B., Savarino, J., Erbland, J., and Geng, L.: Impacts of the photo-driven post-depositional processing on snow nitrate and its isotopes at Summit, Greenland: a model-based study, The Cryosphere, 15, 4207–4220, https://doi.org/10.5194/tc-15-4207-2021, 2021.
Jiang, Z., Alexander, B., Savarino, J., and Geng, L.: An inverse model to correct for the effects of post-depositional processing on ice-core nitrate and its isotopes: model framework and applications at Summit, Greenland, and Dome C, Antarctica, Atmos. Chem. Phys., 24, 4895–4914, https://doi.org/10.5194/acp-24-4895-2024, 2024.
Kahl, J. D. W., Martinez, D. A., Kuhns, H., Davidson, C. I., Jaffrezo, J.-L., and Harris, J. M.: Air mass trajectories to Summit, Greenland: A 44-year climatology and some episodic events, J. Geophys. Res.-Oceans, 102, 26861–26875, https://doi.org/10.1029/97JC00296, 1997.
Kawakami, K., Iizuka, Y., Sasage, M., Matsumoto, M., Saito, T., Hori, A., Ishino, S., Fujita, S., Fujita, K., Takasugi, K., Hatakeyama, T., Hamamoto, S., Watari, A., Esashi, N., Otsuka, M., Uemura, R., Horiuchi, K., Minowa, M., Hattori, S., Aoki, T., Hirabayashi, M., Kawamura, K., and Matoba, S.: SE-Dome II ice core dating with half-year precision: increasing melting events from 1799 to 2020 in Southeastern Greenland, J. Geophys. Res.-Atmos., 128, e2023JD038874, https://doi.org/10.1029/2023JD038874, 2023.
Kendall, M. G. J. L. L: Rank correlation methods. 4th edn., Charles Griffin, London, https://archive.org/details/rankcorrelationm0000kend (last access: 6 June 2025), 1975.
Khalzan, P., Sakai, A., and Fujita, K.: Mass balance of four mongolian glaciers: in-situ measurements, long-term reconstruction and sensitivity analysis, Front. Earth Sci., 9, 785306, https://doi.org/10.3389/feart.2021.785306, 2022.
Law, K., Hjorth, J., Pernov, J., Whaley, C., Skov, H., Coen, M., and Zhang, K.: Arctic tropospheric ozone trends, Geophys. Res. Lett., 50, e2023GL103096, https://doi.org/10.1029/2023GL103096, 2023.
Li, Z., Hastings, M. G., Walters, W. W., Tian, L., Clemens, S. C., Song, L., and Fang, Y.: Isotopic evidence that recent agriculture overprints climate variability in nitrogen deposition to the Tibetan Plateau, Environ. Int., 138, 105614, https://doi.org/10.1016/j.envint.2020.105614, 2020.
Lim, S., Lee, M., Savarino, J., and Laj, P.: Oxidation pathways and emission sources of atmospheric particulate nitrate in Seoul: based on δ15N and Δ17O measurements, Atmos. Chem. Phys., 22, 5099–5115, https://doi.org/10.5194/acp-22-5099-2022, 2022.
Mann, H. B.: Non-parametric tests against trend, Econometrica, 13, 245–259, https://doi.org/10.2307/1907187, 1945.
Mayewski, P. A., Lyons, W. B., Spencer, M. J., Twickler, M., Dansgaard, W., Koci, B., and Honrath, R. E.: Sulfate and nitrate concentrations from a south Greenland ice core, Science, 232, 975–977, https://doi.org/10.1126/science.232.4753.975, 1986.
McCabe, J. R., Boxe, C. S., Colussi, A. J., Hoffmann, M. R., and Thiemens, M. H.: Oxygen isotopic fractionation in the photochemistry of nitrate in water and ice, J. Geophys. Res.-Atmos., 110, 148–227, https://doi.org/10.1029/2004JD005484, 2005.
McIlvin, M. R., and Casciotti, K. L.: Technical updates to the bacterial method for nitrate isotopic analyses, Anal. Chem., 83, 1850–1856, https://doi.org/10.1021/ac1028984, 2011.
Meusinger, C., Berhanu, T. A., Erbland, J., Savarino, J., and Johnson, M. S.: Laboratory study of nitrate photolysis in Antarctic snow. I. Observed quantum yield, domain of photolysis, and secondary chemistry, J. Chem. Phys., 140, 244305, https://doi.org/10.1063/1.4882898, 2014.
Michalski, G., Scott, Z., Kabiling, M., and Thiemens, M. H.: First measurements and modeling of Δ17O in atmospheric nitrate, Geophys. Res. Lett., 30, 1870, https://doi.org/10.1029/2003GL017015, 2003.
Michalski, G., Bhattacharya, S. K., and Mase, D. F.: Oxygen Isotope Dynamics of Atmospheric Nitrate and Its Precursor Molecules, in: Handbook of Environmental Isotope Geochemistry, edited by: Baskaran, M., Advances in Isotope Geochemistry, Springer, Berlin, Heidelberg, https://doi.org/10.1007/978-3-642-10637-8_30, 2012.
Morin, S., Savarino, J., Frey, M. M., Yan, N., Bekki, S., Bottenheim, J. W., and Martins, J. M.: Tracing the origin and fate of NOx in the Arctic atmosphere using stable isotopes in nitrate, Science, 322, 730–732, https://doi.org/10.1126/science.1161910, 2008.
Morin, S., Savarino, J., Frey, M. M., Domine, F., Jacobi, H. W., Kaleschke, L., and Martins, J. M. F.: Comprehensive isotopic composition of atmospheric nitrate in the Atlantic Ocean boundary layer from 65° S to 79° N, J. Geophys. Res.-Atmos., 114, D05303, https://doi.org/10.1029/2008JD010696, 2009.
Morin, S., Erbland, J., Savarino, J., Domine, F., Bock, J., Friess, U., Jacobi, H.-W., Sihler, H., and Martins, J. M. F.: An isotopic view on the connection between photolytic emissions of NOx from the Arctic snowpack and its oxidation by reactive halogens, J. Geophys. Res.-Atmos., 117, D00R08, https://doi.org/10.1029/2011JD016618, 2012.
Neftel, A., Moor, E., Oeschger, H., and Stauffer, B.: Evidence from polar ice cores for the increase in atmospheric CO2 in the past two centuries, Nature, 315, 45–47, https://doi.org/10.1038/315045a0, 1985.
Noro, K., Hattori, S., Uemura, R., Fukui, K., Hirabayashi, M., Kawamura, K., Motoyama, H., Takenaka, N., and Yoshida, N.: Spatial variation of isotopic compositions of snowpack nitrate related to post-depositional processes in eastern Dronning Maud Land, East Antarctica, Geochem. J., 52, e7–e14, https://doi.org/10.2343/geochemj.2.0519, 2018.
Oyabu, I., Matoba, S., Yamasaki, T., Kadota, M., and Iizuka, Y.: Seasonal variations in the major chemical species of snow at the Southeast Dome in Greenland, Polar Sci., 10, 36–42, https://doi.org/10.1016/j.polar.2016.01.003, 2016.
Parvin, F., Seki, O., Fujita, K., Iizuka, Y., Matoba, S., Ando, T., and Sawada, K.: Assessment for paleoclimatic utility of biomass burning tracers in SE-Dome ice core, Greenland, Atmos. Environ., 196, 86–94, https://doi.org/10.1016/j.atmosenv.2018.10.012, 2019.
Röthlisberger, R., Hutterli, M. A., Sommer, S., Wolff, E. W., and Mulvaney, R.: Factors controlling nitrate in ice cores: Evidence from the Dome C deep ice core, J. Geophys. Res.-Atmos., 105, 20565–20572, https://doi.org/10.1029/2000JD900264, 2000.
Röthlisberger, R., Hutterli, M. A., Wolff, E. W., Mulvaney, R., Fischer, H., Bigler, M., Goto-Azuma, K., Hansson, M. E., Ruth, U., Siggaard-Andersen, M.-L., and Steffensen, J. P.: Nitrate in Greenland and Antarctic ice cores: a detailed description of post-depositional processes, Ann. Glaciol., 35, 209–216, https://doi.org/10.3189/172756402781817220, 2002.
Savarino, J., Kaiser, J., Morin, S., Sigman, D. M., and Thiemens, M. H.: Nitrogen and oxygen isotopic constraints on the origin of atmospheric nitrate in coastal Antarctica, Atmos. Chem. Phys., 7, 1925–1945, https://doi.org/10.5194/acp-7-1925-2007, 2007.
Sigman, D. M., Casciotti, K. L., Andreani, M., Barford, C., Galanter, M., and Böhlke, J. K.: A Bacterial Method for the Nitrogen Isotopic Analysis of Nitrate in Seawater and Freshwater, Anal. Chem., 73, 4145–4153, https://doi.org/10.1021/ac010088e, 2001.
Shammas, N. K., Wang, L. K., and Wang, M. H. S.: Sources, chemistry and control of acid rain in the environment, in: Handbook of Environment and Waste Management, 1–26, https://doi.org/10.1142/9789811207136_0001, 2020.
Shi, G., Ma, H., Zhu, Z., Hu, Z., Chen, Z., Jiang, S., An, C., Yu, J., Ma, T., Li, Y., Sun, B., and Hastings, M. G.: Using stable isotopes to distinguish atmospheric nitrate production and its contribution to the surface ocean across hemispheres, Earth Planet. Sci. Lett., 564, 116914, https://doi.org/10.1016/j.epsl.2021.116914, 2021.
Shi, G., Buffen, A. M., Hu, Y., Chai, J., Li, Y., Wang, D., and Hastings, M. G.: Modeling the complete nitrogen and oxygen isotopic imprint of nitrate photolysis in snow, Geophys. Res. Lett., 50, e2023GL103778, https://doi.org/10.1029/2023GL103778, 2023.
Song, W., Liu, X. Y., Hu, C. C., Chen, G. Y., Liu, X. J., Walters, W. W., Michalski, G., and Liu, C. Q.: Important contributions of non-fossil fuel nitrogen oxides emissions, Nat. Commun., 12, 243, https://doi.org/10.1038/s41467-020-20356-0, 2021.
Stein, A. F., Draxler, R. R., Rolph, G. D., Stunder, B. J. B., Cohen, M. D., and Ngan, F.: NOAA's HYSPLIT atmospheric transport and dispersion modeling system, B. Am. Meteorol. Soc., 96, 2059–2077, https://doi.org/10.1175/BAMS-D-14-00110.1, 2015.
The International GEOS-Chem User Community: geoschem/geos-chem: GEOS-Chem 12.9.3 (12.9.3), Zenodo [code], https://doi.org/10.5281/zenodo.3974569, 2020.
Vega, C. P., Pohjola, V. A., Samyn, D., Pettersson, R., Isaksson, E., Björkman, M. P., Martma, T., Marca, A., and Kaiser, J.: First ice core records of NO stable isotopes from Lomonosovfonna, Svalbard, J. Geophys. Res.-Atmos., 120, 313–330, https://doi.org/10.1002/2013JD020930, 2015.
Vicars, W. and Savarino, J.: Quantitative constraints on the 17O-excess (Δ17O) signature of surface ozone: Ambient measurements from 50° N to 50° S using the nitrite-coated filter technique, Geochim. Cosmochim. Ac., 135, 270–287, https://doi.org/10.1016/j.gca.2014.03.023, 2014.
Walters, W. W. and Michalski, G.: Theoretical calculation of nitrogen isotope equilibrium exchange fractionation factors for various NOy molecules, Geochim. Cosmochim. Ac., 164, 284–297, https://doi.org/10.1016/j.gca.2015.05.029, 2015a.
Walters, W. W., Goodwin, S. R., and Michalski, G.: Nitrogen stable isotope composition (δ15N) of vehicle-emitted NOx, Environ. Sci. Technol., 49, 2278–2285, https://doi.org/10.1021/es505580v, 2015b.
Walters, W. W. and Michalski, G.: Theoretical calculation of oxygen equilibrium isotope fractionation factors involving various NOy molecules, OH, and H2O and its implications for isotope variations in atmospheric nitrate, Geochim. Cosmochim. Ac., 191, 89–101, https://doi.org/10.1016/j.gca.2016.06.039, 2016.
Wei, Z., Hattori, S., Tsuruta, A., Jiang, Z., Ishino, S., Fujita, K., Matoba, S., Geng, L., Lamothe, A., Uemura, R., Yoshida, N., Savarino, J., and Iizuka, Y.: A 60-year atmospheric nitrate isotope record from a Southeast Greenland ice core with minimal post-depositional alteration, Hokkaido University [data set], https://doi.org/10.14943/hu94240, 2025.
Zatko, M., Geng, L., Alexander, B., Sofen, E., and Klein, K.: The impact of snow nitrate photolysis on boundary layer chemistry and the recycling and redistribution of reactive nitrogen across Antarctica and Greenland in a global chemical transport model, Atmos. Chem. Phys., 16, 2819–2842, https://doi.org/10.5194/acp-16-2819-2016, 2016.
Zhai, S., Jacob, D. J., Wang, X., Liu, Z., Wen, T., Shah, V., Li, K., Moch, J. M., Bates, K. H., Song, S., Shen, L., Zhang, Y., Luo, G., Yu, F., Sun, Y., Wang, L., Qi, M., Tao, J., Gui, K., Xu, H., Zhang, Q., Zhao, T., Wang, Y., Lee, H. C., Choi, H., and Liao, H.: Control of particulate nitrate air pollution in China, Nat. Geosci., 14, 389–395, https://doi.org/10.1038/s41561-021-00726-z, 2021.