the Creative Commons Attribution 4.0 License.
the Creative Commons Attribution 4.0 License.
 | 05 Jun 2025
Emission inventory development for spatiotemporal release of vanadium from anthropogenic sources in China
Han Zhang
Bo Jiang
Qimin Li
Xuewen Hu
Yi Xing
Anthropogenic activities are the major contributor to vanadium pollution in surficial environment, but quantitative assessment of anthropogenic vanadium emission across environmental receptors remains scarce. This study develops a nationwide vanadium emission inventory in China for 2015–2019, covering five major anthropogenic sources: coal combustion, stationary oil burning, transportation, industrial production, and waste handling. A cumulative flux model reveals emissions of 211 095, 3725, and 0.1 t of vanadium into the atmosphere, soil, and water during 2015–2019, respectively, highlighting the atmosphere as the primary vanadium receptor. Coal combustion (46.7 %) and stationary oil burning (40.1 %) are the largest vanadium contributors. The emission pattern is mainly shaped by regional activity levels, with Shandong, Liaoning, Hebei, and Guangdong contributing 35.8 % of national inventories. Shanxi and Inner Mongolia, designated as energy-producing bases, dominate coal-combustion-related emission. Beijing–Tianjin–Hebei achieves significant emission reductions due to coal restriction policies and adoption of cleaner energy and an advanced end-of-pipe system. In economically developed coastal regions, coal consumption has decreased, while oil consumption makes a greater contribution due to industrial modernization. Moreover, steelmaking operations account for 88.2 % emission in industrial production, and this continues to increase nationwide. Emissions induced by vanadium mining show remarkable spatial heterogeneity, with 66.1 % of output in southwestern China. Inventory uncertainties are driven by insufficiently resolved activity data, poorly characterized emission factors, and variability in vanadium content in raw materials, particularly in coal combustion, transportation, and waste disposal sectors. These findings underscore the atmosphere as the main vanadium receptor and identify the primary contributors, which is helpful to develop targeted mitigation strategies.
- Article
(5038 KB) - Full-text XML
-
Supplement
(1081 KB) - BibTeX
- EndNote


Vanadium is a transit metal ubiquitously found in the natural environment, including soil, water, atmosphere, and the fauna system. The global reserve of vanadium exceeds 63×106 t (U.S. Geological Survey, 2023). China, Russia, South Africa, and Brazil were the top four countries with the most abundant vanadium resources (Schlesinger et al., 2017), among which China harbors the most vanadium, totaling 9.5×10⁶ t (Fu et al., 2023). Vanadium exists in four main types of mineral sources in the earth's crust, including vanadium titanomagnetite, stone coal, petroleum-associated minerals, and uvanite (Zhang et al., 2023). As the largest vanadium producer, Sichuan and Hebei in China account for the vast majority of vanadium output, with principal vanadium forms in vanadium–titanium deposits (Yu et al., 2015), and in Shaanxi, Gansu, Hubei, and Hunan Province, it is mainly in vanadium-containing stone coal (Yuan et al., 2022). Vanadium plays indispensable catalytical roles in modern industrial development, particularly in the manufacture of steel, ceramic, glass, and pigment products, as well as vanadium redox-flow batteries (Watt et al., 2018; Wang et al., 2023). The rising demand for vanadium production has led to intensive anthropogenic emission, which makes vanadium a re-emerging environmental problem and draws increasingly more attention from research entities (Watt et al., 2018).
Vanadium exposure can lead to potential adverse effects (Huang et al., 2015; Fei et al., 2023; He et al., 2023), which calls for stricter environmental regulation on vanadium levels in various environmental media. The mobilization of environmental vanadium can occur through natural pathways, i.e., weathering of vanadium-bearing rocks (Hope, 2008; Shiller and Mao, 2000) and volcanic activity (Bortnikova et al., 2009), as well as wide ranges of anthropogenic activity, which has surpassed the vanadium output induced by natural processes (Schlesinger et al., 2017). The inefficient vanadium utilization (i.e., 70 %) during industrial processes results in discharging vanadium into the natural environmental media (Wang et al., 2020a; Zhang et al., 2020; Wright et al., 2014). For example, in the city of Panzhihua=, China, soil contains up to 4793 mg kg−1 of vanadium adjacent to the smelter plant (Zhang et al., 2019a), while vanadium levels in local aerosol samples are as high as 228 ng m−3 (Wang et al., 2020a). Among all emission pathways, the cumulative atmospheric emission of vanadium made the largest contribution to environmental pollution, which has increased by 86 % over the past few decades in China (Bai et al., 2021). In addition, the sum of the atmospheric emission factors of vanadium-bearing ore during the mining, smelting, and manufacturing processes is 43 kg t−1 (Anderson, 1973), significantly higher than that for coal burning (0.001 kg t−1), petroleum consumption (0.06 kg t−1), and steelmaking (0.0001 kg t−1) (Anderson, 1973). However, the quantitative evaluation of vanadium flux derived from various anthropogenic sources to environmental receptors remain lacking, especially at the continental scale. Moreover, although China has promulgated the Air Pollution Prevention and Control Action Plan (Clean Air Act) since 2014 to reduce industrial emissions (Zheng et al., 2018), its specific impact on vanadium emission trends has yet to be thoroughly explored (Zheng et al., 2018).
Emission inventories are essential tools to elucidate the magnitude and spatial and temporal patterns of pollutant emission from different various sectors, serving as a foundation for policies aimed at reducing environmental impact. The development of vanadium emission inventories is performed at global scales for anthropogenic sources (Pacyna and Pacyna, 2001). However, these inventories hardly capture the variation in vanadium emissions across different sectors, influenced by ever-changing market demand and improvements in pollution control technologies, resulting in low-resolution inventories. To address the inadequacy in control and supervision of vanadium discharge, it is vital to establish a national emission inventory system, which comprehensively tracks the vanadium emission pattern at a spatiotemporal scale, providing insightful information for governing bodies to formulate sector- and regional-specific solutions for mitigating the impact of vanadium emission. However, no effort has been made in this regard.
The goal of this study is to establish the bottom-up inventories of vanadium emission from anthropogenic activity in China for the period of 2015–2019, following the introduction of the “Clean Air Act”. The study encompasses three primary tasks: (1) performing modeling studies to quantify the contribution of anthropogenic sources to environmental receptors, (2) evaluating the temporal and spatial pattern of anthropogenic vanadium release from different sectors across years and regions (provinces), and (3) conducting uncertainty analysis to assess the reliability of the inventory model. This comprehensive approach aims to provide a detailed understanding of vanadium emissions, supporting efforts to mitigate their environmental impacts.
2.1 Anthropogenic sources of vanadium emission
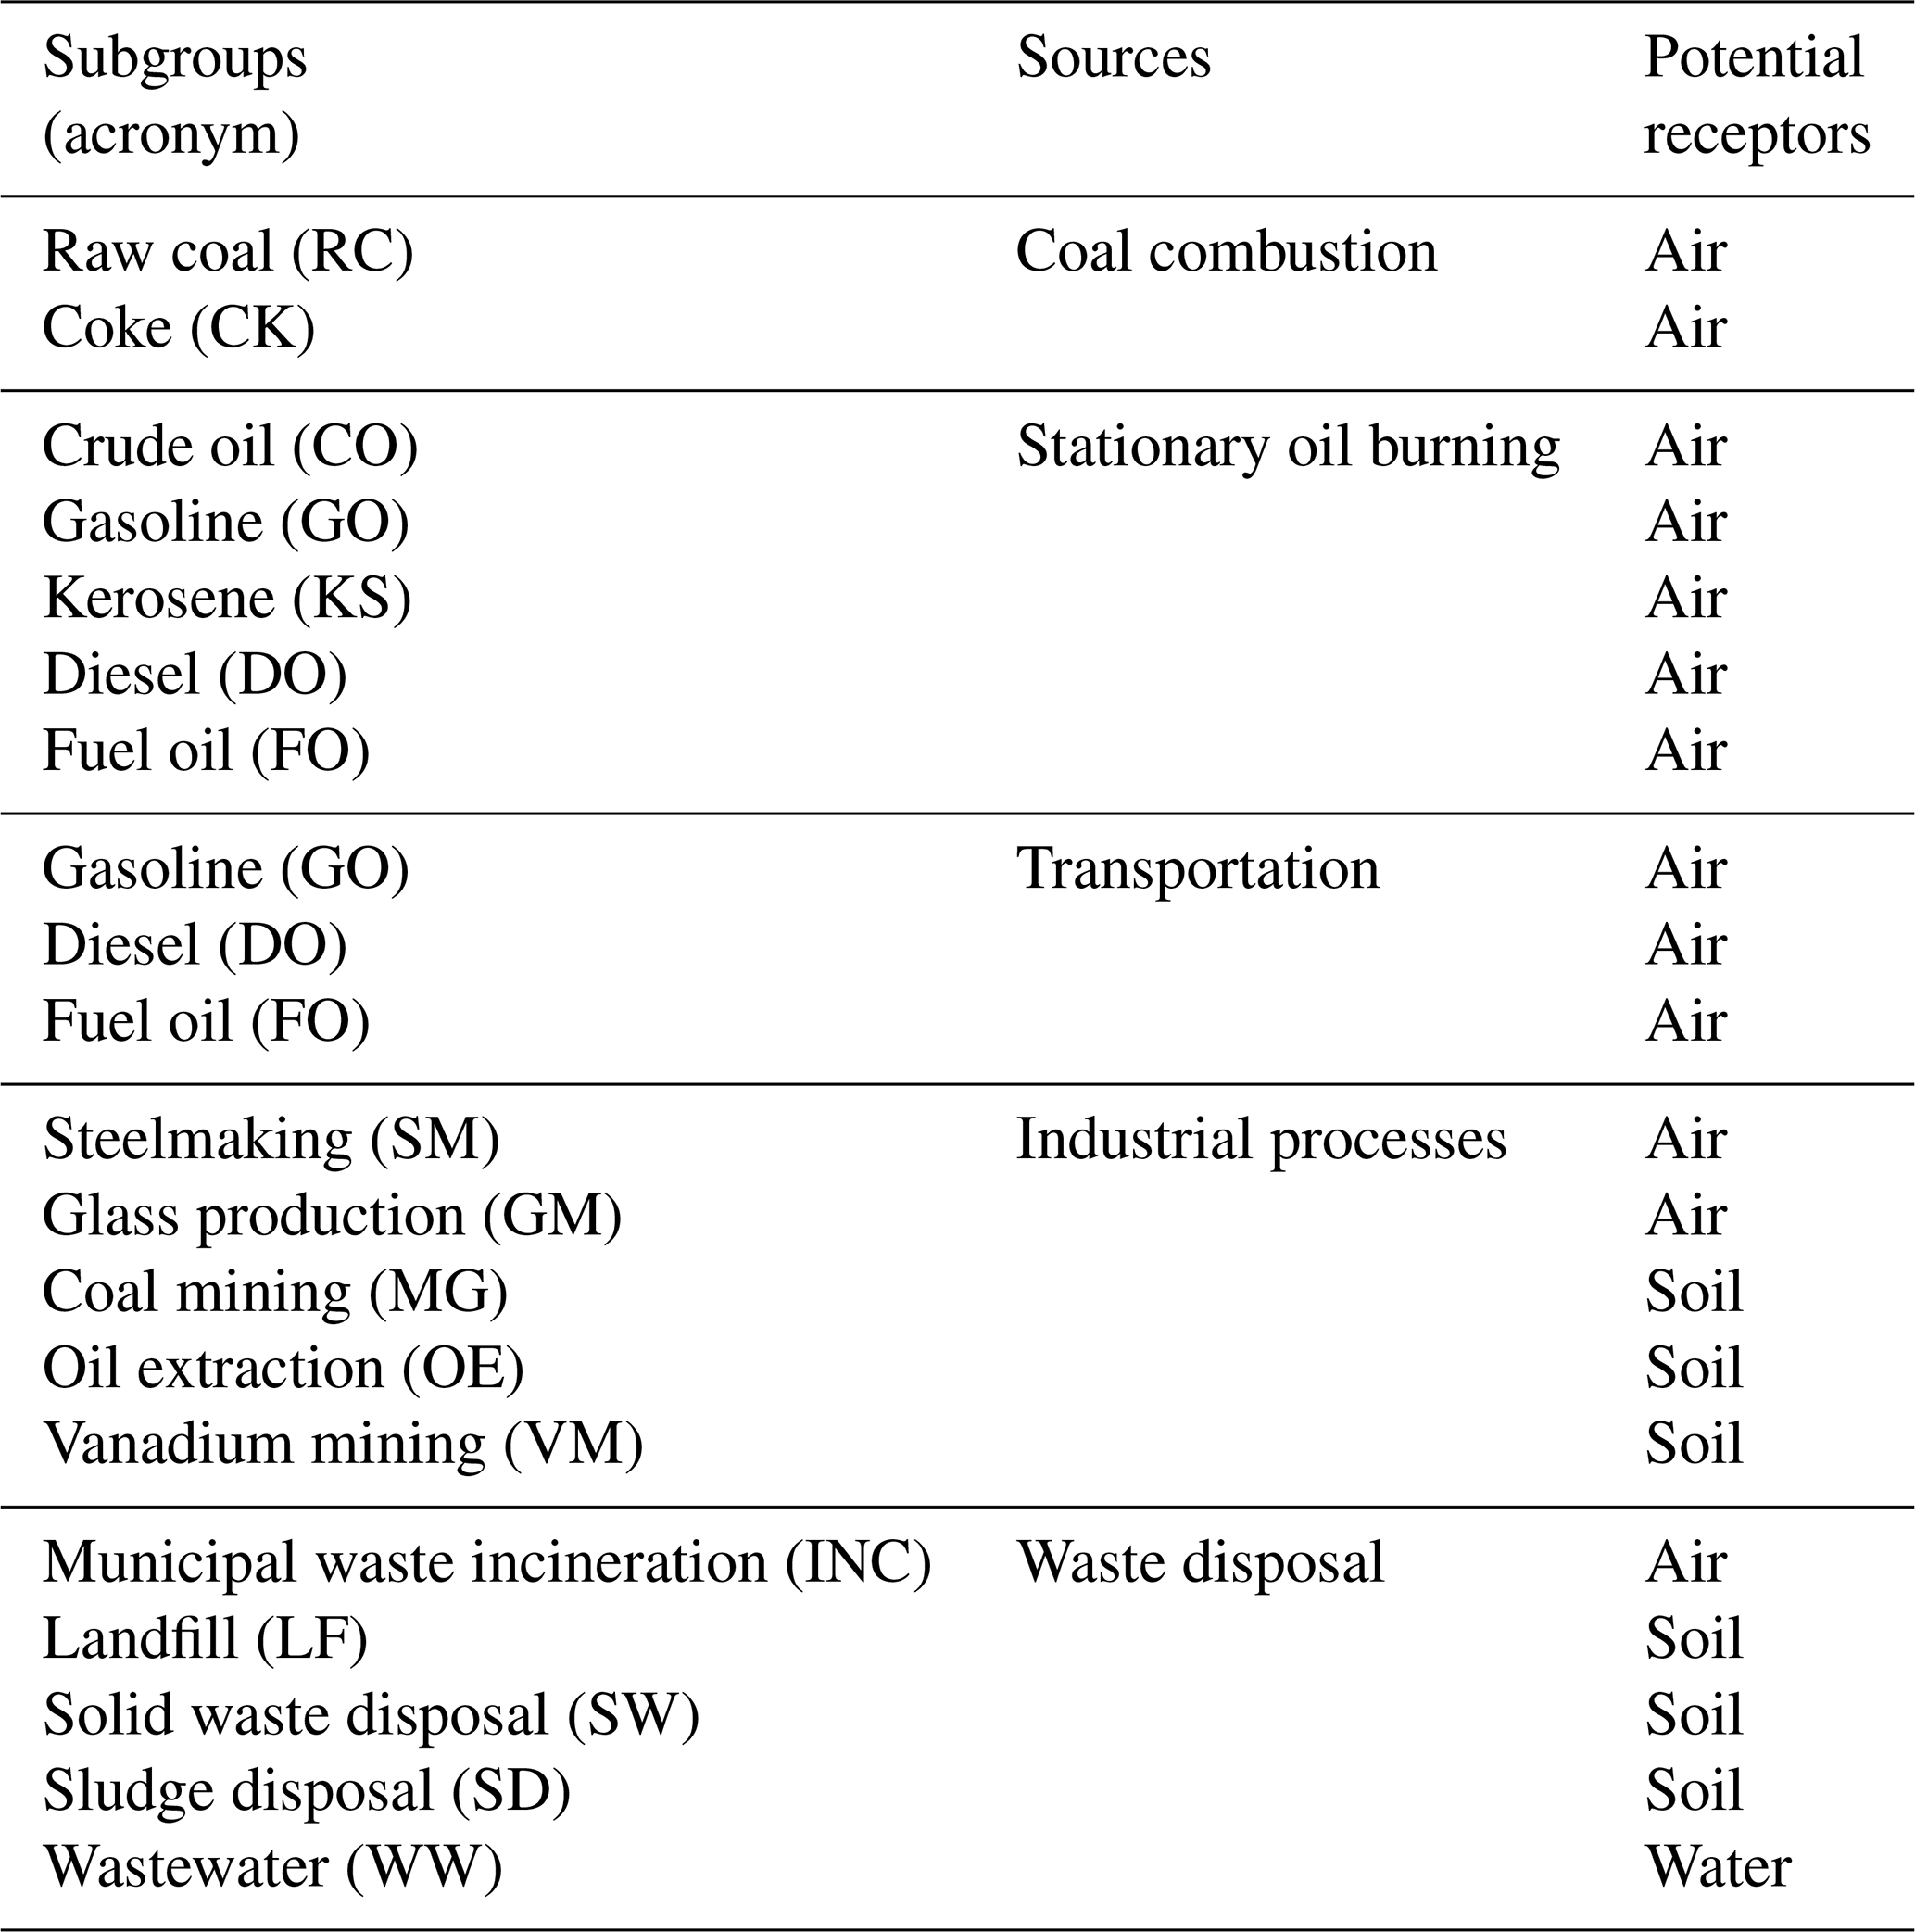
The environmental impact was assessed utilizing the life cycle assessment (LCA) that accounted for five major anthropogenic sources leading to vanadium emission (Table 1), which was consistent with previous studies (Bai et al., 2021), including (1) coal combustion, (2) stationary oil burning, (3) transportation, (4) industrial processes, and (5) waste disposal. The subgroups of each category are also displayed in full in Table 1 along with their presumed environmental receptors. Emission sources were assumed to release vanadium into the respective receptors through a single route (i.e., airborne, solid waste, wastewater) (Hope, 2008). The presumed vanadium emission routes of each anthropogenic process are illustrated in detail in the Supplement. For each emission source, activity data at provincial level were retrieved from yearbooks of China's industrial activity, including coal (SS-A), energy (SS-B), industrial and resource production (SS-C), transportation (SS-D), and waste disposal (SS-E). Additional statistics on socioeconomic information, government policies, and global warming potentials were also collected from published data of National Statistics Bureau (SS-F, SS-G, SS-H). All of these spreadsheet files, labeled SS-A to SS-H, can be accessed in the Zenodo repository (Zhang, 2024). For transportation-derived emission, the yearly volume of national oil consumption was applied due to a lack of provincial data. All dynamic emission factors were retrieved from previous reported values and assumed consistent across all provinces. All activity datasets were collected during the period of 2015–2019, which may reflect the effects of air pollution mitigation practices implemented since the introduction of the Clean Air Act.
Table 1Anthropogenic sources of vanadium emission and potential receptors.
2.2 Computational method for establishing the emission inventory
A decision tree was constructed to provide guidelines for selecting the appropriate computational method during inventory development (Fig. S1 in the Supplement). In general, the on-site measurements of emission parameters during anthropogenic processes were obtained to estimate the vanadium emission pertinent to consumption by industrial application, mainly integrating the emission factors of each procedure and activity levels (Gu et al., 2023). For datasets reflecting the industrial production, the following formula was used:
where EV is the vanadium emission in metric tons, EFj is the emission factor in kilograms of vanadium emitted per ton of product, and APj is the total production amount of industrial products (or waste) in metric tons.
Datasets obtained from regional or provincial statistic reflected the geographic variation in vanadium emission, for which the following computation was applied.
where EV is the vanadium emission in metric tons, EFi is the regional (provincial) emission factor in kilograms of vanadium emitted per metric ton of products, and EPi typifies the total production volume in a specific geographic region.
Default values obtained from other studies in the literature were used due to insufficiency in data collection and data quality, which were employed as a last resort. Therefore,
EP is the default value for vanadium emission factor in vanadium emitted per metric ton, and AP is the national output in metric tons.
The inventory was built based on five major categories of anthropogenic process, which comprised 21 sub-sources in total, across China's 31 provinces. The detailed algorithm of the bottom-up emission inventories is provided in full detail in the Supplement, with activity level data and dynamic emission factors uploaded in a data repository (Zhang, 2024).
2.3 Uncertainty analysis
The uncertainties in algorithm of emission inventory affected both data input and output of the emission model. The model was formulated based on previous experience, with errors, which failed to reflect realistic conditions. Moreover, the input parameters experienced constant changes by random chance. In this study, input data for quantification of the anthropogenic activity and emission factors were summarized from available literature sources. The uncertainty levels of these variables were evaluated using the bootstrapping simulation (Tian et al., 2011). The types of probability distribution of variables were determined (i.e., normal distribution, triangle distribution, beta distribution, gamma distribution etc.), followed by random sampling of the variables to obtain bootstrapped samples, for which the confidence intervals were calculated to delineate the uncertainties level of the datasets. The detailed calculation procedure is provided in the Supplement. Furthermore, the uncertainty in the inventory output for vanadium emission was quantified by Monte Carlo simulation with 10 000 iterations. For a sensitivity study, the linear relationship between input parameters and emission levels was evaluated using the Pearson rank correlation coefficient, ranging from −1 to 1. Any input parameter with absolute coefficient values closer to 1 indicates strong correlation, which may suggest the source of uncertainty (Liu et al., 2021). All analysis computations were performed in AuvToolPro2.0 following the protocol (Zheng et al., 2018).
3.1 Modeling the anthropogenic vanadium emission fate
The conceptual model for vanadium flux flow illustrated the relationship between anthropogenic emission sources and the cumulative vanadium in environmental receptors (Fig. 1). During 2015–2019, anthropogenic processes emitted a total volume of 214 820.1 t of vanadium into the environment, with a yearly average of 42 964 t. Based on a global inventory developed during 2015–2016, 730 000 t of vanadium was released into the environment due to anthropogenic activity (Schlesinger et al., 2017). As a major energy consumer and industrial advanced nation, China's yearly emission is estimated to comprise 6 % of global emission output based on comparison with the global result. Among different receptors, 98.3 % vanadium generated from anthropogenic processes was directly discharged into the atmosphere, leading to a total emitted vanadium volume of 211 095 t. Most atmospheric vanadium was derived from coal combustion, stationary oil burning, and transportation, corresponding to a relative contribution of 46.7 %, 40.1 %, and 8.2 %, respectively. Globally, 82.2 % of vanadium was directly released into the atmosphere during 2015–2016 (Schlesinger et al., 2017), with 54.6 % and 24.6 % of emission from the combustion of oil products and coal, respectively. 3725 t of vanadium (1.7 %) was directly deposited into Chinese soil, which was predominantly attributed to industrial solid waste discharge and sludge disposal, totaling 1398 and 1425 t, respectively. In comparison, the global inventory assumed all mining and industrial production to be the major source of emissions to the soil (Schlesinger et al., 2017), with a relative contribution of 18.5 %. Wastewater treatment was the sole and direct source of vanadium discharge into the water environment, and it only contributed 0.1 t of vanadium during 2015–2019. Both the Chinese and the global inventory highlighted the dominance of atmospheric flux. However, while coal combustion was the predominant source of atmospheric emission in China, combustion of oil products weighed more importantly for the global inventory. There was also a marked difference in estimated emission flux to soil, with a greater soil flux due to global industrial and mining activity. In contrast, the presented inventory showed a much smaller proportion of vanadium flux to soil receptor because it was assumed that the majority of emission, from large contributors such as steelmaking and glass production, was released into the atmosphere. The development of global inventory mainly employed the available data of industrial activity in the United States, which lacked sufficient data resolution for developing nations. However, coal combustion played more important roles in China's energy sector than petroleum. The contrast could also be attributed to variation in the vanadium-releasing fraction, emission-reducing technology, and vanadium content in raw materials in different regions, as well as assumptions made during inventory development. To improve the inventory, it is essential to perform local-level investigation to increase the spatial and temporal specificity.
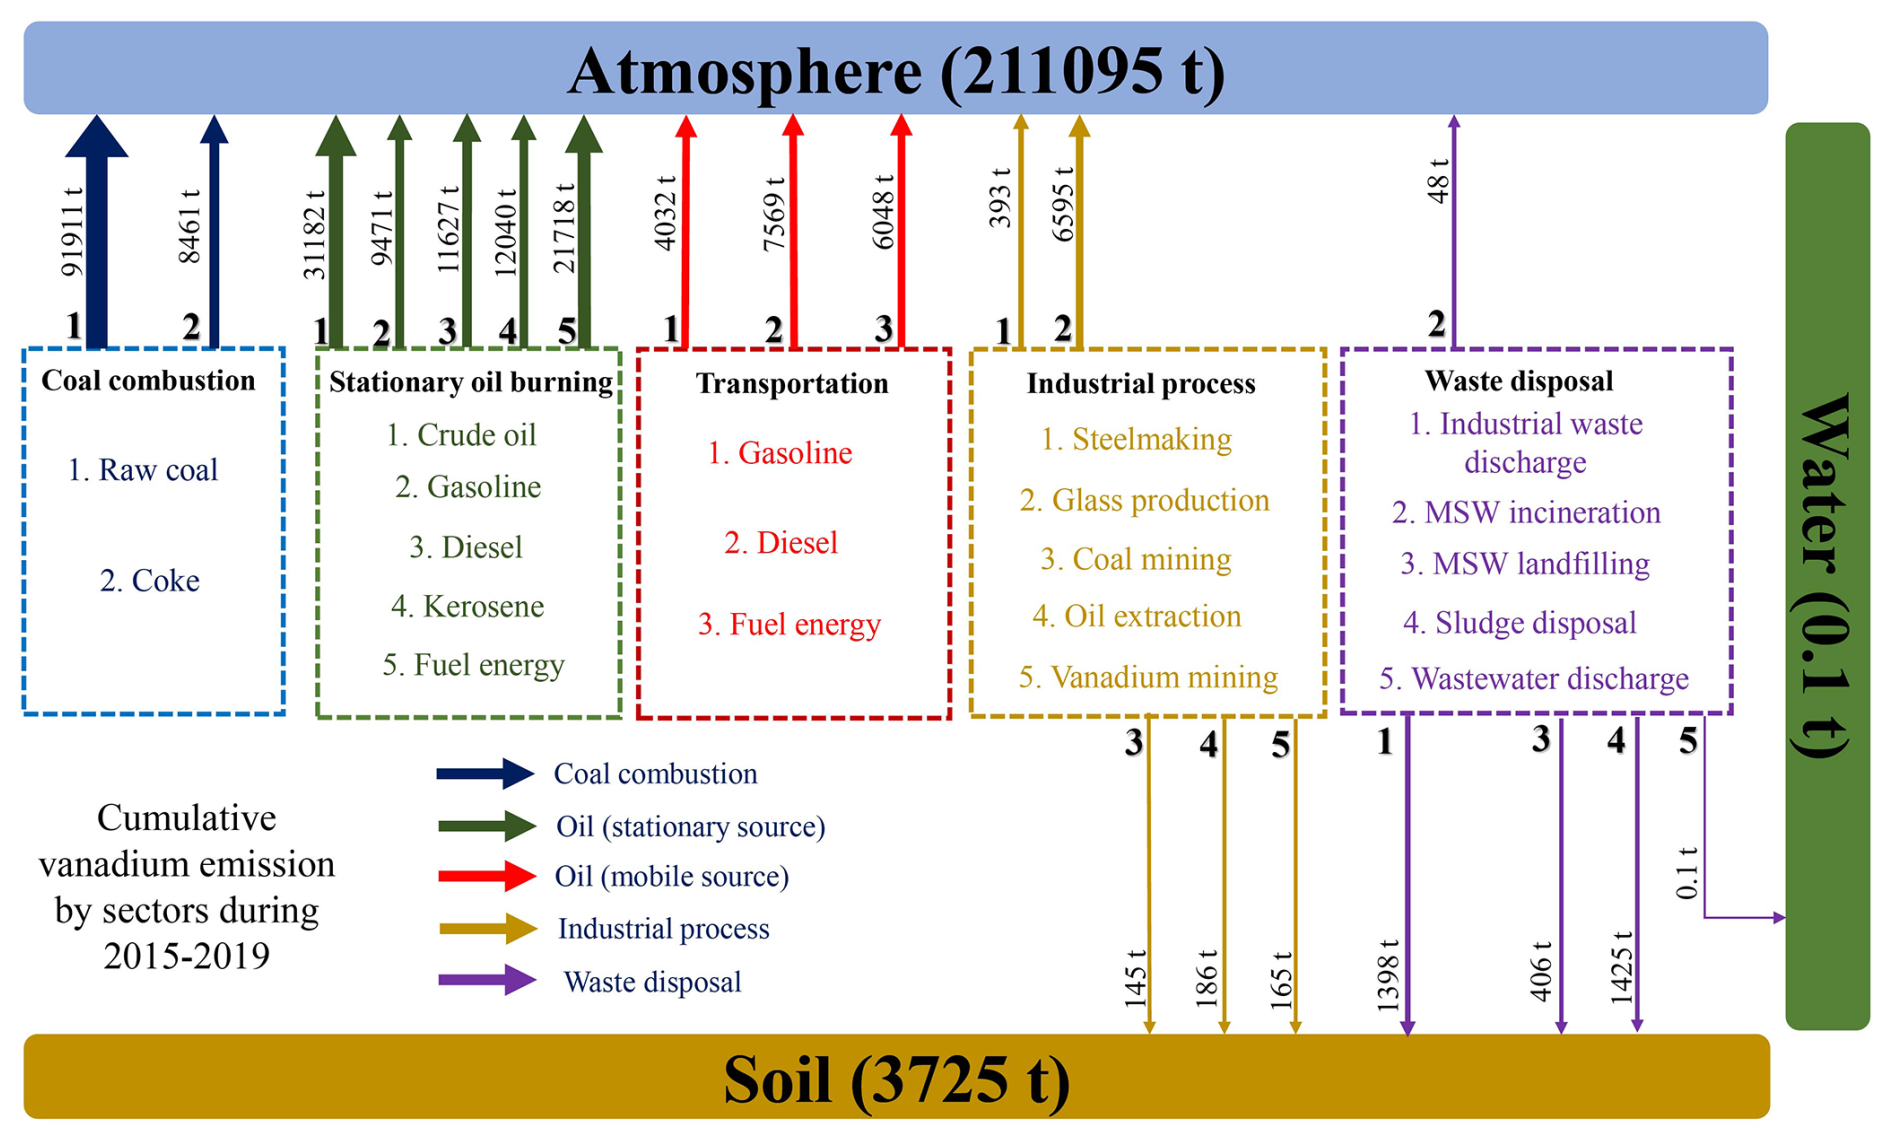
Figure 1Environmental flux model for vanadium directly discharged from anthropogenic activity into environmental receptors. Vanadium flux data were calculated cumulatively during 2015–2019 from different anthropogenic sectors with vanadium emission, i.e., coal combustion, stationary source oil burning, transportation source, industrial processes, and waste disposal, all of which are labeled by numbers. Lines with arrow heads indicate the vanadium flux from different sources to respective receptors, with the line thickness proportional to the magnitude of vanadium flux.
3.2 Temporal variation pattern of vanadium emission
The temporal trend of vanadium emission by contribution percentage of major anthropogenic sources during 2015–2019 is illustrated in Fig. 2. The total vanadium emission increased slightly from 41 389 t in 2015 to 44 069 t in 2019 (Fig. 2a). Emission originated from raw coal combustion accounted for 91.6 % of the subgroup inventory pertinent to coal consumption (Fig. S2), which exhibited a steady increasing trend from 18 096 to 18 856 t during 2015–2019 (Fig. 2b), corresponding to a 2 % decrease in relative contribution to the total emission inventory. Globally, the annual vanadium emission from coal combustion in 2016 was estimated to be only one-fourth of the output in the previous decades (Schlesinger et al., 2017). This reduction was largely due to the emission reduction measures implemented in developed nations, such as in the United States and western Europe, since the 1980s (Maclntosh and Spengler, 2011; Arienzo et al., 2021). Unlike the developed nations, China remained heavily reliant on coal, accounting for 51 % of world annual coal consumption (Wang et al., 2020d). This dependency was further compounded by the continued expansion of installed power generation capacity (Wang et al., 2020e). Additionally, the average vanadium concentrations in China's raw coal were higher than the global average levels (Bartoňová et al., 2023), resulting in a disproportionately large contribution to global vanadium output, and this led to more challenges associated with domestic emission. Vanadium emission pertinent to coke consumption made up 8.4 % of total coal induced emission, and it showed a decreasing trend from 1789.9 to 1743.6 t, corresponding to a decrease in relative contribution by 8.5 %. This downward trend corroborated China's increasing efforts to enhance the energy efficiency of energy sectors, sintering and steelmaking processes under the Clean Air Act (Zheng et al., 2018; Xing et al., 2020).
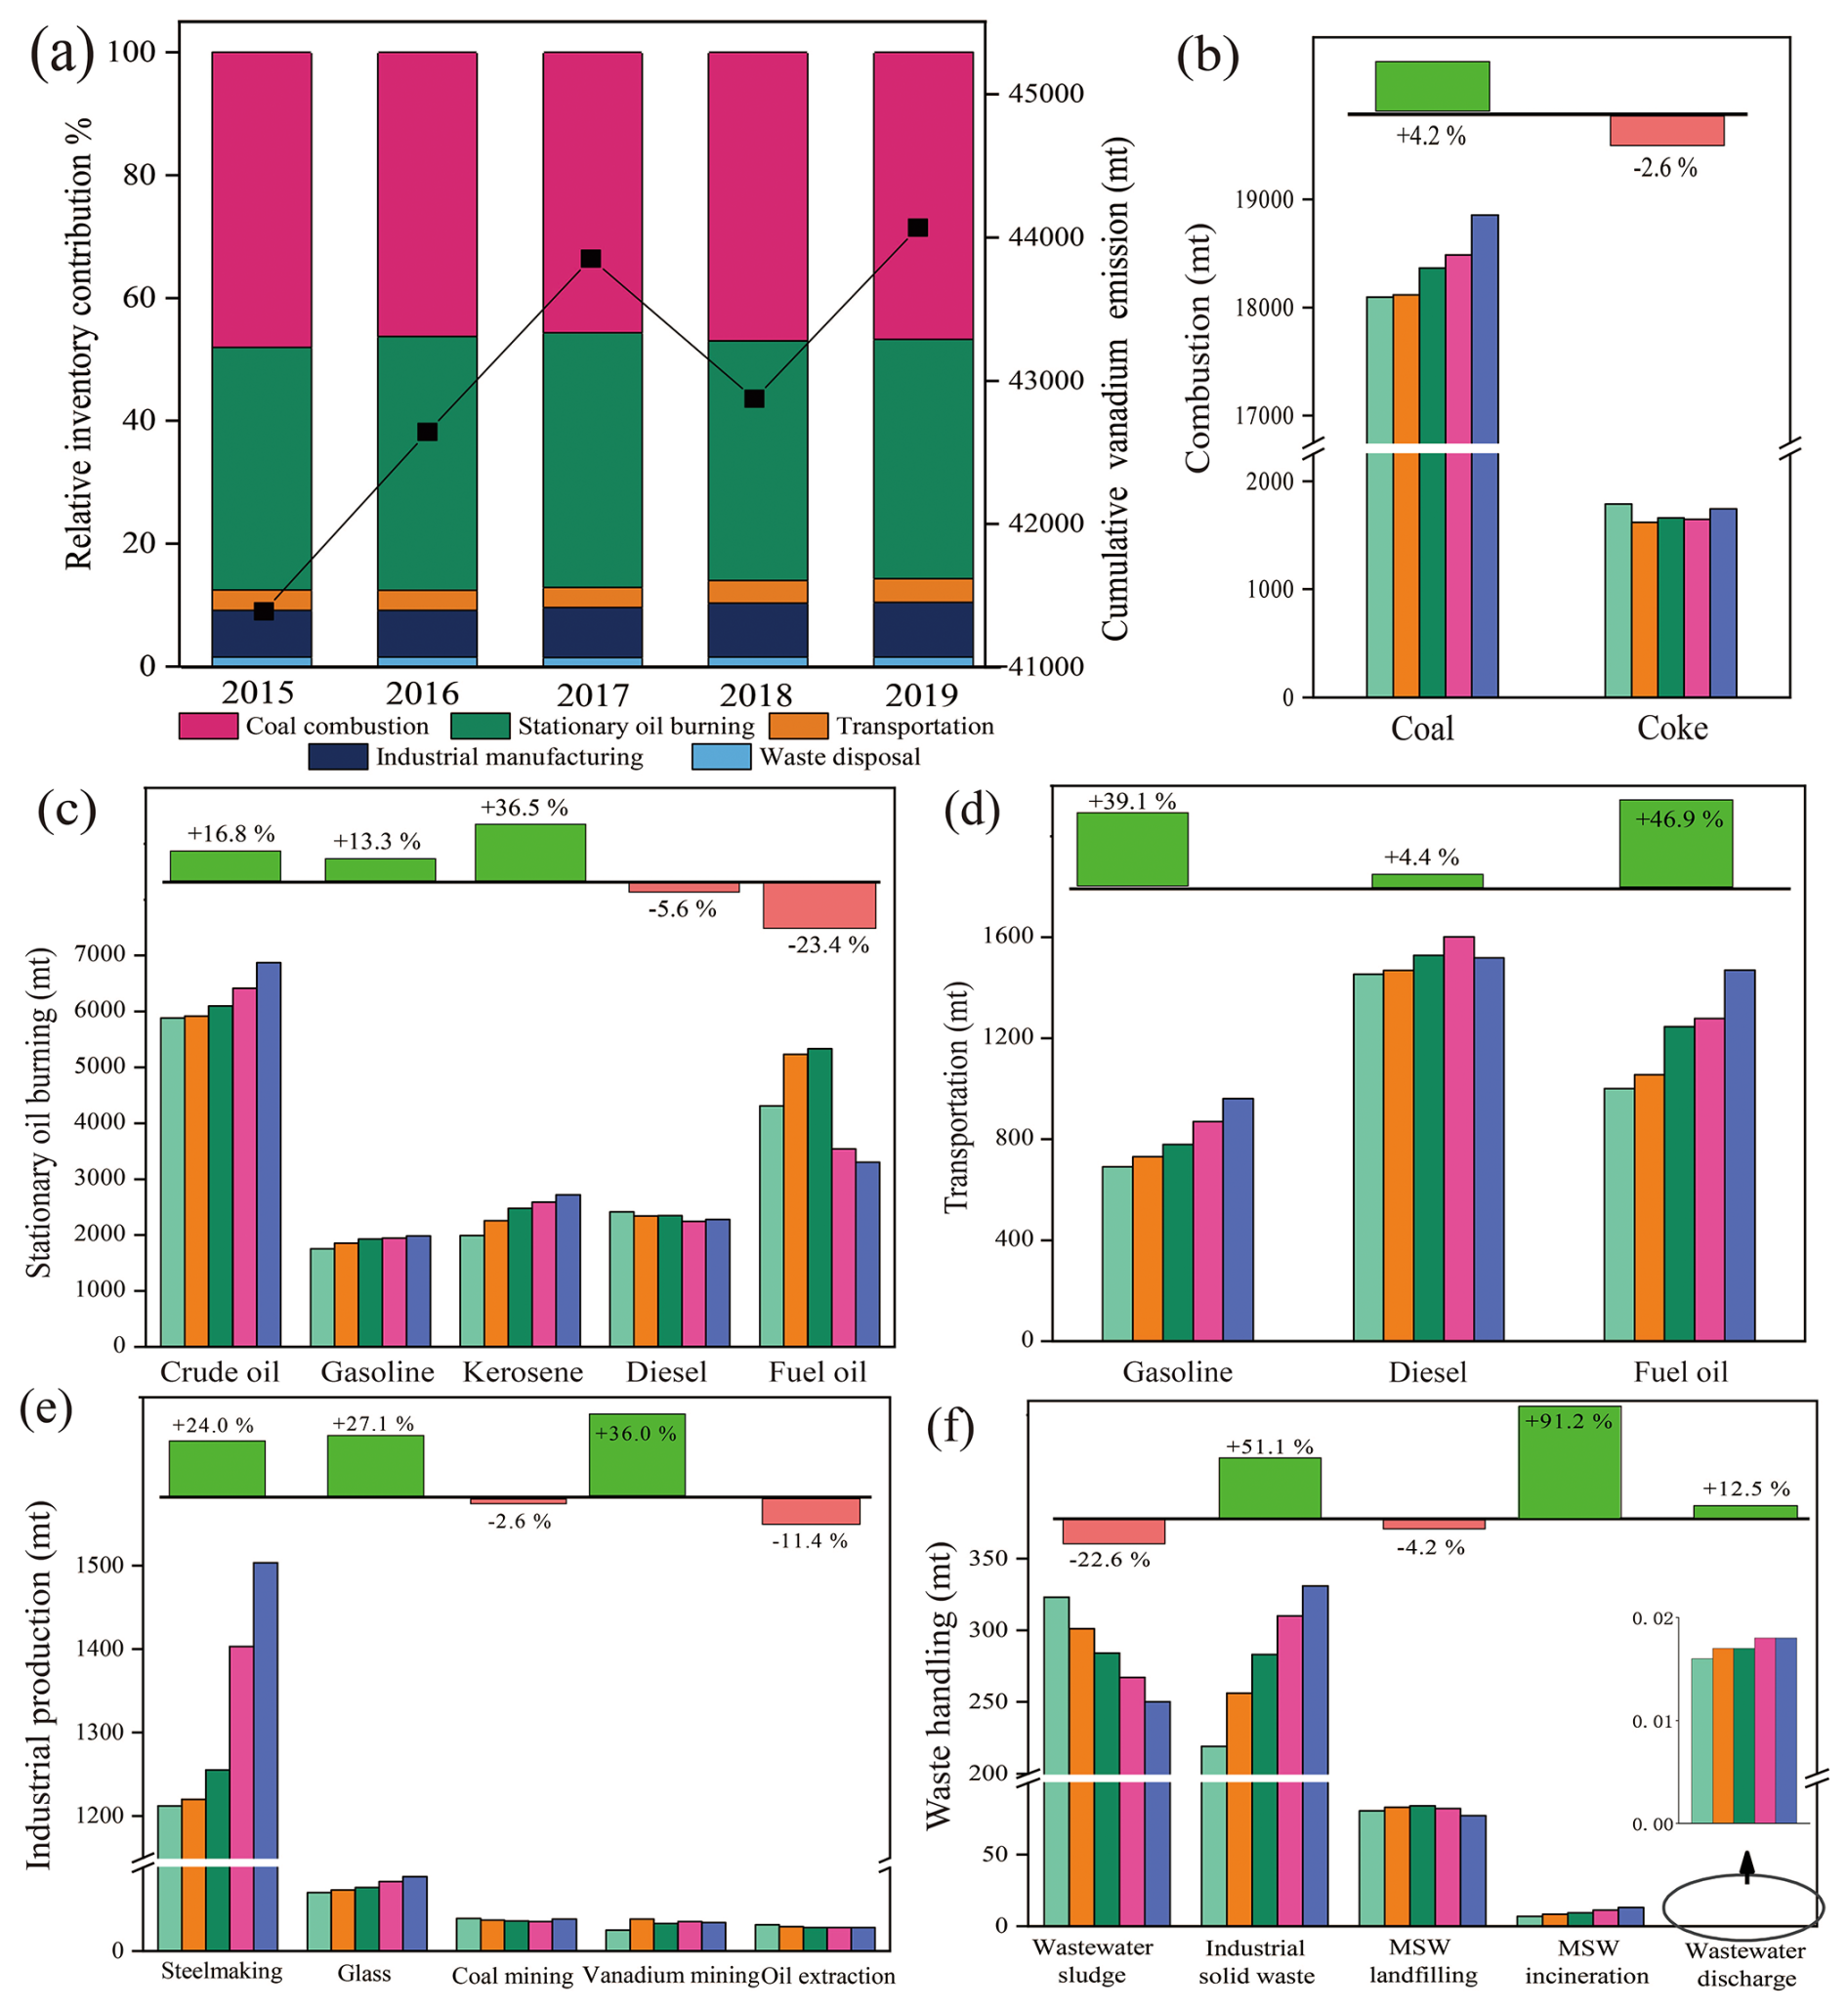
Figure 2Historical trend of vanadium emission inventory during 2015–2019. (a) The relative contribution of yearly cumulative vanadium emitted from each major anthropogenic source was calculated, along with total emission amount; the yearly vanadium emission from subgroups of (b) raw coal combustion, (c) stationary oil burning, (d) transportation, (e) industrial production, and (f) waste handling.
Vanadium emission pertinent to the stationary source of oil burning was predominantly contributed by crude oil consumption (36.2 %) (Fig. S2). The pronounced increase in vanadium emission was observed in the consumption of crude oil, gasoline, and kerosene, from 5882.7, 1754.3, and 1993.9 t, to 6782.1, 1987.1, and 2720.2 t, respectively (Fig. 2c), which led to an increase in relative contribution to the total inventory by 9.7 %, 6.4 %, and 28 %, respectively. Compared with inventory derived from global oil consumption, the annual vanadium output in China accounted for a smaller proportion (∼ 6.1 %) of global vanadium emission in 2016 (Schlesinger et al., 2017), which has also increased 2.5-fold since 2000 (Monakhov et al., 2004). The rapid economic growth during this period drove up oil-refining activity (Zhang et al., 2019b). However, the vanadium emission pertinent to fuel oil combustion decreased significantly, which was possibly because of successful implementation of emission trading scheme focused on energy-intensive heavy industries (Ouyang et al., 2020). The reduction in fuel-oil-derived emission also aligned with the overall decline in global demand (International Energy Agency, 2016), likely attributed to the substitution of residual oil with the use of natural gas in refinery activity (Visschedijk et al., 2013). This trend suggested that regulations in various countries prioritized limiting emissions from vanadium-rich heavy oil.
As for the transportation sector, consumption of gasoline (42.9 %), diesel (34.3 %), and fuel oil (22.8 %) contributed considerably to vanadium emission (Fig. S2), all of which experienced emission growth from 691.1 to 961.3 t, 1453.7 to 1602.4 t, and 1000.5 to 1469.5 t, respectively (Fig. 2d), along with change in relative contribution to the inventory by 30.6 %, −2.0 %, and 37.9 %. The Yearbook of Transportation and Automobile Industry 2015–2019 recorded the significant growth in total volumes of on- and off-road transportation (National Bureau of Statistics of China, 2020), which may be the leading cause of the major rise in vanadium emission associated with gasoline consumption. For heavy-duty vehicles, sulfur emission remained nearly unchanged despite increased logistic activity (Zheng et al., 2018). The trend can be attributed to the strict regulation of vehicle diesel standard (GB-19146) introduced after 2013, which in turn reduced the demand for vanadium-based catalyzers (Bai et al., 2021). In maritime transportation, fuel oil was primarily utilized by shipping vessels. Although global vanadium emissions from maritime transportation decreased due to sulfur restrictions (IMO MARPOL Annex VI) imposed by International Maritime Organization in the early 21st century (Arienzo et al., 2021), China's inventory showed a progressive increase in vanadium output. This suggested that the expanded shipping activity has offset the effects of stricter sulfur emission controls.
In other sectors, industrial processes and waste disposal also contributed a minor proportion of the vanadium emission inventory, accounting for 3.28 % and 1.52 %, respectively (Fig. S2). Among industrial production activity, steelmaking process was the primary emitter (88.2 %) (Fig. S2), showing a significantly increasing trend from 1212 to 1593 t during 2015–2019 (Fig. 2e), with a 16.5 % rise in relative contribution. In recent decades, China undertook strong action to reduce the overcapacity in steel industry, resulting in a slow production growth (Zhu et al., 2022). The implementation of ultralow-emission transformation (ULET) markedly reduced emission of PM2.5 and other pollutants (Tang et al., 2020). However, vanadium emission continued to rise, making up 85 % consumption in industrial production sector (ResearchInChina, 2018). The new standard for high-strength rebars required more vanadium for the alloying process (Polyak, 2024). In contrast, emission from mining and oil exploration in China did not show significant growth, consisting with the global trend (Schlesinger et al., 2017). The relative contributions to the Chinese emission inventory from coal mining (2.5 %) and oil extraction (2.2 %) were significantly lower than the global inventory, where oil exploration and mining activity accounted for 56 % and 18 % of emission output, respectively (Schlesinger et al., 2017). Such a contrast could be explained by higher level of data resolution in China's inventory, capturing a more detailed scope of mining and oil extraction activity, whereas the global inventory used more generalized data and assumptions to fill the data gap, leading to broader, less precise estimates. For vanadium ore mining, the overall vanadium production remained stable in major producing powers such as Russia and South Africa (Polyak, 2015, 2017, 2024). However, the newly adopted environmental policy placed a ban on the importation of vanadium slag into China (Polyak, 2024), which may stimulate the demand for domestic vanadium production. Among waste disposal sectors, the handling of wastewater sludge (43.5 %) and industrial solid waste (42.7 %) were the primary contributors (Fig. S2). Vanadium emission pertinent to wastewater sludge decreased significantly from 322.8 to 249.9 t during 2015–2019, with a remarkable drop in relative contribution by 27.3 %. The National Soil Act published in 2016 regulated sludge utilization, promoting wastewater sludge recycling for construction material and biofuel extraction instead of land application in order to avert the exacerbated soil pollution (Rohrbach and Zimmermman, 2023). Vanadium emissions pertinent to landfill and municipal solid waste (MSW) incineration were relatively stable during 2015–2019. The disposal of industrial solid waste increased vanadium output from 249.1 to 331.1 t (Fig. 2f), incurring a significant increase in relative contribution by 41.9 %. The recycling rate of steel slag in China was only 20 %–30 %, compared to a much higher utilization rate of 97 % in developed nations (Yang and Yang, 2024). Lastly, a negligible impact was incurred on the vanadium emission inventory as a result of direct municipal wastewater discharge. However, the intrinsic vanadium concentration in surface water was extremely low (< 10 ng L−1) (Schlesinger et al., 2017); any input from anthropogenic sources caused a noticeable change in water quality.
The large-scale installation of air pollution control devices (APCDs) has occurred since 2004 (Wang et al., 2020e). After the introduction of the Clean Air Act, the energy and industrial manufacturing sectors underwent a decreasing trend in pollutant emission (e.g., SO2, NOx) (Zheng et al., 2018), and transportation emission (e.g., NOx; CO; and non-methane volatile organic compounds, NMVOCs) remained relatively steady. Despite these achievements, the overall activity levels continued to rise, along with vanadium output. The implementation of ultra-low-emission (ULE) standards mandated the retrofitting of power plants with more efficient air pollutant control devices (APCDs), driving widespread technological upgrades. According to APCD statistics (SS-A-3), electrostatic precipitators have remained prevalent during study period due to the cost effectiveness. In comparison, a remarkable increase in application rates of baghouse filters and wet flue gas desulfurization was observed compared to previous report (Liu et al., 2019). Moreover, catalytic reduction systems for NOx removal were increasingly incorporated into newly commissioned facilities (Liu et al., 2019). However, the catalytic reduction process often involves a vanadium-based catalyst, potentially contributing to an increase in atmospheric emission. Despite the advance in APCDs' implementation, the growing activity level driven by elevated energy consumption and demand for vanadium in various sectors may offset these improvements, underscoring the complex interplay between technological progress and industrial expansion.
3.3 Provincial level of vanadium emissions and spatiotemporal distribution pattern
To facilitate further investigation of the variation patterns in anthropogenic contribution by various sources, we classified the 31 provinces into seven geographic regions as follows: eastern China (EC), central China (CC), northern China (NC), northeastern China (NEC), northwestern China (NWC), southern China (SC), and southwestern China (SWC). The vanadium emission inventories from different sources at provincial level over the period of 2015–2019 are presented in Tables S1–S18 in the Supplement and displayed in maps to reflect the cumulative (Fig. S3) and spatiotemporal distribution (Fig. 3). In general, a substantial amount of vanadium emission was found in northern, eastern coastal, southern, and southwestern provinces. Shandong, Liaoning, Hebei, Guangdong, and Hunan were among the largest provincial emitters, with cumulative vanadium discharge over 10 000 t (Fig. S3a), accounting for over 35.8 % of total national emission combined.
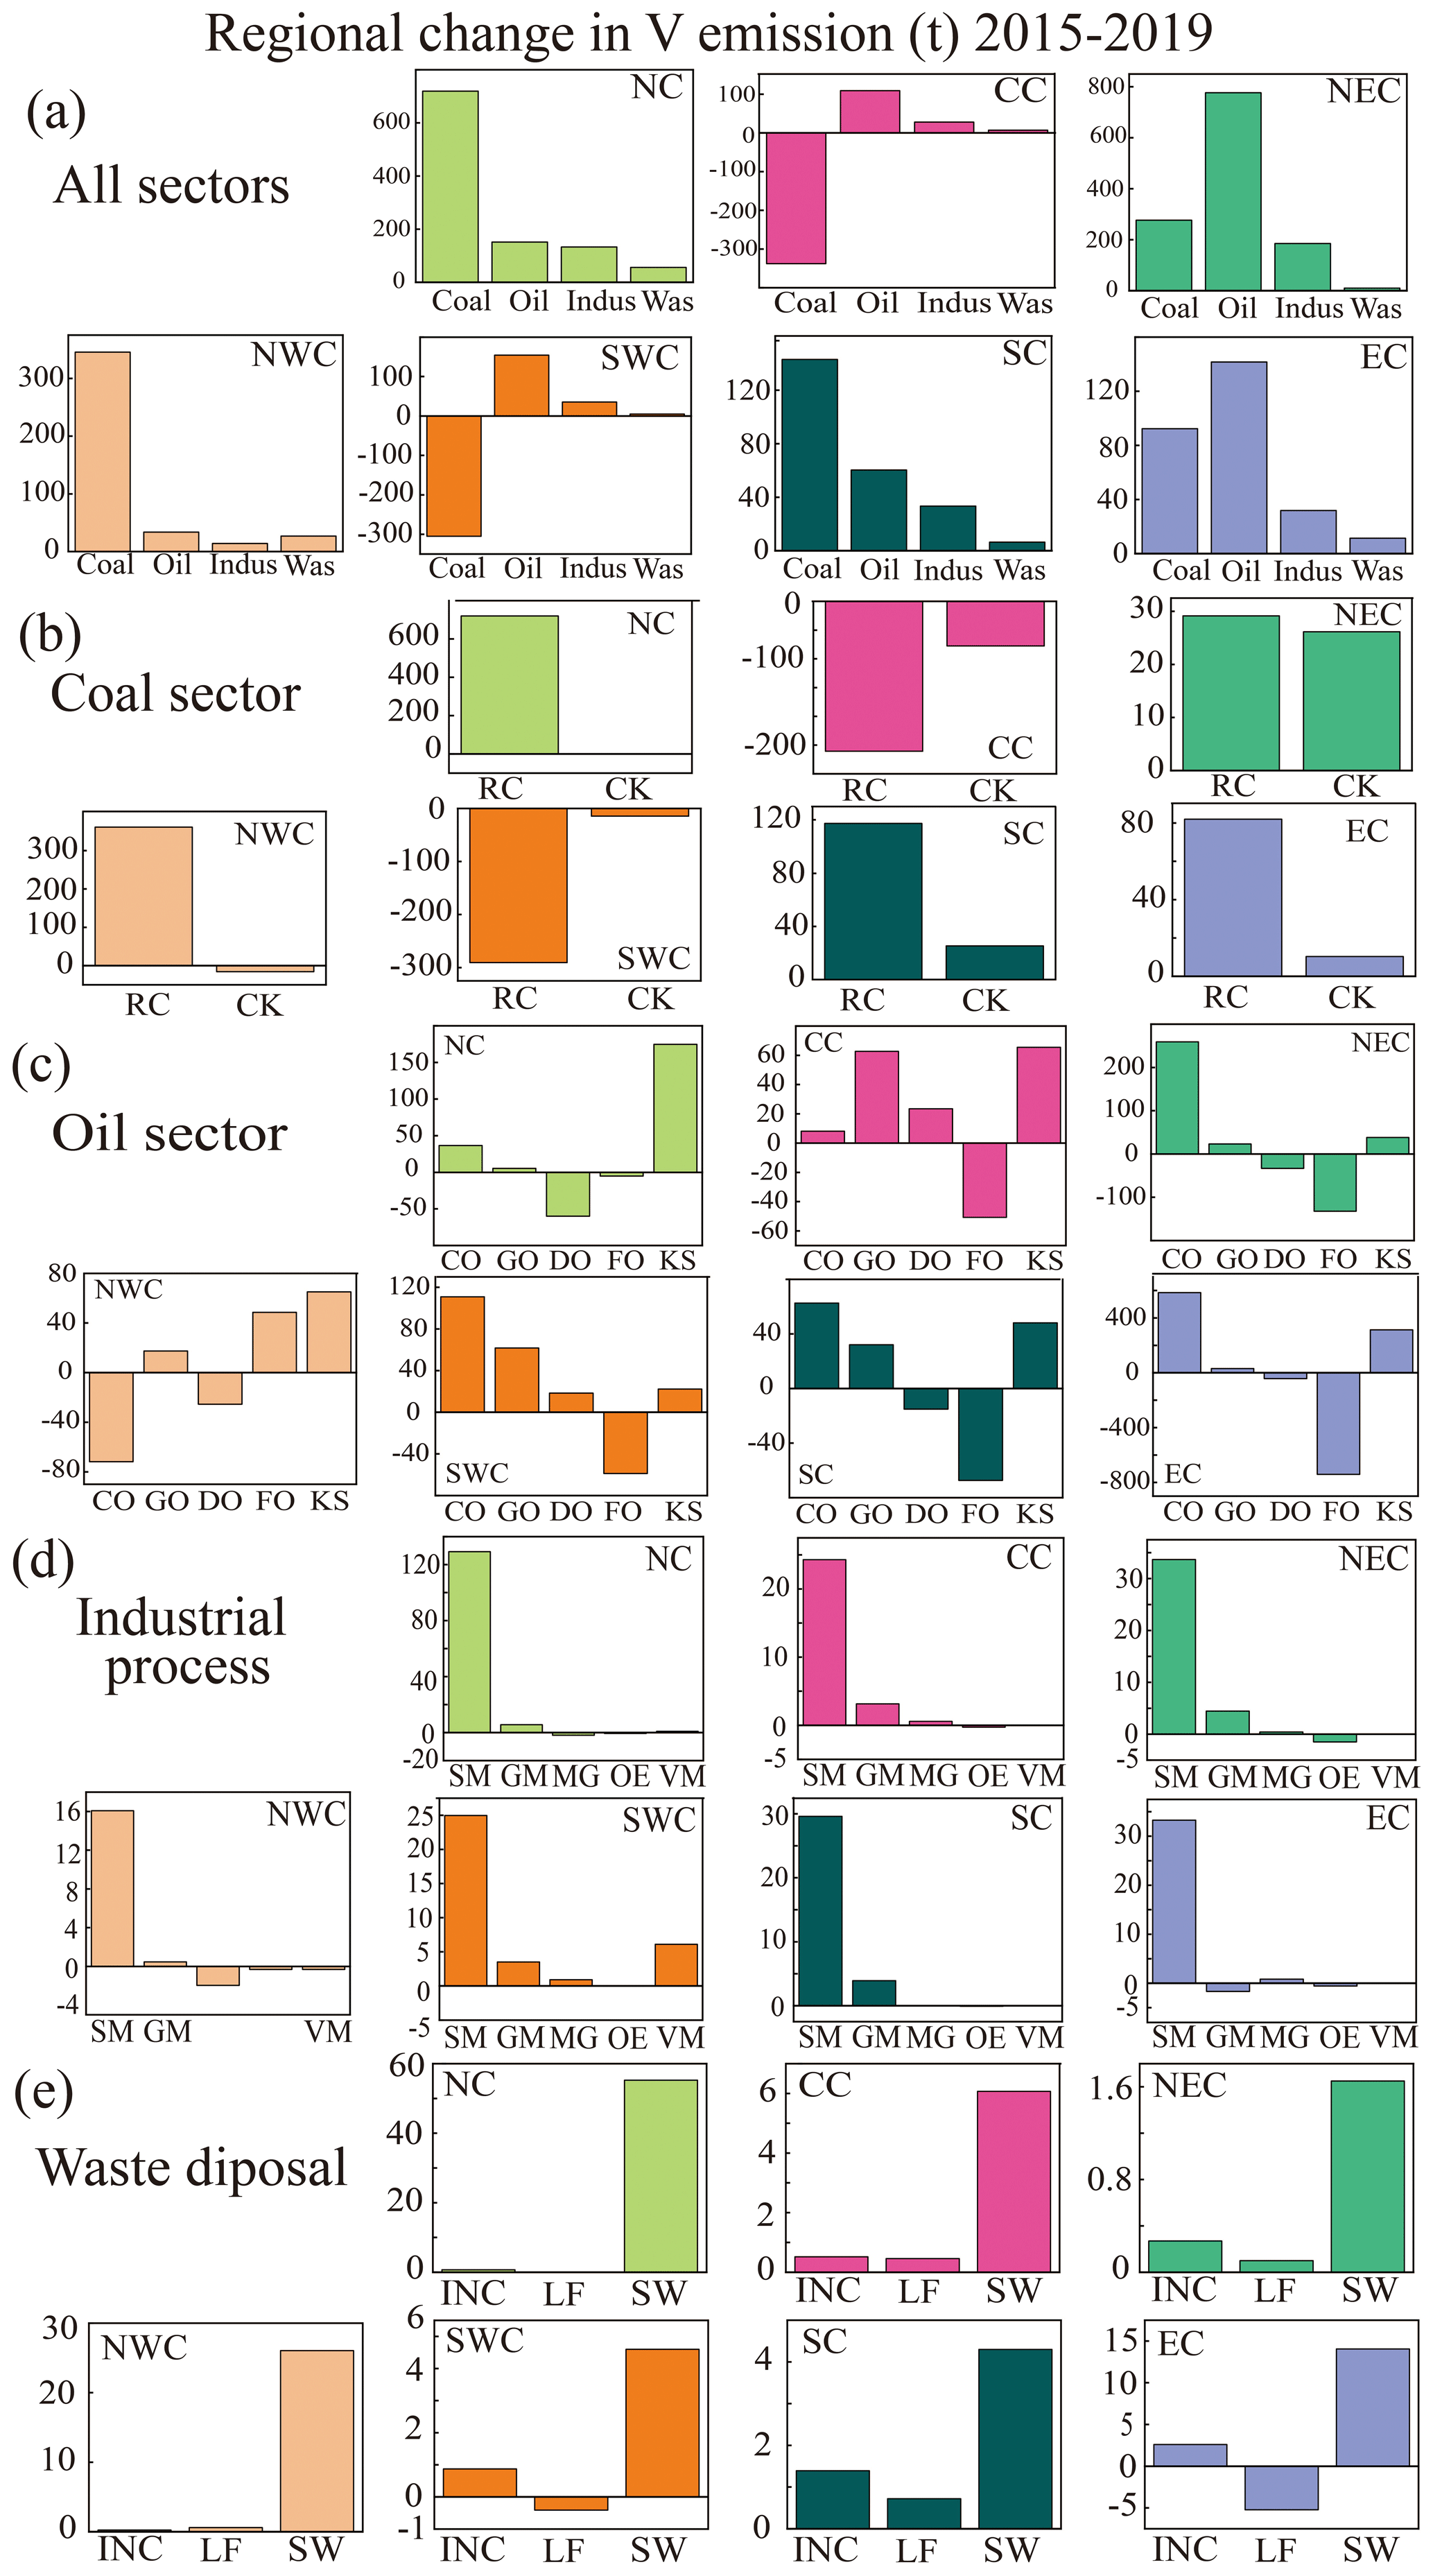
Figure 3Spatiotemporal variation of vanadium emission inventories at provincial and regional levels during 2015–2019. Temporal difference in emitted vanadium from (a) all sectors, (b) the coal sector, (c) the oil sector, (d) industrial processes, and (e) waste disposal for each province and region between 2015 and 2019. The colors of shaded area correspond to the vanadium emission level in different provinces. The inlet box displays the temporal variation in regional vanadium emission level during 2015–2019.
Henan and Hunan in CC, Shanxi and Inner Mongolia in NC, Shaanxi in NWC, Shandong in EC, and Yunnan and Guizhou in SWC were the major contributors to vanadium emissions (> 4500A t) from coal combustion (Fig. S3b). A major increase in raw-coal-induced emission was determined in NC (719 t) and NWC (361 t) (Fig. 3b). Coal was used as the main energy source to meet the needs of economic development throughout China, especially in NC and NWC, where coal resources are abundant and relatively inexpensive (Tian et al., 2012). In NC, Shanxi (420 t) and Inner Mongolia (358 t) experienced the largest increases in coal-derived emission. According to the Energy Development Strategy Action Plan 2014–2020, both provinces were designated as major bases of large-scale thermal power generation, contributing significantly to the national energy supply network through long-distance electricity transport. Both provinces have faced economic challenges with one of the lowest GDP growth and income rises in China (SS-F), making energy substitution unlikely. In contrast, Beijing and its surrounding areas have achieved substantial reductions in coal use through the Regional Collaboration on Air Pollution Control, aiming to reduce 25 % of PM2.5 concentrations in Beijing–Tianjin–Hebei by phasing out small coal-fired boilers and switching to natural gas (Yan et al., 2018). Additionally, according to statistics (SS-A3), NC has one of the highest application rates of APCDs including the advanced baghouse filters, which has the highest capture efficiency for fine particles. Vanadium emission decreased notably in SWC (−290 t) and CC (−269 t), with Sichuan, Guizhou, Chongqing, and Henan and Hubei exhibiting significant decline in coal consumption (SS-A5). Coal produced in the SWC region was highly enriched with toxic arsenic (Wang et al., 2020c), which may invoke more restrictions on local consumption. There was also increased investment in greener energy such as natural gas adopted by CC (e.g., Henan) to reduce their dependence on coal (Wang, 2021). The SWC region significantly reduced coal consumption, while a steady growth of power generation was maintained (SS-H1 and SS-H2). This pattern coincided with increased investment on shale gas supply, particularly in Sichuan Province with one of the most natural gas consumption levels in China. Similarly, in delta area (Shanghai–Jiangsu–Zhejiang) of Yangtze River, the most economically developed region with the highest GDP and income per capita (SS-F), a significant decline in emissions related to coal burning was observed, which aligned with a rapid increase in natural gas consumption (SS-H3). The major vanadium emission (> 500 t) pertinent to coke usage was found in Hebei in NC, Hunan in CC, and Sichuan, Yunnan in SWC, where coking operations were concentrated. Large vanadium emissions (> 5000 t) pertinent to stationary oil burning mainly occurred in coastal regions including Liaoning in NEC, Shandong and Shanghai in EC, and Guangdong in SC (Fig. S3c). In particular, NEC (583 t) and EC (259 t) observed significant increase in vanadium emission induced by crude oil consumption (Fig. 3c). Provinces like Shandong and Guangdong, as economic powerhouses with populations exceeding 100 million, have benefited from seaport advantages, enabling large-scale oil imports to fuel industrial and economic growth, ultimately leading to increased vanadium emissions. Direct vanadium emissions from industrial production processes were much lower but exhibited a heterogeneous distribution pattern (Fig. S3d). The steel industry was the primary source of emissions related to industrial production, with the largest emission from Hebei Province (1587.2 t) due to concentrated steel making operations. In comparison, small emissions induced by glass production were scattered in Hebei in NC, Shandong in EC, Hubei in CC, Sichuan in SWC, and Guangdong in SC. Fossil energy (coal and oil) extraction also made minor contribution to the emission inventory, mainly in NC (Shanxi, Inner Mongolia) and NWC (Xinjiang, Shaanxi). For vanadium ore mining, SWC had the world's largest vanadium–titanium reserve in Sichuan, which alone accounted for 66.1 % of emission, with persistent growth at the production level. Therefore, further investigation into vanadium industry, such as smelting and product processing, would be crucial to improve the comprehensiveness of the inventory, as they may have become major industrial sources of vanadium emission. For industrial waste disposal, vanadium emission pertinent to industrial solid waste disposal increased in all regions (Fig. 3e). A larger proportion of vanadium output (> 250 t) occurred in NC (Fig. S3e), where both production and consumption of wide range of mineral resources were located, generating a massive amount of slag subjected to leaching processes (Li et al., 2013). However, the emission in Hebei experienced a decreasing trend. Since the introduction of the Steel Industry Adjustment and Upgrading Plan in 2016, the elimination of inefficient production processes decreased the generation of slag and dusts, and the consolidation of industry into larger enterprise further encouraged the recycling and re-utilization of solid waste, such as converting slag into construction materials or recovering vanadium. For municipal waste, the temporal variation in vanadium emission was insignificant, which may be attributed to an increased recycling rate (Xiao et al., 2018) and new regulations that led to a smaller volume of trash subjected to disposal, such as the ban on imported waste (Song et al., 2023). Among all regions, NWC was responsible for less proportion of overall vanadium emission. However, emissions related to numbers of sources in NWC increased, including the consumption of raw coal, oil burning, and industrial solid waste (Fig. 3). The National Main Functional Zone Plan released in 2010 explicitly designated the western region of China as a base for energy resource development and heavy industry. Local governments in the western region have introduced investment incentives to attract energy-intensive enterprises to establish operations and ease the environmental burden of eastern regions. This move consequently resulted in remarkable growth in vanadium emission over the study period, highlighting the need for more attention in the future regarding its environmental impact.
Policy changes usually impose a more direct impact on coal consumption. In the coastal region with strong economy and public awareness, the enforcement of environmental policies has become very urgent because wealthier populations tend to be more concerned with environmental well-being, and these regions have more financial and technological resources for implementing environmental policies. For example, the coastal region made a huge investment in liquified natural gas terminals and processing facilities, which can support the steady growth in natural gas usage. However, for poorer provinces, there is less incentive to prioritize environmental concerns, as the immediate focus is typically on supporting economic development. These regions may rely on cheaper energy sources, such as coal, to fuel industrial growth and meet the energy demands of expanding economies. The development of a vanadium emission inventory at a provincial level will serve as a key basis for policymaking, which would warrant more targeted efforts on major provincial emitters from different emission sources.
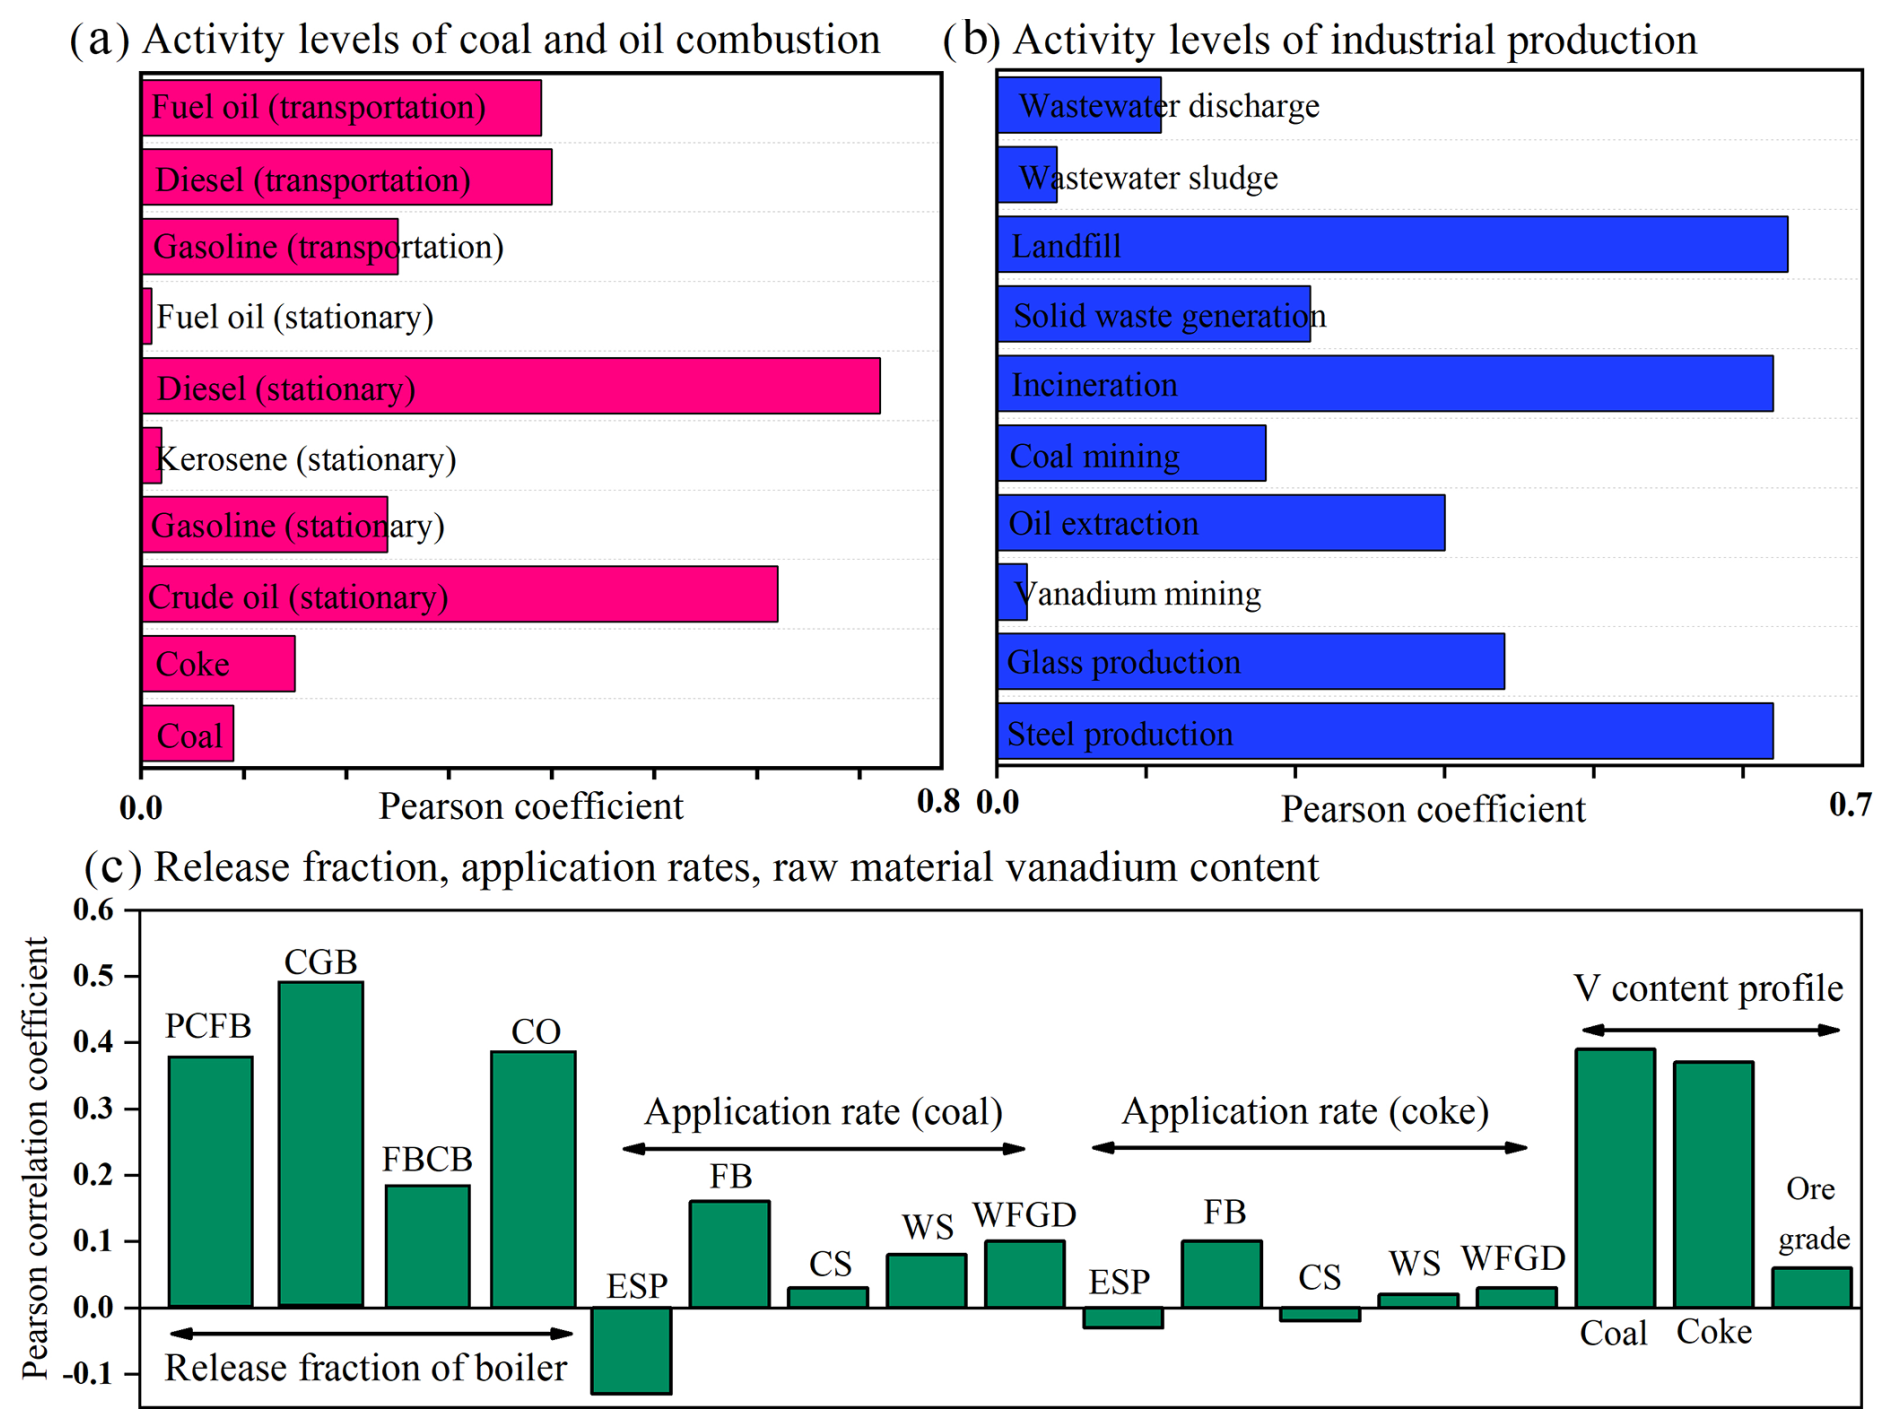
Figure 4Sensitivity analysis of input parameters using the Pearson rank correlation coefficient. The strength and direction of linear relationship between subgroup emission and input parameters related to (a) consumption level, (b) production level, and (c) other emission factors were measured using the Pearson correlation method (abbreviations are used as follows: ESP – electrostatic precipitator, FB – baghouse filter, CS – cyclone separator, WS – wet scrubber, WFGD – wet flue gas desulfurization, PCFB – pulverized coal-fired boiler, CGB – chain grate boiler, FBCB – fluidized bed combustion, CO – coke oven).
3.4 Uncertainty analysis of the vanadium emission inventory
The successful establishment of the inventory was affected by various factors including the authenticity, representativeness, accuracy of data, and adopted statistic methods. Identifying the sources of uncertainty and assessing their impacts provide valuable insights for improving the inventory quality. The uncertainties of input data were firstly evaluated by bootstrapping simulation. Table S19 provides the characterization for fitted probability distribution of bootstrapped samples and the range of uncertainties for emission factors and activity levels. Most samples after bootstrap simulation were normally distributed, suggesting an adequate fit to original samples that well represented the variability and uncertainties. Table S20 displays the quantification results for the uncertainty of vanadium emissions determined by a 95 % confidence interval. Among the model outputs, the inventories for vanadium emission pertinent to oil burning and industrial processes were well established, with less than ±10 % uncertainty. However, emissions pertinent of coal combustion, transportation, and wastewater sludge exhibited great level of uncertainties. Pearson's correlation coefficients were further computed to measure the linear relationship between input parameters and emission inventories. For subgroup inventories with high level of uncertainties, transportation-related oil consumption and wastewater sludge generation were significantly correlated (p<0.05) with emission levels (Fig. 4a and b). Both sectors lacked activity level data at a provincial level, resulting in imprecise or insufficient data resolution for inventory development. For coal combustion, the vanadium release fraction of typical boilers exhibited a significant correlation (p<0.05) with the emission level. Some release fraction data were retrieved from old studies from other countries, which may not represent the overall status in China well. Vanadium content in raw coal and coke was another influential factor (p<0.05), as its high variability may introduce significant uncertainty in the emissions calculation. The application rates of electrostatic precipitators, bag filters, and wet flue gas desulfurization showed a stronger correlation with emission inventory, which may serve as a potential source of uncertainties. It was also challenging to access the temporal and spatial data on technology penetration for APCDs. The data profile assumed that application rates remained unchanged during the study period, and extrapolation was done for old-fashioned technologies (e.g., electrostatic precipitators) based on previous reports (Liu et al., 2015). To reduce the uncertainty level, more focus should be allocated to improve the data resolution of transportation-related activity levels. It is also vital to perform on-site measurement for domestic facility processes in raw coal and coke combustion sectors in order to improve the data quality of emission factors. For example, a previous study employed a continuous emission monitoring system to provide real-time tracking of emissions for the computation of emission factors (Tang et al., 2020).
3.5 Comparison with a previous domestic study
In a previous study on the historical trend of vanadium emissions in China (Bai et al., 2021), the emission from coal combustion significantly declined following a peak in 2007, with emission levels in 2010s lower than this study. This contrast may largely stem from differences in collection and handling of APCD data. According to the China Electricity Council, major technological upgrades since 2010s led to a sharp increase in the implementation of baghouse filters and wet flue gas desulfurization. However, we assumed that their annual installation rates have stabilized in recent years. Notably, studies on the vanadium removal efficiencies of baghouse filters (79.0 ± 17.9 %) are extremely limited, and their performance may be substantially underestimated compared to that of conventional electrostatic precipitators (89.7 ± 13.7 %). In a previous study, the relative contribution of both stationary and mobile sources showed a decreasing trend until 2017. In comparison, oil consumption data in this inventory showed a persistently increasing trend in all sectors except for fuel oil and diesel. For transportation emission, our study utilized the amount of fuel consumption reported by the National Statistics Bureau, whereas vehicle counts were integrated into the emission calculation in previous study. It should be noted that the substantial rise in electric-powered and natural-gas-powered vehicles after 2015 may affect the emission calculation. Therefore, differences in data sources may contribute to the discrepancy between inventories. Moreover, both studies agreed on a significant increase in emission pertinent to industrial production and solid waste disposal, highlighting the contribution of steel and glass production to the rise in vanadium output. However, the present study also underscored the importance of solid waste disposal, which were neglected in the previous study.
Our study examined the vanadium emission pattern to develop China's vanadium emission inventory based on a bottom-up approach, comprising five major categories and 20 affiliated subgroups. Vanadium emission increased from 41 389 to 44 069 t during 2015–2019, with the majority of vanadium discharged directly into the atmosphere. Coal combustion and stationary sources of oil burning accounted for 46.7 % and 40.1 % of overall emission inventory, respectively. Major vanadium emission occurred in northern, eastern coastal, southern, and southwestern provinces, with Shandong, Liaoning, Hebei, Guangdong, and Hunan emitting over 10 000 t of vanadium cumulatively. This inventory highlighted the significant role of regional economic development and energy demand in shaping vanadium emission patterns. Advanced policies in economically developed areas reduced emissions by enabling cleaner energy transitions, while energy-dependent regions showed persistent coal-related emissions. The analysis revealed critical uncertainties in emissions from transportation, coal combustion, and sludge disposal, largely due to insufficiently resolved activity data and poorly characterized emission factors. These uncertainties underscored the need for region-specific data collection and on-site measurements, particularly for vanadium release fractions and APCD efficiencies. Overall, this study provides an essential framework for tracking vanadium emissions, identifying hotspots, and guiding policy interventions. Future efforts should focus on integrating seasonal and higher-resolution datasets to further refine the inventory and address emerging challenges in emission control and mitigation strategies.
Datasets used for the development of vanadium emission inventories are available at https://doi.org/10.5281/zenodo.14467726 (Zhang, 2024).
The supplement related to this article is available online at https://doi.org/10.5194/acp-25-5577-2025-supplement.
BZ reviewed and edited the paper, and YX supervised the project. XH collected the datasets and performed analysis, with contributions from HZ, BJ, and QL. HZ wrote the manuscript.
The contact author has declared that none of the authors has any competing interests.
Publisher’s note: Copernicus Publications remains neutral with regard to jurisdictional claims made in the text, published maps, institutional affiliations, or any other geographical representation in this paper. While Copernicus Publications makes every effort to include appropriate place names, the final responsibility lies with the authors.
This research work was supported by the National Natural Science Foundation of China (NSFC) (nos. U21A2033 and 42307341).
This research has been supported by the National Natural Science Foundation of China (grant nos. U21A2033 and 42307341).
This paper was edited by Samara Carbone and reviewed by two anonymous referees.
Anderson, D.: Emission factors for trace substances, National Technical Information Service, U.S. Environmental Protection Agency, 91 pp., EPA-450/2-73-001, 1973.
Arienzo, M. M., Legrand, M., Preunkert, S., Stohl, A., Chellman, N., Eckhardt, S., Gleason, K. E., and McConnell, J. R.: Alpine Ice–Core Evidence of a Large Increase in Vanadium and Molybdenum Pollution in Western Europe During the 20th Century, J. Geophys. Res.-Atmos., 126, e2020JD033211, https://doi.org/10.1029/2020JD033211, 2021.
Bai, X., Luo, L., Tian, H., Liu, S., Hao, Y., Zhao, S., Lin, S., Zhu, C., Guo, Z., and Lv, Y.: Atmospheric Vanadium Emission Inventory from Both Anthropogenic and Natural Sources in China, Environ. Sci. Technol., 55, 11568–11578, https://doi.org/10.1021/acs.est.1c04766,2021.
Bartoňová, L., Raclavská, H., and Najser, J.: Vanadium – Valuable and toxic element in coal combustion ash: An overview, Process Saf. Environ., 172, 923–940, https://doi.org/10.1016/j.psep.2023.02.070, 2023.
Bortnikova, S. B., Gavrilenko, G. M., Bessonova, E. P., and Lapukhov, A. S.: The hydrogeochemistry of thermal springs on mutnovskii volcano, southern Kamchatka, J. Volcanol. Seismol., 3, 388–404, https://doi.org/10.1134/S0742046309060025, 2009.
Fei, Y., Zhang, B., Chen, D., Liu, T., and Dong, H.: The overlooked role of denitrifying bacteria in mediating vanadate reduction, Geochim. Cosmochim. Ac., 361, 67–81, https://doi.org/10.1016/j.gca.2023.10.015, 2023.
Fu, X., Xu, L., Yan, H., Ye, H., and Ding, J.: Mineralogy and trace element geochemistry of the early Cambrian black shale-hosted Zhongcun vanadium deposit, southern Qinling, China, Ore. Geo. Rev., 155, 105371, https://doi.org/10.1016/j.oregeorev.2023.105371, 2023.
Gu, C., Zhang, L., Xu, Z., Xia, S., Wang, Y., Li, L., Wang, Z., Zhao, Q., Wang, H., and Zhao, Y.: High-resolution regional emission inventory contributes to the evaluation of policy effectiveness: a case study in Jiangsu Province, China, Atmos. Chem. Phys., 23, 4247–4269, https://doi.org/10.5194/acp-23-4247-2023, 2023.
He, J., Zhang, B., Wang, Y., Chen, S., and Dong, H.: Vanadate bio-detoxification driven by pyrrhotite with secondary mineral formation, Environ. Sci. Technol., 57, 1807–1818, https://doi.org/10.1021/acs.est.2c06184, 2023.
Hope, B. K.: A dynamic model for the global cycling of anthropogenic vanadium, Global Biogeochem. Cy., 22, 1–16, https://doi.org/10.1029/2008GB003283, 2008.
Huang, J., Huang, F., Evans, L., and Glasauer, S.: Vanadium: Global (Bio)geochemistry, Chem. Geol., 417, 68–89, https://doi.org/10.1016/j.chemgeo.2015.09.019, 2015.
International Energy Agency: World Energy Statistics 2016, OECD, https://doi.org/10.1787/9789264263079-en, 2016.
Li, C., Wang, A., Chen, X., Chen, Q., Zhang, Y., and Li, Y.: Regional distribution and sustainable development strategy of mineral resources in China, Chinese Geogr. Sci., 23, 470–481, https://doi.org/10.1007/s11769-013-0611-z, 2013.
Liu, K., Wu, Q., Wang, L., Wang, S., Liu, T., Ding, D., Tang, Y., Li, G., Tian, H., Duan, L., Wang, X., Fu, X., Feng, X., and Hao, J.: Measure-Specific Effectiveness of Air Pollution Control on China's Atmospheric Mercury Concentration and Deposition during 2013–2017, Environ. Sci. Technol., 53, 8938–8946, https://doi.org/10.1021/acs.est.9b02428, 2019.
Liu, C., Zhang, L., Wen, Y., and Shi, K.: Sensitivity analysis of O3 formation to its precursors-Multifractal approach, Atmos. Environ., 251, 118275, https://doi.org/10.1016/j.atmosenv.2021.118275, 2021.
Maclntosh, D. and Spengler, J.: Emission of Hazardous Air Pollutants from Coal-Fired Power Plants, Environmental Health & Engineering, Inc., 35 pp., 2011.
Monakhov, I. N., Khromov, S. V., Chernousov, P. I., and Yusfin, Yu. S.: The Flow of Vanadium-Bearing Materials in Industry, Metallurgist, 48, 381–385, https://doi.org/10.1023/B:MELL.0000048420.68839.2a, 2004.
Ouyang, X., Fang, X., Cao, Y., and Sun, C.: Factors behind CO2 emission reduction in Chinese heavy industries: Do environmental regulations matter? Energ. Policy, 145, 111765, https://doi.org/10.1016/j.enpol.2020.111765, 2020.
Pacyna, J. M. and Pacyna, E. G.: An assessment of global and regional emissions of trace metals to the atmosphere from anthropogenic sources worldwide, Environ. Rev., 9, 269–298, 2001.
Polyak, D. E.: Minerals Yearbook 2015, Vanadium, U.S. Geological Survey, 176 pp., 2015.
Polyak, D. E.: Minerals Yearbook 2017, Vanadium, U.S. Geological Survey, 182 pp., 2017.
Polyak, D. E.: Minerals Yearbook 2019, Vanadium, U.S. Geological Survey, 81.3 pp., 2024.
ResearchInChina: Global and China Vanadium Industry Report 2018–2023, http://www.researchinchina.com/Htmls/Report/2018/10513.html (last access: 30 August 2024), 2018.
Rohrbach, M. and Zimmermann, M.: Improving sewage sludge treatment and utilisation in China: a German perspective on barriers to and measures for the dissemination of innovative technologies, H2Open J. 6, 268–279, https://doi.org/10.2166/h2oj.2023.022, 2023.
Schlesinger, W. H., Klein, E. M., and Vengosh, A.: Global biogeochemical cycle of vanadium, P. Natl. Acad. Sci. USA, 114, 11092–11100, https://doi.org/10.1073/pnas.171550011, 2017.
Shiller, A. M. and Mao, L. J.: Dissolved vanadium in rivers: Effects of silicate weathering, Chem. Geol., 165, 13–22, https://doi.org/10.1016/S0009-2541(99)00160-6, 2000.
Song, N., Mclellan, I., Liu, W., Wang, Z., and Hursthouse, A.: The waste ban in China: what happened next? Assessing the impact of new policies on the waste management sector in China, Environ. Geochem. Heal., 45, 1117–1131, https://doi.org/10.1007/s10653-021-01101-y, 2023.
Tang, L., Xue, X., Jia, M., Jing, H., Wang, T., Zhen, R., Huang, M., Tian, J., Guo, J., Li, L., Bo, X., and Wang, S.: Iron and steel industry emissions and contribution to the air quality in China, Atmos. Environ., 237, 117668, https://doi.org/10.1016/j.atmosenv.2020.117668, 2020.
Tian, H., Cheng, K., Wang, Y., and Zhao, D.: Quantitative Assessment of Variability and Uncertainty of Hazardous Trace Element (Cd, Cr, and Pb) Contents in Chinese Coals by Using Bootstrap Simulation, J. Air Waste Manage. Assoc., 61, 755–763, https://doi.org/10.3155/1047-3289.61.7.755, 2011.
Tian, H., Cheng, K., Wang, Y., Zhao, D., Long, L., Jia, W., and Hao, J.: Temporal and spatial variation characteristics of atmospheric emissions of Cd, Cr, and Pb from coal in China, Atmos. Environ., 50, 157–163, https://doi.org/10.1016/j.atmosenv.2011.12.045, 2012.
U.S. Geological Survey: Mineral commodity summaries 2023, U.S. Geological Survey, 210 pp., https://doi.org/10.3133/mcs2023, 2023.
Visschedijk, A. H. J., Denier Van Der Gon, H. A. C., Hulskotte, J. H. J., and Quass, U.: Anthropogenic Vanadium emissions to air and ambient air concentrations in North-West Europe, E3S Web of Conferences, 1, 03004, https://doi.org/10.1051/e3sconf/20130103004, 2013.
Wang, G., Deng, J., Zhang, Y., Zhang, Q., Duan, L., Hao, J., and Jiang, J.: Air pollutant emissions from coal-fired power plants in China over the past two decades, Sci. Total Environ., 741, 140326, https://doi.org/10.1016/j.scitotenv.2020.140326, 2020e.
Wang, S., Zhang, B., Fei, Y., Liu, H., Zhao, Y., and Guo, H.: Elucidating multiple electron-transfer pathways for metavanadate bioreduction by actinomycetic Streptomyces microflavus, Environ. Sci. Technol., 57, 19921–19931, https://doi.org/10.1021/acs.est.3c07288, 2023.
Wang, S., Zhang, B., Li, T., Li, Z., and Fu, J.: Soil vanadium(V)-reducing related bacteria drive community response to vanadium pollution from a smelting plant over multiple gradients, Environ. Int. 138, 105630, https://doi.org/10.1016/j.envint.2020.105630, 2020b.
Wang, Q., Song, X., and Liu, Y.: China's coal consumption in a globalizing world: Insights from Multi-Regional Input-Output and structural decomposition analysis, Sci. Total Environ., 711, 134790, https://doi.org/10.1016/j.scitotenv.2019.134790, 2020d.
Wang, X., Wang, L., Chen, J., Zhang, S., and Tarolli, P.: Assessment of the External Costs of Life Cycle of Coal: The Case Study of Southwestern China, Energies, 13, 4002, https://doi.org/10.3390/en13154002, 2020c.
Wang, Y.: Research on the Relationship Between Green Energy Use, Carbon Emissions and Economic Growth in Henan Province, Front. Energy Res. 9, 701551, https://doi.org/10.3389/fenrg.2021.701551, 2021.
Wang, Y., Zhang, B., Wang, S., and Zhong, Y.: Temporal dynamics of heavy metal distribution and associated microbial community in ambient aerosols from vanadium smelter, Sci. Total Environ., 735, 139360, https://doi.org/10.1016/j.scitotenv.2020.139360, 2020a.
Watt, J. A. J., Burke, I. T., Edwards, R. A., Malcom, H. M., Mayes, W. M., Olszewska, J. P., and Pan, G.: Vanadium: A re-emerging environmental hazard, Environ. Sci. Technol., 52, 11973–11974, https://doi.org/10.1021/acs.est.8b05560, 2018.
Wright, M., Stollenwerk, K., and Belitz, K.: Assessing the solubility controls on vanadium in groundwater, northeastern San Joaquin Valley, CA, Appl. Geochem., 48, 41–52, https://doi.org/10.1016/j.apgeochem.2014.06.025, 2014.
Xiao, S., Dong, H., Geng, Y., and Brander, M.: An overview of China's recyclable waste recycling and recommendations for integrated solutions, Resour. Conserv. Recy., 134, 112–120, https://doi.org/10.1016/j.resconrec.2018.02.032, 2018.
Xing, J., Lu, X., Wang, S., X., Wang, T., Ding, D., Yu, S., Shindell, D., Ou, Y.; Morawska, L., Li, S. W., Ren, L., Zhang, Y. Q., Loughlin, D., Zheng, H. T., Zhao, B., Liu, S. C., Smith, K. R., and Hao, J. M.: The quest for improved air quality may push China to continue its CO2 reduction beyond the Paris Commitment, P. Natl. Acad. Sci. USA, 117, 29535–29542, https://doi.org/10.1073/pnas.2013297117, 2020.
Yan, D., Lei, Y., Shi, Y., Zhu, Q., Li, L., and Zhang, Z.: Evolution of the spatiotemporal pattern of PM2.5 concentrations in China – A case study from the Beijing-Tianjin-Hebei region, Atmos. Environ., 183, 225–233, https://doi.org/10.1016/j.atmosenv.2018.03.041, 2018.
Yang, M. and Yang, J.: Vanadium extraction from steel slag: Generation, recycling and management, Environ. Pollut., 343, 123126, https://doi.org/10.1016/j.envpol.2023.123126, 2024.
Yearbook of Transportation and Automobile Industry 2015–2019, National Bureau of Statistics of China [data set], http://www.stats.gov.cn/tjsj/ndsj/ (last access: 10 December 2023), 2020.
Yu, C., Li, H., Jia, X., and Li, Q.: Improving resource utilization efficiency in China's mineral resource-based cities: A case study of Chengde, Hebei province, Resour. Conserv. Recy., 94, 1–10, https://doi.org/10.1016/j.resconrec.2014.10.013, 2015.
Yuan, S., He, M., Wang, R., Jin, Y., and Li, Y.: Multistage suspension roasting of refractory stone coal: Enhanced extraction based on decarburization and vanadium oxidation, Powder Technol., 405, 117532, https://doi.org/10.1016/j.powtec.2022.117532, 2022.
Zhang, B., Wang, S., Diao, M., Fu, J., Xie, M., and Shi, J.: Microbial community responses to vanadium distributions in mining geological environments and bioremediation assessment, J. Geophys. Res.-Biogeo., 124, 601–615, https://doi.org/10.1029/2018JG004670, 2019a.
Zhang, B., Zhang, H., He, J., Zhou, S., Dong, H., Rinklebe, J., and Ok, Y.: Vanadium in the Environment: Biogeochemistry and Bioremediation, Environ. Sci. Technol., 57, 14770–14786, https://doi.org/10.1021/acs.est.3c04508, 2023.
Zhang, H.: Datasets for Emission Inventory Development for Spatiotemporal Release of Vanadium from Anthropogenic Sources in China, Zenodo [data set], https://doi.org/10.5281/zenodo.14467726, 2024.
Zhang, H., Zhang, B., Wang, S., Chen, J., Jiang, B., and Xing, Y.: Spatiotemporal vanadium distribution in soils with microbial community dynamics at vanadium smelting site, Environ. Pollut., 265, 114782, https://doi.org/10.1016/j.envpol.2020.114782, 2020.
Zhang, X., Zhang, Y., Liu, Y. M., Zhao, J. R., Zhou, Y. Y., Wang, X. F., Yang, X., Zou, Z., Zhang, C. G., Fu, Q. Y., Xu, J. M., Gao, W., Li, N., and Chen, J.: Changes in the SO2 Level and PM2.5 Components in Shanghai Driven by Implementing the Ship Emission Control Policy, Environ. Sci. Technol., 53, 11580–11587, https://doi.org/10.1021/acs.est.9b03315, 2019b.
Zheng, B., Tong, D., Li, M., Liu, F., Hong, C., Geng, G., Li, H., Li, X., Peng, L., Qi, J., Yan, L., Zhang, Y., Zhao, H., Zheng, Y., He, K., and Zhang, Q.: Trends in China's anthropogenic emissions since 2010 as the consequence of clean air actions, Atmos. Chem. Phys., 18, 14095–14111, https://doi.org/10.5194/acp-18-14095-2018, 2018.
Zhu, S., Gao, C., Song, K., Gao, W., Guo, Y., and Gao, C.: The changes in spatial layout of steel industry in China and associated pollutant emissions: A case of SO2, J. Environ. Manage., 302, 114034, https://doi.org/10.1016/j.jenvman.2021.114034, 2022.