the Creative Commons Attribution 4.0 License.
the Creative Commons Attribution 4.0 License.
 | 02 Jun 2025
Water vapour isotopes over West Africa as observed from space: which processes control tropospheric H2O ∕ HDO pair distributions?
Christopher Johannes Diekmann
Matthias Schneider
Peter Knippertz
Tim Trent
Hartmut Boesch
Amelie Ninja Roehling
John Worden
Benjamin Ertl
Farahnaz Khosrawi
Frank Hase
The West African Monsoon (WAM) is crucial for rainfall in West Africa, impacting socio-economic conditions. Its complexity arises from interactions between large-scale circulation, convective dynamics, and microphysical processes, making it challenging to disentangle individual contributions to the hydrological cycle.
Recent advances in retrieving the isotopic composition of tropospheric water vapour from space promote the paired analysis of H2O and HDO to study atmospheric moisture pathways and processes. Using data from the satellite instruments IASI (Infrared Atmospheric Sounding Interferometer), AIRS (Atmospheric Infrared Sounder) and TROPOMI (Tropospheric Monitoring Instrument), along with the IMERG (Integrated Multi-Satellite Retrievals for GPM) precipitation product, we analyse the variability of H2O and HDO (given as δD) over West Africa at convective and seasonal scales. Key findings include the following: (1) monsoon convection over the Sahel induces an anti-correlation between H2O and δD in the mid-troposphere. This is due to dry intrusions from the Saharan upper troposphere into Sahelian squall lines, fostering rain evaporation and mid-tropospheric δD depletion. (2) Over the Guinea coast, convective precipitation is associated with moist and enriched signals, with surface evaporation from the tropical Atlantic reducing rain evaporation and δD depletion. (3) During the Sahelian monsoon peak, an anti-correlation between precipitation and δD forms year to year, indicating the amount effect in tropospheric water vapour. (4) In the Sahelian winter, when precipitation is minimal, {H2O, δD} signals point to mixing of dry air masses of different origins.
This study is the first to apply comprehensive isotopic datasets from IASI, TROPOMI and AIRS to the WAM, demonstrating the utility of satellite-based {H2O, δD} pairs in detecting impacts of microphysical and dynamical processes on water vapour isotopic composition.
- Article
(5337 KB) - Full-text XML
- BibTeX
- EndNote


The West African Monsoon (WAM) is one of the most prominent atmospheric features of the West African climate system (Fink et al., 2017). Over the semi-arid Sahel zone, the WAM causes a pronounced annual cycle that ranges from very dry winter months, when north-easterly Harmattan winds from the Sahara dominate, to a marked rainy season during summer, when south-westerly monsoon winds transport moisture from the tropical Atlantic into the Sahel and feed intense convective rainfalls often related to westward-propagating squall lines (Lafore et al., 2017). With the WAM thus being the main source of annual precipitation over the Sahel (Dhonneur, 1981; Fink et al., 2006), its socio-economic impacts are enormous, as the region relies heavily on rain-fed agriculture (Sultan et al., 2005; Berntell et al., 2018). From a climatological perspective, changes in the WAM system are critical for West Africa, e.g. for the contribution to the greenhouse effect (Spencer and Braswell, 1997) and for the degree of desiccation, i.e. progressive soil drying and subsequent desertification as a result of decreasing rainfall and intensifying drought (Hulme, 2001). In addition, the WAM system is found to affect weather systems in remote areas through dynamical teleconnections, such as over the North Atlantic and Europe (Bielli et al., 2010; Gaetani et al., 2011; Pante and Knippertz, 2019).
The simulation of the atmospheric processes related to the WAM, however, still poses a major challenge for modern numerical weather and climate models (Roehrig et al., 2013; Vogel et al., 2018). This is mainly due to the strong non-linearity in the coupling of atmospheric circulation, radiative transfer, land surface features, boundary layer processes and microphysical processes associated with convection (e.g. Colman et al., 2017; Lafore et al., 2017). Even a seemingly accurate precipitation forecast may be a result of error compensation within the model, with the effect of potentially reducing the robustness of climate projections using this model. Studies have shown that, besides other factors such as changes in Atlantic sea surface temperatures (e.g. Monerie et al., 2023), one of the main sources of uncertainty in climate projections over the Sahel is convection, mostly due to insufficient spatio-temporal resolution and the poor simulation of the convective organization and interaction with its environment (Marsham et al., 2013; de Vries et al., 2022). In particular, convective mixing processes play a crucial role in controlling the free tropospheric water vapour budget, which in turn affects the radiative transfer and atmospheric stability, but accurately simulating these processes can be particularly challenging (Sherwood et al., 2014). In addition, the network of observations is limited in West Africa (Parker et al., 2008) and may not be adequate for capturing the effects of the controlling processes required to enhance our general process understanding and for improving model performance.
A promising approach to provide new insights into different branches of the hydrological cycle and to validate numerical models is to inspect the isotopic composition of water in the atmosphere, in all its forms: liquid, gaseous and solid. As each water isotopologue (in the following referred to as a water isotope) is associated with characteristic binding energies and diffusivities, the ratios of different isotope concentrations are altered during phase changes. In this way, paired distributions of the light water isotope H2O against heavier molecules such as HDO can be used to track effects from microphysical and dynamical processes and thus give unique insights into the history of observed air masses (e.g. Worden et al., 2007; Noone et al., 2011; Noone, 2012; Bolot et al., 2013; Galewsky et al., 2016; González et al., 2016; Schneider et al., 2016; Lacour et al., 2018; Risi et al., 2021). Typically, the ratio between HDO and H2O is given in δD notation (‰) with respect to the standardized ratio (Craig, 1961):
Concomitant distributions of H2O and δD are often referred to as {H2O, δD} pairs.
Previous studies have investigated tropospheric distributions of stable water isotopes during the WAM using campaign-based observations of near-surface humidity (Risi et al., 2008b, 2010a; Tremoy et al., 2012, 2014), spatio-temporally limited retrievals from historical spaceborne sensors (Risi et al., 2010b) and isotope-enabled atmospheric models (Risi et al., 2010a; Diekmann et al., 2021b; Risi et al., 2023). These studies underline the strong influence of large-scale dynamics and microphysical processes on the isotopic composition of rain and water vapour. In particular, partial evaporation of falling rain droplets in the boundary layer and free troposphere has been linked to convective systems such as squall lines and was found to account for an increased depletion of δD observed in ambient vapour. By applying a model-based Lagrangian process attribution, Diekmann et al. (2021b) confirmed in a reverse engineering approach that the paired {H2O, δD} phase space is particularly suited to representing effects of the main atmospheric processes controlling the WAM. They found that its isotopic signatures in the troposphere during the summer monsoon period are explained well by means of theoretical formulations derived by Noone (2012): (1) dynamical processes, in particular the mixing of moist air masses from the tropical Atlantic with dry air from the Sahara affected by large-scale subsidence, and (2) microphysical processes, i.e. condensation and evaporation equilibration of liquid hydrometeors. In order to evaluate these theoretical concepts using real observations, new tropospheric datasets of pairs of H2O and δD with dense spatio-temporal coverage are needed, which, however, have only recently become available for West Africa.
Despite its lower abundance compared to other heavy isotopes in atmospheric water vapour molecules, deuterium has distinct spectroscopic features in the infrared electromagnetic range, allowing detection and quantification by remote sensing sensors (Clerbaux et al., 2009). With recent advances in the development of retrieval processors for state-of-the-art satellite sensors in terms of computational efficiency and data storage, new spaceborne datasets of tropospheric {H2O, δD} pairs with high spatio-temporal coverage over multiple years have become available. For instance, corresponding retrievals were performed for observations on daily and global bases from the current infrared sensors MetOp/IASI (Infrared Atmospheric Sounding Interferometer; Schneider et al., 2012, 2022; Diekmann et al., 2021c), Aqua/AIRS (Atmospheric Infrared Sounder; Worden et al., 2019) and Sentinel-5P/TROPOMI (Tropospheric Monitoring Instrument; Schneider et al., 2020; Trent et al., 2021). The growing availability of such datasets creates new opportunities for investigating atmospheric moisture processes from convective to climatic scales.
In this study, we make use of the high spatio-temporal coverage given by the {H2O, δD} pair datasets from IASI, AIRS and TROPOMI in order to investigate the isotopic signatures of tropospheric water vapour over West Africa. Building on an observational basis, the aim is to shed new light on atmospheric processes governing the WAM development, particularly microphysical processes associated with convection and the impact of large-scale circulation. The focus will be on
-
effects of convection in the {H2O, δD} phase space on a daily event basis,
-
the interannual variability of convection-related {H2O, δD} signals and
-
the quasi-climatological seasonal cycle of {H2O, δD} signals.
For this purpose, this study also includes the hourly precipitation rates from the multi-satellite precipitation product IMERG (Integrated Multi-Satellite Retrievals for GPM; Huffman et al., 2014) to link the observed {H2O, δD} pair signals to the prevailing precipitation conditions. We further utilize the IMERG data to detect individual major convective events as well as pronounced dry periods, with the aim of identifying the corresponding {H2O, δD} observations and inspecting the isotopic signatures for the different conditions. In order to foster process-based understanding of the observed {H2O, δD} pair signals, we add the theoretical process curves from Diekmann et al. (2021b) to assess effects of rain–vapour interactions and large-scale circulations on the {H2O, δD} phase space.
The paper is structured as follows: Sect. 2 documents the research datasets and analysis methods considered throughout this study. We analyse the remote sensing data for different target regions over West Africa on the convective scale (Sect. 3), with respect to the year-to-year variability (Sect. 4) and with a focus on the mean seasonal cycle (Sect. 5). The main conclusions and an outlook are given in Sect. 6.
Table 1Remote sensing datasets used within this study, sampled for the region of interest over West Africa (0–15° N, 8° W–8° E).
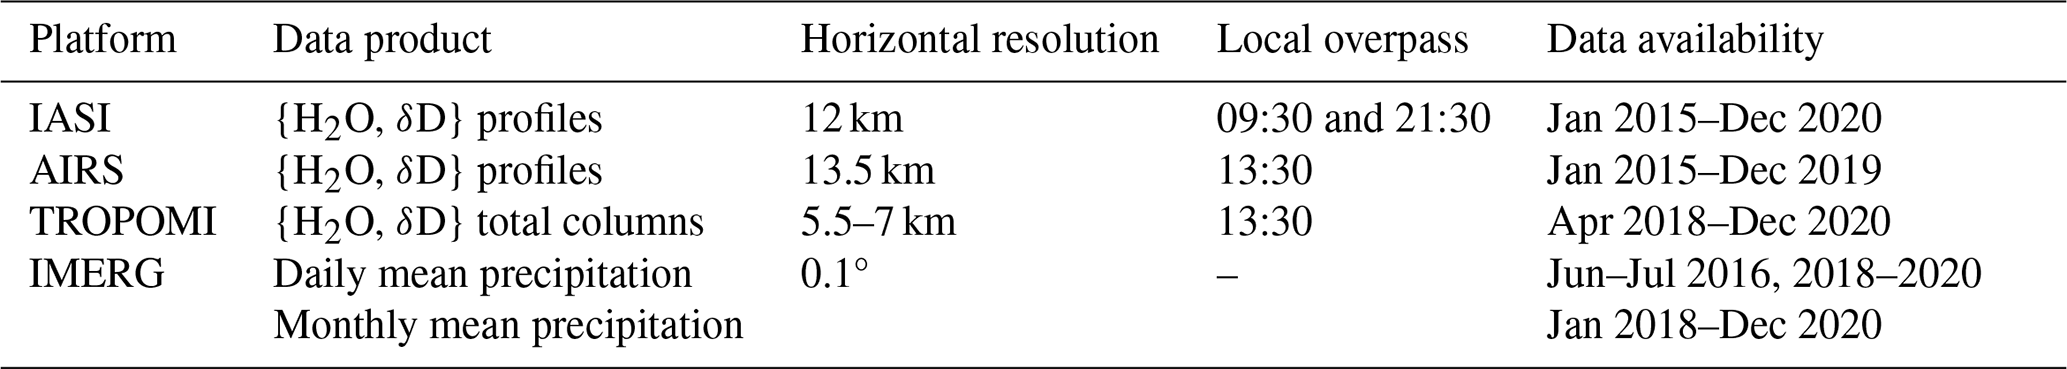
With the aim of characterizing and further understanding the {H2O, δD} pair variability over West Africa, this study makes use of observational datasets from space-based remote sensing (see Table 1) in combination with additional interpretative frameworks (see Sects. 2.1.1 and 2.2). Domains over the Guinea coast and the Sahel serve as study regions with different climatological conditions and are defined in alignment with Knippertz et al. (2017), i.e. latitudinal bounds of 0 to 7.5° N and 7.5 to 15° N, respectively, with common longitudinal bounds of 8° W to 8° E. These domains are found to be useful for documenting the shift in maximum precipitation from the coastal to Sahelian regions, which is a key criterion for defining the onset and further evolution of the WAM (Fitzpatrick et al., 2015; Knippertz et al., 2017; Diekmann et al., 2021b).
2.1 Tropospheric water isotope products from remote sensing
2.1.1 Dataset description
The main data sources for this study are three long-term and global datasets of tropospheric {H2O, δD} observations that were retrieved from state-of-the-art satellite sensors and made available in recent years (see Table 1). In the following we briefly describe these products and highlight selected particularities that are relevant for this study. Due to the distinct spectroscopic features of deuterium in the infrared spectrum, infrared sounders have proven useful for retrieving HDO abundances in the troposphere. However, water vapour products from these sensors are currently limited to cloud-free conditions, thus inducing a dry bias in larger-scale water vapour distributions (Schneider et al., 2010).
The first water isotope product is the {H2O, δD} pair dataset generated from thermal infrared spectra from MetOp/IASI (Diekmann et al., 2021c; Schneider et al., 2022) and developed and published in the framework of the MUSICA project (Schneider et al., 2012, 2016). This paired product is created using a post-processing step (1) to increase the sensitivity of the δD data, in particular for dry conditions, and (2) to harmonize the vertical sensitivities of the retrieved H2O and δD products, such that both profiles are representative of regions of the same overall altitude. That is, H2O and δD have matching averaging kernels (Wiegele et al., 2014; Schneider et al., 2016; Barthlott et al., 2017; Diekmann et al., 2021c). The MUSICA IASI {H2O, δD} pair product is sensitive to variations in H2O and δD in the free troposphere, predominantly at around 4.2 km, with contributions from layers up to 2–6 km (800–400 hPa). Diekmann et al. (2021c) reported typical errors of up to ∼ 12 % for H2O and 30‰ for δD at 4.2 km. The constellation of at least two simultaneously operating MetOp satellites allows us to achieve a twice-daily global coverage, with Equator crossings at around 09:30 and 21:30 local time. Here, we consider only quality-checked {H2O, δD} pair data according to the recommended filter conditions for observations with high sensitivity, as defined in Diekmann et al. (2021c).
The second product is the corresponding dataset from the Aqua/AIRS sensor (Worden et al., 2019). Similar to IASI, it captures the thermal infrared part of Earth's outgoing radiation, and thus, analogously, its {H2O, δD} product is also most sensitive to water isotope abundances in the free troposphere. For the scope of this study, {H2O, δD} data with a sensitivity peak between 825 and 421 hPa are selected. Errors reported for δD are in a similar range to those for IASI (∼25 ‰–30 ‰). Conceptually, the overall AIRS retrieval processor shares similarities with the MUSICA IASI retrieval, with however the difference that it uses no additional post-processing to achieve harmonization of the averaging kernels of the H2O and δD retrieval states. In particular, for dry conditions, the retrieval results were found to be much more sensitive to variations in H2O than in δD, with the effect that the averaging kernels of H2O and δD showed significant discrepancies in their vertical structures. This might have the consequence that the retrieved H2O and δD results evaluated at the same retrieval grid level may not represent the same air masses, so that their direct comparison would create misleading results. A more detailed discussion of these difficulties is given in Schneider et al. (2016).
A third product of tropospheric water isotope data was retrieved from the short-wave infrared sensor Sentinel-5P/TROPOMI and recently published in the scope of the ESA S5P+Innovation Water Vapour Isotopologues (H2O-ISO) project by Trent et al. (2021). In contrast to IASI and AIRS, which capture infrared radiation emitted by Earth's surface and atmosphere, TROPOMI measures solar radiation back-scattered at Earth's surface. By making use of the TROPOMI observations only over land, where the back-scattering features of the short-wave infrared radiation are significantly more effective than over oceans, Trent et al. (2021) performed total-column-averaged dry air mole fraction retrievals of H2O and HDO (δD is then calculated a posteriori using Eq. 1). The uncertainty of the TROPOMI δD product is estimated to achieve values of up to ∼30 %, thereby being comparable to IASI and AIRS. The total-column-averaged δD represents a weighted vertical δD average, with the weighting performed according to the vertical H2O distribution. That is, reported δD values are determined by the most humid atmospheric layers. Consequently, we expect the column-averaged {H2O, δD} products from TROPOMI to overall reflect the isotopic composition of the boundary layer or, in the case of the WAM, the monsoon layer (i.e. the near-surface humid layer during the monsoon, which is typically deeper than the actual boundary layer). Furthermore, we apply the quality filtering and bias correction for H2O and δD as described and suggested in Trent et al. (2021).
As our study focuses on the information content of the retrieved water isotope observations and their implications for process understanding during the WAM, the reader interested in more technical information of the sensors and data products is encouraged to review the corresponding publications and documents.
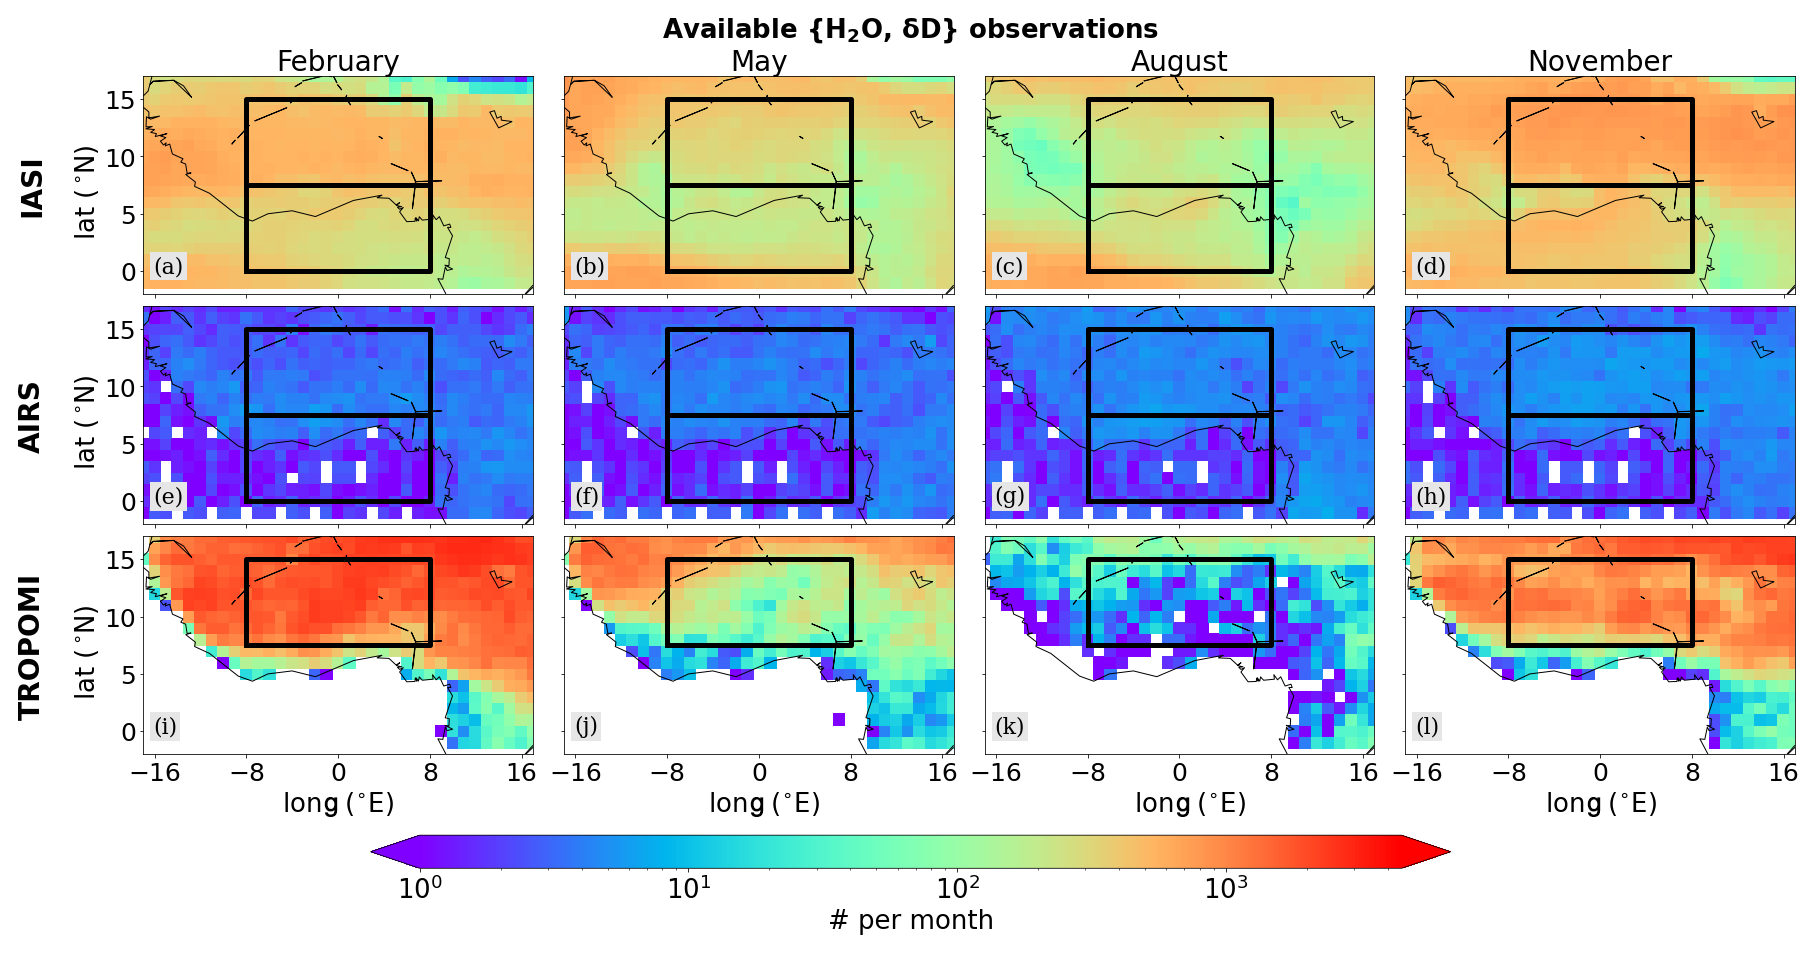
Figure 1Horizontal distributions of the monthly averaged coverage of available isotope retrievals from IASI, AIRS and TROPOMI evaluated on a 1° × 1° grid, after filtering for clouds and data quality (from left to right: February, May, August and November). The black frames indicate the study regions over the Sahel (upper box) and the Guinea coast (lower box). As the TROPOMI dataset only consists of observations over land, the Guinea coast region is omitted when studying the TROPOMI observations.
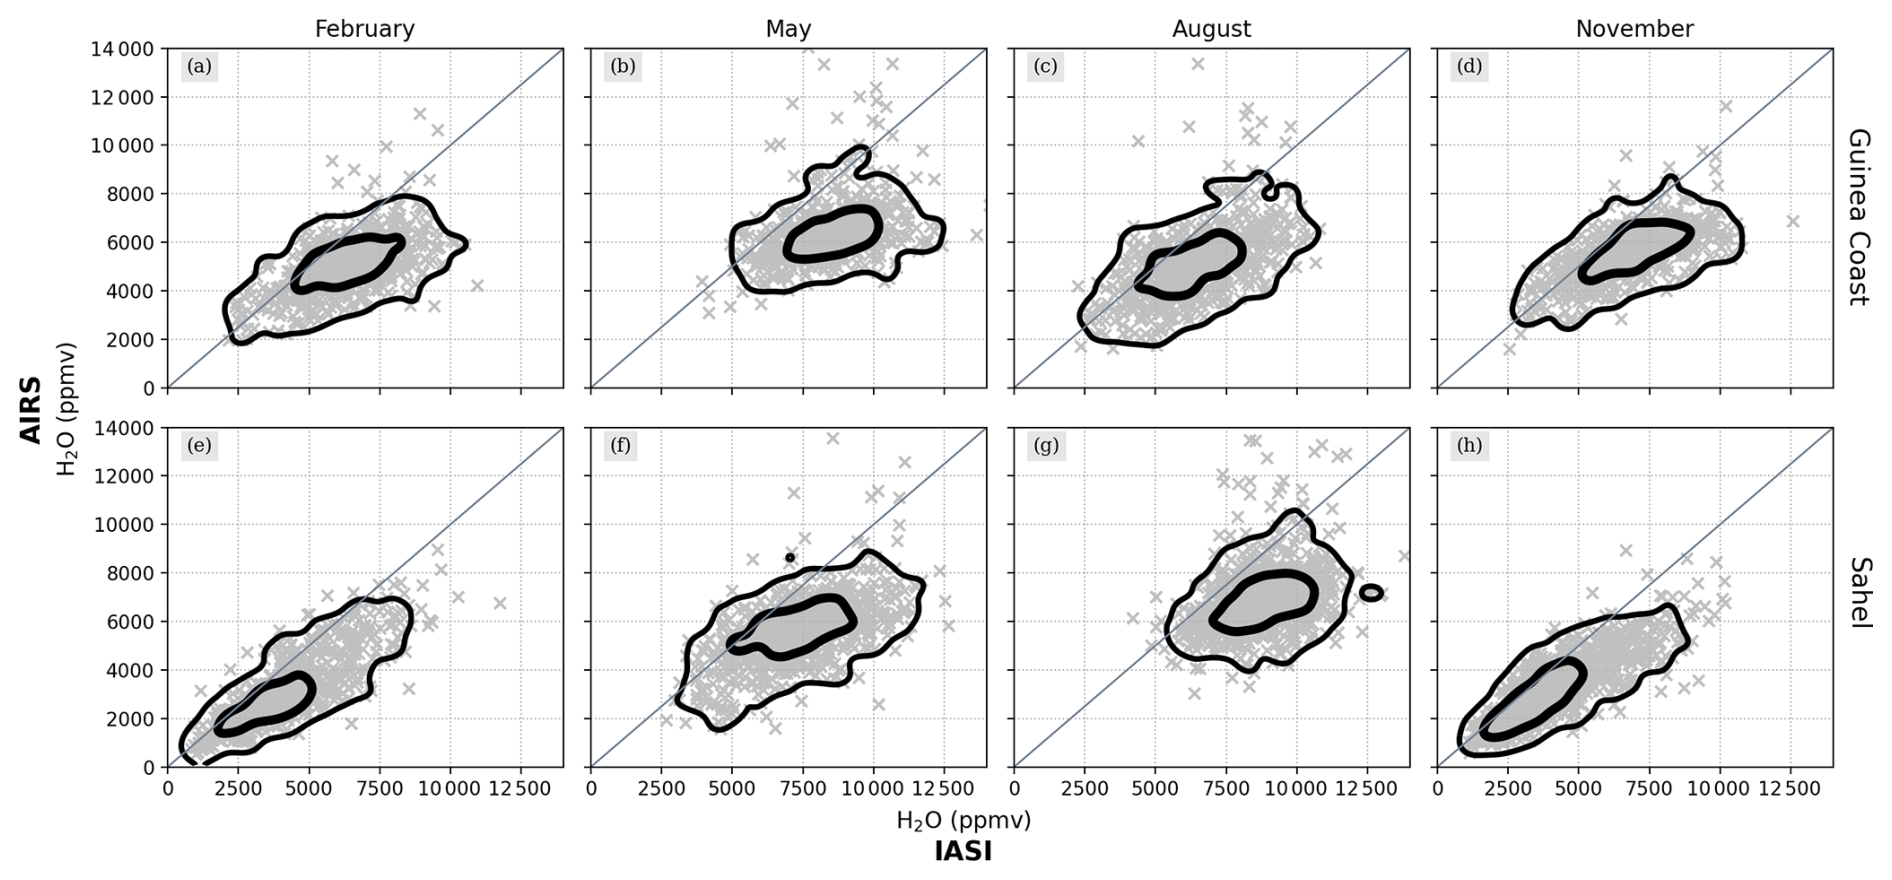
Figure 2Comparison of daily H2O data from IASI against AIRS over the Guinea coast and the Sahel for February, May, August and November from the years 2015 to 2019. The satellite data have been re-gridded onto a regular 2.5° × 2.5° grid by averaging all of the samples within a single grid box. The gridded data are then cross-compared for IASI and AIRS, shown as grey scatter and described by the two-dimensional histogram contours.
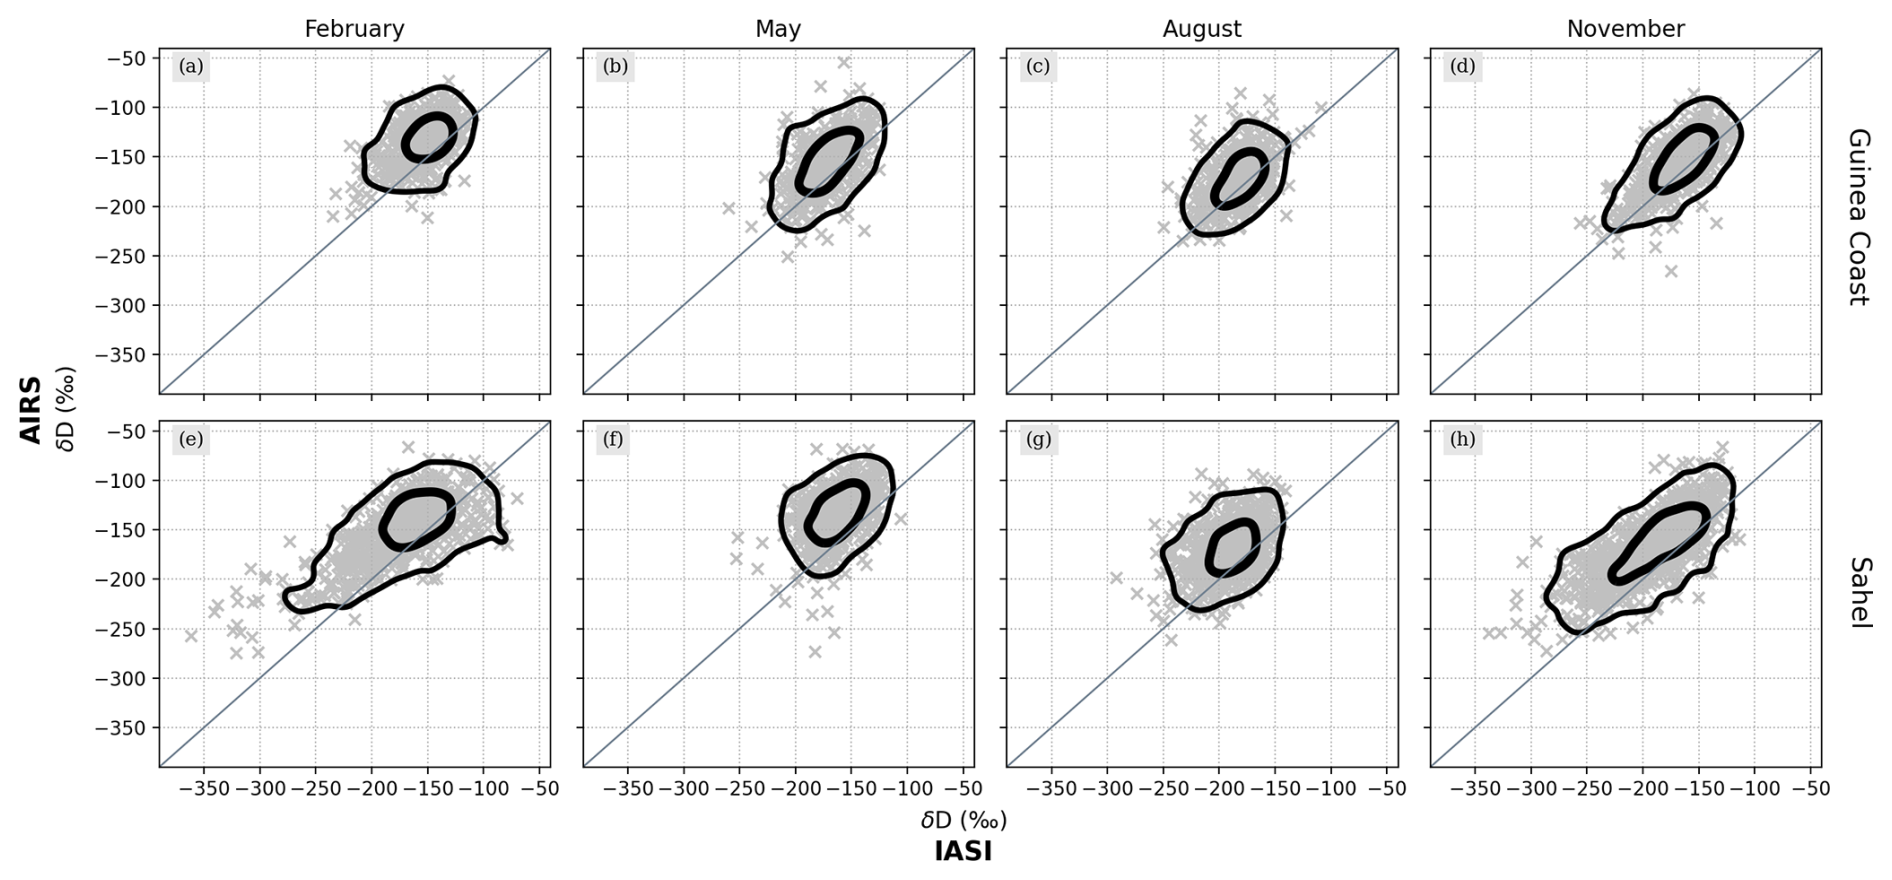
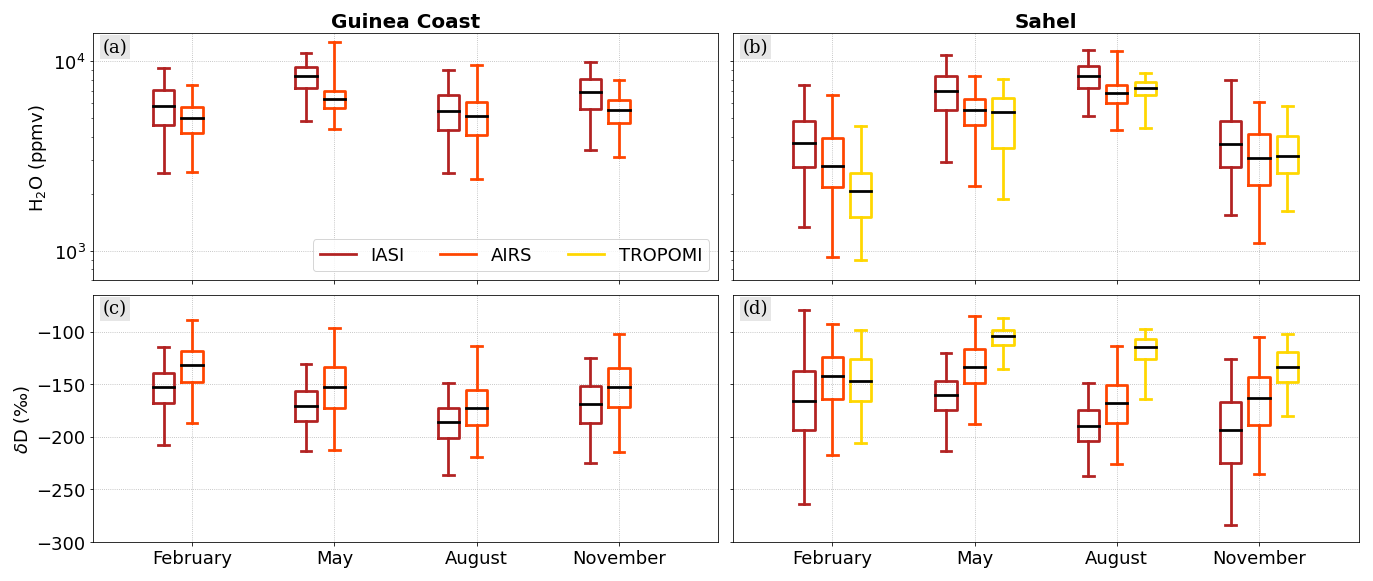
Figure 4Boxplots evaluating the distributions of H2O (using the natural logarithm) and δD from IASI, AIRS and TROPOMI for the Guinea coast (a, c) and the Sahel (b, d), averaged for February, May, August and November from the available periods (see Table 1). The boxes extend from the lower to upper quartiles, with the middle line depicting the median.
2.1.2 Cross-comparison of the different H2O and δD datasets
For the scope of this study, we make use of the {H2O, δD} dataset from IASI for its currently available period of 2015–2020, thereby resulting in data overlaps of 5 years with AIRS (available until 2019) and almost 3 years with TROPOMI (available from April 2018 until December 2020). Figure 1 shows the mean data availability of the considered data products over West Africa throughout the year, focusing on data from February, May, August and November (the choice of these months is discussed in Sect. 5). Overall, the {H2O, δD} pair dataset from IASI has robust good coverage, with up to 103 observations per 1° × 1° grid box per month. Observation counts are highest in the drier months of February and November and lowest during the rainy month of August, in particular over the precipitation maximum along the western coast and in Nigeria. AIRS has a data coverage that is comparably constant over time, with however a significantly lower number of observations available per grid point. In contrast to IASI and AIRS, TROPOMI data are only available over land, which is why we will omit the Guinea coast domain for this sensor throughout this study. Furthermore, a strong seasonal cycle in the data availability of TROPOMI becomes apparent, ranging from high to low data volumes from winter to summer. The fact that the reduced coverage correlates with the monsoon activity peak suggests that this is a result of the cloud treatment in the TROPOMI retrieval processing.
As the isotopic datasets of both IASI and AIRS are vertically resolved with the main sensitivity in the free troposphere, we can directly compare their daily H2O and δD distributions for the Sahel and the Guinea coast after interpolating the data to a common reference grid with 2.5° grid size (see Figs. 2 and 3). Overall, the two satellites show great agreement for both H2O and δD, with, however, slight deviations for certain regimes. For instance, we observe that IASI depicts a pull to higher H2O ranges for moist conditions compared to AIRS. Furthermore, we observe that for low δD IASI appears more depleted than AIRS, which becomes particularly apparent over the Sahel in February and November. Such differences between the two datasets are to be expected due to differences in the respective instrument and retrieval characteristics. For instance, IASI has a higher spectral resolution (0.5 cm−1) compared to AIRS (1 cm−1) and, hence, is more sensitive to atmospheric changes in H2O and δD. Furthermore, the MUSICA IASI {H2O, δD} pair retrieval includes various optimizations to harmonize and increase the sensitivities of H2O and δD, e.g. allowing us to better capture changes for dry conditions (see Sect. 2.1.1).
In Fig. 4, we focus on the comparison of averaged absolute values by month and satellite product. We see that H2O from IASI appears consistently higher compared to AIRS, with an averaged difference of around 1000–1500 ppmv. For δD, a positive bias of around 15 ‰–25 ‰ becomes visible in the AIRS data compared to IASI.
An interpretation of the comparison of IASI and AIRS with TROPOMI data is difficult, because the data represent different altitude ranges (i.e. total columns versus the free troposphere) and H2O has a strong gradient from the boundary layer to the troposphere. In terms of δD, TROPOMI appears even more enriched on the large scale than IASI and AIRS (δD increases up to 70 ‰). This is expected as TROPOMI is a total column product and thus dominated by the lower troposphere, which is typically more enriched due to contributions from e.g. evapotranspiration (Worden et al., 2021). In general, this direct comparison of the absolute data range of H2O and δD between TROPOMI (total column products), IASI and AIRS (mid-tropospheric products) needs to be treated with caution due to the structurally differing vertical sensitivities of the different products.
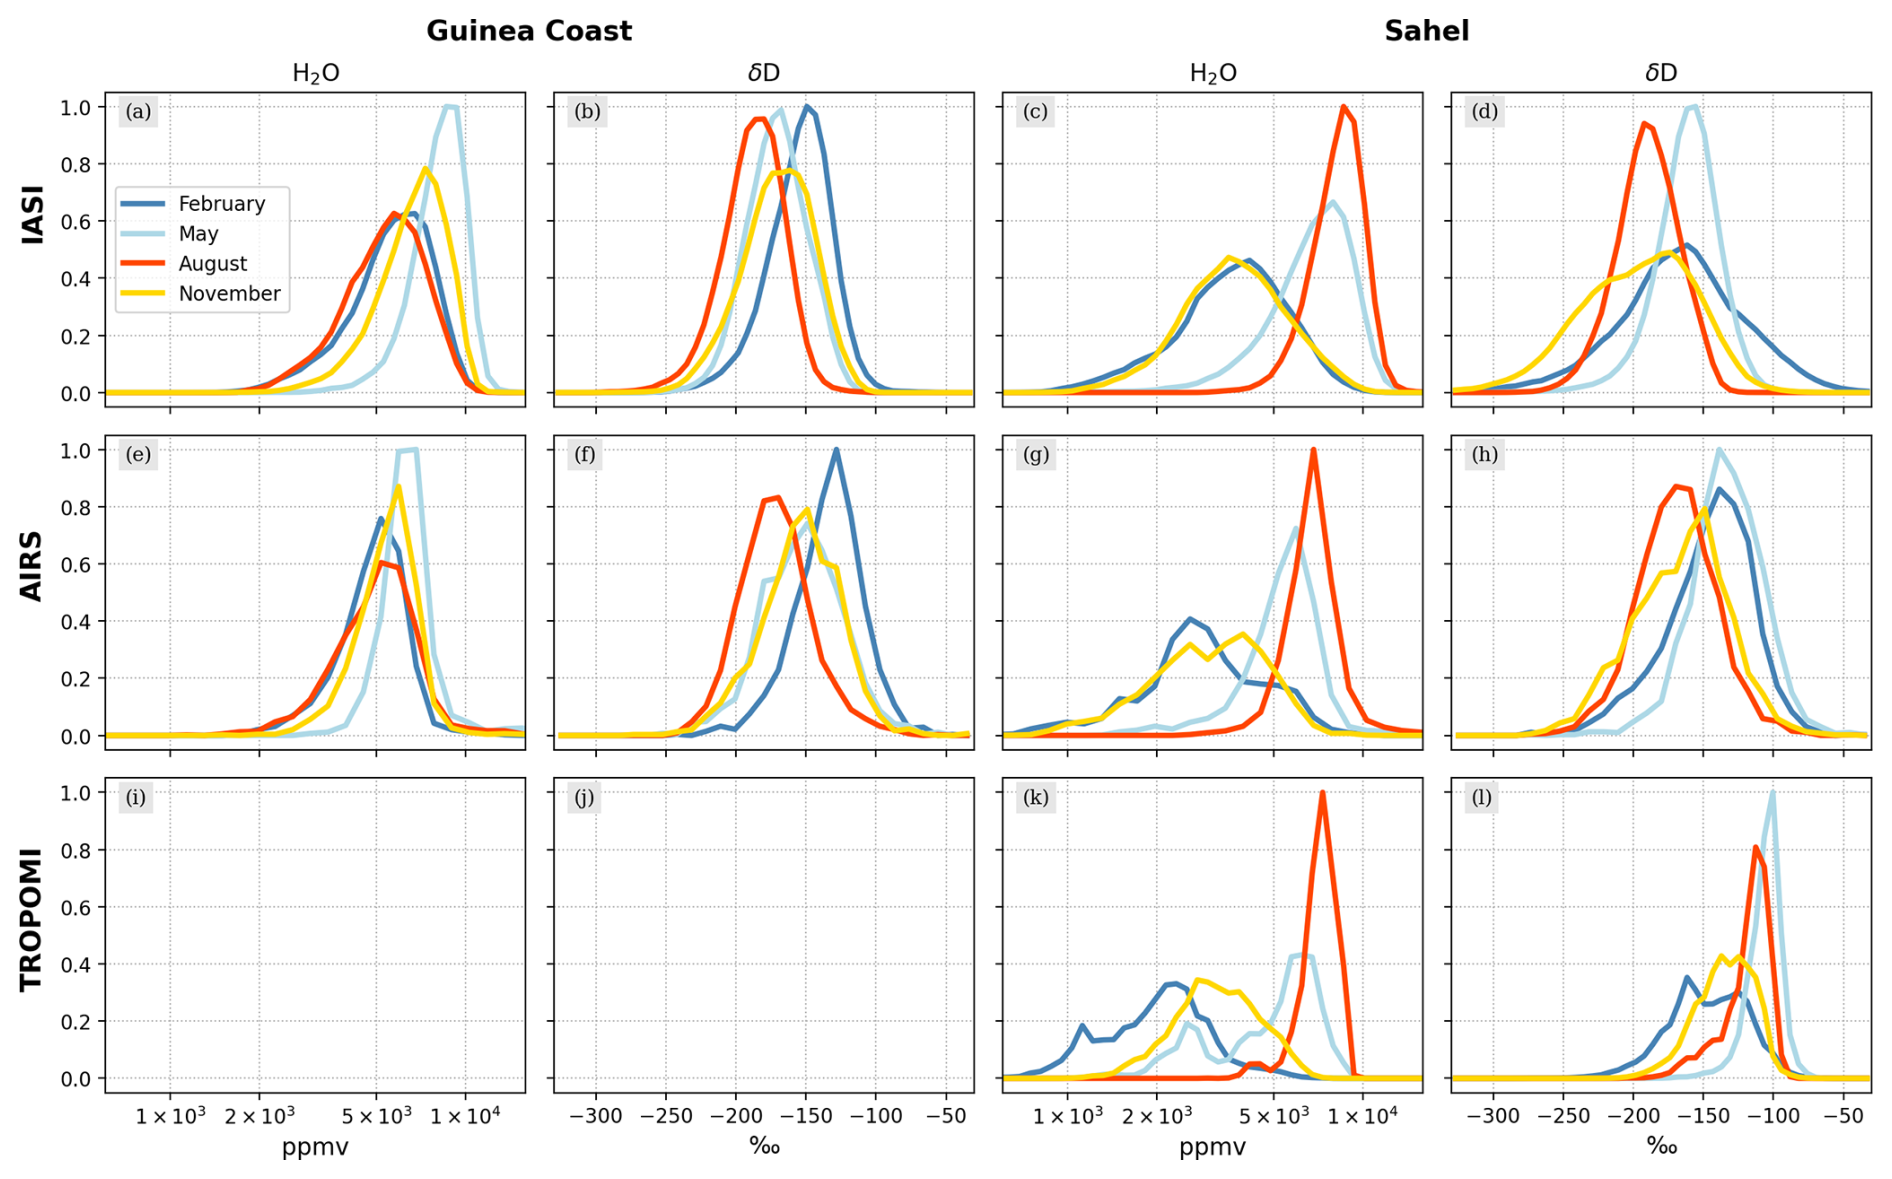
As the next step of cross-comparing the different satellite datasets, we now focus on the distribution shapes of H2O and δD from a qualitative point of view, as shown by the respective probability density functions (PDFs) in Fig. 5. We observe that, in particular, IASI and AIRS show great agreement for both H2O and δD, with the largest discrepancy again for the Sahelian February data. As has been discussed above, IASI reaches significantly lower δD values for dry regimes, which has the effect that the corresponding PDF stretches and flattens compared to AIRS. Furthermore, the TROPOMI PDFs depict overall agreement with IASI and AIRS for H2O, revealing however discrepancies for δD, e.g. in terms of relative PDF positions between February and May and between February and August. This results from the different characteristics of the TROPOMI data being total column products compared to the mid-tropospheric IASI and AIRS products. To better understand such differences with respect to the underlying control processes (see Sect. 2.3), this study will shed light on the paired {H2O, δD} distributions of the three instruments.
2.2 Precipitation products from remote sensing
In order to obtain information about precipitation over West Africa, we make use of the IMERG precipitation dataset, which is a fused product from precipitation estimates retrieved during the TRMM (Tropical Rainfall Measuring Mission) and GPM (Global Precipitation Mission) satellite missions (Huffman et al., 2014). The retrieved precipitation estimates are calibrated with actual rain gauge data on a monthly basis, and the final IMERG precipitation product is available on half-hourly, daily and monthly bases. The daily precipitation product is derived from averaging half-hourly precipitation rates on the considered 0.1° × 0.1° grid and afterwards multiplying the mean precipitation rates (in millimetres per hour) by 24 to obtain daily rates (i.e. millimetres per day) (Huffman et al., 2019). Using long-term series of several rain gauges, Maranan et al. (2020) performed a systematic and process-based validation of the IMERG precipitation product for the West African zone and, hence, demonstrated that IMERG is capable of reproducing the well-known evolution of West African precipitation over the full year.
The high resolution in space and time of the remotely sensed {H2O, δD} pairs from the sensors described in Sect. 2.1.1 allows us to examine the impact of individual convective systems on tropospheric water isotope signals. As the considered IASI, AIRS and TROPOMI datasets are limited to cloud-free scenes, we cannot measure directly the impact of microphysical rain processes occurring within convective cells. Therefore, we utilize the IMERG precipitation dataset to derive a simple clustering method, which allows us to assess whether the observed cloud-free air masses have been affected in their recent history by convective precipitation. In this context, we aim to categorize the available satellite observations as follows: (1) if, within a chosen grid box and on a given calendar day, the daily precipitation summed over the previous 3 d remains below a chosen threshold (here, 0.2 mm d−1), all observations inside this grid box and on the target date are classified as non-rain observations. (2) If, 1 d prior to the given calendar day, a chosen grid box experiences an averaged precipitation rate higher than a chosen threshold (here, 3 mm d−1), all observations within this grid box and on the target date are classified as post-rain. For this purpose, we consider the daily IMERG precipitation data to cluster the daily {H2O, δD} pairs from all three sensors at a target grid size of 1° × 1°. Despite the rather simple nature of this approach (e.g. neglecting effects such as the advection of air masses from adjacent grid boxes, which could be addressed by Lagrangian backward trajectories), the current choice of method and thresholds proves successful in identifying the targeted precipitation states, i.e. persistent dry conditions against convective systems with marked precipitation (see Sect. 3).
By utilizing the results of the precipitation clustering method, we derive a decomposition method that assesses to what extent the non-rain and post-rain clusters may prove useful for explaining year-to-year variations in δD as observed in the satellite datasets. For this purpose, we focus on ΔδD as the overall year-to-year anomaly in δD and decompose it by estimating the contribution of the following control factors per year i:
with
Here, ΔδDr represents the impact of year-to-year anomalies on the fraction of post-rain events, fpost-rain. Analogously, ΔδDnon-rain refers to the contributions to ΔδD due to anomalies in δDnon-rain and to ΔδDpost-rain due to anomalies in δDpost-rain. fnon-rain is the fraction of non-rain events. The variables marked with a bar refer to the averaged value over all of the considered years, and the variables with the subscript i denote the respective values per year. c refers to the residual anomalies in δD that cannot be addressed by the considered clustering method (e.g. the non-rain and post-rain clusters cover only the edge cases of precipitation rates and not the range in between) and, hence, is not part of this study. Consequently, the described decomposition method will not provide a complete view of year-to-year anomalies in δD but will focus on the separate contributions of the described control factors.
2.3 Process curves in the {H2O, δD} phase space
Furthermore, we make use of idealized process curves derived by Noone et al. (2011) that help interpret observed {H2O, δD} pair distributions with respect to the underlying dynamical and microphysical processes. In particular, Diekmann et al. (2021b) applied these process curves to describe characteristic {H2O, δD} pair variations with respect to processes representative of the WAM (see Fig. 6). (1) The hyperbolic curves indicate characteristic {H2O, δD} signals due to mixing of dry and depleted and humid and enriched air masses. (2) The Rayleigh lines mark the depletion in δD according to condensation and subsequent moisture removal by rainout. If evaporation and equilibration occur on top of a Rayleigh process, enhanced depletion in δD takes place and leads to the so-called super-Rayleigh regime below the Rayleigh lines (3). This is found to be particularly pronounced over the Sahel during the WAM season, when well-organized convective systems such as squall lines lead to intense convective rainfall.
Throughout this study, the idealized curves identified in Diekmann et al. (2021b) will provide a process-based interpretation context for the {H2O, δD} pair variability as observed by the remote sensing sensors.
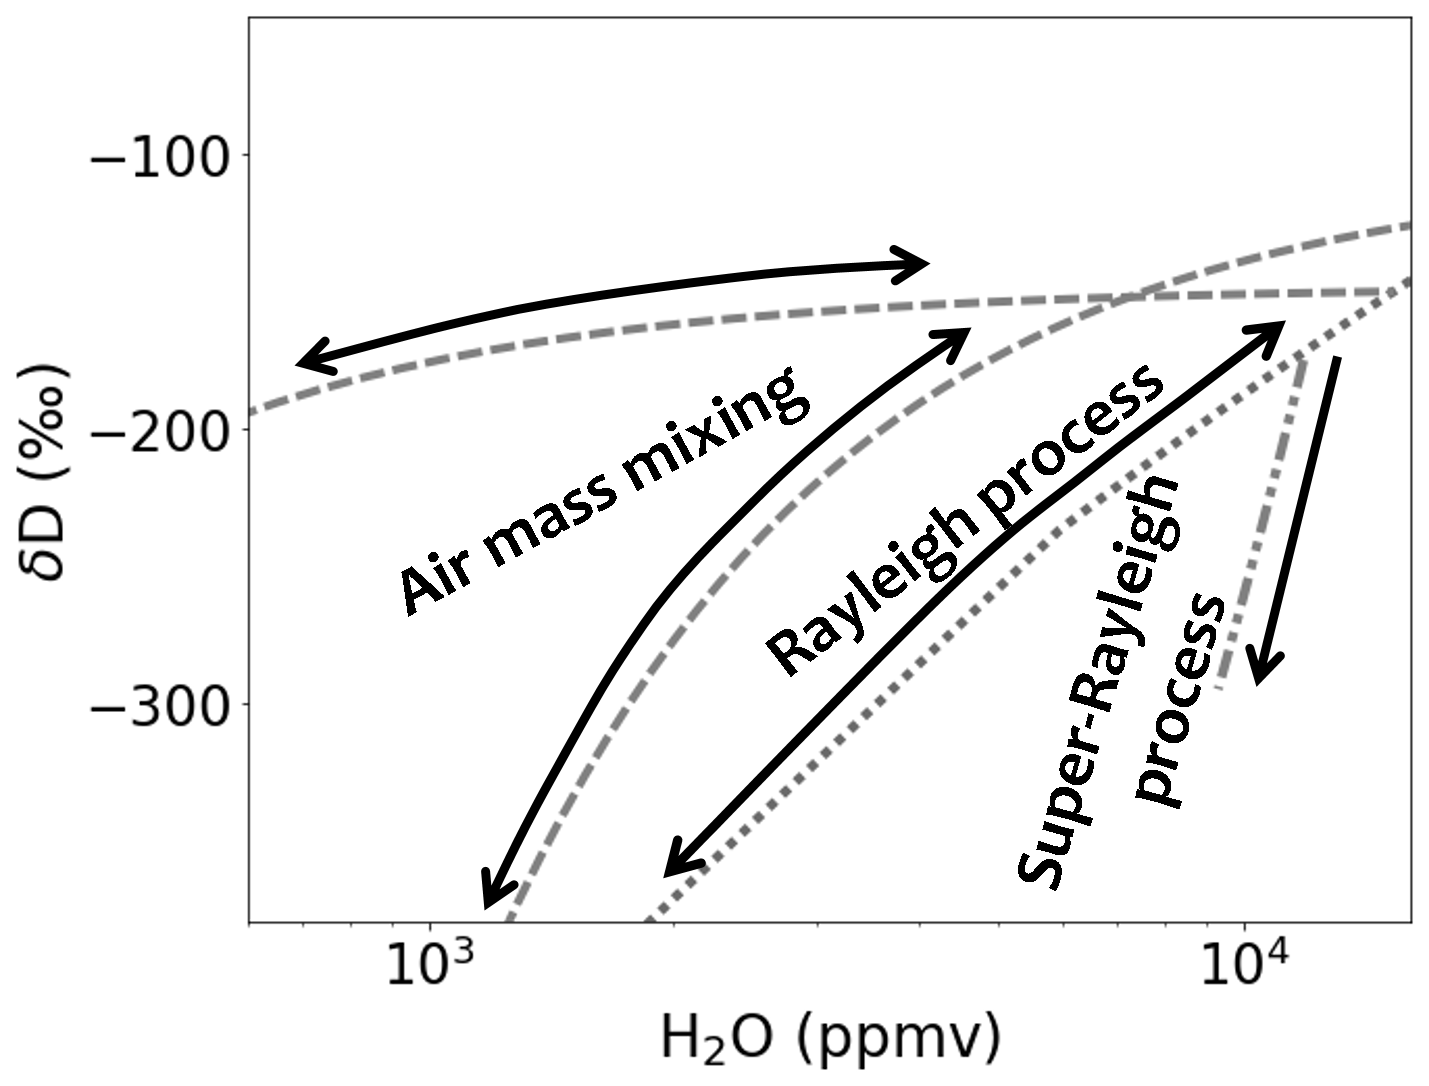
Figure 6Theoretical process curves describing effects of idealized dynamical and microphysical processes in the {H2O, δD} phase space. The curves are defined as described in Diekmann et al. (2021b): the hyperbolic mixing curves are representative of dry and moist air mass mixing processes over West Africa, considering the mixing members x0= [50 ppmv, −700 ‰] and x1= [15 300 ppmv, −120 ‰] for the dry mixing curve (upper curve) and x0= [100 ppmv, −450 ‰] and x1= [22 000 ppmv, −120 ‰] for the moist mixing curve (lower curve). The Rayleigh curve results from a Rayleigh process with initial conditions ‰, RH =90 % and T0=30 °C. The super-Rayleigh curve has been defined in order to represent signals due to rain evaporation and equilibration as found along backward air trajectories by Diekmann et al. (2021b).
In the first step, we aim to address the variability of the spaceborne {H2O, δD} pair observations with respect to microphysical processes that are associated with convection on a daily event basis. It applies the clustering method from Sect. 2.2 to the {H2O, δD} data from IASI, AIRS and TROPOMI to identify those observations that were impacted by considerable monsoon precipitation and to contrast them with largely dry instances. In the following, this is done for a case study focusing on the 2016 season and additionally for a statistical multi-year analysis.
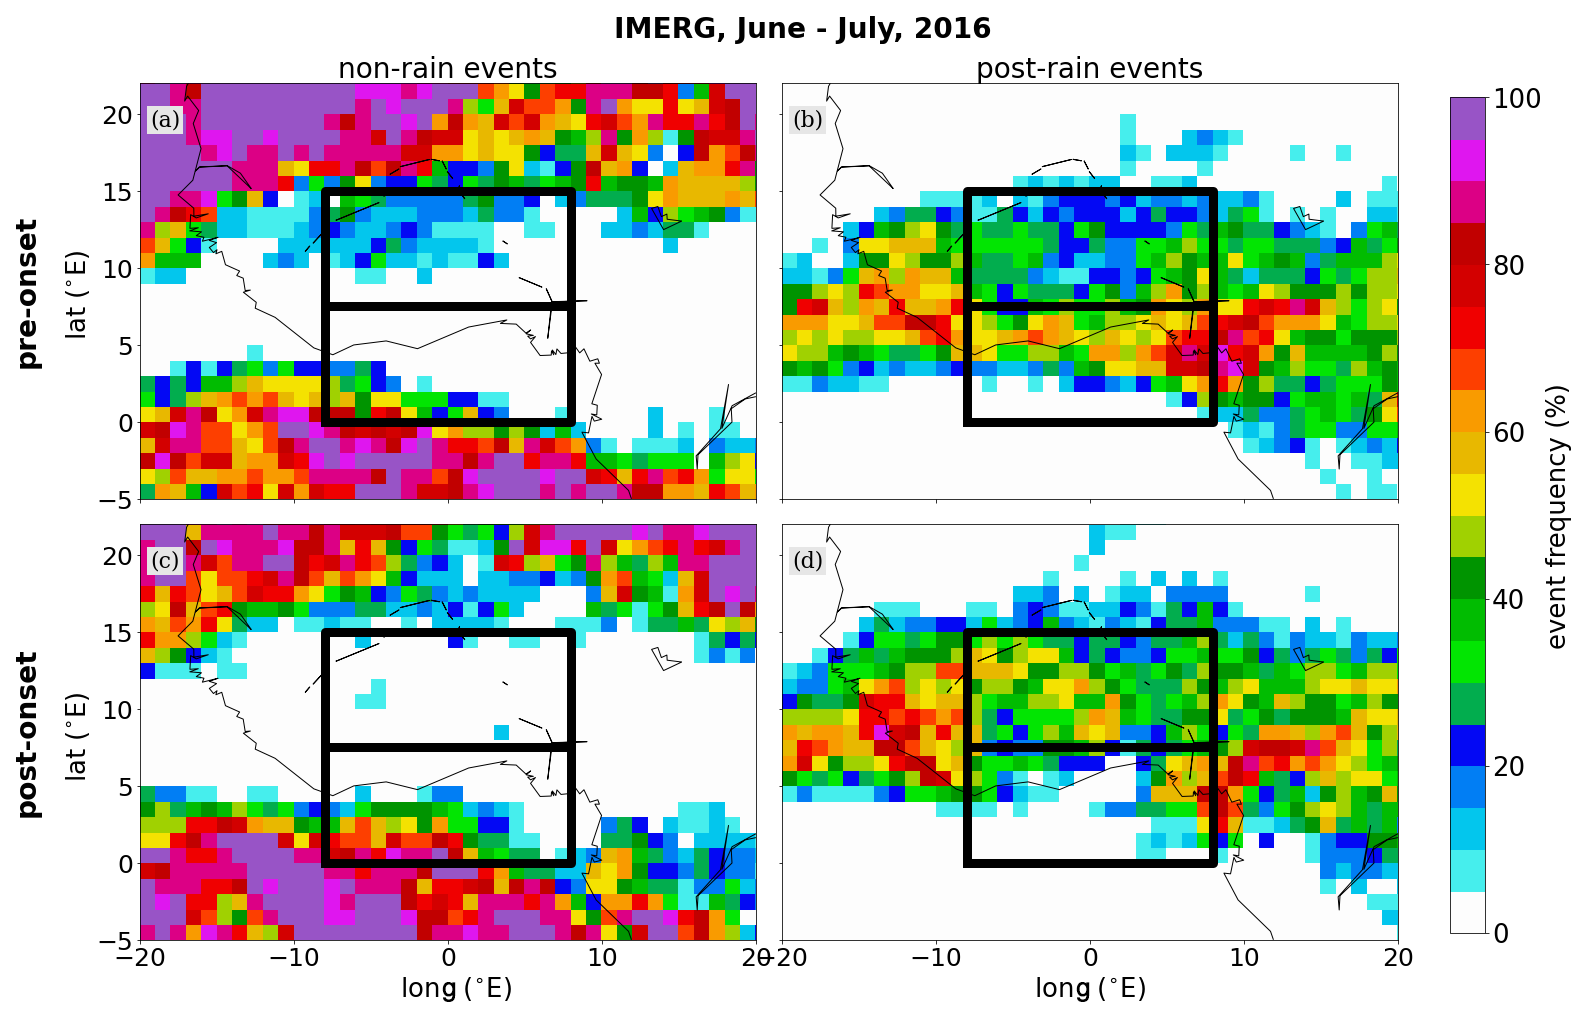
Figure 7Fraction of days marked as (a, c) non-rain and (b, d) post-rain events for the pre-onset and post-onset phases of the WAM between June and July 2016 (with the monsoon onset occurring on 22 June 2016), derived by considering the daily averaged precipitation from the half-hourly IMERG precipitation dataset and evaluated on a 1° × 1° grid. The black-framed boxes depict the chosen target domains over the Guinea coast and the Sahel.
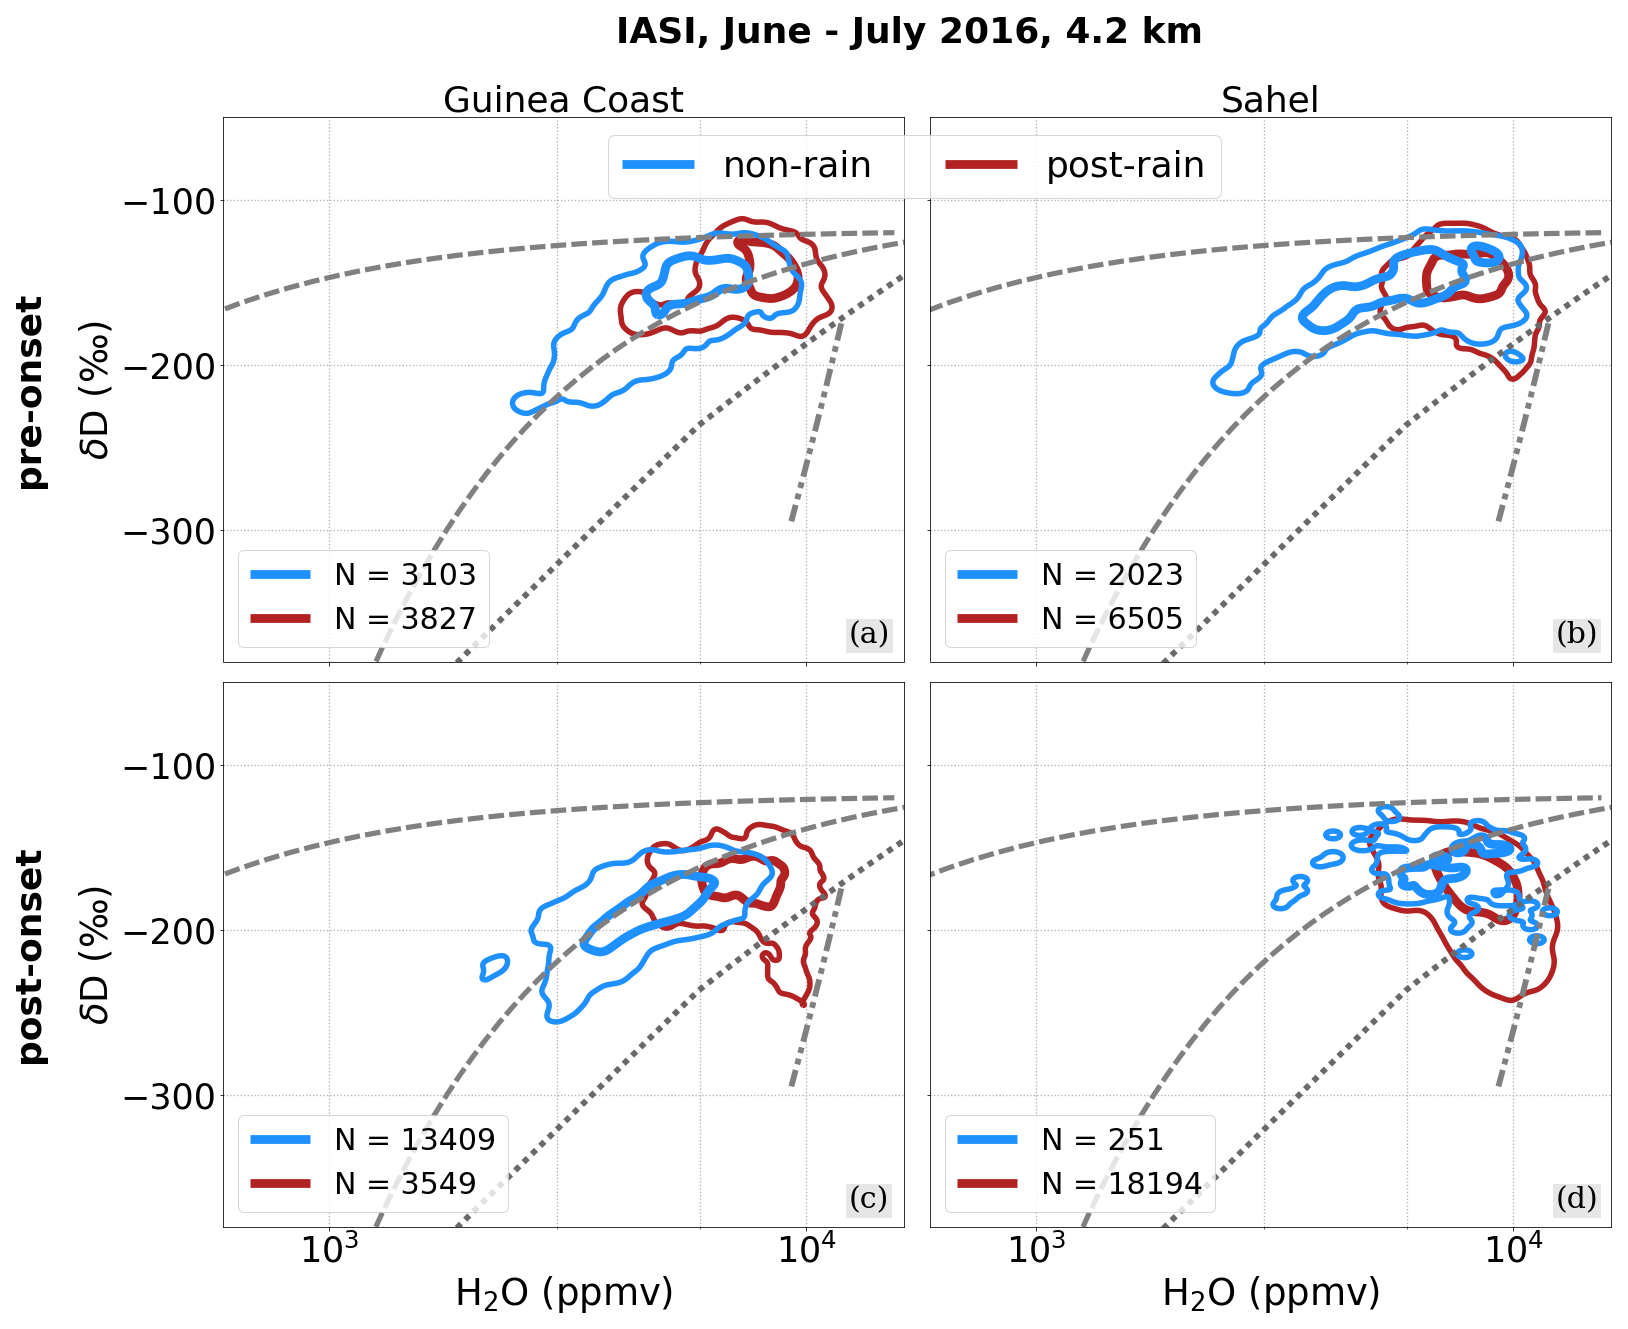
Figure 8IASI {H2O, δD} pair data over the Guinea coast and the Sahel for the pre-onset and post-onset WAM phases between June and July 2016 (monsoon onset on 22 June 2016), clustered into non-rain and post-rain events based on daily averaged precipitation from IMERG. The {H2O, δD} pair data are summarized by normalized two-dimensional histogram contours, with the contours indicating the main 95 % and 50 % samples of the respective data points and with the corresponding total data numbers given in the legend (calculated according to Eckstein et al., 2018).
3.1 Rain analysis of the 2016 West African Monsoon
We demonstrate the basic concept of the clustering approach through non-rain and post-rain events and evaluate it on a case-study basis using the IASI data from the West African Monsoon in 2016. This specific monsoon season was the key subject of the multi-platform DACCIWA campaign (Knippertz et al., 2017), where data were collected over the period June–July 2016 in order to characterize the monsoon system from synoptic, microphysical, dynamical and aerosol perspectives. In this framework, the onset of the monsoon activity was defined according to the northwards shift in precipitation from the Guinea coast to the Sahel and was set to 22 June 2016. Based on this, we separate the period into the pre-onset (1–21 June 2016) and post-onset (22 June–31 July 2016) phases, with the aim of further underlining the impact of the WAM activity on the {H2O, δD} pairs.
Figure 7 provides a horizontal overview of the relative fraction of days that are identified as non-rain or post-rain events during the pre-onset and post-onset phases, for each considered 1° × 1° grid box over West Africa. Overall, this clustering appears to successfully capture the areas associated with strong precipitation. It reflects the onset criterion for the WAM activity well. That is, before the onset, the predominance of precipitation is located over the Guinea coast, with occasional convective events over the Sahel, while after the onset the precipitation maximum moves to the Sahel. The post-onset phase leaves the Guinea coast mostly rain-free, with regional exceptions for its easternmost areas, where around the coasts of Nigeria and Cameroon a localized and persistent precipitation peak prevails (e.g. as discussed in Nlend et al., 2020).
Figure 8 shows the IASI {H2O, δD} distributions sorted into non-rain and post-rain clusters for the phases before and after the monsoon onset. During the pre-onset phase, both regions feature a considerable number of events for both the non-rain and post-rain classes. It becomes apparent that the non-rain events from both the Guinea coast and the Sahel consistently evolve along the mixing line, which is in line with our understanding that no microphysical interactions have occurred and that the respective air masses are instead dominated by mixing. As discussed in the trajectory study of Diekmann et al. (2021b), air masses of different origins meet over West Africa, i.e. mainly the moist southerly monsoon flow from the Gulf of Guinea, the dry Saharan northerly winds and the dry intrusions from the upper troposphere.
As a response to the formation of strong precipitation systems over the Guinea coast, we observe that the corresponding {H2O, δD} pairs mainly move up the mixing line to higher H2O and δD regimes with no observable Rayleigh and super-Rayleigh features. This can be explained by the fact that rain evaporation is reduced for more intense precipitation events (Dansgaard, 1964). As large raindrops fall faster, there is less time for evaporation, leading to less depletion of the ambient vapour (Stewart, 1975). Additionally, the rainfall over the Guinea coast appears to be sufficiently large-scale and persistent such that the moist updrafts lead to a significant moistening of the free troposphere, which in turn leads to high relative humidity and thus further reduces the rain evaporation efficiency (Risi et al., 2008a; Lee and Fung, 2008; Yoshimura et al., 2010).
In contrast, over the Sahel, a noticeable pull towards the rain-evaporation-driven super-Rayleigh regime stands out, forming a clearly anti-correlated relation between H2O and δD. The precipitation events appear to be less intense than over the Guinea Coast (see Fig. 7), but over the Sahel strong intrusions from the Sahara and the upper troposphere transport dry and unsaturated air masses into the troposphere, hence increasing the rain evaporation efficiency. This effect intensifies during the post-onset phase, when precipitation is mainly driven by westward-propagating convective events, so-called squall lines that induce strong convective precipitation on the leading edge of the system and moderate precipitation below the trailing stratiform cloud shield (e.g. Risi et al., 2008b, 2010b; Lafore et al., 2017; Diekmann et al., 2021b). The latter is characterized by smaller raindrops that, as discussed above, generally have a higher rain evaporation efficiency. Additionally, such squall line systems are driven by a rear-to-front inflow (usually connected to the African Easterly Jet), which feeds dry and unsaturated air to middle and lower levels below the stratiform rain region and thus further increases the efficiency of rain evaporation. In this way, squall lines exert a strong fractionating effect on the West African troposphere, which is reflected in clear super-Rayleigh features in the post-rain {H2O, δD} pairs over the Sahel and slightly over the Guinea coast after the monsoon has set in. This is in agreement with Diekmann et al. (2021b), who attributed this super-Rayleigh regime to microphysical rain processes within the melting zone of a convective system, i.e. the evaporation of falling raindrops in unsaturated areas as well as the equilibration between water vapour and relatively depleted raindrops formed from melting snow for saturated conditions (see also Risi et al., 2021).
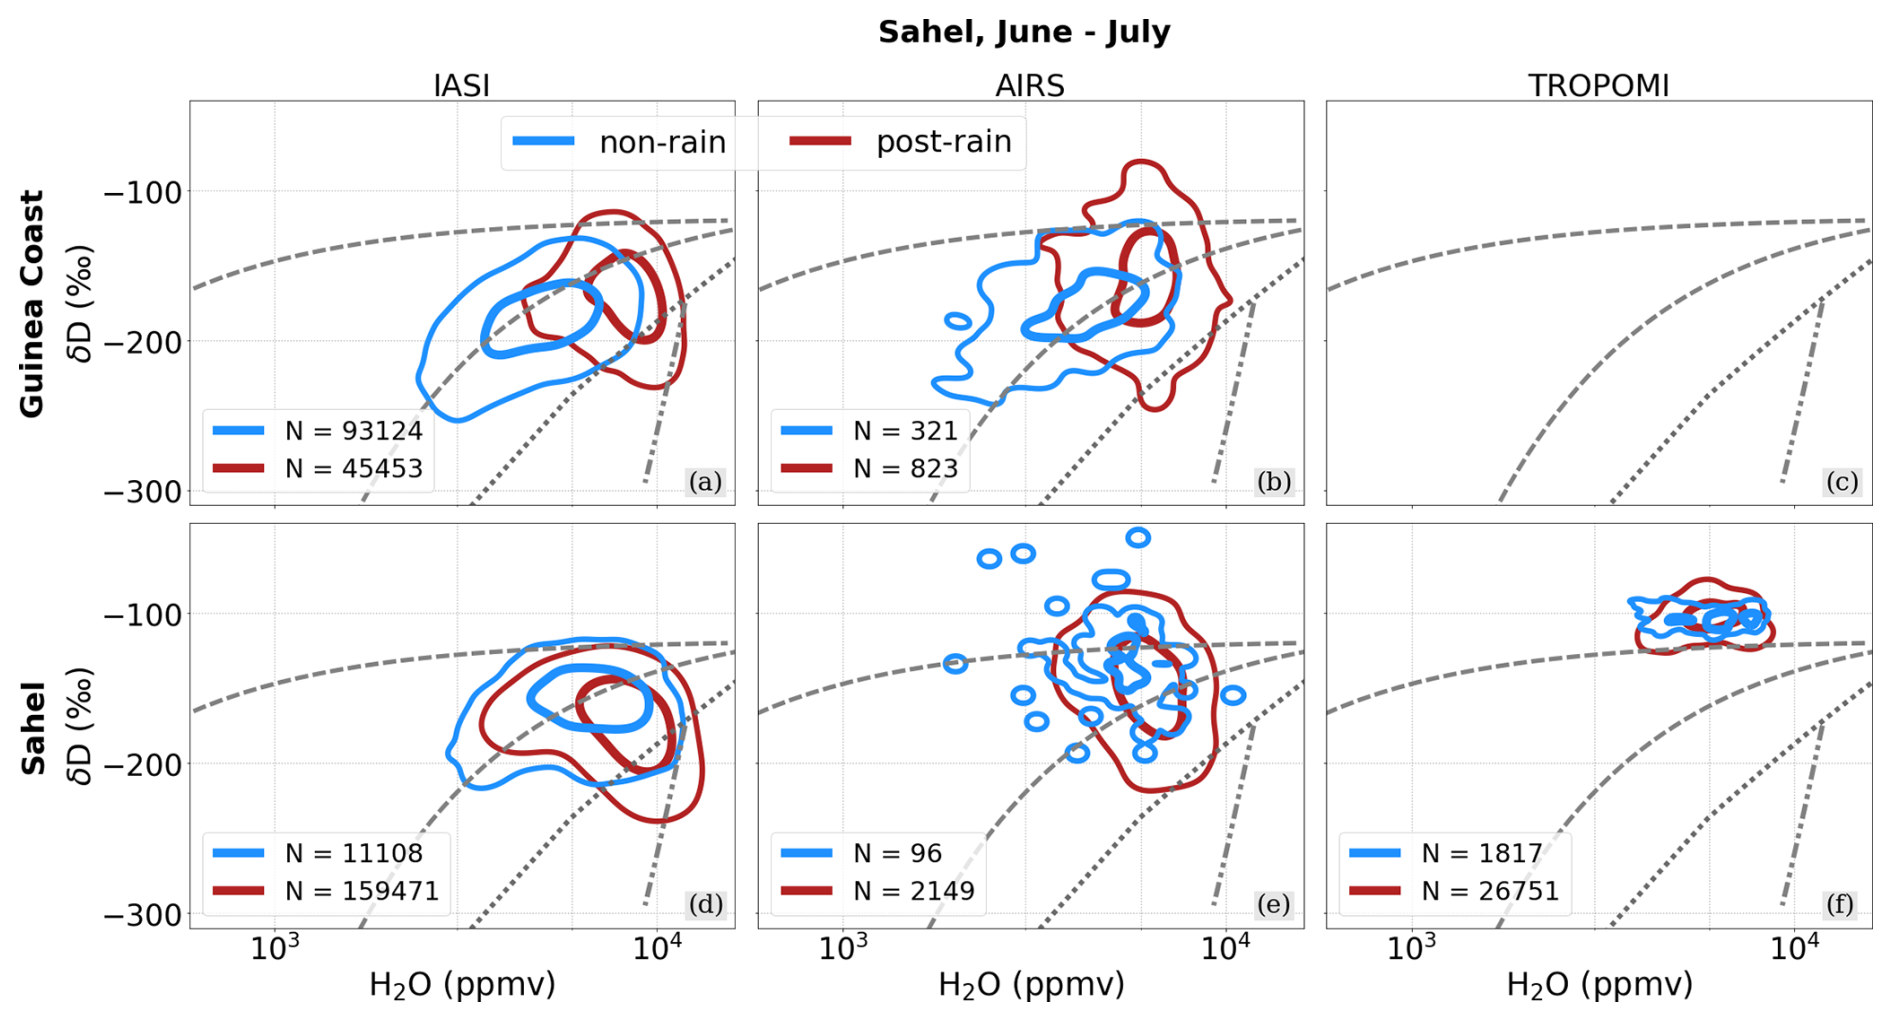
Figure 9{H2O, δD} pair data from IASI and AIRS over the Guinea coast (a, b) and from IASI, AIRS and TROPOMI over the Sahel (d, e, f) as averages for June–July for the respective available years (see Table 1), clustered into non-rain and post-rain events based on daily averaged precipitation from IMERG and with the contours depicting the distribution of the main 95 % and 50 % scatter points.
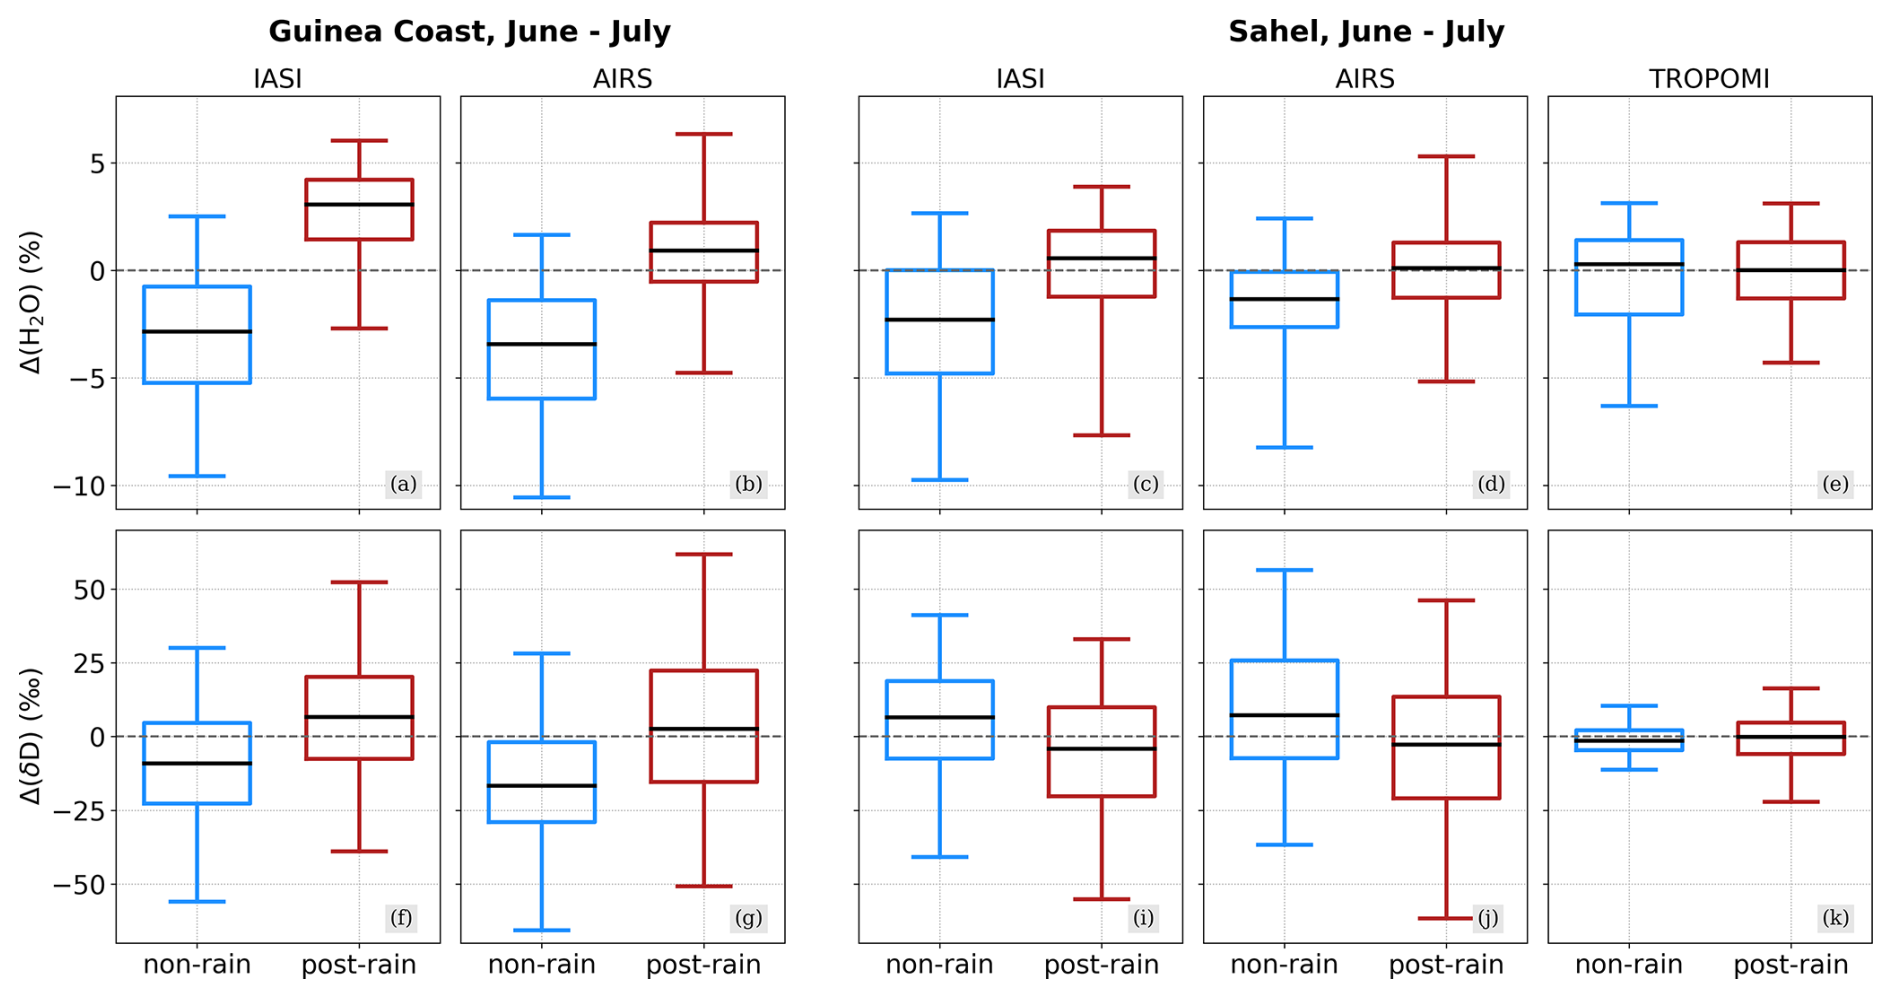
Figure 10Boxplots evaluating the distributions of H2O and δD for the non-rain and post-rain clusters during June and July for the respective available years from IASI (a, c, f, i), AIRS (b, d, g, j) and TROPOMI (e, k); see Table 1. The boxes extend from the lower- to upper-quartile values, with the middle line depicting the median. The whiskers mark the lower and upper 2.5 percentiles of the underlying distributions. The H2O (evaluated using the natural logarithm) and δD values are given as differences from the corresponding instrument-specific average over the full available period (see Table 1).
3.2 Multi-year analysis
After characterizing the predominant control processes of the IASI {H2O, δD} pairs during June–July with respect to the monsoon onset during 2016, the objective of this section is to provide a statistically more robust view of the observed convection-related {H2O, δD} features. For this purpose, we now aim for a multi-annual view of {H2O, δD} signals from the June–July average clustered for the non-rain and post-rain events and evaluated for all available data for all three sensors, i.e. IASI, AIRS and TROPOMI (see Table 1). The {H2O, δD} pairs collected and clustered for the Guinea coast and the Sahel are shown in Fig. 9, except for TROPOMI over the Guinea coast (see Fig. 1). The corresponding boxplots for H2O and δD of the non-rain and post-rain clusters (shown in Fig. 10) serve to add a more quantitative perspective of the differences between the signals from the two clusters.
It becomes apparent that the characteristic {H2O, δD} signals of the two rain clusters identified for IASI during 2016 (Fig. 8) persist as robust features over the multi-annual perspective for both IASI and AIRS: while the Guinea coast experiences an overall increase in both H2O (around 5 %) and δD (15 ‰–25 ‰) along the mixing curves when comparing the non-rain and post-rain events, the Sahel develops the previously discussed anti-correlated {H2O, δD} features towards the super-Rayleigh regime as a robust response to convective monsoon precipitation (1.5 %–3 % increase in H2O, 10 ‰–25 ‰ decrease in δD).
In contrast to the vertically resolved data products from IASI and AIRS, TROPOMI does not exhibit such a clear distinction between the non-rain and post-rain events over the Sahel but rather experiences a broadening of the {H2O, δD} distribution along the δD dimension. Accordingly, we find that the boxplots of the non-rain and post-rain classes shown in Fig. 10 reveal a high level of agreement in terms of their mean values. This is contrary to various studies that have documented significant drying and depletion of near-surface air after the passage of a convective squall line event as result of dry rear-to-front downdrafts (e.g. Tremoy et al., 2012, 2014; Lafore et al., 2017; Torri, 2022; Risi et al., 2023). The resulting warm and dry air near the surface enhances the evapotranspiration of surface water, which is associated with enrichment in δD (Noone, 2012; Worden et al., 2021) and may thus accelerate the recovery of water vapour after the convective event. The advection of moist air masses due to the monsoon flow from the tropical Atlantic into the Sahel further fosters the recovery of the post-storm near-surface air (Lafore et al., 2017). Therefore, we assume that rapidly recovering water vapour may hamper the capability of the clustering to capture actual post-rain conditions (e.g. super-Rayleigh signals that are typical of an atmosphere affected by convection) when applying it to TROPOMI and defining the post-rain events by means of the precipitation from the previous day. Instead, a higher temporal frequency would be beneficial for creating more direct links between individual convective systems and collocated TROPOMI data.
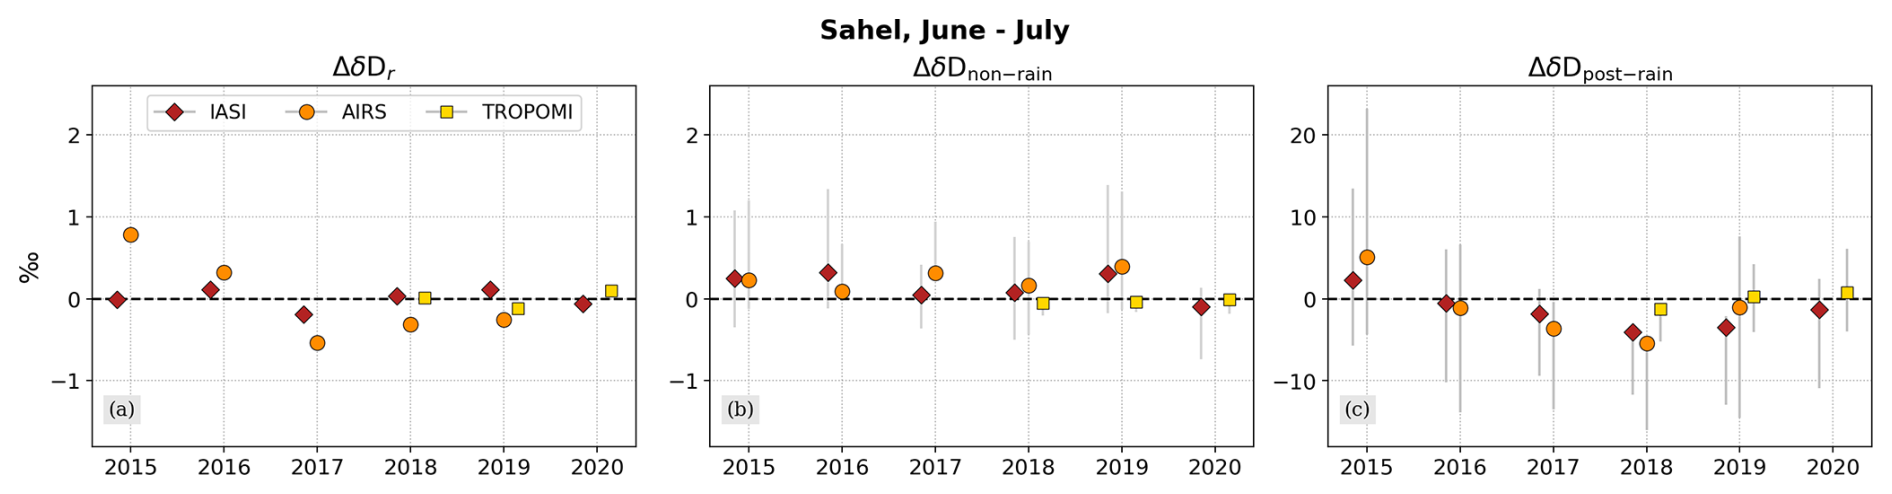
Figure 11Results from the decomposition analysis to characterize the impact of the anomalies in rain fraction (a), non-rain events (b) and post-rain events (c) on the overall δD anomalies for IASI, AIRS and TROPOMI for the respective available years. The scatters represent the mean values of the respective anomaly contributions and the grey bars denote the 1σ spread around the mean (only plotted for non-rain and post-rain events). The ranges of the y axes have been selected individually with respect to the data variability per sub-figure. A detailed description of the decomposition method is given in Sect. 2.2.
3.3 Decomposition of multi-year δD anomalies
From Fig. 10 we can estimate the parameters required to apply the decomposition method for year-to-year anomalies in δD, as described in Sect. 2.2. In particular, this includes the δD values for the individual years, the multi-year average for the non-rain and post-rain clusters and the per-year and averaged fractions of non-rain and post-rain events. The δD anomalies resulting from variations in rainfall fraction (ΔδDr) as well as from variations in δD for non-rain and post-rain events are shown by instrument and year in Fig. 11.
The results indicate that, for the considered years, the anomalies in the δD of the post-rain situations exhibit high year-to-year variability in the overall δD anomaly, while the respective anomalies in rainfall fractions in δDnon-rain show only minor relative contributions to ΔδD. Since the latter implies that rainfall fraction has been overall stable during the considered time period, this leads us to conclude that the strong variations in δDpost-rain result from convective events with varying intensities in terms of e.g. precipitation rates and dry air intrusions. The differences in ΔδDpost-rain observed between IASI and AIRS may arise from the different samplings. With the spatial coverage of AIRS being much lower than IASI, this makes the statistical analysis of AIRS more sensitive to outliers, while for IASI the results become smoother. This would explain why for positive ΔδDpost-rain values AIRS is higher than IASI and why for negative values it generally appears lower.
The overall low contributions of δDnon-rain to ΔδD in all three datasets are driven by the much lower fraction of non-rain events compared to post-rain events (see Fig. 7).
Discussion of the clustering method
This section demonstrates that the rather simple and observation-based clustering approach allows us to successfully identify observations with and without substantial impacts due to convective precipitation and, in addition, to clearly distinguish between them in the {H2O, δD} phase space, in alignment with the characteristic signals due to air mass mixing and microphysical rain–vapour interactions.
The main outcome of this analysis is that it reveals significant regional differences in how convective events impact the {H2O, δD} pair variability, i.e. whether they have an enriching or depleting effect on mid-tropospheric δD. Thus, a promising perspective for strengthening the value of the clustering results would be to characterize post-rain clusters as a function of precipitation rates, with the aim of addressing the role of convection type in the isotopic composition of tropospheric water vapour. Maranan et al. (2018) found that convection over southern West Africa may form in various types, ranging from highly organized mesoscale convective systems to small-sized isolated systems. Furthermore, Galewsky et al. (2023) linked such differences in convective aggregation to features in δD from IASI. They found that highly aggregated convective systems are characterized by mostly moderate precipitation and less pronounced δD depletion in tropospheric water vapour, whereas un-aggregated convection with strong precipitation is associated with more depleted δD signals. This somewhat contradicts the result from our cluster analysis as well as from other studies (Risi et al., 2008b; Tremoy et al., 2014; Diekmann et al., 2021b) that mid-tropospheric δD appears relatively more depleted after the passage of Sahelian squall lines. While squall lines are highly organized systems and, hence, represent aggregated convection, they are associated with deep convective precipitation on the leading edge, followed by a trailing stratiform cloud shield with moderate precipitation. Thus, this demonstrates that more refined methods are required to achieve a more comprehensive view of convection and its impact on δD, e.g. by combining methods addressing convective aggregation (such as from Galewsky et al., 2023) and convective depth (e.g. by introducing further and specifically tailored rainfall selection criteria into our clustering method).
Furthermore, we have placed the focus of the clustering method on the monsoon onset phase, with the aim of characterizing the impact due to convection as opposed to the impact due to air mass mixing. Therefore, another interesting direction for future studies would be to investigate whether the clustering method would provide the same results for the monsoon retreat phase or whether asymmetries would appear, e.g. due to different land–sea contrasts during the different seasons and seasonal mean state differences. For instance, Diaconescu et al. (2015) showed that atmospheric models and reanalyses have significant differences in performance when reproducing the monsoon onset and retreat. Due to the impact of convection, simulating the monsoon onset remains a key challenge for the models, while the modelled retreat phase is more in line with observational datasets. This points to differences in the main processes controlling the atmospheric state over the Sahel, and, for this purpose, our clustering method would be valuable for evaluating to what extent dynamical and microphysical processes change from an isotopic perspective when compared to the onset.
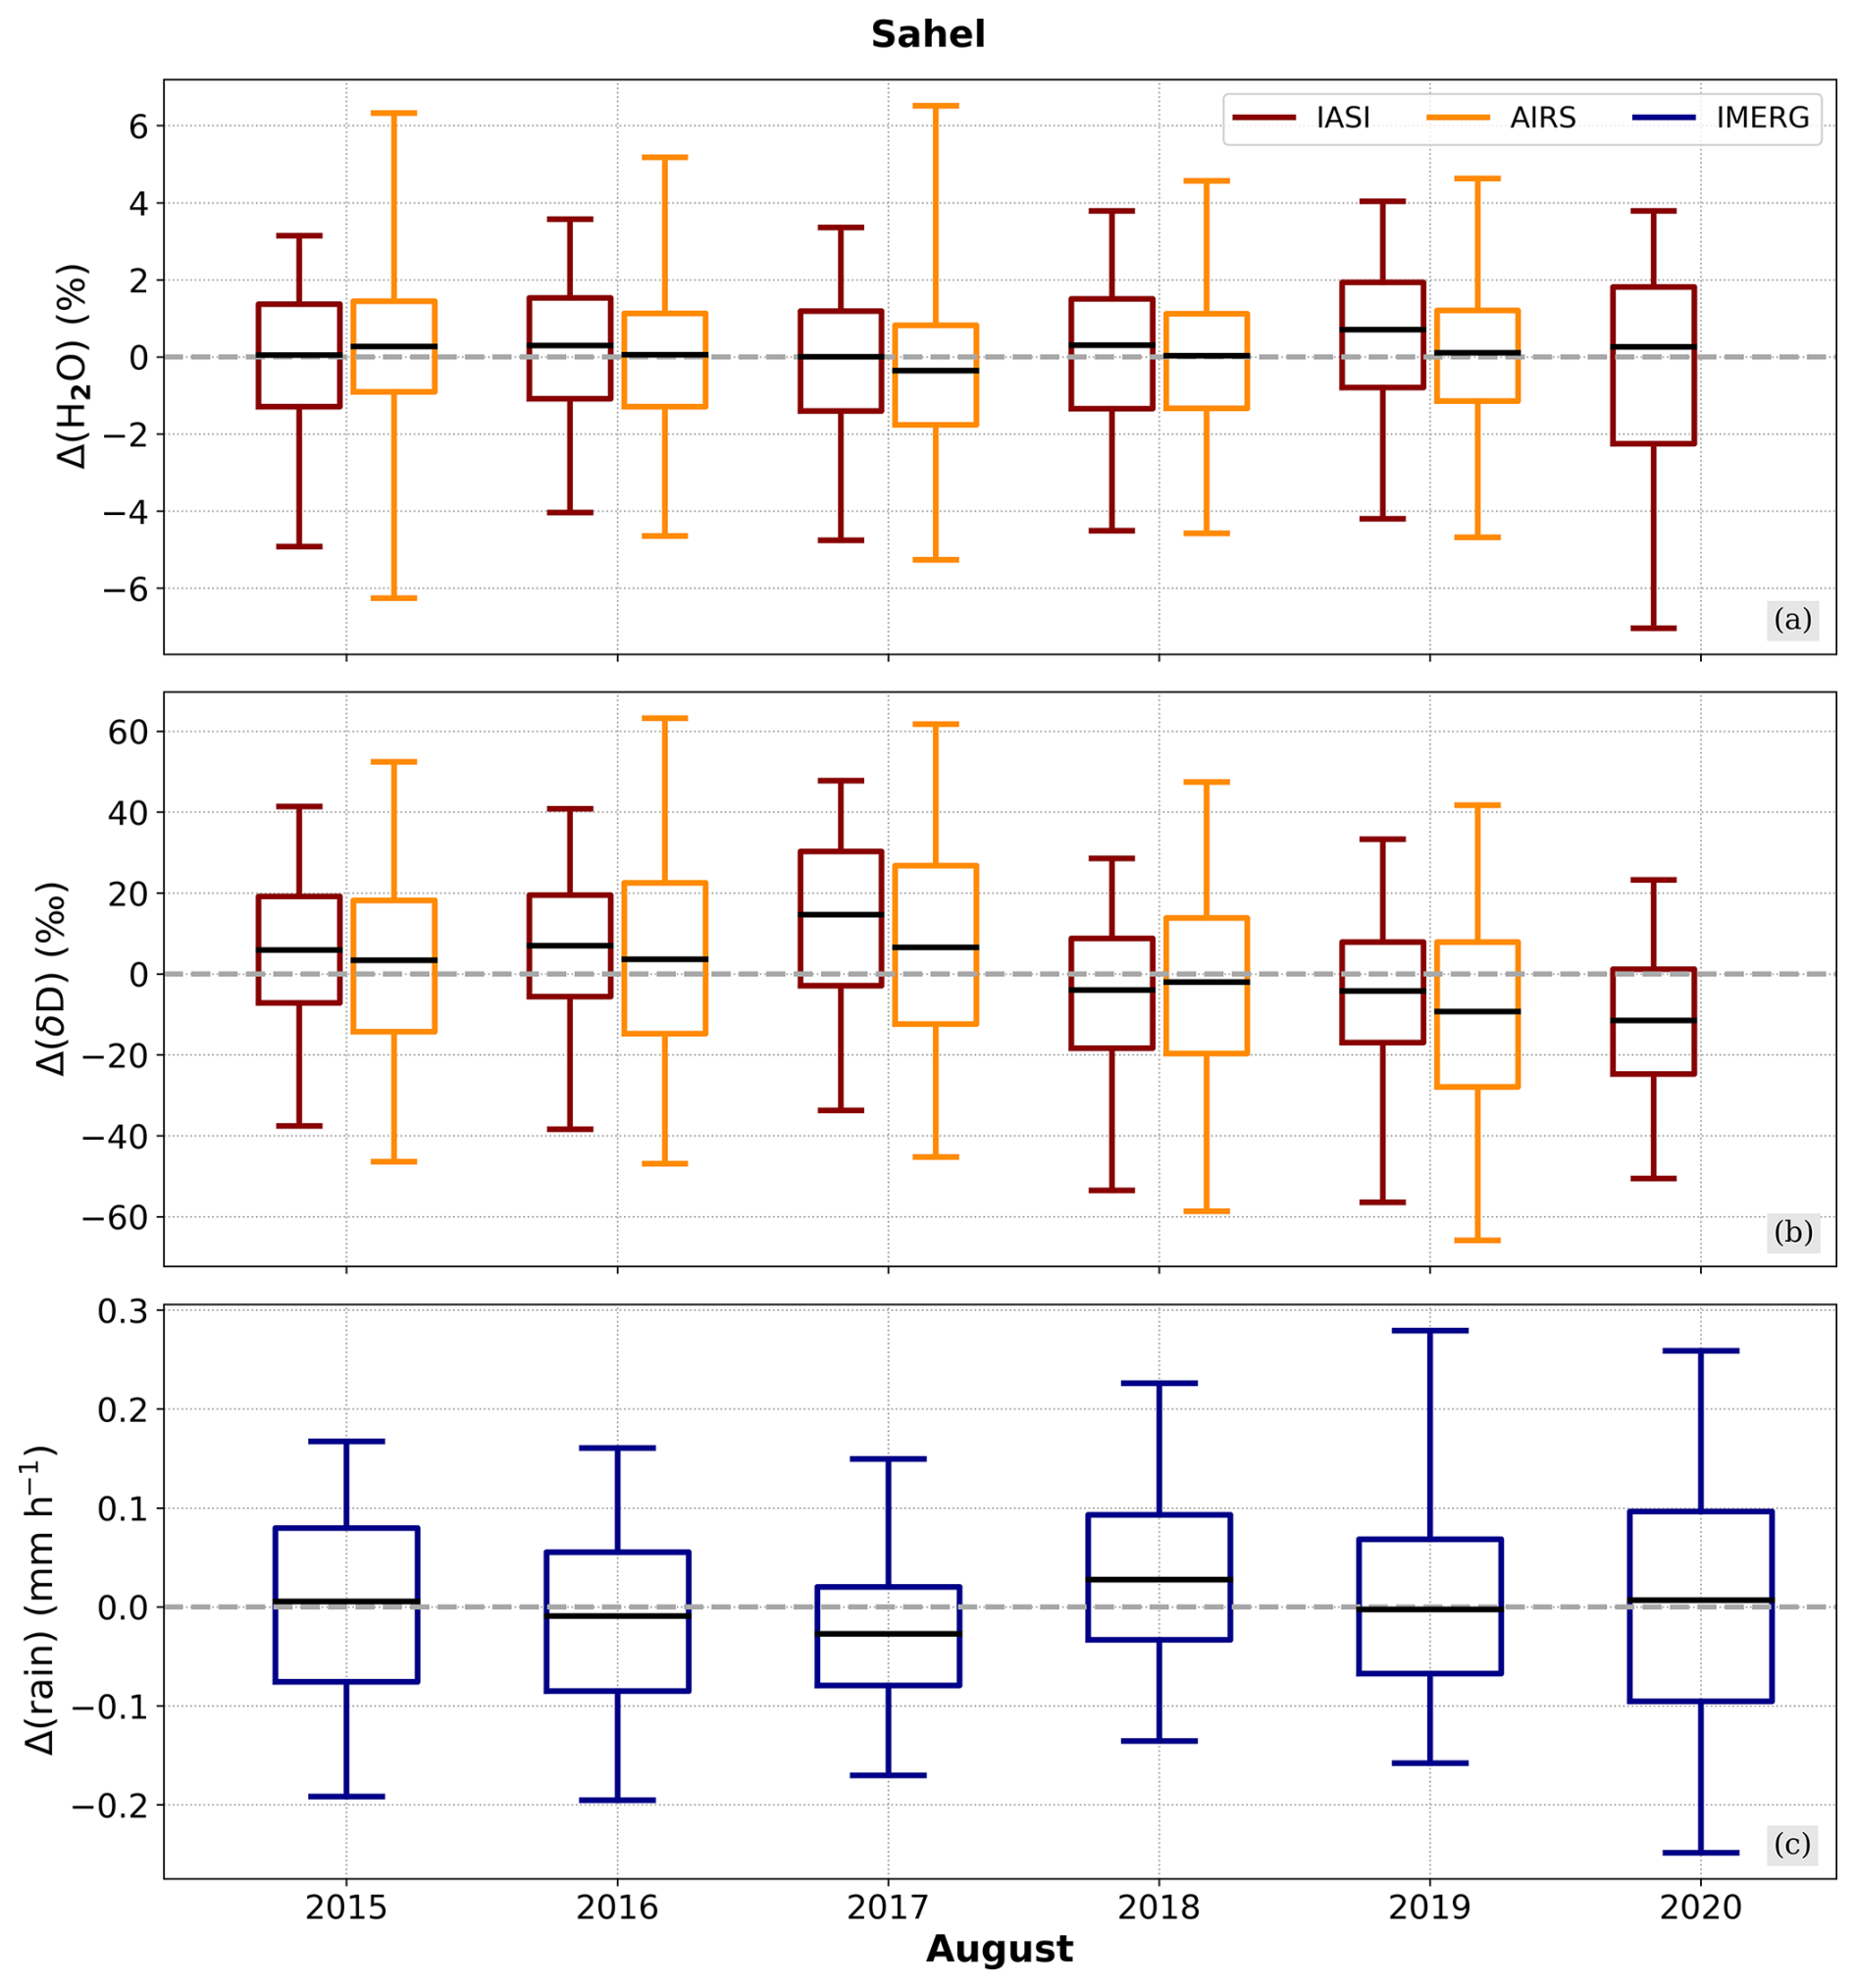
Figure 12Boxplots evaluating the August distributions of H2O and δD from IASI and AIRS (red and orange boxes, shown in panels a, b) and precipitation from IMERG (blue boxes in panel c). The boxes extend from the lower to upper quartiles, with the middle line depicting the median. The whiskers mark the lower and upper 2.5th percentiles. The H2O (evaluated using the natural logarithm), δD and precipitation distributions are given as differences from the corresponding instrument-specific averages over the full available period (see Table 1).
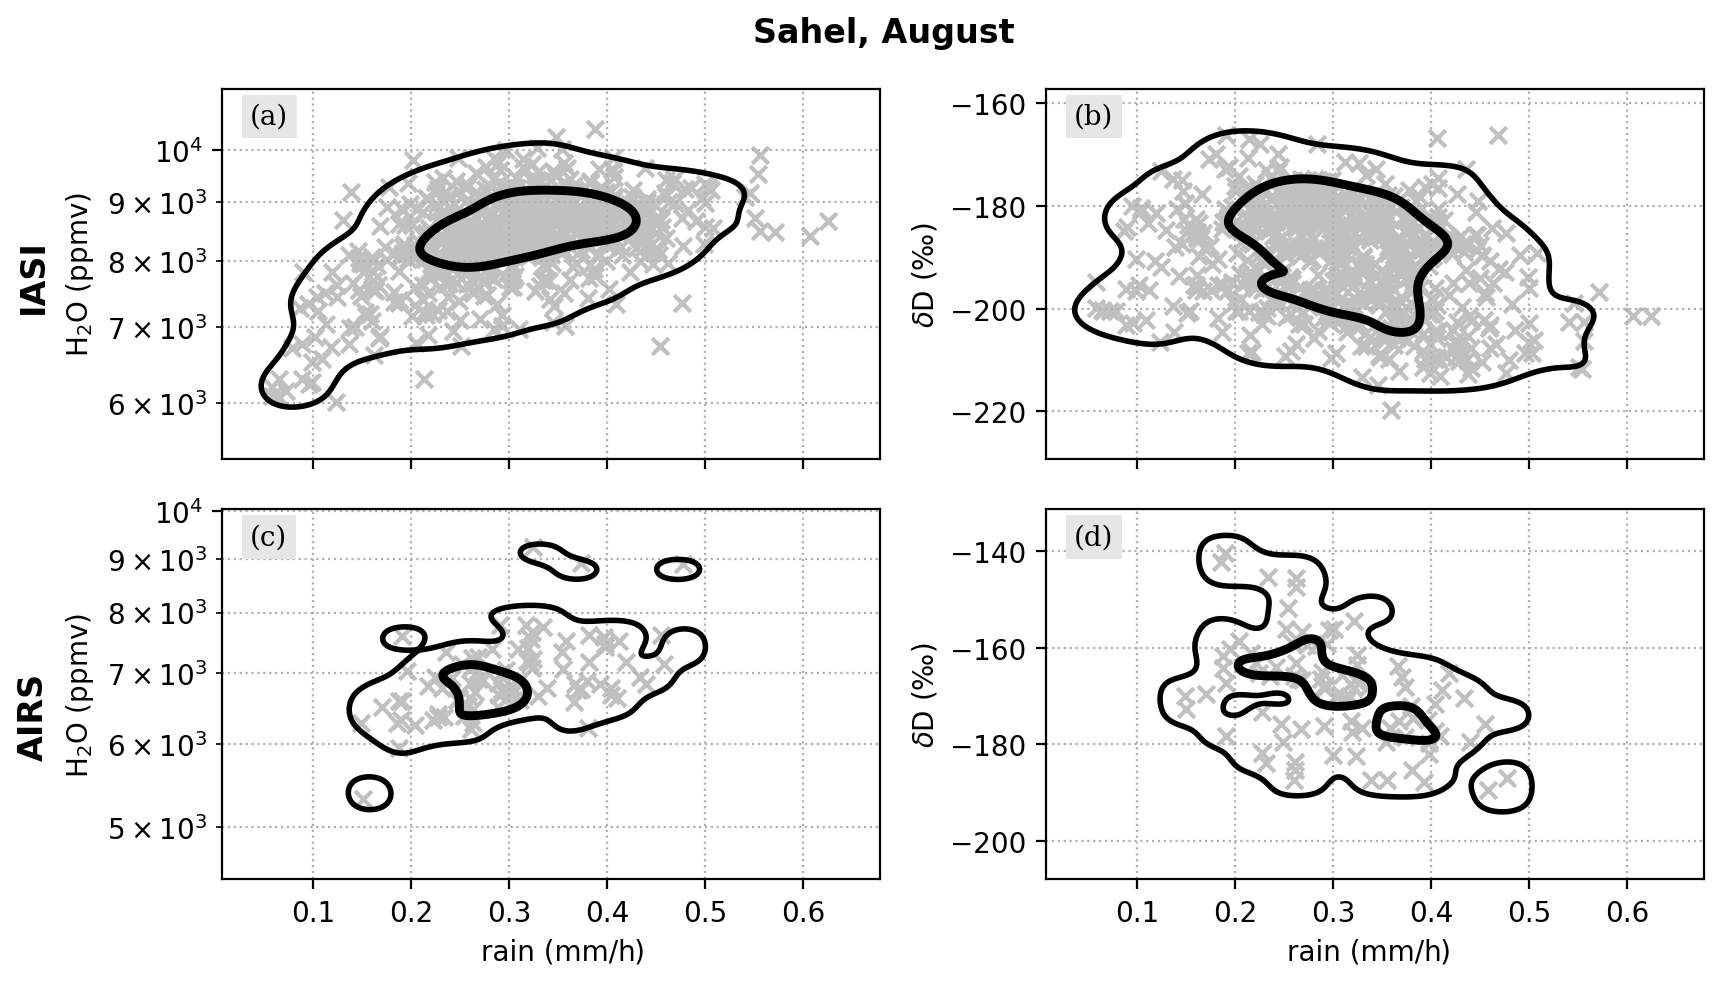
Figure 13Comparison of the H2O and δD data from IASI and AIRS with IMERG precipitation data. For this purpose, the data from Fig. 10 have been re-gridded onto a regular 1° × 1° grid for the comparison of IASI with IMERG and onto a regular 2.5° × 2.5° for the comparison of AIRS with IMERG. The re-gridding has been achieved by averaging all satellite data within a grid cell. Then, the compared data are displayed as scatter and described as two-dimensional histogram contours (indicating the distribution of the main 95 % and 50 % samples).
In the second step, we investigate to which extent the short-term convection-related {H2O, δD} features identified on an event basis are observable on a monthly scale comparing different years. For this purpose, we focus on the isotopic signals in the Sahelian mid-troposphere during the peak summer monsoon in August. Figure 12 exhibits the median and data spread for H2O and δD from IASI and AIRS as anomalies of the average of all available August data (TROPOMI is omitted due to the limited time coverage) and for precipitation from IMERG.
The first half of the period, 2015–2017, is characterized by a stable median of H2O, with both IASI and AIRS agreeing with their multi-annual averages. Differences between the two datasets arise with respect to the data spread, which, however, needs to be interpreted carefully, since IASI and AIRS have a considerably different number of available observations (on average, differing by a factor of 50–200; see Fig. 1) and distributions with smaller samples are more sensitive to outliers. Furthermore, in reasonable agreement with both sensors, δD is enriched between 2015 and 2017 compared to the full period. The annual averages exceed the full period average with up to 20 ‰ and the upper data spread limits reach up to 60 ‰–70 ‰ above average.
The second half of the full period, 2018–2020, experiences a marked increase in the spread of the precipitation. The year 2018 has the highest precipitation median value of the 6 study years, although H2O does not depict a significant deviation from the average. In contrast, the IASI δD shows a consistent drop of down to 25 ‰ compared to 2017 with respect to the median value and data spread. While this decrease in δD is not observed for AIRS during 2018, it becomes even more apparent in 2019, when both sensors indicate a larger depletion in δD compared to 2017. The δD averages reach up to 10 ‰ below the average, and the main data spread lies between −100 ‰ and 50 ‰. In addition, strong outliers become apparent for IASI in δD with values far below −100 ‰, but not in H2O, which instead remains in an overall compact and slightly increased data range. This can be understood in the context of the discussion in Sect. 3.1, where convective systems were found to create marked super-Rayleigh signals through processes like rain evaporation and equilibration, with the effect of reducing δD only. For 2020, IASI again indicates relatively strong depleted δD signals (median below −10 ‰ and minimum values between −100 ‰ and −75 ‰), but, interestingly, H2O also exhibits comparably low minimum values, while its median value is aligned with the full period average. This can be explained by the corresponding precipitation signals, which similarly show a median value close to the full period median, but also a large extent in the observed data range, reaching from around −0.3 mm−1 to over 0.4 mm−1. This suggests that 2020 was characterized by both intense convective and dry intrusion events, with the former resulting in humid and depleted air masses and the latter in dry and depleted air masses.
The comparison of the different years also emphasizes that an anti-correlation between precipitation amount and δD in the vapour phase can be observed. This becomes particularly evident when contrasting individual H2O and δD data points with the corresponding precipitation data, as shown in Fig. 13. While H2O increases for intensifying precipitation, we again observe the aforementioned anti-correlated relation between precipitation rates and δD, with higher precipitation rates corresponding to a lower δD. This effect has also been found in collected rainwater samples (e.g. Dansgaard, 1964; Lee and Fung, 2008; Risi et al., 2008a; Tharammal et al., 2017) as well as water vapour δD values (e.g. Lawrence et al., 2004; Worden et al., 2007; Tremoy et al., 2012), i.e. the so-called amount effect. Various mechanisms have been proposed to explain this anti-correlation observed in the vapour phase, such as dry mixing due to convective (Risi et al., 2008a) and meso-scale (Kurita, 2013) downdrafts as well as the occurrence of partial rain evaporation (e.g. Worden et al., 2007; Risi et al., 2010b; Noone, 2012), which all have been identified as pronounced within deep convection (Lacour et al., 2018). In this way, this is consistent with the observed anti-correlation between H2O and δD over the Sahel, which, as discussed in Sect. 3.1, was found to be the result of intense rain–vapour interactions associated with convective activity.
Despite differences in the considered time frames, the analysis of Fig. 12 with respect to the decomposition of δD anomalies shown in Fig. 11 provides further insights in this context. Following the discussion of the latter in Sect. 3.3, the decomposition method reveals that the main drivers of year-to-year anomalies in δD are data samples that have experienced significant convective events, i.e. the post-rain events. As the overall fraction of post-rain air masses was stable over the considered period (see Fig. 11a), the conclusion was drawn that the variations in δDpost-rain may be a result of varying intensities of the convective events. In particular for the years 2018 and 2019, the IASI δDpost-rain anomalies reach minimum values and are substantially lower than for 2015 and 2016. Since 2018 and 2019 were associated with higher precipitation peaks than 2015 and 2016 (see Fig. 12), this suggests that higher precipitation rates account for the negative δDpost-rain in Fig. 11 and, hence, for the drop in δD for 2018–2020 as observed in Fig. 12. However, these results should be treated with a degree of caution, as Fig. 11 refers to observations from June to July and Fig. 12 to those from August.
In conclusion, this section shows that the anti-correlated relation between H2O and δD in mid-tropospheric water vapour as a result of Sahelian convection forms a stable signal during the monsoon period. Moreover, we find that the degree of depletion in δD relates to the formation of precipitation events in this region.
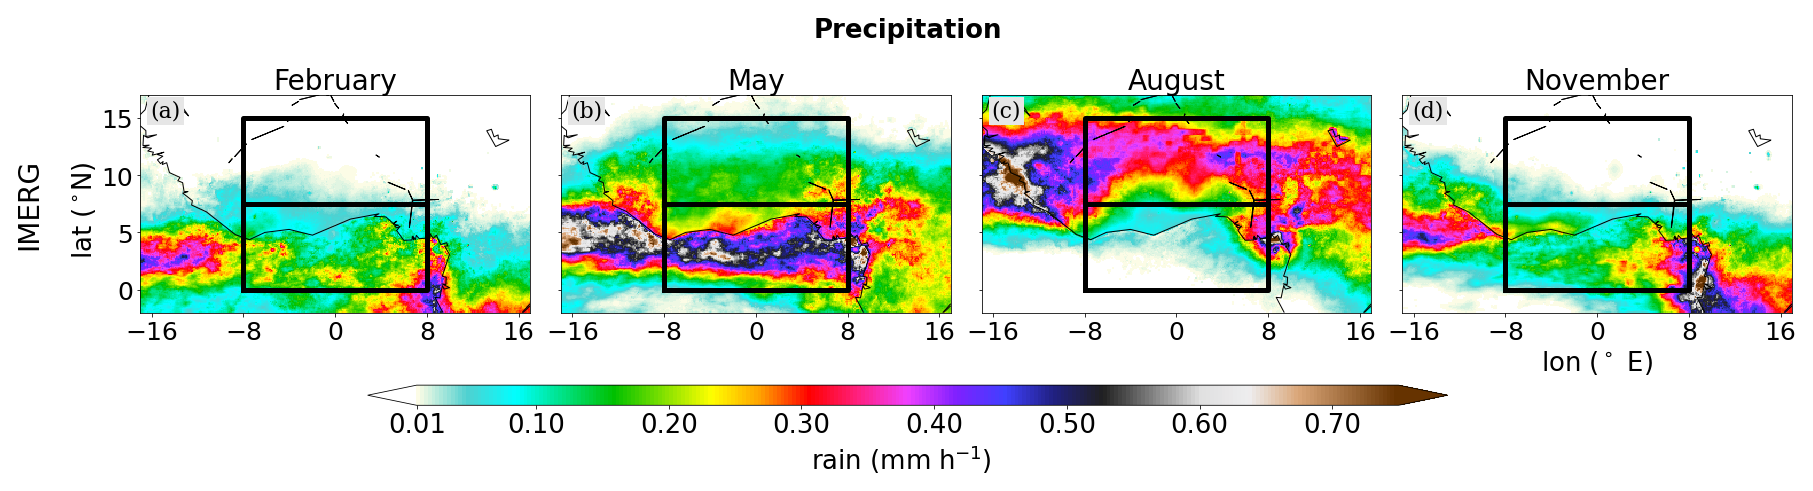
Figure 14Horizontal distributions of monthly averaged precipitation from IMERG over West Africa on the native 0.1° grid. The black rectangles denote the chosen target regions for the Guinea coast (0–7.5° N) and the Sahel (7.5–15° N).
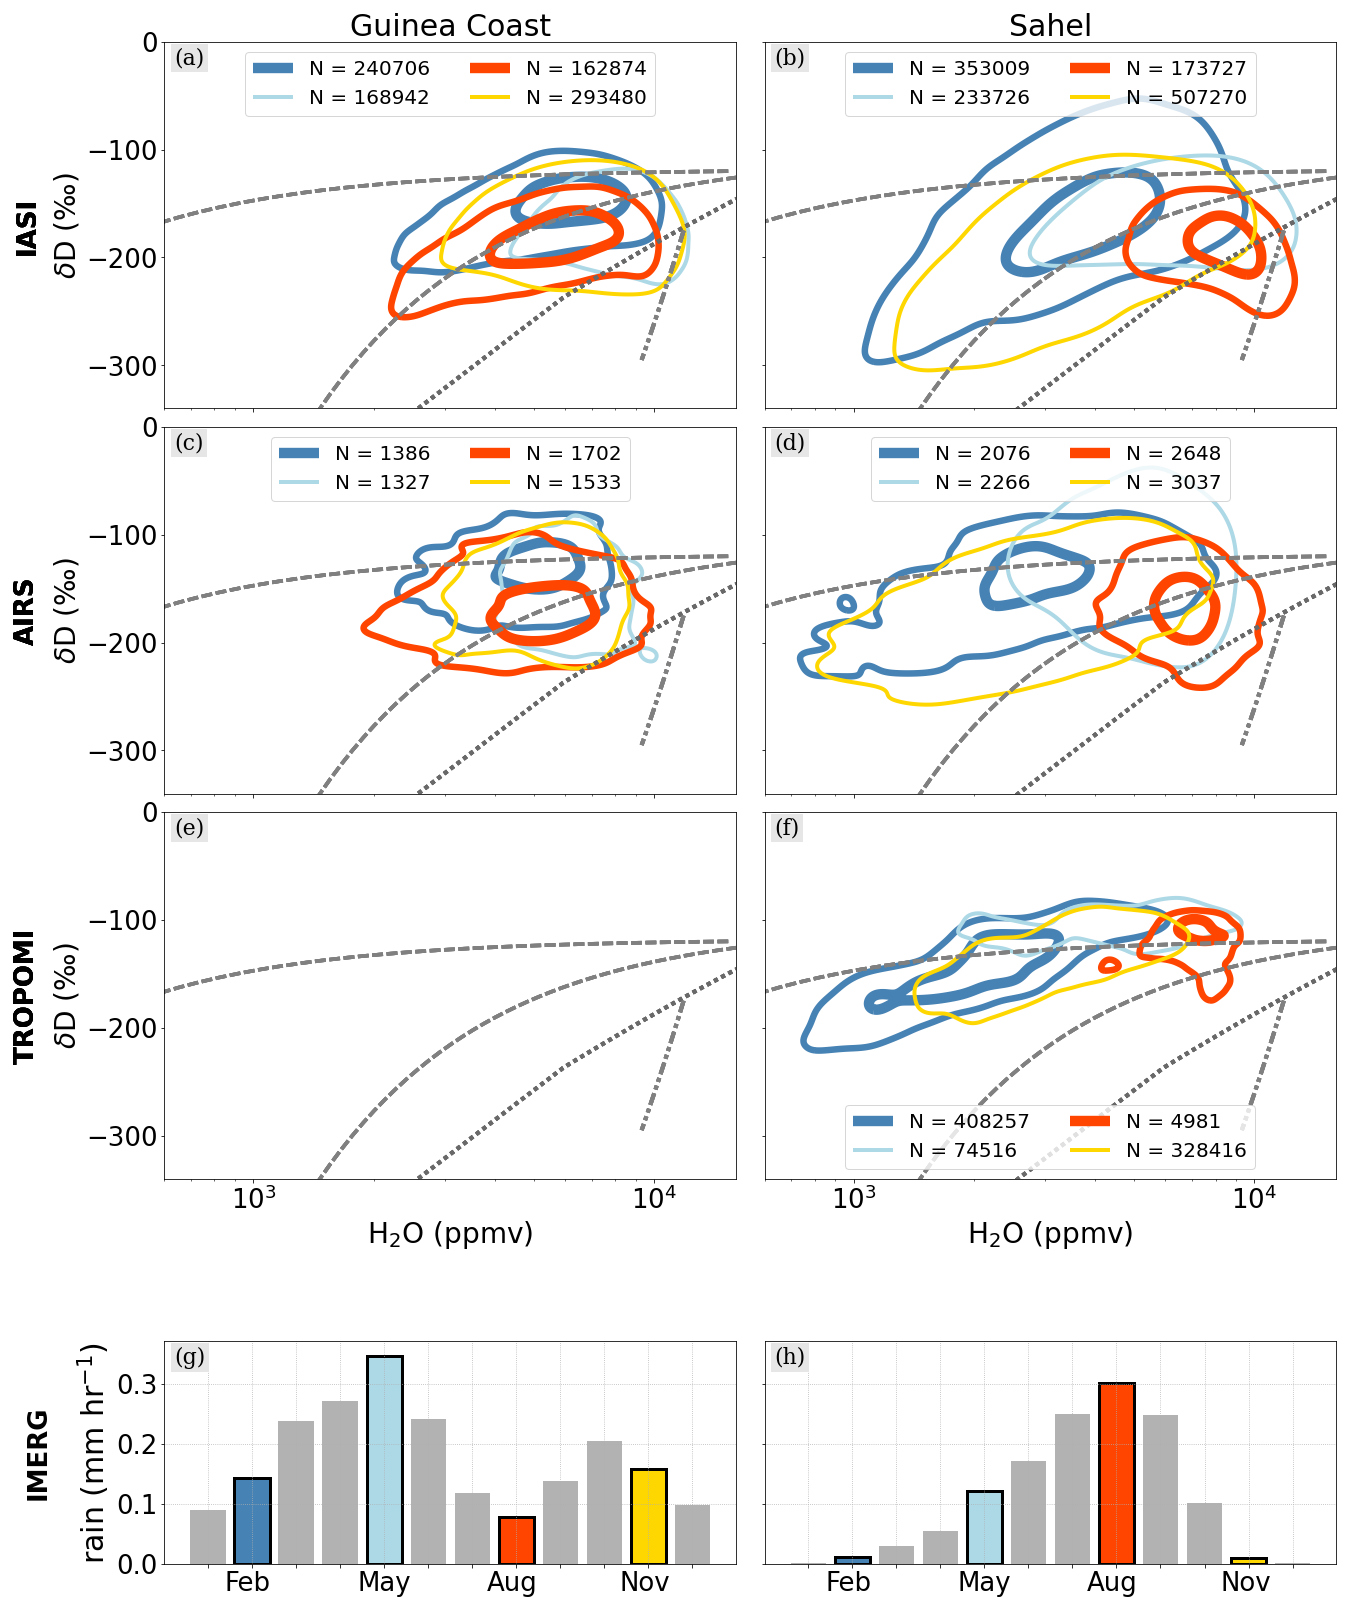
Figure 15First to third rows: {H2O, δD} pair distributions from IASI and AIRS for the Guinea coast (a, c) and from IASI, AIRS and TROPOMI for the Sahel (b, d), averaged for February, May, August and November from the available periods (see Table 1). The contours indicate the distribution of the main 95 % and 50 % samples of the respective data points and with the corresponding total data numbers given in the legend. Bottom row: monthly precipitation averaged over the Guinea coast and the Sahel. The colour-coded bars correspond to the time periods of the respective contours in panels (a) and (b).
In the third step, we put the seasonal WAM development into a climatological context. The aim is to investigate to what extent the changes in circulation and monsoon convection affect the isotopic signature of the tropospheric water vapour over the year and whether further control processes may be identified in the {H2O, δD} phase space.
5.1 Seasonality of precipitation
The subject of our discussion is averaged data from February, May, August and November, with these months proving useful for tracking the overall different seasonal cycles in precipitation over the Guinea coast and the Sahel. Bringing together the evolution of the horizontal precipitation distributions (Fig. 14) and the region-specific precipitation histograms (Fig. 15g, h), we can characterize the selected months as follows:
-
In February, when dry Harmattan winds penetrate south into the Guinea coast region, the land mass of West Africa (Sahel) is mostly rain-free and precipitation is largely restricted to a weak zonal band over the tropical Atlantic (Guinea coast).
-
In May, the precipitation intensifies strongly but still remains over the ocean. As a result, the Guinea coast experiences the first rain season, and the first precipitation events occur over the Sahel.
-
In August, the monsoon is fully established and strong southerly winds from the tropical Atlantic push the precipitation band northwards into the Sahel. While a little dry season develops over the Guinea coast, the Sahel shows its annual precipitation peak.
-
In November, the monsoon has retreated, leading to a distribution largely similar to that of February. The Sahel is overall dry and the southwards propagation of the precipitation band creates a second, weaker rain season over the Guinea Coast.
In this way, we confirm that the IMERG precipitation products of the selected months serve as valuable proxies for tracking the mean dynamical cycle over West Africa.
5.2 Seasonality of isotopic signals
5.2.1 Guinea coast
Throughout the whole year, the Guinea coast shows relatively high and overall stable signals in H2O and δD for both IASI and AIRS (Fig. 15a, c; TROPOMI is not considered for the target domain over the Guinea coast), and the corresponding {H2O, δD} pair distributions gather around the moist and enriched hyperbolic mixing regime. This is a result of the tropical Atlantic acting as a strong evaporative source of moisture into the troposphere (Frankenberg et al., 2009; Diekmann et al., 2021b). The rain seasons during May and November further moisten the already humid troposphere (up to approximately 10 000 ppmv) and additionally lead to a slight depletion in δD (down to approximately −200 ‰). As a result of the increased occurrence of rain–vapour interaction during the rain seasons, when in particular rain condensation and evaporation deplete the water vapour in δD, the respective {H2O, δD} pair distributions depict a minor shift from the mixing regime to the Rayleigh curve and even slightly to the super-Rayleigh regime. During the dry season between the two rain seasons, the {H2O, δD} pairs show a stretch along the indicated mixing curve down to 2000 ppmv in H2O and −230 ‰ in δD, presumably as a response to dry intrusions mixing in the Guinean troposphere.
In contrast to the {H2O, δD} evolution over the Guinea coast, drastic differences become evident between the dry winter and rainy summer periods for the study domain over the Sahel, which can be understood in the context of the discussion about the seasonal movement of the precipitation belt (Sect. 5.1). Due to its more northerly position, the Sahelian troposphere experiences stronger dehydration than the Guinea coast during the dry season (represented here by November and February). With the precipitation maximum being located over the tropical Atlantic, almost no precipitation occurs over the Sahel. Furthermore, the descending branch of the Hadley cell is found to feed dry and depleted air masses into the North and West African troposphere (Frankenberg et al., 2009), which are then transported by the far-south-reaching Saharan Harmattan winds towards the Sahel. With only weak evaporation taking place, this creates a strong mixing signal in the {H2O, δD} distribution of the Sahelian troposphere, reaching minimum values of 1000 ppmv for H2O and −300 ‰ for δD in IASI. This is in agreement with Diekmann et al. (2021b), where this moist mixing curve was found to represent the near-surface moistening well along the Harmattan winds and the Atlantic westerly inflow. Similar to the findings over the Guinea coast, AIRS depicts a spread in H2O, while for δD an enriched bias in low-δD regimes is documented. This reduces the observed spread in δD, which varies between −200 ‰ and −100 ‰ over the full H2O range. This means that for dry conditions the AIRS data follow significantly less a mixing line when compared to IASI. We assume that this can be explained by differences in the H2O and δD sensitivities for dry conditions. Typically, retrieval results for δD have a much lower sensitivity than for H2O. That is, the paired {H2O, δD} data product captures the decrease in H2O with altitude well but falls short in accurately depicting the decrease in δD (see also Sect. 7 in Schneider et al., 2016). The {H2O, δD} harmonization as part of the MUSICA IASI post-processing (see Sect. 2.1.1) serves to increase the sensitivity of the δD retrieval to dry conditions and thus ensures very similar sensitivities of H2O and δD, with the effect that the respective IASI {H2O, δD} pairs are distributed close to the mixing line.
For TROPOMI, the column-averaged δD mainly represents the δD values of the humid boundary layer (see the discussion in Sect. 2.1.1), and there is only a weak variability, with a data range between −100 ‰ and −200 ‰. The column-averaged H2O can be interpreted as a measure of the depth of the humid near-surface layer. For a deep humid layer, as is the case in the monsoon layer over West Africa during the rain season (Cornforth et al., 2017), H2O values are much higher than for a shallow boundary layer during the dry season. These particularities of the column-averaged {H2O, δD} pair data create strong signals along the mixing line that arise from the mixing of humid and very dry end-members (column-averaged data represent a vertically completely mixed atmosphere).
5.2.2 Sahel
Even though the Sahelian winter is mostly dry and rain-free, rare but heavy precipitation events may form as a response to strong tropical–extratropical interactions between the upper-tropospheric wind regimes, the monsoon southerlies and the Saharan Harmattan winds (e.g. Knippertz and Martin, 2005; Knippertz and Fink, 2009; Davis et al., 2013). Occasional northward shifts of the moist southerly winds allow the precipitation belt from the Gulf of Guinea to reach (for boreal winter) unusually high latitudes. This explains the occurrences of high moisture contents even in the dry winter season (up to 10 000 ppmv), ultimately resulting in a large variability in the corresponding {H2O, δD} pair distributions around the mixing lines for all three satellite products. As has been discussed for the Guinea coast, we again observe discrepancies in δD for dry conditions between IASI and AIRS. While IASI shows clear mixing signals reaching 1000 ppmv and −300 ‰, AIRS appears less depleted in δD for the same H2O regime, which is assumed to be a result of the optimization of IASI H2O and δD retrieval states for dry conditions (see Sect. 2.1.1).
The winter distribution of Sahelian {H2O, δD} pairs reveals another interesting feature in the H2O range of 2000–8000 ppmv. The corresponding contour exhibits enriched δD values of larger than −100 ‰, i.e. above the shown process curves. This is likely caused by vertical mixing of the very dry sub-tropical free tropospheric air with more humid air of the Saharan boundary layer. This mixing peaks in the dust-loaded Saharan air layer. High δD values for this layer have been reported in several studies, using in situ measurements from ground and aircraft (Dyroff et al., 2015; González et al., 2016), data from ground- and space-based remote sensing (Schneider et al., 2015) and isotopic-enabled modelling (Dahinden et al., 2023).
As discussed in Sect. 5.1, the monsoon onset is characterized by the shift in maximum precipitation from the Guinea coast to the Sahel during summer. The precipitation peak over the Sahel during August goes together with a strong increase in H2O (data range between 5000 and 10 000 ppmv), whereas δD shows decreasing tendencies (below −200 ‰) and points to the previously observed anti-correlation between H2O and δD. Figure 15 shows that the enhanced depletion during summer is strongly associated with signals below the Rayleigh prediction and creates {H2O, δD} structures following the super-Rayleigh line indicated in the figure. These features are also detected by the coarser resolved AIRS dataset, where the anti-correlation is less pronounced but still observable. Furthermore, despite the vertical smoothing over the troposphere for TROPOMI, which leads to a shift in the {H2O, δD} pair contour to higher δD and lower H2O, the super-Rayleigh structures stand out as distinct spikes in the otherwise round {H2O, δD} pair contour. This underlines the strong depleting effect of the rain–vapour interactions that mainly occur in a rather shallow layer in the free troposphere (Diekmann et al., 2021b).
In conclusion, we find that the {H2O, δD} data over the Sahel reflect the overall transition from the dry winter season, which is mostly governed by dry air mass mixing, to the summer monsoon season, when moist air reaches into the Sahel and drives microphysical processes related to convection. In contrast, the Guinea coast develops a comparably less pronounced seasonality in the {H2O, δD} phase space due to its structurally different meteorological conditions. In this way, this section demonstrates that the {H2O, δD} phase space is capable of tracking individual effects from dynamical and microphysical processes that control the atmospheric state over West Africa.
The goal of this study was to characterize the joint variability of H2O and δD in the West African troposphere using space-based remote sensing data and to shed light on the key processes controlling this variability. For this purpose, global and multi-annual data from the state-of-the-art infrared satellite sensors IASI, AIRS and TROPOMI served to track pairs of tropospheric H2O and δD abundances over the Guinea coast region and the Sahel from the interannual scale down to the convective scale. Based on IMERG precipitation estimates, we derive a clustering method to distinguish observations affected by convection or not. Furthermore, the use of idealized process curves in the {H2O, δD} phase space, as derived by the Lagrangian process attribution study of Diekmann et al. (2021b), allowed us to interpret the remotely sensed {H2O, δD} pairs with respect to the governing dynamical and microphysical processes.
By bringing together the isotopic and precipitation datasets for the Sahel and the Guinea coast, we were able to draw the following conclusions:
-
Despite the rather simple concept of our precipitation-based clustering method, we find that convection from different regions leads to different structures in the {H2O, δD} phase space during the monsoon: over the Sahel, where convective squall line events contrast with strong dry air intrusions, convective precipitation is associated with the coupling of rain condensation and evaporation. As a result, this leads to a moistening of the mid-troposphere as well as an enhanced depletion in δD, creating clearly anti-correlated features in the {H2O, δD} phase space towards the super-Rayleigh regime. In contrast, the Guinea Coast is less affected by dry intrusions, and thus, here, convective precipitation goes together with overall moist and enriched air masses.
-
The anti-correlated behaviour between H2O and δD over the Sahel during the monsoon peak remains a robust feature of the multi-year perspective. In addition, an anti-correlation between precipitation amount and δD becomes apparent, where stronger precipitation events are associated with more enhanced δD depletion, thus pointing towards the amount effect in water vapour.
-
The analysis of the mean seasonal cycles demonstrates that the anti-correlated relationship between H2O and δD is overall limited to the monsoon period and the Sahel. During the Sahelian winter, which is overall dry and rain-free, predominant mixing signals form as a response to strong dynamical processes over West Africa. Again, in contrast, the Guinea Coast appears consistently moist and enriched, and due to the missing dry air intrusions, no significant depletion in δD develops.
The discussed features in {H2O, δD} over the Guinea coast and the Sahel are particularly pronounced and qualitatively consistent for the vertically resolved water vapour isotope products from IASI and AIRS. Compared to AIRS, IASI reveals differences of approximately 1000–1500 ppmv in H2O and approximately 10 ‰–20 ‰ in δD. In contrast, the total-column-averaged TROPOMI product differs markedly from IASI and AIRS. While the seasonal TROPOMI {H2O, δD} cycle is similar to the signals observed by the other instruments, the anti-correlation between H2O and δD associated with Sahelian convection is less evident due to weak δD variability. These differences are due to the fact that the TROPOMI H2O data mainly indicate the depth of the monsoon layer (i.e. a high total-column-averaged H2O referring to a deep monsoon layer), whereas its δD reflects the isotopic composition predominantly from within the monsoon layer.
In conclusion, this study underlines the value of utilizing paired distributions of H2O and δD observed from space to study the atmospheric water cycle in terms of tropical convection, microphysical processes and large-scale circulation. Together with new frameworks to describe isotopic processes using satellite data in a more quantitative way (e.g. Galewsky et al., 2023), new methods to combine retrieval results from different instruments in order to create synergy products with increased information content (e.g. for IASI and TROPOMI, see Schneider et al., 2022) and new techniques to assimilate isotopic observations into atmospheric models (Toride et al., 2021; Schneider et al., 2024), promising opportunities are emerging to further exploit the process-based view of paired {H2O, δD} data from space and, hence, to reveal new insights into atmospheric processes and their numerical representations.
The MUSICA IASI data are available at https://doi.org/10.35097/415 (Diekmann et al., 2021a). The AIRS data can be accessed at https://doi.org/10.5067/55XVECXA26EK (Bowman, 2023). Information on how to access the TROPOMI data is documented in https://doi.org/10.5281/zenodo.15465255 (Trent and Boesch, 2025). The GPM IMERG data are available at https://doi.org/10.5067/GPM/IMERG/3B-HH/07 (hourly data set, Huffman et al., 2023a) and https://doi.org/10.5067/GPM/IMERG/3B-MONTH/06 (monthly data set, Huffman et al., 2023b).
MS, BE and CJD created and provided the MUSICA IASI dataset, in which they were supported by FK and FH. HB and TT created and provided the Sentinel-5P dataset with support by ANR. JW created and provided the AIRS dataset. PK provided the scientific background to the West African Monsoon. PK, MS and CJD designed the concept of the study. All the authors supported the generation of the final version of this paper.
At least one of the (co-)authors is a member of the editorial board of Atmospheric Chemistry and Physics. The peer-review process was guided by an independent editor, and the authors also have no other competing interests to declare.
Publisher's note: Copernicus Publications remains neutral with regard to jurisdictional claims made in the text, published maps, institutional affiliations, or any other geographical representation in this paper. While Copernicus Publications makes every effort to include appropriate place names, the final responsibility lies with the authors.
This work has benefited from the discussions and outcomes obtained through the projects MOTIV and TEDDY (funded by the Deutsche Forschungsgemeinschaft) and S5P+Innovation Water Vapour Isotopologoues (H2O-ISO, funded by the European Space Agency). Furthermore, it has benefited from the MUSICA project (funded by the European Research Council under the European Community's Seventh Framework Programme (FP7/2007-2013)/ERC grant no. 256961). The technical processing for the presented results was performed using the supercomputer HoreKa, which is funded by the Ministry of Science, Research and the Arts Baden-Württemberg and by the German Federal Ministry of Education and Research. Part of this research was carried out at the Jet Propulsion Laboratory, California Institute of Technology, under a contract with the National Aeronautics and Space Administration.
This research has been supported by the Deutsche Forschungsgemeinschaft (grant nos. 950290612604/GZ:SCHN1126/2-1 and 416767181/GZ:SCHN1126/5-1) and the European Space Agency (grant no. 4000127561/19/I-NS).
The article processing charges for this open-access publication were covered by the Karlsruhe Institute of Technology (KIT).
This paper was edited by Ann Fridlind and reviewed by three anonymous referees.
Barthlott, S., Schneider, M., Hase, F., Blumenstock, T., Kiel, M., Dubravica, D., García, O. E., Sepúlveda, E., Mengistu Tsidu, G., Takele Kenea, S., Grutter, M., Plaza-Medina, E. F., Stremme, W., Strong, K., Weaver, D., Palm, M., Warneke, T., Notholt, J., Mahieu, E., Servais, C., Jones, N., Griffith, D. W. T., Smale, D., and Robinson, J.: Tropospheric water vapour isotopologue data (HO, HO, and HD16O) as obtained from NDACC/FTIR solar absorption spectra, Earth Syst. Sci. Data, 9, 15–29, https://doi.org/10.5194/essd-9-15-2017, 2017. a
Berntell, E., Zhang, Q., Chafik, L., and Körnich, H.: Representation of Multidecadal Sahel Rainfall Variability in 20th Century Reanalyses, Sci. Rep., 8, 10937, https://doi.org/10.1038/s41598-018-29217-9, 2018. a
Bielli, S., Douville, H., and Pohl, B.: Understanding the West African monsoon variability and its remote effects: An illustration of the grid point nudging methodology, Clim. Dynam., 35, 159–174, https://doi.org/10.1007/s00382-009-0667-8, 2010. a
Bolot, M., Legras, B., and Moyer, E. J.: Modelling and interpreting the isotopic composition of water vapour in convective updrafts, Atmos. Chem. Phys., 13, 7903–7935, https://doi.org/10.5194/acp-13-7903-2013, 2013. a
Bowman, K. W.: TROPESS AIRS-Aqua L2 Deuterated Water Vapor for Reanalysis Stream, Summary Product V1, Greenbelt, MD, USA, Goddard Earth Sciences Data and Information Services Center (GES DISC) [data set], https://doi.org/10.5067/55XVECXA26EK (last access: 28 May 2023), 2023. a
Clerbaux, C., Boynard, A., Clarisse, L., George, M., Hadji-Lazaro, J., Herbin, H., Hurtmans, D., Pommier, M., Razavi, A., Turquety, S., Wespes, C., and Coheur, P.-F.: Monitoring of atmospheric composition using the thermal infrared IASI/MetOp sounder, Atmos. Chem. Phys., 9, 6041–6054, https://doi.org/10.5194/acp-9-6041-2009, 2009. a
Colman, A., Rowell, D., Foamouhoue, A. K., Ndiaye, O., Rodríguez-Fonseca, B., Suarez, R., Yaka, P., Parker, D. J., and Diop-Kane, M.: Seasonal Forecasting, Chap. 8, 289–322, John Wiley & Sons, Ltd, ISBN 9781118391297, https://doi.org/10.1002/9781118391297.ch8, 2017. a
Cornforth, R., Mumba, Z., Parker, D. J., Berry, G., Chapelon, N., Diakaria, K., Diop-Kane, M., Ermert, V., Fink, A. H., Knippertz, P., Lafore, J. P., Laing, A., Lepape, S., Maidment, R., Methven, J., Orji, B., Osika, D., Poan, E., Roca, R., Rowell, S., Smith, R., Spengler, T., Taylor, C. M., Thorncroft, C., Vincendon, J.-C., Yorke, C., and Thorncroft, C.: Synoptic Systems, Chap. 2, 40–89, John Wiley & Sons, Ltd, ISBN 9781118391297, https://doi.org/10.1002/9781118391297.ch2, 2017. a
Craig, H.: Standard for reporting concentrations of deuterium and oxygen-18 in natural waters, Science, 133, 1833–1834, https://doi.org/10.1126/science.133.3467.1833, 1961. a
Dahinden, F., Aemisegger, F., Wernli, H., and Pfahl, S.: Unravelling the transport of moisture into the Saharan Air Layer using passive tracers and isotopes, Atmos. Sci. Lett., 24, e1187, https://doi.org/10.1002/asl.1187, 2023. a
Dansgaard, W.: Stable isotopes in precipitation, Tellus, 16, 436–468, https://doi.org/10.1111/j.2153-3490.1964.tb00181.x, 1964. a, b
Davis, J., Knippertz, P., and Fink, A. H.: The predictability of precipitation episodes during the West African dry season, Q. J. Roy. Meteor. Soc., 139, 1047–1058, https://doi.org/10.1002/qj.2014, 2013. a
de Vries, A. J., Aemisegger, F., Pfahl, S., and Wernli, H.: Stable water isotope signals in tropical ice clouds in the West African monsoon simulated with a regional convection-permitting model, Atmos. Chem. Phys., 22, 8863–8895, https://doi.org/10.5194/acp-22-8863-2022, 2022. a
Dhonneur, G.: Les amas nuageux mobiles, principale composante de la météorologie du Sahel, La Météorologie Paris, 6, 75–82, 1981. a
Diaconescu, E. P., Gachon, P., Scinocca, J., and Laprise, R.: Evaluation of daily precipitation statistics and monsoon onset/retreat over western Sahel in multiple data sets, Clim. Dynam., 45, 1325–1354, https://doi.org/10.1007/s00382-014-2383-2, 2015. a
Diekmann, C. J., Schneider, M., and Ertl, B.: MUSICA IASI water isotopologue pair product (a posteriori processing version 2), Institute of Meteorology and Climate Research, Atmospheric Trace Gases and Remote Sensing (IMK-ASF), Karlsruhe Institute of Technology (KIT) [data set], https://doi.org/10.35097/415, 2021.a. a
Diekmann, C. J., Schneider, M., Ertl, B., Hase, F., García, O., Khosrawi, F., Sepúlveda, E., Knippertz, P., and Braesicke, P.: The global and multi-annual MUSICA IASI H2O, δD pair dataset, Earth Syst. Sci. Data, 13, 5273–5292, https://doi.org/10.5194/essd-13-5273-2021, 2021b. a, b, c, d, e, f, g, h, i, j, k, l, m, n, o, p
Diekmann, C. J., Schneider, M., Knippertz, P., de Vries, A. J., Pfahl, S., Aemisegger, F., Dahinden, F., Ertl, B., Khosrawi, F., Wernli, H., and Braesicke, P.: A Lagrangian Perspective on Stable Water Isotopes During the West African Monsoon, J. Geophys. Res.-Atmos., 126, e2021JD034895, https://doi.org/10.1029/2021JD034895, 2021c. a, b, c, d, e
Dyroff, C., Sanati, S., Christner, E., Zahn, A., Balzer, M., Bouquet, H., McManus, J. B., González-Ramos, Y., and Schneider, M.: Airborne in situ vertical profiling of HDO HO in the subtropical troposphere during the MUSICA remote sensing validation campaign, Atmos. Meas. Tech., 8, 2037–2049, https://doi.org/10.5194/amt-8-2037-2015, 2015. a
Eckstein, J., Ruhnke, R., Pfahl, S., Christner, E., Diekmann, C., Dyroff, C., Reinert, D., Rieger, D., Schneider, M., Schröter, J., Zahn, A., and Braesicke, P.: From climatological to small-scale applications: simulating water isotopologues with ICON-ART-Iso (version 2.3), Geosci. Model Dev., 11, 5113–5133, https://doi.org/10.5194/gmd-11-5113-2018, 2018. a
Fink, A. H., Vincent, D. G., and Ermert, V.: Rainfall types in the West African Sudanian zone during the summer monsoon 2002, Mon. Weather Rev., 134, 2143–2164, https://doi.org/10.1175/MWR3182.1, 2006. a
Fink, A. H., Engel, T., Ermert, V., Van Der Linden, R., Schneidewind, M., Redl, R., Afiesimama, E., Thiaw, W. M., Yorke, C., Evans, M., and Janicot, S.: Mean climate and seasonal cycle, in: Meteorology of Tropical West Africa: The Forecasters' Handbook, pp. 1–39, John Wiley & Sons, Ltd, Chichester, UK, ISBN 9781118391297, https://doi.org/10.1002/9781118391297.ch1, 2017. a
Fitzpatrick, R. G., Bain, C. L., Knippertz, P., Marsham, J. H., and Parker, D. J.: The West African monsoon onset: A concise comparison of definitions, J. Climate, 28, 8673–8694, https://doi.org/10.1175/JCLI-D-15-0265.1, 2015. a
Frankenberg, C., Yoshimura, K., Warneke, T., Aben, I., Butz, A., Deutscher, N., Griffith, D., Hase, F., Notholt, J., Schneider, M., Schrijver, H., and Röckmann, T.: Dynamic processes governing lower-tropospheric HDO/H2O Ratios as Observed from Space and Ground, Science, 325, 1374–1377, https://doi.org/10.1126/science.1173791, 2009. a, b
Gaetani, M., Pohl, B., Douville, H., and Fontaine, B.: West African Monsoon influence on the summer Euro-Atlantic circulation, Geophys. Res. Lett., 38, L09705, https://doi.org/10.1029/2011GL047150, 2011. a
Galewsky, J., Steen-Larsen, H. C., Field, R. D., Worden, J., Risi, C., and Schneider, M.: Stable isotopes in atmospheric water vapor and applications to the hydrologic cycle, Rev. Geophys., 54, 809–865, https://doi.org/10.1002/2015RG000512, 2016. a
Galewsky, J., Schneider, M., Diekmann, C., Semie, A., Bony, S., Risi, C., Emanuel, K., and Brogniez, H.: The Influence of Convective Aggregation on the Stable Isotopic Composition of Water Vapor, AGU Adv., 4, e2023AV000877, https://doi.org/10.1029/2023AV000877, 2023. a, b, c
González, Y., Schneider, M., Dyroff, C., Rodríguez, S., Christner, E., García, O. E., Cuevas, E., Bustos, J. J., Ramos, R., Guirado-Fuentes, C., Barthlott, S., Wiegele, A., and Sepúlveda, E.: Detecting moisture transport pathways to the subtropical North Atlantic free troposphere using paired H2O-δD in situ measurements, Atmos. Chem. Phys., 16, 4251–4269, https://doi.org/10.5194/acp-16-4251-2016, 2016. a, b
Huffman, G., Bolvin, D., Nelkin, E., and Tan, J.: Integrated Multi-satellitE Retrievals for GPM (IMERG) Technical Documentation, Tech. rep., NASA Goddard Centre, https://gpm.nasa.gov/data/imerg (last access: 15 February 2021), 2019. a
Huffman, G. J., Bolvin, D., Braithwaite, D., Hsu, K., Joyce, R., and Xie, P.: Integrated Multi-satellitE Retrievals for GPM (IMERG), version 4.4, https://gpm.nasa.gov/data/directory (last access: 7 February 2021), 2014. a, b
Huffman, G. J., Stocker, E. F., Bolvin, D. T., Nelkin, E. J., and Tan, J.: GPM IMERG Final Precipitation L3 Half Hourly 0.1 degree x 0.1 degree V07, Greenbelt, MD, Goddard Earth Sciences Data and Information Services Center (GES DISC) [data set], https://doi.org/10.5067/GPM/IMERG/3B-HH/07 (last access: 22 August 2022), 2023. a
Huffman, G. J., Stocker, E. F., Bolvin, D. T., Nelkin, E. J., and Tan, J.: GPM IMERG Final Precipitation L3 1 month 0.1 degree x 0.1 degree V07, Greenbelt, MD, Goddard Earth Sciences Data and Information Services Center (GES DISC) [data set], https://doi.org/10.5067/GPM/IMERG/3B-MONTH/06 (last access: 20 February 2022), 2023b. a
Hulme, M.: Climatic perspectives on Sahelian desiccation: 1973-1998, Global Environ. Change, 11, 19–29, https://doi.org/10.1016/S0959-3780(00)00042-X, 2001. a
Knippertz, P. and Fink, A. H.: Prediction of dry-season precipitation in tropical West Africa and its relation to forcing from the extratropics, Weather Forecast., 24, 1064–1084, https://doi.org/10.1175/2009WAF2222221.1, 2009. a
Knippertz, P. and Martin, J. E.: Tropical plumes and extreme precipitation in subtropical and tropical West Africa, Q. J. Roy. Meteor. Soc., 131, 2337–2365, https://doi.org/10.1256/qj.04.148, 2005. a
Knippertz, P., Fink, A. H., Deroubaix, A., Morris, E., Tocquer, F., Evans, M. J., Flamant, C., Gaetani, M., Lavaysse, C., Mari, C., Marsham, J. H., Meynadier, R., Affo-Dogo, A., Bahaga, T., Brosse, F., Deetz, K., Guebsi, R., Latifou, I., Maranan, M., Rosenberg, P. D., and Schlueter, A.: A meteorological and chemical overview of the DACCIWA field campaign in West Africa in June–July 2016, Atmos. Chem. Phys., 17, 10893–10918, https://doi.org/10.5194/acp-17-10893-2017, 2017. a, b, c
Kurita, N.: Water isotopic variability in response to mesoscale convective system over the tropical ocean, J. Geophys. Res.-Atmos., 118, 10376–10390, https://doi.org/10.1002/jgrd.50754, 2013. a
Lacour, J. L., Risi, C., Worden, J., Clerbaux, C., and Coheur, P. F.: Importance of depth and intensity of convection on the isotopic composition of water vapor as seen from IASI and TES δD observations, Earth Planet. Sc. Lett., 481, 387–394, https://doi.org/10.1016/j.epsl.2017.10.048, 2018. a, b
Lafore, J. P., Chapelon, N., Diop, M., Gueye, B., Largeron, Y., Lepape, S., Ndiaye, O., Parker, D. J., Poan, E., Roca, R., Roehrig, R., Taylor, C., and Moncrieff, M.: Deep Convection, Chap. 3, 90–129, John Wiley & Sons, Ltd, ISBN 9781118391297, https://doi.org/10.1002/9781118391297.ch3, 2017. a, b, c, d, e
Lawrence, J. R., Gedzelman, S. D., Dexheimer, D., Cho, H. K., Carrie, G. D., Gasparini, R., Anderson, C. R., Bowman, K. P., and Biggerstaff, M. I.: Stable isotopic composition of water vapor in the tropics, J. Geophys. Res.-Atmos., 109, D06115, https://doi.org/10.1029/2003jd004046, 2004. a
Lee, J. E. and Fung, I.: “Amount effect” of water isotopes and quantitative analysis of post-condensation processes, Hydrol. Process., 22, 1–8, https://doi.org/10.1002/hyp.6637, 2008. a, b
Maranan, M., Fink, A. H., and Knippertz, P.: Rainfall types over southern West Africa: Objective identification, climatology and synoptic environment, Q. J. Roy. Meteor. Soc., 144, 1628–1648, https://doi.org/10.1002/qj.3345, 2018. a
Maranan, M., Fink, A. H., Knippertz, P., Amekudzi, L. K., Atiah, W. A., and Stengel, M.: A Process-Based Validation of GPM IMERG and Its Sources Using a Mesoscale Rain Gauge Network in the West African Forest Zone, J. Hydrometeorol., 21, 729–749, https://doi.org/10.1175/JHM-D-19-0257.1, 2020. a
Marsham, J. H., Dixon, N. S., Garcia-Carreras, L., Lister, G. M., Parker, D. J., Knippertz, P., and Birch, C. E.: The role of moist convection in the West African monsoon system: Insights from continental-scale convection-permitting simulations, Geophys. Res. Lett., 40, 1843–1849, https://doi.org/10.1002/grl.50347, 2013. a
Monerie, P.-A., Biasutti, M., Mignot, J., Mohino, E., Pohl, B., and Zappa, G.: Storylines of Sahel Precipitation Change: Roles of the North Atlantic and Euro-Mediterranean Temperature, J. Geophys. Res.-Atmos., 128, e2023JD038712, https://doi.org/10.1029/2023JD038712, 2023. a
Nlend, B., Celle-Jeanton, H., Risi, C., Pohl, B., Huneau, F., Ngo Boum-Nkot, S., Seze, G., Roucou, P., Camberlin, P., Etame, J., and Ketchemen-Tandia, B.: Identification of processes that control the stable isotope composition of rainwater in the humid tropical West-Central Africa, J. Hydrol., 584, 124650, https://doi.org/10.1016/j.jhydrol.2020.124650, 2020. a
Noone, D.: Pairing measurements of the water vapor isotope ratio with humidity to deduce atmospheric moistening and dehydration in the tropical midtroposphere, J. Climate, 25, 4476–4494, https://doi.org/10.1175/JCLI-D-11-00582.1, 2012. a, b, c, d
Noone, D., Galewsky, J., Sharp, Z. D., Worden, J., Barnes, J., Baer, D., Bailey, A., Brown, D. P., Christensen, L., Crosson, E., Dong, F., Hurley, J. V., Johnson, L. R., Strong, M., Toohey, D., Van Pelt, A., and Wright, J. S.: Properties of air mass mixing and humidity in the subtropics from measurements of the D/H isotope ratio of water vapor at the Mauna Loa Observatory, J. Geophys. Res.-Atmos., 116, D22113, https://doi.org/10.1029/2011JD015773, 2011. a, b
Pante, G. and Knippertz, P.: Resolving Sahelian thunderstorms improves mid-latitude weather forecasts, Nat. Commun., 10, 1–9, https://doi.org/10.1038/s41467-019-11081-4, 2019. a
Parker, D. J., Fink, A., Janicot, S., Ngamini, J. B., Douglas, M., Afiesimama, E., Agusti-Panareda, A., Beljaars, A., Dide, F., Diedhiou, A., Lebel, T., Polcher, J., Redelspergerk, J. L., Thorncroft, C., and Wilson, G. A.: The Amma radiosonde program and its implications for the future of atmospheric monitoring over Africa, B. Am. Meteorol. Soc., 89, 1015–1027, https://doi.org/10.1175/2008BAMS2436.1, 2008. a
Risi, C., Bony, S., and Vimeux, F.: Influence of convective processes on the isotopic composition (δ18O and δD) of precipitation and water vapor in the tropics: 2. Physical interpretation of the amount effect, J. Geophys. Res.-Atmos., 113, D19306, https://doi.org/10.1029/2008JD009943, 2008a. a, b, c
Risi, C., Bony, S., Vimeux, F., Descroix, L., Ibrahim, B., Lebreton, E., Mamadou, I., and Sultan, B.: What controls the isotopic composition of the African monsoon precipitation? Insights from event-based precipitation collected during the 2006 AMMA field campaign, Geophys. Res. Lett., 35, 1–6, https://doi.org/10.1029/2008GL035920, 2008b. a, b, c
Risi, C., Bony, S., Vimeux, F., Chongd, M., and Descroixe, L.: Evolution of the stable water isotopic composition of the rain sampled along sahelian squall lines, Q. J. Roy. Meteor. Soc., 136, 227–242, https://doi.org/10.1002/qj.485, 2010a. a, b
Risi, C., Bony, S., Vimeux, F., Frankenberg, C., Noone, D., and Worden, J.: Understanding the Sahelian water budget through the isotopic composition of water vapor and precipitation, J. Geophys. Res.-Atmos., 115, 1–23, https://doi.org/10.1029/2010JD014690, 2010b. a, b, c
Risi, C., Muller, C., and Blossey, P.: Rain Evaporation, Snow Melt, and Entrainment at the Heart of Water Vapor Isotopic Variations in the Tropical Troposphere, According to Large-Eddy Simulations and a Two-Column Model, J. Adv. Model. Earth Sy., 13, e2020MS002381, https://doi.org/10.1029/2020MS002381, 2021. a, b
Risi, C., Muller, C., Vimeux, F., Blossey, P., Védeau, G., Dufaux, C., and Abramian, S.: What Controls the Mesoscale Variations in Water Isotopic Composition Within Tropical Cyclones and Squall Lines? Cloud Resolving Model Simulations in Radiative-Convective Equilibrium, J. Adv. Model. Earth Sy., 15, e2022MS003331, https://doi.org/10.1029/2022MS003331, 2023. a, b
Roehrig, R., Bouniol, D., Guichard, F., Hourdin, F., and Redelsperger, J. L.: The present and future of the west african monsoon: A process-oriented assessment of CMIP5 simulations along the AMMA transect, J. Climate, 26, 6471–6505, https://doi.org/10.1175/JCLI-D-12-00505.1, 2013. a
Schneider, A., Borsdorff, T., aan de Brugh, J., Aemisegger, F., Feist, D. G., Kivi, R., Hase, F., Schneider, M., and Landgraf, J.: First data set of H2O/HDO columns from the Tropospheric Monitoring Instrument (TROPOMI), Atmos. Meas. Tech., 13, 85–100, https://doi.org/10.5194/amt-13-85-2020, 2020. a
Schneider, M., Romero, P. M., Hase, F., Blumenstock, T., Cuevas, E., and Ramos, R.: Continuous quality assessment of atmospheric water vapour measurement techniques: FTIR, Cimel, MFRSR, GPS, and Vaisala RS92, Atmos. Meas. Tech., 3, 323–338, https://doi.org/10.5194/amt-3-323-2010, 2010. a
Schneider, M., Barthlott, S., Hase, F., González, Y., Yoshimura, K., García, O. E., Sepúlveda, E., Gomez-Pelaez, A., Gisi, M., Kohlhepp, R., Dohe, S., Blumenstock, T., Wiegele, A., Christner, E., Strong, K., Weaver, D., Palm, M., Deutscher, N. M., Warneke, T., Notholt, J., Lejeune, B., Demoulin, P., Jones, N., Griffith, D. W. T., Smale, D., and Robinson, J.: Ground-based remote sensing of tropospheric water vapour isotopologues within the project MUSICA, Atmos. Meas. Tech., 5, 3007–3027, https://doi.org/10.5194/amt-5-3007-2012, 2012. a, b
Schneider, M., González, Y., Dyroff, C., Christner, E., Wiegele, A., Barthlott, S., García, O. E., Sepúlveda, E., Hase, F., Andrey, J., Blumenstock, T., Guirado, C., Ramos, R., and Rodríguez, S.: Empirical validation and proof of added value of MUSICA's tropospheric δD remote sensing products, Atmos. Meas. Tech., 8, 483–503, https://doi.org/10.5194/amt-8-483-2015, 2015. a
Schneider, M., Wiegele, A., Barthlott, S., González, Y., Christner, E., Dyroff, C., García, O. E., Hase, F., Blumenstock, T., Sepúlveda, E., Mengistu Tsidu, G., Takele Kenea, S., Rodríguez, S., and Andrey, J.: Accomplishments of the MUSICA project to provide accurate, long-term, global and high-resolution observations of tropospheric H2O,δD pairs – a review, Atmos. Meas. Tech., 9, 2845–2875, https://doi.org/10.5194/amt-9-2845-2016, 2016. a, b, c, d, e
Schneider, M., Ertl, B., Diekmann, C. J., Khosrawi, F., Weber, A., Hase, F., Höpfner, M., García, O. E., Sepúlveda, E., and Kinnison, D.: Design and description of the MUSICA IASI full retrieval product, Earth Syst. Sci. Data, 14, 709–742, https://doi.org/10.5194/essd-14-709-2022, 2022. a, b, c
Schneider, M., Toride, K., Khosrawi, F., Hase, F., Ertl, B., Diekmann, C. J., and Yoshimura, K.: Assessing the potential of free-tropospheric water vapour isotopologue satellite observations for improving the analyses of convective events, Atmos. Meas. Tech., 17, 5243–5259, https://doi.org/10.5194/amt-17-5243-2024, 2024. a
Sherwood, S., Bony, S., and Dufresne, J.-L.: Spread in model climate sensitivity traced to atmospheric convective mixing, Nature, 505, 37–42, https://doi.org/10.1038/nature12829, 2014. a
Spencer, R. W. and Braswell, W. D.: How Dry is the Tropical Free Troposphere? Implications for Global Warming Theory, B. Am. Meteorol. Soc., 78, 1097–1106, https://doi.org/10.1175/1520-0477(1997)078<1097:HDITTF>2.0.CO;2, 1997. a
Stewart, M. K.: Stable isotope fractionation due to evaporation and isotopic exchange of falling waterdrops: Applications to atmospheric processes and evaporation of lakes, J. Geophys. Res., 80, 1133, https://doi.org/10.1029/JC080i009p01133, 1975. a
Sultan, B., Baron, C., Dingkuhn, M., Sarr, B., and Janicot, S.: Agricultural impacts of large-scale variability of the West African monsoon, Agric. Forest Meteorol., 128, 93–110, https://doi.org/10.1016/j.agrformet.2004.08.005, 2005. a
Tharammal, T., Bala, G., and Noone, D.: Impact of deep convection on the isotopic amount effect in tropical precipitation, J. Geophys. Res., 122, 1505–1523, https://doi.org/10.1002/2016JD025555, 2017. a
Toride, K., Yoshimura, K., Tada, M., Diekmann, C., Ertl, B., Khosrawi, F., and Schneider, M.: Potential of Mid‐tropospheric Water Vapor Isotopes to Improve Large‐Scale Circulation and Weather Predictability, Geophys. Res. Lett., 48, e2020GL091698, https://doi.org/10.1029/2020GL091698, 2021. a
Torri, G.: Isotopic Equilibration in Convective Downdrafts, Geophys. Res. Lett., 49, e2022GL098743, https://doi.org/10.1029/2022GL098743, 2022. a
Tremoy, G., Vimeux, F., Mayaki, S., Souley, I., Cattani, O., Risi, C., Favreau, G., and Oi, M.: A 1-year long δ18O record of water vapor in Niamey (Niger) reveals insightful atmospheric processes at different timescales, Geophys. Res. Lett., 39, L08805, https://doi.org/10.1029/2012GL051298, 2012. a, b, c
Tremoy, G., Vimeux, F., Soumana, S., Souley, I., Risi, C., Favreau, G., and Oï, M.: Clustering mesoscale convective systems with laser-based water vapor δ18O monitoring in niamey (Niger), J. Geophys. Res., 119, 5079–5103, https://doi.org/10.1002/2013JD020968, 2014. a, b, c
Trent, T. and Boesch, H.: University of Leicester TROPOMI Stable Water Vapour Isotopologue (H2O-ISO) Prototype Product (Vesrion 1.0.1), Zenodo [data set], https://doi.org/10.5281/zenodo.15465255, 2025. a
Trent, T., Boesch, H., Schneider, M., Roeling, A. N., Khosrawi, F., Diekmann, C. J., and Sodemann, H. (Eds.): Sentinel-5p + Innovation (S5P+I) – Water Vapour Isotopologues (H2O-ISO) Algorithm Theoretical Basis Document (ATBD), ESA S5P+I Project, European Space Agency, https://s5pinnovationh2o-iso.le.ac.uk/wp-content/uploads/2021/10/S5P-I_ISO_ATBD_Version1.4.pdf (last access: 26 May 2025), 2021. a, b, c, d
Vogel, P., Knippertz, P., Fink, A. H., Schlueter, A., and Gneiting, T.: Skill of global raw and postprocessed ensemble predictions of rainfall over Northern Tropical Africa, Weather Forecast., 33, 369–388, https://doi.org/10.1175/WAF-D-17-0127.1, 2018. a
Wiegele, A., Schneider, M., Hase, F., Barthlott, S., García, O. E., Sepúlveda, E., González, Y., Blumenstock, T., Raffalski, U., Gisi, M., and Kohlhepp, R.: The MUSICA MetOp/IASI H2O and δD products: characterisation and long-term comparison to NDACC/FTIR data, Atmos. Meas. Tech., 7, 2719–2732, https://doi.org/10.5194/amt-7-2719-2014, 2014. a
Worden, J., Noone, D., Bowman, K., Beer, R., Eldering, A., Fisher, B., Gunson, M., Goldman, A., Herman, R., Kulawik, S. S., Lampel, M., Osterman, G., Rinsland, C., Rodgers, C., Sander, S., Shephard, M., Webster, C. R., and Worden, H.: Importance of rain evaporation and continental convection in the tropical water cycle, Nature, 445, 528–532, https://doi.org/10.1038/nature05508, 2007. a, b, c
Worden, J. R., Kulawik, S. S., Fu, D., Payne, V. H., Lipton, A. E., Polonsky, I., He, Y., Cady-Pereira, K., Moncet, J.-L., Herman, R. L., Irion, F. W., and Bowman, K. W.: Characterization and evaluation of AIRS-based estimates of the deuterium content of water vapor, Atmos. Meas. Tech., 12, 2331–2339, https://doi.org/10.5194/amt-12-2331-2019, 2019. a, b
Worden, S., Fu, R., Chakraborty, S., Liu, J., and Worden, J.: Where Does Moisture Come From Over the Congo Basin?, J. Geophys. Res.-Biogeo., 126, e2020JG006024, https://doi.org/10.1029/2020JG006024, 2021. a, b
Yoshimura, K., Kanamitsu, M., and Dettinger, M.: Regional downscaling for stable water isotopes: A case study of an atmospheric river event, J. Geophys. Res.-Atmos., 115, D18114, https://doi.org/10.1029/2010JD014032, 2010. a
- Abstract
- Introduction
- Data and methods
- Convective-scale variability of {H2O, δD} pair signals
- Interannual variability of convective {H2O, δD} signals during the peak monsoon
- Mean seasonal cycle of {H2O, δD} signals
- Conclusion and outlook
- Data availability
- Author contributions
- Competing interests
- Disclaimer
- Acknowledgements
- Financial support
- Review statement
- References