the Creative Commons Attribution 4.0 License.
the Creative Commons Attribution 4.0 License.
 | 02 Jun 2025
Quantified ice-nucleating ability of AgI-containing seeding particles in natural clouds
Christopher Fuchs
Fabiola Ramelli
Huiying Zhang
Nadja Omanovic
Robert Spirig
Claudia Marcolli
Zamin A. Kanji
Ulrike Lohmann
Jan Henneberger
For decades, silver iodide (AgI) has been widely used for laboratory ice nucleation experiments and glaciogenic cloud-seeding operations due to its ability to nucleate ice at relatively warm temperatures (up to −3 °C). Despite being one of the most well-characterized ice-nucleating substances, gaps remain in the understanding of how its ice nucleation behavior in the laboratory translates to natural clouds. Here, we present, for the first time, measurements of the ice-nucleated fractions (INFs) of AgI-containing seeding particles, derived from in situ measurements of ice crystal number concentrations (ICNC) and seeding particle number concentrations during glaciogenic cloud-seeding experiments. The experiments were performed as part of the CLOUDLAB project, in which we used targeted cloud seeding with an uncrewed aerial vehicle to try to answer fundamental questions about ice-phase cloud microphysics. Data from 16 seeding experiments show strong linear correlations between ICNC and seeding particle concentration, indicating relatively constant INFs throughout each experiment. Median INFs (0.07 %–1.63 %) were found to weakly increase with decreasing cloud temperature at seeding height (range of −5.1 to −8.3 °C). We compare our results with previous key laboratory experiments and discuss the possible freezing mechanisms. This study can help to bridge the gap in understanding of AgI ice nucleation behavior between laboratory and field experiments which further helps to inform future cloud-seeding operations.
- Article
(2345 KB) - Full-text XML
- BibTeX
- EndNote


The presence of ice in mixed-phase clouds is important for precipitation formation and Earth's radiative balance. Cloud droplets can freeze either through homogeneous nucleation (below −38 °C) or through heterogeneous nucleation, where the ice phase nucleates with the help of an ice-nucleating particle (INP) at temperatures between 0 and −38 °C (Pruppacher and Klett, 1978; Lohmann et al., 2016). After ice nucleation, ice crystals may grow through vapor deposition, often at the expense of surrounding cloud droplets if the ambient vapor pressure is between the saturation vapor pressures of liquid water and ice (Wegener–Bergeron–Findeisen (WBF) process, Wegener, 1911; Bergeron, 1935; Findeisen, 1938). Additionally, ice crystals can also grow through collisions with cloud droplets (riming) and other ice crystals (aggregation) until they are large and heavy enough to sediment out of the cloud as precipitation (Lohmann et al., 2016). In this way, ice nucleation in a supercooled liquid cloud can lead to rapid glaciation, precipitation, and ultimately dissipation of the cloud.
Scientists have been studying the process from ice nucleation to precipitation for decades to better understand cloud evolution for improving weather forecasts or for attempting weather modification. Since the discovery (Vonnegut, 1947) of the potential for silver iodide (AgI) to be an efficient INP (1 µm particles froze already at −4 °C), it has been used across the globe for cloud-seeding projects (e.g., Vonnegut, 1949; Hobbs, 1975; Holroyd et al., 1988; Huggins, 2007; Griffith et al., 2009; Kulkarni et al., 2019; Tessendorf et al., 2019; Dong et al., 2020; Al Hosari et al., 2021; Wang et al., 2021; Benjamini et al., 2023), and it has been the subject of numerous laboratory ice nucleation studies (e.g., Mason and van den Heuvel, 1959; Edwards and Evans, 1962; Gokhale and Goold, 1968; Sax and Goldsmith, 1972; Langer et al., 1978; Schaller and Fukuta, 1979; DeMott, 1988; Feng and Finnegan, 1989; DeMott, 1995; Zimmermann et al., 2007; Nagare et al., 2016; Shafiei et al., 2023; Chen et al., 2024), making AgI one of the most well-characterized ice-nucleating substances. The review by Marcolli et al. (2016) demonstrates the wealth of laboratory research on the ice nucleation efficiency of AgI, but it also shows the lack of agreement between studies, like how exactly the ice-nucleating ability depends on temperature or particle size. Furthermore, it is unclear how the results of laboratory experiments translate to seeding experiments in natural clouds as cloud-seeding field studies have not been able to quantify the ice-nucleating ability of the seeding particles. Therefore, while it is clear that AgI is an effective INP, both in the laboratory and in natural clouds, there is still no consensus about fundamental aspects, e.g., what fraction of seeding particles can be expected to nucleate ice in a given cloud environment or what freezing mechanisms are at play. Here, we aim to tackle these questions by presenting measurements of the ice-nucleated fraction (INF) of AgI-containing seeding particles from 16 seeding experiments in natural clouds and using our results to investigate the freezing mode in our experiments.
Heterogeneous ice nucleation with INPs has typically been split into various freezing mechanisms or modes, namely, the immersion, condensation, deposition, and contact freezing modes (e.g., Vali et al., 2015; Kanji et al., 2017). The different freezing modes have historically been derived in the context of laboratory studies, where the method of nucleating ice in cloud chambers affects how the ice nucleation efficiency is quantified and what other factors it depends on. In immersion freezing, the INP is fully immersed in a cloud droplet or aqueous solution droplet before ice nucleation takes place. Condensation freezing, however, is thought to occur when the particle activates into a cloud droplet concurrently to the ice phase forming, at high enough supersaturations for the particle's activation. In deposition nucleation, the ice forms while the INP is in water-subsaturated conditions, which may be either from water vapor depositing as ice onto the INP or, more recently proposed, when nucleation occurs in microscopic pores on the INP's surface that hold liquid water (pore condensation freezing; Marcolli, 2014; David et al., 2019). Lastly, contact freezing occurs through nucleation at the air–liquid–particle triple interface as a result of collisions between INPs and cloud droplets, which depends strongly on their collision rates. Through the lens of these different freezing mechanisms, we can better interpret the results of our experiments in the context of the existing laboratory literature.
Our experiments presented here were conducted as part of the CLOUDLAB project (Henneberger et al., 2023; Miller et al., 2024b). The goal of CLOUDLAB was to conduct glaciogenic cloud-seeding experiments to study ice-phase cloud microphysics in natural clouds, such as ice nucleation (this paper), ice crystal growth rates (Ramelli et al., 2024), the WBF representation in numerical weather prediction models (Omanovic et al., 2024), and ice aggregation and riming (future publications in preparation). CLOUDLAB used a novel seeding approach in which an uncrewed aerial vehicle (UAV) equipped with burn-in-place flares released AgI-containing particles within supercooled stratus clouds over the Swiss Plateau. We then measured the resulting cloud microphysical changes 4–16 min downwind with a holographic imager for cloud particles and an optical particle counter for aerosols mounted on a tethered balloon, along with ground-based cloud radars. With these in situ measurements of ice crystal number concentration and aerosol concentrations, we could derive the fraction of seeding particles which caused ice nucleation (i.e., the ice-nucleated fraction, INF), which, to our knowledge, has never been done before for cloud-seeding experiments in natural clouds. This work aims to complement the existing literature on AgI ice nucleation and bridge the gap between laboratory and field experiments.
First, in Sect. 2, we present the seeding method, instrumentation, and the calculation for INF. In Sect. 3.1, a case study of a seeding experiment is provided before we discuss and compare the INFs of all 16 experiments in Sect. 3.2. Then in Sect. 4.1 and 4.2, the possible freezing mechanism of the seeding particles is discussed, and the INFs are compared with previous AgI ice nucleation laboratory studies.
The CLOUDLAB project consisted of three winter field campaigns in January–March 2022, December 2022–February 2023, and December 2023–February 2024. The campaigns were conducted in Eriswil, Switzerland, with the main measurement site ( N, E; 920 m elevation) containing a suite of remote sensing and in situ instrumentation (see Henneberger et al., 2023, for the detailed overview). The instrumentation and methods related to this study are described below, including the seeding experiments, the seeding UAV, and the tethered balloon system (TBS) which carried the HOLographic Imager for Microscopic Objects (HOLIMO; Ramelli et al., 2020) and a portable optical particle counter (POPS Handix Scientific; Gao et al., 2016).
2.1 Seeding experiments
A seeding experiment proceeded as follows (illustrated in Fig. 1). The seeding UAV flew to a selected location in the supercooled cloud of interest, 1000–3000 m upwind of the main measurement site. The UAV then released seeding particles for approximately 5 min from a burn-in-place flare, while flying up to six 200–400 m legs perpendicular to the wind direction at constant altitude. The newly formed ice crystals subsequently grew by vapor deposition, riming, and aggregation until they reached the main measurement site (advected by the wind). There, the ice crystals, cloud droplets, and un-nucleated seeding particles were measured by HOLIMO and POPS aboard the TBS. Meanwhile, the cloud and the seeding patches were also continuously monitored by ground-based cloud radars (here, the 35.12 GHz Doppler radar (Mira-35, METEK) in vertical-pointing mode). An extensive description of how we performed the seeding experiments is provided in Henneberger et al. (2023) and Miller et al. (2024b).
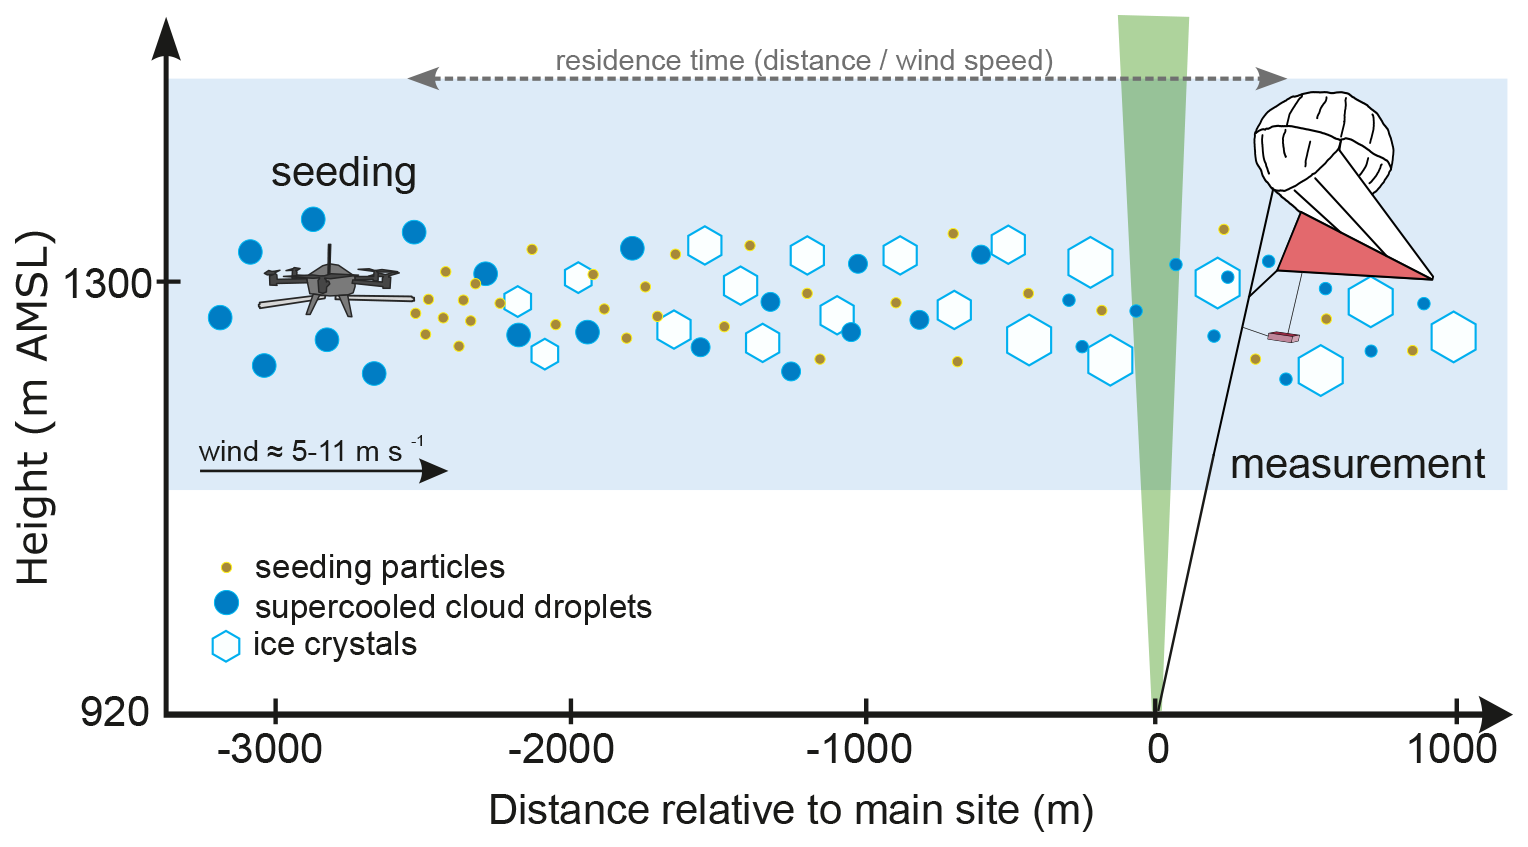
Figure 1Schematic overview of the CLOUDLAB seeding experiments, with instrumentation relevant to this study. The seeding UAV releases seeding particles from a burn-in-place flare, in a supercooled cloud, upwind of the main measurement site. A tethered balloon system and a ground-based vertical-pointing cloud radar monitor the cloud microphysics. Figure adapted from Henneberger et al. (2023).
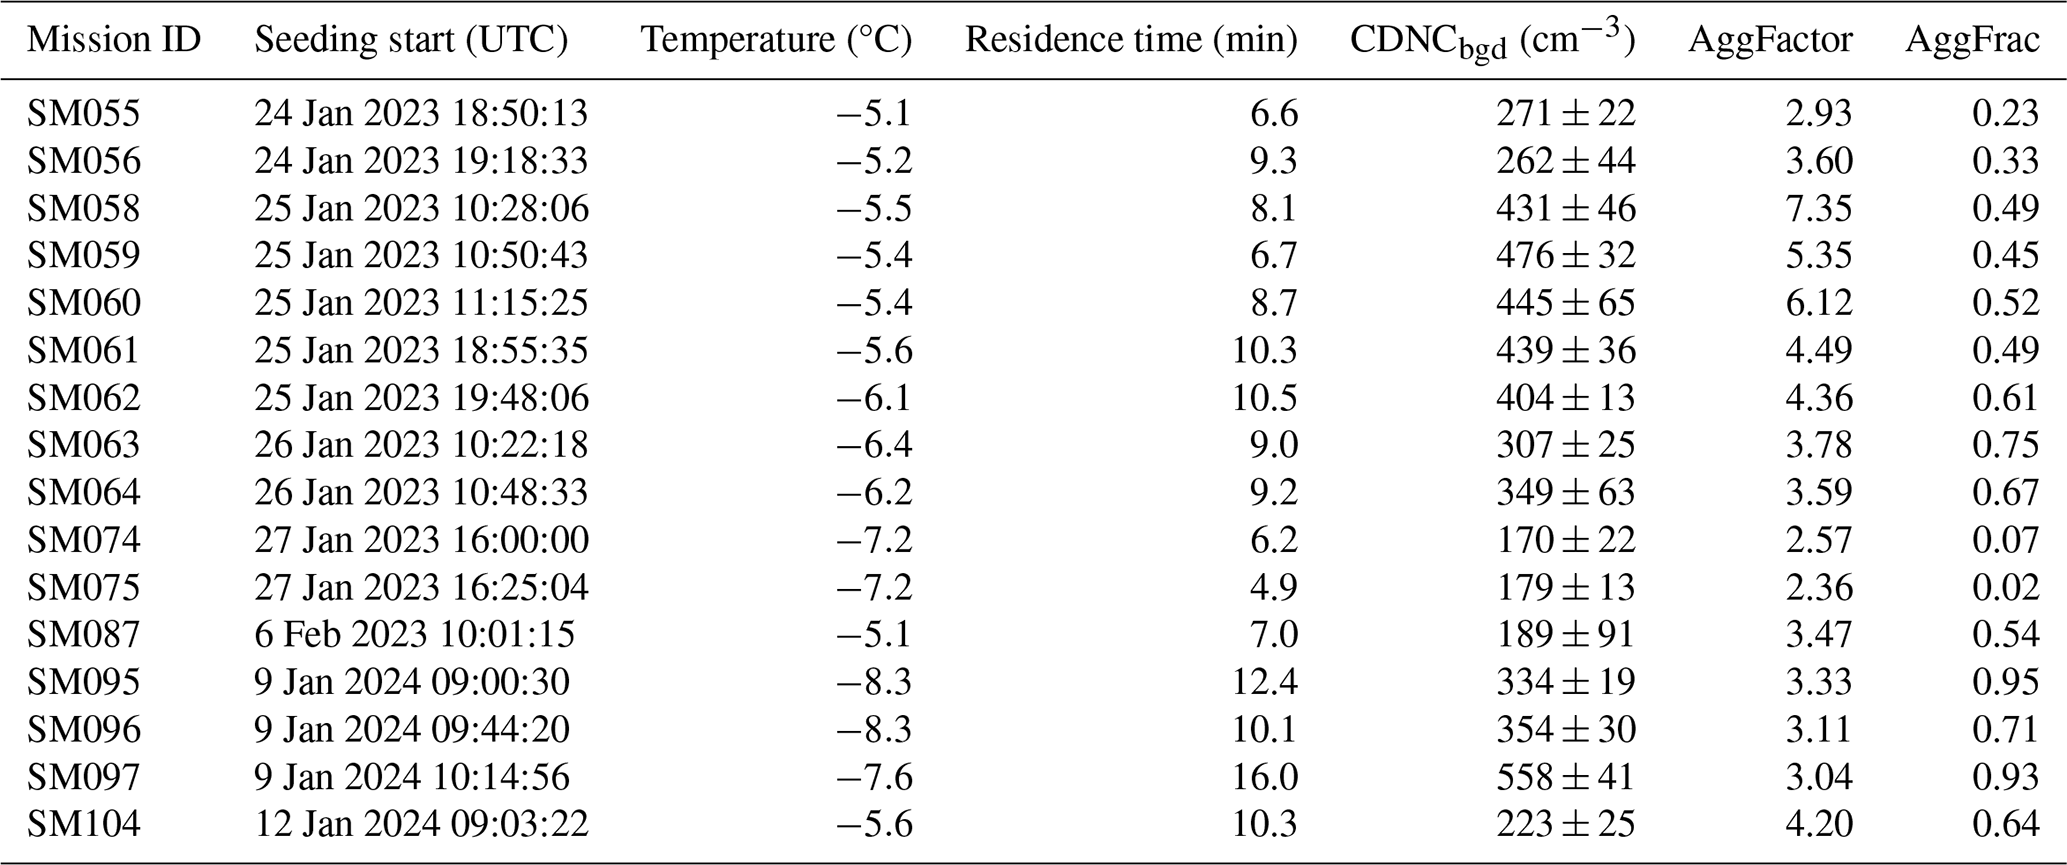
Over the three winter campaigns, 78 in-cloud seeding experiments were conducted. In this paper, we focus on a subset of 16 experiments for which there are good-quality measurements available from both HOLIMO and POPS (described in Sect. 2.3). These 16 experiments were carried out at varying seeding temperatures (−5.1 to −8.3 °C), residence times (4.9 to 15.9 min, i.e., the time between seeding and measuring aboard the TBS), and background cloud properties like cloud droplet number concentrations (170 to 560 cm−3). Table 1 provides an overview of the experiments presented in this study.
Table 1Overview of the 16 seeding experiments included in this study: the mission ID, the date and time of the start of the experiment, the temperature at seeding height in the cloud (°C), the residence time (min, time between seeding and measurement), the background median cloud droplet number concentration ± standard deviation (CDNCbgd, cm−3, defined in Sect. 2.3.1), the mean aggregation factor of ice crystals (AggFactor, defined in Sect. 2.3.1), and the total fraction of ice aggregates during the experiment (AggFrac) are shown.
2.2 Seeding material and UAV
The seeding flares (Zeus MK2, Cloud Seeding Technologies, Germany) contained a 200 g mixture of silver iodide (AgI, ≈12 %), other iodine-containing compounds (≈15 %), and supplementary materials including ammonium perchlorate (NH4ClO4), catalysts, and fuel binder (Chen et al., 2024); the exact composition cannot be disclosed for proprietary reasons. The particle diameter of the produced particles depends on the air speed (wind speed and UAV flight velocity), where a slower air speed produces larger particles. In the CLOUDLAB seeding experiments, the flares experienced typical air speeds of 10 m s−1, for which Chen et al. (2024) measured a dry mode diameter of 120 nm in the laboratory. Henneberger et al. (2023) showed that most of the seeding particles were <200 nm when the flare burned in clear-sky conditions (low relative humidity). These AgI-containing seeding particles are expected to initiate ice nucleation at temperatures as high as −5 °C (Chen et al., 2024). Each flare burns for approximately 5 min, and here we used a single flare per seeding experiment.
The seeding UAV is a modified Meteodrone MM-670 (Meteomatics AG, Switzerland), a hexacopter with 70 cm diameter and 5 kg weight. The Meteodrone, originally designed for meteorological profiling (Leuenberger et al., 2020; Hervo et al., 2023), was modified to be able to burn up to two burn-in-place cloud-seeding flares (Miller et al., 2024b). The UAV has integrated heating on the rotor blades to prevent a build-up of ice in icing conditions (Miller et al., 2024a). With this deicing system, the UAV can fly within supercooled clouds, allowing us to perform our in-cloud seeding experiments. The UAV is equipped with sensors for measuring temperature (±0.1 °C), relative humidity (±1.8 % at 23 °C between 0 %–90 % RH), and pressure (±1.5 hPa), with a 10 Hz sampling rate (Hervo et al., 2023; Miller et al., 2024b).
2.3 Tethered balloon system for in situ measurements
The in situ cloud microphysical measurements were taken using our tethered balloon system (TBS, HoloBalloon; Ramelli et al., 2020; Henneberger et al., 2023), consisting of a 200 m3 kite-balloon (Desert Star, Allsopp Helikites, UK) tethered to a propane winch to launch and land the balloon. The balloon can reach up to 1000 m above ground, depending on the wind and icing conditions. The instrument platform hung ≈30 m below the balloon and carried primarily HOLIMO and POPS.
2.3.1 Cloud particle measurements with HOLIMO
HOLIMO is a digital in-line holography instrument used to measure cloud particles (cloud droplets and ice crystals) of sizes 6 µm to 2 mm in a three-dimensional measurement volume of approximately 20 cm3. The instrument is detailed in Beck (2017), Ramelli et al. (2020), and Ramelli et al. (2021). Holograms were reconstructed at a temporal resolution of 5 or 20 Hz for seeding times and 1 or 10 Hz for non-seeding times (depending on the particular experiment). The data were then averaged to obtain 1 s time series and subsequently converted to 5 s rolling means to reduce noise.
Through the processing of holograms, we obtained the number and size distribution of cloud particles in the given measurement volume. Cloud particles and their phases were detected using a neural network (an updated version of Touloupas et al., 2020). All spherical particles <25 µm were classified as cloud droplets; particles >25 µm were classified as ice crystals or droplets depending on their shape. All ice crystals and large droplets were additionally hand-labeled to minimize misclassifications. Cloud droplet number concentrations (CDNCs) have an estimated uncertainty of 5 %, ice crystal number concentrations (ICNCs) for crystals larger than 100 µm have an uncertainty of 5 %–10 %, and ICNCs for crystals smaller than 100 µm have an uncertainty of 15 % (Beck, 2017). For each experiment, a background CDNC (CDNCbgd) was calculated by taking the median CDNC in the 5 min prior to (with 15 s buffer) the time of the first ice signal in HOLIMO (illustrated for the case study shown in Fig. 2d). Note that for all 16 experiments, there were no ice crystals in the background.
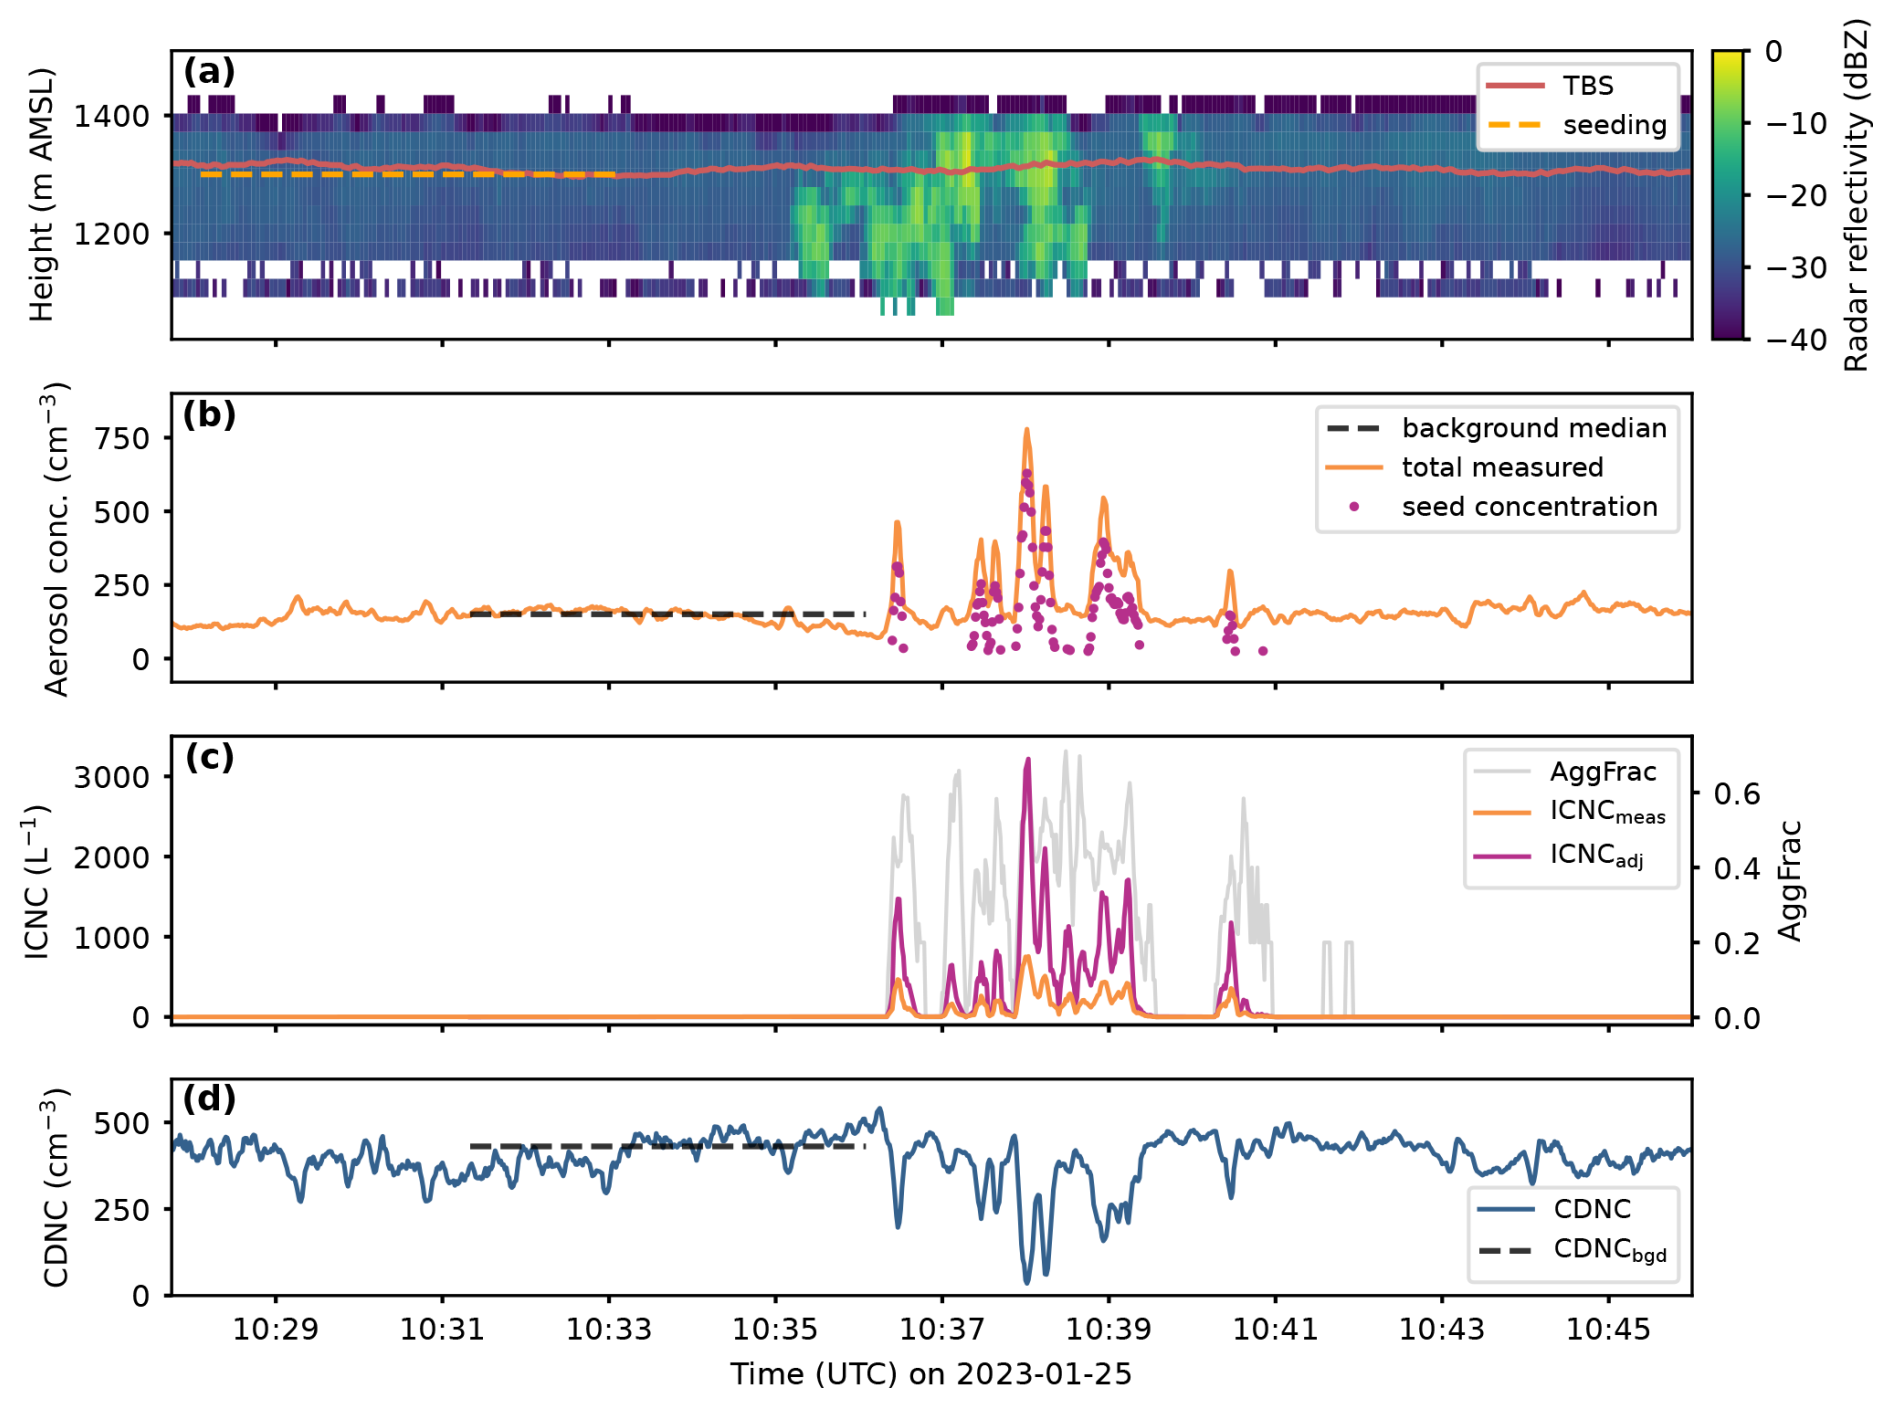
Figure 2Radar, aerosol, ice crystal, and cloud droplet data from the seeding experiment SM058. (a) Time–height plot of radar reflectivity (dBZ). Brighter colors correspond to higher reflectivity, indicating the presence of larger and/or more numerous hydrometeors. Dashed orange line: the time and height of seeding. Solid brown line: the height of the tethered balloon system (TBS). Note that the seeding occurred 2500 m upwind of the radar and that the TBS flew 280 m downwind of the radar. (b) Time series of aerosol concentration (cm−3). Dashed black line: the median background total particle number concentration (background defined as 5 min prior to first ice in HOLIMO with 15 s buffer). Orange line: the total particle number concentration. Magenta dots: the seed concentration, calculated by subtracting the background median from the total concentration, for times when the total was greater than the background plus 1 standard deviation and where ICNCmeas>0 L−1. (c) Time series of ice crystal number concentration (ICNC, L−1). Orange line: the measured ICNC (ICNCmeas). Magenta line: the ICNC adjusted for aggregation (ICNCadj), as described in Sect. 2.3.1. Grey line (with right y axis): the ratio of aggregated ice crystals to the total number of ice crystals (AggFrac). Note that the two peaks in AggFrac at around 10:42 UTC are because ICNCmeas, although it appears to be zero, was actually approx. 1 L−1 with 20 % aggregated. (d) Time series of total cloud droplet number concentration (CDNC, cm−3, blue line) with the background median cloud droplet number concentration (CDNCbgd, dashed black line).
Ice crystals were first classified by hand-labeling into “single-component” (i.e., one component per ice crystal) and “aggregated” (at least two ice components stuck together to make one larger ice crystal), which does not provide any information about the number of components in an aggregate. Because we are interested here in the ice nucleation caused by seeding, we require an estimate of how many ice crystals were initially created. For this, we used the newly developed IceDetectNet, an object-detection algorithm by Zhang et al. (2024), to estimate the aggregation factor, i.e., the number of components per aggregate, ranging from 2 to more than 11 components. For large, amorphous ice crystals with many aggregated components and/or strong riming, the components may not be distinguished and detected accurately, leading to an underestimation of the aggregation factor. However, since the ice in our experiments is fairly freshly formed (<16 min prior to measurement), we assume this issue to be negligible. For each experiment, the mean aggregation factor was then calculated (AggFactor, illustrated in Fig. A1 in Appendix A), as well as the fraction of aggregates for each 1 s measurement (AggFrac); see Table 1 for the AggFactor and the total AggFrac for each seeding experiment. Using those values, we then calculated an aggregation-adjusted ICNC (ICNCadj) from the measured ICNC (ICNCmeas):
As previously mentioned, only 16 of the 78 in-cloud seeding experiments are included in this study. This is partly due to the limited amount of HOLIMO data, as the TBS was not available for all experiments, and reconstruction of holograms with subsequent hand-labeling of hydrometeors is resource-intensive. Thus, not all available holograms have been processed yet, and we focused thus far on experiments with the highest seeding impact (according to radar reflectivity). Furthermore, some experiments were excluded not due to HOLIMO limitations but because of POPS limitations (see below).
2.3.2 Aerosol measurements with POPS
Aerosol particles were measured using the POPS aboard the TBS. POPS (Handix Scientific, USA) is a lightweight (550 g) optical particle counter measuring particle size distributions in the size range of 120 nm to 3 µm at a 1 s time resolution. POPS has become a standard instrument for in situ aerosol measurements on many balloon systems (e.g., Yu et al., 2017; Kloss et al., 2020; de Boer et al., 2018; Pilz et al., 2022; Miller et al., 2024b) and UAVs (e.g., Telg et al., 2017; Liu et al., 2021; Mei et al., 2022; Miller et al., 2024b). Here, the setup was the same as described in Miller et al. (2024b): POPS was contained in a water-tight plastic housing unit attached to the platform of the TBS. The sampling inlet (not isokinetic) consisted of an L-shaped brass tube (2 mm inner diameter) with a 3.5 cm long horizontal section directing flow into the instrument and, after a 90° bend, a 25 cm long section pointing up vertically. A small cap was placed on top of the inlet to avoid very large particles falling into the inlet. A flow rate of 3 cm3 s−1 was used, and particle losses through the inlet are expected to be minimal (Miller et al., 2024b). POPS generally has an uncertainty in total number concentration of ±10 % (Gao et al., 2016; Pilz et al., 2022).
The inlet was equipped with coiled heating wire to prevent the buildup of ice, though significant icing still sometimes occurred. Furthermore, no drying system was used prior to measurement, so the particle size distributions are humidity-dependent (very small cloud droplets may also have been sampled). There were sometimes problems with the inlet and instrument becoming wet inside after prolonged operation, blocking the pump from working properly and causing very unstable background particle measurements. To remedy this, the instrument was run in a dry room overnight in between experiment days. Still, in some seeding experiments, the seeding particle plume could not be detected above such very unstable background particle concentration, and we removed these experiments from our analysis. Future models of this POPS-TBS system would profit from a drying system for in-cloud measurements to prevent these problems.
Miller et al. (2024b) presented a new method for quality control of POPS measurements, especially when measuring at high concentrations such as in a seeding plume. The quality control method consists of examining the so-called “baseline” of POPS, which is the background scattering signal received by the detector and is essentially a measure of noise in the data. When the baseline is too high (e.g., higher than 3 times the standard deviation of the whole experiment time series), then the data are flagged and excluded. All seeding experiments presented here contain only POPS data which passed this data quality check.
POPS was thus used for continuously measuring total particle number concentrations on the TBS during seeding experiment periods, which includes both background aerosol and seeding particles, within the cloud. We obtained the seeding particle concentration by the following method. First, the default 1 s time resolution time series were converted to 5 s rolling means to reduce noise. The time series of particle concentration and ICNCmeas were then matched to correct for any time lag between the two instruments (time lags were between 0 and 30 s and appropriately matched the time drift of POPS). Then, the median background particle number concentration was calculated for each seeding experiment, where the background was defined as the 5 min prior to (with 15 s buffer) the time of the first ice signal in HOLIMO (see Fig. 2b). Next, we defined the “plume” as times when the total particle concentration was greater than the background median plus 1 standard deviation and additionally where ICNCmeas was >0 L−1. Finally, to obtain the seed concentration (seed_conc), which is only defined for times in the plume, we subtracted the background particle concentration from the total particle concentration (Fig. 2b).
2.4 Ice-nucleated fraction
To assess the ice-nucleating ability of the seeding particles in our seeding experiments, we calculated the ice-nucleated fraction (INF). The INF here is analogous to the activated fraction often used in the ice nucleation community, defined as the ratio between the number of ice particles and the total number of particles (Kanji et al., 2017). We prefer the term INF over “activated fraction” because we want to be clear in differentiating between “activation”, which is usually used for the process of aerosols becoming cloud droplets, and “nucleation”, used for the process of creating ice crystals, which may occur without the prior activation of cloud droplets. Still, we similarly calculate INF as
The denominator represents the total seeding particle concentration, because seed_conc consists of the measured particles that did not nucleate (i.e., the background-subtracted total particle number concentration, as described in Sect. 2.3.2), and the ICNCadj is assumed to be equal to the number of seeding particles that nucleated. However, it is important to note that the measured seed_conc and ICNCadj are not the initial seeding particle concentration or ice crystal concentration, because we measured them only after 4–16 min, at which point the plume was diluted due to dispersion and turbulence. As both ice crystals and aerosols disperse, we assume that the INF is representative of the initial conditions. However, we additionally note that, because ice crystals and aerosol particles have different sizes, their differences in dispersion behavior likely lead to uncertainties in the calculated INF. Furthermore, this INF relies on the assumption that no significant secondary ice production occurred in our experiments, which is based on the fact that very few large droplets (radii >20 µm) were present and that very few splinters were observed. If there would have been significant secondary ice production, our estimated INF would be an overestimation.
The results are divided into two parts. First, we will present results from one seeding experiment to show how a seeding experiment typically proceeded. Then, we will discuss all 16 experiments by comparing their INFs and other experimental parameters. After, in the Discussion (Sect. 4), we consider potential ice nucleation mechanisms and compare our results to previous studies.
3.1 Case study of a seeding experiment
Observations from the seeding experiment (SM058) on 25 January 2023 are illustrated in Fig. 2. The radar reflectivity (Fig. 2a) shows that the background cloud had a cloud-top height of approximately 1400 m a.m.s.l. with low reflectivity (on average −29 dBZ), indicating a mostly liquid cloud. Seeding occurred at 10:28–10:33 UTC, 2500 m upwind of the main measurement site at a height of 1300 m a.m.s.l., where the seeding UAV flew four 400 m legs perpendicular to the prevailing wind direction while releasing seeding particles. Cloud temperature at seeding height was −5.5 °C at the time of seeding. The seeding patch is clearly visible in the radar reflectivity, characterized by the increase up to −2 dBZ for 5 min (corresponding to the 5 min of flare burning). The increase begins 7.1 min after the start of seeding (corresponding to the time it took the plume to be transported 2500 m horizontally with an average wind speed of 5.8 m s−1). These high reflectivities are indicative of ice crystals in the cloud. Although seeding occurred only at 1300 m altitude, the seeding patch in the radar signal covers the entire vertical extent of the cloud, indicating vertical mixing, updrafts triggered by the latent heat release, and sedimentation of ice crystals.
The aerosol concentrations, measured aboard the TBS (height of the TBS in Fig. 2a), are shown in Fig. 2b for the same period. The total particle number concentrations in the background lie around 150 cm−3 (i.e., the background median) and spike during the passing of the seeding plume up to 800 cm−3. We can thus distinguish between the background aerosol and the seeding particles by subtracting the background from the total concentration (as described in Sect. 2.3.2), to see that the seed concentration in the plume varied between 25–630 cm−3. This variation in concentration comes from the heterogeneity of the plume and its transport: although we measure at a stationary location, the passing plume is not constant but rather meanders due to turbulence in all directions. Additionally, the plume is expected to arrive at the measurement site in (ideally) four patches corresponding to the four flown legs, although turbulence and dispersion merge and redistribute the patches. When seed concentrations peak in the time series, it indicates that we were measuring nearly at the center of the plume, whereas the lower concentrations rather indicate measurements at the plume edge.
In the ICNC measurements (Fig. 2c), the passing of the (non-constant) plume is again obvious, seen as the peaks between 10:36–10:41 UTC, whereas before and after seeding ICNC was approximately 0 L−1. We show both the measured ICNC (ICNCmeas) and the aggregation-adjusted ICNC (ICNCadj) to illustrate the difference between the two. Where ICNCmeas has its maximum at 750 L−1, ICNCadj peaks at 3200 L−1, more than 4 times higher. At other times, ICNCadj is only 1.5 times greater than ICNCmeas. In fact, we see that at higher ICNC and seed concentrations, i.e., towards the middle of the plume, there tends to be a higher fraction of aggregated ice (AggFrac, grey; a linear regression between ICNCmeas and AggFrac for this experiment shows a significant correlation with Pearson correlation coefficient (r from here on) r=0.65, p<0.0001). This relationship is expected given that the aggregation rate depends on the number of ice crystals in a given volume. Note that ICNCs in natural mixed-phase clouds without secondary ice production are on the order of 0.1 L−1 at −10 °C (Lohmann et al., 2016), so our seeding plume has ICNCs of several orders of magnitude higher than natural clouds.
Finally, the corresponding CDNC measurements for this experiment (Fig. 2d) show that while the cloud droplet population is relatively stable (CDNCbgd=431 cm−3) before and after seeding, the CDNC has marked decreases in the seeded patch. These decreases in CDNC are the result of the WBF process, whereby the produced ice crystals grow by vapor deposition at the expense of evaporating cloud droplets, explored in greater detail in Omanovic et al. (2024) and Ramelli et al. (2024).
Comparing the time series in Fig. 2, it is notable how well the timing of the peaks align. The slight discrepancy in time between the radar reflectivity (Fig. 2a) and the TBS measurements (Fig. 2b–d) can be explained by the spatial offset between the radar and TBS. In this experiment, the TBS was flying 280 m downwind of the radar (the TBS anchor is only 50 m away from the radar position, but the balloon and measurement platform are horizontally displaced with the wind while airborne; see Fig. 1); thus, the plume needed more time to reach the TBS. Even so, the pattern of the high radar reflectivity corresponds to the pattern of peaks in ICNC: the tallest peak in ICNC occurs at around 2.5 min after the start, corresponding to the area of highest reflectivity in the radar at a similar timing, and the small patch after 5 min in the radar corresponds to the extra peak at the end in the ICNC.
Furthermore, there is an excellent correlation between the seed concentration and ICNC, which can be seen more explicitly in Fig. 3a, where the seed concentration was regressed with ICNCadj, showing a strong linear trend (r=0.86, p<0.001). The strong correlation shows that the ice crystals were formed via heterogeneous ice nucleation by the AgI-containing seeding particles. The linearity of the relationship is surprising for two main reasons. First, it indicates just how well the plume of seeding particles matched the plume of ice crystals, despite aerosols and ice crystals having sizes that are different by orders of magnitude and thus differences in fall speeds as well as different reactions to turbulence within the cloud. These differences in flow patterns mean that after the 2500 m horizontal distance, the plume of seeding particles and ice crystals might not align, but the presence of a strong linear correlation indicates that they were indeed aligned. Second, the linearity is surprising because it means that nearly everywhere in the plume the ratio of ice crystals to seeding particles was almost constant. Indeed, the INF converges to a constant value at higher seed concentrations (>200 cm−3), which is in excellent agreement with the median INF of 0.58 %, shown in Fig. 3b. At low seed concentrations (0–200 cm−3), there were higher INFs up to 4 %, which may be due to a greater mismatch at the plume edges but also likely just due to the higher amount of scatter in the data at low concentrations amplified by dividing by those small numbers. One might expect a plateauing of ICNC at high seed concentration, which would indicate over-seeding, i.e., that at some point there are more seeding particles than there is the capability to make ice. Since we did not observe this in our data, it implies that we were in an aerosol-limited regime, where more seeding particles would still result in more ice crystals.
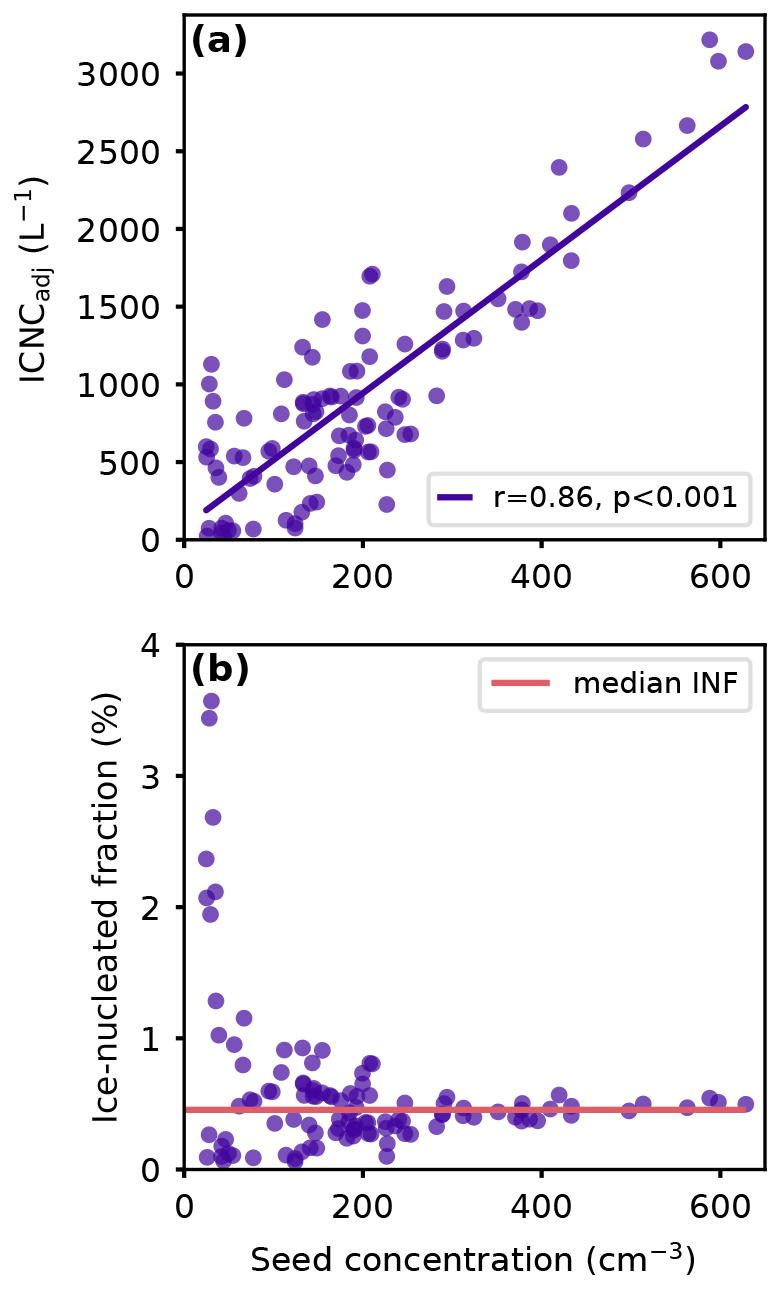
Figure 3(a) The seed concentration (cm−3) correlated to the aggregation-adjusted ICNC (ICNCadj, L−1) for times in the seeding plume during the seeding experiment SM058 on 25 January 2023. A linear regression was fit to the data (, r=0.86, p<0.001). (b) The seed concentration correlated to the ice-nucleated fraction (INF, %). The pink line shows the median INF at 0.58 %.
3.2 Ice-nucleated fraction across all seeding experiments
The good linear correlation between ICNCadj and seed concentration observed in the seeding experiment discussed in the previous section was also observed in all other seeding experiments (Fig. B1 in Appendix B). Interestingly, the slope of the linear relationship varied across experiments, corresponding to different median INFs (Fig. B2). To investigate the possible causes of the variation in INFs across experiments, we assessed the linear relationships between the median INFs and temperature, residence time, and background cloud droplet number concentration (CDNCbgd), shown in Fig. 4 and summarized in a qualitative causal graph (Pearl, 2009) in Fig. 5. Further linear correlations between these variables and background liquid water content (LWCbgd), background mean cloud droplet diameter (dmean,bgd), and AggFactor are shown in Fig. C1 in Appendix C.
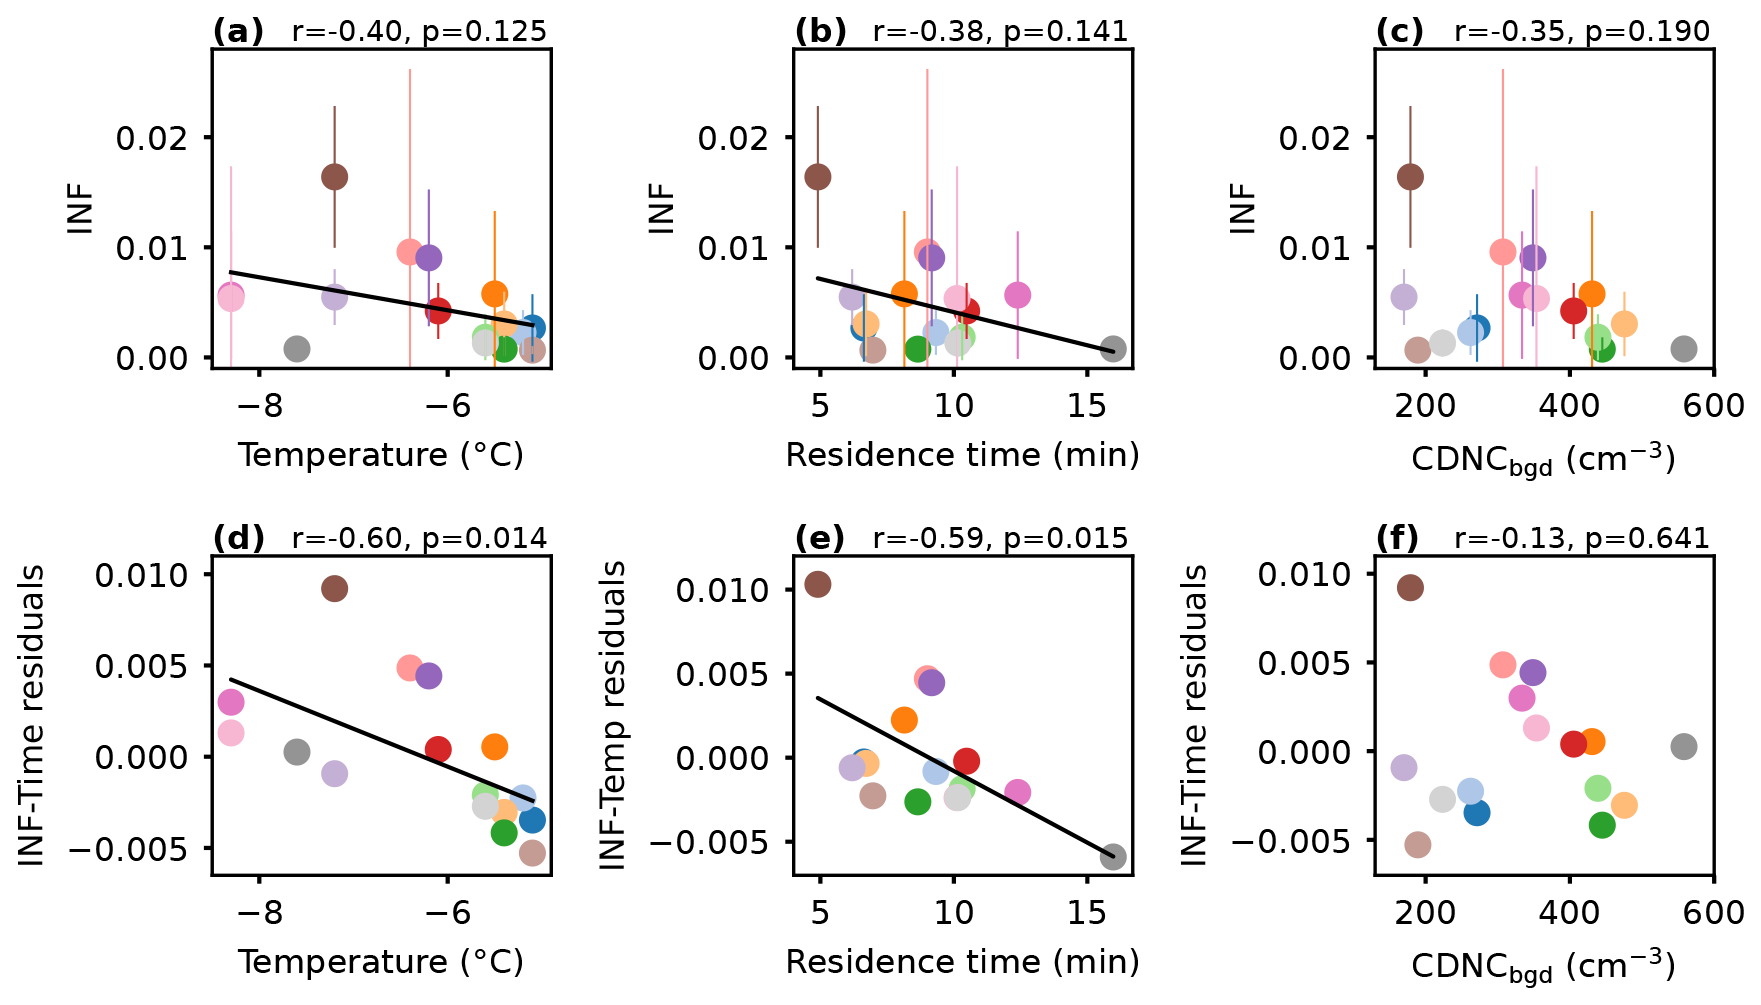
Figure 4(a) Temperature (°C) correlated to ice-nucleated fraction (INF) for every seeding experiment, with a linear regression (, , p=0.125). INFs are the median values for each experiment (one color per experiment, corresponds to Figs. B1 and B2), with error bars representing 1 standard deviation (if no error bar is visible, it is smaller than the size of the marker). (b) Residence time (time between seeding and measuring, min) correlated to INF, with a linear regression (, , p=0.141). (c) Background cloud droplet number concentration (CDNCbgd, cm−3) correlated to INF. The linear regression was not significant at the 15 % significance level (, p=0.190). (d) Temperature correlated to the residuals of the INF–residence time relationship (INF residuals = observed INF − INF predicted by the linear regression), with a linear regression (, p=0.014). (e) Residence time correlated to the residuals of the INF–temperature relationship, with a linear regression (, p=0.015). (f) CDNCbgd correlated to the residuals of the INF–residence time relationship. The linear regression was not significant at the 15 % significance level (, p=0.641).
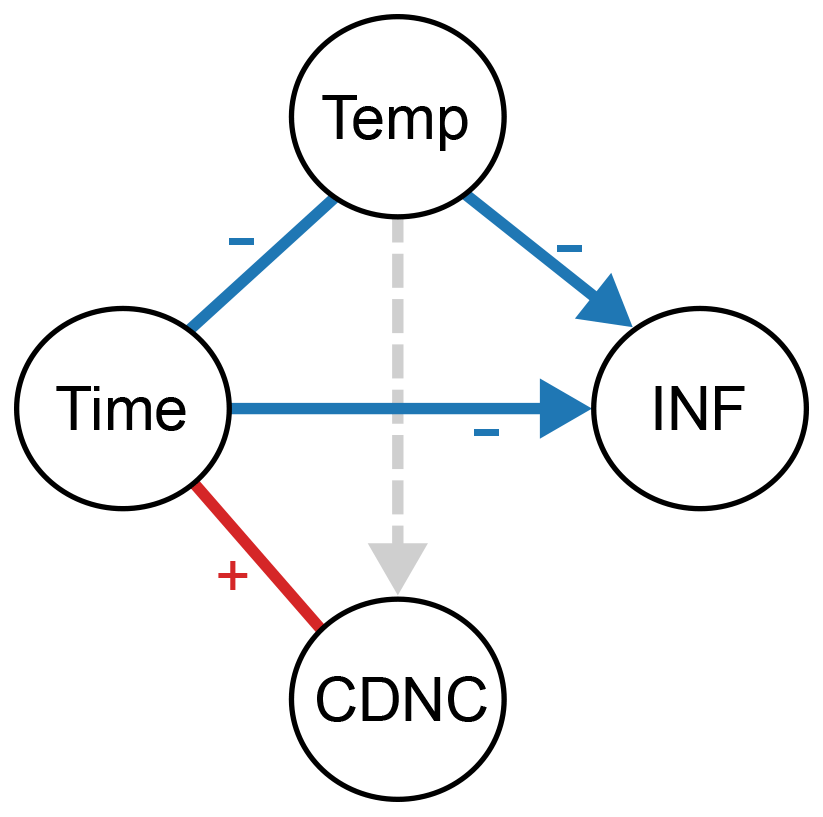
Figure 5Qualitative causal graph illustrating the relationships between temperature (Temp), residence time (Time), background cloud droplet number concentrations (CDNC), and ice-nucleated fraction (INF). The arrows indicate the direction of causality, assumed from physical knowledge. Lines without arrowheads indicate that there is no causality and that the relationship is likely due to sampling bias. Blue (red) lines indicate a significant negative (positive) linear relationship (at the 15 % significance level). The dashed grey line (Temp–CDNC) indicates that there was no significant linear relationship found in our dataset, but a positive relationship (colder temperatures → less CDNC, Korolev et al., 2003) would be expected if a larger and more balanced dataset were used.
With decreasing temperatures (more supercooling), it is expected that more seeding particles will be able to initiate ice nucleation. For our 16 seeding experiments, a weak negative linear correlation was found between temperature and INF, significant at the 15 % significance level (i.e., there is an 85 % chance that there is significance) when using the median INF for each experiment (, p=0.125, Fig. 4a; Temp → INF in Fig. 5). The linear correlation is weak likely because of the amount of natural variability and possible confounding factors in experiments in natural clouds. Indeed, in our experiments, temperature also had a significant negative linear correlation with residence time (the time between the start of flare burning and the time of the first ice signal; , p=0.125, Fig. C1a; Temp−Time in Fig. 5). There is no physical reason for this, and it likely arises from sampling bias, i.e., that our 16 experiments could not be conducted over an equally representative range of temperatures and residence times. This temperature–time relationship weakens the relationship between temperature and INF. When we regressed residence time with the residuals from the INF–temperature regression (INF residuals = observed INF − predicted INF from the regression), we found a linear relationship (, p=0.015, Fig. 4e), indicating that the variability in the INF–temperature relationship can be predicted by residence time. The opposite was also true: temperature predicted the spread in the INF–residence time relationship (, p=0.014, Fig. 4d). In other words, temperature had an effect on INF after removing the effect of time, and time had an effect on INF after removing the effect of temperature. Therefore, these correlations indicate that there was a causal relationship between temperature and INF and between residence time and INF (explored in the next paragraph), but both relationships were mediated by the other. However, it is important to note that the experiments with the shortest (4.9 min) and longest (15.6 min) residence times significantly influence the resulting trends for both residence time and temperature. When they are excluded from the analysis, there is a stronger linear correlation between INF and temperature (, p=0.059; see Fig. D1a in Appendix D), and at the same time, there is no significant correlation between INF and residence time (Fig. D1b).
Nonetheless, the weak negative linear correlation between INF and residence time for all experiments (, p=0.141; Fig. 4b; Time → INF in Fig. 5) may be explainable: longer residence times mean that the ice crystals had more time to grow, aggregate, and sediment. Even though we have attempted to correct for aggregation with ICNCadj, it is possible that we still underestimate the true concentration of nucleated ice crystals, because the aggregation factor is not representative of the highly aggregated ice crystals where the components are too difficult to distinguish. Moreover, larger aggregates sediment more than smaller ones due to their larger mass, so with longer residence times, it is likely that by measuring at seeding height we missed a greater portion of the large aggregates. This underestimation in ICNCadj could affect the experiments with longer residence times more severely, thus potentially explaining the negative trend. Otherwise, there should be no physical reason that there could be less ice nucleation with longer residence times. In fact, if contact freezing were a dominant freezing mode, we could expect that there would be more ice nucleation with longer times, since contact freezing relies on collisions with cloud droplets, and the number of collisions should increase with time. The lack of positive correlation is one indication that contact freezing is likely not dominant in our experiments. The negative correlation (or even lack of any correlation) also supports the absence of secondary ice production in our experiments; that is, if there was secondary ice production, we would expect more ice crystals to grow to a detectable size with increasing time rather than the opposite.
Further considering the possibility of nucleation via contact freezing, we correlated CDNCbgd with INF in Fig. 4c; we found no significant linear correlation at the 15 % significance level (, p=0.190). However, CDNCbgd had a significant positive linear correlation to residence time (r=0.59, p=0.015, Fig. C1h), again likely due to sampling bias (not measuring over a representative range of CDNC with varying residence times). Since residence time and INF were negatively correlated, their relationship affects that of CDNCbgd and INF. When regressing CDNCbgd with the residuals of the INF–residence time relationship, no significant linear correlation was found (r=0.23, p=0.400, Fig. 4f), indicating that CDNCbgd did not have an influence on INF after accounting for the effect of residence time. Furthermore, excluding the shortest and longest residence time experiments resulted in an even weaker CDNCbgd–INF trend (r=0.04; see Fig. D1c). Therefore, any effect of CDNCbgd on INF is mediated by residence time here, i.e., no direct effect of CDNCbgd on INF. If contact freezing were a dominant freezing mode in our experiments, then we would expect that with a higher concentration of cloud droplets a higher fraction of seeding particles would nucleate ice. Thus, the absence of a significant direct positive correlation is a second indication that contact freezing is not a dominant process in our seeding experiments.
4.1 Our proposed freezing mechanism
Based on the composition of our seeding particles, our experimental setup, and the results we have outlined thus far, we propose that our particles cause ice nucleation in the following way. Upon emission of seeding particles in the cloud at (assumed) water saturation (RH≈100 %), the seeding particles grow hygroscopically into solution droplets due to the hygroscopic material in the flare. Then (or perhaps simultaneously), some of these droplets freeze immediately if cold enough. Once there are ice crystals, the ambient saturation ratio is locally reduced as the ice crystals start growing and consuming water vapor. The larger (and/or more numerous) the ice crystals become, the more the saturation ratio is decreased and the more strong updrafts are needed to reach water saturation (Korolev and Mazin, 2003). Note that the depletion of cloud droplets visible in Fig. 2d is evidence for water-subsaturated conditions in the seeding plume when ice is present. Therefore, in water-subsaturated conditions, the remaining solution droplets shrink and become less dilute, i.e., their water activity (aw) decreases. A decreased aw means there are stronger freezing point depression effects: with every 1 % drop in RH, there is approximately 1 °C of freezing point depression (Koop et al., 2000; Zobrist et al., 2008). Thus, new ice nucleation becomes unlikely. In this way, most of the nucleation occurs at the beginning of the experiment, and only the best 0.1 %–1 % of particles initiate freezing. The best particles are likely the largest, having the most surface area (more active sites) for ice nucleation (i.e., the deterministic component of heterogeneous nucleation) and/or the ones that grow fastest to dilute solution droplets with aw≈1 (i.e., the kinetic/stochastic component).
An alternative ice nucleation pathway may occur if some local supersaturations exist in the cloud or in the seeding plume. There may be local supersaturations created by updrafts from natural small-scale turbulence or from the burning of the flare, which also introduces water vapor. As the particles are hygroscopic, small supersaturations could be enough to activate them into cloud droplets, whereby freezing occurs simultaneously to activation or immediately thereafter. However, since droplet activation just leads to further dilution at almost constant water activity, it is unlikely to stimulate more ice nucleation, as compared to freezing of unactivated dilute solution droplets. Nevertheless, after the first ice crystals start to grow, consuming water vapor, the saturation ratio will be reduced, shrinking/evaporating the leftover droplets and making continued ice nucleation unlikely, as described above.
Furthermore, we assume that contact freezing is not a dominant mode in our experiments. As described in the previous section, we do not observe positive correlations between CDNCbgd and INF or between residence time and INF. We can also consider the collision efficiencies between the seeding particles and cloud droplets. Quantifying the exact collision efficiencies is not straightforward (and beyond the scope of this study), however, and different theoretical equations can produce estimations that are different by orders of magnitude, especially given that we are in the (less-studied) subzero temperature range (Nagare et al., 2015). We can assume, though, that as our (polydisperse) seeding particles are in the size range of 0.1–1 µm, they are in the so-called Greenfield gap (Greenfield, 1957; Lohmann et al., 2016) and thus have very low collision efficiencies with cloud droplets. It is likely that hygroscopic growth and immersion freezing occur much quicker than the rate at which collisions and contact freezing could occur, corresponding to the observations by Feng and Finnegan (1989) which showed that, with hygroscopic AgI–AgCl–4NaCl particles, contact freezing did not occur because condensation/immersion freezing was so much more efficient.
4.2 Comparison with previous work
We show in Fig. 6 INFs at various temperatures from different laboratory experiments that investigated the immersion, condensation, and contact freezing modes of AgI particles, compared to the INFs found in our work. The experimental parameters of the previous studies are summarized in Table 2. In order to maintain similarity to our work, we limit our comparison to experiments which used AgI (or AgI-containing) particles of <1 µm diameter and droplet sizes of ≤100 µm in diameter and where INFs were able to be quantified. Note that in the immersion freezing studies they report frozen fractions, which are the fractions of frozen droplets to the total number of droplets, where each particle is first activated into a droplet. This is different from our calculation of INF, where we use the total number of particles and total number of ice crystals. Still, we call their frozen fractions INFs because it is a nucleated fraction of some starting population, and we place all data on the same graph for the sake of discussion. We further note that although the experimental setups, exact particle composition, and measurement techniques are not the same (and thus the measurements are not directly comparable), we still find it beneficial to discuss the data together in order to contextualize our work.
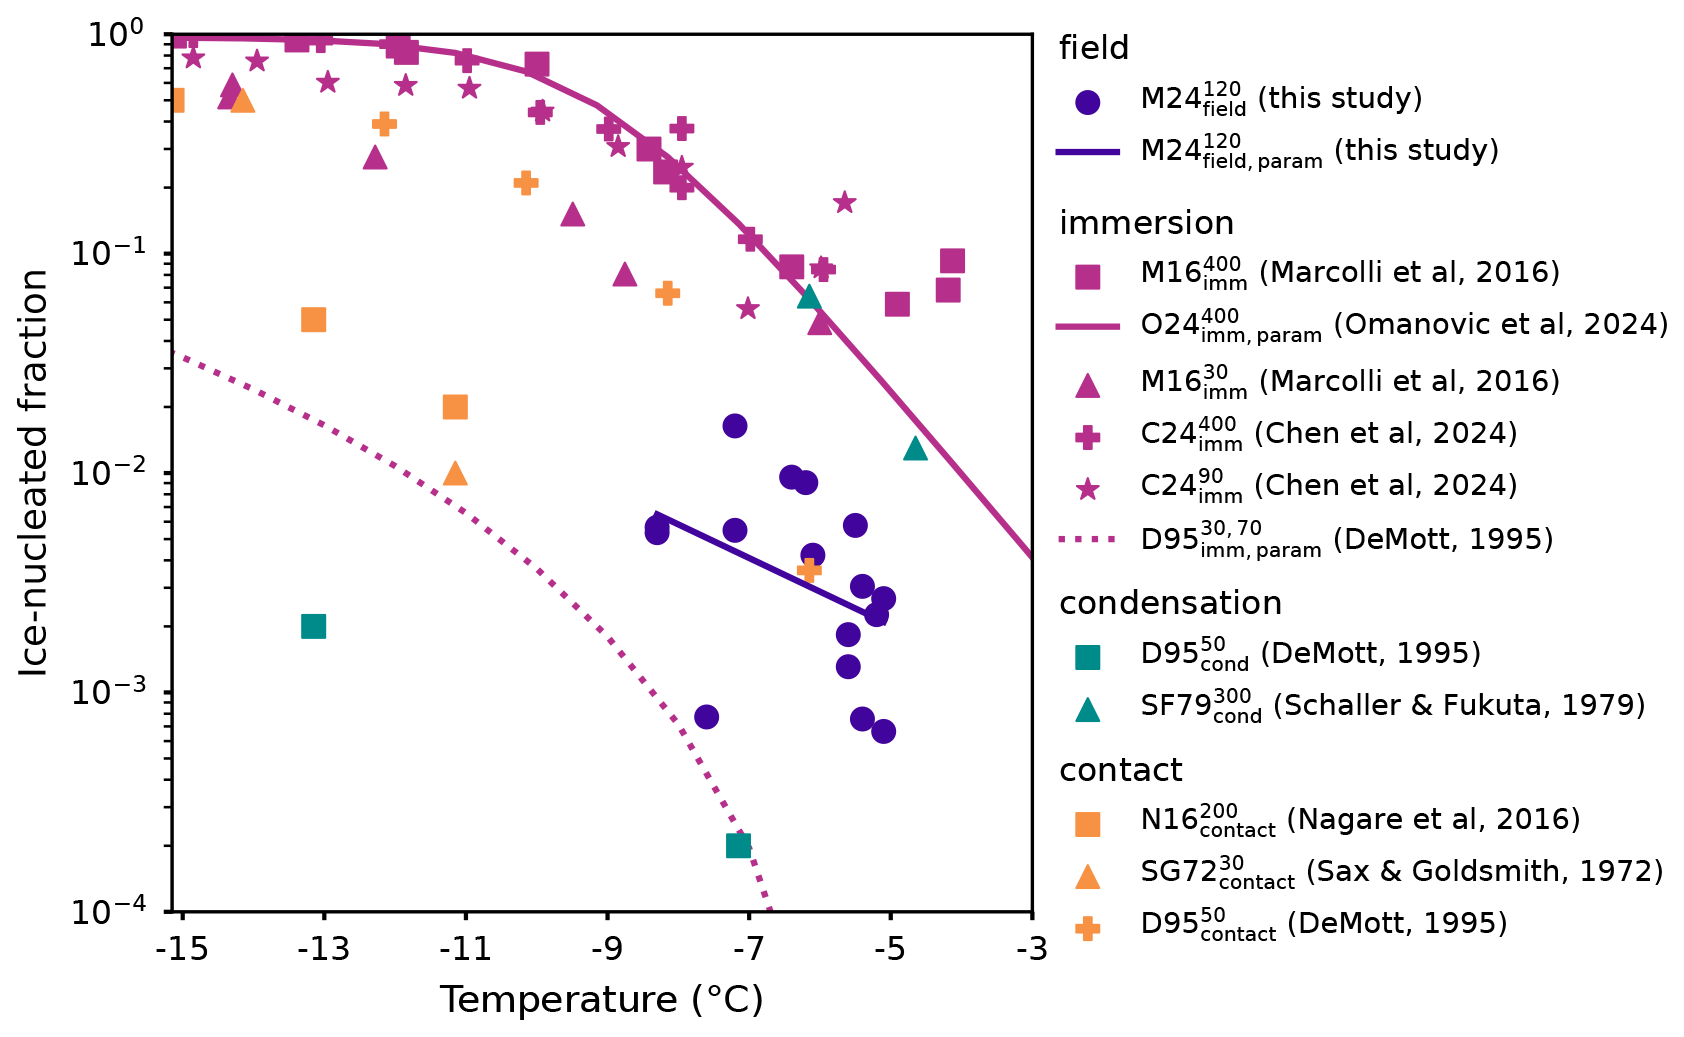
Figure 6Ice-nucleated fraction (INF) at different temperatures from this study compared to previous laboratory studies. Legend abbreviation key: means A for author name, YY for publication year, freeze for freezing mode, and size for particle size used in the experiments. (dark blue): each seeding experiment in this study (median INF) with an x−log (y) linear regression (, , p=0.12). For the immersion (magenta), condensation (teal), and contact freezing (yellow) studies, see Table 2 for details.
Table 2Summary of the experimental parameters for the freezing experiments shown in Fig. 6. means A for author name, YY for publication year, freeze for freezing mode, and size for particle size used in the experiments. “Poly.” and “mono.” mean polydisperse and monodisperse, respectively.
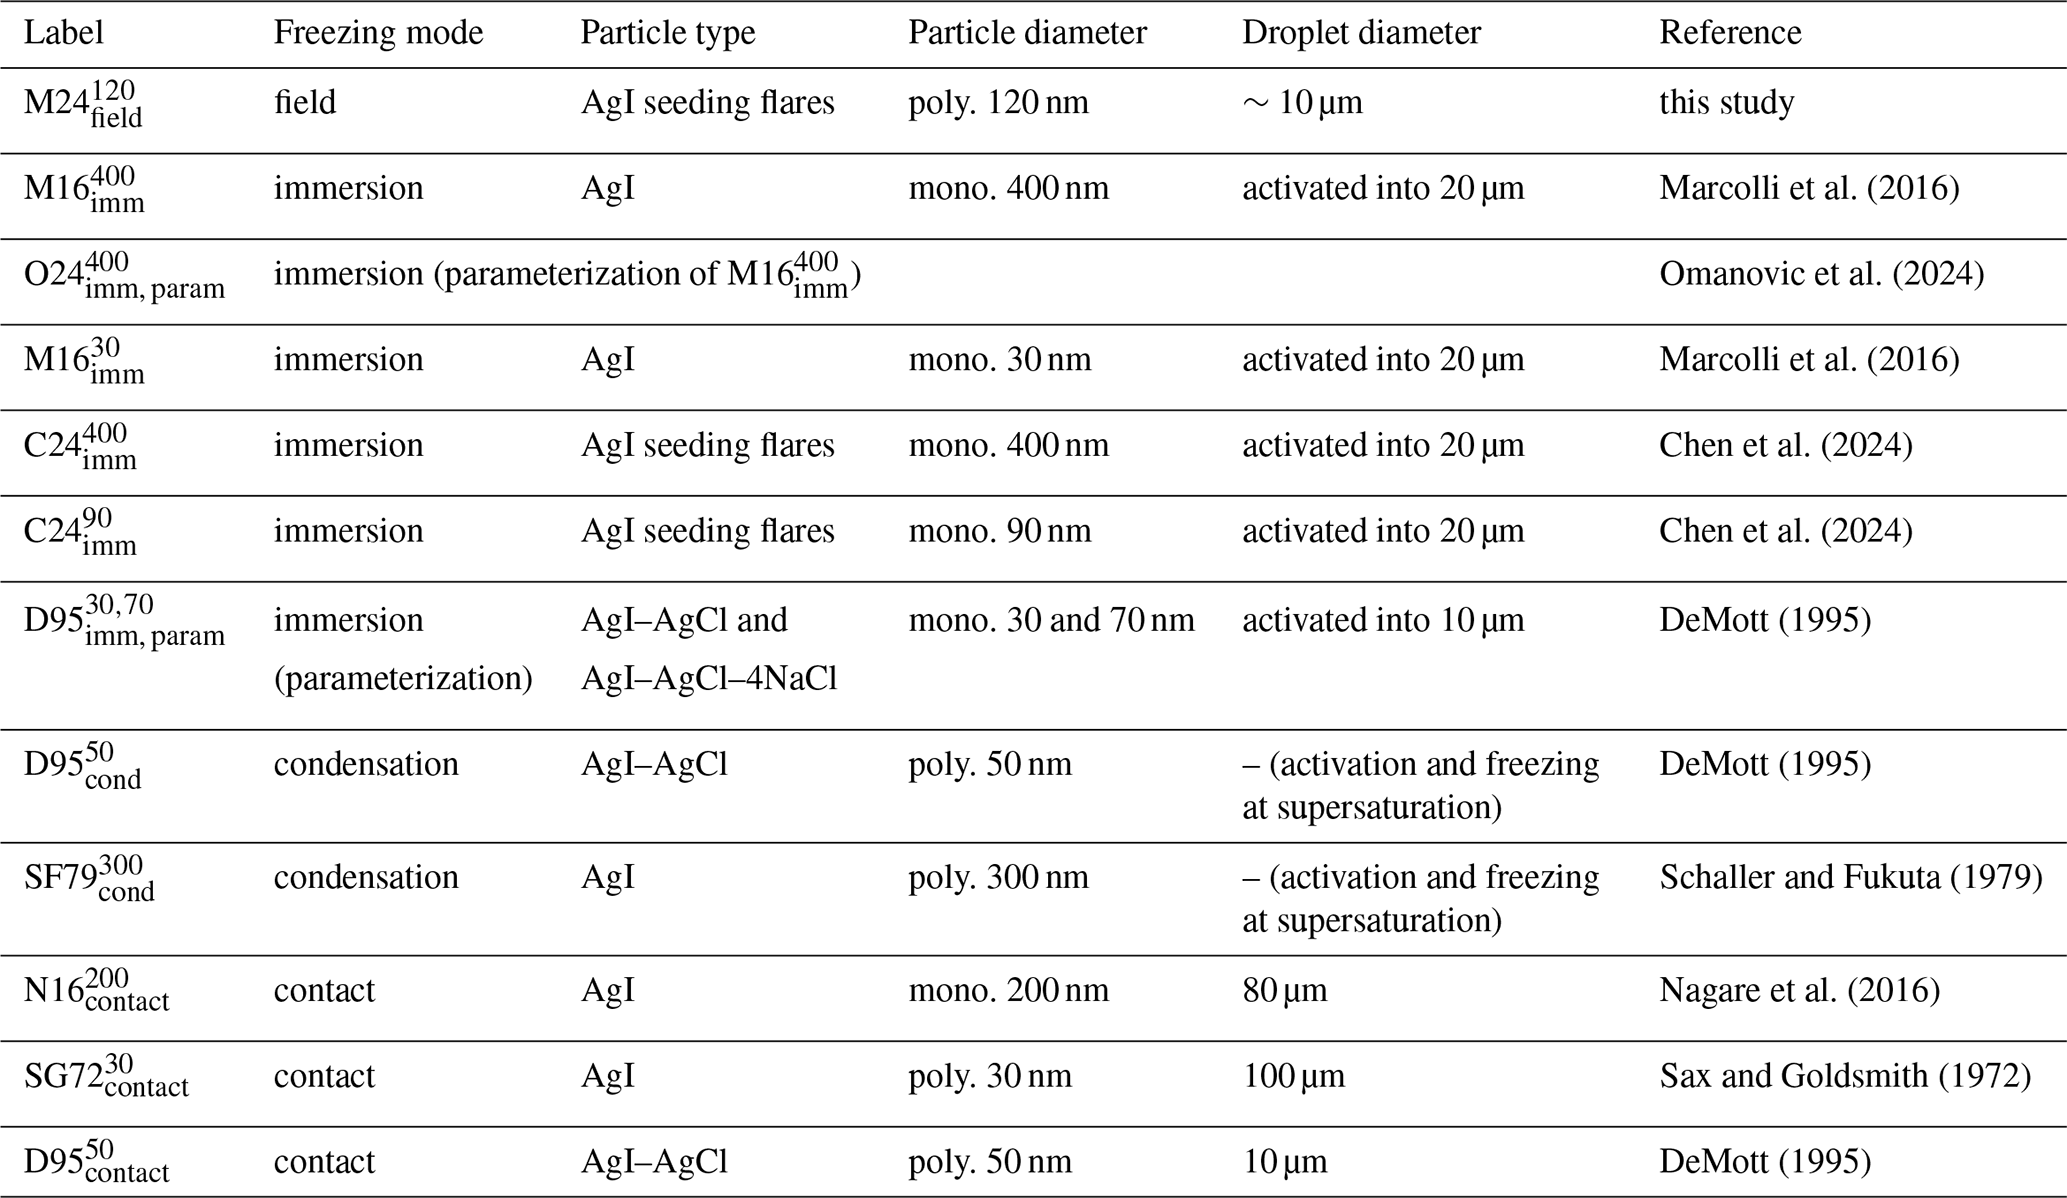
The immersion freezing experiments of Marcolli et al. (2016) (M16imm) and Chen et al. (2024) (C24imm) had similar INFs (Fig. 6). M16imm measured the INF of monodisperse AgI particles which were prepared by mixing potassium iodide and silver nitrate. After replacing the supernatant solution with pure water, the particles were atomized, dried, and size-selected before they were brought into the Immersion Mode Cooling chAmber and Zurich Ice Nucleation Chamber (IMCA-ZINC), where they were first activated into droplets of 18–20 µm at RH>120 % in IMCA and then cooled down to specific supercooled temperatures in ZINC. They found that all particle sizes ≥40 nm showed similar INFs as the 400 nm particles (), whereas smaller-sized particles had reduced INFs (30 nm shown in Fig. 6, ). Omanovic et al. (2024) () fitted a sigmoid curve to the 400 nm freezing data to make a parameterization that could be used in high-resolution large-eddy simulations of cloud-seeding experiments; the parameterization is shown here for reference. Marcolli et al. (2016) suggested that the main reason for the lower INFs of <40 nm particles was the dissolution effect: although the solubility of AgI in water is quite low, there is still some AgI that will dissolve in water droplets, and this dissolution reduces the number of active sites available for freezing on the very small (<40 nm) AgI particles. Smaller particles will have a greater portion of loss due to dissolution; thus, they will experience a greater loss of ice-nucleating ability. The experiments by Chen et al. (2024) (C24imm) were also conducted with IMCA-ZINC, but they tested AgI-containing particles produced by burning cloud-seeding flares of the same composition as we used in our study. Their results from 400 nm () and 90 nm () particle sizes had nearly the same INFs as each other and as . They suggested that the 90 nm particles from the flare, which contain AgI as well as other flare materials, were equivalent to the pure AgI particles of 40 nm in terms of AgI content and ice-nucleating ability.
The immersion freezing experiments from DeMott (1995) (), however, gave INFs that were several orders of magnitude below the M16imm and C24imm experiments. The curve is the parameterization of four sets of similar experiments (individual data points around the curve are not shown to not overcrowd the figure). They used AgI–AgCl and AgI–AgCl–4NaCl particles of 30 and 70 nm, produced by burning aqueous solutions of AgI, ammonium iodide, acetone, and sodium perchlorate. Then, with a dynamic controlled expansion cloud chamber, the particles were activated at temperatures °C into a cloud of 10 µm droplets which was subsequently cooled to freezing ( °C). One reason for the lower INFs as compared to M16imm and C24imm may be because of the difference in ice nucleation chambers. IMCA-ZINC is a continuous-flow chamber where water saturation is held constant for every droplet-freezing event. In an experiment in the dynamic expansion chamber, however, there is finite water vapor, which is depleted first during activation and droplet growth and then during ice crystal growth. After some ice crystals are produced, the chamber can only maintain ice saturation (not water saturation), meaning that continued nucleation is less likely. Other reasons for the disagreement in INFs may result from different particle generation, particle composition, particle size, or activated droplet size.
The INFs from our experiments () fall mid-way between those of and . C24imm used the same flares as us, so we can assume the same chemical composition of the particles; thus, it may be the most relevant study for comparison. Our INFs may be lower than theirs for a similar reason as was just explained for the INFs, i.e., the effect of reduced saturation in the cloud after initial ice nucleation. Moreover, because every droplet in IMCA-ZINC remains with aw=1 until freezing, no freezing point depression would occur. In our experiments, if the particles do not activate but remain as dilute solution droplets, then they experience aw≈1 only for as long as water saturation is maintained. Since RH in a natural cloud is locally reduced where ice exists, the remaining solution droplets would have aw<1, inducing a freezing point depression. Freezing point depression lowers the possible freezing temperature, which translates to a shift of INFs to the left (colder temperatures) in Fig. 6. Therefore, we could imagine that without freezing point depression the INFs of our experiments would shift to the right and could then be in alignment with the INF curve of (extrapolated from ). Alternatively, if the ice nucleation in our experiments relies on some particles encountering high enough supersaturation to activate into cloud droplets before freezing, then the lower INFs as compared to C24imm may be due to the fact that only few particles encountered such conditions, unlike in IMCA-ZINC.
It should be further noted that the slope of the parameterization from our study is lower than the slopes of the parameterizations of and . They both used nonlinear functions for their parameterization, however, in the temperature range of −3 to −9 °C, and depends exponentially on temperature (and is therefore linear in x−log (y) space). For our data in the same temperature range, an exponential dependence on temperature (linear regression on the x−log (y) data) was also found to be most suitable, though with a less steep slope. This less steep slope may be explained by two reasons. (1) Our fit is affected by the large scatter in our data, particularly the low INF of 10−3 at −7 °C flattens the slope. As discussed in Sect. 3.2, the scatter in INFs in our data is due to changes in residence time between experiments and other natural variability, factors which are not present in laboratory experiments. (2) The difference between water saturation and ice saturation becomes greater at colder temperatures: at −5.1 °C, ice saturation (RHi=1) equates to 95 % RH, but at −8.1 °C ice saturation equates to 92 % RH. This means that at colder temperatures, higher updrafts are needed to reach water saturation for a given quantity of ice (Korolev and Mazin, 2003), which means we are less likely to reach water saturation. This implies that the lower the temperature, the stronger the freezing point depression becomes, resulting in a more shallow increase in INF with temperature in the field experiments as compared to the laboratory (where water saturation can be maintained).
The condensation freezing experiments of DeMott (1995) () and Schaller and Fukuta (1979) () and the contact freezing experiments of Nagare et al. (2016) (), Sax and Goldsmith (1972) (), and DeMott (1995) () are also shown in Fig. 6. We do not provide here a complete description of the experiments by these authors (see the respective papers or the review by Marcolli et al., 2016, for more details), but we include their results just for reference. Note that INFs span orders of magnitude within and between the freezing modes. Discrepancies may stem from different particle sizes, particle generation, particle composition, and (relevant for contact freezing) different cloud droplet sizes and resulting collisional efficiencies. Our INFs agree somewhat well with those of (at −6 °C) and (if extrapolated to warmer temperatures), implying that contact freezing cannot completely be ruled out in our experiments. However, as explained previously, we suggest that the most likely and most dominant mechanism is that freezing occurred after water uptake on the seeding particles rather than through contact with pre-existing droplets.
In this work, we have attempted to identify and quantify the ice-nucleating ability of AgI-containing flare particles in seeding experiments in natural supercooled stratus clouds for the first time. First, we showed a case study of a typical seeding experiment (Sect. 3.1) in which an increase in radar reflectivity aligned with increased concentrations of the in situ-measured ICNC and aerosol concentrations. We illustrated with this example the result of our new method for obtaining an aggregation-adjusted ICNC to estimate how many ice crystals initially formed – important for considering the ice nucleation ability of the seeding particles. Furthermore, we highlighted the linear relationship between ICNC and seed concentration, translating to a nearly constant INF within each seeding experiment.
Then, comparing the 16 seeding experiments (Sect. 3.2), we showed that they each had unique INFs in the range of 0.1 %–1 %, which were found to negatively correlate with the cloud temperature at seeding height and with the residence time. The inverse relationship with temperature is expected, but the relationship with residence time is hypothesized to be due to an underestimation of true ICNC because of increased aggregation with longer times. However, both relationships were weak (significant at the 15 % level) due to the overall small sample size and the presence of sampling bias; that is, our experiments do not have an equally representative range of temperatures and residence times, a result of the environmental conditions occurring during our field campaigns. Future campaigns could balance out the dataset, complementing it with experiments at colder temperatures and with more varied residence times across the temperature range.
We next presented our hypothesis for the nucleation mechanism in our seeding experiments (Sect. 4.1). We expect that the polydisperse seeding particles grow hygroscopically upon emission into the cloud at water saturation, and/or some particles may activate into cloud droplets if encountering local regions of supersaturation; then the best particles (largest and/or most quickly reaching aw≈1) initiate freezing. We do not rule out the possibility that contact freezing may also occur, but we do not consider it to be dominant due to the fact that there were no positive correlations found between INFs and background CDNC or between INFs and residence time, and because the collision rates are expected to be very low (particle sizes are in the Greenfield gap). Furthermore, we also suggest that ice nucleation occurs mostly at the start of the experiment, because once there is ice, the reduced saturation ratio causes shrinking/evaporation of leftover droplets, inducing freezing point depression and reducing the likelihood of further nucleation. These effects of more limited water vapor may explain why our observed INFs were an order of magnitude lower than the recent measurements of the same seeding flare particles by Chen et al. (2024).
Overall, our study presents the first known quantification of the ice-nucleating ability of AgI-containing flare particles in seeding experiments in natural clouds. With our simultaneous aerosol and ICNC measurements (including the aggregation adjustment on ICNC) in the seeded patch of cloud, we were able to estimate the fraction of seeding particles that nucleated ice. These measurements are valuable to bridge the gap between ice nucleation in the laboratory and in natural clouds and may help to better inform future cloud-seeding operations in terms of how much seeding is necessary for the desired effects.
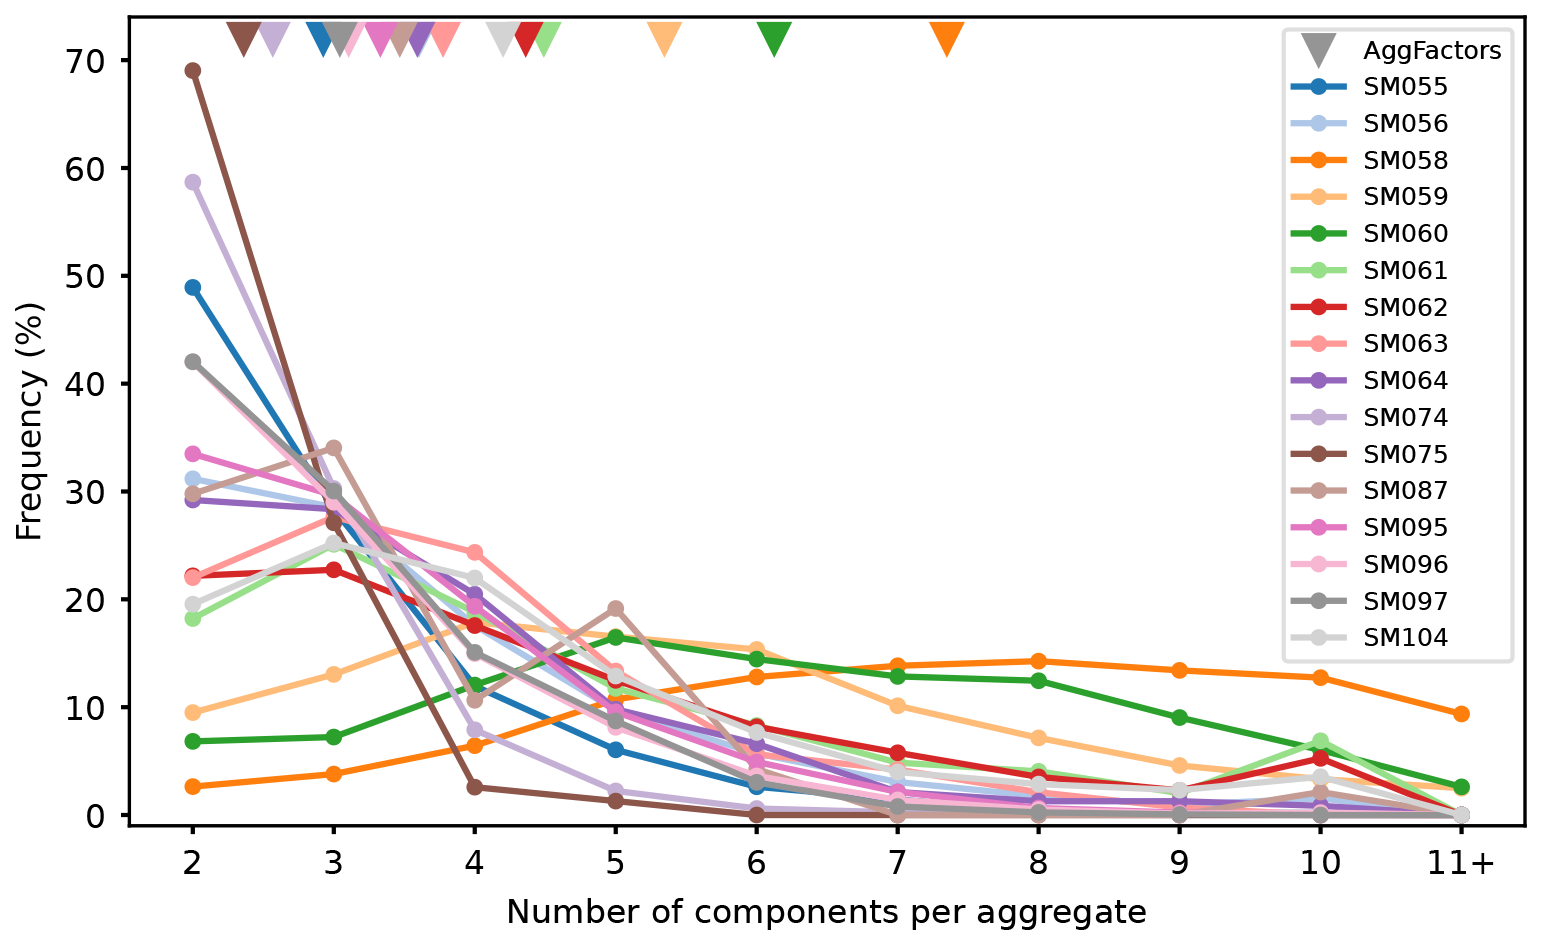
Figure A1Frequency histograms of the number of ice crystal components per ice aggregate for all aggregates for each seeding experiment. The triangle markers at the top (corresponding to the x axis) illustrate the AggFactor for each experiment, i.e., the average number of components per aggregate for the entire experiment (see Sect. 2.3.1), also given in Table 1. Colors correspond to Fig. 4.
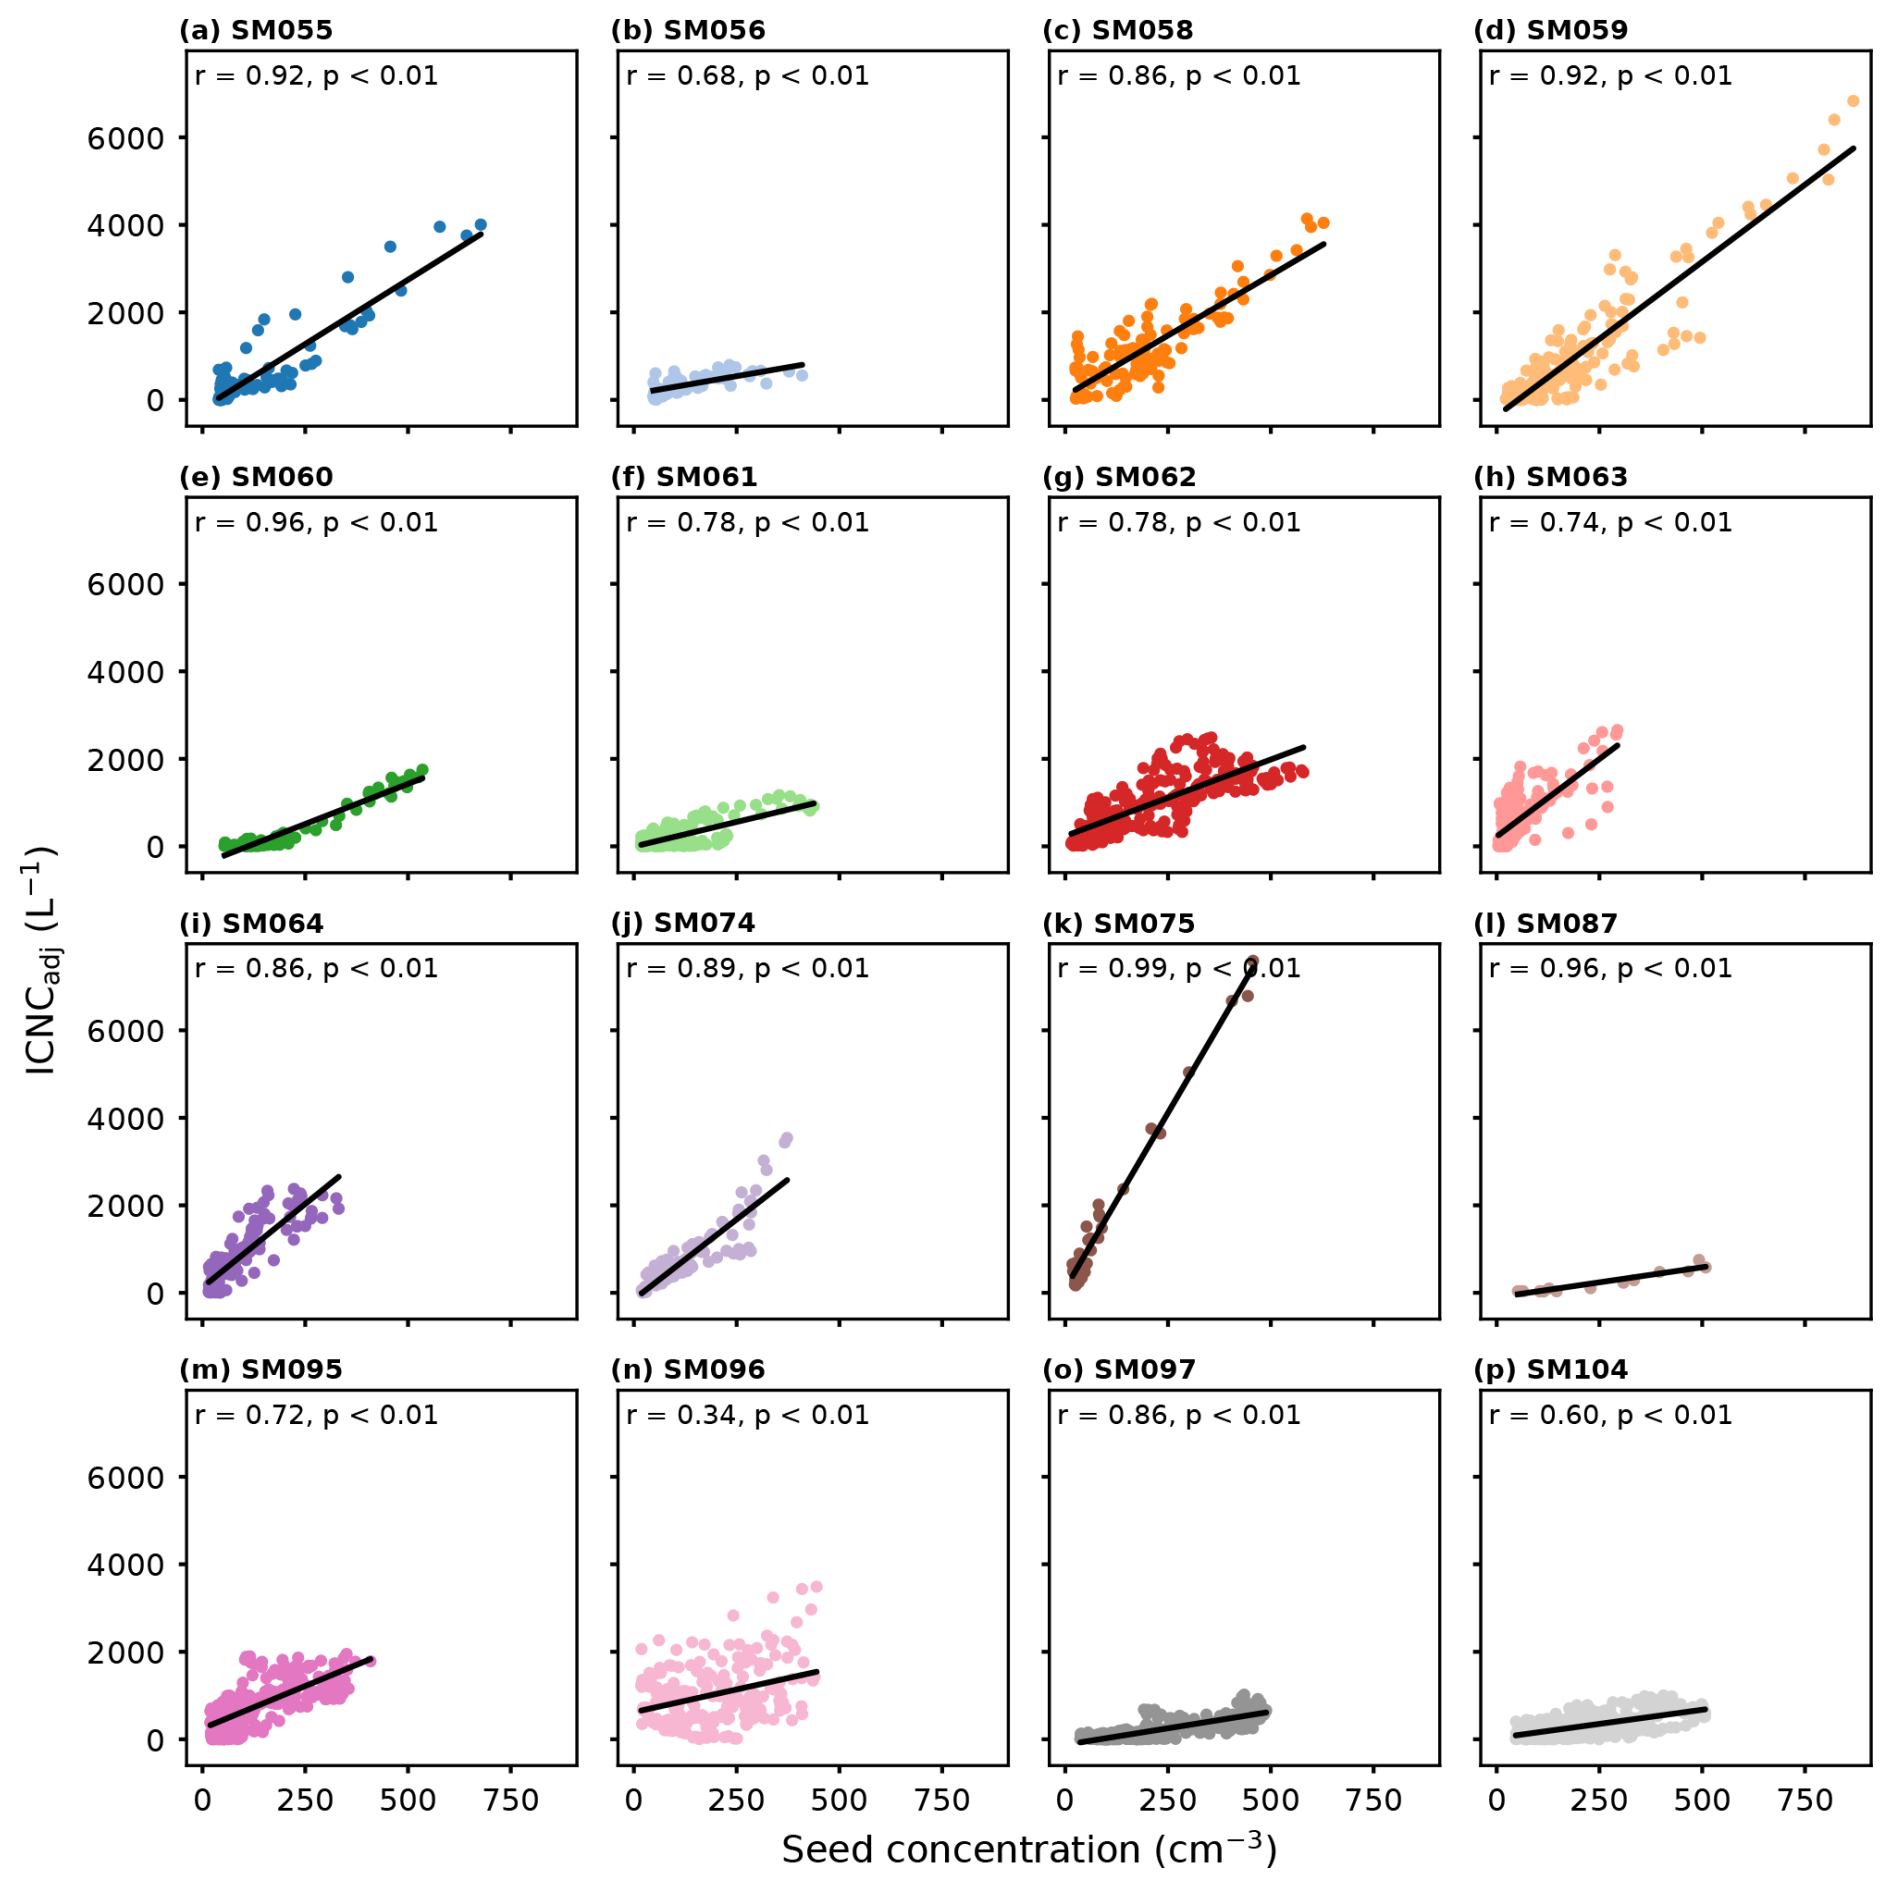
Figure B1(a–p) Seed concentration (cm−3) correlated to ice crystal number concentration, adjusted for aggregation (ICNCadj, L−1), for all 16 seeding experiments. The mission IDs and the Pearson r for the linear correlations are above each subplot. For all, p values were smaller than 10−7. Colors correspond to Fig. 4.
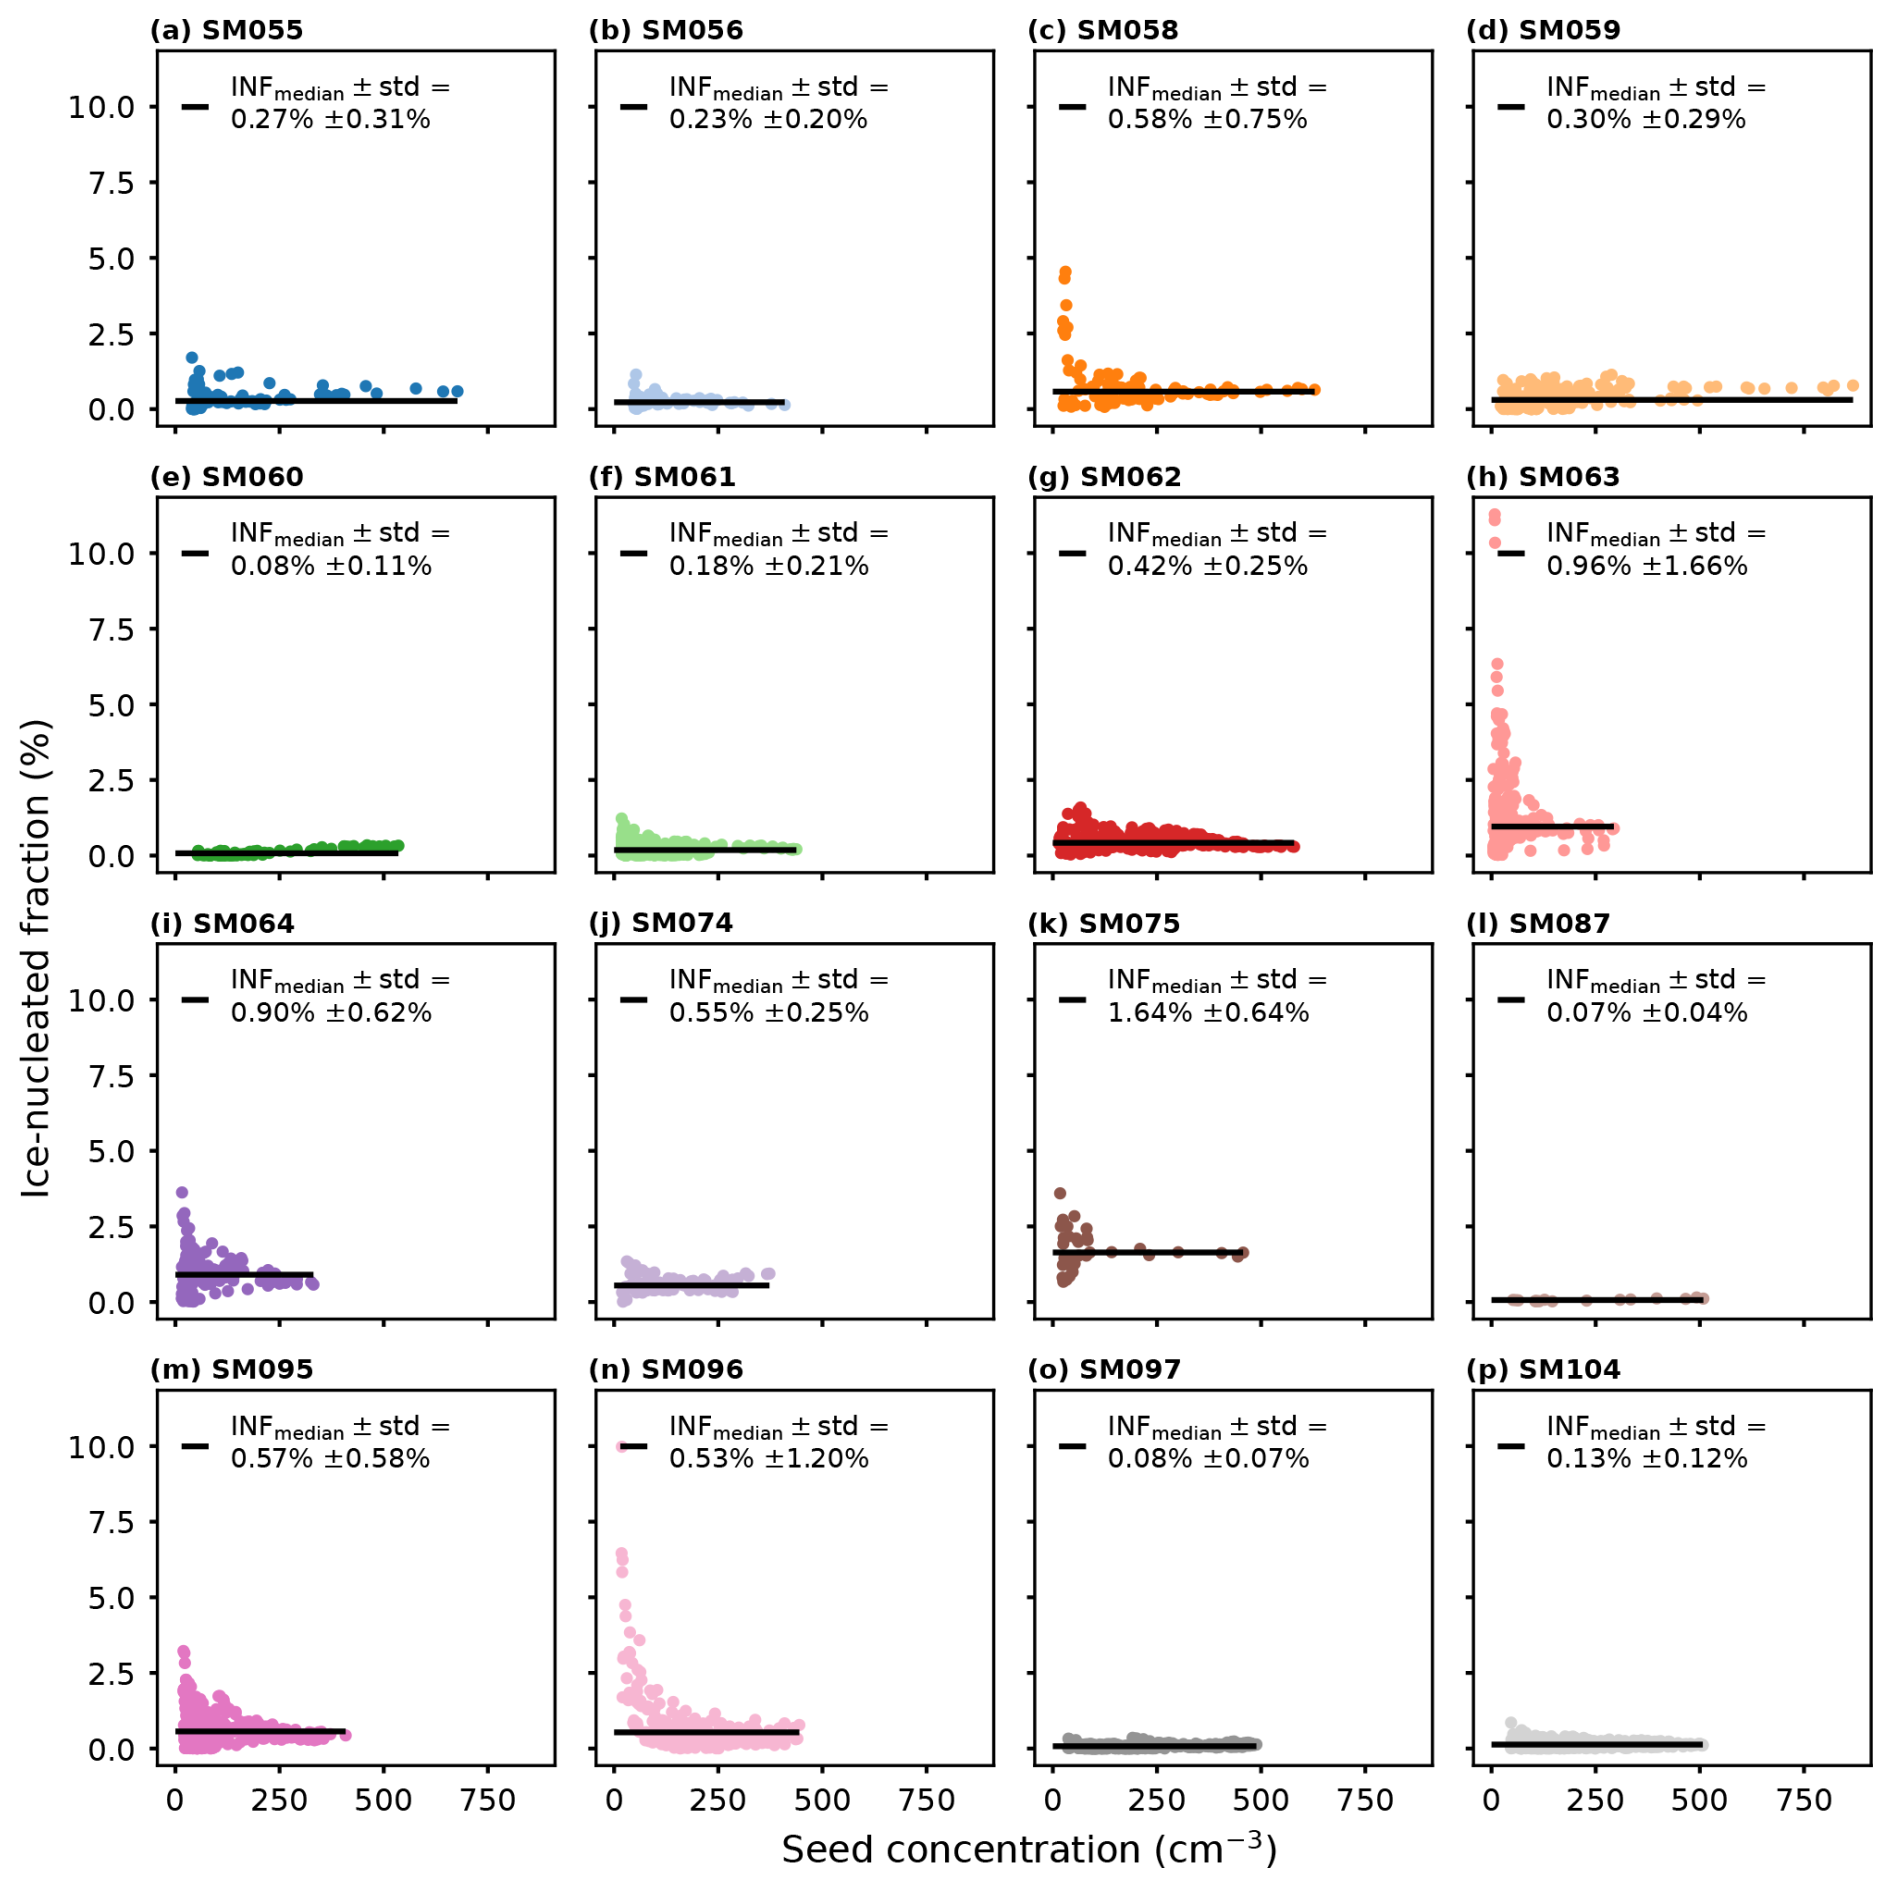
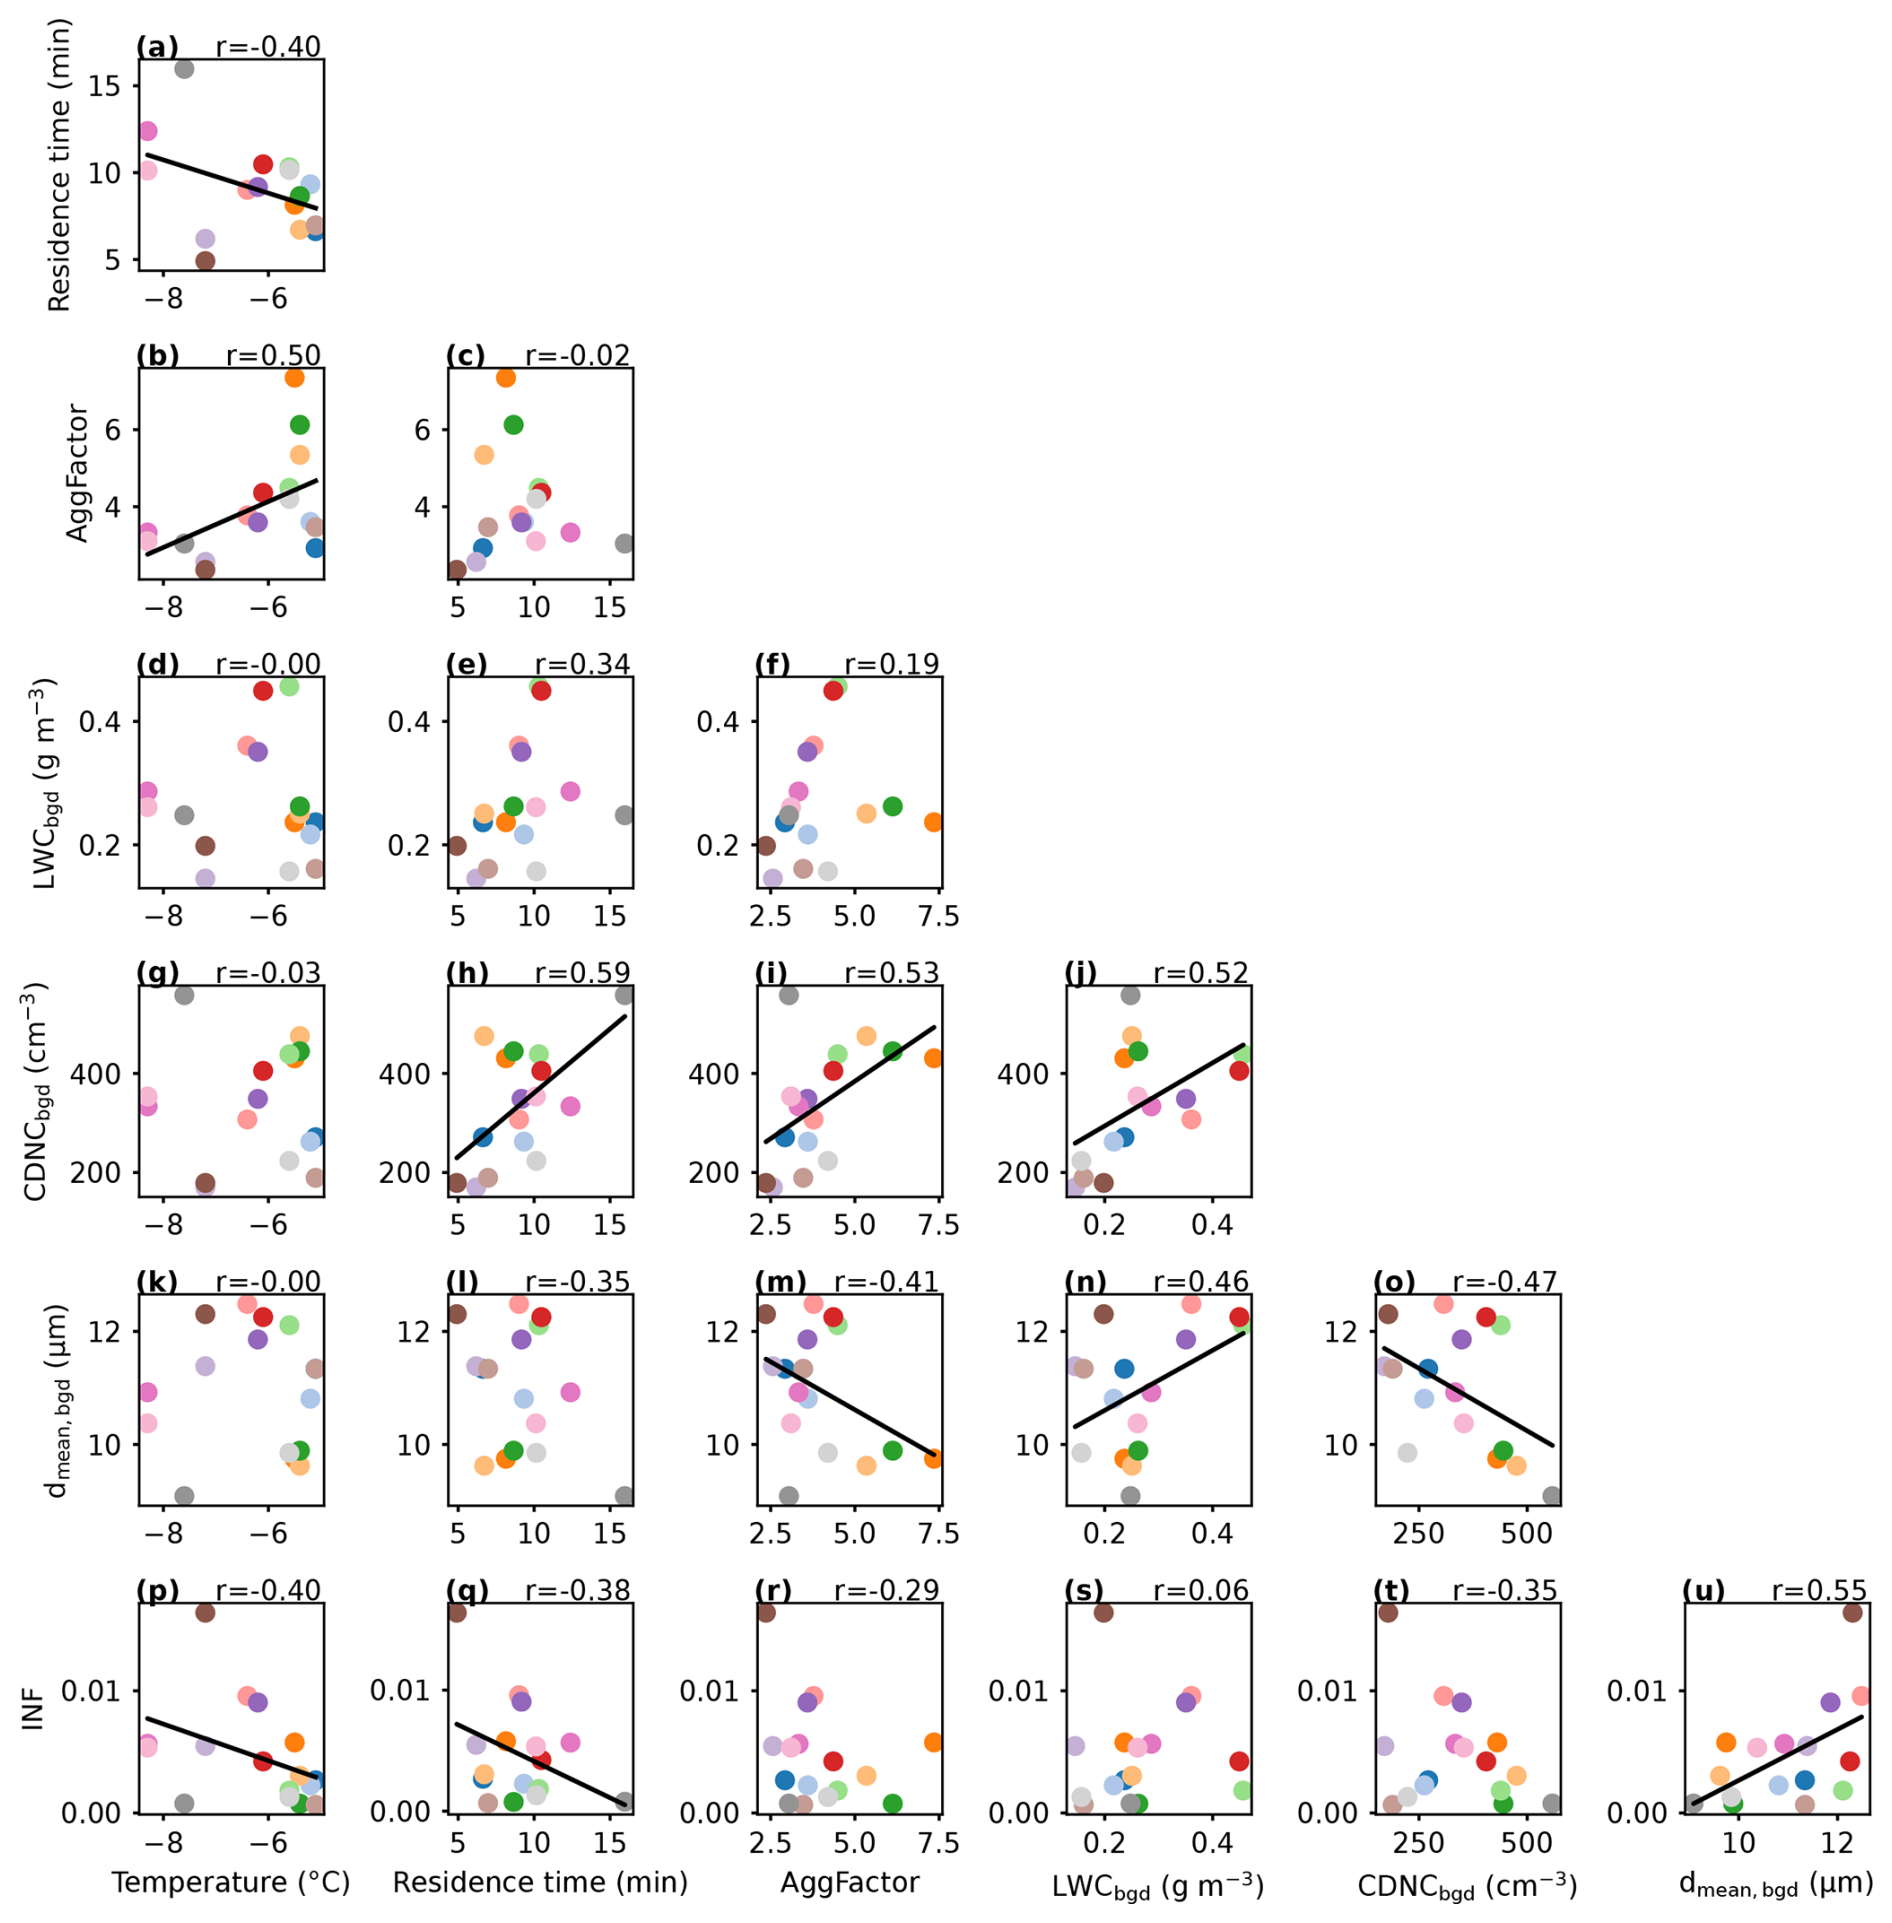
Figure C1(a–u) Correlation matrix showing correlations between temperature (°C), residence time (min), AggFactor, background liquid water content (LWCbgd, g m−3), background median cloud droplet number concentration (CDNCbgd, cm−3), background mean cloud droplet diameter (dmean,bgd, µm), and ice-nucleated fraction (INF, %). Each color marker represents one seeding experiment, and colors correspond to Figs. B1 and B2. Linear regressions are shown where significant at the 15 % significance level (i.e., where p<0.15).
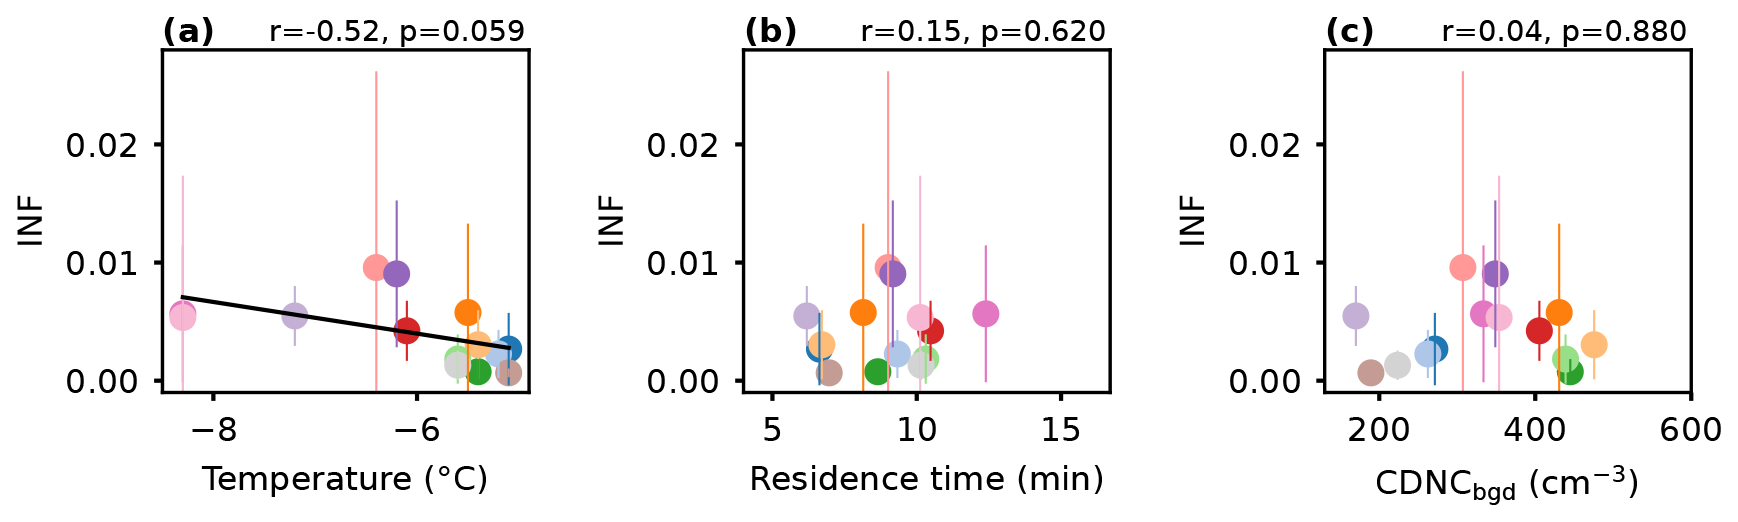
Figure D1Same as Fig. 4a–c but two experiments are excluded: SM075 and SM097, i.e., the experiments with the shortest and longest residence times, respectively. Ice-nucleated fraction (INF) correlated to (a) temperature (°C) with linear regression (, p=0.059), (b) residence time (min), and (c) background median cloud droplet number concentration (CDNCbgd, cm−3).
Datasets are available at https://doi.org/10.5281/zenodo.14718516 (Miller et al., 2025a). Analysis and plotting scripts are available at https://doi.org/10.5281/zenodo.14727004 (Miller et al., 2025b).
AJM conducted the scientific analysis, prepared the figures, and wrote the manuscript. CF did the reconstruction and hand-labeling of holographic data, with contributions from FR. HZ provided the ice crystal aggregation data. JH, FR, AJM, CF, NO, HZ, and RS were in the field conducting the seeding experiments and measurements. UL, ZAK, and JH provided supervision and scientific input during the analysis. UL, ZAK, JH, and CM especially contributed to the scientific discussion. UL, ZAK, JH, and FR conceived of CLOUDLAB and obtained funding. All authors contributed to the manuscript editing and review.
The contact author has declared that none of the authors has any competing interests.
Publisher's note: Copernicus Publications remains neutral with regard to jurisdictional claims made in the text, published maps, institutional affiliations, or any other geographical representation in this paper. While Copernicus Publications makes every effort to include appropriate place names, the final responsibility lies with the authors.
We would like to extend our gratitude to the following people: the TROPOS PolarCAP team including Patric Seifert, Kevin Ohneiser, Johannes Bühl, Tom Gaudek, Hannes Griesche, Willi Schimmel, and Martin Radenz for the remote sensing instrumentation and the scientific discussions and collaborations; the Meteomatics drone team including Lukas Hammerschmidt, Daniel Schmitz, Philipp Kryenbühl, Remo Steiner, and Dominik Brändle for the support, development, and expertise of our drones; Michael Rösch (ETH) for the technical support of our field setup; Maxime Hervo and MeteoSwiss for the wind profiler supporting our experiments; Frank Kasparek and Aleksei Shilin (Cloud Seeding Technologies) for their expertise on our seeding flares; and the Swiss army, the town of Eriswil, and Stefan Minder for allowing the use and maintenance of our base.
This research has received support from the European Research Council (ERC) under the European Union's Horizon 2020 research and innovation program (grant agreement no. 101021272 CLOUDLAB).
This paper was edited by Andreas Petzold and reviewed by Russell J. Perkins and one anonymous referee.
Al Hosari, T., Al Mandous, A., Wehbe, Y., Shalaby, A., Al Shamsi, N., Al Naqbi, H., Al Yazeedi, O., Al Mazroui, A., and Farrah, S.: The UAE Cloud Seeding Program: A Statistical and Physical Evaluation, Atmosphere-Basel, 12, 1013–1030, https://doi.org/10.3390/atmos12081013, 2021. a
Beck, A.: Observing the Microstructure of Orographic Clouds with HoloGondel, Doctoral Thesis, ETH Zurich, https://doi.org/10.3929/ethz-b-000250847, 2017. a, b
Benjamini, Y., Givati, A., Khain, P., Levi, Y., Rosenfeld, D., Shamir, U., Siegel, A., Zipori, A., Ziv, B., and Steinberg, D. M.: The Israel 4 Cloud Seeding Experiment: Primary Results, J. Appl. Meteorol. Clim., 62, 317–327, https://doi.org/10.1175/JAMC-D-22-0077.1, 2023. a
Bergeron, T.: On the Physics of Clouds and Precipitation, Proc. 5th Assembly UGGI, Lisbon, Portugal, vol. 2, 156–178, 1935. a
Chen, J., Rösch, C., Rösch, M., Shilin, A., and Kanji, Z. A.: Critical Size of Silver Iodide Containing Glaciogenic Cloud Seeding Particles, Geophys. Res. Lett., 51, e2023GL106680, https://doi.org/10.1029/2023GL106680, 2024. a, b, c, d, e, f, g, h, i
David, R. O., Marcolli, C., Fahrni, J., Qiu, Y., Perez Sirkin, Y. A., Molinero, V., Mahrt, F., Brühwiler, D., Lohmann, U., and Kanji, Z. A.: Pore Condensation and Freezing Is Responsible for Ice Formation below Water Saturation for Porous Particles, P. Natl. Acad. Sci. USA, 116, 8184–8189, https://doi.org/10.1073/pnas.1813647116, 2019. a
de Boer, G., Ivey, M., Schmid, B., Lawrence, D., Dexheimer, D., Mei, F., Hubbe, J., Bendure, A., Hardesty, J., Shupe, M. D., McComiskey, A., Telg, H., Schmitt, C., Matrosov, S. Y., Brooks, I., Creamean, J., Solomon, A., Turner, D. D., Williams, C., Maahn, M., Argrow, B., Palo, S., Long, C. N., Gao, R.-S., and Mather, J.: A Bird's-Eye View: Development of an Operational ARM Unmanned Aerial Capability for Atmospheric Research in Arctic Alaska, B. Am. Meteorol. Soc., 99, 1197–1212, https://doi.org/10.1175/BAMS-D-17-0156.1, 2018. a
DeMott, P. J.: Comparison of the Behavior of AgI-type Ice Nucleating Aerosols in Laboratory-Simulated Clouds, The Journal of Weather Modification, 20, 44–50, https://journalofweathermodification.scholasticahq.com/article (last access: 16 May 2025), 1988. a
DeMott, P. J.: Quantitative Descriptions of Ice Formation Mechanisms of Silver Iodide-Type Aerosols, Atmos. Res., 38, 63–99, https://doi.org/10.1016/0169-8095(94)00088-U, 1995. a, b, c, d, e, f, g
Dong, X., Zhao, C., Yang, Y., Wang, Y., Sun, Y., and Fan, R.: Distinct Change of Supercooled Liquid Cloud Properties by Aerosols From an Aircraft-Based Seeding Experiment, Earth and Space Science, 7, e2020EA001196, https://doi.org/10.1029/2020EA001196, 2020. a
Edwards, G. R. and Evans, L. F.: Effect of Surface Charge on Ice Nucleation by Silver Iodide, T. Faraday Soc., 58, 1649, https://doi.org/10.1039/tf9625801649, 1962. a
Feng, D. and Finnegan, W. G.: An Efficient, Fast Functioning Nucleating Agent – AgI-AgCl-4NaCl, Journal of Weather Modification, 21, 41–45, https://journalofweathermodification.scholasticahq.com/article/132831 (last access: 16 May 2025), 1989. a, b
Findeisen, W.: Kolloid-Meteorologische Vorgänge bei der Niederschlagsbildung, Meteorol. Z., 24, 121–133, https://doi.org/10.1127/metz/2015/0675, 1938. a
Gao, R. S., Telg, H., McLaughlin, R. J., Ciciora, S. J., Watts, L. A., Richardson, M. S., Schwarz, J. P., Perring, A. E., Thornberry, T. D., Rollins, A. W., Markovic, M. Z., Bates, T. S., Johnson, J. E., and Fahey, D. W.: A Light-Weight, High-Sensitivity Particle Spectrometer for PM2.5 Aerosol Measurements, Aerosol Sci. Tech., 50, 88–99, https://doi.org/10.1080/02786826.2015.1131809, 2016. a, b
Gokhale, N. R. and Goold, J.: Droplet Freezing by Surface Nucleation, J. Appl. Meteorol. Clim., 7, 870–874, https://doi.org/10.1175/1520-0450(1968)007<0870:DFBSN>2.0.CO;2, 1968. a
Greenfield, S.: Rain Scavenging of Radioactive Particulate Matter from the Atmosphere, J. Meteorol., 14, 115–125, https://doi.org/10.1175/1520-0469(1957)014<0115:RSORPM>2.0.CO;2, 1957. a
Griffith, D. A., Solak, M. E., and Yorty, D. P.: 30+ Winter Seasons Of Operational Cloud Seeding In Utah, The Journal of Weather Modification, 41, 23–37, https://journalofweathermodification.scholasticahq.com/article/133047 (last access: 16 May 2025), 2009. a
Henneberger, J., Ramelli, F., Spirig, R., Omanovic, N., Miller, A. J., Fuchs, C., Zhang, H., Bühl, J., Hervo, M., Kanji, Z. A., Ohneiser, K., Radenz, M., Rösch, M., Seifert, P., and Lohmann, U.: Seeding of Supercooled Low Stratus Clouds with a UAV to Study Microphysical Ice Processes: An Introduction to the CLOUDLAB Project, B. Am. Meteorol. Soc., 104, E1962–E1979, https://doi.org/10.1175/BAMS-D-22-0178.1, 2023. a, b, c, d, e, f
Hervo, M., Romanens, G., Martucci, G., Weusthoff, T., and Haefele, A.: Evaluation of an Automatic Meteorological Drone Based on a 6-Month Measurement Campaign, Atmosphere-Basel, 14, 1382, https://doi.org/10.3390/atmos14091382, 2023. a, b
Hobbs, P.: The Nature of Winter Clouds and Precipitation in the Cascade Mountains and Their Modification by Artificial Seeding. Part III: Case Studies of the Effects of Seeding, J. Appl. Meteorol. Clim., 14, 819–858, https://doi.org/10.1175/1520-0450(1975)014<0819:TNOWCA>2.0.CO;2, 1975. a
Holroyd, E. W., McPartland, J. T., and Super, A. B.: Observations of Silver Iodide Plumes over the Grand Mesa of Colorado, J. Appl. Meteorol. Clim., 27, 1125–1144, https://doi.org/10.1175/1520-0450(1988)027<1125:OOSIPO>2.0.CO;2, 1988. a
Huggins, A. W.: Another Wintertime Cloud Seeding Case Study with Strong Evidence of Seeding Effects, The Journal of Weather Modification, 39, 9–36, https://journalofweathermodification.scholasticahq.com/article/132988 (last access: 16 May 2025), 2007. a
Kanji, Z. A., Ladino, L. A., Wex, H., Boose, Y., Burkert-Kohn, M., Cziczo, D. J., and Krämer, M.: Overview of Ice Nucleating Particles, Meteor. Mon., 58, 1.1–1.33, https://doi.org/10.1175/AMSMONOGRAPHS-D-16-0006.1, 2017. a, b
Kloss, C., Sellitto, P., Legras, B., Vernier, J.-P., Jégou, F., Venkat Ratnam, M., Suneel Kumar, B., Lakshmi Madhavan, B., and Berthet, G.: Impact of the 2018 Ambae Eruption on the Global Stratospheric Aerosol Layer and Climate, J. Geophys. Res.-Atmos., 125, e2020JD032410, https://doi.org/10.1029/2020JD032410, 2020. a
Koop, T., Luo, B. P., Tsias, A., and Peter, T.: Water Activity as the Determinant for Homogeneous Ice Nucleation in Aqueous Solutions, Nature, 406, 611–614, https://doi.org/10.1038/35020537, 2000. a
Korolev, A. V. and Mazin, I. P.: Supersaturation of Water Vapor in Clouds, J. Atmos. Sci., 60, 2957–2974, https://doi.org/10.1175/1520-0469(2003)060<2957:SOWVIC>2.0.CO;2, 2003. a, b
Korolev, A. V., Isaac, G. A., Cober, S. G., Strapp, J. W., and Hallett, J.: Microphysical Characterization of Mixed-Phase Clouds, Q. J. Roy. Meteor. Soc., 129, 39–65, https://doi.org/10.1256/qj.01.204, 2003. a
Kulkarni, J., Morwal, S., and Deshpande, N.: Rainfall Enhancement in Karnataka State Cloud Seeding Program “Varshadhare” 2017, Atmos. Res., 219, 65–76, https://doi.org/10.1016/j.atmosres.2018.12.020, 2019. a
Langer, G., Cooper, G., Nagamoto, C. T., and Rosinski, J.: Ice Nucleation Mechanisms of Submicron Monodispersed Silver Iodide, 1,5-Dihydroxynaphthalene and Phloroglucinol Aerosol Particles, J. Appl. Meteorol. Clim., 17, 1039–1048, https://doi.org/10.1175/1520-0450(1978)017<1039:INMOSM>2.0.CO;2, 1978. a
Leuenberger, D., Haefele, A., Omanovic, N., Fengler, M., Martucci, G., Calpini, B., Fuhrer, O., and Rossa, A.: Improving High-Impact Numerical Weather Prediction with Lidar and Drone Observations, B. Am. Meteorol. Soc., 101, E1036–E1051, https://doi.org/10.1175/BAMS-D-19-0119.1, 2020. a
Liu, Z., Osborne, M., Anderson, K., Shutler, J. D., Wilson, A., Langridge, J., Yim, S. H. L., Coe, H., Babu, S., Satheesh, S. K., Zuidema, P., Huang, T., Cheng, J. C. H., and Haywood, J.: Characterizing the performance of a POPS miniaturized optical particle counter when operated on a quadcopter drone, Atmos. Meas. Tech., 14, 6101–6118, https://doi.org/10.5194/amt-14-6101-2021, 2021. a
Lohmann, U., Lüönd, F., and Mahrt, F.: An Introduction to Clouds: From the Microscale to Climate, 1st edn., Cambridge University Press, https://doi.org/10.1017/CBO9781139087513, 2016. a, b, c, d
Marcolli, C.: Deposition nucleation viewed as homogeneous or immersion freezing in pores and cavities, Atmos. Chem. Phys., 14, 2071–2104, https://doi.org/10.5194/acp-14-2071-2014, 2014. a
Marcolli, C., Nagare, B., Welti, A., and Lohmann, U.: Ice nucleation efficiency of AgI: review and new insights, Atmos. Chem. Phys., 16, 8915–8937, https://doi.org/10.5194/acp-16-8915-2016, 2016. a, b, c, d, e, f
Mason, B. J. and van den Heuvel, A. P.: The Properties and Behaviour of Some Artificial Ice Nuclei, P. Phys. Soc., 74, 744, https://doi.org/10.1088/0370-1328/74/6/312, 1959. a
Mei, F., Pekour, M. S., Dexheimer, D., de Boer, G., Cook, R., Tomlinson, J., Schmid, B., Goldberger, L. A., Newsom, R., and Fast, J. D.: Observational data from uncrewed systems over Southern Great Plains, Earth Syst. Sci. Data, 14, 3423–3438, https://doi.org/10.5194/essd-14-3423-2022, 2022. a
Miller, A. J., Fuchs, C., Omanovic, N., Ramelli, F., Seifert, P., Spirig, R., Zhang, H., Fons, E., Lohmann, U., and Henneberger, J.: Multirotor UAV Icing Correlated to Liquid Water Content Measurements in Natural Supercooled Clouds, Cold Reg. Sci. Technol., 225, 104262, https://doi.org/10.1016/j.coldregions.2024.104262, 2024a. a
Miller, A. J., Ramelli, F., Fuchs, C., Omanovic, N., Spirig, R., Zhang, H., Lohmann, U., Kanji, Z. A., and Henneberger, J.: Two new multirotor uncrewed aerial vehicles (UAVs) for glaciogenic cloud seeding and aerosol measurements within the CLOUDLAB project, Atmos. Meas. Tech., 17, 601–625, https://doi.org/10.5194/amt-17-601-2024, 2024b. a, b, c, d, e, f, g, h, i
Miller, A. J., Fuchs, C., Ramelli, F., Zhang, H., Omanovic, N., Spirig, R., Marcolli, C., Kanji, Z. A., Henneberger, J., and Lohmann, U.: Data for Publication “Quantified Ice-Nucleating Ability of AgI-containing Seeding Particles in Natural Clouds”, Zenodo [data set], https://doi.org/10.5281/zenodo.14718516, 2025a. a
Miller, A. J., Fuchs, C., Ramelli, F., Zhang, H., Omanovic, N., Spirig, R., Marcolli, C., Kanji, Z. A., Henneberger, J., and Lohmann, U.: Scripts for Publication “Quantified Ice-Nucleating Ability of AgI-containing Seeding Particles in Natural Clouds”, Zenodo [code], https://doi.org/10.5281/zenodo.14727004, 2025b. a
Nagare, B., Marcolli, C., Stetzer, O., and Lohmann, U.: Comparison of measured and calculated collision efficiencies at low temperatures, Atmos. Chem. Phys., 15, 13759–13776, https://doi.org/10.5194/acp-15-13759-2015, 2015. a
Nagare, B., Marcolli, C., Welti, A., Stetzer, O., and Lohmann, U.: Comparing contact and immersion freezing from continuous flow diffusion chambers, Atmos. Chem. Phys., 16, 8899–8914, https://doi.org/10.5194/acp-16-8899-2016, 2016. a, b, c
Omanovic, N., Ferrachat, S., Fuchs, C., Henneberger, J., Miller, A. J., Ohneiser, K., Ramelli, F., Seifert, P., Spirig, R., Zhang, H., and Lohmann, U.: Evaluating the Wegener–Bergeron–Findeisen process in ICON in large-eddy mode with in situ observations from the CLOUDLAB project, Atmos. Chem. Phys., 24, 6825–6844, https://doi.org/10.5194/acp-24-6825-2024, 2024. a, b, c, d
Pearl, J.: Causality, 2nd edn., Cambridge University Press, Cambridge, https://doi.org/10.1017/CBO9780511803161, 2009. a
Pilz, C., Düsing, S., Wehner, B., Müller, T., Siebert, H., Voigtländer, J., and Lonardi, M.: CAMP: an instrumented platform for balloon-borne aerosol particle studies in the lower atmosphere, Atmos. Meas. Tech., 15, 6889–6905, https://doi.org/10.5194/amt-15-6889-2022, 2022. a, b
Pruppacher, H. and Klett, J.: Homogeneous Nucleation, in: Microphysics of Clouds and Precipitation, D. Reidel Publishing Company, Dordrecht, Holland, 191–215, https://doi.org/10.1007/978-0-306-48100-0, 1978. a
Ramelli, F., Beck, A., Henneberger, J., and Lohmann, U.: Using a holographic imager on a tethered balloon system for microphysical observations of boundary layer clouds, Atmos. Meas. Tech., 13, 925–939, https://doi.org/10.5194/amt-13-925-2020, 2020. a, b, c
Ramelli, F., Henneberger, J., David, R. O., Bühl, J., Radenz, M., Seifert, P., Wieder, J., Lauber, A., Pasquier, J. T., Engelmann, R., Mignani, C., Hervo, M., and Lohmann, U.: Microphysical investigation of the seeder and feeder region of an Alpine mixed-phase cloud, Atmos. Chem. Phys., 21, 6681–6706, https://doi.org/10.5194/acp-21-6681-2021, 2021. a
Ramelli, F., Henneberger, J., Fuchs, C., Miller, A. J., Omanovic, N., Spirig, R., Zhang, H., David, R. O., Ohneiser, K., Seifert, P., and Lohmann, U.: Repurposing Weather Modification for Cloud Research Showcased by Ice Crystal Growth, PNAS Nexus, 3, pgae402, https://doi.org/10.1093/pnasnexus/pgae402, 2024. a, b
Sax, R. I. and Goldsmith, P.: Nucleation of Water Drops by Brownian Contact with AgI and Other Aerosols, Q. J. Roy. Meteor. Soc., 98, 60–72, https://doi.org/10.1002/qj.49709841506, 1972. a, b, c
Schaller, R. C. and Fukuta, N.: Ice Nucleation by Aerosol Particles: Experimental Studies Using a Wedge-Shaped Ice Thermal Diffusion Chamber, J. Atmos. Sci., 36, 1788–1802, https://doi.org/10.1175/1520-0469(1979)036<1788:INBAPE>2.0.CO;2, 1979. a, b, c
Shafiei, S., Akbari, M., Botha, N., and Maaza, M.: A Study on the Size Effect of AgI on Cloud Seeding, Mater. Today-Proc., https://doi.org/10.1016/j.matpr.2023.07.374, online first, 2023. a
Telg, H., Murphy, D. M., Bates, T. S., Johnson, J. E., Quinn, P. K., Giardi, F., and Gao, R.-S.: A Practical Set of Miniaturized Instruments for Vertical Profiling of Aerosol Physical Properties, Aerosol Sci. Tech., 51, 715–723, https://doi.org/10.1080/02786826.2017.1296103, 2017. a
Tessendorf, S. A., French, J. R., Friedrich, K., Geerts, B., Rauber, R. M., Rasmussen, R. M., Xue, L., Ikeda, K., Blestrud, D. R., Kunkel, M. L., Parkinson, S., Snider, J. R., Aikins, J., Faber, S., Majewski, A., Grasmick, C., Bergmaier, P. T., Janiszeski, A., Springer, A., Weeks, C., Serke, D. J., and Bruintjes, R.: A Transformational Approach to Winter Orographic Weather Modification Research: The SNOWIE Project, B. Am. Meteorol. Soc., 100, 71–92, https://doi.org/10.1175/BAMS-D-17-0152.1, 2019. a
Touloupas, G., Lauber, A., Henneberger, J., Beck, A., and Lucchi, A.: A convolutional neural network for classifying cloud particles recorded by imaging probes, Atmos. Meas. Tech., 13, 2219–2239, https://doi.org/10.5194/amt-13-2219-2020, 2020. a
Vali, G., DeMott, P. J., Möhler, O., and Whale, T. F.: Technical Note: A proposal for ice nucleation terminology, Atmos. Chem. Phys., 15, 10263–10270, https://doi.org/10.5194/acp-15-10263-2015, 2015. a
Vonnegut, B.: The Nucleation of Ice Formation by Silver Iodide, J. Appl. Phys., 18, 593–595, https://doi.org/10.1063/1.1697813, 1947.
Vonnegut, B.: Nucleation of Supercooled Water Clouds by Silver Iodide Smokes, Chem. Rev., 44, 277–289, https://doi.org/10.1021/cr60138a003, 1949. a
Wang, J., Yue, Z., Rosenfeld, D., Zhang, L., Zhu, Y., Dai, J., Yu, X., and Li, J.: The Evolution of an AgI Cloud-Seeding Track in Central China as Seen by a Combination of Radar, Satellite, and Disdrometer Observations, J. Geophys. Res.-Atmos., 126, e2020JD033914, https://doi.org/10.1029/2020JD033914, 2021. a
Wegener, A.: Thermodynamik der Atmosphäre, Barth, Leipzig, Germany, 1911. a
Yu, P., Rosenlof, K. H., Liu, S., Telg, H., Thornberry, T. D., Rollins, A. W., Portmann, R. W., Bai, Z., Ray, E. A., Duan, Y., Pan, L. L., Toon, O. B., Bian, J., and Gao, R.-S.: Efficient Transport of Tropospheric Aerosol into the Stratosphere via the Asian Summer Monsoon Anticyclone, P. Natl. Acad. Sci. USA, 114, 6972–6977, https://doi.org/10.1073/pnas.1701170114, 2017. a
Zhang, H., Li, X., Ramelli, F., David, R. O., Pasquier, J., and Henneberger, J.: IceDetectNet: a rotated object detection algorithm for classifying components of aggregated ice crystals with a multi-label classification scheme, Atmos. Meas. Tech., 17, 7109–7128, https://doi.org/10.5194/amt-17-7109-2024, 2024. a
Zimmermann, F., Ebert, M., Worringen, A., Schütz, L., and Weinbruch, S.: Environmental Scanning Electron Microscopy (ESEM) as a New Technique to Determine the Ice Nucleation Capability of Individual Atmospheric Aerosol Particles, Atmos. Environ., 41, 8219–8227, https://doi.org/10.1016/j.atmosenv.2007.06.023, 2007. a
Zobrist, B., Marcolli, C., Peter, T., and Koop, T.: Heterogeneous Ice Nucleation in Aqueous Solutions: The Role of Water Activity, J. Phys. Chem. A, 112, 3965–3975, https://doi.org/10.1021/jp7112208, 2008. a
- Abstract
- Introduction
- Methods
- Results
- Discussion
- Conclusions
- Appendix A: AggFactor for each experiment
- Appendix B: ICNCadj, seed concentrations, and INFs for each experiment
- Appendix C: Correlations between several variables for all experiments
- Appendix D: INF, temperature, and residence time, excluding the shortest and longest residence time experiments
- Code and data availability
- Author contributions
- Competing interests
- Disclaimer
- Acknowledgements
- Financial support
- Review statement
- References