the Creative Commons Attribution 4.0 License.
the Creative Commons Attribution 4.0 License.
 | 27 May 2025
The critical number and size of precipitation embryos to accelerate warm rain initiation
Jung-Sub Lim
Yign Noh
Hyunho Lee
Understanding warm rain initiation through droplet collision and coalescence is a fundamental yet complex challenge in cloud microphysics. Although it is well-known that sufficiently large droplets, so-called precipitation embryos (PEs), may accelerate droplet collisions, it is uncertain how many and how large these PEs should be to affect rain initiation substantially. We address this question using an ensemble of box simulations with Lagrangian cloud microphysics. We find that warm rain initiation is substantially accelerated only if the PE size or number (or the product of those) exceeds a critical threshold necessary to compensate for the PE-induced suppression of collisions among non-PEs. The sensitivity of this threshold to the shape of the droplet size distribution and turbulence effects on the collision process is analysed. It is shown that more and larger PEs are needed to accelerate rain initiation when collisions are already efficient without PEs, e.g. due to a broad droplet size distribution or a strong turbulence effect. Beyond increasing our fundamental understanding of the precipitation process in warm clouds, our results may help to constrain the effect of PE-like particles intentionally or unintentionally added in climate intervention approaches, such as rain enhancement or marine cloud brightening.
- Article
(5232 KB) - Full-text XML
- BibTeX
- EndNote


A key challenge in understanding warm rain initiation is explaining the growth of cloud droplets in the radius range between 15 and 40 µm, the so-called size gap, in which neither condensational nor collisional growth is effective (e.g. Shaw, 2003; Devenish et al., 2012; Grabowski and Wang, 2013). In the droplet size distributions (DSDs) that are too narrow or consist of overly small droplets, collisions among droplets and thus precipitation formation are inefficient. These collision-limited DSDs can be regarded as being in a collisionally stable state (Squires, 1958), where mechanisms that accelerate the collision–coalescence process to form raindrops and initiate precipitation are crucial for breaking this stability. Research over the past 5 decades has identified several key mechanisms: (i) DSD broadening by entrainment and mixing (Baker et al., 1980; Blyth, 1993; Krueger et al., 1997; Lasher-Trapp et al., 2005; Cooper et al., 2013; Hoffmann et al., 2019; Lim and Hoffmann, 2023, 2024); (ii) turbulence-induced collision enhancement (TICE), which increases the collision efficiency and reduces the size dependency of droplets to initiate collisions (e.g. Saffman and Turner, 1956; Kostinski and Shaw, 2005; Pinsky et al., 2008; Wang and Grabowski, 2009; Grabowski and Wang, 2013; Onishi et al., 2015; Hoffmann et al., 2017; Chen et al., 2020; Chandrakar et al., 2024); and (iii) the role of so-called precipitation embryos (PEs) (e.g. Johnson, 1993), the primary focus of this study.
The presence of PEs larger than 20 µm can initiate the collision process as they are already larger than the size gap range (e.g. Woodcock, 1953; Telford, 1955; Exton et al., 1986; Johnson, 1982, 1993; Feingold et al., 1999; Teller and Levin, 2006; Alfonso et al., 2013; Hoffmann et al., 2017; Dziekan et al., 2021). The sources of these PEs can be giant aerosol particles, predominantly large sea salt aerosols that form solution droplets with a radius between 1 and 100 µm (Johnson, 1982; Blyth, 1993; O'Dowd et al., 1997; Feingold et al., 1999; Jensen and Nugent, 2017; Hudson and Noble, 2020; Hoffmann and Feingold, 2023), rare (“one-in-a-million”) “lucky droplets” that grow faster than the average droplet (Telford, 1955; Kostinski and Shaw, 2005; Wilkinson, 2016; Alfonso and Raga, 2017; Alfonso et al., 2019), or particles from cloud seeding experiments to enhance precipitation (Bowen, 1952; Cotton, 1982). In this study, PEs are broadly defined as large droplets, irrespective of their origin.
Although the aforementioned studies generally agree that PEs can accelerate warm rain initiation, it is uncertain how their number and size affect the acceleration of droplet growth. Some studies suggest that 10−3 cm−3 20 µm droplets can effectively accelerate the rain initiation (e.g. Feingold et al., 1999) and change the number of precipitation and cloud properties, such as the droplet number concentration and liquid water content (e.g. Yin et al., 2000). Other studies indicate that the effectiveness of PEs relies on the type of cloud, with shallower clouds being more susceptible (e.g. Kuba and Murakami, 2010; Dziekan et al., 2021). In the absence of PEs, DSDs with small-sized droplets barely initiate precipitation unless stochastic fluctuations in the collision process are considered. This phenomenon is known as the lucky droplet effect, which may produce PEs on its own (Telford, 1955; Kostinski and Shaw, 2005; Dziekan and Pawlowska, 2017). When this effect dominates, adding only a few PEs may not substantially accelerate rain initiation. In addition, although a few previous studies have investigated these mechanisms (Hoffmann et al., 2017; Chen et al., 2020), it remains unclear whether PE and TICE compete with or complement each other in influencing collisional growth.
Lastly, there is a large uncertainty in the number concentration of PEs in clouds (Khain, 2009). For instance, PEs originating from 1 to 20 µm sea salt aerosols exhibit a wide range of concentrations from 10−4 to 10−2 cm−3 (Jung et al., 2015; Jensen and Nugent, 2017), with a strong environmental and spatial dependency (Woodcock, 1953; Jung et al., 2015). Based on the one-in-a-million definition of lucky droplets acting as PEs (e.g. Kostinski and Shaw, 2005), typical cloud droplet concentrations over the ocean and continents (101–103 cm−3) imply PE concentrations of 10−5–10−3 cm−3. On the other hand, for climate-engineering practices such as cloud seeding, the concentration of seeded particles can exceed natural values, ranging from 10−1 to 101 cm−3 (Kuba and Murakami, 2010). Due to this large variability, assessing the PE effect for a broad range of PE concentrations is important.
A particle-based Lagrangian cloud model (LCM) is the natural choice for such investigation (e.g. Gillespie, 1972; Shima et al., 2009; Hoffmann et al., 2017; Dziekan and Pawlowska, 2017; Unterstrasser et al., 2020; Li et al., 2022). In particular, it was shown that a “one-to-one” LCM, where each computational particle represents one single cloud drop, is suitable for considering stochastic fluctuations in collisional growth naturally (e.g. Dziekan and Pawlowska, 2017; Li et al., 2022). While considering the numerous processes that also affect warm rain initiation (i.e. aerosol activation and condensation) is essential for investigating rain initiation, a simple box model of the collision–coalescence process alone offers unique insights that cannot be captured in a more complex model due to its tremendous computational costs when using the one-to-one LCM. Therefore, this study aims to investigate the early stages of collisional growth to determine the number and size of PEs needed to accelerate collisional growth.
This paper is organized as follows. Section 2 introduces the LCM box model and the simulation setup. Section 3 presents the results revealing the threshold on the minimum number and size of PEs to accelerate droplet collisions. Section 4 explores the mechanism behind the existence of this threshold. We conclude our paper in Sect. 5.
2.1 Lagrangian cloud box model
In most applications, each computational particle of an LCM represents a large number of real droplets with identical properties, frequently called super-droplets, by introducing a weighting factor (Wi) (e.g. Shima et al., 2009). Thus, the number concentration of droplets is determined by
where ΔV is a reference volume and nptcl represents the number of computational particles in ΔV. In this study, we apply the one-to-one method, where each computational particle represents a single cloud droplet (Wi=1). This approach fully captures the inherent stochasticity of the collision process (Shima et al., 2009; Dziekan and Pawlowska, 2017; Li et al., 2022).
The collision scheme follows the approach introduced by Shima et al. (2009) and Sölch and Kärcher (2010), in which a collision occurs with the probability
which is primarily determined by the gravitational collection kernel
where rm and rn are the radii of the interacting droplets, E is the collision efficiency of droplet pairs (Hall, 1980), and w is the droplet terminal velocity (Beard, 1976). δt is the model time step. Here, we assume the coalescence efficiency to be unity. In this study, a collected droplet is removed from the simulation after the collision–coalescence event, and the mass of the collecting droplet increases by the mass of the collected droplet.
The simulations do not consider other processes besides collisional growth, such as condensation or sedimentation, which are beyond the focus of our study. Therefore, our results should be regarded as representative of the early stages of collisional growth only. For a detailed explanation of the LCM collision scheme, readers are referred to Hoffmann et al. (2017), Noh et al. (2018), and Unterstrasser et al. (2020).
2.2 Simulation setups
The initial DSD is expressed as
where m is the mass of a droplet, N0=238 cm−3 is the initial droplet number concentration, and is the mass of a droplet with (see the light-blue line in Fig. 1). The DSD results in a cloud water mixing ratio (qc) of approximately 1.0 g kg−1. Additionally, cases with , or 14 µm are considered to investigate the effect of PEs on different DSD shapes. In these cases, N0=466, 138, and 87 cm−3 to achieve the same (Fig. 1). We name these cases “RM”, where RM stands for the mean radius with the subsequent number denoting (e.g. RM10). In this study, we primarily discuss the simulation with , i.e. RM10, unless noted otherwise.
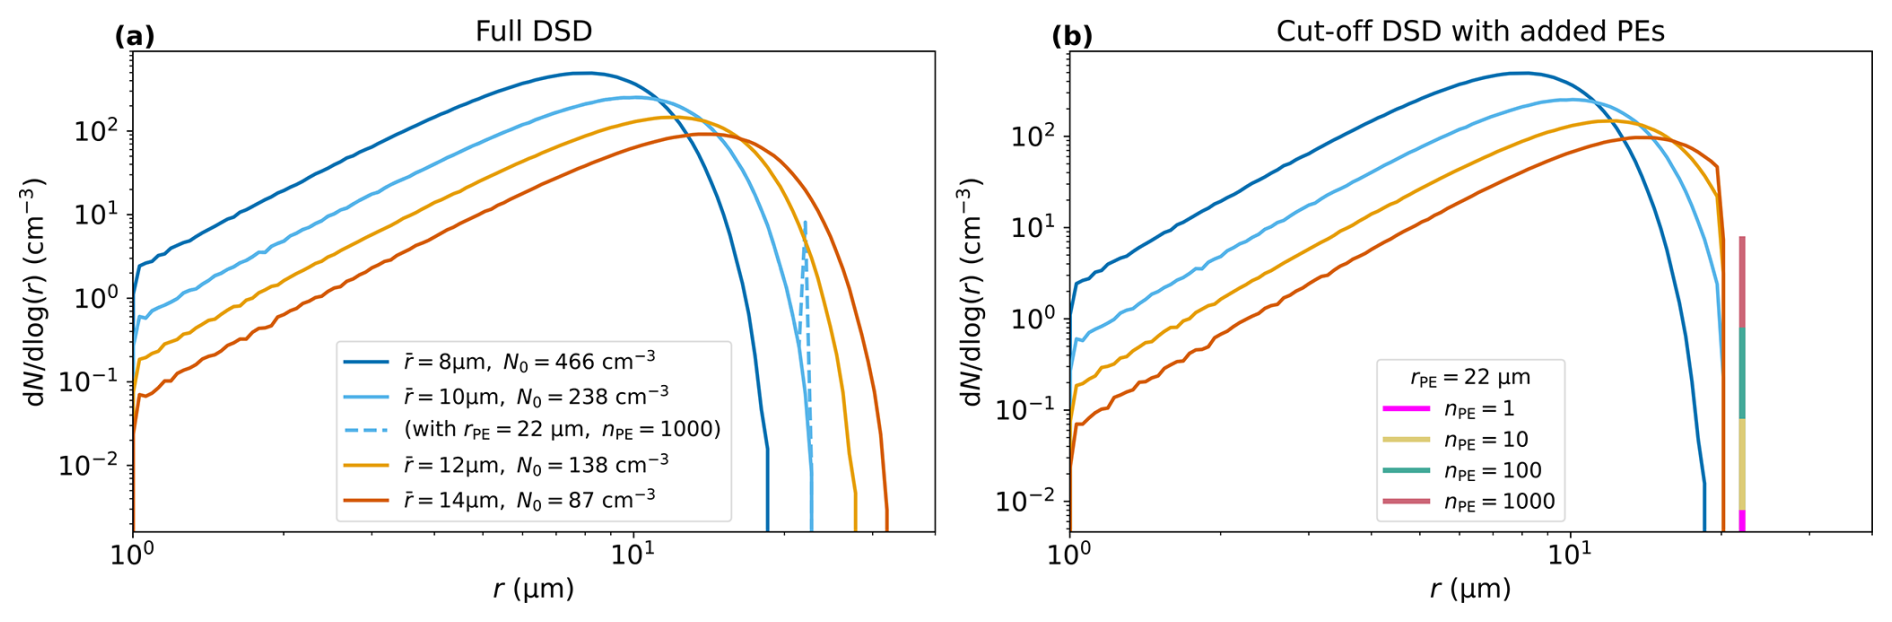
Figure 1(a) Initial DSDs for various and their corresponding N0 values. The dashed line represents the DSD with rPE=27 µm and nPE=1000. (b) Initial DSDs with a DSD cut-off for various and N0 values, along with a vertical bar plot showing various PE distributions for rPE=27 µm and various nPE values.
To explore the impact of PEs, we investigate 42 ensemble simulations, each representing different combinations of PE radii (rPE = 18, 22, 27, 33, 40, and 50 µm) and numbers (nPE = 1, 3, 10, 30, 100, 300, and 1000). Here, we define PEs as any droplets added to the original DSD, although the conventional definition of PEs requires rPE>20 µm. The largest PE size is chosen to correspond to the size of haze particles grown from 1 to 5 µm sea salt aerosols (Kuba and Murakami, 2010). We choose a minimum of nPE=1 to investigate whether a one-in-a-million PE can accelerate droplet collision, as highlighted in previous studies on lucky droplets (Kostinski and Shaw, 2005; Dziekan and Pawlowska, 2017). Within a given reference volume, the minimum and maximum nPE values of 1 and 1000 correspond to concentrations of approximately and cm−3, respectively, reflecting the wide range of PE concentrations observed in nature (Khain, 2009; Jung et al., 2015).
Every setup is simulated 100 times with different random numbers to ensure statistical convergence (Fig. A1). Using a time step δt=0.1 s, the model is integrated for 7200 s to account for the slowest realization to complete collisional growth, but the discussion is focused on the initial 2500 s, capturing the initiation of collisional growth. A total of 106 computational particles (nptcl=106) are initialized to represent the initial DSD of RM10, resulting in a reference volume . For cases with different N0, nptcl scales with N0 from 106 at RM10 (N0=238 cm−3) to nptcl=1 953 125 at RM8 (N0=466 cm−3), and nptcl=364 431 at RM14 (N0=87 cm−3). This adjustment only applies to non-PE particles, with nPE being varied from 1 to 1000 for all N0.
Changing also alters the number and mean radius of droplets larger than 20 µm, which are critical for initiating droplet collisions. For instance, the radii of the largest initialized droplets are 24 and 34 µm for RM10 and RM14, respectively. To isolate the dependency of the PE effect on the DSD shape for smaller droplets, we remove droplets larger than 20 µm in specific simulations (Wang et al., 2006; Dziekan and Pawlowska, 2017). This initialization is referred to as a “cut-off DSD” (see the dotted line in Fig. 1). We denote these cases by adding the letter “N” to the naming convention (e.g. RM10N), referring to the resulting narrower DSD.
To investigate the effect of TICE, five different kinetic energy dissipation rates , and 200 cm2 s−3 are considered for RM10. These ε values are chosen to explore the TICE effect across different cloud types, where typical values range from 1 to 10 cm2 s−3 in stratocumulus clouds, from 10 to 100 cm2 s−3 in shallow convective clouds, and from 100 to 1000 cm2 s−3 in deep convective clouds (Siebert et al., 2006; Seifert et al., 2010; Pruppacher and Klett, 1980). TICE is incorporated into Eq. (3) using the parameterizations developed by Ayala et al. (2008) and Wang and Grabowski (2009), which are steered by ε. When TICE is considered, the case names are amended by a “T” followed by the numerical value of ε (cm2 s−3) (e.g. RM10-T100).
In this study, the timescales t100 and t10 % are used to characterize the precipitation efficiency. In previous studies, the time for the first raindrop formation is used to quantify the efficiency of stochastic raindrop formation (Dziekan and Pawlowska, 2017). In this study, a raindrop is defined as a droplet larger than 40 µm. As PEs considered in this study can be raindrops already, we define t100 as the time required for the formation of the first 100 µm droplet, i.e. a sufficiently large droplet that stimulates subsequent collisions (Kostinski and Shaw, 2005; Alfonso et al., 2019). Thus, t100 characterizes the efficiency for raindrop formation. The timescale t10 % represents the time when 10 % of the initial cloud droplet mass is converted into rain, measuring the efficiency of rain initiation from a mass perspective (Onishi et al., 2015; Dziekan and Pawlowska, 2017).
Adding PEs increases the initial qc or the rainwater mixing ratio qr when rPE>40 µm and nPE>0, potentially limiting the comparability of simulated cases. To address this, we restricted the analysis of t10 % and further conversion rates such as the autoconversion rate (i.e. raindrop formation by collisions between cloud droplets) and the accretion rate (i.e. raindrop growth by raindrops collecting cloud droplets) to cases where the increase in the initial qc+qr due to the addition of PEs is below 2 %. In most cases, the increase in qc and qr is below 1 %. However, two exceptions, nPE=300 with rPE=40 µm and nPE=1000 with rPE=27 µm, show an increase of 1.9 %.
3.1 Critical thresholds for raindrop formation and rain initiation
Figure 2 shows the ensemble-averaged t100 and t10 %, named μ100 and μ10 %, for RM10 and RM14. In general, increasing rPE or nPE shortens μ100 and μ10 %, indicating accelerated rain initiation. However, when rPE=18 µm, i.e. smaller than the maximum droplet radius of the initial DSD (Fig. 1a), μ100 and μ10 % are not substantially accelerated compared to those cases without PEs regardless of nPE. Note that, in the case without PEs, μ100 and μ10 % are 1027 and 1452 s, respectively, for RM10. This indicates that the addition of PEs smaller than the maximum droplet radius of the DSD, even in large numbers (e.g. nPE=1000), has a negligible effect on raindrop formation. Interestingly, nPE plays a more crucial role for μ10 % than for μ100. For nPE≤3, μ10 % is not accelerated (Fig. 2b) even for large PEs, whereas μ100 is accelerated (Fig. 2a). Thus, a faster μ100 does not always ensure a shorter μ10 %.
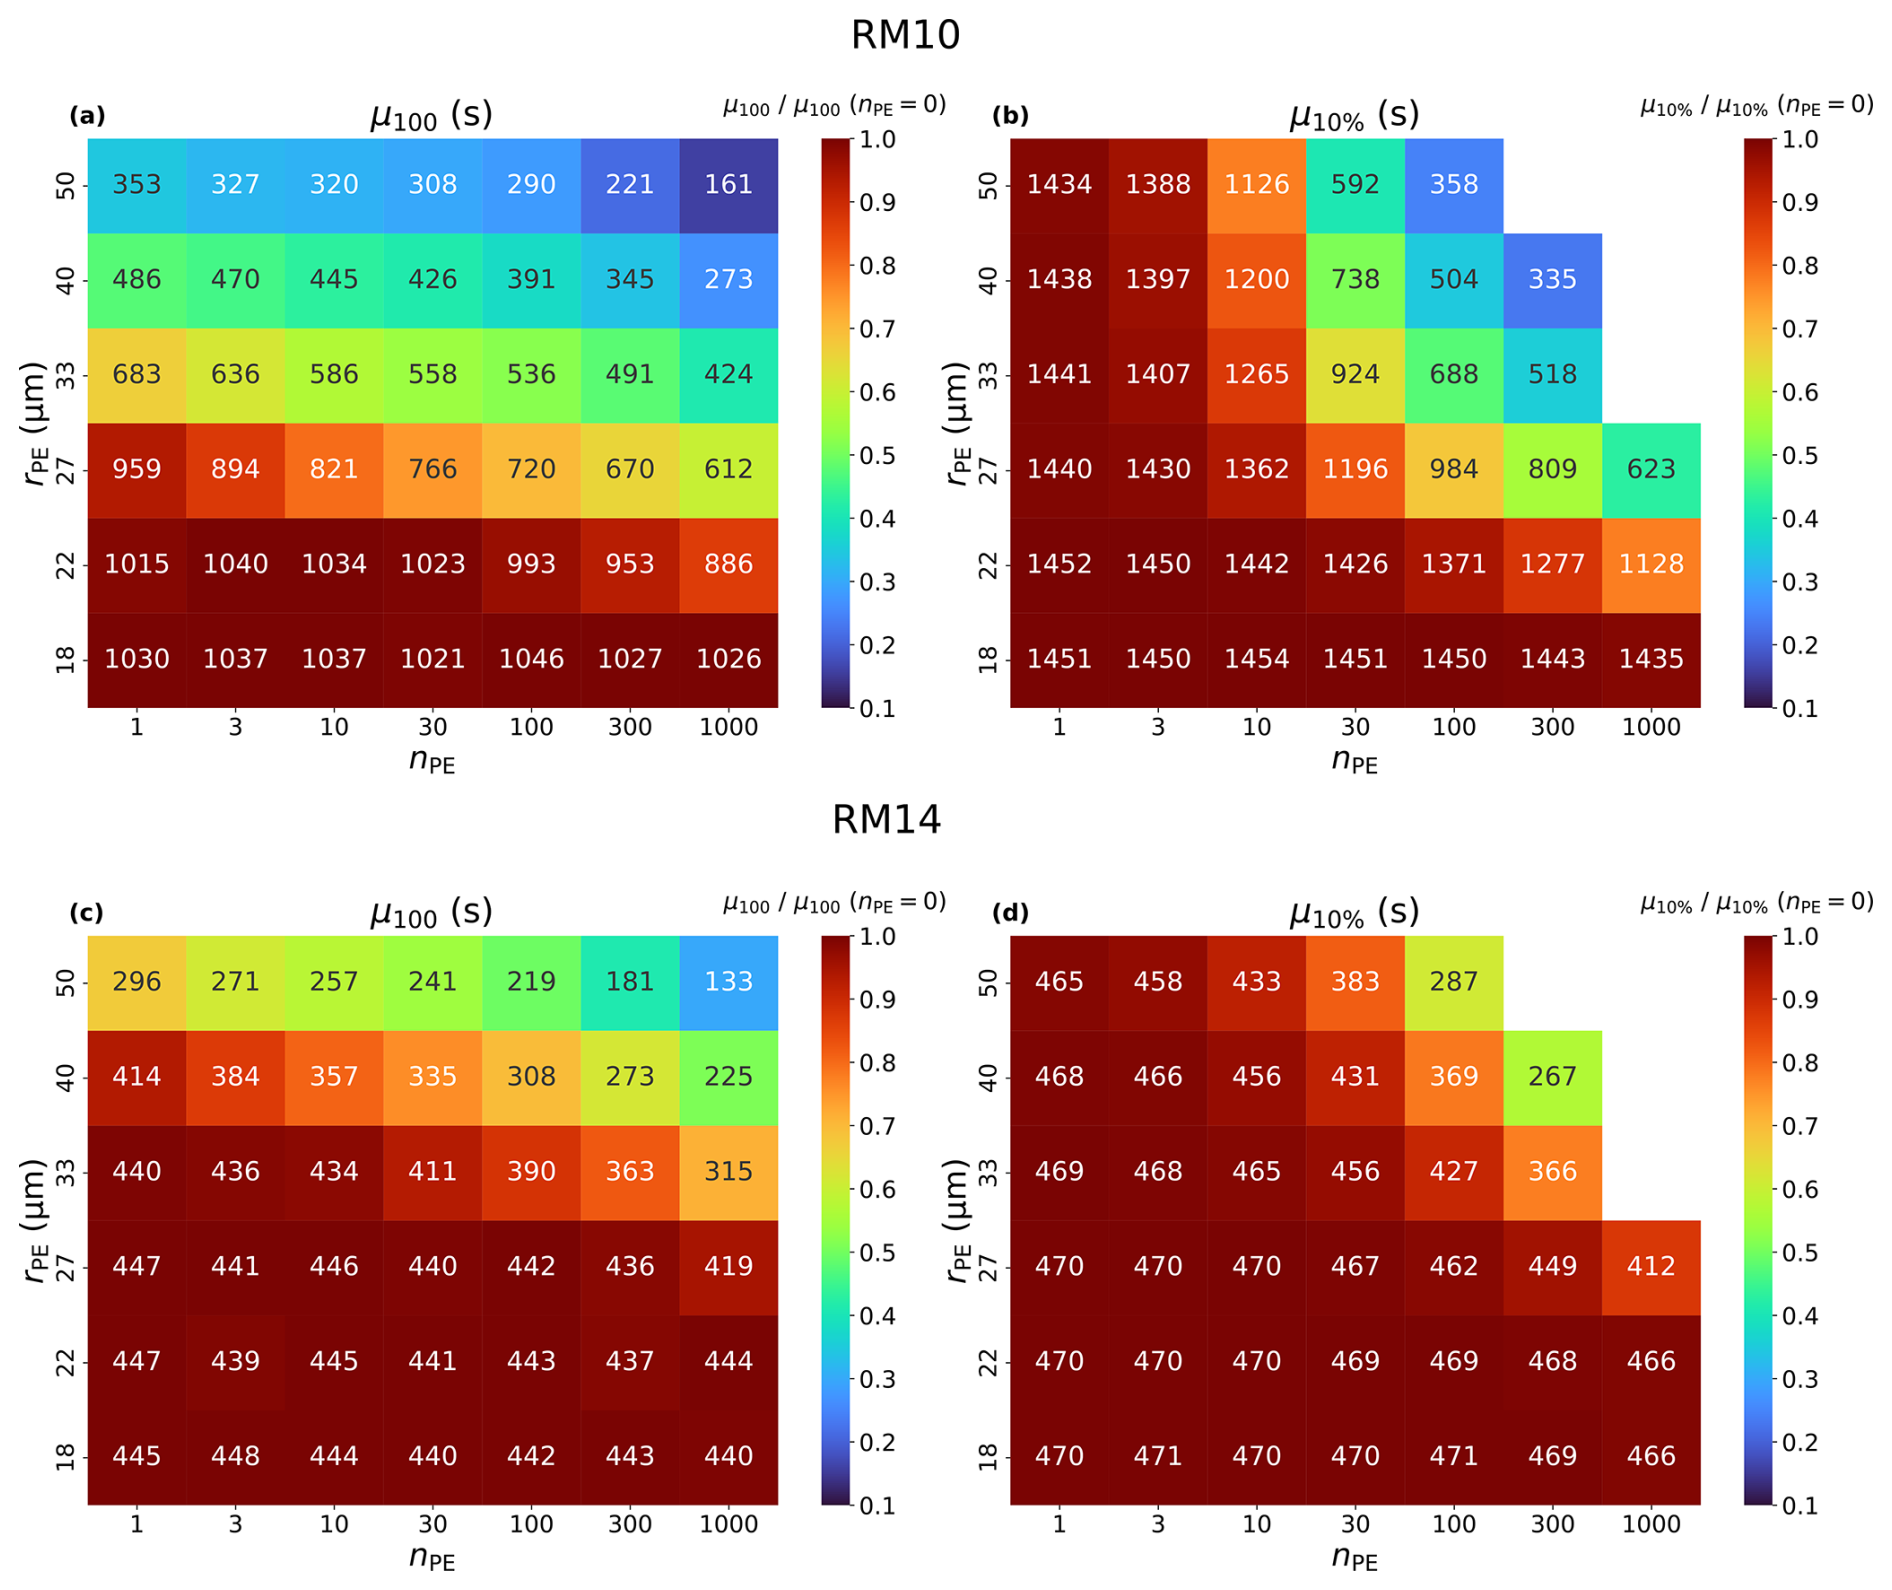
Figure 2Ensemble-averaged values of (a, c) the time for the first 100 µm of raindrop formation, μ100, and (b, d) the time for 10 % of cloud droplets to convert to raindrops, μ10%, for RM10 (first row) and RM14 (second row). The abscissa represents nPE, the ordinate rPE. μ10% values for the cases where the initial qc+qr increases by more than 2 % due to PEs are not shown. The colours in the plot represent the ratio of μ100 and μ10 % to their values in the case without PEs (nPE=0). In the case without PEs, μ100=1027 s and μ10 %=1452 s for RM10 and μ100=442 s and μ10 %=470 s for RM14.
For RM10, when nPE=3, the PE number concentration is approximately 10−3 cm−3. In this case, even PEs larger than 40 µm are not effective at accelerating t10 % (Fig. 2b). However, when the PE concentration increases to a relatively high value (nPE=30), PEs larger than 22 µm can substantially accelerate t10 % (Fig. 2b). Such high PE concentrations are uncommon but have been observed under certain oceanic conditions (Jung et al., 2015). In contrast, for RM14, which represents typical maritime clouds in a pristine environment with N0=87 cm−3, the effect of PEs is reduced. PEs smaller than 33 µm are unable to accelerate μ100 regardless of nPE (Fig. 2c). Moreover, t10 % is accelerated only when both nPE and rPE are very large (Fig. 2d). However, such extreme conditions are uncommon in typical maritime environments. This suggests that the impact of PEs depends on the initial DSD shape, requiring a collisionally stable cloud for a substantial effect.
Overall, Fig. 2 shows that μ100 and μ10 % can be shortened with increasing nPE and rPE, but only if a critical threshold is exceeded. Below this critical threshold, the effect of PEs on rain initiation is negligible. This raises the following question: what are the specific size and number of PEs required to accelerate rain initiation substantially? To identify the critical threshold, we first express μ100 and μ10 % as functions of nPE and rPE. As shown in Fig. 2, μ100 and μ10 % decrease as both nPE and rPE increase once the critical threshold is exceeded. Thus, we write
for a μα value exceeding the critical threshold. Here kα is a rate-of-change coefficient, cα is a constant, and Φα(nPE,rPE) represents the composite relationship of nPE and rPE with scaling exponents aα and bα. The subscript α is 100 % and 10 % for μ100 and μ10 %, respectively.
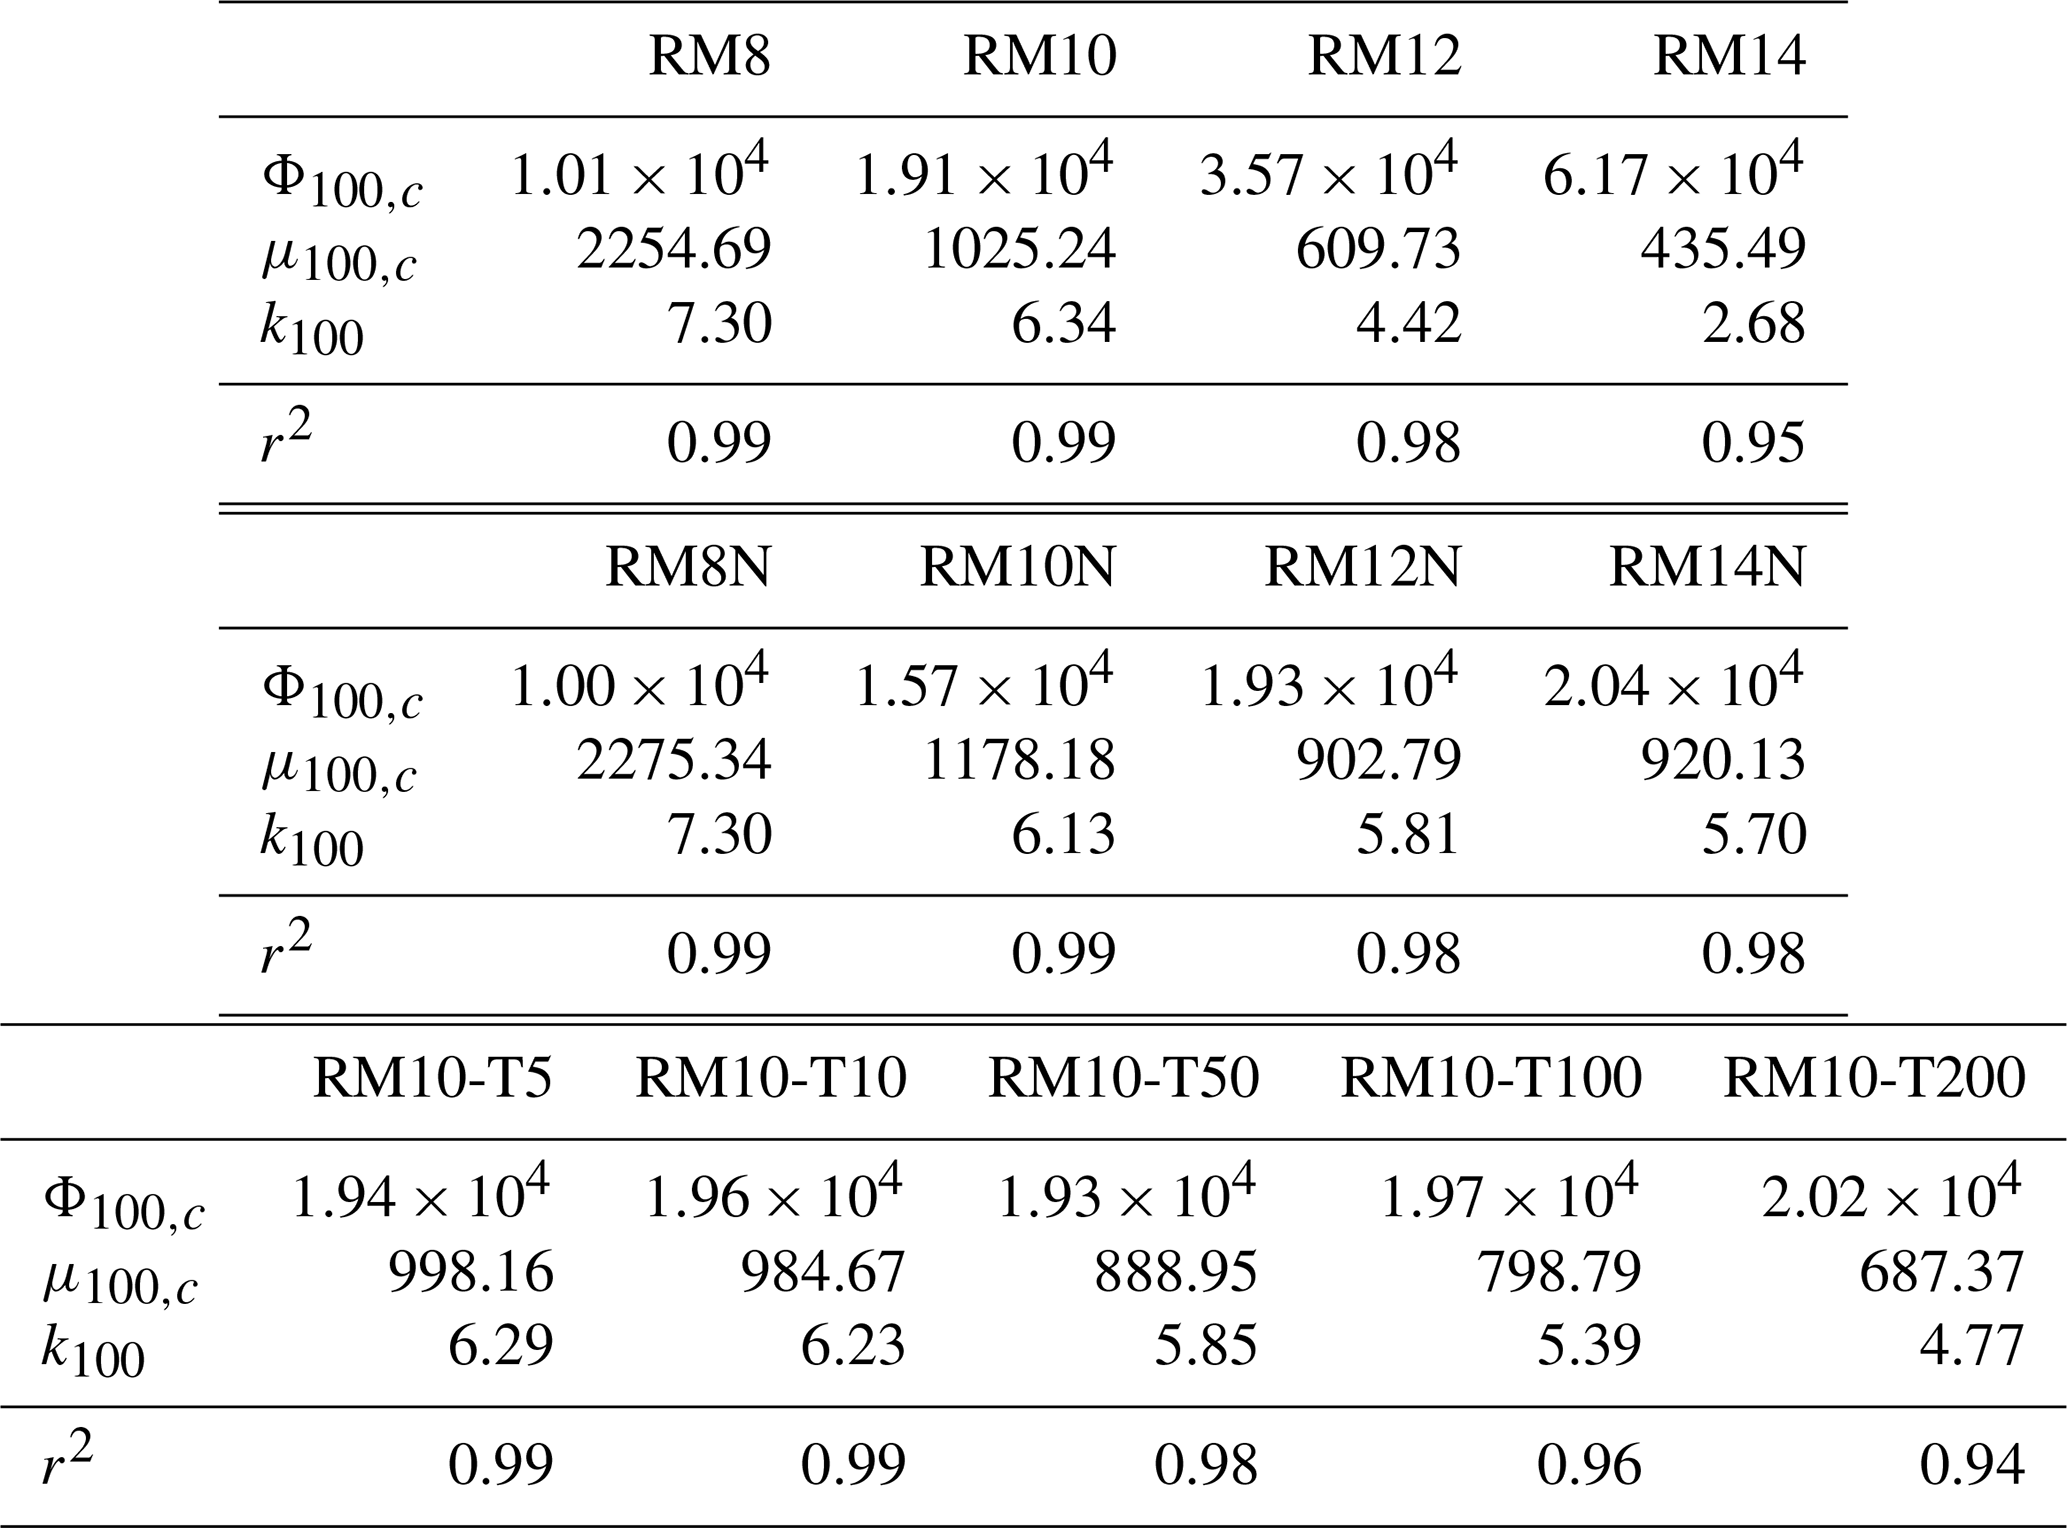
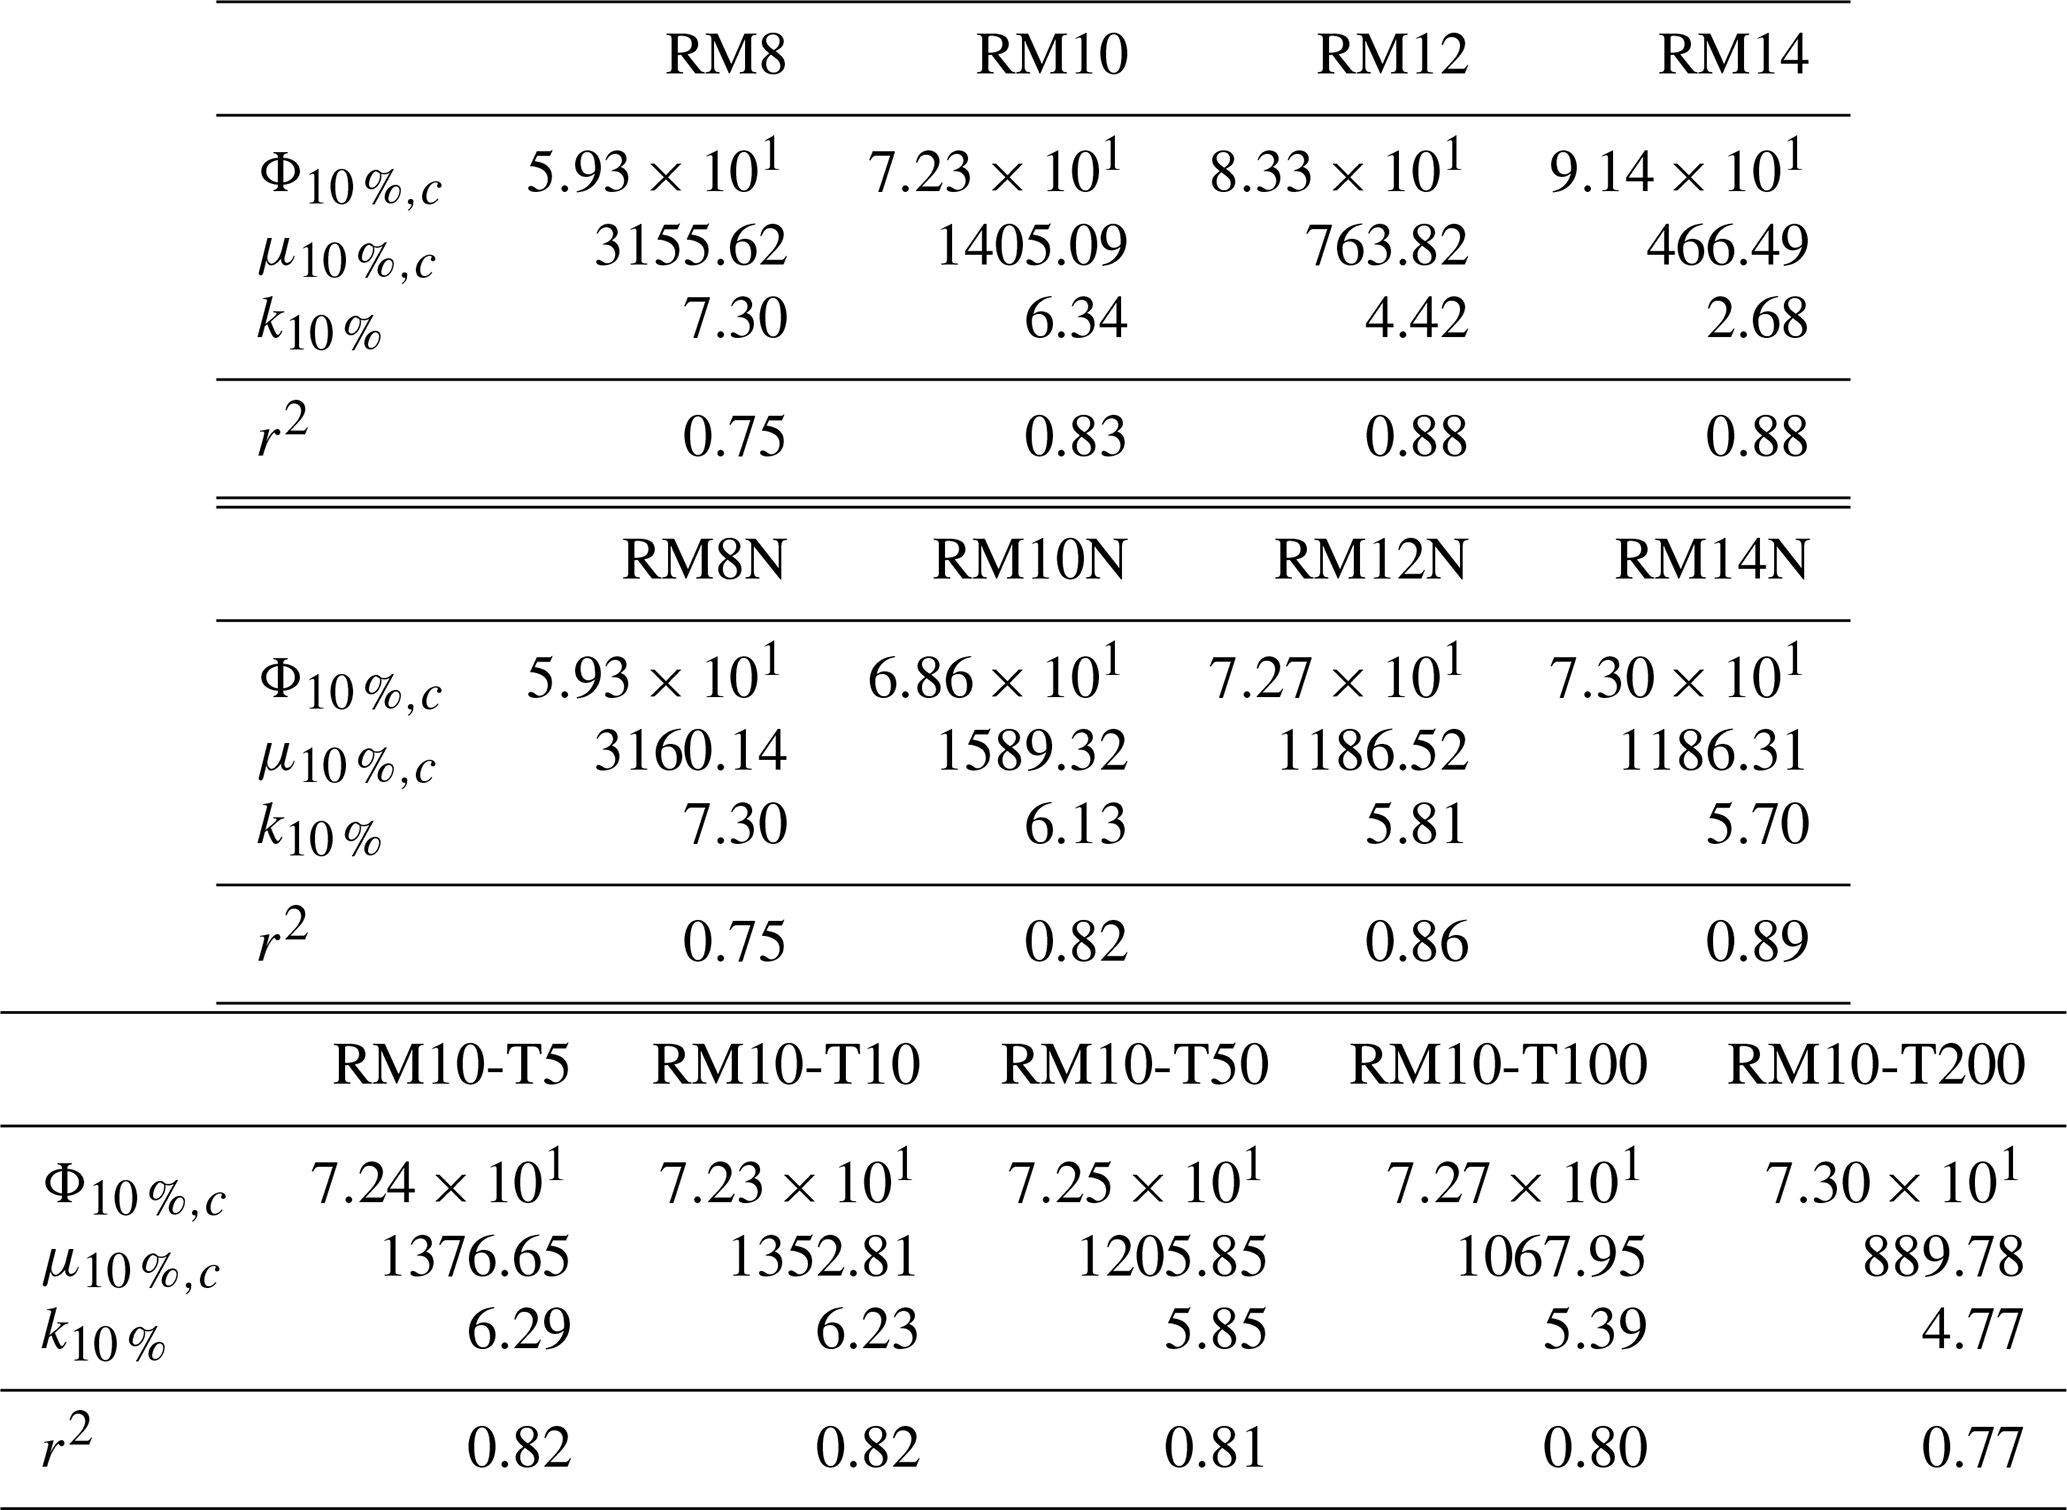
To determine the parameters of Eq. (5), we fit aα, bα, cα, and kα, using μ100 and μ10 % from cases with rPE≥22 and nPE≥10. In these cases, both μ100 and μ10 % are directly affected by changes in rPE and nPE (Fig. 2). That is, the PE critical threshold is exceeded. The fitted parameters are a100=0.086, b100=3.086, c100=3363 s, and k100=1.035 for μ100 and a10 %=0.13, b10 %=1.13, c10 %=165 592 s, and k10 %=3.018 for μ10 %, with rPE in micrometres. The units of each parameter are detailed in Appendix B.
Our focus will be on Φα(nPE,rPE), with aα and bα first. The parameters cα and kα will be discussed in more detail after we expand Eq. (5) with more physically meaningful terms. The values of aα and bα indicate that both μ100 and μ10 % are more sensitive to rPE than nPE, as expected from Fig. 2. When comparing a100 and b100 to a10 % and b10 %, the dependency on nPE is stronger in μ10 % than in μ100, which is also consistent with the results shown in Fig. 2. Figure 3 juxtaposes the simulated and predicted μ100 and μ10 % using Eq. (5). This result indicates that μ100 and μ10 % can be expressed with Φα relatively well. However, Eq. (5) overestimates μ10 % when it is over 1400 s (Fig. 3b). This is due to the cases with nPE<10, which show almost no dependency on rPE. The reasons behind this behaviour will be discussed further in detail in Sect. 4.
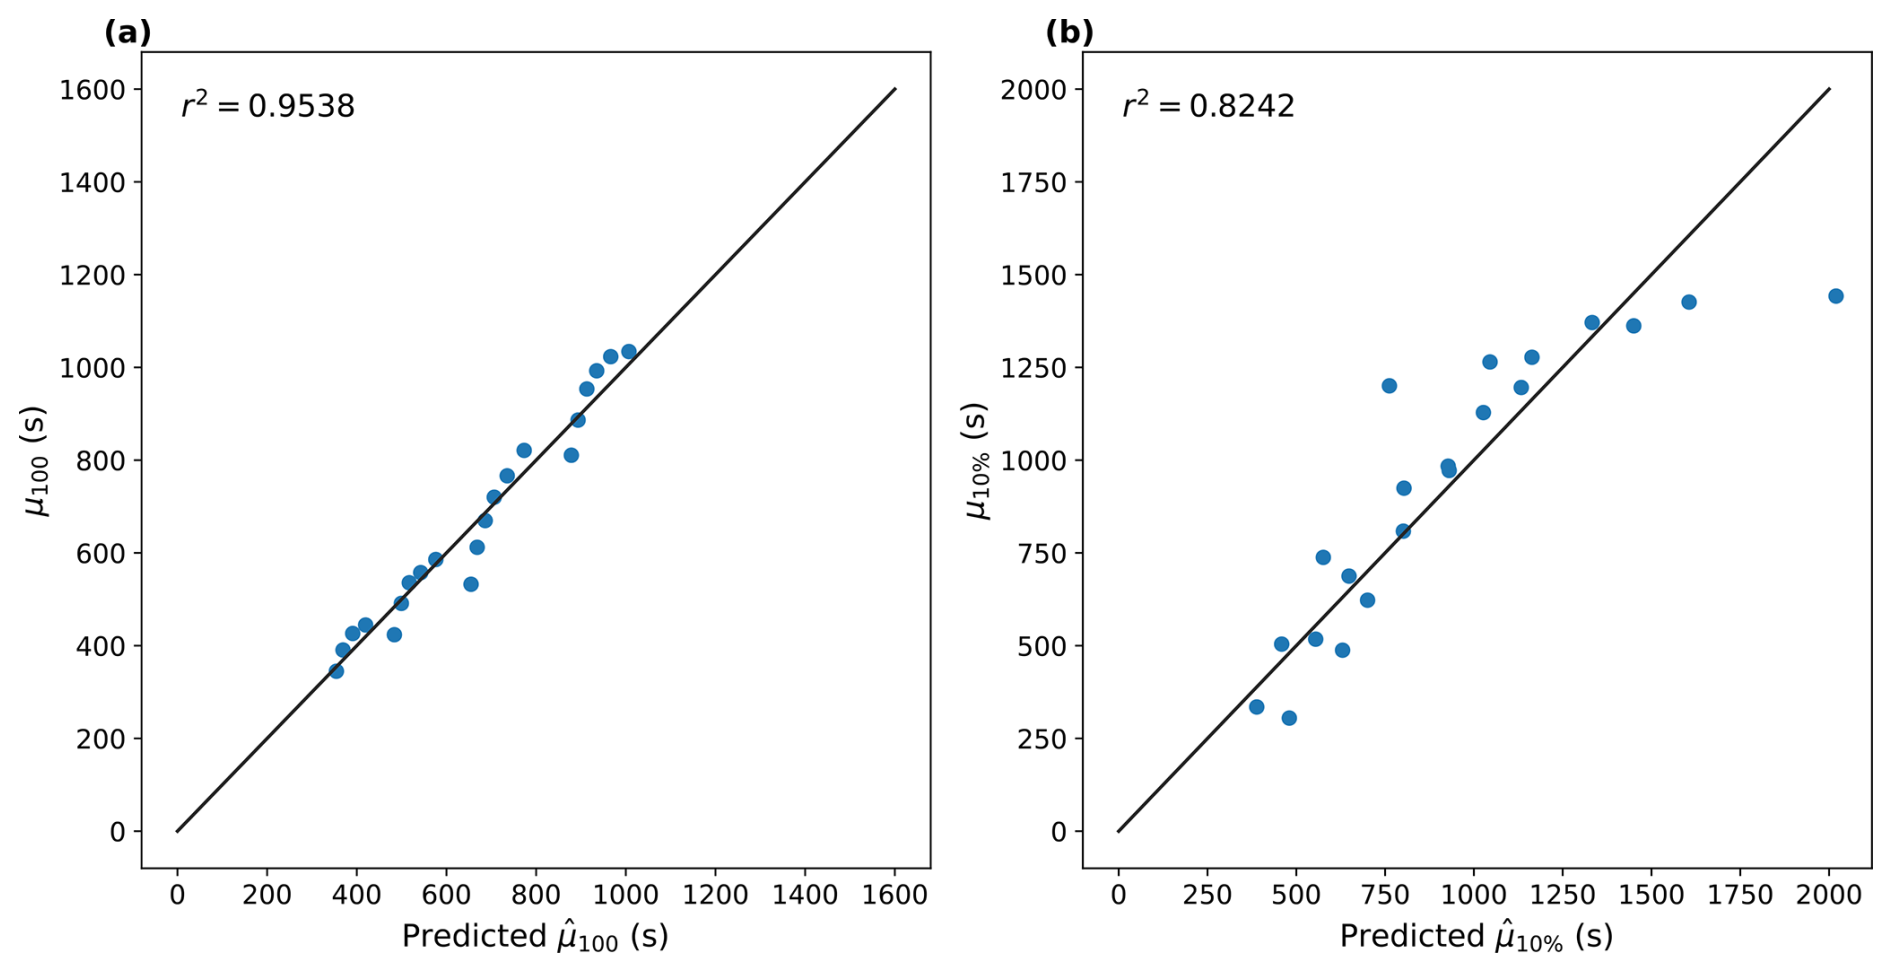
Figure 3Scatterplots of simulated (a) μ100 and (b) μ10 % (ordinate) and predicted (abscissa) values using Eq. (5) for RM10. The solid black lines indicate the one-to-one line.
To better capture the behaviour of μ100 and μ10 %, especially near the critical threshold where the dependency on rPE and nPE vanishes, e.g. cases where rPE<22 µm and nPE<10 for RM10, we expand Eq. (5) by a Heaviside step function ℋ, such that
where μα,c is the baseline value of μα in the absence of PEs incorporating parameter cα from above. When fitting Eq. (6) to all of the results, the parameters aα and bα were fixed to the values previously obtained from RM10 to enable a more direct comparison between different cases, focusing solely on the parameters in Eq. (6). The specific parameters for Eq. (6) and their r-squared values are detailed in Appendix B. In general, r-squared values exceed 0.95 for μ100 and range from 0.67 to 0.84 for μ10 %. The results of μ100(Φ100) and μ10 %(Φ10 %) for RM10 are shown in Fig. 4a and b as blue solid lines. Until they exceed their critical thresholds ( and for RM10; see Tables B1 and B2), μ100 and μ10 % remain constant at and . These values agree well with μ100 and μ10 % without PEs, at 1027 and 1452 s, respectively. However, once Φα becomes larger than Φα,c, i.e. exceeds the critical threshold, μ100 and μ10 % decrease, as expected from Eq. (5).
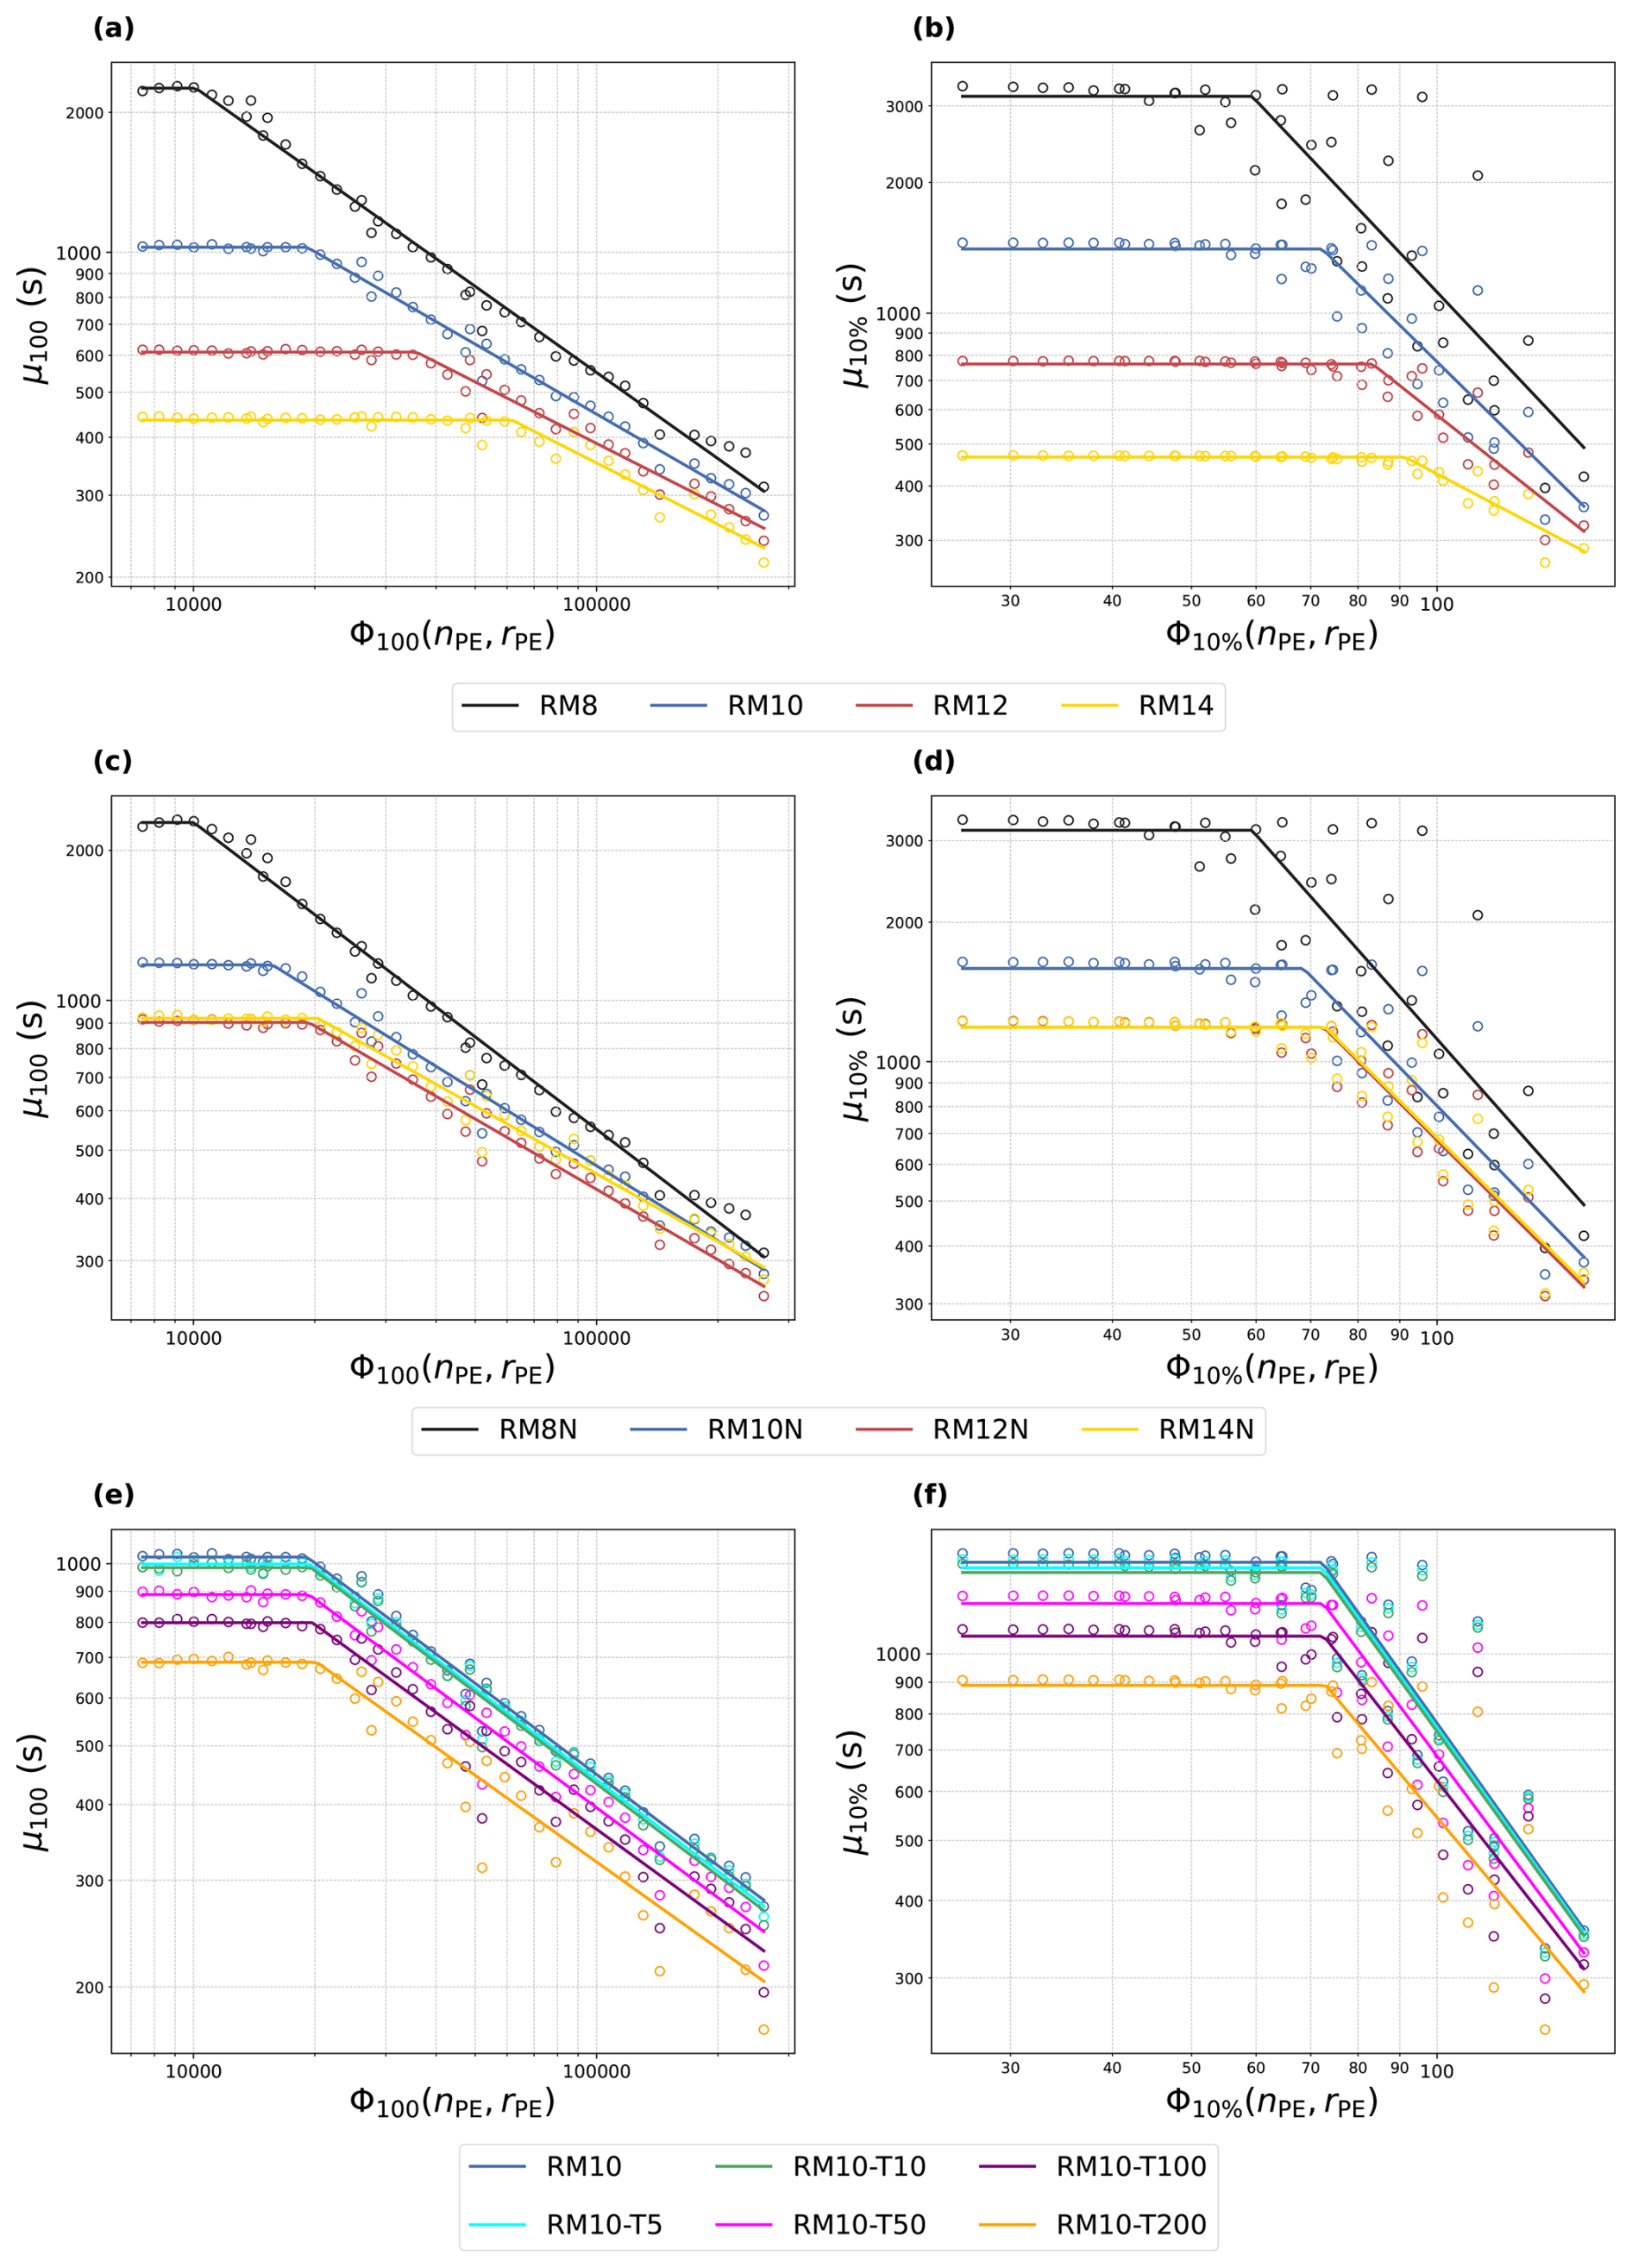
Figure 4μ100 (a, c, e) and μ10 % (b, d, f) are shown as functions of Φα for different initial conditions. Each point represents the simulation results, while the solid lines indicate the fitted Eq. (6). The first row (a, b) represents cases without a cut-off DSD (RM8, RM10, RM12, and RM14), and the second row (c, d) represents cases with a cut-off DSD (RM8N, RM10N, RM12N, and RM14N). The third row (e, f) represents RM10 with different ε values (RM10-T5, RM10-T10, RM10-T50, RM10-T100, and RM10-T200).
3.2 Factors controlling the critical threshold
Using Eq. (6), we are now able to investigate how the critical threshold varies for different initial DSD shapes (characterized by and the consideration of a cut-off radius) and the presence of TICE. To achieve this, we fit the results to Eq. (6) for RM8, RM10, RM12, and RM14 without or with a cut-off DSD (Fig. 4a–d). Additionally, we consider the TICE for RM10 (Fig. 4e and f). Although the values of parameters aα and bα for Φ100 and Φ10 % may vary for different cases, we fix them to the values obtained earlier (see Fig. 3) to directly compare μα,c, Φα,c, and kα across different initial conditions. The fitted parameters for these initial conditions are detailed in Appendix B. Figure 4 shows that all cases exhibit the same fundamental feature: the presence of a critical threshold Φα,c.
As increases, both μ100,c and μ10 %,c decrease (Figs. 4a and b and 5b and d). This is due to the increased number of large droplets, making collisions more likely when increases. Results from the cases with a cut-off DSD with different are shown in Fig. 4c and d. As before, μ100,c and μ10 %,c also decrease with increasing , although the largest droplet size remains unchanged due to the cut-off DSD (Fig. 5b). Here, this is due to the increased number of droplets in the 15–20 µm size range among non-PE droplets (Fig. 1b), which can initiate collisions through stochastic processes. However, μ100,c and μ10 %,c remain nearly unchanged for the and cases because the difference in the number concentration of 15–20 µm droplets between these cases is minimal (Fig. 1b), even though the number concentration of smaller droplets is substantially lower for . This suggests that μ100,c is more sensitive to the number concentration of larger droplets (e.g. those with radii of 15–20 µm) than that of smaller droplets, particularly when considering the cut-off DSD.
Figure 5Results of (a) Φ100,c, (b) μ100,c, (c) Φ10 %,c, and (d) μ10 %,c for different . The black circles depict cases without a cut-off DSD (original), while the light-blue circles depict cases with a cut-off DSD. The orange star, cross, and triangle represent the results with ε=5, 50, and 200 cm2 s−3, respectively, for RM10. The insets show a zoomed-in view of the cases with different ε at µm.
The critical threshold Φ100,c increases with increasing , indicating that more and larger PEs are required to exceed the critical threshold (Fig. 5a). Interestingly, for , almost all sizes and numbers of PEs are effective at shortening μ100 (Fig. 2a). In contrast, for , Φ100,c becomes very high, making most PEs ineffective at shortening μ100. This suggests that the PE effect is more pronounced for DSDs where collisions among droplets are less efficient, i.e. cases with smaller and slower μ100.
In cases with a cut-off DSD, Φ100,c is lower compared to those without a cut-off DSD for the same (Fig. 5a). This is due to the absence of larger droplets in the initial DSD, which are as effective as PEs in the collision process. Thus, employing a cut-off DSD, which removes large droplets, amplifies the influence of PEs. Likewise, the results for Φ10 %,c show a similar pattern to those for Φ100,c (Fig. 5a and c), with Φ10 %,c increasing as becomes larger. Now, we examine the relationship between the radius of the largest initialized non-PE droplet and the radius of a single PE, which can accelerate t100. We employ Φ100,c for RM10 and RM10N from Table B1. When nPE=1, the critical rPE=24.4 and 22.9 µm for RM10 and RM10N, respectively. In each case, the radii of the largest initialized non-PE droplet are 24 µm (RM10) and 20 µm (RM10N). Therefore, for RM10, a single PE only slightly larger than the largest initialized non-PE droplet radius is sufficient to exceed the critical threshold. In contrast, RM10N requires PEs much larger than the largest non-PE droplet. This difference implies that the critical PE size is influenced not only by the radius of the largest initialized non-PE droplet, but also by the collision efficiency among non-PE droplets, which depends on and whether a DSD cut-off is present.
Additionally, the TICE effect is considered for RM10 (Fig. 4e and f). TICE has a greater impact on μα,c than on Φα,c. Specifically, μα,c decreases as ε increases (Figs. 4e and f and 5b and d), whereas Φα,c only exhibits a slight increase (Figs. 4e and f and 5a and c). This indicates that TICE enhances the efficiency of collisions among all cloud droplets, making μα,c shorter. Therefore, more PEs are required in the presence of TICE compared to cases without it. Notably, the critical PE threshold only increases substantially when (Fig. 5a and c, Table B1). This indicates that the influence of TICE on limiting the PE effect is primarily important in deep convective clouds or in regions within shallow clouds where ε is locally high (e.g. Pruppacher and Klett, 1980). In summary, when droplet collisions are already efficient without PEs – due either to the presence of large droplets (i.e. a large or the absence of a DSD cut-off) or the influence of TICE – a larger PE size and number are necessary to substantially accelerate rain initiation.
Although we have identified the existence of the critical threshold for the PE effect, there remains a question regarding why t10 % is not always affected by the presence of PEs even though t100 is decreased (e.g. nPE<10 cases in Fig. 2). This discrepancy may arise because t10 % involves interactions between multiple droplets and PEs, whereas t100 depends on the behaviour of an individual droplet or PE. This suggests that, while PEs can accelerate the formation of the largest raindrop, these droplets may not directly impact the overall rain mass growth when the number of PEs is low. In the following section, we will explore how PEs affect t10 % to explain why a shorter t100 does not ensure a shorter t10 %.
In order to understand the effects of PE size and number on rain initiation more clearly, we consider the time series of the raindrop mixing ratio qr, the autoconversion, and the accretion rate (i.e. raindrop growth by raindrops collecting cloud droplets) using rPE=22 and 27 µm with different nPE values from 0 to 300 for RM10 (Fig. 6). Overall, qr evolves faster for larger rPE and nPE values (Fig. 6a and b). However, with PEs below the critical threshold (i.e. for nPE≤30 at rPE=22 µm and nPE≤3 at rPE=27 µm), the difference from the cases with and without PE is insignificant, implying that PEs do not substantially enhance rain initiation, although raindrop formation (qr>0) starts earlier (Fig. 6a and b). This result is consistent with Fig. 2, in which μ100 is smaller than μ100,c but μ10 % is comparable to μ10 %,c.
Figure 6Time series of (a, b) the raindrop mixing ratio, (c, d) the autoconversion rate, and (e, f) the accretion rate for RM10, shown for two different values of rPE: 22 µm (first column) and 27 µm (second column). The colours of the lines represent different nPE values, with the black solid line representing the result from the simulation without PEs (nPE=0). In panels (c)–(f), the solid lines denote autoconversion and accretion without PEs (between non-PE droplets exclusively), while the dotted line depicts autoconversion and accretion by PEs.
The time series of autoconversion and accretion provide more details on how PEs affect rain initiation. In Fig. 6c–f, the solid lines represent droplet growth without PEs (i.e. between non-PE droplets exclusively), while the dotted lines represent droplet growth involving PEs (i.e. collisions between PEs and non-PE droplets or among PEs). We find that non-PE autoconversion decreases with increasing nPE (Fig. 6c and d). This is because large PEs have an advantage in the autoconversion process, growing more quickly and collecting non-PE droplets, which in turn suppresses the autoconversion of non-PE droplets.
For rPE=22 µm, both autoconversion and accretion initiate earlier with PEs than in the case without PEs, but only for nPE≥100 (Fig. 6c). When nPE<30, autoconversion and consequently accretion by PEs are even slower than those of non-PE droplets. This implies that the collisional growth of PEs is not necessarily faster than the collisional growth among non-PE droplets. Thus, although larger PEs are more likely to collide, the overall collision frequency remains low when nPE is small, resulting in slower PE autoconversion compared to non-PE autoconversion. While non-PE-autoconversion always decreases with increasing nPE, PE autoconversion increases substantially only for nPE≥100. Therefore, before exceeding the critical threshold, PEs suppress non-PE autoconversion more than they enhance autoconversion, which can even lead to a decrease in the total (PE and non-PE) autoconversion. Hence, a shorter t100 does not necessarily lead to a shorter t10 % when nPE is small (Fig. 2).
For rPE=27 µm, while non-PE autoconversion always decreases with increasing nPE, PE autoconversion increases substantially only when nPE≥100. Therefore, before exceeding the critical threshold, PEs suppress non-PE autoconversion more than they enhance autoconversion, which can even lead to a decrease in the total (PE and non-PE) autoconversion. Interestingly, increasing nPE does not affect the time to initiate PE autoconversion but only affects its magnitude (Fig. 6c). The initiation time for PE autoconversion is influenced by rPE since this process is closely related to the number of collisions or the time required for droplets to grow larger than 40 µm, which occurs more quickly for larger PEs (Fig. 6c and d). Thus, rPE determines the initiation time for autoconversion, especially when rPE≥27 µm, while nPE determines how much non-PE droplet autoconversion and accretion are suppressed. PE accretion starts earlier when rPE=22 µm and nPE>100 and any nPE for rPE is 27 µm (Fig. 6e and f), which is triggered by the earlier raindrop formation by PE autoconversion (Fig. 6c and d). However, even for rPE=27 µm, accretion by PEs increases only slightly when nPE≤30, i.e. below the critical threshold. Once the critical threshold is exceeded, particularly for nPE>30, accretion is substantially increased and accelerated compared to the case for nPE=0 (Fig. 6e and f). In this case, accretion is dominated by PEs, outweighing the decrease in non-PE autoconversion (Fig. 6e and f), and initially a larger qr persists (Fig. 6a and b).
Interestingly, at high nPE, the non-PE autoconversion and accretion rates reach their peak values earlier than in cases without PEs or with low nPE (Fig. 6c–f). During the initial 1000 s, the non-PE autoconversion rate is nearly identical across all of the cases, regardless of nPE. However, when nPE is high, more non-PE droplets are collected by PEs, reducing the number of droplets available for autoconversion. As a result, the non-PE autoconversion rate peaks and declines earlier in cases with higher PE concentrations. This suppression of non-PE autoconversion decreases the number of non-PE raindrops and the non-PE accretion rate. These findings highlight that the primary role of PEs is to collect non-PE droplets, which might suppress non-PE autoconversion and accretion.
Results with TICE (, Fig. 7) also highlight the importance of PEs in suppressing non-PE autoconversion. With TICE, collisions between small and similar-sized droplets are more efficient (Pinsky et al., 2008). Thus, with TICE, non-PE autoconversion is still substantial when nPE≥100 (Fig. 7d), while it is almost totally suppressed without TICE (Fig. 6d). Thus, more and larger PEs are needed to outweigh non-PE accretion, making droplet growth less sensitive to PEs when TICE is considered. However, even with TICE, if nPE substantially exceeds the critical threshold (rPE=27 µm and nPE=300), droplet collisional growth is entirely dominated by PEs (purple solid line in Fig. 7f). Thus, while both PEs and TICE accelerate droplet collisional growth, each effect becomes weaker when the other effect dominates rain initiation (e.g. Chandrakar et al., 2024).
Understanding whether precipitation embryos (PEs), particles larger than the so-called size gap range, can accelerate the droplet collision process remains a key question in warm rain initiation. Despite decades of research on the effect of PEs on rain initiation (e.g. Telford, 1955; Johnson, 1982; Feingold et al., 1999; Teller and Levin, 2006; Alfonso et al., 2013), this challenge persists and is still highlighted in recent studies (e.g. Chen et al., 2020; Dziekan et al., 2021; Chandrakar et al., 2024), underscoring the need for further investigation. In this study, we systematically investigated how PEs affect droplet collisional growth using ensembles of Lagrangian cloud model (LCM) collision simulations. Our primary focus was on identifying the minimal PE size and number necessary to accelerate the droplet collision–coalescence process substantially. We evaluated the droplet collision efficiency using two timescales: the time required for the first 100 µm droplet to form (t100) and the time to convert 10 % of the total initial cloud mass to rain mass (t10 %).
We found that the droplet collision process does not substantially accelerate when the number or size of a PE is below a critical threshold. t100 is accelerated only when the radii of PEs are larger than the maximum non-PE droplet radius of the initial DSD. This is because t100 is more related to the growth of a single droplet where larger droplets, such as PEs, are expected to grow more quickly than smaller droplets. In contrast, t10 % depends more on the number of PEs. Even with substantially large PEs, a faster formation of the first large raindrop does not always ensure faster rain initiation when the number of PEs is small. This is because PEs increase autoconversion and accretion only when their number is sufficient while simultaneously suppressing the autoconversion of non-PE droplets to become raindrops. Thus, when autoconversion of non-PE droplets is already efficient, more or larger PEs are required to accelerate t10 %.
To determine the critical threshold for rain initiation by PEs, we derived a simple equation that relates the numbers and sizes of PEs to t100 and t10 %. The equation revealed that the critical threshold depends on the collisional stability of the DSD characterized by the DSD shape or TICE. We showed that increasing the droplet mean radius and hence the sizes of pre-existing large droplets increases the collisional stability of the DSD and makes the collisional process less susceptible to PE perturbations because non-PE droplet collisions are already sufficient for initiating rain. Equivalently, more and larger PEs are needed to substantially accelerate the droplet growth with TICE, which increases the collision frequency among smaller non-PE droplets, making the collision process less reliant on PEs. Although TICE does not directly alter the PE critical threshold, it reduces the difference in rain initiation acceleration between cases with and without PEs. Consequently, more and larger PEs are required to achieve the same acceleration in droplet growth as in cases without TICE.
In this study, PEs larger than 22 µm are found to effectively accelerate the precipitation (t10 %) of clouds in relatively polluted environments when their concentration exceeds 10−3 cm−3, which is consistent with Feingold et al. (1999). While this PE concentration falls within the range observed for giant sea salt particles over the ocean (Jung et al., 2015), for clouds in a pristine environment substantially higher numbers and sizes of PE are required to achieve effective precipitation acceleration. These observations are based on measurements of sea salt aerosols (2–20 µm), which have large solution masses and correspondingly large equilibrium sizes. However, under atmospheric conditions, these particles might not have sufficient time to grow to their equilibrium size (Ivanova et al., 1977), potentially resulting in lower PE concentrations. On the other hand, it is possible that PE concentrations can increase through stochastic collisions (Kostinski and Shaw, 2005; Dziekan and Pawlowska, 2017) as the cloud evolves. Furthermore, because the critical threshold decreases in DSDs with higher collisional stability, the effect of PEs is expected to be especially strong in non-precipitating or polluted clouds, as suggested in previous studies (e.g. Johnson, 1993; Dziekan et al., 2021).
While PEs can accelerate the rain initiation by collecting other droplets, they may reduce the number of raindrops by suppressing non-PE droplets to grow as raindrops. As a result, clouds without PEs may have more and larger raindrops, as PEs do not collect those before reaching the cloud top. This might lead to longer-lasting clouds and affect the precipitation differently. Thus, confirming this study's findings in more complex scenarios is necessary. Modelling efforts should incorporate additional processes such as aerosol activation, condensation, and entrainment. In particular, collisional droplet breakup (Low and List, 1982) is expected to increase the small number of PEs, causing more PE accretion afterwards, and droplet sedimentation is expected to decrease the effect of PEs by making large raindrops precipitate and preventing PEs from colliding further.
In conclusion, we confirm that a DSD barely producing raindrops is more sensitive to PEs (e.g. Dziekan et al., 2021). This underscores the need for caution in climate-engineering approaches like marine cloud brightening (Latham et al., 2012), which aim to create highly reflective clouds by artificially adding aerosol particles where the unintended initiation of rain by adding large particles could be counterproductive (Hoffmann and Feingold, 2021). Indeed, this study found that PEs surpassing a critical threshold can initiate rain, while numerous PEs with a sufficiently small size are harmless. In addition, approaches to enhance precipitation, such as cloud seeding (Bowen, 1952; Cotton, 1982), should prioritize identifying target clouds with high stability and minimal rain production to maximize efficiency.
Figure A1 illustrates how the mean and relative standard deviation of t100 (μ100 and , respectively) and t10 % (μ10 % and , respectively) evolve as the ensemble size increases from 1 to 200. Different colours of the dots represent RM8 (black), RM10 (blue), RM12 (red), and RM14 (yellow) without PEs (nPE=0). The mean values and the relative standard deviations converge when the ensemble size exceeds 100. Therefore, we consider an ensemble size of 100 to be adequate for obtaining reliable results.
Figure A1Variation of (a) μ100, (b) μ10 %, (c) , and (d) with ensemble size (nens) for RM8, RM10, RM12, and RM14 without PEs (nPE=0).
Table B1 depicts the parameters and r2 values derived from curve-fitting Eq. (6) to μ100 for each result shown in Fig. 4a. Similarly, Table B2 shows the parameters and r2 values obtained from fitting Eq. (6) to μ10 % for the results shown in Fig. 4b. The naming conventions for each case are as follows: numbers following “RM” denote (e.g. “RM8” corresponds to cases with ). “N” denotes cases with a cut-off DSD. Numbers following “T” indicate ε (e.g. “T50” corresponds to cases with ). The units of μ100,c and μ10 %,c are seconds, Φ100 is in micrometres to the power of 3.086, and Φ10 % is in micrometres to the power of 1.13. The units of Φ100 and Φ10 % are determined by Eq. (5) with the respective aα and bα parameters, where the unit of rPE is micrometres and nPE is unitless. The subscript α is 100 % or 10 % for μ100 and μ10 %, respectively. Thus, the units of kα for μ100 and μ10 % are micrometres to the power of −3.086 per second and micrometres to the power of −1.13 per second, respectively. In this study, these parameters are mainly used to compare how the critical threshold varies in different cases rather than to obtain actual values.
A Python version of the LCM code is available at https://doi.org/10.5281/zenodo.15468311 (Lim and Hoffmann, 2025). The simulations were conducted using the FORTRAN version of the code, which employs the same collision routine as the Python version but provides faster computation. Simulation data will be made available upon request to the authors.
JSL, YN, HL, and FH conceived the original conceptualization and interpretation of the results and contributed to the discussions. FH provided the base model, and JSL modified it and formally analysed the results. JSL wrote the original draft, and JSL, YN, FH, and HL contributed to the review and editing. YN and FH provided the funding acquisition for the study and project administration.
The contact author has declared that none of the authors has any competing interests.
Publisher's note: Copernicus Publications remains neutral with regard to jurisdictional claims made in the text, published maps, institutional affiliations, or any other geographical representation in this paper. While Copernicus Publications makes every effort to include appropriate place names, the final responsibility lies with the authors.
This work was supported by the Korea Meteorological Administration Research and Development Program under grant no. KMI2021-01512, a National Research Foundation of Korea (NRF) grant funded by the Korean government (MSIT) (grant no. 2021R1F1A1051121), and the Emmy Noether Program of the Deutsche Forschungsgemeinschaft (DFG) under grant no. HO 6588/1-1. The authors gratefully acknowledge the Gauss Centre for Supercomputing e.V. (http://www.gauss-centre.eu, last access: 19 May 2025) for helping this project by providing computing time on the GCS supercomputer SuperMUC-NG at the Leibniz Supercomputing Centre (http://www.lrz.de, last access: 19 May 2025). The authors greatly appreciate the comments of Clara Bayley and an anonymous reviewer that improved the quality of the paper.
This research has been supported by the Deutsche Forschungsgemeinschaft (grant no. HO 6588/1-1), the Korea Meteorological Administration (grant no. KMI2021-01512), and the National Research Foundation of Korea (grant no. 2021R1F1A1051121).
This paper was edited by Thijs Heus and reviewed by Clara Bayley and one anonymous referee.
Alfonso, L. and Raga, G. B.: The impact of fluctuations and correlations in droplet growth by collision–coalescence revisited – Part 1: Numerical calculation of post-gel droplet size distribution, Atmos. Chem. Phys., 17, 6895–6905, https://doi.org/10.5194/acp-17-6895-2017, 2017. a
Alfonso, L., Raga, G. B., and Baumgardner, D.: The validity of the kinetic collection equation revisited – Part 3: Sol–gel transition under turbulent conditions, Atmos. Chem. Phys., 13, 521–529, https://doi.org/10.5194/acp-13-521-2013, 2013. a, b
Alfonso, L., Raga, G. B., and Baumgardner, D.: The impact of fluctuations and correlations in droplet growth by collision–coalescence revisited – Part 2: Observational evidence of gel formation in warm clouds, Atmos. Chem. Phys., 19, 14917–14932, https://doi.org/10.5194/acp-19-14917-2019, 2019. a, b
Ayala, O., Rosa, B., and Wang, L.-P.: Effects of turbulence on the geometric collision rate of sedimenting droplets. Part 2. Theory and parameterization, New J. Phys., 10, 075016, https://doi.org/10.1088/1367-2630/10/9/099802, 2008. a
Baker, M., Corbin, R., and Latham, J.: The influence of entrainment on the evolution of cloud droplet spectra: I. A model of inhomogeneous mixing, Q. J. Roy. Meteor. Soc., 106, 581–598, https://doi.org/10.1002/qj.49710644914, 1980. a
Beard, K. V.: Terminal velocity and shape of cloud and precipitation drops aloft, J. Atmos. Sci., 33, 851–864, 1976. a
Blyth, A. M.: Entrainment in cumulus clouds, J. Appl. Meteorol. Clim., 32, 626–641, https://doi.org/10.1175/1520-0450(1993)032<0626:EICC>2.0.CO;2, 1993. a, b
Bowen, E.: A new method of stimulating convective clouds to produce rain and hail, Q. J. Roy. Meteor. Soc., 78, 37–45, 1952. a, b
Chandrakar, K. K., Morrison, H., Grabowski, W. W., and Lawson, R. P.: Are turbulence effects on droplet collision–coalescence a key to understanding observed rain formation in clouds?, P. Natl. Acad. Sci. USA, 121, e2319664121, https://doi.org/10.1073/pnas.2319664121, 2024. a, b, c
Chen, S., Xue, L., and Yau, M.-K.: Impact of aerosols and turbulence on cloud droplet growth: an in-cloud seeding case study using a parcel–DNS (direct numerical simulation) approach, Atmos. Chem. Phys., 20, 10111–10124, https://doi.org/10.5194/acp-20-10111-2020, 2020. a, b, c
Cooper, W. A., Lasher-Trapp, S. G., and Blyth, A. M.: The influence of entrainment and mixing on the initial formation of rain in a warm cumulus cloud, J. Atmos. Sci., 70, 1727–1743, 2013. a
Cotton, W. R.: Modification of precipitation from warm clouds – a review, B. Am. Meteorol. Soc., 63, 146–160, 1982. a, b
Devenish, B., Bartello, P., Brenguier, J., Collins, L., Grabowski, W. W., IJzermans, R., Malinowski, S. P., Reeks, M., Vassilicos, J., and Wang, L.: Droplet growth in warm turbulent clouds, Q. J. Roy. Meteor. Soc., 138, 1401–1429, https://doi.org/10.1002/qj.1897, 2012. a
Dziekan, P. and Pawlowska, H.: Stochastic coalescence in Lagrangian cloud microphysics, Atmos. Chem. Phys., 17, 13509–13520, https://doi.org/10.5194/acp-17-13509-2017, 2017. a, b, c, d, e, f, g, h, i
Dziekan, P., Jensen, J. B., Grabowski, W. W., and Pawlowska, H.: Impact of giant sea salt aerosol particles on precipitation in marine cumuli and stratocumuli: lagrangian cloud model simulations, J. Atmos. Sci., 78, 4127–4142, https://doi.org/10.1175/JAS-D-21-0041.1, 2021. a, b, c, d, e
Exton, H., Latham, J., Park, P., Smith, M., and Allan, R.: The production and dispersal of maritime aerosol, in: Oceanic Whitecaps, Springer Netherlands, ISBN 9789400946682, 175–193, https://doi.org/10.1007/978-94-009-4668-2_17, 1986. a
Feingold, G., Cotton, W. R., Kreidenweis, S. M., and Davis, J. T.: The impact of giant cloud condensation nuclei on drizzle formation in stratocumulus: Implications for cloud radiative properties, J. Atmos. Sci., 56, 4100–4117, https://doi.org/10.1175/1520-0469(1999)056<4100:TIOGCC>2.0.CO;2, 1999. a, b, c, d, e
Gillespie, D. T.: The stochastic coalescence model for cloud droplet growth, J. Atmos. Sci., 29, 1496–1510, https://doi.org/10.1175/1520-0469(1972)029<1496:TSCMFC>2.0.CO;2, 1972. a
Grabowski, W. W. and Wang, L.-P.: Growth of cloud droplets in a turbulent environment, Annu. Rev. Fluid Mech., 45, 293–324, https://doi.org/10.1146/annurev-fluid-011212-140750, 2013. a, b
Hall, W. D.: A detailed microphysical model within a two-dimensional dynamic framework: model description and preliminary results, J. Atmos. Sci., 37, 2486–2507, https://doi.org/10.1175/1520-0469(1980)037<2486:ADMMWA>2.0.CO;2, 1980. a
Hoffmann, F. and Feingold, G.: Cloud microphysical implications for marine cloud brightening: the importance of the seeded particle size distribution, J. Atmos. Sci., 78, 3247–3262, https://doi.org/10.1175/jas-d-21-0077.1, 2021. a
Hoffmann, F. and Feingold, G.: A note on aerosol processing by droplet collision-coalescence, Geophys. Res. Lett., 50, e2023GL103716, https://doi.org/10.1029/2023gl103716, 2023. a
Hoffmann, F., Noh, Y., and Raasch, S.: The route to raindrop formation in a shallow cumulus cloud simulated by a Lagrangian cloud model, J. Atmos. Sci., 74, 2125–2142, https://doi.org/10.1175/JAS-D-16-0220.1, 2017. a, b, c, d, e
Hoffmann, F., Yamaguchi, T., and Feingold, G.: Inhomogeneous mixing in Lagrangian cloud models: effects on the production of precipitation embryos, J. Atmos. Sci., 76, 113–133, https://doi.org/10.1175/jas-d-18-0087.1, 2019. a
Hudson, J. G. and Noble, S.: CCN spectral shape and cumulus cloud and drizzle microphysics, J. Geophys. Res.-Atmos., 125, e2019JD031141, https://doi.org/10.1029/2019jd031141, 2020. a
Ivanova, E., Kogan, Y., Mazin, I., and Permyakov, M.: The ways of parameterization of condensation drop growth in numerical models, Izv. Atmos. Ocean. Phys.+, 13, 1193–1201, 1977. a
Jensen, J. B. and Nugent, A. D.: Condensational growth of drops formed on giant sea-salt aerosol particles, J. Atmos. Sci., 74, 679–697, https://doi.org/10.1175/jas-d-15-0370.1, 2017. a, b
Johnson, D. B.: The role of giant and ultragiant aerosol particles in warm rain initiation, J. Atmos. Sci., 39, 448–460, https://doi.org/10.1175/1520-0469(1982)039<0448:TROGAU>2.0.CO;2, 1982. a, b, c
Johnson, D. B.: The onset of effective coalescence growth in convective clouds, Q. J. Roy. Meteor. Soc., 119, 925–933, 1993. a, b, c
Jung, E., Albrecht, B. A., Jonsson, H. H., Chen, Y.-C., Seinfeld, J. H., Sorooshian, A., Metcalf, A. R., Song, S., Fang, M., and Russell, L. M.: Precipitation effects of giant cloud condensation nuclei artificially introduced into stratocumulus clouds, Atmos. Chem. Phys., 15, 5645–5658, https://doi.org/10.5194/acp-15-5645-2015, 2015. a, b, c, d, e
Khain, A.: Notes on state-of-the-art investigations of aerosol effects on precipitation: a critical review, Environ. Res. Lett., 4, 015004, https://doi.org/10.1088/1748-9326/4/1/015004, 2009. a, b
Kostinski, A. B. and Shaw, R. A.: Fluctuations and luck in droplet growth by coalescence, B. Am. Meteorol. Soc., 86, 235–244, https://doi.org/10.1175/BAMS-86-2-235, 2005. a, b, c, d, e, f, g
Krueger, S. K., Su, C.-W., and McMurtry, P. A.: Modeling entrainment and finescale mixing in cumulus clouds, J. Atmos. Sci., 54, 2697–2712, https://doi.org/10.1175/1520-0469(1997)054<2697:MEAFMI>2.0.CO;2, 1997. a
Kuba, N. and Murakami, M.: Effect of hygroscopic seeding on warm rain clouds – numerical study using a hybrid cloud microphysical model, Atmos. Chem. Phys., 10, 3335–3351, https://doi.org/10.5194/acp-10-3335-2010, 2010. a, b, c
Lasher-Trapp, S. G., Cooper, W. A., and Blyth, A. M.: Broadening of droplet size distributions from entrainment and mixing in a cumulus cloud, Q. J. Roy. Meteor. Soc., 131, 195–220, 2005. a
Latham, J., Bower, K., Choularton, T., Coe, H., Connolly, P., Cooper, G., Craft, T., Foster, J., Gadian, A., Galbraith, L., Iacovides, H., Johnston, D., Launder, B., Leslie, B., Meyer, J., Neukermans, A., Ormond, B., Parkes, B., Rasch, P., Rush, J., Salter, S., Stevenson, T., Wang, H., Wang, Q., and Wood, R.: Marine cloud brightening, Philos. T. Roy. Soc. A, 370, 4217–4262, 2012. a
Li, X.-Y., Mehlig, B., Svensson, G., Brandenburg, A., and Haugen, N. E.: Collision fluctuations of lucky droplets with superdroplets, J. Atmos. Sci., 79, 1821–1835, 2022.. a, b, c
Lim, J.-S. and Hoffmann, F.: Between broadening and narrowing: how mixing affects the width of the droplet size distribution, J. Geophys. Res.-Atmos., 128, e2022JD037900, https://doi.org/10.1029/2022jd037900, 2023. a
Lim, J.-S. and Hoffmann, F.: Life cycle evolution of mixing in shallow cumulus clouds, J. Geophys. Res.-Atmos., 129, e2023JD040393, https://doi.org/10.1029/2023jd040393, 2024. a
Lim, J.-S. and Hoffmann, F.: jslim93/PyLCM_edu: ACP_paper_v1.0.0 (Paper), Zenodo [code], https://doi.org/10.5281/zenodo.15468311, 2025. a
Low, T. B. and List, R.: Collision, coalescence and breakup of raindrops. Part I: Experimentally established coalescence efficiencies and fragment size distributions in breakup, J. Atmos. Sci., 39, 1591–1606, 1982. a
Noh, Y., Oh, D., Hoffmann, F., and Raasch, S.: A cloud microphysics parameterization for shallow cumulus clouds based on Lagrangian cloud model simulations, J. Atmos. Sci., 75, 4031–4047, https://doi.org/10.1175/JAS-D-18-0080.1, 2018. a
O'Dowd, C. D., Smith, M. H., Consterdine, I. E., and Lowe, J. A.: Marine aerosol, sea-salt, and the marine sulphur cycle: a short review, Atmos. Environ., 31, 73–80, https://doi.org/10.1016/S1352-2310(96)00106-9, 1997. a
Onishi, R., Matsuda, K., and Takahashi, K.: Lagrangian tracking simulation of droplet growth in turbulence–turbulence enhancement of autoconversion rate, J. Atmos. Sci., 72, 2591–2607, https://doi.org/10.1175/JAS-D-14-0292.1, 2015. a, b
Pinsky, M., Khain, A., and Krugliak, H.: Collisions of cloud droplets in a turbulent flow. Part V: Application of detailed tables of turbulent collision rate enhancement to simulation of droplet spectra evolution, J. Atmos. Sci., 65, 357–374, https://doi.org/10.1175/2007jas2358.1, 2008. a, b
Pruppacher, H. R. and Klett, J. D.: Microphysics of Clouds and Precipitation: Reprinted 1980, Springer Dordrecht, ISBN 978-90-277-1106-9, https://doi.org/10.1007/978-94-009-9905-3, 1980. a, b
Saffman, P. and Turner, J.: On the collision of drops in turbulent clouds, J. Fluid Mech., 1, 16–30, 1956. a
Seifert, A., Nuijens, L., and Stevens, B.: Turbulence effects on warm-rain autoconversion in precipitating shallow convection, Q. J. Roy. Meteor. Soc., 136, 1753–1762, https://doi.org/10.1002/qj.684, 2010. a
Shaw, R. A.: Particle-turbulence interactions in atmospheric clouds, Annu. Rev. Fluid Mech., 35, 183–227, 2003. a
Shima, S.-I., Kusano, K., Kawano, A., Sugiyama, T., and Kawahara, S.: The super droplet method for the numerical simulation of clouds and precipitation: a particle based and probabilistic microphysics model coupled with a non hydrostatic model, Q. J. Roy. Meteor. Soc., 135, 1307–1320, https://doi.org/10.1002/qj.441, 2009. a, b, c, d
Siebert, H., Lehmann, K., and Wendisch, M.: Observations of small-scale turbulence and energy dissipation rates in the cloudy boundary layer, J. Atmos. Sci., 63, 1451–1466, https://doi.org/10.1175/JAS3687.1, 2006. a
Squires, P.: The microstructure and colloidal stability of warm clouds: Part I – The relation between structure and stability, Tellus, 10, 256–261, 1958. a
Sölch, I. and Kärcher, B.: A large eddy model for cirrus clouds with explicit aerosol and ice microphysics and Lagrangian ice particle tracking, Q. J. Roy. Meteor. Soc., 136, 2074–2093, https://doi.org/10.1002/qj.689, 2010. a
Telford, J.: A new aspect of coalescence theory, J. Meteorol., 12, 436–444, https://doi.org/10.1175/1520-0469(1955)012<0436:ANAOCT>2.0.CO;2, 1955. a, b, c, d
Teller, A. and Levin, Z.: The effects of aerosols on precipitation and dimensions of subtropical clouds: a sensitivity study using a numerical cloud model, Atmos. Chem. Phys., 6, 67–80, https://doi.org/10.5194/acp-6-67-2006, 2006. a, b
Unterstrasser, S., Hoffmann, F., and Lerch, M.: Collisional growth in a particle-based cloud microphysical model: insights from column model simulations using LCM1D (v1.0), Geosci. Model Dev., 13, 5119–5145, https://doi.org/10.5194/gmd-13-5119-2020, 2020. a, b
Wang, L. and Grabowski, W. W.: The role of air turbulence in warm rain initiation, Atmos. Sci. Lett., 10, 1–8, https://doi.org/10.1002/asl.210, 2009. a, b
Wang, L., Xue, Y., Ayala, O., and Grabowski, W. W.: Effects of stochastic coalescence and air turbulence on the size distribution of cloud droplets, Atmos. Res., 82, 416–432, https://doi.org/10.1016/j.atmosres.2005.12.011, 2006. a
Wilkinson, M.: Large deviation analysis of rapid onset of rain showers, Phys. Rev. Lett., 116, 018501, https://doi.org/10.1103/PhysRevLett.116.018501, 2016. a
Woodcock, A. H.: Salt nuclei in marine air as a function of altitude and wind force, J. Atmos. Sci., 10, 362–371, https://doi.org/10.1175/1520-0469(1953)010<0366:SNIMAA>2.0.CO;2, 1953. a, b
Yin, Y., Levin, Z., Reisin, T. G., and Tzivion, S.: The effects of giant cloud condensation nuclei on the development of precipitation in convective clouds – a numerical study, Atmos. Res., 53, 91–116, https://doi.org/10.1016/S0169-8095(99)00046-0, 2000. a
- Abstract
- Introduction
- Model and simulation setup
- PE effect on precipitation timescales
- PE effects on rain initiation
- Summary and conclusion
- Appendix A: Ensemble size sensitivity of t100 and t10 %
- Appendix B: Parameters for the fitting function
- Code and data availability
- Author contributions
- Competing interests
- Disclaimer
- Acknowledgements
- Financial support
- Review statement
- References