the Creative Commons Attribution 4.0 License.
the Creative Commons Attribution 4.0 License.
 | 26 May 2025
Regional and sectoral contributions of NOx and reactive carbon emission sources to global trends in tropospheric ozone during the 2000–2018 period
Aura Lupaşcu
Tabish Ansari
Tim Butler
Over the past few decades, the tropospheric ozone precursor anthropogenic emissions – nitrogen oxides (NOx) and reactive carbon (RC) from northern mid-/high-latitude regions (e.g., North America, Europe) – have been decreasing, and those from (sub-)tropical regions (e.g., South Asia , the Middle East ) have been increasing, leading to an equatorward emission redistribution. In this study, we quantify the contributions of various sources of NOx and RC emissions to tropospheric ozone using a source attribution technique during the 2000–2018 period in a global chemistry transport model. We tag the ozone molecules with the source of their NOx or RC precursor emission in two separate simulations: NOx-tagged and RC-tagged. These tags include various natural (biogenic, biomass burning, lightning NOx and RC from methane oxidation) and regional anthropogenic precursor emission sources and influx from the stratosphere. We simulate ∼336 Tg O3 of tropospheric ozone burden (TOB) with an increasing trend of 0.91 Tg O3 yr−1 (0.28 % yr−1), largely contributed (and trend driven) by anthropogenic NOx emissions and methane oxidation. The ozone production efficiency of regional anthropogenic NOx emissions increases when emissions decrease (e.g., Europe, North America) and decreases when emissions increase (e.g., South Asia, Middle East, international shipping). Tropical regions, despite lower emissions, contribute more to TOB compared to emissions from higher latitudes, consistent with previous work, predominantly due to large convection (combined with intense sunlight and larger reaction rates) at the tropics, thereby lifting O3 and its precursor molecules into the free troposphere where ozone's lifetime is longer. We simulate a smaller relative contribution from tropical regions to the global mean surface ozone compared to their contribution to the TOB. The global population-weighted mean ozone is much larger compared to global mean surface ozone, mainly due to large anthropogenic emissions from densely populated regions – East Asia, South Asia and other tropical regions – and a substantial contribution from international ship NOx emissions. The increasing trends in anthropogenic precursor emissions from these regions are the main drivers of increasing global population-weighted mean ozone.
- Article
(6260 KB) - Full-text XML
-
Supplement
(2122 KB) - BibTeX
- EndNote


Tropospheric ozone is a major greenhouse gas (Myhre et al., 2013), after carbon dioxide and methane. It also has an indirect influence on the lifetime of methane through its impact on the hydroxyl radical, OH (Monks et al., 2015). At the surface, ozone is a major air pollutant, causing a large number of premature deaths (∼423 100 ozone-attributable deaths [95 % confidence interval: 223 200, 659 400] in 2019; Malashock et al., 2022) and heavy yield losses in the production of staple food crops worldwide (losses of up to 79–121 Tg annually; Avnery et al., 2011; Mills et al., 2018). Tropospheric ozone, initially thought to be mostly of stratospheric origin (Junge, 1962), is also a secondary pollutant produced from the reaction between ozone precursor gases: nitrogen oxides (NOx: NO and NO2) and reactive carbon (RC: CH4, CO and volatile organic compounds (VOCs); Levy, 1972; Chameides and Walker, 1973; Crutzen, 1974). A multi-model assessment study showed that the tropospheric ozone burden has increased by ∼44 % since the pre-industrial period, mainly driven by increasing anthropogenic emissions of ozone precursor gases (Griffiths et al., 2021). Gaudel et al. (2020) utilize the data from the In-service Aircraft for a Global Observing System (IAGOS) database and identify a remarkable increase in tropospheric ozone since 1994 over several regions in the Northern Hemisphere. Addressing the effects of tropospheric ozone both as a pollutant and a greenhouse gas requires mitigation of the anthropogenic emissions of ozone precursors.
Since the 1980s, anthropogenic emissions of tropospheric ozone precursors from North America and western Europe have decreased in response to the implementation of control measures, while emissions from Asia, Central America and eastern Europe have increased due to economic and population growth (Granier et al., 2011; Cooper et al., 2014), leading to an equatorward shift in global emission pattern. A recent study (Li et al., 2024) confirms an equatorward shift in Asian NOx emissions between 2010 and 2017 according to bottom-up estimates. Zhang et al. (2016) found that this equatorward shift in precursor emissions is the dominant factor, compared to the change in magnitude of emissions and methane concentration, which has led to an increase in the tropospheric ozone burden between 1980 and 2010. This is mainly due to larger convection of polluted air masses from the boundary layer into the free troposphere, in addition to larger reaction rates and NOx sensitivity over the tropical regions (Wild et al., 2001) compared to extratropical regions. Further, Wang et al. (2022) show that increasing aircraft emissions play a major role in the increasing trend in tropospheric ozone burden over the 1995–2017 period. Similarly, the increase in methane concentration during the industrial period also had a substantial impact on tropospheric ozone burden (Stevenson et al., 2020).
Source apportionment methods are used in chemical transport modeling studies to quantify the influence of specific emission sources on ozone concentration at any given location. Typically, global modeling studies have used two different methods for source apportionment: perturbation and tagging, which will be described in more detail below.
Several previous studies have used the perturbation method of source attribution to study the impact of emission changes from a particular region/sector on tropospheric ozone (e.g. West et al., 2007; Fiore et al., 2009; Jonson et al., 2018). Zhang et al. (2021) use this method to study the influence of changing emissions from various world regions between 1980 and 2010 on tropospheric ozone burden. In their study, multiple model simulations were performed: one base simulation with all emissions at 2010 levels and other perturbed simulations with 1980 emissions from the region/sector of interest. The study found that the change in tropospheric ozone burden responded the most to perturbation in prescribed methane concentration. Of the geographical source regions, tropospheric ozone burden responded the most to perturbations in emissions of anthropogenic ozone precursor emissions at tropical regions: South Asian and Southeast Asian regions.
The second method of source apportionment is called tagging, which involves labeling the modeled ozone molecules with the name of its precursor emission sources. As opposed to the previously discussed perturbation method that delivers the sensitivity of simulated ozone to emission changes, this tagging method delivers the exact contribution to the simulated ozone concentration from each of the tagged emission sources (see Table 1 in Mertens et al., 2020, for a detailed comparison between the two methods). Several previous studies have implemented the tagging method in box (e.g., Butler et al., 2011; Coates and Butler, 2015), regional (Kwok et al., 2015; Lupascu and Butler, 2019; Zhao et al., 2022) and global models (Grewe et al., 2010, 2017; Emmons et al., 2012; Butler et al., 2018) to study the contribution of various emission sources on ozone concentrations (see Butler et al., 2018, for a review of various tagging approaches). The formation of one tropospheric ozone molecule requires two precursors (NOx and RC); a major challenge in its emission source attribution is knowing the label of which of the precursors the ozone molecule should inherit.
Among the previous global modeling approaches that implement tagging, Grewe et al. (2010, 2017) calculate the production rate of the tagged ozone molecules, by giving equal weight to the proportion of tagged NOx and RC molecules emitted from a given sector (“combinatorial” tagging). While this approach can deliver information on the role of each emission source in its contribution to the tropospheric ozone concentration, it does not communicate the contrasting roles of NOx and RC from those sources. For example, Mertens et al. (2018), using the combinatorial approach, attribute ∼8 % of tropospheric ozone burden to ozone precursor emissions from land transportation but cannot determine which emitted precursor from land transportation: NOx or RC contributes predominantly. Butler et al. (2018) formulated the tropospheric ozone source attribution system with tagging (TOAST) within the CAM4-chem (Community Atmosphere Model version 4 with chemistry) model that requires running two separate simulations – NOx-tagged and RC-tagged – to separately attribute ozone to NOx and RC sources, respectively, by labeling them with the name of their originating source region/sector. With this approach, the previously mentioned problems related to the contrasting roles of NOx and RC are avoided as the contribution from each precursor source is separately attributed. To illustrate, O3 attributed to biogenic emissions in the NOx-tagged simulation would clearly mean that the contribution is from emitted biogenic NOx only, irrespective of where the RC comes from to produce the O3 molecule. Contribution from biogenic RC emissions can be simulated in the RC-tagged simulation. In this way, the roles of NOx and RC emissions from a given sector are exclusively simulated in separate simulations.
Butler et al. (2020) use the TOAST tagging technique to quantify the contribution of ozone precursor emissions for the year 2010 from several regions/sectors. They demonstrated that the ozone production efficiency can directly be calculated using this method, as the ratio of tropospheric ozone attributed to a tagged emission source to the amount of precursor emission from that source. NOx emissions from tropical regions such as South Asia, Southeast Asia and Central America were found to be the most efficient at producing tropospheric ozone compared to the emissions from other regions, consistent with the earlier work of Zhang et al. (2016). They further showed, using a methane perturbation introduced to NOx-tagged simulation, that the contribution to tropospheric ozone burden by NOx emitted from international shipping increases especially strongly in response to changes in methane concentration.
While Butler et al. (2020) discuss the ozone precursor contributions to tropospheric ozone burden for one year – 2010 – we use the TOAST tagging approach (further explained in Sect. 2) in this study over the 2000–2018 period to answer the following questions: (i) In Sects. 3.1 and 3.2, what is the contribution of precursor emissions from various regions/sectors to the global tropospheric O3 burden? How do changes in these emissions during 2000–2018 affect their contribution to the trend in tropospheric ozone burden? (ii) In Sect. 3.3, how does the ozone production efficiency (OPE) of ozone precursor emissions respond to the changes in these emissions during the 2000–2018 period? And (iii) in Sect. 3.4, how do contributions of different ozone precursors to the tropospheric O3 burden contrast with their contribution to global mean surface O3 and population-weighted O3? We conclude our article with a summary, limitations and future scope in Sect. 4.
2.1 Simulation setup
We use the ozone source attribution methods described in Butler et al. (2018) and Butler et al. (2020). We perform simulations with CAM4-chem, which is a component of the CESM (Community Earth System Model) version 1.2.2 (Lamarque et al., 2012). The model is run at a horizontal resolution of 1.9°×2.5°, with 56 vertical levels for the 2000–2018 period with specified dynamics from MERRA2 reanalysis (Molod et al., 2015). The temperature, horizontal winds, and sensible and latent heat fluxes from MERRA2 reanalysis dataset are nudged every time step (30 min) by 10 % towards analysis fields (i.e., a 5 h Newtonian relaxation timescale for nudging).
Anthropogenic emissions of NOx and non-methane reactive carbon (NMRC: CO and volatile organic compounds (VOCs) collectively), including land-based emissions, international shipping emissions and aircraft emissions, are taken from Hemispheric Transport of Air Pollution version 3 (HTAPv3; Crippa et al., 2023) emissions inventory. We specify aircraft emissions at various altitudes effectively representing three different flight phases (landing/take-off, ascent/descent and cruising). Biomass burning emissions are taken from GFED-v4 inventory (van der Werf et al., 2010). The biogenic NMRC emissions are taken from CAMS-GLOB-BIO-v3.0 (Sindelarova et al., 2021), and biogenic NOx (from soil) is prescribed as in Tilmes et al. (2015). While we interpolate the emissions from HTAPv3's high-resolution dataset to our coarser model resolution, we also correct the interpolated land-based emissions over ocean grid cells by moving them to the nearest land grid cell (vice versa for ocean-based emissions) to make sure that the emissions are allocated to the correct region for the source attribution.
We impose methane concentration as a surface boundary condition. The methane concentration is taken from the 2000–2018 average mole fraction fields from the CAMS CH4 flux inversion product v18r1 (https://ads.atmosphere.copernicus.eu/datasets/cams-global-greenhouse-gas-inversion?tab=overview, last access: 7 May 2025) and is specified as a zonally and monthly varying transient boundary condition. As in Butler et al. (2018) and Butler et al. (2020), we use the MOZART-4 chemical mechanism (Emmons et al., 2012) further modified to include tagged ozone tracers. This tagging system allows attribution of tropospheric ozone to reactive nitrogen (NOx) and reactive carbon (CH4 and NMRC) precursors in two separate simulations. Additionally, stratospheric influx and other minor production pathways of tropospheric ozone are also tagged in our model. For a complete attribution, we perform two separate simulations: (i) NOx-tagged and (ii) RC-tagged (reactive carbon tagged) with their respective tagged emission sources.
We specify separate tag identities for biogenic, biomass burning, aircraft and surface-based anthropogenic emission sources of ozone precursors and for ozone from production in the stratosphere. We tag anthropogenic emissions according to the HTAP Tier 1 regions (Galmarini et al., 2017) from which the respective NOx or NMRCs are emitted. We focus our study on the northern hemispheric anthropogenic emissions by individually tagging the major northern hemispheric regions (East Asia, South Asia, North America, Europe, the Middle East and the Russia–Belarus–Ukraine region) and combining the other regions under the “rest of the world” tag. Within our “rest of the world” tag, some regions (e.g. Central Asia, Southeast Asia) have been explicitly tagged in our NOx-tagged simulation but not in our RC-tagged simulation. We also specify additional tags for emissions from international shipping and aircraft emissions (see Table 1 and Fig. S1 in the Supplement for a summary of tags used in this study).
Table 1List of tags used in this study. See Fig. S1 for a map of tagged regions considered in this study.
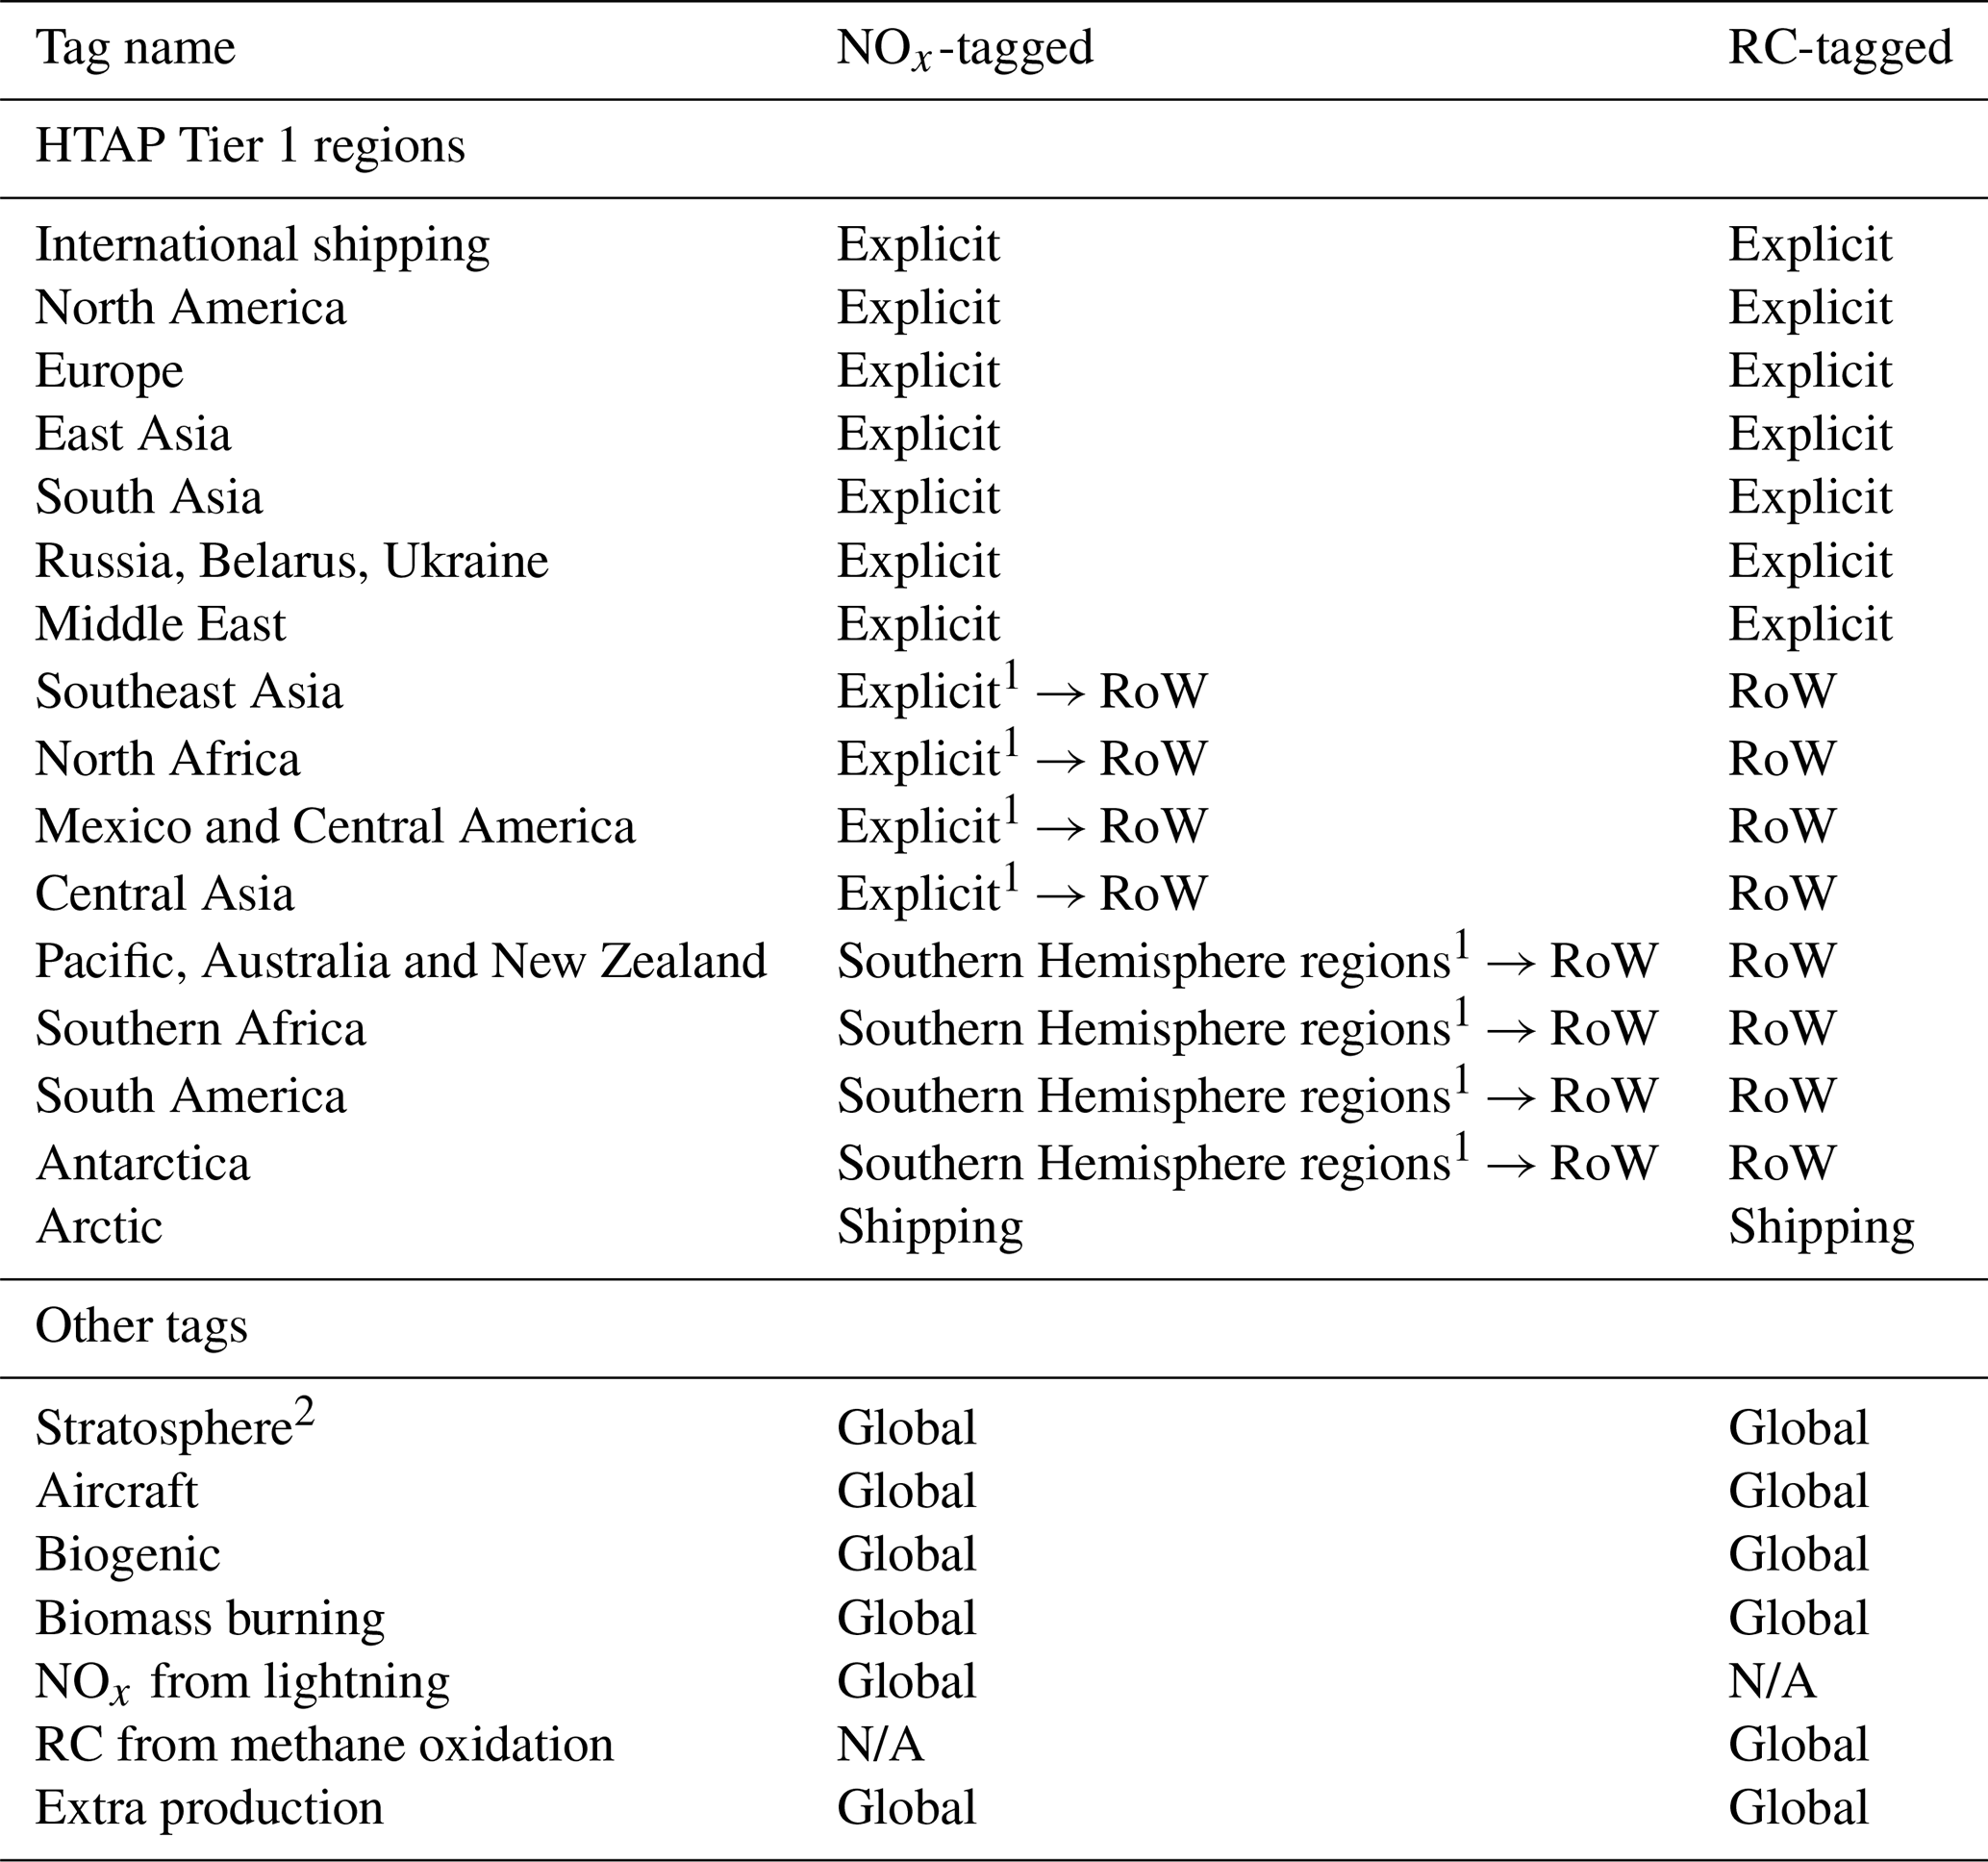
1 Although explicitly tagged in the NOx-tagged simulation, these regions have been lumped into the “rest of the world” tag (RoW) used in this paper.
2 NOx-tagged simulation attributes ozone to influx from the stratosphere (same as RC-tagged) and also to NO produced from oxidation of N2O.
We specify an additional tag for NOx emission from lightning in our NOx-tagged simulation and for RC from methane oxidation in our RC-tagged simulation. In both NOx and RC tagged simulations, the sum of tagged ozone tracers is equal to the total ozone simulated by the model.
2.2 Model evaluation
CAM4-chem has been evaluated in previous studies for simulating tropospheric ozone and precursors (Lamarque et al., 2012; Tilmes et al., 2015) and was also evaluated in its ozone-tagged configuration by Butler et al. (2018) and Butler et al. (2020). Here we evaluate the configuration of CAM4-chem used in this study, which primarily differs from the earlier work though its use of the HTAPv3 global emissions. In Fig. 1 we compare our simulated surface ozone against the gridded observation dataset provided by Tropospheric Ozone Assessment Report (TOAR; Schultz et al., 2017) until year 2014. We also make the comparison using simulation output from the “CESM2-WACCM6” model, which is part of the CMIP6 ensemble (Emmons et al., 2020), using this as a standard reference model. Results are shown as monthly averages over various HTAP Tier 2 regions (Galmarini et al., 2017) at the grid cells where the TOAR data are available. We overestimate the surface ozone mixing ratio by up to ∼ 4–12 ppbv over most regions where TOAR data are available, largely during the summer months. This overestimation is also simulated by the CESM2-WACCM6 model (shown in Fig. 1) and is consistent with high model bias of ∼7 ppbv simulated by most models in various ensembles, as discussed in Young et al. (2018). We also simulate an underestimation of up to 2–6 ppbv over the northern and eastern United States during winter months, which is not simulated by CESM2-WACCM6. For the year 2010, we simulate slightly smaller surface ozone at most regions over grid cells where TOAR data are available compared to that simulated by Butler et al. (2020), and it is closer to the observations from TOAR dataset.
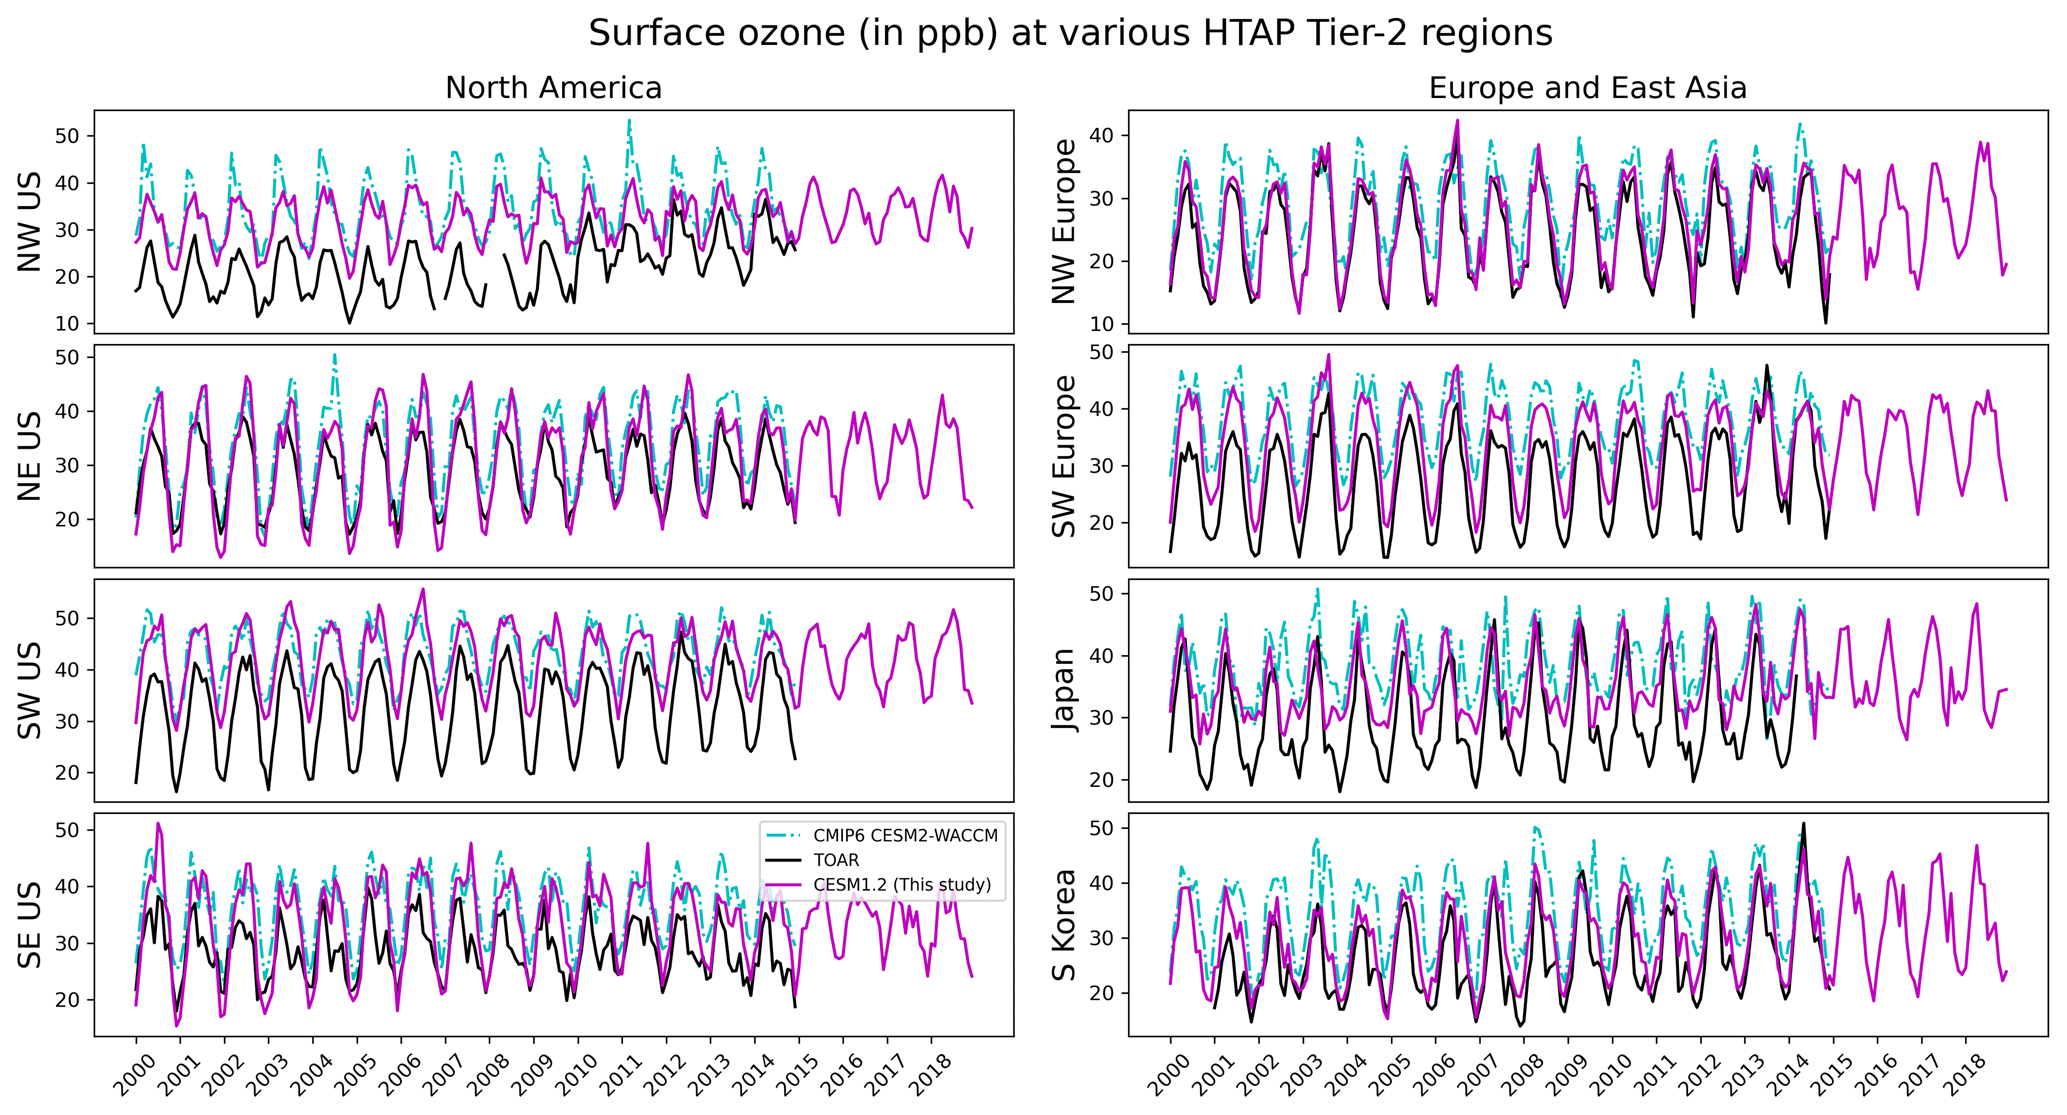
Figure 1Comparing the time series of monthly mean surface ozone (in ppb) simulated over the 2000–2018 period in this study with the gridded observation dataset from TOAR available until 2014 (https://toar-data.fz-juelich.de/, last access: 7 May 2025), in various regions defined by HTAP2 (Galmarini et al., 2017). The comparison is performed for simulated surface ozone values only over those grid cells where the TOAR data are available. Also shown is the comparison with the CESM2-WACCM6 model, which is a CMIP6 ensemble member (also until 2014).
We evaluate free tropospheric ozone against the ozone-sonde-based climatology compiled by Tilmes et al. (2012). Figure 2 shows the comparison of our simulated climatology (2000–2010) to the ozone sonde climatology (1995–2010) in Taylor-like diagrams (Taylor, 2001; Tilmes et al., 2012) at 900, 500 and 250 hPa pressure levels, grouped by latitude ranges. The correlation coefficient between the observed and simulated monthly regional O3 average is usually more than 0.8, and the fractional mean difference is usually within 25 % at most regions in the troposphere. The model captures the vertical distribution of ozone derived from ozone sonde climatology very well, albeit slightly biased high particularly in the upper troposphere at most sites (Fig. S2 in the Supplement). Our free troposphere evaluation results are therefore largely consistent with previously evaluated versions of CAM4-chem (Tilmes et al., 2012; Zhang et al., 2016; Emmons et al., 2020).
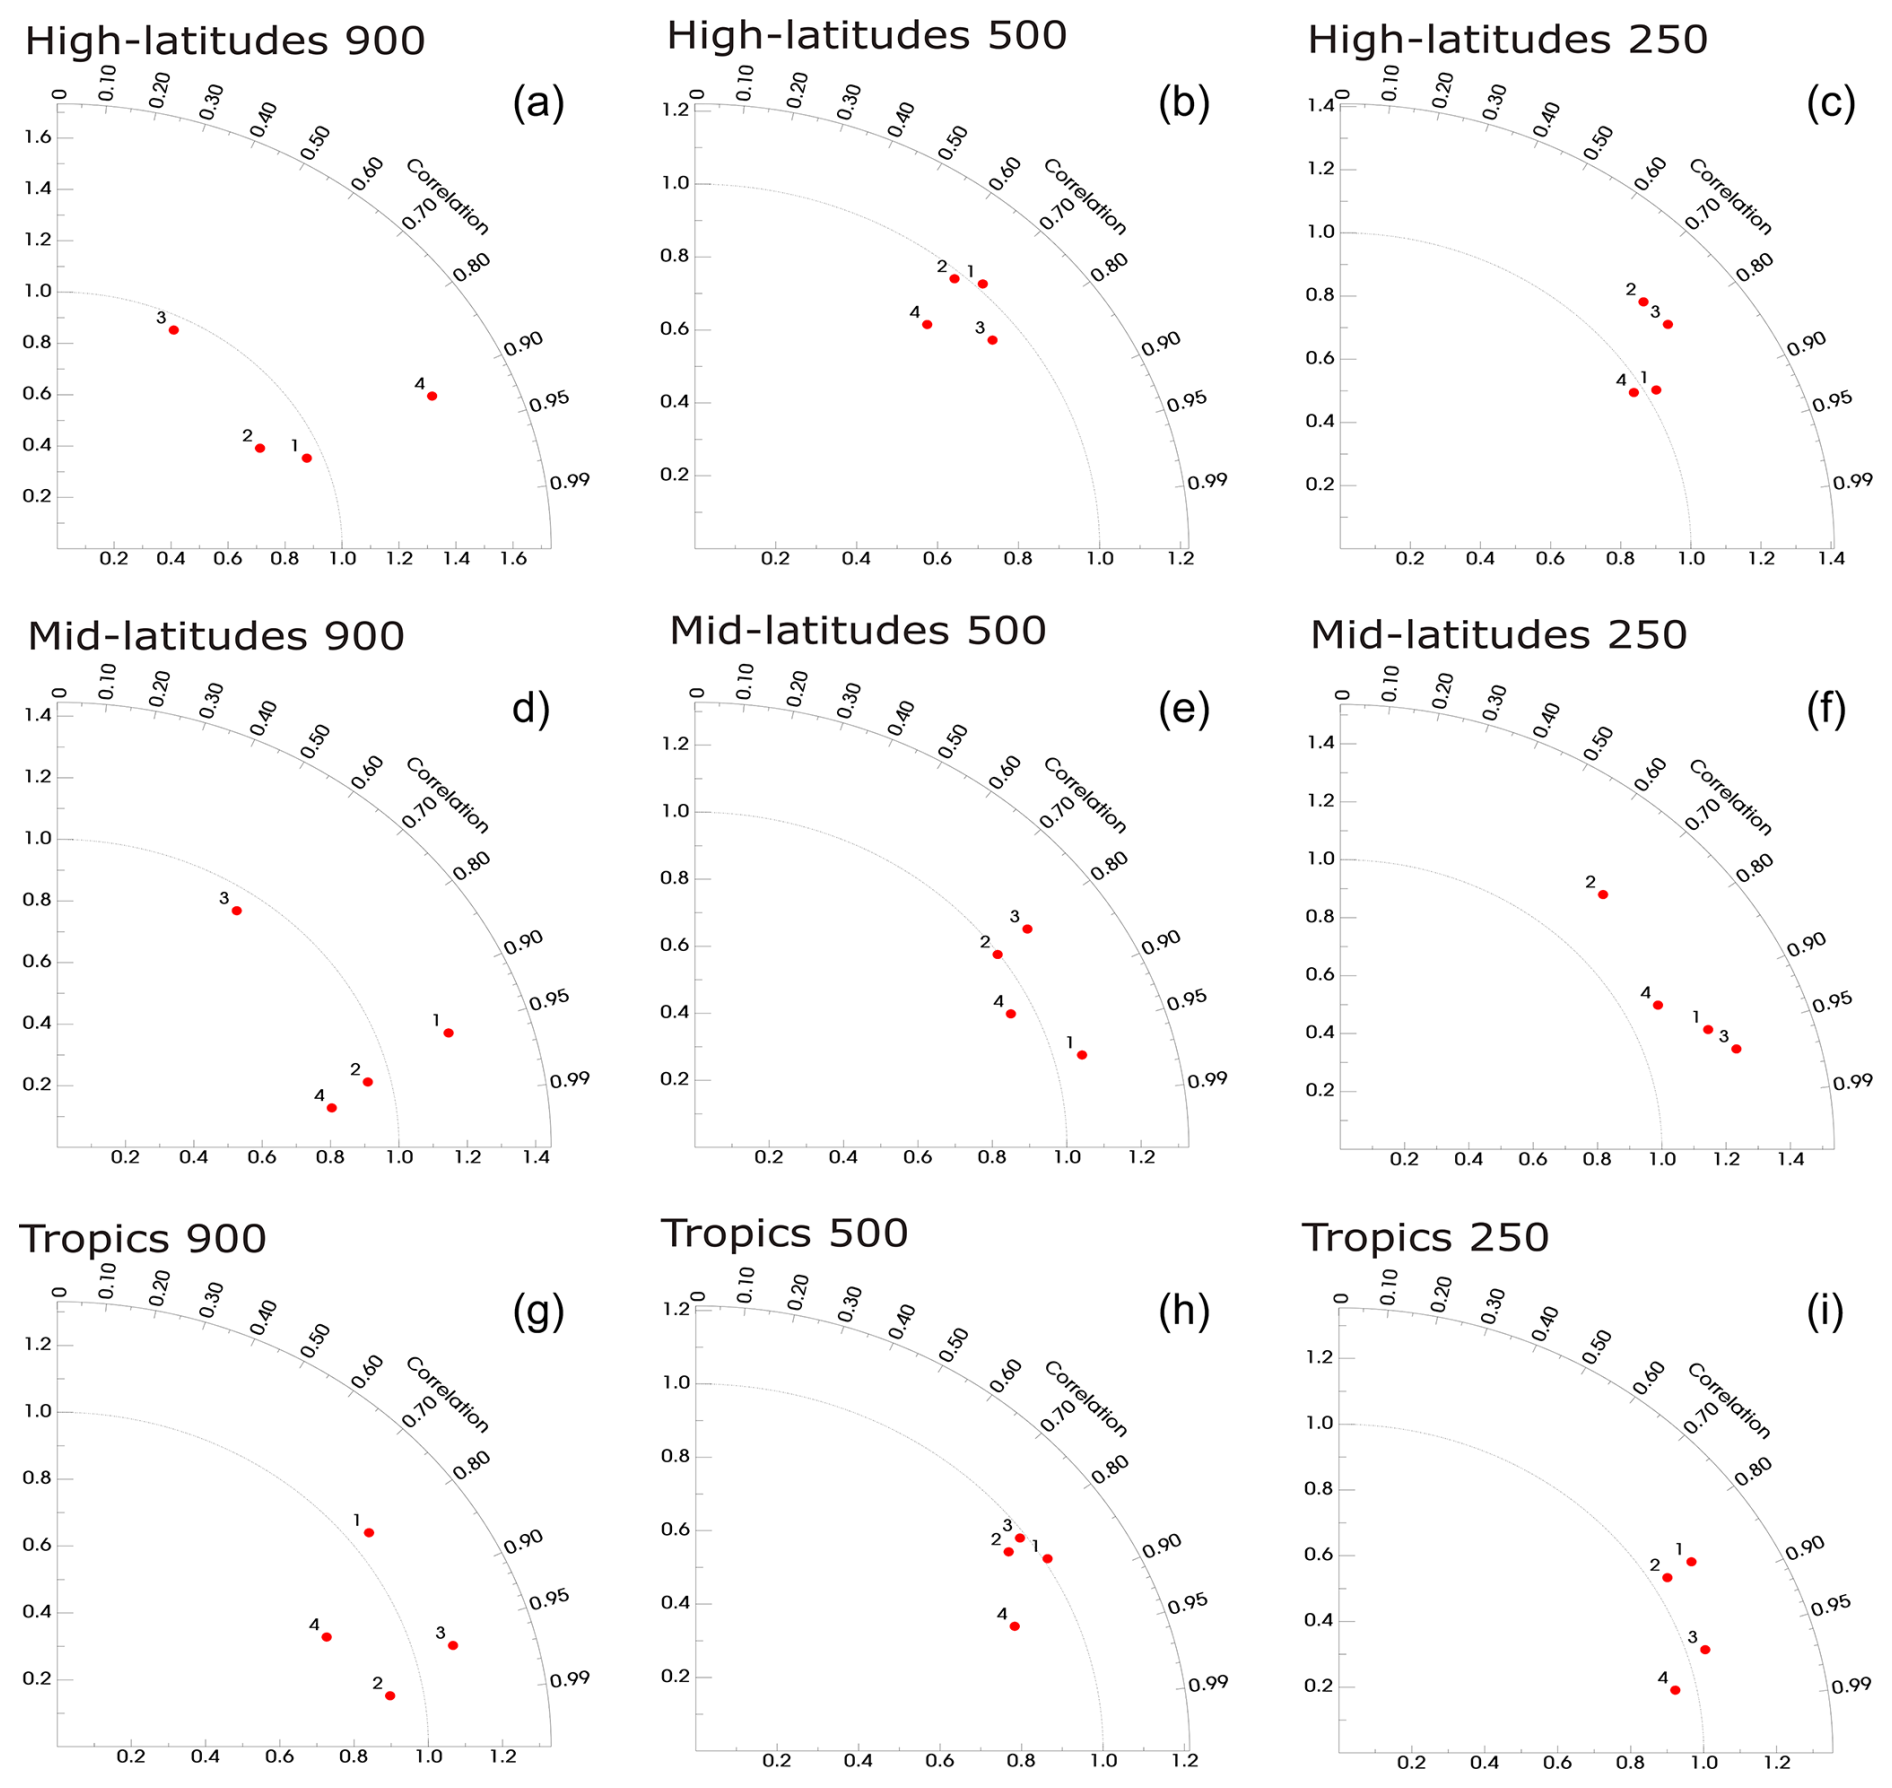
Figure 2Taylor diagram of comparisons between modeled monthly mean ozone climatology (2000–2018) and ozone sonde climatology (1995–2010) data from Tilmes et al. (2012) in the high tropics (g–i), midlatitudes (d–f) and high latitudes (a–c) for three different altitude levels (900, 500 and 250 hPa) in the troposphere. The x axis shows the relative ozone-normalized bias of the simulations compared to the observations, whereas the radiant in the y axis describes the correlation coefficient of seasonally averaged ozone values between simulated and observed values. Numbers indicate different regions as the difference in previous studies (Zhang et al., 2016; Emmons et al., 2020) (g–i) 1 – NH subtropics, 2 – western Pacific–eastern India Ocean, 3 – equatorial America, 4 – Atlantic/Africa; (d–f) 1 – western Europe, 2 – eastern USA, 3 – Japan, 4 – SH midlatitudes; (a–c) 1 – NH polar west, 2 – NH polar east, 3 – Canada, 4 – SH polar.
2.3 Trend analysis
We express the trend for the 2000–2018 period in various quantities discussed in our study: precursor emissions, tropospheric ozone burden, global surface mean and population-weighted mean ozone concentration as a slope of the time series (in respective units yr−1 and in % yr−1 relative to the first absolute value (for year 2000)). This slope is calculated using the Theil–Sen estimator method available as a Python module (https://docs.scipy.org/doc/scipy/reference/generated/scipy.stats.theilslopes.html, last access: 7 May 2025), which also calculates the 95 % confidence interval of the slope. We further use the Mann–Kendall test to determine the extent to which the detected trend is monotonic (Hussain and Mahmud, 2019), expressed by p. In the TOAR guidelines for best statistical practices (Chang et al., 2023), it is recommended not to use a dichotomized expression such as significant/insignificant trend. Hence, we also provide p and the 95 % confidence interval in the Supplement for interested readers to assess the meaningfulness of the estimated trend in our study. For the sake of discussion in Sects. 3 and 4, we categorize the trends with p values less than 0.05 to be of high certainty, between 0.05 and 0.1 to be of medium certainty, and larger than 0.1 to be of low certainty (Table 3 in Chang et al., 2023).
We discuss our results related to the ozone precursor emissions, contribution to tropospheric ozone burden, ozone production efficiency, and contribution to surface mean and population-weighted mean ozone from each of the tags used in our study. Each subsection is further divided into two parts to discuss the role of NOx- and RC-tagged contributions separately. All our results are discussed as time series of annual means for the 2000–2018 period, unless otherwise specified. When referring to anthropogenic emissions and their contributions to tropospheric ozone in our discussion, we only refer to surface-based anthropogenic emissions and exclude aircraft emissions.
3.1 Ozone precursor emission trends
3.1.1 NOx emissions
Table 2 shows the global NOx emissions (averaged over the 2000–2018 period) from various regions and sectors and their relative contribution (in %) to the total NOx emissions. Figure 3a and c show the time series of NOx emissions from all sources: natural/global sources (a) and regional anthropogenic sources (c).
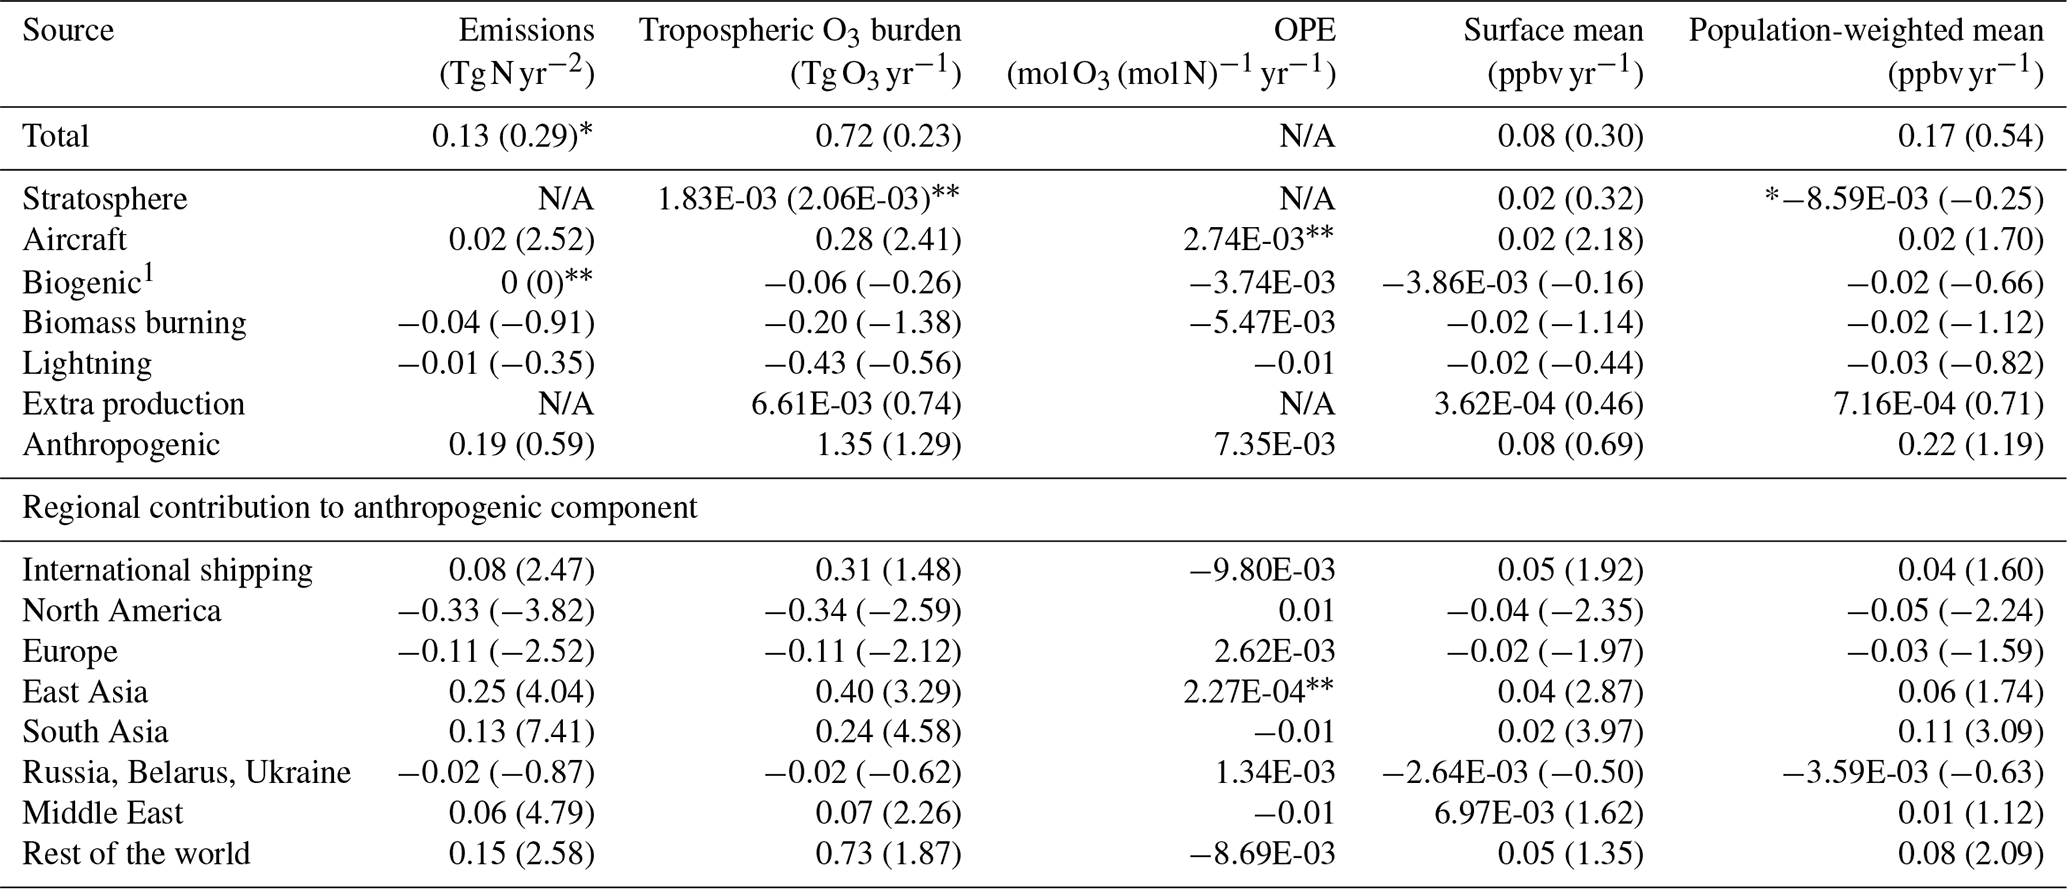
Table 2Attribution of O3 to NOx-tagged precursor emissions. The 2000–2018 mean contribution from NOx-tagged components to various metrics: precursor emissions, tropospheric ozone burden, ozone production efficiency, grid-cell-area-weighted and population-weighted global mean surface ozone. In brackets is the percentage contribution to the total, wherever applicable.
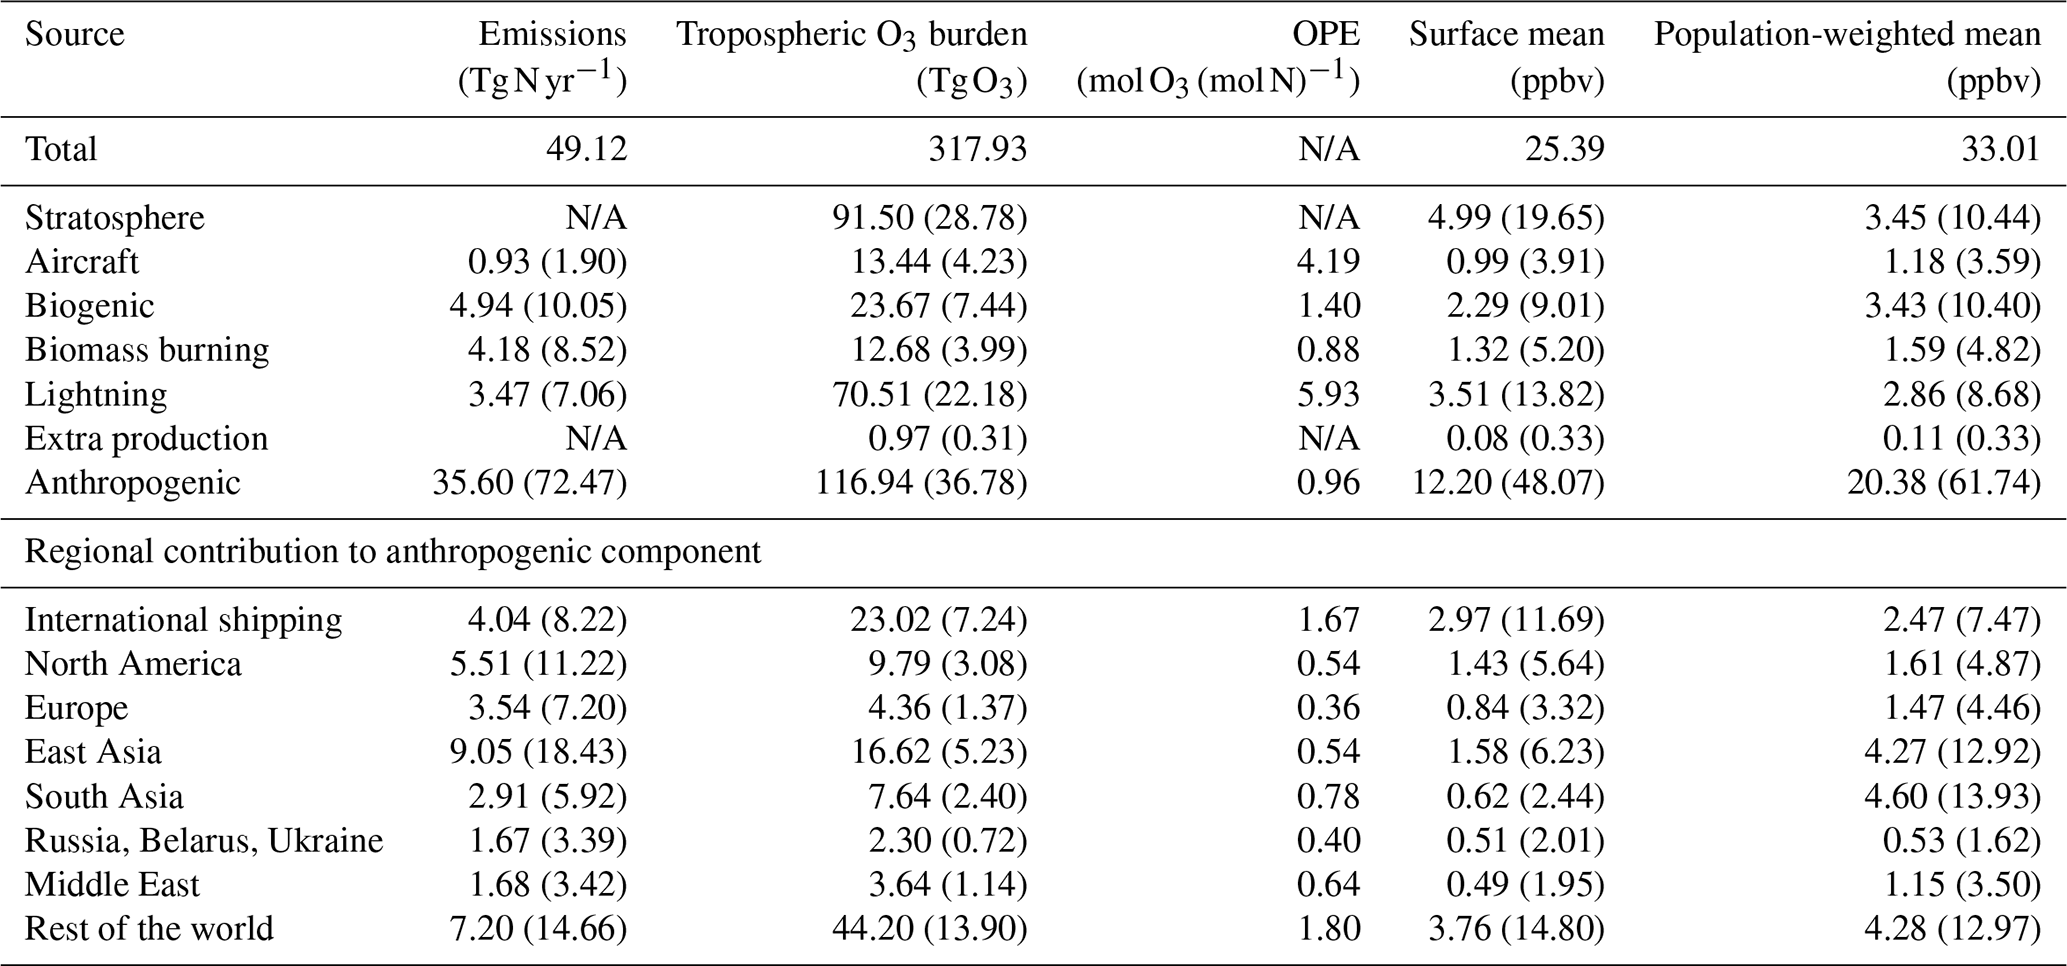
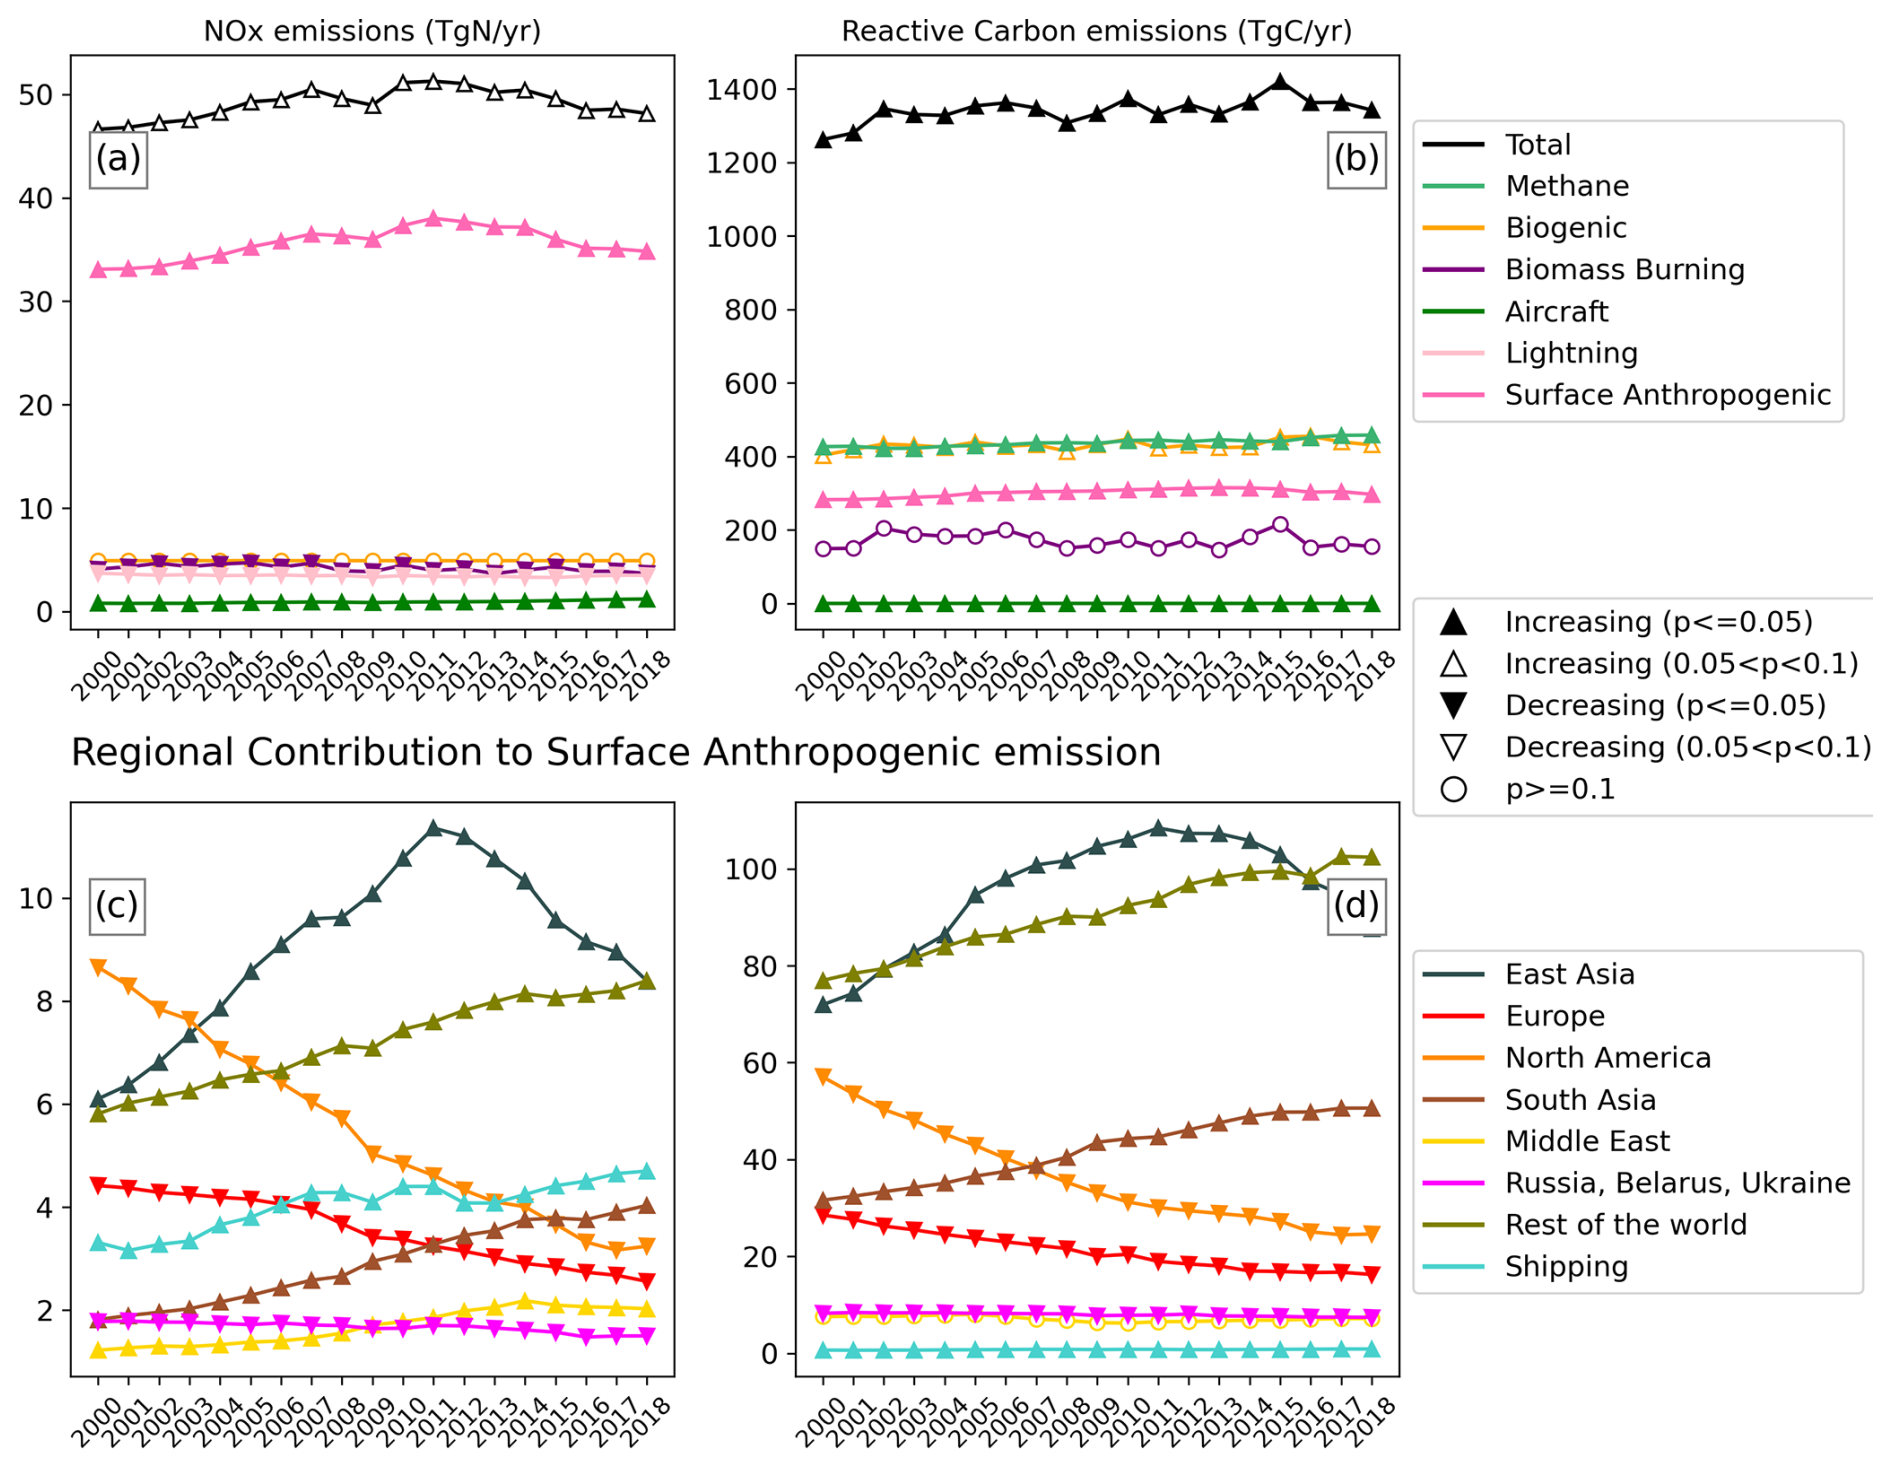
Figure 3Global annual emissions of ozone precursors from various sources used in this study. (a, c) NOx emissions (in Tg N yr−1), (b, d) reactive carbon emissions (Tg C yr−1). Panels (c) and (d) are the regional contributions to the total anthropogenic emission (dark-pink line) shown in (b) and (b). The symbols indicate the sign and certainty of trend in the plotted quantity. The time series of relative contributions (in %) from each of the emission sectors to the total emissions is provided in Fig. S3 in the Supplement.
Over the period 2000–2018, the average annual NOx emissions are ∼49 Tg N yr−1, which includes both surface and aloft emissions. There is an increasing trend with medium certainty in the total NOx emissions over the 2000–2018 period, with ∼ 46.6 Tg N yr−1 emitted in 2000, peaking at ∼ 51.3 Tg N yr−1 in 2011 and decreasing to ∼48.2 Tg N yr−1 emitted in 2018 (Fig. 3a; Table 3).
Table 3Theil–Sen estimator/slope of trends in contributions of NOx-tagged metrics, wherever applicable. Trend slope and p estimation are summarized in Sect. 2.3. The 95 % confidence interval and p for each of these estimated trends are provided in Table S1. In brackets is the trend (in % yr−1). Note that this trend in % yr−1 is the trend slope relative to the first value of the absolute contribution (for year 2000), not to be confused with the relative contribution to the total as shown in Figs. S3, S6, S7 and S8 in the Supplement.
* : medium certainty.
p≥0.1: low certainty.
1 Since we prescribe an annually repeating seasonal cycle of biogenic / soil NOx emissions, the annual mean value is held constant, leading to zero slope and p=1.
The trend in total NOx emissions is mainly driven by the anthropogenic NOx emissions, which are the largest source of NOx (∼35.6 Tg N yr−1 (72.5 %); Table 2), much larger than natural sources such as lightning, biomass burning and biogenic emissions, which contribute ∼7.1 %, 8.5 % and 10 %, respectively (Table 2). We also notice a slight decrease in the global anthropogenic NOx emissions in 2008–2009, mostly related to the global financial crisis (Schneider and van der A, 2012).
Among the anthropogenic NOx emissions, East Asian emissions are the largest (∼18.5 %; Table 2), with an increasing trend with high certainty (∼0.25 Tg N yr−2; Table 3 and Fig. 3) over the 2000–2018 period. These emissions increase at 0.49 Tg N yr−2, peak in 2011 and start declining after that at −0.44 Tg N yr−2 (Zheng et al., 2018), as shown in Fig. 3c and Table S2 in the Supplement, which largely explain the time series of anthropogenic and total NOx emissions time series shown in Fig. 3a. The NOx emissions increase over South Asia (0.13 Tg N yr−2), the Middle East (0.06 Tg N yr−2) and the “rest of the world” (0.15 Tg N yr−2), whereas they decrease over North America (−0.33 Tg N yr−2), the Russia–Belarus–Ukraine region (−0.02 Tg N yr−2) and Europe (−0.11 Tg N yr−2). The magnitude of international ship NOx emissions (4.04 Tg N yr−1) is comparable to that of NOx emissions from continental regions such as North America, Europe and South Asia (Table 2) and have an increasing trend (∼0.08 Tg N yr−2; Table 3) with high certainty. These trends effectively also indicate an overall equatorward shift in anthropogenic emissions as discussed in several previous studies (e.g., Zhang et al., 2016, 2021; Gaudel et al., 2020). We further illustrate this equatorward shift using zonal sum profiles of deviation in anthropogenic NOx emissions from year 2000 (Fig. S4a in the Supplement). The zonal NOx emissions relative to year 2000 show a positive (negative) deviation south (north) of ∼35° N latitude, indicating an equatorward shift in the overall global NOx emissions.
Emissions from the aircraft sector contribute only 0.93 Tg N (∼1.90 %) to the total NOx emissions, with an increasing trend of ∼2.5 % yr−1. This is comparable to the emissions taken from the CEDS inventory reported by Wang et al. (2022): 0.88 Tg N (contributing ∼3.3 % to total NOx emissions) increasing at ∼3.46 % yr−1 between 1995 and 2017.
3.1.2 Reactive carbon emissions
The total amount of tropospheric reactive carbon emissions averaged over the 2000–2018 period in our simulations is ∼1342 Tg C yr−1 (Table 4) with a small increasing trend (0.25 % yr−2; Table 5) (Fig. 3b). Methane and biogenic NMRCs are the largest sources of reactive carbon (each about ∼430 Tg C yr−1 (32 %); Table 4; Fig. 3b; Heald and Kroll, 2020). Total anthropogenic NMRC emissions contribute ∼302 Tg C yr−1 (∼22.5 %; Table 4), and biomass burning emissions contribute ∼171 Tg C yr−1 (∼12.8 %). Aircraft emissions contribute very small amounts (Table 4).
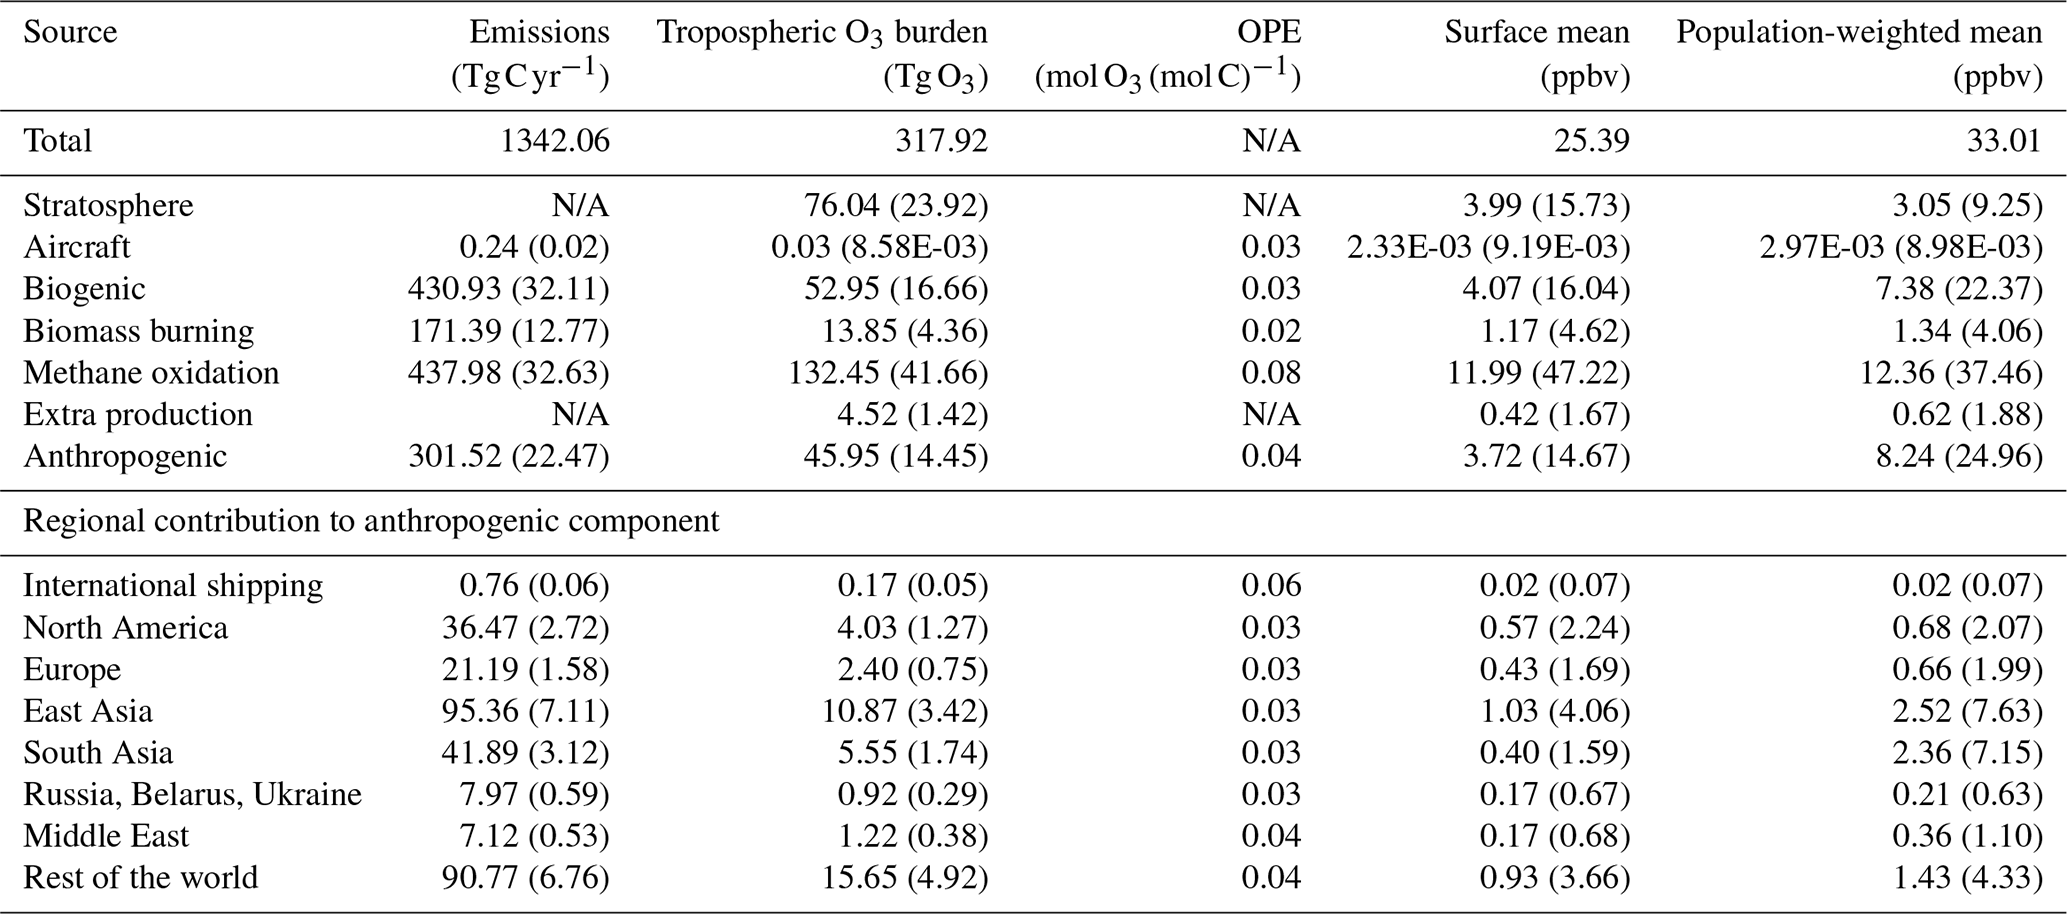
Table 5Same as Table 3 but for RC-tagged metrics. The 95 % confidence interval and p for each of these estimated trends are provided in Table S3 in the Supplement.
* : medium certainty.
** p≥0.1: low certainty.
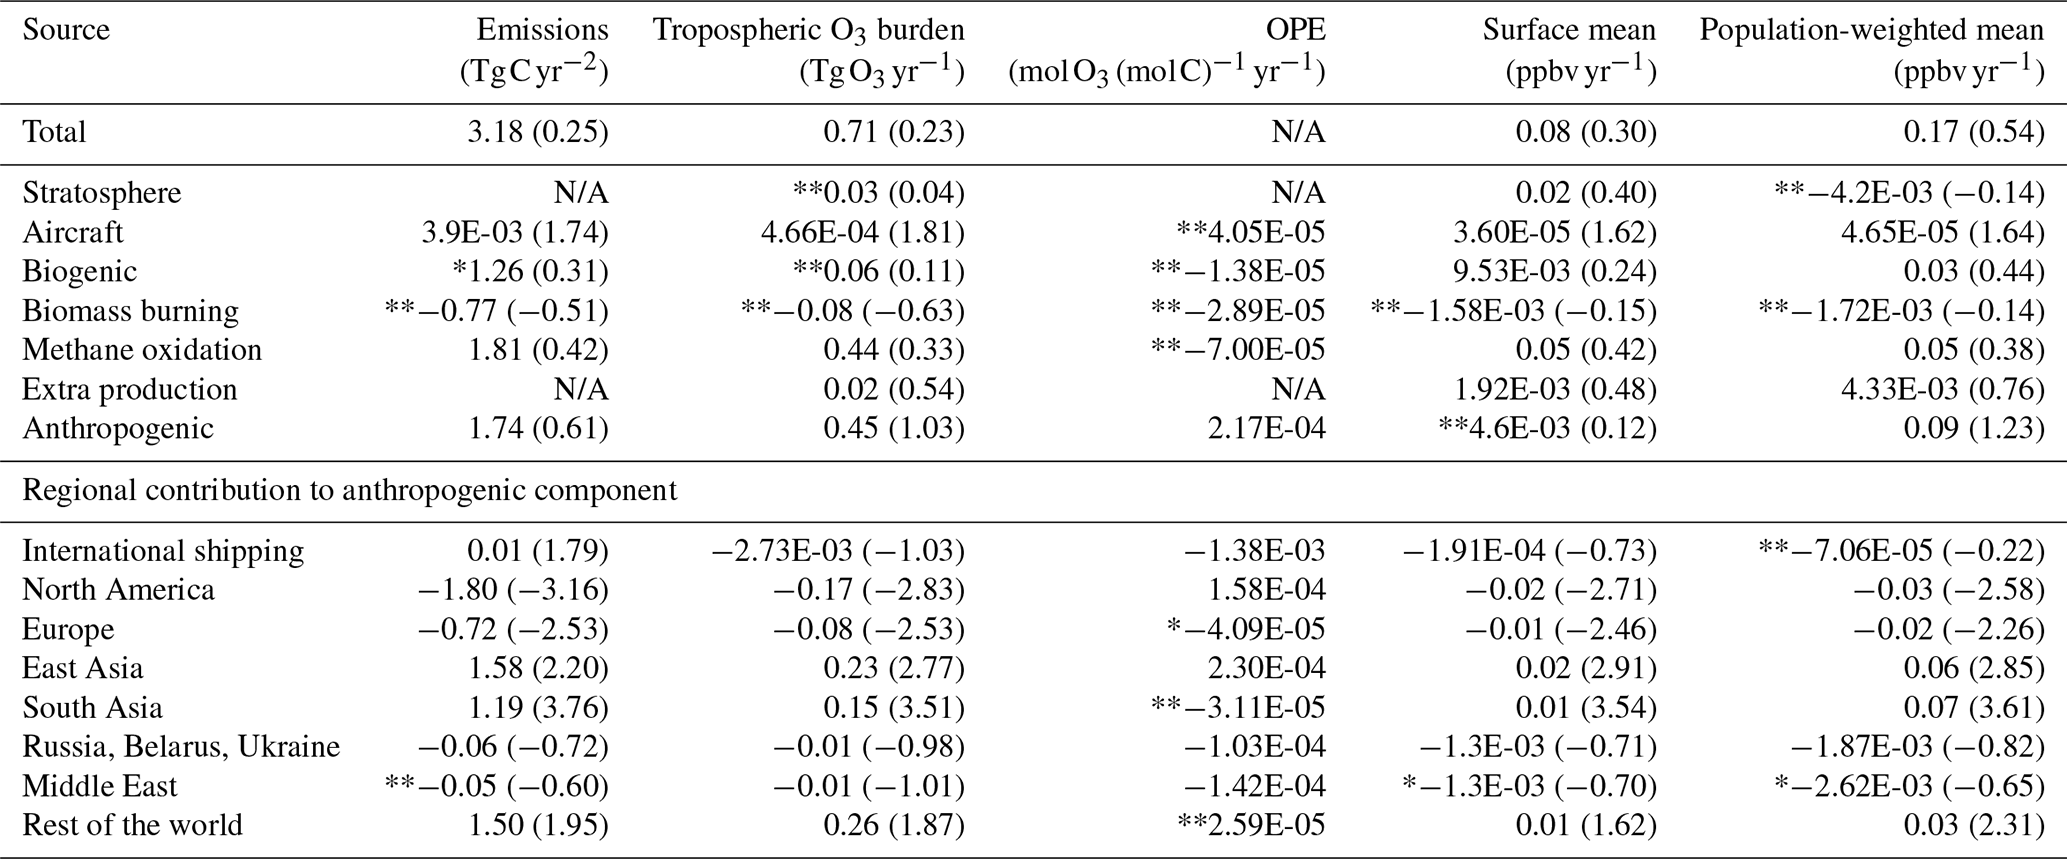
Since the concentration of methane is fixed at the surface in our simulations, we consider the methane oxidation rate derived from methane's oxidation reaction with atmospheric hydroxyl radical as the effective source of RC for subsequent ozone production through rapid chemical reactions. We simulate ∼438 Tg C yr−1 of methane oxidation with an increasing trend of high certainty over the 2000–2018 period. The prescribed CH4 concentrations are such that there is a plateau until the year 2006 (Lan et al., 2024) followed by a steep increase (Fig. 4a: red line). Our simulated methane oxidation rate also increases with high certainty but does not strictly follow this plateau followed by steep increase pattern and has large inter-annual variability (Fig. 4a). This could possibly be due to variability in the prescribed meteorology and OH concentration (Fig. 4b) resulting in variations in the oxidation rate of methane. We simulate slightly larger methane oxidation for the year 2010 compared to that simulated by Butler et al. (2020), possibly due to the usage of a different anthropogenic emissions dataset, a prescribed CH4 mixing ratio and a prescribed meteorology dataset. A detailed comparison of methane-related variables such as prescribed concentration, burden, lifetime and oxidation rate between our study and Butler et al. (2020) for the year 2010 is provided in Table S4 in the Supplement. While the absolute contributions from methane oxidation, anthropogenic and biogenic NMRC emissions to total reactive carbon emissions increase with medium–high certainty (Fig. 3b), their relative contributions show trends with low certainty (Fig. S3b).
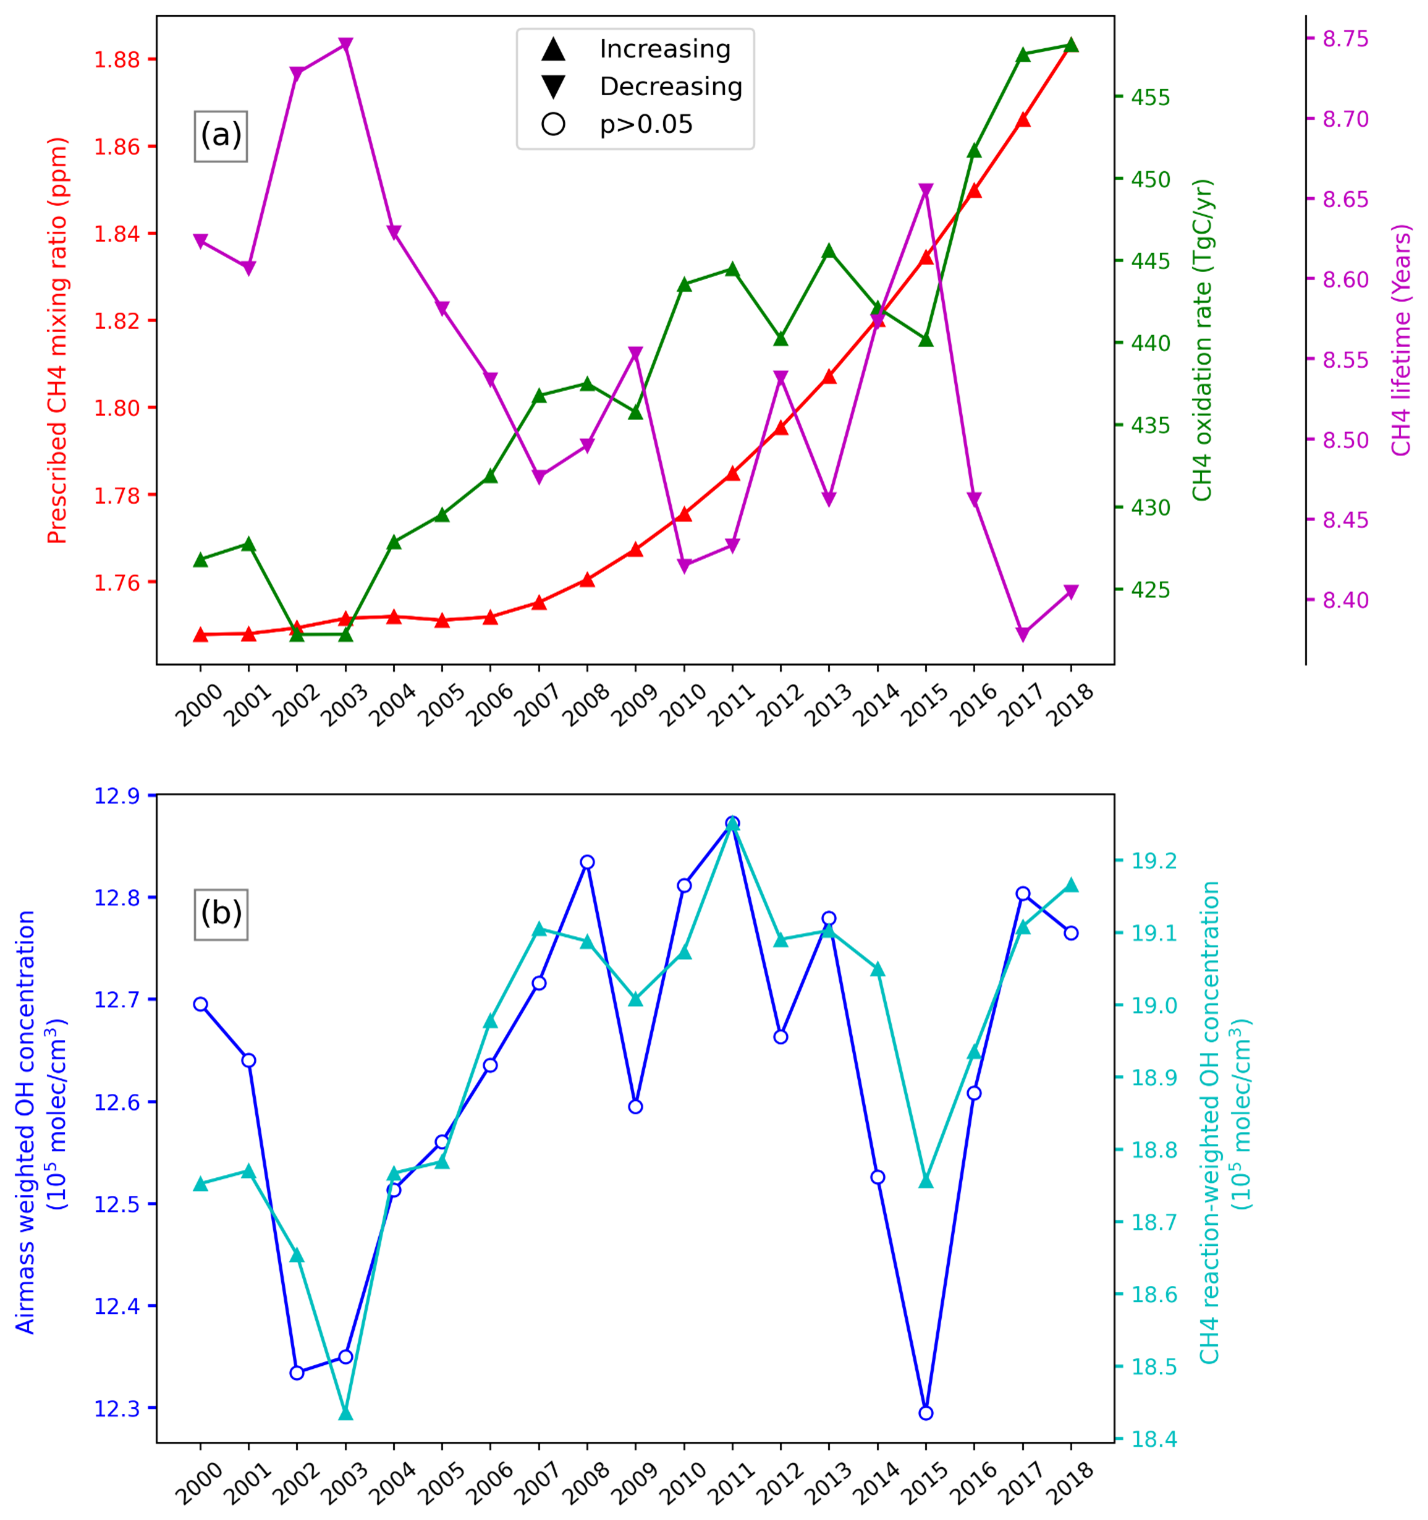
Figure 4(a) Red line: annually varying methane mixing ratio (in ppm) prescribed in our model. Green line: methane oxidation rate (in Tg C yr−1) simulated by our model. Magenta line: lifetime of methane (in years). (b) Air-mass-weighted and CH4-reaction-weighted tropospheric OH concentration (in 105 ). The symbols on the plotted time series indicate the sign of trend in the plotted quantity. The mean values, slope of trend, 95 % confidence interval and p for the 2000–2018 period are provided in Table S5 in the Supplement.
The tropospheric methane lifetime (∼8.54 years), calculated as the total atmospheric methane burden divided by tropospheric methane oxidation rate, decreases with high certainty (−0.01 yr yr−1; Table S5) in our simulations (Fig. 4a: magenta line). This result is contrary to the expectation that methane lifetime might increase due to increasing methane concentrations, leading to a smaller availability of OH radicals to oxidize methane (Prather, 1996). Oxidation of CH4 with OH radical being the major loss pathway for CH4, we show the time series of OH in Fig. 4b. Here we simulate an increasing trend in air-mass-weighted tropospheric OH concentration (a prominent indicator for tropospheric oxidizing capacity; e.g., Voulgarakis et al., 2013; Chua et al., 2023) but with low certainty. Nevertheless, the CH4-reaction-weighted tropospheric OH concentration (Lawrence et al., 2001) shows an increasing trend with high certainty. This increasing trend in tropospheric OH concentration is consistent with the trend discussed in Chua et al. (2023) and explains the decreasing lifetime of CH4 as these quantities are inversely proportional. The increasing OH availability despite increasing CH4 concentration could be due to increasing NOx emissions over the simulated period that recycle HO2 to OH (e.g. Lelieveld et al., 2008; Chua et al., 2023). The mean magnitude of our air-mass-weighted tropospheric OH concentration ( ) is slightly larger than previous studies ( in Chua et al., 2023, or in Voulgarakis et al., 2013), which is likely why we simulate a mean CH4 lifetime slightly smaller than the aforementioned studies (∼9 years) but within the multi-model range (7.1–10.6 years) reported in Voulgarakis et al. (2013).
Among the anthropogenic NMRC emissions, East Asian emissions are the largest (∼95.4 Tg C yr−1 (7.11 %); Table 4), increasing at 3.54 Tg C yr−2, peaking in 2011 and decreasing after that at −2.8 Tg C yr−2 (Fig. 3d; Table S6 in the Supplement), a feature similar to the NOx emissions. The second largest emitter is the “rest of the world” region (∼90.8 Tg C yr−1 (6.76 %); Table 4), with an increasing trend of high certainty (Fig. 3d). Remaining regions each contribute to less than 5 % of reactive carbon emissions. South Asian, Middle Eastern and ship NMRC emissions show an increasing trend, and North American, European and the Russia–Belarus–Ukraine region's NMRC emissions show a decreasing trend (Fig. 3d; similar sign of trend also seen for anthropogenic NOx emissions). We also see an equatorward shift in global anthropogenic NMRC emissions, similar to the anthropogenic NOx emissions in our zonal sum profiles of deviation in anthropogenic NMRC from year 2000 (Fig. S4b).
3.2 Tropospheric ozone burden
The tropospheric ozone burden is calculated as the mass of ozone in the model grid cells below the ozone tropopause, defined as the highest layer in the upper troposphere with an ozone mixing ratio less than 150 ppb (e.g., Bak et al., 2022; Liu et al., 2022). We simulate a climatological average tropospheric ozone burden of ∼318 Tg O3, with an increasing trend of 0.72 Tg O3 yr−1 over the 2000–2018 period. Our simulated tropospheric ozone burden is towards the lower end of values simulated by several multi-model studies for the 2005–2014 period (values from Griffiths et al., 2021): the CMIP6 ensemble at 356±31 Tg O3, ACCENT at 336±27 Tg O3, Atmospheric Chemistry and Climate Model Intercomparison Project (ACCMIP) at 337±23 Tg O3, TOAR at 340±34 Tg O3, and the Intergovernmental Panel on Climate Change (IPCC) at 347±28 Tg O3 (Szopa et al., 2021). The trend in tropospheric ozone burden is within the range of trends simulated by the CMIP6 model ensemble: 0.4 to 1.3 Tg O3 yr−1, as reported by Wang et al. (2022). When integrated from 60° S to 60° N, we simulate a climatological mean tropospheric ozone burden of ∼287.4 Tg O3 (lower end of the range of 287–311 Tg O3 estimated by satellite products for 2014–2016 period; Gaudel et al., 2018), with an increasing trend of 0.68 Tg O3 yr−1 (close to the trend of 0.82±0.13 Tg O3 yr−1 simulated by CMIP6 ensemble members; Griffiths et al., 2021).
We simulate a substantial amount of tropospheric ozone attributed to stratospheric influx in the NOx-tagged (∼91.5 Tg O3 (∼29 %); Table 2) and RC-tagged simulation (∼76.0 Tg O3 (∼24 %); Table 4). The larger amount of ozone attributed to stratospheric influx in the NOx-tagged simulation compared to the RC-tagged simulation is because of the production of tropospheric O3 attributed to NOx from the stratosphere formed by the oxidation of N2O, which is then subsequently transported into the troposphere. As described in Sect. 3.1.2 of Butler et al. (2018), ozone production in the stratosphere is handled directly in the chemical mechanism with the addition of new reactions producing the relevant odd oxygen species. Similarly, production of NO in the stratosphere from the oxidation of N2O by O1D is also handled directly with an additional chemical reaction.
We attribute minor ozone production pathways with the “extra production” tag. In our NOx-tagged simulation, this category consists of Ox production from the self-reaction of OH radicals and from reactions between HO2 and organic peroxy radicals. In our RC-tagged simulation this category consists of Ox production from the self-reaction of OH radicals and production of HO2 from the reaction of OH with H2O2. The contribution of these minor production pathways to the total tropospheric ozone burden is not very substantial (up to 2 %; Tables 2 and 4).
3.2.1 Tropospheric ozone burden attributed to NOx emission sources
Our simulation shows that ∼71 % of tropospheric ozone is attributed to NOx emissions (both surface-based and aloft). The remaining ∼29 % of tropospheric ozone burden is attributed to the stratospheric influx and a small contribution from minor production pathways, as discussed above. We note that the tropospheric ozone attributable to stratospheric influx in our NOx-tagged simulation is larger than the stratospheric contribution in the reactive-carbon-tagged simulation (24 %, described below) due to the inclusion of tropospheric ozone production from stratospheric NOx (as described above).
Anthropogenic NOx emissions are the largest contributors to tropospheric ozone (∼117 Tg O3 (∼37 %)), followed by lightning NOx (∼71 Tg O3 (22 %)), biogenic NOx emissions (24 Tg O3 (7.44 %)) and aircraft NOx emissions (13.44 Tg O3 (∼4.23 %); Table 2). Lightning NOx has a large contribution despite a small amount of NOx emissions because of large ozone production efficiency (OPE) of NOx when emitted aloft (Table 2). Further discussion about OPE is provided in Sect. 3.3. Biomass burning NOx emissions contribute ∼4 % to the total tropospheric ozone burden.
Among regional anthropogenic NOx sources, the contribution from the “rest of the world” used in this study (Table 1) to the tropospheric ozone burden is largest among the anthropogenic NOx emissions, followed by ship NOx emissions. This “rest of the world” contribution is even larger than that of East Asian contribution, which is the region with the largest anthropogenic NOx emission among continental regions considered in this study (Fig. 3, Table 2). This is due to more efficient production of ozone and convection into the free troposphere at the tropical regions (Zhang et al., 2016, 2021; see further discussion in Sect. 3.3.1) that are included within the “rest of the world” tag. The disaggregated contribution of explicitly tagged regions within the “rest of the world” tag in our NOx-tagged simulation – Southeast Asia, Central Asia, North Africa and Mexico–Central America (Table 1; Fig. S1b) – are provided in the Supplement (Tables S5 and S6). We notice that the largest contributors among these regions are the NOx emissions from the tropical regions: Mexico and Central America and Southeast Asia (Table S5). Similarly, the tropically situated South Asian contribution to the tropospheric ozone burden is larger than that of the European contribution, despite having a smaller amount of NOx emissions (Table 2), due to the larger convection into the free troposphere as stated above.
To illustrate the predominant role of convection in transporting ozone and its precursors in the tropics into the free troposphere, we show the zonal mean vertical profiles of annual mean O3 and NOx (sum of NO and NO2) mixing ratios for the 2000–2018 climatological mean attributed to NOx emitted from a typical tropical region: Southeast Asia and a typical northern midlatitude region – Europe (Fig. 6; see Fig. S1 for the location of defined regions). The vertical gradient in the ozone attributed to European NOx is consistent with summertime production of ozone primarily within the boundary layer with subsequent vertical transport into the free troposphere. While there is indeed some ozone attributed to Southeast Asian NOx emissions present in the boundary layer, the mixing ratio of this attributed ozone is much higher in the free troposphere, which is consistent with ozone production aloft. This is due to emitted NOx directly being transported aloft, eventually leading to free tropospheric ozone production. Further, we also note the increasing trend in NOx burden attributed to anthropogenic NOx emissions in the free troposphere (above 700 hPa; Fig. S5).
The contribution from ship NOx is also large due being emitted in remote ocean regions where ship NOx is the only source of NOx emissions. This results in less competition among tagged NOx sources in producing ozone, leading to very efficient ozone production from ship NOx (Butler et al., 2020). Further discussion about ozone production efficiency of ship NOx is provided in Sect. 3.3.1.
The sign of the trend in the contribution to the tropospheric ozone burden from each of the tags (Fig. 5a and c) is consistent with the sign of the NOx emissions trend (Fig. 3a and c, Table 3). The percentage slope (ignoring the sign) of the trend in the contribution to tropospheric ozone burden by regional anthropogenic NOx sources, however, is generally smaller than that of NOx emission trend (Table 3). Similarly, the magnitude of the percentage slope in the trend in tropospheric ozone burden attributed to East Asian NOx emissions for both the pre-2011 (2000–2011) and post-2011 (2011–2018) periods is smaller compared to the corresponding percentage slope in East Asian NOx emissions trend (Table S2). The reason for this is due to changing ozone production efficiency with changing NOx emissions, explained in detail in Sect. 3.3.1.
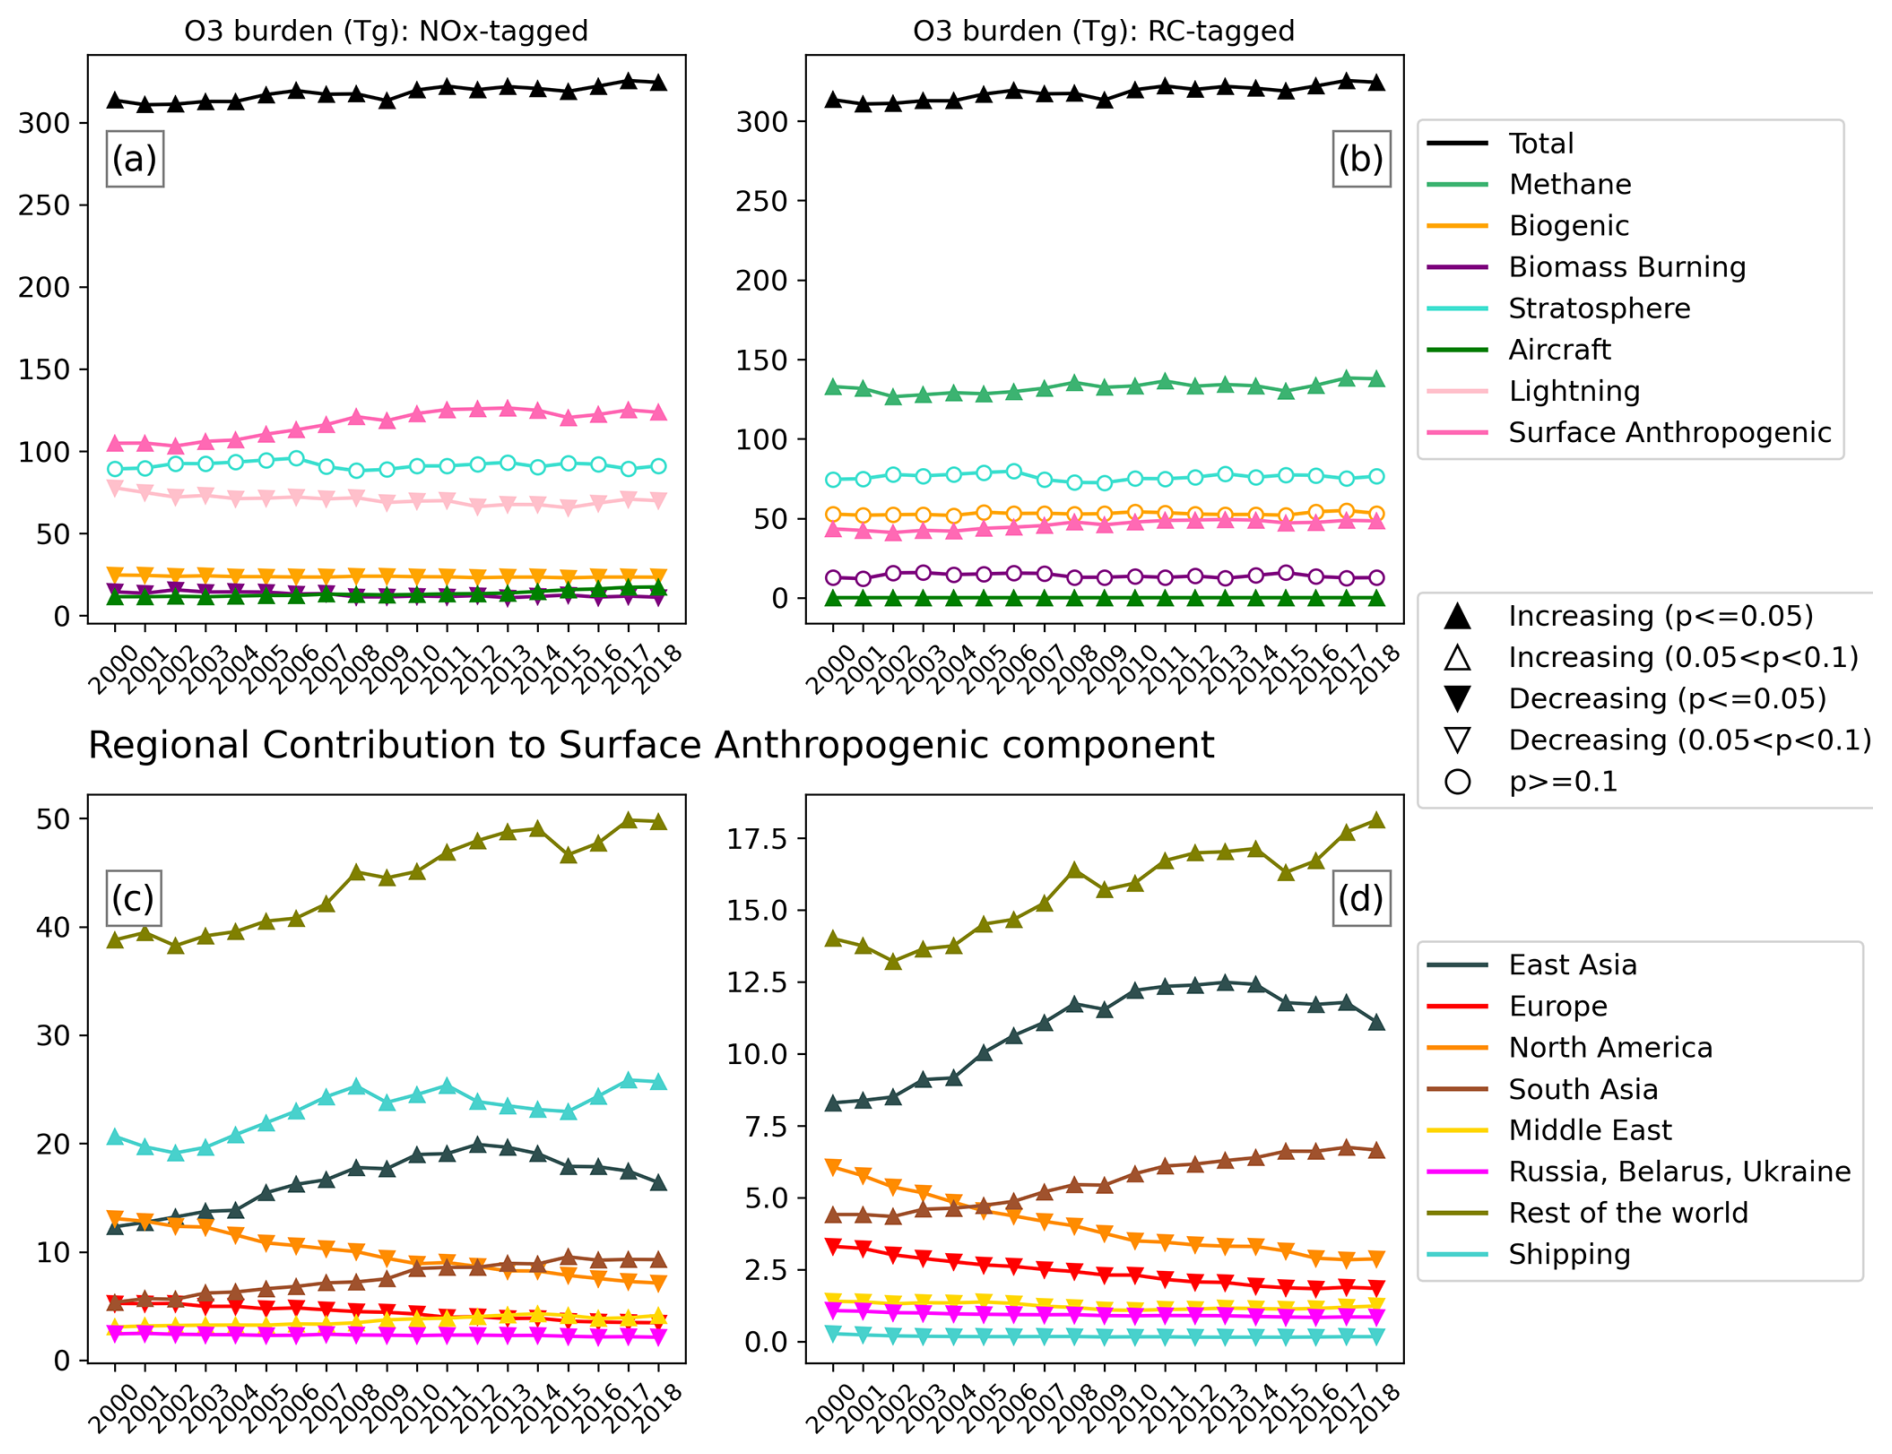
Figure 5Simulated global annual mean tropospheric ozone burden (in Tg O3) time series over the 2000–2018 period. Shown are the total simulated ozone burden (black line) and the contributions from the NOx-tagged (a, c) and RC-tagged (b, d) simulations. Panels (c) and (d) are the regional contributions to the total anthropogenic component (dark-pink line) shown in (a) and (b). The symbols indicate the sign and certainty of trend in the plotted quantity. The time series of relative contributions (in %) from each of the emission sectors to the total emissions is provided in Fig. S6.
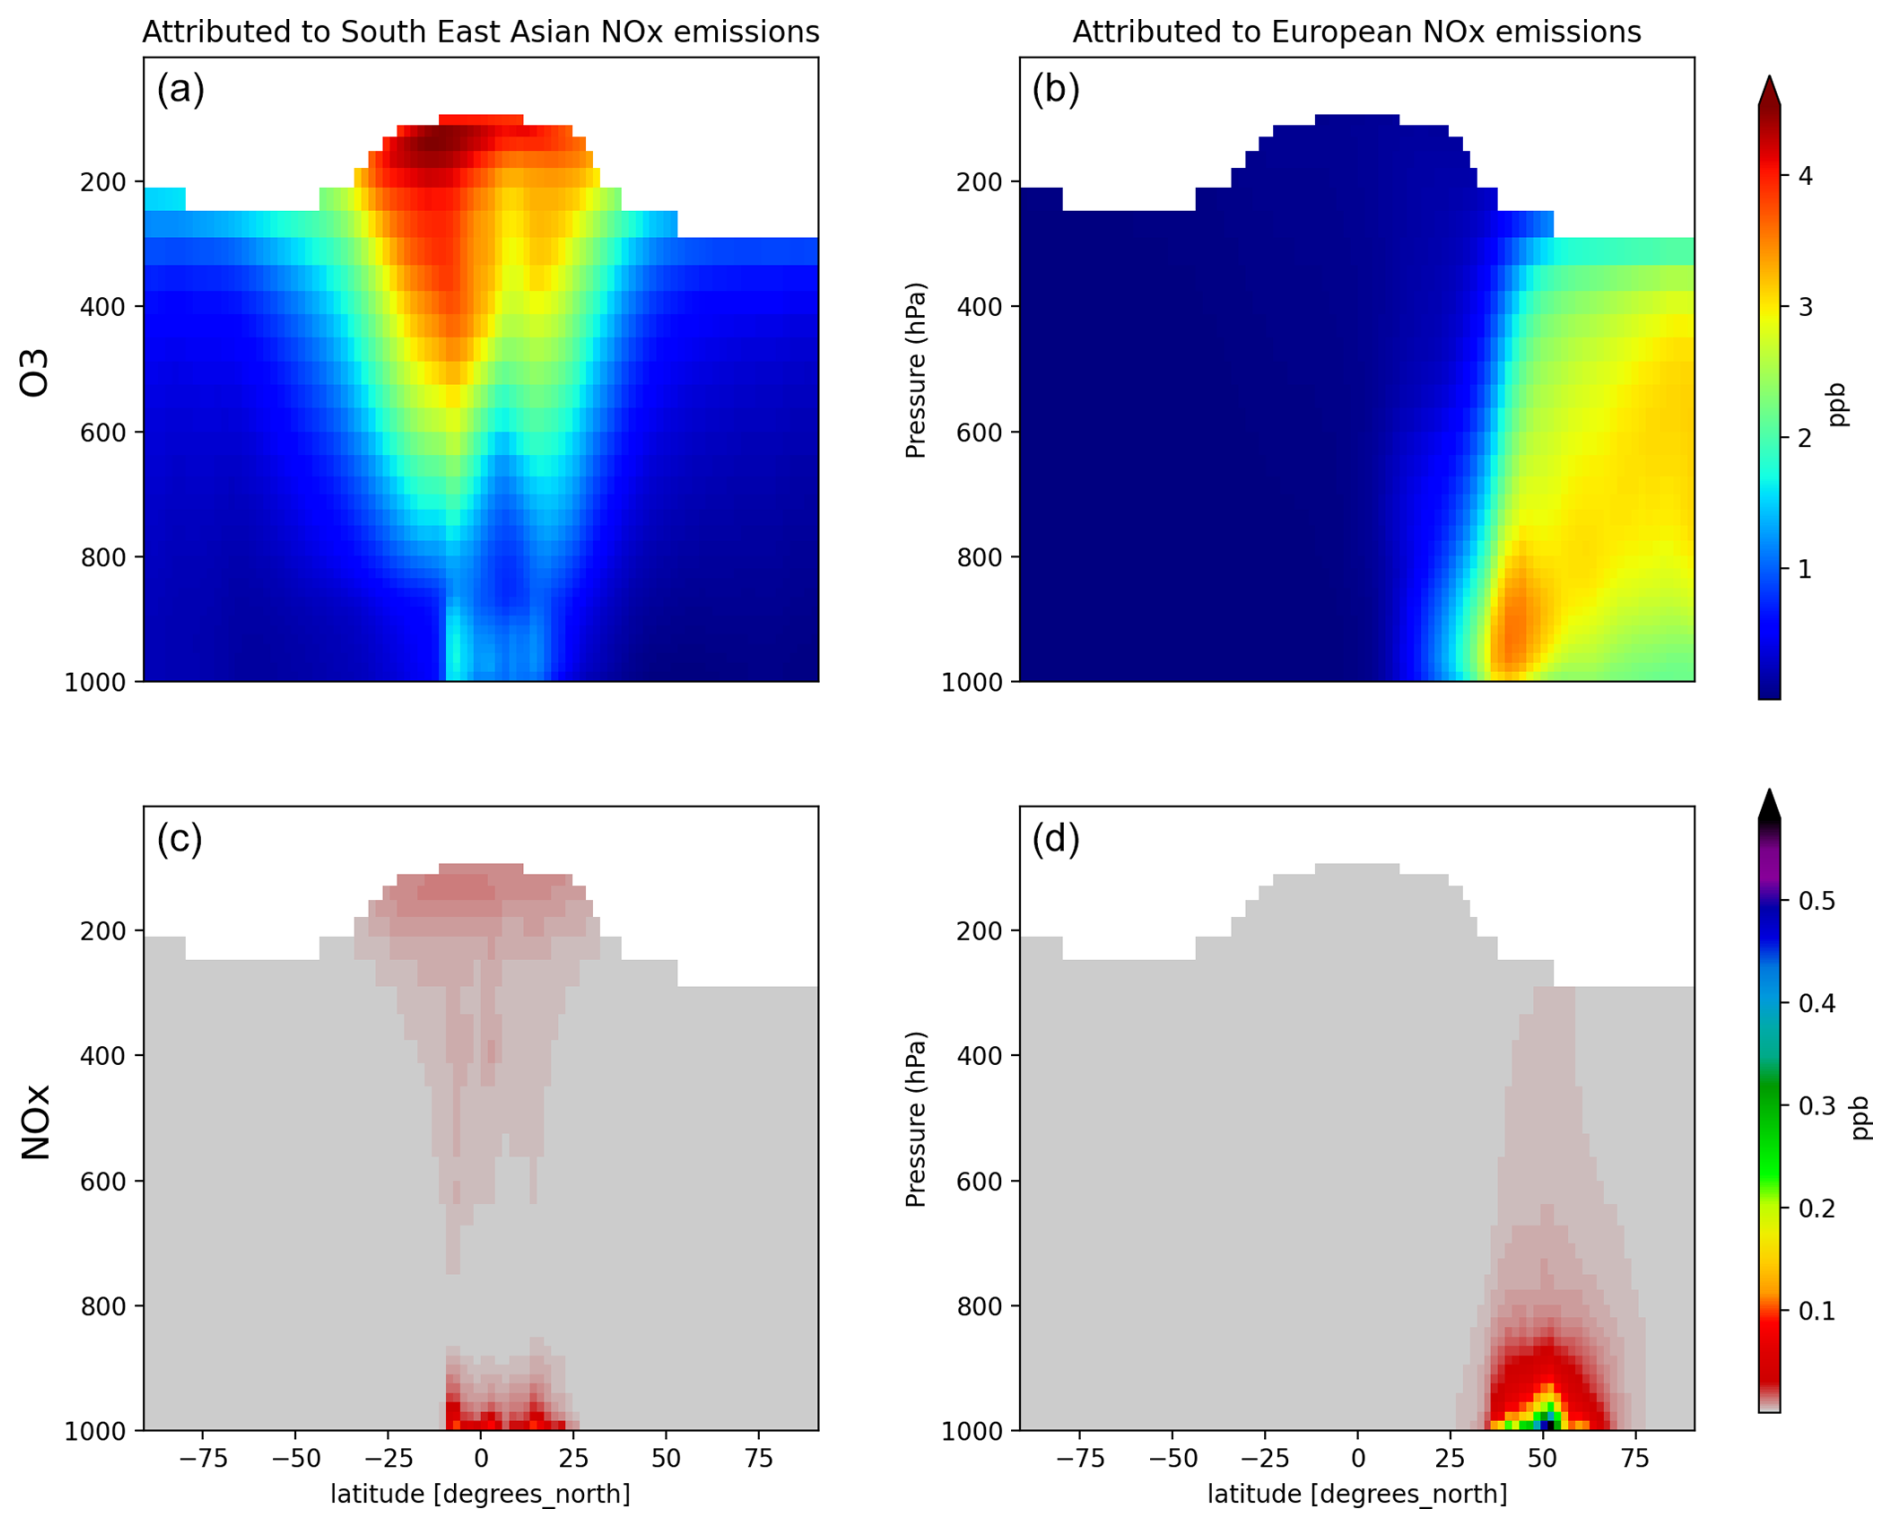
Figure 6Vertical profiles of zonal climatological (2000–2018) mean mixing ratio within the troposphere: O3 (a, b) and NOx (c, d) attributed to Southeast Asian (a, c) and European (b, d) anthropogenic NOx emissions.
We simulate a trend of ∼0.28 Tg O3 yr−1 (2.41 % yr−1; Table 3) in ozone burden attributed to aircraft NOx emissions, which is comparable to 0.3 Tg O3 yr−1 estimated by Wang et al. (2022) using sensitivity simulations, where the difference between a simulation with transient aircraft emissions and that with fixed aircraft emissions delivers the exclusive impact of changing aircraft emissions over the 1995–2017 period. While the trend derived from our tagged simulation only delivers the trend in contribution from aircraft NOx emissions, a sensitivity simulation would also cover the changes in simulated ozone contributed from various sectors when their ozone production efficiency changes as a result of emissions being held constant. A combination of sensitivity simulations with tagging included would help us track these nonlinearities and compensating feedbacks that would otherwise not be seen from sensitivity-only or tagging-only simulations.
3.2.2 Tropospheric ozone burden attributed to reactive carbon emission sources
In our RC-tagged simulation ∼76 % of the total amount of tropospheric ozone burden is attributed to tropospheric reactive carbon, while the remaining ∼24 % is attributed to stratospheric influx and minor production pathways as discussed above.
Of the reactive carbon sources, methane oxidation is the largest contributor to the tropospheric ozone burden (∼132 Tg O3 (42 %); Table 4) and is consistent with previous studies (Young et al., 2013; Butler et al., 2018). We simulate an increasing trend with high certainty in the part of the tropospheric ozone burden attributed to RC from methane oxidation (Fig. 5b), consistent with the increasing methane oxidation rate during the 2000–2018 period, as shown in Fig. 4a.
The contribution to tropospheric ozone burden from biogenic NMRC emissions (53 Tg O3 (∼17 %); Table 4) is much smaller than that of methane, despite having a comparable mass of RC emissions from both sources. This is consistent with the smaller number of oxidizable bonds per carbon atom in biogenic emissions, mainly isoprene (2.8) compared with methane (4) and the subsequently lower number of NO to NO2 conversions possible (per carbon atom) during isoprene oxidation compared with methane oxidation (Edwards and Evans, 2017). We simulate much smaller contributions of NMRC emissions from biomass burning and aircraft NMRCs compared to biogenic and anthropogenic sources (consistent with Butler et al., 2020; Table 4). Contribution to tropospheric ozone attributed to anthropogenic NMRC emissions is relatively low at ∼46 Tg O3 (14 %; Table 4).
Regional anthropogenic tags each contribute less than 5 % to the total tropospheric ozone burden. The sign of the trend in tropospheric ozone attributed to most of the tags, including regional anthropogenic NMRC tags, in our RC-tagged simulation is consistent with that of the trend in the corresponding reactive carbon emissions (Table 5). We also note that the percentage trend in contribution to tropospheric ozone burden from anthropogenic NMRC (1.03 % yr−1) is more than that of the trend in anthropogenic NMRC emissions (0.61 % yr−1), whereas the trend in contribution from methane oxidation (0.33 % yr−1) is less than that of trend in methane oxidation rate (0.42 % yr−1). While the biogenic NMRC emissions show an increasing trend with medium certainty, the trend in its absolute contribution to tropospheric ozone burden shows a small trend with low certainty.
3.3 Ozone production efficiency (OPE)
We estimate ozone production efficiency of emissions of any given sector as the ratio of annual mean tropospheric ozone burden (in mol O3) attributed to that sector to the amount of ozone precursors emitted in a given year (either NOx (in mol N) or reactive carbon (in mol C)). Several previous studies report OPE as the ratio of response in tropospheric ozone burden to change in emissions introduced in the model or as a ratio of the production rate of ozone to the loss rate of NOx (e.g. Lin et al., 1988; Kim et al., 2016; Miyazaki et al., 2021; Archibald et al., 2020). Since our model directly calculates the ozone attributed to emissions from tagged emission sources, the ratio of the attributed tropospheric ozone burden to the emitted amount of ozone precursor is calculated as OPE of that tagged precursor source. This can only be made possible when the NOx and reactive carbon precursors are tagged in two separate simulations, as explained in Butler et al. (2020). A similar metric – ozone burden efficiency (OBE) – has been defined by Mertens et al. (2024) as the ratio of ozone attributed of precursor emissions (both NOx and RC) from a given source using the combinatorial tagging approach (in Tg O3) to the emitted NOx (Tg NO) for various tagged sectors.
3.3.1 OPE of NOx emissions
Lightning NOx (5.93 mol O3 (mol N)−1) and aircraft NOx (4.19 mol O3 (mol N)−1) are most efficient at producing ozone (Fig. 6a, Table 2) directly into the free troposphere, due to being emitted aloft (Hoor et al., 2009; Dahlmann et al., 2011). NOx emissions aloft are highly efficient at producing ozone due to the relatively low quantities of NOx at higher altitudes. Low NOx concentrations increase the ozone production efficiency of NOx due to a lower frequency of radical termination reactions compared with higher NOx concentrations so that each molecule of NOx can produce more molecules of ozone before being lost by reaction with OH (Seinfeld and Pandis, 2016). In contrast, biogenic NOx (1.4 mol O3 (mol N)−1), biomass burning NOx (0.88 mol O3 (mol N)−1) and anthropogenic NOx (0.96 mol O3 (mol N)−1) are comparatively less efficient at producing ozone as they are emitted at the surface into regions with comparatively large NOx concentrations.
Among regional anthropogenic NOx emissions, the “rest of the world” is the most efficient (1.8), as it mainly consists of tropical regions where the convection into the free troposphere is large. We further elaborate the explicitly tagged regions in our NOx-tagged simulation within the “rest of the world” tag in Table S7 in the Supplement. The tropical regions are the most efficient among all the explicitly tagged regions: Mexico and Central America (1.81 mol O3 (mol N)−1) and Southeast Asia (1.98 mol O3 (mol N)−1). The larger sensitivity of tropospheric ozone to emission changes in these tropical regions has also been noted in Zhang et al. (2021). Similarly, OPE of South Asian NOx (0.78 mol O3 (mol N)−1) and to some extent Middle Eastern NOx (0.64 mol O3 (mol N)−1) is much larger compared to that of North American (0.54 mol O3 (mol N)−1), European (0.36 mol O3 (mol N)−1), the Russia–Belarus–Ukraine region's (0.4 mol O3 (mol N)−1) and East Asian (0.54 mol O3 (mol N)−1) NOx, for being more tropically situated (e.g., Wild et al., 2001; Butler et al., 2020; Zhang et al., 2021). International shipping is the second most efficient (1.67 mol O3 (mol N)−1) source of anthropogenic NOx emissions in producing ozone, due to their presence at remote pristine regions where there is a much smaller availability of other sources of NOx (Lawrence and Crutzen, 1999; Butler et al., 2020). We note that the chemistry occurring within the expanding plume emitted by ships is not considered in our coarse-resolution model, leading to an instantaneous dilution of emitted NOx into the large grid cells (Vinken et al., 2011), thereby making ozone production from ship NOx more efficient than observed (Kim et al., 2016).
The increasing trend in anthropogenic NOx emissions from South Asia, the Middle East and international shipping (Fig. 3c and Table 3) results in less efficient production of tropospheric ozone from these sources over time (Fig. 7c and Table 3). Similarly, there is an increasing trend in OPE of anthropogenic NOx emissions from regions with decreasing emissions (North American, European and the Russia–Belarus–Ukraine region; Fig. 7c). The decreasing (increasing) NOx emissions from regional anthropogenic sources become more (less) efficient at producing ozone, and this leads to a dampening effect where there is a smaller-percentage slope (ignoring the sign) in tropospheric ozone burden compared to the slope in NOx emissions (Table 3). This result is also consistent with Mertens et al. (2024), where an increase in NOx emission from various tagged sectors is associated with a decrease in OBE in both present-day and future scenarios.
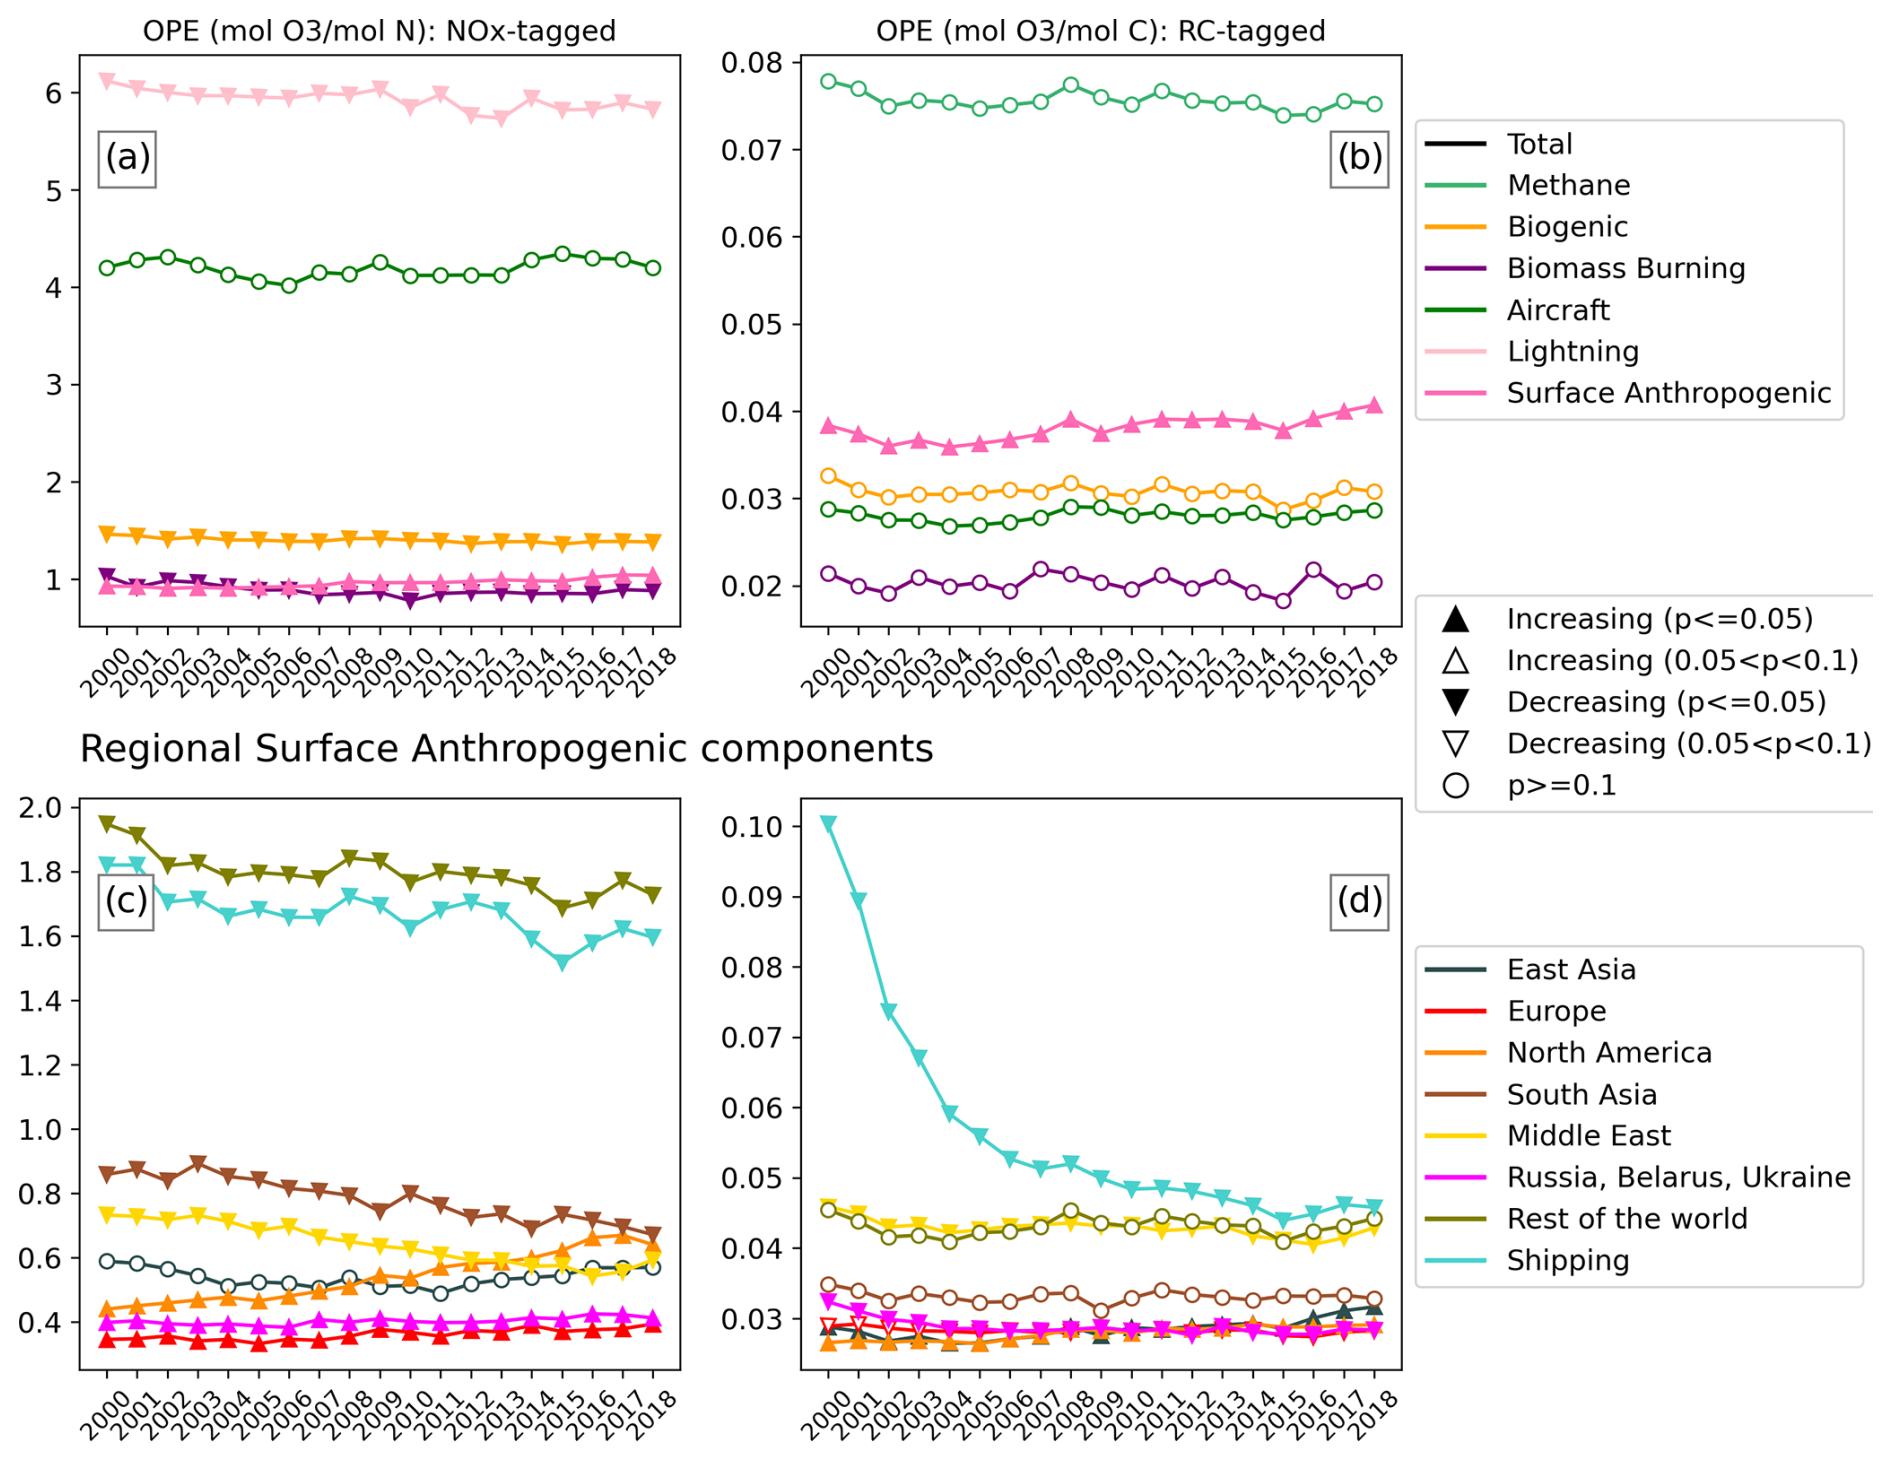
Figure 7Time series (2000–2018) of the ozone production efficiency (OPE; in mol O3 (mol N)−1: NOx-tagged, a, c, mol O3 (mol C)−1: RC-tagged, b, d) of various ozone precursor emission regions/sectors tagged in this study. Panels (c) and (d) are the OPE values of regional anthropogenic emissions tagged in this study. The symbols indicate the sign and certainty of trend in the plotted quantity.
Figure 7c shows that the OPE of East Asian NOx has a trend of low certainty over the 2000–2018 period. However, when shorter periods are considered, it decreases with high certainty during the pre-2011 period when emissions increase (2000–2011 period) and increases with high certainty for the post-2011 period when emissions decrease (2011–2018 period; Table S2).
In the case of total anthropogenic NOx emissions, we do not simulate a decrease in their OPE despite their increasing emission trend. We rather simulate an increase in OPE of anthropogenic NOx with high certainty. This is due to an equatorward shift in emissions over the 2000–2018 period (Fig. S4), where the emitted NOx from the tropics and the subsequently formed ozone and NOy (NOx and reservoir species for NOx (e.g., NO3, N2O5) molecules are rapidly lifted into the free troposphere as discussed previously (Zhang et al., 2016). We also notice that the increase in anthropogenic emissions leads to a decreasing trend in OPE of other natural sources of NOx such as biogenic, biomass burning and lightning sources, as these natural sources must compete with more NOx emissions from anthropogenic sources in order to produce ozone.
3.3.2 OPE of reactive carbon emissions
Consistent with Butler et al. (2020), we simulate methane oxidation as the most efficient (0.08 mol O3 (mol C)−1; Table 4) among the tagged reactive carbon sources in our RC-tagged simulation. Similarly, we simulate smaller OPEs for biogenic (0.03 mol O3 (mol C)−1), biomass burning (0.02 mol O3 (mol C)−1) and anthropogenic (0.04 mol O3 (mol C)−1) reactive carbon sources. As noted in Sect. 3.2.2, RC from methane oxidation is expected to be more efficient at producing ozone per unit of carbon due to the higher number of oxidizable bonds per carbon atom. Anthropogenic reactive carbon emissions might be expected to be more efficient than biogenic reactive carbon emissions at producing ozone due to their proximity to anthropogenic NOx emissions, but we see no large differences in OPE in our study (Table 4).
We simulate a trend with low certainty in the OPE RC from natural sources such as biogenic, biomass burning and methane oxidation (Fig. 7; Table 5). We do simulate an increasing trend with high certainty in the OPE of global anthropogenic reactive carbon emissions. Among the regional anthropogenic sources, we simulate trends with low–medium certainty for European, South Asian and “rest of the world” RC emissions. We simulate an increasing trend for North American and East Asian emissions and a decreasing trend for the OPE of the remaining tagged regional anthropogenic reactive carbon emissions. OPEs of East Asian anthropogenic RC emissions have a small trend with low certainty over the 2000–2011 period and then increase with high certainty during the 2011–2018 period (Table S6).
We would expect that the ozone production by reactive carbon emissions should mainly depend on the availability of NOx, especially in pristine environments. The trends in the OPE of regional anthropogenic NMRC emissions largely, but not always, follow the trends in the emissions of NOx in their vicinity (Tables 3 and 5). However, the trends in the emission of the RC from a given sector itself could influence the OPE of its own emissions and the OPE of the NMRC emissions from other sources. For example, Butler et al. (2020) illustrate how an increase in prescribed methane concentration leads to smaller OPE of not just RC from methane oxidation but also of other tagged RC emission sectors. To better understand the behavior of changes in OPE of reactive carbon emissions, further studies could investigate the OPE changes from perturbation simulations, by enabling ozone source attribution with tagging in the simulations. Mertens et al. (2018) demonstrate that the combination of tagging and perturbation can be used to explain the compensating feedbacks induced by perturbation, from various tags used in the simulations.
3.4 Contributions from tagged precursor emission sources to surface ozone
In this subsection, we discuss the contribution of various NOx and reactive carbon sources to both the global surface mean and population-weighted mean ozone. We further contrast this contribution with that of their contribution to the tropospheric ozone burden (discussed in Sect. 3.2).
We select the population count for the year 2020 Gridded Population of the World (Center for International Earth Science Information Network – CIESIN – Columbia University, 2018) and scale the surface ozone according to this distribution to calculate the global population-weighted mean ozone, which is related to the ozone exposure. Choosing only 1 year for population weighting gives the exclusive effect of changing emissions and not the effect of changing population. Future studies may consider scaling according to a transient population over the analysis period rather than fixing it at 1 year (year 2020 in this study). Table S9 provides the population and their fraction of world population (in %) for the regions considered in this study.
We simulate ∼25.4 ppbv of global mean surface ozone with an increasing trend of high certainty (0.08 ppbv yr−1 (0.3 % yr−1); Fig. 7 and Table 3). Similarly, we simulate ∼33.0 ppbv of global population-weighted mean ozone with an increasing trend and slightly larger slope (0.17 ppbv yr−1 (0.54 % yr−1); Fig. 8 and Table 3) compared to global surface mean ozone. We will explain the main contributors responsible for this increasing trend and the larger slope in global mean population-weighted ozone in the subsequent discussion. DeLang et al. (2021) showed that the increasing trend in global ozone exposure is mainly driven by increasing ozone exposure at highly populated regions such as Asia and Africa. In our study, we quantify the contribution of various ozone precursor emission sources to the global population-weighted surface ozone and its trend.
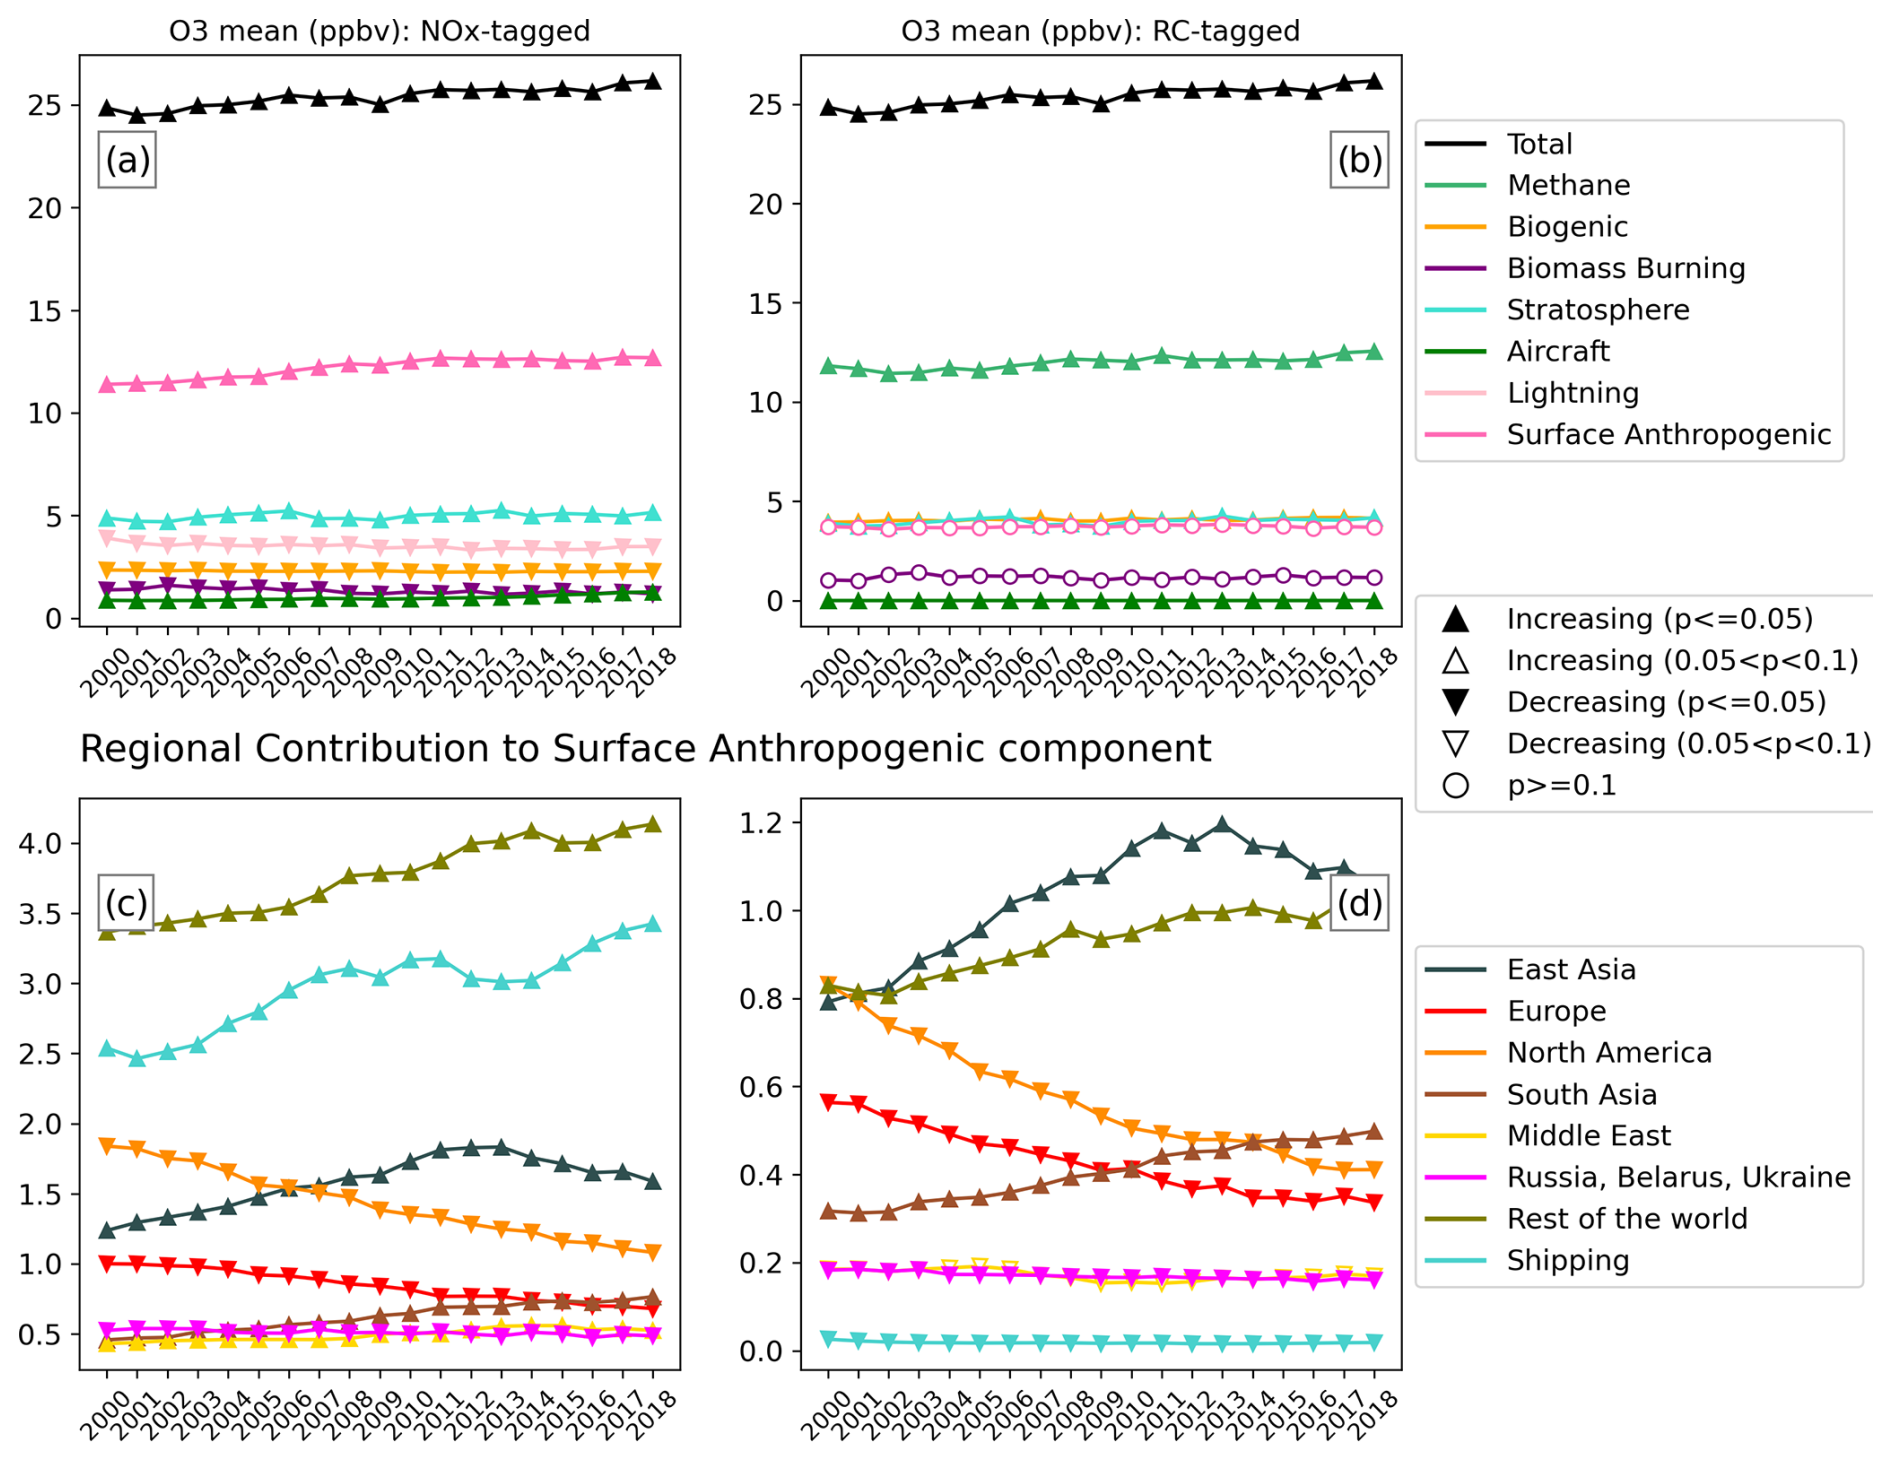
Figure 8Same as Fig. 5 but for global annual area-weighted mean surface ozone (in ppb). The time series of relative contributions (in %) from each of the tagged components to the global annual area-weighted mean surface ozone is provided in Fig. S7.
The share of the stratospheric contribution to the global mean surface ozone (4–5 ppbv (∼15 %–20 %); Tables 2 and 4) is smaller than its contribution to tropospheric ozone burden (24 %–29 %; Tables 2 and 4). We simulate an increasing trend with high certainty (∼0.3 %–0.4 % yr−1; Tables 3 and 5) in this contribution mainly over the Southern Hemisphere (not shown). The stratospheric contribution to the population-weighted surface ozone is much smaller (∼3 ppbv (9 %–11 %); Tables 2 and 4) compared to the quantities discussed above, as it mainly contributes over remote regions such as polar and oceanic regions (not shown).
3.4.1 Surface ozone attributed to NOx emissions
The percentage contribution to global mean surface ozone from sources aloft (lightning, aircraft, stratosphere) is smaller compared to the contribution to tropospheric ozone burden (Table 2). Consequently, the surface-based NOx sources (biogenic, biomass burning and anthropogenic) contribute a larger share to the global mean surface ozone compared to their share of the tropospheric ozone burden.
The share of the anthropogenic NOx contribution has the largest difference in its contribution from ∼37 % (to tropospheric ozone burden) to ∼48 % (to global mean surface ozone; Table 2). All the tagged regional anthropogenic NOx sources contribute a larger percentage share to global mean surface ozone than to the tropospheric ozone burden (Table 2). However, the tropically situated explicitly tagged regions within the “rest of the word” tag in our NOx-tagged simulation – Mexico and Central America and Southeast Asia – have a smaller share in their contribution to global mean surface ozone compared to that of tropospheric ozone burden (Table S7), largely due to being situated in a tropical region with large convection to the free troposphere (Fig. 6; Zhang et al., 2016, 2021). We simulate a small increasing trend (0.08 ppbv yr−1 (0.30 % yr−1); Table 3) in global mean surface ozone, mainly driven by increasing stratospheric contribution (0.02 ppbv yr−1 (∼0.32 % yr−1)) and increasing trend in contribution from anthropogenic NOx sources (0.08 ppbv yr−1 (0.69 % yr−1); Table 3 and Fig. 7c).
The contribution from anthropogenic NOx to the population-weighted surface ozone (∼20 ppbv (62 %;) Table 2) is larger than its contribution to global mean surface ozone. This larger contribution is compensated by smaller remote contributions such as the stratosphere, lightning, aircraft and biomass burning. Among the regional anthropogenic sources, the NOx emissions from highly populated regions (see Table S9 for population of world regions) are the largest contributors to global population-weighted mean ozone: South Asia (4.6 ppbv (∼14 %), East Asia (∼4.3 ppbv (13 %)) and the “rest of the world” (∼4.3 ppbv (13 %)). Ship NOx emissions also have a substantial contribution (∼2.5 ppbv (7.5 %)) to the global population-weighted surface mean ozone, larger than contributions from anthropogenic NOx emissions by relatively sparsely populated world regions such as North America, Europe, the Russia–Belarus–Ukraine region, or the Middle East (Table 2). The increasing trend in global population-weighted surface ozone (0.17 ppbv yr−1 (0.54 % yr−1); Table 3), which is slightly larger compared to the trend in global mean surface ozone, is mainly driven by increasing anthropogenic NOx emissions especially from highly populated regions (South Asia, East Asia and the “rest of the world”) and from international shipping. Despite NOx emissions from international shipping happening only over ocean grid cells, the ozone attributed to ship NOx spreads across land areas and contributes to the total surface ozone by ∼3–6 ppb (Fig. 10a). Although there is no population over the regions where international ship NOx is emitted, the global population-weighted mean ozone attributed to ship NOx is comparable to that of global mean surface ozone (Table 2) as large populations at several coastal areas and densely populated inland regions in East Asia and South Asia are exposed to ozone attributed to ship NOx emissions (Fig. 10b). We notice that while there is a steep decreasing slope after year 2013 in global mean surface ozone attributed to East Asian NOx emissions (Fig. 8c; due to emission reduction shown in Fig. 3c), we do not find a similar feature for global population-weighted mean ozone attributed to East Asian NOx emissions (Fig. 9c and Table S2). The reason for this is unclear at this point and could be an interesting topic for future studies.
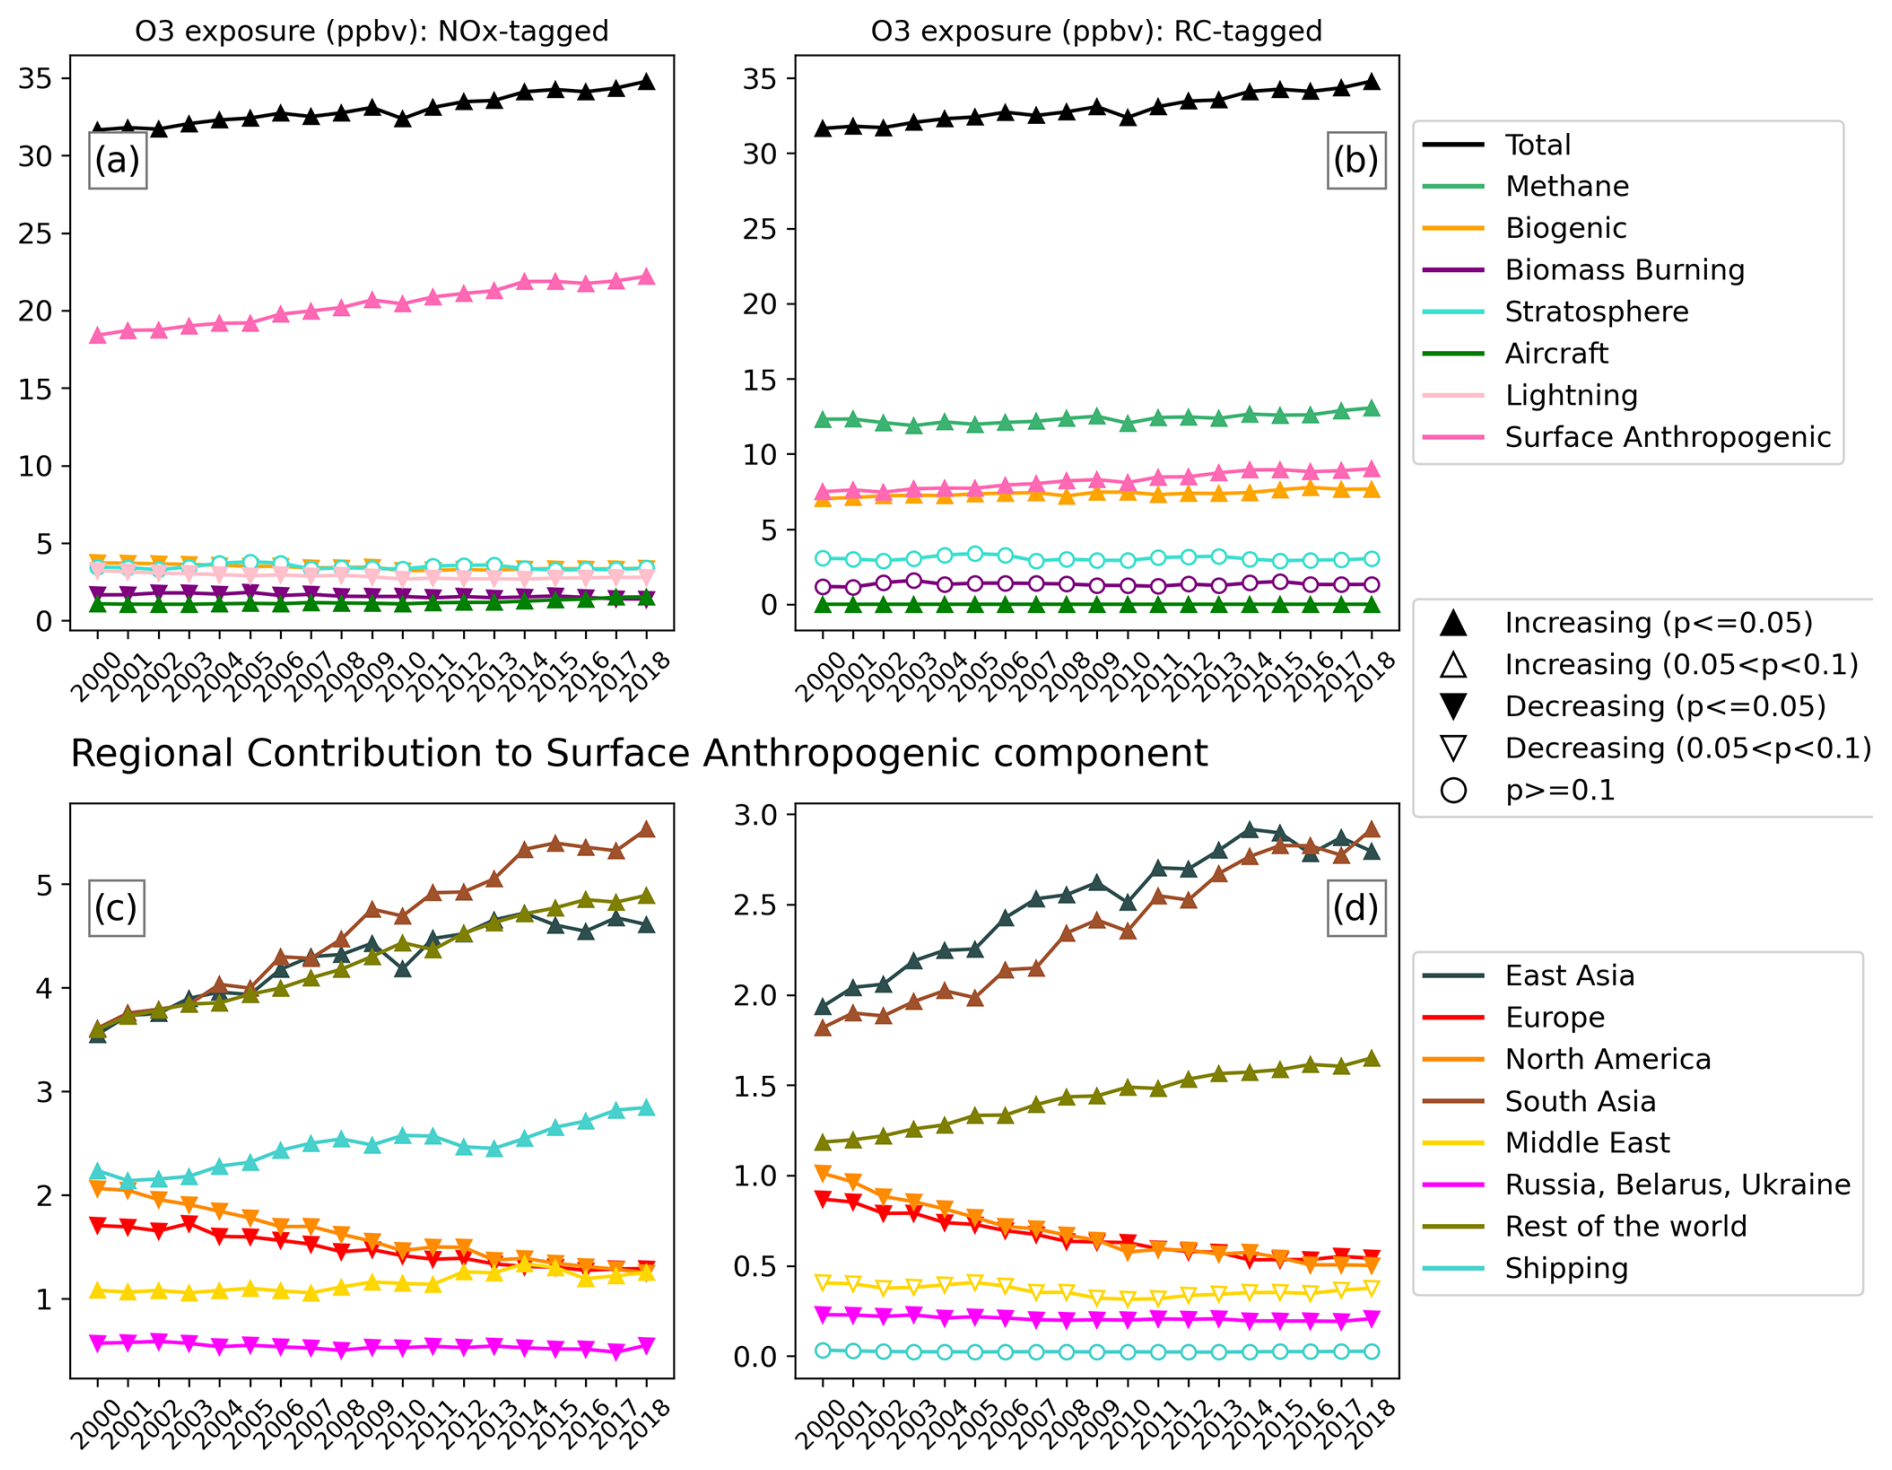
Figure 9Same as Fig. 5 but for global annual population-weighted mean surface ozone (in ppb). The time series of relative contributions (in %) from each of the tagged components to the global annual population-weighted mean surface ozone is provided in Fig. S8.
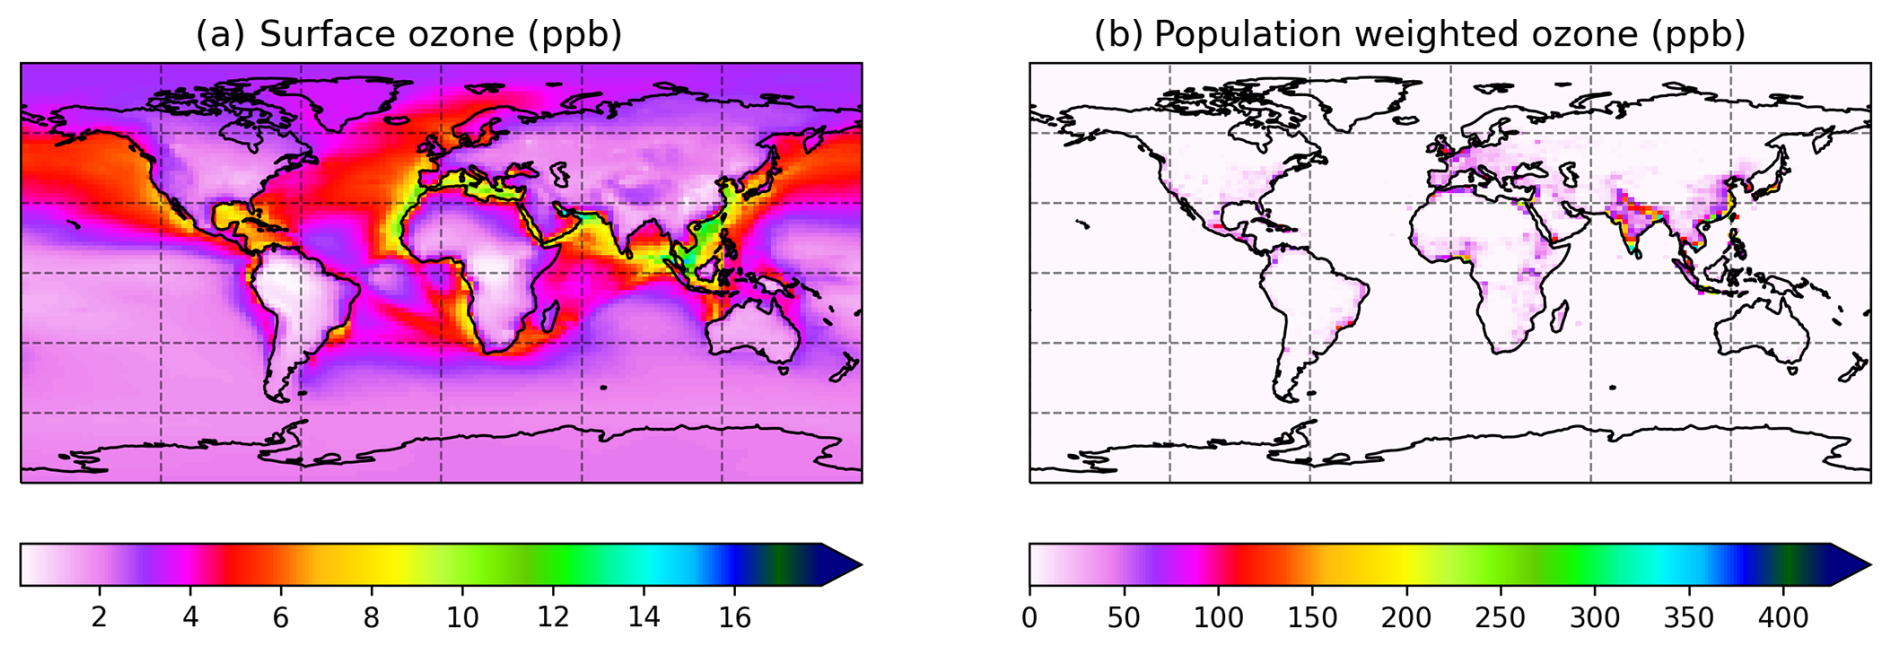
Figure 10Spatial distribution of climatological (2000–2018) annual mean O3 attributed to NOx emissions from international shipping (in ppbv): (a) surface ozone and (b) population-weighted surface ozone.
3.4.2 Surface ozone attributed to reactive carbon emissions
RC from methane oxidation contributes ∼12 ppbv (47 %) to global mean surface ozone; biogenic and anthropogenic NMRC emissions contribute ∼4.1 ppbv (∼16 %) and 3.72 ppbv (∼14.7 %; Table 4), respectively. Regional anthropogenic tags each contribute less than 5 % to the global mean surface ozone. Since the percentage contribution from stratospheric influx to global mean surface ozone is smaller than its contribution to tropospheric ozone burden (as explained above), there is a larger contribution from methane oxidation and anthropogenic and biomass burning RC emissions. We simulate a small trend with low certainty in the contribution to global mean surface ozone from anthropogenic NMRC emissions (Table 5). The increasing trend in global mean surface ozone is mainly driven by increasing contribution from the stratosphere, RC from methane oxidation and biogenic NMRC emissions. Although there is no trend with high certainty in emissions of biogenic NMRC, its increasing contribution to global mean surface ozone (Table 5) could be explained by the increasing anthropogenic NOx emissions (Butler et al., 2018; Lupascu et al., 2022).
The largest contribution to global population-weighted mean surface ozone is from ozone attributed to RC from methane oxidation (∼12 ppbv (37 %); Table 4). This contribution is smaller compared to its contribution to global mean surface ozone (∼47 %), because a substantial part of this contribution to global mean surface ozone is in remote oceanic regions (not shown). Consequently, there is a larger relative contribution from biogenic (22 %) and anthropogenic (25 %) NMRC sources to global population-weighted mean ozone compared to their contribution to global mean surface ozone. Among regional anthropogenic NMRC emissions, there is a larger share of contributions from highly populated regions such as South Asian, East Asian and the “rest of the world” and a smaller share from North American, European and the Russia–Belarus–Ukraine region's anthropogenic NMRC emissions to global population-weighted mean ozone compared to contribution to global mean surface ozone (Table 4).
The increasing trend in population-weighted surface ozone is mainly driven by increasing trends in the contribution of RC from methane oxidation (0.05 ppbv yr−1 (0.38 % yr−1)) and anthropogenic (0.09 ppbv yr−1 (1.23 % yr−1)) and biogenic (0.03 ppbv yr−1 (0.44 % yr−1)) NMRC emissions (Table 5). McDuffie et al. (2023) show that with a ∼100 ppb of methane pulse, the population-weighted ozone response is larger than the response in the global mean surface ozone. They further explain that this larger response was due to the larger availability of NOx precursor emissions at populated regions, leading to larger ozone production in populated regions. In contrast, we simulate a larger trend in contribution from methane oxidation to global mean (0.42 % yr−1) than to population-weighted mean surface ozone (0.38 % yr−1; Table 5), despite having a comparable change in prescribed methane concentration (∼135 ppb; Fig. 4) over the 2000–2018 period. This is due to a dominant trend in contribution from anthropogenic NMRC emissions from populated regions in our simulation, which is lacking in the methane pulse simulated by McDuffie et al. (2023). This dominant trend in anthropogenic NMRC contribution to population-weighted surface ozone can also be seen in its significantly increasing relative contribution (Fig. S8), which is not seen in other major contributors such as methane and biogenic NMRCs.
The total NOx emissions show a positive trend leading to an increasing contribution from methane oxidation. Similarly, the increasing anthropogenic NOx emitted at densely populated regions reacts with NMRC emitted from anthropogenic and biogenic sources (Fig. 8b; Lupascu et al., 2022). Among regional anthropogenic NMRC emissions, the contribution from highly populated regions (Table S9) – South Asia (∼0.07 ppbv yr−1 (% yr−1)) and East Asia (∼0.06 ppbv yr−1 (2.85 % yr−1) – Table 4) to global population-weighted ozone shows the largest increasing trend. As for the NOx-tagged case discussed in the previous subsection, the global population-weighted ozone attributed to East Asian anthropogenic NMRC emissions shows a small trend with low certainty during the post-2011 period in response to the reduction in emissions (Table S6).
In this study we quantify the contributions of ozone precursor emissions from various sources to tropospheric ozone during the 2000–2018 period. For this, we use the tagging approach using CAM4-chem introduced in Butler et al. (2018). We perform separate simulations for NOx and RC-tagged contributors to tropospheric ozone, which allows us to quantify the absolute contribution from the tagged emission sources to the tropospheric ozone burden and to calculate the ozone production efficiency per tagged sector/region.
We note a decreasing trend in both anthropogenic NOx and reactive carbon ozone precursor emissions from North America, Europe and the Russia–Belarus–Ukraine region and an increasing trend from East Asia, South Asia, the Middle East, international shipping and the “rest of the world”. We simulate the largest contribution to tropospheric ozone burden from anthropogenic NOx emissions (in our NOx-tagged simulation) and reactive carbon from methane oxidation (in our RC-tagged simulation), both with a significantly increasing trend, followed by contribution of ozone influx from the stratosphere but with no significant trend in its contribution. We simulate a relatively larger contribution to the tropospheric ozone burden from emissions at tropical regions compared to other regions, as previously discussed in Zhang et al. (2021). For example, the anthropogenic NOx emissions from the “rest of the world” regional tag, which mainly consists of tropical and Southern Hemisphere regions, contribute more to the tropospheric ozone burden compared with East Asia despite lower NOx emissions. We show using vertical profiles of tagged O3 and NOx mixing ratio fields (Fig. 6) that it is the emitted NOx in the tropics which predominantly gets lofted into the free troposphere and eventually forms ozone. Our tagging method only conveys information on the precursor source of the simulated ozone and associated gas molecules. It, however, does not convey information about where exactly the ozone molecule was formed: in the free troposphere or within the boundary layer. While addressing this is beyond the scope of our study, further studies could employ ozone tagging method used in Sudo and Akimoto (2007) and Derwent et al. (2015) that tag/label ozone molecules based on the location at which the ozone molecules are formed. Our study highlights the dominant effect of equatorward shifting of O3 precursor emissions, which contributes to the tropospheric O3 burden trend. Nevertheless, there remain other climatic factors that may play an amplifying or offsetting role to these contributions. These include, for example, changes in the general circulation of the atmosphere and monsoonal changes under a warming planet, as well as the natural variability of climate.
The trend in each tagged sector's contribution to the total tropospheric ozone burden is consistent with the sign of trend in the respective precursor emission from that tagged sector. We simulate an increasing trend in OPE of NOx emissions from regions where the emissions are decreasing (European, North American and the Russia–Belarus–Ukraine region's emissions) and vice versa (South Asian and the Middle Eastern emissions). The anthropogenic NMRC becomes more efficient at producing ozone, following the increasing trend in anthropogenic NOx emissions in their vicinity. We, however, do not simulate any trends with medium–high certainty in the OPE of other major reactive carbon sources such as methane oxidation and biogenic and biomass burning. We therefore recommend that further studies perform simulations combining perturbation and tagging to investigate how perturbation in the emissions of one sector induces changes in OPE of itself and other tagged sectors.
We contrast the contribution of emissions from tagged sectors to the global tropospheric ozone burden with their contribution to the global mean surface ozone and the population-weighted mean surface ozone. Except for tropical source regions such as South Asia, we simulate a larger share of contributions from regional anthropogenic NOx emissions to the global mean surface ozone compared to the tropospheric ozone burden. We also simulate an increasing trend in contribution by RC from methane oxidation and biogenic NMRC to global mean surface ozone and population-weighted mean ozone, leading to an overall global increasing trend in both these quantities. The increasing trend in population-weighted ozone is mainly driven by the increasing trend in contribution from anthropogenic NOx and (to a lesser extent) NMRC emissions over highly populated regions: South Asia and East Asia. We also simulate a substantial contribution of NOx emissions from international shipping to the population-weighted mean ozone. While the focus of the present study has been the quantification of the influences on global ozone metrics, future work using the methods employed in this study could focus on quantification of the intra- and extra-regional contributions to surface ozone in the regions studied here.
In our study, we discuss the results related to the 2000–2018 trends in global annual ozone metrics and its precursor emissions. Further studies could investigate the tagged contributions to the trends in the spatial and seasonal distribution of ozone (e.g., Wang et al., 2022; Fiore et al., 2022), which may help us enhance our understanding of various processes responsible for these trends. While previous studies used the TOAST tagging to understand the trends in surface ozone over United States (e.g., Li et al., 2023a), free tropospheric ozone over Southeast Asia (e.g., Li et al., 2023b) and over East Asia in future scenarios (e.g., Hou et al., 2023), we recommend such studies be extended to other regions of interest. Comparison of smaller time periods (2000–2011 and 2011–2018) could also be considered to understand the contrasting effect of increasing and decreasing East Asian precursor emissions, respectively. Finally, we recommend other global models implement the tropospheric ozone source attribution with NOx and RC tagging separately, which would enable a more rigorous model intercomparison and a better understanding of the underlying processes leading to the inter-model spread in their estimation of tropospheric ozone.
The values in the time series plotted in this study (Figs. 3, 5, 7, 8 and 9) are provided in the Supplement. Please contact tim.butler@rifs-potsdam.de for the model output of our simulations.
Attached documents are noxtagged_annual.csv, rctagged_annual.csv and Supplementary-figures-tables.docx. The supplement related to this article is available online at https://doi.org/10.5194/acp-25-5287-2025-supplement.
AN designed the study and model simulations with support from AL and TB. TA performed the simulations with support from AN, AL and TB. AN has written the paper with input from AL, TB and TA. TA supported the article with a population-weighted ozone analysis.
At least one of the (co-)authors is a member of the editorial board of Atmospheric Chemistry and Physics. The peer-review process was guided by an independent editor, and the authors also have no other competing interests to declare.
Publisher's note: Copernicus Publications remains neutral with regard to jurisdictional claims made in the text, published maps, institutional affiliations, or any other geographical representation in this paper. While Copernicus Publications makes every effort to include appropriate place names, the final responsibility lies with the authors.
This article is part of the special issue “Tropospheric Ozone Assessment Report Phase II (TOAR-II) Community Special Issue (ACP/AMT/BG/GMD inter-journal SI)”. It is not associated with a conference.
The authors would like to thank Mark Lawrence, Louisa Emmons, Claire Granier, Jukka-Pekka Jalkanen, Jan Eiof Jonson and Mariano Mertens for their helpful discussions during the performance of our simulations and preparation of this paper. Simulations were performed on the high-performance supercomputing cluster GLIC at the GFZ, Potsdam.
This research has been supported by the Bundesministerium für Bildung und Forschung (grant no. 01US1701).
This paper was edited by Joshua Fu and reviewed by Michael Prather and two anonymous referees.
Archibald, A. T., Neu, J. L., Elshorbany, Y. F., Cooper, O. R., Young, P. J., Akiyoshi, H., Cox, R. A., Coyle, M., Derwent, R. G., Deushi, M., Finco, A., Frost, G. J., Galbally, I. E., Gerosa, G., Granier, C., Griffiths, P. T., Hossaini, R., Hu, L., Jöckel, P., Josse, B., Lin, M. Y., Mertens, M., Morgenstern, O., Naja, M., Naik, V., Oltmans, S., Plummer, D. A., Revell, L. E., Saiz-Lopez, A., Saxena, P., Shin, Y. M., Shahid, I., Shallcross, D., Tilmes, S., Trickl, T., Wallington, T. J., Wang, T., Worden, H. M., and Zeng, G.: Tropospheric Ozone Assessment Report: A critical review of changes in the tropospheric ozone burden and budget from 1850 to 2100, Elem. Sci. Anth., 8, 034, https://doi.org/10.1525/elementa.2020.034, 2020.
Avnery, S., Mauzerall, D. L., Liu, J., and Horowitz, L. W.: Global crop yield reductions due to surface ozone exposure: 1. Year 2000 crop production losses and economic damage, Atmos. Environ., 45, 2284–2296, 2011.
Bak, J., Song, E.-J., Lee, H.-J., Liu, X., Koo, J.-H., Kim, J., Jeon, W., Kim, J.-H., and Kim, C.-H.: Temporal variability of tropospheric ozone and ozone profiles in the Korean Peninsula during the East Asian summer monsoon: insights from multiple measurements and reanalysis datasets, Atmos. Chem. Phys., 22, 14177–14187, https://doi.org/10.5194/acp-22-14177-2022, 2022.
Butler, T., Lupascu, A., Coates, J., and Zhu, S.: TOAST 1.0: Tropospheric Ozone Attribution of Sources with Tagging for CESM 1.2.2, Geosci. Model Dev., 11, 2825–2840, https://doi.org/10.5194/gmd-11-2825-2018, 2018.
Butler, T., Lupascu, A., and Nalam, A.: Attribution of ground-level ozone to anthropogenic and natural sources of nitrogen oxides and reactive carbon in a global chemical transport model, Atmos. Chem. Phys., 20, 10707–10731, https://doi.org/10.5194/acp-20-10707-2020, 2020.
Butler, T. J., Vermeylen, F. M., Rury, M., Likens, G. E., Lee, B., Bowker, G. E., and McCluney, L.: Response of ozone and nitrate to stationary source NOx emission reductions in the eastern USA, Atmos. Environ., 45, 1084–1094, 2011.
Center for International Earth Science Information Network (CIESIN), Columbia University, 2018, Documentation for the Gridded Population of the World, Version 4 (GPWv4), Revision 11 Data Sets, Palisades NY, NASA Socioeconomic Data and Applications Center (SEDAC), https://doi.org/10.7927/H45Q4T5F, 2025.
Chameides, W. and Walker, J. C.: A photochemical theory of tropospheric ozone, J. Geophys. Res., 78, 8751–8760, 1973.
Chang, K.-L., Schultz, M. G., Koren, G., and Selke, N.: Guidance note on best statistical practices for TOAR analyses, arXiv [preprint], https://doi.org/10.48550/arXiv.2304.14236, 2023.
Chua, G., Naik, V., and Horowitz, L. W.: Exploring the drivers of tropospheric hydroxyl radical trends in the Geophysical Fluid Dynamics Laboratory AM4.1 atmospheric chemistry–climate model, Atmos. Chem. Phys., 23, 4955–4975, https://doi.org/10.5194/acp-23-4955-2023, 2023.
Coates, J. and Butler, T. M.: A comparison of chemical mechanisms using tagged ozone production potential (TOPP) analysis, Atmos. Chem. Phys., 15, 8795–8808, https://doi.org/10.5194/acp-15-8795-2015, 2015.
Cooper, O. R., Parrish, D. D., Ziemke, J., Balashov, N. V., Cupeiro, M., Galbally, I. E., Gilge, S., Horowitz, L., Jensen, N. R., Lamarque, J.-F., Naik, V., Oltmans, S. J., Schwab, J., Shindell, D. T., Thompson, A. M., Thouret, V., Wang, Y., and Zbinden, R. M.: Global distribution and trends of tropospheric ozone: An observation-based review, Elementa, 2, 000029, https://doi.org/10.12952/journal.elementa.000029, 2014.
Crippa, M., Guizzardi, D., Butler, T., Keating, T., Wu, R., Kaminski, J., Kuenen, J., Kurokawa, J., Chatani, S., Morikawa, T., Pouliot, G., Racine, J., Moran, M. D., Klimont, Z., Manseau, P. M., Mashayekhi, R., Henderson, B. H., Smith, S. J., Suchyta, H., Muntean, M., Solazzo, E., Banja, M., Schaaf, E., Pagani, F., Woo, J.-H., Kim, J., Monforti-Ferrario, F., Pisoni, E., Zhang, J., Niemi, D., Sassi, M., Ansari, T., and Foley, K.: The HTAP_v3 emission mosaic: merging regional and global monthly emissions (2000–2018) to support air quality modelling and policies, Earth Syst. Sci. Data, 15, 2667–2694, https://doi.org/10.5194/essd-15-2667-2023, 2023.
Crutzen, P. J.: Photochemical reactions initiated by and influencing ozone in unpolluted tropospheric air, Tellus, 26, 47–57, 1974.
Dahlmann, K., Grewe, V., Ponater, M., and Matthes, S.: Quantifying the contributions of individual NOx sources to the trend in ozone radiative forcing, Atmos. Environ., 45, 2860–2868, 2011.
Delang, M., Becker, J. S., Chang, K., Serre, M. L., Cooper, O. R., Schultz, M. G., Schröder, S., Lu, X., Zhang, L., Deushi, M., Josse, B., Keller, C. A., Lamarque, J., Lin, M., Liu, J., Marécal, V., Strode, S. A., Sudo, K., Tilmes, S., Zhang, L., Cleland, S. E., Collins, E. L., Brauer, M., and West, J. J.: Mapping yearly fine resolution global surface ozone through the Bayesian maximum entropy data fusion of observations and model output for 1990–2017, Environ. Sci. Technol., 55, 4389–4398, 2021.
Derwent, R. G., Utembe, S. R., Jenkin, M. E., and Shallcross, D. E.: Tropospheric ozone production regions and the intercontinental origins of surface ozone over Europe, Atmos. Environ., 112, 216–224, 2015.
Edwards, P. M. and Evans, M. J.: A new diagnostic for tropospheric ozone production, Atmos. Chem. Phys., 17, 13669–13680, https://doi.org/10.5194/acp-17-13669-2017, 2017.
Emmons, L. K., Hess, P. G., Lamarque, J.-F., and Pfister, G. G.: Tagged ozone mechanism for MOZART-4, CAM-chem and other chemical transport models, Geosci. Model Dev., 5, 1531–1542, https://doi.org/10.5194/gmd-5-1531-2012, 2012.
Emmons, L. K., Schwantes, R. H., Orlando, J. J., Tyndall, G., Kinnison, D., Lamarque, J.-F., Marsh, D., Mills, M. J., Tilmes, S., Bardeen, C., Buchholz, R. R., Conley, A., Gettelman, A., Garcia, R., Simpson, I., Blake, D. R., Meinardi, S., and Pétron, G.: The chemistry mechanism in the community earth system model version 2 (CESM2), J. Adv. Model. Earth Sy., 12, e2019MS001882, https://doi.org/10.1029/2019MS001882, 2020.
Fiore, A. M., Dentener, F. J., Wild, O., Cuvelier, C., Schultz, M. G., Hess, P., Textor, C., Schulz, M., Doherty, R. M., Horowitz, L. W., MacKenzie, I. A., Sanderson, M. G., Shindell, D. T., Stevenson, D. S., Szopa, S., Van Dingenen, R., Zeng, G., Atherton, C., Bergmann, D., Bey, I., Carmichael, G., Collins, W. J., Duncan, B. N., Faluvegi, G., Folberth, G., Gauss, M., Gong, S., Hauglustaine, D., Holloway, T., Isaksen, I. S. A., Jacob, D. J., Jonson, J. E., Kaminski, J. W., Keating, T. J., Lupu, A., Marmer, E., Montanaro, V., Park, R. J., Pitari, G., Pringle, K. J., Pyle, J. A., Schroeder, S., Vivanco, M. G., Wind, P., Wojcik, G., Wu, S., and Zuber, A.: Multimodel estimates of intercontinental source-receptor relationships for ozone pollution, J. Geophys. Res.-Atmos., 114, D04301, https://doi.org/10.1029/2008JD010816, 2009.
Fiore, A. M., Hancock, S. E., Lamarque, J.-F., Correa, G. P., Chang, K.-L., Ru, M., Cooper, O. R., Gaudel, A., Polvani, L. M., Sauvage, B., and Ziemke, J. R.: Understanding recent tropospheric ozone trends in the context of large internal variability: a new perspective from chemistry-climate model ensembles, Environmental Research: Climate, 1, 025008, https://doi.org/10.1088/2752-5295/ac9cc2, 2022.
Galmarini, S., Koffi, B., Solazzo, E., Keating, T., Hogrefe, C., Schulz, M., Benedictow, A., Griesfeller, J. J., Janssens-Maenhout, G., Carmichael, G., Fu, J., and Dentener, F.: Technical note: Coordination and harmonization of the multi-scale, multi-model activities HTAP2, AQMEII3, and MICS-Asia3: simulations, emission inventories, boundary conditions, and model output formats, Atmos. Chem. Phys., 17, 1543–1555, https://doi.org/10.5194/acp-17-1543-2017, 2017.
Gaudel, A., Cooper, O. R., Ancellet, G., Barret, B., Boynard, A., Burrows, J. P., Clerbaux, C., Coheur, P.-F., Cuesta, J., Cuevas, E., Doniki, S., Dufour, G., Ebojie, F., Foret, G., Garcia, O., Muños, M. J. G., Hannigan, J. W., Hase, F., Huang, G., Hassler, B., Hurtmans, D., Jaffe, D., Jones, N., Kalabokas, P., Kerridge, B., Kulawik, S. S., Latter, B., Leblanc, T., Flochmoën, E. L., Lin, W., Liu, J., Liu, X., Mahieu, E., McClure-Begley, A., Neu, J. L., Osman, M., Palm, M., Petetin, H., Petropavlovskikh, I., Querel, R., Rahpoe, N., Rozanov, A., Schultz, M. G., Schwab, J., Siddans, R., Smale, D., Steinbacher, M., Tanimoto, H., Tarasick, D. W., Thouret, V., Thompson, A. M., Trickl, T., Weatherhead, E., Wespes, C., Worden, H. M., Vigouroux, C., Xu, X., Zeng, G., and Ziemke, J.: Tropospheric Ozone Assessment Report: Present-day distribution and trends of tropospheric ozone relevant to climate and global atmospheric chemistry model evaluation, Elem. Sci. Anth., 6, 39, https://doi.org/10.1525/elementa.291, 2018.
Gaudel, A., Cooper, O. R., Chang, K.-L., Bourgeois, I., Ziemke, J. R., Strode, S. A., Oman, L. D., Sellitto, P., Nédélec, P., Blot, R., Thouret, V., and Granier, C.: Aircraft observations since the 1990s reveal increases of tropospheric ozone at multiple locations across the Northern Hemisphere, Science Advances, 6, eaba8272, https://doi.org/10.1126/sciadv.aba8272, 2020.
Granier, C., Bessagnet, B., Bond, T., D'Angiola, A., van der Gon, H. D., Frost, G. J., Heil, A., Kaiser, J. W., Kinne, S., Klimont, Z., Kloster, S., Lamarque, J.-F., Liousse, C., Masui, T., Meleux, F., Mieville, A., Ohara, T., Raut, J.-C., Riahi, K., Schultz, M. G., Smith, S. J., Thompson, A., van Aardenne, J., van der Werf, G. R., and van Vuuren, D. P.: Evolution of anthropogenic and biomass burning emissions of air pollutants at global and regional scales during the 1980–2010 period, Climatic Change, 109, 163–190, 2011.
Grewe, V., Tsati, E., and Hoor, P.: On the attribution of contributions of atmospheric trace gases to emissions in atmospheric model applications, Geosci. Model Dev., 3, 487–499, https://doi.org/10.5194/gmd-3-487-2010, 2010.
Grewe, V., Tsati, E., Mertens, M., Frömming, C., and Jöckel, P.: Contribution of emissions to concentrations: the TAGGING 1.0 submodel based on the Modular Earth Submodel System (MESSy 2.52), Geosci. Model Dev., 10, 2615–2633, https://doi.org/10.5194/gmd-10-2615-2017, 2017.
Griffiths, P. T., Murray, L. T., Zeng, G., Shin, Y. M., Abraham, N. L., Archibald, A. T., Deushi, M., Emmons, L. K., Galbally, I. E., Hassler, B., Horowitz, L. W., Keeble, J., Liu, J., Moeini, O., Naik, V., O'Connor, F. M., Oshima, N., Tarasick, D., Tilmes, S., Turnock, S. T., Wild, O., Young, P. J., and Zanis, P.: Tropospheric ozone in CMIP6 simulations, Atmos. Chem. Phys., 21, 4187–4218, https://doi.org/10.5194/acp-21-4187-2021, 2021.
Heald, C. L. and Kroll, J.: The fuel of atmospheric chemistry: Toward a complete description of reactive organic carbon, Science Advances, 6, eaay8967, https://doi.org/10.1126/sciadv.aay8967, 2020.
Hoor, P., Borken-Kleefeld, J., Caro, D., Dessens, O., Endresen, O., Gauss, M., Grewe, V., Hauglustaine, D., Isaksen, I. S. A., Jöckel, P., Lelieveld, J., Myhre, G., Meijer, E., Olivie, D., Prather, M., Schnadt Poberaj, C., Shine, K. P., Staehelin, J., Tang, Q., van Aardenne, J., van Velthoven, P., and Sausen, R.: The impact of traffic emissions on atmospheric ozone and OH: results from QUANTIFY, Atmos. Chem. Phys., 9, 3113–3136, https://doi.org/10.5194/acp-9-3113-2009, 2009.
Hou, X., Wild, O., Zhu, B., and Lee, J.: Future tropospheric ozone budget and distribution over east Asia under a net-zero scenario, Atmos. Chem. Phys., 23, 15395–15411, https://doi.org/10.5194/acp-23-15395-2023, 2023.
Hussain, M. and Mahmud, I.: pyMannKendall: a python package for non-parametric Mann Kendall family of trend tests., Journal of Open Source Software, 4, 1556, https://doi.org/10.21105/joss.01556, 2019.
Jonson, J. E., Schulz, M., Emmons, L., Flemming, J., Henze, D., Sudo, K., Tronstad Lund, M., Lin, M., Benedictow, A., Koffi, B., Dentener, F., Keating, T., Kivi, R., and Davila, Y.: The effects of intercontinental emission sources on European air pollution levels, Atmos. Chem. Phys., 18, 13655–13672, https://doi.org/10.5194/acp-18-13655-2018, 2018.
Junge, C. E.: Global ozone budget and exchange between stratosphere and troposphere, Tellus, 14, 363–377, 1962.
Kim, H. S., Kim, Y. H., Han, K. M., Kim, J., and Song, C. H.: Ozone production efficiency of a ship-plume: ITCT 2K2 case study, Chemosphere, 143, 17–23, 2016.
Kwok, R. H. F., Baker, K. R., Napelenok, S. L., and Tonnesen, G. S.: Photochemical grid model implementation and application of VOC, NOx, and O3 source apportionment, Geosci. Model Dev., 8, 99–114, https://doi.org/10.5194/gmd-8-99-2015, 2015.
Lamarque, J.-F., Emmons, L. K., Hess, P. G., Kinnison, D. E., Tilmes, S., Vitt, F., Heald, C. L., Holland, E. A., Lauritzen, P. H., Neu, J., Orlando, J. J., Rasch, P. J., and Tyndall, G. K.: CAM-chem: description and evaluation of interactive atmospheric chemistry in the Community Earth System Model, Geosci. Model Dev., 5, 369–411, https://doi.org/10.5194/gmd-5-369-2012, 2012.
Lan, X., Thoning, K. W., and Dlugokencky, E. J.: Trends in globally-averaged CH4, N2O, and SF6 determined from NOAA Global Monitoring Laboratory measurements. Version 2024-01, https://doi.org/10.15138/P8XG-AA10, 2024.
Lawrence, M. G. and Crutzen, P. J.: Influence of NOx emissions from ships on tropospheric photochemistry and climate, Nature, 402, 167–170, 1999.
Lawrence, M. G., Jöckel, P., and von Kuhlmann, R.: What does the global mean OH concentration tell us?, Atmos. Chem. Phys., 1, 37–49, https://doi.org/10.5194/acp-1-37-2001, 2001.
Lelieveld, J., Butler, T., Crowley, J., Dillon, T., Fischer, H., Ganzeveld, L., Harder, H., Lawrence, M., Martinez, M., Taraborrelli, D., and Williams, J.: Atmospheric oxidation capacity sustained by a tropical forest, Nature, 452, 737–740, 2008.
Levy II, H.: Photochemistry of the lower troposphere, Planet Space Sci., 20, 919–935, 1972.
Li, M., Kurokawa, J., Zhang, Q., Woo, J.-H., Morikawa, T., Chatani, S., Lu, Z., Song, Y., Geng, G., Hu, H., Kim, J., Cooper, O. R., and McDonald, B. C.: MIXv2: a long-term mosaic emission inventory for Asia (2010–2017), Atmos. Chem. Phys., 24, 3925–3952, https://doi.org/10.5194/acp-24-3925-2024, 2024.
Li, P., Yang, Y., Wang, H., Li, S., Li, K., Wang, P., Li, B., and Liao, H.: Source attribution of near-surface ozone trends in the United States during 1995–2019, Atmos. Chem. Phys., 23, 5403–5417, https://doi.org/10.5194/acp-23-5403-2023, 2023a.
Li, S., Yang, Y., Wang, H., Li, P., Li, K., Ren, L., Wang, P., Li, B., Mao, Y., and Liao, H.: Rapid increase in tropospheric ozone over Southeast Asia attributed to changes in precursor emission source regions and sectors, Atmos. Environ., 304, 119776, https://doi.org/10.1016/j.atmosenv.2023.119776, 2023b.
Lin, X., Trainer, M., and Liu, S.: On the nonlinearity of the tropospheric ozone production, J. Geophys. Res.-Atmos., 93, 15879–15888, 1988.
Liu, Z., Doherty, R. M., Wild, O., O'Connor, F. M., and Turnock, S. T.: Tropospheric ozone changes and ozone sensitivity from the present day to the future under shared socio-economic pathways, Atmos. Chem. Phys., 22, 1209–1227, https://doi.org/10.5194/acp-22-1209-2022, 2022.
Lupaşcu, A. and Butler, T.: Source attribution of European surface O3 using a tagged O3 mechanism, Atmos. Chem. Phys., 19, 14535–14558, https://doi.org/10.5194/acp-19-14535-2019, 2019.
Lupaşcu, A., Otero, N., Minkos, A., and Butler, T.: Attribution of surface ozone to NOx and volatile organic compound sources during two different high ozone events, Atmos. Chem. Phys., 22, 11675–11699, https://doi.org/10.5194/acp-22-11675-2022, 2022.
Malashock, D. A., DeLang, M. N., Becker, J. S., Serre, M. L., West, J. J., Chang, K.-L., Cooper, O. R., and Anenberg, S. C.: Estimates of ozone concentrations and attributable mortality in urban, peri-urban and rural areas worldwide in 2019, Environ. Res. Lett., 17, 054023, https://doi.org/10.1088/1748-9326/ac66f3, 2022.
McDuffie, E. E., Sarofim, M. C., Raich, W., Jackson, M., Roman, H., Seltzer, K., Henderson, B. H., Shindell, D. T., Collins, M., Anderton, J., Barr, S., and Fann, N.: The Social Cost of Ozone-Related Mortality Impacts From Methane Emissions, Earths Future, 11, e2023EF003853, https://doi.org/10.1029/2023EF003853, 2023.
Mertens, M., Grewe, V., Rieger, V. S., and Jöckel, P.: Revisiting the contribution of land transport and shipping emissions to tropospheric ozone, Atmos. Chem. Phys., 18, 5567–5588, https://doi.org/10.5194/acp-18-5567-2018, 2018.
Mertens, M., Kerkweg, A., Grewe, V., Jöckel, P., and Sausen, R.: Attributing ozone and its precursors to land transport emissions in Europe and Germany, Atmos. Chem. Phys., 20, 7843–7873, https://doi.org/10.5194/acp-20-7843-2020, 2020.
Mertens, M., Brinkop, S., Graf, P., Grewe, V., Hendricks, J., Jöckel, P., Lanteri, A., Matthes, S., Rieger, V. S., Righi, M., and Thor, R. N.: The contribution of transport emissions to ozone mixing ratios and methane lifetime in 2015 and 2050 in the Shared Socioeconomic Pathways (SSPs), Atmos. Chem. Phys., 24, 12079–12106, https://doi.org/10.5194/acp-24-12079-2024, 2024.
Mills, G., Pleijel, H., Malley, C. S., Sinha, B., Cooper, O. R., Schultz, M. G., Neufeld, H. S., Simpson, D., Sharps, K., Feng, Z., and Gerosa, G.: Tropospheric Ozone Assessment Report: Present-day tropospheric ozone distribution and trends relevant to vegetation, Elem. Sci. Anth., 6, 47, https://doi.org/10.1525/elementa.302, 2018.
Miyazaki, K., Bowman, K., Sekiya, T., Takigawa, M., Neu, J. L., Sudo, K., Osterman, G., and Eskes, H.: Global tropospheric ozone responses to reduced NOx emissions linked to the COVID-19 worldwide lockdowns, Science Advances, 7, eabf7460, https://doi.org/10.1126/sciadv.abf7460, 2021.
Molod, A., Takacs, L., Suarez, M., and Bacmeister, J.: Development of the GEOS-5 atmospheric general circulation model: evolution from MERRA to MERRA2, Geosci. Model Dev., 8, 1339–1356, https://doi.org/10.5194/gmd-8-1339-2015, 2015.
Monks, P. S., Archibald, A. T., Colette, A., Cooper, O., Coyle, M., Derwent, R., Fowler, D., Granier, C., Law, K. S., Mills, G. E., Stevenson, D. S., Tarasova, O., Thouret, V., von Schneidemesser, E., Sommariva, R., Wild, O., and Williams, M. L.: Tropospheric ozone and its precursors from the urban to the global scale from air quality to short-lived climate forcer, Atmos. Chem. Phys., 15, 8889–8973, https://doi.org/10.5194/acp-15-8889-2015, 2015.
Myhre, G., Shindell, D., Bréon, F.-M., Collins, W., Fuglestvedt, J., Huang, J., Koch, D., Lamarque, J.-F., Lee, D., Mendoza, B., Nakajima, T., Robock, A., Stephens, G., Takemura, T., and Zhang, H.: Anthropogenic and Natural Radiative Forcing, in: Climate Change 2013: The Physical Science Basis. Contribution of Working Group I to the Fifth Assessment Report of the Intergovernmental Panel on Climate Change, edited by: Stocker, T., Qin, D., Plattner, G.-K., Tignor, M., Allen, S., Boschung, J., Nauels, A., Xia, Y., Bex, V., and Midgley, P., Cambridge University Press, Cambridge, United Kingdom and New York, NY, USA, 659–740, https://doi.org/10.1017/CBO9781107415324.018, 2013.
Prather, M. J.: Time scales in atmospheric chemistry: Theory, GWPs for CH4 and CO, and runaway growth, Geophys. Res. Lett., 23, 2597–2600, 1996.
Schneider, P. and Van Der A, R.: A global single-sensor analysis of 2002–2011 tropospheric nitrogen dioxide trends observed from space, J. Geophys. Res.-Atmos., 117, D16309, https://doi.org/10.1029/2012JD017571, 2012.
Schultz, M. G., Schröder, S., Lyapina, O., Cooper, O., Galbally, I., Petropavlovskikh, I., Schneidemesser, E. V., Tanimoto, H., Elshorbany, Y., Naja, M., Seguel, R., Dauert, U., Eckhardt, P., Feigenspahn, S., Fiebig, M., Hjellbrekke, A.-G., Hong, Y.-D., Kjeld, P. C., Koide, H., Lear, G., Tarasick, D., Ueno, M., Wallasch, M., Baumgardner, D., Chuang, M.-T., Gillett, R., Lee, M., Molloy, S., Moolla, R., Wang, T., Sharps, K., Adame, J. A., Ancellet, G., Apadula, F., Artaxo, P., Barlasina, M., Bogucka, M., Bonasoni, P., Chang, L., Colomb, A., Cuevas, E., Cupeiro, M., Degorska, A., Ding, A., Fröhlich, M., Frolova, M., Gadhavi, H., Gheusi, F., Gilge, S., Gonzalez, M. Y., Gros, V., Hamad, S. H., Helmig, D., Henriques, D., Hermansen, O., Holla, R., Huber, J., Im, U., Jaffe, D. A., Komala, N., Kubistin, D., Lam, K.-S., Laurila, T., Lee, H., Levy, I., Mazzoleni, C., Mazzoleni, L., McClure-Begley, A., Mohamad, M., Murovic, M., Navarro-Comas, M., Nicodim, F., Parrish, D., Read, K. A., Reid, N., Ries, L., Saxena, P., Schwab, J. J., Scorgie, Y., Senik, I., Simmonds, P., Sinha, V., Skorokhod, A., Spain, G., Spangl, W., Spoor, R., Springston, S. R., Steer, K., Steinbacher, M., Suharguniyawan, E., Torre, P., Trickl, T., Weili, L., Weller, R., Xu, X., Xue, L., and Zhiqiang, M.: Tropospheric Ozone Assessment Report: Database and metrics data of global surface ozone observations, Elem. Sci. Anth., 5, 58, https://doi.org/10.1525/elementa.244, 2017.
Seinfeld, J. H and Pandis, S.: Atmospheric Chemistry and Physics, 3rd Edn., Wiley, ISBN 9781118947401, 2016.
Sindelarova, K., Markova, J., Simpson, D., Huszar, P., Karlicky, J., Darras, S., and Granier, C.: Copernicus Atmosphere Monitoring Service Global Biogenic VOC emissions version 3.0 (CAMS-GLOB-BIO v3.0), ECCAD, https://doi.org/10.24380/xs64-gj42, 2021.
Stevenson, D. S., Zhao, A., Naik, V., O'Connor, F. M., Tilmes, S., Zeng, G., Murray, L. T., Collins, W. J., Griffiths, P. T., Shim, S., Horowitz, L. W., Sentman, L. T., and Emmons, L.: Trends in global tropospheric hydroxyl radical and methane lifetime since 1850 from AerChemMIP, Atmos. Chem. Phys., 20, 12905–12920, https://doi.org/10.5194/acp-20-12905-2020, 2020.
Sudo, K. and Akimoto, H.: Global source attribution of tropospheric ozone: Long-range transport from various source regions, J. Geophys. Res.-Atmos., 112, D12302, https://doi.org/10.1029/2006JD007992, 2007.
Szopa, S., Naik, V., Adhikary, B., Artaxo, P., Berntsen, T., Collins, W. D., Fuzzi, S., Gallardo, L., Kiendler-Scharr, A., Klimont, Z., Liao, H., Unger, N., and Zanis, P.: Short-Lived Climate Forcers, in: Climate Change: The Physical Science Basis. Contribution of Working Group I to the Sixth Assessment Report of the Intergovernmental Panel on Climate Change, edited by: Masson-Delmotte, V., Zhai, P., Pirani, A., Connors, S. L., Péan, C., Berger, S., Caud, N., Chen, Y., Goldfarb, L., Gomis, M. I., Huang, M., Leitzell, K., Lonnoy, E., Matthews, J. B. R., Maycock, T. K., Waterfield, T., Yelekçi, O., Yu, R., and Zhou, B., Cambridge University Press, Cambridge, United Kingdom and New York, NY, USA, 817–922, https://doi.org/10.1017/9781009157896.008, 2021.
Taylor, K. E.: Summarizing multiple aspects of model performance in a single diagram, J. Geophys. Res.-Atmos., 106, 7183–7192, 2001.
Tilmes, S., Lamarque, J.-F., Emmons, L. K., Conley, A., Schultz, M. G., Saunois, M., Thouret, V., Thompson, A. M., Oltmans, S. J., Johnson, B., and Tarasick, D.: Technical Note: Ozonesonde climatology between 1995 and 2011: description, evaluation and applications, Atmos. Chem. Phys., 12, 7475–7497, https://doi.org/10.5194/acp-12-7475-2012, 2012.
Tilmes, S., Lamarque, J.-F., Emmons, L. K., Kinnison, D. E., Ma, P.-L., Liu, X., Ghan, S., Bardeen, C., Arnold, S., Deeter, M., Vitt, F., Ryerson, T., Elkins, J. W., Moore, F., Spackman, J. R., and Val Martin, M.: Description and evaluation of tropospheric chemistry and aerosols in the Community Earth System Model (CESM1.2), Geosci. Model Dev., 8, 1395–1426, https://doi.org/10.5194/gmd-8-1395-2015, 2015.
van der Werf, G. R., Randerson, J. T., Giglio, L., Collatz, G. J., Mu, M., Kasibhatla, P. S., Morton, D. C., DeFries, R. S., Jin, Y., and van Leeuwen, T. T.: Global fire emissions and the contribution of deforestation, savanna, forest, agricultural, and peat fires (1997–2009), Atmos. Chem. Phys., 10, 11707–11735, https://doi.org/10.5194/acp-10-11707-2010, 2010.
Vinken, G. C. M., Boersma, K. F., Jacob, D. J., and Meijer, E. W.: Accounting for non-linear chemistry of ship plumes in the GEOS-Chem global chemistry transport model, Atmos. Chem. Phys., 11, 11707–11722, https://doi.org/10.5194/acp-11-11707-2011, 2011.
Voulgarakis, A., Naik, V., Lamarque, J.-F., Shindell, D. T., Young, P. J., Prather, M. J., Wild, O., Field, R. D., Bergmann, D., Cameron-Smith, P., Cionni, I., Collins, W. J., Dalsøren, S. B., Doherty, R. M., Eyring, V., Faluvegi, G., Folberth, G. A., Horowitz, L. W., Josse, B., MacKenzie, I. A., Nagashima, T., Plummer, D. A., Righi, M., Rumbold, S. T., Stevenson, D. S., Strode, S. A., Sudo, K., Szopa, S., and Zeng, G.: Analysis of present day and future OH and methane lifetime in the ACCMIP simulations, Atmos. Chem. Phys., 13, 2563–2587, https://doi.org/10.5194/acp-13-2563-2013, 2013.
Wang, W., Parrish, D. D., Wang, S., Bao, F., Ni, R., Li, X., Yang, S., Wang, H., Cheng, Y., and Su, H.: Long-term trend of ozone pollution in China during 2014–2020: distinct seasonal and spatial characteristics and ozone sensitivity, Atmos. Chem. Phys., 22, 8935–8949, https://doi.org/10.5194/acp-22-8935-2022, 2022.
West, J. J., Fiore, A. M., Naik, V., Horowitz, L. W., Schwarzkopf, M. D., and Mauzerall, D. L.: Ozone air quality and radiative forcing consequences of changes in ozone precursor emissions, Geophys. Res. Lett., 34, L06806, https://doi.org/10.1029/2006GL029173, 2007.
Wild, O., Prather, M. J., and Akimoto, H.: Indirect long-term global radiative cooling from NOx emissions, Geophys. Res. Lett., 28, 1719–1722, 2001.
Young, P. J., Archibald, A. T., Bowman, K. W., Lamarque, J.-F., Naik, V., Stevenson, D. S., Tilmes, S., Voulgarakis, A., Wild, O., Bergmann, D., Cameron-Smith, P., Cionni, I., Collins, W. J., Dalsøren, S. B., Doherty, R. M., Eyring, V., Faluvegi, G., Horowitz, L. W., Josse, B., Lee, Y. H., MacKenzie, I. A., Nagashima, T., Plummer, D. A., Righi, M., Rumbold, S. T., Skeie, R. B., Shindell, D. T., Strode, S. A., Sudo, K., Szopa, S., and Zeng, G.: Pre-industrial to end 21st century projections of tropospheric ozone from the Atmospheric Chemistry and Climate Model Intercomparison Project (ACCMIP), Atmos. Chem. Phys., 13, 2063–2090, https://doi.org/10.5194/acp-13-2063-2013, 2013.
Young, P. J., Naik, V., Fiore, A. M., Gaudel, A., Guo, J., Lin, M. Y., Neu, J. L., Parrish, D. D., Rieder, H. E., Schnell, J. L., Tilmes, S., Wild, O., Zhang, L., Ziemke, J. R., Brandt, J., Delcloo, A., Doherty, R. M., Geels, C., Hegglin, M. I., Hu, L., Im, U., Kumar, R., Luhar, A., Murray, L., Plummer, D., Rodriguez, J., Saiz-Lopez, A., Schultz, M. G., Woodhouse, M. T., and Zeng, G.: Tropospheric Ozone Assessment Report: Assessment of global-scale model performance for global and regional ozone distributions, variability, and trends, Elem. Sci. Anth., 6, 10, https://doi.org/10.1525/elementa.265, 2018.
Zhang, Y., Cooper, O. R., Gaudel, A., Thompson, A. M., Nédélec, P., Ogino, S.-Y., and West, J. J.: Tropospheric ozone change from 1980 to 2010 dominated by equatorward redistribution of emissions, Nat. Geosci., 9, 875–879, 2016.
Zhang, Y., West, J. J., Emmons, L. K., Flemming, J., Jonson, J. E., Lund, M. T., Sekiya, T., Sudo, K., Gaudel, A., Chang, K.-L., Nédélec, P., and Thouret, V.: Contributions of world regions to the global tropospheric ozone burden change from 1980 to 2010, Geophys. Res. Lett., 48, e2020GL089184, https://doi.org/10.1029/2020GL089184, 2021.
Zhao, Y., Li, Y., Kumar, A., Ying, Q., Vandenberghe, F., and Kleeman, M. J.: Separately resolving NOx and VOC contributions to ozone formation, Atmos. Environ., 285, 119224, https://doi.org/10.1016/j.atmosenv.2022.119224, 2022.
Zheng, B., Tong, D., Li, M., Liu, F., Hong, C., Geng, G., Li, H., Li, X., Peng, L., Qi, J., Yan, L., Zhang, Y., Zhao, H., Zheng, Y., He, K., and Zhang, Q.: Trends in China's anthropogenic emissions since 2010 as the consequence of clean air actions, Atmos. Chem. Phys., 18, 14095–14111, https://doi.org/10.5194/acp-18-14095-2018, 2018.