the Creative Commons Attribution 4.0 License.
the Creative Commons Attribution 4.0 License.
 | 16 May 2025
Spatially separate production of hydrogen oxides and nitric oxide in lightning
William H. Brune
The atmosphere's most important oxidizer, the hydroxyl radical (OH), is generated in abundance by lightning, but the contribution of this electrically generated OH (LOH) to global OH oxidation needs to be better quantified. Part of the uncertainty in this contribution is due to the abundant nitric oxide (NO) also generated in lightning, which rapidly removes the LOH before it can oxidize other pollutants in the atmosphere. However, atmospheric observations and a previous laboratory study show extreme LOH coexists with extreme NO. The only way this electrically generated HOx (LHOx) can possibly survive is if LOH production is spatially separated from the NO production in lightning flashes and laboratory sparks. This hypothesis of spatially separate OH and NO production is further tested here in a series of laboratory experiments, where the OH decays were measured from spark discharges in air which had increasing amounts of NO added to it. The LOH decayed faster as more NO was added to the air, indicating that the LOH was reacting with the added NO and not the spark NO. Thus, LOH from lightning flashes is not immediately consumed by the electrically generated NO but is available to oxidize other pollutants in the atmosphere and contribute to global OH oxidation. Subsequent modeling of the laboratory data also supports the spatially separate production of LOH and NO and further suggests that substantial HONO may also be produced by sparks and lightning in the atmosphere.
- Article
(4207 KB) - Full-text XML
-
Supplement
(1091 KB) - BibTeX
- EndNote


Lightning and other electrical discharges have been shown to directly generate extreme amounts of the atmosphere's primary oxidant the hydroxyl radical (OH) and the closely related hydroperoxyl radical (HO2) in field studies (Brune et al., 2021, 2022), laboratory studies (Jenkins et al., 2021; Ono and Oda, 2002), and modeling studies (Bhetanabhotla et al., 1985; Ripoll et al., 2014). The first reported field measurements of electrically generated OH and HO2 (together called the hydrogen oxides or HOx) were from the Deep Convective Clouds and Chemistry campaign in 2012, where as much as ∼ 2 ppbv of electrically generated HOx (LHOx) was measured (Brune et al., 2021). Subsequent laboratory studies showed that both lightning and weaker cloud electrical discharges, called corona discharges, were generating the extreme amounts of LHOx and that LHOx was initially generated as equal amounts of electrically generated OH (LOH) and LHO2 (Jenkins et al., 2021). Based on these studies, lightning and corona discharges in thunderstorms are together estimated to account for as much as 2 %–16 % of global OH. However, narrowing down the uncertainty of this range will require more work. The frequency, duration, and location of corona discharges are not well known, complicating attempts to estimate global OH production from these discharges.
In comparison, it is accepted that lightning flashes occur at a rate of 44 s−1 globally (Christian et al., 2003), last <1 s (Rakov and Uman, 2006), and are mostly detected by satellites and lightning networks. The extreme amount of nitrogen oxide (NO) also generated in lightning makes estimating the impact of LHOx difficult, as theoretically this NO will rapidly remove the extreme OH before it oxidizes other chemical species in the atmosphere, such as methane, carbon monoxide, sulfur dioxide, or other pollutants. However, evidence from a previous laboratory study shows that LHOx is not immediately destroyed by electrically generated NO (LNO). In Jenkins et al. (2021), laboratory sparks were generated inside a flow tube, and the subsequent LNO and LHOx formed from these discharges were measured. Hundreds of parts per trillion by volume (pptv) of LHOx were observed to decay over hundreds of milliseconds, while simultaneously 1–2 ppmv of LNO was also measured. When these same measurements of LHOx and LNO from the laboratory experiments were input into a photochemical box model, the Framework for 0-D Atmospheric Modeling (F0AM) (Wolfe et al., 2016) with the Master Chemical Mechanism (MCM) v3.3.1 (Jenkin et al., 2015), the model predicted that LNO should have titrated all LHOx away in less than 10 ms, a small percentage of the hundreds of milliseconds over which the LHOx decay was actually observed. It is unlikely that this discrepancy is due to some unimagined chemistry considering how well studied this chemistry is. Therefore, the only logical conclusion is that LHOx generation and LNO generation are spatially separated for the spark, preventing their immediate reaction.
Spatially separate production is possible due to the structure of and different types of energy present in lightning flashes and sparks. At the center of a lightning flash is a ∼ 1–2 cm diameter core (Rakov and Uman, 2006) with air temperatures exceeding 30 000 K (Orville, 1968a). Surrounding this hot core is a weaker area of electrical discharge, called the corona sheath. The air temperature in the corona sheath is near ambient, and the electrical discharges from the sheath extend radially several meters from the hot core (Rakov and Uman, 2006), so the ratio of the volume of the corona sheath to the volume of the core is at least 104:1. Some of the radiation emitted by lightning flashes is in the ultraviolet (UV) range, composed of both broad spectrum and line emissions (Orville, 1968b) and including wavelengths <300 nm that are emitted from the sun but normally not present in the troposphere due to their absorption in the higher levels of the atmosphere by ozone. This UV radiation is generated by both the hot core and the corona sheath. The reach of the UV radiation depends on the wavelength and scattering that the radiation encounters but can be as much as tens of meters. Sparks are essentially a smaller-scale version of lightning flashes, still composed of a hot core (though not as hot as lightning) surrounded by a weaker and cooler corona sheath and emitting UV radiation (though not as much as lightning).
The differences between the core and corona sheath lead to different chemistry occurring in each area. For example, the extremely high temperatures of the lightning flash or spark core are required to dissociate stable N2 and make the extreme amounts of NO present in lightning flashes via the Zel'dovich mechanism (Chameides et al., 1977):
The air cools down rapidly after the lightning flash, removing the energy required for the reverse reactions to convert NO back to N2 and O2 faster than these reactions can occur. As a result, elevated NO remains after the lightning flash is completed.
Conversely, without the high temperatures, the corona sheath makes several orders of magnitude less LNO (Rehbein and Cooray, 2001; Bhetanabhotla et al., 1985), so less than 1 % of the spark NO is made outside the core. However, large amounts of OH, though not HO2, are also made by combustion at the high temperatures of the core (Dyer and Crosley, 1982; Bhetanabhotla et al., 1985; Ripoll et al., 2014), while both OH and HO2 are made through multiple pathways in the corona sheath. These pathways include, for example, OH-forming reactions like or (Bruggeman and Schram, 2010); reactions that form HO2 like (M denotes N2 or O2); or UV radiation that directly dissociates water vapor at wavelengths <200 nm, directly producing equal amounts of OH and HO2:
In short, LNO production is contained in the very narrow hot core, while HOx production occurs in both the hot core and a volume extending several meters outside the hot core in the corona sheath. Thus, spatially separate LHOx production and LNO production are possible.
To further test the hypothesis that LHOx production and LNO production are spatially separated in spark discharges, we conducted a series of laboratory experiments in which the LOH and LHO2 decays from spark discharges in air were measured with different amounts of background NO added into the airflow, from 0 ppbv up to 1000 ppbv of added NO. The decays from the laboratory experiments are also compared to decays calculated by F0AM with MCM to see if the model can successfully reproduce these decays. If LHOx decays faster as the background NO mixing ratio is increased, then LHOx is mostly or entirely reacting with background NO instead of spark LNO, confirming that LHOx generation and LNO generation are spatially separated in the spark. Otherwise, if the LHOx decays are unaffected by the amount of added NO, then LHOx mostly or entirely reacts with spark LNO, LHOx and LNO are likely generated in the same location, and some unimagined chemistry causes the discrepancy between the model and measurement.
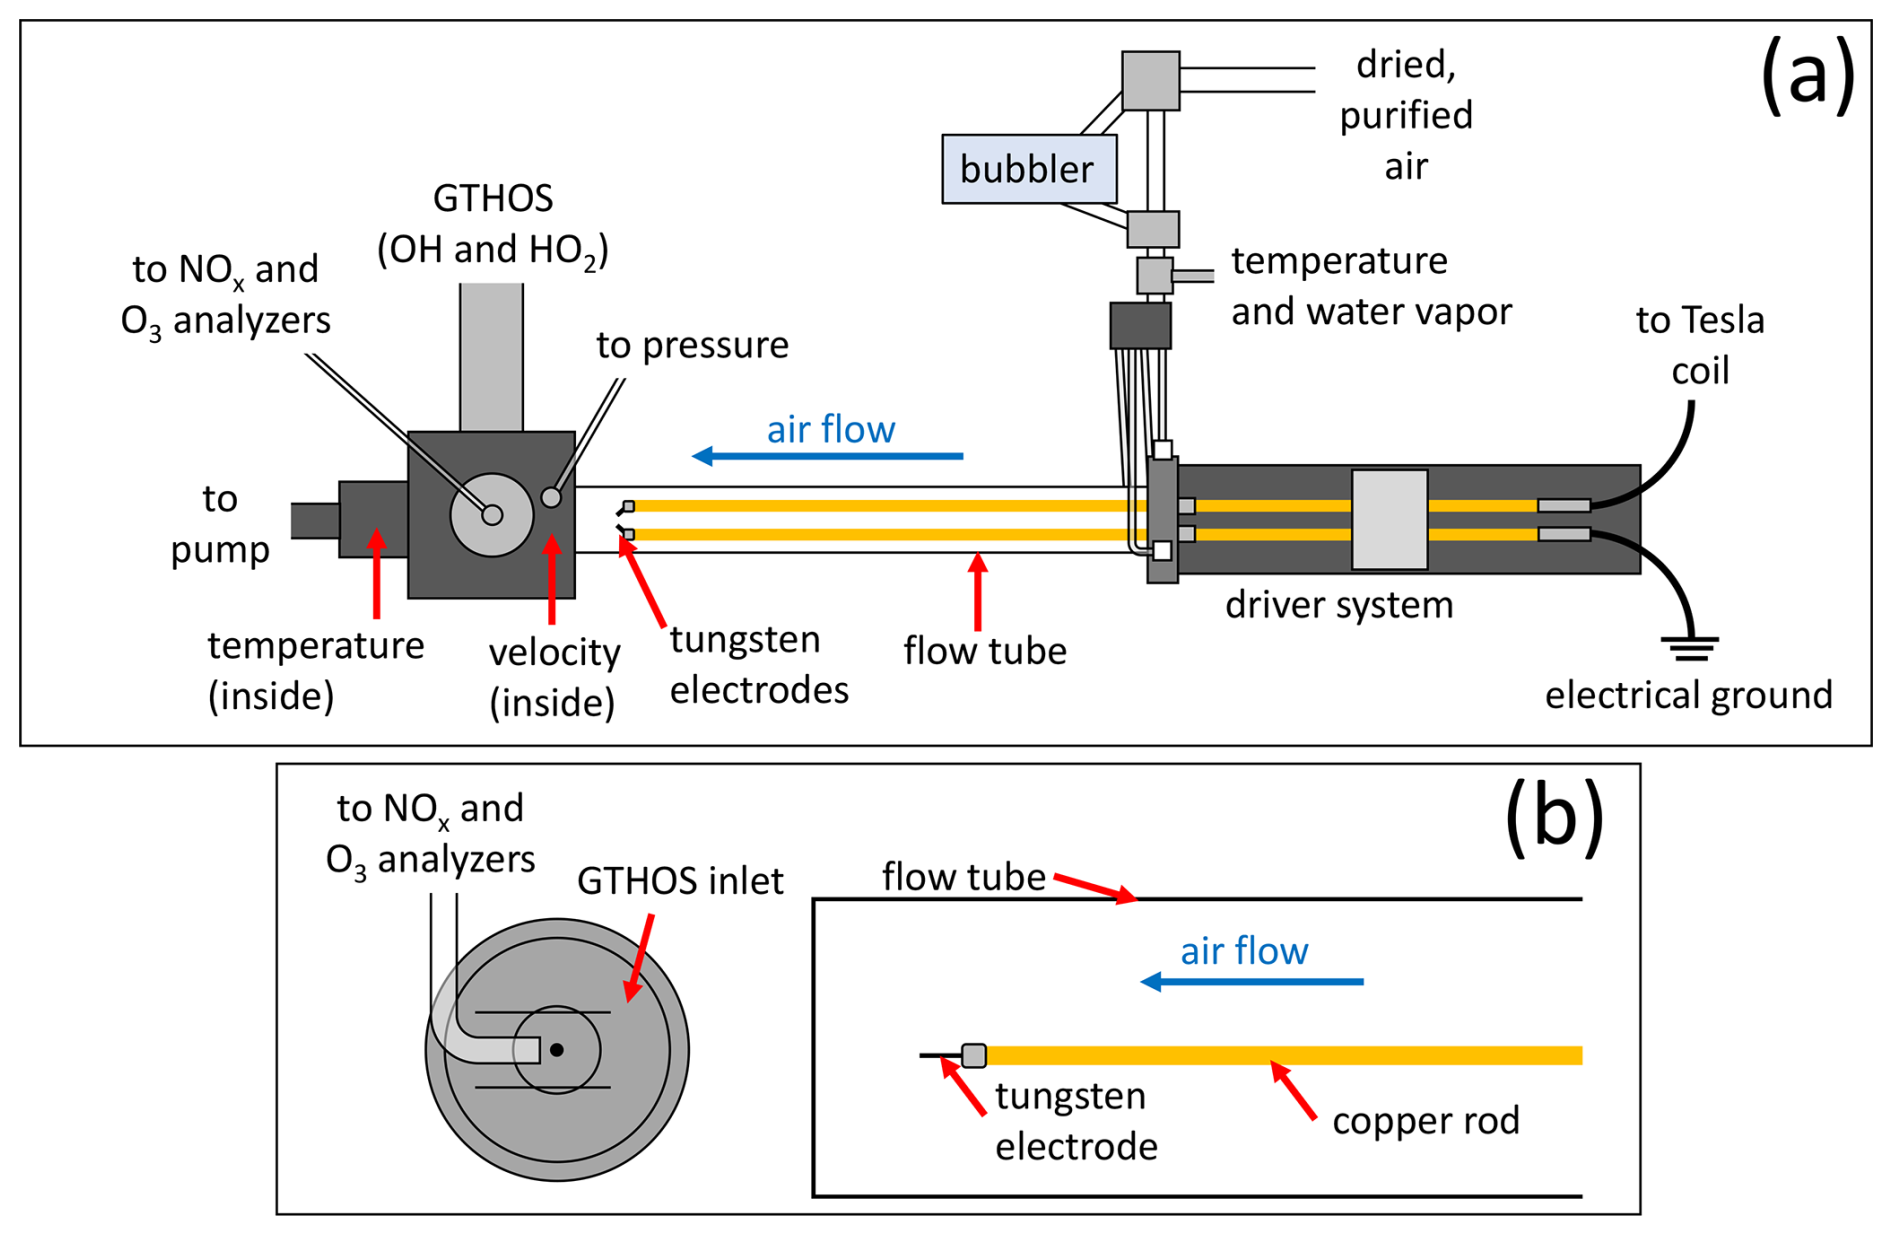
Figure 1(a) Top-down diagram of the laboratory experimental setup showing the key components. (b) Side view showing a close-up of the GTHOS inlet and Teflon line leading to the NOx and O3 analyzers, which sample from the same volume as GTHOS in a 1.3 cm diameter tube placed over the GTHOS inlet (shown as two horizontal lines), along with the relative positions of the flow tube, copper rod, and tungsten electrode. Neither (a) nor (b) is shown to scale.
2.1 Laboratory experimental setup
The laboratory setup was nearly identical to the setup used in our previous LHOx studies (Jenkins et al., 2021; Jenkins and Brune, 2023). Purified and dried air, with an OH reactivity of ∼ 0.35 s−1 (Brune and Jenkins, 2024), was flowed through a bubbler to add a controlled amount of water vapor, then mixed with dry air that flowed down a quartz (previously Pyrex®) tube (50 mm o.d. ×46 mm i.d. ×105 cm) at 50 standard liters per minute (slpm); through spark discharges; and over to instruments for measuring OH and HO2 (Ground-based Tropospheric Hydrogen Oxides Sensor (GTHOS); Faloona et al., 2004), NO–NO2–NOx (ECO PHYSICS nCLD 855Y), and O3 (Kalnajs and Avallone, 2010). A solid-state Tesla coil (Eastern Voltage Research, Plasmasonic® 1.3) was used to generate the sparks across a 0.7 cm gap between tungsten wire electrodes (0.10 cm diameter) inside the flow tube. The sparks were generated in packets of 10 sparks, with ∼ 75 ms between each spark in the packet, as signals from individual sparks were too narrow to consistently measure even at the 5 Hz sampling rate of GTHOS. The NOx analyzer collected data at a rate of 2 Hz, and the O3 analyzer collected data at a rate of 1 Hz. Each electrode was attached to a copper rod; one copper rod was attached via a copper wire cable to the output toroid of the Tesla coil, while the other was attached to an electrical ground. All discharges were generated using the same Tesla coil settings. Pressure (MKS Baratron® type 222) was monitored ahead of the inlet for GTHOS and the Teflon tubing leading to the NOx and O3 analyzers, temperature was measured both before air entered the flow tube (Vaisala HMT310) and as the air exited (thermistor), and the water vapor mixing ratio (Vaisala HMT310) was also measured before the air entered the flow tube. The air velocity was measured with an anemometer (TSI Inc., 8455-09) before running experiments, and the flow in the tube was previously determined to be laminar that was not fully developed (Jenkins et al., 2021). A short piece of Teflon tubing (1.3 cm diameter × 2.5 cm long) was placed on the GTHOS inlet, and the opening of the Teflon tube leading to the NOx and O3 analyzers was positioned ∼ 2 mm downstream of the GTHOS opening and facing into the short piece of Teflon tubing. This arrangement ensured that GTHOS and the NOx and O3 analyzers all sampled from the same volume. The absolute uncertainty and limit of detection at the 68 % confidence level were ±20 % and ∼ 1 pptv for the HOx measurements from GTHOS, ±10 % and ∼ 1–3 ppbv for the NOx measurements, and ±5 % and ∼ 20 ppbv for the O3 measurements. A diagram of the laboratory setup is shown in Fig. 1.
As in real lightning, the core of the sparks is small relative to the volume available for the corona sheath and ultraviolet radiation to occupy. Based on the visible light, the spark core is estimated to be ∼ 1 mm in diameter across the 0.7 cm spark gap, so the core volume occupies ∼ 0.006 cm3. Assuming a ratio of corona sheath to core in the sparks that is similar to that present in lightning, then the spark corona sheath can occupy a volume as large as 55 cm3 with a radius of 5 cm, although the 4.6 cm inner diameter of the flow tube will be the actual cutoff point for the corona sheath. We can detect the UV radiation from the spark discharges with a spectrometer placed outside of the flow tube, so the UV radiation travels well beyond the spark core. The air that the NO instrument samples through a 4 m long, 0.25 in. Teflon line is well mixed, indicating that the actual core NO is much higher than measured. However, GTHOS pulls 6 slpm, and thus each 0.2 s measurement contains a volume of surrounding air hundreds of times larger than the ∼ 0.006 cm3 volume of core air. Because GTHOS is right at the exit of the flow tube and the flow is laminar and 50 slpm, molecular diffusion mixes the core air into a volume less than 1 cm3 at the longest reaction time of ∼ 0.5 s. Thus, GTHOS samples both core air and sheath air, but they are spatially separated in the flow tube when sampled.
The experiments were conducted as follows. To capture the LHOx decay, the copper rods were moved by a driver system so that discharges were generated at five different positions in the flow tube, over a total distance of 27.5 cm. In each position, four spark packets were generated, with 5 s spacing between each packet. For one of the four spark packets, the laser on GTHOS was switched to a wavelength slightly off the OH absorption wavelength to confirm the absence of electrical interference in the OH and HO2 signals. By moving the discharge, the distance between the discharge and instrument inlets was changed, which also changed the time between the LHOx generation and measurement, producing the LHOx decay over time. The different amounts of added NO in the system were created by adding NO (Linde, 4.83 ppm) to the airflow before it entered the flow tube to create mixing ratios of 0, 50, 100, 250, 500, or 1000 ppbv (all within ±6 %). Because lightning can occur at any pressure in the troposphere, data were collected at pressures of 970, 770, 570, and 360 hPa (all within ±2 %) to cover most of the tropospheric pressures. Data were also collected at water vapor mixing ratios between 2000–2400 ppmv and temperatures between 289–294 K.
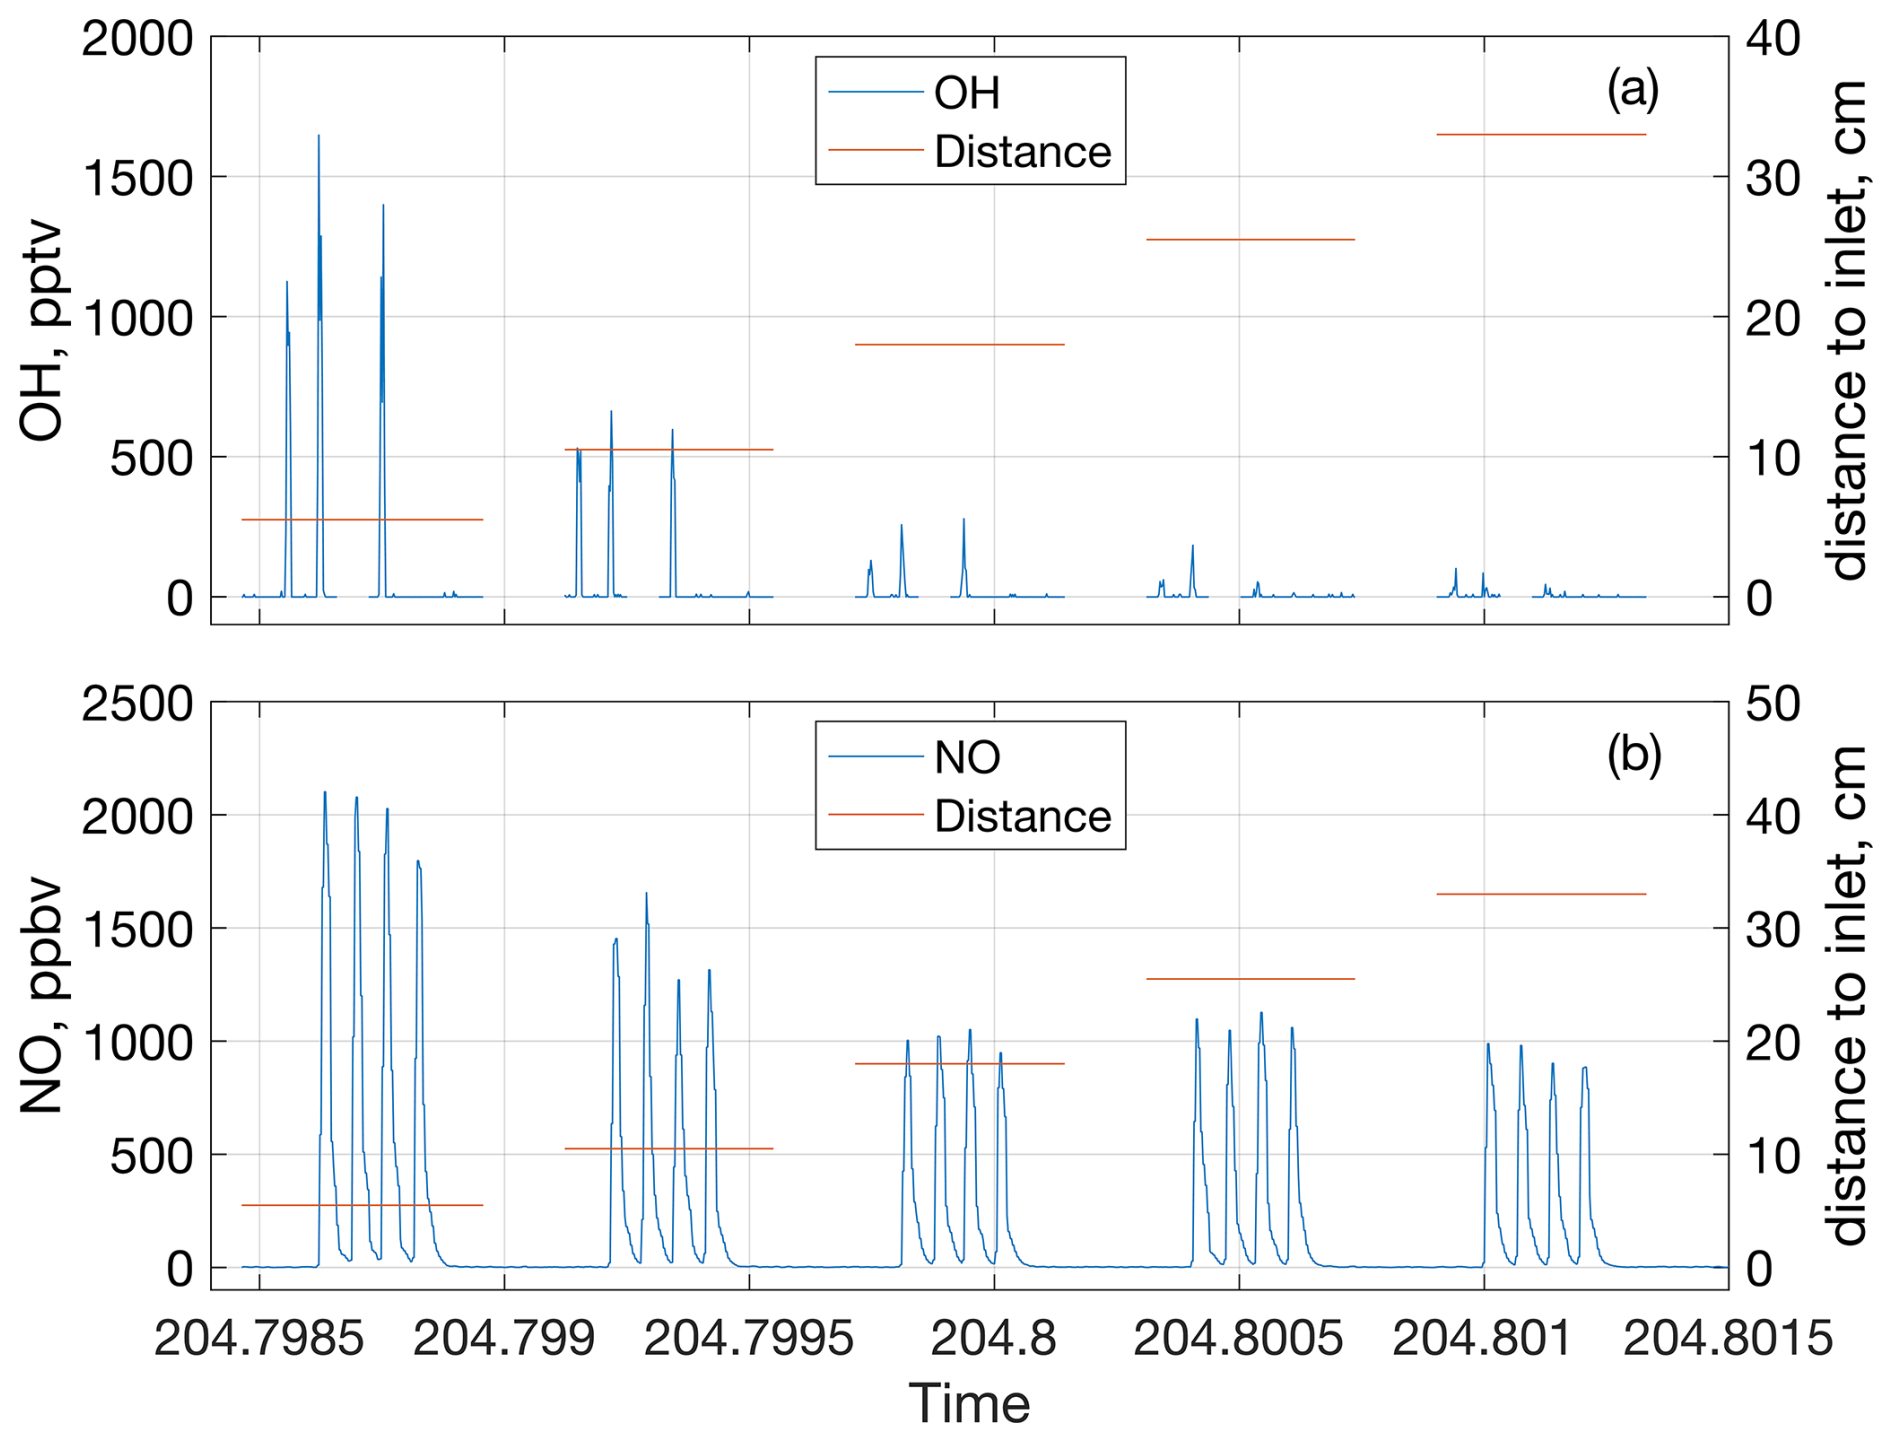
Figure 2Change in OH (a) and NO (b) mixing ratios due to the spark discharges at each of the five discharge positions at 770 hPa and 0 ppbv of added NO. Each peak is from one spark packet containing 10 sparks. OH and NO mixing ratios are indicated by the blue lines and use the y axes on the left side of their respective subplots, while the distances from the discharge to the GTHOS inlet and Teflon line leading to the NOx analyzer are indicated by the orange lines and use the y axes on the right side. Time is in fractional day of year.
Normally GTHOS uses two detection axes to simultaneously measure OH and HO2, but only one detection axis was available when these experiments were conducted. To obtain both OH and HO2 measurements for these experiments, OH was measured in a set of experiments and total HOx was measured in another set of experiments conducted under the same conditions. The average OH measured at each position was subtracted from the total HOx generated at the same position and collected under the same conditions to determine the HO2 generated.
2.2 Laboratory data processing
Each 10-spark discharge packet created a single spike in the OH, HO2, NO, and NOx signals. Figure 2 shows the OH and NO signals from the spark packets over time for one experiment. No O3 was detected in these experiments. These spikes were integrated over time to determine the total amount of chemicals generated by the spark discharge. For the OH and HO2 measurements, the peaks were about ∼ 1.2 s wide and were integrated over 2.2 s, while the NO and NOx peaks were ∼ 4.8 s wide and were also integrated over 4.8 s. From previous tests, it has been shown that only about 85 % of the generated LNOx is sampled (Jenkins et al., 2021), so the LNO and LNO2 results were corrected upwards 15 % to account for the LNOx that was not sampled. OH and HO2 have similar diffusion coefficients to NOx (Tang et al., 2014), so OH and HO2 were also corrected upwards 15 % to account for sampling. Additionally, the lifetime of NOx is long relative to the time it spends in the flow tube (hours vs. <0.5 s, respectively), so any change in the NOx mixing ratio across the different positions was assumed to come from diffusion and not chemical loss. The average change in NOx over the different discharge positions in the flow tube is shown in Fig. S1 in the Supplement for all four pressures tested. The LOH and LHO2 measurements were also corrected upwards based on the NOx diffusion to account for diffusion losses.
Both the LOH and the LHO2 decays were fitted with equations assuming constant, first-order losses. These equations were extrapolated back to time zero to determine the initial amount of these species generated in the discharge. In some experiments, the HOx decay was fast enough that the HOx data became too scant and imprecise to use at farther discharge positions in the flow tube. If at least three positions had clear OH and HO2 signals, the decay was included in the results; if only two positions or fewer were available, the data were not used in the results, as there was not enough confidence in the extrapolated fit. Consequently, not all pressures have results for all the different amounts of added NO.
The initial LNOx formed in the discharges was taken as the LNOx in the position closest to the instrument inlets as it was least affected by diffusion. NO2 made up <10 % of total NOx.
2.3 Model setup
The modeling experiments were conducted using F0AM v3 with MCM 3.3.1 chemistry. The laboratory data were collected in 10-spark packets, but the chemical measurements were scaled down to single-spark equivalents before inputting them into the model. The reason for scaling down is twofold. First, even at the slowest speed in the flow tube, one spark will travel ∼ 7 cm before the next one occurs, and previous work has shown that the HOx and NOx measurements scale proportionally to the number of sparks in the packet (Jenkins et al., 2021), indicating that the chemicals generated by sparks within a packet do not likely overlap. Second, due to the nonlinear chemistry between HOx and NOx, we cannot assume that any modeling done with 10 sparks will scale simply to a single spark. Therefore, because each spark within a packet can be treated as an independent event, the modeling was done using HOx and NOx values scaled down to a single spark.
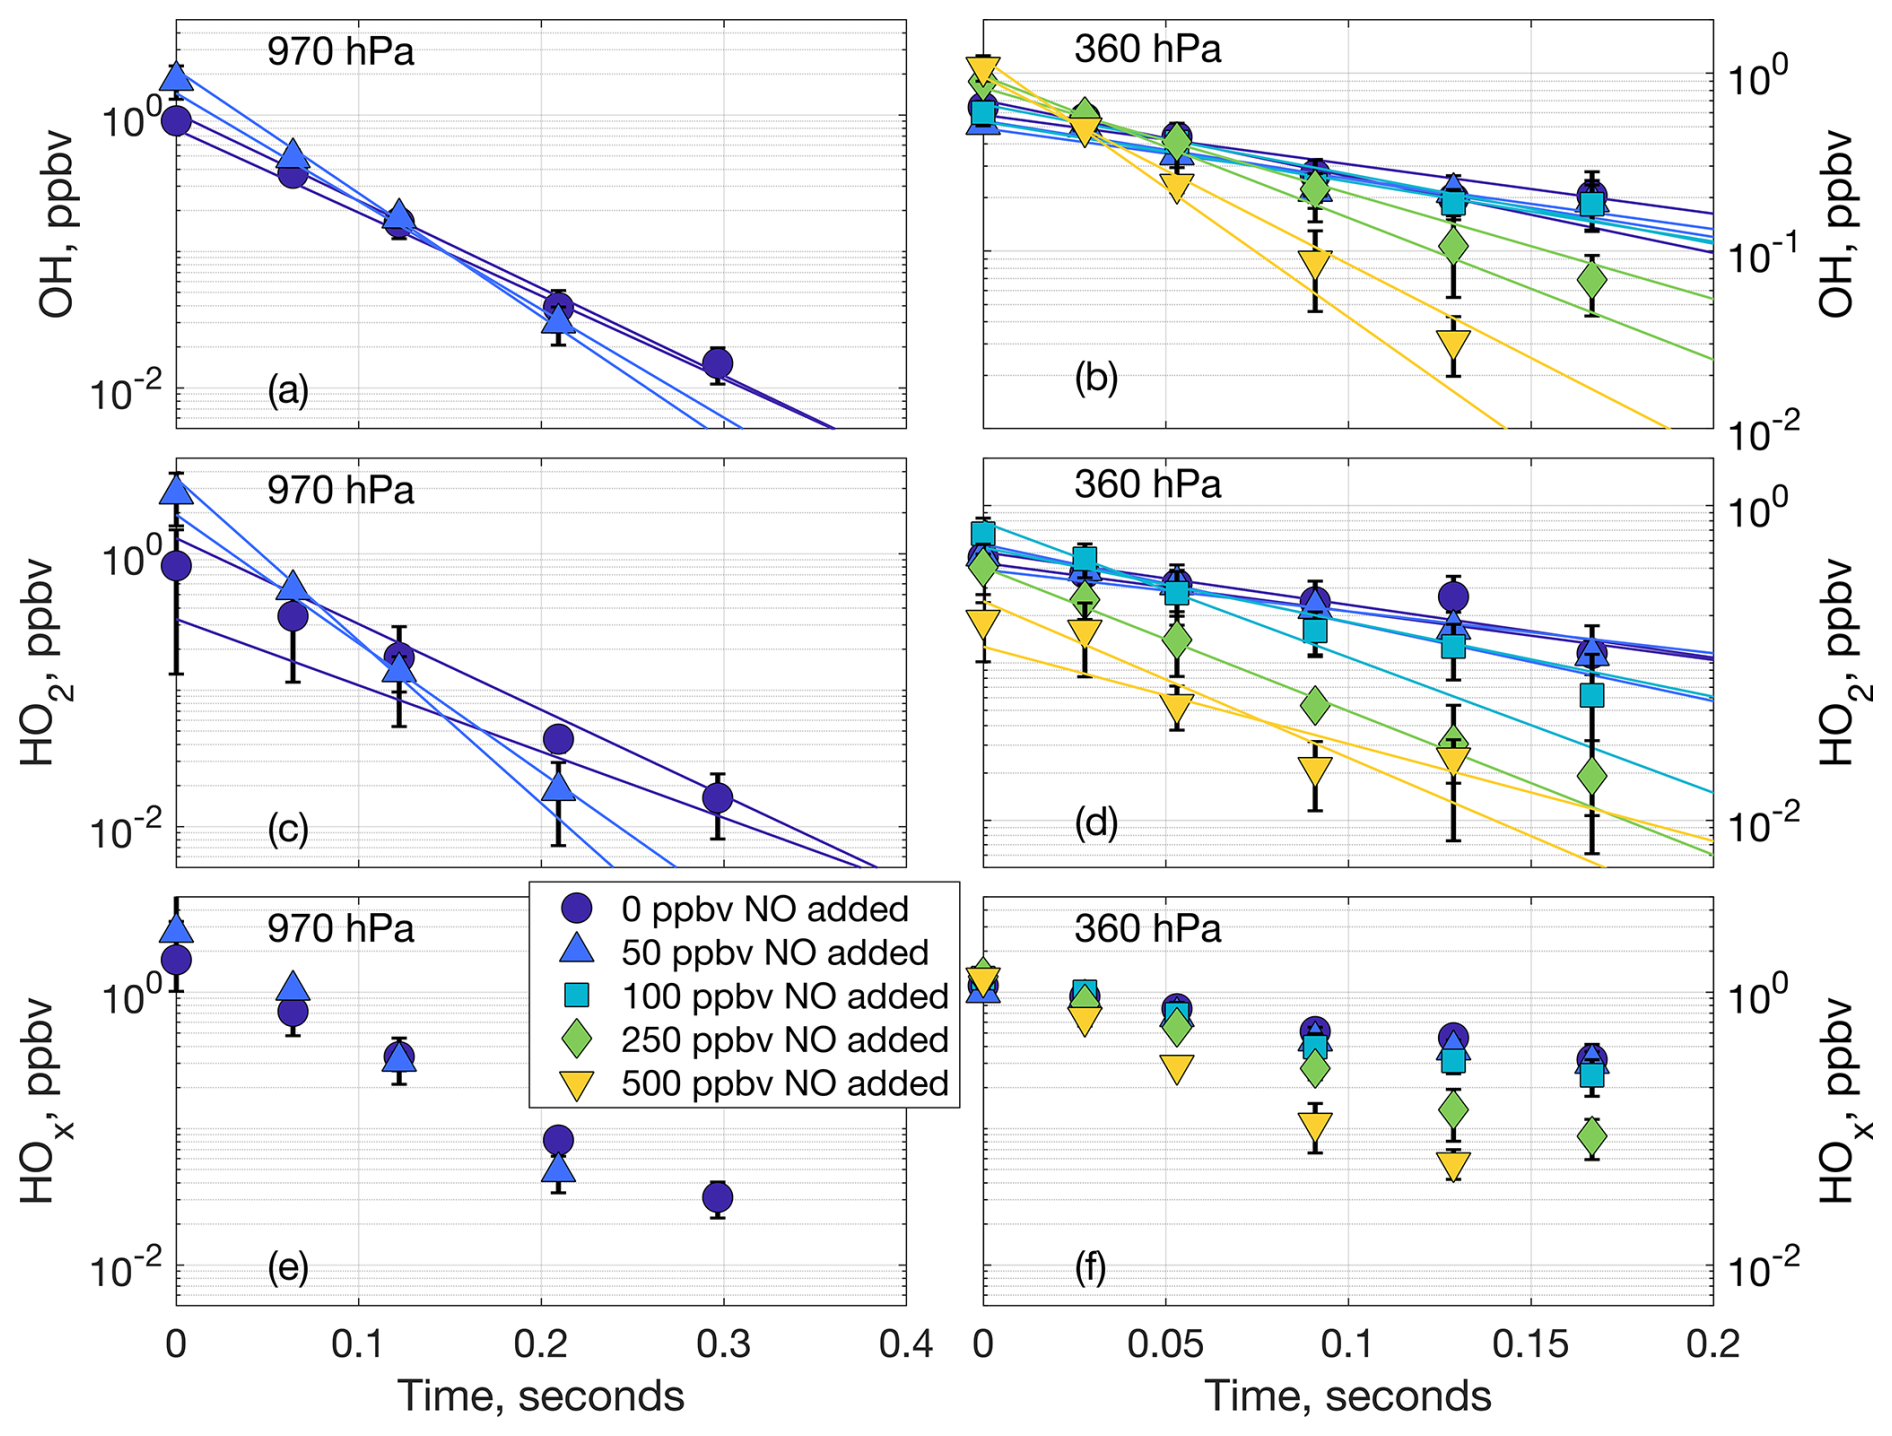
Figure 3Laboratory decays of OH (a, b), HO2 (c, d), and net HOx (e, f) at 970 hPa (a, c, e) and 360 hPa (b, d, f). The markers are the averaged data points containing three or six measurements from one or two laboratory experiments, respectively. The markers at time zero are the averaged extrapolated values from the decays. The lines in (a), (b), (c), and (d) are the linear fits to the individual decays. Error bars are the standard deviation from averaging the multiple laboratory measurements.
The initial OH and HO2 determined from the extrapolation of the laboratory decays, scaled down 10-fold, were chosen as the initial OH and HO2 (respectively) for the model runs. Using this same initial HOx, three cases using different amounts of initial NOx were tested. In the first case, only the added NO was included in the model, and no spark NOx was included. In the second case, the added NO as well as all the spark NOx was included, and in the third case, the added NO as well as only a small percentage of the spark NOx was included. The purified air used in the laboratory experiments was found to contain ∼ 20 ppbv of CO (Thermo Scientific, 48i-TLE), which was also included in all the model experiments, along with wall loss at a rate of 0.9 s−1 for OH (no wall loss was observed for HO2). Model tests confirmed that even if up to 20 ppbv of O3 (our limit of detection) had been generated in the laboratory experiments, it would not have significantly affected the HOx decays, so O3 was not included in any of the model runs shown here. The model experiments were set to simulate 0.5 s of reaction time, enough to cover the longest reaction timescale of the laboratory experiments, using the same pressure, temperature, and water vapor as the laboratory experiments, and included no dilution.
3.1 Laboratory results
As an increasing amount of NO was added to the airflow in the laboratory experiments, the OH and HO2 decays became progressively steeper, as shown Fig. 3 (970 and 360 hPa), Fig. S2 (770 and 570 hPa), and Fig. S3 (average slopes for all experiments). In other words, both OH and HO2 decayed faster as more NO was added to the airflow. This dependence of the OH and HO2 decays on the added NO indicates that LHOx reacts mostly with the added NO and little or not at all with the spark NOx, supporting the hypothesis that the HOx we measure from spark and lightning discharges is produced separately from the spark NOx. The average LNOx generated in the laboratory experiments is shown in Fig. S4.
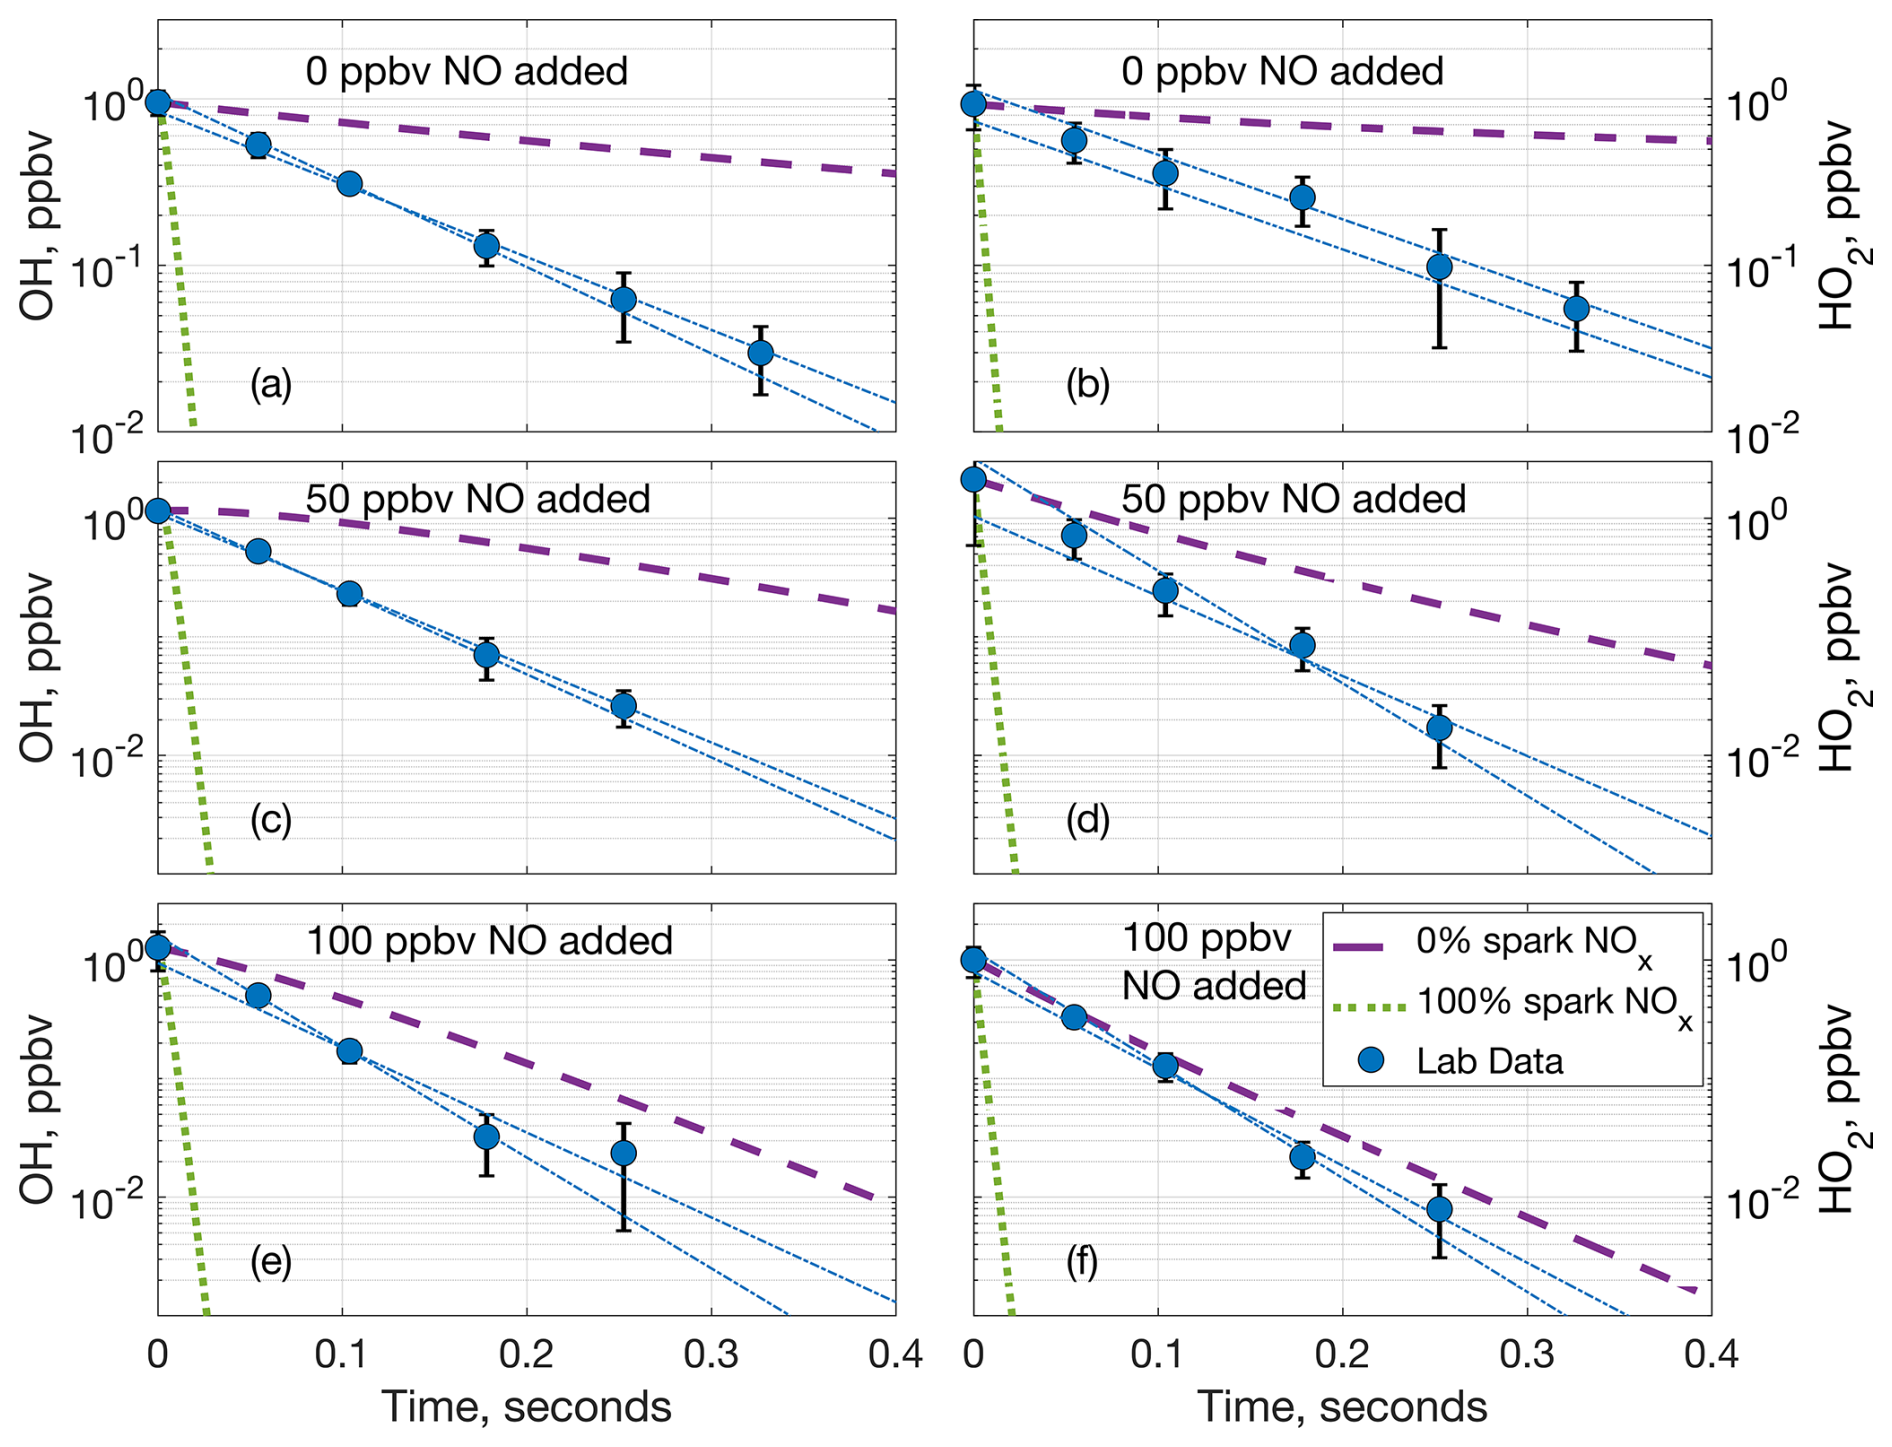
Figure 4Comparison of measured OH (a, c, e) and HO2 (b, d, f) laboratory decays and two model decays at 770 hPa and (a, b) 0 ppbv of added NO, (c, d) 50 ppbv of added NO, and (e, f) 100 ppbv of added NO. The dashed purple lines are the model decay with only the added NO and no NOx from the spark, and the dotted green lines are the model decay with the added NO and all of the spark NOx. The blue circles are the average laboratory measurements and average extrapolated value at time zero, while the dashed–dotted blue lines are the individual extrapolated linear fits to the laboratory data. Error bars are the standard deviation from averaging multiple measurements.
3.2 Laboratory versus model decays
Comparing the laboratory OH decays to the model decays from F0AM not only further supports the separate production of LHOx and LNO, but also indicates that LHOx and LNO or other chemical products from the spark discharges likely interact. For example, at 770 hPa and 0 ppbv of added NO, the laboratory LHOx measurements decay neither as fast as when 100 % of the spark NOx is added to the model nor as slowly as when no spark NOx is added to the model (Fig. 4a, b). If LHOx and LNOx were generated in the same place, the laboratory LHOx decays would match the model decay with 100 % LNOx included, and if LHOx and LNOx did not interact at all, the laboratory decays would match the 0 % LNOx model case. The laboratory decays falling in between the two model runs indicate that LHOx either partially interacts with LNOx or interacts with some other product(s) from the sparks.
As the background NO was increased, the gap between the laboratory decay and 0 % LNOx model case decreased (Fig. 4c, d), and this gap decreased further as more background NO was added (Fig. 4e, f). This decrease in the difference between the laboratory and the model decays is likely because as the background NO was increased, it accounted for an increasing amount of the HOx reactivity compared to the spark products. This increasing agreement between the model and laboratory decays as the added NO was increased can be seen at 970, 570, and 360 hPa as well (Figs. S5, S6, S7, respectively) and is another indicator that LHOx is mostly made separately from the LNOx made in the spark hot channel.
3.3 Improving the measurement–model agreement
The agreement between the laboratory and model decays was at its worst when 0 ppbv of NO was added in the laboratory experiments. As these cases are also the most relevant to the atmosphere, trying to resolve this disagreement can also give insight into lightning chemistry in the atmosphere.
When we first observed this measured–modeled discrepancy in Jenkins et al. (2021), we were able to resolve the discrepancy for both OH and HO2 by including just 0.5 % of the spark NOx in a model run. However, the model in the previous study was initialized using the full 10-spark-packet data and also did not include the OH wall loss. Here, adding 3 % of the spark NOx to the model (amounting to 61.6, 62.8, 69.9, and 90.7 ppbv of NOx at 970, 770, 570, and 360 hPa, respectively) brings agreement within uncertainty to the laboratory HO2 data, but the OH data are still overestimated by the model (Fig. S8). Adding 5 % (104, 105, and 117 ppbv at 970, 770, and 570 hPa, respectively) or 10 % (303 ppbv at 360 hPa) of LNOx instead brings measured–modeled agreement for OH, but the HO2 data are then consistently underpredicted by the model (Fig. S9). There is no amount of LNOx that can match the OH and HO2 measurements simultaneously, leaving some chemistry still unaccounted for in the model.
Adding ∼ 10 s−1 of OH reactivity into the model along with 3 % LNOx can resolve the discrepancy (Fig. S10) within uncertainty. What chemical species could be responsible for this reactivity? In addition to the HOx, NOx, and O3 we measured, many other species are generated in sparks as well, including atoms, ions, and excited states such as O, N, H, N, O(1D), and O−; other molecules that are primary products of the discharge, like N2O and CO; and secondary products formed from reactions between or within the first two categories, like H2O2, HONO, and NO2 (Bhetanabhotla et al., 1985; Boldi, 1992; Ripoll et al., 2014). For one (or more) of these species to account for the missing reactivity, it must fulfill a few criteria. First, its lifetime needs to be long enough that it is still present over the time frame in which we measure the HOx decays, at least 0.2–0.5 s post-discharge. Second, it needs to react with OH in the same 0.2–0.5 s time frame, so it must either react with OH quickly or be present in large enough quantities to compensate for a slow reaction rate. Third, it must spatially overlap with the LHOx we measure, so either it is produced in the corona sheath and/or UV radiation or it is produced in large amounts in the hot core, with ∼ 3 % mixing out as we think LNOx is doing. Lastly, the reaction between OH and this species must not produce HO2. The mismatch between the model and measurements is because OH is overpredicted by the model relative to HO2. If the reaction between OH and the missing species yields HO2, then instead of increasing the OH loss rate, OH will be quickly recycled through the reaction .
Neither of the first two categories of species, the atoms, ions, and excited states or the other primary molecules, can account for the missing reactivity in the model. The lifetime of the atoms, ions, and excited states species will be too short to affect the HOx decays over 0.2–0.5 s, failing the first criterion. On the other hand, the primary products CO and N2O fail the second criterion. Both species are longer-lived than the first category, but their reactions with OH are relatively slow, and not enough of these species will be produced to compensate. For example, only about ∼ 340 ppbv of N2O is expected to be made in the combined hot core and corona sheath of a lightning flash (Brandvold et al., 1989, 1996; Donohoe et al., 1977; Hill et al., 1984; Levine et al., 1979), but ∼ 11 000 ppmv would need to be produced in the laboratory sparks to compensate for a reaction rate of cm3 molec.−1 s−1 (Biermann et al., 1976). The reaction between CO and OH is faster, with cm3 molec.−1 s−1 at 970 hPa in F0AM, and only ∼ 1.8 ppmv of CO is needed to satisfy the missing reactivity in the model. But this 1.8 ppmv is ∼ 12 % of the 14.6 ppmv of CO expected to be made in the lightning hot core (Bhetanabhotla et al., 1985; Levine et al., 1979), and it is unlikely that the laboratory sparks make as much CO as a lightning flash. The reaction of CO and OH also produces HO2, leading to OH recycling.
The secondary discharge products are long-lived enough to still exist 0.2–0.5 s after the discharge, and their reaction rates with OH are faster than the rates with the primary products, so fewer of them are required to satisfy the missing reactivity compared to the primary products. Still, modeling results indicate that at most ∼ 400 ppbv of H2O2 is generated in the lightning hot channel, and if only 3 % of the hot channel mixes out, then this will not be enough to satisfy the ∼ 250 ppbv of H2O2 needed to account for the missing OH reactivity in the sparks based on the reaction rate of cm3 molec.−1 s−1 from F0AM. Additionally, the reaction of OH and H2O2 produces HO2. For NO2, we have already included 3 % of what we measure in the laboratory experiments in the model runs, which amounts to <10 ppbv of NO2.
Table 1Comparison of the averaged NO and NO2 measured in the laboratory experiments and the predicted NO, NO2, and HONO from a model run starting with 4 ppmv of LNO and 2.8 ppmv of LOH.
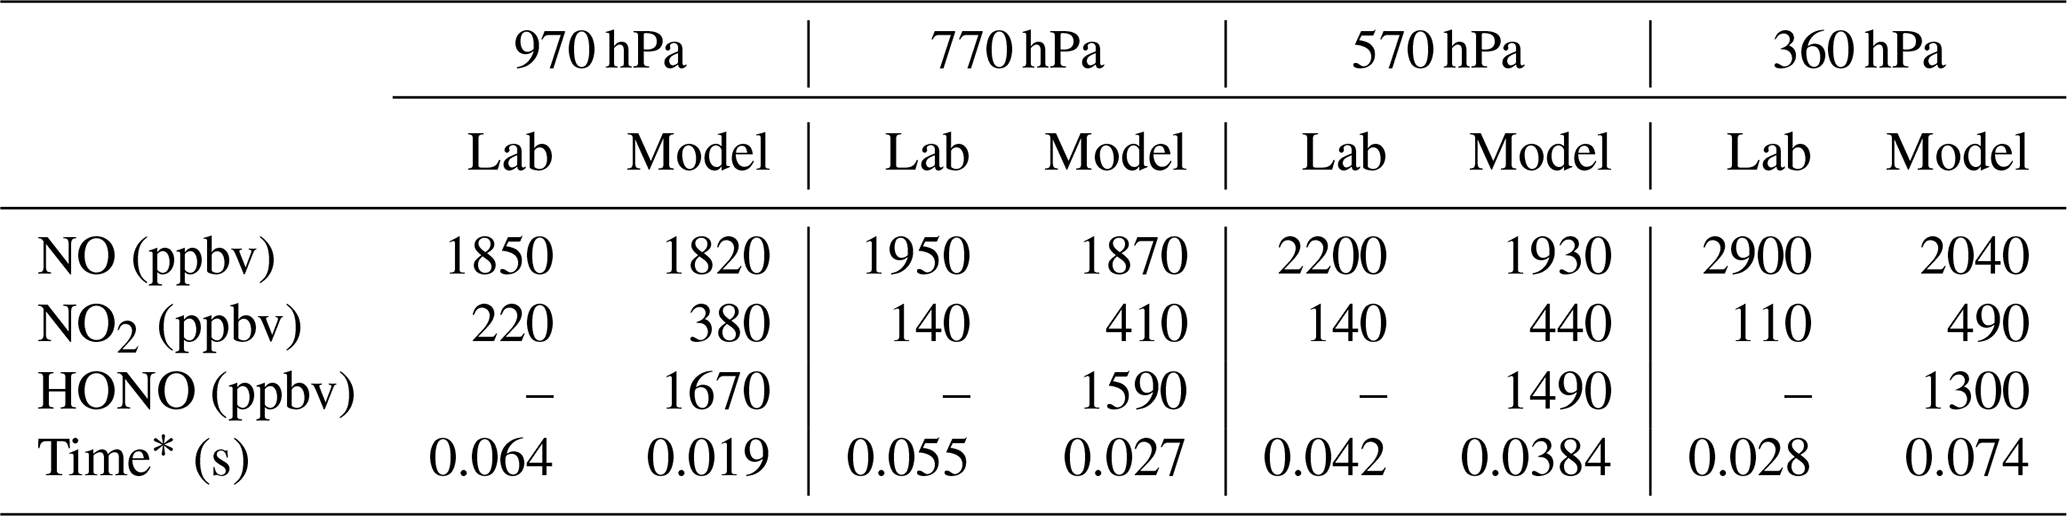
* For the laboratory data, time is when the first HOx measurement is made post-spark. For the model data, time is when OH has been titrated to <1 pptv, our limit of detection in these experiments.
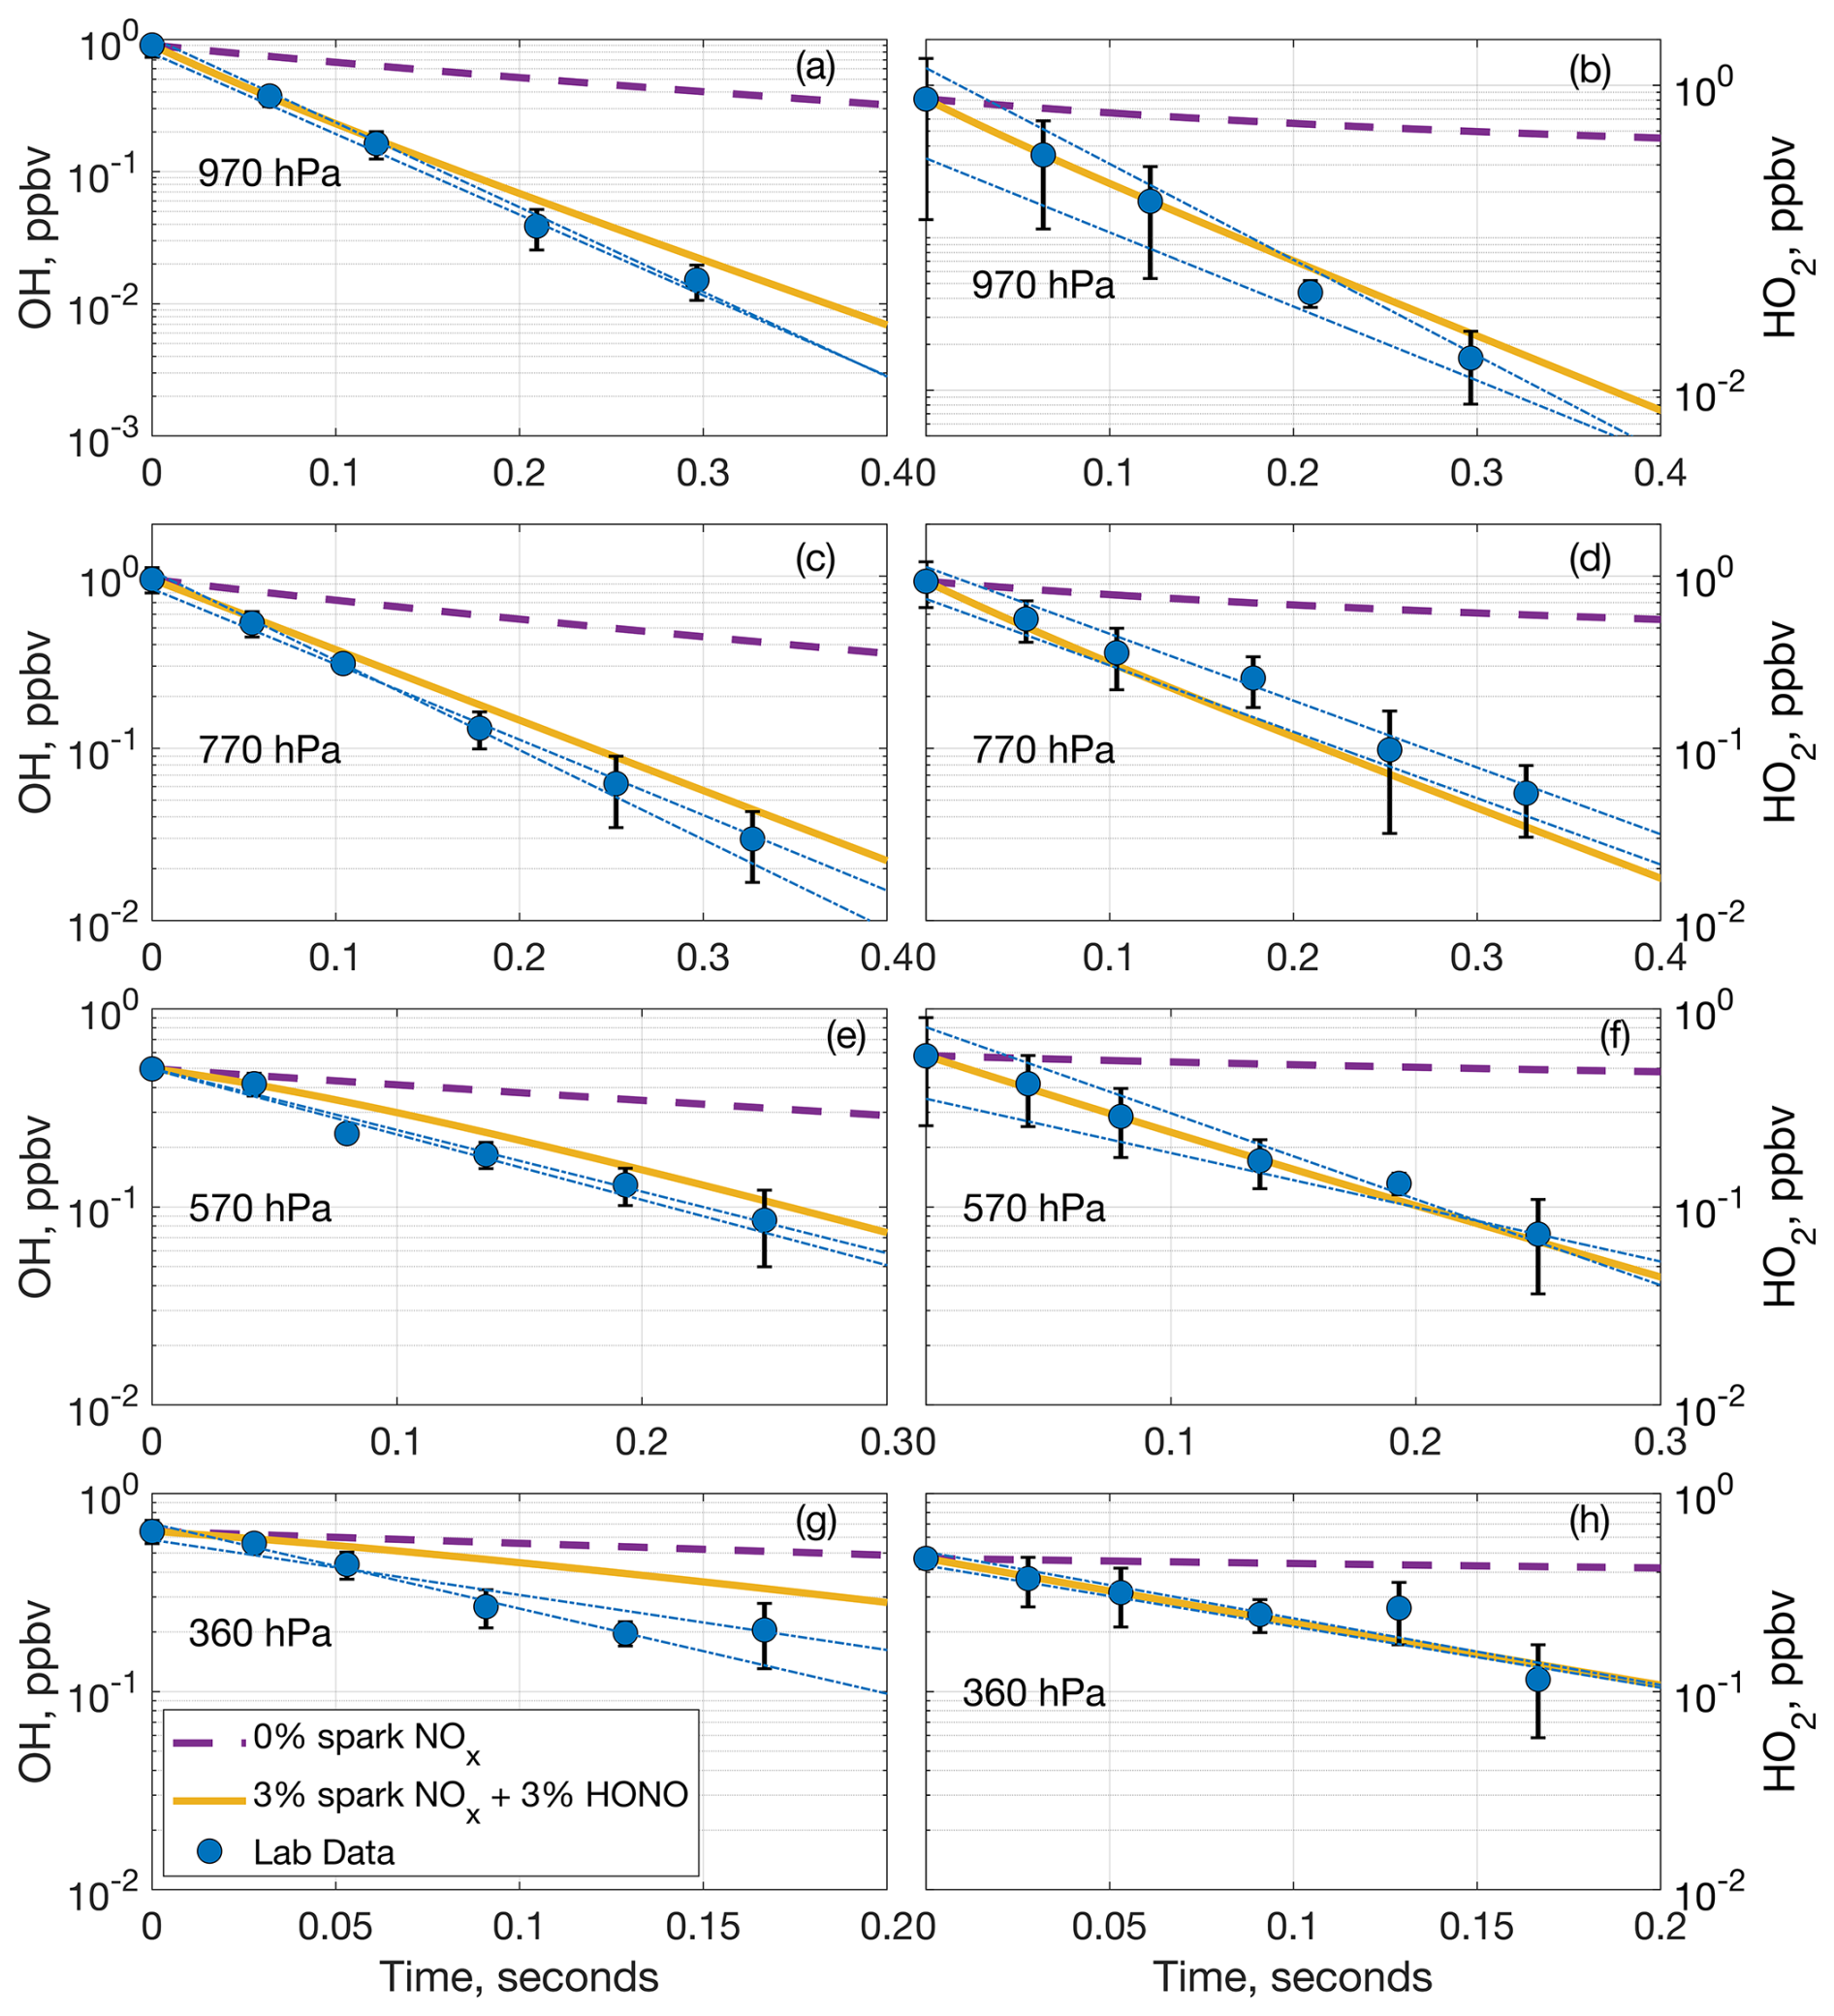
Figure 5Comparison of measured OH (a, c, e, g) and HO2 (b, d, f, h) laboratory decays and two model decays at (a, b) 970 hPa, (c, d) 770 hPa, (e, f) 570 hPa, and (g, h) 360 hPa. The dashed purple lines are the model decay including no NOx from the spark, and the solid yellow lines are the model decay including 3 % of the spark NOx and 3 % of the HONO predicted to be generated in a model run. The blue circles are the average laboratory measurements and average extrapolated value at time zero, while the dashed–dotted blue lines are the individual extrapolated linear fits to the laboratory data. Error bars are the standard deviation from averaging multiple measurements.
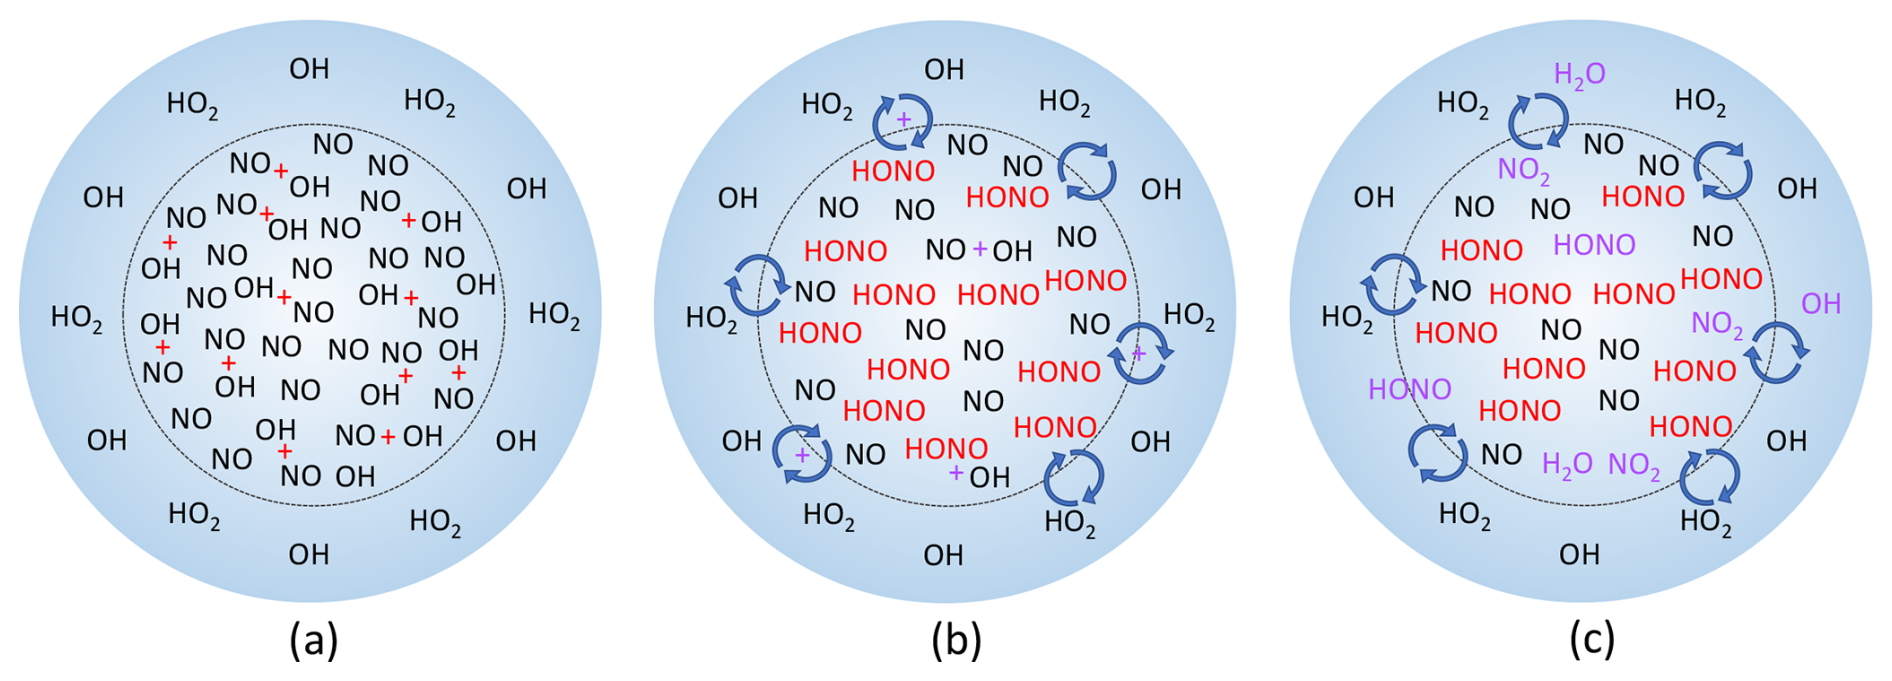
Figure 6Simplified progression of the proposed HOx and NOx chemistry in spark and lightning discharges. (a) Initially, extreme amounts of NO and OH are made inside the lightning hot channel, indicated by the dashed inner circle, while OH and HO2 are produced outside the hot channel in the corona sheath and UV radiation. (b) The NO and OH in the hot channel react and form HONO, while the species in the hot channel and corona sheath start to mix together. (c) Inside the hot channel, any remaining OH reacts with NO and HONO, forming either more HONO or H2O and NO2, respectively. Where the hot channel and corona sheath have started mixing, OH and HO2 from the corona sheath react with NO from the core, forming HONO or OH and NO2, respectively, while OH from the corona sheath and HONO from the core can also react to form H2O and NO2.
HONO, however, could account for the missing reactivity. It meets all four of the criteria: it lasts long enough to affect the HOx decays, its reaction with OH does not recycle HOx, it can react with OH over the 0.2–0.5 s time frame, and production of HONO in the core is expected to be high enough that only ∼ 3 % overlapping from the core could account for the OH reactivity. A model study including HONO production in the lightning hot core suggests as much as 12.6 ppmv of HONO can be generated within 10 ms of the discharge (Bhetanabhotla et al., 1985), and we only need ∼ 70 ppbv of HONO to fulfill the missing reactivity, using the F0AM reaction rate of cm3 molec.−1 s−1. Even considering that the laboratory sparks are smaller and cooler than a real lightning flash, substantial HONO production in the range of 1–2 ppmv is possible for the laboratory sparks as well.
Chemical models of the lightning hot channel show that both LNO production and LOH production are extreme inside it. For example, the model from Bhetanabhotla et al. (1985) has as much as 4300 ppmv of LNO and 860 ppmv of LOH initially produced, while the simulations of Ripoll et al. (2014) have as much as 42 000 ppmv of LNO and 8400 ppmv LOH, with LNO and LOH within an order of magnitude of each other in the shock front. Little to no HO2 is expected to be generated in the hot channel (Bhetanabhotla et al., 1985; Ripoll et al., 2014). As a test, a model experiment was run assuming 4 ppmv of LNO is initially produced in the laboratory sparks, which is only ∼ 1.4–2 times our laboratory measurements for LNO, along with 2.8 ppmv of hot core LOH and no other chemicals added. The result of this experiment is HONO production in the range of 1–2 ppbv across all pressures (Table 1). Additionally, this HONO is generated fast, before we make our first measurement of HOx in the laboratory flow tube. All the core LOH is also titrated to <1 pptv (our limit of detection in these experiments) over the same time frame that the HONO is generated, so it would not be detected by GTHOS in the laboratory experiments. This model result is consistent with our laboratory observations because if substantial core LOH remains beyond the time the first measurement is made in the laboratory, then we would expect to detect significantly more LOH than LHO2 during the experiments instead of the relatively equal amounts of LOH and LHO2 that are actually detected. This result is also in line with the Bhetanabhotla et al. (1985) model prediction that all the core LOH should decay away very rapidly. The only model case where the core LOH is not titrated to <1 pptv before the first laboratory measurement is made is at 360 hPa, but even at this pressure, the model predicts that HONO, NO, and NO2 are all within 1 % of their final values when that first measurement is made.
This model run demonstrates that HONO can be formed fast and in large amounts in the spark discharges. The initial chemistry in the sparks is occurring at thousands of degrees Celsius with electrons and many other chemical species besides NO and OH present, and the production of these species may have spatial dependencies that we cannot incorporate or account for in F0AM. These limitations may explain why the model does not entirely reproduce the NO and NO2 laboratory measurements. Still, the model results are within an order of magnitude of the laboratory results while simultaneously producing substantial HONO. Adding 3 % of the modeled HONO from Table 1 into the model of the laboratory decays drastically improves the agreement between the modeled and measured OH, and in some cases brings the modeled and measured decays into agreement within the laboratory uncertainty (Fig. 5). A diagram of the simplified HOx and NOx spark chemistry discussed in the preceding paragraphs is shown in Fig. 6.
Both the laboratory and model results across all the tested pressures confirm that the OH and HO2 we measure from sparks are generated outside the lightning hot channel, separate from the core where the LNO is generated. It took 3 % NO and 3 % HONO to resolve the measured–modeled discrepancy in these laboratory experiments, where the sparks occurred in a flow tube with laminar flow and a fast air velocity. In the atmosphere, the percentage of NO or HONO reacting with LHOx could be lower or higher than 3 %, depending on the turbulence and air velocity where the lightning flash occurs, and likely varies from one lightning flash to the next. But the overall conclusion, that the HOx generated outside the hot channel only partially interacts with the hot-channel products, will still be true in the atmosphere.
Additionally, these results indicate only that the substantial LHOx we measure is generated outside the hot channel; they do not imply that no LHOx is generated in the hot channel. As stated previously, modeling studies of the lightning hot channel indicate that substantial LHOx is also generated in the hot channel, likely even more than we measure outside the hot channel. But this hot-channel HOx will be rapidly titrated away in the presence of the large NO also generated in the core, becoming substantial HONO. As for the LHOx we measure outside the hot channel, LHOx production has been found to be proportional to ultraviolet radiation (UV) production in corona discharge (Jenkins et al., 2022), and UV may also be responsible for the LHOx we measure in sparks and lightning. The consequence of this spatially separate production of LHOx and LNO is that LHOx is not immediately consumed by LNO in lightning flashes but instead is available to oxidize other pollutants in the atmosphere and contribute to global OH oxidation.
While we did not test the full range of possible tropospheric pressures and temperatures in this study, we still expect that these results apply for the lower pressures and lower temperatures found in the upper troposphere where most lightning occurs. Regardless of where it occurs in the troposphere, a lightning flash is composed of a hot core surrounded by a corona sheath and UV radiation, so HOx production and NOx production are also expected to be spatially separate in the upper troposphere. Our previous study showed that the initial LNOx mixing ratio is independent of temperature and only slightly dependent on pressure, with less than a factor-of-2 difference in production between 970 and 250 hPa, while the initial LHOx mixing ratio is independent of pressure and decreases with decreasing temperature, depending on the available water vapor (Jenkins and Brune, 2023). Therefore, we expect roughly the same LNOx production in the upper troposphere as was observed in the experiments here, with likely ∼ 200–300 pptv of LHOx produced. The modeling results showed that for all the pressures tested in this study, the reaction accounts for over half of the OH loss, while the reaction accounts for 80 % of the HO2 loss. The rates of these two reactions increase with decreasing temperature, although the rate of is also pressure dependent. However, further modeling tests using the lowered LHOx production with the same LNOx as was measured at 360 hPa demonstrate that, even at 200 hPa and 220 K, the reactions and HO2+NO still account for more than 50 % of the OH loss and 80 % of the HO2 loss, respectively. Thus, based on this information, we also expect the same subsequent HOx–NOx chemistry to occur in the upper troposphere as shown for the pressures and temperatures here.
Differences in the model and laboratory HOx decays are resolved if substantial HONO is produced in the spark discharges, and therefore HONO would also be a substantial product of lightning in the atmosphere. Aside from the substantial HONO production predicted in two lightning chemistry models (Bhetanabhotla et al., 1985; Hill and Rinker, 1981), enhanced HONO has been measured inside two different electrified convective clouds (Dix et al., 2009; Heue et al., 2014). The field studies estimate HONO mixing ratios from 37–160 pptv inside the clouds, a range much lower than what the modeling studies predict and the 1–2 ppbv that we expect is made in the laboratory sparks. However, both field cases measured the HONO using differential optical absorption spectroscopy, generating long-path measurements that are averaged over the entire length of the cloud, while higher-resolution measurements would likely show very high HONO mixing ratios in lightning-affected air and lower mixing ratios in air that lightning did not pass through. We are not aware of any laboratory measurements of electrically produced HONO. Measurements of electrically generated HONO, either in the laboratory or at higher spatial resolution in the field, would thus be a good target for future work.
All data shown in the figures are publicly available at https://doi.org/10.26208/0VND-TQ52 (Jenkins and Brune, 2024).
The supplement related to this article is available online at https://doi.org/10.5194/acp-25-5041-2025-supplement.
The investigation, methodology, visualization, and original manuscript draft were by JMJ. Funding acquisition was by WHB. Conceptualization and reviewing and editing of the manuscript were by WHB and JMJ.
The contact author has declared that neither of the authors has any competing interests.
Publisher’s note: Copernicus Publications remains neutral with regard to jurisdictional claims made in the text, published maps, institutional affiliations, or any other geographical representation in this paper. While Copernicus Publications makes every effort to include appropriate place names, the final responsibility lies with the authors.
We thank Philip Stevens for lending us a microchannel plate detector after ours failed.
This research has been supported by the National Science Foundation, Directorate for Geosciences (grant no. 2134961).
This paper was edited by Frank Keutsch and reviewed by two anonymous referees.
Bhetanabhotla, M. N., Crowell, B. A., Coucouvinos, A., Hill, R. D., and Rinker, R. G.: Simulation of trace species production by lightning and corona discharge in moist air, Atmos. Environ., 19, 1391–1397, https://doi.org/10.1016/0004-6981(85)90276-8, 1985.
Biermann, H. W., Zetzsch, C., and Stuhl, F.: Rate Constant for the reaction of OH with N2O at 298 K, Berich. Bunsen. Gesell., 80, 909–911, https://doi.org/10.1021/i160062a006, 1976.
Boldi, R. A.: A model of the ion chemistry of electrified convection, PhD dissertation, Massachusetts Institute of Technology, http://hdl.handle.net/1721.1/51502, 1992.
Brandvold, D. K., Martinez, P, and Dogruel, D.: Polarity Dependence of N2O Formation From Corona Discharge, Atmos. Environ., 23, 1881–1883, https://doi.org/10.1016/0004-6981(89)90513-1, 1989.
Brandvold, D. K., Martinez, P., and Hipsh, R. Field measurements of O3 and N2O produced from corona discharge, Atmos. Environ., 30, 973–976, https://doi.org/10.1016/1352-2310(95)00234-0, 1996.
Bruggeman, P. and Schram, D. C.: On OH production in water containing atmospheric pressure plasmas, Plasma Sources Sci. T., 19, 045025, https://doi.org/10.1088/0963-0252/19/4/045025, 2010.
Brune, W. H. and Jenkins, J. M.: Is the reaction rate coefficient for OH + HO2 → H2O + O2 dependent on water vapor?, JACS Au., 4, 4921–4926, https://doi.org/10.1021/jacsau.4c00905, 2024.
Brune, W. H., McFarland, P. J., Bruning, E., Waugh, S., MacGorman, D., Miller, D. O., Jenkins, J. M., Ren, X., Mao, J., and Peischl, J.: Extreme oxidant amounts produced by lightning in storm clouds, Science, 372, 711–715, https://doi.org/10.1126/science.abg0492, 2021.
Brune, W. H., Jenkins, J. M., Olson, G. A., McFarland, P. J., Miller, D. O., Mao, J., and Ren, X.: Extreme hydroxyl amounts generated by thunderstorm-induced corona on grounded metal objects, P. Natl. Acad. Sci. USA, 119, e2201213119, https://doi.org/10.1073/pnas.2201213119, 2022.
Chameides, W. L., Stedman, D. H., Dickerson, R. R., Rusch, D. W., and Cicerone, R. J.: NOx production in lightning, J. Atmos. Sci., 34, 143–149, https://doi.org/10.1175/1520-0469(1977)034<0143:NPIL>2.0.CO;2, 1977.
Christian, H. J., Blakeslee, R. J., Boccippio, D. J., Boeck, W. L., Buechler, D. E., Driscoll, K. T., Goodman, S. J., Hall, J. M., Koshak, W. J., Mach, D. M., and Stewart, M. F.: Global frequency and distribution of lightning as observed from space by the Optical Transient Detector, J. Geophys. Res.-Atmos., 108, ACL 4-1–ACL 4-15, https://doi.org/10.1029/2002JD002347, 2003.
Dix, B., Brenninkmeijer, C. A. M., Frieß, U., Wagner, T., and Platt, U.: Airborne multi-axis DOAS measurements of atmospheric trace gases on CARIBIC long-distance flights, Atmos. Meas. Tech., 2, 639–652, https://doi.org/10.5194/amt-2-639-2009, 2009.
Donohoe, K. G., Shair, F. H., and Wulf, O. R.: Production of O3, NO, and N2O, in a pulsed discharge at 1 atm, Ind. Eng. Chem. Fund., 16, 208–215, https://doi.org/10.1021/i160062a006, 1977.
Dyer, M. J. and Crosley, D. R.: Two-dimensional imaging of OH laser-induced fluorescence in a flame, Opt. Lett., 7, 382–384, https://doi.org/10.1364/OL.7.000382, 1982.
Faloona, I. C., Tan, D., Lesher, R. L., Hazen, N. L., Frame, C. L., Simpas, J. B., Harder, H., Martinez., M., Di Carlo, P., Ren, X., and Brune, W. H.: A laser-induced fluorescence instrument for detecting tropospheric OH and HO2: Characteristics and calibration, J. Atmos. Chem., 47, 139–167, https://doi.org/10.1023/B:JOCH.0000021036.53185.0e, 2004.
Heue, K.-P., Riede, H., Walter, D., Brenninkmeijer, C. A. M., Wagner, T., Frieß, U., Platt, U., Zahn, A., Stratmann, G., and Ziereis, H.: CARIBIC DOAS observations of nitrous acid and formaldehyde in a large convective cloud, Atmos. Chem. Phys., 14, 6621–6642, https://doi.org/10.5194/acp-14-6621-2014, 2014.
Hill, R. D. and Rinker, R. G.: Production of nitrate ions and other trace species by lightning. J. Geophys. Res.-Oceans, 86, 3203–3209, https://doi.org/10.1029/JC086iC04p03203, 1981.
Hill, R. D., Rinker, R. G., and Coucouvinos, A.: Nitrous oxide production by lightning, J. Geophys. Res.-Atmos., 89, 1411–1421, https://doi.org/10.1029/JD089iD01p01411, 1984.
Jenkins, J. M. and Brune, W. H.: Effect of Temperature and Water Droplets on Production of Prodigious Hydrogen Oxides by Electrical Discharges, J. Geophys. Res.-Atmos., 128, e2023JD039362, https://doi.org/10.1029/2023JD039362, 2023.
Jenkins, J. M. and Brune, W. H.: Spatially separate production of hydrogen oxides and nitric oxide in lightning, datacommons@psu [data set], https://doi.org/10.26208/0VND-TQ52, 2024.
Jenkins, J. M., Brune, W. H., and Miller, D. O.: Electrical discharges produce prodigious amounts of hydroxyl and hydroperoxyl radicals, J. Geophys. Res.-Atmos., 126, e2021JD034557, https://doi.org/10.1029/2021JD034557, 2021.
Jenkins, J. M., Olson, G. A., McFarland, P. J., Miller, D. O., and Brune, W. H.: Prodigious Amounts of Hydrogen Oxides Generated by Corona Discharges on Tree Leaves, J. Geophys. Res.-Atmos., 127, e2022JD036761, https://doi.org/10.1029/2022JD036761, 2022.
Jenkin, M. E., Young, J. C., and Rickard, A. R.: The MCM v3.3.1 degradation scheme for isoprene, Atmos. Chem. Phys., 15, 11433–11459, https://doi.org/10.5194/acp-15-11433-2015, 2015.
Kalnajs, L. E. and Avallone, L. M.: A novel lightweight low-power dual-beam ozone photometer utilizing solid-state optoelectronics, J. Atmos. Ocean. Tech., 27, 869–880, https://doi.org/10.1175/2009JTECHA1362.1, 2010.
Levine, J. S., Hughes, R. E., Chameides, W. L., and Howell, W. E.: N2O and CO Production by electric discharge: Atmospheric implications, Geophys. Res. Lett., 6, 557–559, https://doi.org/10.1029/GL006i007p00557, 1979.
Ono, R. and Oda, T.: Measurement of hydroxyl radicals in pulsed corona discharge, J. Electrostat., 55, 333–342, https://doi.org/10.1016/S0304-3886(01)00215-7, 2002.
Orville, R. E.: A High-Speed Time-Resolved Spectroscopic Study of the Lightning Return Stroke: Part II. A Quantitative Analysis, J. Atmos. Sci., 25, 839–851, https://doi.org/10.1175/1520-0469(1968)025<0839:AHSTRS>2.0.CO;2, 1968a.
Orville, R. E.: A High-Speed Time-Resolved Spectroscopic Study of the Lightning Return Stroke: Part I. A Qualitative Analysis, J. Atmos. Sci., 25, 827–838, https://doi.org/10.1175/1520-0469(1968)025<0827:AHSTRS>2.0.CO;2, 1968b.
Rakov, V. A. and Uman, M. A.: Lightning: Physics and Effects, Cambridge University Press, 687 pp., ISBN 0-521-03541-4, 2006.
Rehbein, N. and Cooray, V.: NO production in spark and corona discharges, J. Electrostat., 51–52, 333–339, https://doi.org/10.1016/S0304-3886(01)00115-2, 2001.
Ripoll, J.-F., Zinn, J., Jeffrey, C. A., and Colestock, P. L.: On the dynamics of hot air plasmas related to lightning discharges: 1. Gas dynamics, J. Geophys. Res.-Atmos., 119, 9218–9235, https://doi.org/10.1002/2013JD020068, 2014.
Tang, M. J., Cox, R. A., and Kalberer, M.: Compilation and evaluation of gas phase diffusion coefficients of reactive trace gases in the atmosphere: volume 1. Inorganic compounds, Atmos. Chem. Phys., 14, 9233–9247, https://doi.org/10.5194/acp-14-9233-2014, 2014.
Wolfe, G. M., Marvin, M. R., Roberts, S. J., Travis, K. R., and Liao, J.: The Framework for 0-D Atmospheric Modeling (F0AM) v3.1, Geosci. Model Dev., 9, 3309–3319, https://doi.org/10.5194/gmd-9-3309-2016, 2016.