the Creative Commons Attribution 4.0 License.
the Creative Commons Attribution 4.0 License.
 | 13 May 2025
Spatiotemporal variations in atmospheric CH4 concentrations and enhancements in northern China based on a comprehensive dataset: ground-based observations, TROPOMI data, inventory data, and inversions
Ning Zeng
Bo Yao
Wen Zhang
Weijun Quan
Pucai Wang
Ting Wang
Minqiang Zhou
Qixiang Cai
Yuzhong Zhang
Ruosi Liang
Wanqi Sun
Shengxiang Liu
Methane (CH4) is a potent greenhouse gas with a global warming potential that is 28–36-fold higher than that of CO2 at the 100-year scale. Northern China notably contributes to CH4 emissions. However, high uncertainties remain in emissions, and observation gaps exist in this region, especially in urban areas. Here, we compiled a comprehensive dataset (available at https://doi.org/10.5281/zenodo.10957950) (Han et al., 2024b), including ground- and satellite-based observations, inventory data, and modeling results, to study the CH4 concentration, enhancement, and spatiotemporal variation in this area. High-precision in situ observations from Beijing and Xianghe revealed that obvious seasonal cycles and notable enhancements (500–1500 ppb) occurred at a regional background site (Shangdianzi). We found significant increasing trends in the CH4 concentration over time in both the ground- and satellite-based observations and positive correlations between these observations. Anthropogenic emissions largely contributed to surface concentration variations and their increases in middle and southern Shanxi Province and Hebei Province. The posterior concentrations generally agreed well with the surface in situ observations (mean biases ranging from −2.3 to 80.7 ppb), and the RMSE ranges from 110 to 185 ppb, which is in the range from 5 % to 10 % of the XCH4. Moreover, a generally spatially consistent pattern was observed between the results of posterior results and the Tropospheric Monitoring Instrument (TROPOMI) column CH4 observations in four seasons. The posterior surface CH4 concentrations (with a spatial resolution of 0.5° × 0.625°) revealed that southern Shanxi, northern Henan, and Beijing exhibited relatively high levels (an increase of ∼ 300 ppb), which were positively correlated with the PKU-CH4 v2 emission inventory data. The inversion results using TROPOMI observations was 24.0 Tg, a decrease of 15.6 %, or 4.4 Tg, compared with the prior EDGARv4.3.2 (28.5 Tg). This study provides a comprehensive dataset of CH4 concentrations and enhancements in high-emission areas, which can benefit at the level of the research community and policy-makers in designing future observations, conducting atmospheric inversions, and formulating policies and at the city level, where high-spatial-resolution atmospheric inversions are highly needed at the kilometer scale.
- Article
(6552 KB) - Full-text XML
-
Supplement
(3516 KB) - BibTeX
- EndNote


Methane (CH4) is a potent greenhouse gas (GHG) that exhibits a 28–36-fold greater global warming potential than that of CO2 at the 100-year scale (Hu et al., 2024; Lin et al., 2021), with a radiative forcing of 0.61 W m−2, and CH4 is responsible for almost one-third of the total warming to date (Etminan et al., 2016; IPCC, 2022). According to National Oceanic and Atmospheric Administration (NOAA) atmospheric observations, the global mean atmospheric CH4 growth rate increased dramatically to 13.2 ppb in 2022, resulting in record-high CH4 levels above 1900 ppb throughout 2022 (https://gml.noaa.gov/ccgg/trends_ch4/, last access: 8 January 2025). The fluctuations in the atmospheric CH4 concentration are driven by various natural (e.g., wetlands) and anthropogenic sources (e.g., fossil fuel exploitation), and atmospheric CH4 can be removed by sinks via chemical oxidation involving hydroxyl radicals (OH) and dry soil sinks involving aerobic methane-oxidizing bacteria (Saunois et al., 2020; Turner et al., 2019; Tan et al., 2022; Lin et al., 2021). Anthropogenic sources contribute approximately 60 % to global CH4 emissions (Jackson et al., 2020; Saunois et al., 2020). Thus, reductions in anthropogenic CH4 emissions have significant implications for achieving near-term climate goals (IPCC, 2022; Gouw et al., 2020; Staniaszek et al., 2022). To limit global warming to 1.5 °C, more than 130 countries have pledged to achieve carbon neutrality or net-zero emissions, which requires the combined reduction in both CO2 and non-CO2 (GHG) emissions (Fankhauser et al., 2022; Ou et al., 2021).
Direct emissions (e.g., leakage/incomplete combustion from energy storage, transportation and consumption, landfills, and wastewater) originating from urban areas account for approximately 21 % of global CH4 emissions (Zhao et al., 2019). For example, Crippa et al. (2021) reported that urbanization contributed to an increase in CH4 emissions that is 6-fold faster, stemming from urban centers, and that energy, transport, and waste were the dominant drivers of increases in urban emissions. Since 2000, CH4 emissions in China have rapidly increased in response to industrialization and urbanization development (Lin et al., 2021). Accompanying this trend, notable expanding hotspots in megacities and high-energy-exploitation regions have become a concern. China has enacted an ambitious plan to reach carbon neutrality before 2060 to address climate change. In November 2023, China issued the Methane Emissions Control Action Plan, which targets a utilization volume of coal mine methane of 6×10⁹ m3, a utilization rate of urban household waste of approximately 60 %, and a utilization rate of dung and waste from livestock of at least 80 % by 2025 (MEE, 2023). Understanding the current emission status, impacts on atmospheric CH4 concentration increases, and mitigation potentials for CH4 emissions is a prerequisite for developing effective mitigation policies.
Although previous efforts have been made to improve the accuracy of CH4 emission estimates for China, substantial inconsistencies remain, especially in hotspot regions (Lin et al., 2021; Sheng et al., 2019; Miller et al., 2019; Liu et al., 2021b). The recent emission inventories of PKU-CH4 v2 (Liu et al., 2021b), Community Emissions Data System (CEDS) v2021-4-21 (Hoesly et al., 2019), and Emissions Database for Global Atmospheric Research (EDGAR) v7.0 (Crippa et al., 2023) exhibit a wide range of 47–67 Tg for 2019, which highlights the considerable uncertainty in the application of bottom-up methods. These uncertainties are mainly due to differences in source-specific emission factors and spatial disaggregation of national or provincial annual totals (Crippa et al., 2023; Lin et al., 2021; Peng et al., 2016; Zhang et al., 2016). Furthermore, differences among inventories could substantially affect inversions using inventory data as prior estimates. The adoption of data from existing top-down studies (Miller et al., 2019; Yin et al., 2021) based on outdated bottom-up inventories could bias the determination of trends in CH4 emissions in China (Liu et al., 2021b). Tan et al. (2022) also reported that the inversion model performance is highly affected by prior data and measurements across China. There is a pressing need to improve the accuracy of CH4 emission estimates to support the implementation of mitigation strategies and better characterize regional CH4 surface fluxes.
Satellite observational platforms provide promising pathways for tracking spatial and temporal variations in CH4 sources (Schuit et al., 2023; Jacob et al., 2016; Irakulis-Loitxate et al., 2021; Turner et al., 2015; Pandey et al., 2019). Satellite retrievals of the column-averaged dry-air mole fraction of methane (XCH4) with an unprecedented spatiotemporal coverage and resolution can be used to rapidly detect CH4 variations and verify bottom-up inventories. Although several previous studies have involved the use of data from the Greenhouse Gases Observing Satellite (GOSAT) and the SCanning Imaging Absorption SpectroMeter for Atmospheric CHartographY (SCIAMACHY) to characterize atmospheric CH4 concentrations in China, the monitoring of emissions originating from large sources remains limited because of the relatively sparse observations and coarse resolution (Tan et al., 2022; Chen et al., 2022b; Chen et al., 2022a). Furthermore, Plant et al. (2022), Maasakkers et al. (2022), and Peng et al. (2023) reported that inventoried urban CH4 emissions are underestimated relative to Tropospheric Monitoring Instrument (TROPOMI)-based estimates. Several studies have shown the ability of the recently launched TROPOMI to track and quantify CH4 emissions stemming from point and regional sources (Schuit et al., 2023; Jacob et al., 2016; Barré et al., 2021). Gouw et al. (2020) reported that TROPOMI can identify distinct methane emission increases in oil and natural production regions in the United States. Liu et al. (2021c) developed a new divergence method to estimate CH4 emissions in Texas (North America) on the basis of TROPOMI observations. Liang et al. (2023) used TROPOMI observations to estimate emissions in East Asia.
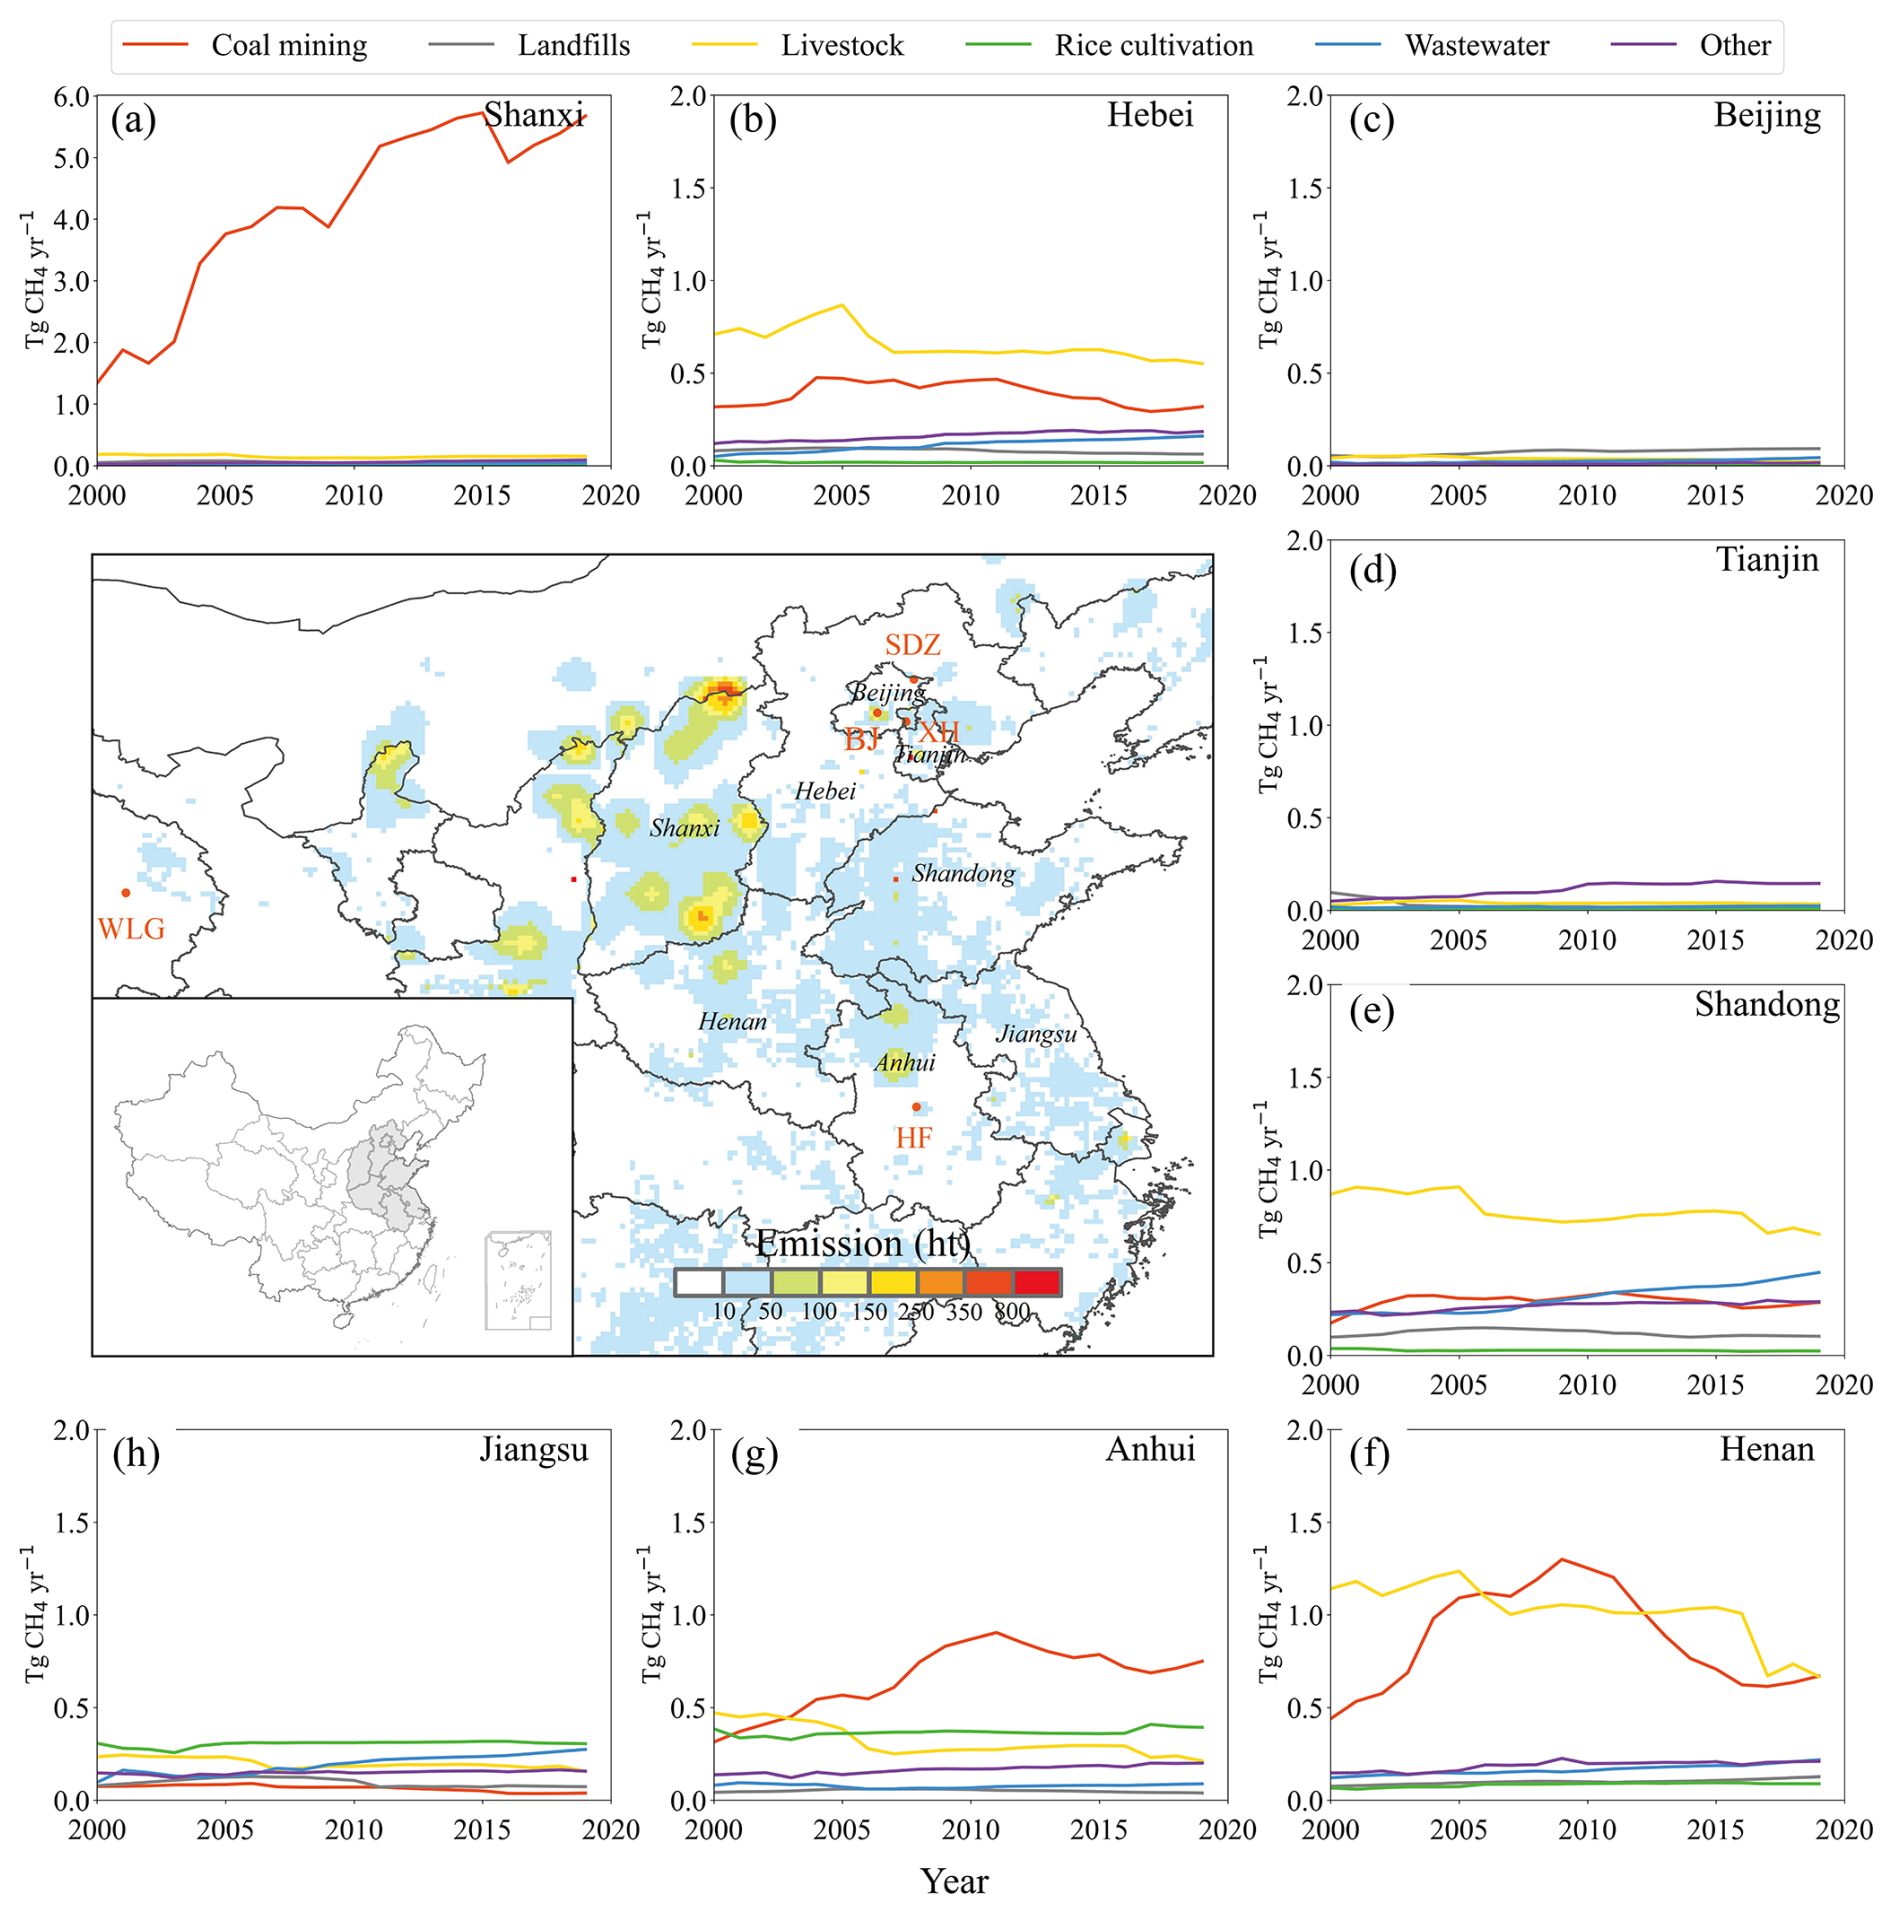
Figure 1Observation sites (red dots) and gridded anthropogenic CH4 emissions and sectoral emissions in northern China from the PKU-CH4 v2 inventory (Peng et al., 2023). BJ, XH, SDZ, and HF represent Beijing urban, Xianghe suburban, Shangdianzi regional background, and Hefei suburban conditions, respectively (Table 1). Methane emissions from coal mining, landfills, livestock, rice cultivation, wastewater, and others are presented in the subplots for each province. The units ht and Tg denote hundred metric tons and teragrams (1012 g). Publisher’s remark: please note that the above figure contains disputed territories.
Northern China, encompassing the Beijing–Tianjin–Hebei (BTH) region and its surrounding provinces (including Shanxi, Shandong, Jiangsu, Anhui, and Henan), is a populous region with rapid socioeconomic development, and more than 30 % of the anthropogenic CH4 emissions in China in 2019 were generated in this region (PKU-CH4, Fig. 1). Previous studies have indicated that northern China is a CH4 emission hotspot region (Tan et al., 2022; Liang et al., 2023). Emissions resulting from the production of raw coal in northern China constitute one of the major sources, and Shanxi is the largest regional CH4 emitter, yielding 5.7 Tg of emissions in 2019 (PKU-CH4). Notably, northern China is a hotspot region for atmospheric CH4 concentration and flux studies.
In this study, we used high-precision in situ observations, Total Carbon Column Observing Network (TCCON) observations, satellite data, inventory data, and modeling data from atmospheric inversions to better understand the spatiotemporal variations and spatial gradients of atmospheric CH4 concentrations and the correlations between emissions and concentrations in northern China. On the basis of this comprehensive dataset, we aimed to (1) quantify the spatiotemporal variation of CH4 concentrations and enhancements in northern China, (2) study the correlations between satellite- and ground-based observations, and (3) assess the consistency and deviation in results derived from surface and satellite observations. First, we studied the temporal variations in local CH4 concentrations and their enhancement in urban areas. Second, we analyzed the correlations between satellite-based column CH4 concentrations and surface observations. Third, we assessed the model performance via high-precision measurements. Finally, we analyzed the spatial and temporal variations in posterior concentrations determined with the Westlake model, which exhibits a satisfactory output and performance, at the monthly, seasonal, and yearly scales.
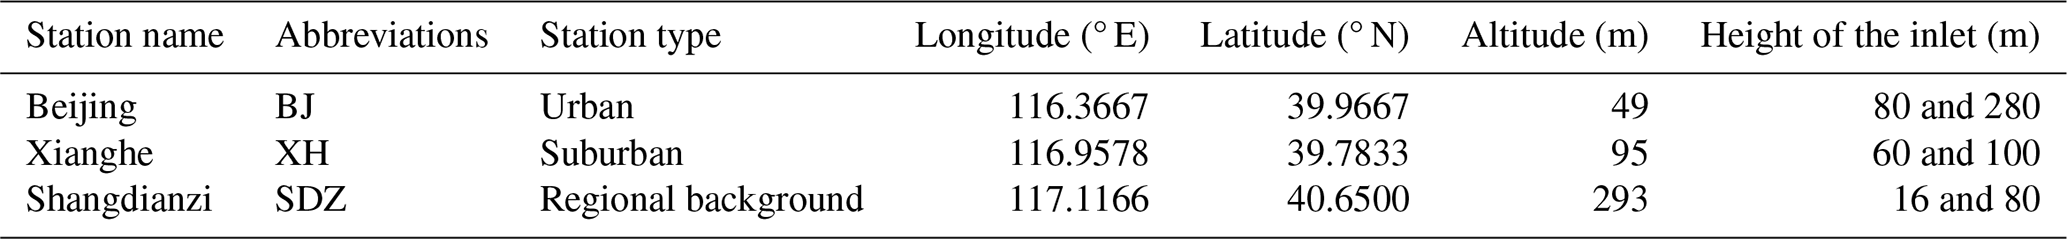
Table 1Information on the three regional high-precision observation sites.
2.1 Surface observations
To monitor GHG emissions in support of assessing the realization of carbon neutrality goals, China is making great efforts in terms of its GHG monitoring capacity (Sun et al., 2022; MEE, 2021; Han et al., 2018; Zeng et al., 2021). Three stations equipped with high-precision (1 ppb) Picarro instruments have been established in the BTH region, namely, the urban Beijing station (BJ), the suburban Xianghe station (XH), and the WMO/GAW regional background Shangdianzi station (SDZ) (Fig. 1, Table 1), since 2019. Wind rose plots for data from these sites are shown in Fig. S1 in the Supplement. Moreover, two TCCON stations (http://www.tccon.caltech.edu/, last access: 8 January 2025), namely, the Hefei and Xianghe stations, were established to continuously monitor the variability in the atmospheric XCH4. In this study, we analyzed surface measurements along with satellite observations to better understand the temporal variations and seasonal cycles of atmospheric CH4 from 2019 to 2021, while TCCON data were also employed to assess TROPOMI observations.
2.1.1 Ground-based high-precision in situ measurements
In situ measurements of atmospheric CH4 dry mole fractions were conducted at the three sites (BJ, XH, and SDZ) via Picarro GHG analyzers (Fig. 1). The BJ station (39.97° N, 116.37° E) is located at the Institute of Atmospheric Physics, Chinese Academy of Sciences, in urban Beijing between the Third and Fourth Ring Roads (Liu et al., 2021a). This area is densely populated, and CH4 concentrations are frequently influenced by local residential and transportation emissions. The XH station (39.75° N, 116.96° E) is located at a suburban site that represents the transition region from urban to regional background areas (Yang et al., 2021). The SDZ station (40.65° N, 117.12° E) is one of the regional Global Atmosphere Watch (GAW) stations of the World Meteorological Organization (WMO) in China and occurs on a mountainside 100 km northeast of urban Beijing. There is a small village in the lower valley of the mountain. The major vegetation types are shrubs and corn (Fang et al., 2016). The Mauna Loa (MLO; 19.54° N, 155.58° W) site is a GAW station representing the global background (not shown in Fig. 1) located atop a mountain on Hawai′i island with the longest history of observations. The background map in Fig. 1 shows 10 km × 10 km gridded anthropogenic CH4 emissions from the PKU-CH4 inventory with hotspots in Shanxi, Beijing, Henan, Anhui, and Inner Mongolia, while the panels show sectoral CH4 emissions from 2000 to 2019 at the provincial scale (Figs. 1 and S2).
Cavity ring-down spectroscopy (CRDS) instruments (Picarro G2301/G2401, Picarro Inc.) were used to continuously measure in situ atmospheric CH4 concentrations at BJ, XH, and SDZ. CH4 concentration data from the Waliguan (WLG) and MLO sites were obtained from the World Data Centre for Greenhouse Gases (WDCGG; https://gaw.kishou.go.jp/, last access: 8 January 2025). At the three regional sites, ambient air was sampled by an oil-free vacuum pump at different tower levels after particles were removed with a 2 µm filter. Then, the air was dried with a Nafion dryer to the dew point at −25 °C, and the pressure and flow rate were stabilized before the air samples were analyzed with a CRDS instrument. All the observation systems were calibrated every 6 h by WMO X2007 standard gases. The accuracy of the observations was greater than 1 ppb at a 1 min resolution. The sampling height was 80 and 280 m above ground level (a.g.l.) at BJ, 60 and 100 m a.g.l. at XH, and 16 and 80 m a.g.l. at SDZ.
2.1.2 Ground-based total column measurements
TCCON aims to measure column-averaged mole fractions of CO2, CH4, and other gases beginning in 2004 across 30 sites worldwide via solar absorption spectroscopy in the near-infrared region (Laughner et al., 2023). It is a ground-based network of Fourier transform spectrometers (FTSs) designed to retrieve high-precision data on GHG emissions and to provide a validation dataset for space-based measurements (Wunch et al., 2011, 2010). Here, we used GGG2020 TCCON data from the Hefei (HF; 31.9° N, 117.17° E) and XH stations (Liu, 2023; Zhou, 2022). A high-resolution FTS (IFS 125HR, Bruker GmbH, Germany) system and a solar tracker (Tracker-A Solar 547, Bruker GmbH, Ettlingen, Germany) have been operational at the HF site since January 2014 (the site location shown in Fig. 1) (Wang et al., 2017). The observatory is located in the northwestern suburbs of Hefei and is surrounded by wetlands and croplands (Tian et al., 2018). Therefore, the CH4 concentration observed at the HF station may be partly influenced by local anthropogenic emissions from urban areas and cultivated lands and by natural emissions from wetlands (Tian et al., 2018; Wang et al., 2017). The bias correction factor for CH4 at HF is 0.9765, with a 1σ standard deviation of 0.0020 (Tian et al., 2018). Additionally, an automatic weather station (ZENO 3200, Coastal Environmental Systems, Inc., Seattle, USA) was installed near the solar tracker instrument on the roof in September 2015 to collect meteorological data (Wang et al., 2017; Shan et al., 2019). The other TCCON site is located at XH in the suburban area 50 km southeast of Beijing (Zhou et al., 2023). The XH station is surrounded by croplands and residential buildings (with an average height of ∼ 20 m) (Yang et al., 2021). A Bruker IFS 125HR instrument was installed in the upper level of a four-story building in June 2016, and a solar tracker instrument was installed on the rooftop in June 2018 (Yang et al., 2021). The retrieved XCH4 products at XH are subjected to air-mass-dependence correction and calibrated to the WMO scale (Wunch et al., 2015; Yang et al., 2020). Moreover, the Xianghe and Hefei sites have percentages of 32.6 % and 87.1 % in 2019, respectively, for high aerosol optical depth (AOD) (polluted or cloudy), and in these high AOD conditions local scientists do not retrieve CH4. With high aerosol or cloud conditions, the DC signal of the interferogram has a large variation. All the spectra with the DC variation larger than 5 % are filtered out, which guarantees the data quality of the TCCON spectra. In addition, TCCON uses the solar direct absorption spectra; this has much less of an impact for the low aerosol as compared to the satellite retrieval.
2.2 Satellite observations
TROPOMI on board the Copernicus Sentinel-5 Precursor is a nadir-viewing, imaging spectrometer covering wavelength bands between the ultraviolet and shortwave infrared (SWIR) bands (Veefkind et al., 2012). TROPOMI retrieves a methane column from the 2305–2385 nm SWIR band and the 757–774 nm near-infrared band, with a daily global coverage at a fine spatial resolution of 5.5 km × 7 km since August 2019 (7 km × 7 km before August 2019) and a swath width of ∼ 2600 km (Butz et al., 2012; Lorente et al., 2021; Hu et al., 2016). We used the TROPOMI CH4 total column level 2 data product to quantify the variations and trends in northern China from January 2019 to December 2021. We employed XCH4 retrievals with quality values greater than 0.5 (Gouw et al., 2020). To ensure comparison with surface measurements, bottom-up inventories, and inversion results at different spatial resolutions, the TROPOMI XCH4 observations were averaged to three spatial resolutions of 0.1° × 0.1°, 0.25° × 0.25°, and 0.5° × 0.5°. The TROPOMI data were resampled to each of the spatial resolutions. We first defined the spatial bounds of the resampled grids and then placed the original pixels into coarser grids according to the longitude and latitude of the pixel center. We defined the resampled values of XCH4 as the average of the original pixels belonging to the new resampled grids. This method ensures consistency between the regionally averaged XCH4 values before and after resampling, with an average relative error of 0.03 %. We used TCCON data from HF and XH to evaluate the accuracy and precision of the TROPOMI observations.
2.3 Bottom-up inventory
A gridded inventory of anthropogenic CH4 emissions from Peking University (PKU-CH4 v2) (Liu et al., 2021b; Peng et al., 2022, 2023), which has been assessed in our previous study (Lin et al., 2021), was adopted in this study. PKU-CH4 v2 is an annual bottom-up inventory based on provincial activity data and regional, sector-specific emission factors for eight major sectors in China (Liu et al., 2021b; Peng et al., 2016). The inventory provides a priori knowledge of the temporal and regional distribution characteristics of anthropogenic CH4 emissions in China. The main sources of CH4 emissions in China are coal mining and agriculture, which contributed approximately 77 % to the total national emissions in 2019 (Lin et al., 2021; Liu et al., 2021b).
Coal mining is the dominant driver of CH4 emissions in China, accounting for > 80 % of the increase in the total emissions in the 2000s due to the growth in coal production with rapid economic development and the increasing energy demand (Lin et al., 2021; Liu et al., 2021b). However, the reductions in both coal production and emission factors, with increasing utilization rates, contributed to slowing coal methane emissions from 2010–2019 (Liu et al., 2021b).
2.4 Atmospheric modeling and inversions
We present a Bayesian inversion framework over East Asia, using GEOS-Chem as the forward model, with a spatial resolution of 0.5° × 0.625° (Liang et al., 2023). The state vector to be optimized in the inversion consists of 600 clusters for methane emissions and average methane column biases at four model boundaries. The inversion-derived posterior simulations (referred to as Westlake data), which provide an improved fit to the TROPOMI observations, are considered in our study (Liang et al., 2023). For oil and gas, we used the Global Fuel Exploitation Inventory (GFEI) v1.0 dataset, and for coal in China, we used the inventory of Sheng et al. (2019), while the data for other sectors were derived from the EDGAR v4.3.2 dataset (Janssens-Maenhout et al., 2019a). We used annual coal emissions (GFEI v1.0) and annual livestock emissions (annual EDGAR v4.3.2), which are evenly distributed across time, but used monthly rice emissions, which constitute annual EDGAR v4.3.2 data scaled by seasonal scaling factors (higher in autumn and lower in other seasons). To consider major patterns in the distribution of emissions and significantly reduce the inversion computation burden, emissions were optimized on the basis of 600 spatial clusters instead of the native 0.5° × 0.625° grid, which were generated with a Gaussian mixed model algorithm (Turner and Jacob, 2015). The model performance was evaluated by high-precision in situ observations. The optimized surface and column concentrations were used to analyze the spatiotemporal dynamics of CH4 concentrations and emissions. Moreover, Copernicus Atmosphere Monitoring Service (CAMS) global inversion-optimized greenhouse gas concentrations were used in the comparison, which are coarse-resolution (2° × 3°) monthly data that can provide a regional baseline (Rayner et al., 2016).
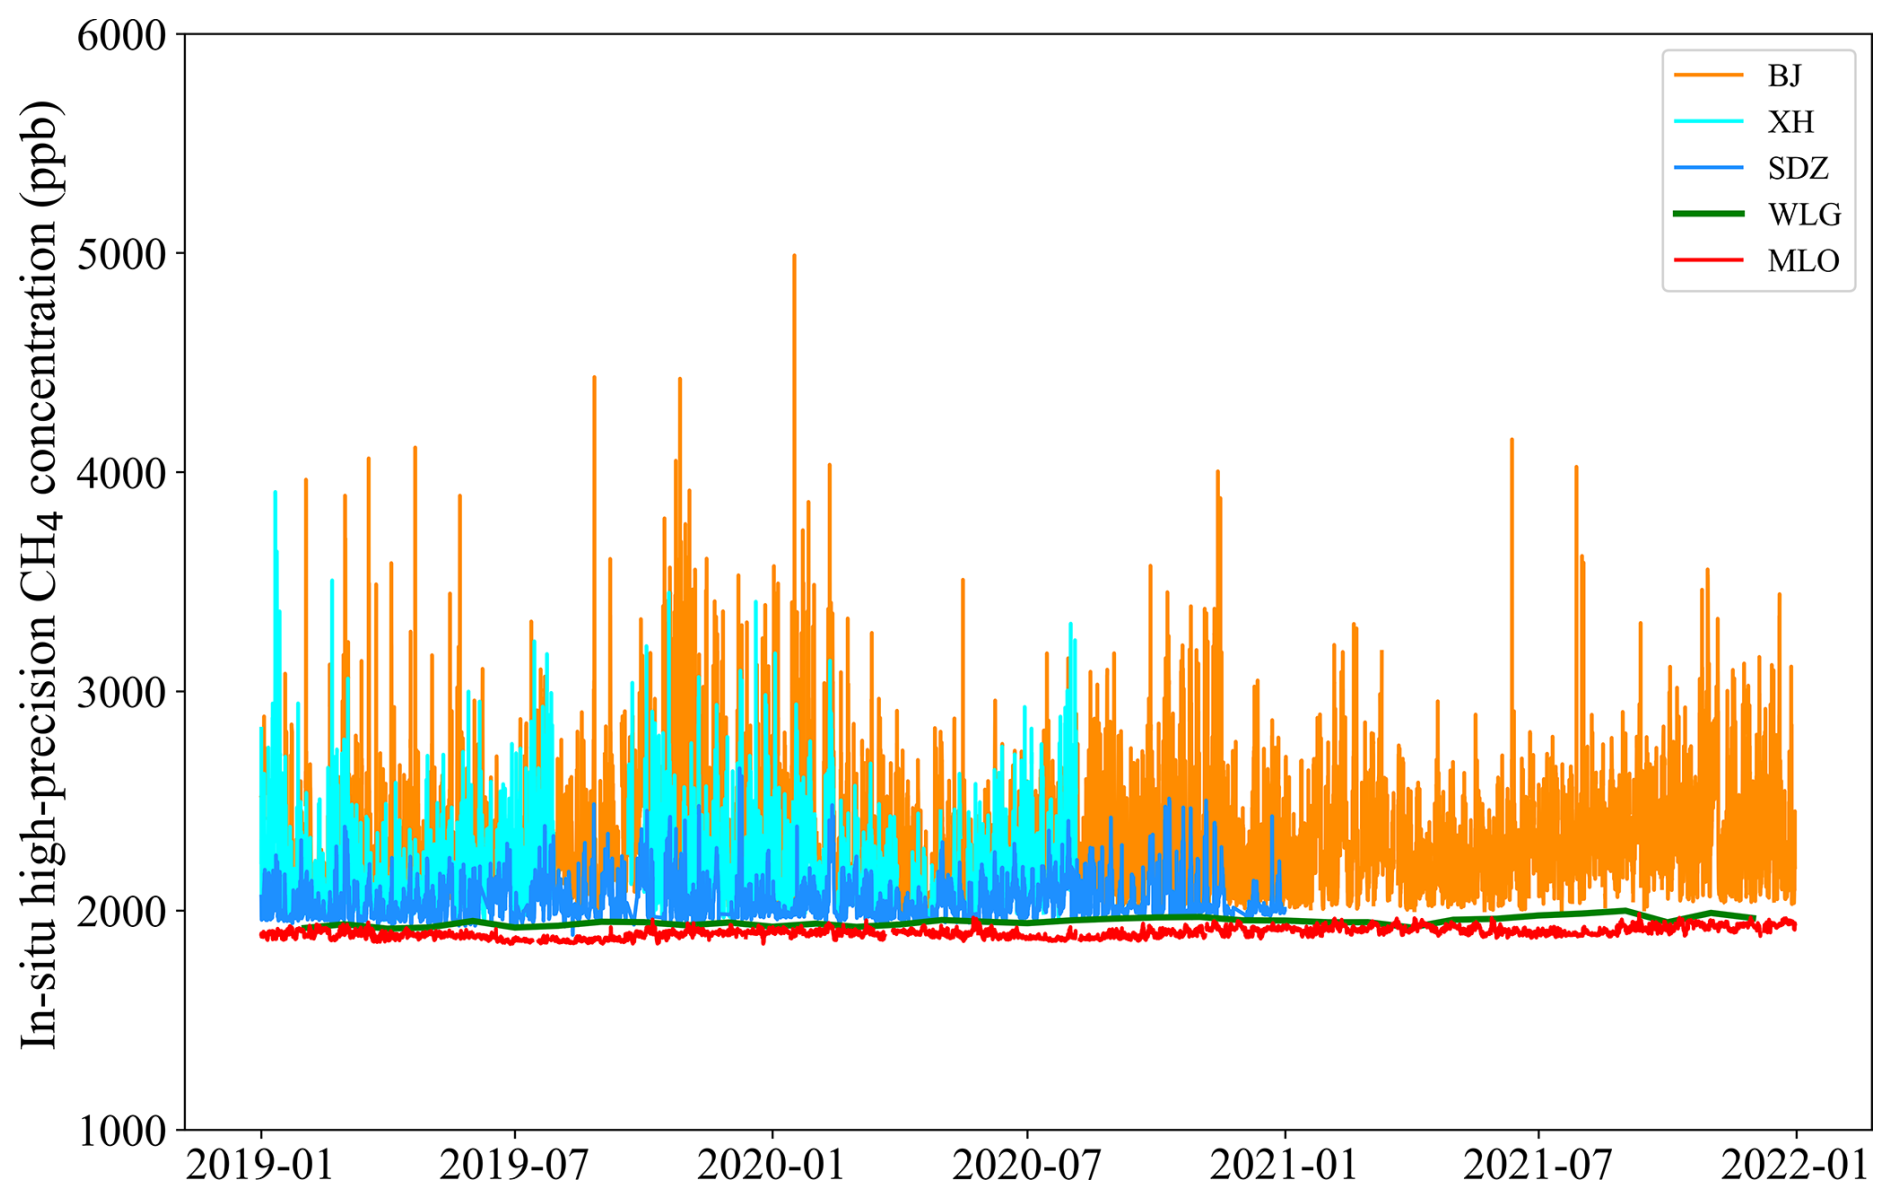
Figure 2Hourly CH4 variations at the four sites in northern China on the basis of ground high-precision observations. BJ, XH, SDZ, WLG, and MLO represent Beijing, Xianghe, Shangdianzi, Waliguan, and Mauna Loa, respectively. For WLG, we used weekly data because of data availability.
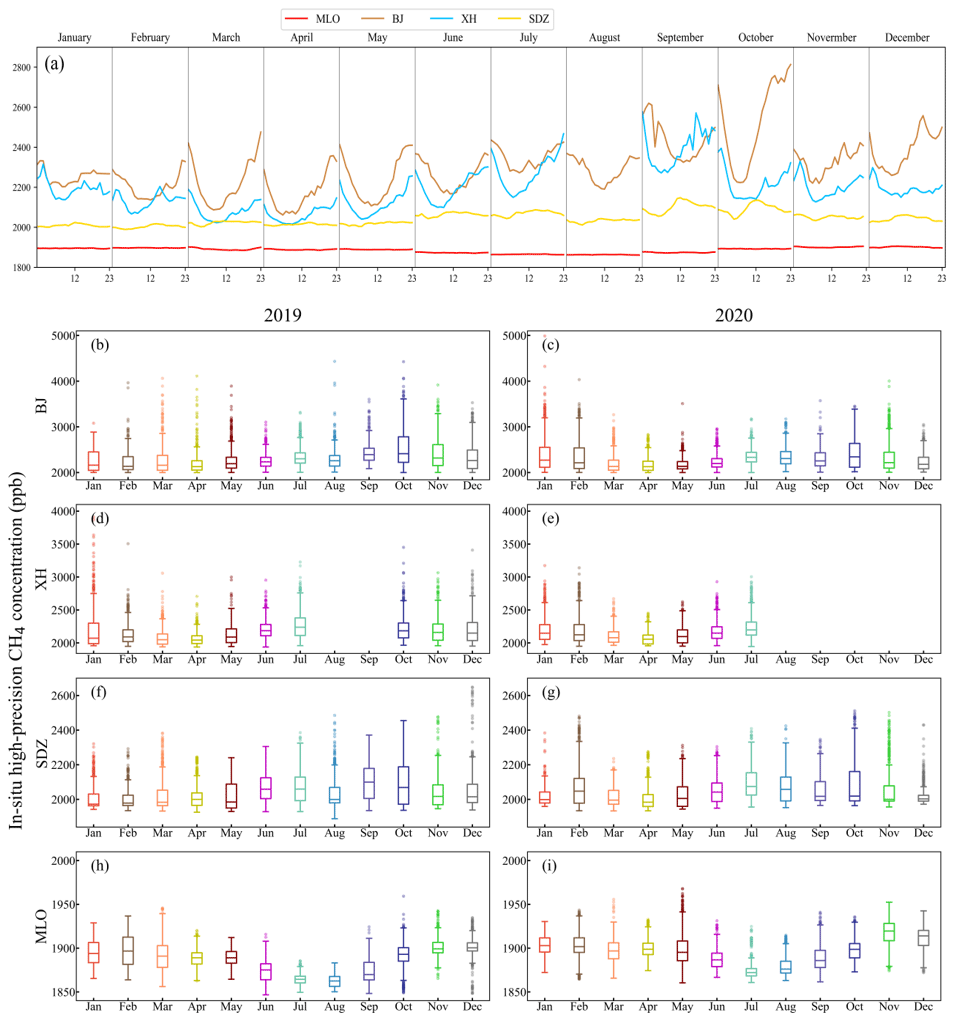
Figure 3CH4 concentrations for the hourly mean from 00:00–23:59 UTC in each month and box plots of monthly concentrations in the four sites in 2019 and 2020. BJ, XH, SDZ, and MLO represent Beijing, Xianghe, Shangdianzi, and Mauna Loa, respectively.
3.1 Temporal variations in the in situ CH4 concentrations in urban areas determined by ground-based high-precision measurements
To understand the errors in concentrations and emissions in the study area, we firstly analyzed the temporal variations and the spatial enhancements on the basis of ground-based observations. There were clear temporal variations in the high-precision in situ CH4 concentrations (Figs. 2 and 3) at all three sites from the urban BJ station to the suburban XH station to the regional background SDZ station. The concentrations at BJ and XH ranged from ∼ 2000 ppb for the baseline to 4000–5000 ppb for the peak values in September and November to February in some heavily polluted cases in winter. We further plotted frequencies higher than 2500 ppb for each month (Fig. S5), and autumn and winter months reached frequencies 20 % higher than spring and summer for BJ. These results could be associated with high emissions from nearby wetlands at XH in summer (July) and high residential and natural gas power plant emissions at BJ in winter (Ji et al., 2020).
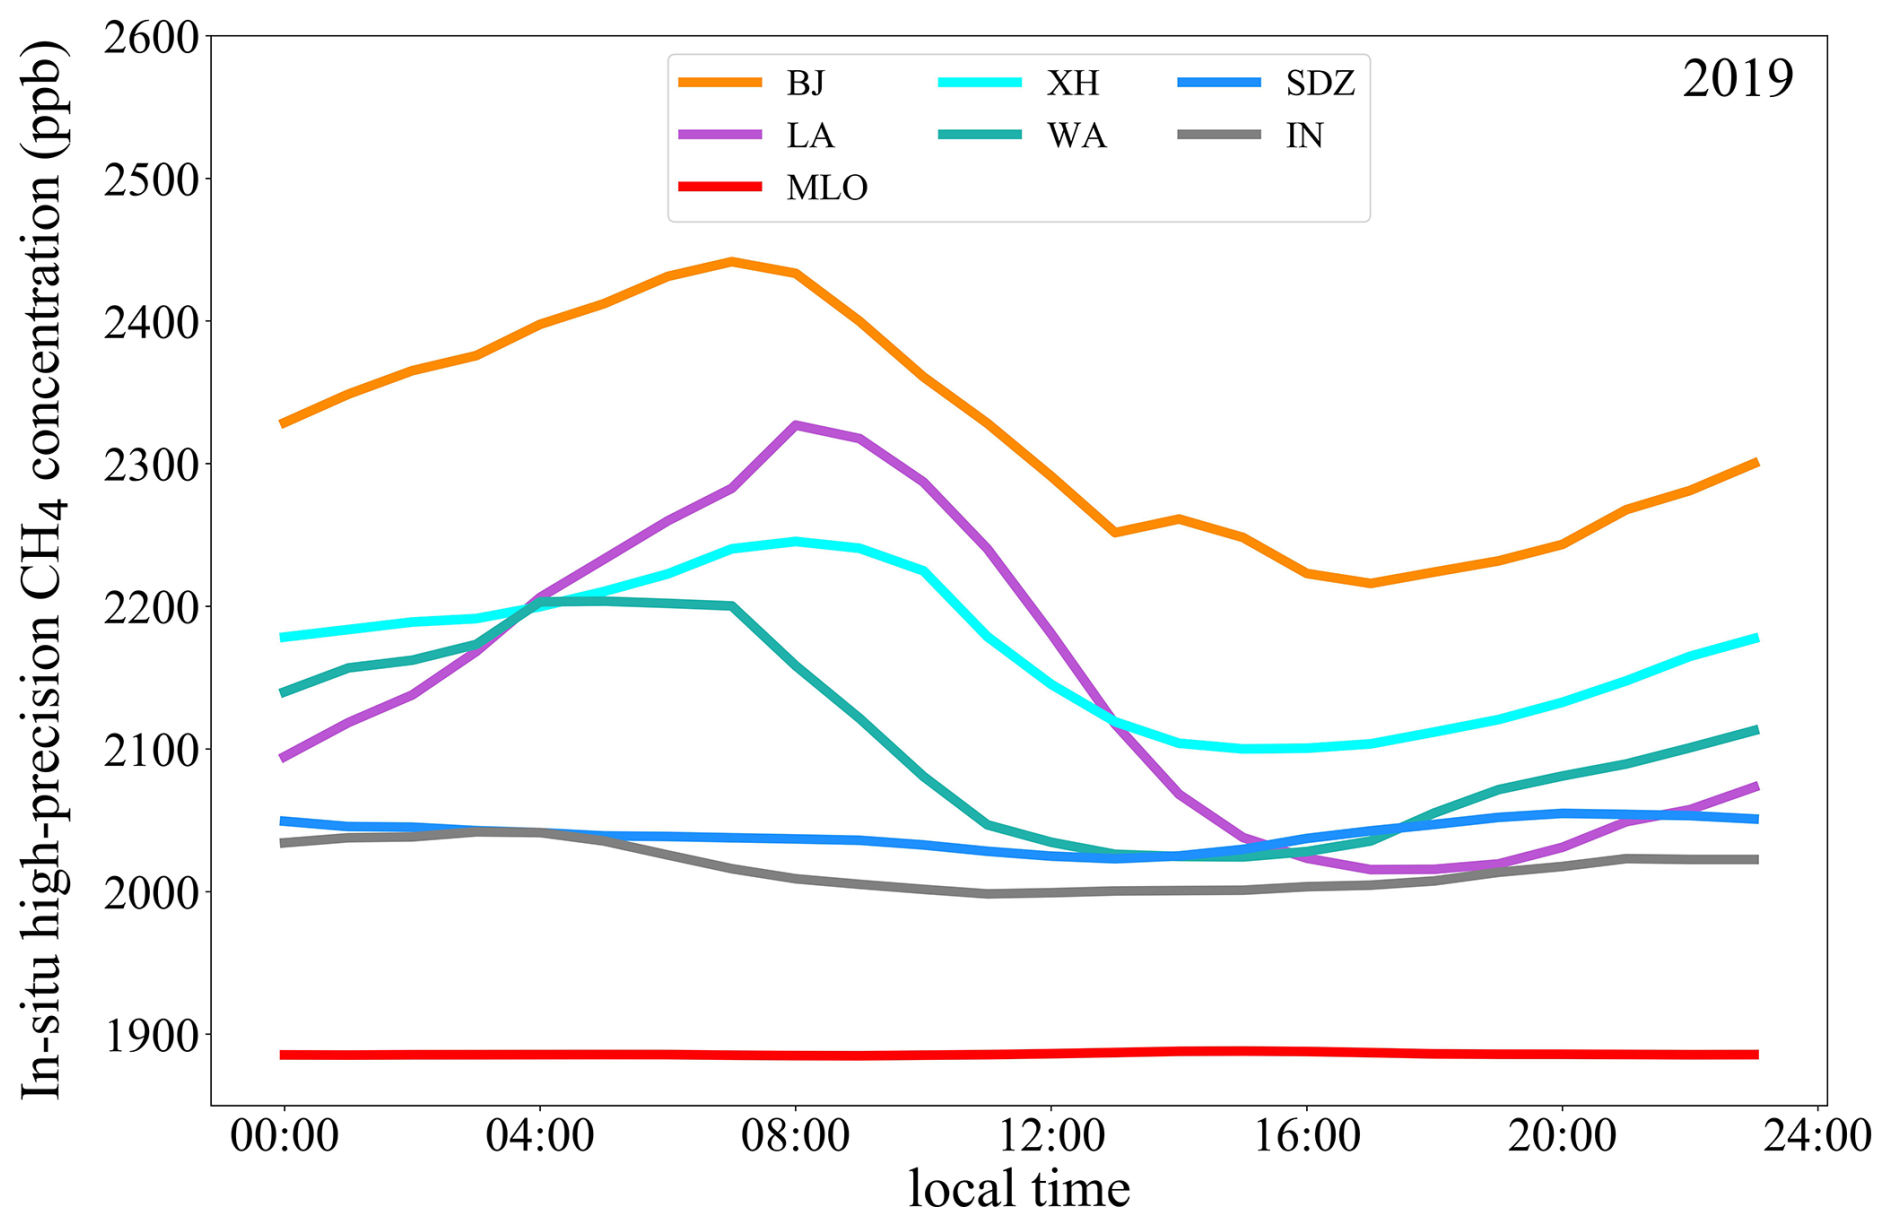
Figure 4Hourly mean of CH4 concentrations from 00:00–23:59 LT (local time) in 2019 at northern China and comparison sites in the USA (Mitchell et al., 2022). BJ, XH, SDZ, LA, WA, IN, and MLO denote Beijing, Xianghe, Shangdianzi, Los Angeles, Washington, Indianapolis, and Mauna Loa.
We compared our results with other observations in this region and similar latitudes in the USA. The results were consistent with the hourly concentrations (2000–6000 ppb) and enhancements (0–1800 ppb) in Xiaodian, near Taiyuan, Shanxi (Hu et al., 2023). Such high concentrations have also been observed in large cities in Canada and the USA, such as Los Angeles (LA) (Verhulst et al., 2017); Washington, DC, and Baltimore (WA) (Huang et al., 2019); and Indianapolis (IN) (Mitchell et al., 2022) (Fig. 4). And for overall hourly means of the 2019, BJ showed the highest concentrations, followed by LA and XH, and almost all sites showed diurnal variations with a peak around 08:00 LT (Fig. 4), due to the lower planetary boundary layer height (PBLH) and accumulation of emissions (Figs. S4 and S5) like CO2 (Bao et al., 2020; Zeng et al., 2021) and air pollutants (Chu et al., 2019; Su et al., 2018). Monthly mean data also showed high concentrations in autumn and winter in all sites, with BJ and XH much stronger, although with large hourly and daily variations (Figs. 3, S4, and S5). Furthermore, the WLG site (green line) provided a continental baseline, while the MLO site (red line) provided a global baseline. There were also notable seasonal cycles and high spatial gradients at the three regional sites (Figs. 2–4, respectively). In contrast, SDZ and WLG exhibited fewer seasonal cycles (Figs. 2–4).
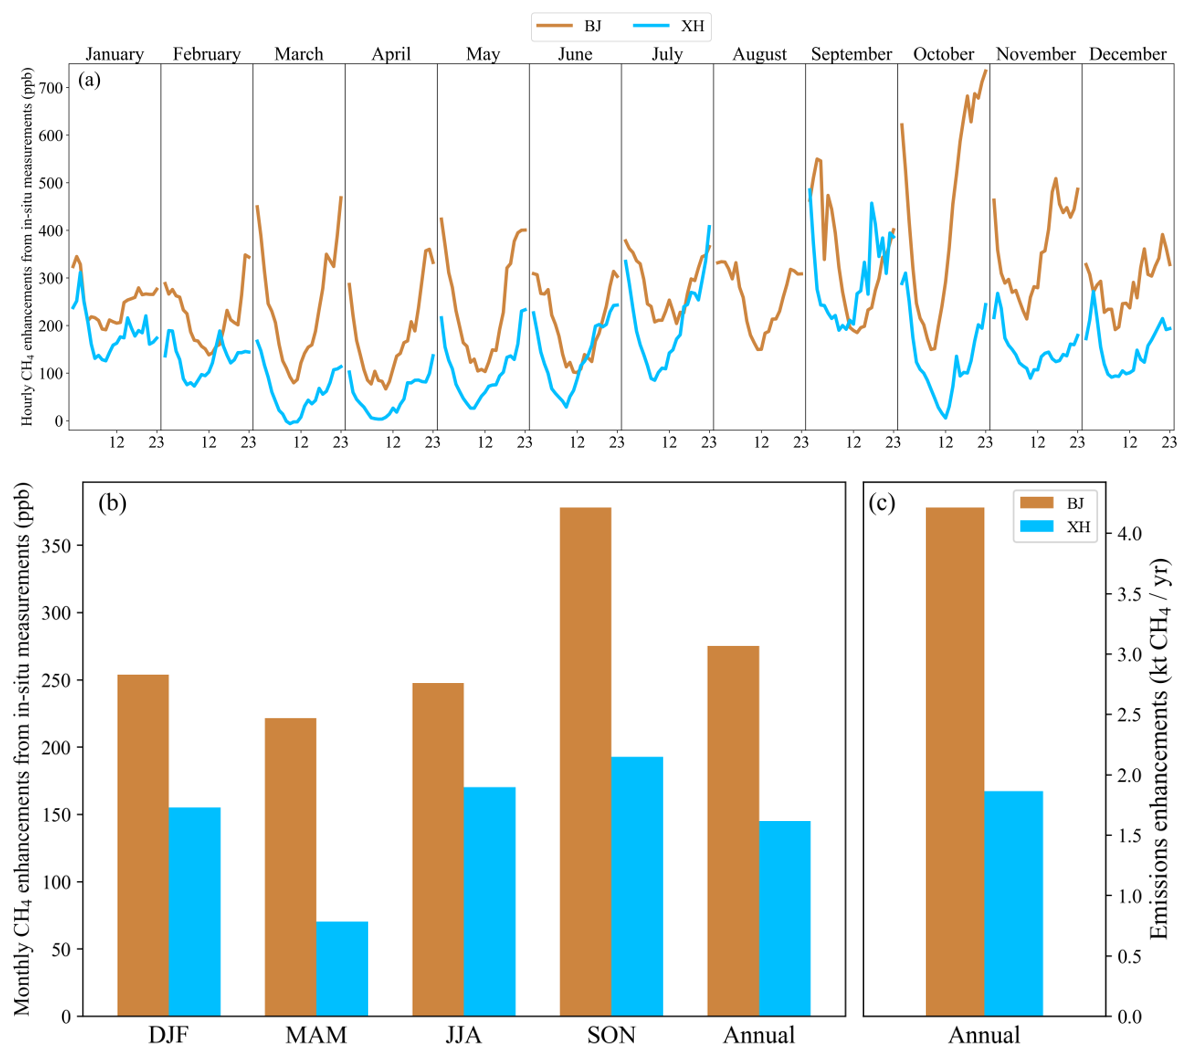
Figure 5Enhancements in the in situ CH4 concentrations and emissions at BJ and XH compared with those at SDZ for the hourly mean from 00:00–23:59 UTC in each month (a) and during the four seasons and for the annual mean (b) in 2019. Panel (c) denotes emissions enhancements at BJ and XH, compared with SDZ.
3.2 Temporal variations in the in situ CH4 enhancements in urban areas determined by ground-based high-precision measurements
For the CH4 enhancements in urban and suburban areas, the urban BJ station exhibited the greatest enhancements, with an annual mean enhancement ranging from 200–350 ppb over the 2019 season (Fig. 5a and b), followed by the suburban XH station (with seasonal enhancements ranging from 50–200 ppb), compared with the concentration at the regional background SDZ station. The jumps during the months shown in Fig. 5a occurred because the hourly means from 23:00–23:59 UTC (all times in the paper are given in UTC unless otherwise noted) within a certain month differed from those from 00:00–00:59 within the next month. The MLO data revealed the lowest surface concentrations (∼ 1800 ppb) and provided a global-scale background. The three regional sites all exhibited obvious enhancements over the MLO. The CH4 dome observed in northern China is comparable to that observed in other cities in Canada and the USA, such as Los Angeles (Verhulst et al., 2017) and Washington, DC (Huang et al., 2019), but higher than that observed in Salt Lake City and Toronto, with values ranging from 100–1000 ppb (Mitchell et al., 2022). These surface enhancements also exhibited seasonal cycles, with higher values in autumn (371 and 193 ppb at BJ and XH, respectively) and lower signals in spring (195 and 70 ppb at BJ and XH, respectively). Moreover, the monthly enhancements were consistent with this trend, with high enhancements from September to November (Fig. S3). We compared the enhancement for the whole time series (00:00–23:59) with the afternoon well-mixed period (14:00–16:00), and the annual mean differences between them are 59.1 ppb for Beijing and 62.5 ppb for XH (Fig. S4), respectively.
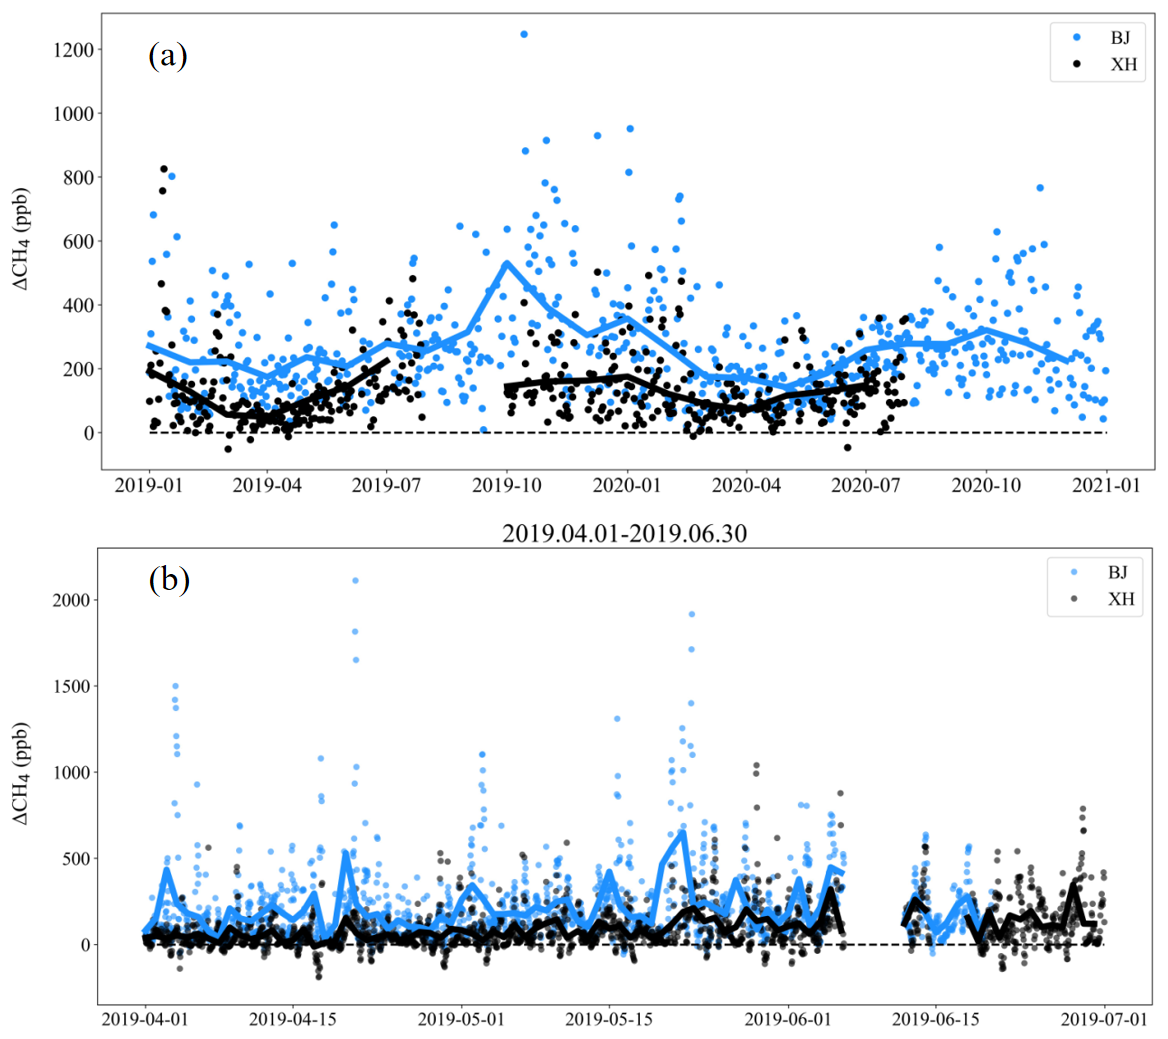
Figure 6Enhancements in the in situ CH4 concentrations at BJ and XH compared with that at SDZ for the daily (dots) and monthly (line) mean (a) from 2019–2020 and hourly (dots) and daily (line) mean (b) from 1 April to 30 June 2019 to show the high resolution and variation in time. Data gaps were due to instrument malfunctions.
Furthermore, to explore the high resolution and variations in time (Chen and Prinn, 2005; Rivera Martinez et al., 2023), we showed the enhancements in the in situ CH4 concentrations at BJ and XH compared with that at SDZ. For the daily (dots) and monthly (line) mean enhancements from 2019–2020 (Fig. 6a), the daily enhancements ranged from 0–1200 ppb, and the monthly enhancements ranged from 0–600 ppb during 2019–2020, and BJ enhancements were much higher than XH. Both sites showed higher enhancements in autumn and winter days. For the hourly to daily enhancements from 1 April to 30 June 2019 (Fig. 6b), the hourly enhancements reached 2000 ppb at polluted events, and daily enhancements ranged 0–500 ppb.
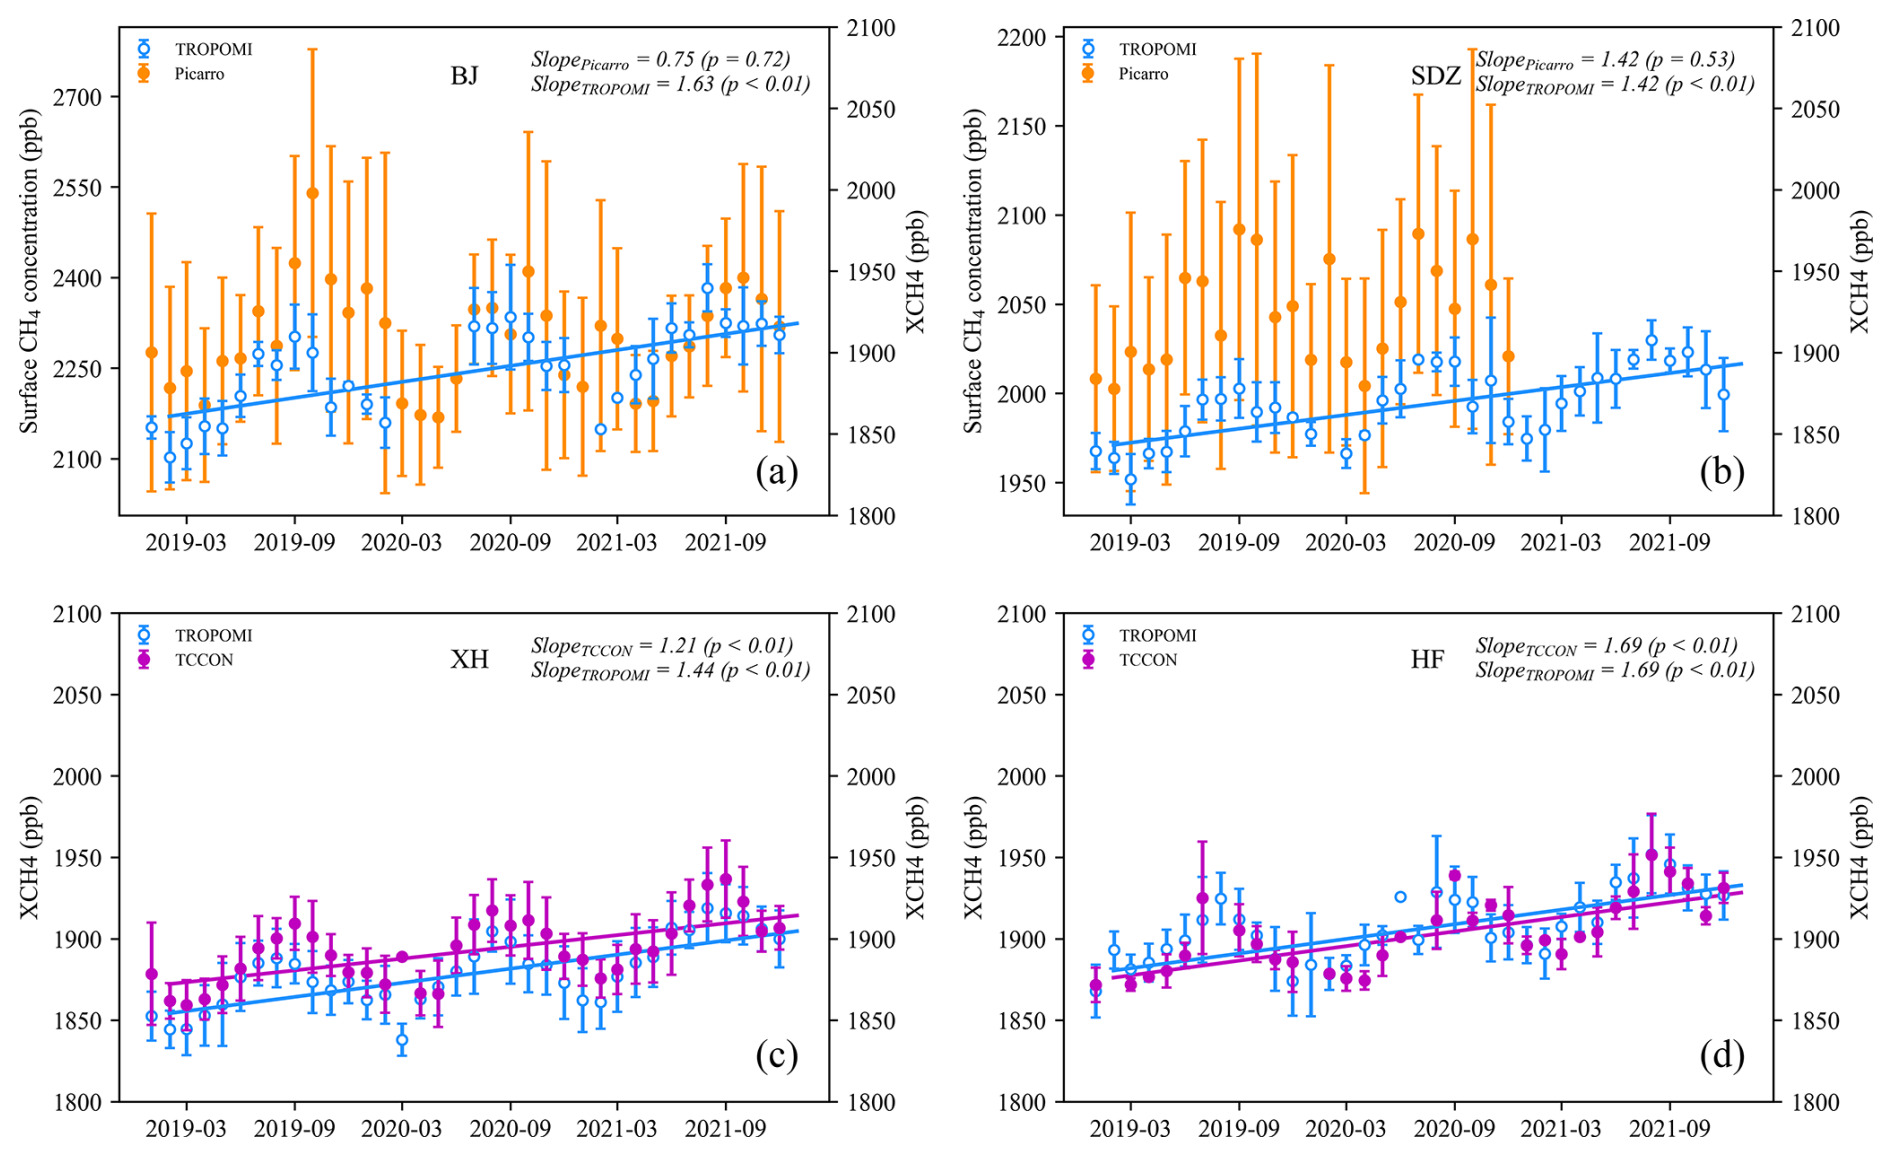
Figure 7Temporal variations in the mean monthly XCH4 and surface CH4 concentrations observed at the BJ (a), SDZ (b), XH (c), and HF (d) stations from 2019–2021. Note that the scales differ between BJ and SDZ, and the two y-axis plots in (a) and (b) have different scales (higher for Picarro). BJ, XH, SDZ, and HF represent Beijing, Xianghe, Shangdianzi, and Hefei, respectively.
3.3 Correlations between the satellite-based XCH4 concentrations and surface observations
Satellite observations have an advantage in spatial coverage, yet they need careful calibration and validation, especially for regional-scale studies. Surface concentrations are more influenced by ground emissions, yet they generally have good relationships with column concentrations (Fig. S22) (Ialongo et al., 2020). The satellite and surface observations generally agreed well in capturing seasonal variations: the CH4 concentration was highest in autumn, and the concentration decreased to a low level in winter (Fig. 7). The phase of the cycles in the seasonal column CH4 concentrations at BJ, XH, and SDZ from the TROPOMI data was consistent with that of the surface in situ measurements at the monthly scale (Figs. 7a, b and S3). However, the in situ CH4 concentrations were greatly influenced by local emissions and meteorological conditions, with larger amplitudes than those of the TROPOMI data, thus yielding lower correlations with XCH4 (R2 = 0.16 and 0.48, for p < 0.05 and 0.01 at BJ and SDZ, respectively; Fig. 7a and b). Furthermore, the urban BJ station exhibited higher XCH4 values than those at the suburban XH station and the regional background SDZ station, which is consistent with the surface in situ measurements with higher signals. These results also indicated high local anthropogenic emissions in the urban areas of Beijing. At HF, the average XCH4 was highest from August–September because of emissions originating from surrounding wetlands and rice paddies (Fig. 7d). BJ and SDZ exhibited the highest values from September–October.
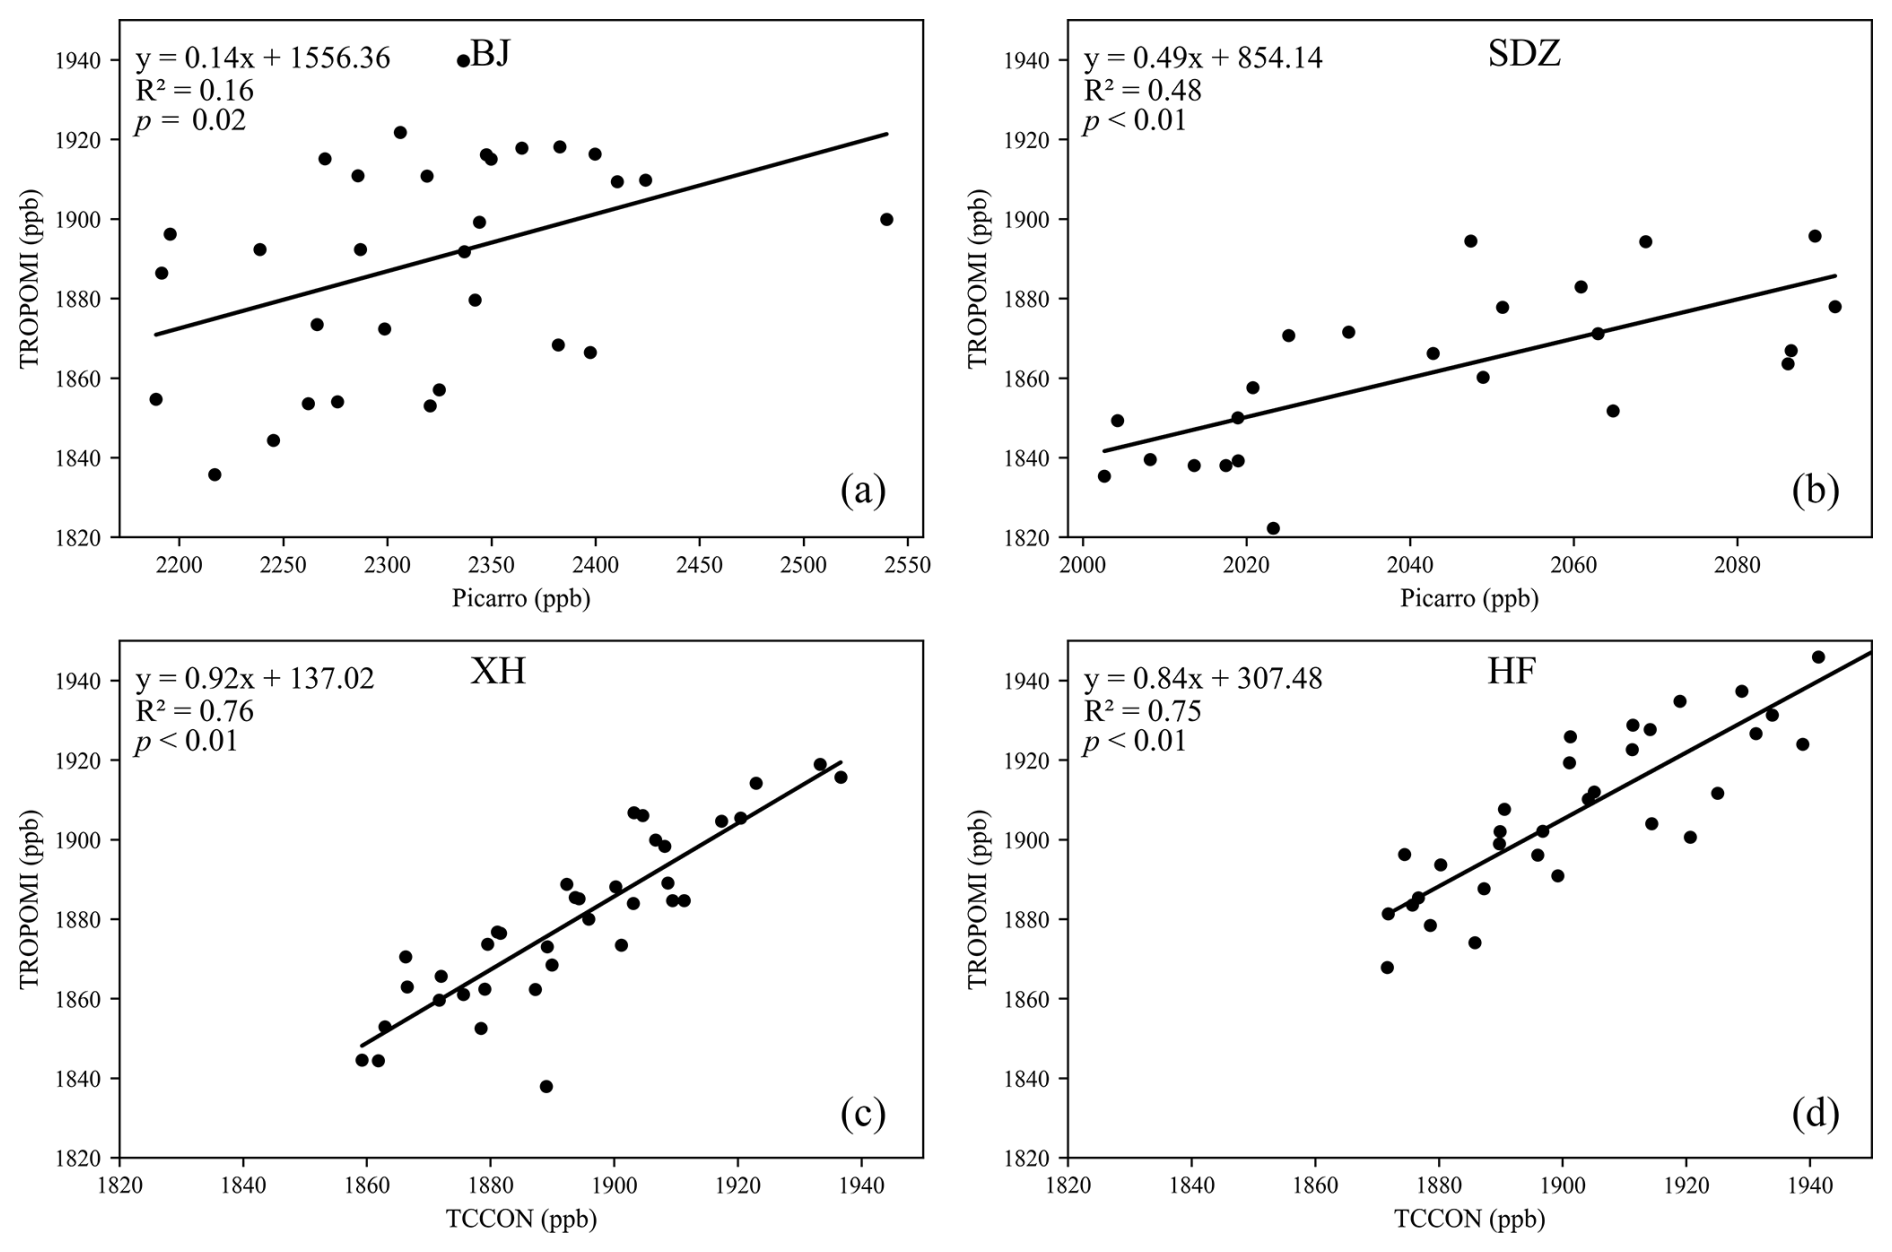
Figure 8Correlations between the mean monthly XCH4 concentration from the TROPOMI dataset and the surface CH4 concentration observed at BJ (a) and SDZ (b) and correlations between the mean monthly XCH4 concentrations from the TROPOMI and TCCON datasets at XH (c) and HF (d) from 2019–2021. BJ, XH, SDZ, and HF represent Beijing, Xianghe, Shangdianzi, and Hefei, respectively.
As expected, the phase and magnitude of the seasonal cycles observed in the TROPOMI data at XH and HF agreed better with those in the TCCON data than the in situ comparisons did (Fig. 8), with higher variations in the in situ observations (Figs. 8a, b and S11). The R2 values were 0.76 and 0.75 for XH and HF (Fig. 8c and d), respectively, which are higher than those with the in situ observations (Fig. 8a and b), with a p value < 0.01 at both sites. Moreover, a daily-scale comparison showed much weaker correlations (Figs. S11–S13). Furthermore, the surface CH4 concentrations at XH site observed by Picarro showed differences when retrievals were successful and not for TCCON (Fig. S14). And when retrievals were not successful, the surface CH4 concentrations usually reached peaks. The reduced air pressure was not considered in the comparisons across different sites (Beijing, Xianghe, Shangdianzi, and Hefei), and the elevations of these four sites were less than 500 m, which is within the boundary layer, where CH4 concentrations are mixed well. We also acknowledge that it is better to consider this factor when comparing with the higher-elevation observations such as at Shanxi sites.
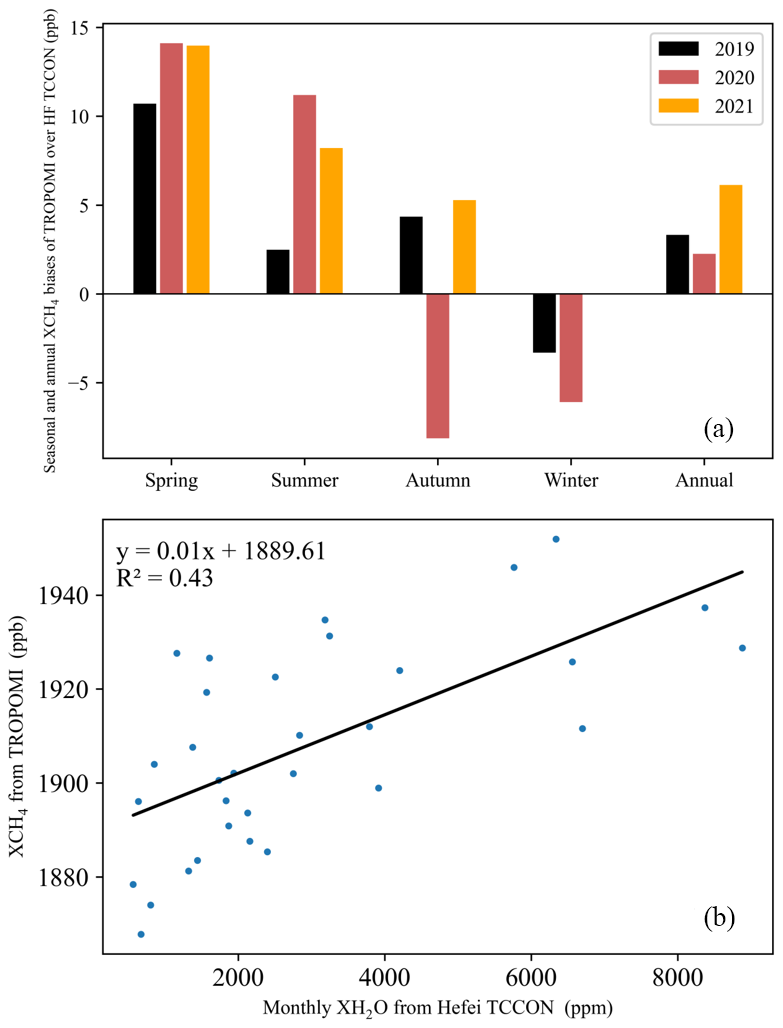
Figure 9(a) Seasonal and annual biases of the TROPOMI XCH4 observations minus the Hefei TCCON observations from 2019–2021. (b) Positive correlations between the monthly XH2O from the Hefei TCCON observations and XCH4 from the TROPOMI observations.
Moreover, there were seasonal trends between the TROPOMI and TCCON observations, with positive biases in the TROPOMI observations in spring and summer (5–15 ppb, or 0.5 %) and negative biases in winter (∼ −5 ppb, or 0.25 %) compared with the TCCON observations, which is consistent with the findings of Sha et al. (2021). We further analyzed the bias at three resolutions at 0.1, 0.25, and 2.5° (Fig. S10), and the mean bias increased with the TROPOMI resolution, from −4.2 to −13.8 ppb in XH and −0.7 to 4.4 ppb in HF, but lower resolution would match fewer TROPOMI observations, indicating a moderate resolution is needed. The TROPOMI XCH4 and Hefei TCCON XH2O values were significantly positively correlated, with R2 = 0.43 and a p value < 0.01 (Fig. 9b). Similar results have also been reported in other studies. High CH4 biases at high latitudes correlated with H2O columns were found in H2O retrievals from TROPOMI by Schneider et al. (2020) and Lorente et al. (2021). The satellite retrieval biases might also be associated with cloudiness in summer and thus the limited number of TROPOMI observations (Qu et al., 2021) and relevant surface albedo and scattering issues (Barré et al., 2021; Schneising et al., 2023, 2019). Moreover, we calculated the XCH4 and in situ CH4 growth rates. The XCH4 level observed from the TROPOMI data clearly increased from 2019–2021, with increase rates ranging from 1.4 to 1.6 ppb per month (p < 0.01, Fig. 7). Future TROPOMI validations for potential H2O impacts need vertical profile observations in the southern area (e.g., in Anhui and Henan Province) in summer.
Furthermore, the satellite platforms measure radiance, which is then used to invert or constrain a column concentration loading. There are additional assumptions and steps required to go from concentration to emissions. And both steps introduce uncertainties and errors. Several recently published papers demonstrated that the latter step can lead to extremely different emissions end-point inversions, especially at high spatial and temporal resolution (Guanter et al., 2021; Pei et al., 2023; Qin et al., 2023). In order to assess the precision and uncertainty, several errors need to be considered: measurement errors, parameter errors, approximation errors, resolution errors, and system errors (Povey and Grainger, 2015). And the use of ensemble techniques (e.g., different algorithms or forward models) to present multiple self-consistent realizations of a dataset is useful in depicting unquantified uncertainties. Furthermore, although the inversion algorithms and related processing methods of TCCON and TROPOMI are different, TCCON, as a calibration standard for docking with WMO, can be used as satellite authenticity test data, and the comparison between TCCON and TROPOMI can be used to transmit WMO standards to satellite observations.
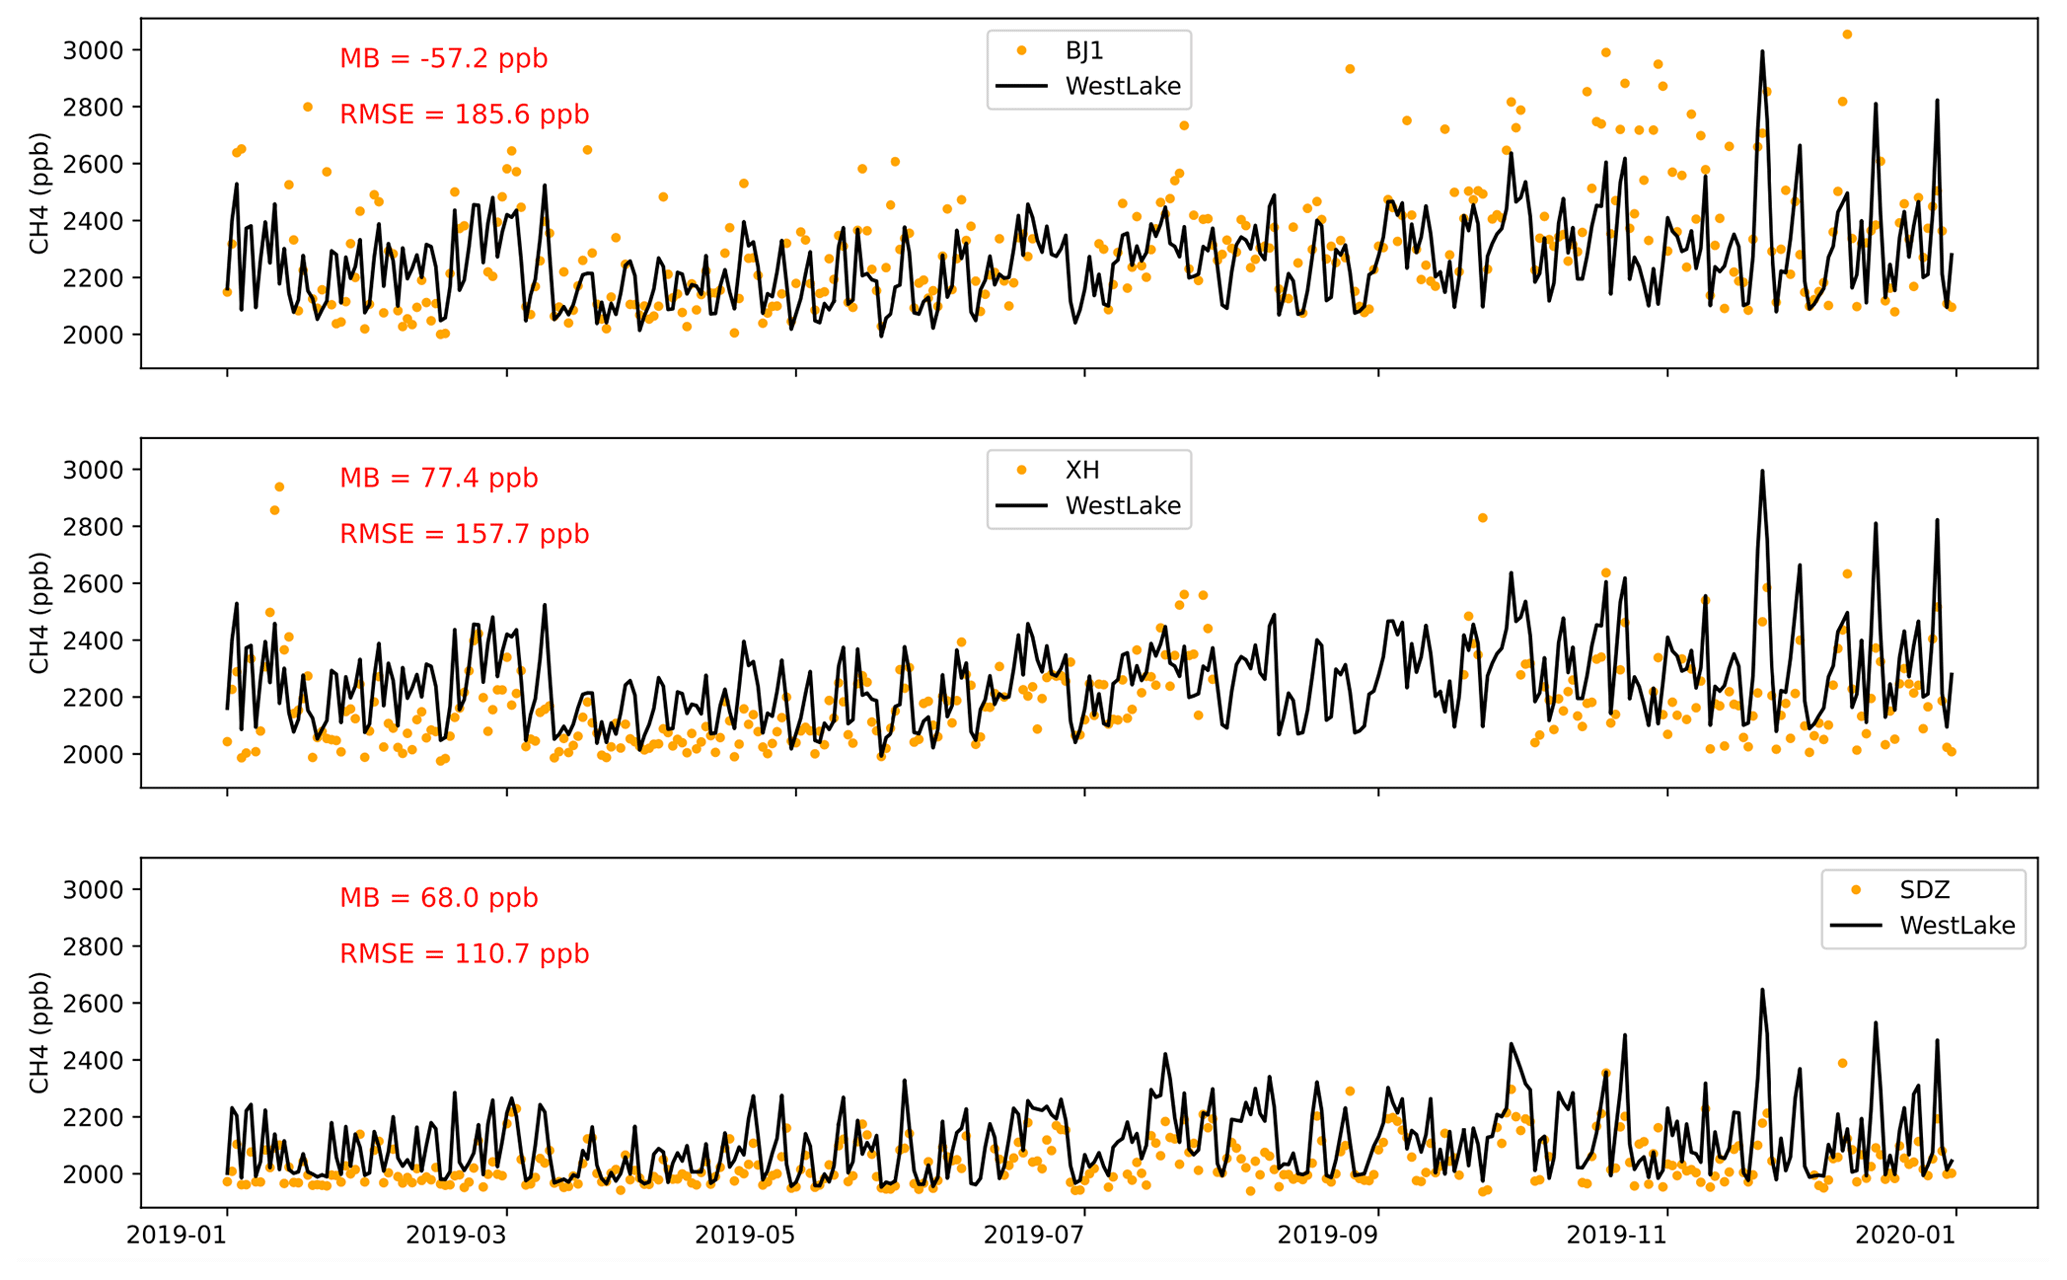
Figure 10Daily comparisons of the Westlake model simulations with the in situ high-precision measurements at the three sites. MB denotes the mean bias, and RMSE is the mean root square error. BJ, XH, and SDZ denote the observations from the Beijing, Xianghe, and Shangdianzi stations, respectively.
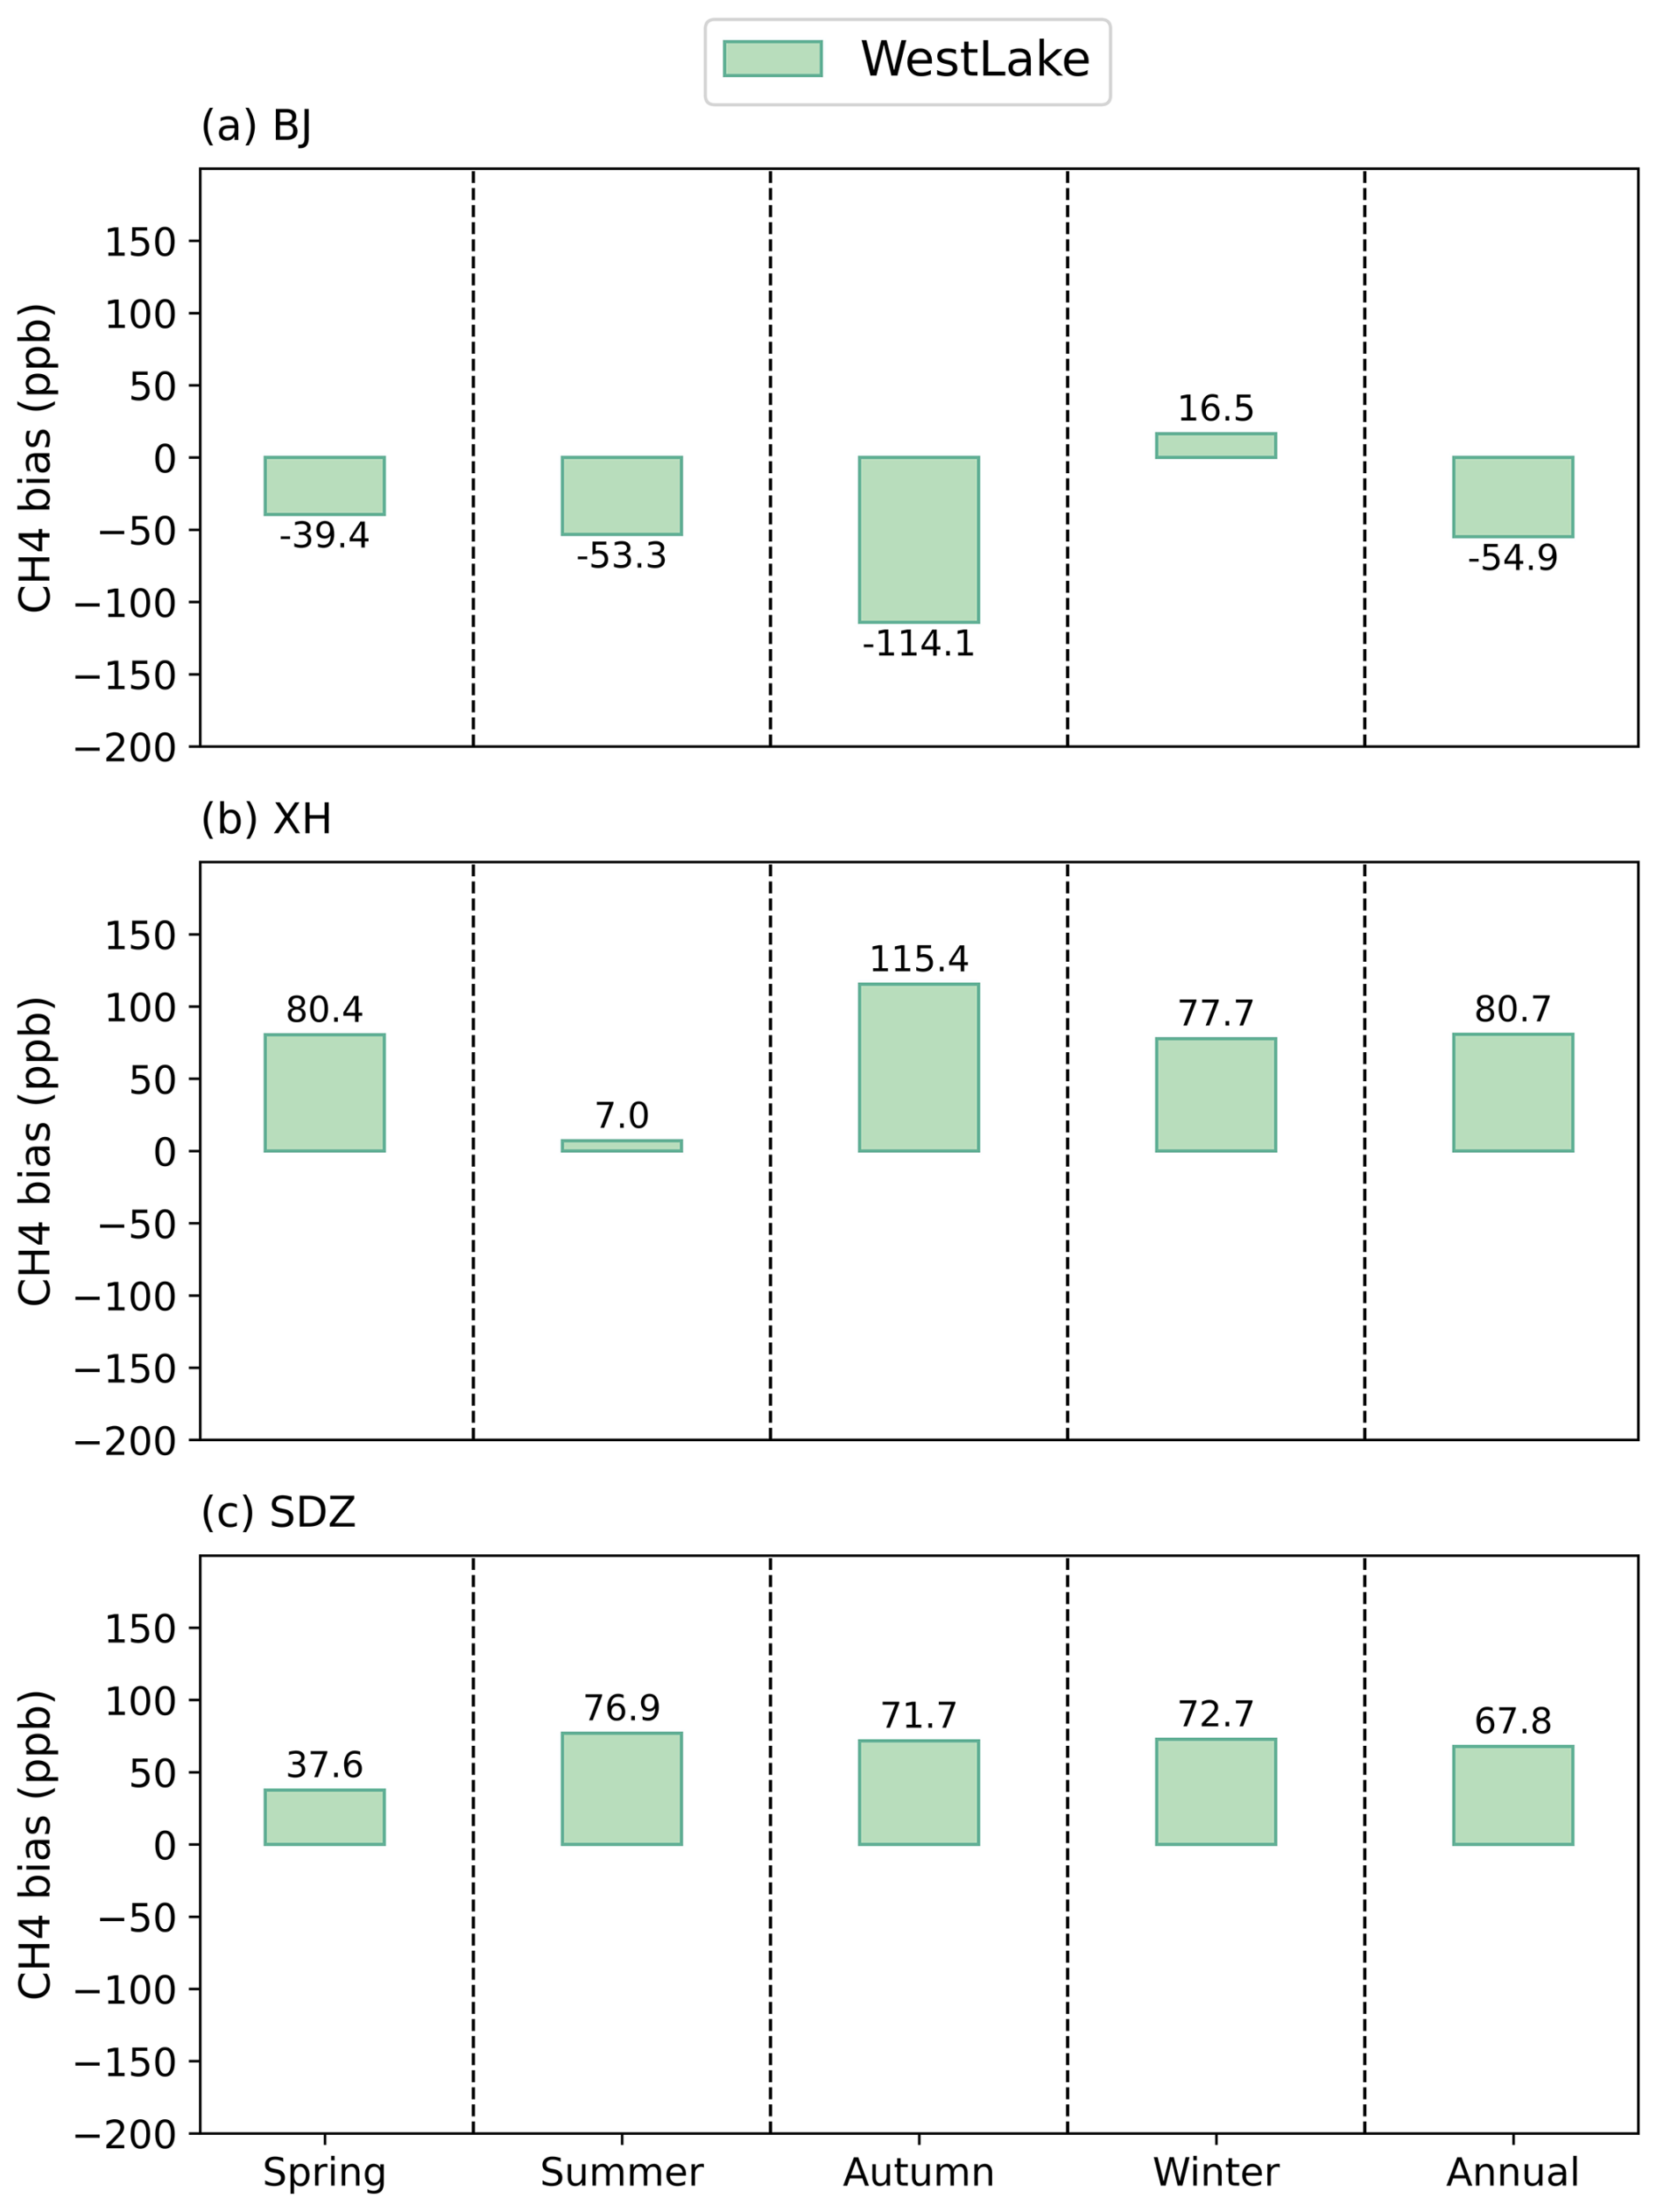
Figure 11Seasonal and annual biases for the Westlake model compared with the high-precision in situ measurements at BJ, XH, and SDZ. BJ, XH, and SDZ represent Beijing, Xianghe, and Shangdianzi, respectively.
3.4 Validation of the model performance against in situ measurements
To assess the accuracy of the posterior CH4 data from the GEOS-Chem and CAMS models, we compared the simulated concentrations with the high-precision measurements at BJ, XH, and SDZ. We used the mean bias (MB) and root mean square error (RMSE) to assess the model performance. The MB is an indicator of systematic biases, while the RMSE reflects the spread in simulations, with higher weights for large errors. In general, the models captured the CH4 trends and variations (Figs. 7 and 8, respectively). The daily comparisons between the simulations and observations revealed a negative bias at the urban BJ site (MB = −57.2 ppb) and positive biases at the XH (77.4 ppb) and SDZ (68.0 ppb) sites (Fig. 10). The optimized GEOS-Chem model captured the observed baseline at BJ (Fig. 10a) but slightly overestimated the baselines at XH and SDZ (Figs. 10 and 11). Moreover, the RMSEs for the three sites decreased from the urban BJ site (185.6 ppb) to the suburban XH site (157.7 ppb) and the regional background SDZ site (110.7 ppb) (Fig. 11). The simulations could not capture some of the peak values in urban Beijing (Fig. 10a), indicating considerable simulation challenges in urban areas with complex anthropogenic emissions, which is consistent with the CO2 and air pollutant simulations (Feng et al., 2019; Liang et al., 2022). And this requires a high-resolution CH4 simulation and inversion system to assimilate the observed urban–rural gradient.
The seasonal and annual biases of the GEOS-Chem and CAMS models relative to the in situ measurements were calculated (Figs. 11 and S16). Both models showed negative biases (−39 to −152 ppb) from spring to autumn in Beijing and positive biases (17–86 ppb) in winter, which was due to the higher-baseline simulations on clean days (Fig. 11a). The GEOS-Chem model simulations revealed positive biases in the annual mean at the suburban and regional background sites during most seasons (Fig. 11b and c). The CAMS model showed positive biases at XH and negative biases at SDZ, and both sites showed positive biases in winter (Fig. 11b and c). The hourly and monthly comparisons also revealed similar variations and trends (Figs. S5 and S6, respectively), while the monthly and seasonal data from the CAMS model also revealed negative biases in urban areas and positive biases in suburban areas, with lower biases at the suburban and regional background sites than at the urban site (Figs. 8c and S6). As researched by Zhang et al. (2024) and in this study, the outdated a priori emissions datasets indeed introduced errors into both spatial distribution and magnitude, and the temporal variation introduced errors in forward transport simulation and thus inversions (Figs. 10 and 11, biases at three sites). These errors could be largely adjusted by the data assimilation algorithm, but more accurate a priori data could induce fewer errors in the data assimilation and produce more accurate posterior estimates. Yu et al. (2021) described the impact of errors in prior estimates on inversions results. And they showed that 4D-Var analysis of the TROPOMI data improved monthly emission estimates at 25 km, even with a spatially biased prior.
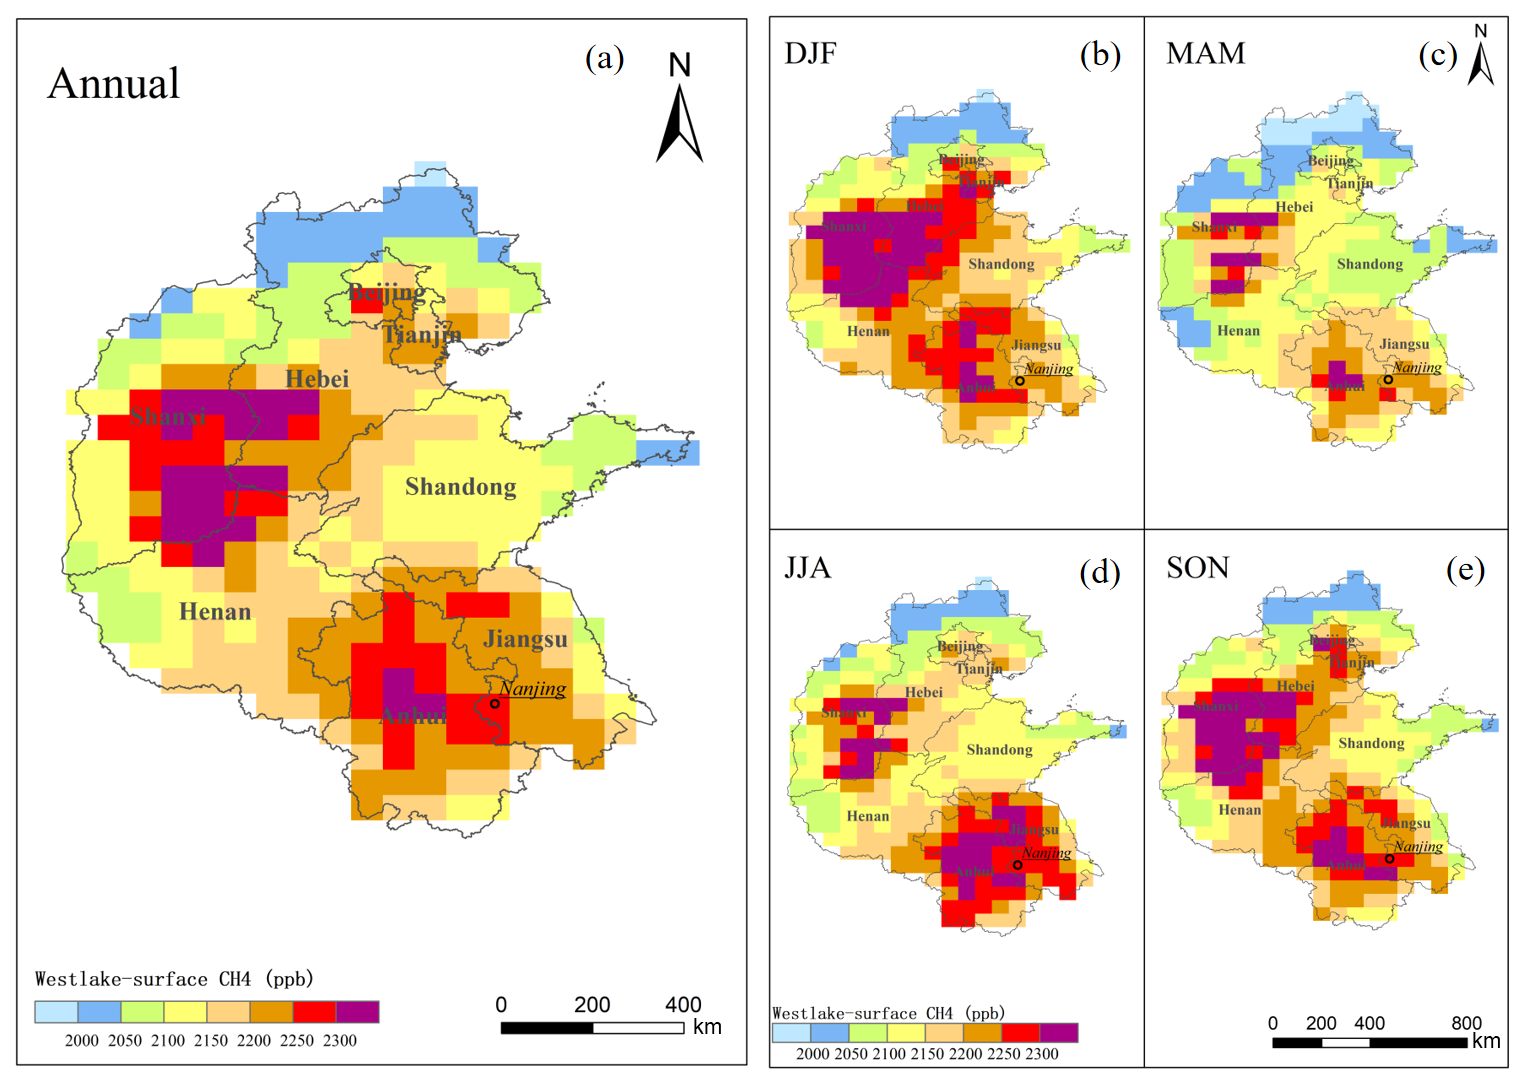
Figure 12Posterior annual and seasonal spatial distributions of the surface CH4 concentration (Westlake model) in northern China in 2019. For the annual panel, purple is used to show the coal mining emissions, which are generally consistent with the high-concentration regions.
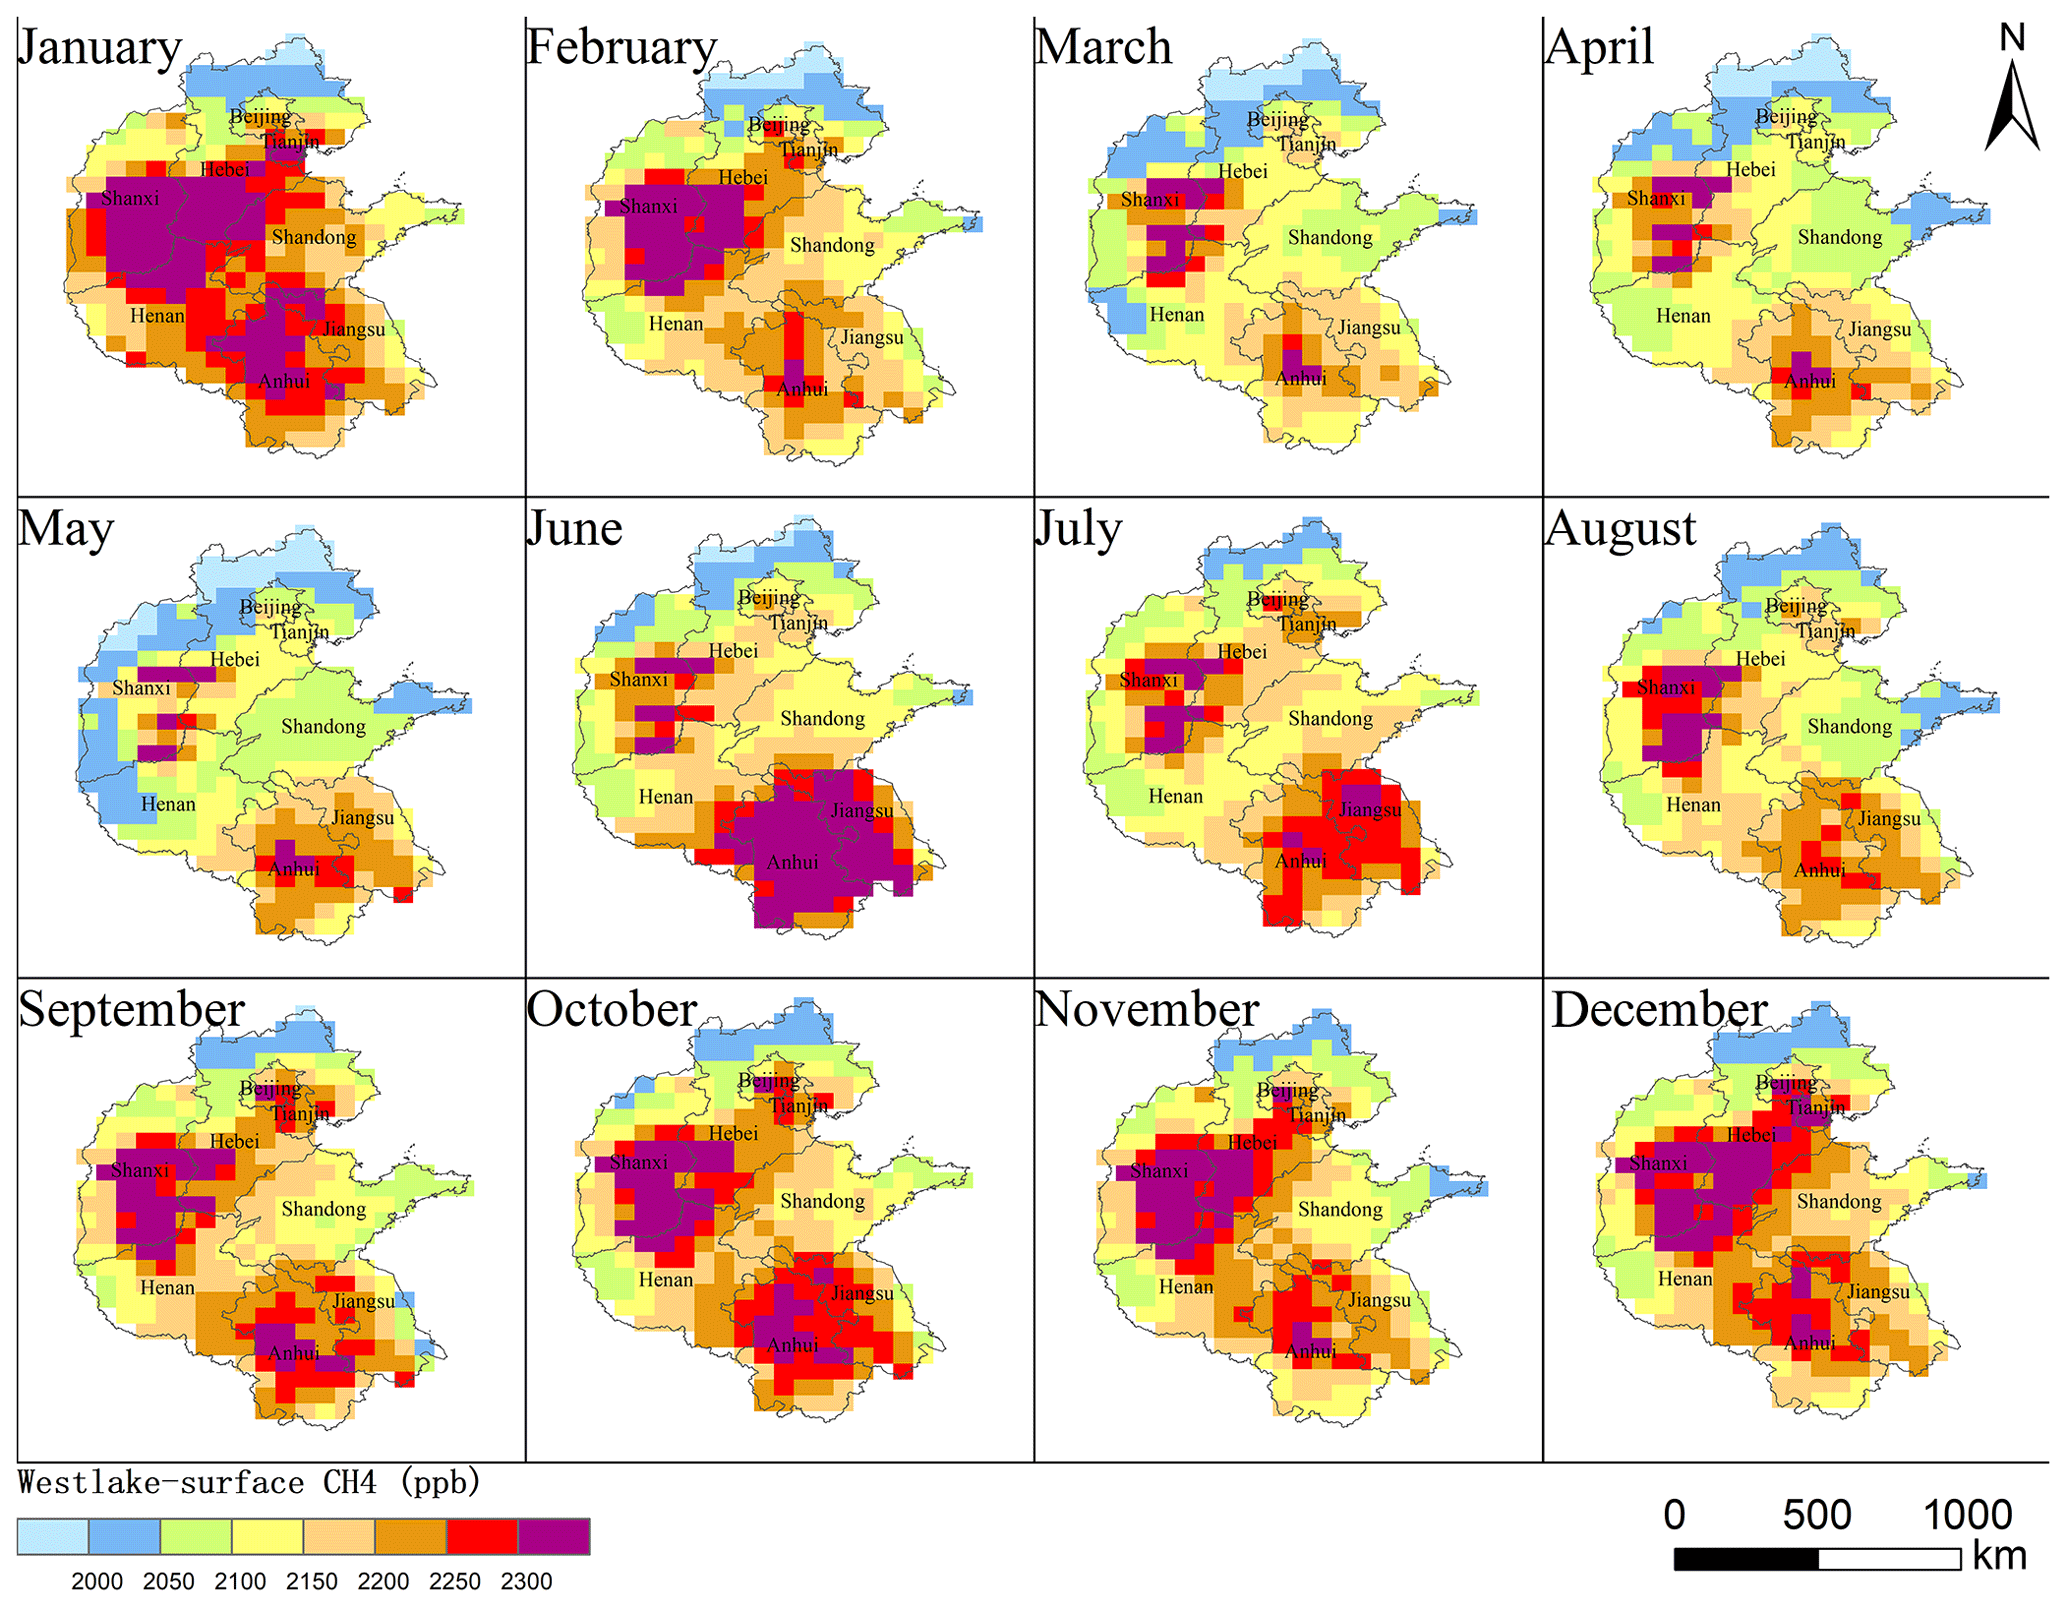
Figure 13Posterior monthly spatial distributions of the surface CH4 concentration (Westlake model) in northern China in 2019.
3.5 Spatial characteristics of the inversion-optimized surface CH4 concentrations and their correlations with emissions
Northern China serves as a notable CH4 source, and the total emissions increased to 14.2 Tg yr−1 in 2019 (Figs. 1, 15, and S2), accounting for 30 % of the total emissions in China (Fig. S25) (Liu et al., 2021b). Correspondingly, the optimized GEOS-Chem model surface CH4 concentration reached 2112.1 ppb in 2019. High surface concentrations were mostly consistent with high emissions in southern Shanxi (mainly coal mine emissions), northern Henan, central-northern Anhui, southern Hebei, and Beijing (Figs. 12, 13, S17, S18, and 1), which has also been reported by Peng et al. (2023), Qin et al. (2023), and Han et al. (2024a) in Shanxi. These enhancements are not only located in large urban areas but also located in coal and oil production areas (Figs. 12, 13, S17, and S18). In contrast, most parts of Shandong, Jiangsu, and northern Hebei indicated a relatively low annual mean concentration in 2019. In terms of seasonal and monthly spatial patterns, spring (March–April–May) exhibited the lowest values, while autumn (September–October–November) and winter (January–February) exhibited much higher concentrations (Figs. 12 and 13, respectively). The northern part demonstrated lower concentrations in winter than in summer, largely due to the favorable climatic conditions for dispersion, with greater wind speeds in winter than during the other seasons (Figs. 9 and 10). We also compared the Westlake column CH4 data with the TROPOMI observations, and these two datasets exhibited consistent spatial patterns across all seasons (Fig. S19) and suitable correlations (R2 = 0.46–0.74, p < 0.01; Fig. S20).
Moreover, the spatial patterns of the surface and column concentrations revealed consistent trends in spring (March–April–May) and summer (June–July–August) (Figs. 12, 13, and S19–S22), and the R2 values for the correlations during four seasons were 0.46–0.74 for TROPOMI XCH4 and Westlake XCH4 (Fig. S20). Moreover, we selected 3 high-concentration (emitting) days in 2019 (Fig. S23). Although there were systematic errors between TROPOMI- and Westlake-modeled results, they showed generally consistent spatial patterns, with much higher concentrations in southern Shanxi and Henan and lower concentration in northern Shanxi and northern Hebei. And the R even reached 0.6–0.7 for two cases, which is consistent with studies on TROPOMI NO2 (Ialongo et al., 2020; Verhoelst et al., 2021; Wang et al., 2021).
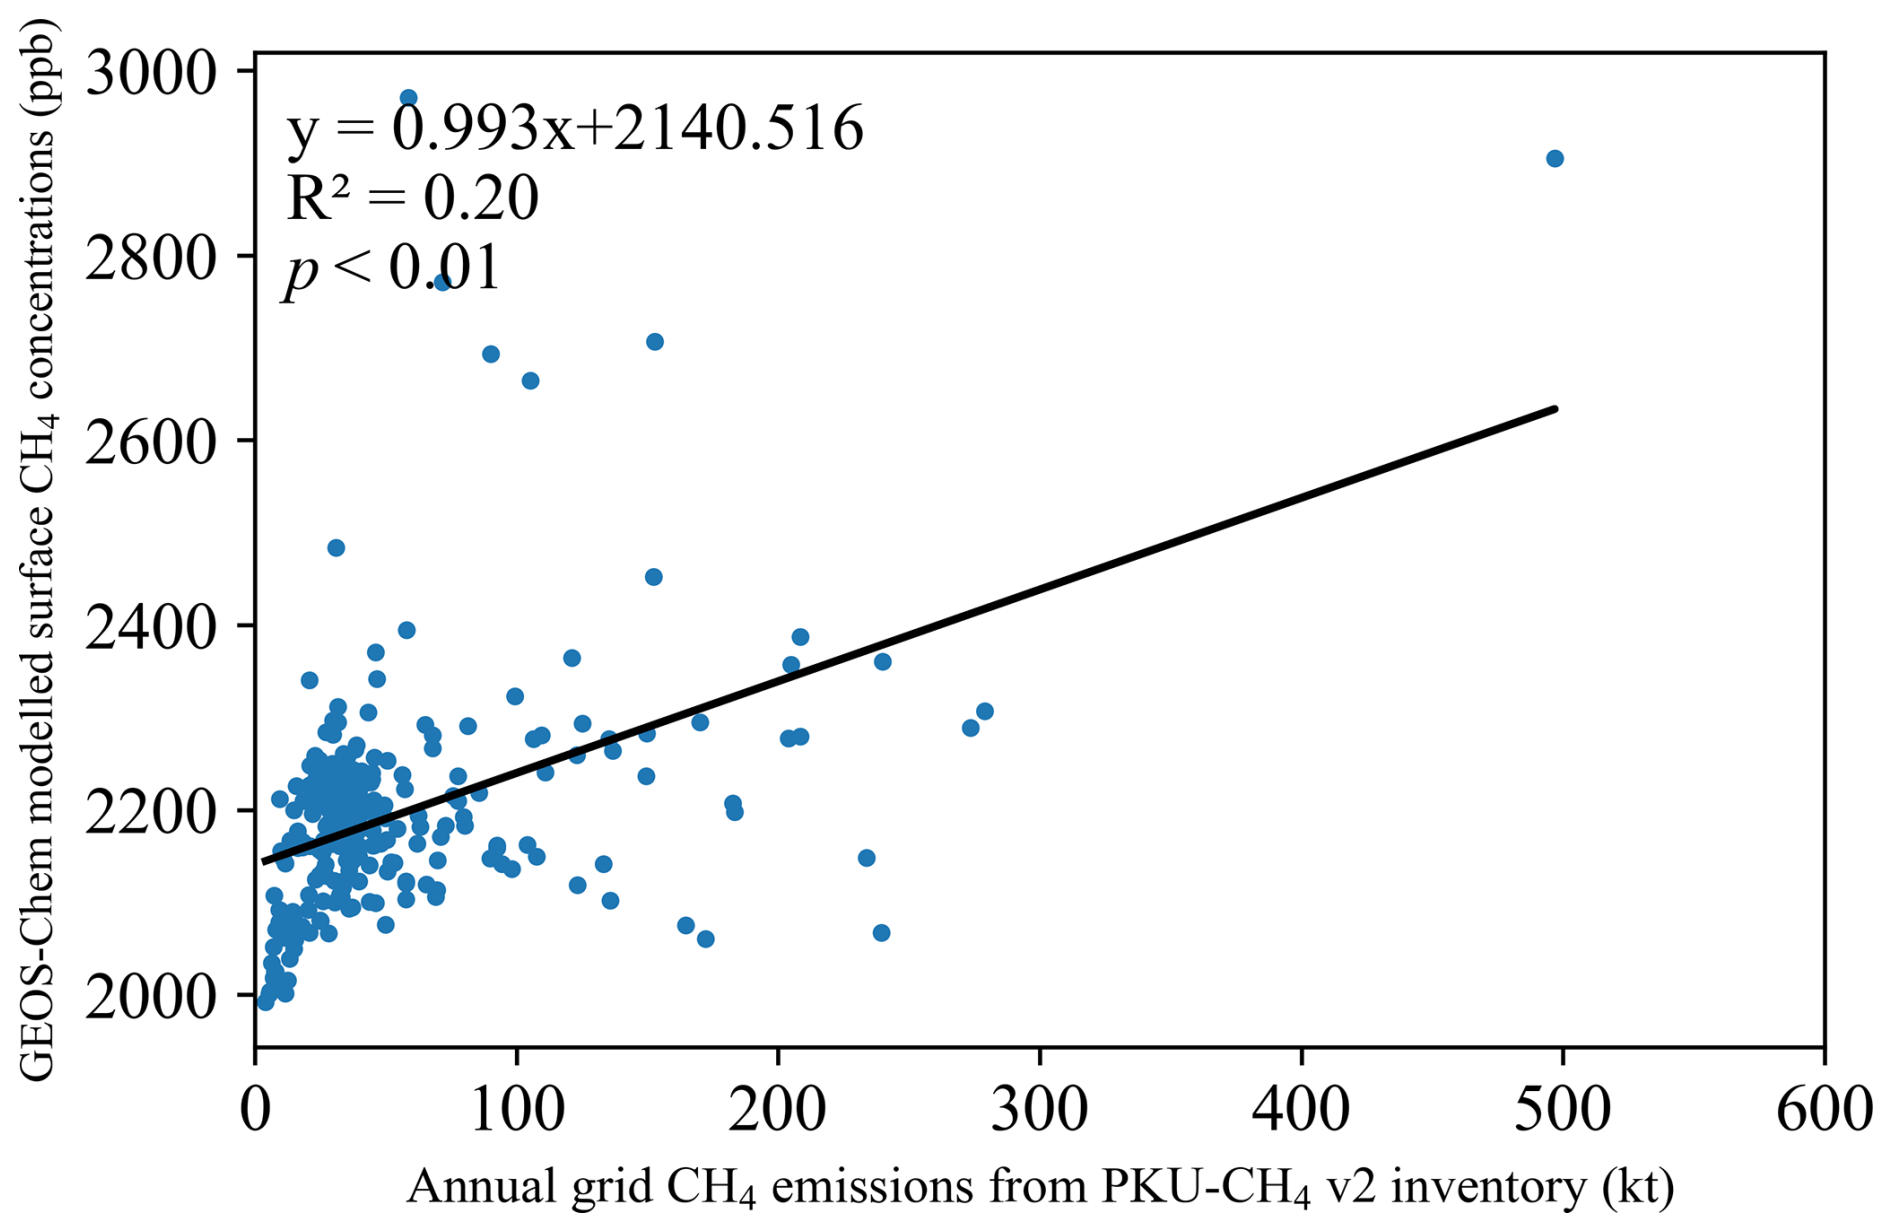
Figure 14Correlations between the CH4 emissions from the PKU-CH4 v2-modeled and Westlake-modeled surface CH4 concentrations. PKU-CH4 data (10 km resolution) were aggregated to Westlake-modeled resolution (50 km) for consistency.
Enhanced surface CH4 concentrations are an indication of high local emissions associated with coal mining, oil and gas activities, agriculture, or wetland processes (Barré et al., 2021; Gouw et al., 2020; Zhang et al., 2020). The correlation between the PKU-CH4 v2 emissions and the simulated surface concentrations at the grid level (Fig. 14) was statistically significant (p < 0.05), albeit with a low R2 value of 0.20. Regressions with or without two outliers or different emissions intervals also showed similar positive correlations (Fig. S24). Positive relationships with low R2 have also been found in oil and gas production regions in the USA (Gouw et al., 2020).
Moreover, we found a positive correlation between the Westlake column CH4 and PKU-CH4 v2 emission inventories (Fig. S24), which demonstrates the ability of satellite data to detect large local sources, such as coal mining (Peng et al., 2023), in urban regions. Recent studies have also indicated that TROPOMI data combined with other satellite observations can be employed to identify large emission sources in gas and oil well blowouts (Schuit et al., 2023; Cusworth et al., 2021). These findings showed the potential use of satellite data in detecting hotspot emissions that may be omitted from emissions inventory, and thus further mobile observations (e.g., cars and UAVs) can be used for field double check in environmental enforcement.
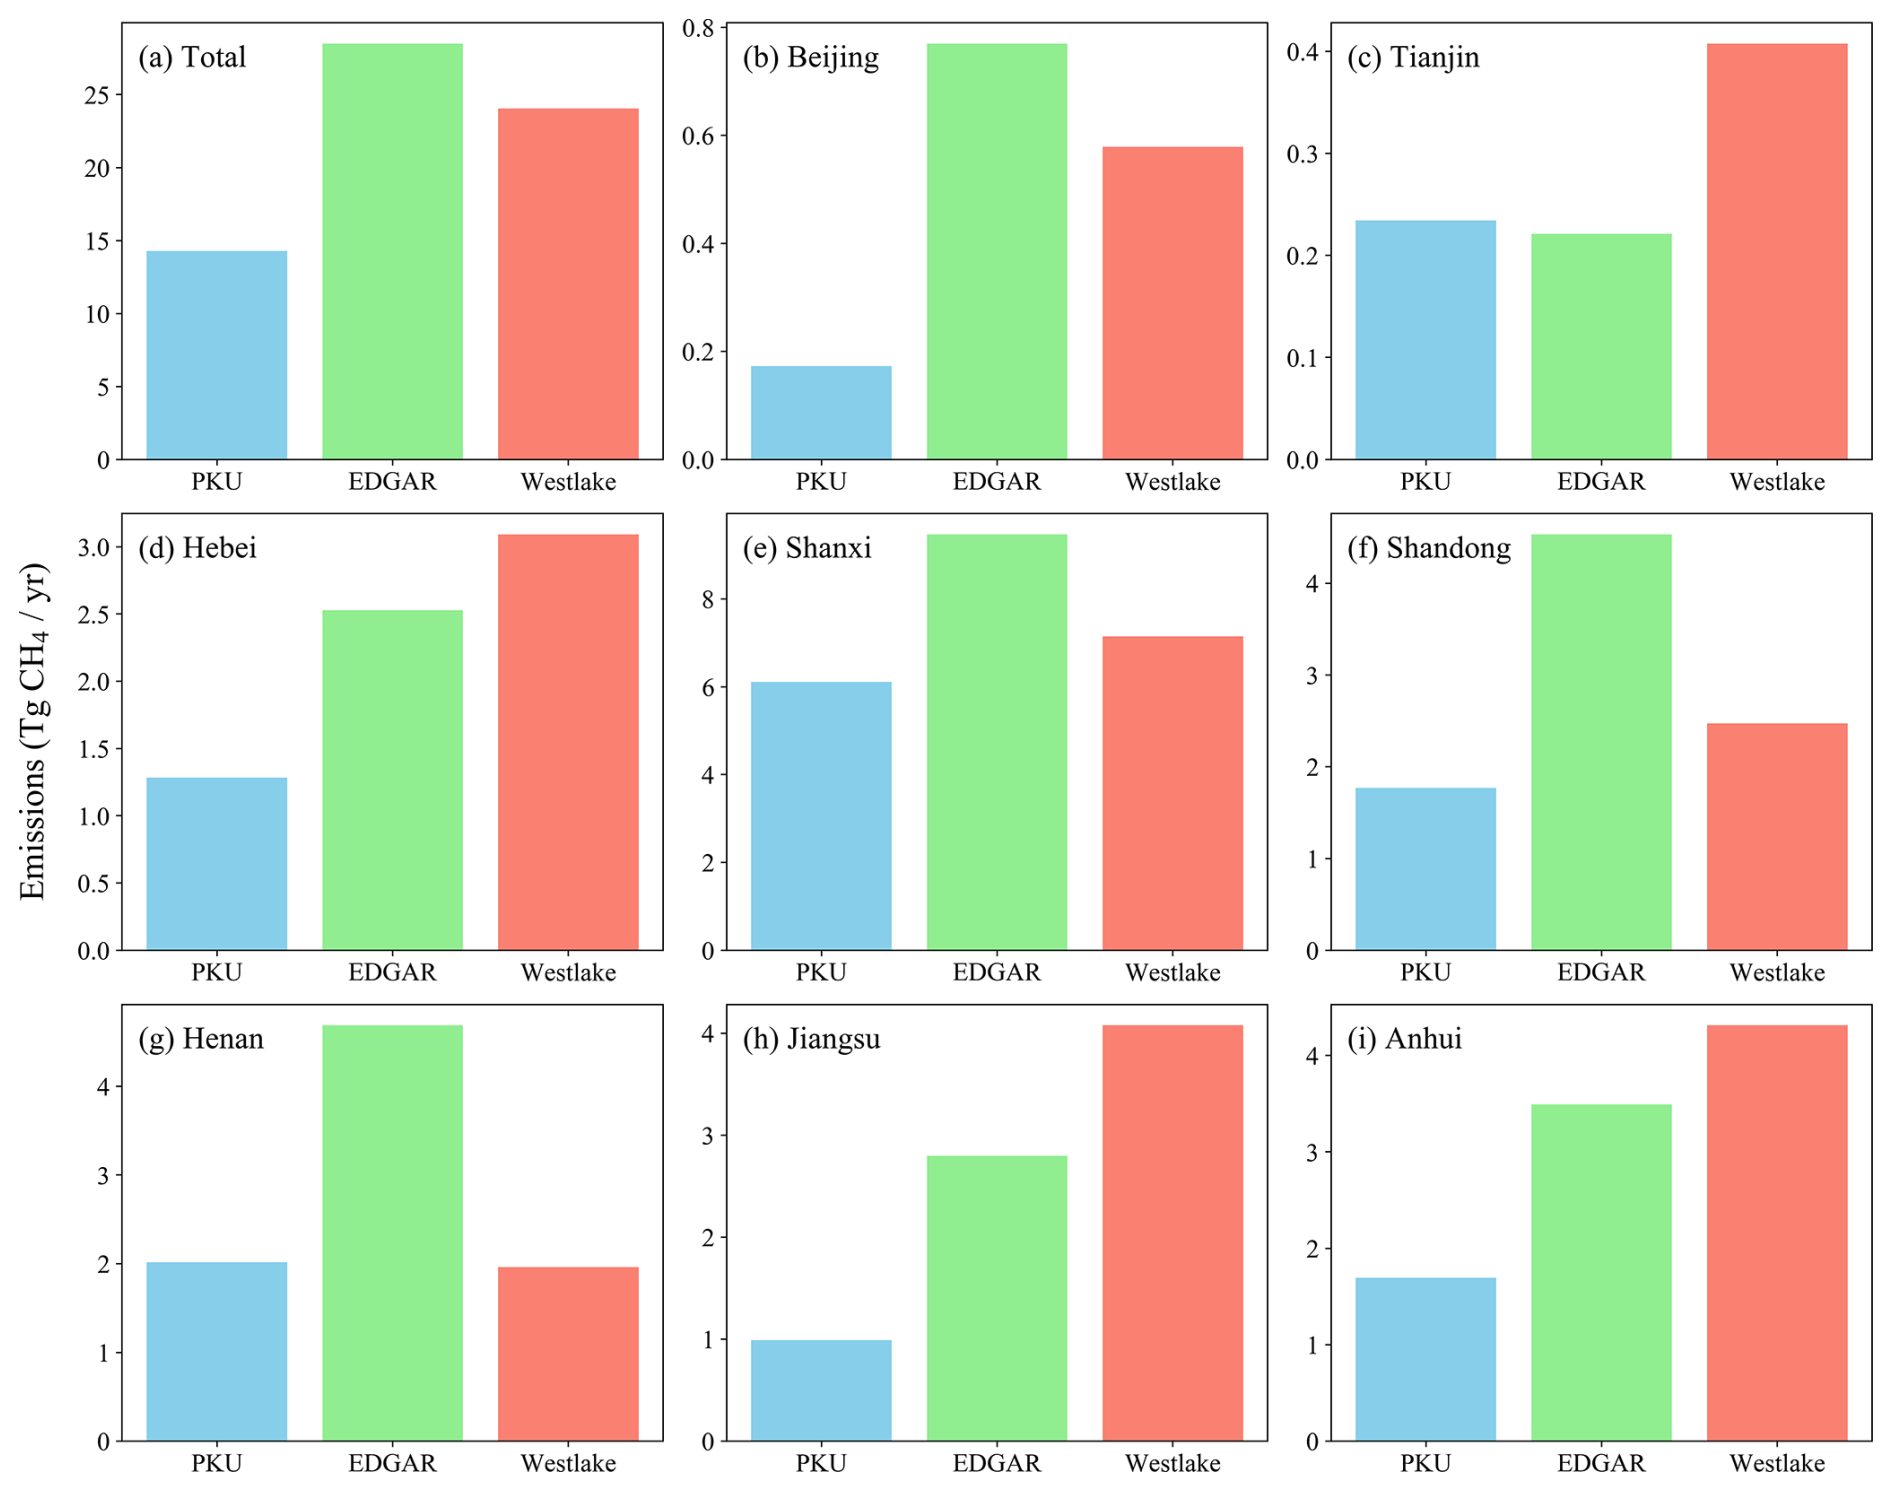
Figure 15Total and provincial CH4 emissions from PKU-CH4 v2, EDGAR-v4.3.2 inventories, and Westlake model posterior results. Note that the scales are different for provinces.
3.6 CH4 emission estimates from inventories and inversions
The CH4 emissions were 14.3, 28.5, and 24.0 Tg for the PKU-CH4 v2, EDGAR-v4.3.2, and Westlake model, respectively (Fig. 15a). The posterior results from the Westlake model using TROPOMI as observations showed a 15.6 % (4.4 Tg) decrease in relation to the prior results (EDGAR v4.3.2). Emissions were adjusted for higher values in Hebei, Jiangsu, and Anhui (Fig. 15d, h, and i) and were adjusted for smaller values in Shanxi, Shandong, and Henan (Fig. 15e–g), which were consistent with the spatial pattern of TROPOMI XCH4 (Fig. S19). A literature review by this study showed a range of 4.4–13.1 Tg CH4 yr−1 for Shanxi CMM (coal mine methane) emissions (Table S2 in the Supplement) (Chen et al., 2024; Janssens-Maenhout et al., 2019b; Kang et al., 2024; Peng et al., 2023; Qin et al., 2024; Sheng et al., 2019; Tate, 2022). And the rest of the emissions from this region showed a range of 6.6–20.1 Tg, resulting in a range of 11.0–28.5 Tg for total emissions (Table S2) (Janssens-Maenhout et al., 2019b; Peng et al., 2016). We thus recommend that more researchers make their datasets publicly available, more in situ observations progress in this region, and high spatial-resolution modeling studies are conducted at a city to province level with multiple-source observations.
In this study, we compiled a comprehensive dataset to study the spatiotemporal characteristics of surface and column CH4 concentration variations and their correlations with emissions. We found that surface CH4 concentrations can be much greater (500–1500 ppb) than regional background CH4 concentrations in urban and suburban areas because of anthropogenic emissions. Notable seasonal surface enhancements of 200–350 ppb at the urban Beijing station and 50–200 ppb at the suburban Xianghe station were observed compared with the concentration at the regional background Shangdianzi station. Positive relationships were found between the surface (both in situ and TCCON) and TROPOMI column observations. The inversion-optimized concentrations generally agreed well with the surface in situ observations in terms of the seasons and annual means in 2019. A generally spatially consistent pattern was observed between the posterior results and the Tropospheric Monitoring Instrument (TROPOMI) column CH4 observations for all seasons and the annual mean. The optimized surface CH4 concentrations were relatively high in southern Shanxi, northern Henan, and Beijing (with enhancements of ∼ 300 ppb), whereas relatively low concentrations were observed in northern Hebei and most parts of Shandong, which was positively correlated with the PKU-CH4 v2 emission inventory data. The posterior result using TROPOMI observations was 24.0 Tg CH4, a decrease of 15.6 % (4.4 Tg), compared with the prior EDGARv4.3.2 data. This study provides a comprehensive dataset of CH4 concentrations and spatial gradients in northern China, which provides key data for further observations, high-resolution atmospheric inversions and policy-making related to emission reduction.
The data used to generate the figures in this paper are available as open-access data at https://doi.org/10.5281/zenodo.10957950 (Han et al., 2024b).
Sectoral CH4 emissions are provided at the provincial level, as well as simulated posterior monthly mean CH4 concentrations, enhancements, etc. The supplement related to this article is available online at https://doi.org/10.5194/acp-25-4965-2025-supplement.
PFH, QXC, and WQS conceived and designed the study. PFH, QXC, RSL, WQS, and SXL collected and analyzed the datasets. PFH led the writing of the paper, with contributions from all coauthors. All coauthors contributed to the descriptions and discussions in the manuscript.
The contact author has declared that none of the authors has any competing interests.
Publisher's note: Copernicus Publications remains neutral with regard to jurisdictional claims made in the text, published maps, institutional affiliations, or any other geographical representation in this paper. While Copernicus Publications makes every effort to include appropriate place names, the final responsibility lies with the authors.
This article is part of the special issue “Greenhouse gas monitoring in the Asia–Pacific region (ACP/AMT/GMD inter-journal SI)”. It is a result of the 4th China Greenhouse Gas Monitoring Symposium, Nanjing, China, 2–3 November 2024.
We thank all the team members involved in the surface in situ observations. We thank Shushi Peng for kindly providing the emission inventory and suggestions for the manuscript. We thank Liye Wei, Xiaohui Lin, and Zhoutong Liang for their help with the data analyses.
This research was supported by the National Key R&D Program of China (grant nos. 2023YFC3705500 and 2017YFB0504000); the China Quality Certification Center project – Monitoring, simulation and inventory joint assessment of carbon emissions in typical industrial parks against the background of carbon peaking and carbon neutrality (grant no. 2022ZJYF001); the Qilu Zhongke Institute of Carbon Neutrality Program of Jinan Dual Carbon Simulator; and the Chinese Academy of Sciences (CAS) Proof of Concept Program – Carbon neutrality-oriented urban carbon monitoring system and its industrialization (grant no. CAS-GNYZ-2022).
This paper was edited by Ilse Aben and reviewed by two anonymous referees.
Bao, Z., Han, P., Zeng, N., Liu, D., Cai, Q., Wang, Y., Tang, G., Zheng, K., and Yao, B.: Observation and modeling of vertical carbon dioxide distribution in a heavily polluted suburban environment, Atmospheric and Oceanic Science Letters, 1–9, https://doi.org/10.1080/16742834.2020.1746627, 2020.
Barré, J., Aben, I., Agustí-Panareda, A., Balsamo, G., Bousserez, N., Dueben, P., Engelen, R., Inness, A., Lorente, A., McNorton, J., Peuch, V.-H., Radnoti, G., and Ribas, R.: Systematic detection of local CH4 anomalies by combining satellite measurements with high-resolution forecasts, Atmos. Chem. Phys., 21, 5117–5136, https://doi.org/10.5194/acp-21-5117-2021, 2021.
Butz, A., Galli, A., Hasekamp, O., Landgraf, J., Tol, P., and Aben, I.: TROPOMI aboard Sentinel-5 Precursor: Prospective performance of CH4 retrievals for aerosol and cirrus loaded atmospheres, Remote Sens. Environ., 120, 267–276, https://doi.org/10.1016/j.rse.2011.05.030, 2012.
Chen, D., Chen, A., Hu, X., Guo, L., Yang, Y., and Fang, X.: Historical trend of China's CH4 concentrations and emissions during 2003–2020 based on satellite observations, and their implications, Atmos. Pollut. Res., 13, 101615, https://doi.org/10.1016/j.apr.2022.101615, 2022a.
Chen, D., Ma, M., Hu, L., Du, Q., Li, B., Yang, Y., Guo, L., Cai, Z., Ji, M., Zhu, R., and Fang, X.: Characteristics of China's coal mine methane emission sources at national and provincial levels, Environ. Res., 259, 119549, https://doi.org/10.1016/j.envres.2024.119549, 2024.
Chen, Y.-H. and Prinn, R. G.: Atmospheric modeling of high- and low-frequency methane observations: Importance of interannually varying transport, J. Geophys. Res.-Atmos., 110, D10303, https://doi.org/10.1029/2004JD005542, 2005.
Chen, Z., Jacob, D. J., Nesser, H., Sulprizio, M. P., Lorente, A., Varon, D. J., Lu, X., Shen, L., Qu, Z., Penn, E., and Yu, X.: Methane emissions from China: a high-resolution inversion of TROPOMI satellite observations, Atmos. Chem. Phys., 22, 10809–10826, https://doi.org/10.5194/acp-22-10809-2022, 2022b.
Chu, Y., Li, J., Li, C., Tan, W., Su, T., and Li, J.: Seasonal and diurnal variability of planetary boundary layer height in Beijing: Intercomparison between MPL and WRF results, Atmos. Res., 227, 1–13, https://doi.org/10.1016/j.atmosres.2019.04.017, 2019.
Crippa, M., Guizzardi, D., Pisoni, E., Solazzo, E., Guion, A., Muntean, M., Florczyk, A., Schiavina, M., Melchiorri, M., and Hutfilter, A. F.: Global anthropogenic emissions in urban areas: patterns, trends, and challenges, Environ. Res. Lett., 16, 074033, https://doi.org/10.1088/1748-9326/ac00e2, 2021.
Crippa, M., Guizzardi, D., Pagani, F., and Pisoni, E.: GHG Emissions at sub-national level. European Commission, Joint Research Centre (JRC) [data set], https://doi.org/10.2905/D67EEDA8-C03E-4421-95D0-0ADC460B9658 (last access: 17 January 2024), 2023.
Cusworth, D. H., Duren, R. M., Thorpe, A. K., Pandey, S., Maasakkers, J. D., Aben, I., Jervis, D., Varon, D. J., Jacob, D. J., Randles, C. A., Gautam, R., Omara, M., Schade, G. W., Dennison, P. E., Frankenberg, C., Gordon, D., Lopinto, E., and Miller, C. E.: Multisatellite Imaging of a Gas Well Blowout Enables Quantification of Total Methane Emissions, Geophys. Res. Lett., 48, e2020GL090864, https://doi.org/10.1029/2020GL090864, 2021.
Etminan, M., Myhre, G., Highwood, E. J., and Shine, K. P.: Radiative forcing of carbon dioxide, methane, and nitrous oxide: A significant revision of the methane radiative forcing, Geophys. Res. Lett., 43, 12,614 - 612,623, 2016.
Fang, S., Tans, P. P., Dong, F., Zhou, H.-g., and Luan, T.: Characteristics of atmospheric CO2 and CH4 at the Shangdianzi regional background station in China, Atmos. Environ., 131, 1–8, 2016.
Fankhauser, S., Smith, S. M., Allen, M., Axelsson, K., Hale, T., Hepburn, C., Kendall, J. M., Khosla, R., Lezaun, J., Mitchell-Larson, E., Obersteiner, M., Rajamani, L., Rickaby, R., Seddon, N., and Wetzer, T.: The meaning of net zero and how to get it right, Nat. Clim. Change, 12, 15–21, https://doi.org/10.1038/s41558-021-01245-w, 2022.
Feng, T., Zhou, W., Wu, S., Niu, Z., Cheng, P., Xiong, X., and Li, G.: High-resolution simulation of wintertime fossil fuel CO2 in Beijing, China: Characteristics, sources, and regional transport, Atmos. Environ., 198, 226–235, https://doi.org/10.1016/j.atmosenv.2018.10.054, 2019.
Gouw, J. A. d., Veefkind, J. P., Roosenbrand, E., Dix, B., Lin, J. C., Landgraf, J., and Levelt, P. F.: Daily Satellite Observations of Methane from Oil and Gas Production Regions in the United States, Sci. Rep.-UK, 10, 1379, https://doi.org/10.1038/s41598-020-57678-4, 2020.
Guanter, L., Irakulis-Loitxate, I., Gorroño, J., Sánchez-García, E., Cusworth, D. H., Varon, D. J., Cogliati, S., and Colombo, R.: Mapping methane point emissions with the PRISMA spaceborne imaging spectrometer, Remote Sens. Environ., 265, 112671, https://doi.org/10.1016/j.rse.2021.112671, 2021.
Han, P., Zeng, N., Wang, Y., Zhang, X., Yao, B., Hu, H., Zhao, M., and Wang, S.: Regional carbon monitoring for the Beijing-Tianjin-Hebei (JJJ) City Cluster, 20th EGU General Assembly, EGU2018, Proceedings from the conference held 4–13 April, 2018 in Vienna, Austria, p. 4149, 2018.
Han, G., Pei, Z., Shi, T., Mao, H., Li, S., Mao, F., Ma, X., Zhang, X., and Gong, W.: Unveiling Unprecedented Methane Hotspots in China's Leading Coal Production Hub: A Satellite Mapping Revelation, Geophys. Res. Lett., 51, e2024GL109065, https://doi.org/10.1029/2024GL109065, 2024a.
Han, P., Zeng, N., Yao, B., Zhang, W., Quan, W., Wang, P., Wang, T., Zhou, M., Cai, Q., Zhang, Y., Liang, R., Sun, W., and Liu, S.: Methane concentration and emissions data for the northern China, Zenodo, https://doi.org/10.5281/zenodo.10957950 (last access: 11 April 2024), 2024b.
Hoesly, R., O'Rourke, P., Braun, C., Feng, L., Smith, S. J., Pitkanen, T., Seibert, J. J., Vu, L., Presley, M., Bolt, R., Goldstein, B., and Kholod, N.: Community Emissions Data System (Version Dec-23-2019), Zenodo, https://doi.org/10.5281/zenodo.3592073 (last access: 17 January 2024), 2019.
Hu, C., Xiao, W., Griffis, T. J., Xiao, Q., Wang, S., Zhang, Y., Wang, W., Zhu, L., Chen, X., Yu, X., and Lee, X.: Estimation of Anthropogenic CH4 and CO2 Emissions in Taiyuan-Jinzhong Region: One of the World's Largest Emission Hotspots, J. Geophys. Res.-Atmos., 128, e2022JD037915, https://doi.org/10.1029/2022JD037915, 2023.
Hu, H., Hasekamp, O., Butz, A., Galli, A., Landgraf, J., Aan de Brugh, J., Borsdorff, T., Scheepmaker, R., and Aben, I.: The operational methane retrieval algorithm for TROPOMI, Atmos. Meas. Tech., 9, 5423–5440, https://doi.org/10.5194/amt-9-5423-2016, 2016.
Hu, H., Chen, J., Zhou, F., Nie, M., Hou, D., Liu, H., Delgado-Baquerizo, M., Ni, H., Huang, W., Zhou, J., Song, X., Cao, X., Sun, B., Zhang, J., Crowther, T. W., and Liang, Y.: Relative increases in CH4 and CO2 emissions from wetlands under global warming dependent on soil carbon substrates, Nat. Geosci., 17, 26–31, https://doi.org/10.1038/s41561-023-01345-6, 2024.
Huang, Y., Kort, E. A., Gourdji, S., Karion, A., Mueller, K., and Ware, J.: Seasonally Resolved Excess Urban Methane Emissions from the Baltimore/Washington, DC Metropolitan Region, Environ. Sci. Technol., 53, 11285–11293, https://doi.org/10.1021/acs.est.9b02782, 2019.
Ialongo, I., Virta, H., Eskes, H., Hovila, J., and Douros, J.: Comparison of TROPOMI/Sentinel-5 Precursor NO2 observations with ground-based measurements in Helsinki, Atmos. Meas. Tech., 13, 205–218, https://doi.org/10.5194/amt-13-205-2020, 2020.
IPCC: Climate Change 2022: Impacts, Adaptation, and Vulnerability. Contribution of Working Group II to the Sixth Assessment Report of the Intergovernmental Panel on Climate Change, edited by: Pörtner, H.-O., Roberts, D. C., Tignor, M., Poloczanska, E. S., Mintenbeck, K., Alegría, A., Craig, M., Langsdorf, S., Löschke, S., Möller, V., Okem, A., Rama , B., Cambridge University Press, Cambridge, UK and New York, NY, USA, https://doi.org/10.1017/9781009325844, 3056 pp., 2022.
Irakulis-Loitxate, I., Guanter, L., Liu, Y.-N., Varon, D. J., Maasakkers, J. D., Zhang, Y., Chulakadabba, A., Wofsy, S. C., Thorpe, A. K., Duren, R. M., Frankenberg, C., Lyon, D. R., Hmiel, B., Cusworth, D. H., Zhang, Y., Segl, K., Gorroño, J., Sánchez-García, E., Sulprizio, M. P., Cao, K., Zhu, H., Liang, J., Li, X., Aben, I., and Jacob, D. J.: Satellite-based survey of extreme methane emissions in the Permian basin, Science Advances, 7, eabf4507, https://doi.org/10.1126/sciadv.abf4507, 2021.
Jackson, R. B., Saunois, M., Bousquet, P., Canadell, J. G., Poulter, B., Stavert, A. R., Bergamaschi, P., Niwa, Y., Segers, A., and Tsuruta, A.: Increasing anthropogenic methane emissions arise equally from agricultural and fossil fuel sources, Environ. Res. Lett., 15, 071002, https://doi.org/10.1088/1748-9326/ab9ed2, 2020.
Jacob, D. J., Turner, A. J., Maasakkers, J. D., Sheng, J., Sun, K., Liu, X., Chance, K., Aben, I., McKeever, J., and Frankenberg, C.: Satellite observations of atmospheric methane and their value for quantifying methane emissions, Atmos. Chem. Phys., 16, 14371–14396, https://doi.org/10.5194/acp-16-14371-2016, 2016.
Janssens-Maenhout, G., Crippa, M., Guizzardi, D., Muntean, M., Schaaf, E., Dentener, F., Bergamaschi, P., Pagliari, V., Olivier, J. G. J., Peters, J. A. H. W., van Aardenne, J. A., Monni, S., Doering, U., Petrescu, A. M. R., Solazzo, E., and Oreggioni, G. D.: EDGAR v4.3.2 Global Atlas of the three major greenhouse gas emissions for the period 1970–2012, Earth Syst. Sci. Data, 11, 959–1002, https://doi.org/10.5194/essd-11-959-2019, 2019a.
Janssens-Maenhout, G., Crippa, M., Guizzardi, D., Muntean, M., Schaaf, E., Dentener, F., Bergamaschi, P., Pagliari, V., Olivier, J. G. J., Peters, J. A. H. W., van Aardenne, J. A., Monni, S., Doering, U., Petrescu, A. M. R., Solazzo, E., and Oreggioni, G. D.: EDGAR v4.3.2 Global Atlas of the three major greenhouse gas emissions for the period 1970–2012, Earth Syst. Sci. Data, 11, 959–1002, https://doi.org/10.5194/essd-11-959-2019, 2019b.
Ji, D., Zhou, M., Wang, P., Yang, Y., Wang, T., Sun, X., Hermans, C., Yao, B., and Wang, G.: Deriving Temporal and Vertical Distributions of Methane in Xianghe Using Ground-based Fourier Transform Infrared and Gas-analyzer Measurements, Adv. Atmos. Sci., 37, 597–607, https://doi.org/10.1007/s00376-020-9233-4, 2020.
Kang, H., Qin, K., Fan, L., Wei, H., Qing, X., and Cohen, J. B.: Methane point sources emission characteristics of coal industry in Shanxi Province based on Gaofen-5 satellite, J. China Coal Soc., 49, 3960–3968, https://doi.org/10.13225/j.cnki.jccs.2023.1247, 2024.
Laughner, J. L., Toon, G. C., Mendonca, J., Petri, C., Roche, S., Wunch, D., Blavier, J.-F., Griffith, D. W. T., Heikkinen, P., Keeling, R. F., Kiel, M., Kivi, R., Roehl, C. M., Stephens, B. B., Baier, B. C., Chen, H., Choi, Y., Deutscher, N. M., DiGangi, J. P., Gross, J., Herkommer, B., Jeseck, P., Laemmel, T., Lan, X., McGee, E., McKain, K., Miller, J., Morino, I., Notholt, J., Ohyama, H., Pollard, D. F., Rettinger, M., Riris, H., Rousogenous, C., Sha, M. K., Shiomi, K., Strong, K., Sussmann, R., Té, Y., Velazco, V. A., Wofsy, S. C., Zhou, M., and Wennberg, P. O.: The Total Carbon Column Observing Network's GGG2020 data version, Earth Syst. Sci. Data, 16, 2197–2260, https://doi.org/10.5194/essd-16-2197-2024, 2024.
Liang, R., Zhang, Y., Chen, W., Zhang, P., Liu, J., Chen, C., Mao, H., Shen, G., Qu, Z., Chen, Z., Zhou, M., Wang, P., Parker, R. J., Boesch, H., Lorente, A., Maasakkers, J. D., and Aben, I.: East Asian methane emissions inferred from high-resolution inversions of GOSAT and TROPOMI observations: a comparative and evaluative analysis, Atmos. Chem. Phys., 23, 8039–8057, https://doi.org/10.5194/acp-23-8039-2023, 2023.
Liang, Z., Tang, W., Zeng, N., Cai, Q., Han, P., Zhang, y., Quan, W., Yao, B., Wang, P., and Liu, Z.: High-precision observation and WRF model simulation of surface atmospheric CO2 concentration in Beijing–Tianjin–Hebei region, Transactions of Atmospheric Sciences, 45, 387–396, https://doi.org/10.13878/j.cnki.dqkxxb.20220228018, 2022 (in Chinese).
Lin, X., Zhang, W., Crippa, M., Peng, S., Han, P., Zeng, N., Yu, L., and Wang, G.: A comparative study of anthropogenic CH4 emissions over China based on the ensembles of bottom-up inventories, Earth Syst. Sci. Data, 13, 1073–1088, https://doi.org/10.5194/essd-13-1073-2021, 2021.
Liu, C., Wang, W., Sun, Y., and Shan, C.: TCCON Data from Hefei (PRC), Release GGG2020.R1, California Institute of Techonolgy, https://doi.org/10.14291/tccon.ggg2020.hefei01.R1, 2023.
Liu, D., Sun, W., Zeng, N., Han, P., Yao, B., Liu, Z., Wang, P., Zheng, K., Mei, H., and Cai, Q.: Observed decreases in on-road CO2 concentrations in Beijing during COVID-19 restrictions, Atmos. Chem. Phys., 21, 4599–4614, https://doi.org/10.5194/acp-21-4599-2021, 2021a.
Liu, G., Peng, S., Lin, X., Ciais, P., Li, X., Xi, Y., Lu, Z., Chang, J., Saunois, M., Wu, Y., Patra, P., Chandra, N., Zeng, H., and Piao, S.: Recent Slowdown of Anthropogenic Methane Emissions in China Driven by Stabilized Coal Production, Environ. Sci. Tech. Lett., 8, 739–746, https://doi.org/10.1021/acs.estlett.1c00463, 2021b.
Liu, M., van der A, R., van Weele, M., Eskes, H., Lu, X., Veefkind, P., de Laat, J., Kong, H., Wang, J., Sun, J., Ding, J., Zhao, Y., and Weng, H.: A New Divergence Method to Quantify Methane Emissions Using Observations of Sentinel-5P TROPOMI, Geophys. Res. Lett., 48, e2021GL094151, https://doi.org/10.1029/2021GL094151, 2021c.
Lorente, A., Borsdorff, T., Butz, A., Hasekamp, O., aan de Brugh, J., Schneider, A., Wu, L., Hase, F., Kivi, R., Wunch, D., Pollard, D. F., Shiomi, K., Deutscher, N. M., Velazco, V. A., Roehl, C. M., Wennberg, P. O., Warneke, T., and Landgraf, J.: Methane retrieved from TROPOMI: improvement of the data product and validation of the first 2 years of measurements, Atmos. Meas. Tech., 14, 665–684, https://doi.org/10.5194/amt-14-665-2021, 2021.
Maasakkers, J. D., Varon, D. J., Elfarsdóttir, A., McKeever, J., Jervis, D., Mahapatra, G., Pandey, S., Lorente, A., Borsdorff, T., Foorthuis, L. R., Schuit, B. J., Tol, P., van Kempen, T. A., van Hees, R., and Aben, I.: Using satellites to uncover large methane emissions from landfills, Science Advances, 8, eabn9683, https://doi.org/10.1126/sciadv.abn9683, 2022.
MEE: Carbon monitoring and assessment pilot work programme, Ministry of Ecology and Environment of the People's Republic of China, https://www.mee.gov.cn/ywdt/spxw/202109/t20210923_952715.shtml (last access: 17 January 2024), 2021 (in Chinese).
MEE: Methane emissions control action plan, Ministry of Ecology and Environment of the People's Republic of China, https://www.mee.gov.cn/xxgk2018/xxgk/xxgk03/202311/t20231107_1055437.html (last access: 17 January 2024), 2023 (in Chinese).
Miller, S. M., Michalak, A. M., Detmers, R. G., Hasekamp, O. P., Bruhwiler, L. M. P., and Schwietzke, S.: China's coal mine methane regulations have not curbed growing emissions, Nat. Commun., 10, 303, https://doi.org/10.1038/s41467-018-07891-7, 2019.
Mitchell, L. E., Lin, J. C., Hutyra, L. R., Bowling, D. R., Cohen, R. C., Davis, K. J., DiGangi, E., Duren, R. M., Ehleringer, J. R., Fain, C., Falk, M., Guha, A., Karion, A., Keeling, R. F., Kim, J., Miles, N. L., Miller, C. E., Newman, S., Pataki, D. E., Prinzivalli, S., Ren, X., Rice, A., Richardson, S. J., Sargent, M., Stephens, B. B., Turnbull, J. C., Verhulst, K. R., Vogel, F., Weiss, R. F., Whetstone, J., and Wofsy, S. C.: A multi-city urban atmospheric greenhouse gas measurement data synthesis, Scientific Data, 9, 361, https://doi.org/10.1038/s41597-022-01467-3, 2022.
Ou, Y., Roney, C., Alsalam, J., Calvin, K., Creason, J., Edmonds, J., Fawcett, A. A., Kyle, P., Narayan, K., O'Rourke, P., Patel, P., Ragnauth, S., Smith, S. J., and McJeon, H.: Deep mitigation of CO2 and non-CO2 greenhouse gases toward 1.5 °C and 2 °C futures, Nat. Commun., 12, 6245, https://doi.org/10.1038/s41467-021-26509-z, 2021.
Pandey, S., Gautam, R., Houweling, S., van der Gon, H. D., Sadavarte, P., Borsdorff, T., Hasekamp, O., Landgraf, J., Tol, P., van Kempen, T., Hoogeveen, R., van Hees, R., Hamburg, S. P., Maasakkers, J. D., and Aben, I.: Satellite observations reveal extreme methane leakage from a natural gas well blowout, P. Natl. Acad. Sci. USA, 116, 26376–26381, https://doi.org/10.1073/pnas.1908712116, 2019.
Peng, S., Piao, S., Bousquet, P., Ciais, P., Li, B., Lin, X., Tao, S., Wang, Z., Zhang, Y., and Zhou, F.: Inventory of anthropogenic methane emissions in mainland China from 1980 to 2010, Atmos. Chem. Phys., 16, 14545–14562, https://doi.org/10.5194/acp-16-14545-2016, 2016.
Peng, S., Lin, X., Thompson, R. L., Xi, Y., Liu, G., Hauglustaine, D., Lan, X., Poulter, B., Ramonet, M., Saunois, M., Yin, Y., Zhang, Z., Zheng, B., and Ciais, P.: Wetland emission and atmospheric sink changes explain methane growth in 2020, Nature, 612, 477–482, https://doi.org/10.1038/s41586-022-05447-w, 2022.
Peng, S., Giron, C., Liu, G., d'Aspremont, A., Benoit, A., Lauvaux, T., Lin, X., de Almeida Rodrigues, H., Saunois, M., and Ciais, P.: High-resolution assessment of coal mining methane emissions by satellite in Shanxi, China, iScience, 26, 108375, https://doi.org/10.1016/j.isci.2023.108375, 2023.
Pei, Z., Han, G., Mao, H., Chen, C., Shi, T., Yang, K., Ma, X., and Gong, W.: Improving quantification of methane point source emissions from imaging spectroscopy, Remote Sens. Environ., 295, 113652, https://doi.org/10.1016/j.rse.2023.113652, 2023.
Plant, G., Kort, E. A., Murray, L. T., Maasakkers, J. D., and Aben, I.: Evaluating urban methane emissions from space using TROPOMI methane and carbon monoxide observations, Remote Sens. Environ., 268, 112756, https://doi.org/10.1016/j.rse.2021.112756, 2022.
Povey, A. C. and Grainger, R. G.: Known and unknown unknowns: uncertainty estimation in satellite remote sensing, Atmos. Meas. Tech., 8, 4699–4718, https://doi.org/10.5194/amt-8-4699-2015, 2015.
Qin, K., Lu, L., Liu, J., He, Q., Shi, J., Deng, W., Wang, S., and Cohen, J. B.: Model-free daily inversion of NOx emissions using TROPOMI (MCMFE-NOx) and its uncertainty: Declining regulated emissions and growth of new sources, Remote Sens. Environ., 295, 113720, https://doi.org/10.1016/j.rse.2023.113720, 2023.
Qin, K., Hu, W., He, Q., Lu, F., and Cohen, J. B.: Individual coal mine methane emissions constrained by eddy covariance measurements: low bias and missing sources, Atmos. Chem. Phys., 24, 3009–3028, https://doi.org/10.5194/acp-24-3009-2024, 2024.
Qu, Z., Jacob, D. J., Shen, L., Lu, X., Zhang, Y., Scarpelli, T. R., Nesser, H., Sulprizio, M. P., Maasakkers, J. D., Bloom, A. A., Worden, J. R., Parker, R. J., and Delgado, A. L.: Global distribution of methane emissions: a comparative inverse analysis of observations from the TROPOMI and GOSAT satellite instruments, Atmos. Chem. Phys., 21, 14159–14175, https://doi.org/10.5194/acp-21-14159-2021, 2021.
Rayner, P., Michalak, A. M., and Chevallier, F.: Fundamentals of Data Assimilation, Geosci. Model Dev. Discuss. [preprint], https://doi.org/10.5194/gmd-2016-148, 2016.
Rivera Martinez, R. A., Santaren, D., Laurent, O., Broquet, G., Cropley, F., Mallet, C., Ramonet, M., Shah, A., Rivier, L., Bouchet, C., Juery, C., Duclaux, O., and Ciais, P.: Reconstruction of high-frequency methane atmospheric concentration peaks from measurements using metal oxide low-cost sensors, Atmos. Meas. Tech., 16, 2209–2235, https://doi.org/10.5194/amt-16-2209-2023, 2023.
Saunois, M., Stavert, A. R., Poulter, B., Bousquet, P., Canadell, J. G., Jackson, R. B., Raymond, P. A., Dlugokencky, E. J., Houweling, S., Patra, P. K., Ciais, P., Arora, V. K., Bastviken, D., Bergamaschi, P., Blake, D. R., Brailsford, G., Bruhwiler, L., Carlson, K. M., Carrol, M., Castaldi, S., Chandra, N., Crevoisier, C., Crill, P. M., Covey, K., Curry, C. L., Etiope, G., Frankenberg, C., Gedney, N., Hegglin, M. I., Höglund-Isaksson, L., Hugelius, G., Ishizawa, M., Ito, A., Janssens-Maenhout, G., Jensen, K. M., Joos, F., Kleinen, T., Krummel, P. B., Langenfelds, R. L., Laruelle, G. G., Liu, L., Machida, T., Maksyutov, S., McDonald, K. C., McNorton, J., Miller, P. A., Melton, J. R., Morino, I., Müller, J., Murguia-Flores, F., Naik, V., Niwa, Y., Noce, S., O'Doherty, S., Parker, R. J., Peng, C., Peng, S., Peters, G. P., Prigent, C., Prinn, R., Ramonet, M., Regnier, P., Riley, W. J., Rosentreter, J. A., Segers, A., Simpson, I. J., Shi, H., Smith, S. J., Steele, L. P., Thornton, B. F., Tian, H., Tohjima, Y., Tubiello, F. N., Tsuruta, A., Viovy, N., Voulgarakis, A., Weber, T. S., van Weele, M., van der Werf, G. R., Weiss, R. F., Worthy, D., Wunch, D., Yin, Y., Yoshida, Y., Zhang, W., Zhang, Z., Zhao, Y., Zheng, B., Zhu, Q., Zhu, Q., and Zhuang, Q.: The Global Methane Budget 2000–2017, Earth Syst. Sci. Data, 12, 1561–1623, https://doi.org/10.5194/essd-12-1561-2020, 2020.
Schneider, A., Borsdorff, T., aan de Brugh, J., Aemisegger, F., Feist, D. G., Kivi, R., Hase, F., Schneider, M., and Landgraf, J.: First data set of columns from the Tropospheric Monitoring Instrument (TROPOMI), Atmos. Meas. Tech., 13, 85–100, https://doi.org/10.5194/amt-13-85-2020, 2020.
Schneising, O., Buchwitz, M., Reuter, M., Bovensmann, H., Burrows, J. P., Borsdorff, T., Deutscher, N. M., Feist, D. G., Griffith, D. W. T., Hase, F., Hermans, C., Iraci, L. T., Kivi, R., Landgraf, J., Morino, I., Notholt, J., Petri, C., Pollard, D. F., Roche, S., Shiomi, K., Strong, K., Sussmann, R., Velazco, V. A., Warneke, T., and Wunch, D.: A scientific algorithm to simultaneously retrieve carbon monoxide and methane from TROPOMI onboard Sentinel-5 Precursor, Atmos. Meas. Tech., 12, 6771–6802, https://doi.org/10.5194/amt-12-6771-2019, 2019.
Schneising, O., Buchwitz, M., Hachmeister, J., Vanselow, S., Reuter, M., Buschmann, M., Bovensmann, H., and Burrows, J. P.: Advances in retrieving XCH4 and XCO from Sentinel-5 Precursor: improvements in the scientific TROPOMI/WFMD algorithm, Atmos. Meas. Tech., 16, 669–694, https://doi.org/10.5194/amt-16-669-2023, 2023.
Schuit, B. J., Maasakkers, J. D., Bijl, P., Mahapatra, G., van den Berg, A.-W., Pandey, S., Lorente, A., Borsdorff, T., Houweling, S., Varon, D. J., McKeever, J., Jervis, D., Girard, M., Irakulis-Loitxate, I., Gorroño, J., Guanter, L., Cusworth, D. H., and Aben, I.: Automated detection and monitoring of methane super-emitters using satellite data, Atmos. Chem. Phys., 23, 9071–9098, https://doi.org/10.5194/acp-23-9071-2023, 2023.
Sha, M. K., Langerock, B., Blavier, J.-F. L., Blumenstock, T., Borsdorff, T., Buschmann, M., Dehn, A., De Mazière, M., Deutscher, N. M., Feist, D. G., García, O. E., Griffith, D. W. T., Grutter, M., Hannigan, J. W., Hase, F., Heikkinen, P., Hermans, C., Iraci, L. T., Jeseck, P., Jones, N., Kivi, R., Kumps, N., Landgraf, J., Lorente, A., Mahieu, E., Makarova, M. V., Mellqvist, J., Metzger, J.-M., Morino, I., Nagahama, T., Notholt, J., Ohyama, H., Ortega, I., Palm, M., Petri, C., Pollard, D. F., Rettinger, M., Robinson, J., Roche, S., Roehl, C. M., Röhling, A. N., Rousogenous, C., Schneider, M., Shiomi, K., Smale, D., Stremme, W., Strong, K., Sussmann, R., Té, Y., Uchino, O., Velazco, V. A., Vigouroux, C., Vrekoussis, M., Wang, P., Warneke, T., Wizenberg, T., Wunch, D., Yamanouchi, S., Yang, Y., and Zhou, M.: Validation of methane and carbon monoxide from Sentinel-5 Precursor using TCCON and NDACC-IRWG stations, Atmos. Meas. Tech., 14, 6249–6304, https://doi.org/10.5194/amt-14-6249-2021, 2021.
Shan, C., Wang, W., Liu, C., Sun, Y., Hu, Q., Xu, X., Tian, Y., Zhang, H., Morino, I., Griffith, D. W. T., and Velazco, V. A.: Regional CO emission estimated from ground-based remote sensing at Hefei site, China, Atmos. Res., 222, 25–35, https://doi.org/10.1016/j.atmosres.2019.02.005, 2019.
Sheng, J., Song, S., Zhang, Y., Prinn, R. G., and Janssens-Maenhout, G.: Bottom-Up Estimates of Coal Mine Methane Emissions in China: A Gridded Inventory, Emission Factors, and Trends, Environ. Sci. Tech. Let., 6, 473–478, https://doi.org/10.1021/acs.estlett.9b00294, 2019.
Staniaszek, Z., Griffiths, P. T., Folberth, G. A., O'Connor, F. M., Abraham, N. L., and Archibald, A. T.: The role of future anthropogenic methane emissions in air quality and climate, npj Climate and Atmospheric Science, 5, 21, https://doi.org/10.1038/s41612-022-00247-5, 2022.
Su, T., Li, Z., and Kahn, R.: Relationships between the planetary boundary layer height and surface pollutants derived from lidar observations over China: regional pattern and influencing factors, Atmos. Chem. Phys., 18, 15921–15935, https://doi.org/10.5194/acp-18-15921-2018, 2018.
Sun, Y., Yin, H., Wang, W., Shan, C., Notholt, J., Palm, M., Liu, K., Chen, Z., and Liu, C.: Monitoring greenhouse gases (GHGs) in China: status and perspective, Atmos. Meas. Tech., 15, 4819–4834, https://doi.org/10.5194/amt-15-4819-2022, 2022.
Tan, H., Zhang, L., Lu, X., Zhao, Y., Yao, B., Parker, R. J., and Boesch, H.: An integrated analysis of contemporary methane emissions and concentration trends over China using in situ and satellite observations and model simulations, Atmos. Chem. Phys., 22, 1229–1249, https://doi.org/10.5194/acp-22-1229-2022, 2022.
Tate, R. D.: Bigger than oil or gas? Sizing Up Coal Mine Methane [R], Global Energy Monitor 2022, https://globalenergymonitor.org/report/worse-than-oil-or-gas/ (last access: 3 December 2024), 2022.
Tian, Y., Sun, Y., Liu, C., Wang, W., Shan, C., Xu, X., and Hu, Q.: Characterisation of methane variability and trends from near-infrared solar spectra over Hefei, China, Atmos. Environ., 173, 198–209, https://doi.org/10.1016/j.atmosenv.2017.11.001, 2018.
Turner, A. J. and Jacob, D. J.: Balancing aggregation and smoothing errors in inverse models, Atmos. Chem. Phys., 15, 7039–7048, https://doi.org/10.5194/acp-15-7039-2015, 2015.
Turner, A. J., Jacob, D. J., Wecht, K. J., Maasakkers, J. D., Lundgren, E., Andrews, A. E., Biraud, S. C., Boesch, H., Bowman, K. W., Deutscher, N. M., Dubey, M. K., Griffith, D. W. T., Hase, F., Kuze, A., Notholt, J., Ohyama, H., Parker, R., Payne, V. H., Sussmann, R., Sweeney, C., Velazco, V. A., Warneke, T., Wennberg, P. O., and Wunch, D.: Estimating global and North American methane emissions with high spatial resolution using GOSAT satellite data, Atmos. Chem. Phys., 15, 7049–7069, https://doi.org/10.5194/acp-15-7049-2015, 2015.
Turner, A. J., Frankenberg, C., and Kort, E. A.: Interpreting contemporary trends in atmospheric methane, P. Natl. Acad. Sci. USA, 116, 2805–2813, https://doi.org/10.1073/pnas.1814297116, 2019.
Veefkind, J. P., Aben, I., McMullan, K., Förster, H., de Vries, J., Otter, G., Claas, J., Eskes, H. J., de Haan, J. F., Kleipool, Q., van Weele, M., Hasekamp, O., Hoogeveen, R., Landgraf, J., Snel, R., Tol, P., Ingmann, P., Voors, R., Kruizinga, B., Vink, R., Visser, H., and Levelt, P. F.: TROPOMI on the ESA Sentinel-5 Precursor: A GMES mission for global observations of the atmospheric composition for climate, air quality and ozone layer applications, Remote Sens. Environ., 120, 70–83, https://doi.org/10.1016/j.rse.2011.09.027, 2012.
Verhoelst, T., Compernolle, S., Pinardi, G., Lambert, J.-C., Eskes, H. J., Eichmann, K.-U., Fjæraa, A. M., Granville, J., Niemeijer, S., Cede, A., Tiefengraber, M., Hendrick, F., Pazmiño, A., Bais, A., Bazureau, A., Boersma, K. F., Bognar, K., Dehn, A., Donner, S., Elokhov, A., Gebetsberger, M., Goutail, F., Grutter de la Mora, M., Gruzdev, A., Gratsea, M., Hansen, G. H., Irie, H., Jepsen, N., Kanaya, Y., Karagkiozidis, D., Kivi, R., Kreher, K., Levelt, P. F., Liu, C., Müller, M., Navarro Comas, M., Piters, A. J. M., Pommereau, J.-P., Portafaix, T., Prados-Roman, C., Puentedura, O., Querel, R., Remmers, J., Richter, A., Rimmer, J., Rivera Cárdenas, C., Saavedra de Miguel, L., Sinyakov, V. P., Stremme, W., Strong, K., Van Roozendael, M., Veefkind, J. P., Wagner, T., Wittrock, F., Yela González, M., and Zehner, C.: Ground-based validation of the Copernicus Sentinel-5P TROPOMI NO2 measurements with the NDACC ZSL-DOAS, MAX-DOAS and Pandonia global networks, Atmos. Meas. Tech., 14, 481–510, https://doi.org/10.5194/amt-14-481-2021, 2021.
Verhulst, K. R., Karion, A., Kim, J., Salameh, P. K., Keeling, R. F., Newman, S., Miller, J., Sloop, C., Pongetti, T., Rao, P., Wong, C., Hopkins, F. M., Yadav, V., Weiss, R. F., Duren, R. M., and Miller, C. E.: Carbon dioxide and methane measurements from the Los Angeles Megacity Carbon Project – Part 1: calibration, urban enhancements, and uncertainty estimates, Atmos. Chem. Phys., 17, 8313–8341, https://doi.org/10.5194/acp-17-8313-2017, 2017.
Wang, S., Cohen, J. B., Deng, W., Qin, K., and Guo, J.: Using a New Top-Down Constrained Emissions Inventory to Attribute the Previously Unknown Source of Extreme Aerosol Loadings Observed Annually in the Monsoon Asia Free Troposphere, Earth's Future, 9, e2021EF002167, https://doi.org/10.1029/2021EF002167, 2021.
Wang, W., Tian, Y., Liu, C., Sun, Y., Liu, W., Xie, P., Liu, J., Xu, J., Morino, I., Velazco, V. A., Griffith, D. W. T., Notholt, J., and Warneke, T.: Investigating the performance of a greenhouse gas observatory in Hefei, China, Atmos. Meas. Tech., 10, 2627–2643, https://doi.org/10.5194/amt-10-2627-2017, 2017.
Wunch, D., Toon, G. C., Wennberg, P. O., Wofsy, S. C., Stephens, B. B., Fischer, M. L., Uchino, O., Abshire, J. B., Bernath, P., Biraud, S. C., Blavier, J.-F. L., Boone, C., Bowman, K. P., Browell, E. V., Campos, T., Connor, B. J., Daube, B. C., Deutscher, N. M., Diao, M., Elkins, J. W., Gerbig, C., Gottlieb, E., Griffith, D. W. T., Hurst, D. F., Jiménez, R., Keppel-Aleks, G., Kort, E. A., Macatangay, R., Machida, T., Matsueda, H., Moore, F., Morino, I., Park, S., Robinson, J., Roehl, C. M., Sawa, Y., Sherlock, V., Sweeney, C., Tanaka, T., and Zondlo, M. A.: Calibration of the Total Carbon Column Observing Network using aircraft profile data, Atmos. Meas. Tech., 3, 1351–1362, https://doi.org/10.5194/amt-3-1351-2010, 2010.
Wunch, D., Toon, G. C., Blavier, J.-F. L., Washenfelder, R. A., Notholt, J., Connor, B. J., Griffith, D. W. T., Sherlock, V., and Wennberg, P. O.: The Total Carbon Column Observing Network, Philos. T. R. Soc. A, 369, 2087–2112, https://doi.org/10.1098/rsta.2010.0240, 2011.
Wunch, D., Toon, G. C., Sherlock, V., Deutscher, N. M., Liu, C., Feist, D. G., and Wennberg, P. O.: Documentation for the 2014 TCCON Data Release (GGG2014.R0), CaltechDATA, https://doi.org/10.14291/TCCON.GGG2014.DOCUMENTATION.R0/1221662, 2015.
Yang, Y., Zhou, M., Langerock, B., Sha, M. K., Hermans, C., Wang, T., Ji, D., Vigouroux, C., Kumps, N., Wang, G., De Mazière, M., and Wang, P.: New ground-based Fourier-transform near-infrared solar absorption measurements of XCO2, XCH4 and XCO at Xianghe, China, Earth Syst. Sci. Data, 12, 1679–1696, https://doi.org/10.5194/essd-12-1679-2020, 2020.
Yang, Y., Zhou, M., Wang, T., Yao, B., Han, P., Ji, D., Zhou, W., Sun, Y., Wang, G., and Wang, P.: Spatial and temporal variations of CO2 mole fractions observed at Beijing, Xianghe, and Xinglong in North China, Atmos. Chem. Phys., 21, 11741–11757, https://doi.org/10.5194/acp-21-11741-2021, 2021.
Yin, Y., Chevallier, F., Ciais, P., Bousquet, P., Saunois, M., Zheng, B., Worden, J., Bloom, A. A., Parker, R. J., Jacob, D. J., Dlugokencky, E. J., and Frankenberg, C.: Accelerating methane growth rate from 2010 to 2017: leading contributions from the tropics and East Asia, Atmos. Chem. Phys., 21, 12631–12647, https://doi.org/10.5194/acp-21-12631-2021, 2021.
Yu, X., Millet, D. B., and Henze, D. K.: How well can inverse analyses of high-resolution satellite data resolve heterogeneous methane fluxes? Observing system simulation experiments with the GEOS-Chem adjoint model (v35), Geosci. Model Dev., 14, 7775–7793, https://doi.org/10.5194/gmd-14-7775-2021, 2021.
Zeng, N., Han, P., Liu, Z., Liu, D., Oda, T., Martin, C., Liu, Z., Yao, B., Sun, W., Wang, P., Cai, Q., Dickerson, R., and Maksyutov, S.: Global to local impacts on atmospheric CO2 from the COVID-19 lockdown, biosphere and weather variabilities, Environ. Res. Lett., 17, 015003, https://doi.org/10.1088/1748-9326/ac3f62, 2021.
Zhang, B., Yang, T., Chen, B., and Sun, X.: China's regional CH4 emissions: Characteristics, interregional transfer and mitigation policies, Appl. Energ., 184, 1184–1195, 2016.
Zhang, B., Chellman, N. J., Kaplan, J. O., Mickley, L. J., Ito, T., Wang, X., Wensman, S. M., McCrimmon, D., Steffensen, J. P., McConnell, J. R., and Liu, P.: Improved biomass burning emissions from 1750 to 2010 using ice core records and inverse modeling, Nat. Commun., 15, 3651, https://doi.org/10.1038/s41467-024-47864-7, 2024.
Zhang, G., Xiao, X., Dong, J., Xin, F., Zhang, Y., Qin, Y., Doughty, R. B., and Moore, B.: Fingerprint of rice paddies in spatial–temporal dynamics of atmospheric methane concentration in monsoon Asia, Nat. Commun., 11, 554, https://doi.org/10.1038/s41467-019-14155-5, 2020.
Zhao, X., Marshall, J., Hachinger, S., Gerbig, C., Frey, M., Hase, F., and Chen, J.: Analysis of total column CO2 and CH4 measurements in Berlin with WRF-GHG, Atmos. Chem. Phys., 19, 11279–11302, https://doi.org/10.5194/acp-19-11279-2019, 2019.
Zhou, M., Langerock, B., Wang, P., Vigouroux, C., Ni, Q., Hermans, C., Dils, B., Kumps, N., Nan, W., and De Mazière, M.: Understanding the variations and sources of CO, C2H2, C2H6, H2CO, and HCN columns based on 3 years of new ground-based Fourier transform infrared measurements at Xianghe, China, Atmos. Meas. Tech., 16, 273–293, https://doi.org/10.5194/amt-16-273-2023, 2023.
Zhou, M., Wang, P., Kumps, N., Hermans, C., and Nan, W.: TCCON Data from Xianghe, China, Release GGG2020.R0, CaltechDATA, https://doi.org/10.14291/tccon.ggg2020.xianghe01.R0, 2022.