the Creative Commons Attribution 4.0 License.
the Creative Commons Attribution 4.0 License.
 | 09 May 2025
Measurement report: Wintertime aerosol characterization at an urban traffic site in Helsinki, Finland
Kimmo Teinilä
Sanna Saarikoski
Henna Lintusaari
Teemu Lepistö
Petteri Marjanen
Minna Aurela
Heidi Hellén
Toni Tykkä
Markus Lampimäki
Janne Lampilahti
Luis Barreira
Timo Mäkelä
Leena Kangas
Juha Hatakka
Sami Harni
Joel Kuula
Jarkko V. Niemi
Harri Portin
Jaakko Yli-Ojanperä
Ville Niemelä
Milja Jäppi
Katrianne Lehtipalo
Joonas Vanhanen
Liisa Pirjola
Hanna E. Manninen
Tuukka Petäjä
Topi Rönkkö
Hilkka Timonen
Physical and chemical properties of particulate matter and concentrations of trace gases were measured at an urban site in Helsinki, Finland, for 5 weeks to investigate the effect of wintertime conditions on pollutants. The measurement took place in a street canyon (traffic supersite) in January–February 2022. In addition, measurements were conducted in an urban background station (UB supersite, SMEAR III, located approx. 0.9 km from the traffic supersite).
Measurements were also made using the mobile laboratory. The measurements were made driving the adjacent side streets and the street along the traffic supersite. Source apportionment was performed for the soot particle aerosol mass spectrometer measurements to identify organic factors connected to different particulate sources. Particle number concentration time series and the pollution detection algorithm were used to compare local pollution level differences between the sites.
During the campaign three different pollution events were observed with increased pollution concentrations. The increased concentrations during these episodes were due to both trapping of local pollutants near the boundary layer and the long-range and regional transport of pollutants to the Helsinki metropolitan area. Local road vehicle emissions increased the particle number concentrations, especially sub-10 nm particles, and long-range-transported and regionally transported aged particles increased the PM mass and particle size.
- Article
(5198 KB) - Full-text XML
-
Supplement
(2287 KB) - BibTeX
- EndNote


Exposure to increased particulate and gaseous pollutants can have adverse health effects on human health (Atkinson et al., 2014). In particular, exposure to elevated concentrations of particulate matter (PM) is estimated to cause 3.3 million premature deaths per year on the global level (Lelieveld et al., 2015). Fine particles (Dp<2.5 µm) are harmful since they can be transported deep into the human respiratory tract (Zanobetti et al., 2014). Ultrafine particles (Dp<0.1 µm) in particular may cause serious health problems since they can enter even deeper into the respiratory tract (Schraufnagel, 2020), and their concentration can be very high near local sources, for example, near streets and highways with heavy traffic or in street canyons (Pirjola et al., 2017; Trechera et al., 2023).
In earlier studies it was shown that the main local anthropogenic sources in the Helsinki metropolitan area are direct vehicular emissions, road dust, and residential wood burning (Aurela et al., 2015; Carbone et al., 2014; Järvi et al., 2008; Saarikoski et al., 2008; Savadkoohi et al., 2023). The concentration of ultrafine particles can increase in particular near heavily polluted streets and street canyons during morning and evening rush hour (Hietikko et al., 2018; Lintusaari et al., 2023; Okuljar et al., 2021; Trechera et al., 2023). In addition to local sources, long-range or regional transportation increases pollutant concentrations in the Helsinki metropolitan area occasionally (Niemi et al., 2004, 2005, 2009). Local pollutants, mainly vehicle exhaust emissions, increase the particle number concentration due to the increased concentration of ultrafine particles (Rönkkö et al., 2017). In contrast, long-range-transported or regionally transported particles increase the concentration of particulate mass due to the larger size of aged aerosol particles. Lung-deposited surface area (LDSA) is used to predict the health effects of particulate matter related to the particle deposition in the lung alveoli. Increased LDSA concentrations are connected to both increased number concentrations of ultrafine particles and increased particle size during the episodes with long-range-transported or regionally transported aerosol (Kuula et al., 2020; Lepistö et al., 2023a; Liu et al., 2023).
In addition to temporal and diurnal variation of pollutant sources, local meteorology affects the pollutant concentrations in the Helsinki metropolitan area. Wind speed in particular may either decrease or increase pollutant concentrations. Concentrations of gaseous and particulate pollutants from nearby sources like motor vehicle exhausts decrease together with increasing wind speed due to more effective ventilation (Teinilä et al., 2019). On the other hand, the concentration of coarse particles (Dp>2.5 µm) may increase due to the resuspension of street dust during windy periods. Volatile organic compounds emitted from motor vehicle engines can produce secondary organic aerosol (SOA; e.g. Gentner et al., 2017). Cold periods during wintertime cause stagnant conditions with low mixing height, trapping the pollutants in the boundary layer and increasing their concentrations. Snow cover, rain, and wet snow inhibit the resuspension of street dust during wintertime.
A 5-week intensive campaign at a traffic supersite was conducted during winter 2022 in Helsinki, Finland. The aim of the study was to investigate the role of wintertime conditions in aerosol formation and precursor gases, black carbon (BC) emissions, and emission sources and their influence on particles' physical and chemical properties. During wintertime, temperature inversion episodes cause traffic-related pollutants to be trapped in the boundary layer, hindering the mixing and dilution of pollutants. Also, photochemical reactions are minimal during wintertime, and the contribution of biogenic emissions is limited. Dispersion of street canyon emissions was also studied using mobile measurements with the Aerosol and Trace Gas Mobile Laboratory (ATMo-Lab) by Tampere University near and at the measurement site. Particle physical and chemical properties were also measured at an urban background station (UB supersite) during the campaign.
2.1 Measurement sites
2.1.1 Traffic supersite, Mäkelänkatu
The traffic supersite station was the principal measurement site during the winter campaign. The traffic supersite station is an urban measurement station operated by the Helsinki Region Environmental Services Authority (HSY), located in a street canyon on Mäkelänkatu street (60.19654° N, 24.95172° E) in Helsinki (Fig. 1). At the traffic supersite, continuous monitoring of urban air quality, together with the detailed measurements of particle physical and chemical properties, takes place. An additional measurement container was placed next to the traffic supersite station for installing additional measurement devices during the intensive campaign.
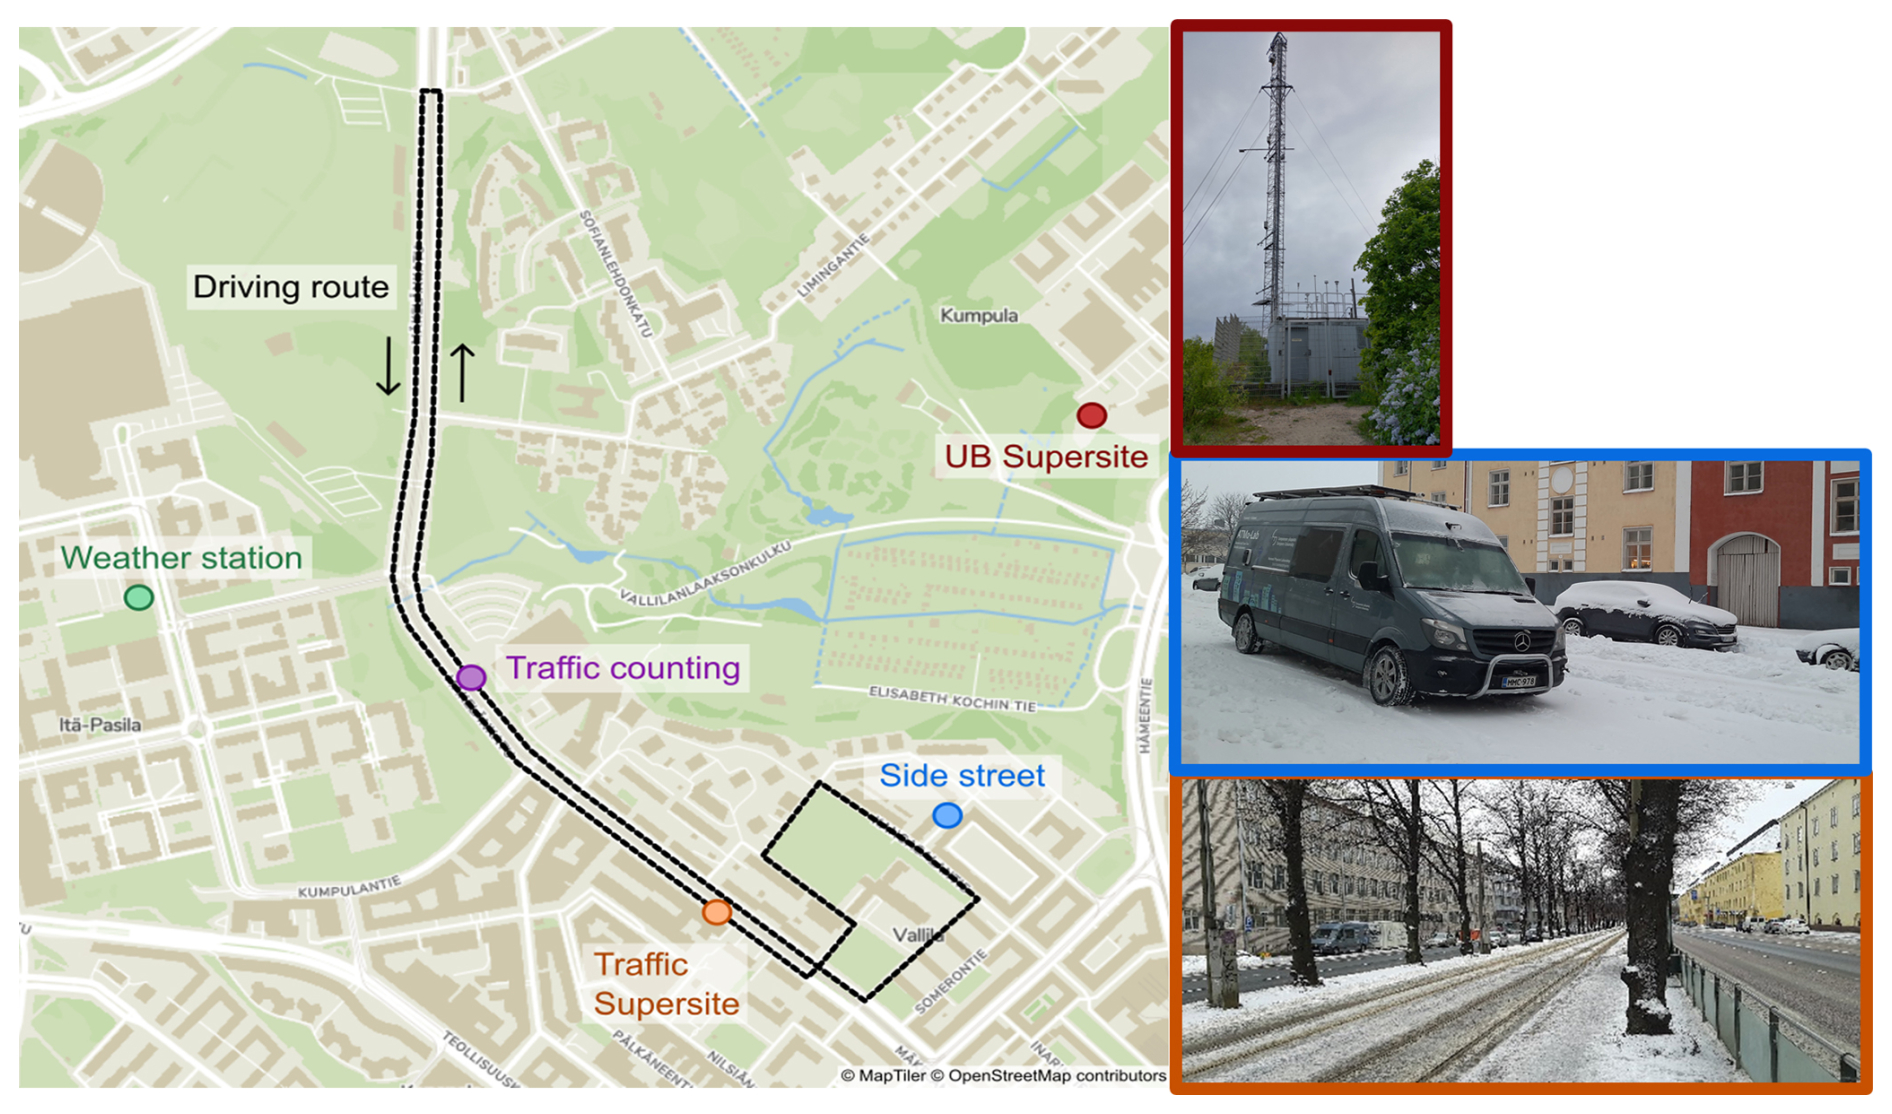
Figure 1Stationary measurement locations and the driving route of the Aerosol and Trace Gas Mobile Laboratory. The traffic supersite is shown on the map as an orange balloon, with a photo in the bottom right. The side street is shown as a blue balloon, with a photo in the middle. The UB supersite is shown as a red balloon, with a photo in the top right.
Mäkelänkatu street, next to the traffic supersite station, consists of six lanes, two rows of trees, two tram lines, and two pavements, resulting in a total width of 42 m in the vicinity of the traffic supersite station. More detailed descriptions of the site and its air flow patterns are found in Hietikko et al. (2018), Kuuluvainen et al. (2018), and Olin et al. (2020), During the measurement campaign, the average number of vehicles driving along the street was 17 000 per day during workdays, and the share of heavy-duty vehicles was 10 % (statistics from the City of Helsinki).
2.1.2 Urban background supersite, SMEAR III, Kumpula
The SMEAR III measurement station is an urban background supersite (UB supersite) located in the Kumpula campus area (Fig. 1, Järvi et al., 2009) There is one main road nearby, approx. 150 m from the station, with a daily traffic load of approx. 50 000 vehicles, also containing a considerable number of heavy-duty vehicles. However, the UB supersite is less affected by the local traffic compared to the traffic supersite because of the markedly longer distance to the main road. The site is also affected by local residential wood combustion emissions, especially during the winter months. A more detailed description of the UB supersite surroundings is given in Järvi et al. (2009).
At the UB supersite, aerosol particle physical and chemical properties and trace gases are continuously measured. During the intensive campaign, additional instrumentation was placed at the UB supersite (see below). The measurements at the UB supersite were used to get information on the aerosol and trace gas properties in urban background areas.
2.1.3 Rural site, Luukki
Luukki measurement station, operated by the HSY, is a Helsinki metropolitan area background station situated in a clean background area (20 km from the traffic supersite) with no major local pollution sources nearby. The increased concentrations of PM2.5 and BC due to the long-range or regional transport of particulate matter are typically observed at the Luukki measurement station together with the measurement stations inside the city centre area. The concentrations of PM2.5 and BC at the Luukki measurement station were measured using Fidas 200 (Palas GmbH) and multi-angle absorption photometer (MAAP; Thermo Electron Corporation) instruments.
2.2 Instrumentation
2.2.1 Stationary measurements at traffic supersite and UB supersite
SP-AMS
The chemical composition of aerosol particles was studied with a soot particle aerosol mass spectrometer (SP-AMS; Aerodyne Research Inc; Onasch et al., 2012) at the traffic supersite. Briefly, the AMS consists of a particle sampling inlet, a particle size chamber, and a particle composition detection system. After entering through the critical orifice and aerodynamic lenses, particles are size-separated in a time-of-flight (ToF) chamber and vaporized either on a tungsten plate (600 °C) or with an intracavity Nd:YAG laser (1064 nm), which were both used in this study. The resulting species are ionized by electron impaction (70 eV) and detected with time-of-flight mass spectrometry. The size range covered by the SP-AMS is achieved with the aerodynamic lens system, which exhibits nearly 100 % transmission efficiency from approximately 70 to 500 nm (aerodynamic diameter; see, e.g., Canagaratna et al., 2007; Jayne et al., 2000). In addition to non-refractory species like organic aerosol (OA), sulfate, nitrate, ammonium, and chloride, the SP-AMS also measures refractory black carbon (rBC) as well as other refractory particulate material (e.g. metals). However, rBC concentrations are not shown in this paper since the BC size emitted by traffic is partially below the transmission efficiency of the SP-AMS.
In this study, the SP-AMS was operated with a 60 s time resolution, of which half was measured in mass spectrum mode (bulk mass concentrations) and half in particle time-of-flight (PToF) mode (mass size distributions). Composition-dependent collection efficiency (CE) was calculated based on Middlebrook et al. (2012). The effective nitrate response factor and relative ionization efficiency (RIE) of ammonium (RIE: 4) and sulfate (RIE: 0.9) were determined by calibrating the instrument using dried size-selective ammonium nitrate and ammonium sulfate particles. Default RIE values for organic aerosol (1.4) and chloride (1.3) were used. The SP-AMS data were analysed using standard AMS data analysis software (SQUIRREL v. 1.63B and PIKA v. 1.23B) within Igor Pro 6 (Wavemetrics, Lake Oswego, OR). For the elemental analysis of OA, the Improved-Ambient method was used (Canagaratna et al., 2015). The sources of OA were investigated by positive matrix factorization (PMF; Paatero, 1999) using the SoFi Pro software package (version 8.4.0), which employs the Multilinear Engine (ME-2) as a PMF solver (Canonaco et al., 2013).
The uncertainties of the AMS measurement arise from several factors. One source of uncertainty is the effective nitrate response factor used, which is determined by the calibration of the AMS. Also, the use of default RIE for the calculation of total OA concentration is a source of uncertainty as a single RIE value for organics may not represent thousands of different organic compounds found in particles. The fact that the lower size range of the AMS is 50 nm only has a minor effect on the measured concentrations since the majority of PM1 mass is in particles above this size. The calculation of CE based on the chemical composition of measured aerosol is an additional source increasing the uncertainty as it uses nitrate, ammonium, and sulfate concentrations in the calculation. The overall uncertainty of the AMS measurements can be estimated to be about 20 %–30 %.
ACSM
The chemical composition of particulate matter (PM1) was measured continuously using an aerosol chemical speciation monitor (ACSM; Aerodyne Research Inc., Ng et al., 2011) at the UB supersite. The ACSM characterizes non-refractory aerosol species (total organics, sulfate, nitrate, ammonium, and chloride) with a time resolution of approximately 30 min. The ACSM measures particles that pass through the aerodynamic lens that is similar to the aerodynamic lens used in the AMS. The flow into the ACSM (controlled by critical orifice) was roughly 0.1 L min−1, but in addition bypass flow of 3 L min−1 was used to get particles efficiently close to the inlet of the ACSM. A cyclone (URG, URG-2000-30ED) was used before the ACSM to remove particles larger than 2.5 µm (aerodynamic diameter) to prevent the critical orifice from being clocked. The uncertainties related to the ACSM measurements are like those described for the AMS above. However, the measured concentrations of chloride and ammonia were very low during the campaign, so the measurement uncertainty for these two components in particular is clearly higher. The estimation for the uncertainties is 50 % for ammonia and > 50 % for chloride.
GC-MS/FID
Volatile organic compounds (VOCs) and intermediate-volatility organic compounds (IVOCs) containing 6 to 15 carbon atoms were measured with 1 h time resolution using an in situ thermal desorption–gas chromatograph–mass spectrometer (TD-GC-MS) at the traffic supersite. Quantified compounds included 10 terpenoids, 15 alkanes, 20 aromatic hydrocarbons, 4 oxygenated aromatic hydrocarbons, and 8 polycyclic aromatic hydrocarbons (PAHs) (Table S1 in the Supplement). The system consisted of a TurboMatrix 350 thermal desorber (TD) connected to an online sampling accessory, a Clarus 680 (GC), and a Clarus SQ 8 T (MS), all manufactured by PerkinElmer. The GC column used was an Elite-5MS, 60 m × 0.25 mm (i.d.), with a film thickness of 0.25 µm (PerkinElmer). Samples were collected on the TD's Tenax-TA & Carbopack B dual absorbent cold trap, which was kept at 20 °C. Sampling was done approx. 3 m from street level. The inlet was 1/8 in. FEP-lined tubing, and the outside portion was heated to be around 30 °C. Ozone was removed from the sample flow by guiding the flow through a 1/8 in. stainless steel tube heated to 120 °C. A flow of 300–800 mL min−1 was kept through the inlet, from which the TD collected 30–45 min samples with a flow of 40 mL min−1. More detailed description of the system and method can be found in Helin et al. (2021).
Additional sorbent tube samples were collected at the UB supersite. Samples were collected on Tenax-TA & Carbopack B dual absorbent tubes via a modified sequential tube sampler (STS 25 Unit, PerkinElmer). Main modifications for the sampler were an upgrade to the sampling pump and the exchange of rain cover from stainless steel to PFA. The STS unit consists of a carrousel that rotates on a timer placing the tubes to the slot for active sampling. The carrousel holds 24 tubes at a time, and the sampling time was set to 4 h, making sampling sets approx. 4 d long. The sampling flow was kept at around 100 mL min−1. Tubes were then analysed in the laboratory with a similar TD-GC-MS setup to that described above for in situ samples.
Non-methane hydrocarbons (NMHCs) containing 2–5 carbon atoms were sampled with stainless steel vacuum canisters at the traffic supersite. The flow from ambient air to the vacuum of the canisters was restricted by a critical orifice, making sampling time 24 h. The canister walls were coated with silcosteel. Before analysis, canisters were over pressurized with pure nitrogen (99.9999 %). From the pressurized canisters, samples were collected on the cold trap of the Markes International Unity 2 TD via the AirServer add-on. The system had a Dean switch with a dual-column and detector setup. The first column was a DB-5ms, 60 m × 0.25 mm (i.d.), with a film thickness of 1 µm (Agilent), and after that the most volatile compounds (C2–C5) were directed to a second column, the CP-Al2O3/KCl, 50 m × 0.32 mm (i.d.), with a film thickness of 5 µm (Agilent) via the Dean switch. C2–C5 compounds were analysed with a flame ionization detector (FID) and the rest with the MS. The GC–FID setup was an Agilent 7890A, and the MS was an Agilent 5975C. The detection limits for the different VOCs varied between 0.2 and 16 ng m−3. The average uncertainty was 2.8, 25, and 18 ng m−3 for terpenoids, aromatic compounds, and C6–C15 alkanes, respectively.
CI-API-ToF-MS
At the traffic supersite, gaseous sulfuric acid (H2SO4) was sampled and measured in the same way as described in Olin et al. (2020) with a nitrate-ion-based chemical ionization–atmospheric pressure interface– time-of-flight mass spectrometer (nitrate CI-API-ToF-MS; Aerodyne Research Inc. USA and Tofwerk AG Switzerland). A high flow rate of outdoor air was pulled in through the roof into the container with a vertical probe and a fan. A vacuum pump pulled in a partial flow of 12 L min−1 from the vertical probe and 19.01 L min−1 of reagent flow, of which 19 L min−1 was sheath air and 0.01 L min−1 flowed over a reservoir of liquid HNO3. The air for the reagent flow was drawn from inside the container and filtered with a HEPA filter. A diaphragm pump also pushed to provide sufficient flow. The flows were combined and proceeded through an X-ray source, which ionized HNO3 vapour into NO ions. The instrument pulled in approximately 0.1 L min−1 through a critical orifice, and the excess flowed through an active carbon filter, HEPA filter, and vacuum pump to outside of the container. NO ionized H2SO4 into HSO by receiving a proton. Inside the instrument, quadrupoles directed the sample through differential pumping stages onto a detector inside a time-of-flight chamber. The CI-API-ToF-MS data are not shown in this paper.
NAIS
Two neutral cluster and air ion spectrometers (NAISs; Airel Ltd, Manninen et al., 2016; Mirme and Mirme, 2013) were used to measure size and mobility distributions of aerosol particles and air ions at the traffic supersite station (NAIS 5-27) and at the UB supersite station (NAIS12). Air ions of both polarities in the electric mobility range from 3.2 to 0.0013 cm2 V−1 s−1 (∼ 0.8–40 nm in mobility diameter) and the distribution of aerosol particles in the size range from ∼ 2 to 40 nm were measured with a maximum time resolution of 1 s. Both instruments sampled via horizontal copper inlets with a sample flow rate of ∼ 54 L min−1. The total particle concentrations measured by the NAISs have been observed within ±50 % of the reference condensation particle counter (CPC) concentration at 4–40 nm sizes (Asmi et al., 2009).
SO2 analyser
An enhanced trace level SO2 analyser (Thermo Scientific™, Model 43i-TLE) was employed at the measurement container next to the traffic supersite between 29 January and 22 February. Data were collected in 20 s time resolution with the instrument flow rate of 0.5 L min−1. SO2 data are not shown in this paper.
CPCs
Two condensation particle counters (CPCs), TSI model 3756 (UB supersite) and Airmodus model A20 (traffic supersite), were used to measure particle number concentration time series. The TSI 3756 has a particle concentration range up to 300 000 cm−3, a size range down to 7 nm (), and a maximum detectable particle size >3 µm. An inlet flow rate of 1.5 L min−1 was used. The Airmodus A20 was used with a bifurcated flow diluter (dilution ratio 8.5), which expands the concentration range up to 250 000 cm−3 in single-particle counting mode. The particle size range measured was from 5.4 nm () to 2.5 µm. The uncertainties of the CPCs are typically within 10 % concentrations of the ambient aerosol, ranging from a few thousands up to 100 000 particles cm−3 (Schmitt et al., 2020). In both CPC types, butanol (n-butyl alcohol) was used as a working fluid, and data were collected at a 1 min time resolution.
nCNC with AND
An Airmodus nanoparticle diluter (AND) (Airmodus Ltd, Lampimäki et al., 2023) was used to dilute sample air upstream of a nano-condensation nucleus counter (nCNC) system (Airmodus Ltd, Vanhanen et al., 2017) at the traffic supersite. The nCNC measures the particle activation size distribution between ca. 1 and 4 nm by scanning the cut-off size. A default dilution factor of 5 was used, whereby dry compressed air was used in the dilution, which also allowed for drying of the sample to <30 % relative humidity (RH). In the present study, the ion precipitator (IOP) voltage (1 kV) of AND was sequentially switched on and off with a custom-made MATLAB-based program. IOP can be used to scavenge ions at mobility diameters below ∼8 nm, while the larger (> 10 nm) particles pass through the IOP with a 50 % cut-off size of around 9 nm. Thus, the IOP mode could provide additional information on the charged fraction of recently formed particles or clusters. The nCNC–AND data have not been shown in this paper.
MAAP
Black carbon concentration was measured using a multi-angle absorption photometer (Thermo Electron Corporation, Model 5012, Petzold and Schönlinner, 2004) at the traffic supersite and at the UB supersite stations. The MAAP determines the absorption coefficient (σAP) of the particles deposited on a filter by a simultaneous measurement of transmitted and backscattered light. The σAP is converted to BC mass concentrations by the instrument firmware using a mass absorption cross section of 6.6 m2 g−1 (Petzold and Schönlinner, 2004). The flow rate of the MAAP at the traffic supersite was 11 and 5 L min−1 at the UB supersite. Both MAAP instruments measured at a 1 min time resolution, and the cyclone/PM1 inlet was used to cut off particles above 1 µm. At the traffic supersite, most of the time, the measured BC concentration was above the detection limit of the MAAP, so the measurement uncertainty is mostly due to the uncertainties in the sampling, like particle losses in the sampling lines. The uncertainty of the MAAP results can be estimated to be around 10 %–15 %. At the UB supersite the measured BC concentration was more frequently near or below the detection limit. This can cause larger uncertainties for the BC measurements at UB supersite.
AE33
An AE33 dual-spot aethalometer (Magee Scientific, Slovenia) was used to measure the aerosol light absorption and corresponding carbon mass concentrations at the traffic supersite and at the UB supersite. The AE33 measures at seven different wavelengths between 370 and 950 nm (Drinovec et al., 2015; Hansen et al., 1984). The flow rate of the AE33 was 5 L min−1, and the filter tape used was a PTFE-coated glass fibre filter (no. M8060). The cut-off size of the sample was 1 µm at both stations, and it was achieved using a Sharp Cut Cyclone (Model SCC1.197, BGI Inc., Butler, NJ, USA). The data from the AE33 instrument are not used in this paper.
AQ Urban
The alveolar LDSA concentration of aerosol particles between 10 and 400 nm was measured with the Pegasor AQ™ Urban instrument (Pegasor Ltd., Finland) at the traffic supersite and at the UB supersite (Kuula et al., 2020). The measured LDSA concentration was typically above the detection limit of the AQ Urban instrument (1 µm2 cm−3).
DMPS
A differential mobility particle sizer (DMPS) was used to measure particle size distributions from 11 to 800 nm (traffic supersite) and from 3 to 800 nm (UB supersite) using a Vienna-type differential mobility analyser and an Airmodus A20 model CPC (traffic supersite) and TSI 3025 CPC (UB supersite). The particle number size distributions from 20 to 200 nm determined by the mobility particle size spectrometers are typically within an uncertainty range of around ±10 %, while below and above this size range the uncertainty increases. For particle sizes above 200 nm, 30 % uncertainty has been reported (Wiedensohler et al., 2012).
Picarro
The gas analyser for carbon monoxide (CO), carbon dioxide (CO2), and methane (CH4) at both sites was a Picarro G2401, manufactured by Picarro Inc. (Santa Clara, CA). It also measures water vapour concentration, based on which it calculates dry concentrations for the other components. The instrument is based on cavity ring-down spectroscopy (CRDS), whereby long optical path length allows for measurements with high precision and stability using near-infrared laser sources.
The Kumpula instrument close to the UB supersite took its sample air from the roof of the five-storey Finnish Meteorological Institute's building, ca. 30 m above the ground. The sample air was dried with a Nafion dryer run in reflux mode. The traffic supersite Picarro was run with non-dried sample air. Both instruments were calibrated with WMO/CCL (World Meteorological Organization/Central Calibration Laboratory) traceable gases. The measured CO2 and CH4 concentrations were above the detection limit of Picarro at both sites. The uncertainty of these two gases is low (10 %), but for the measured CO concentrations, the uncertainty can be larger.
Filter sampling and chemical analysis
In addition to online measurements, PAH filter samples (PM10) were collected on a daily basis at the traffic supersite. Also, 12–24 h filter samples (PM1) were collected for sugar anhydride (levoglucosan, mannosan, and galactosan) and elemental carbon–organic carbon () analyses at the traffic supersite. Quartz fibre filters (Pall, Tissuquartz 2500-QAT-UP, NY, USA) were used as sampling substrates for the PM1 samplings at a flow rate of 20 L min−1.
Other instrumentation
Concentrations of particulate mass (PM2.5 and PM10) were measured with the Fidas 200 (Palas) instrument at the traffic supersite. Concentrations of gaseous compounds were also continuously measured at the traffic supersite. The APNA 370 (Horiba) instrument was used for measuring the concentrations of NOx (APNA 370) and O3 (APOA 370), the APMA 360 (Horiba) was used to measure the concentration of CO, and the LI-7000 (LI-COR) was used to measure the concentration of CO2. The particle scattering coefficient was measured with a nephelometer (TSI, model 3610) at the traffic supersite. The measurement devices at the traffic supersite are shown in Table S2 and those at the UB supersite in Table S3.
Back trajectories of air masses arriving at the traffic supersite were calculated using the NOAA HYSPLIT model (Rolph et al., 2017; Stein et al., 2015). The 96 h back trajectories were calculated for every hour for 200 m above sea level. Mixing height was calculated using a model developed at the Finnish Meteorological Institute (MPP-FMI; Karppinen et al., 2000; detailed description of the mixing height calculation is in the Supplement). The data analysis was done using R software (R Core Team 2022) and the R package openair (Carslaw and Ropkins, 2012). Hourly mean concentrations of the measured components were used in the following discussion unless otherwise mentioned. The timestamp used for hourly mean concentrations is the end hour, and the time is local time (LT) throughout the paper.
PAH analyses
The concentrations of six PAHs (benzo(a)anthracene, benzo(b)fluoranthene, benzo(k)fluoranthene, benzo(a)pyrene, indeno(1,2,3-cd) pyrene, dibenz(a,h)anthracene) were analysed from daily PM10 samples using a gas chromatograph–mass spectrometer (GC-MS/MS, Agilent 7890A and 7010 GC/MS Triple Quadrupole). For the analysis, the samples were ultrasonically extracted with toluene, dried with sodium sulfate, and concentrated to 1 mL. For chromatographic separation, the HP-5MS UI (ultra inert) column (30 m × 0.25 mm i.d., film thickness 0.25 µm) and 2 m pre-column (same phase as analytical column) were used. Helium (99.9996 %) was used as a carrier gas with a flow of 1 mL min−1. The temperature programme started at 60 °C with a 1 min hold, followed by an increase of 40 °C min−1 1 to 170 °C, and 10 °C min−1 to 310 °C with a hold of 3 min. Deuterated PAH compounds (naphthalene-d8, acenaphthene-d10, phenanthrene-d10, chrysene-d12, perylene-d12, PAH-Mix 31D, Dr. Ehrenstorfer) were used as internal standards and were added to an extraction solvent before extraction. External standards (PAH-Mix 137, Dr. Ehrenstorfer) with five different concentration levels were used. In the analysis of benzo(a)pyrene, the EN 15549 (2008) standard was followed. Measurement uncertainty was calculated from the validation data (Guide Nordtest TR537) for the target value (0.1 ng m−3), found to be 25 %. The analysis method is accredited (SFS-EN ISO/IEC 17025:2017). The method has been previously described in detail by Vestenius et al. (2011).
analyses
The concentrations of particulate OC and EC were analysed using a thermal–optical aerosol analyser (model 5 L, Sunset Laboratory Inc., Tigard, OR, US; Birch and Cary, 1996). The thermal analytical technique splits carbon into fractions according to their volatility. In the first stage, OC is desorbed from the quartz fibre filter through progressive heating under a pure He stream. However, a fraction of OC may char and form pyrolysed OC during that stage. In the second phase, the sample is heated in temperature steps under a mixture of 98 %He–2 %O2 (HeOx phase), during which pyrolysed OC and EC are desorbed. To correct the pyrolysis effect, the analyser measures the transmittance of a 658 nm laser beam through the filter media. The split point, which separates OC and pyrolysed OC from EC, is determined as a point when the laser signal returns to its initial value. After being vaporized in several temperature steps, OC, EC, and pyrolysed OC are catalytically converted first to CO2 and then to CH4, which is quantified with a flame ionization detector. At the end of each analysis, a fixed volume of calibration gas (5 %CH4 in helium) is injected into the instrument to correct possible variations in the analyser's performance. In this study, EUSAAR-2 protocol was used (Cavalli et al., 2010). The uncertainties of the analysis are ∼ 15 % (Cavalli et al., 2024).
Sugar anhydride analyses
The concentration of monosaccharide anhydrides (MAs; levoglucosan, mannosan and galactosan) was analysed from the PM1 samples using high-performance anion-exchange chromatography and mass spectrometry (HPAEC-MS). The HPAEC-MS system consists of a Dionex ICS-3000 ion chromatograph coupled with a quadrupole mass spectrometer (Dionex MSQ). The HPAEC-MS system had 2 mm CarboPac PA10 guard and analytical columns (Dionex) and a potassium hydroxide (KOH) eluent. The ionization technique used was electrospray ionization. The analytical method is similar to that described in Saarnio et al. (2010), except that the internal standard used was methyl-β-D-arabinopyranoside. A 1 cm2 punch of the quartz fibre filter was extracted into 5 mL of Milli-Q water with an internal standard concentration of 100 ng mL−1, and the HPAEC-MS system was utilized for determination of MAs: s at 161. The uncertainty of the analyses was typically 10 %–15 % and even larger (25 %) when the analysed concentration was low.
2.2.2 ATMo-Lab measurements
In addition to the stationary measurement stations, the Aerosol and Trace Gas Mobile Laboratory by Tampere University was utilized in both stationary and mobile measurements between 18 January and 16 February 2022. The focus of the ATMo-Lab measurements was to understand how the effects of road traffic vary in the studied street canyon compared to more open sections of the same road. Also, the aim was to study the dispersion of road traffic emissions to the adjacent streets in a built environment. Stationary measurements were conducted on the kerbside, next to the traffic supersite, and along a side street (Anjalantie, 60.197725° N, 24.957364° E) nearby. Mobile measurements included a park and a street canyon section of the main street (Mäkelänkatu) along which the measurement stations were located and its side streets with apartment buildings. Stationary measurement locations along with the driving route are presented in Fig. 1. Measurements were conducted daytime between 06:30 and 19:30 because the effects of traffic were clearest during that time. The measurement setup inside the Aerosol and Trace Gas Mobile Laboratory is shown in Fig. S1 in the Supplement.
The sample air was taken from an inlet located above the ATMo-Lab's windscreen and distributed to the instruments at the back of the van. The risk of self-sampling during driving measurements was minimal as the exhaust pipe is at the rear end of the van. The van itself is Euro VI-compliant. The measurement setup inside the ATMo-Lab is shown in Fig. S1. The key measurement target of the ATMo-Lab measurements was ultrafine particles. Particle number concentrations were measured using a condensation particle counter battery (CPCB) and an electrical low-pressure impactor (ELPI+, Dekati Ltd). The CPCB consisted of a combination of a particle size magnifier (PSM) and a CPC in parallel with four CPCs with different cut-off sizes. The working principle of the PSM is described in Vanhanen et al. (2011). Exact CPCB instruments were the A11 nCNC (combination of PSM and CPC, Airmodus Ltd), CPC 3756 (TSI Inc), CPC 3775 (TSI Inc), CPC A20 (Airmodus Ltd), and CPC A23 (Airmodus Ltd). Total particle number concentrations were simultaneously measured for size ranges of > 1.3, > 2.5, > 4, > 10, and > 23 nm, respectively, with a time resolution of 1 s. Sample air was diluted before entering to the CPCB using a bifurcated flow diluter, including a static mixer, with dilution ratio of 17.
The ELPI+ measured the particle number size distribution with its 14 impactor stages in a size range from 6 nm to 10 µm. The operation principle of the ELPI is described in Keskinen et al. (1992) and Marjamäki et al. (2000), and the calibration of the renewed ELPI+ is presented in Järvinen et al. (2014). The ELPI+ was also used to measure particle lung-deposited surface area (LDSA) and mass (PM). The stage-specific conversion from electric current data of the ELPI+ to LDSA concentration enables measurement of the LDSA concentration and size distribution with the whole ELPI+ size range (Lepistö et al., 2020). LDSA was also measured by a sensor-type device Partector (naneos particle solutions GmbH). Furthermore, PM2.5 concentrations were calculated by integrating the particle number size distribution measured with the ELPI+, assuming spherical particles with unit density. Similar assumptions were made for particle number and LDSA size distributions.
Non-volatile particle number was measured with two prototype instruments originally developed for renewed demands of vehicle inspection: a mobile particle emission counter (MPEC+, Dekati Ltd) and a Pegasor sensor (Pegasor Ltd). The latter sampled first from the roof of the ATMo-Lab (18 January to 2 February), after which it was also connected to the main line (2 to 16 February). A combination of a thermodenuder followed by a CPC was used as a reference for the prototype instruments. The thermodenuder model was the same as in Heikkilä et al. (2009) and Amanatidis et al. (2018). The CPC used was a model CPC 3775 (by TSI Inc) with altered cut-off diameter (4, 10, or 23 nm) as the cut-off size was changed twice during the measurements. The cut-off size was changed by altering the condenser temperature of the CPC according to a laboratory calibration.
For the analysis of particles' chemical composition and especially black carbon, the ATMo-Lab setup included a SP-AMS and an AE33 aethalometer like the instruments described in the stationary measurements section. For the driving measurements, the SP-AMS menu was switched from a 60 s time resolution (30 s mass spectrum mode + 30 s PToF mode) to a 24 s time resolution operation mode, in which 14 s was measured in a mass spectrum mode and 10 s in a PToF mode. From the gaseous compounds, the ATMo-Lab was equipped to measure CO2 (LI-7000, LI-COR Corp) and NO (Model T201, Teledyne Technologies Inc.).
In stationary measurement locations, particles were collected with and without thermal treatment on holey carbon grids by a flow-through sampler. This was done for elemental composition and morphology study with a (scanning) transmission electron microscope (S/TEM) accompanied by an energy-dispersive spectrometer (EDS).
3.1 General description of the measurement campaign
3.1.1 Meteorology
The intensive campaign took place between 17 January and 22 February 2022, which is typically the coldest winter period with a minimum amount of sunlight in Helsinki, Finland. Temperature, relative humidity, wind speed, and wind direction, measured about 1 km from the traffic supersite during the winter campaign, are shown in Fig. 2. Mean temperature during the measurement campaign was −1.4 °C (range −10.0–2.9 °C), and mean relative humidity was 89 % (range 58 %–100 %). The temperature was near 0 °C most of the time. The prevailing wind direction during the measurements was from south to south-east, and the mean wind speed was 4.9 m s−1 (range 0.59–11.4 m s−1). The average mixing height was 408 m (range 58–844). Surface inversion episodes take place during the coldest winter days with low temperature and wind speed, causing gaseous and particulate pollutants to be accumulated in the boundary layer (Barreira et al., 2021; Teinilä et al., 2019). Two cold periods together with low wind speed and low mixing height took place during the campaign (Fig. 2), enabling surface inversion episodes. The conditions during the winter campaign (temperature, inversion episodes, and variable snow cover) represented typical winter conditions in Helsinki.
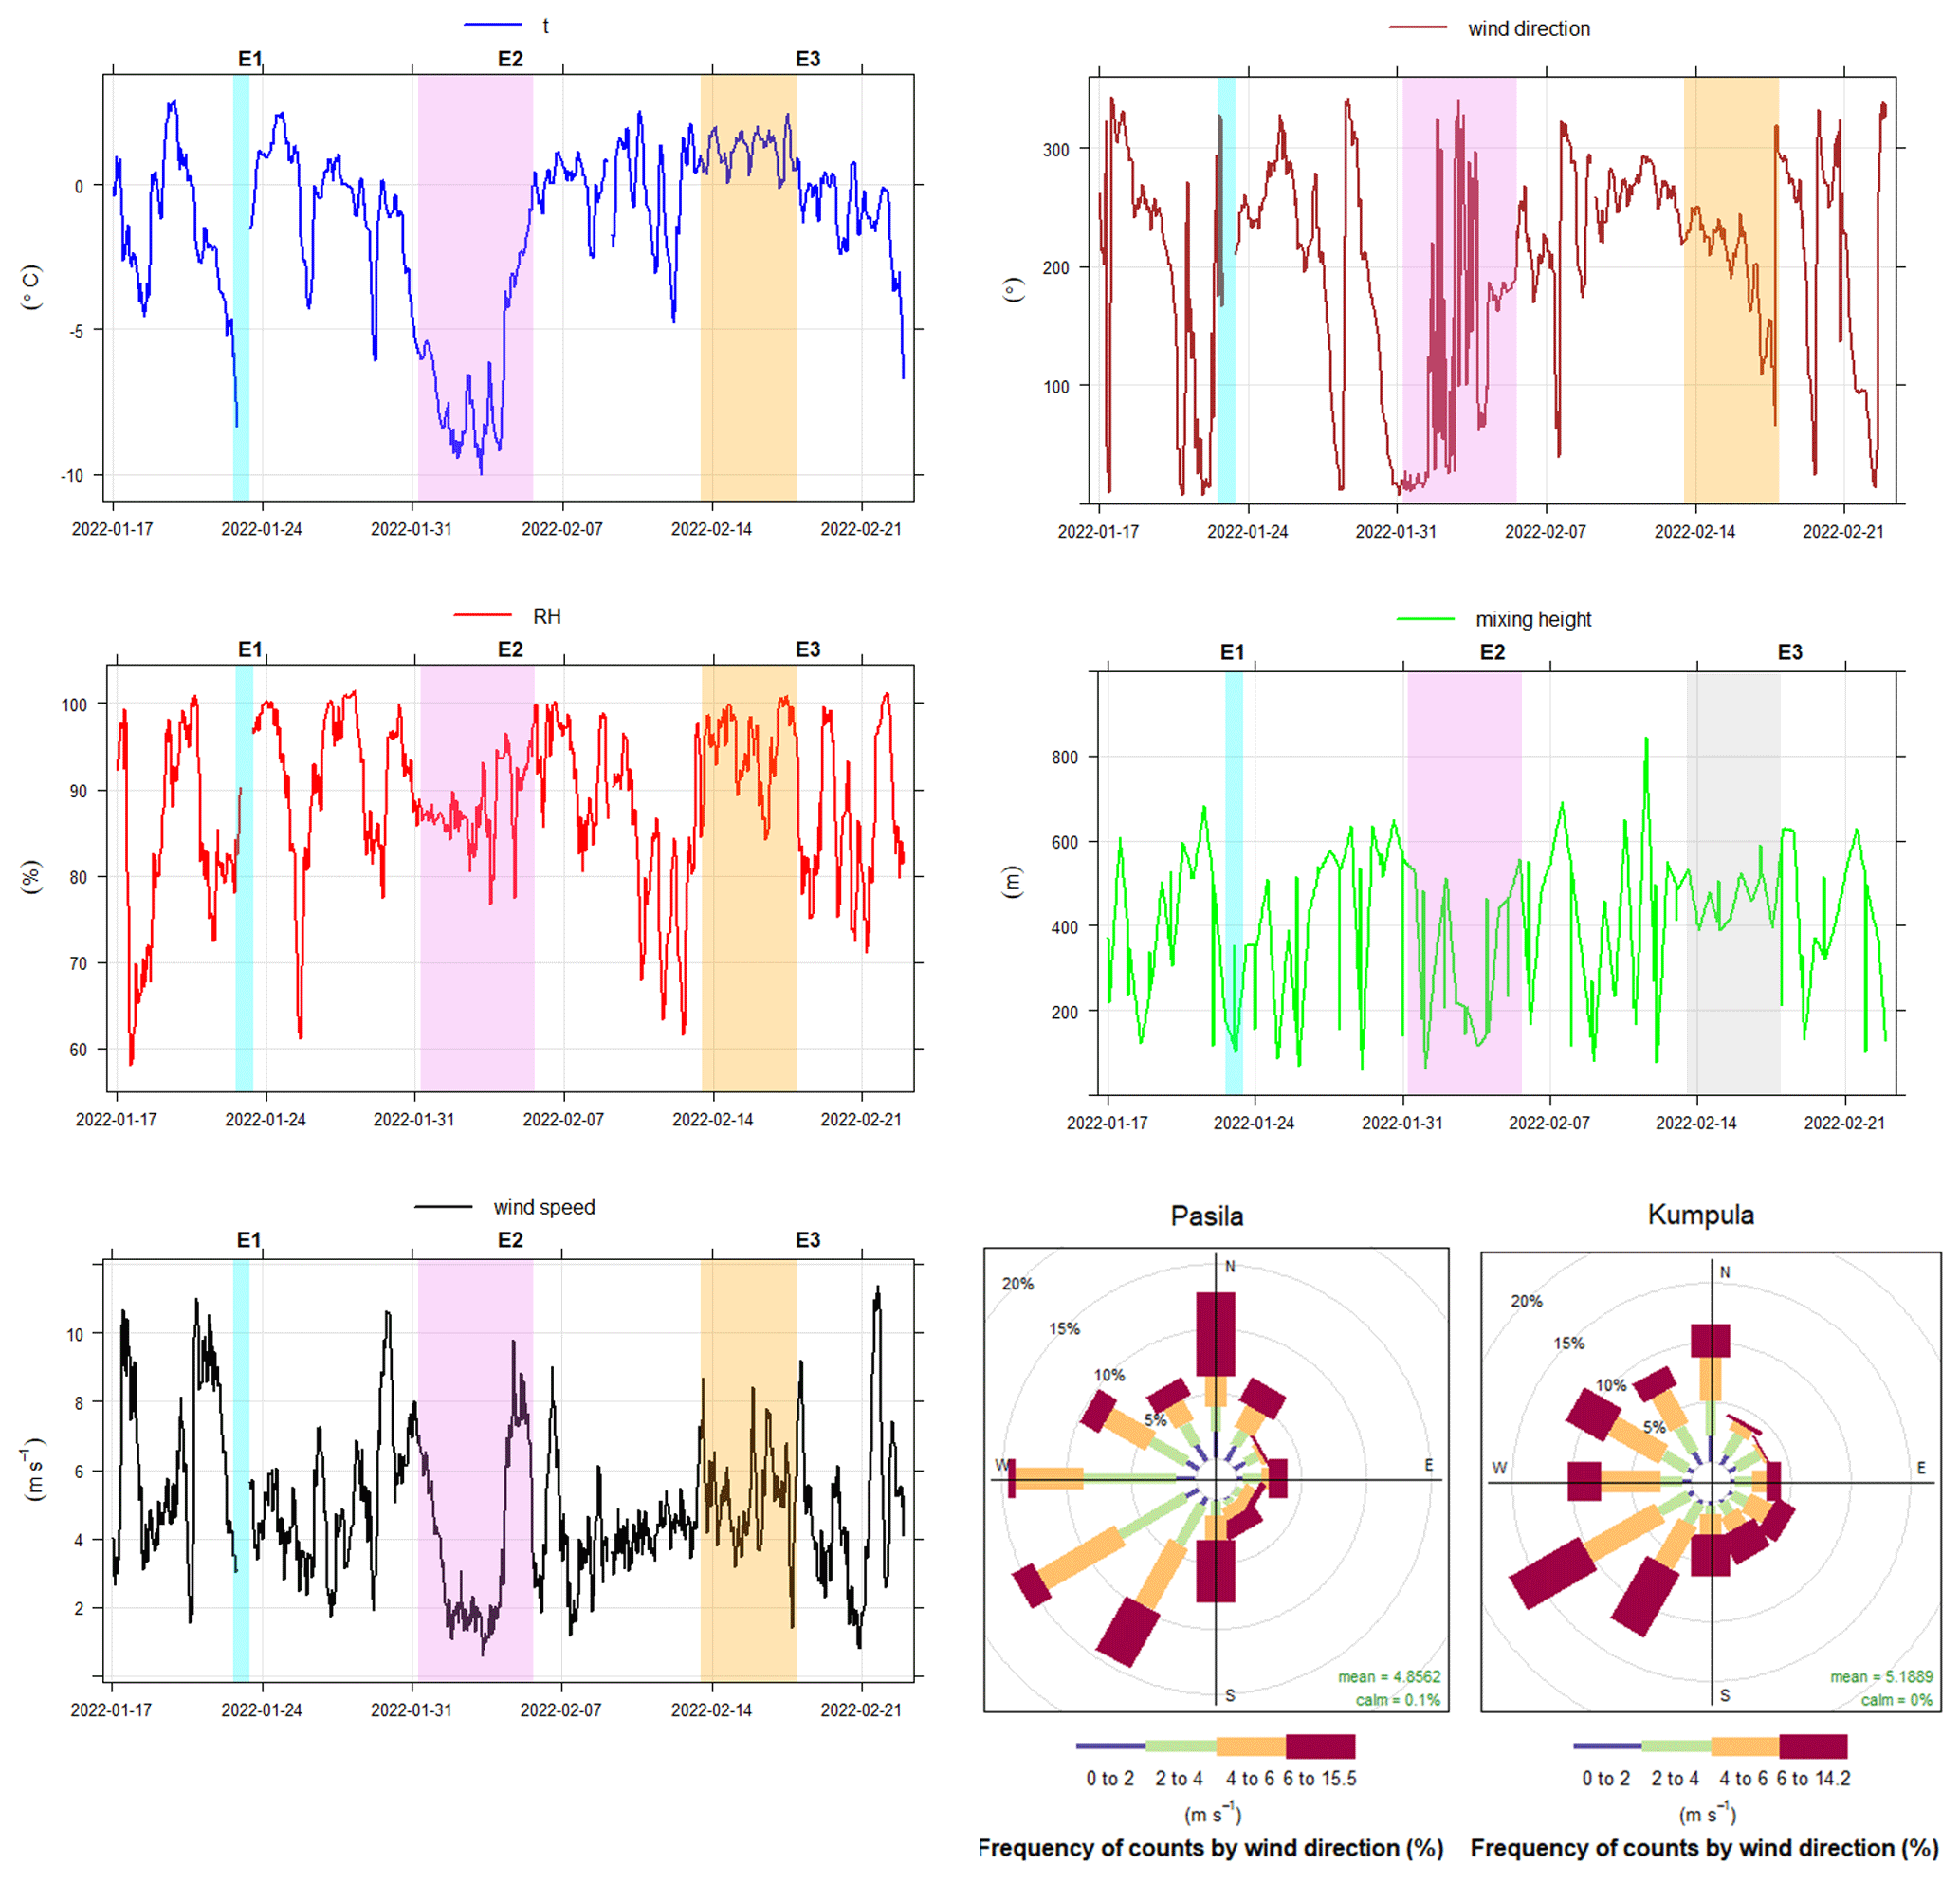
Figure 2Temperature, relative humidity, wind speed, wind direction, and mixing height during the measurement period measured at Pasila. The three episodes are coloured in the figure. The wind roses at Pasila and Kumpula during the campaign are also shown (bottom figure). The Pasila weather station is about 1 km distance from the traffic supersite, and the Kumpula weather station is next to the UB supersite.
In general, local traffic is an important source of gaseous and particulate pollutants at the traffic supersite. The air quality in Helsinki is also affected by long-range-transported pollution episodes (Niemi et al., 2004, 2005, 2009; Leino et al., 2014; Pirjola et al., 2017). Local wood burning due to heating of detached houses in winter increases air pollutant concentrations in Helsinki. The majority of this wood burning takes place outside the city centre in the residential suburban area (Kangas et al., 2024). During wintertime, the long-range-transported and regionally transported air masses consist of more particulate pollutants connected to biomass burning (Pirjola et al., 2017; Teinilä et al., 2022).
3.1.2 Traffic frequencies
Traffic frequencies near the traffic supersite station are shown in Fig. 3. The exact location for traffic counting is presented in Fig. 1. Traffic frequencies are continuously counted by the City of Helsinki. Inductive loop sensors are installed below the asphalt surface for each driving lane. As the magnetic field of a vehicle passes over the inductive loop, it generates signals that are then recorded. The traffic frequencies were measured about 500 m from the station but after the measurement point traffic directed to the city centre is divided into two other main streets before the traffic supersite. The average number of vehicles passing the traffic supersite during workdays was 17 000 per day, which is about 40 % fewer than at the point where traffic frequencies were measured. The traffic frequency at the traffic supersite was obtained by manual traffic counting.
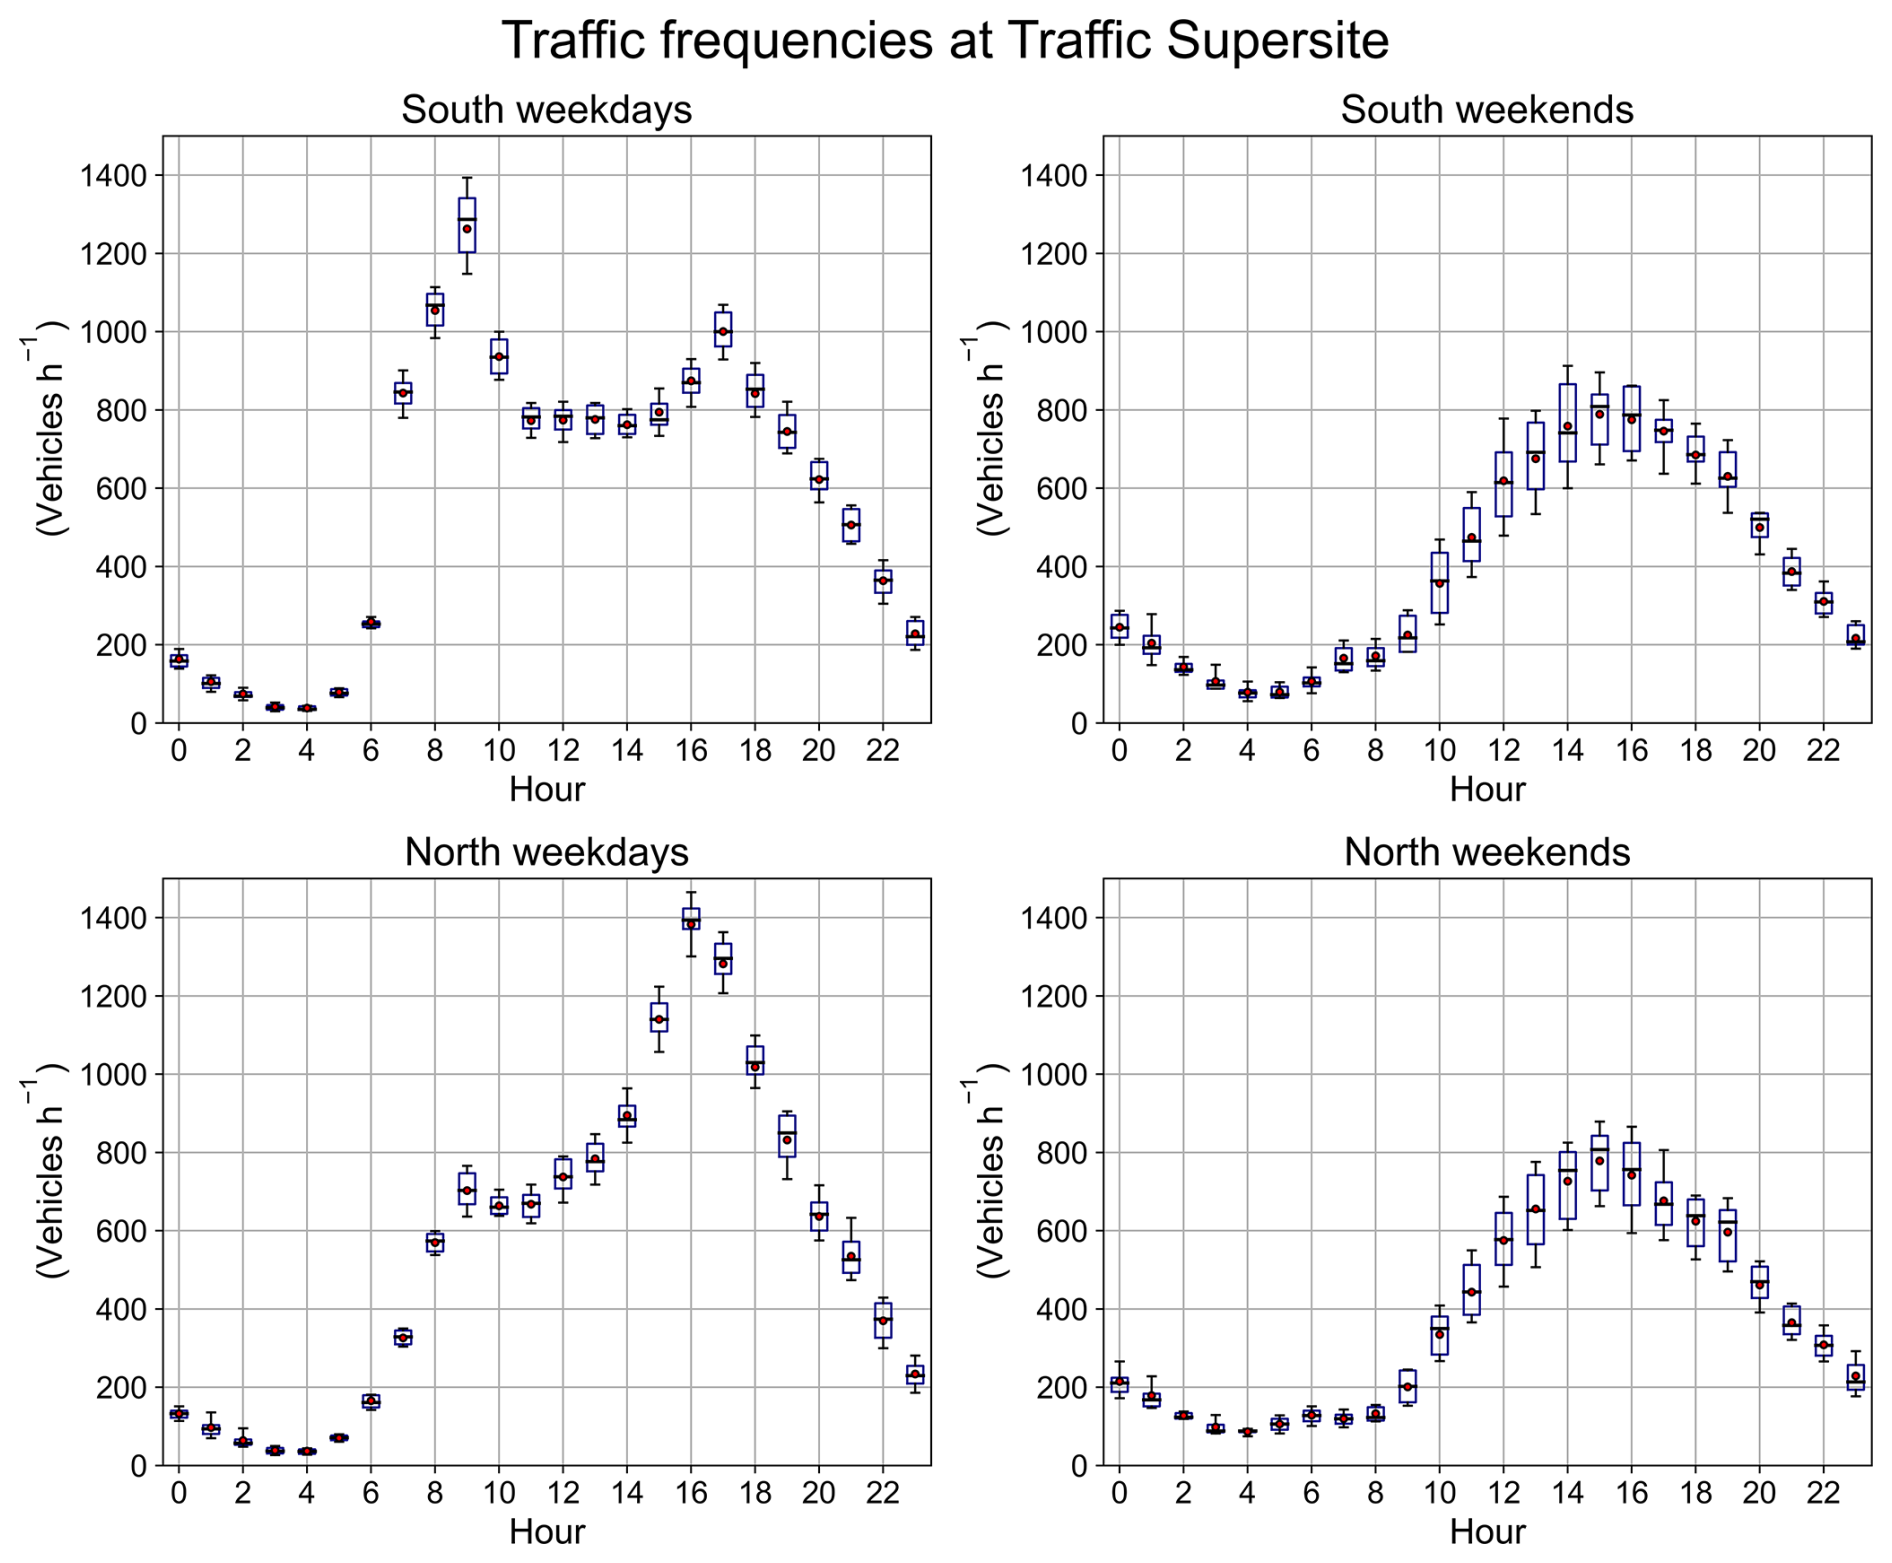
Figure 3Hourly traffic frequencies to south (towards city centre) and to north during workdays and weekends near the traffic supersite. The traffic supersite station is placed on a pavement on the south traffic side on Mäkelänkatu street.
Traffic frequency towards the city centre (south) starts to increase around 06:00, and it reaches its maximum between 09:00 and 10:00. The afternoon traffic frequency peak between 17:00 and 18:00 is slightly lower compared to the morning. Traffic frequencies away from the city centre (north) follow an opposite trend, showing maximum frequencies during afternoon hours. The maximum frequencies out of the city centre are achieved at the same time as those towards the city centre. There is no rush hour during the weekends (Fig. 3), and traffic frequencies start to slowly increase before noon and show their maximum between 18:00 and 19:00 in both directions. The measurement site is located near to the lines leading towards the city centre (south).
3.1.3 Particle chemical and physical properties during the campaign
The mean concentrations of PM2.5 and PM2.5−10 were 5.2 and 3.3 µg m−3, respectively, during the whole campaign. The maximum 24 h average concentration of PM2.5 was 20.1 µg m−3. This 24 h average exceeds the WHO (2021) AQG levels (Air Quality Guideline) during 2 d during the measurement campaign (WHO AQG level 15 µg m−3 for PM2.5). The maximum 24 h average for PM10 was 24.7 µg m−3, which is clearly below the WHO AQG level of 45 µg m−3. The 5-year average PM2.5 concentration between 2015 and 2019 at the traffic supersite was 7.2 µg m−3 (Barreira et al., 2021). The PM2.5−10 concentration was relatively low during the campaign. This is due to rainfall, snowfall, and snow covering the streets during the campaign, which inhibited the formation and re-suspension of street dust. Most of the street dust has a coarse particle size, but it also has, to some degree, a fine particle size range. The lack of street dust episodes in winter explains, at least partly, why the mean PM2.5 is also lower than that measured at the traffic supersite in the years 2015–2019 (Rönkkö et al., 2023b). Some pollution episodes can be observed, and they will be analysed in Sect. 3.1.5.
The mean concentrations of BC, NO, and NO2 were 0.59, 12.8, and 20.8 µg m−3, respectively, at the traffic supersite. The 24 h maximum NO2 concentration during the measurement campaign was 44.7 µg m−3, and in 11 d the WHO AQG level (25 µg m−3) was exceeded. The mean particle number (PN; nm concentration at the traffic supersite during the measurement period was 18 093 particles cm−3, but mean hourly concentrations of PN higher than 80 000 particles cm−3 was also measured (Fig. S3). The PN concentration in the ATMo-Lab measurements (: 2.5 nm) next to the traffic supersite was considerably higher than the one measured at the supersite (: 5.4 nm) (Fig. S4), showing the effect of road traffic in the emissions of the smallest nanoparticles (e.g. Hietikko et al., 2018; Lintusaari et al., 2023; Rönkkö et al., 2017). In general, it should be noted that the measured PN concentrations may differ notably, depending on the instrument cut-off size used, as also seen when comparing the ATMo-Lab measurements with cut-off sizes 2.5 and 10 nm (Fig. S5, Rönkkö et al., 2023a). The mean hourly LDSA concentration at the traffic supersite was 13.6 µm2 cm−3 during the measurement period (Fig. S2), and the highest hourly mean LDSA concentration during the measurement period was 62 µm2 cm−3.
Mean concentrations of organics, sulfate, nitrate, ammonium, and chloride measured with the SP-AMS (PM1) were 2.0, 0.6, 0.6, 0.4, and 0.07 µg m−3, respectively. The sum of the concentrations of the measured chemical components (organic and inorganic species from the SP-AMS and BC from the MAAP) showed a good correlation coefficient (square of Pearson correlation, R2) against the PM2.5 concentrations (0.87).
3.1.4 Volatile organic compounds
The mean concentrations of the continuously measured C6–C15 aromatic hydrocarbons, alkanes, PAHs, and terpenoids were 2.2, 0.94, 0.037, and 0.16 µg m−3, respectively, at the traffic supersite. Offline samples of C2–C5 NMHCs collected during the shorter periods showed that light alkanes were the most significant compound group detected (Fig. 4). However, larger and more reactive compounds with higher SOA formation potentials are expected to have stronger impacts on the local chemistry even with lower concentration. Compounds with 6 to 9 carbon atoms were mostly aromatic hydrocarbons, and for higher carbon masses (C10–C11) alkanes and terpenes had a major contribution (Fig. 6). The contribution of PAHs was very low. A major contribution of aromatic hydrocarbons was expected due to traffic being a major local source of VOCs. Higher alkanes (C10–C15), which had the highest contribution for IVOCs (Fig. 6, C10–C15), are commonly found, especially in diesel emissions (Marques et al., 2022; Wu et al., 2020). Also, terpenoids, which are traditionally considered biogenic compounds, had relatively high concentrations during this winter period. Emissions from vegetation are expected to be negligible due to cold weather (e.g. Hellén et al., 2021; Hakola et al., 2023), and this indicates anthropogenic sources for these compounds. They are commonly found for example in personal care and cleaning products (Coggon et al., 2021; Steinemann, 2015). In earlier studies terpenoids were also detected during wintertime in the urban background air in Helsinki (Hellén et al., 2012).
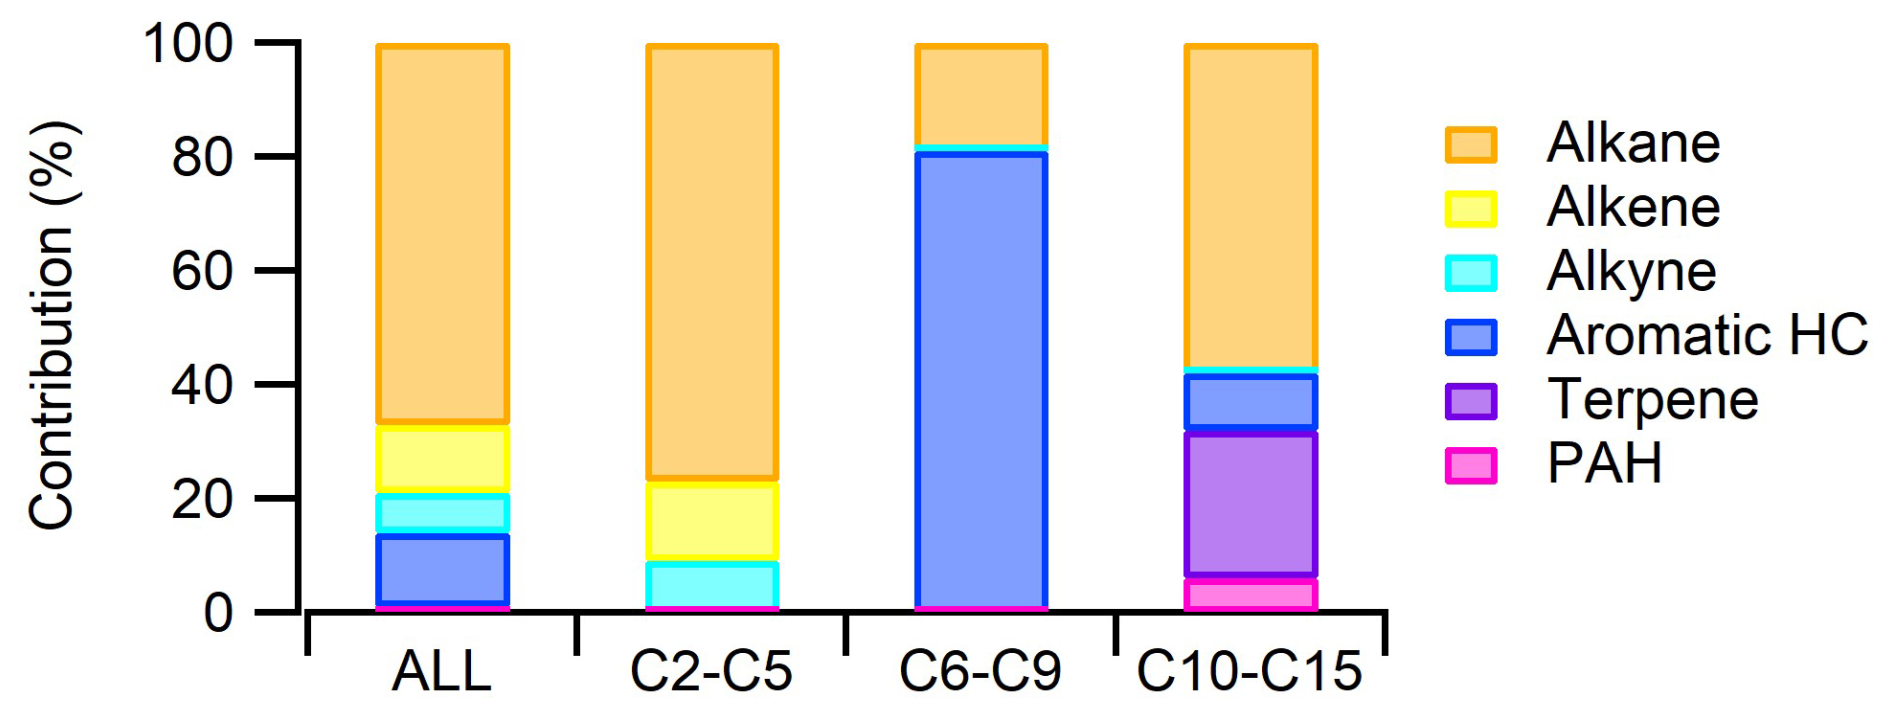
Figure 4Contribution of different compound groups to measured concentrations during the periods when all VOCs with 2 to 15 carbons (ALL) were measured at the traffic supersite. C2–C5: VOCs with 2 to 5 carbons. C6–C9: VOCs with 6 to 9 carbon atoms. C10–C15: VOCs/IVOCs with 10 to 15 carbon atoms.
3.1.5 Pollution episodes
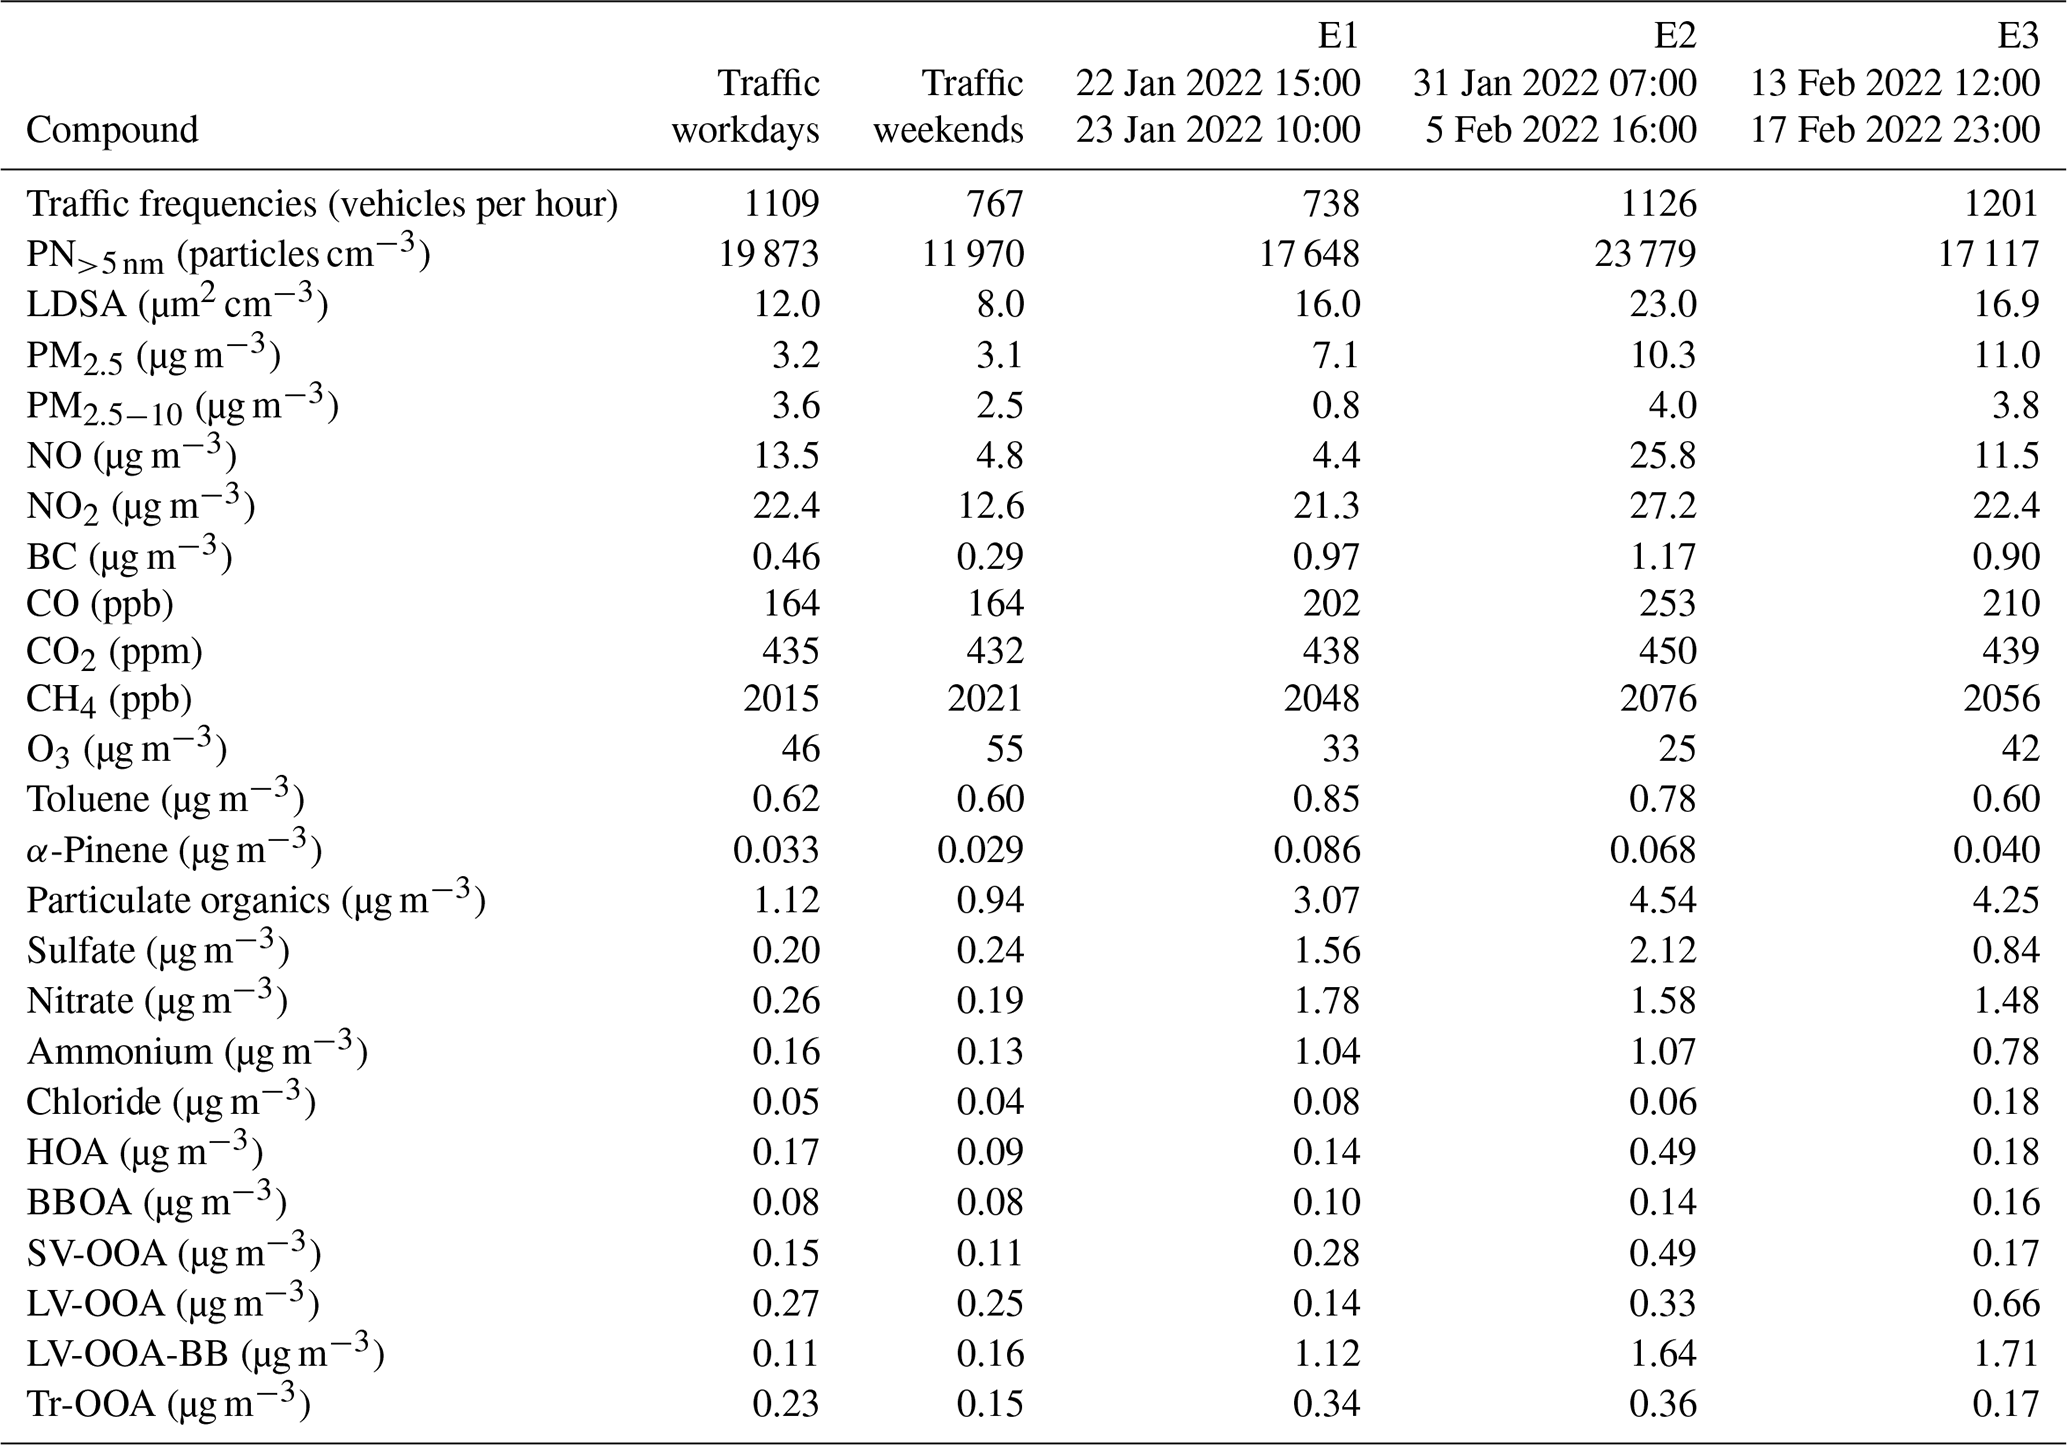
During the campaign, three episodes with enhanced particulate and gaseous pollutant concentrations were observed. The duration of these episodes is shown in Table 1. The names from E1 to E3 will be used for these episodes in the proceeding chapters.
Table 1Traffic frequencies and average concentrations of measured components during the traffic (averages without episodes)-dominated period on workdays and weekends and their averages during three different episodes at the traffic supersite.
The time series in Fig. 5 show the concentrations of fine (PM2.5) and coarse (PM2.5−10) particles at the traffic supersite, UB supersite, and rural site. PM2.5 showed elevated concentrations during the three episodes at the traffic supersite. PM2.5−10 concentration did not show a long-lasting increase in its concentration during these episodes, but shorter high peaks were observed. The increased concentrations of PM2.5 are due to both trapping of local pollutants in the boundary layer during cold periods and the effect of long-range or regional transport of pollutants at the traffic supersite. The increased PM2.5 concentration at all sites, also including the rural site, indicates that long-range or regional transport had an important effect on the air quality in the Helsinki metropolitan area during these episodes. The concentration of PM2.5−10, on the other hand, was affected by wind speed and local snow cover or by wet street surface when the temperature was near or above 0 °C (during E3). Also, coarse particles are not typically transported from very long distances. The source of the short-lasting peaks in PM2.5−10 concentration may be due to some local activity near the stations (traffic supersite and UB supersite), together with the favourable meteorological conditions, as well as non-exhaust emissions from traffic.
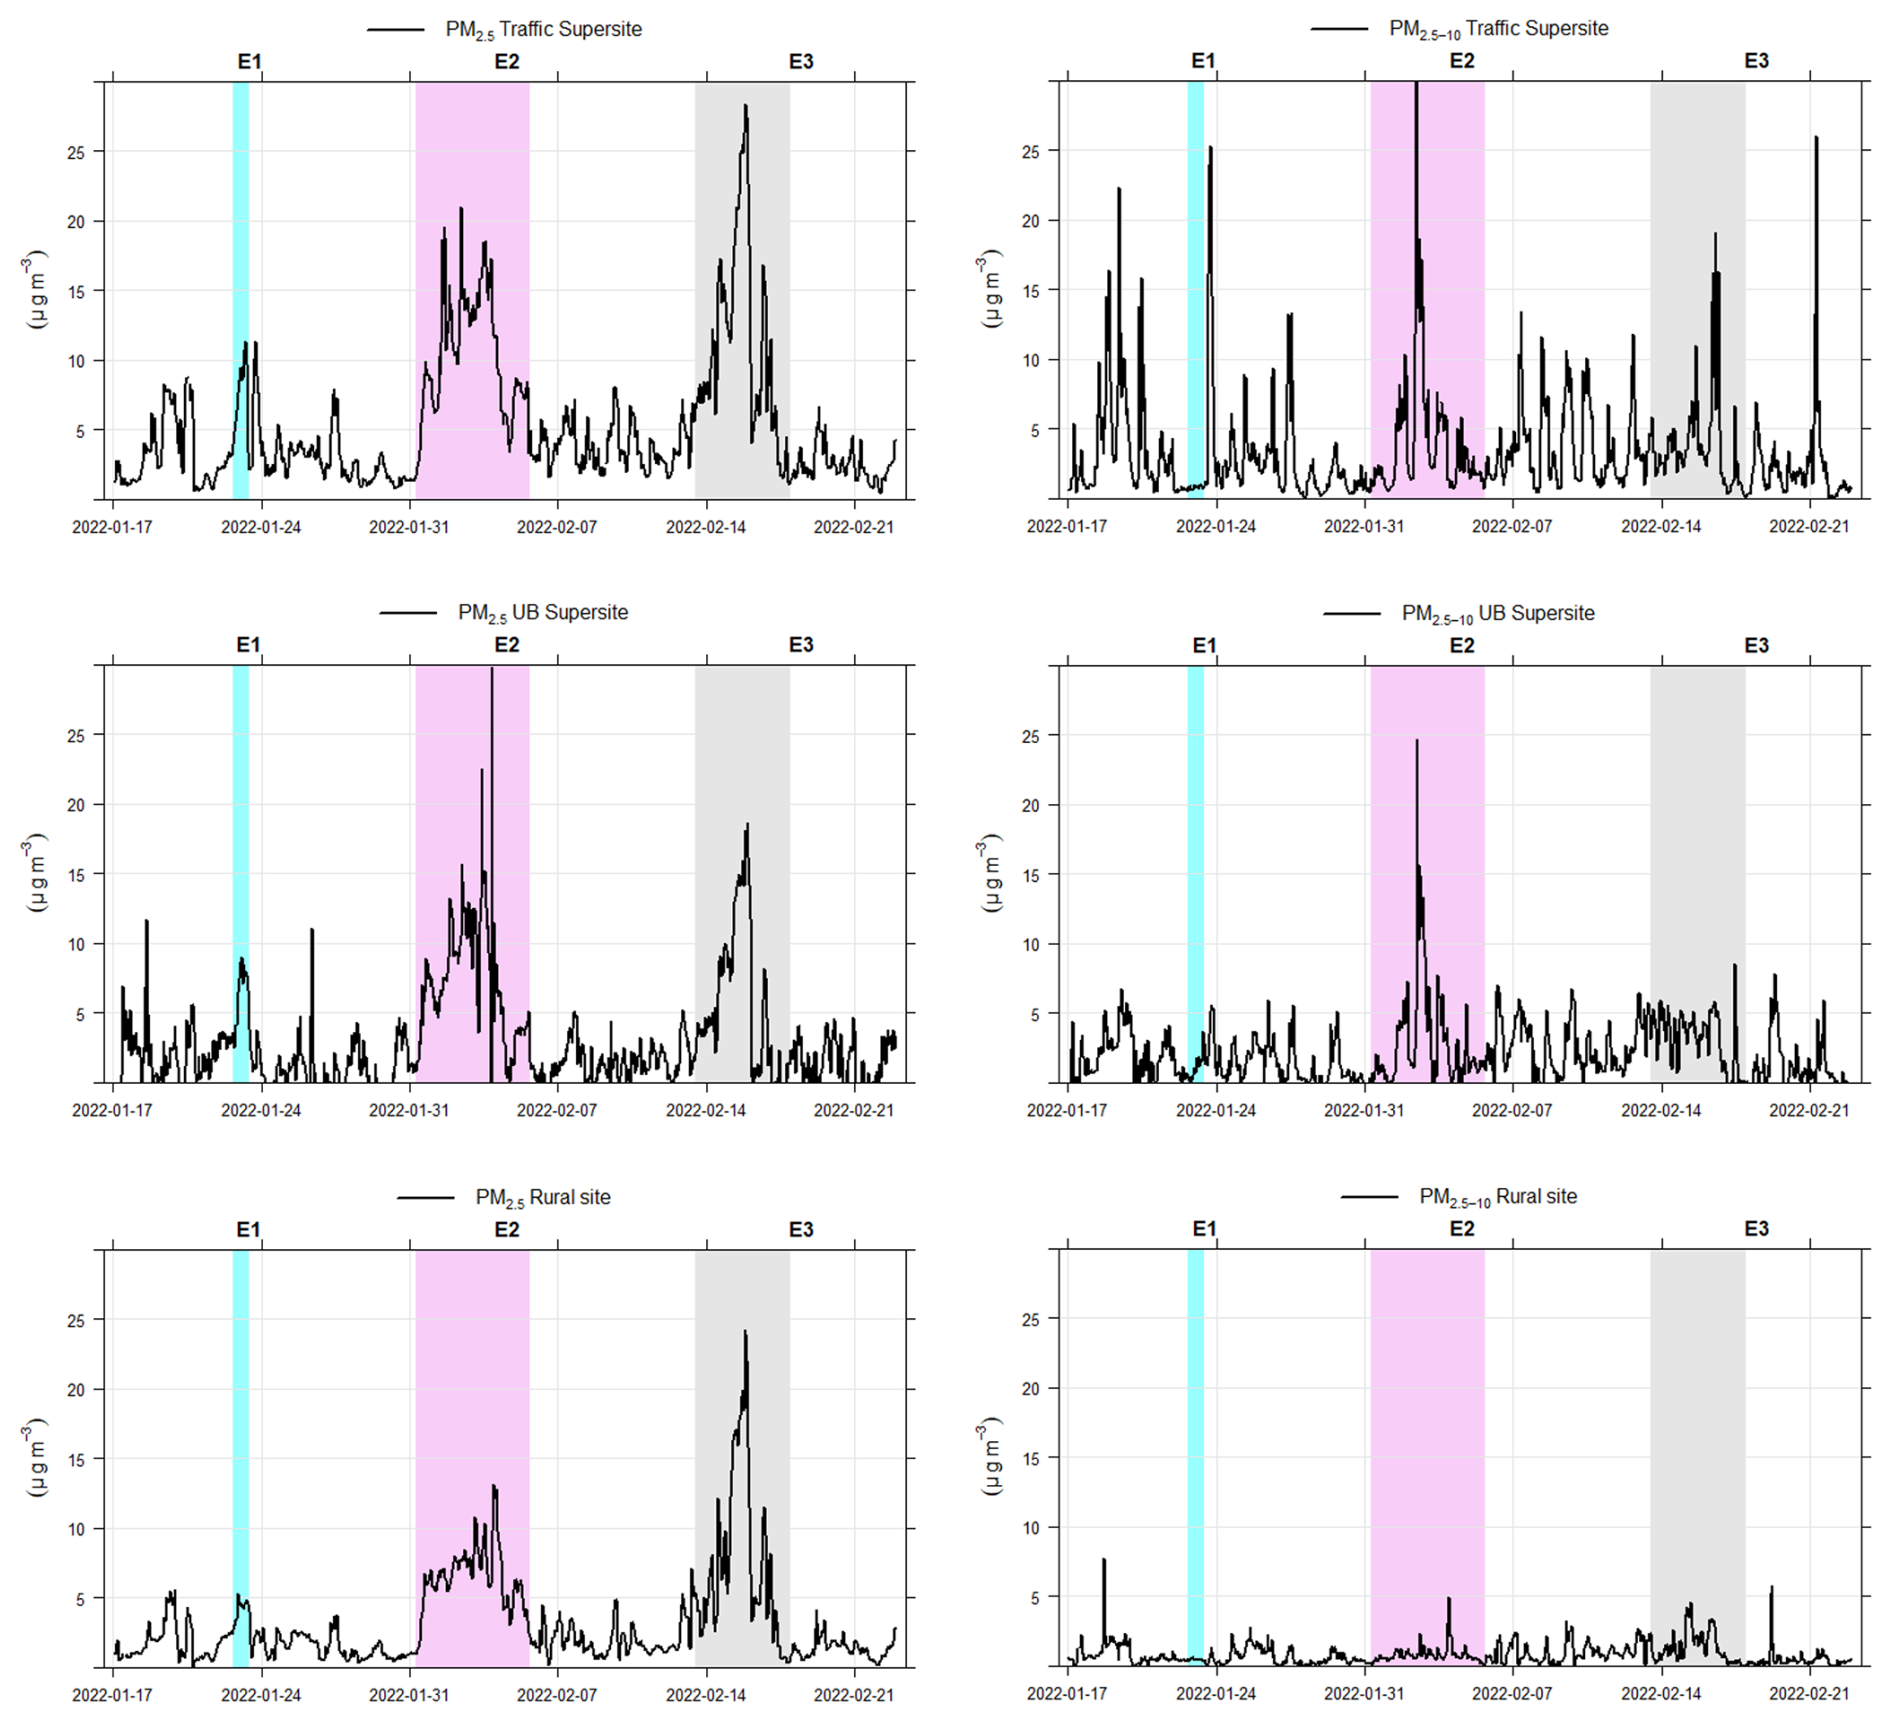
Figure 5Concentrations of PM2.5 and PM2.5−10 at the traffic supersite, UB supersite, and rural site. The three episodes are coloured in the figure.
The highest increase in their concentrations during the episodes at traffic supersite was found for secondary inorganics (sulfate, nitrate, and ammonium), total organics, and BC measured in PM1 (Table 1). α-Pinene, known as a SOA precursor, also clearly had higher concentrations during the periods E1–E3. The concentration of chloride only showed a clear increase during period E3. A similar increase in the concentrations of BC (Fig. 6), inorganics, and organics (Fig. S6) was also seen at the UB supersite. The increased PM2.5 concentration is thus connected to the formation of secondary inorganics, together with the increased concentration of organics.
Particle number concentrations showed a slight increase during the E2 episode at both sites and in ATMo-Lab with cold temperatures (Tables 1 and S4, Fig. S3), which indicates that, in addition to long-range-transported pollutants, local traffic emissions were also trapped in the boundary layer and affected the air quality at the measurement site. Also, higher concentrations of α-pinene with short atmospheric lifetime (∼ few hours, Hellén et al., 2012) indicated local influence. α-Pinene is not long-range-transported, and sources are expected to be local/regional; α-pinene also has anthropogenic sources related to human activity (e.g. cleaning and hygiene products). Episode E1 took place during the weekend, so its concentrations should be compared against the traffic weekend situation.
Concentrations of major gaseous and chemical components were also measured at the UB supersite during the campaign (Table S4). The concentrations of traffic-related components PN, LDSA, and NO2 were on average 2–3 times higher at the traffic supersite compared to the UB supersite during non-episodic workdays, which is expected due to the much lower influence of traffic at the UB supersite. The same was also noticed for PM2.5 concentrations between the two sites, indicating its local source at the traffic supersite. Concentrations of these compounds were similar or only slightly lower during non-episodic weekends at the UB supersite, so it can be concluded that the measured concentrations at the UB supersite correspond to urban background concentrations in the Helsinki area.
The concentration of organics and secondary inorganics showed a similar increase during the three episodes at the UB supersite and traffic supersite (Fig. S6). The increased PM2.5 concentration during the episodes is connected to the formation of secondary particulate matter, together with the increased concentration of organics. During non-episodic periods, the concentration of organics was higher at the traffic supersite compared to the UB supersite, indicating that it had a local source, most probably traffic, at the traffic supersite.
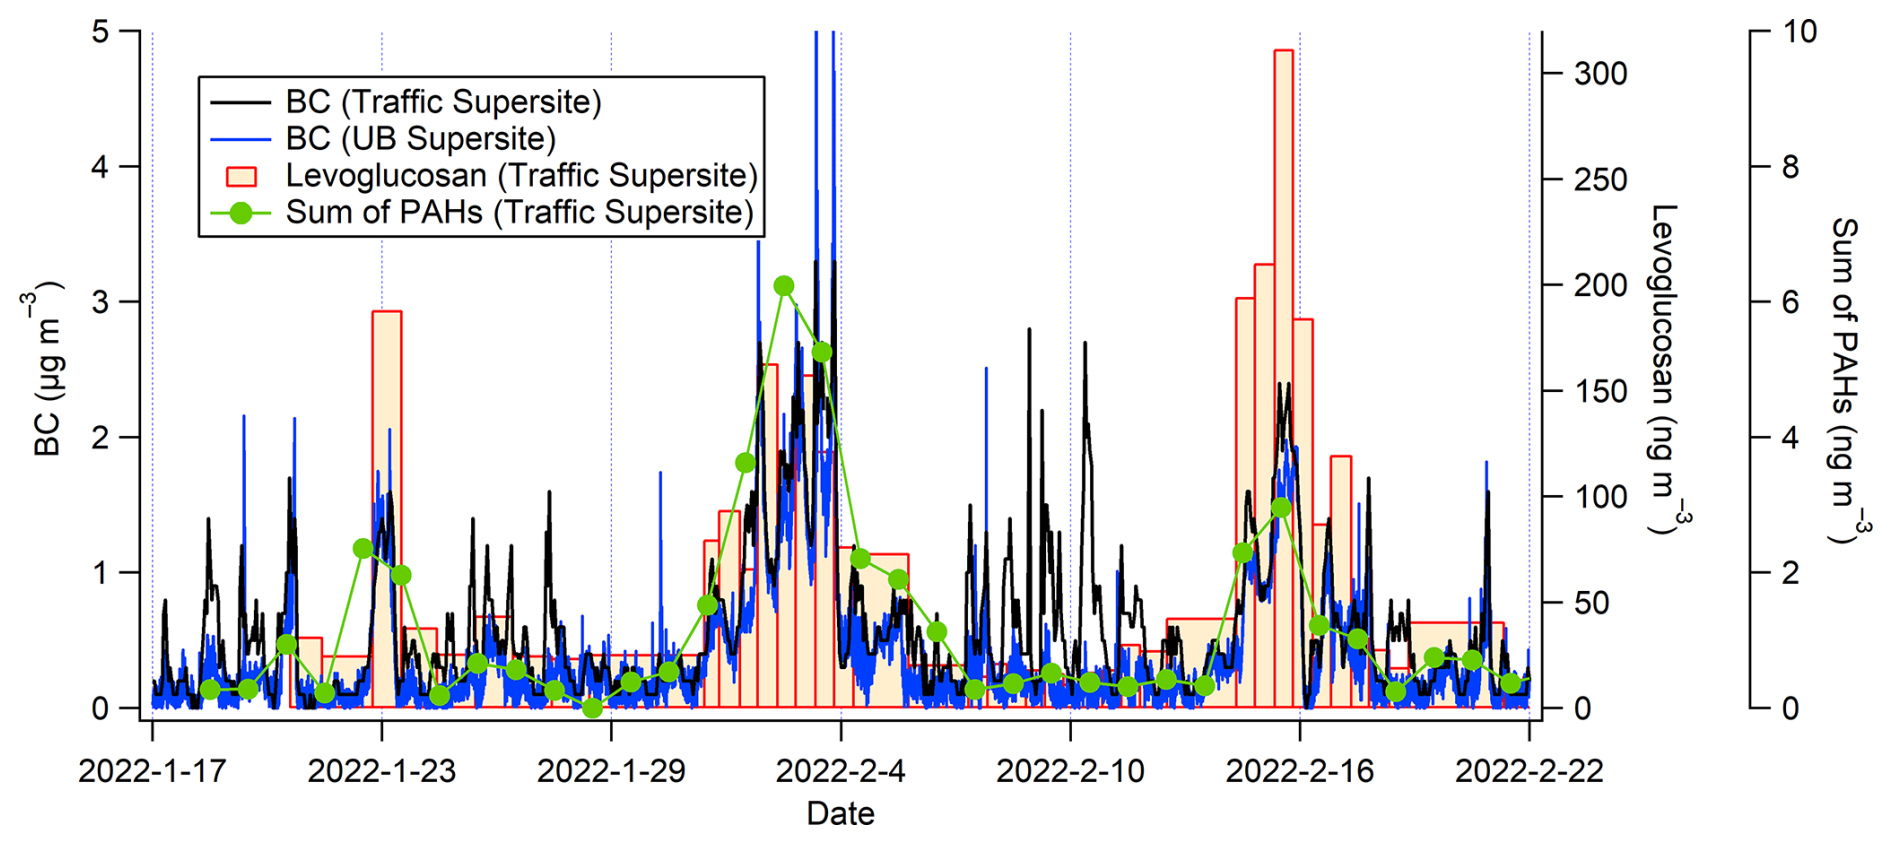
Figure 6Concentrations of BC at the traffic supersite and at the UB supersite, as well as the concentrations of levoglucosan and the sum of measured PAH compounds at the traffic supersite, analysed from the filter samples. The filter sample times are the mean sampling start and stop times. The PAH sampling time during 15 February consisted of only 12 h.
During all episodes, the concentration of PM2.5 and LDSA (Fig. S2, Tables 1 and S3) and BC (traffic supersite and UB supersite, Fig. 6) showed a clear increase in their concentrations. Also, the biomass burning tracer levoglucosan and the sum of PAHs (traffic supersite) increased during the episodes. It seems that the long-range-transported or regionally transported air masses containing particles originated form biomass burning and that the transported particles clearly increased the PM2.5 and BC concentrations, thus degrading the air quality in the Helsinki area. During the cold season, wood burning for heating purposes, especially in detached house areas, in Helsinki takes place. However, the effect of local wood burning on pollutant concentrations at the traffic supersite is minimal on an annual level compared to the effect of traffic-related pollutants (Aurela et al., 2015; Helin et al., 2021; Kangas et al., 2024). This can also be seen from the relatively low concentration of levoglucosan and the sum of PAHs during non-episodic periods. However, the concentration of levoglucosan and PAHs increased during the episodes, indicating that long-range-transported or regionally transported biomass burning aerosol was transported to the measurement site.
Figure S7 shows the particle number size distributions at the traffic supersite and UB supersite during the three episodes and during the traffic-related (non-episodic) period. The mean particle number concentration did not show any marked increase during the episodes compared to the non-episodic situation at the traffic supersite (Table 1), but the mean LDSA concentrations measured with the AQ Urban instrument were clearly higher. The increased LDSA concentration during the episodes is connected to a higher concentration of larger particles at both sites (Fig. S7). The higher LDSA concentration at the traffic supersite compared to the UB supersite during non-episodic situation is due to the higher concentration of traffic-related ultrafine particles at the traffic supersite.
HYSPLIT back trajectories were calculated during these episodes on a daily basis (3 h resolution, 96 h back trajectories, Fig. S8). The air masses during the short period (E1) came from the Arctic areas. The air masses during the E2 period between 31 January and 3 February came from eastern Europe (Moscow area, Fig. S8) straight to the measurement site and between 4 and 5 February came across the Baltics and Belarus. During the E3 period, the air masses first circulated over central Europe (Poland and the Baltics, 13–14 February) and then arrived from southern Europe over Romania, Ukraine, Belarus, Poland, and the Baltics.
The coldest temperatures during the measurement campaign were measured during periods E1 and E2 (Fig. 2), and only during the E3 period was the temperature near 0 °C. It is possible that especially traffic-related particulate components and trace gases accumulated in the boundary layer during the cold days and that the increased concentrations are due to both this accumulation and long-range-transported pollutants. The concentrations of traffic-related gaseous pollutants CO, CO2, NO, and NO2 were higher at the traffic supersite (Table 1) during episodes compared to non-episodic periods, especially during the E2 episode when the wind speed was very low in the last days. For CO2 this increase was minimal, and for the PN concentration only a slight difference between episodes and workdays without episodes could be seen. The difference of PN concentration between non-episodic workdays and weekends was clearer (Table 1).
3.1.6 Source apportionment of organics in aerosol particles
Source apportionment of organic aerosols was conducted on the AMS data collected at the traffic supersite. The PMF solution consisted of six factors: OA with a significant signal at 60 (C2H4O) and 61 (C2H5O), Tr-OOA; low-volatility oxygenated OA (LV-OOA) with a large signal at 44 (CO); hydrocarbon-like OA (HOA) mostly composed of CXH fragments; biomass burning OA (BBOA) with characteristic 60 (C2H4O) and 73 (C3H5O) signal peaks; semi-volatile oxygenated OA (SV-OOA) with a high signal at 43 (C2H3O+); and LV-OOA-BB that had also a high signal at 44 but a significant signal at 60 (Figs. S9 and S10) as well. LV-OOA primarily represents regionally transported or long-range-transported emissions, while the pronounced 60 signal in LV-OOA-BB strongly indicates its biomass burning origin. In contrast, the exact source of Tr-OOA remains uncertain. It is likely linked to vehicular emissions based on its mass spectra and a diurnal profile that closely aligns with HOA, the factor representing primary traffic-related OA. The PMF results have been shown earlier in Barreira et al. (2024), which studied the light absorption characteristics of organics.
The share of chemical composition of major measured compounds (BC, organics, sulfate, nitrate, ammonium, and chloride) as well as the share of organic factors are shown in Fig. S11. Concerning primary emissions, HOA was the dominant factor at the traffic supersite, with an average contribution of 12.5 % during the whole campaign (Fig. S11). In fact, HOA had a moderate correlation with NOx (R2 equal to 0.74), and its concentration was particularly high during workdays and rush hour (Table 1 and Fig. S11). On the other hand, the overall contribution from BBOA was small (6.1 %), even though the mean concentration of BBOA was like the one of HOA during weekends. This low BBOA contribution reflects the fact that residences around the measurement site do not use biomass burning as a dominant heating source (e.g. Kangas et al., 2024; Barreira et al., 2021) The results obtained agree with previous observations at the same measurement site concerning primary organic aerosol chemical characteristics during wintertime (Lepistö et al., 2023b).
Contrary to primary emissions, SV-OOA, LV-OOA, and LV-OOA-BB, which mostly represent secondary organic emissions, constituted on average 67.7 % of the total organics during the campaign period (Table 1 and Fig. S11). The concentration of the LV-OOA-BB factor was especially high during the E1, E2, and E3 periods, reaching up to 52.8 %, 47.4 %, and 56.2 % for the aforementioned periods, respectively, indicating a strong influence of long-range-transported aerosol during these periods. These results reveal the high importance of long-range transport episodes to the atmospheric particulate mass and composition in Helsinki. Furthermore, they suggest a heterogeneity of chemical and physical properties of long-range-transported particles because of distinct production and emission sources. Interestingly, the SV-OOA contribution was relatively constant during all events (approximately 15 %), except in E3 due to the increased contribution from LV-OOA-BB (lower SV-OOA contribution). SV-OOA is expected to be low during winter due to decreased atmospheric photochemistry comparatively to the warmest periods of the year (e.g. Praplan et al., 2017). During episodes E2 and E3, all PMF factors exhibited heightened concentrations, including HOA known to mostly originating from local traffic. This result suggests that, during these episodes, aerosol particles comprised a blend of both transported and locally emitted pollutants, despite the dominance of LV-OOA aerosol.
3.1.7 Traffic-related (non-episodic) periods
Table 1 shows the mean traffic frequencies and concentrations of gaseous and particulate pollutants at the traffic supersite during traffic-related (non-episodic) period divided further as workdays and weekends and during the three periods with high pollutant concentrations.
The traffic frequency during workdays was on average 1.4 times higher than during the weekends, which is mostly due to the lack of commuter traffic during weekends. Probably the number of trucks and other heavy-duty vehicles during the weekends is also smaller. The mean concentrations of PN, NO, NO2, BC, PM2.5−10, and HOA were higher during the workdays compared to weekends, which is expected since PN, NO, NO2, BC, and HOA are emitted directly from the motor engines. Local traffic also increases concentration of coarse particles, but their concentration also depends on meteorology like rain, snow cover, or wind speed. Concentrations of most pollutants decreased with increasing wind speed despite of the wind direction.
Mean LDSA concentration is connected to both PN concentration and particle size. The lower mean PN concentration, together with lower mean LDSA concentrations during non-episodic weekends, indicates that LDSA concentration is connected to local PN emissions during non-episodic periods. The effect of long-range-transported or regionally transported aerosol to the LDSA concentration is clearly stronger than the effect of local traffic during the episodes. However, in general the local traffic-related PN emissions dominate the LDSA concentration at the traffic supersite, which can be seen in the higher LDSA concentration during the daytime at the traffic supersite compared to the UB supersite (Fig. S12). The slightly higher mean concentration of organics during the workdays is probably due to the higher HOA concentrations during workdays.
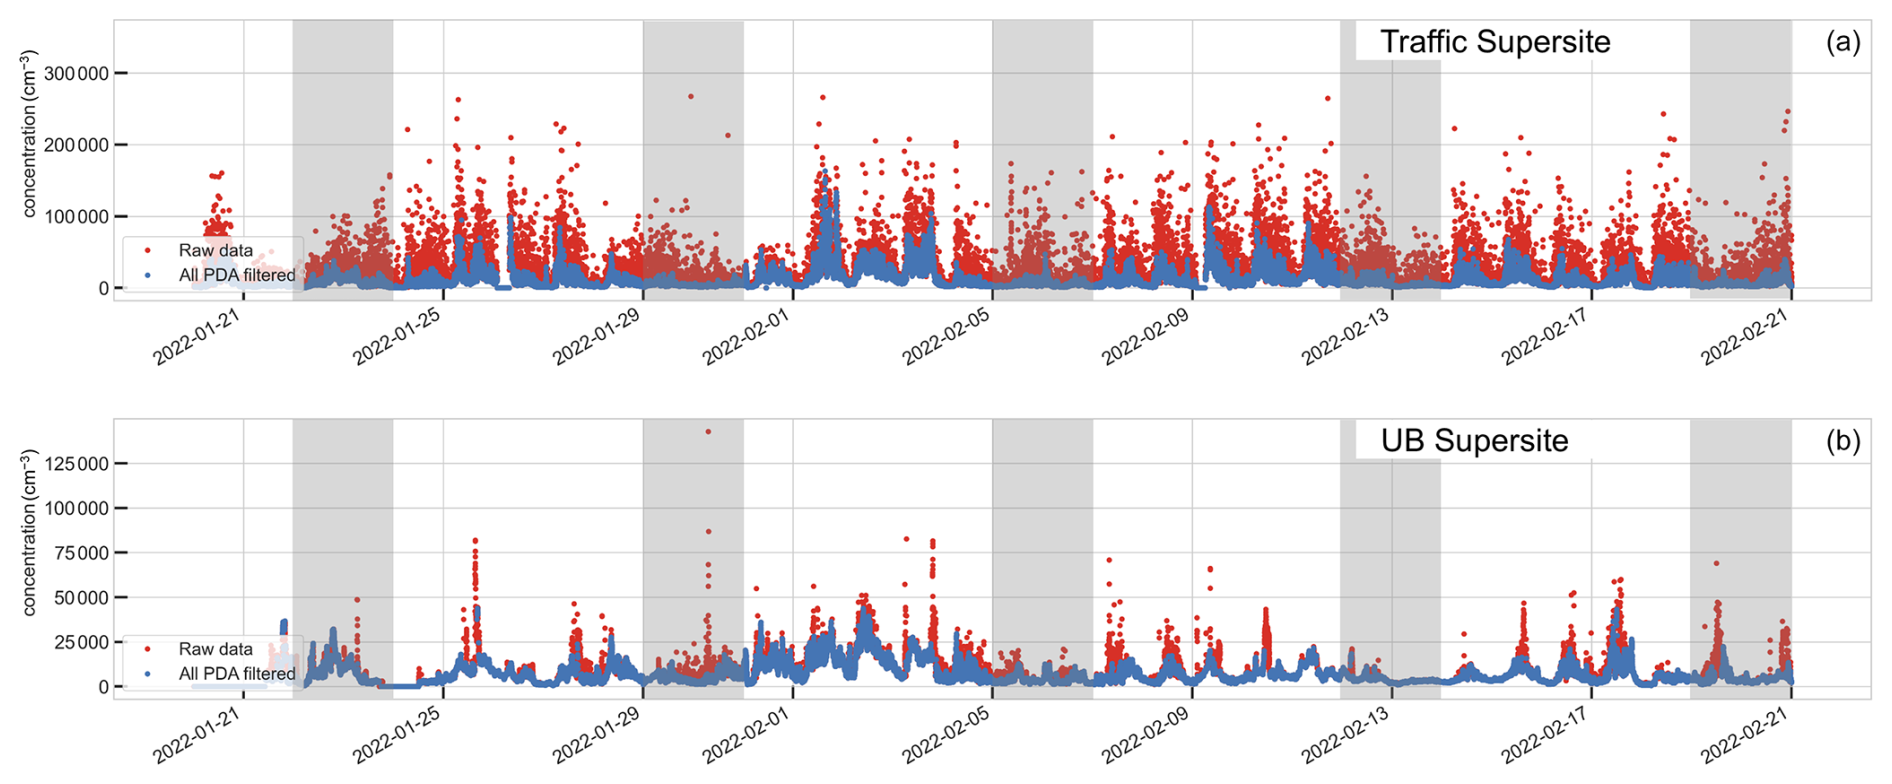
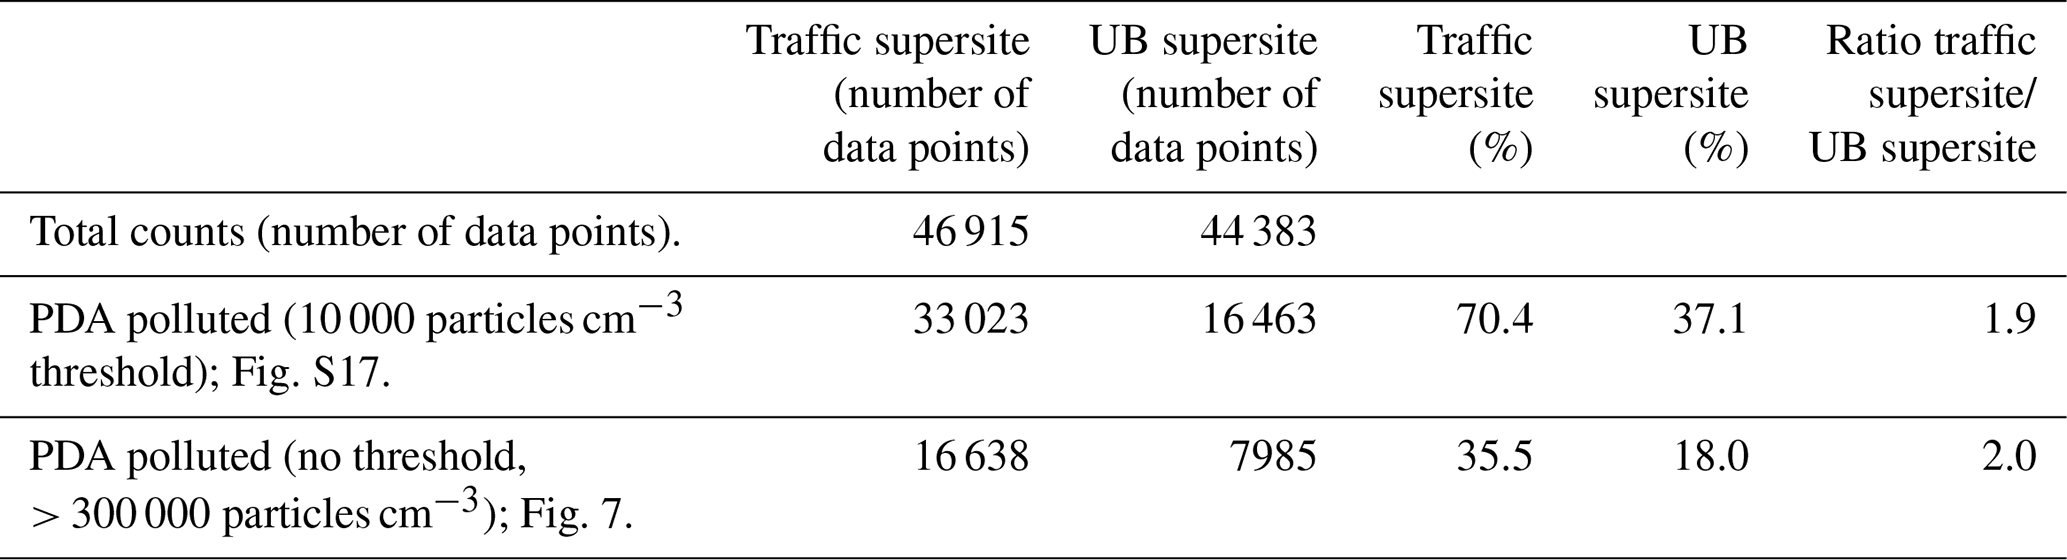
Figure 7PDA filter results for the traffic supersite (a) and the UB supersite (b) after identical filtering steps, showing the flagged data (red) with the threshold set to upper concentration range of the measurements. Shadowed periods represent weekends. See Table S5 for the applied filter steps and parameters.
The hourly variations of PN, BC, NOx, PM2.5, PM2.5−10, and LDSA during non-episodic periods are shown in Fig. S12 (workdays) and Fig. S13 (weekends) at the traffic supersite and UB supersite station. During workdays the hourly variations of PN, BC, NOx, and LDSA are clearly connected to local traffic frequencies (Figs. 2 and S12), showing the morning and late afternoon rush hour. The concentrations of PM2.5 and PM2.5−10 also increased during daytime but were not as clearly correlated to morning and afternoon rush hour. Their concentrations started to rise during the morning and stayed high during the daytime. The hourly variations of these compounds were similar at the UB supersite, but their concentrations were much lower.
Table 2An overview of the PDA results and percentage of data declared as polluted with the applied filtering steps.
The hourly variations of total organics and the calculated factors HOA, BBOA, SV-OOA, LV-OOA, LV-OOA-BB, and Tr-OOA during non-episodic periods are shown in Fig. S14 (workdays) and Fig. S15 (weekends). The hourly variation of HOA factor is clearly connected to traffic frequencies. In fact, its diurnal variation is similar to that of PN, NOx, and BC, which are primarily from the engine emissions. During the weekends the diurnal pattern of HOA together with PN, NOx, and BC show higher concentrations during afternoon and late evening following the diurnal variation of traffic frequencies. The correlation coefficients (R2) between HOA and NO and NO2 were 0.67 and 0.74, respectively. The factor connected to biomass burning (BBOA) shows two peaks: one at midday and another in the evening. The evening peak is probably connected to wood burning in the Helsinki area. Wood burning takes places in detached houses in Helsinki in sauna stoves and for residential heating purposes, especially during cold months. The evening peak of BBOA was also clearly seen during weekends, and it already started in the late afternoon, which is due to more active use of sauna stoves and fireplaces during weekends. The diurnal cycle of Tr-OOA during workdays (Fig. S14) indicates that it was connected to local traffic-related emissions. However, compared to HOA, its concentration did not clearly increase during the afternoon and late evening on weekends. The concentrations of oxidized organic factors SV-OOA and LV-OOA were quite similar during the whole day, both on workdays and at weekends. This indicates that their source was mostly of long-range or regional origin. Concentration of LV-OOA-BB factor was also very stable during the workdays but showed increased concentrations during the evening on weekends. It is possible that the local or regional wood burning is shown in this factor during the weekends.
3.1.8 Local pollution level comparison – CPCs and PDA
CPC number concentration time series were used to compare local pollution level differences at the traffic supersite and the UB supersite stations. It can be seen from the time series (Fig. S16) that significantly higher particle concentration levels are frequently observed at the traffic supersite during the campaign. To look at the differences between the sites in more detail, the Pollution Detection Algorithm (PDA) was employed (Beck et al., 2022). The PDA identifies and flags polluted periods in five steps, most importantly by the first filter step: the time derivative (gradient) of a concentration over time.
The PDA is primarily designed to identify and flag periods of polluted data in remote atmospheric composition time series, but it might also be applied to locations where local contamination interference is so frequent that most data points exceed the contribution from the underlying background in the period of interest, like in urban areas (Beck et al., 2022). The PDA only relies on the concentration time series datasets and is independent of ancillary datasets, such as meteorological variables or black carbon data. Consequently, the PDA can provide valuable additional information on the pollution levels and characteristics of urban conditions.
Figures 7 and S17 show PDA filter results for the traffic supersite and the UB supersite for the campaign period using typical PDA parameters for the 1 min time resolution data (Beck et al., 2022). CPC data gaps (Fig. S17), 1.3 % and 6.6 % of the traffic supersite and UB supersite, respectively, were assigned to one and removed for CPC total counts (Table 2). It should be noted that although both CPCs were operational simultaneously most of the time during the campaign, these data gaps cause some uncertainty in the analysis. Identical PDA settings were used for both stations. An interquartile range (IQR) filter, instead of a power law derivative filter, was used as a first derivative filter as it is better suited for the current (relatively polluted) urban data with no clear separation of data to polluted/unpolluted branches. Two cases were compared, one with a threshold filter for typical polluted concentration levels > 104 particles cm−3 (Fig. S17) and one with an upper threshold set to 3×10⁵ particles cm−3 (upper concentration range of the measurements) to observe differences in the derivative filtering without a threshold filter that otherwise dominates in the urban environment (Fig. 7). It can be seen that the flagged (red) data fraction is more prominent in the traffic supersite data. All employed filter steps and PDA parameters are shown in Tables S4 and S5.
The PDA results are summarized in Table 2. In both cases, the ratio of the PDA filtered data for traffic supersite/UB supersite was similar (1.9 and 2.0). The higher pollution ratio for the case without the upper threshold filter (gradient filter dominates) seems to reflect more polluted conditions due to local traffic and near roadside conditions at the traffic supersite as the higher derivatives represent periods of high concentration variability, i.e., due to local sources (Beck et al., 2022).
3.1.9 NAIS particle size distribution comparison
Figure 8 presents hourly median particle size distributions obtained during the workdays (Monday–Friday) with the NAIS particle mode negative polarity at the traffic supersite (Fig. 8, top) and at the UB supersite (Fig. 8, bottom). It is also clear from the NAIS measurements that the traffic supersite location has significantly higher median particle concentrations throughout the day, starting from the early working hours (∼ 06:00) and continuing to late evening (22:00). Furthermore, it appears that during office hours the relatively high particle concentrations (∼ 104 particles cm−3) are also observed in the sub-3 nm size range and lower size range of the nucleation mode (3–5 nm), whereas at the UB supersite similar concentrations are only observed for particles > 5 nm. At the UB supersite the sub-5 nm particle concentrations also rapidly decrease after ∼ 17:00, while at the traffic supersite the concentrations remain relatively high until ∼ 22:00.
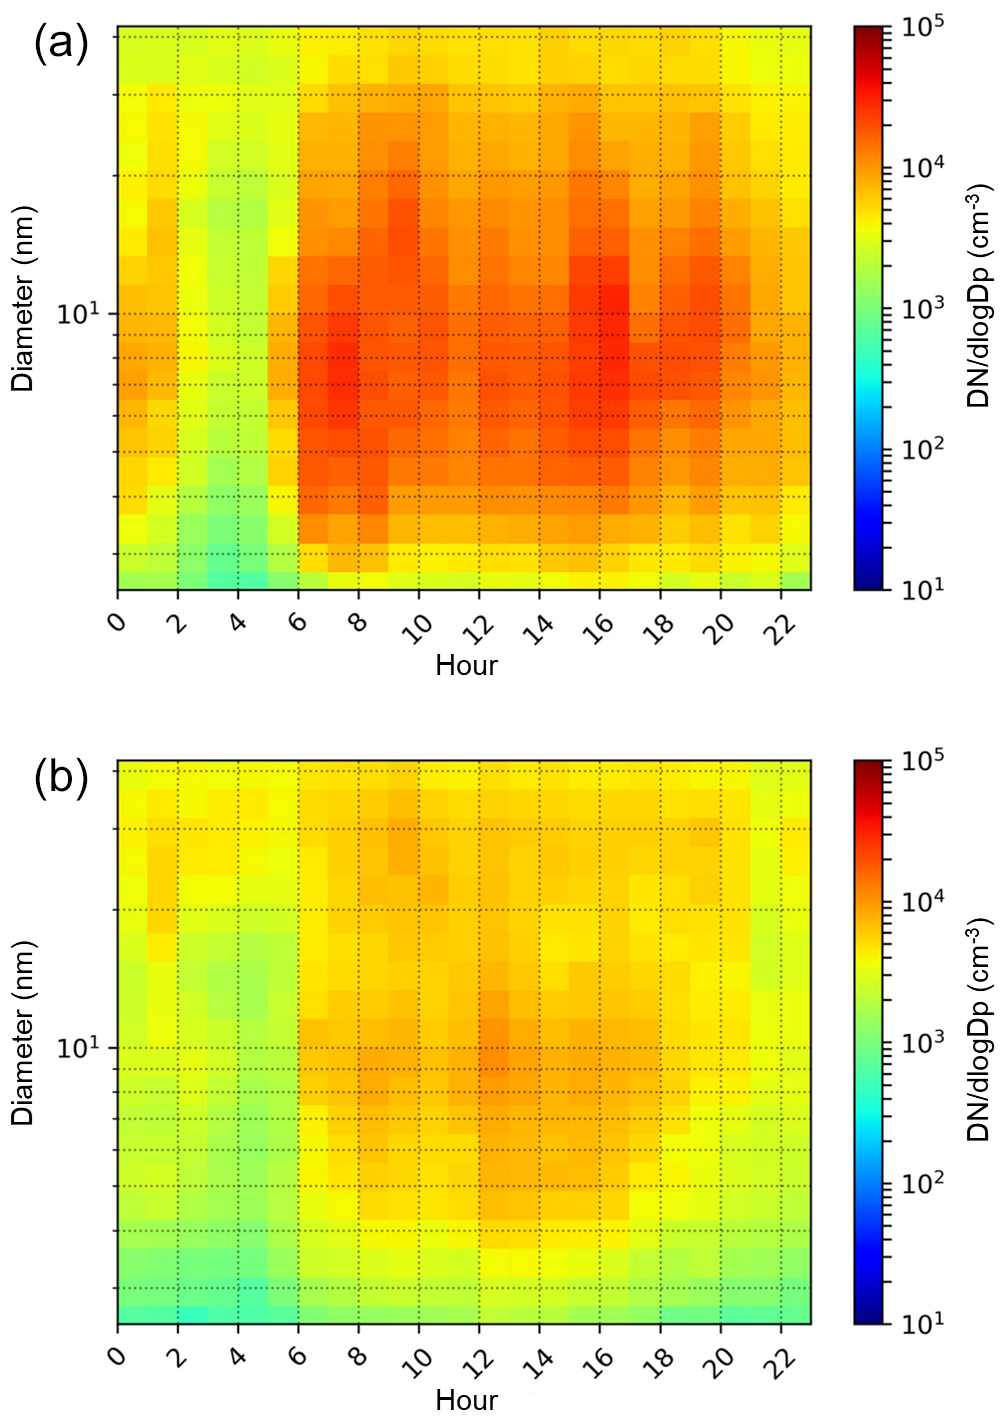
Figure 8Hourly median particle size distributions obtained from NAIS negative polarity during the campaign workdays (Monday–Friday) at the traffic supersite (a) and the corresponding particle size distributions at the UB supersite (b).
In this study, physical and chemical properties of particulate matter and concentrations of trace gases were measured at an urban traffic site in Helsinki, Finland. The 5-week intensive campaign took place at the traffic supersite in Helsinki in January–February 2022. The goal of the study was to characterize wintertime aerosol and obtain information on factors affecting air quality at urban traffic site in the wintertime. To estimate the importance of local traffic and long-range-transported pollutants on the air quality, measurements were also made at the same time at an urban background supersite. Source apportionment of organics was performed for the SP-AMS measurements at the traffic supersite. The solution consisted of six factors, of which three were connected to primary emissions (HOA, BBOA, and Tr-OOA) and three to aged aerosol (SV-OOA, LV-OOA, and LV-OOA-BB).
During the intensive campaign the meteorological conditions such as temperature, snow cover, and rain varied largely. Three clear pollution episodes with elevated concentrations of particulate matter and trace gases took place during the campaign. During these episodes the increased pollutant concentrations were connected to trapping of local pollutants in the boundary layer and the long-range and regional transport of pollutants to the site. The concentrations of traffic-related pollutants PN, NO, NO2, BC, and HOA followed the traffic frequencies on an hourly basis and also had lower concentrations during weekends when traffic frequencies were lower. The source apportionment showed that, in addition to traffic-related primary HOA, particulate matter also consisted of biomass-burning-related aerosol (BBOA factor). During the pollution episodes, high concentrations of secondary inorganics (sulfate, nitrate, and ammonium) and secondary organics (SV-OOA, LV-OOA, and LV-OOA-BB) were observed. Especially the concentration of secondary organics containing biomass burning material, LV-OOA-BB, was very high, showing concentrations as high as 6 µg m−3, and it was the dominant factor during episodes E1, E2, and E3. This, together with the increased concentration of levoglucosan and BC, indicates that long-range-transported or regionally transported aerosol contained biomass burning originated particles.
The pollutant concentrations were also affected by meteorology, like wind speed and temperature. During cold periods, pollutants from local traffic in particular were trapped in the boundary layer, increasing their concentrations. Stagnant conditions with low wind speed during coldest days inhibit the ventilation and removal of local pollutants effectively. The concentrations of most pollutants decreased with increasing wind speed.
It can be concluded that the air quality at the traffic supersite was affected by both changes in pollution sources and the removal of pollutants. The two most important pollution sources at the site were local traffic and long-range or regional transportation. Long-range-transported or regionally transported aerosols are constantly present in the Helsinki area, but we also observed episodes with markedly increased pollutant concentrations and increased PM2.5 concentrations. During these episodes PM2.5 mainly consisted of secondary inorganic and organic aerosol and black carbon. Trapping of pollutants with stagnant conditions during the coldest days also increased pollutant concentrations that originated from local traffic exhaust. As long-range-transported pollutant episodes increased PM2.5 mass, the pollutants from local traffic increased particle number concentration. The effect of local traffic on particle number concentration was most clearly seen in diurnal variation in PN with the morning and afternoon rush hour and lowered PN concentration during weekends. A strong effect of traffic was also seen with the concentrations of the smallest nanoparticles (both < 5 and < 10 nm), which agrees with the existing literature. As expected, due to traffic as a major local source, aromatic hydrocarbons made the highest contribution to the total measured concentration of SOA precursor VOCs (> C5).
The fact that we observed such a high contribution of long-range-transported and regionally transported pollutants to PM mass, and the concentration of secondary inorganic and organic constituents show the need to tackle atmospheric pollutants, not only at the local level but in concerted actions involving regional and international regulative entities.
The pollution detection algorithm described in Beck et al. (2022) is available on Zenodo at https://doi.org/10.5281/zenodo.5761101 (Beck et al., 2021).
Data described in this paper can be accessed on the Zenodo repository under https://doi.org/10.5281/zenodo.14754890 (Teinilä, 2025).
The supplement related to this article is available online at https://doi.org/10.5194/acp-25-4907-2025-supplement.
HT, SS, TR, JVN, HH, TL, HL, and TP designed the measurement campaign, and KT, SS, HL, TL, MJ, PM, MA, TT, ML, JL, LB, TM, SH, JK, HP, and LP carried out the measurements and participated the data analysis. HT, TR, TP, HH, and JVN contributed to the funding acquisition and supervision. KT, SS, ML, MA, LB, JVN, HT, JH, TL, HL, HH, TT, LP, and LK wrote the manuscript. All authors participated in the interpretation of the results, paper review and editing.
At least one of the (co-)authors is a member of the editorial board of Atmospheric Chemistry and Physics. The peer-review process was guided by an independent editor, and the authors also have no other competing interests to declare.
Publisher’s note: Copernicus Publications remains neutral with regard to jurisdictional claims made in the text, published maps, institutional affiliations, or any other geographical representation in this paper. While Copernicus Publications makes every effort to include appropriate place names, the final responsibility lies with the authors.
Long-term research co-operation and support from HSY to this project is gratefully acknowledged. Katja Moilanen from the City of Helsinki is acknowledged for the traffic count data. Financial support from the Black Carbon Footprint project, funded by Business Finland and participating companies (grant 528/31/2019); the Technology Industries of Finland Centennial Foundation to Urban Air Quality 2.0 project; the EU Horizon 2020 Framework Programme via the Research Infrastructures Services Reinforcing Air Quality Monitoring Capacities in European Urban & Industrial AreaS (RI-URBANS) project (GA-101036245); and the Research Council of Finland, project BBrCAC (grant no. 341271) and the Flagship ACCC (grant nos. 337552 and 337551) is gratefully acknowledged. This work was supported by the Finnish Research Impact Foundation under grant 4708620.
This research has been supported by Business Finland (grant no. 528/31/2019); EU Horizon 2020 (grant no. GA-101036245); and the Research Council of Finland (grant nos. 341271, 337552, and 337551).
This paper was edited by Samara Carbone and reviewed by two anonymous referees.
Amanatidis, S., Ntziachristos, L., Karjalainen, P., Saukko, E., Simonen, P., Kuittinen, N., Aakko-Saksa, P., Timonen, H., Rönkkö, T., and Keskinen, J.: Comparative performance of a thermal denuder and a catalytic stripper in sampling laboratory and marine exhaust aerosols, Aerosol Sci. Technol., 52, 420–432, https://doi.org/10.1080/02786826.2017.1422236, 2018.
Asmi, E., Sipilä, M., Manninen, H. E., Vanhanen, J., Lehtipalo, K., Gagné, S., Neitola, K., Mirme, A., Mirme, S., Tamm, E., Uin, J., Komsaare, K., Attoui, M., and Kulmala, M.: Results of the first air ion spectrometer calibration and intercomparison workshop, Atmos. Chem. Phys., 9, 141–154, https://doi.org/10.5194/acp-9-141-2009, 2009.
Atkinson, R. W., Kang, S., Anderson, H. R., Mills, I. C., and Walton, H. A.: Epidemiological time series studies of PM2.5 and daily mortality and hospital admissions: a systematic review and meta-analysis, Thorax, 69, 660–665, https://doi.org/10.1136/thoraxjnl-2013-204492, 2014.
Aurela, M., Saarikoski, S., Niemi, J. V., Canonaco, F., Prevot, A. S. H., Frey, A., Carbone, S., Kousa, A., and Hillamo, R.: Chemical and Source Characterization of Submicron Particles at Residential and Traffic Sites in the Helsinki Metropolitan Area, Finland, Aerosol Air Qual. Res., 15, 1213–1226, https://doi.org/10.4209/aaqr.2014.11.0279, 2015.
Barreira, L. M. F., Helin, A., Aurela, M., Teinilä, K., Friman, M., Kangas, L., Niemi, J. V., Portin, H., Kousa, A., Pirjola, L., Rönkkö, T., Saarikoski, S., and Timonen, H.: In-depth characterization of submicron particulate matter inter-annual variations at a street canyon site in northern Europe, Atmos. Chem. Phys., 21, 6297–6314, https://doi.org/10.5194/acp-21-6297-2021, 2021.
Barreira, L. M. F., Aurela, M., Saarikoski, S., Li, D., Teinilä, K., Virkkula, A., Niemi, J. V., Manninen, H. E., Pirjola, L., Petäjä, T., Rönkkö, T., and Timonen, H.: Characterizing winter-time brown carbon: Insights into chemical and light-absorption properties in residential and traffic environments, Sci. Total Environ., 955, 177089, https://doi.org/10.1016/j.scitotenv.2024.177089, 2024.
Beck, I., Angot, H., Baccarini, A., Lampimäki, M., Boyer, M., and Schmale, J.: Pollution Detection Algorithm (PDA) (1.0.0), Zenodo [code], https://doi.org/10.5281/zenodo.5761101, 2021.
Beck, I., Angot, H., Baccarini, A., Dada, L., Quéléver, L., Jokinen, T., Laurila, T., Lampimäki, M., Bukowiecki, N., Boyer, M., Gong, X., Gysel-Beer, M., Petäjä, T., Wang, J., and Schmale, J.: Automated identification of local contamination in remote atmospheric composition time series, Atmos. Meas. Tech., 15, 4195–4224, https://doi.org/10.5194/amt-15-4195-2022, 2022.
Birch, M. E. and Cary, R. A.: Elemental Carbon-Based Method for Monitoring Occupational Exposures to Particulate Diesel Exhaust, Aerosol Sci. Technol., 25, 221–241, https://doi.org/10.1080/02786829608965393, 1996.
Canagaratna, M. R., Jayne, J. T., Jimenez, J. L., Allan, J. D., Alfarra, M. R., Zhang, Q., Onasch, T. B., Drewnick, F., Coe, H., Middlebrook, A., Delia, A., Williams, L. R., Trimborn, A. m., Northway, M. J., DeCarlo, P. F., Kolb, C. E., Davidovits, P., and Worsnop, D. R.: Chemical and microphysical characterization of ambient aerosols with the aerodyne aerosol mass spectrometer, Mass Spectrom. Rev., 26, 185–222, https://doi.org/10.1002/mas.20115, 2007.
Canagaratna, M. R., Jimenez, J. L., Kroll, J. H., Chen, Q., Kessler, S. H., Massoli, P., Hildebrandt Ruiz, L., Fortner, E., Williams, L. R., Wilson, K. R., Surratt, J. D., Donahue, N. M., Jayne, J. T., and Worsnop, D. R.: Elemental ratio measurements of organic compounds using aerosol mass spectrometry: characterization, improved calibration, and implications, Atmos. Chem. Phys., 15, 253–272, https://doi.org/10.5194/acp-15-253-2015, 2015.
Canonaco, F., Crippa, M., Slowik, J. G., Baltensperger, U., and Prévôt, A. S. H.: SoFi, an IGOR-based interface for the efficient use of the generalized multilinear engine (ME-2) for the source apportionment: ME-2 application to aerosol mass spectrometer data, Atmos. Meas. Tech., 6, 3649–3661, https://doi.org/10.5194/amt-6-3649-2013, 2013.
Carbone, S., Aurela, M., Saarnio, K., Saarikoski, S., Timonen, H., Frey, A., Sueper, D., Ulbrich, I. M., Jimenez, J. L., Kulmala, M., Worsnop, D. R., and Hillamo, R. E.: Wintertime Aerosol Chemistry in Sub-Arctic Urban Air, Aerosol Sci. Technol., 48, 313–323, https://doi.org/10.1080/02786826.2013.875115, 2014.
Carslaw, D. C. and Ropkins, K.: openair – An R package for air quality data analysis, Environ. Model. Softw., 27–28, 52–61, https://doi.org/10.1016/j.envsoft.2011.09.008, 2012.
Cavalli, F. and Putaud, J.-P.: Results of the inter-laboratory comparison exercise for TC and EC measurements (OCEC-2023-1), European Commission, Ispra, JRC133803, https://doi.org/10.2760/843174, 2023.
Cavalli, F., Viana, M., Yttri, K. E., Genberg, J., and Putaud, J.-P.: Toward a standardised thermal-optical protocol for measuring atmospheric organic and elemental carbon: the EUSAAR protocol, Atmos. Meas. Tech., 3, 79–89, https://doi.org/10.5194/amt-3-79-2010, 2010.
Coggon, M. M., Gkatzelis, G. I., McDonald, B. C., Gilman, J. B., Schwantes, R. H., Abuhassan, N., Aikin, K. C., Arend, M. F., Berkoff, T. A., Brown, S. S., Campos, T. L., Dickerson, R. R., Gronoff, G., Hurley, J. F., Isaacman-VanWertz, G., Koss, A. R., Li, M., McKeen, S. A., Moshary, F., Peischl, J., Pospisilova, V., Ren, X., Wilson, A., Wu, Y., Trainer, M., and Warneke, C.: Volatile chemical product emissions enhance ozone and modulate urban chemistry, P. Natl. Acad. Sci. USA, 118, e2026653118, https://doi.org/10.1073/pnas.2026653118, 2021.
Drinovec, L., Močnik, G., Zotter, P., Prévôt, A. S. H., Ruckstuhl, C., Coz, E., Rupakheti, M., Sciare, J., Müller, T., Wiedensohler, A., and Hansen, A. D. A.: The ”dual-spot” Aethalometer: an improved measurement of aerosol black carbon with real-time loading compensation, Atmos. Meas. Tech., 8, 1965–1979, https://doi.org/10.5194/amt-8-1965-2015, 2015.
Gentner, D. R., Jathar, S. H., Gordon, T. D., Bahreini, R., Day, D. A., El Haddad, I., Hayes, P. L., Pieber, S. M., Platt, S. M., de Gouw, J., Goldstein, A. H., Harley, R. A., Jimenez, J. L., Prévôt, A. S. H., and Robinson, A. L.: Review of Urban Secondary Organic Aerosol Formation from Gasoline and Diesel Motor Vehicle Emissions, Environ. Sci. Technol., 51, 1074–1093, https://doi.org/10.1021/acs.est.6b04509, 2017.
Hakola, H., Taipale, D., Praplan, A., Schallhart, S., Thomas, S., Tykkä, T., Helin, A., Bäck, J., and Hellén, H.: Emissions of volatile organic compounds from Norway spruce and potential atmospheric impacts, Front. For. Glob. Change, 6, 1116414, https://doi.org/10.3389/ffgc.2023.1116414, 2023.
Hansen, A. D. A., Rosen, H., and Novakov, T.: The aethalometer – An instrument for the real-time measurement of optical absorption by aerosol particles, Carbonaceous Part, Atmosphere, 1983, 36, 191–196, https://doi.org/10.1016/0048-9697(84)90265-1, 1984.
Heikkilä, J., Rönkkö, T., Lähde, T., Lemmetty, M., Arffman, A., Virtanen, A., Keskinen, J., Pirjola, L., and Rothe, D.: Effect of Open Channel Filter on Particle Emissions of Modern Diesel Engine, J. Air Waste Manag. Assoc., 59, 1148–1154, https://doi.org/10.3155/1047-3289.59.10.1148, 2009.
Helin, A., Virkkula, A., Backman, J., Pirjola, L., Sippula, O., Aakko-Saksa, P., Väätäinen, S., Mylläri, F., Järvinen, A., Bloss, M., Aurela, M., Jakobi, G., Karjalainen, P., Zimmermann, R., Jokiniemi, J., Saarikoski, S., Tissari, J., Rönkkö, T., Niemi, J. V., and Timonen, H.: Variation of Absorption Ångström Exponent in Aerosols From Different Emission Sources, J. Geophys. Res.-Atmos., 126, e2020JD034094, https://doi.org/10.1029/2020JD034094, 2021.
Hellén, H., Tykkä, T., and Hakola, H.: Importance of monoterpenes and isoprene in urban air in northern Europe, Atmos. Environ., 59, 59–66, https://doi.org/10.1016/j.atmosenv.2012.04.049, 2012.
Hellén, H., Praplan, A. P., Tykkä, T., Helin, A., Schallhart, S., Schiestl-Aalto, P. P., Bäck, J., and Hakola, H.: Sesquiterpenes and oxygenated sesquiterpenes dominate the VOC (C5–C20) emissions of downy birches, Atmos. Chem. Phys., 21, 8045–8066, https://doi.org/10.5194/acp-21-8045-2021, 2021.
Hietikko, R., Kuuluvainen, H., Harrison, R. M., Portin, H., Timonen, H., Niemi, J. V., and Rönkkö, T.: Diurnal variation of nanocluster aerosol concentrations and emission factors in a street canyon, Atmos. Environ., 189, 98–106, https://doi.org/10.1016/j.atmosenv.2018.06.031, 2018.
Järvi, L., Junninen, H., Karppinen, A., Hillamo, R., Virkkula, A., Mäkelä, T., Pakkanen, T., and Kulmala, M.: Temporal variations in black carbon concentrations with different time scales in Helsinki during 1996–2005, Atmos. Chem. Phys., 8, 1017–1027, https://doi.org/10.5194/acp-8-1017-2008, 2008.
Järvi, L., Hannuniemi, H., Hussein, T., Junninen, H., Aalto, P., Hillamo, R., Mäkelä, T., Keronen, P., Siivola, E., Vesala, T., and Kulmala, M.: The urban measurement station SMEAR III: Continuous monitoring of air pollution and surface–atmosphere interactions in Helsinki, Finland, Boreal Env. Res., 14, 86–109, 2009.
Järvinen, A., Aitomaa, M., Rostedt, A., Keskinen, J., and Yli-Ojanperä, J.: Calibration of the new electrical low pressure impactor (ELPI+), J. Aerosol Sci., 69, 150–159, https://doi.org/10.1016/j.jaerosci.2013.12.006, 2014.
Jayne, J. T., Leard, D. C., Zhang, X., Davidovits, P., Smith, K. A., Kolb, C. E., and Worsnop, D. R.: Development of an Aerosol Mass Spectrometer for Size and Composition Analysis of Submicron Particles, Aerosol Sci. Technol., 33, 49–70, https://doi.org/10.1080/027868200410840, 2000.
Kangas, L., Kukkonen, J., Kauhaniemi, M., Riikonen, K., Sofiev, M., Kousa, A., Niemi, J. V., and Karppinen, A.: The contribution of residential wood combustion to the PM2.5 concentrations in the Helsinki metropolitan area, Atmos. Chem. Phys., 24, 1489–1507, https://doi.org/10.5194/acp-24-1489-2024, 2024.
Karppinen, A., Joffre, S. M., and Kukkonen, J.: The refinement of a meteorological pre-processor for the urban environment, Int. J. Environ. Pollut., 14, 565–572, https://doi.org/10.1504/IJEP.2000.000580, 2000.
Keskinen, J., Pietarinen, K., and Lehtimäki, M.: Electrical low pressure impactor, J. Aerosol Sci., 23, 353–360, https://doi.org/10.1016/0021-8502(92)90004-F, 1992.
Kuula, J., Kuuluvainen, H., Niemi, J. V., Saukko, E., Portin, H., Kousa, A., Aurela, M., Rönkkö, T., and Timonen, H.: Long-term sensor measurements of lung deposited surface area of particulate matter emitted from local vehicular and residential wood combustion sources, Aerosol Sci. Technol., 54, 190–202, https://doi.org/10.1080/02786826.2019.1668909, 2020.
Kuuluvainen, H., Poikkimäki, M., Järvinen, A., Kuula, J., Irjala, M., Dal Maso, M., Keskinen, J., Timonen, H., Niemi, J. V., and Rönkkö, T.: Vertical profiles of lung deposited surface area concentration of particulate matter measured with a drone in a street canyon, Environ. Pollut., 241, 96–105, https://doi.org/10.1016/j.envpol.2018.04.100, 2018.
Lampimäki, M., Baalbaki, R., Ahonen, L., Korhonen, F., Cai, R., Chan, T., Stolzenburg, D., Petäjä, T., Kangasluoma, J., Vanhanen, J., and Lehtipalo, K.: Novel aerosol diluter – Size dependent characterization down to 1 nm particle size, J. Aerosol Sci., 172, 106180, https://doi.org/10.1016/j.jaerosci.2023.106180, 2023.
Leino, K., Riuttanen, L., Nieminen, T., Maso, M. D., Väänänen, R., Pohja, T., Keronen, P., Järvi, L., Aalto, P. P., Virkkula, A., Kerminen, V.-M., Petäjä, T., and Kulmala, M.: Biomass-burning smoke episodes in Finland from eastern European wildfires, Boreal Environ. Res., 19, 275–292, 2014.
Lelieveld, J., Evans, J. S., Fnais, M., Giannadaki, D., and Pozzer, A.: The contribution of outdoor air pollution sources to premature mortality on a global scale, Nature, 525, 367–371, https://doi.org/10.1038/nature15371, 2015.
Lepistö, T., Kuuluvainen, H., Juuti, P., Järvinen, A., Arffman, A., and Rönkkö, T.: Measurement of the human respiratory tract deposited surface area of particles with an electrical low pressure impactor, Aerosol Sci. Technol., 54, 958–971, https://doi.org/10.1080/02786826.2020.1745141, 2020.
Lepistö, T., Lintusaari, H., Oudin, A., Barreira, L. M. F., Niemi, J. V., Karjalainen, P., Salo, L., Silvonen, V., Markkula, L., Hoivala, J., Marjanen, P., Martikainen, S., Aurela, M., Reyes, F. R., Oyola, P., Kuuluvainen, H., Manninen, H. E., Schins, R. P. F., Vojtisek-Lom, M., Ondracek, J., Topinka, J., Timonen, H., Jalava, P., Saarikoski, S., and Rönkkö, T.: Particle lung deposited surface area (LDSAal) size distributions in different urban environments and geographical regions: Towards understanding of the PM2.5 dose–response, Environ. Int., 180, 108224, https://doi.org/10.1016/j.envint.2023.108224, 2023a.
Lepistö, T., Barreira, L. M. F., Helin, A., Niemi, J. V., Kuittinen, N., Lintusaari, H., Silvonen, V., Markkula, L., Manninen, H. E., Timonen, H., Jalava, P., Saarikoski, S., and Rönkkö, T.: Snapshots of wintertime urban aerosol characteristics: Local sources emphasized in ultrafine particle number and lung deposited surface area, Environ. Res., 231, 116068, https://doi.org/10.1016/j.envres.2023.116068, 2023b.
Lintusaari, H., Kuuluvainen, H., Vanhanen, J., Salo, L., Portin, H., Järvinen, A., Juuti, P., Hietikko, R., Teinilä, K., Timonen, H., Niemi, J. V., and Rönkkö, T.: Sub-23 nm Particles Dominate Non-Volatile Particle Number Emissions of Road Traffic, Environ. Sci. Technol., 57, 10763–10772, https://doi.org/10.1021/acs.est.3c03221, 2023.
Liu, P. S. K., Deng, R., Smith, K. A., Williams, L. R., Jayne, J. T., Canagaratna, M. R., Moore, K., Onasch, T. B., Worsnop, D. R., and Deshler, T.: Transmission Efficiency of an Aerodynamic Focusing Lens System: Comparison of Model Calculations and Laboratory Measurements for the Aerodyne Aerosol Mass Spectrometer, Aerosol Sci. Technol., 41, 721–733, https://doi.org/10.1080/02786820701422278, 2007.
Liu, X., Hadiatullah, H., Zhang, X., Trechera, P., Savadkoohi, M., Garcia-Marlès, M., Reche, C., Pérez, N., Beddows, D. C. S., Salma, I., Thén, W., Kalkavouras, P., Mihalopoulos, N., Hueglin, C., Green, D. C., Tremper, A. H., Chazeau, B., Gille, G., Marchand, N., Niemi, J. V., Manninen, H. E., Portin, H., Zikova, N., Ondracek, J., Norman, M., Gerwig, H., Bastian, S., Merkel, M., Weinhold, K., Casans, A., Casquero-Vera, J. A., Gómez-Moreno, F. J., Artíñano, B., Gini, M., Diapouli, E., Crumeyrolle, S., Riffault, V., Petit, J.-E., Favez, O., Putaud, J.-P., Santos, S. M. D., Timonen, H., Aalto, P. P., Hussein, T., Lampilahti, J., Hopke, P. K., Wiedensohler, A., Harrison, R. M., Petäjä, T., Pandolfi, M., Alastuey, A., and Querol, X.: Ambient air particulate total lung deposited surface area (LDSA) levels in urban Europe, Sci. Total Environ., 898, 165466, https://doi.org/10.1016/j.scitotenv.2023.165466, 2023.
Manninen, H. E., Mirme, S., Mirme, A., Petäjä, T., and Kulmala, M.: How to reliably detect molecular clusters and nucleation mode particles with Neutral cluster and Air Ion Spectrometer (NAIS), Atmos. Meas. Tech., 9, 3577–3605, https://doi.org/10.5194/amt-9-3577-2016, 2016.
Marjamäki, M., Keskinen, J., Chen, D.-R., and Pui, D. Y. H.: PERFORMANCE EVALUATION OF THE ELECTRICAL LOW-PRESSURE IMPACTOR (ELPI), J. Aerosol Sci., 31, 249–261, https://doi.org/10.1016/S0021-8502(99)00052-X, 2000.
Marques, B., Kostenidou, E., Valiente, A. M., Vansevenant, B., Sarica, T., Fine, L., Temime-Roussel, B., Tassel, P., Perret, P., Liu, Y., Sartelet, K., Ferronato, C., and D'Anna, B.: Detailed Speciation of Non-Methane Volatile Organic Compounds in Exhaust Emissions from Diesel and Gasoline Euro 5 Vehicles Using Online and Offline Measurements, Toxics, 10, 184, https://doi.org/10.3390/toxics10040184, 2022.
Middlebrook, A. M., Bahreini, R., Jimenez, J. L., and Canagaratna, M. R.: Evaluation of Composition-Dependent Collection Efficiencies for the Aerodyne Aerosol Mass Spectrometer using Field Data, Aerosol Sci. Technol., 46, 258–271, https://doi.org/10.1080/02786826.2011.620041, 2012.
Mirme, S. and Mirme, A.: The mathematical principles and design of the NAIS – a spectrometer for the measurement of cluster ion and nanometer aerosol size distributions, Atmos. Meas. Tech., 6, 1061–1071, https://doi.org/10.5194/amt-6-1061-2013, 2013.
Ng, N. L., Herndon, S. C., Trimborn, A., Canagaratna, M. R., Croteau, P. L., Onasch, T. B., Sueper, D., Worsnop, D. R., Zhang, Q., Sun, Y. L., and Jayne, J. T.: An Aerosol Chemical Speciation Monitor (ACSM) for Routine Monitoring of the Composition and Mass Concentrations of Ambient Aerosol, Aerosol Sci. Technol., 45, 780–794, https://doi.org/10.1080/02786826.2011.560211, 2011.
Niemi, J. V., Tervahattu, H., Vehkamäki, H., Kulmala, M., Koskentalo, T., Sillanpää, M., and Rantamäki, M.: Characterization and source identification of a fine particle episode in Finland, Atmos. Environ., 38, 5003–5012, https://doi.org/10.1016/j.atmosenv.2004.06.023, 2004.
Niemi, J. V., Tervahattu, H., Vehkamäki, H., Martikainen, J., Laakso, L., Kulmala, M., Aarnio, P., Koskentalo, T., Sillanpää, M., and Makkonen, U.: Characterization of aerosol particle episodes in Finland caused by wildfires in Eastern Europe, Atmos. Chem. Phys., 5, 2299–2310, https://doi.org/10.5194/acp-5-2299-2005, 2005.
Niemi, J. V., Saarikoski, S., Aurela, M., Tervahattu, H., Hillamo, R., Westphal, D. L., Aarnio, P., Koskentalo, T., Makkonen, U., Vehkamäki, H., and Kulmala, M.: Long-range transport episodes of fine particles in southern Finland during 1999–2007, Atmos. Environ., 43, 1255–1264, https://doi.org/10.1016/j.atmosenv.2008.11.022, 2009.
Okuljar, M., Kuuluvainen, H., Kontkanen, J., Garmash, O., Olin, M., Niemi, J. V., Timonen, H., Kangasluoma, J., Tham, Y. J., Baalbaki, R., Sipilä, M., Salo, L., Lintusaari, H., Portin, H., Teinilä, K., Aurela, M., Dal Maso, M., Rönkkö, T., Petäjä, T., and Paasonen, P.: Measurement report: The influence of traffic and new particle formation on the size distribution of 1–800 nm particles in Helsinki – a street canyon and an urban background station comparison, Atmos. Chem. Phys., 21, 9931–9953, https://doi.org/10.5194/acp-21-9931-2021, 2021.
Olin, M., Kuuluvainen, H., Aurela, M., Kalliokoski, J., Kuittinen, N., Isotalo, M., Timonen, H. J., Niemi, J. V., Rönkkö, T., and Dal Maso, M.: Traffic-originated nanocluster emission exceeds H2SO4-driven photochemical new particle formation in an urban area, Atmos. Chem. Phys., 20, 1–13, https://doi.org/10.5194/acp-20-1-2020, 2020.
Onasch, T. B., Trimborn, A., Fortner, E. C., Jayne, J. T., Kok, G. L., Williams, L. R., Davidovits, P., and Worsnop, D. R.: Soot Particle Aerosol Mass Spectrometer: Development, Validation, and Initial Application, Aerosol Sci. Technol., 46, 804–817, https://doi.org/10.1080/02786826.2012.663948, 2012.
Paatero, P.: The Multilinear Engine – A Table-Driven, Least Squares Program for Solving Multilinear Problems, Including the n-Way Parallel Factor Analysis Model, J. Comput. Graph. Stat., 8, 854–888, https://doi.org/10.1080/10618600.1999.10474853, 1999.
Petzold, A. and Schönlinner, M.: Multi-angle absorption photometry—a new method for the measurement of aerosol light absorption and atmospheric black carbon, J. Aerosol Sci., 35, 421–441, https://doi.org/10.1016/j.jaerosci.2003.09.005, 2004.
Pirjola, L., Niemi, J. V., Saarikoski, S., Aurela, M., Enroth, J., Carbone, S., Saarnio, K., Kuuluvainen, H., Kousa, A., Rönkkö, T., and Hillamo, R.: Physical and chemical characterization of urban winter-time aerosols by mobile measurements in Helsinki, Finland, Atmos. Environ., 158, 60–75, https://doi.org/10.1016/j.atmosenv.2017.03.028, 2017.
Praplan, A. P., Pfannerstill, E. Y., Williams, J., and Hellén, H.: OH reactivity of the urban air in Helsinki, Finland, during winter, Atmos. Environ., 169, 150–161, https://doi.org/10.1016/j.atmosenv.2017.09.013, 2017.
Rolph, G., Stein, A., and Stunder, B.: Real-time Environmental Applications and Display sYstem: READY, Environ. Model. Softw., 95, 210–228, https://doi.org/10.1016/j.envsoft.2017.06.025, 2017.
Rönkkö, T., Kuuluvainen, H., Karjalainen, P., Keskinen, J., Hillamo, R., Niemi, J. V., Pirjola, L., Timonen, H. J., Saarikoski, S., Saukko, E., Järvinen, A., Silvennoinen, H., Rostedt, A., Olin, M., Yli-Ojanperä, J., Nousiainen, P., Kousa, A., and Dal Maso, M.: Traffic is a major source of atmospheric nanocluster aerosol, P. Natl. Acad. Sci. USA, 114, 7549–7554, https://doi.org/10.1073/pnas.1700830114, 2017.
Rönkkö, T., Pirjola, L., Karjalainen, P., Simonen, P., Teinilä, K., Bloss, M., Salo, L., Datta, A., Lal, B., Hooda, R. K., Saarikoski, S., and Timonen, H.: Exhaust particle number and composition for diesel and gasoline passenger cars under transient driving conditions: Real-world emissions down to 1.5 nm, Environ. Pollut., 338, 122645, https://doi.org/10.1016/j.envpol.2023.122645, 2023a.
Rönkkö, T., Saarikoski, S., Kuittinen, N., Karjalainen, P., Keskinen, H., Järvinen, A., Mylläri, F., Aakko-Saksa, P., and Timonen, H.: Review of black carbon emission factors from different anthropogenic sources, Environ. Res. Lett., 18, 033004, https://doi.org/10.1088/1748-9326/acbb1b, 2023b.
Saarikoski, S., Timonen, H., Saarnio, K., Aurela, M., Järvi, L., Keronen, P., Kerminen, V.-M., and Hillamo, R.: Sources of organic carbon in fine particulate matter in northern European urban air, Atmos. Chem. Phys., 8, 6281–6295, https://doi.org/10.5194/acp-8-6281-2008, 2008.
Saarnio, K., Teinilä, K., Aurela, M., Timonen, H., and Hillamo, R.: High-performance anion-exchange chromatography–mass spectrometry method for determination of levoglucosan, mannosan, and galactosan in atmospheric fine particulate matter, Anal. Bioanal. Chem., 398, 2253–2264, https://doi.org/10.1007/s00216-010-4151-4, 2010.
Savadkoohi, M., Pandolfi, M., Reche, C., Niemi, J. V., Mooibroek, D., Titos, G., Green, D. C., Tremper, A. H., Hueglin, C., Liakakou, E., Mihalopoulos, N., Stavroulas, I., Artiñano, B., Coz, E., Alados-Arboledas, L., Beddows, D., Riffault, V., De Brito, J. F., Bastian, S., Baudic, A., Colombi, C., Costabile, F., Chazeau, B., Marchand, N., Gómez-Amo, J. L., Estellés, V., Matos, V., van der Gaag, E., Gille, G., Luoma, K., Manninen, H. E., Norman, M., Silvergren, S., Petit, J.-E., Putaud, J.-P., Rattigan, O. V., Timonen, H., Tuch, T., Merkel, M., Weinhold, K., Vratolis, S., Vasilescu, J., Favez, O., Harrison, R. M., Laj, P., Wiedensohler, A., Hopke, P. K., Petäjä, T., Alastuey, A., and Querol, X.: The variability of mass concentrations and source apportionment analysis of equivalent black carbon across urban Europe, Environ. Int., 178, 108081, https://doi.org/10.1016/j.envint.2023.108081, 2023.
Schmitt, S. H., Gendarmes, F., Tritscher, T., Zerrath, A., Krinke, T., and Bischof, O. F.: Concentration uncertainties in atmospheric aerosol measurement with Condensation Particle Counters, EGU General Assembly 2020, Online, 4–8 May 2020, EGU2020-13059, https://doi.org/10.5194/egusphere-egu2020-13059, 2020.
Schraufnagel, D. E.: The health effects of ultrafine particles, Exp. Mol. Med., 52, 311–317, https://doi.org/10.1038/s12276-020-0403-3, 2020.
Stein, A. F., Draxler, R. R., Rolph, G. D., Stunder, B. J. B., Cohen, M. D., and Ngan, F.: NOAA's HYSPLIT Atmospheric Transport and Dispersion Modeling System, Bull. Am. Meteorol. Soc., 96, 2059–2077, https://doi.org/10.1175/BAMS-D-14-00110.1, 2015.
Steinemann, A.: Volatile emissions from common consumer products, Air Qual. Atmosphere Health, 8, 273–281, https://doi.org/10.1007/s11869-015-0327-6, 2015.
Teinilä: MEASUREMENT REPORT: WINTERTIME AEROSOL CHARACTERIZATION AT AN URBAN TRAFFIC SITE IN HELSINKI FINLAND, Zenodo [data set], https://doi.org/10.5281/zenodo.14754890, 2025.
Teinilä, K., Aurela, M., Niemi, J. V., Kousa, A., Petäjä, T., Järvi, L., Hillamo, R., Kangas, L., Saarikoski, S., and Timonen, H.: Concentration variation of gaseous and particulate pollutants in the Helsinki city centre – observations from a two-year campaign from, Boreal Env. Res., 24, 2013–2015, 2019.
Teinilä, K., Timonen, H., Aurela, M., Kuula, J., Rönkkö, T., Hellèn, H., Loukkola, K., Kousa, A., Niemi, J. V., and Saarikoski, S.: Characterization of particle sources and comparison of different particle metrics in an urban detached housing area, Finland, Atmos. Environ., 272, 118939, https://doi.org/10.1016/j.atmosenv.2022.118939, 2022.
Trechera, P., Garcia-Marlès, M., Liu, X., Reche, C., Pérez, N., Savadkoohi, M., Beddows, D., Salma, I., Vörösmarty, M., Casans, A., Casquero-Vera, J. A., Hueglin, C., Marchand, N., Chazeau, B., Gille, G., Kalkavouras, P., Mihalopoulos, N., Ondracek, J., Zikova, N., Niemi, J. V., Manninen, H. E., Green, D. C., Tremper, A. H., Norman, M., Vratolis, S., Eleftheriadis, K., Gómez-Moreno, F. J., Alonso-Blanco, E., Gerwig, H., Wiedensohler, A., Weinhold, K., Merkel, M., Bastian, S., Petit, J.-E., Favez, O., Crumeyrolle, S., Ferlay, N., Martins Dos Santos, S., Putaud, J.-P., Timonen, H., Lampilahti, J., Asbach, C., Wolf, C., Kaminski, H., Altug, H., Hoffmann, B., Rich, D. Q., Pandolfi, M., Harrison, R. M., Hopke, P. K., Petäjä, T., Alastuey, A., and Querol, X.: Phenomenology of ultrafine particle concentrations and size distribution across urban Europe, Environ. Int., 172, 107744, https://doi.org/10.1016/j.envint.2023.107744, 2023.
Vanhanen, J., Mikkilä, J., Lehtipalo, K., Sipilä, M., Manninen, H. E., Siivola, E., Petäjä, T., and Kulmala, M.: Particle Size Magnifier for Nano-CN Detection, Aerosol Sci. Technol., 45, 533–542, https://doi.org/10.1080/02786826.2010.547889, 2011.
Vanhanen, J., Svedberg, M., Miettinen, E., Salo, J.-P., and Väkevä, M.: Dekati Diluter characterization in the 1–20 nm particle size range, https://www.researchgate.net/publication/31941 (last access: 1 February 2021), 2017.
Vestenius, M., Leppänen, S., Anttila, P., Kyllönen, K., Hatakka, J., Hellén, H., Hyvärinen, A.-P., and Hakola, H.: Background concentrations and source apportionment of polycyclic aromatic hydrocarbons in south-eastern Finland, Atmos. Environ., 45, 3391–3399, https://doi.org/10.1016/j.atmosenv.2011.03.050, 2011.
WHO: WHO global air quality guidelines: Particulate matter (PM2.5 and PM10), ozone, nitrogen dioxide, sulfur dioxide and carbon monoxide, World Health Organization, Geneva, ISBN 978-92-4-003422-8, 2021.
Wiedensohler, A., Birmili, W., Nowak, A., Sonntag, A., Weinhold, K., Merkel, M., Wehner, B., Tuch, T., Pfeifer, S., Fiebig, M., Fjäraa, A. M., Asmi, E., Sellegri, K., Depuy, R., Venzac, H., Villani, P., Laj, P., Aalto, P., Ogren, J. A., Swietlicki, E., Williams, P., Roldin, P., Quincey, P., Hüglin, C., Fierz-Schmidhauser, R., Gysel, M., Weingartner, E., Riccobono, F., Santos, S., Grüning, C., Faloon, K., Beddows, D., Harrison, R., Monahan, C., Jennings, S. G., O'Dowd, C. D., Marinoni, A., Horn, H.-G., Keck, L., Jiang, J., Scheckman, J., McMurry, P. H., Deng, Z., Zhao, C. S., Moerman, M., Henzing, B., de Leeuw, G., Löschau, G., and Bastian, S.: Mobility particle size spectrometers: harmonization of technical standards and data structure to facilitate high quality long-term observations of atmospheric particle number size distributions, Atmos. Meas. Tech., 5, 657–685, https://doi.org/10.5194/amt-5-657-2012, 2012.
Wu, D., Fei, L., Zhang, Z., Zhang, Y., Li, Y., Chan, C., Wang, X., Cen, C., Li, P., and Yu, L.: Environmental and Health Impacts of the Change in NMHCs Caused by the Usage of Clean Alternative Fuels for Vehicles, Aerosol Air Qual. Res., 20, 930–943, https://doi.org/10.4209/aaqr.2019.09.0459, 2020.
Zanobetti, A., Austin, E., Coull, B. A., Schwartz, J., and Koutrakis, P.: Health effects of multi-pollutant profiles, Environ. Int., 71, 13–19, https://doi.org/10.1016/j.envint.2014.05.023, 2014.