the Creative Commons Attribution 4.0 License.
the Creative Commons Attribution 4.0 License.
 | 08 May 2025
Spatial–temporal patterns in anthropogenic and biomass burning emission contributions to air pollution and mortality burden changes in India from 1995 to 2014
Bin Luo
Hongliang Zhang
Jianlin Hu
Jiangshan Mu
Wenxing Wang
Likun Xue
Anthropogenic (ANTHRO) and biomass burning (BB) emissions are major contributors to ambient air pollution, with the latter playing a particularly dominant role in nonurban regions. India has experienced a dramatic deterioration in air quality over the past few decades, but no systematic assessment has been conducted to investigate the individual contributions of ANTHRO and BB emission changes over the long term in India, particularly in nonurban areas. In this study, we conduct a comprehensive analysis of the long-term trends in particulate matter with aerodynamic diameters < 2.5 µm (PM2.5) and ozone (O3) in India and their mortality burden changes from 1995 to 2014, using a state-of-the-art high-resolution global chemical transport model (CAM-chem). Our simulations reveal a substantial nationwide increase in annual mean PM2.5 (6.71 µg m−3 per decade) and O3 (7.08 ppbv per decade), with the Indo-Gangetic Plain (IGP) and eastern central India serving as hotspots for PM2.5 and O3 trend changes, respectively. It is noteworthy that substantial O3 decreases were observed in the northern IGP, potentially linked to nitric oxide (NO) titration due to a surge in nitrogen oxides (NOx) emissions. Sensitivity analyses highlight ANTHRO emissions as primary contributors to rising PM2.5 and O3, while BB emissions play a prominent role in winter and spring. In years with high BB activity, the contributions from BB emissions to both PM2.5 and O3 changes were comparable to or even exceeded ANTHRO emissions in specific areas. We further estimate that the elevated air pollutant levels were associated with increased premature mortality attributable to PM2.5 and O3, leading to 97 830 and 73 911 deaths per decade. Although there has been a decrease in premature mortality per capita in the IGP region, population increase has offset its effectiveness.
- Article
(8812 KB) - Full-text XML
-
Supplement
(8314 KB) - BibTeX
- EndNote


Air pollution is among the most detrimental environmental factors to human health. According to the World Health Organization (WHO) database, 99 % of the global population lives in areas where the air quality surpasses WHO guideline limits (https://www.who.int/health-topics/air-pollution#tab=tab_1, last access: 21 September 2024). The two most concerning pollutants, particulate matter with aerodynamic diameters < 2.5 µm (PM2.5) and ozone (O3), can cause significant damage to the human heart and lungs (Hoek et al., 2013; Hystad et al., 2013; Villeneuve et al., 2015), potentially leading to premature death due to exposure over extended periods (Dedoussi et al., 2020; Fuller et al., 2022). The latest Global Burden Disease (GBD 2019) study, a comprehensive research initiative that quantifies health loss due to disease, injury, and risk factors worldwide, estimated that exposure to air pollution, including both household and ambient pollution, led to 6.7 million premature deaths (95 % confidence interval, CI, of 5.9 to 7.5 million) worldwide in 2019 (GBD 2019 Risk Factors Collaborators, 2020). Thus, mediating air pollution has become one of the most pressing global challenges.
It is well known that surface air pollution is usually unequally distributed in space, with higher levels in developing countries than in developed countries (GBD 2015 Risk Factors Collaborators, 2016). For example, India was ranked as the most polluted country in the world in 2021, encompassing 63 of the world's 100 most polluted cities (IQAir: 2021 World Air Quality Report, available at https://lib.icimod.org/record/35767/files/HimalDoc2022_2021WorldAirQualityReport.pdf?type=primary, last access: 21 September 2024). Previous modeling studies have indicated that the number of districts exceeding India's annual ambient standard of 40 µg m−3 rose from 200 to 385 (out of 640) from 1998 to 2020 (Guttikunda and Ka, 2022). The GBD 2019 study estimated that premature deaths attributable to ambient PM2.5 and O3 pollution accounted for 10.4 % (8.4–12.3) and 1.8 % (0.9–2.7) of the total deaths in India in 2019, respectively, and that the death rate per 100 000 people related to these pollutants increased by 115.3 % (28.3–344.4) and 139.2 % (96.5–195.8) from 1990 to 2019, respectively (India State-Level Disease Burden Initiative Air Pollution Collaborators, 2021). However, the GBD 2019 study did not separate the air quality changes due to various contribution factors, such as anthropogenic (ANTHRO) and biomass burning (BB). Meanwhile, the elevated chemical reaction rates in India, driven by intense sunlight and warm temperatures, create conditions conducive to ozone formation. Additionally, strong convection enhances the transport of ozone and its precursors, such as reactive nitrogen oxides (NOy), to higher altitudes, where the prolonged ozone lifetime promotes accumulation. This phenomenon positions India as a hotspot for ozone pollution and also significantly impacts the air quality in downwind regions (Zhang et al., 2016, 2021a).
As seen from the Community Emissions Data System (CEDS) inventory (Hoesly et al., 2018), the increasing trends in ANTHRO emissions of major air pollutants, such as nitrogen oxides (NOx), carbon monoxide (CO), and non-methane volatile organic compounds (NMVOCs), are significantly higher in India than in other regions (Wang et al., 2022). Meanwhile, crop yields in India have significantly increased since the mid-1960s after the Green Revolution, thereby contributing to increased BB emissions (Huang et al., 2022). Venkatramanan et al. (2021) showed that the crop residue burning in India increased from 18×106 to 116×106 t, in terms of total biomass burned, from 1950–1951 to 2017–2018. The frequency and intensity of forest fires in India have also increased in recent years due to persistent warmer temperatures and climate extremes (Vadrevu et al., 2019; Jain et al., 2021). These fires could pose significant threats to ambient air quality and human health, as large amounts of certain compounds are emitted into the atmosphere, namely, carbon dioxide (CO2), NOx, particulate matter (PM), and other chemical species (Crutzen and Andreae, 1990; Carvalho et al., 2011; Lan et al., 2022; Miranda et al., 2005). Previous studies have utilized observational and satellite data to assess the impacts of ANTHRO and BB sources on air quality trends in some Indian cities (Gurjar et al., 2016; Vohra et al., 2022). Additionally, model simulations have been employed to analyze source contributions to air pollution (Conibear et al., 2018a, b). However, there remains a lack of comprehensive assessments regarding the impacts of long-term ANTHRO and BB emission changes on air quality, particularly in nonurban areas.
In this study, we aim to improve our understanding of the spatial–temporal distribution of major air pollutants, mainly surface PM2.5 and O3, and the related mortality burden in India from 1995 to 2014 using a state-of-the-art global chemistry transport model. In addition, the individual contributions of changes in ANTHRO and BB emissions are further separated to better understand the causes of worsening air quality and escalating health risks in India. The selected period encompasses a dynamic phase of rapid changes in both ANTHRO and BB activities in India, thereby providing an ideal context for investigating their respective contributions to air pollution.
2.1 CAM-chem model configuration
We simulate surface PM2.5 and O3 concentrations over India between 1995 and 2014 using the CAM-chem global chemistry model, which is based on version 6 of the Community Atmosphere Model (CAM6), the atmospheric component of the Community Earth System Model (CESM2), as detailed by Danabasoglu et al. (2020) and Emmons et al. (2020). Following Emmons et al. (2020), the original model is run at a 1.25° (longitude) × 0.9° (latitude) horizontal resolution with 32 vertical levels reaching ∼ 45 km. We configure the Model for Ozone and Related Chemical Tracers – Tropospheric and Stratospheric (MOZART-TS1) chemistry mechanism with various complexity choices for tropospheric and stratospheric chemistry (Emmons et al., 2020). The aerosol module adopts the four-mode version of the Modal Aerosol Model (MAM4), including sulfate, black carbon, primary organic matter, secondary organic aerosols, sea salt, and mineral dust. The first level of the model outputs is considered the surface level, and all of the model outputs are then regridded to a finer resolution of 0.5° × 0.5° to match the grid cell population and baseline mortality rate datasets with respect to performing the health impact assessment.
Global historical ANTHRO emissions are adopted from CEDS (version 2017-05-18), which provides monthly emissions of ANTHRO aerosols and precursor compounds at a 0.5° × 0.5° resolution from 1750 to 2014, and were used in the Coupled Model Intercomparison Project Phase 6 (CMIP6) experiments (Emmons et al., 2020; Hoesly et al., 2018). The ANTHRO emissions include eight sectors: agriculture; energy; industrial; transportation; residential, commercial, and other; solvent production and application; waste; and international shipping (Hoesly et al., 2018). The air pollutants from the CEDS inventory, especially NMVOCs, are then re-speciated to match the chemical species in the latest CESM2 model, following the steps introduced by Emmons et al. (2020). Interpolation of the emission inventory from its original resolution (0.5° × 0.5°) to the target model resolution (0.9° × 1.25°) is undertaken prior to input into the model. Global historical BB emissions are sourced from van Marle et al. (2017) at a monthly temporal resolution and a 0.5° native spatial resolution, with all emissions occurring at the surface. Additionally, the biogenic emissions are calculated using the Model of Emissions of Gases and Aerosols from Nature (MEGAN v2.1). More emissions used are described in Emmons et al. (2020).
2.2 Numerical experiment designs
As described above, the standard (BASE) simulation is driven by the year-to-year variability in ANTHRO and BB emissions from 1995 to 2014. To separate the contributions from these two emission sources, we then conduct two sensitivity simulations in which ANTHRO emissions (FixAN) and BB emissions (FixBB) are fixed at 1995 levels individually, while all other parameters are kept consistent with the BASE simulation (Table 1). Subtracting each sensitivity simulation from the BASE simulation enables quantification of the respective influences of changes in ANTHRO and BB emissions on air quality and the associated health burden in India. In this work, we will discuss the air quality and mortality burden changes in six Indian regions based on meteorological conditions and aerosol variability (Fig. 1).
Table 1Model simulations performed in this study.
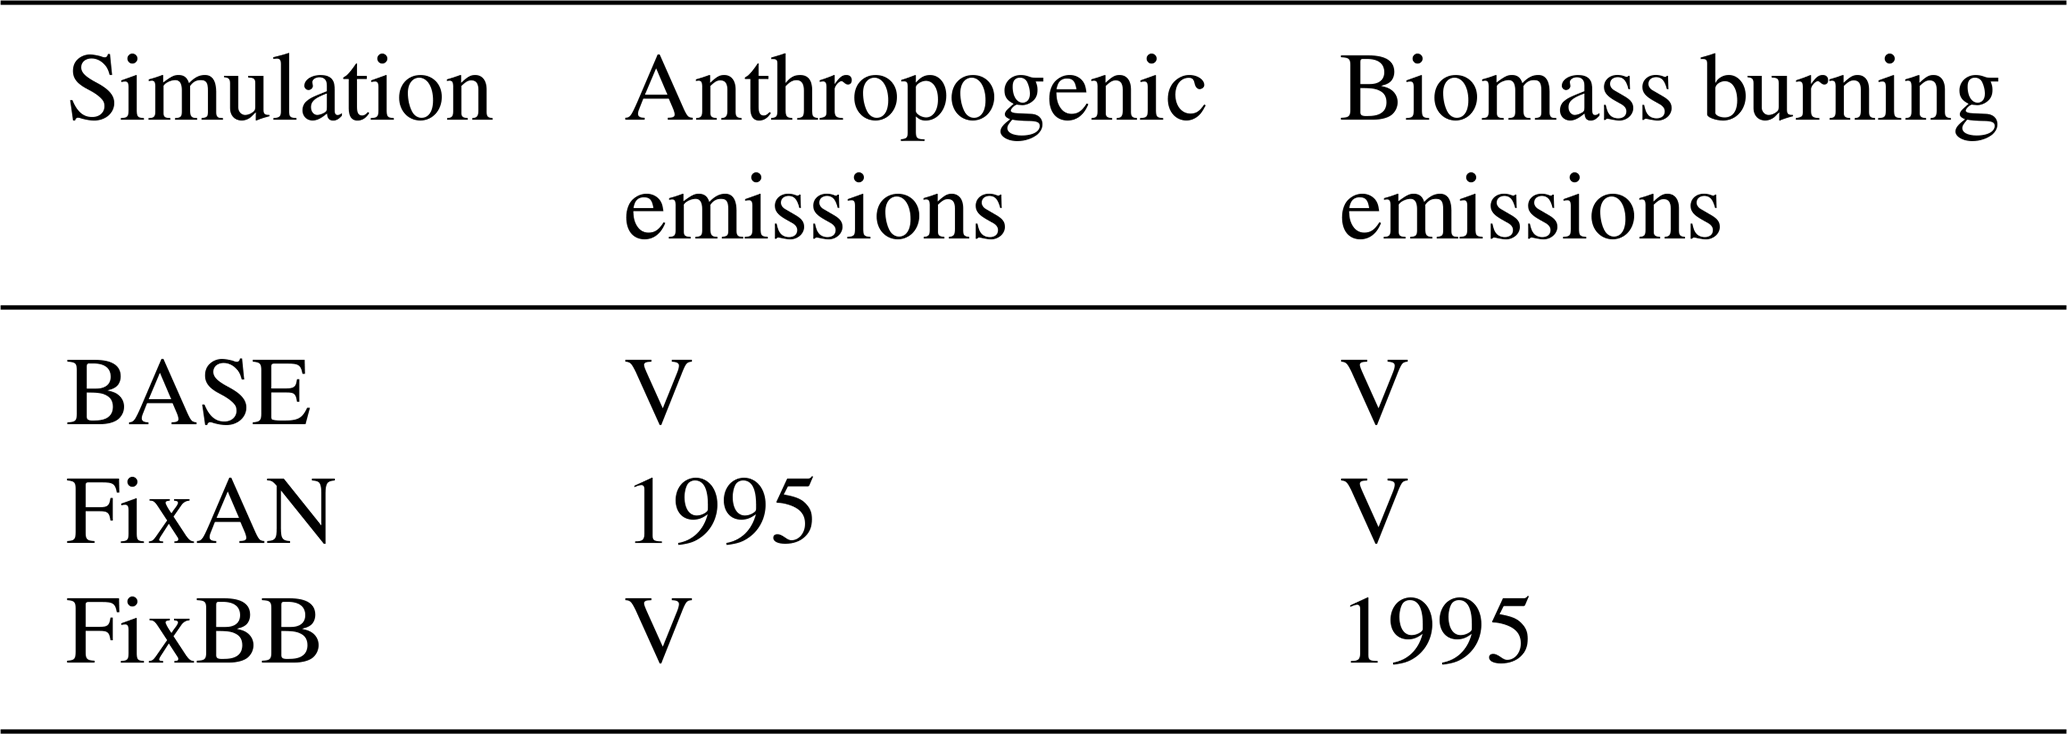
“V” indicates that particular input is subject to interannual variation in the simulation during the 1995–2014 period, “BASE” indicates that global ANTHRO and BB emissions vary according to their interannual variations during 1995–2014, “FixAN” indicates that only global ANTHRO emissions are fixed to 1995 levels in the simulation, and “FixBB” indicates that only global BB emissions are fixed to 1995 levels.
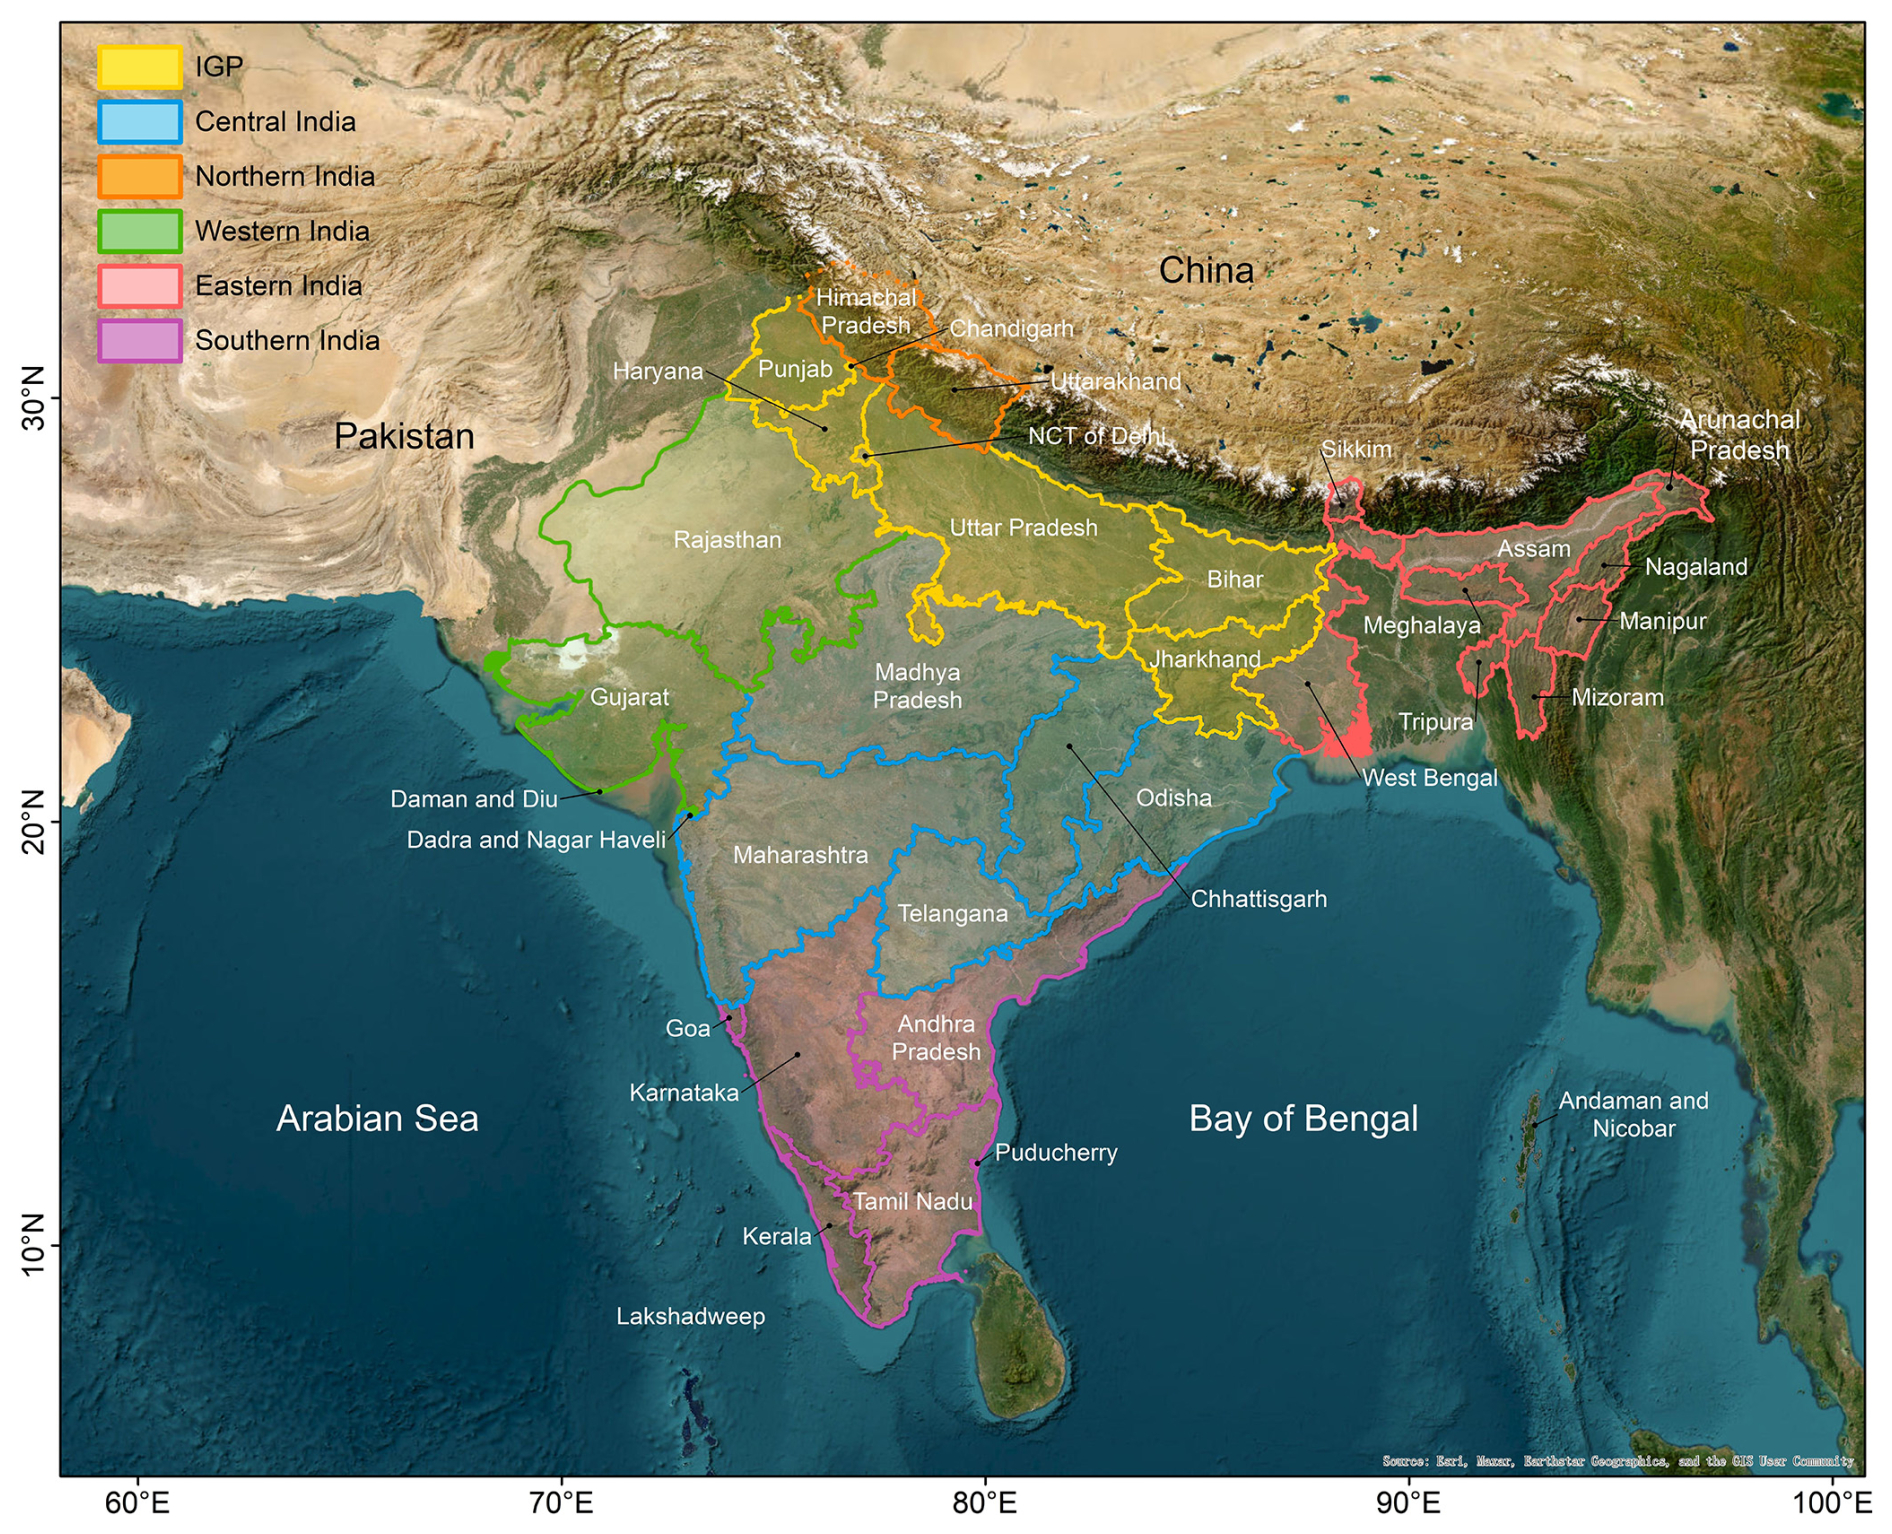
Figure 1A map of India divided into six regions based on meteorological conditions and aerosol variability (adapted from David et al., 2018).
2.3 Trend estimation
In this study, we apply the Theil–Sen estimator (Theil, 1992; Sen, 1968) to calculate the magnitude of trends in surface PM2.5 and O3 concentrations and the attributed mortality burden from 1995 to 2014. The Theil–Sen estimator is a robust nonparametric method for trend analysis based on the median slope, which is insensitive to outliers and highly competent with respect to identifying the slope of non-normally distributed data, as described in Eq. (1). This method has been widely used to analyze temporal trends in air pollutants that are always non-normally distributed (e.g., Munir et al., 2013; Sarkar et al., 2019; Vanem and Walker, 2013; Wan et al., 2023).
Here, xi and xj represent the concentrations of either PM2.5, O3, or attributed premature mortality at the time ti and tj (i > j), respectively, for the same parameter. A slope > 0 indicates an increasing trend, whereas a slope < 0 indicates a decreasing trend.
In addition to the Theil–Sen estimator, we use the nonparametric Mann–Kendall test to assess the significance of temporal trends within the data series (Zhang et al., 2022a, b). Both the Mann–Kendall test and Theil–Sen estimator require independence and randomness in the data, making them suitable for identifying monotonic trends. According to previous studies, a p value of less than 0.05 is most commonly treated as the absolute threshold of statistical significance (Christiansen et al., 2020; Wang et al., 2021; Zhou et al., 2017). The above methods are completed by implementing a Python program with the “pyMannKendall” package (Shourov et al., 2023).
2.4 Mortality burdens of surface PM2.5 and O3 in India
Based on an integrated exposure–response function utilized in the most recent GBD studies, we estimate the mortality burden associated with long-term exposure to ambient annual PM2.5 and the O3 seasonal daily maximum 8 h mixing ratio (OSDMA8) in India from 1995 to 2014, as described in Eq. (2):
Here, ΔMort refers to the annual mortality burden attributed to long-term PM2.5 or O3 exposure; y0 is the baseline mortality rate for a specific cause of disease; AF is the attributable fraction, which is a measure of the disease burden attributable to PM2.5 or O3 exposure, represented as (RR refers to relative risk); and pop represents the exposed population above the age of 25 for each grid cell in the domain.
Following our previous work (Zhang et al., 2021b), we obtain the baseline mortality rate (y0) for each country and 5-year age group from 1995 to 2014 from the GBD 2017 project (GBD 2017 Risk Factor Collaborators, 2018). The RR of long-term PM2.5 exposure associated with the mortality burden due to specific diseases was estimated using an integrated exposure–response model (IER) constructed by Burnett et al. (2014) and updated in GBD 2017. The RR for long-term O3 exposure is obtained from Turner et al. (2016), who indicated an RR of 1.12 (95 % confidence interval, CI, of [1.08, 1.16]) for respiratory disease. The recent GBD 2019 reported a relatively lower RR for chronic obstructive pulmonary disease (COPD), a subcategory of respiratory disease (1.06, with a 95 % CI of [1.03, 1.10]). To be comparable with the GBD 2019 results, we also estimate the O3-related mortality burden for COPD in India during the same period. The population distribution with age stratification data (pop) were retrieved from the GBD 2017 with a horizontal resolution of 0.1°. The population-weighted (pop-weighted) average of specific air pollutants discussed in the results is calculated by weighting the population of all grid cells inside each administrative region or country. Additionally, we calculate mortality rates per capita (avoidable deaths per 100 000 people) in each administrative region to exclude the influence of varying populations.
3.1 CAM-chem evaluation
We perform a comprehensive model evaluation by comparing our simulated monthly concentrations from the BASE simulation with multiple datasets, including ground-based observations in India; a historical multi-model simulation from the CMIP6 project; and different versions of multiyear reanalysis data from the Atmospheric Composition Analysis Group (ACAG) at Washington University in St. Louis, hereinafter referred as “Wustl Extracts” (van Donkelaar et al., 2021). We also compare our simulated PM2.5 and O3 with previously published studies in India using either global or regional chemical transport models (CTMs) as well as with the concentration reported from the GBD 2019 study. We select available ground-level PM2.5 observations over India from previous studies (Latha and Badarinath, 2005; Panwar et al., 2013; Reddy et al., 2012; Saradhi et al., 2008; Tiwari et al., 2009, 2013), which were also collected by the ACAG. The locations of these sites are listed in Table S1 in the Supplement. Figure S1 indicates that the model exhibits good performance with respect to capturing seasonal variations in surface PM2.5 observations, especially during the peak months, with correlation coefficient (R) values ranging from 0.59 to 0.91. Two exceptions are Mumbai (with an R of −0.16), where the model shows a contrasting trend for the seasonal PM2.5 characteristics (Fig. S1b), and Mukteshwar (with an R of 0.45). One possible explanation for this is the potential underestimation of emission inventories, especially during early periods for developing regions, such as India (McDuffie et al., 2020; Wang et al., 2022; Agarwal et al., 2024). For O3, our model shows an even higher R value when compared with the available surface observation sites in India from 1997 to 2011 (Fig. S2). Unlike the underestimations of surface PM2.5 in India, the CAM-chem model tends to overestimate surface O3, which is not very uncommon for global CTMs and has also been frequently discussed in previous studies (Hou et al., 2023; Tilmes et al., 2015; Young et al., 2018; Zhang et al., 2021b). The overestimation is partly caused by the coarse resolution, which leads to diluted emissions of O3 precursors and then simulated high O3 production. Figure 2 compares our study with previous studies and other publicly available PM2.5 and O3 datasets, as detailed in Tables S2 and S3. The comparisons indicate that our simulated results using CAM-chem agree very well with previous studies for both PM2.5 and O3, based on various metrics, such as average O3, pop-weighted average O3, or OSDMA8, consistent with the findings within the multiple CMIP6 models (Turnock et al., 2020). Figure S3 further compares the long-term trend in annual surface PM2.5 concentrations from 1998 to 2014 in the BASE simulation and Wustl Extracts dataset. A consistent increasing trend is found in both datasets, with a temporal R of 0.86 and lower estimations in our model. The model performs better in eastern India than in western India, with R values usually larger than 0.9 and normalized mean bias (NMB) values lower than −25 %. Similarly, compared to the simulated trend in our study with different versions of Wustl Extracts and the GBD 2019 study, our simulated PM2.5 concentration is lower, whereas the simulated O3 is higher (Fig. S4). The underestimation of the surface PM2.5 is partly caused by the missing model representation of nitrate and ammonium (Ren et al., 2024) and the secondary organic aerosol (Liu et al., 2021).
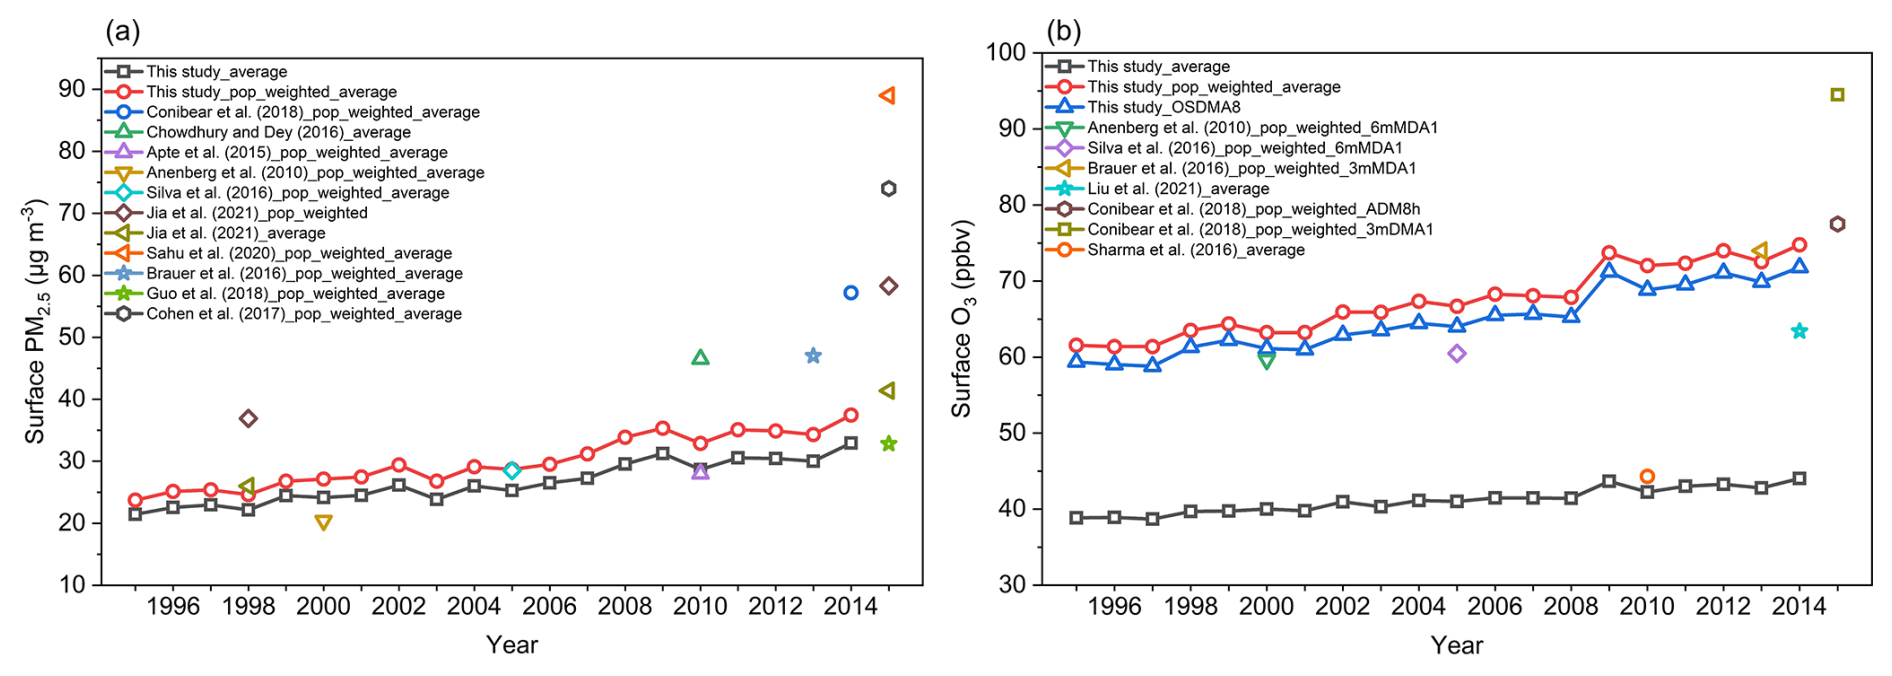
Figure 2Comparison of annual PM2.5 and O3 concentrations in India with previous studies. Note that the metrics vary depending on the study.
3.2 Spatial and temporal distribution of air pollution changes in India from 1995 to 2014
3.2.1 Historical emissions in India from 1995 to 2014
We first assess the interannual variation in ANTHRO and BB emissions of CO, NOx, NMVOCs, sulfur dioxide (SO2), ammonia (NH3), black carbon (BC), and organic carbon (OC) in India between 1995 and 2014 from the CEDS inventory. Figure S5 indicates an overall increase in ANTHRO emissions prior to a slow decrease after 2011. Significant interannual variations in BB emissions, such as in 1999, 2006, and 2009, were mainly caused by climate-change-induced hot and arid conditions (Sahu et al., 2015). Figure S6 shows that ANTHRO emissions occurred predominately in the Indo-Gangetic Plain (IGP) and central India, significantly increasing across all regions. Unlike other administrative regions, northern and eastern areas in India, such as Punjab and Manipur, feature a higher ratio of BB emissions to ANTHRO emissions.
3.2.2 The long-term trends in PM2.5 and O3 in India from 1995 to 2014
From the BASE simulation, we estimate that the annual mean pop-weighted PM2.5 and O3 values for India in 1995 and 2014 were 29.88 µg m−3 and 67.41 ppbv, respectively. Figure 3a and b show that annual average PM2.5 concentrations gradually rose from the south to the north, with high levels predominantly found in the IGP, mainly caused by high ANTHRO emissions (Fig. S6) and reduced ventilation due to obstruction by the Tibetan Plateau (Gao et al., 2018). Annual average O3 concentrations at the surface gradually increased from west to east and from south to north, with the highest levels concentrated in northern India and the eastern part of central India. The spatial patterns in the PM2.5 and O3 distribution in India have also been seen in several previous studies, although these publications only discussed one or several specific years (Jia et al., 2021; India State-Level Disease Burden Initiative Air Pollution Collaborators, 2021).
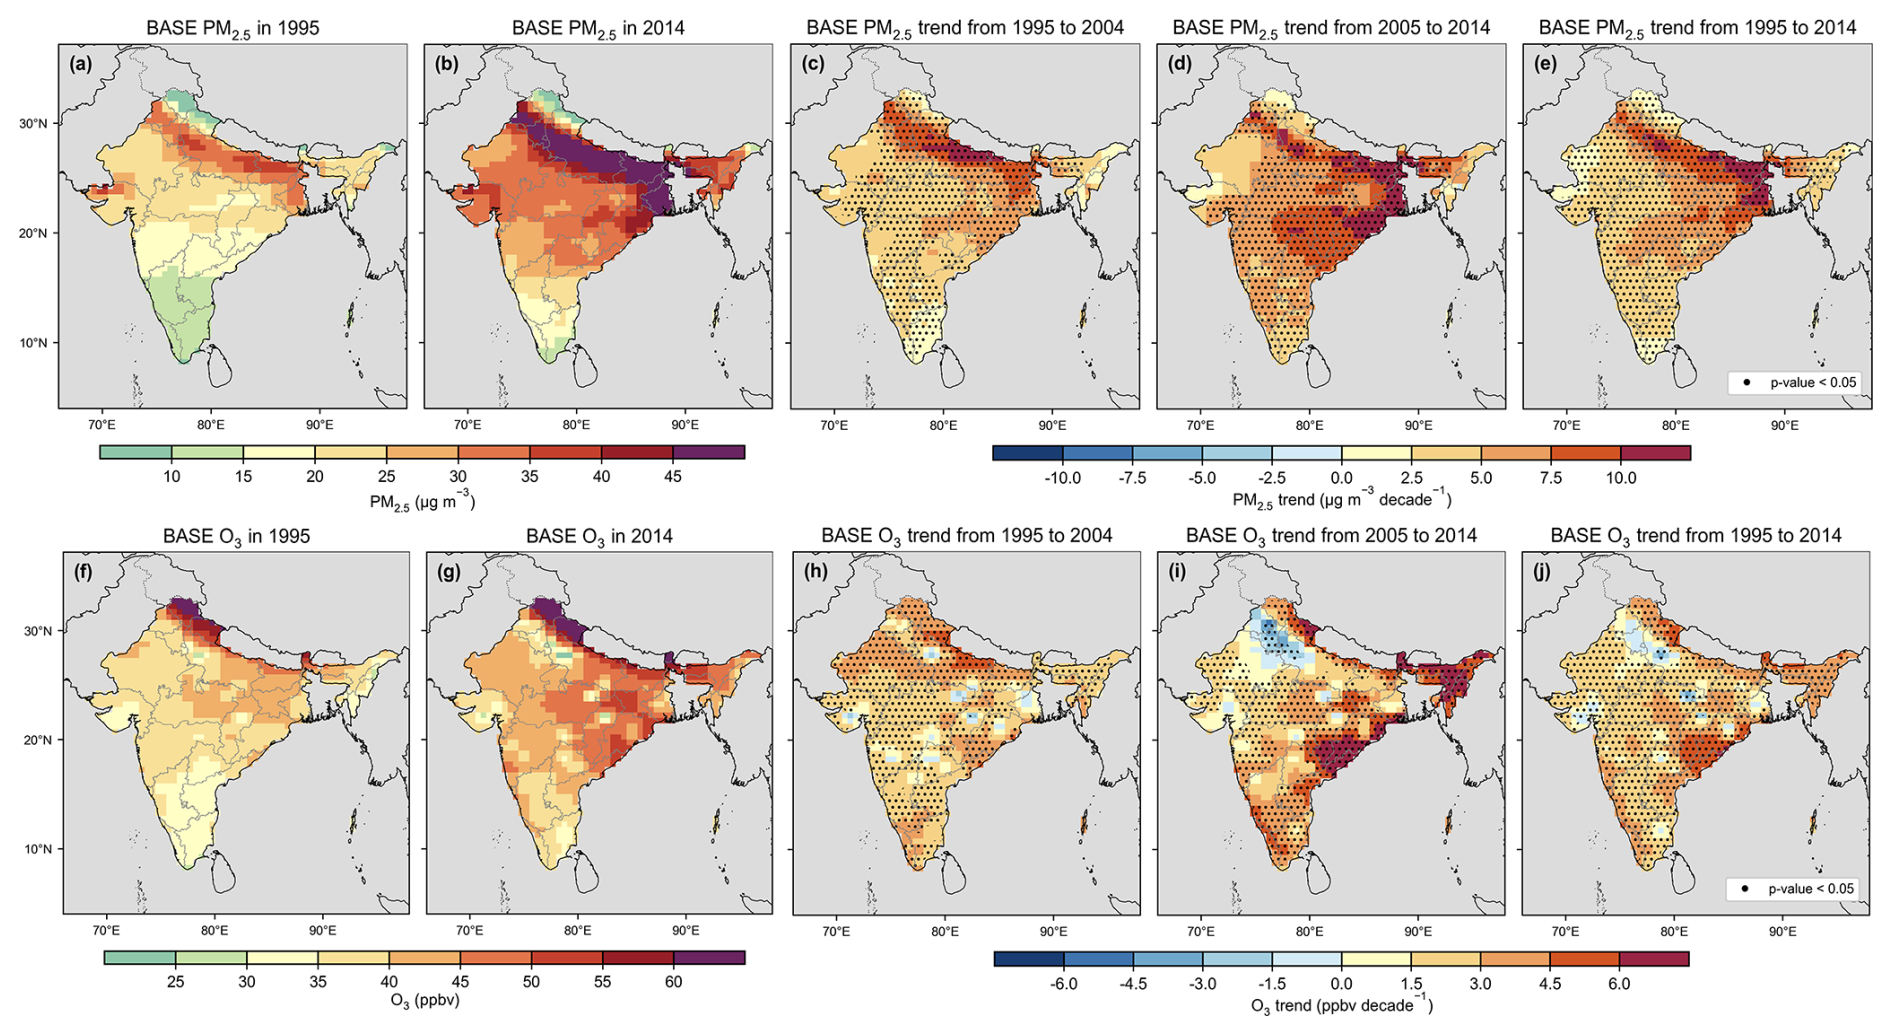
Figure 3Spatial distributions of PM2.5 (a–e) and O3 (f–j) with respect to the annual average in 1995 (a, f) and 2014 (b, g) as well as the trends in these species from 1995 to 2004 (c, h), from 2005 to 2014 (d, i), and from 1995 to 2014 (e, j). The black dot denotes the areas where the trend is statistically significant (p < 0.05). The units are micrograms per cubic meter (µg m−3) for PM2.5 (a, b), parts per billion by volume (ppbv) for O3 (f, g), micrograms per cubic meter (µg m−3) per decade for PM2.5 trends (c, d, e), and parts per billion by volume (ppbv) per decade for O3 trends (h, i, j).
From Fig. 3, we also find that both PM2.5 and O3 showed a statistically significant increasing trend throughout the country from 1995 to 2014, with a nationwide increasing rate of 6.71 µg m−3 per decade (p < 0.01) for pop-weighted PM2.5 and 7.08 ppbv per decade (p < 0.01) for pop-weighted O3 (Fig. S7), mainly driven by rapid industrialization and substantial economic development (Pandey et al., 2014; Sadavarte and Venkataraman, 2014). However, distinct spatial heterogeneity in the increasing trend was observed for the two air pollutants. PM2.5 exhibited varying degrees of increase across India, with the most distinctive increase occurring in the IGP, where the maximum trend reached 12.60 µg m−3 per decade. This notable rise can be attributed to increased regional ANTHRO emissions (Fig. S6). For O3, eastern central India experienced the highest O3 increases, with an obvious increase in eastern India and the lowest values in western India. It is notable that, in the northern IGP, including New Delhi, significant O3 decreases were also observed, which could have been caused by inhibited O3 production due to nitric oxide (NO) titration as a result of the dramatic increase in NOx emissions, as discussed in Karambelas et al. (2018). Splitting the trend into two periods (1995–2004 and 2005–2014), we find a larger increasing trend in the latter period than that in the former for both PM2.5 and O3, which may be due to the rapid urbanization and growing transportation activities over populous regions (Fig. S8) in recent years in India (Gao et al., 2018).
3.3 Driving factor analysis for air pollution changes in India
3.3.1 Contributions to the annual and seasonal trends
To disentangle the contributions of ANTHRO and BB emissions to long-term trends in PM2.5 and O3 concentrations in India from 1995 to 2014, we first analyze their contributions to annual and seasonal trends (Fig. 4). Not surprisingly, changes in ANTHRO emissions dominated the deterioration of PM2.5 and O3 in India, consistent with studies based on observational and satellite data (Gurjar et al., 2016; Vohra et al., 2022). Changes in ANTHRO emissions alone increased the area-weighted PM2.5 by 5.46 µg m−3 per decade (p < 0.01) and increased the area-weighted O3 by 2.71 ppbv per decade (p < 0.01), accounting for 102.21 % and 104.11 % of the total change, respectively. The contributions of changes in BB emissions were relatively minor, with distinct interannual variations and seasonal variations. Spatially, we found that both the long-term PM2.5 and O3 trends were mostly dominated by the ANTHRO emission changes throughout India (Fig. S9a, c). Changes in BB emissions led to a slightly increasing trend in PM2.5 in most of India and a decreasing trend in eastern India, although neither trend was statistically significant. BB emissions seemed to increase O3 in the IGP and central India and decrease O3 in western India, but the trends were insignificant (Fig. S9b, d).
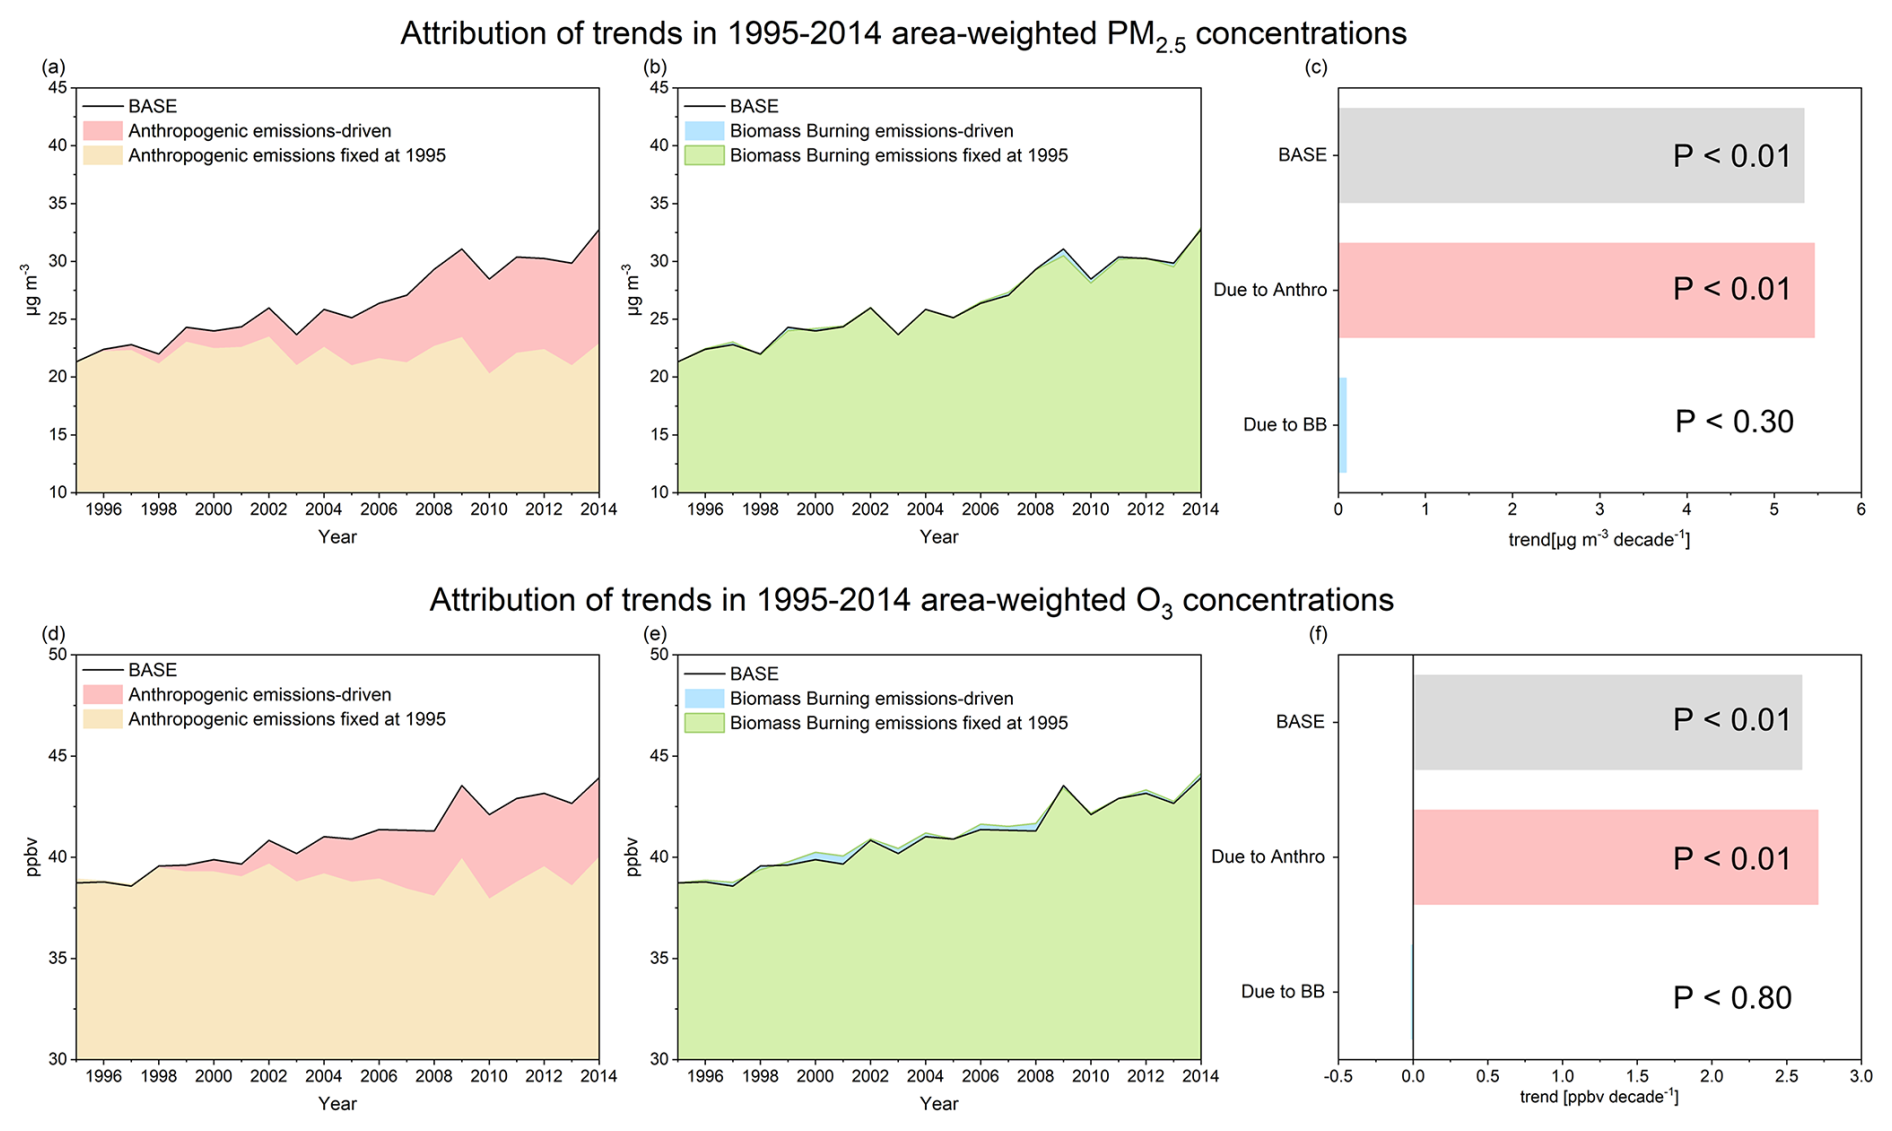
Figure 4Drivers of trends in the area-weighted (a–c) PM2.5 and (d–f) O3 in India in 1995–2014. The yellow shading in panels (a) and (d) shows the evolution of model-simulated PM2.5 and O3 concentrations in the FixAN simulation, whereas the red shading illustrates the estimation of the PM2.5 and O3 concentrations resulting from changes in ANTHRO emissions compared to the 1995 level. Panels (b) and (e) are the same as panels (a) and (d), respectively, but for the impacts of changes in BB emissions. Panels (c) and (f) denote the respective estimated PM2.5 and O3 trends in India derived from the BASE simulation and the impacts of ANTHRO and BB emissions.
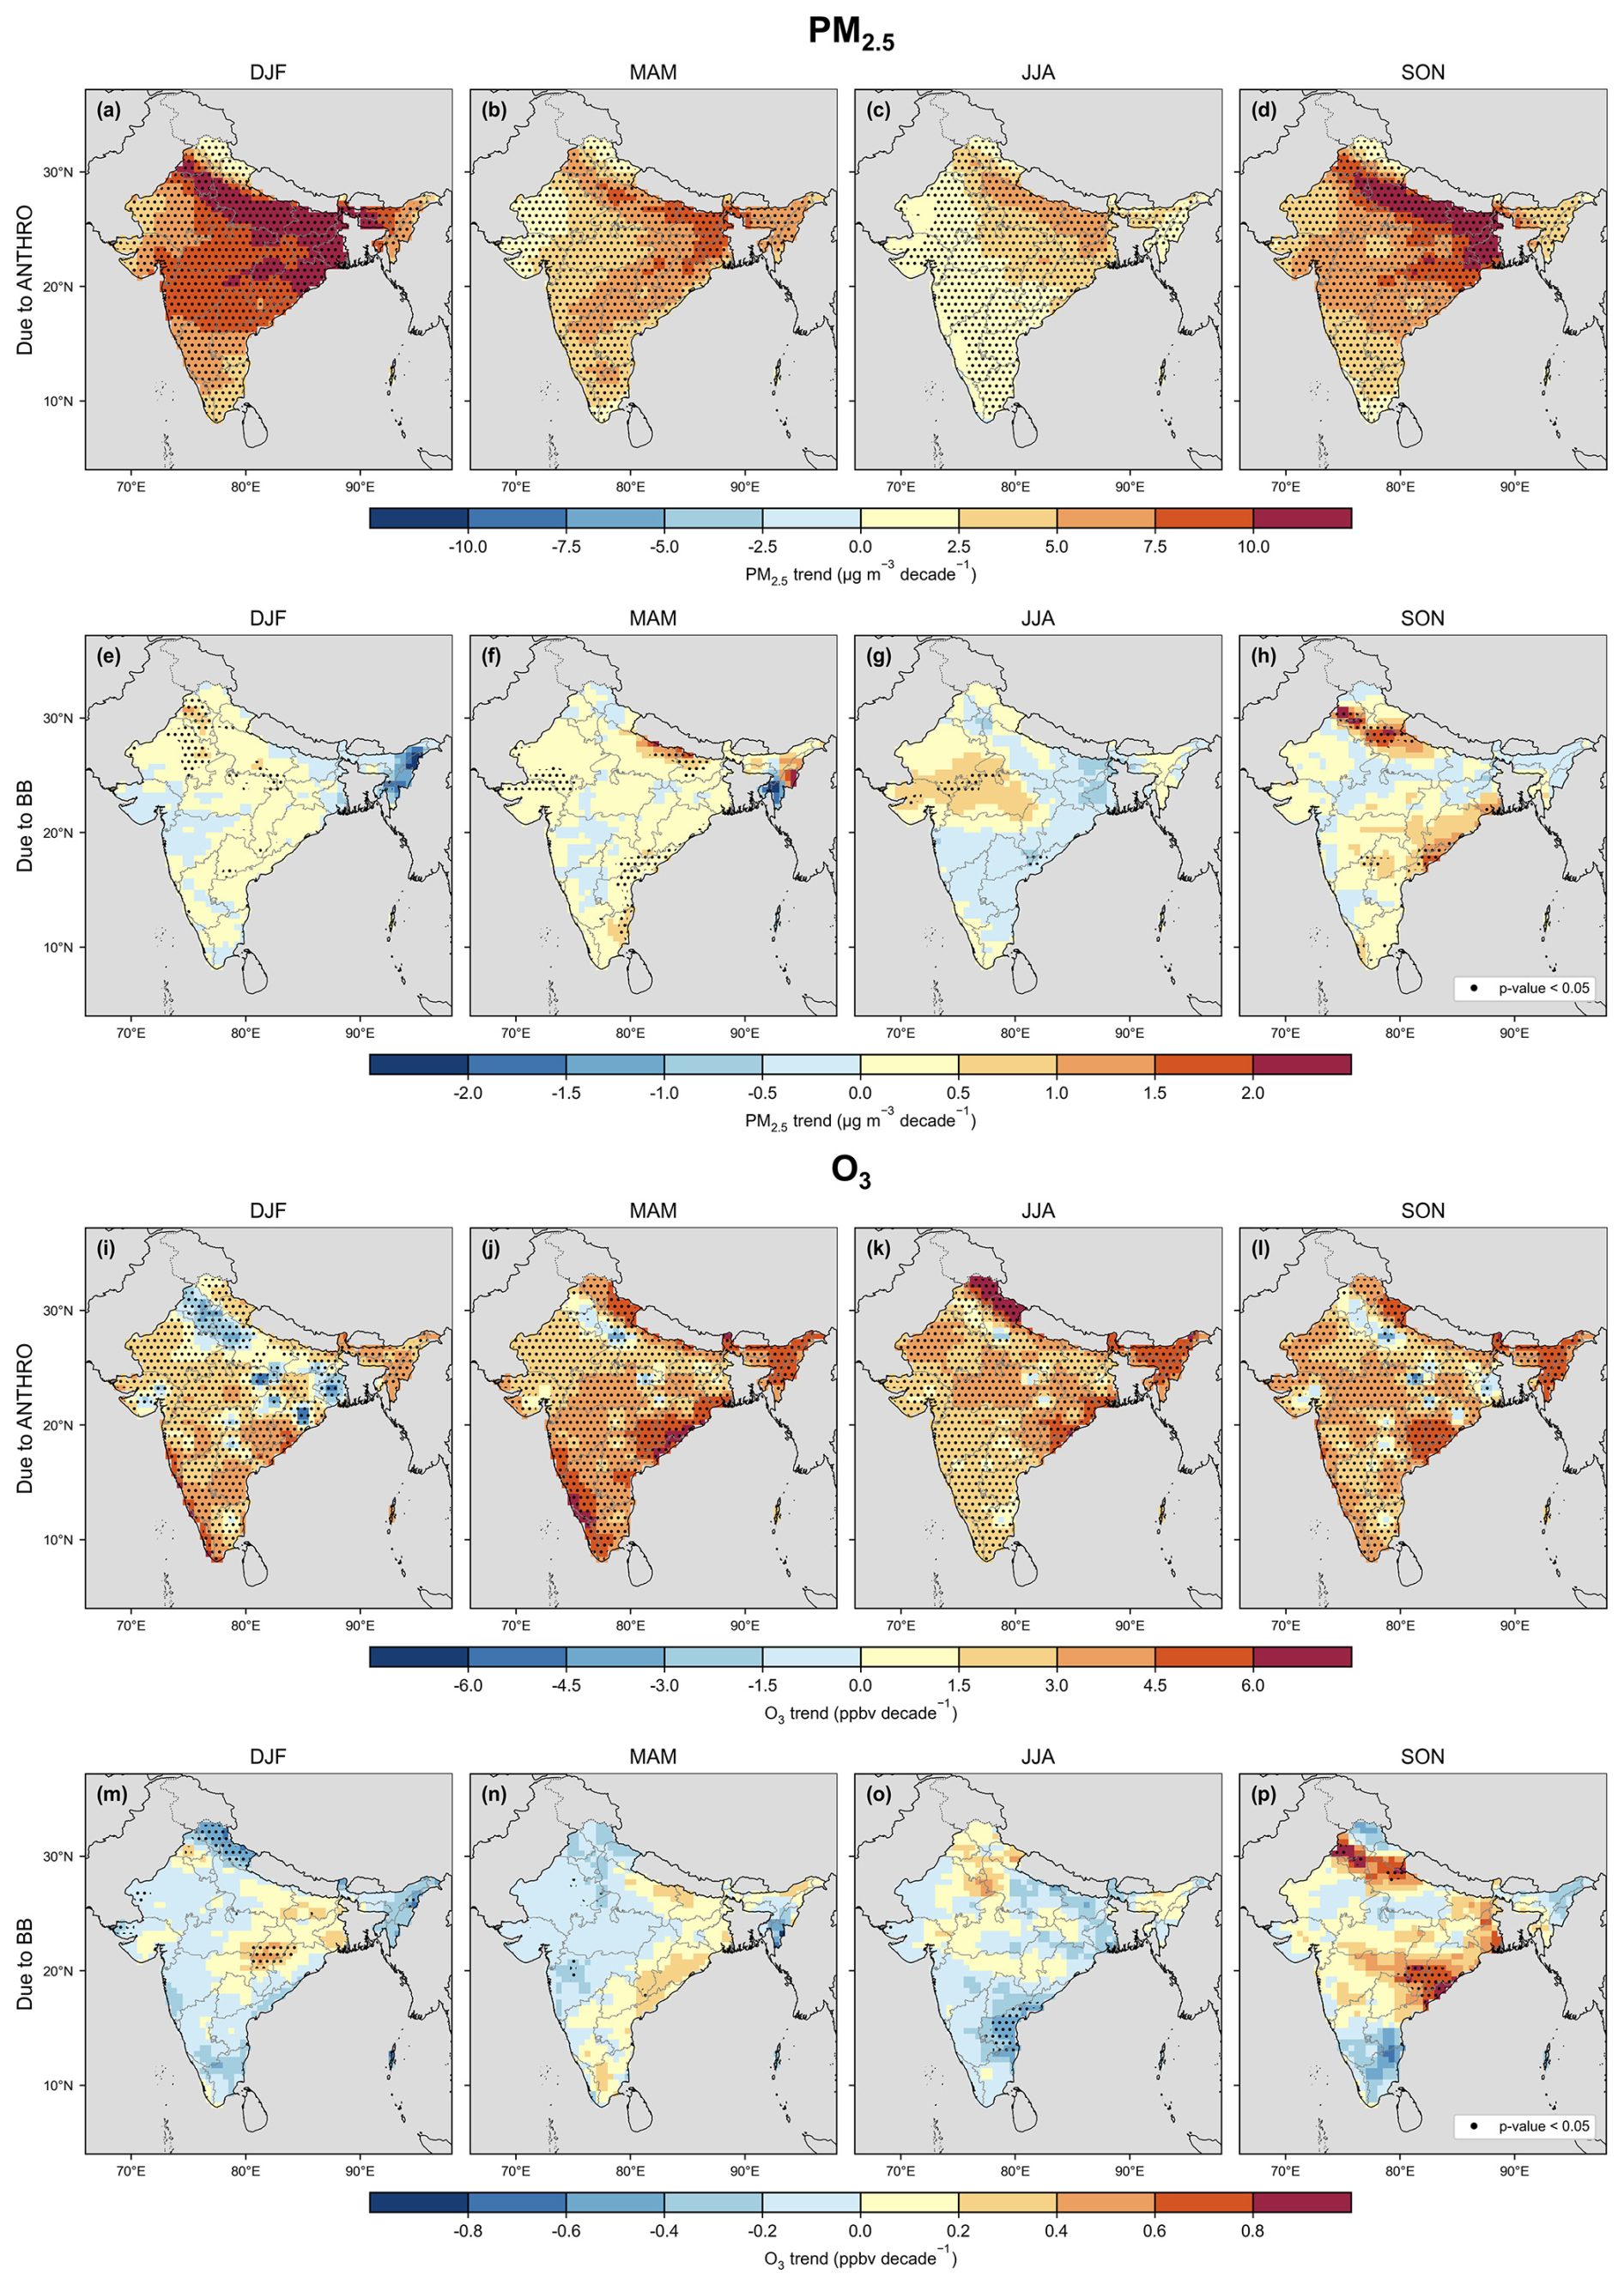
Figure 5Seasonal patterns in (a–d) ANTHRO and (e–h) BB emission contributions for the trends in PM2.5 and (i–p) for O3 in India from 1995 to 2014. The units are micrograms per cubic meter (µg m−3) per decade for PM2.5 and parts per billion by volume (ppbv) per decade for O3. The dots in the plots indicate statistically significant trends (p values less than 0.05).
It is well recognized that BB emissions usually feature a distinct seasonal trend, especially in India, where monsoons influence them. Hence, we quantify the seasonal trends in PM2.5 and O3 from ANTHRO and BB emissions for DJF (December–January–February), MAM (March–April–May), JJA (June–July–August, monsoon season), and SON (September–October–November, post-monsoon season) from 1995 to 2014 by subtracting the FixAN or FixBB simulation from the BASE simulation. The annual trends in PM2.5 and O3 for each season were subsequently estimated using the Theil–Sen estimator and the Mann–Kendall test. From Fig. 5a–h, we find that the contributions of ANTHRO emissions had consistent spatial patterns for the seasonal PM2.5 trend, with larger influences in the post-monsoon seasons (DJF and SON). These influences were estimated to be responsible for PM2.5 enhancements as high as 17.08 µg m−3 per decade, due to the decreased vertical dispersion and diffusion of aerosol caused by lower solar radiation during winter and surface wind speeds (Bran and Srivastava, 2017). The contributions of ANTHRO emissions during MAM and JJA were modulated as a result of increased precipitation, strong air convergence, and uplift during the presence of the summer monsoon, which impeded the accumulation of PM2.5 emissions at ground level (Bran and Srivastava, 2017; Gao et al., 2020; Lu et al., 2018). Unlike PM2.5, the contributions of ANTHRO emission changes to the surface O3 trend in India had a distinct spatial pattern across seasons (Fig. 5i–p). The ANTHRO emissions had a much stronger positive influence on the O3 increases in northern, eastern central, and eastern India during JJA and SON, while they had the largest increases in southern India in the pre-monsoon season (MAM; Fig. 5j). It has been reported that the stronger solar radiation and higher temperature in MAM are responsible for an increase in the photochemical efficiency of O3 in the presence of NOx (Doherty et al., 2013; Jacob and Winner, 2009; Pusede et al., 2015). The decreased O3 in the IGP was most pronounced in DJF (Fig. 5i), mainly due to lower solar radiation and titration of O3 owing to higher NOx levels (Kumar et al., 2012). Additionally, the occurrence of the winter monsoon led to extensive air subsidence in northern India, resulting in low net O3 production and strong horizontal export, ultimately leading to relatively low O3 levels (Lu et al., 2018).
3.3.2 Contributions to the seasonal air quality changes
BB emissions exhibit a high degree of interannual variability, leading to less clear trends in the annual data. Thus, Fig. 6 focuses on the spatial distributions of BB emission contributions for seasonal PM2.5 and O3 changes between 1995 and 2014 rather than trends, as detailed in Table S4. These contributions are quantified by subtracting the FixBB simulation in 2014 from the BASE simulation in 2014. The changes in BB emissions from 1995 to 2014 contributed significantly to the PM2.5 increases in eastern India (over 20 µg m−3) with a high incidence of forest fires (Jena et al., 2015). They also led to an O3 increase of more than 4 ppbv in eastern India in MAM. Contributions to seasonal PM2.5 and O3 changes from BB emissions were comparable to or even exceeded those from ANTHRO in some regions, such as Manipur and Nagaland (Fig. S10). With a higher BB emission fraction in other years, such as 1999, these contributions could even be even higher, reaching up to 46.03 µg m−3 and 6.46 ppbv for PM2.5 and O3, respectively (Fig. S11). Therefore, despite their variability, the BB emissions in India posed a great threat to the air quality and, thus, could not be overlooked.
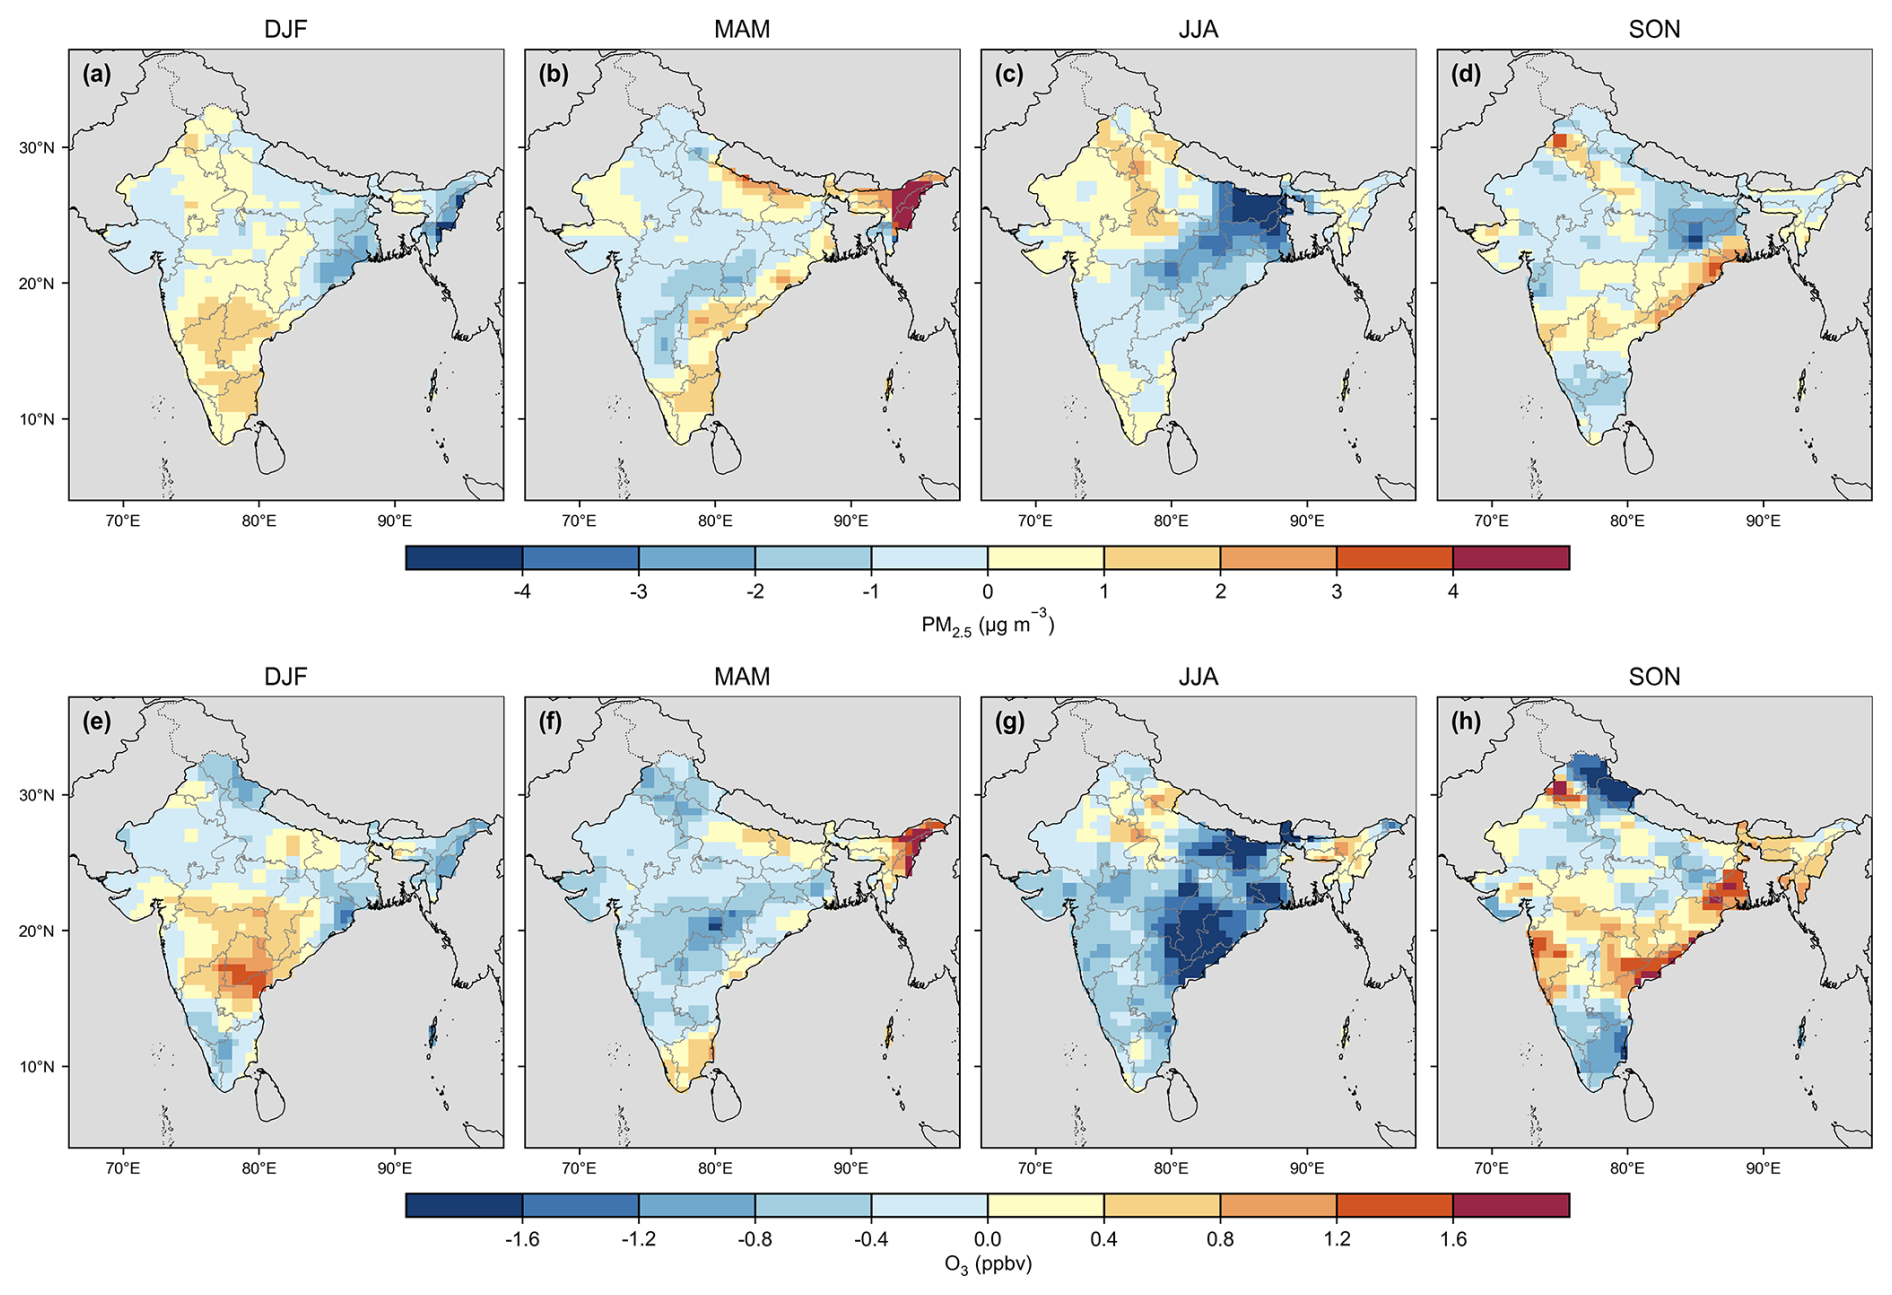
Figure 6Spatial distributions in the BB contribution for seasonal (a–d) PM2.5 and (e–h) O3 changes from 1995 to 2014 for DJF, MAM, JJA, and SON. The contributions from BB were calculated as the differences between the BASE and FixBB simulations in 2014. The units are micrograms per cubic meter (µg m−3) and parts per billion by volume (ppbv) for PM2.5 and O3, respectively.
3.4 Long-term trends in premature mortality due to PM2.5 and O3 in India
We estimate that the national mortality burden attributable to ambient PM2.5 exposure rose significantly, from 698 291 deaths in 1995 to 893 325 deaths in 2014, at a rate of 97 830 deaths per decade (p < 0.01; Fig. 7a). Similarly, the mortality burden attributable to O3 exposure also notably rose from 414 498 deaths in 1995 to 580 028 deaths in 2014 at a rate of 73 911 deaths per decade (p < 0.01). The hotspots of premature mortality attributable to PM2.5 and O3 exposure were located in the New Delhi and IGP regions in 1995 and 2014 (Fig. 7b–e), coinciding with densely populated areas (Fig. S8). We found that Uttar Pradesh, Bihar, West Bengal, and Haryana, four states within the IGP region, accounted for 41.00 % and 39.77 % of the national premature mortality due to PM2.5 and O3 in 2014, respectively. Considering this heterogeneous spatial distribution, it is imperative for the IGP region to implement stronger air pollution control policies to safeguard human health, as discussed by Jia et al. (2021). Our estimations for the O3-related mortality burden are higher than those reported in the GBD 2019 study (Fig. S12), as we applied a higher RR and used higher baseline mortality rates (see Sect. 2.4). After recalculating the O3-related mortality burden using the GBD 2019 metrics, we report an increasing trend of 29 736 deaths per decade for O3-related mortality, which is comparable to the GBD 2019 estimation of 33 243 deaths per decade. However, our estimated mortality burdens are still slightly higher than the GBD 2019 values due to the O3 overestimation in our model (Figs. 2, S4).
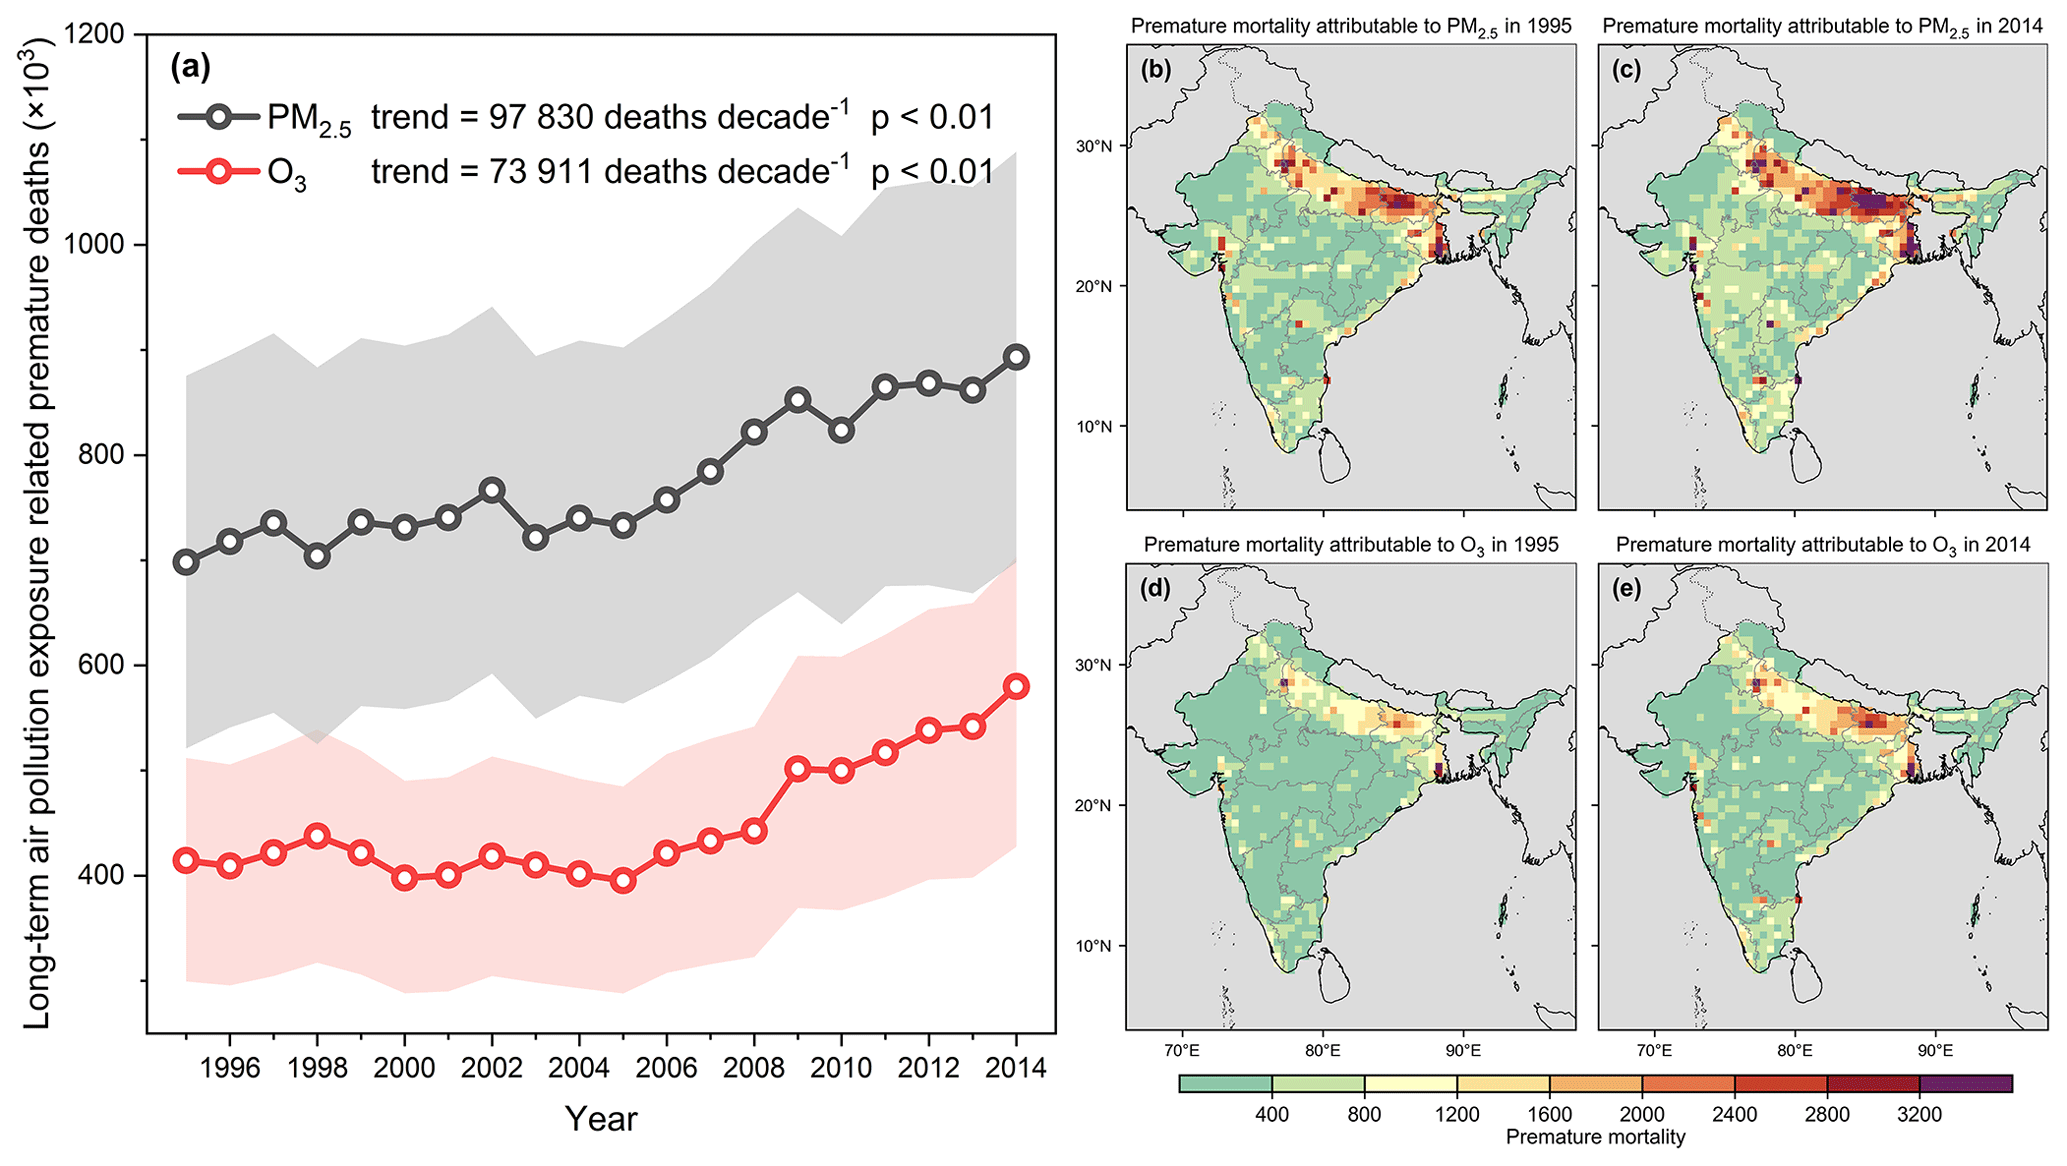
Figure 7Spatial–temporal change in the mortality burden attributable to PM2.5 and O3. (a) Interannual variation from 1995 to 2014. The shaded area indicates the range of the 95 % confidence interval accounting for RR estimates of long-term exposure to PM2.5 and O3 (gray indicates half of the range). (b–e) Spatial distributions of the average annual premature mortality attributable to (b–c) PM2.5 and (d–e) O3 in 1995 and 2014.
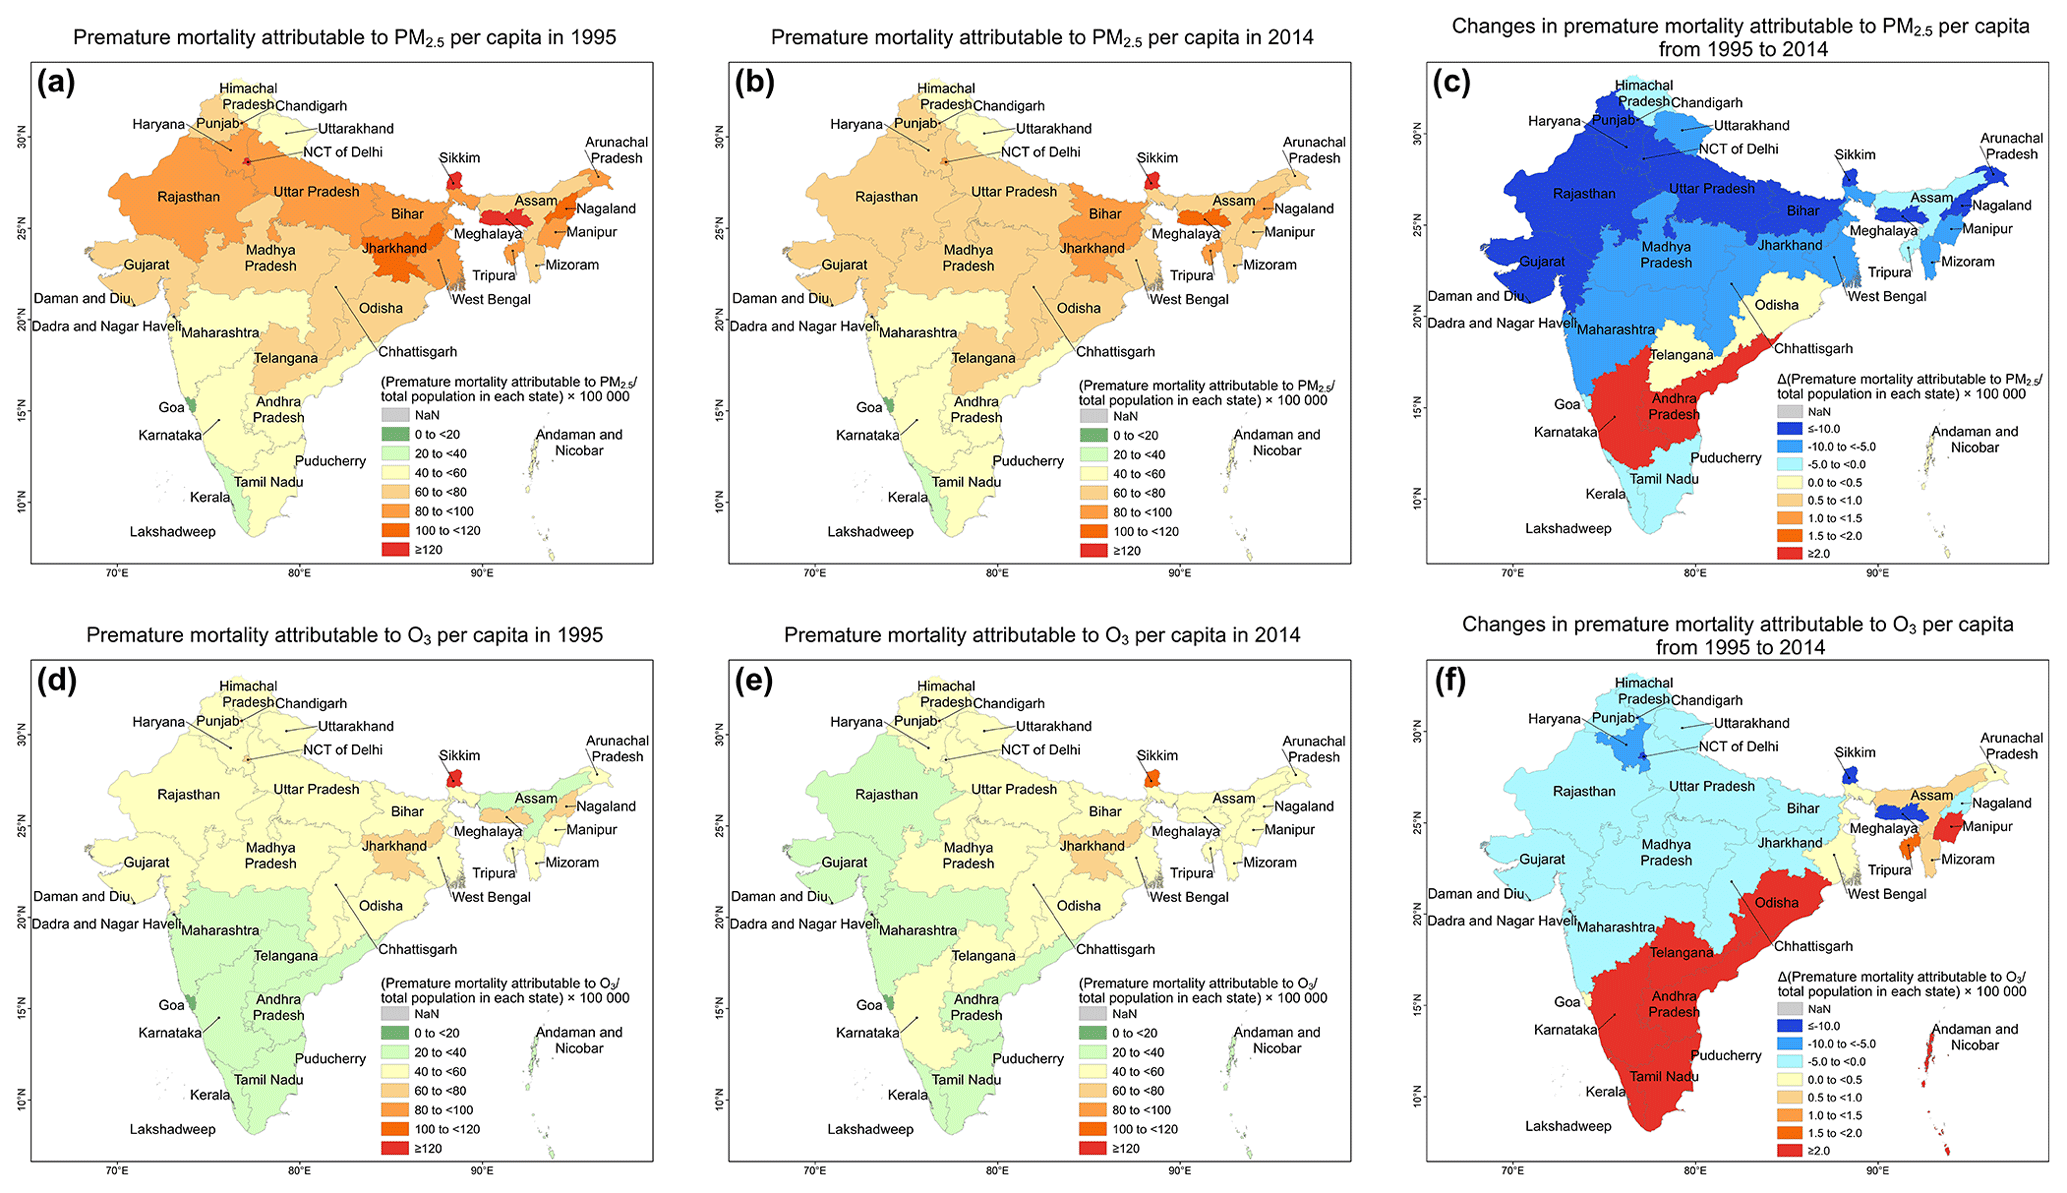
Figure 8Spatial distributions of premature mortality attributable to PM2.5 or O3 per capita (avoidable deaths per 100 000 people) (a, d) in 1995, (b, e) in 2014, and (c, f) the changes from 1995 to 2014 in the state of India.
To isolate the effects of population heterogeneity among regions, we also quantify the mortality burden changes per capita (avoidable deaths per 100 000 people) from 1995 to 2014 (Fig. 8). PM2.5-attributable premature mortality per capita was higher in the IGP and eastern India, with the highest value in Chandigarh (427.2), followed by Sikkim (153.6), Meghalaya (140.3), and the National Capital Territory (NCT) of Delhi (126.1) in 1995 (Fig. S13). The spatial distribution of O3-attributable premature mortality per capita resembled that of PM2.5. However, values were relatively lower, with the maximum value also appearing in Chandigarh (288.0), followed by Sikkim (120.2), Meghalaya (68.6), and the NCT of Delhi (68.0) in 1995 (Fig. S13). Over the period from 1995 to 2014, PM2.5- and O3-attributable premature mortality per capita decreased in the north and increased in the south (Fig. 8), indicating that the increasing trend in premature mortality attributable to PM2.5 and O3 in the IGP region was mainly driven by population growth (Fig. S8).
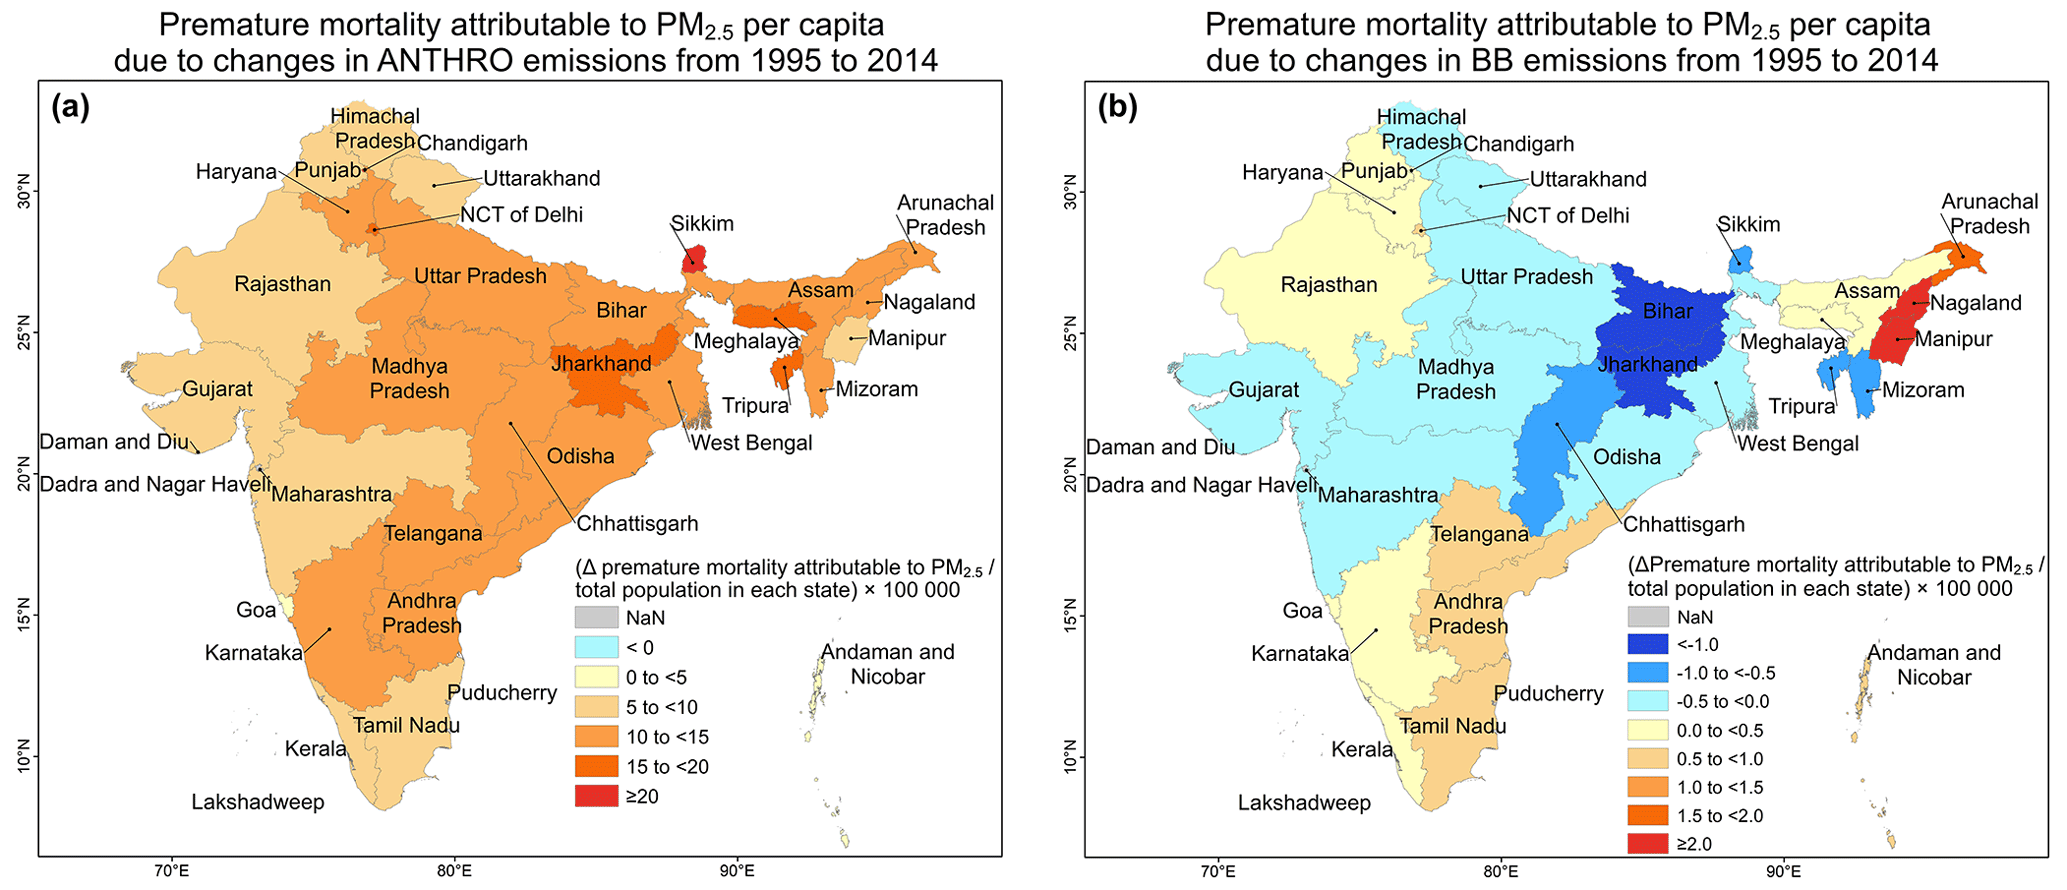
Figure 9Spatial distributions of contributions to premature mortality attributable to PM2.5 per capita (avoidable deaths per 100 000 people) from changes in (a) ANTHRO and (b) BB emissions from 1995 to 2014.
Figure 9 shows that changes in ANTHRO emissions from 1995 to 2014 increased the premature mortality per capita attributable to PM2.5, with higher values located mainly in the eastern IGP and central India. Changes in BB emissions increased premature mortality attributable to PM2.5 per capita in eastern, western, and southern India, whereas these changes decreased premature mortality attributable to PM2.5 per capita in the IGP and central India. The state with the largest increase was Manipur (2.55), followed by Nagaland (2.06), associated with the high incidence of wildfires in these regions. The state that experienced the largest decrease was Jharkhand (−1.71), followed by Bihar (−1.02). To explore contribution changes from ANTHRO and BB emissions, we estimate the premature mortality attributable to PM2.5 per capita in 2000, 2005, and 2010–2014 (Table S5), consistent with the demonstrations from GBD 2017. There was a sharp rise in contributions to premature mortality attributable to PM2.5 from changes in ANTHRO emissions from 1995 to 2014. Not surprisingly, the premature mortality attributable to PM2.5 from changes in BB emissions fluctuated greatly from 1995 to 2014. In 2000, a year with high BB emissions (Fig. S5), the contributions of changes in BB emissions to the premature mortality attributable to PM2.5 in the states of Mizoram, Nagaland, Arunachal Pradesh, and Tripura reached 5.14, 4.90, 4.86, and 4.17, respectively, exceeding the contributions of changes in ANTHRO emissions in that year (Table S5).
In this study, we apply a state-of-the-art global CTM (CAM-chem) to provide a detailed assessment of long-term trends in the ambient annual mean PM2.5 and O3 in India and their health burden from 1995 to 2014, as well as the driving factors of ANTHRO and BB emission changes. The annual mean area-weighted PM2.5 over India increased at 5.34 µg m−3 per decade (p < 0.01) from 1995 to 2014, dominated by ANTHRO emissions (5.46 µg m−3 per decade; p < 0.01). The highest and fastest PM2.5 growth was in the IGP region, due to rapid industrialization, urbanization, and transportation growth. For annual mean area-weighted O3, the increase was 2.60 ppbv per decade (p < 0.01), also dominated by ANTHRO emissions (2.71 ppbv per decade; p < 0.01). We find that O3 concentrations were highest in northern India, with the fastest growth occurring in northern, central, and eastern India. The contributions of BB emissions to the long-term trends were not significant for either PM2.5 (0.09 µg m−3 per decade; p < 0.30) or O3 (−0.01 ppbv per decade; p < 0.80) and showed significant seasonal variations due to large interannual variability features. However, when we examined the air quality changes in specific years, such as 1999 and 2014, when there was a higher amount of BB activity in India, we found that the contributions from BB emissions could be comparable to or even exceed those from ANTHRO emissions during DJF and MAM, reaching over 46.03 µg m−3 and 6.46 ppbv for PM2.5 and O3, respectively.
Further estimation of mortality burden shows a 27.93 % (698 291 to 893 325 deaths) increase in premature mortality attributable to PM2.5 between 1995 and 2014 (22.94 % for 2005–2014) and a 39.93 % (414 498 to 580 028 deaths) increase in premature mortality attributable to O3 (44.54 %, increasing during 2005–2014). Changes in ANTHRO and BB emissions were responsible for an enhancement of premature mortality attributable to PM2.5 by 88.78 % (97 830 deaths per decade; p < 0.01) and 0.02 % (2383 deaths per decade; p < 0.10). After removing the effect of population growth, our analysis reveals a notably higher mortality burden per capita attributable to PM2.5 in the IGP region. However, it was noteworthy that the mortality burden per capita in the IGP exhibited a significant decline over the period from 1995 to 2014, despite the increasing trend in premature mortality. This suggests that population growth was the primary factor driving the trend in premature mortality.
Our study is subject to several uncertainties and limitations. First of all, the coarser resolution (0.9° × 1.25°) in the global model frequently cannot realistically represent the complex physical and chemical processes of regional-scale air pollution, especially for O3 (Yue et al., 2023). Moreover, missing chemical mechanisms in the model, such as the lack of representation of nitrate and ammonium (Ren et al., 2024) and secondary organic aerosol (Liu et al., 2021), prevented the model from accurately simulating the PM2.5 concentration, especially for heavily polluted regions, such as China and India (Turnock et al., 2020). Another major uncertainty originated from the inaccurate emission inventory, especially for developing regions in early periods, as reported by global datasets (Paulot et al., 2018; Wang et al., 2022). Zhang et al. (2021b) revealed that models using the global CEDS inventory tend to predict a lower bias for surface PM2.5 and a higher bias for surface O3 compared with a regional emission inventory (MEIC) in China due to disparities in spatial allocation. Xie et al. (2024) also highlighted a significant underestimation of agricultural fires in the inventory. Moreover, the uncertainty in health functions, such as the choice of the exposure–response functions (Ostro et al., 2018; Giani et al., 2020) and the uncertainties in the baseline mortality rates, had different impacts on human health (Lelieveld et al., 2015; Pozzer et al., 2023). Meanwhile, when estimating the mortality burden, we applied an RR derived from a global study rather than using values specific to India, which could potentially be lower (Brown et al., 2022). Thus, our estimations of the air-pollution-related mortality burden could be to high. More epidemiology studies should be conducted in India to retrieve further RR values. Finally, another limitation in our experimental design was that we set global fixed emissions for ANTHRO and BB instead of using values for India only, thereby ignoring the impact of intercontinental transport.
The “pyMannKendall” package code is available at https://doi.org/10.5281/zenodo.7536429 (Shourov et al., 2023). The CESM2 model code is available at https://www.cesm.ucar.edu/models/cesm2/download (National Center for Atmospheric Research, 2025). Observation data are available at https://wustl.app.box.com/s/79pfex658crbq4dykxh51vvfdpksfhj5 (Atmospheric Composition Analysis Group, 2025).
The supplement related to this article is available online at https://doi.org/10.5194/acp-25-4767-2025-supplement.
BL analyzed the simulation results and wrote the manuscript. YZ and TT conceived the idea and designed and conducted the experiment. YZ, TT, HZ, JH, JM, WW, and LX revised the original paper. All authors contributed to the manuscript.
The contact author has declared that none of the authors has any competing interests.
Publisher's note: Copernicus Publications remains neutral with regard to jurisdictional claims made in the text, published maps, institutional affiliations, or any other geographical representation in this paper. While Copernicus Publications makes every effort to include appropriate place names, the final responsibility lies with the authors. Regarding the maps used in this paper, please note that Figs. 1, 3, 5, 6, 7, 8, and 9 contain disputed territories.
This work was supported by the National Natural Science Foundation of China (grant no. 42375172). The authors would like to acknowledge the Atmospheric Composition Analysis Group (ACAG) at Washington University in St. Louis (WUSTL) for providing open access to the satellite-derived PM2.5 data (https://sites.wustl.edu/acag/datasets/surface-pm2-5/, last access: 18 March 2024). We also acknowledge the high-performance computing resources (grant no. 2023-EL-PT-000184) from the National Key Scientific and Technological Infrastructure project “Earth System Numerical Simulation Facility” (EarthLab). This material is based upon work supported by the National Center for Atmospheric Research, which is a major facility sponsored by the NSF under cooperative agreement no. 1852977. We thank all of the scientists, software engineers, and administrators who contributed to the development of CESM2.
This research has been supported by the National Natural Science Foundation of China (grant no. 42375172).
This paper was edited by Manvendra Krishna Dubey and reviewed by two anonymous referees.
Agarwal, P., Stevenson, D. S., and Heal, M. R.: Evaluation of WRF-Chem-simulated meteorology and aerosols over northern India during the severe pollution episode of 2016, Atmos. Chem. Phys., 24, 2239–2266, https://doi.org/10.5194/acp-24-2239-2024, 2024.
Atmospheric Composition Analysis Group: PM25_Database, Atmospheric Composition Analysis Group at Washington University in St. Louis [data set], https://wustl.app.box.com/s/79pfex658crbq4dykxh51vvfdpksfhj5, last access: 12 April 2025.
Bran, S. H. and Srivastava, R.: Investigation of PM2.5 mass concentration over India using a regional climate model, Environ. Pollut., 224, 484–493, https://doi.org/10.1016/j.envpol.2017.02.030, 2017.
Brown, P. E., Izawa, Y., Balakrishnan, K., Fu, S. H., Chakma, J., Menon, G., Dikshit, R., Dhaliwal, R. S., Rodriguez, P. S., Huang, G., Begum, R., Hu, H., D'Souza, G., Guleria, R., and Jha, P.: Mortality Associated with Ambient PM2.5 Exposure in India: Results from the Million Death Study, Environ. Health Persp., 130, 097004, https://doi.org/10.1289/EHP9538, 2022.
Burnett, R. T., Pope, C. A., Ezzati, M., Olives, C., Lim, S. S., Mehta, S., Shin, H. H., Singh, G., Hubbell, B., Brauer, M., Anderson, H. R., Smith, K. R., Balmes, J. R., Bruce, N. G., Kan, H., Laden, F., Prüss-Ustün, A., Turner, M. C., Gapstur, S. M., Diver, W. R., and Cohen, A.: An Integrated Risk Function for Estimating the Global Burden of Disease Attributable to Ambient Fine Particulate Matter Exposure, Environ. Health Persp., 122, 397–403, https://doi.org/10.1289/ehp.1307049, 2014.
Carvalho, A., Monteiro, A., Flannigan, M., Solman, S., Miranda, A. I., and Borrego, C.: Forest fires in a changing climate and their impacts on air quality, Atmos. Environ., 45, 5545–5553, https://doi.org/10.1016/j.atmosenv.2011.05.010, 2011.
Christiansen, A. E., Carlton, A. G., and Porter, W. C.: Changing Nature of Organic Carbon over the United States, Environ. Sci. Technol., 54, 10524–10532, https://doi.org/10.1021/acs.est.0c02225, 2020.
Conibear, L., Butt, E. W., Knote, C., Spracklen, D. V., and Arnold, S. R.: Current and Future Disease Burden From Ambient Ozone Exposure in India, GeoHealth, 2, 334–355, https://doi.org/10.1029/2018GH000168, 2018a.
Conibear, L., Butt, E. W., Knote, C., Arnold, S. R., and Spracklen, D. V.: Residential energy use emissions dominate health impacts from exposure to ambient particulate matter in India, Nat. Commun., 9, 617, https://doi.org/10.1038/s41467-018-02986-7, 2018b.
Crutzen, P. J. and Andreae, M. O.: Biomass Burning in the Tropics: Impact on Atmospheric Chemistry and Biogeochemical Cycles, Science, 250, 1669–1678, https://doi.org/10.1126/science.250.4988.1669, 1990.
Danabasoglu, G., Lamarque, J.-F., Bacmeister, J., Bailey, D. A., DuVivier, A. K., Edwards, J., Emmons, L. K., Fasullo, J., Garcia, R., Gettelman, A., Hannay, C., Holland, M. M., Large, W. G., Lauritzen, P. H., Lawrence, D. M., Lenaerts, J. T. M., Lindsay, K., Lipscomb, W. H., Mills, M. J., Neale, R., Oleson, K. W., Otto-Bliesner, B., Phillips, A. S., Sacks, W., Tilmes, S., van Kampenhout, L., Vertenstein, M., Bertini, A., Dennis, J., Deser, C., Fischer, C., Fox-Kemper, B., Kay, J. E., Kinnison, D., Kushner, P. J., Larson, V. E., Long, M. C., Mickelson, S., Moore, J. K., Nienhouse, E., Polvani, L., Rasch, P. J., and Strand, W. G.: The Community Earth System Model Version 2 (CESM2), J. Adv. Model. Earth Sy., 12, e2019MS001916, https://doi.org/10.1029/2019MS001916, 2020.
David, L. M., Ravishankara, A. R., Kodros, J. K., Venkataraman, C., Sadavarte, P., Pierce, J. R., Chaliyakunnel, S., and Millet, D. B.: Aerosol Optical Depth Over India, J. Geophys. Res.-Atmos., 123, 3688–3703, https://doi.org/10.1002/2017JD027719, 2018.
Dedoussi, I. C., Eastham, S. D., Monier, E., and Barrett, S. R. H.: Premature mortality related to United States cross-state air pollution, Nature, 578, 261–265, https://doi.org/10.1038/s41586-020-1983-8, 2020.
Doherty, R. M., Wild, O., Shindell, D. T., Zeng, G., MacKenzie, I. A., Collins, W. J., Fiore, A. M., Stevenson, D. S., Dentener, F. J., Schultz, M. G., Hess, P., Derwent, R. G., and Keating, T. J.: Impacts of climate change on surface ozone and intercontinental ozone pollution: A multi-model study, J. Geophys. Res.-Atmos., 118, 3744–3763, https://doi.org/10.1002/jgrd.50266, 2013.
Emmons, L. K., Schwantes, R. H., Orlando, J. J., Tyndall, G., Kinnison, D., Lamarque, J.-F., Marsh, D., Mills, M. J., Tilmes, S., Bardeen, C., Buchholz, R. R., Conley, A., Gettelman, A., Garcia, R., Simpson, I., Blake, D. R., Meinardi, S., and Pétron, G.: The Chemistry Mechanism in the Community Earth System Model Version 2 (CESM2), J. Adv. Model. Earth Sy., 12, e2019MS001882, https://doi.org/10.1029/2019MS001882, 2020.
Fuller, R., Landrigan, P. J., Balakrishnan, K., Bathan, G., Bose-O'Reilly, S., Brauer, M., Caravanos, J., Chiles, T., Cohen, A., Corra, L., Cropper, M., Ferraro, G., Hanna, J., Hanrahan, D., Hu, H., Hunter, D., Janata, G., Kupka, R., Lanphear, B., Lichtveld, M., Martin, K., Mustapha, A., Sanchez-Triana, E., Sandilya, K., Schaefli, L., Shaw, J., Seddon, J., Suk, W., Téllez-Rojo, M. M., and Yan, C.: Pollution and health: a progress update, Lancet Planetary Health, 6, e535–e547, https://doi.org/10.1016/S2542-5196(22)00090-0, 2022.
Gao, M., Beig, G., Song, S., Zhang, H., Hu, J., Ying, Q., Liang, F., Liu, Y., Wang, H., Lu, X., Zhu, T., Carmichael, G. R., Nielsen, C. P., and McElroy, M. B.: The impact of power generation emissions on ambient PM2.5 pollution and human health in China and India, Environ. Int., 121, 250–259, https://doi.org/10.1016/j.envint.2018.09.015, 2018.
Gao, M., Gao, J., Zhu, B., Kumar, R., Lu, X., Song, S., Zhang, Y., Jia, B., Wang, P., Beig, G., Hu, J., Ying, Q., Zhang, H., Sherman, P., and McElroy, M. B.: Ozone pollution over China and India: seasonality and sources, Atmos. Chem. Phys., 20, 4399–4414, https://doi.org/10.5194/acp-20-4399-2020, 2020.
GBD 2015 Risk Factors Collaborators: Global, regional, and national comparative risk assessment of 79 behavioural, environmental and occupational, and metabolic risks or clusters of risks, 1990–2015: a systematic analysis for the Global Burden of Disease Study 2015, Lancet, 388, 1659–1724, https://doi.org/10.1016/S0140-6736(16)31679-8, 2016.
GBD 2017 Risk Factor Collaborators: Global, regional, and national comparative risk assessment of 84 behavioural, environmental and occupational, and metabolic risks or clusters of risks for 195 countries and territories, 1990–2017: a systematic analysis for the Global Burden of Disease Study 2017, Lancet, 392, 1923–1994, https://doi.org/10.1016/S0140-6736(18)32225-6, 2018.
GBD 2019 Risk Factors Collaborators: Global burden of 87 risk factors in 204 countries and territories, 1990–2019: a systematic analysis for the Global Burden of Disease Study 2019, Lancet, 396, 1223–1249, https://doi.org/10.1016/S0140-6736(20)30752-2, 2020.
Giani, P., Castruccio, S., Anav, A., Howard, D., Hu, W., and Crippa, P.: Short-term and long-term health impacts of air pollution reductions from COVID-19 lockdowns in China and Europe: a modelling study, Lancet Planetary Health, 4, e474–e482, https://doi.org/10.1016/S2542-5196(20)30224-2, 2020.
Gurjar, B. R., Ravindra, K., and Nagpure, A. S.: Air pollution trends over Indian megacities and their local-to-global implications, Atmos. Environ., 142, 475–495, https://doi.org/10.1016/j.atmosenv.2016.06.030, 2016.
Guttikunda, S. and Ka, N.: Evolution of India's PM2.5 pollution between 1998 and 2020 using global reanalysis fields coupled with satellite observations and fuel consumption patterns, Environ. Sci.-Atmos., 2, 1502–1515, https://doi.org/10.1039/D2EA00027J, 2022.
Hoek, G., Krishnan, R. M., Beelen, R., Peters, A., Ostro, B., Brunekreef, B., and Kaufman, J. D.: Long-term air pollution exposure and cardio- respiratory mortality: a review, Environ. Health, 12, 43, https://doi.org/10.1186/1476-069X-12-43, 2013.
Hoesly, R. M., Smith, S. J., Feng, L., Klimont, Z., Janssens-Maenhout, G., Pitkanen, T., Seibert, J. J., Vu, L., Andres, R. J., Bolt, R. M., Bond, T. C., Dawidowski, L., Kholod, N., Kurokawa, J.-I., Li, M., Liu, L., Lu, Z., Moura, M. C. P., O'Rourke, P. R., and Zhang, Q.: Historical (1750–2014) anthropogenic emissions of reactive gases and aerosols from the Community Emissions Data System (CEDS), Geosci. Model Dev., 11, 369–408, https://doi.org/10.5194/gmd-11-369-2018, 2018.
Hou, X., Wild, O., Zhu, B., and Lee, J.: Future tropospheric ozone budget and distribution over east Asia under a net-zero scenario, Atmos. Chem. Phys., 23, 15395–15411, https://doi.org/10.5194/acp-23-15395-2023, 2023.
Huang, T., Ma, J., Song, S., Ling, Z., Macdonald, R. W., Gao, H., Tao, S., Shen, H., Zhao, Y., Liu, X., Tian, C., Li, Y., Jia, H., Lian, L., and Mao, X.: Health and environmental consequences of crop residue burning correlated with increasing crop yields midst India's Green Revolution, npj Clim. Atmos. Sci., 5, 1–9, https://doi.org/10.1038/s41612-022-00306-x, 2022.
Hystad, P., Demers, P. A., Johnson, K. C., Carpiano, R. M., and Brauer, M.: Long-term Residential Exposure to Air Pollution and Lung Cancer Risk, Epidemiology, 24, 762, https://doi.org/10.1097/EDE.0b013e3182949ae7, 2013.
India State-Level Disease Burden Initiative Air Pollution Collaborators: Health and economic impact of air pollution in the states of India: the Global Burden of Disease Study 2019, Lancet Planetary Health, 5, e25–e38, https://doi.org/10.1016/S2542-5196(20)30298-9, 2021.
Jacob, D. J. and Winner, D. A.: Effect of climate change on air quality, Atmos. Environ., 43, 51–63, https://doi.org/10.1016/j.atmosenv.2008.09.051, 2009.
Jain, M., Saxena, P., Sharma, S., and Sonwani, S.: Investigation of Forest Fire Activity Changes Over the Central India Domain Using Satellite Observations During 2001–2020, GeoHealth, 5, e2021GH000528, https://doi.org/10.1029/2021GH000528, 2021.
Jena, C., Ghude, S. D., Pfister, G. G., Chate, D. M., Kumar, R., Beig, G., Surendran, D. E., Fadnavis, S., and Lal, D. M.: Influence of springtime biomass burning in South Asia on regional ozone (O3): A model based case study, Atmos. Environ., 100, 37–47, https://doi.org/10.1016/j.atmosenv.2014.10.027, 2015.
Jia, B., Gao, M., Zhang, X., Xiao, X., Zhang, S., and Lam Yung, K. K.: Rapid increase in mortality attributable to PM2.5 exposure in India over 1998–2015, Chemosphere, 269, 128715, https://doi.org/10.1016/j.chemosphere.2020.128715, 2021.
Karambelas, A., Holloway, T., Kinney, P. L., Fiore, A. M., DeFries, R., Kiesewetter, G., and Heyes, C.: Urban versus rural health impacts attributable to PM2.5 and O3 in northern India, Environ. Res. Lett., 13, 064010, https://doi.org/10.1088/1748-9326/aac24d, 2018.
Kumar, R., Naja, M., Pfister, G. G., Barth, M. C., Wiedinmyer, C., and Brasseur, G. P.: Simulations over South Asia using the Weather Research and Forecasting model with Chemistry (WRF-Chem): chemistry evaluation and initial results, Geosci. Model Dev., 5, 619–648, https://doi.org/10.5194/gmd-5-619-2012, 2012.
Lan, R., Eastham, S. D., Liu, T., Norford, L. K., and Barrett, S. R. H.: Air quality impacts of crop residue burning in India and mitigation alternatives, Nat Commun, 13, 6537, https://doi.org/10.1038/s41467-022-34093-z, 2022.
Latha, K. M. and Badarinath, K.: Seasonal variations of PM 10 and PM 2.5 particles loading over tropical urban environment, Int. J. Environ. Heal. R., 15, 63–68, https://doi.org/10.1080/09603120400018964, 2005.
Lelieveld, J., Evans, J. S., Fnais, M., Giannadaki, D., and Pozzer, A.: The contribution of outdoor air pollution sources to premature mortality on a global scale, Nature, 525, 367–371, https://doi.org/10.1038/nature15371, 2015.
Liu, Y., Dong, X., Wang, M., Emmons, L. K., Liu, Y., Liang, Y., Li, X., and Shrivastava, M.: Analysis of secondary organic aerosol simulation bias in the Community Earth System Model (CESM2.1), Atmos. Chem. Phys., 21, 8003–8021, https://doi.org/10.5194/acp-21-8003-2021, 2021.
Lu, X., Zhang, L., Liu, X., Gao, M., Zhao, Y., and Shao, J.: Lower tropospheric ozone over India and its linkage to the South Asian monsoon, Atmos. Chem. Phys., 18, 3101–3118, https://doi.org/10.5194/acp-18-3101-2018, 2018.
McDuffie, E. E., Smith, S. J., O'Rourke, P., Tibrewal, K., Venkataraman, C., Marais, E. A., Zheng, B., Crippa, M., Brauer, M., and Martin, R. V.: A global anthropogenic emission inventory of atmospheric pollutants from sector- and fuel-specific sources (1970–2017): an application of the Community Emissions Data System (CEDS), Earth Syst. Sci. Data, 12, 3413–3442, https://doi.org/10.5194/essd-12-3413-2020, 2020.
Miranda, A. I., Ferreira, J., Valente, J., Santos, P., Amorim, J. H., and Borrego, C.: Smoke measurements during Gestosa-2002 experimental field fires, Int. J. Wildland Fire, 14, 107, https://doi.org/10.1071/WF04069, 2005.
Munir, S., Habeebullah, T. M., Seroji, A. R., Gabr, S. S., Mohammed, A. M. F., and Morsy, E. A.: Quantifying temporal trends of atmospheric pollutants in Makkah (1997–2012), Atmos. Environ., 77, 647–655, https://doi.org/10.1016/j.atmosenv.2013.05.075, 2013.
National Center for Atmospheric Research: Community Earth System Model 2 (CESM2) Downloading Instructions, National Center for Atmospheric Research [code], https://www.cesm.ucar.edu/models/cesm2/download, last access: 12 April 2025.
Ostro, B., Spadaro, J. V., Gumy, S., Mudu, P., Awe, Y., Forastiere, F., and Peters, A.: Assessing the recent estimates of the global burden of disease for ambient air pollution: Methodological changes and implications for low- and middle-income countries, Environ. Res., 166, 713–725, https://doi.org/10.1016/j.envres.2018.03.001, 2018.
Pandey, A., Sadavarte, P., Rao, A. B., and Venkataraman, C.: Trends in multi-pollutant emissions from a technology-linked inventory for India: II. Residential, agricultural and informal industry sectors, Atmos. Environ., 99, 341–352, https://doi.org/10.1016/j.atmosenv.2014.09.080, 2014.
Panwar, T. S., Hooda, R. K., Lihavainen, H., Hyvarinen, A. P., Sharma, V. P., and Viisanen, Y.: Atmospheric aerosols at a regional background Himalayan site—Mukteshwar, India, Environ. Monit. Assess., 185, 4753–4764, https://doi.org/10.1007/s10661-012-2902-8, 2013.
Paulot, F., Paynter, D., Ginoux, P., Naik, V., and Horowitz, L. W.: Changes in the aerosol direct radiative forcing from 2001 to 2015: observational constraints and regional mechanisms, Atmos. Chem. Phys., 18, 13265–13281, https://doi.org/10.5194/acp-18-13265-2018, 2018.
Pozzer, A., Anenberg, S. C., Dey, S., Haines, A., Lelieveld, J., and Chowdhury, S.: Mortality Attributable to Ambient Air Pollution: A Review of Global Estimates, GeoHealth, 7, e2022GH000711, https://doi.org/10.1029/2022GH000711, 2023.
Pusede, S. E., Steiner, A. L., and Cohen, R. C.: Temperature and Recent Trends in the Chemistry of Continental Surface Ozone, Chem. Rev., 115, 3898–3918, https://doi.org/10.1021/cr5006815, 2015.
Reddy, B. S. K., Kumar, K. R., Balakrishnaiah, G., Gopal, K. R., Reddy, R. R., Reddy, L. S. S., Ahammed, Y. N., Narasimhulu, K., Moorthy, K. K., and Babu, S. S.: Potential Source Regions Contributing to Seasonal Variations of Black Carbon Aerosols over Anantapur in Southeast India, Aerosol Air Qual. Res., 12, 344–358, https://doi.org/10.4209/aaqr.2011.10.0159, 2012.
Ren, F., Lin, J., Xu, C., Adeniran, J. A., Wang, J., Martin, R. V., van Donkelaar, A., Hammer, M. S., Horowitz, L. W., Turnock, S. T., Oshima, N., Zhang, J., Bauer, S., Tsigaridis, K., Seland, Ø., Nabat, P., Neubauer, D., Strand, G., van Noije, T., Le Sager, P., and Takemura, T.: Evaluation of CMIP6 model simulations of PM2.5 and its components over China, Geosci. Model Dev., 17, 4821–4836, https://doi.org/10.5194/gmd-17-4821-2024, 2024.
Sadavarte, P. and Venkataraman, C.: Trends in multi-pollutant emissions from a technology-linked inventory for India: I. Industry and transport sectors, Atmos. Environ., 99, 353–364, https://doi.org/10.1016/j.atmosenv.2014.09.081, 2014.
Sahu, L. K., Sheel, V., Pandey, K., Yadav, R., Saxena, P., and Gunthe, S.: Regional biomass burning trends in India: Analysis of satellite fire data, J. Earth Syst. Sci., 124, 1377–1387, https://doi.org/10.1007/s12040-015-0616-3, 2015.
Saradhi, I. V., Prathibha, P., Hopke, P. K., Pandit, G. G., and Puranik, V. D.: Source Apportionment of Coarse and Fine Particulate Matter at Navi Mumbai, India, Aerosol Air Qual. Res., 8, 423–436, https://doi.org/10.4209/aaqr.2008.07.0027, 2008.
Sarkar, C., Roy, A., Chatterjee, A., Ghosh, S. K., and Raha, S.: Factors controlling the long-term (2009–2015) trend of PM2.5 and black carbon aerosols at eastern Himalaya, India, Sci. Total Environ., 656, 280–296, https://doi.org/10.1016/j.scitotenv.2018.11.367, 2019.
Sen, P. K.: Estimates of the Regression Coefficient Based on Kendall's Tau, J. Am. Stat. Assoc., 63, 1379–1389, https://doi.org/10.1080/01621459.1968.10480934, 1968.
Shourov, M. M. H., Mahmud, I., Niemeyer, K., and NonStopAggroPop: mmhs013/pyMannKendall: v1.4.3, Zenodo [code], https://doi.org/10.5281/zenodo.7536429, 2023.
Theil, H.: A Rank-Invariant Method of Linear and Polynomial Regression Analysis, in: Henri Theil's Contributions to Economics and Econometrics, vol. 23, edited by: Raj, B. and Koerts, J., Springer Netherlands, Dordrecht, 345–381, https://doi.org/10.1007/978-94-011-2546-8_20, 1992.
Tilmes, S., Lamarque, J.-F., Emmons, L. K., Kinnison, D. E., Ma, P.-L., Liu, X., Ghan, S., Bardeen, C., Arnold, S., Deeter, M., Vitt, F., Ryerson, T., Elkins, J. W., Moore, F., Spackman, J. R., and Val Martin, M.: Description and evaluation of tropospheric chemistry and aerosols in the Community Earth System Model (CESM1.2), Geosci. Model Dev., 8, 1395–1426, https://doi.org/10.5194/gmd-8-1395-2015, 2015.
Tiwari, S., Srivastava, A. K., Bisht, D. S., Bano, T., Singh, S., Behura, S., Srivastava, M. K., Chate, D. M., and Padmanabhamurty, B.: Black carbon and chemical characteristics of PM10 and PM2.5 at an urban site of North India, J. Atmos. Chem., 62, 193–209, https://doi.org/10.1007/s10874-010-9148-z, 2009.
Tiwari, S., Srivastava, A. K., Bisht, D. S., Parmita, P., Srivastava, M. K., and Attri, S. D.: Diurnal and seasonal variations of black carbon and PM2.5 over New Delhi, India: Influence of meteorology, Atmos. Res., 125–126, 50–62, https://doi.org/10.1016/j.atmosres.2013.01.011, 2013.
Turner, M. C., Jerrett, M., Pope, C. A., Krewski, D., Gapstur, S. M., Diver, W. R., Beckerman, B. S., Marshall, J. D., Su, J., Crouse, D. L., and Burnett, R. T.: Long-Term Ozone Exposure and Mortality in a Large Prospective Study, Am. J. Respir. Crit. Care Med., 193, 1134–1142, https://doi.org/10.1164/rccm.201508-1633OC, 2016.
Turnock, S. T., Allen, R. J., Andrews, M., Bauer, S. E., Deushi, M., Emmons, L., Good, P., Horowitz, L., John, J. G., Michou, M., Nabat, P., Naik, V., Neubauer, D., O'Connor, F. M., Olivié, D., Oshima, N., Schulz, M., Sellar, A., Shim, S., Takemura, T., Tilmes, S., Tsigaridis, K., Wu, T., and Zhang, J.: Historical and future changes in air pollutants from CMIP6 models, Atmos. Chem. Phys., 20, 14547–14579, https://doi.org/10.5194/acp-20-14547-2020, 2020.
Vadrevu, K. P., Lasko, K., Giglio, L., Schroeder, W., Biswas, S., and Justice, C.: Trends in Vegetation fires in South and Southeast Asian Countries, Sci. Rep., 9, 7422, https://doi.org/10.1038/s41598-019-43940-x, 2019.
van Donkelaar, A., Hammer, M. S., Bindle, L., Brauer, M., Brook, J. R., Garay, M. J., Hsu, N. C., Kalashnikova, O. V., Kahn, R. A., Lee, C., Levy, R. C., Lyapustin, A., Sayer, A. M., and Martin, R. V.: Monthly Global Estimates of Fine Particulate Matter and Their Uncertainty, Environ. Sci. Technol., 55, 15287–15300, https://doi.org/10.1021/acs.est.1c05309, 2021.
Vanem, E. and Walker, S.-E.: Identifying trends in the ocean wave climate by time series analyses of significant wave heightdata, Ocean Eng., 61, 148–160, https://doi.org/10.1016/j.oceaneng.2012.12.042, 2013.
van Marle, M. J. E., Kloster, S., Magi, B. I., Marlon, J. R., Daniau, A.-L., Field, R. D., Arneth, A., Forrest, M., Hantson, S., Kehrwald, N. M., Knorr, W., Lasslop, G., Li, F., Mangeon, S., Yue, C., Kaiser, J. W., and van der Werf, G. R.: Historic global biomass burning emissions for CMIP6 (BB4CMIP) based on merging satellite observations with proxies and fire models (1750–2015), Geosci. Model Dev., 10, 3329–3357, https://doi.org/10.5194/gmd-10-3329-2017, 2017.
Venkatramanan, V., Shah, S., Rai, A. K., and Prasad, R.: Nexus Between Crop Residue Burning, Bioeconomy and Sustainable Development Goals Over North-Western India, Frontiers in Energy Research, 8, 614212, https://doi.org/10.3389/fenrg.2020.614212, 2021.
Villeneuve, P. J., Weichenthal, S. A., Crouse, D., Miller, A. B., To, T., Martin, R. V., van Donkelaar, A., Wall, C., and Burnett, R. T.: Long-term Exposure to Fine Particulate Matter Air Pollution and Mortality Among Canadian Women, Epidemiology, 26, 536, https://doi.org/10.1097/EDE.0000000000000294, 2015.
Vohra, K., Marais, E. A., Bloss, W. J., Schwartz, J., Mickley, L. J., Van Damme, M., Clarisse, L., and Coheur, P.-F.: Rapid rise in premature mortality due to anthropogenic air pollution in fast-growing tropical cities from 2005 to 2018, Sci. Adv., 8, eabm4435, https://doi.org/10.1126/sciadv.abm4435, 2022.
Wan, L., Bento, V. A., Qu, Y., Qiu, J., Song, H., Zhang, R., Wu, X., Xu, F., Lu, J., and Wang, Q.: Drought characteristics and dominant factors across China: Insights from high-resolution daily SPEI dataset between 1979 and 2018, Sci. Total Environ., 901, 166362, https://doi.org/10.1016/j.scitotenv.2023.166362, 2023.
Wang, H., Lu, X., Jacob, D. J., Cooper, O. R., Chang, K.-L., Li, K., Gao, M., Liu, Y., Sheng, B., Wu, K., Wu, T., Zhang, J., Sauvage, B., Nédélec, P., Blot, R., and Fan, S.: Global tropospheric ozone trends, attributions, and radiative impacts in 1995–2017: an integrated analysis using aircraft (IAGOS) observations, ozonesonde, and multi-decadal chemical model simulations, Atmos. Chem. Phys., 22, 13753–13782, https://doi.org/10.5194/acp-22-13753-2022, 2022.
Wang, L., Zhang, X., and Ming, J.: Aerosol Optical Properties Measured Using a PAX in Central Asia from 2016 to 2019 and the Climatic and Environmental Outlooks, ACS Earth Space Chem., 5, 95–105, https://doi.org/10.1021/acsearthspacechem.0c00306, 2021.
Xie, X., Zhang, Y., Liang, R., Chen, W., Zhang, P., Wang, X., Zhou, Y., Cheng, Y., and Liu, J.: Wintertime Heavy Haze Episodes in Northeast China Driven by Agricultural Fire Emissions, Environ. Sci. Technol. Lett., 11, 150–157, https://doi.org/10.1021/acs.estlett.3c00940, 2024.
Young, P. J., Naik, V., Fiore, A. M., Gaudel, A., Guo, J., Lin, M. Y., Neu, J. L., Parrish, D. D., Rieder, H. E., Schnell, J. L., Tilmes, S., Wild, O., Zhang, L., Ziemke, J., Brandt, J., Delcloo, A., Doherty, R. M., Geels, C., Hegglin, M. I., Hu, L., Im, U., Kumar, R., Luhar, A., Murray, L., Plummer, D., Rodriguez, J., Saiz-Lopez, A., Schultz, M. G., Woodhouse, M. T., and Zeng, G.: Tropospheric Ozone Assessment Report: Assessment of global-scale model performance for global and regional ozone distributions, variability, and trends, Elem. Sci. Anth., 6, 10, https://doi.org/10.1525/elementa.265, 2018.
Yue, M., Dong, X., Wang, M., Emmons, L. K., Liang, Y., Tong, D., Liu, Y., and Liu, Y.: Modeling the Air Pollution and Aerosol-PBL Interactions Over China Using a Variable-Resolution Global Model, J. Geophys. Res.-Atmos., 128, e2023JD039130, https://doi.org/10.1029/2023JD039130, 2023.
Zhang, R., Wu, X., Zhou, X., Ren, B., Zeng, J., and Wang, Q.: Investigating the effect of improved drought events extraction method on spatiotemporal characteristics of drought, Theor. Appl. Climatol., 147, 395–408, https://doi.org/10.1007/s00704-021-03838-z, 2022a.
Zhang, R., Qi, J., Leng, S., and Wang, Q.: Long-Term Vegetation Phenology Changes and Responses to Preseason Temperature and Precipitation in Northern China, Remote Sens., 14, 1396, https://doi.org/10.3390/rs14061396, 2022b.
Zhang, Y., Cooper, O. R., Gaudel, A., Thompson, A. M., Nédélec, P., Ogino, S.-Y., and West, J. J.: Tropospheric ozone change from 1980 to 2010 dominated by equatorward redistribution of emissions, Nat. Geosci., 9, 875–879, https://doi.org/10.1038/ngeo2827, 2016.
Zhang, Y., West, J. J., Emmons, L. K., Flemming, J., Jonson, J. E., Lund, M. T., Sekiya, T., Sudo, K., Gaudel, A., Chang, K.-L., Nédélec, P., and Thouret, V.: Contributions of World Regions to the Global Tropospheric Ozone Burden Change From 1980 to 2010, Geophys. Res. Lett., 48, e2020GL089184, https://doi.org/10.1029/2020GL089184, 2021a.
Zhang, Y., Shindell, D., Seltzer, K., Shen, L., Lamarque, J.-F., Zhang, Q., Zheng, B., Xing, J., Jiang, Z., and Zhang, L.: Impacts of emission changes in China from 2010 to 2017 on domestic and intercontinental air quality and health effect, Atmos. Chem. Phys., 21, 16051–16065, https://doi.org/10.5194/acp-21-16051-2021, 2021b.
Zhou, H., Zhou, C., Lynam, M. M., Dvonch, J. T., Barres, J. A., Hopke, P. K., Cohen, M., and Holsen, T. M.: Atmospheric Mercury Temporal Trends in the Northeastern United States from 1992 to 2014: Are Measured Concentrations Responding to Decreasing Regional Emissions?, Environ. Sci. Technol. Lett., 4, 91–97, https://doi.org/10.1021/acs.estlett.6b00452, 2017.