the Creative Commons Attribution 4.0 License.
the Creative Commons Attribution 4.0 License.
 | 15 Apr 2025
Local and transboundary contributions to NOy loadings across East Asia using CMAQ-ISAM and a GEMS-informed emission inventory during the winter–spring transition
Jincheol Park
Sagun Kayastha
We investigated source contributions of nitrogen oxides (NOx) emissions to reactive nitrogen species (NOy) loadings across East Asia during the 2022 winter–spring transition. Using the Community Multiscale Air Quality (CMAQ) model and its Integrated Source Apportionment Method (ISAM), we conducted air quality simulations, leveraging top-down estimates of NOx emissions adjusted by the Geostationary Environment Monitoring Spectrometer (GEMS) tropospheric nitrogen dioxide (NO2) columns. After the Bayesian inversion, the inventoried NOx emissions increased by 50 % in South Korea and 33 % in China compared to the a priori estimates, which substantially reduced the model's prior underestimation of surface NO2 concentrations from −32.75 % to −13.01 % in South Korea and from −10.26 % to −3.04 % in China. We compared local and transboundary contributions of NOx emissions to NOy concentrations across East Asia. Local contributions showed a declining trend, from 32 %–43 % in January to 23 %–30 % by May, while transboundary contributions consistently increased from 16 %–33 % in January to 27 %–37 % by May. North China consistently contributed over 10 % to East Asia's NOy loadings. East China and South Central China were significant contributors to each other's NOy budget by 9 %–12 %. South Central China transboundary contributions consistently outweighed local contributions by 5 %, indicating vulnerability to pollution transport. South Korea, initially the least influential, contributed 1 %–4 % to transboundary NOy concentrations in January. This increased to 6 %–7 % by May, becoming comparable to other regions' contributions. These behaviors of NOy were driven by distinct synoptic settings, where strong wintertime northwesterly winds directed pollutants southeastward, while their weakening in spring led to more multidirectional transport patterns, allowing pollutants to spread more broadly across the regions.
- Article
(10160 KB) - Full-text XML
-
Supplement
(1429 KB) - BibTeX
- EndNote


Nitrogen oxides (NOx) emissions have long been a significant concern in East Asia due to their detrimental impact on air quality and public health, particularly in densely populated urban areas (Hoek et al., 2013; Newell et al., 2018). NOx is also a major precursor of secondary aerosols, contributing to the formation of fine particulate matter (PM2.5), exacerbating airborne health risks. NOx has a relatively short atmospheric lifetime, typically ranging from a few hours (Beirle et al., 2011; Lin et al., 2012; Liu et al., 2016; Lange et al., 2022) to several days (Tang et al., 2023; Goldberg et al., 2024), depending on meteorological conditions and chemical regimes in the region. Despite this, NOx plays a significant role in transboundary pollution. For instance, NOx emissions from China have been shown to substantially contribute to air quality in South Korea during transboundary transport episodes, driven by specific meteorological conditions and chemical regimes in the region. During its transport across the Yellow Sea, NOx undergoes chemical reactions, forming secondary aerosols and contributing to elevated particulate matter concentrations in South Korea (Nault et al., 2018; Eck et al., 2020; Jordan et al., 2020). Furthermore, NOx rapidly transforms into longer-lived reactive nitrogen species, collectively known as NOy, which can be transported across long distances. NOy species, such as nitric acid (HNO3), nitrous acid (HONO), and peroxyacetyl nitrate (PAN), play a significant role in redistributing nitrogen across extensive regions (Hertel et al., 2012). This extends the impact of NOx emissions beyond their sources, contributing to both local and transboundary air quality challenges.
The transport of air pollutants across Asia, which is particularly pronounced during the winter–spring transition, is largely determined by shifting synoptic systems that influence both the direction and extent of pollutant movement. In winter, the Siberian High dominates the region, maintaining cold, stable high-pressure systems that drive strong northerly and northwesterly winds (Hui, 2007; Kim et al., 2013; Wyrwoll et al., 2016; Dong et al., 2020). These winds typically result in southeastward and southward pollutant transport, carrying air pollutants from densely industrialized areas in northern China toward downwind regions such as other parts of China, South Korea, Southeast Asia, and Japan (Ikeda et al., 2015; Chen et al., 2021; Wu, 2021; Zhao et al., 2021; Kang et al., 2024). As winter progresses into spring, the Siberian High weakens, and while this leads to weaker northwesterly winds, the directionality of pollutant transport becomes more complex due to changes in synoptic patterns. Spring introduces slowly traveling high- and low-pressure systems along with shifting wind directions, leading to multidirectional movements of air pollutants across Asia (Peterson et al., 2019). This seasonal transition, along with enhanced vertical mixing from warmer air temperatures and weaker subsidence, allows pollutants to disperse more readily within the boundary layer, facilitating their transport across extended distances (Ryu and Min, 2024). This complexity makes it difficult to fully understand how region-specific pollutant emissions contribute to air quality across Asia, complicating efforts to develop effective air quality management strategies.
To better understand the transboundary behaviors of air pollutants, chemical transport models (CTMs) have been widely used. CTMs, such as the Community Multiscale Air Quality (CMAQ) model (Byun and Schere, 2006), translate emission inputs and underlying meteorology into three-dimensional representations of air pollutant loadings. This enables simulations of local and transboundary air pollution dynamics, providing insights into the origins and transport pathways of air pollutants. For example, Dong et al. (2020) conducted source apportionment of surface PM2.5 concentrations in the Beijing–Tianjin–Hebei region, northern China, using CMAQ and its Integrated Source Apportionment Method (CMAQ-ISAM). From 2014 to 2017, annual mean PM2.5 concentrations decreased by 33 %, with local emission reductions accounting for 47 %, intra-regional transport contributing 25 %, and transport from outside the region contributing 28 %. The contribution of regional transport increased by up to 40 % during spring and winter, driven by strong northwesterly winds. Bae et al. (2020) investigated the influence of NOx and sulfur dioxide (SO2) emissions from China on PM2.5 concentrations in the Seoul Metropolitan Area (SMA) of South Korea during the years from 2012 to 2016, using CMAQ. Long-range transport of NOx and SO2, which served as precursors for secondary aerosols such as nitrate and sulfate, significantly contributed to aerosol loadings in the SMA. Nitrate aerosols, in particular, comprised 50 % of PM2.5 during winter and 67 % during spring, underscoring their significant share of PM2.5 pollution in the SMA during these seasons. Similarly, the study by Lee et al. (2020) demonstrated that the long-range transport of PM2.5 and its precursors, including NOx, SO2, and volatile organic compounds (VOCs), originating from China led to substantial increases in PM2.5 concentrations in South Korea by up to 50 % during the 2016 KORUS-AQ campaign period. Tang et al. (2023) also assessed the contributions of local and transboundary emissions to PM2.5 concentrations in South Korea during the 2016 KORUS-AQ campaign. Under stagnant high-pressure conditions, local emissions were the dominant source, accounting for up to 49 % of PM2.5 concentrations in the SMA. However, during periods of strong westerly winds, pollutants transported from China significantly impacted air quality in the SMA, contributing as much as 71 % of PM2.5 concentrations. Kashfi Yeganeh et al. (2024) quantified the contributions of transboundary NOx and VOC sources to ozone concentrations in Seoul, South Korea, during a June 2019 ozone exceedance event. Ozone precursors were transported by northwesterly and westerly winds from China, accounting for 57.7 % of the ozone concentrations in Seoul, while local emissions contributed 42.3 %. Beyond the studies mentioned above, a number of CTM-driven source apportionment efforts have highlighted the substantial contributions of both local and transboundary pollutants to air quality across Asia (Kajino et al., 2013; Wang et al., 2015; Li et al., 2017a, 2019; Shen et al., 2022; Xian et al., 2024). While such earlier efforts have provided valuable insights into Asia's pollution dynamics, which are influenced by prevailing winds and dominant emission sources, the extent of source contributions varied across the regions due to differences in the materials and methods employed in each study. A common issue highlighted in many of these studies is the uncertainty in emission inventories, which can compromise the reliability of simulations. This often stems from the use of incomplete or outdated emission inventories, as pointed out in several previous studies (Carmichael et al., 2002; Pan et al., 2014; Sargent et al., 2021; Russo et al., 2019; Han et al., 2021; Liu et al., 2021), which may not effectively reflect current emission sources, industrial developments, or recent advancements in pollution control.
In response to the need for more accurate air quality simulations, which are essential for proceeding with further analyses based on their outcomes, extensive efforts have been made to refine emission inventories across Asia. Traditional bottom-up methods, such as ground surveys and industrial reporting, however, can be time-consuming and often outpaced by rapidly evolving emission patterns, making them less reflective of contemporary emission activities (Placet et al., 2000; Rypdal and Winiwarter, 2001; Li et al., 2021a; Smith et al., 2022). To address this, satellite observation data have widely been used to update emission inventories in a top-down manner, taking advantage of the instruments' broader geographic coverage. Instruments aboard Sun-synchronous low-Earth-orbit satellites, such as the Ozone Monitoring Instrument (OMI) and the TROPOspheric Monitoring Instrument (TROPOMI), have been particularly effective in constraining the extent of air pollutant emissions. More recently, the Geostationary Environment Monitoring Spectrometer (GEMS) has further enhanced this process by capturing daytime variations in pollutant loadings, such as tropospheric nitrogen dioxide (NO2) columns, offering unprecedented insights into the diurnal behaviors of pollutants across Asia. Leveraging the top-down information, a number of studies have successfully refined Asia's emission inventories, achieving substantial improvements in CTM-based simulation accuracy (Itahashi et al., 2012; Yumimoto et al., 2014; Goldberg et al., 2019; Souri et al., 2020; Li et al., 2021b; Jung et al., 2022a; Son et al., 2022; Feng et al., 2023; Mun et al., 2023; Park et al., 2023, 2024; Momeni et al., 2024). However, only a few have extended their scope to utilize these refined simulations for further analyses of cross-regional pollutant dynamics across multiple seasons; updating emission inventories is already an inherently resource-intensive process, demanding a series of forward model runs and iterative adjustments. For example, Souri et al. (2020) refined NOx and VOC emissions across East Asia during the 2016 KORUS-AQ campaign period, through analytical inversion using satellite data from OMI and the Ozone Mapping and Profiler Suite Nadir Mapper (OMPS-NM) and CMAQ. The inversion led to significant 22 %–41 % reductions in NOx emissions in China, Taiwan, and Malaysia, while South Korea and Japan showed 9 %–12 % increases. VOC emissions over the North China Plain were adjusted upward by 25 %, a significant increase compared to the previously reported 5 % since 2010. This involved shifts in chemical regimes across East Asia, with regions transitioning between NOx-sensitive and VOC-sensitive conditions, providing more recent insights into ozone formation risks across different regions. Similarly, Jung et al. (2022a) refined East Asia's NOx emission inventory for spring 2019 through Bayesian inversion using TROPOMI data and CMAQ-ISAM. The use of more up-to-date emissions substantially reduced model biases in simulating NO2, ozone, and PM2.5 concentrations, revealing that the prior emissions were underestimating the contributions of transboundary pollutants. NOx emissions from neighboring regions contributed 22.96 %–35.24 % to local NOx budgets and 24.23 %–42.26 % to ozone budgets in both China and South Korea, reaffirming the critical role of anticyclonic systems over the Yellow Sea in driving pollutant transport. Despite these efforts, there is still a need for more rigorous efforts in this domain to better explore regional pollution dynamics. Particularly, the recurrent pollutant patterns during East Asia's winter and spring seasons deserve updated perspectives on the complex interplay between evolving synoptic systems and pollutant transport dynamics, which significantly affect air quality across the region.
Leveraging top-down estimates of NOx emissions informed by GEMS tropospheric NO2 columns, followed by improved accuracy in CTM simulations, our study aims to conduct a comprehensive source apportionment of East Asia's NOy concentrations during the winter–spring transition in 2022. First, we applied diurnal updates to the inventoried extent of NOx emissions using GEMS NO2 columns as top-down constraints during the Bayesian inversion, enabling CMAQ to more accurately simulate NOy concentrations. Then, using CMAQ-ISAM, we quantified the local and transboundary contributions of NOx emissions to NOy concentrations across five major NOx source regions of East Asia during the period from January to May 2022. By capturing the response of pollutants to evolving seasonal dynamics, we assessed the source–receptor interplays between the regions, aiming to provide more up-to-date insights into the broader cross-regional pollution transport dynamics.
2.1 Model simulations
Meteorology governs the dispersion and transport of air pollutants, making it a critical factor in CTM simulations. We used the Weather Research and Forecasting (WRF) model 3.8.1 (Skamarock et al., 2008) to simulate meteorological fields over the modeling domain (Fig. 1). The simulation spanned from 1 January to 31 May 2022, covering East Asia's winter and spring seasons. We simulated hourly meteorological fields over a 320×320 grid with 35 vertical layers at a spatial resolution of 27 km and then converted them into a CMAQ-compatible format using the Meteorology–Chemistry Interface Processor (MCIP). We used the Morrison two-moment scheme for microphysics (Morrison et al., 2009), the Rapid Radiative Transfer Model for general circulation models (RRTMG) for longwave and shortwave radiation (Clough et al., 2005; Iacono et al., 2008), and the Pleim–Xiu land surface and surface layer models (Xiu and Pleim, 2001; Pleim, 2006). Planetary boundary layer (PBL) processes were simulated using the ACM2 model (Pleim, 2007a, b), and cumulus parameterization was handled by the Kain–Fritsch scheme (Kain, 2004). We applied the Four-Dimensional Data Assimilation (FDDA) grid-nudging option (Jeon et al., 2015) for meteorological inputs. Initial and boundary conditions were derived from the National Centers for Environmental Prediction (NCEP) FNL operational model global tropospheric analysis.
Using the WRF-simulated meteorology and established emissions as inputs, CMAQ simulates the behavior and distribution of pollutants in the atmosphere in a three-dimensional manner. We employed two different versions of CMAQ: (1) CMAQ 5.2 with its Decoupled Direct Method in Three Dimensions (CMAQ DDM-3D) as a forward model in the emission adjustment process and (2) CMAQ 5.3.2 with its ISAM for performing source apportionment. CMAQ DDM-3D calculates the first-order coefficients that represent locally semi-normalized sensitivities of modeled pollutant concentrations to changes in the relevant emission input (Napelenok et al., 2006). CMAQ-ISAM tags pollutants emitted from user-defined source regions and then tracks them through atmospheric processes such as advection, chemical transformation, and deposition (Kwok et al., 2015). This allows for quantification of the contribution of specific emission sources to pollutant loadings at receptor locations across the modeling domain, offering detailed insights into source attribution. Building upon previous studies conducted in Asia (Jung et al., 2022a; Park et al., 2023, 2024), we employed CMAQ configurations that have been validated in comparable contexts across the region. Using CMAQ DDM-3D, we simulated hourly NO2 concentrations over a 300×300 grid and obtained their corresponding sensitivities to NOx emissions, which were used for the Bayesian inversion to constrain the inventoried extent of NOx emissions (details in Sect. 2.2 and 2.4). We used the YAMO scheme and the WRF omega formula to solve horizontal advection and vertical advection, respectively. Horizontal diffusion was modeled using the multiscale approach, and vertical diffusion was represented with the ACM2 vertical diffusion scheme (Pleim, 2007a, b). Gas-phase chemistry was solved using the Carbon Bond 05 (CB05) mechanisms for CMAQ DDM-3D and CB6 for CMAQ-ISAM. Aerosol processes were modeled using the AERO6 module, and dry deposition was estimated using the M3Dry scheme (Pleim, 2007b). We used static boundary conditions during the entire simulation period. Using CMAQ-ISAM, we quantified the local and transboundary contributions of NOx emissions to NOy concentrations among five selected regions (Fig. 1), including South Korea, Northeast China, North China, East China, and South Central China. In our discussion of South Korea (later in Sect. 3), we focused on the SMA, the country's economic hub, where dense traffic activity contributes to severe air pollution, as highlighted in the small panel of Fig. 1, which illustrates its geographic extent. North Korea, despite its close proximity to these regions and the potential impact of its emissions on neighboring regions' air quality, was excluded from our study. This was primarily due to the uncertainty in North Korea's emissions, which warrants a dedicated study of its own. Global emission inventories like the Emissions Database for Global Atmospheric Research (EDGAR) rely on accurate energy usage data to estimate pollutant emissions, and the lack of reliable input data for North Korea made it impractical to include as a separate source region in this study. Our focus was on total NOy concentrations within the PBL at receptor regions rather than surface NOx or NO2 concentrations due to the latter's short atmospheric lifetimes, which limit their long-range transport. The PBL facilitates the most efficient mixing and transport across regions, making it an ideal layer for assessing the cross-regional behaviors of pollutants (Li et al., 2017b). However, it is important to acknowledge that substantial pollutant transport also occurs in the free troposphere beyond the PBL, where stronger winds facilitate the long-range transport of pollutants. Our study specifically focuses on the PBL to assess cross-regional pollutant behaviors, as this layer directly influences surface air quality, the modeled estimates of which can be evaluated with station measurements (detailed in Sect. 2.5), and human health. We quantified the extent to which NOy remained near local sources versus how much was transported to neighboring receptor regions during the winter–spring months. Note that we used the summation of NOx, nitric acid (HNO3), nitrous acid (HONO), and peroxyacetyl nitrate (PAN) to represent NOy, capturing the major reactive nitrogen species that contribute to total NOy concentrations during the simulations. Both the WRF and CMAQ simulations began with a 10 d spin-up from 22 to 31 December 2021. Further technical details of our modeling setup are listed in Table S1 in the Supplement.
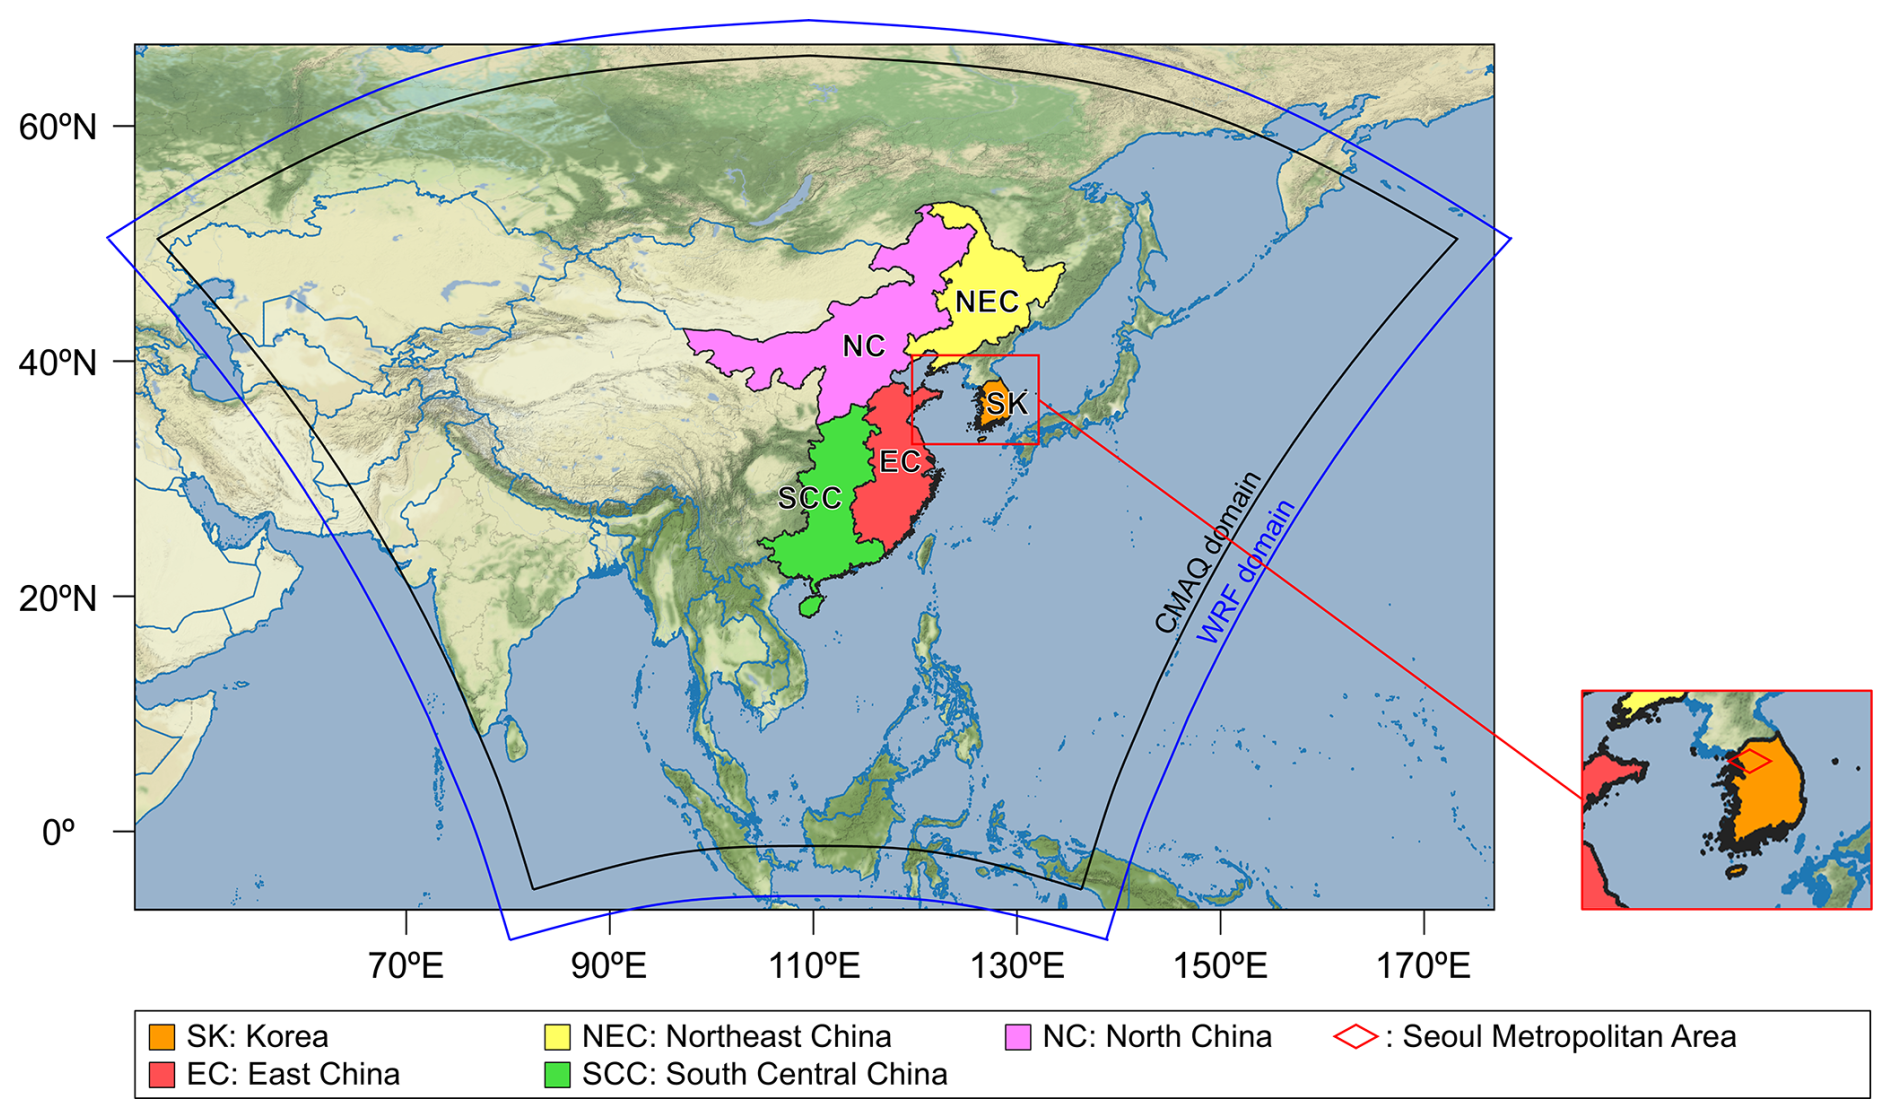
Figure 1Modeling domain and five source apportionment regions across East Asia.
2.2 Emission inventories
Emission inventories provide CTMs with spatiotemporally resolved information on the extent of air pollutant emissions, enabling the simulation of their behavior and resulting concentrations in the atmosphere. We prepared anthropogenic emissions over the modeling domain using EDGAR 6.1 (Crippa et al., 2020), which offers annual data (base year: 2018) for greenhouse gas and air pollutant emissions at a 0.1° spatial resolution. We processed these emissions into a CMAQ-compatible format using the Sparse Matrix Operator Kernel Emissions (SMOKE) 4.7 modeling system (Houyoux et al., 2000). This process involved regridding the emissions into a 27 km resolution and allocating the annual lumped emissions into hourly speciated emissions for the period from 1 January to 31 May 2022, while accounting for time zones and weekday–weekend profiles that vary across geographical locations. It is noteworthy that, unlike our previous study (Park et al., 2023) and other literature that inspired our methodology (Souri et al., 2020; Jung et al., 2022a), we did not use the 2016 KORUS-AQ emission inventory (version 5) developed by Woo et al. (2020). This inventory, widely adopted for Asia-focused studies, was delicately built upon a combination of multiple regional surveys, providing comprehensive representations of emission patterns across Asia. However, as the KORUS-AQ inventory provides the inventoried extent of pollutant emissions as monthly and yearly totals and given the requirements of our inversion method (detailed in Sect. 2.4) to update Asia's emission inventory on an hourly basis, we used the EDGAR inventory instead. The EDGAR database offers region-specific hourly emission profiles, allowing us to avoid introducing additional uncertainties associated with the temporal allocation of monthly emissions into hourly emissions. We prepared biogenic and biomass burning emissions using the Model of Emissions of Gases and Aerosols from Nature (MEGAN) 3.0 (Guenther et al., 2018) and the Fire Inventory from the National Center for Atmospheric Research (NCAR) (FINN) 1.5 (Wiedinmyer et al., 2011). MEGAN estimates the extent of gases and aerosol emissions from terrestrial ecosystems based on vegetation responses to meteorological conditions. We obtained hourly biogenic emissions at a 27 km resolution using the WRF-simulated meteorological fields and leaf area index (LAI) averaged over vegetative surfaces (referred to as LAIv) as an input, which can be calculated by dividing the grid-specific LAI by the fraction of each grid cell covered by vegetation (Guenther, 2006). To calculate LAIv, we used the reprocessed Moderate Resolution Imaging Spectroradiometer (MODIS) Version 6 LAI product (Yuan et al., 2011) and the Visible Infrared Imaging Radiometer Suite (VIIRS) global Green Vegetation Fraction product (Jiang et al., 2016), following the method established in previous studies (Jung et al., 2021; Park et al., 2022). This ensures that MEGAN estimates biogenic emissions based on more contemporary information on vegetative surfaces over the modeling domain. FINN provides emissions from open biomass burning events, such as wildfires, agricultural fires, and prescribed burning, based on satellite observation data and fuel load parameters. We obtained hourly biomass burning emissions at a 27 km resolution, using the Fortran-based gridding program (fire_emis) provided by NCAR, which spatiotemporally allocated FINN emissions into our modeling grid. We merged these anthropogenic, biogenic, and biomass burning emissions to prepare a comprehensive emission input for CMAQ (hereafter referred to as the a priori emissions). Note that our use of two different CMAQ versions required species mapping, as EDGAR emissions were provided in the CB05 mechanism, which CMAQ DDM-3D can digest, but CMAQ-ISAM requires those in CB6. We converted the chemical species from CB05 to CB6 using the species mapping method described in a previous study (Collet et al., 2018).
2.3 Satellite data
GEMS is the first ultraviolet–visible geostationary instrument capable of capturing diurnal profiles of both gaseous pollutants and aerosols across the Asia–Pacific region, covering latitudes from 5° S to 45° N and longitudes from 75 to 145° E (Choi et al., 2018). We used the GEMS Level 2 NO2 product (version 2.0) to obtain a top-down overview of NO2 loadings across the modeling domain. This product, including observations from November 2020 to the present, provides 6 to 10 consecutive snapshots of NO2 column densities at hourly intervals during the daytime, at a spatial resolution of 3.5 km × 8 km. For clarification, GEMS provided 6 observations per day from 00:45 to 05:45 UTC in January, 7 observations from 00:45 to 06:45 UTC in February, 8 observations from 23:45 to 06:45 UTC in March, and 10 observations from 22:45 to 07:45 UTC in April and March.
We used tropospheric NO2 columns observed from 1 January to 31 May 2022 as top-down references for constraining the a priori emissions. In addition to the NO2 columns, we incorporated several other variables during the inversion process (see Sect. 2.4), including the averaging kernel, cloud fraction, data quality flags, and root-mean-square error. We also used model-derived variables from the GEMS Level 2 data, including tropospheric and stratospheric air mass factors (AMFs), the a priori tropospheric NO2 profile, and the tropospheric pressure profile from the WRF model coupled with Chemistry (WRF-Chem) 3.9.1 (NIER, 2020). To ensure consistency in the vertical distribution assumptions between GEMS tropospheric NO2 columns and CMAQ-simulated tropospheric NO2 columns, we recalculated the AMFs using the vertical NO2 profiles simulated by CMAQ. These AMFs were then used to adjust the GEMS-retrieved NO2 columns, aligning them with CMAQ's vertical profiles. This process involves interpreting the satellite retrievals using CMAQ's vertical NO2 profiles instead of the original GEMS a priori vertical profiles, which were based on WRF-Chem. This adjustment ensures that both of the NO2 columns are interpreted consistently with the model vertical structure, thereby mitigating biases introduced by differences in the initial assumptions about the vertical distribution of NO2. This approach builds upon methods established in previous inverse modeling studies that directly compared OMI- and TROPOMI-derived NO2 columns with CMAQ simulations (Souri et al., 2016, 2017, 2020; Jung et al., 2022a, b). To ensure data quality, we used pixels with a quality flag of 0 bits (good sample) and cloud fractions below 0.3; since the Level 2 data version 2.0 no longer employs the OMI climatology and instead adopts its own reflectance data for AMF calculations under cloudy scenes – a relatively new approach that warrants further validation through retrieval studies – we excluded observations with cloud fractions greater than 0.3 to minimize potential biases associated with uncertain AMF estimates.
2.4 Top-down approach to constrain NOx emissions
The extent of NOx emissions is not directly measurable through GEMS's observations, which instead capture NO2 column densities. While these are closely related to NOx emissions, they do not provide direct quantitative measurements of the emissions themselves. Therefore, to establish quantitative constraints on NOx emissions and obtain the updated estimates accordingly, we employed a Bayesian approach for inverse modeling, which is suited to solving problems that are not grossly nonlinear (Rodgers, 2000).
Given the short atmospheric lifetime of NO2, our approach assumes a local, linear relationship between NO2 columns and NOx emissions. This assumption, widely adopted in earlier inverse modeling studies (Martin et al., 2003; Souri et al., 2016, 2018, 2020; Jung et al., 2022a, b; Park et al., 2023, 2024), is based on the understanding that satellite-observed NO2 columns are most likely to reflect recent, localized NOx emissions due to NO2's short atmospheric lifetime. Furthermore, the linearity simplifies the inversion process by directly relating observed column densities to emissions, avoiding the need for computationally intensive modeling of nonlinear processes. However, it is noteworthy that the observed NO2 columns at any given time are influenced not only by current NOx emissions but also by NO2 remaining from previous hours. Additionally, nighttime chemical reactions involving ozone and hydroxyl radicals (•OH) can introduce nonlinearity between NOx emissions and NO2 concentrations, which is a complexity beyond the scope of our study. Assuming that uncertainties in observations and emissions follow a Gaussian distribution, our approach aimed to derive the most probable estimate of a posteriori NOx emissions by integrating prior knowledge (a priori emissions) and top-down observational constraints. This involves minimizing the cost function derived from Bayes' theorem, as shown in Eq. (1) (Rodgers, 2000).
This process determined the a posteriori emissions x for each grid cell, given multiple inputs: the a priori emissions xa, observation constraints y (hourly GEMS NO2 columns), and CMAQ-simulated NO2 columns F. Due to the 15 min offset in the availability of GEMS Level 2 products (from 22:45 to 07:45 UTC), we aligned the observations to the nearest subsequent hour (e.g., GEMS data at 04:45 UTC were used to constrain emissions at 05:00 UTC). We assumed emission uncertainties Se at 50 %, 200 %, and 100 % for anthropogenic, biogenic, and biomass burning emissions, respectively, based on previous modeling studies conducted across Asia (Souri et al., 2020; Jung et al., 2022a; Park et al., 2023, 2024). Observation uncertainty So was sourced from the GEMS Level 2 data.
Once the first derivative of the cost function reached its minimum, we applied the Gauss–Newton method to iteratively refine the emission estimate, as shown in Eq. (2). This process involved adjusting the estimate x (with each iteration noted as i; i=4 in January and February, whereas i=3 in March, April, and May), gradually progressing towards a converged solution. The Jacobian matrix K, which represents the sensitivity between NOx emissions and NO2 concentrations, was calculated by CMAQ DDM-3D at the beginning of the simulations and remained fixed throughout the inversion process. Meanwhile, the forward model F was updated with each iteration, guiding the inversion toward reducing discrepancies between the observed and modeled NO2 columns.
The inversion was applied whenever the top-down constraints were available, allowing us to constrain hourly NOx emissions during GEMS's daylight retrieval hours, while keeping nighttime emissions unchanged. We chose not to adjust nighttime emissions primarily due to the absence of an observational reference during these hours and also to isolate the daily emission cycle, allowing the model to “pause” and mitigate carryover effects from the previous day's emissions (Park et al., 2024). However, a limitation of this approach is that it does not improve the representation of nighttime emissions, leaving these unadjusted due to the absence of observational constraints. Consequently, any model biases associated with nighttime emissions remain unresolved.
2.5 Station measurements for model evaluation
Before using the WRF-simulated meteorological fields as input for CMAQ, we evaluated their accuracy against ground-based measurements at weather stations operated by the Korean Meteorological Administration. We used hourly measurements of the 2 m air temperature and 10 m wind U and V components from 95 stations, collected for the period from 1 January to 31 May 2022. The modeled meteorology showed fair agreement with station measurements (Fig. S1), with Pearson's correlation coefficients (R) ranging from 0.89 to 0.98 and index of agreement (IOA) values between 0.83 and 0.98.
To evaluate the accuracy of CMAQ simulations, we used hourly surface NO2 and PM2.5 concentrations observed at ground-based monitoring stations in South Korea and China during the period from 1 January to 31 May 2022, sourced from South Korea's Ministry of Environment (AirKorea) and China's Ministry of Ecology and Environment (MEE). To ensure the quality of AirKorea measurements, from an original count of 515 stations, we excluded those with more than 50 % missing data during the validation period (Park et al., 2022, 2023), which resulted in a 9.68 % data loss and the retention of 465 stations. To ensure the quality of MEE measurements, we applied data-filtering methods to data from 185 national control points, consisting of 20 sites in Northeast China, 38 sites in North China, 78 sites in East China, and 49 sites in South Central China. These control points are strategically distributed across China and managed by its central government to ensure consistent and reliable air quality measurements (Liu et al., 2021). We excluded negative values and duplicate records (more than consecutive repeats) caused by equipment failures, following the data-filtering methods in previous studies (Rohde and Muller, 2015; Silver et al., 2018; Zhai et al., 2019). This resulted in a decrease in the number of data points by 0.41 % for NO2 and 0.38 % for PM2.5, respectively. Note that we converted MEE's NO2 measurements from its native unit of micrograms per cubic meter (µg m−3) to parts per billion (ppb).
3.1 Model evaluation
Prior to proceeding with source apportionment, we first evaluated the accuracy of our CMAQ simulations across East Asia. We compared the observed and modeled tropospheric NO2 columns from using the a priori and a posteriori NOx emissions, in order to evaluate the improvement in the model's performances. Figure 2 shows monthly averages of hourly daytime NO2 columns during the period from January to May 2022. The prior model generally underestimated NO2 columns across North China, Northeast China, the northern half of East China, and the SMA of South Korea (Fig. 2a, b). The extent of the underestimation was particularly pronounced in North China, failing to capture highly polluted areas observed throughout the simulation period. To a lesser extent, the model sporadically overestimated the columns across South Central China, the southern half of East China, and the rest of South Korea except the SMA.
After the inversion, there were substantial adjustments to the extent of daytime NOx emissions across the regions (Fig. S4), seemingly counterbalancing the earlier model under- and overestimation. During the winter–spring months, on average, there were increases in the emissions by 50.12 % in South Korea, 30.86 % in Northeast China, 78.63 % in North China, 20.76 % in East China, and 2.6 % in South Central China (Table S2). Overall, these adjustments led to a closer alignment between the observed and modeled NO2 columns (Fig. 2c). For example, in regions such as North China, including Beijing, and parts of Northeast China, such as Shenyang, NO2 columns substantially increased by a factor of approximately 1.2–2.0 during winter months (January and February). Similarly, the SMA of South Korea experienced moderate increases by a factor of 1.2–1.5 during the same period. In contrast, in South Central China, NO2 columns showed a mix of increases and decreases depending on the month. In May, for instance, NO2 columns in South Central China decreased by a factor of about 1.3, compensating for the model's earlier overestimation. In addition, we noticed some posterior overcompensation in the modeled columns, shown by some overestimated values across North China, South Central China, and South Korea in February and March, which could have been caused by our use of the Bayesian approach, often regarded as a simple inverse modeling method that cannot fully resolve the non-locality of air pollutants (Park et al., 2024). Nonetheless, overall, our use of the a posteriori NOx emissions yielded a more accurate spatial representation of NO2 concentrations across the regions during the winter–spring transition, demonstrating its effectiveness in refining emission inventories and thereby improving model accuracy.
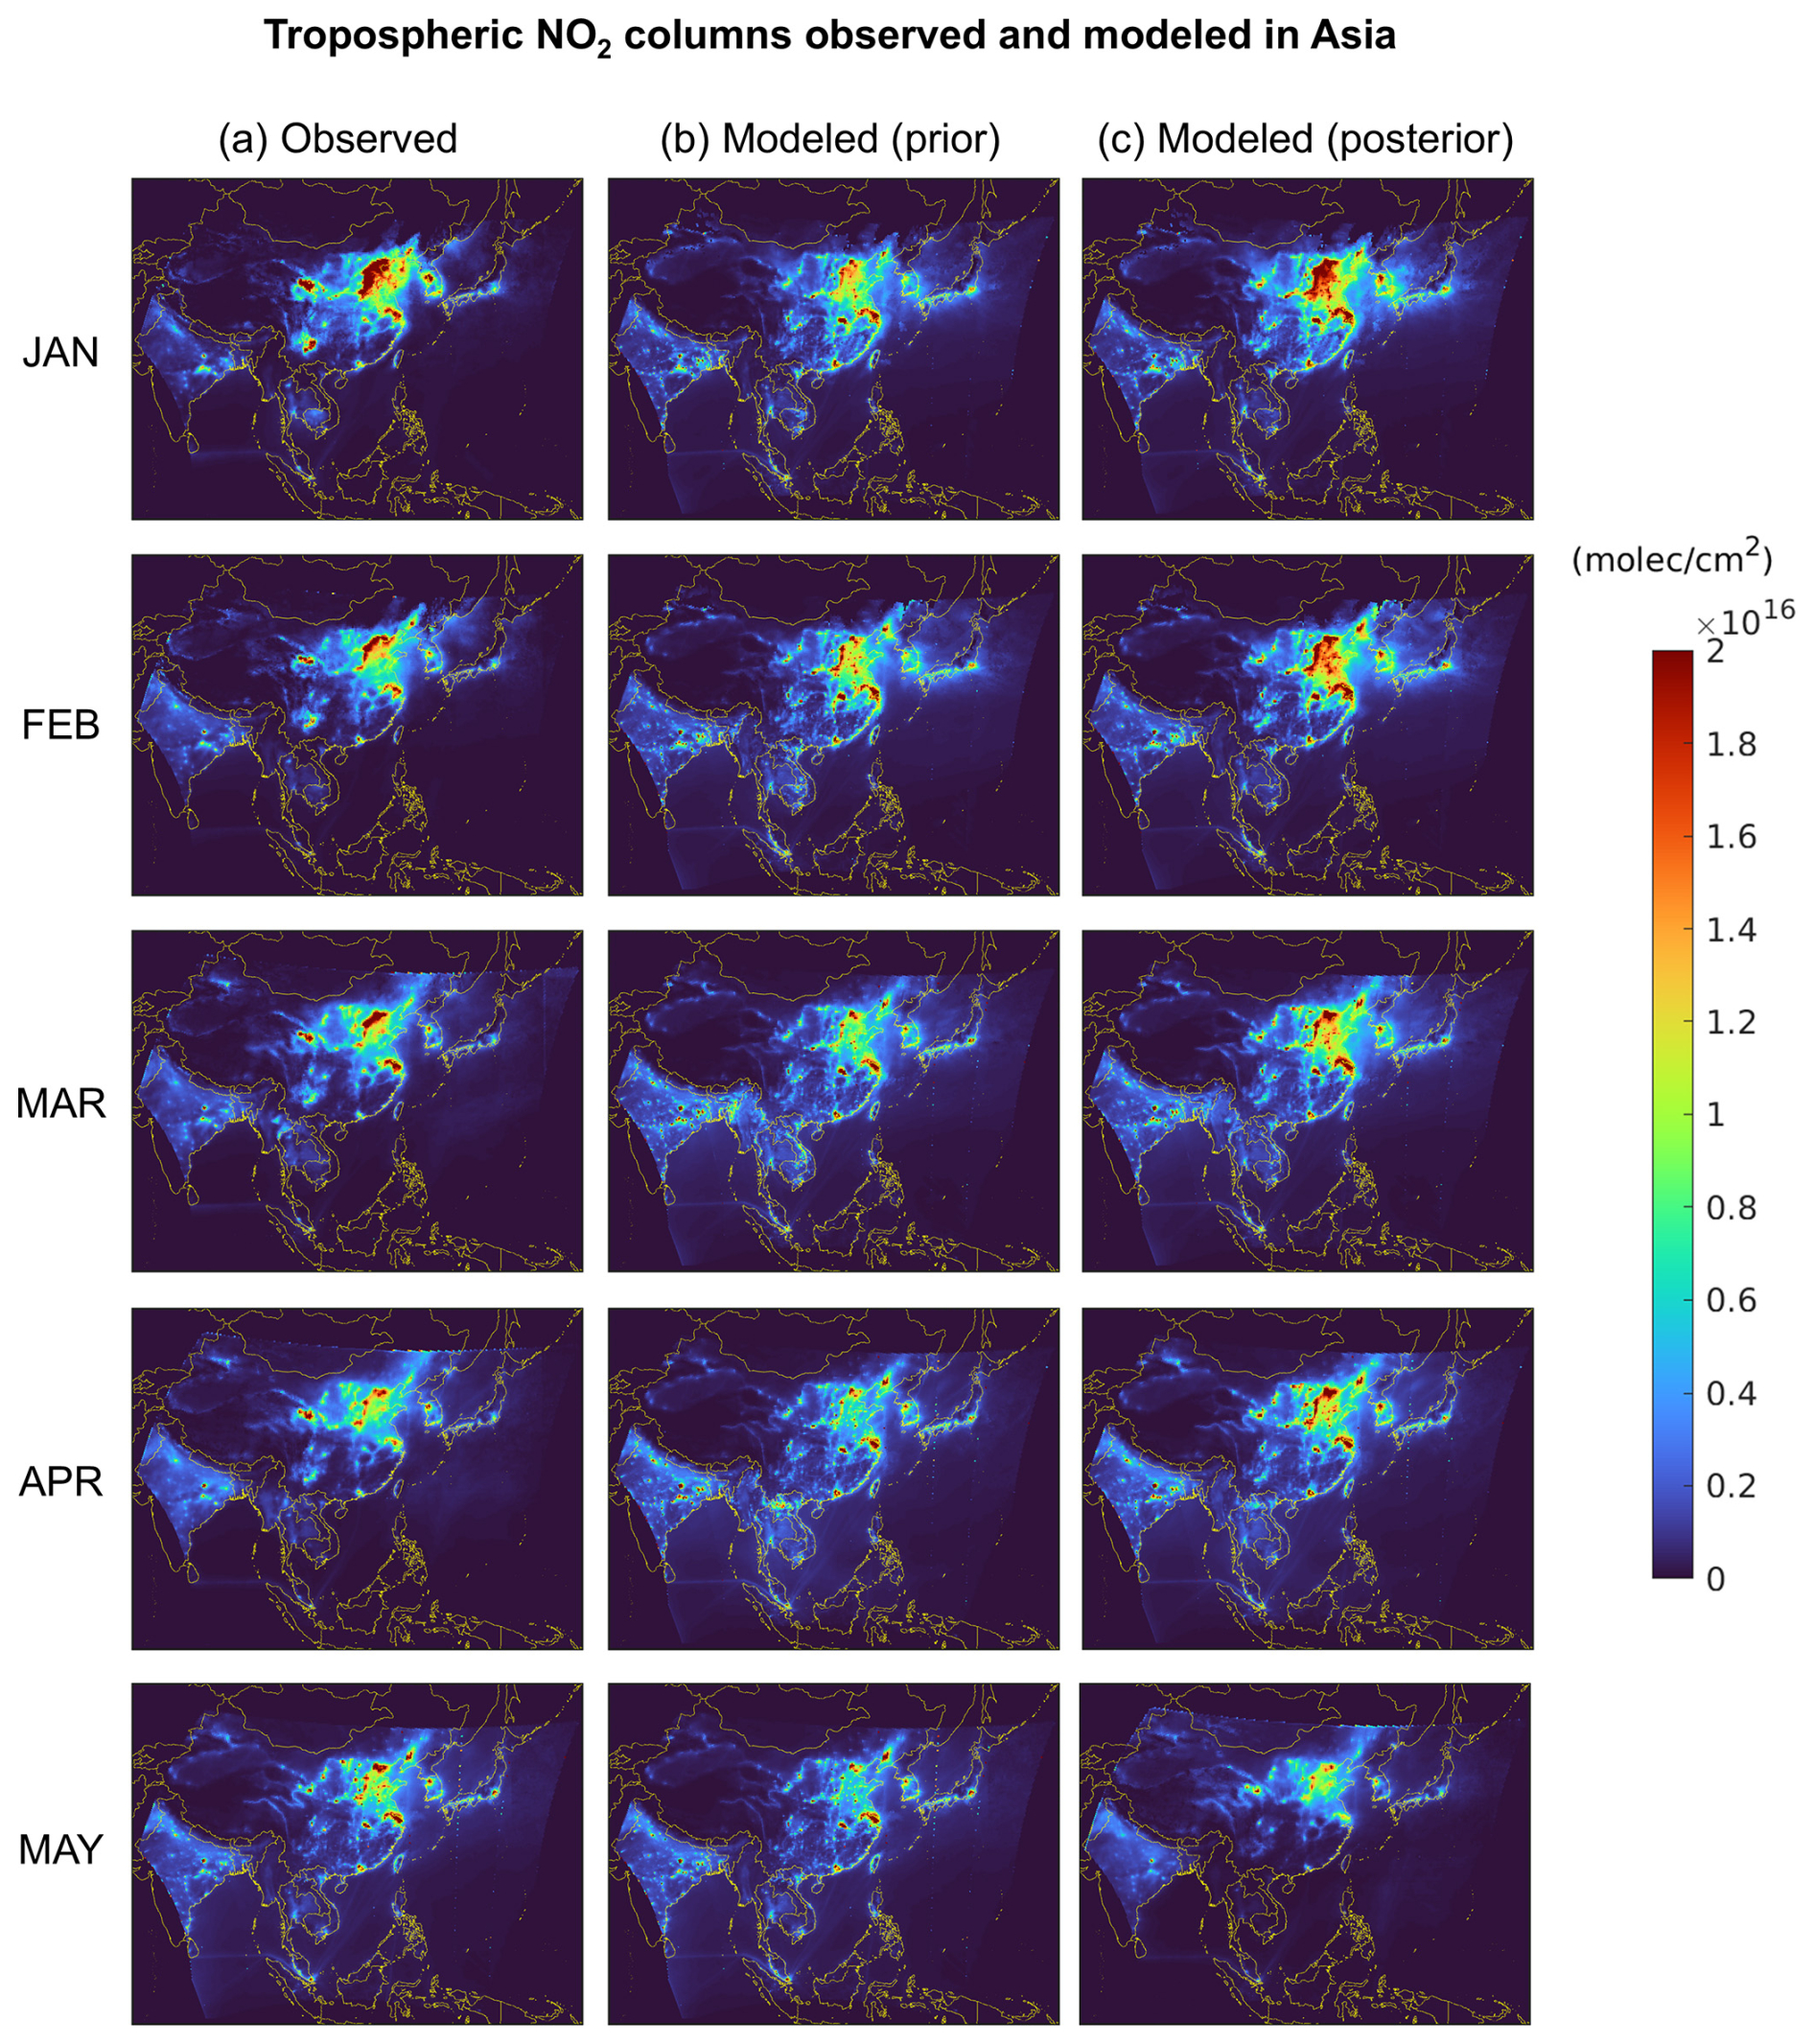
Figure 2Averages of hourly tropospheric NO2 columns (molecules cm−2) observed and modeled during daylight hours (GEMS retrieval hours) in each month from January to May 2022: (a) GEMS tropospheric NO2 columns, (b) modeled NO2 columns using the a priori emissions, and (c) modeled NO2 columns using the a posteriori emissions. Note that we excluded the modeled columns that do not correspond to the GEMS's retrieval times.
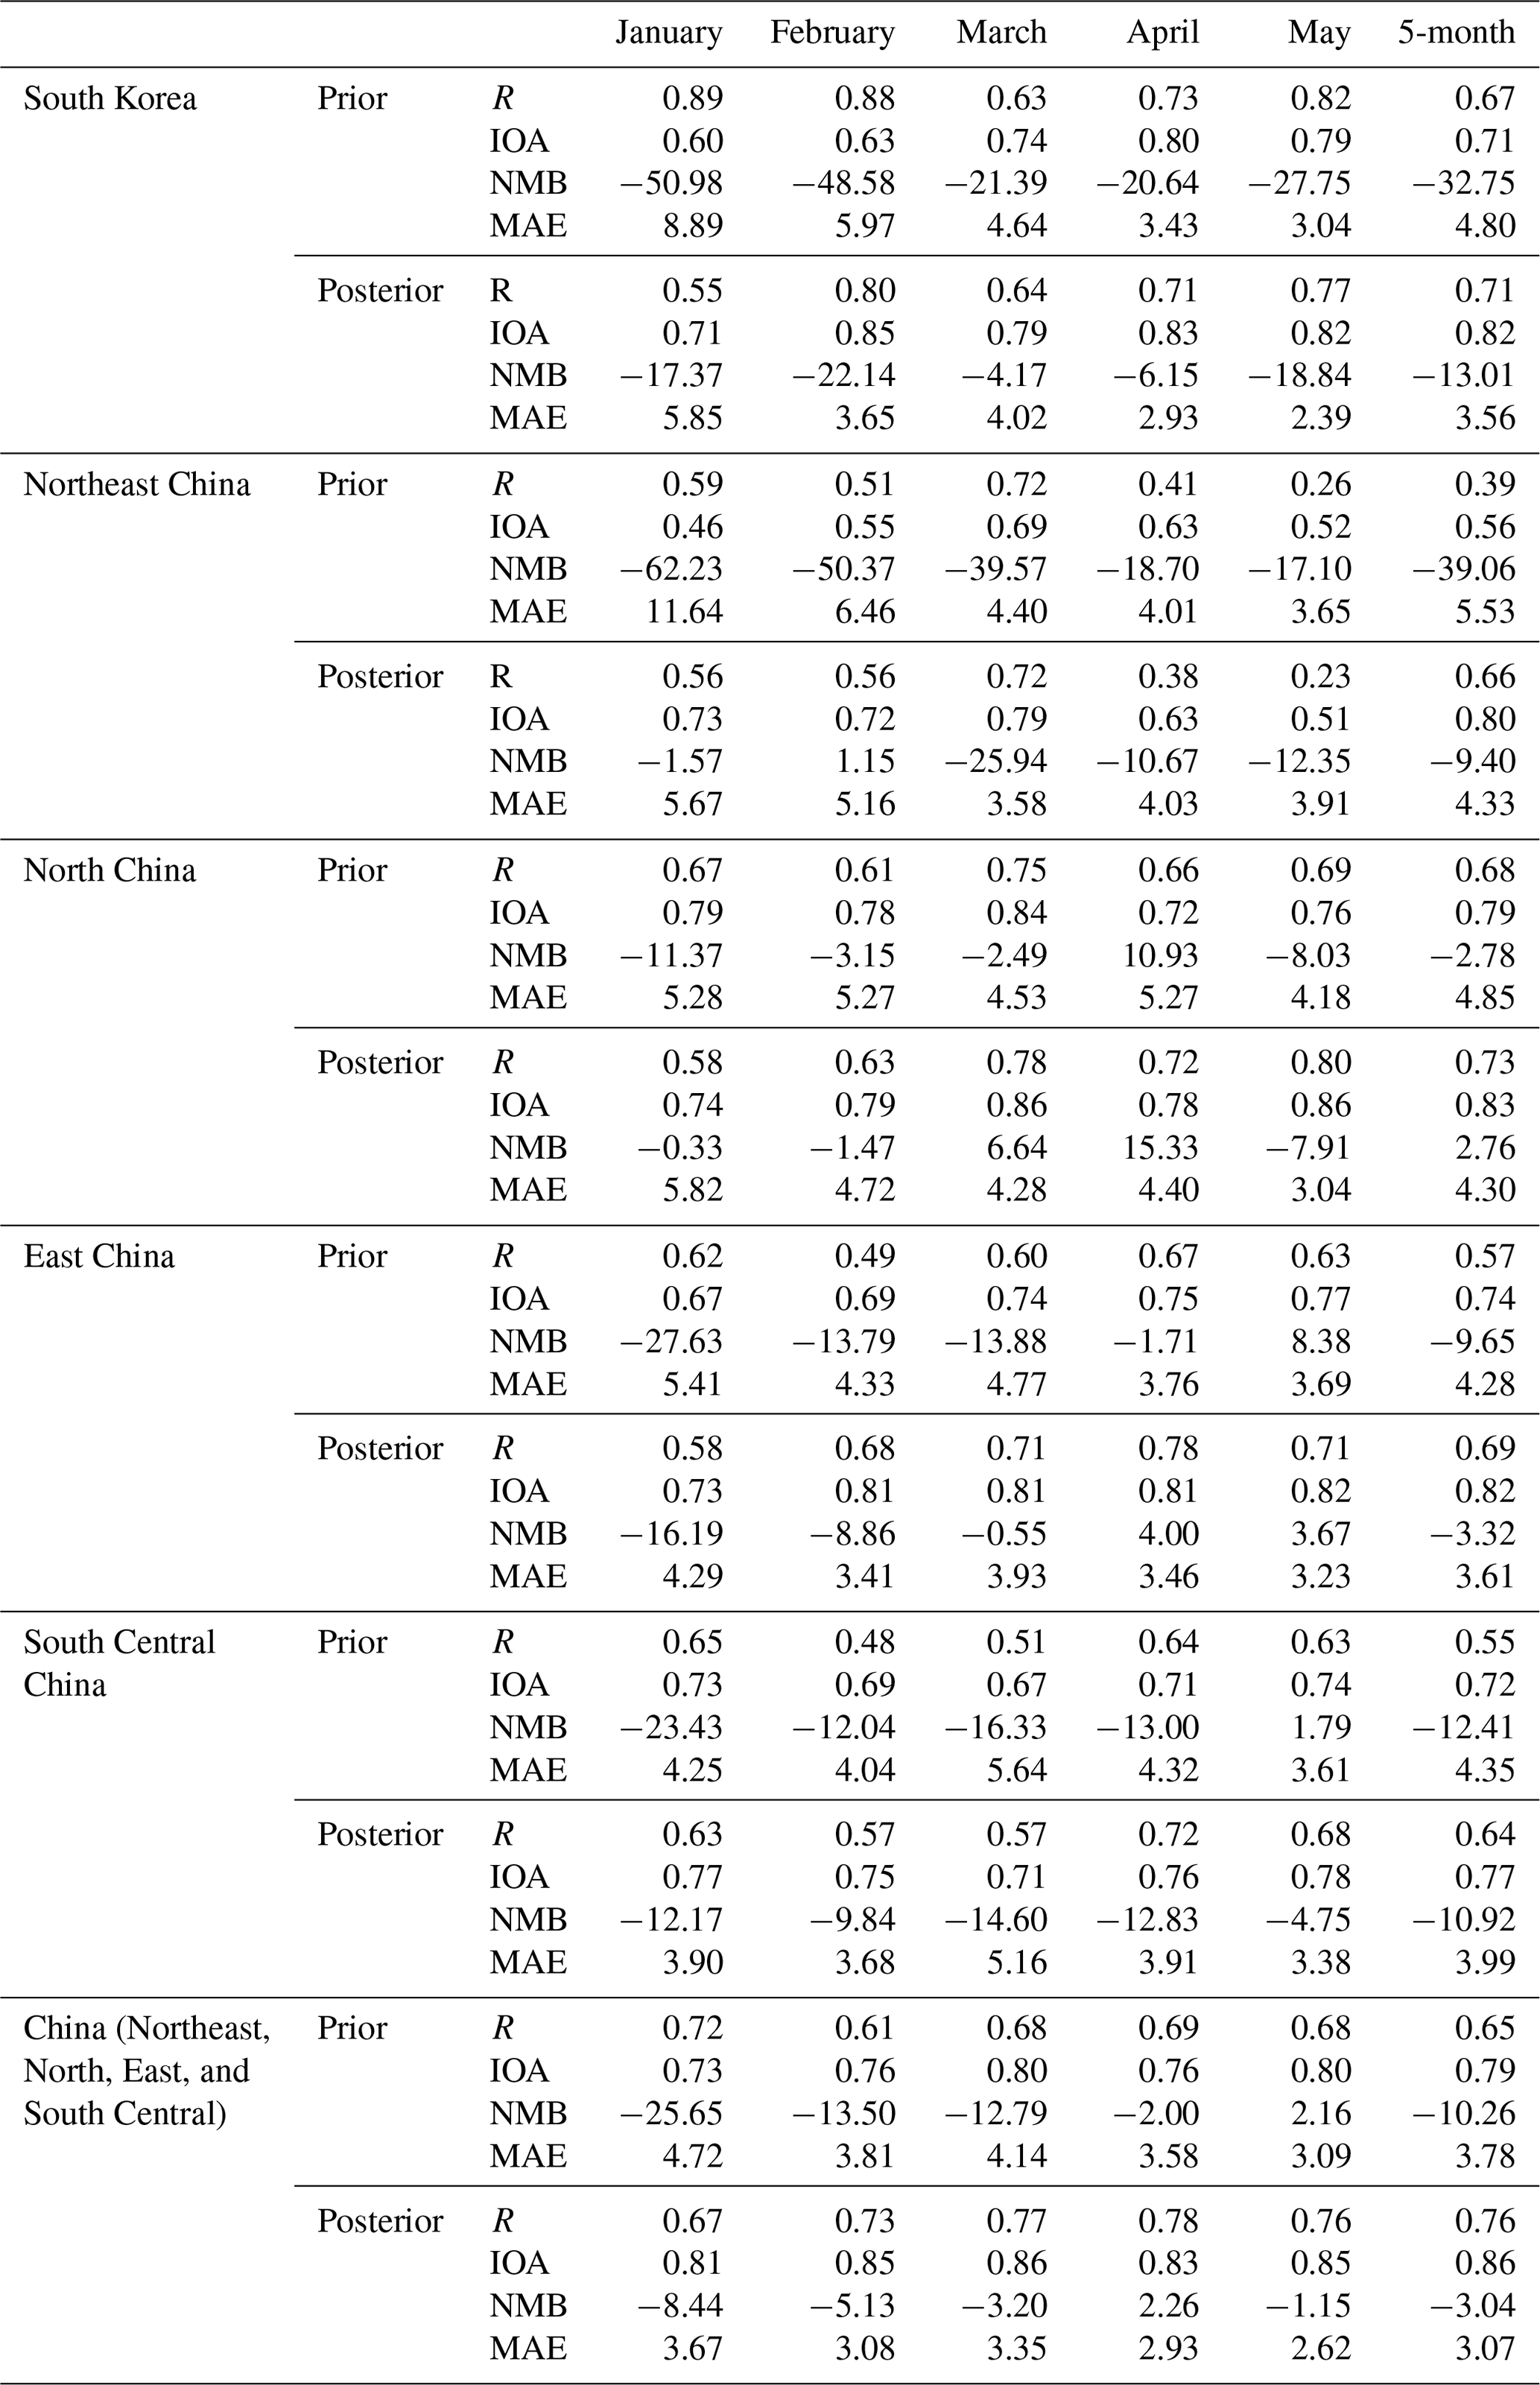
The increases in NOx emissions reduced the extent of model biases with respect to simulating daytime surface NO2 concentrations from −32.75 % to −13.01 % in South Korea and from −10.26 % to −3.04 % in China on average (from −39.06 % to −9.40 % in Northeast China, from −2.78 % to 2.76 % in North China, from −9.65 % to −3.32 % in East China, and from −12.41 % to −10.92 % in South Central China) (Fig. 3, Table 1). This led to closer alignment between the modeled and observed concentrations during the months, showing the following improvements: R increased from 0.67 to 0.71 and the IOA increased from 0.71 to 0.82 in South Korea, while R increased from 0.65 to 0.76 and the IOA increased from 0.79 to 0.86 in China. Despite the improvements, the extent of the prior underestimation still remained the largest in January, gradually decreasing as the months progressed to May. This suggests a potential underrepresentation of NOx emissions in the a priori inventory during the colder months, possibly due to the use of the global emission database, which may not fully capture localized, high energy usage in those periods. There were instances of overcompensation after the inversion, such as in March and April for North China, in April for East China, and in May for South Central China, where the prior model started overestimating NO2 concentrations (Table 1). This could be attributed to the carryover effect of NO2 transport from neighboring grid cells, which the Bayesian inversion, which assumes a strictly local relationship between emissions and concentrations, cannot fully constrain (Park et al., 2024). Nevertheless, the reductions in mean absolute errors across these regions suggest an overall improvement in simulation accuracy.
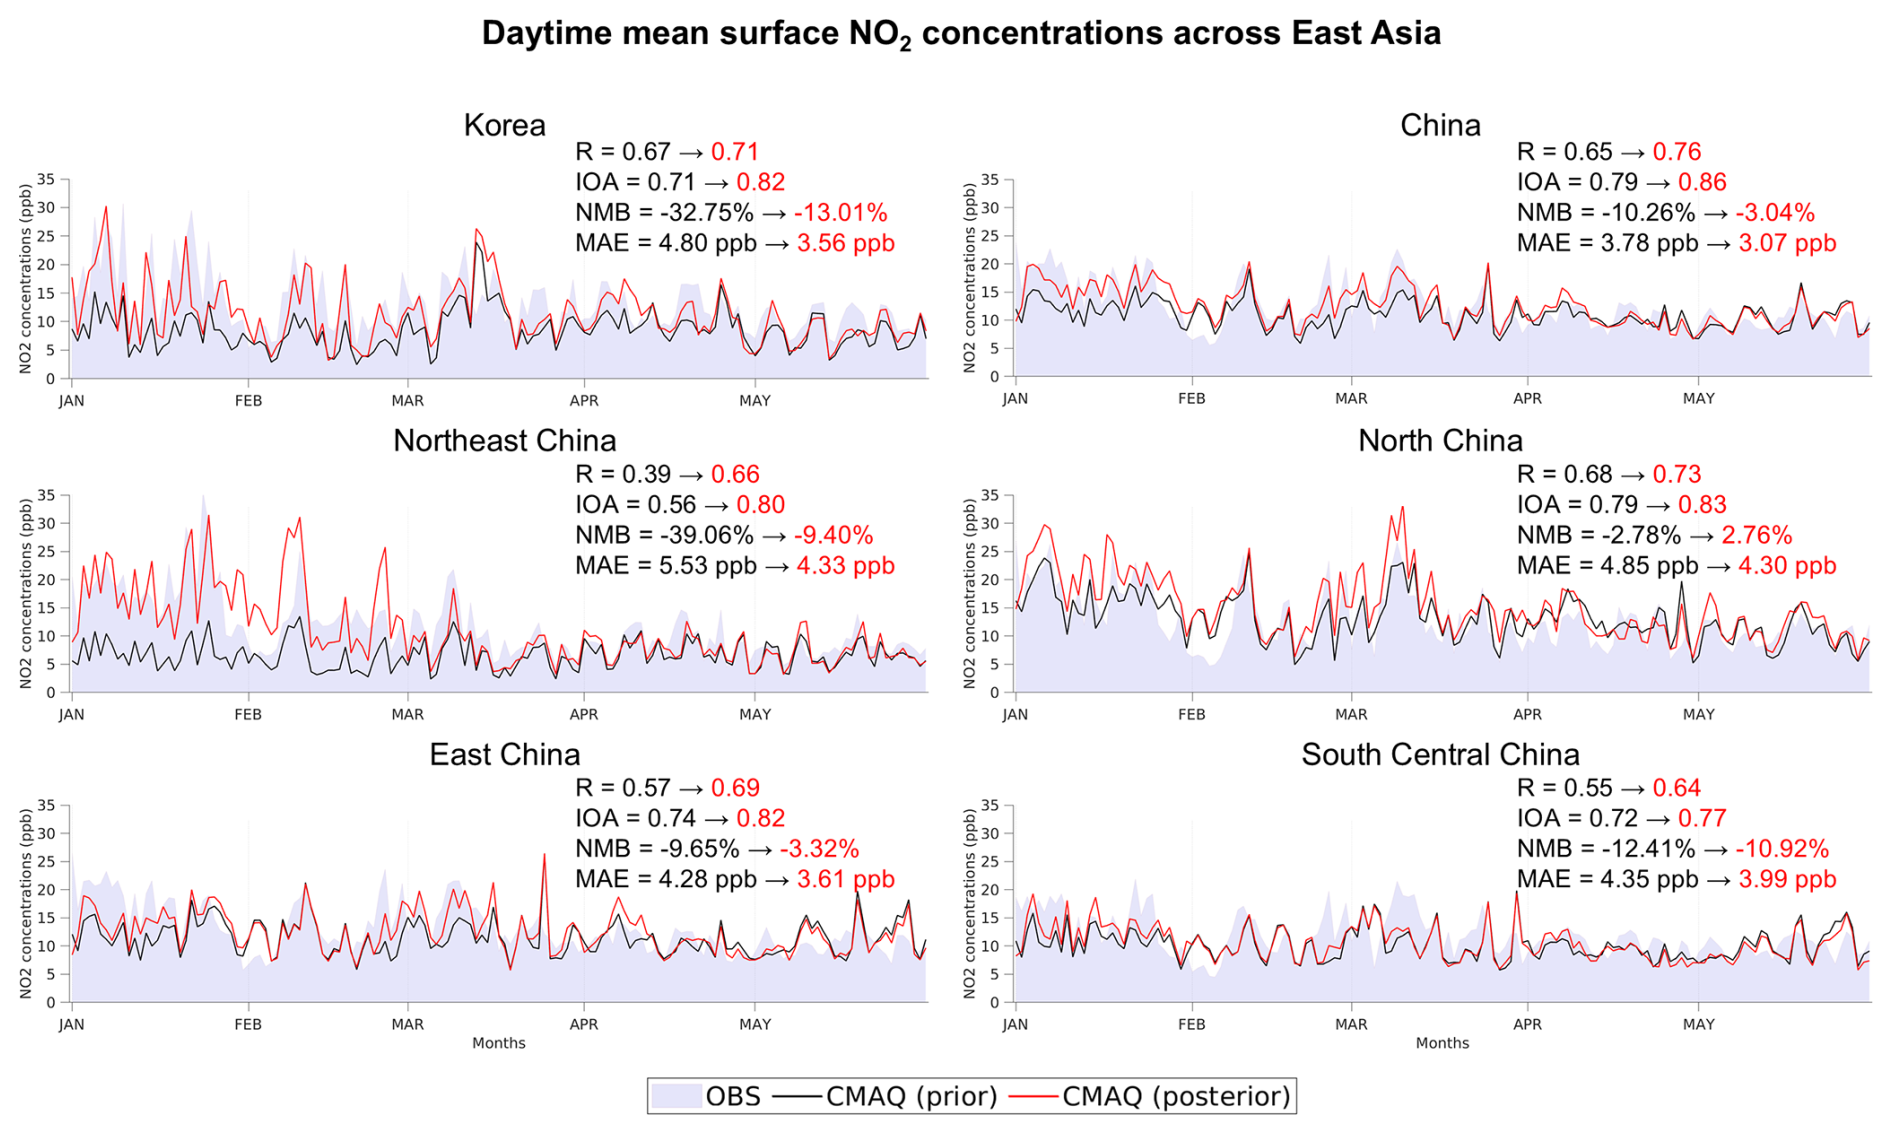
Figure 3Daytime mean surface NO2 concentrations observed and modeled at ground-based measurement sites within each of the five source apportionment regions across East Asia during the period from 1 January to 31 May 2022. OBS denotes observed concentrations, CMAQ (prior) denotes modeled concentrations using the a priori NOx emissions, and CMAQ (posterior) denotes modeled concentrations using the a posteriori NOx emissions. Arrows indicate the changes in metrics from the prior model to the posterior model. R is the Pearson correlation coefficient, IOA is the index of agreement, NMB is the normalized mean bias (%), and MAE is the mean absolute error (ppb).
Table 1Descriptive statistics comparing observed and modeled hourly surface NO2 concentrations at ground-based measurement sites within each of the five source apportionment regions across East Asia during the period from January to May 2022. Prior denotes the modeled concentrations using the a priori NOx emissions, whereas posterior denotes the modeled concentrations using the a posteriori NOx emissions. R is the Pearson correlation coefficient, IOA is the index of agreement, NMB is the normalized mean bias (%), and MAE is the mean absolute error (ppb).
3.2 Source apportionment
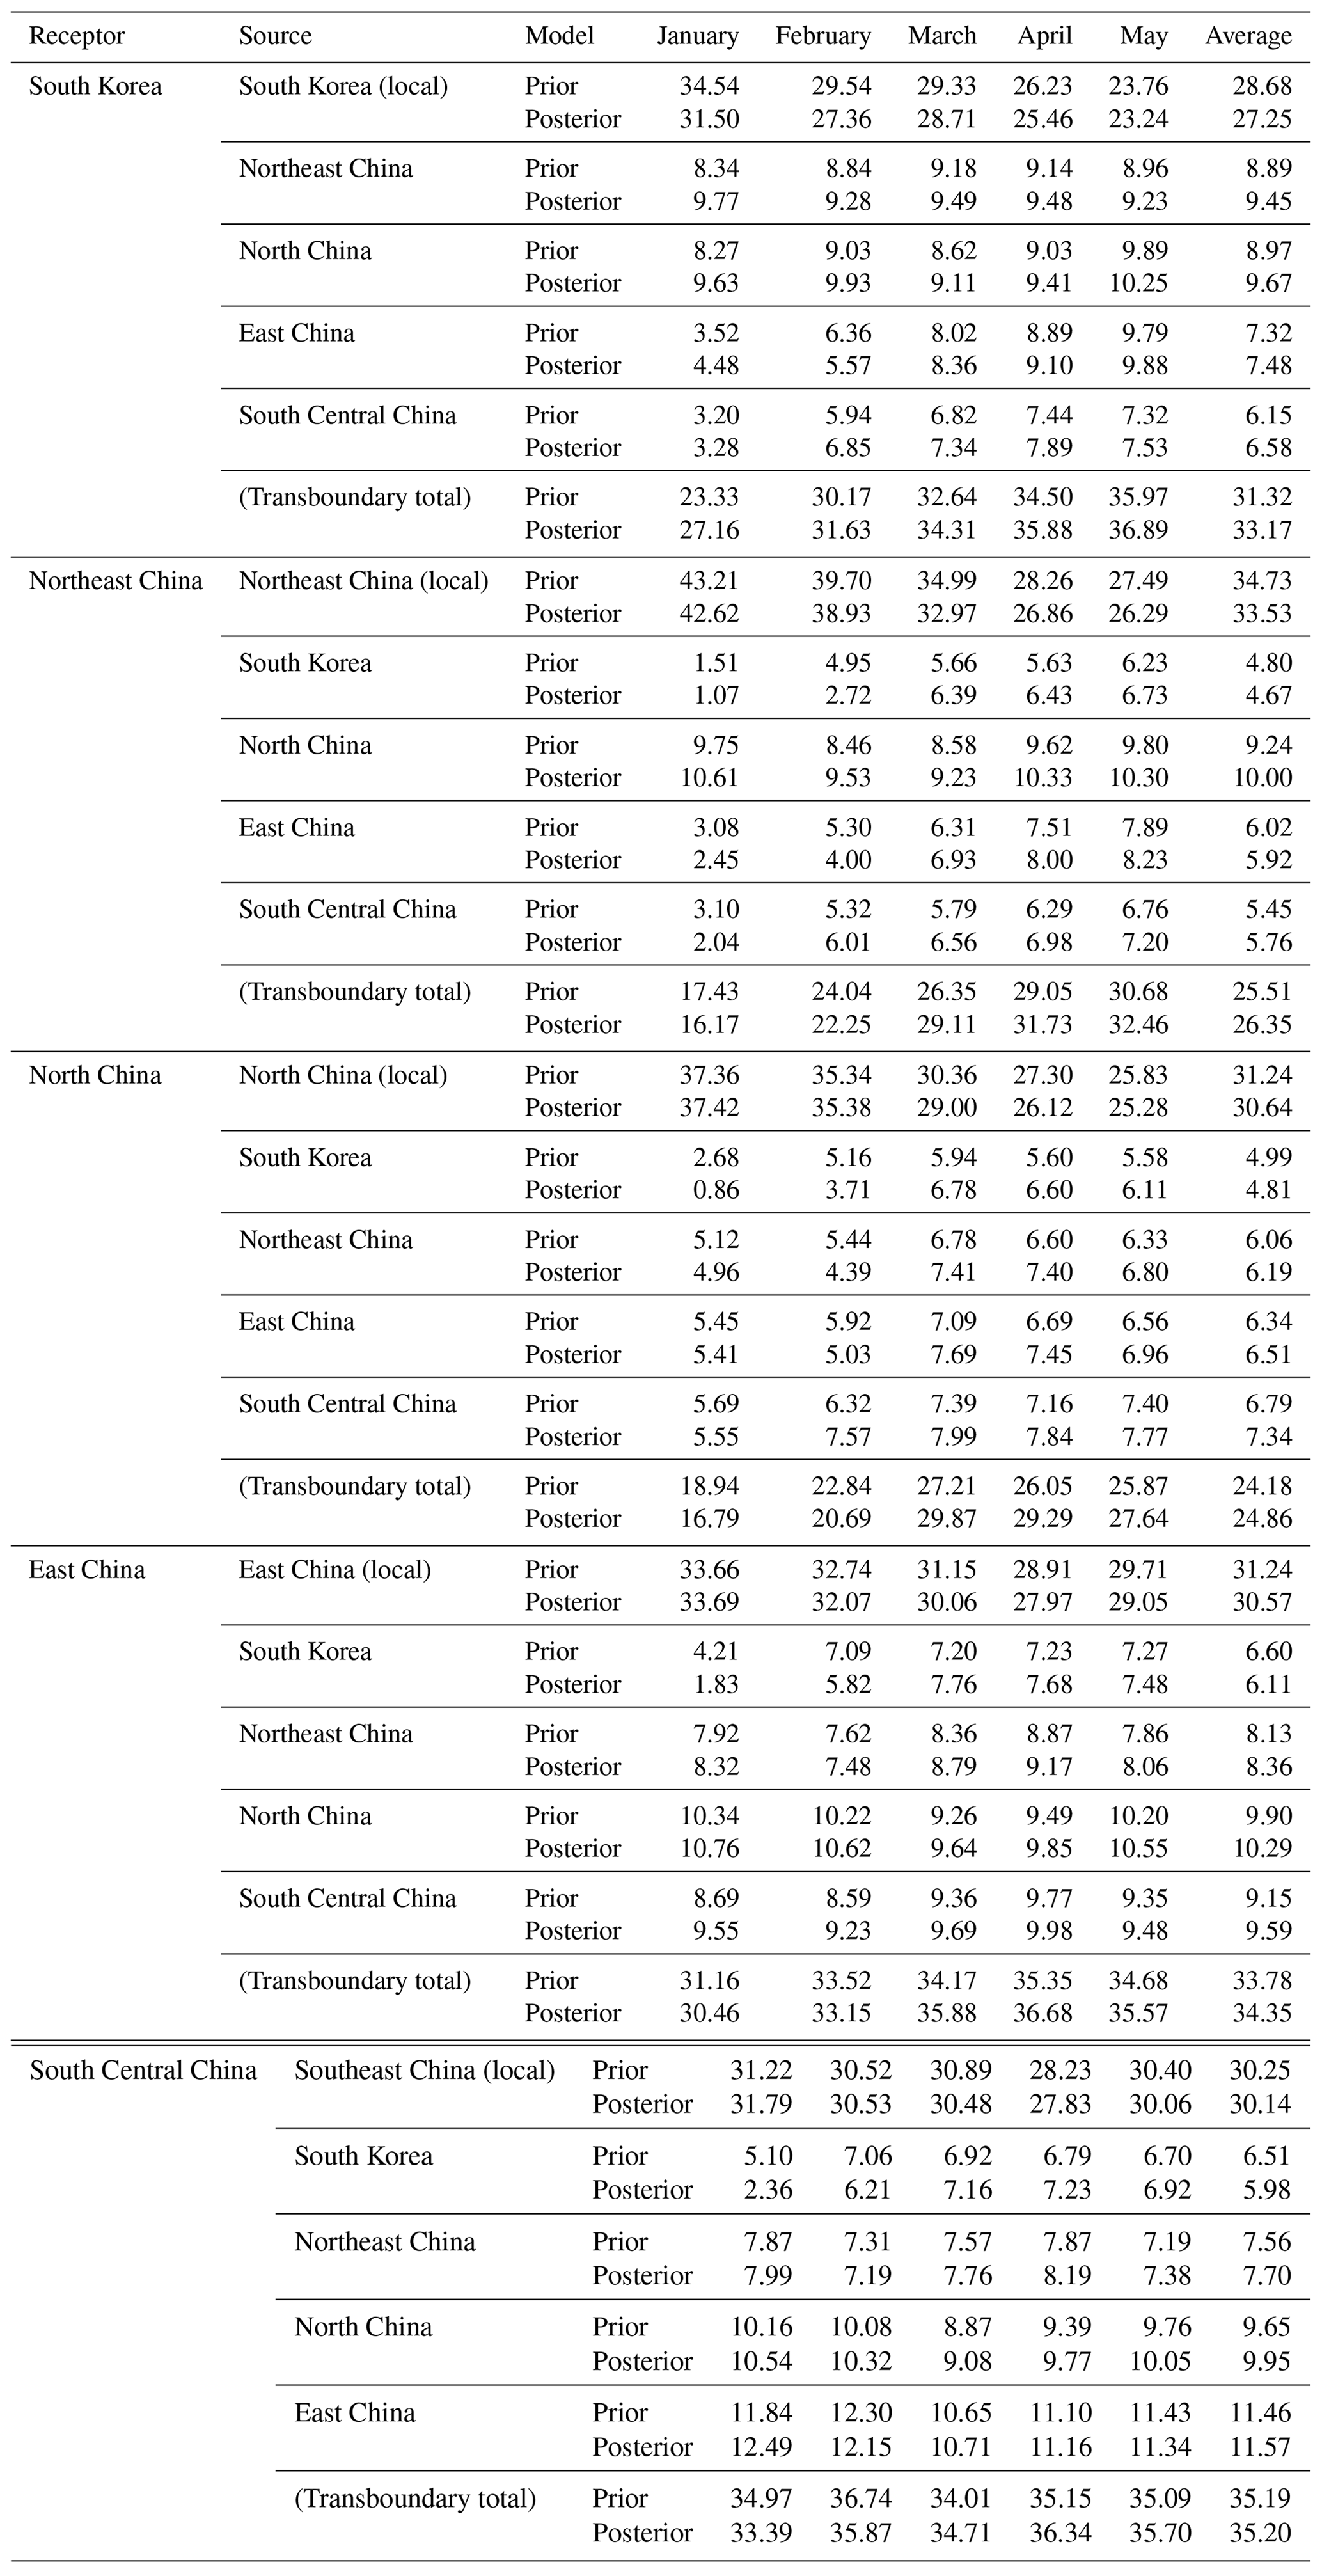
Upon improving model accuracy, we assessed the contributions of NOx emissions from local and outside sources to the total NOy concentrations in each of the five regions of East Asia during the winter–spring transition. NOy concentrations were generally higher near the source regions throughout the months, with notable transboundary transport extending to downwind regions (Fig. 4). While local contributions remained substantial across all regions, a clear decreasing trend was seen as the season progressed. Local sources' contributions were greater during the winter months compared to those from transboundary sources, whereas spring months (March, April, and May) showed a marked increase in transboundary contributions across the regions (Fig. 4, Table 2). In January, local contributions were 31.50 %, 42.62 %, 37.42 %, 33.69 %, and 31.79 % in South Korea, Northeast China, North China, East China, and South Central China, respectively. By May, these decreased to respective values of 23.24 %, 26.29 %, 25.28 %, 29.05 %, and 30.06 %. Meanwhile, transboundary contributions steadily increased as the months progressed. In January, transboundary contributions were 27.16 %, 16.17 %, 16.79 %, 30.46 %, and 33.39 % in South Korea, Northeast China, North China, East China, and South Central China, respectively. By May, these respective values increased to 36.89 %, 32.46 %, 27.64 %, 35.57 %, and 35.70 %. The decreases in local contributions can be partially attributed to reduced energy use and a subsequent decline in anthropogenic emissions as the seasons transitioned to warmer months. However, this does not fully explain the concurrent increase in transboundary contributions, suggesting that NOy concentrations from the sources did not readily remain near their origins but instead dispersed elsewhere, as reflected in the increasing transboundary contributions. However, this does not fully explain the concurrent increase in transboundary contributions, suggesting that other factors, such as the weakening of meteorological barriers, facilitated broader dispersion of NOy from source regions. These dynamics are discussed further below.
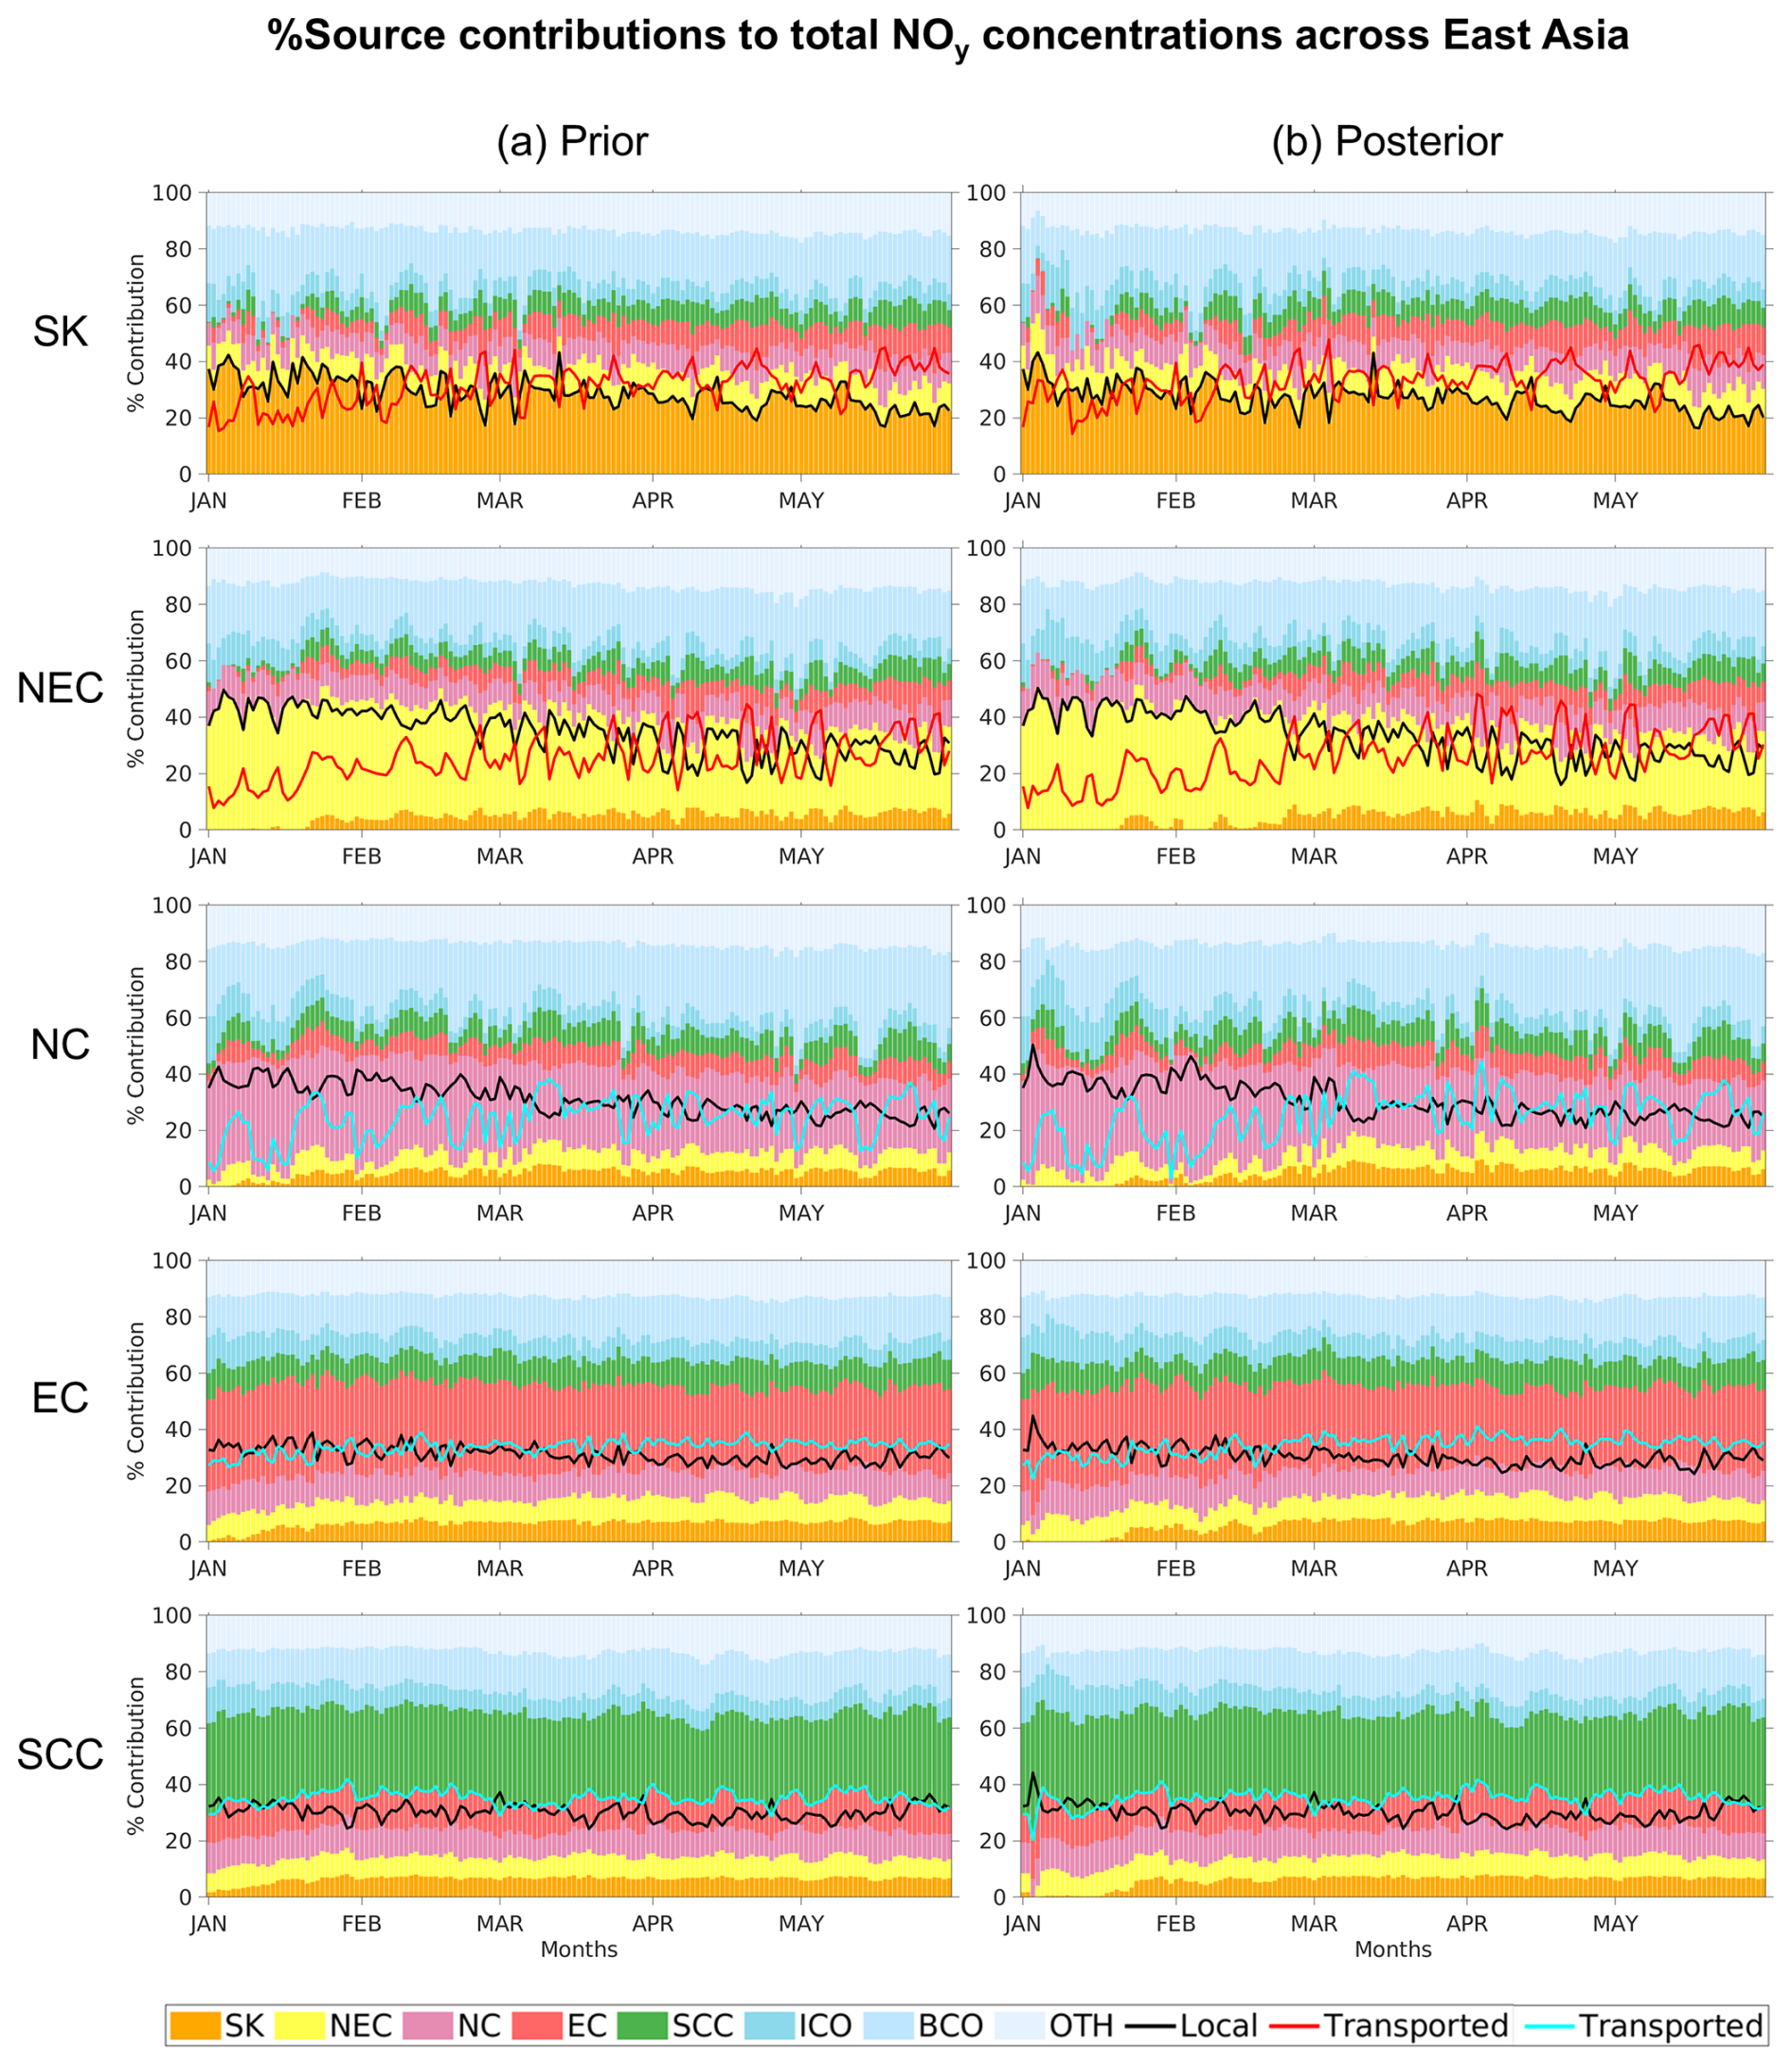
Figure 4Percent contributions (%) of local and transboundary NOx emissions to NOy concentrations within the PBL in five source apportionment regions across East Asia during the period from January to May 2022. Prior and posterior denote the percent contributions quantified based on the simulations using the a priori and a posteriori NOx emissions, respectively. ICO and BCO indicate the contributions from initial conditions and lateral boundary conditions, respectively, and OTH indicates the contribution of the emissions from the regions unspecified during the ISAM.
Table 2Descriptive statistics comparing the percent contributions (%) of local and transboundary NOx emissions to NOy concentrations within the PBL in five source apportionment regions across East Asia during the period from January to May 2022. Prior and posterior denote the percent contributions quantified based on the simulations using the a priori and a posteriori NOx emissions, respectively.
The direction, reach, and amount of NOy transport varied noticeably from January to May, driven by seasonal synoptic settings that influenced prevailing winds. During the winter months, NOy transport was predominantly directed southeastward and eastward, seemingly consistent with the influence of the Siberian High, as shown by the presence of continental anticyclonic winds (Fig. 5). This explains the relatively small transboundary contributions in upwind Northeast China and North China during this period (Table 2). Such a transport pattern was more pronounced when using the a posteriori NOx emissions, showing an overall increase in transboundary NOy transport (Fig. 5). After inversion, there was a noticeable increase in the amount of NOy traveling from the source regions towards the southeast and east, reaffirming the typical wintertime pollution transport patterns. During the spring months (March, April, and May) (Fig. 6), the reach of NOy transport expanded westward noticeably, allowing pollutants to travel more freely across a broader range of directions, rather than being confined to the dominant southeastward flow seen in winter. This can be attributed to the weakening of the Siberian High and the associated northwesterly winds, which enabled a more dynamic and multidirectional transport of pollutants across the regions. In addition, the emergence of seasonal easterlies during this time can facilitate occasional westward transport of pollutants, especially when a low-pressure system travels from west to east across the region, passing to the south of the weakening Siberian High (Peterson et al., 2019). This pattern was particularly evident when using the a posteriori NOx emissions, as a broader reach of NOy transport was shown in all directions, with greater pollutant dispersal across the regions.

Figure 5Source contributions to wintertime NOy concentrations (metric tons) within the PBL across Asia accumulated during the period from January to February 2022: (a) contributions quantified based on the simulations using the a priori NOx emissions, (b) contributions quantified based on the simulations using the a posteriori NOx emissions, and (c) their differences (panel b minus panel a).
In addition, when using the a priori and a posteriori NOx emissions during spring, the severity of NOy pollution did not necessarily decrease as the distance from each source region increased, as shown by some NOy hotspots far outside the sources (Fig. 6). For example, when the SMA was the source region, we noticed some high NOy concentrations in highly populated regions in China such as Beijing and the Yangtze River Delta and Guangdong regions. Considering the “cooking time” allowed for NOx to become NOy components, which involves chemical reactions and transformations from NOx to longer-lived species such as HNO3 and PAN (Shimadera et al., 2014; Yuan et al., 2018; Sun et al., 2020; Kashfi Yeganeh, 2024), we concluded that the high NOy loadings, particularly along the transport pathways, are secondary hotspots (Figs. S2, S3); the formation of such species depends on the availability of radicals and other precursors that are often more abundant in urban environments, which emerged as these hotspots.
This expansion of transboundary contributions during the winter–spring transition reaffirms the critical role of seasonal dynamics in governing pollutant transport and dispersion, leading to increasingly complex cross-regional interactions. While some regions maintained consistent extents of transboundary contributions, others exhibited substantial fluctuations as the months progressed. For example, despite significant NOx emissions (Fig. S2), South Korea was initially the least influential source region, contributing approximately 1 %–5 % to transboundary NOy concentrations in neighboring regions during January due to the location relative to the dominant northwesterly. However, as the season transitioned, South Korea's contribution to other regions grew, reaching up to 6 %–7 % by May, a notable increase comparable to the transboundary contributions shown by other regions (Table 2). Meanwhile, North China consistently emerged as the most influential source region, contributing around 10 % to the NOy concentrations of neighboring regions throughout the months. Besides North China's dominance, East China and South Central China emerged as significant contributors to each other's NOy budget, reflecting a close transboundary relationship between these regions. In addition, South Central China consistently experienced substantial transboundary contributions that outweighed local contributions by around 5 % throughout the entire study period, indicating the region's vulnerability to pollution transport. Even though the winter months offer meteorological conditions more favorable for the directional transport of pollutants, transboundary contributions to NOy loadings across the regions in this season were generally smaller compared to spring. This can be attributed to the stronger winds typical of winter, which can not only facilitate rapid transport of pollutants but also drive them to pass through receptor regions more quickly, limiting their accumulation (Wang et al., 2023). In contrast, during the spring months, the weakening of northwesterly winds seemed to allow for broader pollutant transport in a more multidirectional manner, leading to increased transboundary mixing of pollutants.
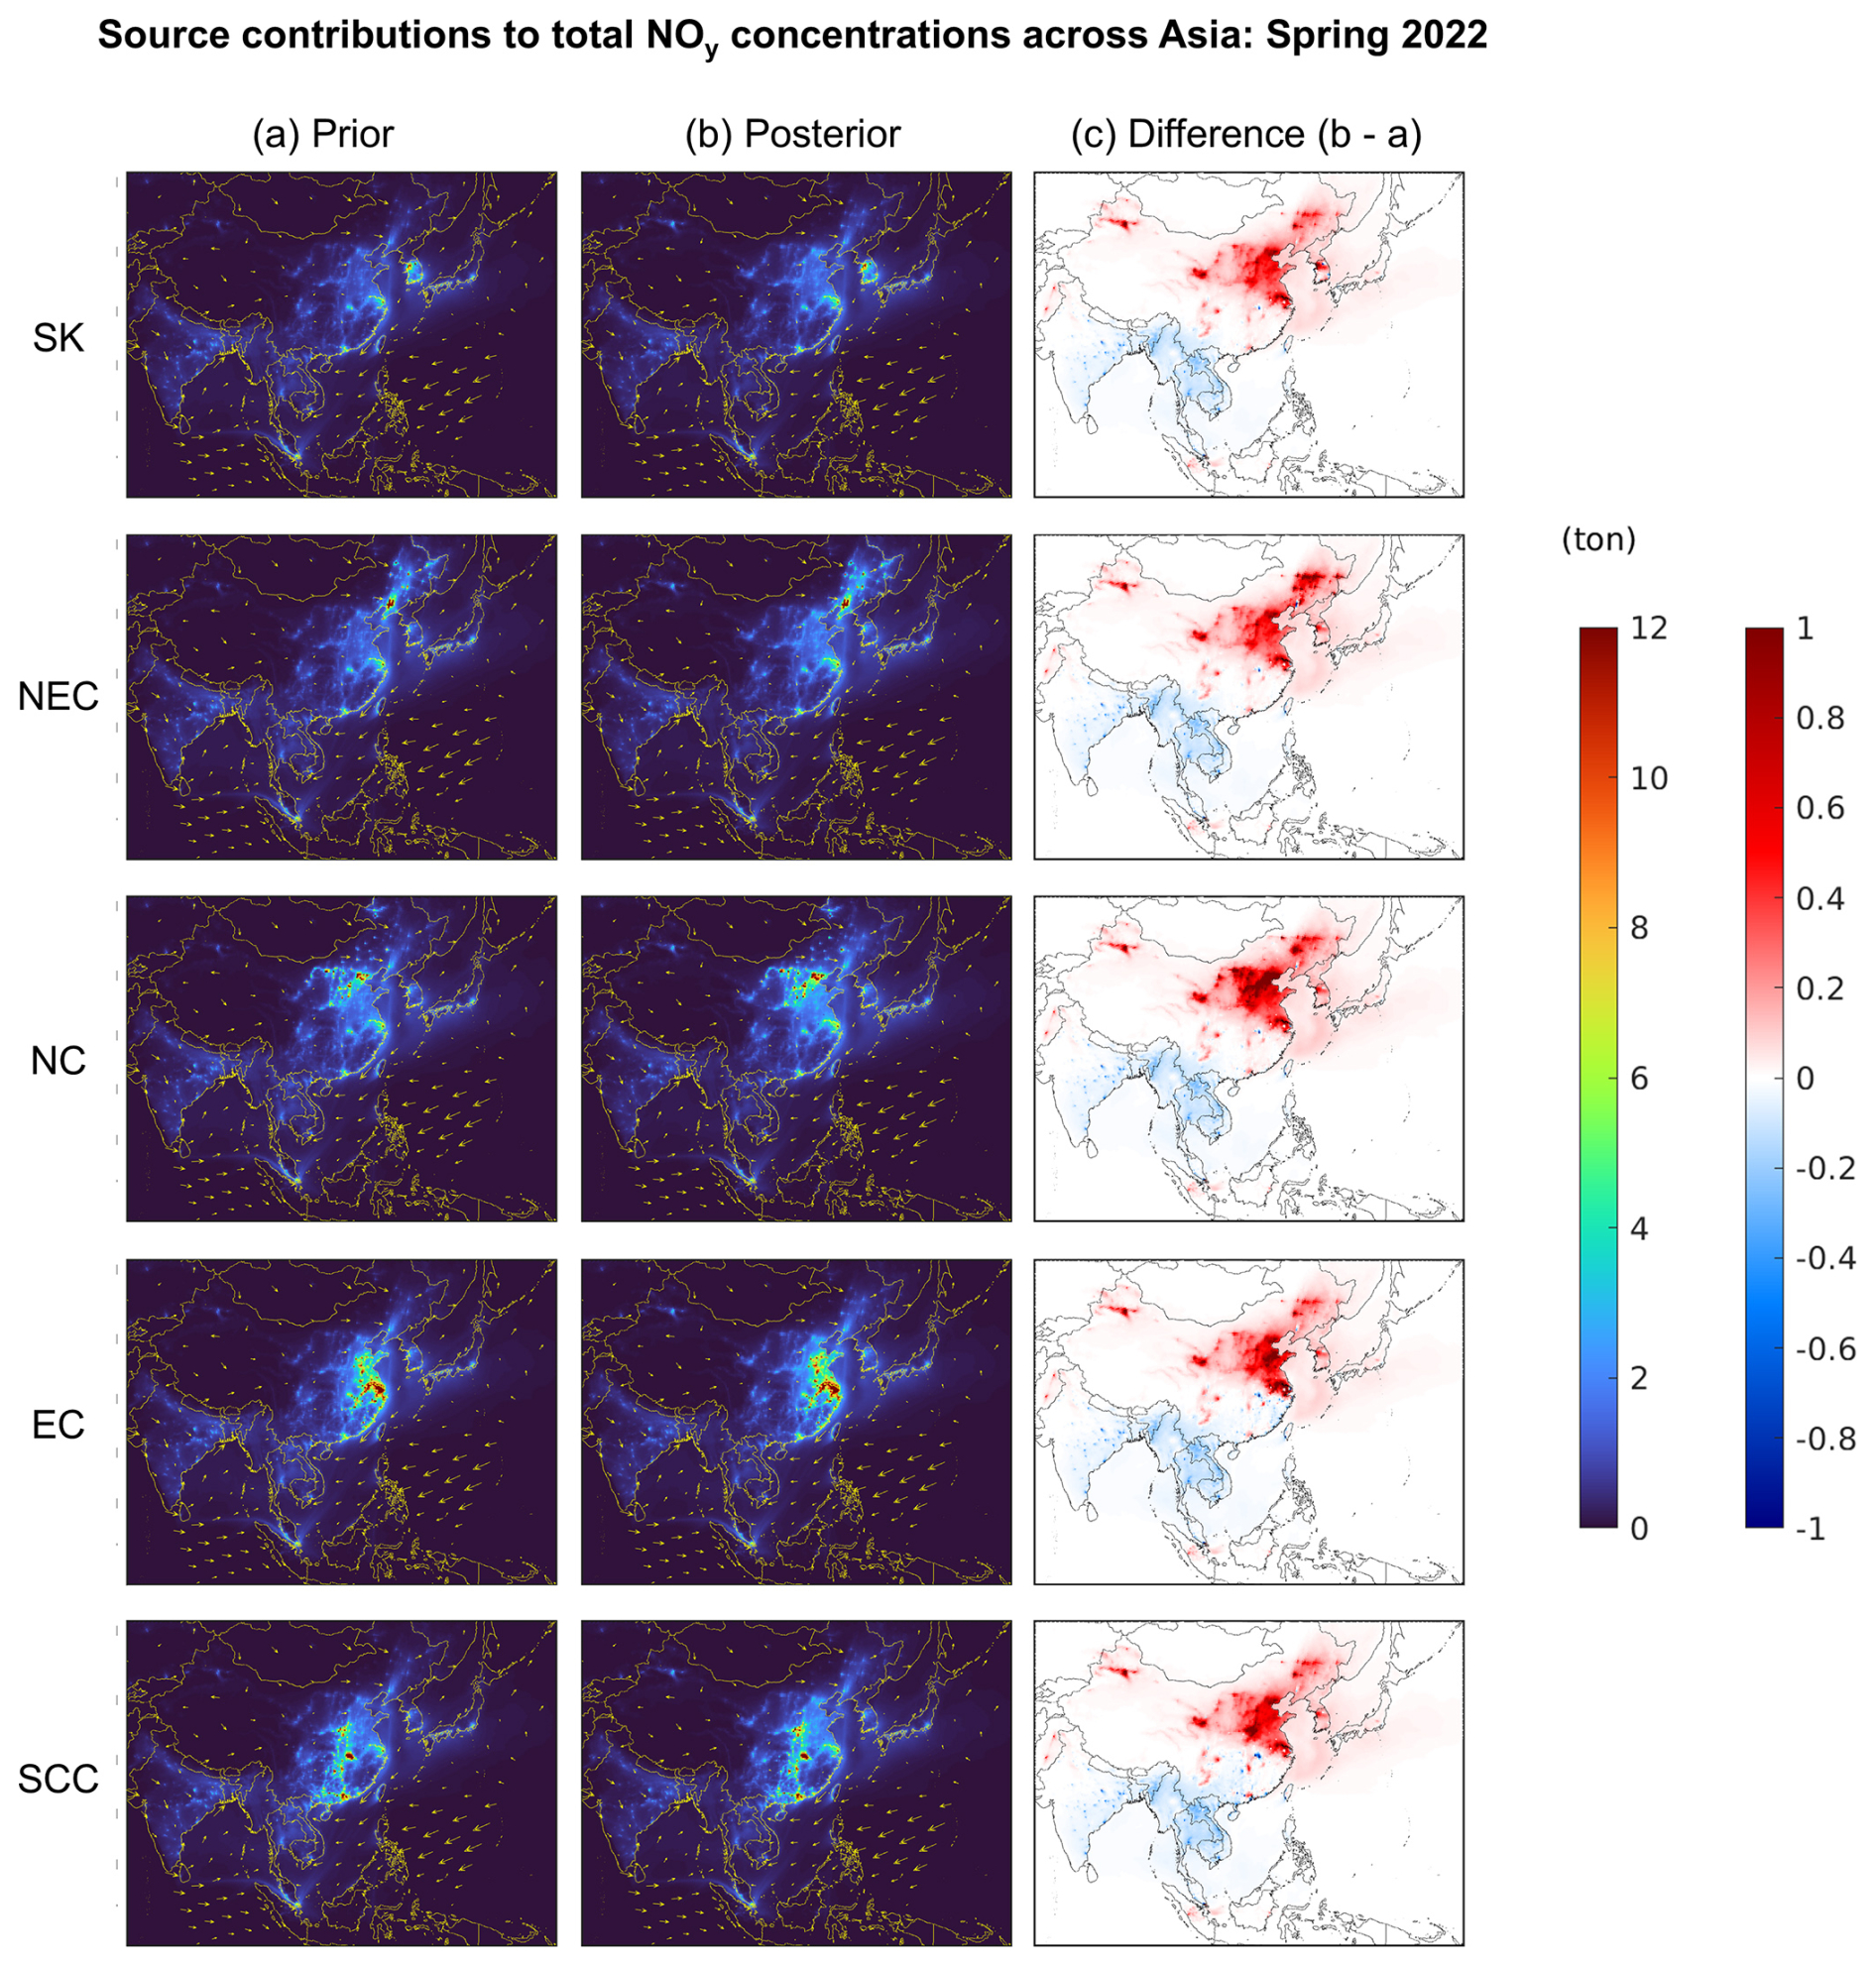
Figure 6Source contributions to springtime NOy concentrations (metric tons) within the PBL across Asia accumulated during the period from March to May 2022: (a) contributions quantified based on the simulations using the a priori NOx emissions, (b) contributions quantified based on the simulations using the a posteriori NOx emissions, and (c) their differences (panel b minus panel a).
3.3 Implications for PM2.5 concentrations
While our study primarily focused on NOy loadings, the updates to the inventoried extent of NOx emissions also affected surface PM2.5 concentrations across East Asia. While the posterior model generally underestimated PM2.5 concentrations in South Korea and China, the overall increases in NOx emissions after the inversion led to corresponding increases in PM2.5 concentrations, which improved model accuracy to a certain extent in the regions (Fig. 7, Table S3). In South Korea, the use of the a posteriori NOx emissions reduced the extent of the model underestimation in PM2.5 concentrations from −21.01 % to −16.95 % on average during the winter–spring transition, leading to a slight improvement in the IOA from 0.86 to 0.88, indicating better alignment between modeled and observed concentrations in the region. The improvement was less pronounced in China, where the model underestimation was only slightly reduced from −32.50 % to −31.05 %, with minor increases in R from 0.61 to 0.64 and the IOA from 0.60 to 0.62. In both South Korea and China, the increases in PM2.5 concentrations seemed to be responsive to the concurrent increases in nitrate aerosol concentrations, a major component of PM2.5. For instance, our previous study across East Asia (Park et al., 2023) suggested that secondary inorganic aerosols, such as nitrate, sulfate, and ammonium, contributed around 53 % of total PM2.5 loadings in South Korea, with nitrate aerosols alone accounting for 21 %, on average, during the year 2019, while primary particulate matter made up around 47 %. The improvements in our model accuracy suggest that the overall upward adjustments to NOx emissions, which likely promoted nitrate aerosol formation, helped remedy the model's prior underestimation of PM2.5 concentrations. However, the underestimation still persisted after the inversion, particularly in China, suggesting a possible underrepresentation of other PM2.5 precursor emissions beyond NOx, such as sulfur dioxide (SO2) and ammonia (NH3), which were outside the scope of our study. Nonetheless, the response of PM2.5 concentrations to the adjustments in NOx emissions reaffirmed the substantial contribution of secondary aerosols, such as nitrate, to regional PM2.5 concentrations across East Asia.
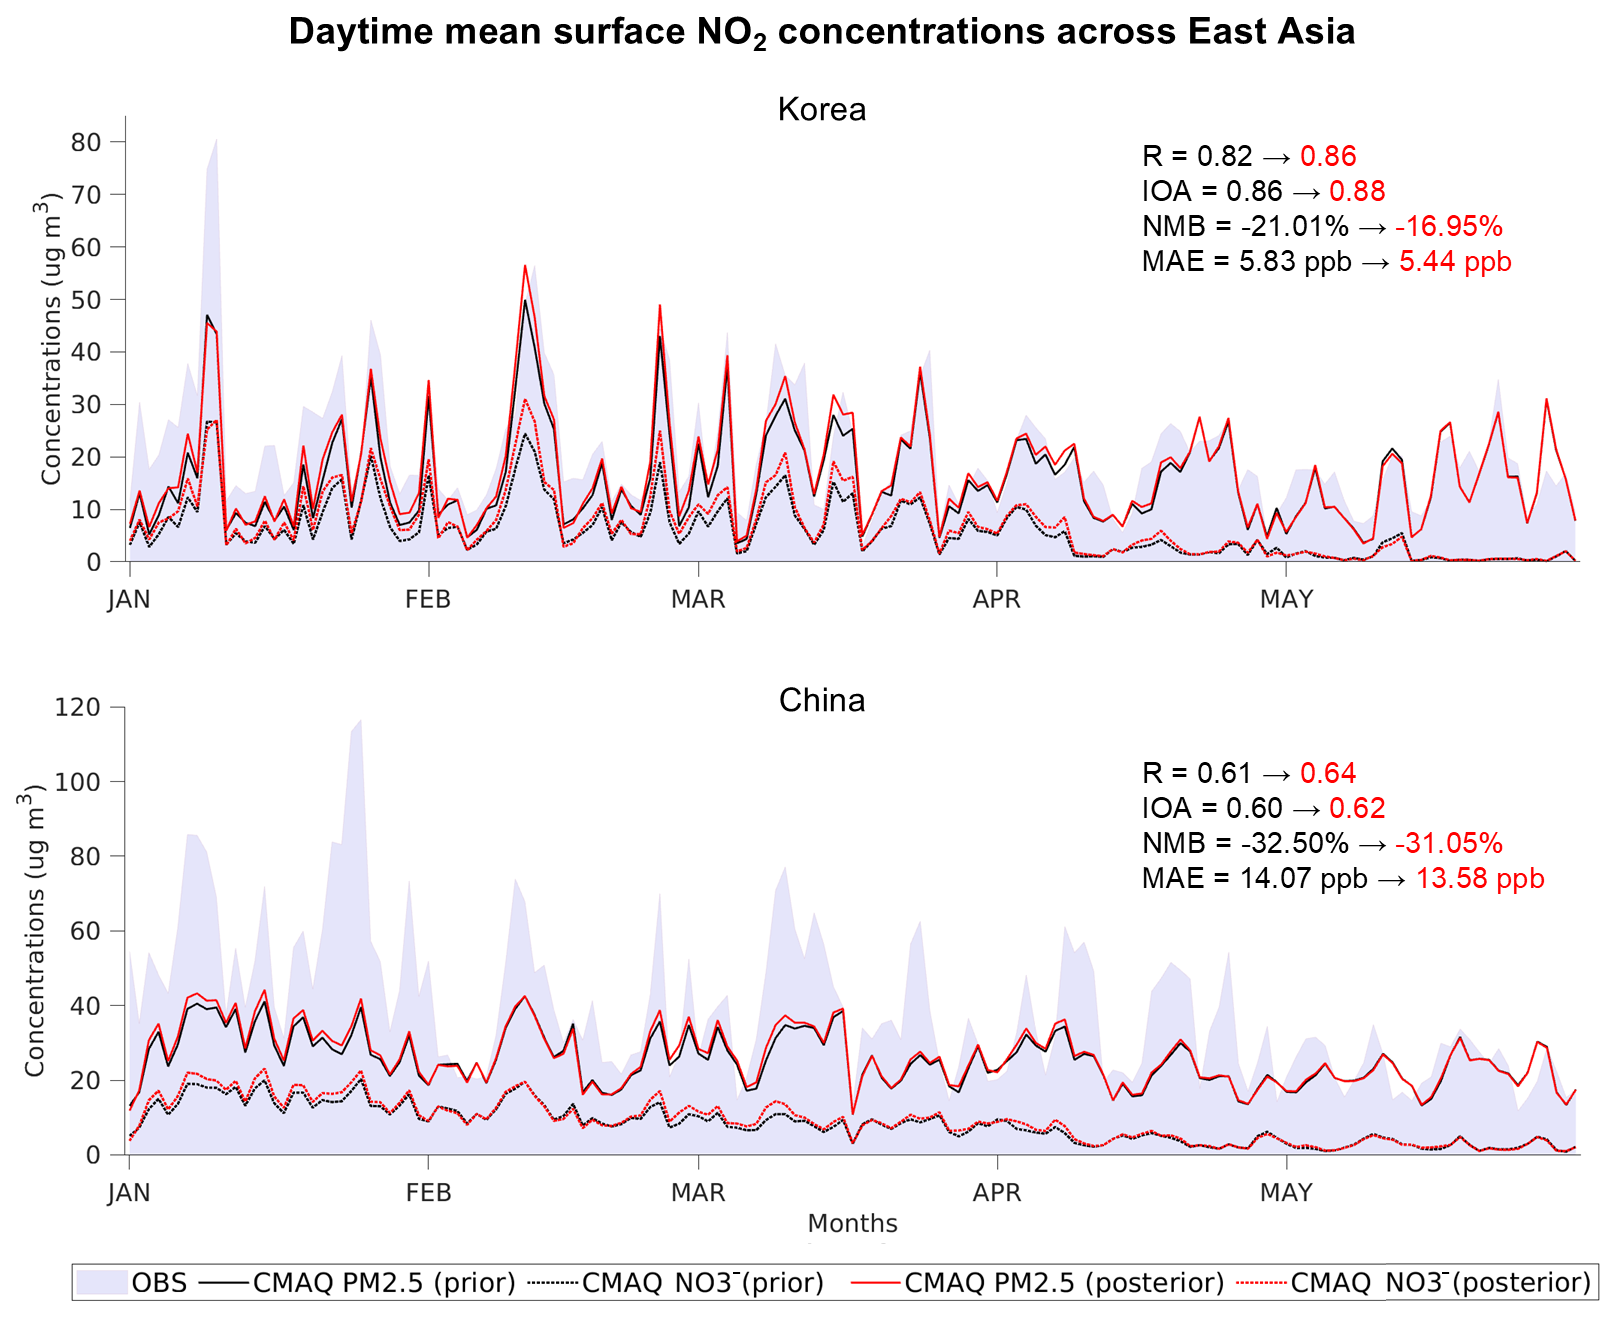
Figure 7Daytime mean surface PM2.5 concentrations observed and modeled at ground-based measurement sites during the period from 1 January to 31 May 2022. OBS denotes the observed concentrations, CMAQ PM2.5 (prior and posterior) denotes the modeled PM2.5 concentrations using the a priori and a posteriori NOx emissions, and CMAQ NO (prior and posterior) denotes the modeled nitrate aerosol (within PM2.5 diameter) concentrations using the a priori and posteriori NOx emissions. Arrows indicate the changes in metrics from the prior model to the posterior model. R is the Pearson correlation coefficient, IOA is the index of agreement, NMB is the normalized mean bias (%), and MAE is the mean absolute error (ppb). Korea indicates South Korea.
Our source apportionment effort, based on refined simulation accuracy, provided seasonal snapshots of NOy transport across East Asia during the 2022 winter–spring transition. Our diurnal updates to the NOx emission inventory led to overall increases in NOx emissions in South Korea and China by 50 % and 33 %, respectively. This suggests that the a priori estimates of NOx emissions from the global dataset might have underrepresented emission patterns to a certain extent, demanding follow-up efforts to better account for local emissions in a more nuanced manner. These increases in the inventoried amount of NOx emissions substantially reduced the extent of the prior model's underestimation of surface NO2 concentrations from −32.75 % to −13.01 % in South Korea and from −10.26 % to −3.04 % in China, underscoring the utility of GEMS data as top-down constraints.
Leveraging the refined simulations, we quantified the local and transboundary contributions of NOx emissions to East Asia's NOy loadings during the winter–spring transition, focusing on our source apportionment regions including North China, Northeast China, East China, South Central China, and South Korea. By comparing how much each region's NOx emissions contributed to its own NOy budget versus neighboring regions under seasonally varying synoptic settings, we assessed the cross-regional pollution transport dynamics and gained insights into source–receptor relationships across major NOx-emitting regions of East Asia. During the winter months, pollutant transport was primarily influenced by strong northwesterly winds driven by the Siberian High, leading to significant transboundary contributions from upwind to downwind areas. As the Siberian High weakened in spring, transport patterns became more multidirectional, allowing pollutants to disperse farther across the regions. This seasonal transition resulted in increased transboundary contributions by up to 16 % as the months progressed, as pollutants spread more extensively across the regions and potentially remained for an extended time near the receptors. From January to May, local contributions steadily decreased from 32 %–43 % to 23 %–30 %, while transboundary contributions showed an increasing trend from 16 %–33 % to 27 %–37 %. Some regions maintained their consistent contributions to East Asia's NOy loadings, whereas others showed noticeable fluctuations in the contributions as the months progressed. North China consistently contributed over 10 % to other regions' NOy concentrations throughout the seasons, while South Korea's contribution gradually increased from 1 %–4 % to 6 %–7 %, highlighting the critical role of seasonal synoptic conditions in governing pollution transport. This shift illustrates how a once less influential source region can become a significant contributor as seasons progress. While East China and South Central China substantially contributed to each other's NOy budget by 9 %–12 %, South Central China consistently experienced transboundary impacts that consistently exceeded its local contribution by 5 %, indicating its vulnerability to pollution transport. These findings highlight the complexity of seasonal pollution dynamics and the evolving nature of transboundary impacts, underscoring the need for adaptive air quality management strategies that account for shifting transport patterns between emission sources and receptor regions.
A limitation of our study is that the source apportionment was largely confined to East Asia, despite our simulation domain covering the entirety of Asia. This limitation was primarily due to our study's objective, which necessitated improving model accuracy through indirect evaluation of the a posteriori emission inventory's reliability and comparing modeled surface NO2 concentrations against station measurements, which were available only for South Korea and China during the study period. The absence of ground-based measurements from other regions in Asia during this period restricted the validation of the model's performance outside East Asia, limiting the broader applicability of our findings. Nonetheless, our study provides a comprehensive perspective on NOy transport dynamics, addressing the broader geographic context and extended simulation period that demand a more rigorous investigation. Future studies could build upon this approach by extending the study period to cover additional seasons, such as summer and fall, to capture year-round pollution transport dynamics. A long-term, decadal study could reveal evolving trends in transboundary pollution, particularly during the winter–spring transition, and provide deeper insights into how policy changes, economic developments, and climate variations shape pollution patterns over time. These follow-up investigations would offer a more comprehensive understanding of East Asia's air quality challenges and further support the development of adaptive, long-term strategies for managing transboundary air pollution.
The GEMS Level 2 NO2 product is available from the Korea National Institute of Environmental Research (https://nesc.nier.go.kr/ko/html/svc/openapi/explain.do; Environmental Satellite Center, 2024), managed by the NIER's Environmental Satellite Center. Quality-assured AirKorea measurement datasets are available from the AirKorea website at https://www.airkorea.or.kr/web/last_amb_hour_data?pMENU_NO=123 (AirKorea, 2024). MEE measurement datasets are available from an online archive at https://quotsoft.net/air/ (Quosoft, 2024), originally sourced from the China National Environmental Monitoring Center (CNEMC) database.
The supplement related to this article is available online at https://doi.org/10.5194/acp-25-4291-2025-supplement.
JP took the lead with respect to drafting the original manuscript. JP and YC set up the experimental design. JP set up the models and conducted air quality simulations. JP and SK performed top-down adjustments to the emission inventory. JP conducted source apportionment. JP, YC, and SK evaluated the emission adjustment and source apportionment outcomes. YC provided overall context as a principal investigator and supervised the research. All authors discussed the results and exchanged feedback to prepare the final version of the manuscript draft.
The contact author has declared that none of the authors has any competing interests.
Publisher’s note: Copernicus Publications remains neutral with regard to jurisdictional claims made in the text, published maps, institutional affiliations, or any other geographical representation in this paper. While Copernicus Publications makes every effort to include appropriate place names, the final responsibility lies with the authors. Regarding the maps used in this paper, please note that Figs. 1, 2, 5, and 6 contain disputed territories.
This work was partially supported by a grant from the National Institute of Environment Research (NIER), funded by the Ministry of Environment (MOE) of the Republic of Korea (grant no. NIER-2023-04-02-082). We thank the Research Computing Data Core at University of Houston for providing the supercomputing resources that supported this work.
This research has been supported by the National Institute of Environmental Research (grant no. NIER-2023-04-02-082).
This paper was edited by Farahnaz Khosrawi and reviewed by two anonymous referees.
AirKorea: Quality-assured (final) air quality station measurement dataset, Korea Ministry of Environment [data set], https://www.airkorea.or.kr/web/last_amb_hour_data?pMENU_NO=123, last access: 16 October 2024 (in Korean).
Bae, C., Kim, B.-U., Kim, H. C., Yoo, C., and Kim, S.: Long-range transport influence on key chemical components of PM2.5 in the Seoul Metropolitan Area, South Korea, during the years 2012–2016, Atmosphere-Basel, 11, 1, https://doi.org/10.3390/atmos11010048, 2020.
Beirle, S., Boersma, K. F., Platt, U., Lawrence, M. G., and Wagner, T.: Megacity emissions and lifetimes of nitrogen oxides probed from space, Science, 333, 1737–1739, 2011.
Byun, D. and Schere, K. L.: Review of the governing equations, computational algorithms, and other components of the Models-3 Community Multiscale Air Quality (CMAQ) modeling system, Appl. Mech. Rev., 59, 51–77, https://doi.org/10.1115/1.2128636, 2006.
Carmichael, G. R., Calori, G., Hayami, H., Uno, I., Cho, S. Y., Engardt, M., Kim, S.-B., Ichikawa, Y., Ikeda, Y., Woo, J.-H., Ueda, H., and Amann, M.: The MICS-Asia study: Model intercomparison of long-range transport and sulfur deposition in East Asia, Atmos. Environ., 36, 175–199, https://doi.org/10.1016/S1352-2310(01)00448-4, 2002.
Chen, D., Xia, L., Guo, X., Lang, J., Zhou, Y., Wei, L., and Fu, X.: Impact of inter-annual meteorological variation from 2001 to 2015 on the contribution of regional transport to PM2.5 in Beijing, China, Atmos. Environ., 260, 118545, https://doi.org/10.1016/j.atmosenv.2021.118545, 2021.
Choi, W. J., Moon, K.-J., Yoon, J., Cho, A., Kim, S., Lee, S., Ko, D. ho, Kim, J., Ahn, M. H., Kim, D.-R., Kim, S.-M., Kim, J.-Y., Nicks, D., and Kim, J.-S.: Introducing the geostationary environment monitoring spectrometer, J. Appl. Remote. Sens., 12, 044005, https://doi.org/10.1117/1.JRS.12.044005, 2018.
Clough, S. A., Shephard, M. W., Mlawer, E. J., Delamere, J. S., Iacono, M. J., Cady-Pereira, K., Boukabara, S., and Brown, P. D.: Atmospheric radiative transfer modeling: A summary of the AER codes, J. Quant. Spectrosc. Ra., 91, 233–244, https://doi.org/10.1016/j.jqsrt.2004.05.058, 2005.
Collet, S., Kidokoro, T., Karamchandani, P., Jung, J., and Shah, T.: Future year ozone source attribution modeling study using CMAQ-ISAM, J. Air. Waste. Manage., 68, 1239–1247, https://doi.org/10.1080/10962247.2018.1496954, 2018.
Crippa, M., Solazzo, E., Huang, G., Guizzardi, D., Koffi, E., Muntean, M., Schieberle, C., Friedrich, R., and Janssens-Maenhout, G.: High resolution temporal profiles in the Emissions Database for Global Atmospheric Research, Sci. Data, 7, 1, https://doi.org/10.1038/s41597-020-0462-2, 2020.
Dong, Z., Wang, S., Xing, J., Chang, X., Ding, D., and Zheng, H.: Regional transport in Beijing-Tianjin-Hebei region and its changes during 2014–2017: The impacts of meteorology and emission reduction, Sci. Total Environ., 737, 139792, https://doi.org/10.1016/j.scitotenv.2020.139792, 2020.
Eck, T. F., Holben, B. N., Kim, J., Beyersdorf, A. J., Choi, M., Lee, S., Koo, J.-H., Giles, D. M., Schafer, J. S., Sinyuk, A., Peterson, D. A., Reid, J. S., Arola, A., Slutsker, I., Smirnov, A., Sorokin, M., Kraft, J., Crawford, J. H., Anderson, B. E., Thornhill, K. L., Diskin, G., Kim, S., and Park, S.: Influence of cloud, fog, and high relative humidity during pollution transport events in South Korea: Aerosol properties and PM2.5 variability, Atmos. Environ., 232, 117530, https://doi.org/10.1016/j.atmosenv.2020.117530, 2020.
Environmental Satellite Center: GEMS Level 2 Tropospheric NO2 product, Korea National Institute of Environmental Research [data set], https://nesc.nier.go.kr/ko/html/svc/openapi/explain.do, last access: 16 October 2024 (in Korean).
Feng, X., Zhang, X., and Wang, J.: Update of SO2 emission inventory in the Megacity of Chongqing, China by inverse modeling, Atmos. Environ., 294, 119519, https://doi.org/10.1016/j.atmosenv.2022.119519, 2023.
Goldberg, D. L., Saide, P. E., Lamsal, L. N., de Foy, B., Lu, Z., Woo, J.-H., Kim, Y., Kim, J., Gao, M., Carmichael, G., and Streets, D. G.: A top-down assessment using OMI NO2 suggests an underestimate in the NOx emissions inventory in Seoul, South Korea, during KORUS-AQ, Atmos. Chem. Phys., 19, 1801–1818, https://doi.org/10.5194/acp-19-1801-2019, 2019.
Goldberg, D. L., Tao, M., Kerr, G. H., Ma, S., Tong, D. Q., Fiore, A. M., Dickens, A. F., Adelman, Z. E., and Anenberg, S. C.: Evaluating the spatial patterns of U.S. urban NOx emissions using TROPOMI NO2, Remote. Sens. Environ., 300, 113917. https://doi.org/10.1016/j.rse.2023.113917, 2024.
Guenther, A., Jiang, X., Shah, T., Huang, L., Kemball-Cook, S., and Yarwood, G.: Model of Emissions of Gases and Aerosol from Nature Version 3 (MEGAN3) for Estimating Biogenic Emissions, In C. Mensink, W. Gong, and A. Hakami (Eds.), Air Pollution Modeling and its Application XXVI, 187–192, Springer International Publishing, https://doi.org/10.1007/978-3-030-22055-6_29, 2020.
Han, X., Cai, J., Zhang, M., and Wang, X.: Numerical simulation of interannual variation in transboundary contributions from Chinese emissions to PM2.5 mass burden in South Korea, Atmos. Environ., 256, 118440, https://doi.org/10.1016/j.atmosenv.2021.118440, 2021.
Hertel, O., Skjøth, C. A., Reis, S., Bleeker, A., Harrison, R. M., Cape, J. N., Fowler, D., Skiba, U., Simpson, D., Jickells, T., Kulmala, M., Gyldenkærne, S., Sørensen, L. L., Erisman, J. W., and Sutton, M. A.: Governing processes for reactive nitrogen compounds in the European atmosphere, Biogeosciences, 9, 4921–4954, https://doi.org/10.5194/bg-9-4921-2012, 2012.
Hoek, G., Krishnan, R. M., Beelen, R., Peters, A., Ostro, B., Brunekreef, B., and Kaufman, J. D.: Long-term air pollution exposure and cardio- respiratory mortality: A review, Environ. Health, 12, 43, https://doi.org/10.1186/1476-069X-12-43, 2013.
Houyoux, M. R., Vukovich, J. M., Coats Jr., C. J., Wheeler, N. J. M., and Kasibhatla, P. S.: Emission inventory development and processing for the Seasonal Model for Regional Air Quality (SMRAQ) project, J. Geophys. Res-Atmos., 105, 9079–9090, https://doi.org/10.1029/1999JD900975, 2000.
Hui, G.: Comparison of East Asian winter monsoon indices, Adv. Geosci., 10, 31–37, https://doi.org/10.5194/adgeo-10-31-2007, 2007.
Iacono, M. J., Delamere, J. S., Mlawer, E. J., Shephard, M. W., Clough, S. A., and Collins, W. D.: Radiative forcing by long-lived greenhouse gases: Calculations with the AER radiative transfer models, J. Geophys. Res.-Atmos., 113, D13103, https://doi.org/10.1029/2008JD009944, 2008.
Ikeda, K., Yamaji, K., Kanaya, Y., Taketani, F., Pan, X., Komazaki, Y., Kurokawa, J., and Ohara, T.: Source region attribution of PM2.5 mass concentrations over Japan, Geochem. J., 49, 185–194, https://doi.org/10.2343/geochemj.2.0344, 2015.
Itahashi, S., Uno, I., and Kim, S.: Source contributions of sulfate aerosol over East Asia estimated by CMAQ-DDM, Environ. Sci. Technol., 46, 6733–6741, https://doi.org/10.1021/es300887w, 2012.
Jeon, W., Choi, Y., Lee, H. W., Lee, S.-H., Yoo, J.-W., Park, J., and Lee, H.-J.: A quantitative analysis of grid nudging effect on each process of PM2.5 production in the Korean Peninsula, Atmos. Environ., 122, 763–774, https://doi.org/10.1016/j.atmosenv.2015.10.050, 2015.
Jiang, Z., Vargas, M., and Csiszar, I.: New operational real-time daily rolling weekly Green Vegetation fraction product derived from suomi NPP VIIRS reflectance data. 2016 IEEE International Geoscience and Remote Sensing Symposium (IGARSS), Beijing, China, 10–15 July 2016, 3524–3527, https://doi.org/10.1109/IGARSS.2016.7729911, 2016.
Jordan, C. E., Crawford, J. H., Beyersdorf, A. J., Eck, T. F., Halliday, H. S., Nault, B. A., Chang, L.-S., Park, J., Park, R., Lee, G., Kim, H., Ahn, J., Cho, S., Shin, H. J., Lee, J. H., Jung, J., Kim, D.-S., Lee, M., Lee, T., Whitehill, A., Szykman, J., Schueneman, M. K., Campuzano-Jost, P., Jimenez, J. L., DiGangi, J. P., Diskin, G. S., Anderson, B. E., Moore, R. H., Ziemba, L. D., Fenn, M. A., Hair, J. W., Kuehn, R. E., Holz, R. E., Chen, G., Travis, K., Shook, M., Peterson, D. A., Lamb, K. D., and Schwarz, J. P.: Investigation of factors controlling PM2.5 variability across the South Korean Peninsula during KORUS-AQ, Elementa-Sci. Anthrop., 8, 28, https://doi.org/10.1525/elementa.424, 2020.
Jung, J., Choi, Y., Wong, D. C., Nelson, D., and Lee, S.: Role of Sea Fog Over the Yellow Sea on Air Quality With the Direct Effect of Aerosols, J. Geophys. Res.-Atmos., 126, e2020JD033498. https://doi.org/10.1029/2020JD033498, 2021.
Jung, J., Choi, Y., Souri, A. H., Mousavinezhad, S., Sayeed, A., and Lee, K.: The impact of springtime-transported air pollutants on local air quality with satellite-constrained NOx emission adjustments over East Asia, J. Geophy. Res-Atmos., 127, e2021JD035251, https://doi.org/10.1029/2021JD035251, 2022a.
Jung, J., Choi, Y., Mousavinezhad, S., Kang, D., Park, J., Pouyaei, A., Ghahremanloo, M., Momeni, M., and Kim, H.: Changes in the ozone chemical regime over the contiguous United States inferred by the inversion of NOx and VOC emissions using satellite observation, Atmos. Res., 270, 106076, https://doi.org/10.1016/j.atmosres.2022.106076, 2022b.
Kain, J. S.: The Kain–Fritsch convective parameterization: An update, J. Appl. Meteorol. Clim., 43, 170–181, https://doi.org/10.1175/1520-0450(2004)043<0170:TKCPAU>2.0.CO;2, 2004.
Kajino, M., Sato, K., Inomata, Y., and Ueda, H.: Source–receptor relationships of nitrate in Northeast Asia and influence of sea salt on the long-range transport of nitrate, Atmos. Environ., 79, 67–78, https://doi.org/10.1016/j.atmosenv.2013.06.024, 2013.
Kang, M.-S., Park, D.-S., Chae, C.-B., Sunwoo, Y., and Hong, K.-H.: Monthly characteristics and source–receptor relationships of anthropogenic total nitrate in Northeast Asia, Atmosphere-Basel, 15, 9, https://doi.org/10.3390/atmos15091121, 2024.
Kashfi Yeganeh, A., Momeni, M., Choi, Y., Park, J., and Jung, J.: A case study of surface ozone source contributions in the Seoul metropolitan area using the adjoint of CMAQ, Japca. J. Air. Waste. Ma, 74, 511–530, https://doi.org/10.1080/10962247.2024.2361021, 2024.
Kim, Y., Kim, K.-Y., and Jhun, J.-G.: Seasonal evolution mechanism of the East Asian winter monsoon and its interannual variability, Clim. Dynam., 41, 1213–1228, https://doi.org/10.1007/s00382-012-1491-0, 2013.
Kwok, R. H. F., Baker, K. R., Napelenok, S. L., and Tonnesen, G. S.: Photochemical grid model implementation and application of VOC, NOx, and O3 source apportionment, Geoscie. Model Dev., 8, 99–114, https://doi.org/10.5194/gmd-8-99-2015, 2015.
Lange, K., Richter, A., and Burrows, J. P.: Variability of nitrogen oxide emission fluxes and lifetimes estimated from Sentinel-5P TROPOMI observations, Atmos. Chem. Phys., 22, 2745–2767, https://doi.org/10.5194/acp-22-2745-2022, 2022.
Lee, H.-J., Jo, H.-Y., Song, C.-K., Jo, Y.-J., Park, S.-Y., and Kim, C.-H.: Sensitivity of simulated PM2.5 concentrations over northeast Asia to different secondary organic aerosol modules during the KORUS-AQ campaign, Atmosphere-Basel, 11, 9, https://doi.org/10.3390/atmos11091004, 2020.
Li, M., Liu, H., Geng, G., Hong, C., Liu, F., Song, Y., Tong, D., Zheng, B., Cui, H., Man, H., Zhang, Q., and He, K: Anthropogenic emission inventories in China: A review, Natl. Sci. Rev., 4, 834–866, https://doi.org/10.1093/nsr/nwx150, 2017a.
Li, Z., Guo, J., Ding, A., Liao, H., Liu, J., Sun, Y., Wang, T., Xue, H., Zhang, H., and Zhu, B.: Aerosol and boundary-layer interactions and impact on air quality, Natl. Sci. Rev., 4, 810–833, https://doi.org/10.1093/nsr/nwx117, 2017b.
Li, R., Mei, X., Wei, L., Han, X., Zhang, M., and Jing, Y.: Study on the contribution of transport to PM2.5 in typical regions of China using the regional air quality model RAMS-CMAQ, Atmos. Environ., 214, 116856, https://doi.org/10.1016/j.atmosenv.2019.116856, 2019.
Li, M., McDonald, B. C., McKeen, S. A., Eskes, H., Levelt, P., Francoeur, C., Harkins, C., He, J., Barth, M., Henze, D. K., Bela, M. M., Trainer, M., de Gouw, J. A., and Frost, G. J.: Assessment of Updated Fuel-Based Emissions Inventories Over the Contiguous United States Using TROPOMI NO2 Retrievals, J. Geophys. Res.-Atmos., 126, e2021JD035484, https://doi.org/10.1029/2021JD035484, 2021a.
Li, N., Tang, K., Wang, Y., Wang, J., Feng, W., Zhang, H., Liao, H., Hu, J., Long, X., Shi, C., and Su, X.: Is the efficacy of satellite-based inversion of SO2 emission model dependent?, Environ. Res. Lett., 16, 035018, https://doi.org/10.1088/1748-9326/abe829, 2021b.
Lin, J.-T., Liu, Z., Zhang, Q., Liu, H., Mao, J., and Zhuang, G.: Modeling uncertainties for tropospheric nitrogen dioxide columns affecting satellite-based inverse modeling of nitrogen oxides emissions, Atmos. Chem. Phys., 12, 12255–12275, https://doi.org/10.5194/acp-12-12255-2012, 2012.
Liu, F., Beirle, S., Zhang, Q., Dörner, S., He, K., and Wagner, T.: NOx lifetimes and emissions of cities and power plants in polluted background estimated by satellite observations, Atmos. Chem. Phys., 16, 5283–5298, https://doi.org/10.5194/acp-16-5283-2016, 2016.
Liu, B., Jin, Y., and Li, C.: Analysis and prediction of air quality in Nanjing from autumn 2018 to summer 2019 using PCR–SVR–ARMA combined model, Sci. Rep.-UK, 11, 348, https://doi.org/10.1038/s41598-020-79462-0, 2021.
Martin, R. V., Jacob, D. J., Chance, K., Kurosu, T. P., Palmer, P. I., and Evans, M. J.: Global inventory of nitrogen oxide emissions constrained by space-based observations of NO2 columns, J. Geophys. Res.-Atmos., 108, 4537, https://doi.org/10.1029/2003JD003453, 2003.
Momeni, M., Choi, Y., Kashfi Yeganeh, A., Pouyaei, A., Jung, J., Park, J., Shephard, M. W., Dammers, E., and Cady-Pereira, K. E.: Constraining East Asia ammonia emissions through satellite observations and iterative Finite Difference Mass Balance (iFDMB) and investigating its impact on inorganic fine particulate matter, Environ. Int., 184, 108473, https://doi.org/10.1016/j.envint.2024.108473, 2024.
Mun, J., Choi, Y., Jeon, W., Lee, H. W., Kim, C.-H., Park, S.-Y., Bak, J., Jung, J., Oh, I., Park, J., and Kim, D.: Assessing mass balance-based inverse modeling methods via a pseudo-observation test to constrain NOx emissions over South Korea, Atmos. Environ., 292, 119429, https://doi.org/10.1016/j.atmosenv.2022.119429, 2023.
Morrison, H., Thompson, G., and Tatarskii, V.: Impact of cloud microphysics on the development of trailing stratiform precipitation in a simulated squall line: Comparison of one- and two-moment schemes, Mon. Weather. Rev., 137, 991–1007, https://doi.org/10.1175/2008MWR2556.1, 2009.
Napelenok, S. L., Cohan, D. S., Hu, Y., and Russell, A. G.: Decoupled direct 3D sensitivity analysis for particulate matter (DDM-3D/PM), Atmos. Environ., 40, 6112–6121, https://doi.org/10.1016/j.atmosenv.2006.05.039, 2006.
National Institute of Environmental Research (NIER): Geostationary Environment Monitoring Spectrometer (GEMS) algorithm theoretical basis document: NO2 retrieval algorithm,, https://nesc.nier.go.kr/en/html/satellite/doc/doc.do (last access: 30 November 2024), 2020.
Nault, B. A., Campuzano-Jost, P., Day, D. A., Schroder, J. C., Anderson, B., Beyersdorf, A. J., Blake, D. R., Brune, W. H., Choi, Y., Corr, C. A., de Gouw, J. A., Dibb, J., DiGangi, J. P., Diskin, G. S., Fried, A., Huey, L. G., Kim, M. J., Knote, C. J., Lamb, K. D., Lee, T., Park, T., Pusede, S. E., Scheuer, E., Thornhill, K. L., Woo, J.-H., and Jimenez, J. L.: Secondary organic aerosol production from local emissions dominates the organic aerosol budget over Seoul, South Korea, during KORUS-AQ, Atmos. Chem. Phys., 18, 17769–17800, https://doi.org/10.5194/acp-18-17769-2018, 2018.
Newell, K., Kartsonaki, C., Lam, K. B. H., and Kurmi, O.: Cardiorespiratory health effects of gaseous ambient air pollution exposure in low and middle income countries: A systematic review and meta-analysis, Environ. Health., 17, 41, https://doi.org/10.1186/s12940-018-0380-3, 2018.
Pan, L., Tong, D., Lee, P., Kim, H.-C., and Chai, T.: Assessment of NOx and O3 forecasting performances in the U.S. National Air Quality Forecasting Capability before and after the 2012 major emissions updates, Atmos. Environ., 95, 610–619, https://doi.org/10.1016/j.atmosenv.2014.06.020, 2014.
Park, J., Jung, J., Choi, Y., Mousavinezhad, S., and Pouyaei, A.: The sensitivities of ozone and PM2.5 concentrations to the satellite-derived leaf area index over East Asia and its neighboring seas in the WRF-CMAQ modeling system, Environ. Pollut., 306, 119419, https://doi.org/10.1016/j.envpol.2022.119419, 2022.
Park, J., Jung, J., Choi, Y., Lim, H., Kim, M., Lee, K., Lee, Y. G., and Kim, J.: Satellite-based, top-down approach for the adjustment of aerosol precursor emissions over East Asia: the TROPOspheric Monitoring Instrument (TROPOMI) NO2 product and the Geostationary Environment Monitoring Spectrometer (GEMS) aerosol optical depth (AOD) data fusion product and its proxy, Atmos. Meas. Tech., 16, 3039–3057, https://doi.org/10.5194/amt-16-3039-2023, 2023.
Park, J., Choi, Y., Jung, J., Lee, K., and Yeganeh, A. K.: First top-down diurnal adjustment to NOx emissions inventory in Asia informed by the Geostationary Environment Monitoring Spectrometer (GEMS) tropospheric NO2 columns, Sci. Rep-UK, 14, 24338, https://doi.org/10.1038/s41598-024-76223-1, 2024.
Peterson, D. A., Hyer, E. J., Han, S.-O., Crawford, J. H., Park, R. J., Holz, R., Kuehn, R. E., Eloranta, E., Knote, C., Jordan, C. E., and Lefer, B. L.: Meteorology influencing springtime air quality, pollution transport, and visibility in Korea, Elementa, 7, 57, https://doi.org/10.1525/elementa.395, 2019.
Placet, M., Mann, C. O., Gilbert, R. O., and Niefer, M. J., Emissions of ozone precursors from stationary sources: A critical review, Atmos. Environ., 34, 2183–2204, https://doi.org/10.1016/S1352-2310(99)00464-1, 2000.
Pleim, J. E.: A simple, efficient solution of flux–profile relationships in the atmospheric surface layer, J. Appl. Meteorol. Clim., 45, 341–347, https://doi.org/10.1175/JAM2339.1, 2006.
Pleim, J. E.: A combined local and nonlocal closure model for the atmospheric boundary layer Part I: Model description and testing, J. Appl. Meteorol. Clim., 46, 1383–1395, https://doi.org/10.1175/JAM2539.1, 2007a.
Pleim, J. E.: A combined local and nonlocal closure model for the atmospheric boundary layer Part II: Application and evaluation in a mesoscale meteorological model, J. Appl. Meteorol. Clim., 46, 1396–1409, https://doi.org/10.1175/JAM2534.1, 2007b.
Quosoft: National air quality monitoring network dataset, China Ministry of Ecology and Environment [data set], https://quotsoft.net/air, last access: 11 April 2024 (in Chinese).
Rodgers, C. D.: Inverse methods for atmospheric sounding: Theory and practice, Series on Atmospheric, Oceanic and Planetary Physics, World Scientific, World Scientific Publishing, https://doi.org/10.1142/3171, 2000.
Rohde, R. A. and Muller, R. A.: Air pollution in China: Mapping of concentrations and sources, PLOS ONE, 10, e0135749, https://doi.org/10.1371/journal.pone.0135749, 2015.
Russo, M. A., Gama, C., and Monteiro, A.: How does upgrading an emissions inventory affect air quality simulations?, Air. Qual. Atmos. Hlth., 12, 731–741, https://doi.org/10.1007/s11869-019-00692-x, 2019.
Rypdal, K. and Winiwarter, W.: Uncertainties in greenhouse gas emission inventories – Evaluation, comparability and implications, Environ. Sci. Policy., 4, 107–116, https://doi.org/10.1016/S1462-9011(00)00113-1, 2001.
Ryu, Y.-H. and Min, S.-K.: Anthropogenic warming degrades spring air quality in Northeast Asia by enhancing atmospheric stability and transboundary transport, Npj. Clim. Atmos. Sci., 7, 1–10, https://doi.org/10.1038/s41612-024-00603-7, 2024.
Sargent, M. R., Floerchinger, C., McKain, K., Budney, J., Gottlieb, E. W., Hutyra, L. R., Rudek, J., and Wofsy, S. C.: Majority of US urban natural gas emissions unaccounted for in inventories, P. Natl. Acad. Sci. USA, 118, e2105804118, https://doi.org/10.1073/pnas.2105804118, 2021.
Shen, A., Liu, Y., Lu, X., Wang, X., Chang, M., Zhang, J., Tian, C., and Fan, Q.: Sulfur deposition in the Beijing-Tianjin-Hebei region, China: Spatiotemporal characterization and regional source attributions, Atmos. Environ., 286, 119225, https://doi.org/10.1016/j.atmosenv.2022.119225, 2022.
Shimadera, H., Hayami, H., Chatani, S., Morino, Y., Mori, Y., Morikawa, T., Yamaji, K., and Ohara, T.: Sensitivity analyses of factors influencing CMAQ performance for fine particulate nitrate, J. Air. Waste. Manage., 64, 374–387, https://doi.org/10.1080/10962247.2013.778919, 2014.
Silver, B., Reddington, C. L., Arnold, S. R., and Spracklen, D. V.: Substantial changes in air pollution across China during 2015–2017, Environ. Res. Lett., 13, 114012, https://doi.org/10.1088/1748-9326/aae718, 2018.
Skamarock, W. C., Klemp, J. B., Dudhia, J., Gill, D. O., Barker, D., Duda, M. G., Huang, X.-Y., Wang, W., and Powers, J. G.: A description of the advanced research WRF version 3, NCAR technical note, No. NCAR/TN-475CSTR, University Corporation for Atmospheric Research, https://doi.org/10.5065/D68S4MVH, 2008.
Smith, S. J., McDuffie, E. E., and Charles, M.: Opinion: Coordinated development of emission inventories for climate forcers and air pollutants, Atmos. Chem. Phys., 22, 13201–13218, https://doi.org/10.5194/acp-22-13201-2022, 2022.
Son, K., Kim, B.-U., Kim, H. C., and Kim, S.: Source apportionment of ambient concentration and population exposure to elemental carbon in South Korea using a three-dimensional air quality model, Air. Qual. Atmos. Hlth., 15, 1729–1744, https://doi.org/10.1007/s11869-022-01213-z, 2022.
Souri, A. H., Choi, Y., Jeon, W., Li, X., Pan, S., Diao, L., and Westenbarger, D. A.: Constraining NOx emissions using satellite NO2 measurements during 2013 DISCOVER-AQ Texas campaign, Atmos. Environ., 131, 371–381, https://doi.org/10.1016/j.atmosenv.2016.02.020, 2016.
Souri, A. H., Choi, Y., Jeon, W., Woo, J.-H., Zhang, Q., and Kurokawa, J.: Remote sensing evidence of decadal changes in major tropospheric ozone precursors over East Asia, J. Geophys. Res.-Atmos., 122, 2474–2492, https://doi.org/10.1002/2016JD025663, 2017.
Souri, A. H., Choi, Y., Pan, S., Curci, G., Nowlan, C. R., Janz, S. J., Kowalewski, M. G., Liu, J., Herman, J. R., and Weinheimer, A. J.: First Top-Down Estimates of Anthropogenic NOx Emissions Using High-Resolution Airborne Remote Sensing Observations, J. Geophys. Res-Atmos., 123, 3269–3284, https://doi.org/10.1002/2017JD028009, 2018.
Souri, A. H., Nowlan, C. R., González Abad, G., Zhu, L., Blake, D. R., Fried, A., Weinheimer, A. J., Wisthaler, A., Woo, J.-H., Zhang, Q., Chan Miller, C. E., Liu, X., and Chance, K.: An inversion of NOx and non-methane volatile organic compound (NMVOC) emissions using satellite observations during the KORUS-AQ campaign and implications for surface ozone over East Asia, Atmos. Chem. Phys., 20, 9837–9854, https://doi.org/10.5194/acp-20-9837-2020, 2020.
Sun, M., Cui, J., Zhao, X., and Zhang, J.: Impacts of precursors on peroxyacetyl nitrate (PAN) and relative formation of PAN to ozone in a southwestern megacity of China, Atmos. Environ., 231, 117542, https://doi.org/10.1016/j.atmosenv.2020.117542, 2020.
Tang, B., Saide, P. E., Gao, M., Carmichael, G. R., and Stanier, C. O.: WRF-Chem quantification of transport events and emissions sensitivity in Korea during KORUS-AQ, Elementa-Sci. Anthrop., 11, 00096, https://doi.org/10.1525/elementa.2022.00096, 2023.
Wang, S., Zhang, Q., Martin, R. V., Philip, S., Liu, F., Li, M., Jiang, X., and He, K.: Satellite measurements oversee China's sulfur dioxide emission reductions from coal-fired power plants, Environ. Res. Lett., 10, 114015, https://doi.org/10.1088/1748-9326/10/11/114015, 2015.
Wang, C.-Y., Chen, J.-P., and Wang, W.-C.: Meteorology-driven PM2.5 interannual variability over East Asia, Sci. Total. Environ., 904, 166911, https://doi.org/10.1016/j.scitotenv.2023.166911, 2023.
Wiedinmyer, C., Akagi, S. K., Yokelson, R. J., Emmons, L. K., Al-Saadi, J. A., Orlando, J. J., and Soja, A. J.: The Fire INventory from NCAR (FINN): a high resolution global model to estimate the emissions from open burning, Geosci. Model Dev., 4, 625–641, https://doi.org/10.5194/gmd-4-625-2011, 2011.
Woo, J.-H., Kim, Y., Kim, H.-K., Choi, K.-C., Eum, J.-H., Lee, J.-B., Lim, J.-H., Kim, J., and Seong, M.: Development of the CREATE inventory in support of integrated climate and air quality modeling for Asia, Sustainability-Basel, 12, 7930, https://doi.org/10.3390/su12197930, 2020.
Wu, C.-H.: Seasonal adjustment of particulate matter pollution in coastal East Asia during the 2020 COVID lockdown, Environ. Res. Lett., 16, 124023, https://doi.org/10.1088/1748-9326/ac343c, 2021.
Wyrwoll, K.-H., Wei, J., Lin, Z., Shao, Y., and He, F.: Cold surges and dust events: Establishing the link between the East Asian Winter Monsoon and the Chinese loess record, Quaternary Sci. Rev., 149, 102–108. https://doi.org/10.1016/j.quascirev.2016.04.015, 2016.
Xian, Y., Zhang, Y., Liu, Z., Wang, H., and Xiong, T.: Characterization of winter PM2.5 source contributions and impacts of meteorological conditions and anthropogenic emission changes in the Sichuan Basin, 2002–2020, Sci. Total. Environ., 947, 174557, https://doi.org/10.1016/j.scitotenv.2024.174557, 2024.
Xiu, A. and Pleim, J. E.: Development of a land surface model Part I: Application in a mesoscale meteorological model, J. Appl. Meteorol. Clim., 40, 192–209, https://doi.org/10.1175/1520-0450(2001)040<0192:DOALSM>2.0.CO;2, 2001.
Yuan, H., Dai, Y., Xiao, Z., Ji, D., and Shangguan, W.: Reprocessing the MODIS Leaf Area Index products for land surface and climate modelling, Remote Sens. Environ., 115, 1171–1187, https://doi.org/10.1016/j.rse.2011.01.001, 2011.
Yuan, J., Ling, Z., Wang, Z., Lu, X., Fan, S., He, Z., Guo, H., Wang, X., and Wang, N.: PAN–precursor relationship and process analysis of PAN variations in the Pearl River Delta region, Atmosphere-Basel, 9, 10, https://doi.org/10.3390/atmos9100372, 2018.
Yumimoto, K., Uno, I., and Itahashi, S.: Long-term inverse modeling of Chinese CO emission from satellite observations, Environ. Pollut., 195, 308–318, https://doi.org/10.1016/j.envpol.2014.07.026, 2014.
Zhai, S., Jacob, D. J., Wang, X., Shen, L., Li, K., Zhang, Y., Gui, K., Zhao, T., and Liao, H.: Fine particulate matter (PM2.5) trends in China, 2013–2018: separating contributions from anthropogenic emissions and meteorology, Atmos. Chem. Phys., 19, 11031–11041, https://doi.org/10.5194/acp-19-11031-2019, 2019.
Zhao, S., Feng, T., Tie, X., Li, G., and Cao, J.: Air Pollution Zone Migrates South Driven by East Asian Winter Monsoon and Climate Change, Geophys. Res. Lett., 48, e2021GL092672, https://doi.org/10.1029/2021GL092672, 2021.