the Creative Commons Attribution 4.0 License.
the Creative Commons Attribution 4.0 License.
 | 14 Apr 2025
Recommendations on benchmarks for numerical air quality model applications in China – Part 2: Ozone and uncertainty analysis
Ling Huang
Xinxin Zhang
Chris Emery
Greg Yarwood
Hehe Zhai
Zhixu Sun
Shuhui Xue
Yangjun Wang
Joshua S. Fu
Ground-level ozone (O3) has emerged as a significant air pollutant in China, attracting increasing attention from both the scientific community and policymakers. Chemical transport models (CTMs) serve as crucial tools in addressing O3 pollution, with frequent applications in predicting O3 concentrations, identifying source contributions, and formulating effective control strategies. The accuracy and reliability of the simulated O3 concentrations are typically assessed through model performance evaluation (MPE). However, the wide array of CTMs available, variations in input data, model setups, and other factors result in a broad range of differences between simulated and observed O3 concentrations, highlighting the necessity of standardized benchmarks in O3 evaluation.
Building upon our previous work, this study conducted a thorough literature review of CTM applications simulating O3 in China from 2006 to 2021. A total of 216 relevant articles out of a total of 667 reviewed were identified to extract quantitative MPE results and key model configurations. From our analysis, two sets of benchmark values for six commonly used MPE metrics are proposed for CTM applications in China, categorized into “goal” benchmarks representing optimal model performance and “criteria” benchmarks representing achievable model performance across a majority of studies. It is recommended that the normalized mean bias (NMB) for hourly O3 and daily 8 h maximum O3 concentrations should ideally fall within ±15 % and ±10 %, respectively, to meet the goal benchmark. If the criteria benchmarks are to be met, the NMB should be within ±30 % and ±20 %, respectively. Moreover, uncertainties in O3 predictions due to uncertainties in various model inputs were quantified using the decoupled direct method (DDM) in a commonly used CTM. For the simulation period of June 2021, the total uncertainty of simulated O3 ranged from 4 to 25 µg m−3, with anthropogenic volatile organic compound (AVOC) emissions contributing most to the uncertainty regarding O3 in coastal regions and with O3 boundary conditions playing a dominant role in the northwestern region. The proposed benchmarks for assessing simulated O3 concentrations, in conjunction with our previous studies on PM2.5 and other criteria air pollutants, represent a comprehensive and systematic effort to establish a model performance framework for CTM applications in China. These benchmarks aim to support the growing modeling community in China by offering a robust set of evaluation metrics and establishing a consistent evaluation methodology relative to the body of prior research, thereby helping to establish the credibility and reliability of CTM applications. These statistical benchmarks need to be periodically updated as models advance and as better inputs become available in the future.
- Article
(6067 KB) - Full-text XML
- Companion paper
-
Supplement
(797 KB) - BibTeX
- EndNote


Tropospheric ozone (O3) is a secondary air pollutant generated by complicated photochemical reactions involving nitrogen oxides (NOx) and volatile organic compounds (VOCs) (Seinfeld and Pandis, 2016). Ozone has negative impacts on human health (Global Burden of Disease Collaborative Network, 2021), as well as on vegetation and ecosystem production (Ainsworth et al., 2012). Due to rapid economic development and fast industrialization and urbanization over the past several decades, China has experienced heavy haze pollution in winter and severe O3 pollution in summer, with the latter extending into the late-winter haze season (Li et al., 2021). Despite efforts to reduce fine particulate matter (PM2.5) and heavy-haze days (Wang et al., 2022; Bai et al., 2019; Chu et al., 2020), ground-level O3 concentrations have continued to increase in recent years (Dang and Liao, 2019; Li et al., 2019; Liu et al., 2019a; Lu et al., 2020; Wang et al., 2017; Yao et al., 2023; Chen et al., 2023; Xu et al., 2023). The challenge in controlling O3 pollution lies in the significant influences of meteorological conditions on O3 formation and its nonlinear chemical relationship with precursors (Wang et al., 2022). In addition, O3 pollution exhibits strong regional characteristics, necessitating regional-scale control efforts (Yang et al., 2021a).
Application of chemical transport models (CTMs) has become increasingly popular in addressing O3-related issues in China (Yang and Zhao, 2023), providing insights into the role of local emissions and regional transport (Shen et al., 2022), sectoral contributions (Liu et al., 2020a), policy effectiveness (Liu et al., 2023b), and predictions of future O3 levels (Yang and Zhao, 2023). Ensuring the representativeness of CTM simulations is crucial and can benefit from establishing performance standards or benchmarks to help put CTM results in context relative to the existing body of work. While other regions (e.g., the US and Europe) have proposed evaluation criteria for simulated O3 (Emery et al., 2017), these may not be suitable for China. Several key factors necessitate the establishment of a tailored benchmark for model applications specific to China. Firstly, ozone concentrations in China have been significantly higher than those in the US and have shown a consistent upward trend (Chinese Society For Environmental Sciences, 2020). For instance, the fourth highest maximum daily 8 h average (4th MDA8) ozone concentration across 74 major cities in China increased from 189 µg m−3 (∼ 95 ppb) in 2013 to 236 µg m−3 (∼ 118 ppb) in 2019 compared to levels at or below 150 µg m−3 (∼ 75 ppb) in the US during the same period (Table S1 in the Supplement). Secondly, background ozone contributions exhibit different trends between China and other regions, with China experiencing a year-on-year increase, especially in urban areas (Chinese Society For Environmental Sciences, 2020). Thirdly, the mechanisms of ozone formation may differ between China and the US. However, a direct comparison of these formation regimes proves to be challenging as both countries encompass vast regions with distinct ozone dynamics. Jung et al. (2022) identified notable shifts in the western US, specifically from an NOx-saturated regime to a transition regime (or from a transition regime to an NOx-limited regime), while rural areas, especially in the eastern and southeastern US, have become increasingly sensitive to VOC emissions. In China, VOC-limited regimes were predominantly observed in the Beijing–Tianjin–Hebei (BTH), Yangtze River Delta (YRD), and Guangdong (GD) regions in 2013 (Zhang et al., 2024), whereas, in 2019, a significant transition from a VOC-limited regime to a transition regime was noted in the BTH area, accompanied by a reduction in VOC-limited areas within the YRD and GD regions. These disparities in ozone concentrations, background contributions, and formation mechanisms underscore the necessity of a customized benchmark for model applications in China, which is essential for appropriately addressing the unique challenges posed by ozone pollution within the country. Therefore, the increasing prevalence of CTM applications in China necessitates specific CTM benchmarks tailored to this region.
This study aims to develop customized CTM benchmarks for O3 simulations in China, building upon our prior work that proposed evaluation indicators and benchmarks for simulating other criteria air pollutants (Huang et al., 2021; Zhai et al., 2024). A thorough literature review was conducted on O3 simulations using CTMs from 2006 to 2021. Detailed information regarding O3 performance was extracted and analyzed to recommended model performance evaluation (MPE) metrics and to propose benchmarks tailored to China. Furthermore, uncertainties in O3 predictions due to various model inputs were quantified using the decoupled direct method (DDM) of sensitivity analysis (Cohan and Napelenok, 2011) in a commonly used CTM. The structure of this study is as follows: Sect. 2 outlines the data source and methodology utilized. Section 3 describes the current status of O3 simulation studies in China and proposes recommended evaluation metrics and associated benchmarks. Section 4 delves into a discussion on O3 uncertainties arising from different model inputs, and conclusions are given in Sect. 5.
2.1 Data collection
The methodology for data compilation was consistent with our prior studies for other criteria pollutants (Huang et al., 2021; Zhai et al., 2024) and is briefly described here. We considered published O3 simulations using five CTMs: the Community Multiscale Air Quality (CMAQ, https://www.epa.gov/cmaq, last access: 12 July 2024) model, the Comprehensive Air Quality Model with extensions (CAMx, https://camx.com, last access: 12 July 2024), GEOS-Chem (https://geoschem.github.io, last access: 12 July 2024), the Weather Research and Forecasting model coupled with Chemistry (WRF-Chem, https://www2.acom.ucar.edu/wrf-chem, last access: 12 July 2024), and the Nested Air Quality Prediction Modeling System (NAQPMS) (Wang et al., 2014; Ge et al., 2014). We gathered relevant publications using a combination of three keywords in the Web of Science, namely O3, the models' names (one of the five models), and China, for studies published between 2006 and 2021. This process identified a total of 667 records (250 studies for CMAQ, 186 for WRF-Chem, 163 for GEOS-Chem, 36 for CAMx, and 32 for NAQPMS), with subsequent refinement steps to exclude duplicates, non-English publications, conference papers, and journals unrelated to air quality. Through manual selection, which involved identifying studies that provide extractable results (i.e., studies offering explicit results from model performance evaluations), a final set of 216 studies was chosen for detailed analysis (see Table S2 for a complete list of publications).
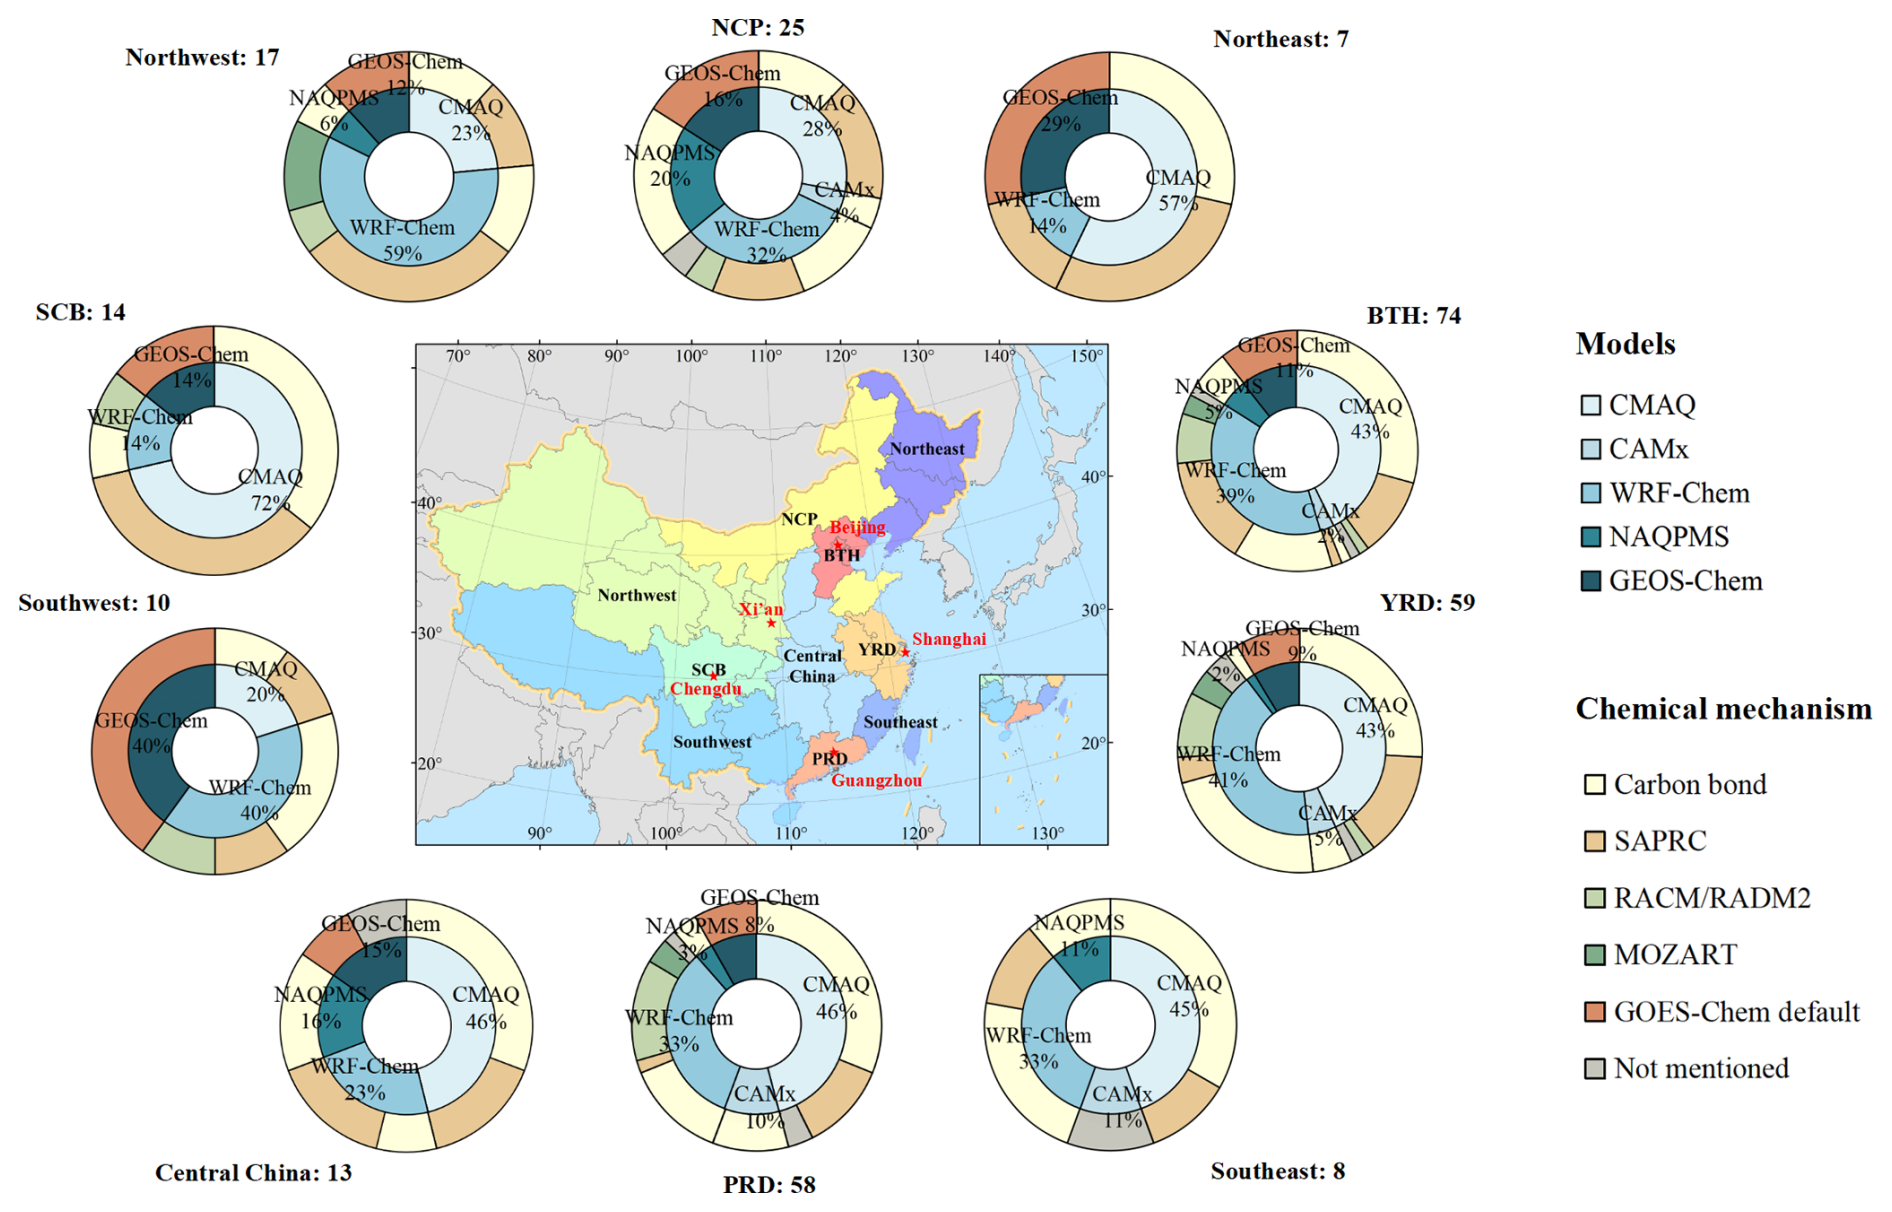
Figure 1CMAQ modeling domain with definitions of regions used in this study. The surrounding pie charts display the total number of studies for each region (excluding studies for the whole of China) and the percentage of different CTMs used. Red stars represent the five cities selected for the uncertainty analysis. Publisher's remark: please note that the above figure contains disputed territories.
Different configurations could be used, even within the same model. For example, WRF-Chem provides different chemical mechanisms, ranging from the simple RADM2 without aerosols to the MOZART chemical mechanism with hundreds of species. Detailed information regarding model configurations (e.g., modeling period, horizontal resolution, gas-phase chemistry, initial and/or boundary conditions) and the results of 23 MPE metrics (Table S3) were extracted and compiled from those 216 studies. For consistency, we converted O3 concentrations (for example, mean bias, root mean square error) expressed in parts per billion by volume (ppbv) to µg m−3 using a factor of 2.14. This factor of 2.14 refers to the “standard state”, i.e., an ambient air temperature of 273.15 K at 101.325 kPa, defined by the Chinese ambient air quality standards (GB 3095-2012; Ministry of Ecology and Environmental of the People's Republic of China, 2016). A total of 10 regions in China (Table S4), including the BTH region, the YRD region, the Pearl River Delta (PRD) region, the Sichuan Basin (SCB), the North China Plain (NCP), and five other regions (Fig. 1), were identified for further analysis.
2.2 Recommended benchmarks for O3
Among the 23 collected MPE metrics, we derived recommended benchmarks for the six most frequently used metrics (see Table S5 for definitions): mean bias (MB), normalized mean bias (NMB), root mean square error (RMSE), normalized mean error (NME), correlation coefficient (R), and index of agreement (IOA). The derivation of benchmarks follows previous studies by Simon et al. (2012) and Emery et al. (2017). Briefly, each metric's rank-ordered (from best to worst, for instance, from 1 to 0 for R) distribution was generated to identify the values at the 33rd and 67th percentiles. As highlighted in Emery et al. (2017), these percentiles serve to categorize the entire distribution into three performance categories: studies falling within the 33rd percentile (the goal) attain the best performance that current models can be expected to achieve, those between the 33rd and 67th percentiles (the “criteria”) attain the typical performance achieved by the majority of modeling studies, while those beyond the 67th percentile indicate relatively poor performance for the particular metric under consideration. We present the benchmarks for hourly O3, maximum daily 8 h average O3 (8 h max O3), and daily maximum 1 h O3 (1 h max O3), depending on data availability.
2.3 Uncertainty analysis of O3 simulation
In addition to developing the MPE benchmarks for simulated ozone, we further quantified uncertainties in predicted ozone concentrations using one of the five models (i.e., CMAQ). CMAQ version 5.3.2 (https://www.epa.gov/cmaq) was employed to simulate O3 during June 2021 in China. Base model configurations are the same as our previous study (Sun et al., 2024) and are briefly described here. The modeling domain covers the entirety of China and adjacent Asian regions (Fig. 1), with a horizontal resolution of 36 km × 36 km and 23 vertical layers and with a top pressure of 10 hPa. Meteorological fields are simulated using the Weather Research and Forecasting model (WRF version 4.0), the model configurations of which are listed in Table S6. CB6 and AERO7 were chosen as the gas-phase and aerosol mechanisms, respectively. Emission data include the 2019 Multi-resolution Emission Inventory for China (MEIC-2019) (http://www.meicmodel.org, last access: 23 June 2022) and the 2010 Emissions Database for Global Atmospheric Research (EDGAR, https://edgar.jrc.ec.europa.eu/, last access: 23 June 2022). Natural emissions were generated based on the Model of Emissions of Gases and Aerosols from Nature (MEGAN version 3.1, https://bai.ess.uci.edu/megan, last access: 23 June 2022). The CMAQ default O3 profile (with a uniform O3 concentration of 29 ppb) was used as the initial and boundary conditions (BCs). The use of a spatially and temporally uniform ozone concentration is a rather simplistic assumption, and, as we illustrate later, the impact of boundary conditions within the domain can range from substantial to minimally impactful. Among the CMAQ application studies collected, 54 out of 90 describe the configuration of the initial and boundary conditions, and 35 of those applied the CMAQ default profile. Since our purpose in the ozone uncertainty analysis was to quantify how variability in boundary conditions affects simulated ozone concentrations throughout China, we elected to mirror how many of the studies have applied CMAQ. A 10 d spin-up run was conducted to mitigate the influence of initial conditions.
We followed Dunker et al. (2020) to quantify the uncertainties in predicted O3 concentrations due to six model inputs: anthropogenic NOx (ANOx) and VOC (AVOC) emissions for China, biogenic VOCs (BVOCs) and soil NOx (SNOx) within China, dry deposition velocities for O3, and BCs for O3. The uncertainties associated with each of the inputs (Table S7) are based on previous studies addressing emission uncertainties (Cheng et al., 2019), deposition velocities, and BCs (Beddows et al., 2017; Derwent et al., 2018). Like Dunker et al. (2020), these uncertainties were considered to be independent and log-normally distributed. The CMAQ decoupled direct method (DDM) was used to generate the first-order sensitivities of O3 to each of the inputs (excluding dry deposition). For dry deposition, we conducted two parallel simulations in which the O3 dry-deposition velocities were manually changed by ±10 %, and the changes in simulated O3 concentrations were treated as the O3 sensitivities to dry-deposition velocity:
where is the O3 sensitivity to dry-deposition velocities, and and represent the simulated O3 concentrations as dry-deposition velocities are increased and decreased by 10 %, respectively. The sensitivities obtained were then combined with their respective uncertainties, enabling us to quantify the contributions to the variance in O3 concentrations. For example, the O3 uncertainties due to dry deposition are calculated as follows:
where un(DEP) represents the uncertainty of O3 due to dry deposition at 1σ, and fDEP (equalling 2 based on Table S7) is the uncertainty factor for dry deposition and follows the assumption of a log-normal distribution.
The contribution of dry deposition to the total uncertainty in O3 is calculated as follows:
3.1 General overview of O3 simulation studies in China
In the last decade, there has been a significant increase in research focusing on O3 in China, as illustrated in Fig. 2. The issuance of the Three-Year Action Plan for Winning the Blue Sky Defense Battle in 2017 (http://www.gov.cn/zhengce/content/2018-07/03/content_5303158.htm, last access: 15 April 2024) led to a further surge in studies related to O3, with a noticeable decline in 2020, which is possibly attributable to the impact of the COVID-19 pandemic. In 2021, there were 48 studies dedicated to addressing O3-related issues using CTMs, marking a 6-fold increase compared to 2011. Similarly to PM2.5, the BTH (74 studies), YRD (59 studies), and PRD (58 studies) regions emerged as the top three most studied regions. Among the various CTMs employed, CMAQ stood out as the most commonly utilized model (90 studies), followed by WRF-Chem (84 studies). The application of CAMx (14 studies) and NAQPMS (8 studies) was less frequent by comparison. In terms of MPE metrics, R had the highest frequency of occurrence at 19 %, followed by NMB (18 %), MB (16 %), RMSE (13 %), and NME (11 %). Nearly half of the studies incorporated two or three metrics for evaluating O3, while less than 7 % assessed at least five different metrics. The three most common types of O3 concentrations evaluated were hourly O3 concentration, the maximum daily 8 h average O3 (8 h max O3), and the daily maximum 1 h O3 (1 h max O3). Among all the articles examined, 77 % focused on evaluating hourly O3, 16 % focused on 8 h max O3, and 7 % focused on 1 h max O3.
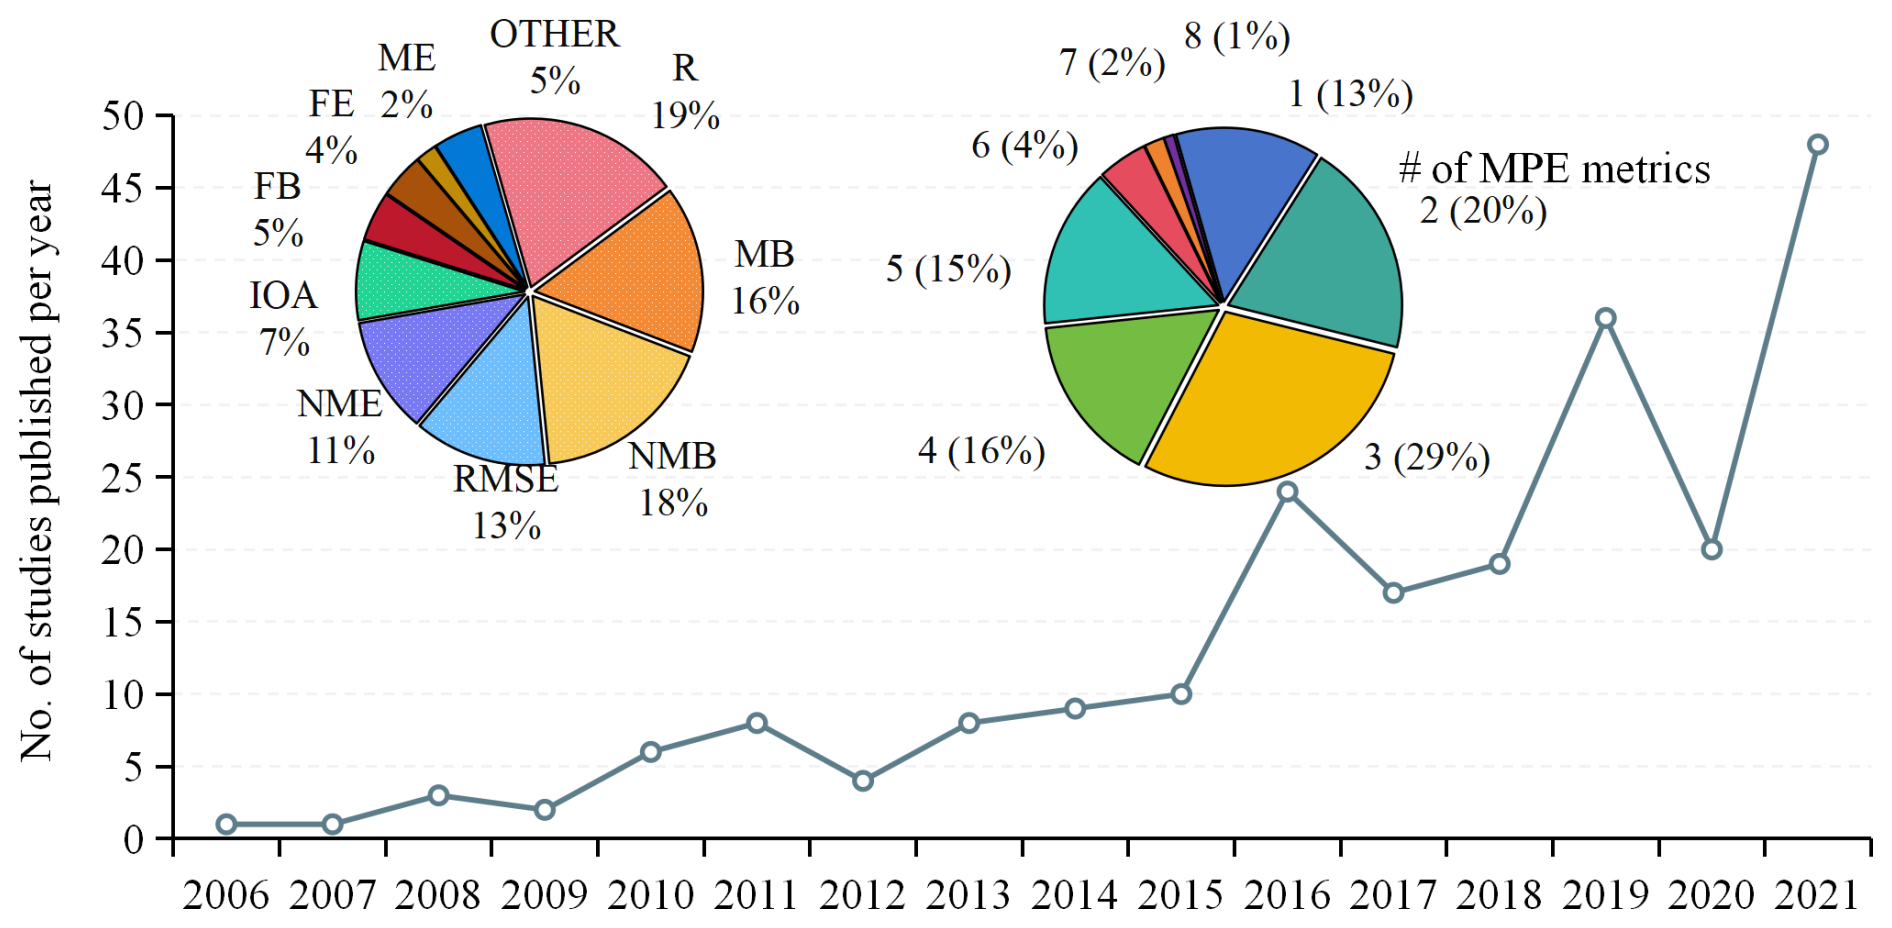
Figure 2Number of O3 studies published during 2006–2021. Pie charts show the frequency of different MPE metrics (left) and the number of metrics used in one study (right).
3.2 Quantile distributions of O3 MPE results
Figure 3 shows the quantile distributions of various evaluation metrics collected in this study. The results are presented for different types of O3 concentrations, namely hourly O3, 1 h max O3, and 8 h max O3, whenever data are available. Previous studies have shown that using maximum O3 values (i.e., 1 h max and 8 h max) instead of hourly O3 can lead to differing results within the same study (e.g., Ni et al., 2020; Li et al., 2016). Peak O3 concentrations typically occur between 12:00 and 18:00 LT (Beijing Time, UTC+8). For example, in Ni et al. (2018), 8 h max O3 showed an overestimation tendency compared to average hourly O3, but, in another study (Yang et al., 2021b), there was an opposite trend. Underestimation of peak O3 concentrations might be offset by overestimation during non-peak hours and vice versa. Therefore, achieving satisfactory performance in daily averaged O3 levels does not necessarily indicate the model's ability to accurately capture high O3 concentrations.
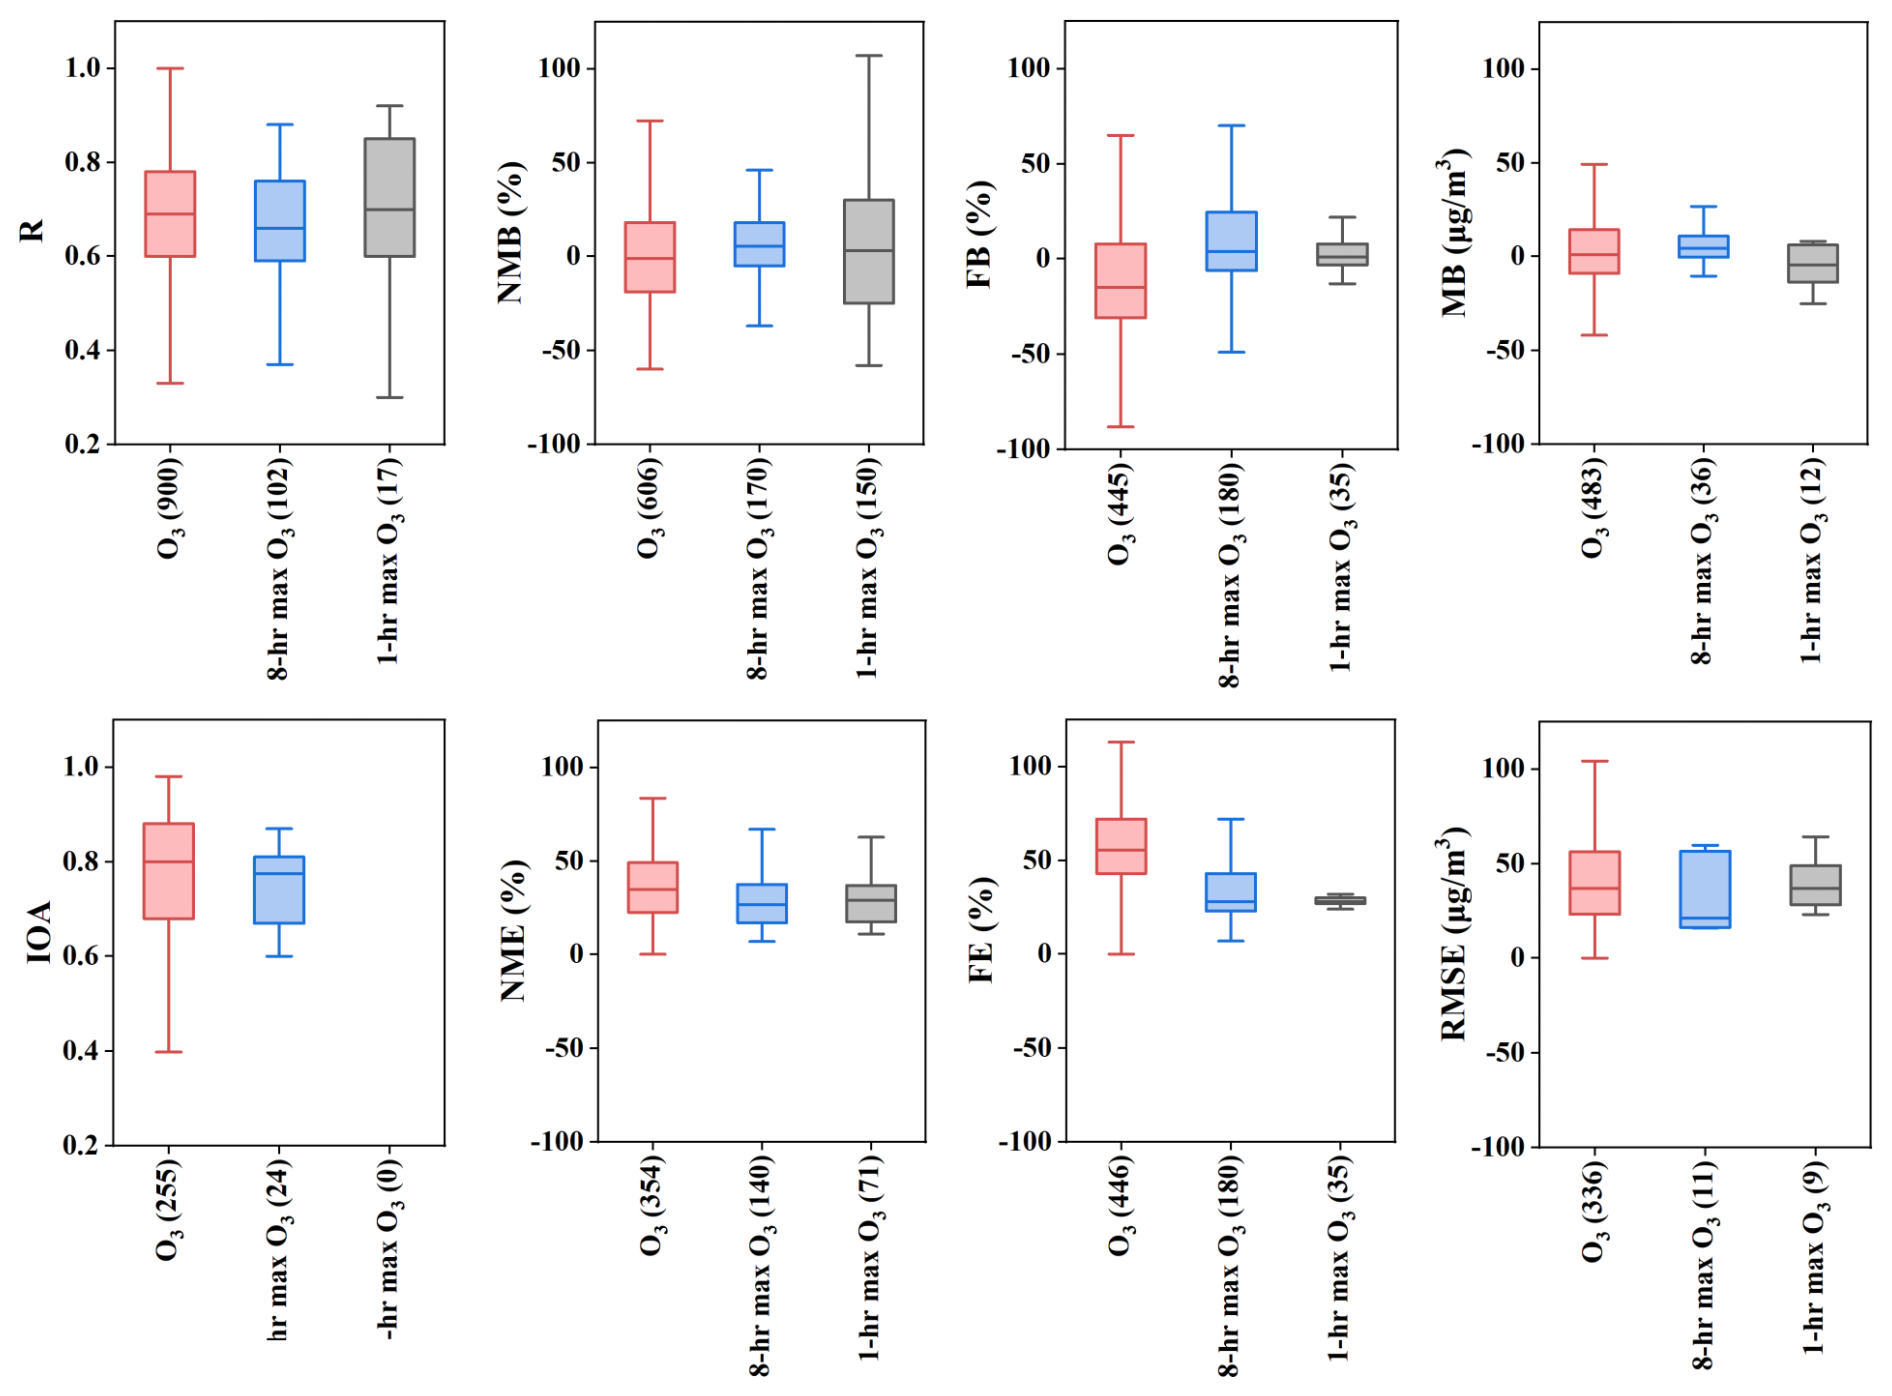
Hourly O3 exhibited equivalent overestimation and underestimation in terms of MB and NMB, with MB ranging from as low as −40 to nearly 50 µg m−3 and with NMB ranging from less than −50 % to more than 70 %. However, fractional bias (FB) indicated more underestimated than overestimated hourly O3 concentrations. For all three bias metrics, 8 h max O3 exhibited more overestimation than underestimation, suggesting a tendency for models to overestimate off-peak hours. For 1 h max O3, both NMB and FB displayed equivalent overestimation and underestimation, with NM showing a wider range than FB, likely due to there being fewer data points. For error metrics, 8 h max and 1 h max O3 generally performed better than hourly O3. For instance, the median values of NME were 34.8 %, 26.6 %, and 29 % for hourly O3, 8 h max, and 1 h max O3, respectively. R and IOA indicate how well the model captures observed variations, either temporally or spatially. The use of IOA was significantly less than R, and no studies reported IOA values for 1 h max O3. For the other two O3 types, IOA values (median value of 0.8 for O3 and 0.77 for 8 h max O3) were generally higher than R (median value of 0.69 for O3 and 0.66 for 8 h max O3). Six studies reported both R and IOA values, of which four (Liu and Wang, 2020; Wang et al., 2019; Liu et al., 2019b; Gao et al., 2017) reported higher IOA values than R.
3.2.1 Regional and seasonal differences
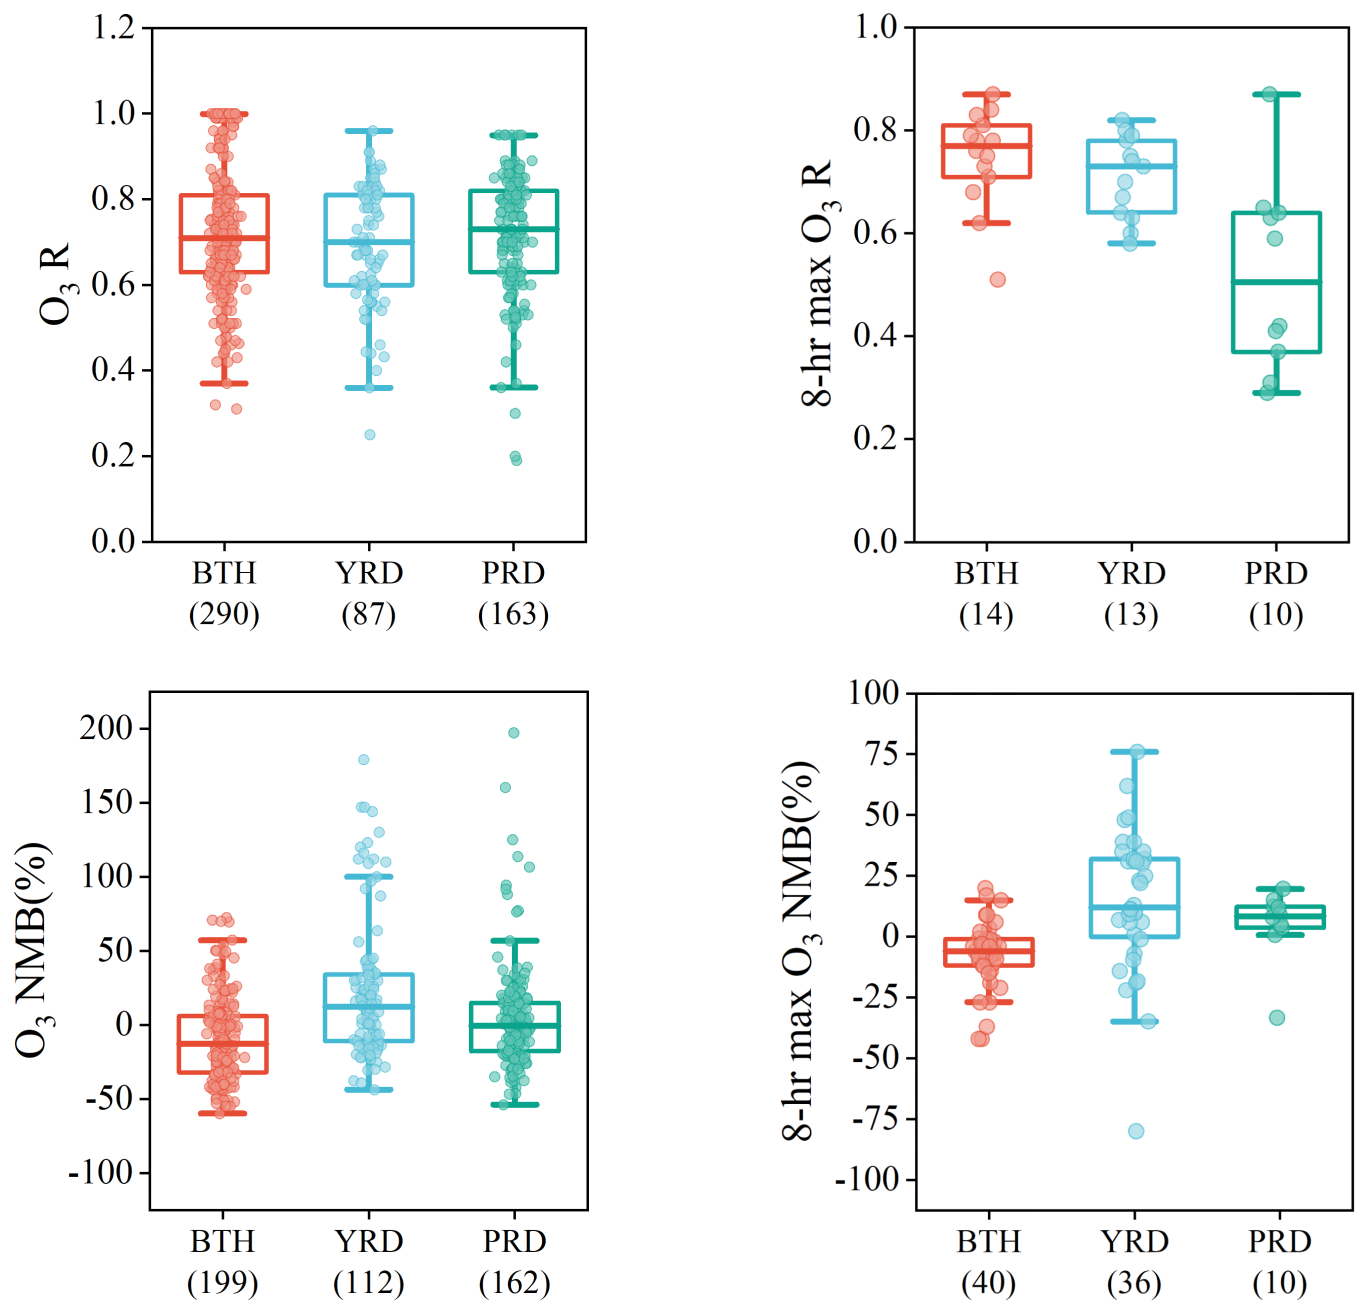
Like our previous studies (Huang et al., 2021; Zhai et al., 2024), we discuss the influences of various key factors on model performance in simulating O3 concentrations. We first considered whether there were discernible regional or seasonal differences. Figure 4 presents the distribution of R and NMB values, grouped by three key regions in China: the BTH, YRD, and PRD (see Table S4 and Fig. 1 for region definition). These regions are the most densely populated and economically developed urban clusters in China. In terms of hourly O3, the R values across the three regions display similarity, with median values of around 0.7. For 8 h max O3, however, the PRD stands out with notably lower R values compared to the BTH and YRD. Regarding NMB values, the BTH tends to have more underestimation, while the YRD and PRD lean towards overestimation. Over the past decade, the BTH has consistently recorded the highest O3 levels and number of O3 pollution days among the three regions (Wang et al., 2024). The variations in NMB values among regions suggest a trend of current models underestimating O3 levels in areas with more severe O3 pollution.
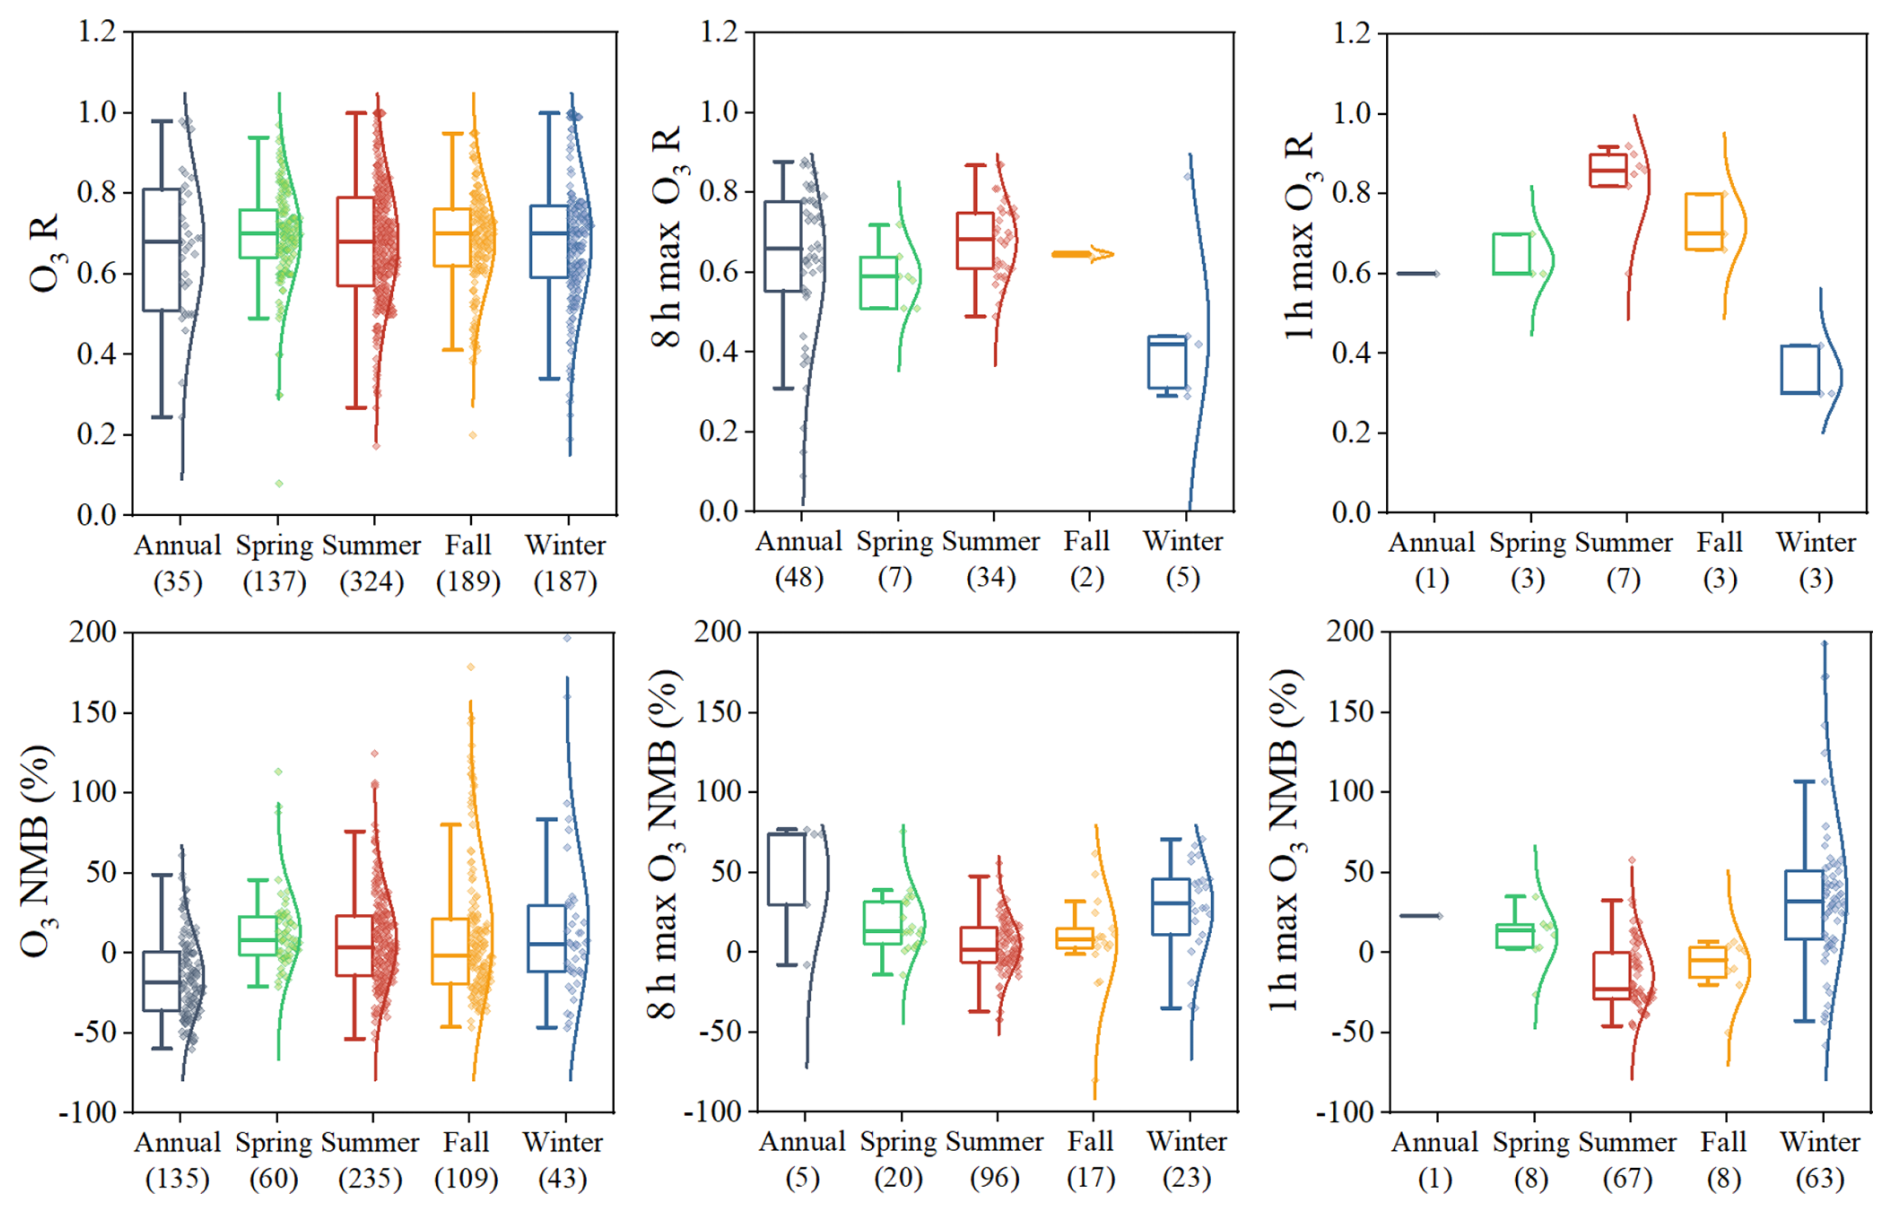
In terms of the seasonal variations (Fig. 5), the NMB values of hourly O3 concentrations exhibit similar patterns across different seasons, showing equivalent overestimation and underestimation. However, when assessed over the entire year, hourly O3 concentrations tend to be largely underestimated. The seasonal patterns of NMB distributions are similar for 8 and 1 h max O3, with summer O3 concentrations being more frequently underestimated compared to in other seasons. For instance, in the case of 1 h max O3, peak O3 concentrations are predominantly underestimated (with a median NMB of −23 %), while they are overestimated in winter (with a median NMB of 31.5 %).
3.2.2 Impact of horizontal resolution
The selection of a horizontal resolution for a CTM application depends on several factors, such as the objective of the study, the geographical scope of the study area, and the availability of input data. Generally, a coarse horizontal resolution (> 50 km) is utilized for global simulations (i.e., GEOS-Chem applications at a global scale), while a finer horizontal resolution (< 4 km) with nested grids is preferred for regional- or city-scale modeling. A coarser horizontal resolution may result in multiple monitoring stations falling within a single grid cell, potentially smoothing out extreme values observed at specific locations. Among the 216 studies reviewed, 29 different horizontal resolutions (based on the resolution of the innermost domain) were identified, ranging from 1 to 200 km. The horizontal resolutions were classified into five groups in this study: < 5, 5–10, 10–25, 25–50, and 50–100 km (horizontal resolutions over 100 km were excluded from the analysis due to limited data points). Figure 6 shows the distribution of eight statistical indicators by different horizontal resolutions while ignoring the differences in other model configurations. Overall, no clear trend was evident to indicate better model performances as horizontal resolution decreases. For example, the median R value is 0.73 for the < 5 km group, surpassing the 5–10 and 25–50 km groups but falling below the 10–25 and 50–100 km groups. Studies conducted with a horizontal resolution of 10–25 km exhibit the best model performance in terms of NME and FE distributions compared to other groups. While most studies assess models within a single domain (usually the innermost domain with the finest horizontal resolution), a few studies have conducted multi-domain analyses, where finer horizontal resolutions generally have superior results compared to coarse horizontal resolutions. Liu et al. (2020b) used WRF-CMAQ to analyze O3 prediction and health exposure at different horizontal resolutions (1, 4, 12, and 36 km). The results showed more than 20 % difference in premature mortality due to different model horizontal resolutions being used. Therefore, modelers should exercise caution and avoid optimism when configuring their model at finer resolutions as reducing the horizontal resolution does not necessarily lead to improved model performance if the input data resolution (i.e., horizontal resolution of the emissions) is insufficient for the model's resolution.
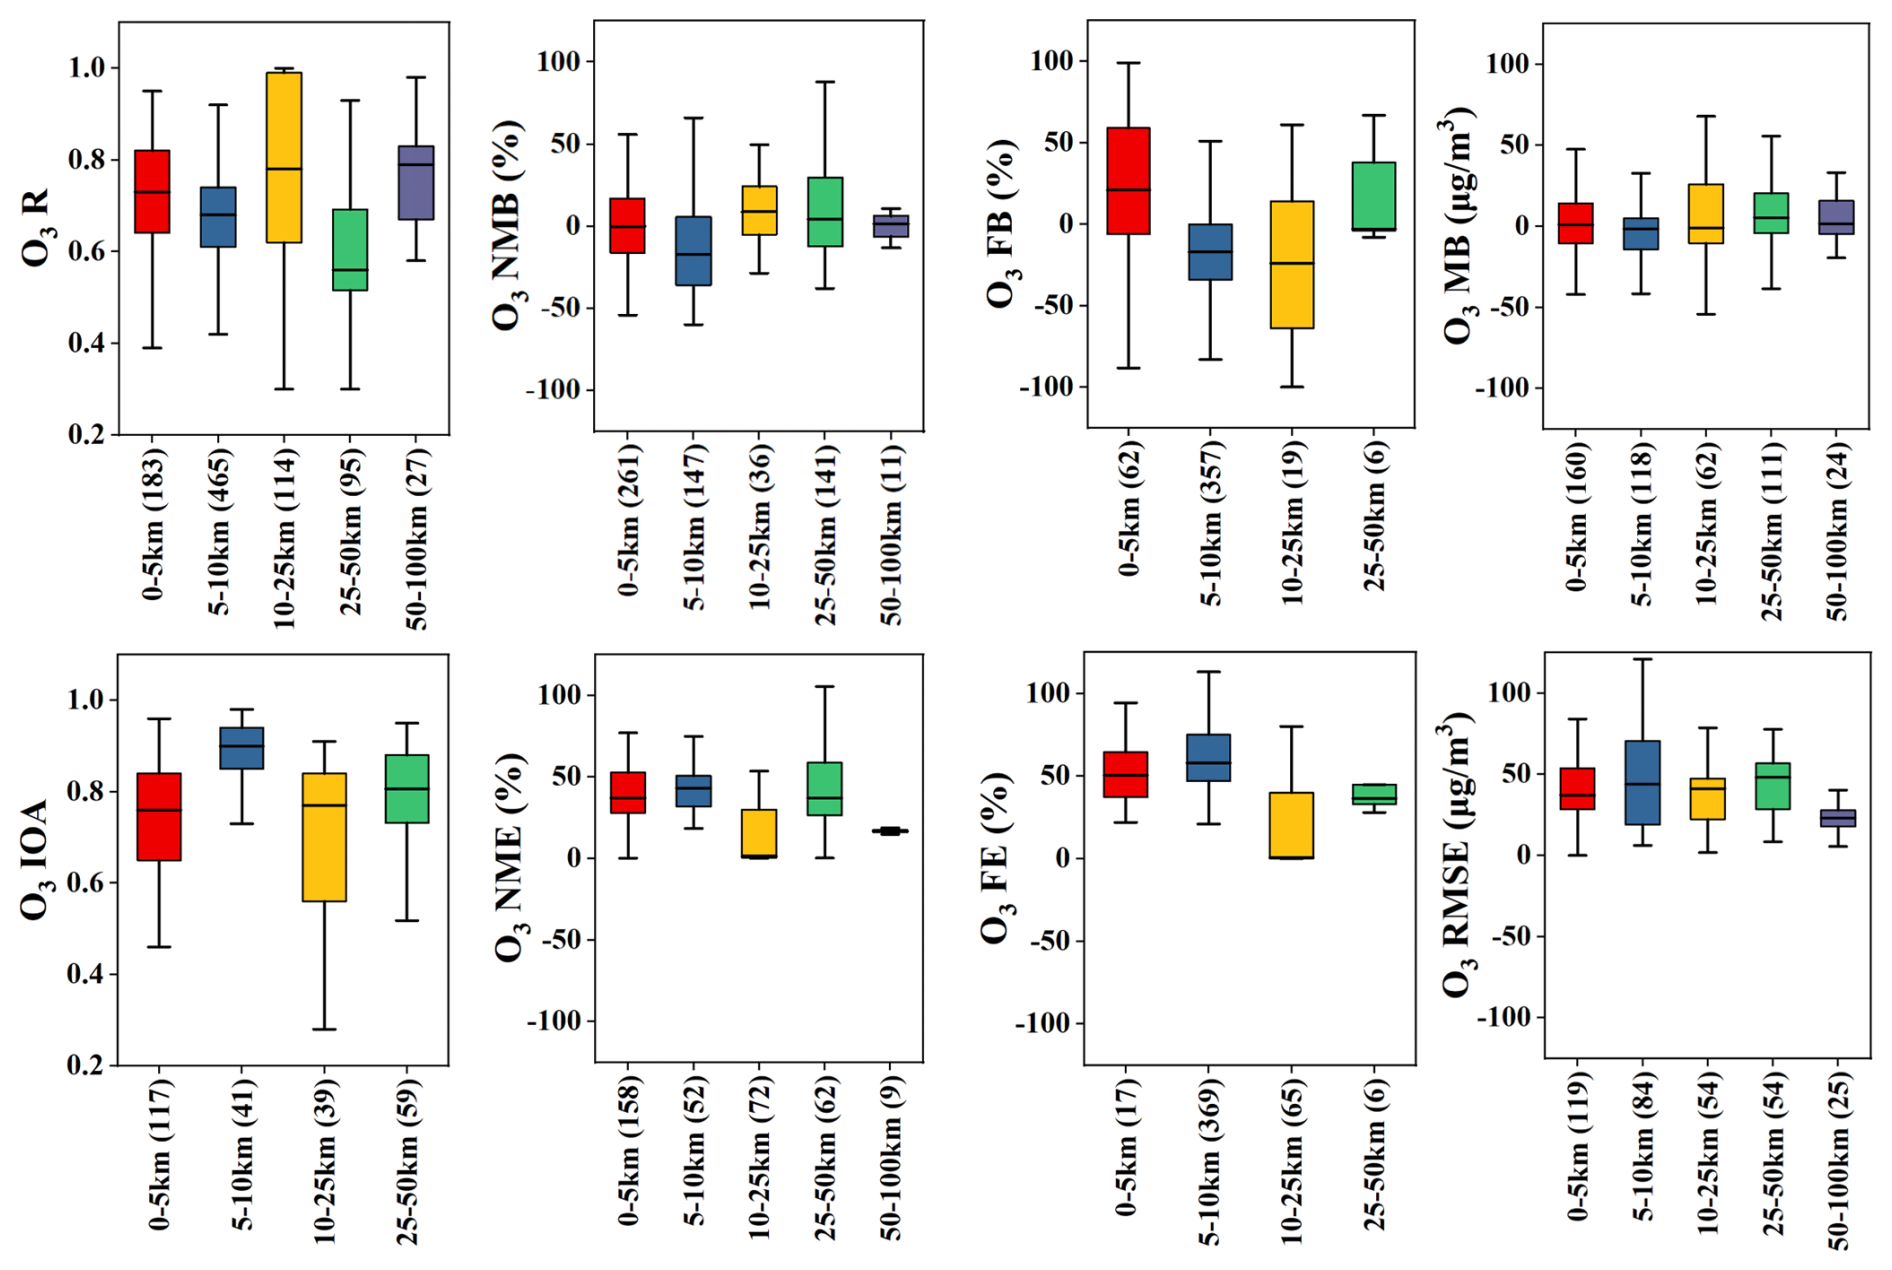
Figure 6Quantile distribution of O3 with respect to commonly used assessment indicators at different horizontal resolutions.
3.2.3 Choice of gas-phase chemical mechanism
Gas-phase chemical mechanisms play a crucial role in the accurate prediction of atmospheric composition using CTMs. Some of the commonly used mechanisms include the carbon bond mechanism (CB) (Yarwood et al., 2010; Luecken et al., 2019; Appel et al., 2021; Yarwood and Tuite, 2024), the Statewide Air Pollution Researcher Center (SAPRC) mechanism (Carter, 1996; Chang et al., 1999; Carter, 2000, 2010), and the Regional Atmospheric Chemistry Mechanism (RACM) (Stockwell et al., 1997; Goliff et al., 2013). These mechanisms have undergone rigorous evaluations against experimental data, showcasing reliable predictive capabilities for O3 in diverse atmospheric environments. The CB mechanism is a condensed mechanism in which the carbon bond is treated as a reaction unit, and the carbon bonds with the same bonding state are treated as a group (Cao et al., 2021). The latest version, CB7, contains 91 gaseous species and 230 reactions (https://www.tceq.texas.gov/downloads/air-quality/research/reports/photochemical, last access: 18 June 2024). In contrast, the SAPRC mechanism categorizes species based on their reactivity with OH (Carter, 2010). The most recent SAPRC22 mechanism includes 162 species and 738 reactions (https://intra.engr.ucr.edu/~carter/SAPRC/22/, last access: 18 June 2024). RACM was developed based on the Regional Acid Deposition Model (RADM), which is an inductive mechanism for treating hydrocarbons with a fixed parameterization method and is carried out according to the reaction rate and activity of different pollutants with •OH. Compared to the other two mechanisms, RACM and RACM2 contain detailed chemical processes of radicals, biogenic VOCs, and less reactive VOCs able to survive during long-distance transport. A total of 119 reactive species and 363 reactions were included in RACM2, describing the oxidation reactions of 21 types of primary VOCs in the system (Liu et al., 2023a).
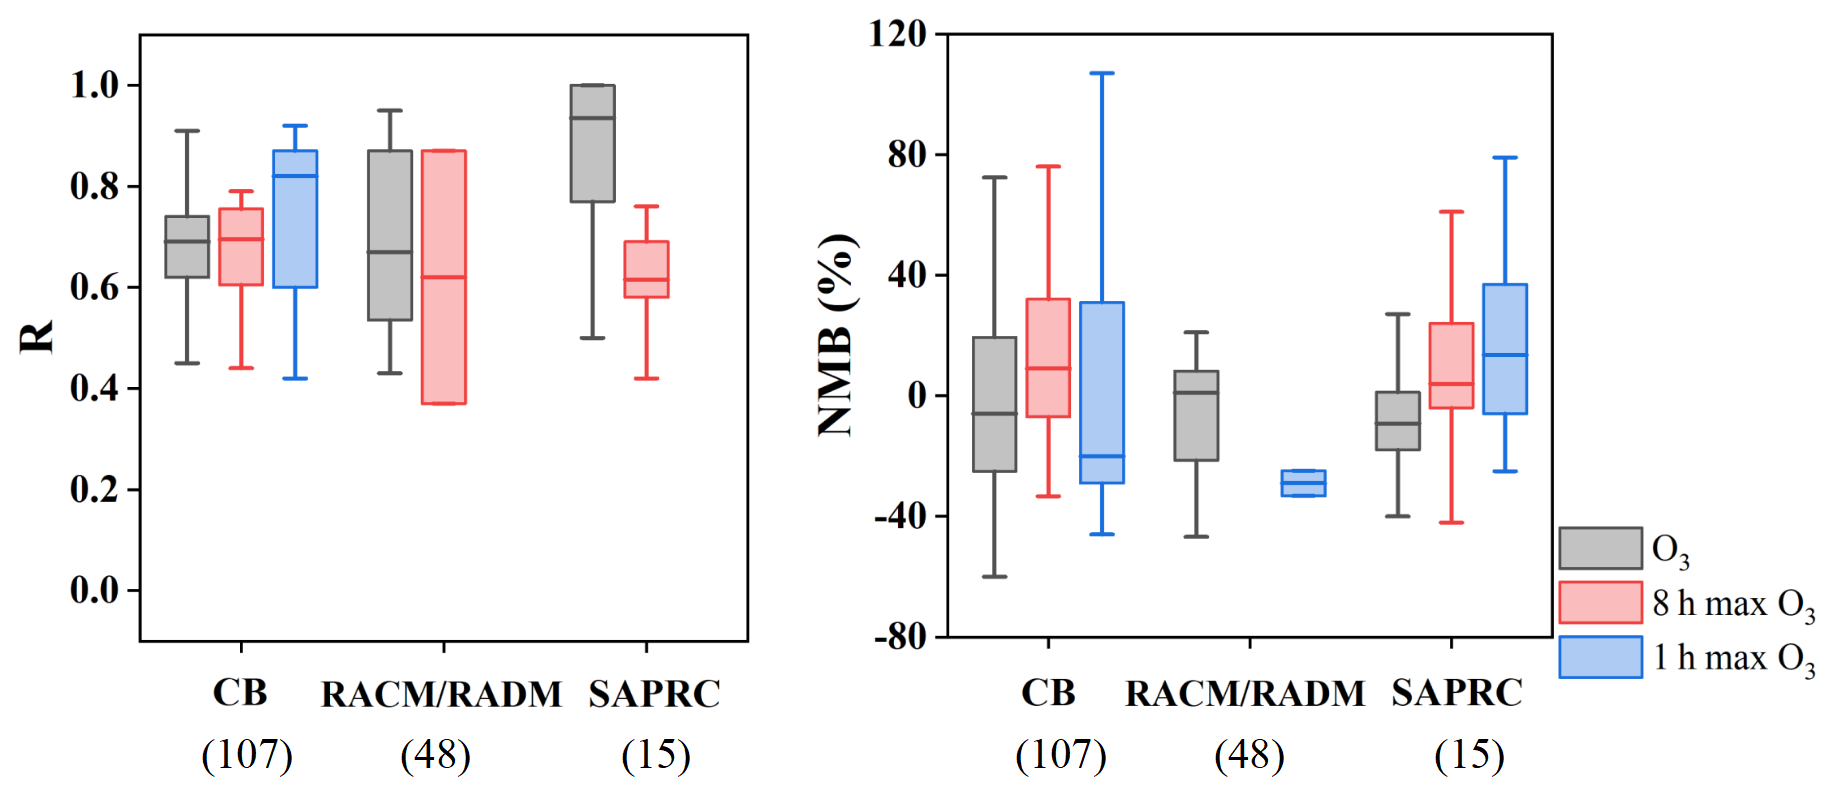
Among the 216 studies compiled, nearly half of them used the CB mechanism for simulations, approximately a quarter employed RACM and/or RADM, and only 15 studies utilized SAPRC. Figure 7 compares the distribution of R and NMB, grouped by different gas-phase mechanism. In terms of R values, CB tends to perform slightly better than RACM and/or RADM, with SAPRC showing the highest R median value (0.93) for hourly O3 but the lowest for 8 h max O3 among the three mechanisms. Regarding NMB, SAPRC tends to overestimate peak O3 values compared to the other mechanisms, particularly for 1 h max O3, a trend observed in previous studies (Qiao et al., 2019).
3.3 Recommended benchmarks for O3 MPE
Figure 8 illustrates the ranked distributions of various statistical indicators, including R, IOA, NMB, NME, FB, and FE for hourly O3, 1 h max O3, and 8 h max O3. The absolute values of NMB and FB are presented to indicate deviations from zero. In terms of R and IOA, the ranked distributions for hourly O3 and 8 h max O3 are quite similar, with R values ranging from around 0.72 at the 33rd percentile to 0.60 at the 67th percentile. The corresponding IOA values are slightly higher, ranging from ∼ 0.83 at the 33rd percentile to ∼ 0.73 at the 67th percentile. For 1 h max O3, the limited number of data points (less than 20) resulted in an R value of 0.80 at the 33rd percentile and 0.60 at the 67th percentile, while the IOA distribution was not available due to missing data. For NMB and NME, the results for 8 h max O3 show the lowest values, indicating that models perform better in capturing the 8 h max O3 concentrations. The 33rd percentile of absolute NMB for 8 h max O3 is less than 10 %, and the 67th percentile is below 20 %. In terms of FB and FE, the ranked distributions for 1 h max O3 are flatter compared to the other two O3 types, likely due to the smaller number of available data points. For both metrics, the 8 h max O3 exhibits lower values than O3. At the 33rd percentile, the absolute FB (FE) is less than 10 % (25 %) for 8 h max O3 and less than 20 % (50 %) for O3. At the 67th percentile, the absolute FB (FE) is 25 % (38 %) for 8 h max O3 and 34 % (65 %) for O3. In addition, we provide a more detailed ranked distribution in Table S8.
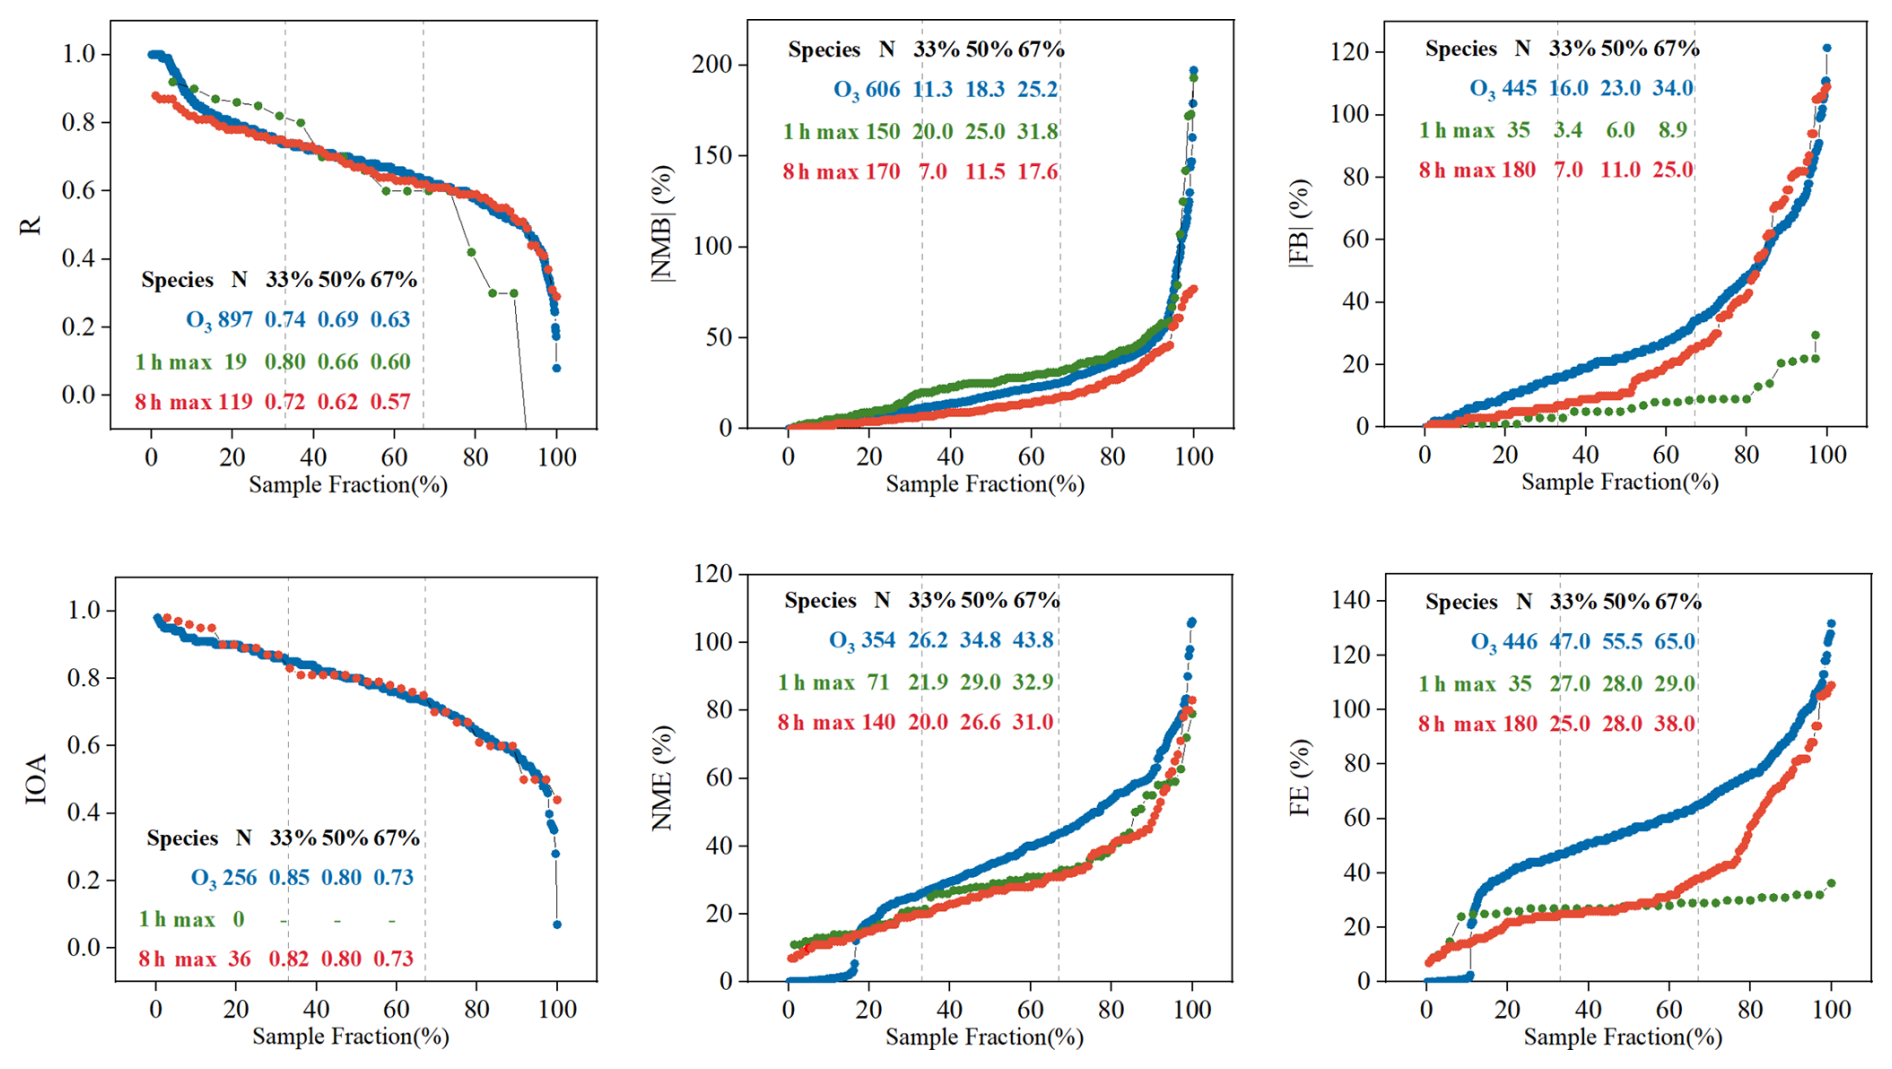
Figure 8Rank-ordered distributions of R, IOA, NMB, NME, FB, and FE for O3, 1 h max O3, and 8 h max O3 speciated components. The number of data points and the 33rd, 50th, and 67th percentile values are also listed.
Table 1Recommended benchmarks for evaluating simulated O3 by CTM application in China. NA: not available.
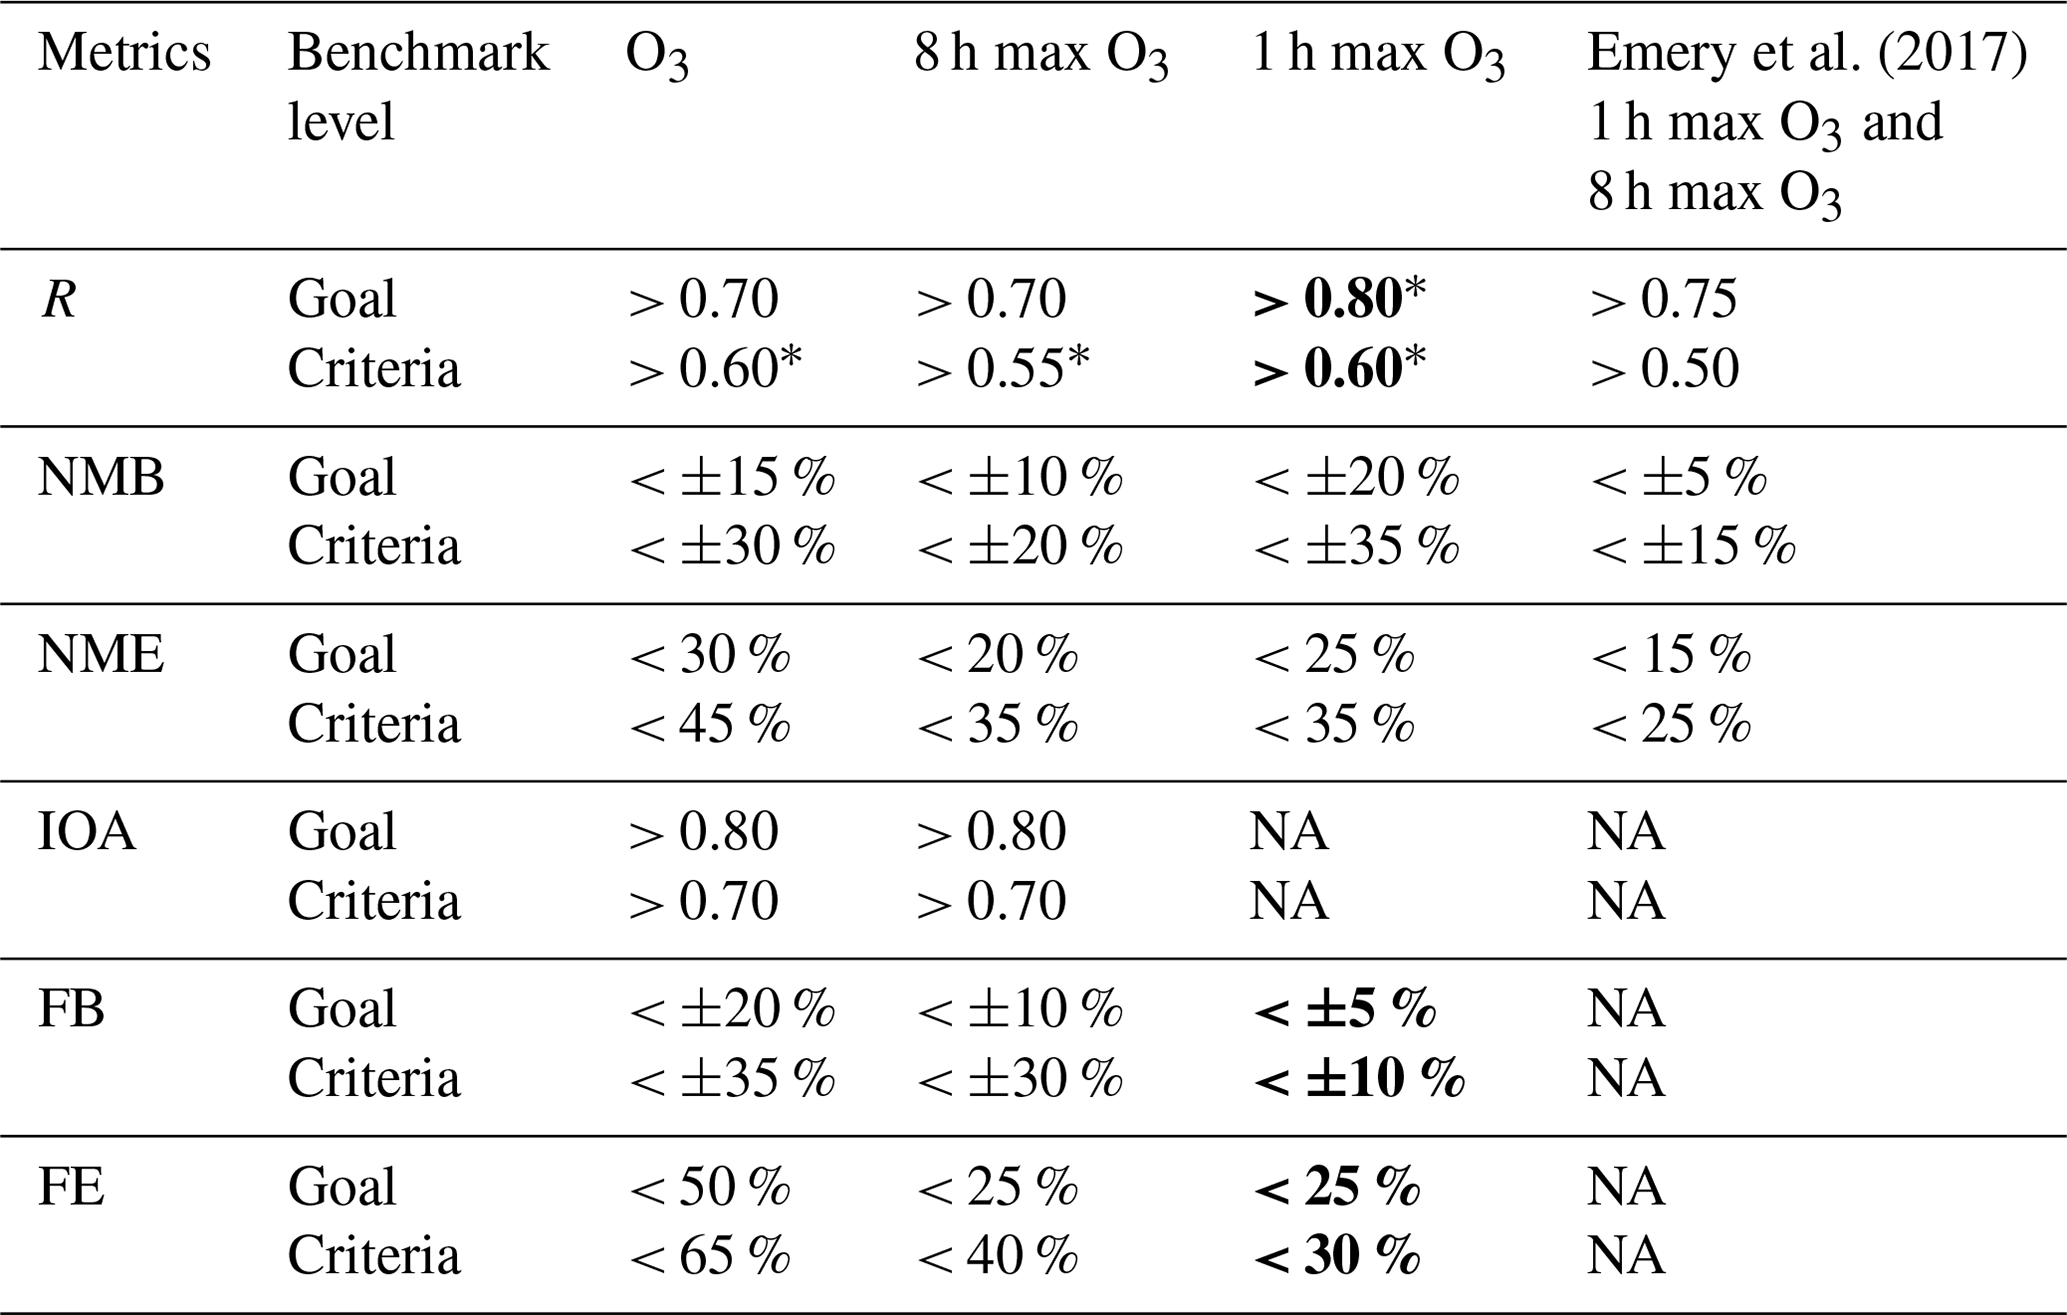
(1) See descriptions in the main text for bold values; (2) values with an asterisk indicate that our benchmarks are stricter than the corresponding values in Emery et al. (2017).
Following Emery et al. (2017) and Huang et al. (2021), we propose recommended statistical indicators and corresponding benchmarks for evaluating O3, as detailed in Table 1. The goal values, corresponding to the threshold at the 33rd percentile, represent the optimal model performance anticipated from current models. The criteria values, reflecting the threshold at the 67th percentile, represent the performance levels achieved by the majority of studies. Due to limited data availability, the derivation of benchmarks for certain metrics concerning 1 h max O3 remains uncertain. In such cases, benchmarks for IOA and R for hourly O3 were directly adopted due to minimal variations among different O3 types. Similarly, benchmarks proposed for 8 h max O3 were applied to 1 h max O3 for FB and FE, given their closer distributions. Our findings indicate that benchmarks tend to be more stringent for 8 h max O3 compared to for the other two types, with the exception of IOA, where they remain the same. Based on our results, a value of R greater than 0.70 and 0.55 would meet the goal and criteria benchmarks, respectively, for 8 h max O3. Correspondingly, the goal and criteria values for NMB are 10 % and 20 %.
In contrast to Emery et al. (2017), we provide separate benchmarks for O3, 8 h max O3, and 1 h max O3. Emery et al. (2017) found rather similar results between hourly and 8 h max O3 in the US and so recommended a single set of benchmarks for ozone. Out of the 216 studies analyzed, 15 studies evaluated at least two O3 types. The use of a cutoff for evaluating O3 is extremely limited in China (only five studies applied cutoffs), thereby precluding any specific recommendation regarding cutoff values. In addition to the benchmarks for NMB, NME, and R provided by Emery et al. (2017), we have introduced benchmarks for IOA, FB, and FE, backed by a sufficient number of data points. The few values marked with an asterisk in Table 1 indicate that our benchmarks are more stringent than the corresponding values in Emery et al. (2017), implying that achieving our recommended 33rd (or 67th) percentile may pose greater challenges.
Overall, however, our proposed benchmarks are more lenient than those of Emery et al. (2017), particularly in the context of hourly O3. For NME, our suggested goal and criteria for O3 stand at 30 % and 45 %, respectively, nearly double the figures reported by Emery et al. (2017), who recommend 15 % for the goal and 25 % for the criteria. The criteria value for R is an exception, where our proposed value (0.55 for 8 h max O3 and 0.60 for O3) is higher than that (0.50) in Emery et al. (2017).
3.4 Uncertainty analysis of O3 simulation using CMAQ
In order to further investigate the uncertainties in O3 concentrations simulated by CTMs, a base model simulation was conducted using CMAQ (the most frequently used CTM in China) for June 2021, a typical month with elevated O3 in northern and eastern China. The uncertainties due to six model inputs were quantified for this case: VOC and NOx emissions in China, differentiation between anthropogenic and biogenic sources, O3 dry-deposition velocities, and boundary conditions (BCs). The evaluation of the base model results indicates generally acceptable simulated MDA8 O3 concentrations when compared to the observations. The results showed an overall MB of 6.1 µg m−3 and an overall NMB of 5.2 % (Fig. 9). O3 underestimation is observed over the BTH region, while overestimation occurs over the Sichuan Basin. The values of NMB, NME, and R meet the goal benchmark we proposed above.
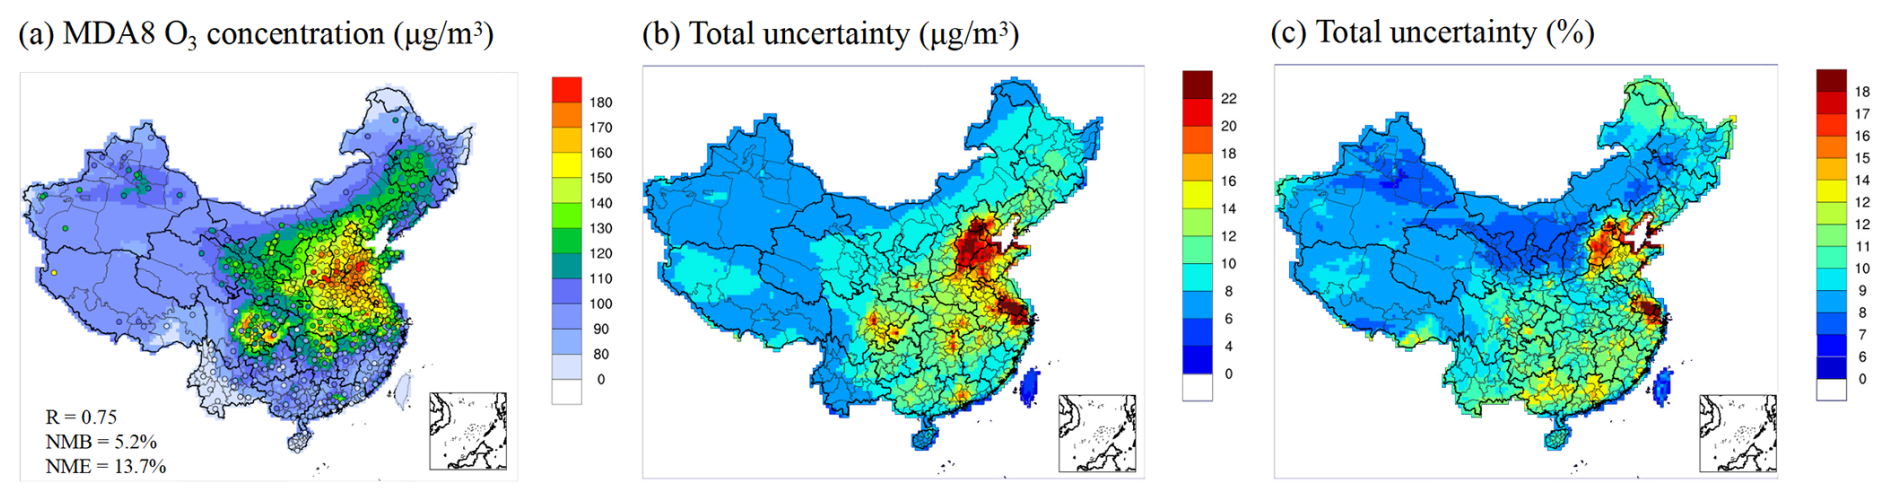
Figure 9Spatial distributions of (a) MDA8 O3 concentrations (µg m−3), (b) total uncertainties (µg m−3), and (c) total uncertainty in percent (%). Results are averaged for June 2021. Publisher's remark: please note that the above figure contains disputed territories.
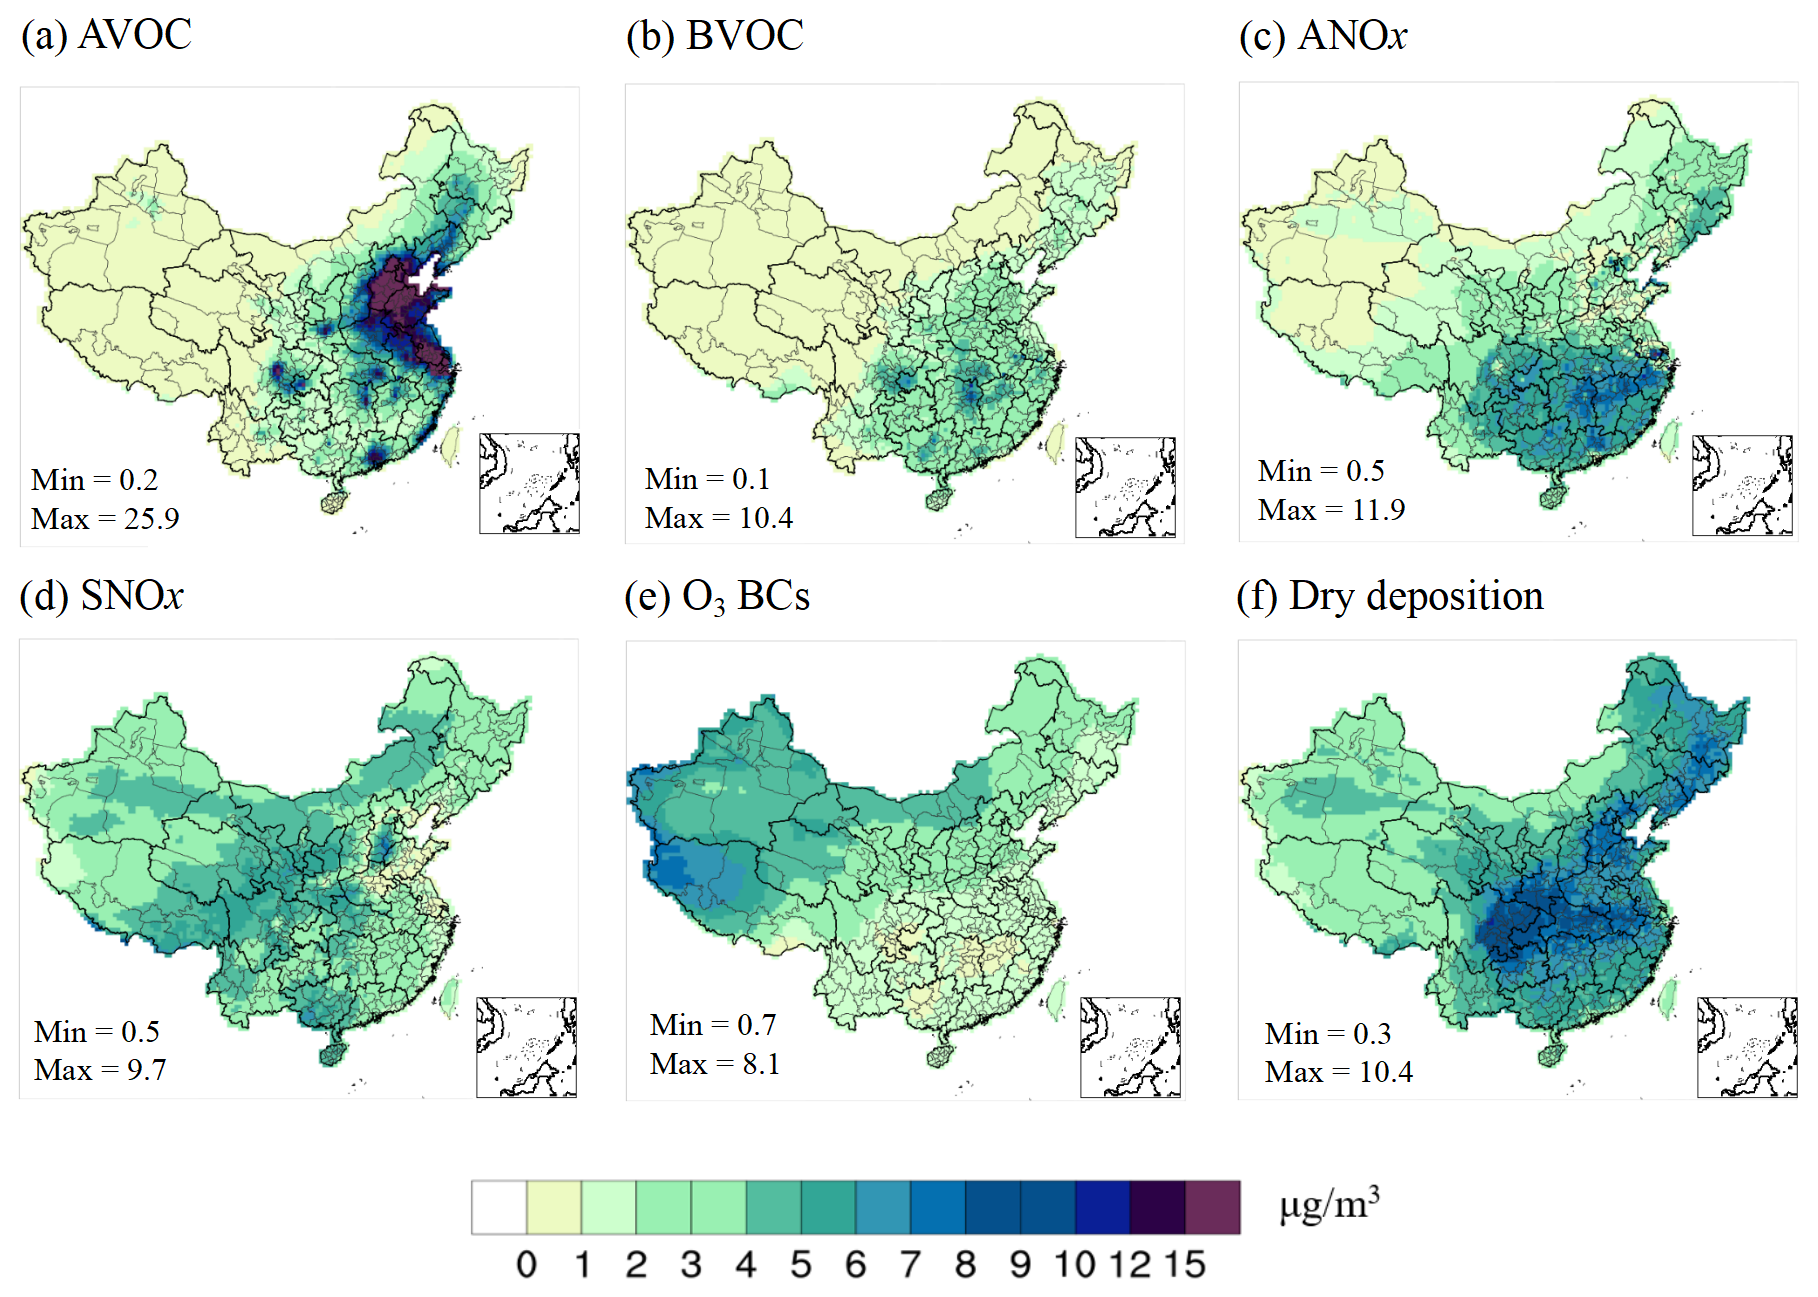
Figure 10Contributions to uncertainty in MDA8 O3 simulation. Contribution of (a) AVOCs, (b) BVOCs, (c) ANOx, (d) SNOx, (e) O3 BCs, and (f) dry deposition in µg m−3. Results are averages over all days in June 2021 and represent 1σ. Publisher's remark: please note that the above figure contains disputed territories.
As displayed in Fig. 10, the first-order sensitivity of MDA8 O3 to the six model inputs exhibits substantial variations in terms of spatial distributions and magnitudes. A higher sensitivity occurs in larger urban areas, while the sensitivity is relatively low in rural areas. The sensitivity to VOC emissions is always positive (i.e., higher VOCs lead to higher O3), whereas the sensitivity to NOx emissions could be both positive and negative. High O3 sensitivity to AVOC emissions is observed for the BTH, the northern YRD, the PRD, and major metropolitan areas (e.g., Chengdu in Sichuan Province, Xi'an in Shaanxi Province) due to NOx-rich and VOC-limited urban conditions. Conversely, anthropogenic NOx emissions resulted in negative O3 sensitivity in the aforementioned regions and positive sensitivity in others where rural conditions are more VOC-rich and NOx-limited. The sensitivity to biogenic precursor emissions (BVOCs and SNOx) was much lower compared to their anthropogenic counterparts. The sensitivity to O3 BCs predominantly extends towards the northwest (up to 50 µg m−3), where O3 precursor emissions are low. The sensitivity to O3 dry-deposition velocity exhibits a uniformly negative distribution (higher deposition rates lead to lower ozone), with higher values in more vegetated areas and an average of −13.7 µg m−3.
When the individual first-order sensitivity coefficient is multiplied by the corresponding 1σ uncertainty (Table S7), the contributions to the uncertainty in O3 predictions can be obtained (Fig. 10). Summing up all these uncertainties yields the total uncertainty (Fig. 9b). Large ozone uncertainties (> 20 µg m−3) were observed over the BTH, the central YRD region, and major metropolitan areas (e.g., the PRD, Chengdu in Sichuan Province). Regions with high uncertainties in O3 predictions generally align with regions with poorer model performance. In the BTH, YRD, and PRD, the total ozone uncertainty due to the six model inputs is between 11.7–31.8, 7.0–34.6, and 5.0–19.0 µg m−3, respectively, corresponding to a relative percentage of O3 concentration of 9.2 %–18.1 %, 7.9 %–25.8 %, and 7.6 %–14.6 %. It should be noted that our uncertainty estimates represent conservative estimates because the effects of uncertainties in the meteorological inputs and the uncertainties associated with the O3 chemistry are not included, the latter of which have been shown to have a comparable contribution to the total contributions from emissions, dry deposition, and O3 BC in the Dallas–Fort Worth region in the US (Dunker et al., 2020).
Among the six model inputs, AVOC emissions make the largest contributions (exceeding 15 µg m−3) to the total uncertainty in regions displaying high O3 sensitivity, such as the BTH, the northern YRD, the PRD, and several metropolitan areas. The large uncertainties, stemming from both the high first-order sensitivities (Fig. S1) and a relatively high uncertainty factor (1.97), suggest that, in these regions, uncertainties associated with AVOC emission estimates would result in more significant biases in simulated O3 concentrations compared to in other areas. O3 uncertainties due to BVOC emissions, ranging between 0.1–10.4 µg m−3, are mainly located in southern China, where BVOC emissions are high. A similar spatial pattern is observed for uncertainties in ANOx emissions, although its contribution is larger (0.5–11.9 µg m−3). While the first-order O3 sensitivity to SNOx emissions is minimal (Fig. S1), the contribution to O3 uncertainty from SNOx emissions is noteworthy (0.5–9.7 µg m−3), given a large uncertainty factor of 2 (Table S7). Uncertainty in O3 BCs is relatively less important, except in the northwest, where it represents the largest contributing factor. Dry deposition serves as an important O3 sink. The uncertainty contribution of O3 dry-deposition velocities (0.3–10.4 µg m−3) is comparable to that of ANOx emissions but has a more evenly distributed spatial impact.
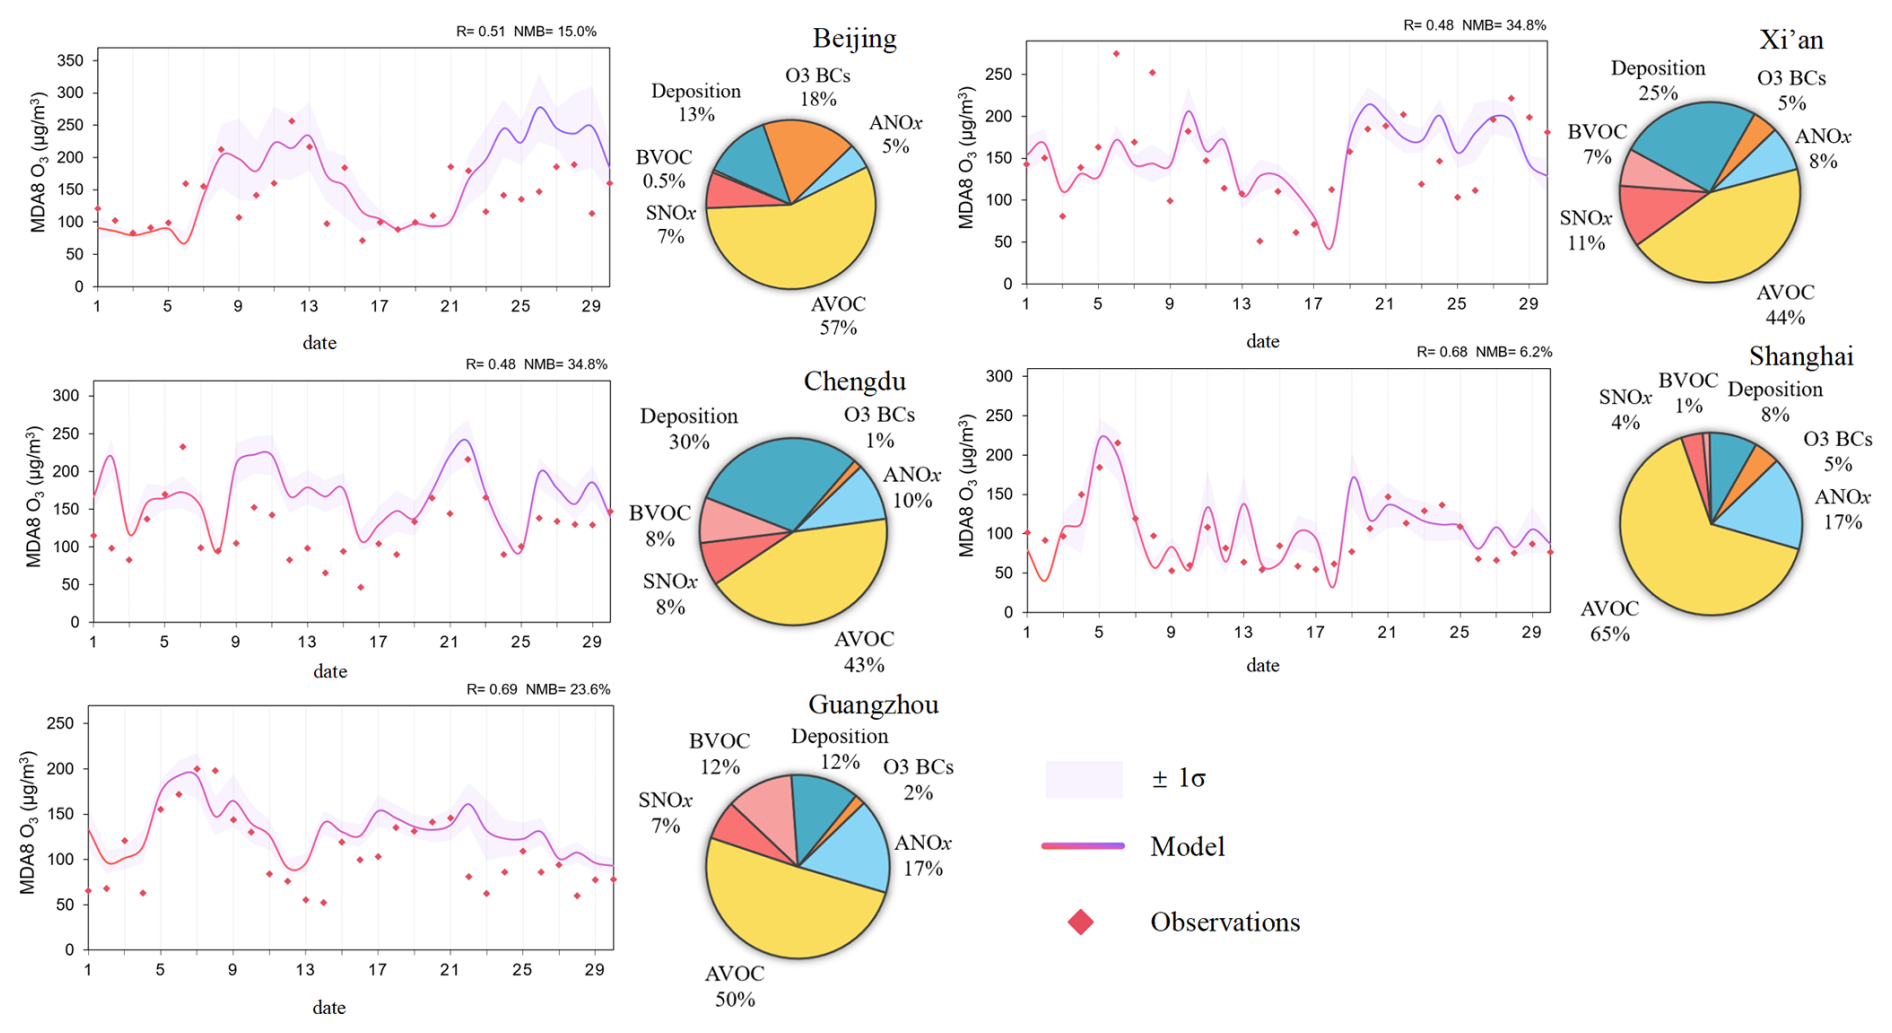
Figure 11Time series of simulated and observed MDA8O3 for five cities in June 2021. The uncertainty limit of MDA8 O3 is ±1σ. The pie chart shows the contribution of each factor to the total uncertainty of the predicted average MDA8 O3 in June 2021.
Figure 11 compares the observed MDA8 O3 to the model results, including their ±1σ uncertainty range for five major cities: Beijing, Shanghai, Guangzhou, Chengdu, and Xi'an. In Shanghai, the majority of the observed O3 falls within the ±1σ uncertainty range. However, in Beijing; Chengdu; and, to a lesser extent, in Guangzhou, the model tends to overpredict lower O3 observations. In Xi'an, the model fails to capture the exceptionally high O3 concentrations (MDA8 O3 > 250 µg m−3) on 6 and 7 June. Expanding the uncertainty limits to a ±2σ range may encompass some of the lower O3 observations, but the current uncertainty estimates do not fully account for all the discrepancies between model results and observations. This discrepancy could be attributed to the coarse horizontal resolution (36 km) used in this study, which may not adequately resolve the impact of local emission sources. Furthermore, as mentioned earlier, uncertainties related to O3 chemistry and meteorological inputs were not accounted for and should be quantified in future work.
The relative contributions to the total uncertainty are also shown in Fig. 11. Across all five cities, uncertainties in the AVOC emissions contribute the most (43 %–65 %), while the relative importance of other model inputs differs by location. For example, O3 BCs represent the second largest uncertainty source in Beijing (accounting for 18 %) but are negligible in Guangzhou and Chengdu. In Shanghai and Guangzhou, uncertainties in ANOx emissions (10 %–17 %) become the second largest contributor. Uncertainties associated with BVOC emissions are minimal in Beijing and Shanghai but are noteworthy (7 %–8 %) in Guangzhou and Chengdu. O3 deposition uncertainty contributes to 8 %–30 % of the total uncertainty, with a higher contribution for cities located in the west.
3.5 Recommendations for future modeling practices
The purpose of this and our previous related papers (Huang et al., 2021; Zhai et al., 2024) is to establish a guideline that offers modelers in China a contextual reference for evaluating their statistical performance metrics against a historical framework of published modeling results. It is crucial to recognize that all models inherently possess a certain degree of error, which may arise from factors such as discretization, approximations, and parameterizations. Merely stating that a model exhibits a 20 % bias has no real value unless contextualized within the framework of historical performance. Without such context, it remains unclear whether this bias aligns with, surpasses, or falls short of commonly achieved standards or optimal expectations. Statistical results outside the proposed benchmarks indicate poor model performance that should be improved upon so that more reliance can be placed on the model to properly characterize air quality and predict responses to changes in model inputs. Based on the above analysis, we list several recommendations for future modeling practices that might help improve model performance.
-
Meteorology is an essential input to CTMs. Many studies have highlighted the strong responses of ozone to various meteorological variables (Coleman et al., 2013; Lu et al., 2019), including transport patterns, temperature, planetary boundary height, and relative humidity. Consequently, it is imperative to conduct a thorough validation of meteorological simulations prior to initiating ozone simulations. The influence of uncertainties associated with simulated meteorological variables on ozone predictions necessitates further exploration.
-
Modelers are encouraged to select the highest feasible horizontal resolution that matches the available emission data horizontal resolution. Our analysis illustrates that finer horizontal resolutions do not invariably lead to enhanced model performance, particularly when the input data do not possess a correspondingly high horizontal resolution. Thus, it is advisable for modelers to engage in sensitivity testing to ascertain the optimal equilibrium between horizontal resolution and data quality.
-
The uncertainty analysis reveals a substantial contribution of AVOC emissions throughout China. Therefore, it is essential to intensify efforts aimed at enhancing the accuracy of AVOC emissions, focusing on both magnitude and speciation profiles. Additionally, the chemical mechanisms within CTMs should be routinely updated to accommodate emerging species, such as volatile chemical products (VCPs; Yarwood and Tuite, 2024).
-
The majority of model applications reviewed in this study apply a spin-up period of less than or equal to 10 d. However, studies (Hogrefe et al., 2017; Karamchandani et al., 2017) have shown that a commonly used spin-up period of 10 d (or a week) might not be sufficient to reduce the effects of initial conditions to less than 1 %. Thus, a longer spin-up period, preferably 20 d, depending on the domain size, is recommended to mitigate the influence of initial conditions.
-
Given the considerable effect of boundary conditions on simulated ozone uncertainties – especially in areas characterized by low precursor emissions – modelers should carefully select and validate boundary conditions. This may involve using multiple global models or observational data to define more accurate initial and boundary conditions.
-
In the context of ozone attainment demonstrations, modelers should place a particular emphasis on the model's performance in relation to high and peak ozone values. Merely achieving satisfactory average ozone concentrations may not suffice; it is essential to ensure robust performance in capturing peak ozone levels as well.
Chemical transport models are increasingly being employed to tackle the severe ozone pollution issues in China. This study involved the compilation and analysis of 216 peer-reviewed studies focused on the use of CTMs to simulate O3 levels in China. Essential model configurations such as study region, simulation season, horizontal resolution, gas-phase mechanism, and quantitative model performance outcomes were systematically documented. The study presented quantile distributions of common statistical metrics found in the literature and discussed the influence of different model configurations on performance outcomes. Furthermore, we proposed benchmarks for six widely used MPE metrics (R, IOA, NMB, NME, FB, and FE) based on the concepts of goals and standards to offer guidance to modelers for a more consistent and contextual evaluation of models. Additionally, we utilized CMAQ-DDM to assess the uncertainties in predicted O3 concentrations resulting from uncertainties in six model inputs. The findings revealed significant variations in the spatial distributions and magnitudes of ozone sensitivity to different model inputs, with the most substantial contributions to total uncertainty originating from AVOC emissions in regions with high ozone sensitivity.
The proposed benchmarks for assessing simulated O3 concentrations, in conjunction with previous studies on PM2.5 (Huang et al., 2021) and other criteria air pollutants (Zhai et al., 2024), represent a comprehensive and systematic effort to establish a model performance framework for CTM applications in China. These outcomes not only offer valuable guidance to the growing modeling community in China but also support the community's endeavors in utilizing CTMs to address various research challenges and to enhance air quality management.
The data for Figs. 1–8 and 11 are publicly available at https://doi.org/10.5281/zenodo.14880358 (Huang, 2025). All other data are available upon request from the corresponding author.
The supplement related to this article is available online at https://doi.org/10.5194/acp-25-4233-2025-supplement.
LL and LH designed the study. LH conducted the formal analysis and drafted the original manuscript. XZ and ZS were responsible for data curation, formal analysis, and visualization. HZ and SX contributed to data curation. CE, QM, GY, YW, and JSF provided critical review and editing of the manuscript. LL supervised the project and secured funding.
At least one of the (co-)authors is a member of the editorial board of Atmospheric Chemistry and Physics. The peer-review process was guided by an independent editor, and the authors also have no other competing interests to declare.
Publisher's note: Copernicus Publications remains neutral with regard to jurisdictional claims made in the text, published maps, institutional affiliations, or any other geographical representation in this paper. While Copernicus Publications makes every effort to include appropriate place names, the final responsibility lies with the authors.
This work is supported by the Shanghai Technical Service Center of Science and Engineering Computing, Shanghai University.
This research has been supported by the National Natural Science Foundation of China (grant nos. 42375103 and 42375102) and the Shanghai International Science and Technology Cooperation Fund (grant no. 24230740200).
This paper was edited by Christopher Cantrell and reviewed by two anonymous referees.
Ainsworth, E. A., Yendrek, C. R., Sitch, S., Collins, W. J., and Emberson, L. D.: The effects of tropospheric ozone on net primary productivity and implications for climate change, Annu. Rev. Plant Biol., 63, 637–661, https://doi.org/10.1146/annurev-arplant-042110-103829, 2012.
Appel, K. W., Bash, J. O., Fahey, K. M., Foley, K. M., Gilliam, R. C., Hogrefe, C., Hutzell, W. T., Kang, D., Mathur, R., Murphy, B. N., Napelenok, S. L., Nolte, C. G., Pleim, J. E., Pouliot, G. A., Pye, H. O. T., Ran, L., Roselle, S. J., Sarwar, G., Schwede, D. B., Sidi, F. I., Spero, T. L., and Wong, D. C.: The Community Multiscale Air Quality (CMAQ) model versions 5.3 and 5.3.1: system updates and evaluation, Geosci. Model Dev., 14, 2867–2897, https://doi.org/10.5194/gmd-14-2867-2021, 2021.
Bai, K., Ma, M., Chang, N. B., and Gao, W.: Spatiotemporal trend analysis for fine particulate matter concentrations in China using high-resolution satellite-derived and ground-measured PM2.5 data, J. Environ. Manage., 233, 530–542, https://doi.org/10.1016/j.jenvman.2018.12.071, 2019.
Beddows, A. V., Kitwiroon, N., Williams, M. L., and Beevers, S. D.: Emulation and Sensitivity Analysis of the Community Multiscale Air Quality Model for a UK Ozone Pollution Episode, Environ. Sci. Technol., 51, 6229–6236, https://doi.org/10.1021/acs.est.6b05873, 2017.
Cao, L., Li, S., and Sun, L.: Study of different Carbon Bond 6 (CB6) mechanisms by using a concentration sensitivity analysis, Atmos. Chem. Phys., 21, 12687–12714, https://doi.org/10.5194/acp-21-12687-2021, 2021.
Carter, W. P. L.: Condensed atmospheric photooxidation mechanisms for isoprene, Atmos. Environ., 30, 4275–4290, https://doi.org/10.1016/1352-2310(96)00088-X, 1996.
Carter, W. P. L.: Implementation of the SAPRC-99 Chemical Mechanism into the Models-3 Framework, Report to the United States Environmental Protection Agency, Riverside, CA, https://intra.cert.ucr.edu/~carter/pubs/s99mod3.pdf (last access: 14 December 2024), 2000.
Carter, W. P. L.: Development of the SAPRC-07 chemical mechanism, Atmos. Environ., 44, 5324–5335, https://doi.org/10.1016/j.atmosenv.2010.01.026, 2010.
Chang, T. Y., Nance, B. I., and Kelly, N. A.: Modeling Smog Chamber Measurements of Vehicle Exhaust Reactivities, J. Air Waste Manage., 49, 57–63, https://doi.org/10.1080/10473289.1999.10463775, 1999.
Chen, B., Wang, Y., Huang, J., Zhao, L., Chen, R., Song, Z., and Hu, J.: Estimation of near-surface ozone concentration and analysis of main weather situation in China based on machine learning model and Himawari-8 TOAR data, Sci. Total Environ., 864, 160928, https://doi.org/10.1016/j.scitotenv.2022.160928, 2023.
Cheng, J., Su, J., Cui, T., Li, X., Dong, X., Sun, F., Yang, Y., Tong, D., Zheng, Y., Li, Y., Li, J., Zhang, Q., and He, K.: Dominant role of emission reduction in PM2.5 air quality improvement in Beijing during 2013–2017: a model-based decomposition analysis, Atmos. Chem. Phys., 19, 6125–6146, https://doi.org/10.5194/acp-19-6125-2019, 2019.
Chinese Society For Environmental Sciences: China Blue Book for the Prevention and Control of Atmospheric Ozone Pollution (2020), Chinese Society For Environmental Sciences, Ozone Pollution Control Professional Committee, Science Press, Beijing, China, ISBN 9787030716644, 2020.
Chu, B., Ma, Q., Liu, J., Ma, J., Zhang, P., Chen, T., Feng, Q., Wang, C., Yang, N., Ma, H., Ma, J., Russell, A. G., and He, H.: Air Pollutant Correlations in China: Secondary Air Pollutant Responses to NOx and SO2 Control, Environ. Sci. Technol. Lett., 7, 695–700, https://doi.org/10.1021/acs.estlett.0c00403, 2020.
Cohan, D. S. and Napelenok, S. L.: Air Quality Response Modeling for Decision Support, Atmosphere, 2, 407–425, https://doi.org/10.3390/atmos2030407, 2011.
Coleman, L., Martin, D., Varghese, S., Jennings, S. G., and O'Dowd, C. D.: Assessment of changing meteorology and emissions on air quality using a regional climate model: Impact on ozone, Atmos. Environ., 69, 198–210, https://doi.org/10.1016/j.atmosenv.2012.11.048, 2013.
Dang, R. and Liao, H.: Radiative Forcing and Health Impact of Aerosols and Ozone in China as the Consequence of Clean Air Actions over 2012–2017, Geophys. Res. Lett., 46, 12511–12519, https://doi.org/10.1029/2019GL084605, 2019.
Derwent, R. G., Parrish, D. D., Galbally, I. E., Stevenson, D. S., Doherty, R. M., Naik, V., and Young, P. J.: Uncertainties in models of tropospheric ozone based on Monte Carlo analysis: Tropospheric ozone burdens, atmospheric lifetimes and surface distributions, Atmos. Environ., 180, 93–102, https://doi.org/10.1016/j.atmosenv.2018.02.047, 2018.
Dunker, A. M., Wilson, G., Bates, J. T., and Yarwood, G.: Chemical Sensitivity Analysis and Uncertainty Analysis of Ozone Production in the Comprehensive Air Quality Model with Extensions Applied to Eastern Texas, Environ. Sci. Technol., 54, 5391–5399, https://doi.org/10.1021/acs.est.9b07543, 2020.
Emery, C., Liu, Z., Russell, A. G., Odman, M. T., Yarwood, G., and Kumar, N.: Recommendations on statistics and benchmarks to assess photochemical model performance, J. Air Waste Manage., 67, 582–598, https://doi.org/10.1080/10962247.2016.1265027, 2017.
Gao, J., Zhu, B., Xiao, H., Kang, H., Hou, X., Yin, Y., Zhang, L., and Miao, Q.: Diurnal variations and source apportionment of ozone at the summit of Mount Huang, a rural site in Eastern China, Environ. Pollut., 222, 513–522, https://doi.org/10.1016/j.envpol.2016.11.031, 2017.
Ge, B. Z., Wang, Z. F., Xu, X. B., Wu, J. B., Yu, X. L., and Li, J.: Wet deposition of acidifying substances in different regions of China and the rest of East Asia: Modeling with updated NAQPMS, Environ. Pollut., 187, 10–21, https://doi.org/10.1016/j.envpol.2013.12.014, 2014.
Global Burden of Disease Collaborative Network: Global Burden of Disease Study 2019 (GBD 2019) Air Pollution Exposure Estimates 1990–2019, Institute for Health Metrics and Evaluation (IHME), Seattle, United States of America, https://doi.org/10.6069/70JS-NC54, 2021.
Goliff, W. S., Stockwell, W. R., and Lawson, C. V.: The regional atmospheric chemistry mechanism, version 2, Atmos. Environ., 68, 174–185, https://doi.org/10.1016/j.atmosenv.2012.11.038, 2013.
Hogrefe, C., Roselle, S. J., and Bash, J. O.: Persistence of initial conditions in continental scale air quality simulations, Atmos. Environ., 160, 36–45, https://doi.org/10.1016/j.atmosenv.2017.04.009, 2017.
Huang, L.: Data for figures in “Recommendations on benchmarks for chemical transport model applications in China – Part 2: Ozone and Uncertainty Analysis” (1.0), Zenodo [data set], https://doi.org/10.5281/zenodo.14880358, 2025.
Huang, L., Zhu, Y., Zhai, H., Xue, S., Zhu, T., Shao, Y., Liu, Z., Emery, C., Yarwood, G., Wang, Y., Fu, J., Zhang, K., and Li, L.: Recommendations on benchmarks for numerical air quality model applications in China – Part 1: PM2.5 and chemical species, Atmos. Chem. Phys., 21, 2725–2743, https://doi.org/10.5194/acp-21-2725-2021, 2021.
Jung, J., Choi, Y., Mousavinezhad, S., Kang, D., Park, J., Pouyaei, A., Ghahremanloo, M., Momeni, M., and Kim, H.: Changes in the ozone chemical regime over the contiguous United States inferred by the inversion of NOx and VOC emissions using satellite observation, Atmos. Res., 270, 106076, https://doi.org/10.1016/j.atmosres.2022.106076, 2022
Karamchandani, P., Long, Y., Pirovano, G., Balzarini, A., and Yarwood, G.: Source-sector contributions to European ozone and fine PM in 2010 using AQMEII modeling data, Atmos. Chem. Phys., 17, 5643–5664, https://doi.org/10.5194/acp-17-5643-2017, 2017.
Li, K., Jacob, D. J., Liao, H., Shen, L., Zhang, Q., and Bates, K. H.: Anthropogenic drivers of 2013–2017 trends in summer surface ozone in China, P. Natl. Acad. Sci. USA, 116, 422–427, https://doi.org/10.1073/pnas.1812168116, 2019.
Li, K., Jacob, D. J., Liao, H., Qiu, Y. L., Shen, L., Zhai, S. X., Bates, K. H., Sulprizio, M. P., Song, S. J., Lu, X., Zhang, Q., Zheng, B., Zhang, Y. L., Zhang, J. Q., Lee, H. C., and Kuk, S. K.: Ozone pollution in the North China Plain spreading into the late-winter haze season, P. Natl. Acad. Sci. USA, 118, e2015797118, https://doi.org/10.1073/pnas.2015797118, 2021.
Li, Q., Zhang, L., Wang, T., Tham, Y. J., Ahmadov, R., Xue, L., Zhang, Q., and Zheng, J.: Impacts of heterogeneous uptake of dinitrogen pentoxide and chlorine activation on ozone and reactive nitrogen partitioning: improvement and application of the WRF-Chem model in southern China, Atmos. Chem. Phys., 16, 14875–14890, https://doi.org/10.5194/acp-16-14875-2016, 2016.
Liu, H., Zhang, M., Han, X., Li, J., and Chen, L.: Episode analysis of regional contributions to tropospheric ozone in Beijing using a regional air quality model, Atmos. Environ., 199, 299–312, https://doi.org/10.1016/j.atmosenv.2018.11.044, 2019a.
Liu, H., Zhang, M., and Han, X.: A review of surface ozone source apportionment in China, Atmos. Ocean. Sc. Lett., 13, 470–484, https://doi.org/10.1080/16742834.2020.1768025, 2020a.
Liu, L., Wu, J., Liu, S., Li, X., Zhou, J., Feng, T., Qian, Y., Cao, J., Tie, X., and Li, G.: Effects of organic coating on the nitrate formation by suppressing the N2O5 heterogeneous hydrolysis: a case study during wintertime in Beijing–Tianjin–Hebei (BTH), Atmos. Chem. Phys., 19, 8189–8207, https://doi.org/10.5194/acp-19-8189-2019, 2019b.
Liu, T., Wang, C., Wang, Y., Huang, L., Li, J., Xie, F., Zhang, J., and Hu, J.: Impacts of model resolution on predictions of air quality and associated health exposure in Nanjing, China, Chemosphere, 249, 126515, https://doi.org/10.1016/j.chemosphere.2020.126515, 2020b.
Liu, Y. and Wang, T.: Worsening urban ozone pollution in China from 2013 to 2017 – Part 1: The complex and varying roles of meteorology, Atmos. Chem. Phys., 20, 6305–6321, https://doi.org/10.5194/acp-20-6305-2020, 2020.
Liu, Y., Li, J., Ma, Y., Zhou, M., Tan, Z., Zeng, L., Lu, K., and Zhang, Y.: A review of gas-phase chemical mechanisms commonly used in atmospheric chemistry modelling, J. Environ. Sci., 123, 522–534, https://doi.org/10.1016/j.jes.2022.10.031, 2023a.
Liu, Y., Geng, G., Cheng, J., Liu, Y., Xiao, Q., Liu, L., Shi, Q., Tong, D., He, K., and Zhang, Q.: Drivers of Increasing Ozone during the Two Phases of Clean Air Actions in China 2013–2020, Environ. Sci. Technol., 57, 8954–8964, https://doi.org/10.1021/acs.est.3c00054, 2023b.
Lu, X., Zhang, L., and Shen, L.: Meteorology and Climate Influences on Tropospheric Ozone: a Review of Natural Sources, Chemistry, and Transport Patterns, Current Pollution Reports, 5, 238–260, https://doi.org/10.1007/s40726-019-00118-3, 2019.
Lu, X., Zhang, L., Wang, X., Gao, M., Li, K., Zhang, Y., Yue, X., and Zhang, Y.: Rapid Increases in Warm-Season Surface Ozone and Resulting Health Impact in China Since 2013, Environ. Sci. Technol. Lett., 7, 240–247, https://doi.org/10.1021/acs.estlett.0c00171, 2020.
Luecken, D. J., Yarwood, G., and Hutzell, W. T.: Multipollutant modeling of ozone, reactive nitrogen and HAPs across the continental US with CMAQ-CB6, Atmos. Environ., 201, 62–72, https://doi.org/10.1016/j.atmosenv.2018.11.060, 2019.
Ministry of Ecology and Environmental of the People's Republic of China: Ambient air quality standards, GB 3095-2012, Ministry of Ecology and Environmental of the People's Republic of China, https://www.mee.gov.cn/ywgz/fgbz/bz/bzwb/dqhjbh/dqhjzlbz/201203/t20120302_224165.htm (last access: 14 December 2024), 2016.
Ni, R., Lin, J., Yan, Y., and Lin, W.: Foreign and domestic contributions to springtime ozone over China, Atmos. Chem. Phys., 18, 11447–11469, https://doi.org/10.5194/acp-18-11447-2018, 2018.
Ni, Z.-Z., Luo, K., Gao, Y., Gao, X., Jiang, F., Huang, C., Fan, J.-R., Fu, J. S., and Chen, C.-H.: Spatial–temporal variations and process analysis of O3 pollution in Hangzhou during the G20 summit, Atmos. Chem. Phys., 20, 5963–5976, https://doi.org/10.5194/acp-20-5963-2020, 2020.
Qiao, X., Guo, H., Wang, P., Tang, Y., Ying, Q., Zhao, X., Deng, W., and Zhang, H.: Fine Particulate Matter and Ozone Pollution in the 18 Cities of the Sichuan Basin in Southwestern China: Model Performance and Characteristics, Aerosol Air Qual. Res., 19, 2308–2319, https://doi.org/10.4209/aaqr.2019.05.0235, 2019.
Seinfeld, J. H. and Pandis, S. N.: Atmospheric chemistry and physics: from air pollution to climate change, 3rd edn., John Wiley & Sons, Inc., ISBN 978-1-119-22117-3, 2016.
Shen, L., Liu, J., Zhao, T., Xu, X., Han, H., Wang, H., and Shu, Z.: Atmospheric transport drives regional interactions of ozone pollution in China, Sci. Total Environ., 830, 154634, https://doi.org/10.1016/j.scitotenv.2022.154634, 2022.
Simon, H., Baker, K. R., and Phillips, S.: Compilation and interpretation of photochemical model performance statistics published between 2006 and 2012, Atmos. Environ., 61, 124–139, https://doi.org/10.1016/j.atmosenv.2012.07.012, 2012.
Stockwell, W. R., Kirchner, F., Kuhn, M., and Seefeld, S.: A new mechanism for regional atmospheric chemistry modeling, J. Geophys. Res.-Atmos., 102, 25847–25879, https://doi.org/10.1029/97JD00849, 1997.
Sun, Z., Tan, J., Wang, F., Li, R., Zhang, X., Liao, J., Wang, Y., Huang, L., Zhang, K., Fu, J. S., and Li, L.: Regional background ozone estimation for China through data fusion of observation and simulation, Sci. Total Environ., 912, 169411, https://doi.org/10.1016/j.scitotenv.2023.169411, 2024.
Wang, B., Sun, M., Si, L., and Niu, Z.: Spatio-temporal variation of O3 concentration and exposure risk assessment in key regions of China, 2015–2021, Atmos. Pollut. Res., 15, 101941, https://doi.org/10.1016/j.apr.2023.101941, 2024.
Wang, M. Y., Yim, S. H. L., Wong, D. C., and Ho, K. F.: Source contributions of surface ozone in China using an adjoint sensitivity analysis, Sci. Total Environ., 662, 385–392, https://doi.org/10.1016/j.scitotenv.2019.01.116, 2019.
Wang, T., Xue, L., Feng, Z., Dai, J., Zhang, Y., and Tan, Y.: Ground-level ozone pollution in China: a synthesis of recent findings on influencing factors and impacts, Environ. Res. Lett., 17, 063003, https://doi.org/10.1088/1748-9326/ac69fe, 2022.
Wang, W.-N., Cheng, T.-H., Gu, X.-F., Chen, H., Guo, H., Wang, Y., Bao, F.-W., Shi, S.-Y., Xu, B.-R., Zuo, X., Meng, C., and Zhang, X.-C.: Assessing Spatial and Temporal Patterns of Observed Ground-level Ozone in China, Sci. Rep., 7, 3651, https://doi.org/10.1038/s41598-017-03929-w, 2017.
Wang, Z., Li, J., Wang, Z., Yang, W., Tang, X., Ge, B., Yan, P., Zhu, L., Chen, X., Chen, H., Wand, W., Li, J., Liu, B., Wang, X., Wand, W., Zhao, Y., Lu, N., and Su, D.: Modeling study of regional severe hazes over mid-eastern China in January 2013 and its implications on pollution prevention and control, Science China Earth Sciences, 57, 3–13, https://doi.org/10.1007/s11430-013-4793-0, 2014.
Xu, T., Zhang, C., Liu, C., and Hu, Q.: Variability of PM2.5 and O3 concentrations and their driving forces over Chinese megacities during 2018–2020, J. Environ. Sci., 124, 1–10, https://doi.org/10.1016/j.jes.2021.10.014, 2023.
Yang, J. and Zhao, Y.: Performance and application of air quality models on ozone simulation in China – A review, Atmos. Environ., 293, 119446, https://doi.org/10.1016/j.atmosenv.2022.119446, 2023.
Yang, L., Xie, D., Yuan, Z., Huang, Z., Wu, H., Han, J., Liu, L., and Jia, W.: Quantification of Regional Ozone Pollution Characteristics and Its Temporal Evolution: Insights from Identification of the Impacts of Meteorological Conditions and Emissions, Atmosphere, 12, 279, https://doi.org/10.3390/atmos12020279, 2021a.
Yang, Y., Zhao, Y., Zhang, L., Zhang, J., Huang, X., Zhao, X., Zhang, Y., Xi, M., and Lu, Y.: Improvement of the satellite-derived NOx emissions on air quality modeling and its effect on ozone and secondary inorganic aerosol formation in the Yangtze River Delta, China, Atmos. Chem. Phys., 21, 1191–1209, https://doi.org/10.5194/acp-21-1191-2021, 2021b.
Yao, Y., Ma, K., He, C., Zhang, Y., Lin, Y., Fang, F., Li, S., and He, H.: Urban Surface Ozone Concentration in Mainland China during 2015–2020: Spatial Clustering and Temporal Dynamics, Int. J. Env. Res. Pub. He., 20, 3810, https://doi.org/10.3390/ijerph20053810, 2023.
Yarwood, G. and Tuite, K.: Representing Ozone Formation from Volatile Chemical Products (VCP) in Carbon Bond (CB) Chemical Mechanisms, Atmosphere, 15, 178, https://doi.org/10.3390/atmos15020178, 2024.
Yarwood, G., Jung, J., Whitten, G. Z., Heo, G., and Estes, M.: Updates to the Carbon Bond Mechanism for Version 6 (CB6), presented at the 9th Annual CMAS Conference, Chapel Hill, NC, USA, 11–13 October 2010, https://www.cmascenter.org/conference/2010/abstracts/emery_updates_carbon_2010.pdf (last access: 14 December 2024), 2010.
Zhai, H., Huang, L., Emery, C., Zhang, X., Wang, Y., Yarwood, G., Fu, J. S., and Li, L.: Recommendations on benchmarks for photochemical air quality model applications in China – NO2, SO2, CO and PM10, Atmos. Environ., 319, 120290, https://doi.org/10.1016/j.atmosenv.2023.120290, 2024.
Zhang, J., Shen, A., Jin, Y., Cui, Y., Xu, Y., Lu, X., Liu, Y., and Fan, Q.: Evolution of ozone formation regimes during different periods in representative regions of China, Atmos. Environ., 338, 120830, https://doi.org/10.1016/j.atmosenv.2024.120830, 2024.