the Creative Commons Attribution 4.0 License.
the Creative Commons Attribution 4.0 License.
 | 10 Apr 2025
Investigating the limiting aircraft-design-dependent and environmental factors of persistent contrail formation
Volker Grewe
Mounting evidence has highlighted the role of aviation non-CO2 emissions in anthropogenic climate change. Of particular importance is the impact of contrails, to which recent studies attribute over one-third of the total effective radiative forcing from aircraft operations. However, the relative importance of the aircraft-design-dependent and environmental factors that influence the formation of persistent contrails is not yet well understood. In this paper, we use ERA5 data from the 2010s to better understand the interplay between the factors on a climatological timescale. We identify ice supersaturation as the most limiting factor for all aircraft designs considered, underscoring the importance of accurately estimating ice supersaturated regions. We also develop climatological relationships that describe potential persistent contrail formation as a function of the pressure level and Schmidt–Appleman mixing line slope. We find that the influence of aircraft design on persistent contrail formation reduces with increasing altitude. Compared to a state-of-the-art conventional aircraft with an overall propulsion system efficiency of 0.37, water vapour extraction technologies envisioned for the future have the potential to reduce persistent contrail formation by up to 85.1 %. On the other hand, compared to the same reference, hydrogen combustion and fuel cell aircraft could increase globally averaged persistent contrail formation by 46.5 % and 54.7 % respectively. Due to differing contrail properties, further work is required to translate these changes into climate impacts. This study is a step towards the development of a new and computationally inexpensive method to analyse the contrail climate impact of novel aviation fuels and propulsion technologies.
- Article
(5756 KB) - Full-text XML
-
Supplement
(11418 KB) - BibTeX
- EndNote


Aviation contributes to anthropogenic climate change through carbon dioxide (CO2) emissions and non-CO2 emissions and effects. Of particular importance is the formation of condensation trails, or contrails, which can form behind aircraft. Most contrails quickly dissipate and have a negligible impact on the climate. However, in certain ambient conditions, contrails can spread to form contrail cirrus clouds and persist for many hours (Haywood et al., 2009; Schumann and Heymsfield, 2017). Current best estimates suggest that contrails and the resulting aircraft-induced cloudiness could be responsible for around half of the anthropogenic effective radiative forcing in 2018 that stems from aircraft operations between 1940 and 2018 (Lee et al., 2021), although these estimates are highly uncertain (Burkhardt and Kärcher, 2011; Kärcher, 2018; Lee et al., 2021). As aircraft using alternative aviation fuels are proposed and developed, there is a need to more closely examine their potential contrail climate impact.
Contrails can form when the hot and moist aircraft engine exhaust plume mixes with the ambient air and cools. If, during mixing, the exhaust plume becomes supersaturated with liquid water, water vapour condenses around condensation nuclei in the exhaust, primarily soot (Kärcher and Yu, 2009; Kärcher et al., 2015). If the ambient temperature is below the homogeneous freezing temperature, the water droplets freeze to form ice crystals, creating a visible contrail. These conditions together constitute the Schmidt–Appleman criterion (SAC; Schumann, 1996; see also Schmidt, 1941; Appleman, 1953). A lack of ice nuclei in the exhaust does not prevent a contrail from forming or persisting: in very low soot or soot-free conditions, volatile exhaust particles and ambient, natural or anthropogenic aerosols can also activate in water droplets (Kärcher et al., 2015; Kärcher, 2018; Bier and Burkhardt, 2019; Yu et al., 2024). However, due to the large variability in the properties and concentration of the ambient aerosols (e.g. Brock et al., 2021; Voigt et al., 2022), the ice crystal numbers and radiative effects of the subsequent contrails are currently highly uncertain.
Contrails can persist for many hours if the ambient conditions are supersaturated with ice (Haywood et al., 2009). These contrails slowly spread out, transitioning into contrail cirrus that can merge with natural cirrus and be transported over large distances (Kärcher, 2018). Contrail cirrus scatters incoming shortwave radiation and reduces outgoing longwave radiation (Kärcher, 2018). The radiative effect of contrail cirrus is thus diurnal in nature, with contrails warming during the night and both warming and cooling during the day (Meerkötter et al., 1999). However, on average, the warming effect has been shown to dominate (Grewe et al., 2017b; Lee et al., 2021).
Recent studies have shown that a small number of flights can have an outsize contribution to the total warming from contrail cirrus (e.g. Grewe et al., 2014; Teoh et al., 2020, 2022a). Avoiding contrail formation, in particular the “big hits”, is a topic of ongoing research (e.g. Gierens et al., 2008; Filippone, 2015; Rosenow and Fricke, 2019; Sausen et al., 2024). Several open questions should be addressed before contrail avoidance is routinely performed in daily operations (Grewe et al., 2017c). One significant hindrance of contrail avoidance schemes is that although contrail formation can be reliably forecasted, persistence currently cannot (Gierens et al., 2020; Wilhelm et al., 2022; Hofer et al., 2024b).
With this research, we take a more holistic approach to the formation of persistent contrails, focusing on the development of longer-term strategies rather than individual contrail avoidance. We aim to better understand the interplay between aircraft-dependent and aircraft-independent factors, which limit persistent contrail formation on a climatological timescale. Persistent contrail formation can be limited by three main factors: droplet formation, droplet freezing and persistence. Our objectives are (1) to identify which factor(s) is/are generally responsible for the boundaries of persistent contrail formation regions; (2) to determine the altitude, latitude and seasonal dependence of these factors and of persistent contrail formation regions; and (3) to explore possibilities for the targeted introduction of future aircraft designs to reduce persistent contrail formation. This study is thus a step towards the development of a new, computationally inexpensive method to analyse the contrail climate impact of novel aircraft fuels and propulsion technologies. Next to conventional kerosene, we consider the following technologies: sustainable aviation fuels (SAFs), hydrogen (H2) fuel cells and combustion, hybrid-electric aircraft, and water vapour extraction technologies. We describe the potential contrail impacts of each technology briefly below.
SAFs have the potential to reduce the climate impact of aviation in the shorter term. The most obvious benefit of using such fuels is the reduction in the life cycle of CO2 emissions, but SAF usage may also affect the formation and climate impact of contrails. SAFs tend to have a higher hydrogen-to-carbon ratio and a lower proportion of aromatics compared to conventional kerosene. This results in a lower soot and ice crystal number concentration (Moore et al., 2017; Bräuer et al., 2021; Voigt et al., 2021), which in turn reduces the optical depth and climate impact of contrails (Burkhardt et al., 2018). However, the higher hydrogen-to-carbon ratio also results in increased water vapour emissions and thus to the more frequent formation of persistent contrails (Rojo et al., 2015; Caiazzo et al., 2017; Teoh et al., 2022b; Hofer et al., 2024a).
In the longer term, another promising technology is hydrogen, either combusted in a jet engine or used in a fuel cell. The use of hydrogen has no direct CO2 emissions and, unlike conventional jet fuels, is not expected to produce any soot or particulate emissions, although the formation of ultrafine volatile particles from lubricant oil vapours has been observed in laboratory combustion tests (Ungeheuer et al., 2022). The use of H2 in a jet engine will also significantly increase water vapour emissions, from 1.25 kg kg−1 (kerosene) to around 8.94 kg kg−1 (hydrogen). Taking into account the fact that H2 has a gravimetric energy density around 3 times higher than that of kerosene – 120.9 compared to 43.6 MJ kg−1 – the slope of the SAC mixing line is around 2.6 times larger for H2 combustion than for kerosene for the same overall propulsion system efficiency. Given the low exhaust temperature, that factor is even higher for H2 fuel cells, between 2.7 and 8.2 times, depending on the operating voltage of the fuel cell (Gierens, 2021). We can, therefore, expect a significant increase in contrail formation from H2 aircraft (e.g. Grewe et al., 2017a; Kaufmann et al., 2024). However, recent studies (Wolf et al., 2023; Sanogo et al., 2024) show that contrail formation does not scale linearly with this factor. Kaufmann et al. (2024) in particular show that contrail formation from hydrogen-powered aircraft is strongly dependent on the season, altitude and latitude. This suggests that the ambient atmospheric conditions and processes rather than the aircraft design mostly limit persistent contrail formation.
Other technologies reduce the slope of the mixing line, promising less frequent contrail formation – here we consider hybrid-electric aircraft and the water-enhanced turbofan (WET) concept. Hybrid-electric aircraft are promising in that they could be flown in such a way that only electric power is used within regions of potential persistent contrail formation. Even when electric power is combined with conventional fuel during continuous use, the mixing line slope of the combined system is lower, resulting in fewer contrails forming (Yin et al., 2020). However, hybrid-electric aircraft have limited use cases due to their low speed and service ceiling. Another possibility for reducing the mixing line slope is by condensing, storing and releasing water in areas where the ambient conditions are not conducive to persistent contrail formation. A notable example of this is the WET concept (Schmitz et al., 2021; Pouzolz et al., 2021; Kaiser et al., 2022). The benefit of such a system is that it can be integrated into a wider range of aircraft and that it is not limited by speed and the service ceiling.
In the following section, we describe the methodology and data used in this study. The limiting factors of climatological persistent contrail formation are analysed, discussed and compared to one another in Sect. 3. We conclude the study in Sect. 4.
This section outlines the data and methods used to calculate the limiting factors of persistent contrail formation on a climatological basis. Section 2.1 describes the thermodynamic contrail formation and persistence criteria and provides the calculation methods for the mixing line slopes of various propulsion systems. We cover the full range of possible mixing line slopes but also specify certain aircraft designs for easier comparison between different technologies, both of which are described in Sect. 2.2. We provide an overview of our air traffic scenario in Sect. 2.3. In Sect. 2.4, we present the reanalysis dataset and the corresponding humidity corrections used in this study. Finally, the limiting factors and maximum slope analyses are described in Sect. 2.5 to 2.7.
2.1 Contrail formation and persistence
As described in the introduction, contrails form as the hot and moist aircraft engine exhaust plume mixes with the cold and dry ambient air. The mixing process is approximated by the Schmidt–Appleman theory (Schumann, 1996) as isobaric mixing, resulting in a straight mixing line on a temperature vs. water vapour partial pressure diagram (e.g. the dashed lines in Fig. 1). The slope G of the mixing line is a function of the ambient pressure as well as aircraft-engine- and fuel-dependent properties. For conventional kerosene (CON), the slope can be calculated using the following equation (Schumann, 1996):
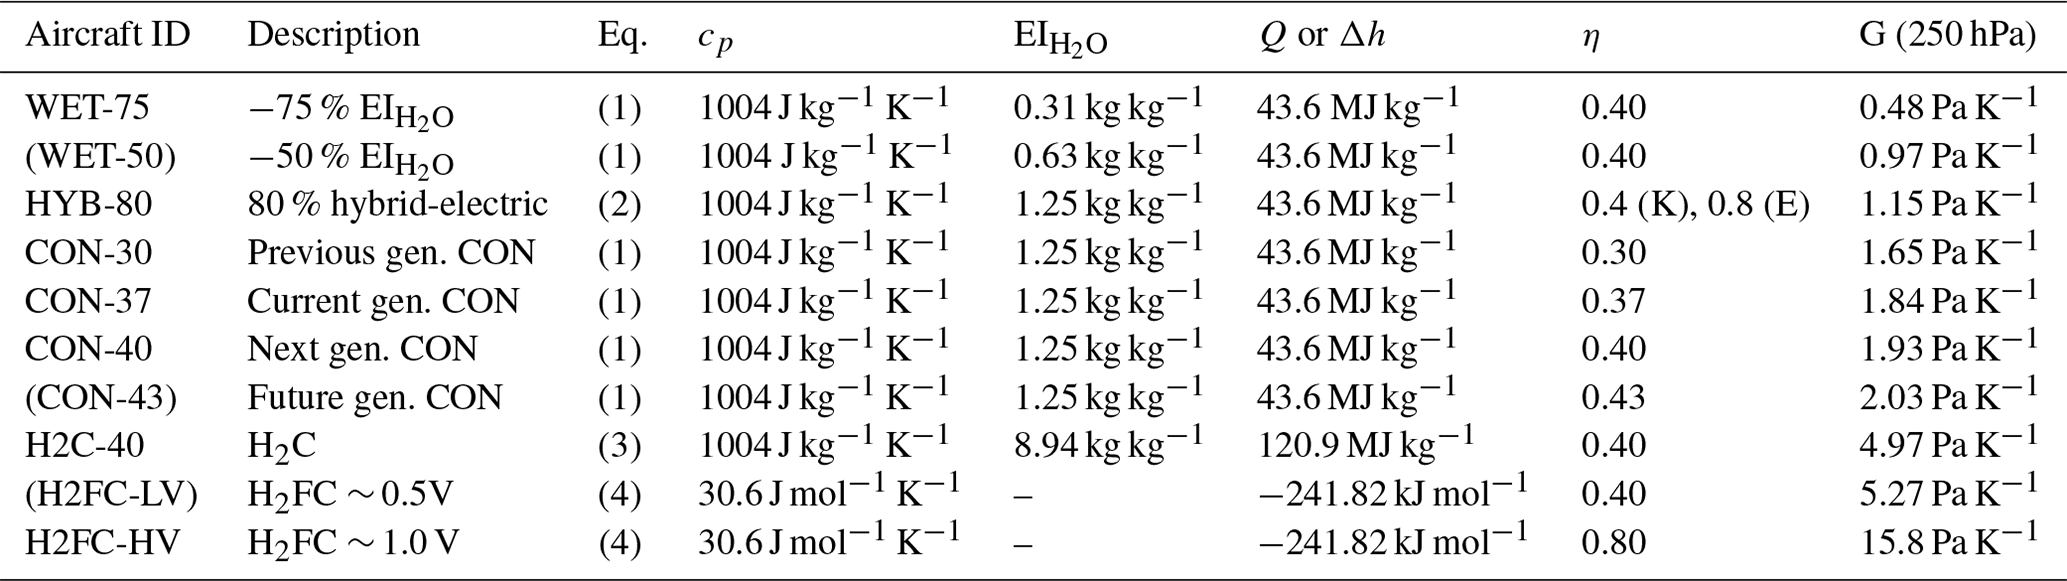
where cp=1004 J kg−1 K−1 is the isobaric heat capacity of air, pa the ambient pressure [Pa], ϵ=0.622 the molar mass ratio of water vapour and dry air, EI the emission index of water vapour [kg kg−1(fuel)], η the overall propulsion system efficiency, and Q the lower heating value of the fuel [MJ kg−1].
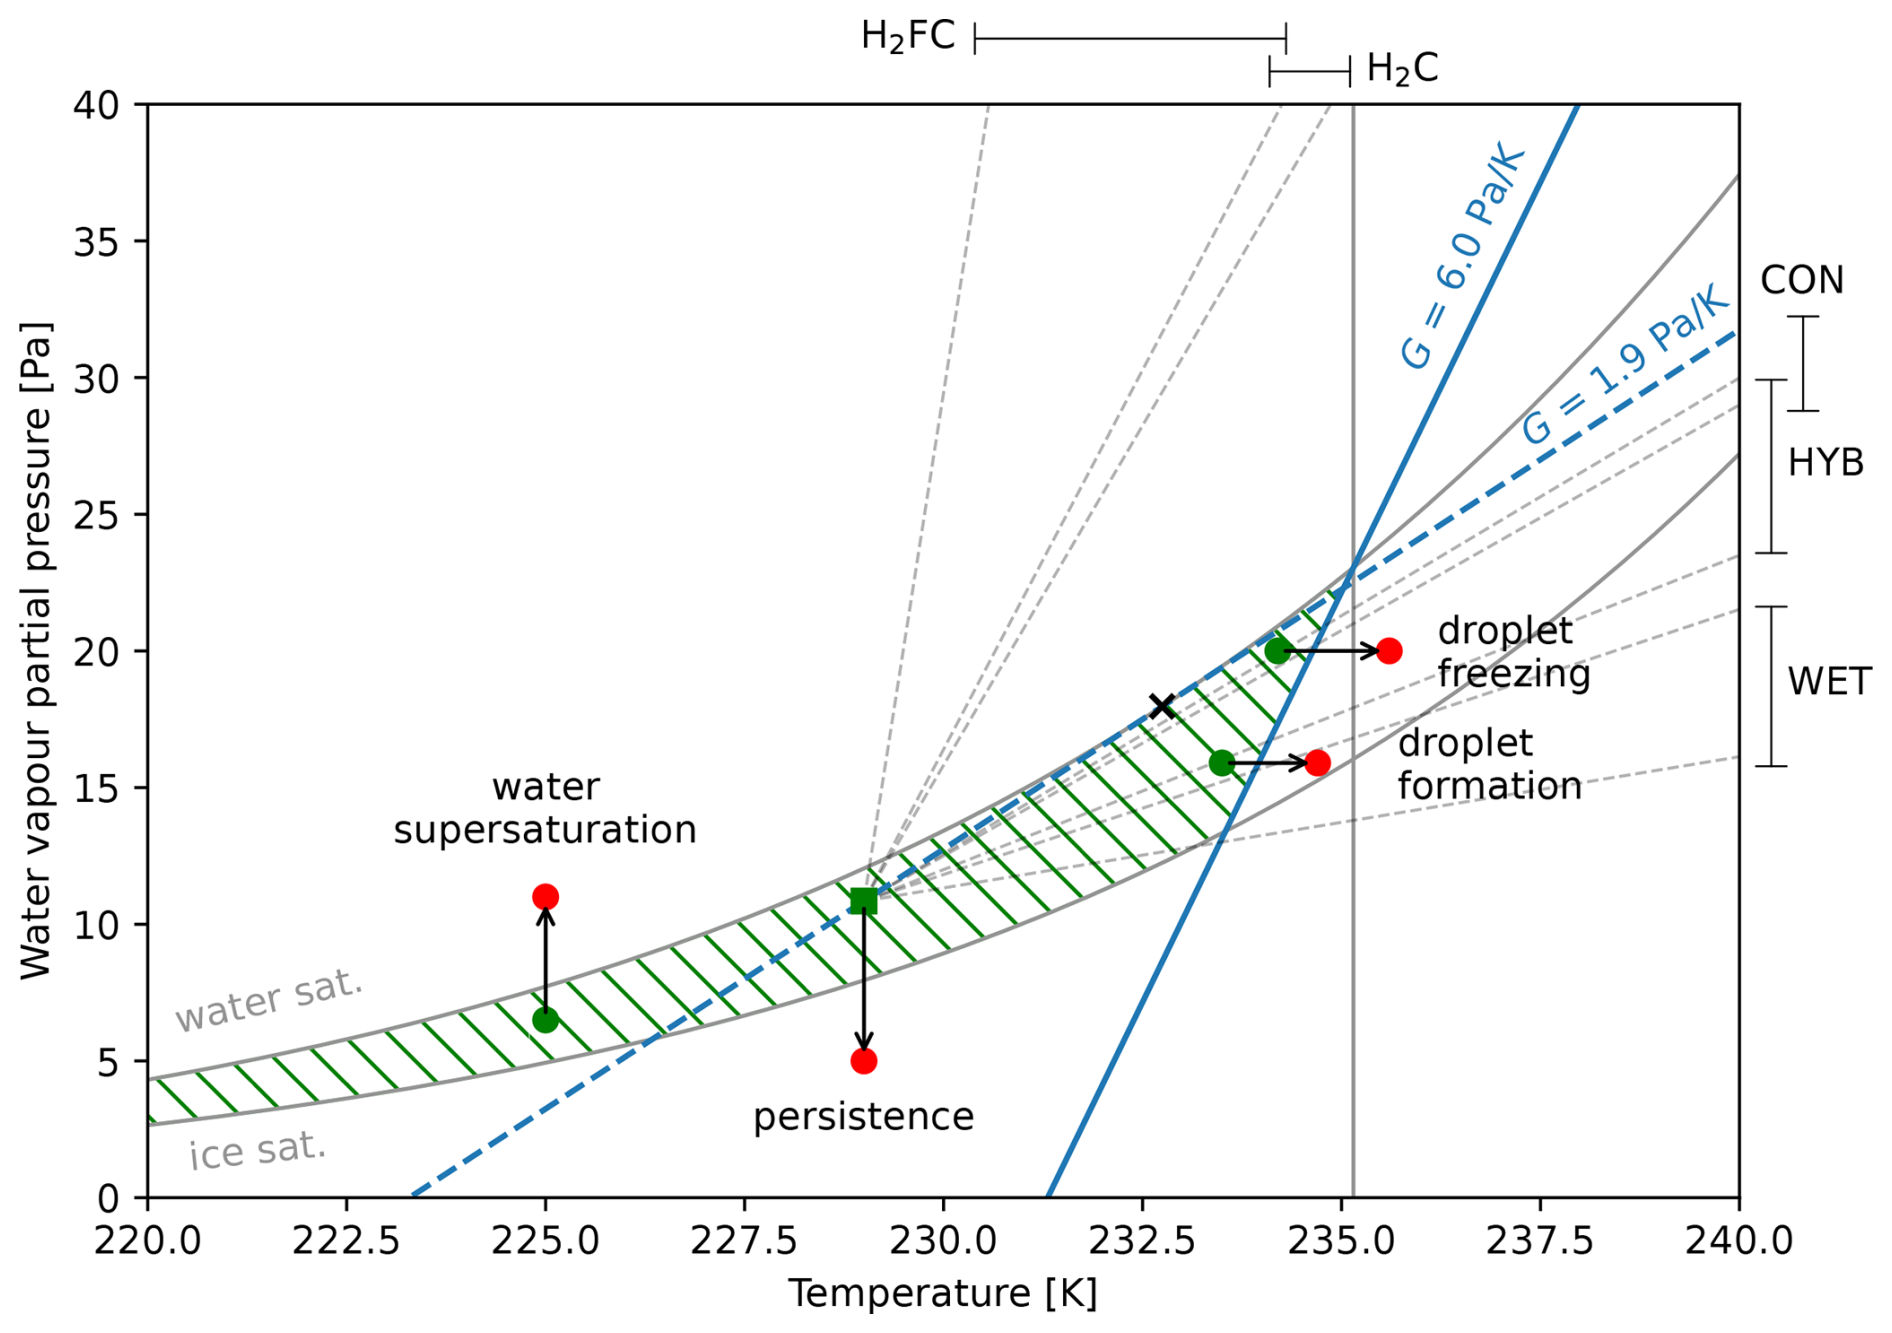
Figure 1Ambient temperature vs. water vapour partial pressure diagram with an example threshold mixing line for an aircraft with G=6.0 Pa K−1 (blue line). A persistent contrail would form behind this aircraft if the ambient conditions are within the hashed green area. Four limiting factors can be identified that define this area, represented by the arrows from green (persistent contrail forms) to red (persistent contrail does not form) points. Ranges of mixing line slopes for each aircraft type at 250 hPa (FL340) are shown as dotted lines. The dashed blue line, G=1.9 Pa K−1, is the threshold mixing line for the ambient conditions defined by the green square. The point at which this mixing line is tangential to the water saturation curve (Tmax; see main text) is shown by a black cross.
This definition was adapted by Yin et al. (2020) for hybrid battery–electric aircraft by introducing a ratio R, where R=1 is pure liquid fuel operation, and R=0 is pure electric operation. The quasi-electric energy content is defined as , where K refers to liquid fuel (kerosene) and E to the electric system.
The definition was further modified for hydrogen combustion (H2C) and fuel cell (H2FC) aircraft by Gierens (2021). Equation (3) is very similar to the standard definition and is used for hydrogen combustion, where the lower heating value MJ kg−1.
The calculation for fuel cells is more complex. Fuel cells operate in conjunction with electric motors, which fully decouple the exhaust from the propulsion. The exhaust could be modified to recover heat, separate and store water, or achieve a desired ice crystal size. The properties of contrails produced by fuel-cell-powered aircraft thus depend on the design of the fuel cell system to a much larger degree than traditional gas turbine engines do. Moreover, due to the potentially very high levels of supersaturation reached in the plume, homogeneous droplet nucleation could also take place even without the presence of aerosols. However, there is not yet a common understanding of the relevance of this nucleation pathway, nor are there any measurements of such contrails. In this study, we have thus used the simplified modification of Gierens (2021), which is shown in Eq. (4). We make use of the mole-based heat capacity of the exhaust gases , which Gierens (2021) showed was not a constant (see their Eq. 15). Nevertheless, we assume it to be 30.6 J mol−1 K−1 for all pressure levels for simplicity. This is possible because the variability in the heat capacity is low. We further define the electric efficiency ηE, the basic efficiency η0 and the formation enthalpy of water vapour Δhm. For simplicity we combine the two efficiencies into a single efficiency η, as shown in Table 1.
To determine whether a persistent contrail forms at a given location, we check the following three conditions, which we define as limiting factors.
-
Droplet formation. Ambient temperature is less than the threshold temperature (see below), and ambient water vapour partial pressure is above the threshold mixing line.
-
Droplet freezing. Ambient temperature is less than the homogeneous freezing temperature (235.15 K).
-
Persistence. Ambient water vapour partial pressure is above the ice saturation curve.
If these three conditions are all met, a persistent contrail forms. For completeness, a fourth boundary, water supersaturation, can also be defined. However, for the pressure levels of interest in this article, the occurrence of this set of conditions is insignificant (Krämer et al., 2009). The limiting factors are shown graphically in Fig. 1.
To aid in determining droplet formation, we can define two threshold temperatures, Tmin and Tmax. Consider first the ambient conditions represented by the green square marker (229 K, 10.9 Pa) and the corresponding dashed blue mixing line for G=1.9 Pa K−1 in Fig. 1. For these ambient conditions, an aircraft with a mixing line slope less than G=1.9 Pa K−1 would not produce a contrail since the mixture never becomes supersaturated with water. The temperature Tmax, or sometimes Θ (e.g. Kärcher et al., 2015), thus traditionally refers to the temperature at which the threshold mixing line (G=1.9 Pa K−1) is tangential to the water saturation curve, in this case around 232.7 K (black cross marker). The temperature Tmin refers to the temperature at which the threshold mixing line has a water vapour partial pressure of 0 Pa, in this case around 223.2 K.
However, we argue that this definition of Tmax is insufficient for aircraft with higher mixing line slopes. In order for a contrail to form, droplet formation and droplet freezing must occur concurrently. If, when using the standard definition, Tmax is found to be larger than 235.15 K (which occurs for G>2.38 Pa K−1), it is possible that the plume becomes subsaturated with water again before it cools below 235.15 K. There is thus insufficient time in the plume for ice crystals to form before the water droplets evaporate (see e.g. Fig. 3 of Bier et al., 2024). This effect has been described as a reduction in the “effective freezing temperature” because ice crystal numbers reduce as the ambient temperature approaches 235.15 K (Kärcher, 2018; Bier et al., 2022, 2024).
To counter this problem, for aircraft with G>2.38 Pa K−1, we set the threshold mixing line to intersect with the point of water saturation at the homogeneous freezing temperature – see the blue threshold mixing line for G=6.0 Pa K−1 in Fig. 1. By doing so, we ensure that all possible mixing lines for the ambient conditions within the green hatched area are at some point concurrently supersaturated with water and colder than the homogeneous freezing temperature. Using this method, we are able to closely replicate the ambient temperatures at which Bier et al. (2022) and Bier et al. (2024) find final ice crystal numbers of zero (their Figs. 5c and 4 respectively) – see Fig. S1. In this study, we therefore extend the original approximation of Tmax by Schumann (1996) and the amendment for higher temperatures by Gierens (2021) to
2.2 Aircraft definitions
For the limiting factors analysis, we define a range of aircraft, representative of different propulsion technologies. This is necessary to limit the computational resources required but nevertheless allows for a good comparison between the technologies. We select 10 aircraft–fuel combinations that span a range of G from 0.48 to 15.8 Pa K−1 at 250 hPa (Table 1).
We define the four conventional kerosene-powered aircraft as CON-XX, where XX is the overall propulsion system efficiency η in percent: 30 % for the previous generation, 37 % for the current state of the art, 40 % for the next generation and 43 % for the future generation. We note that there is a wide range of conventional aircraft currently operating and that the overall propulsion system efficiency varies according to the operating condition, altitude and a multitude of other factors. Assuming a single value for comparison is thus not optimal but is necessary for this analysis. Unless otherwise stated, we use CON-37 as the reference aircraft in this study.
We further define an 80 % parallel hybrid-electric aircraft, HYB-80. We use a high degree of electrification to differentiate it from the conventional aircraft – a 60 % hybrid-electric aircraft would have approximately the same mixing line slope as CON-30. We further include two potential aircraft designs that reduce the effective emission index of water vapour, EI, using the water-enhanced turbofan (WET) concept. In this study, we assume reductions in EI of 50 % (WET-50) and 75 % (WET-75) for simplicity. We ignore the impact of any potential emissions of stored liquid water that is released outside of ice supersaturated regions (ISSRs). We also define three different hydrogen-powered aircraft: H2C-40 is a hydrogen combustion (H2C) aircraft, which assumes that η=0.4, and H2FC-LV and H2FC-HV are hydrogen fuel cell (H2FC) aircraft that have operating voltages of 0.5 and 1.0 V respectively. The operating voltage has a very large influence on the slope of the mixing line, as Gierens (2021) showed.
Table 1Definitions of the aircraft–engine–fuel combinations used in this study, representative of different current and future propulsion technologies. See text for the description of the variables. The results for the aircraft IDs in brackets are available as links in the “Data availability” section but have not been presented in this study's results for the sake of brevity.
2.3 Air traffic data
We use a representative future air traffic scenario to weight our results and identify areas of particular interest. In this study, we use the progressive scenario of the DLR internal project Development Pathways for Aviation up to 2050 (DEPA 2050; Leipold et al., 2021). A key objective of this project was to define and assess the development of the aviation industry until the year 2050 from multiple angles, including climate, economics and society. It also studied the potential entry into service of various novel aviation fuels and technologies. This scenario was selected for this research since it is representative of a future multi-fuel global fleet and because there are no restrictions on its publication. We use the forecasted aggregate yearly fuel and distance flown by the global fleet of aircraft in the year 2050 from the DEPA 2050 progressive scenario, which is available with a 1° latitude resolution. The emission inventory is included in the “Data availability” section and is shown graphically in Fig. S2.
2.4 ERA5 data and corrections
To calculate regions of potential persistent contrail formation, we use the European Centre for Medium-Range Weather Forecasts (ECMWF) fifth-generation reanalysis dataset (ERA5; Hersbach et al., 2020) stored on the German Climate Computing Centre (DKRZ) supercomputer Levante. Specifically, we use the ambient temperature and relative humidity at 350, 300, 250, 225, 200, 175 and 150 hPa pressure levels within the 2010s (December 2009 to November 2019, inclusive). In this study, we use RHi to denote relative humidity with respect to ice and RHw to denote relative humidity with respect to water. We further define the seasons as DJF, MAM, JJA and SON. To avoid autocorrelation and reduce the computational time whilst still obtaining a climatological response, we randomly select 2190 h per season over the 10-year time frame – this corresponds to 10 % of all hourly values within the 2010s. We use numpy.random.choice with seed 42 without replacement to determine the hours to choose per season for repeatability. Figure S3 shows the hours that were selected.
The ERA5 HRES (high-resolution) temperature and relative humidity values are archived on a reduced Gaussian grid with a resolution of N320. The pre-interpolated data are available on DKRZ Levante on a daily basis. We decided to use the irregular N320 grid for our analysis rather than interpolated data to avoid any interpolation artefacts in the relative humidity data in particular. However, this complicates the definition of cell neighbours and the calculation of the limiting factors, as described in the next section.
Numerous authors have shown the difficulty of estimating ice supersaturated regions (ISSRs) and hence contrail persistence when using reanalysis data. For example, Agarwal et al. (2022) found that ERA5 sometimes overestimated ISSR coverage when compared to radiosonde measurements, whereas Reutter et al. (2020) found an underestimation in comparison to in situ In-service Aircraft for a Global Observing System (IAGOS) measurements (Petzold et al., 2015). Gierens et al. (2020), comparing ERA5 and Measurement of Ozone, Water Vapour, Carbon Monoxide, and Nitrogen Oxides by Airbus In-Service Aircraft (MOZAIC) data (Marenco et al., 1998), found that although contrail formation can be predicted reliably, persistence cannot. In a follow-up study, Hofer et al. (2024b) found that even when using variables other than relative humidity, ISSR prediction cannot yet be significantly improved.
There have been many suggestions as to how to correct ERA5 data to more accurately estimate ISSRs at both the regional (Teoh et al., 2022a; Wang et al., 2025) and the global scale (Hofer et al., 2024b; Teoh et al., 2024; Wolf et al., 2025). In this study, we enhance the ERA5 humidity by applying a correction factor of RHicor for RHi, as was done in previous studies (e.g. Schumann, 2012; Teoh et al., 2020; Reutter et al., 2020; Schumann et al., 2021). We note that this approach does not consider latitude dependence of the ERA5 RHi error (Teoh et al., 2024). However, when modifying the cumulative distribution function found for ERA5 by Hofer et al. (2024b, their Fig. 4) to include the RHi enhancements, we find that RHicor=0.95 provides a good fit for the MOZAIC/IAGOS data for RHi ≤ 1.0 (Fig. S4), which is of relevance for this study. We further discuss the regional implications of this method in Sect. 3.6.
Previous studies have shown that compared to IAGOS, ERA5 generally underestimates ambient temperatures, which are also important for determining potential persistent contrail formation regions. At conventional pressure levels, Wolf et al. (2025) find an average global underestimation of up to −0.7 K (see their Fig. 3). At higher altitudes (lower pressure levels), the global average difference increases to around −1.0 K. We analysed the impact of a global increase of 0.1, 0.5 and 1.0 K on climatological potential persistent contrail formation (see Sects. 2.7 & 3.4) and found that the effect of the temperature bias is small compared to that of relative humidity (see Fig. S7). Therefore, we do not consider the temperature correction any further in this study and focus on sensitivity to relative humidity.
2.5 Limiting factor analysis
The objective of the limiting factors analysis is to understand the aircraft design, altitude, latitude and seasonal dependence of the factors responsible for persistent contrail formation. This helps us identify regions where the introduction of aircraft using novel propulsion systems and fuels with substantially higher mixing line slopes, e.g. hydrogen combustion, would lead to increased persistent contrail formation or where the use of aircraft with substantially lower mixing line slopes, such as hybrid-electric or WET aircraft, could be particularly beneficial.
We first consider the probability of persistent contrail formation ppcf for each aircraft design. This is calculated by creating a Boolean mask for persistent contrail formation using the three limiting factors for all 3D grid cells, time steps and aircraft designs. The Boolean values for each grid cell are averaged and saved per month. Since the underlying ERA5 grid is irregular, when reporting and analysing a global ppcf, we use an area and level weighting. We calculate the area of all grid cells as viewed from above using the calculate_areas method of the Python library scipy.spatial.SphericalVoronoi, with an assumed spherical Earth radius of 6371 km, and assume the cell areas to be constant with altitude. Since ERA5 also has irregular spacing in altitude, we use the difference (in hPa) between pressure levels to level weight the results.
We then consider each limiting factor individually. For each aircraft design, time step and grid cell, we determine which of the limiting factors prevents a persistent contrail from forming. By summing the number of times each factor was limiting and normalising by the number of time steps, we obtain the probability of each limiting factor preventing persistent contrail formation. The results are saved per season and year (e.g. 2010 DJF) to limit memory usage. We then investigate the dependence of each limiting factor on the altitude, latitude and season. When reporting global results, we perform area and level weighting as before.
2.6 Analysis of persistent contrail formation region boundaries
We now consider Fig. 1 again: if an aircraft is flying with the mixing line slope G shown by the blue line in ambient conditions within the green hatched area, a persistent contrail will form. If the ambient conditions are subsequently no longer within the green hatched area due to changes in the ambient temperature, relative humidity, altitude or aircraft performance, the aircraft will stop producing a persistent contrail, thus defining the boundary of a persistent contrail formation region. One or more of the limiting factors will have been responsible for that boundary.
The objective of this analysis is to understand the relative importance of the limiting factors in defining the horizontal and vertical boundaries of persistent contrail formation regions. In the horizontal direction, we begin by calculating the total perimeter of all persistent contrail formation regions. Then, we compare the length of the boundary caused by each limiting factor to the total perimeter. The boundary lengths for each limiting factor are thus subsets of the total. But since multiple factors can be simultaneously limiting, the sum of all limiting factor boundary lengths is greater than the total. A large boundary length for a given limiting factor means that factor was often responsible for persistent contrails forming.
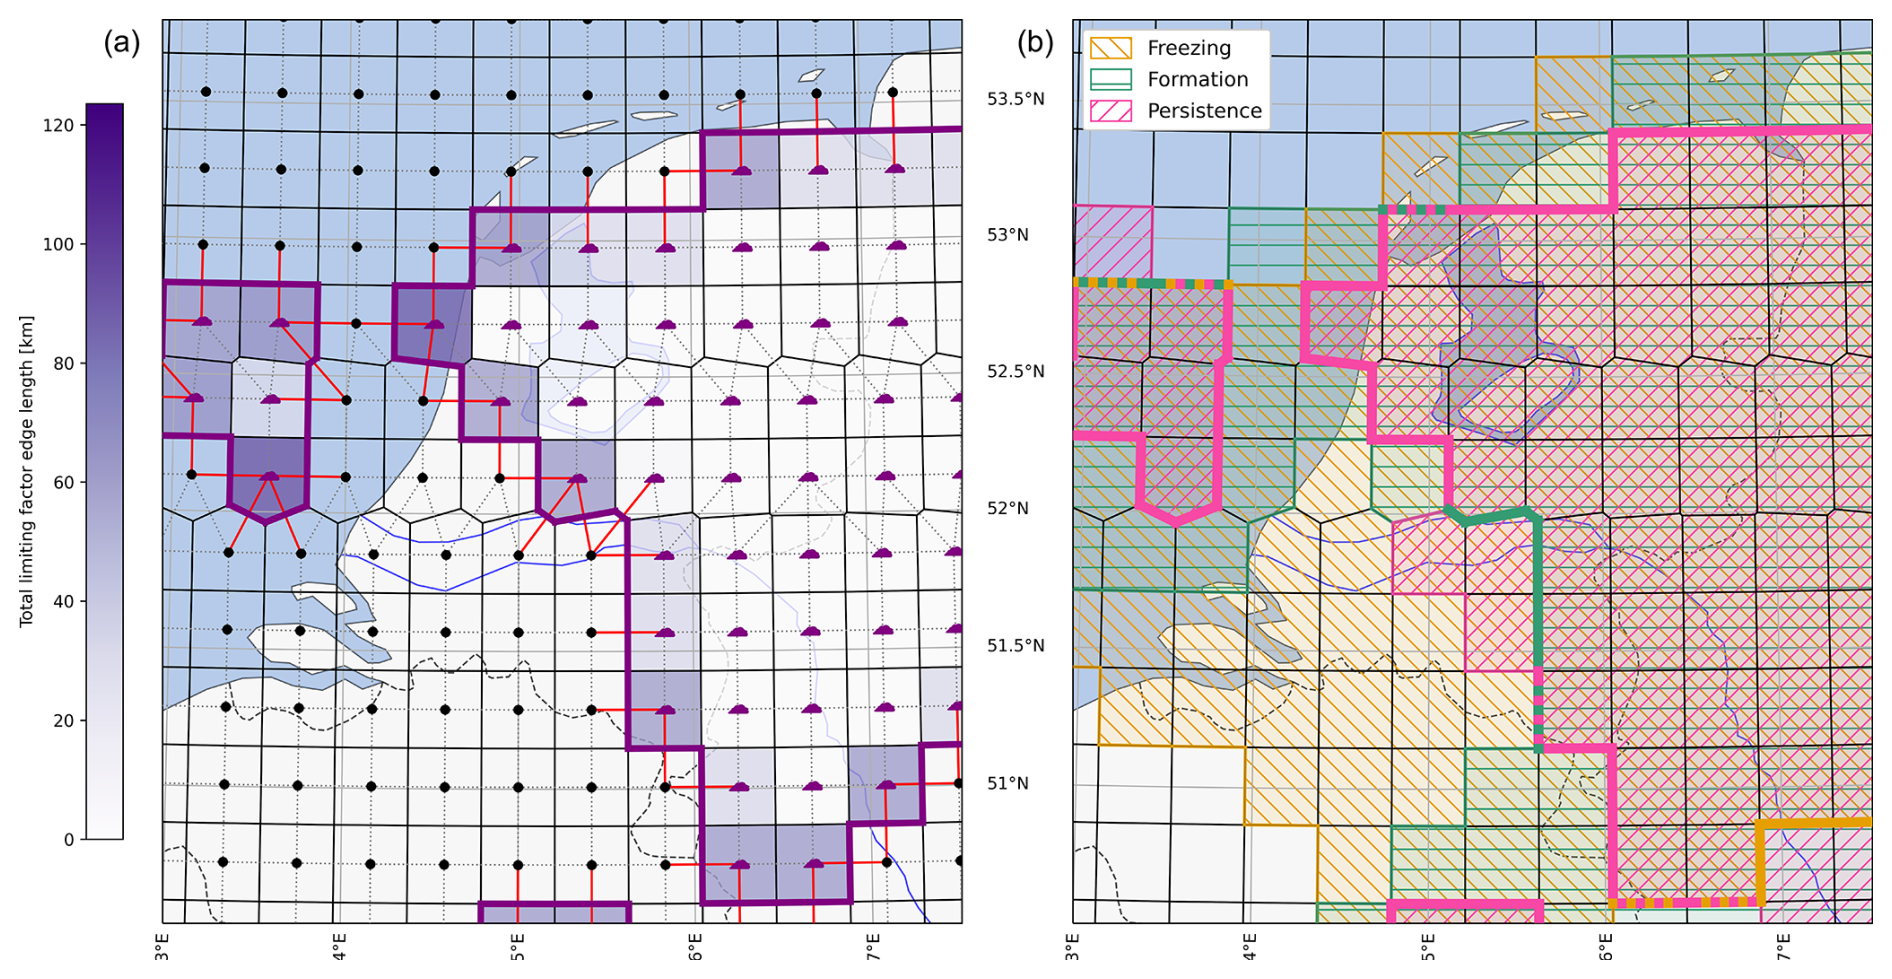
Figure 2Example of the horizontal limiting factor analysis for H2C-40 using fictional data at a single pressure level over the Netherlands. (a) Analysis of the total limiting factor - persistent contrails would form at all grid points with a purple cloud icon. The red lines correspond to all possible boundary crossings into the potential persistent contrail formation regions; the purple shading corresponds to the length of the boundary around each grid cell. (b) Droplet freezing (yellow hatching), droplet formation (green hatching) and persistence (pink hatching) limiting factors. The thick coloured lines represent the limiting factor that is responsible for the boundary. If multiple factors are responsible, the line is dashed. For the analysis of each limiting factor individually, only the correspondingly coloured boundaries are considered in the edge length around each grid cell.
We demonstrate this analysis graphically in an example shown in Fig. 2 for H2C-40 using fictional data on the ERA5 grid for a single time and pressure level over the Netherlands. We calculate the borders between grid cells (black lines) using the scipy.spatial.SphericalVoronoi method and find cell neighbours (dotted grey lines) by determining the cells that share a pair of edge vertices. The combination of persistence, droplet freezing and droplet formation (coloured hatching) results in potential persistent contrail formation regions (purple cloud icons). We are interested in the boundaries of persistent contrail formation regions; therefore, we need to identify neighbouring cells with different icons (red lines). These cells i and j share a border dij (thick purple line), which we calculate using the Haversine formula assuming an Earth radius of 6371 km. The colour gradient bar indicates the length of the persistent contrail formation region border around each grid cell: a darker purple corresponds to a longer boundary, a lighter purple to a shorter boundary. By globally summing all dij, we obtain the total perimeter of all persistent contrail formation regions. This is repeated for the boundaries caused by individual limiting factors (thick yellow, green and pink lines).
Programmatically, for each aircraft design and time step, we create four 3D Boolean masks: one for potential persistent contrail formation and one per limiting factor. For each aircraft design, time step, pressure level and limiting factor, we create a global symmetric adjacency matrix A of size n×n, where n=542 080 is the number of grid points in the ERA5 grid. For any two adjacent cells i and j, Aij=dij (shared border length, thick purple line) if the persistent contrail formation Boolean at i is TRUE (persistent contrail forms, purple cloud icon) and the limiting factor Boolean at j is FALSE (the limiting factor has prevented persistent contrail formation, black point), else Aij=0. To obtain the total perimeter, we set Aij=dij if any limiting factor Boolean at j is FALSE. We then obtain the vector of size n of boundary lengths around each grid cell (cell colour gradient) by summing the columns of the adjacency matrix. This procedure is repeated for each time step, and the monthly summed values for each aircraft design, grid cell, pressure level and limiting factor are saved. We repeat the full analysis for all RHi enhancements.
We perform a similar analysis in the vertical direction to analyse the impact of changing the altitude and thus the mixing line slope G. For simplicity, we neglect the changes in aircraft operating conditions during the climb or descent to a new altitude. Vertically adjacent cells can be found easily because the latitude–longitude location of the cells is constant with altitude. Since there are no clearly defined edge lengths in the vertical direction, we calculate the boundaries of persistent contrail formation regions by summing the cell areas as viewed from above.
2.7 Maximum slope analysis
In the limiting factor analysis, fixed aircraft designs with specific values of G are used. The objective of this second analysis is to explore the dependence of persistent contrail formation ppcf on G in more detail and determine whether there is a climatological relationship between the two. We analyse the results at the global level as well as on three latitude-dependent scales: the northern extratropics (latitude > 30° N), the tropics (30° S ≤ latitude ≤ 30° N) and the southern extratropics (latitude < 30° S).
For each cell where the ambient conditions are sufficient for persistent contrail formation, we use the Newton method to find the slope where the mixing line is tangential to the water saturation curve. If the temperature at which this mixing line is tangential to the water saturation curve (Tmax) is greater than the homogeneous freezing temperature (235.15 K), we set Tmax to 235.15 K (see Sect. 2.1). The slope of the line that connects the ambient conditions to the water supersaturated conditions for Tmax is thus the maximum mixing line slope for which a persistent contrail would not form. We define this threshold mixing line as Gmax. For example, for the ambient conditions shown by a green square in Fig. 1, the corresponding maximum slope is Gmax=1.9 Pa K−1 (dashed blue line). For each region, altitude and time step, we use a histogram with a bin size of 0.2 Pa K−1 to determine the distribution of Gmax. By taking the cumulative sum of the histograms, we obtain ppcf as a function of G.
This section presents and discusses the results of the limiting factor analyses. Section 3.1 and 3.2 analyse the limiting factors within each grid cell and at the boundaries of persistent contrail formation regions. The altitude and latitude dependence of these regions and the changes in global potential persistent contrail formation ppcf are presented in Sect. 3.3. In Sect. 3.4, we develop climatological relationships between the mixing line slope and the ppcf. Finally, we discuss the interplay and competition between the limiting factors in Sect. 3.5 and the limitations of and uncertainties in our study in Sect. 3.6.
3.1 Limiting factors of persistent contrail formation
We find that the formation of persistent contrails is primarily limited by ice supersaturation (the persistence limiting factor). Figure 3 shows the global area- and level-weighted potential persistent contrail formation (ppcf) and the frequency of each limiting factor preventing a persistent contrail from forming. Enhancing the area of ice supersaturation by lowering the relative humidity threshold as a means of correcting ERA5 relative humidity (see Sect. 2.4) increases ppcf proportionally more for aircraft with higher G (markers).
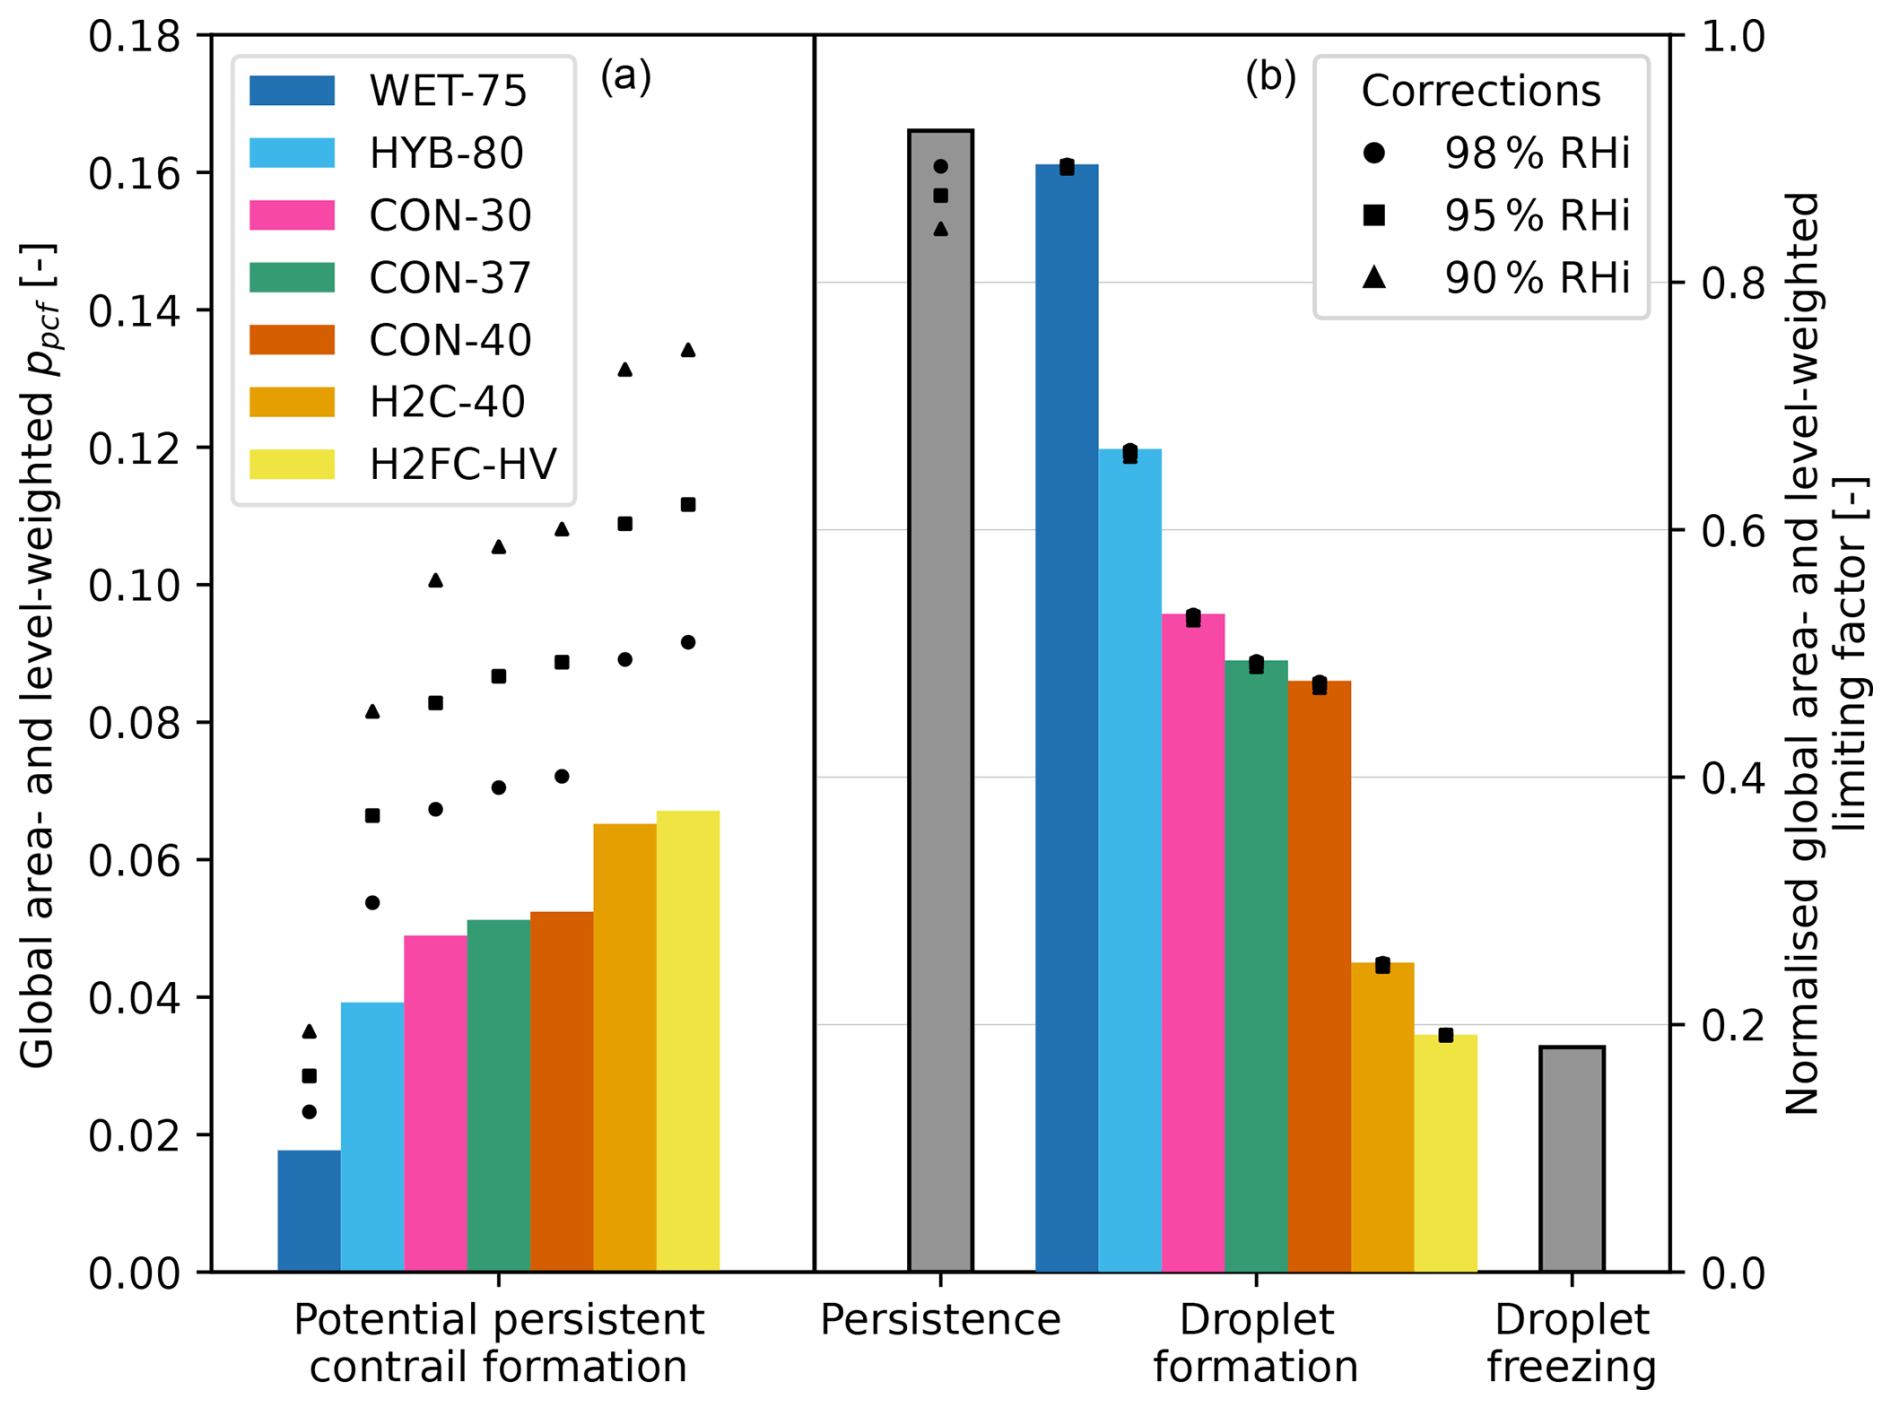
Figure 3Global area- and level-weighted potential persistent contrail formation during the 2010s (a) and the normalised frequency that each limiting factor prevented a persistent contrail from forming (b). A normalised frequency of 0 would mean that the factor never limited persistent contrail formation; 1 means that it always does. Dependence on aircraft design is shown by the different colours – the persistence and droplet freezing limiting factors are independent of aircraft design and thus only have single values. The RHi enhancements are shown as scatter points – note the difference in the y-axis scale.
The altitude and latitude dependence of the limiting factors are shown in Fig. 4. The persistence limiting factor is less limiting in the extratropics at lower altitudes (350 to 250 hPa) and in the tropics at higher altitudes (225 to 150 hPa). In total, it prevents persistent contrail formation 92.3 % of the time. Enhancing humidity by lowering the threshold for ice supersaturation reduces how limiting persistence is, as was expected. On the other hand, droplet freezing is generally only limiting in the tropics at altitudes below FL300 (pressure levels ≥300 hPa), in total only 18.2 % of the time. It is by definition unaffected by humidity enhancements.
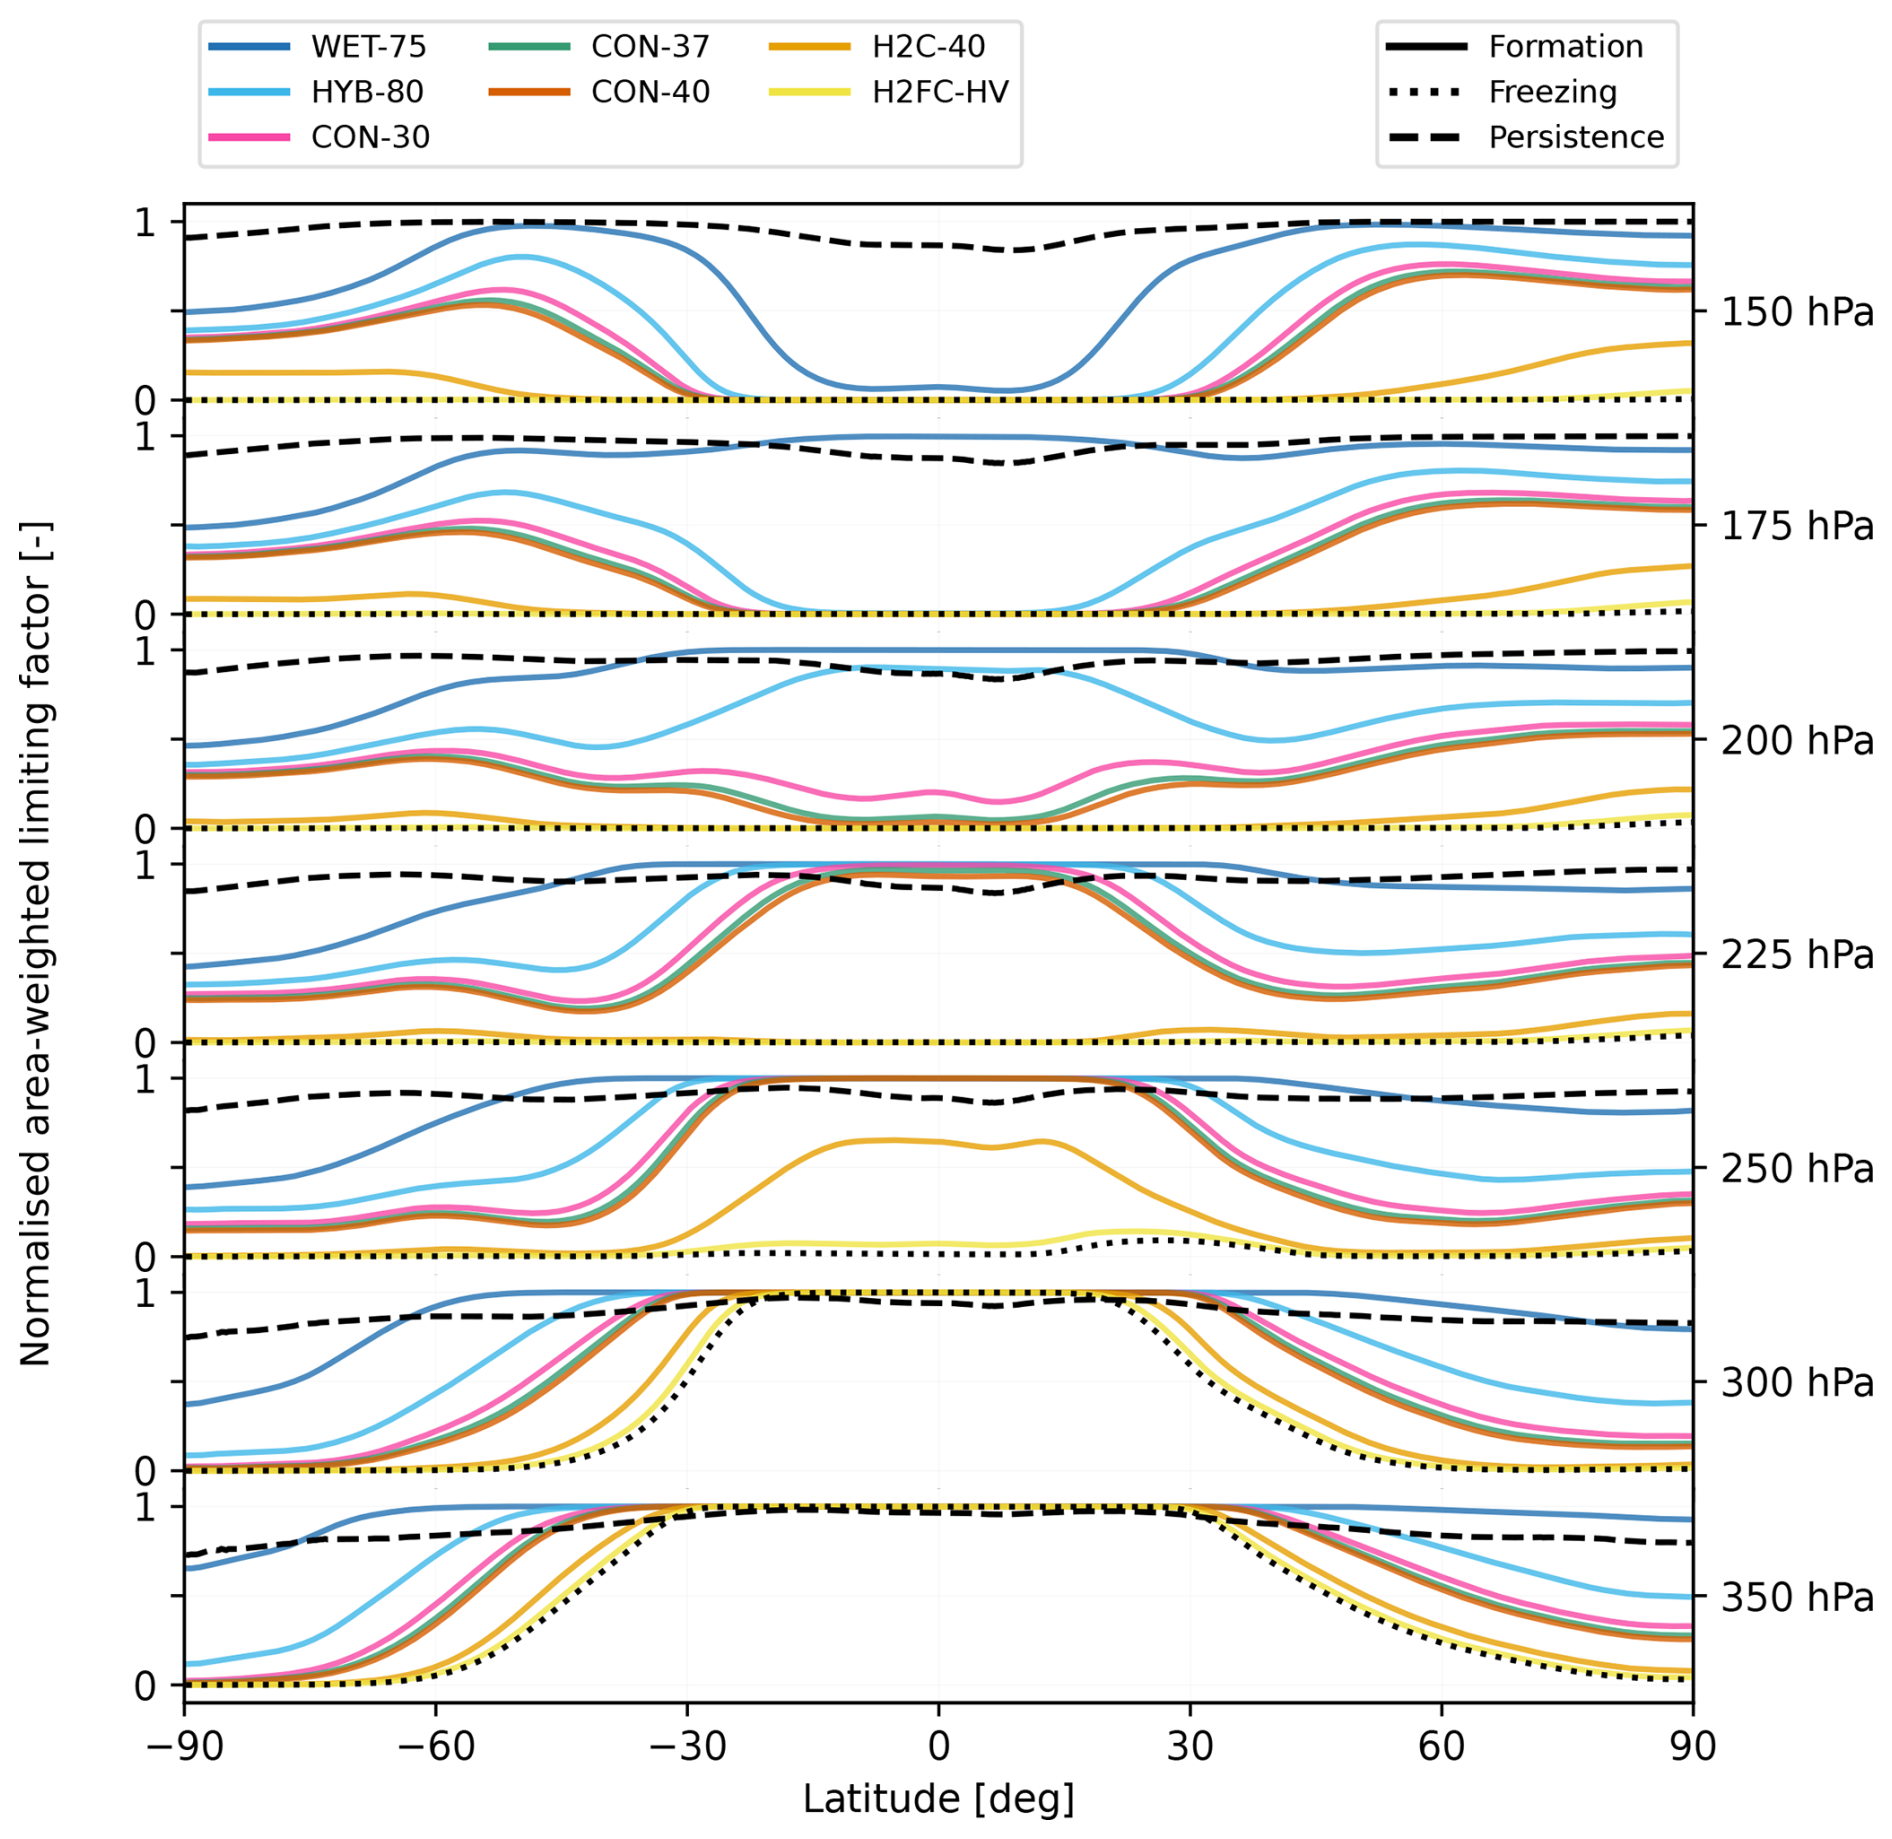
Figure 4Normalised and area-weighted global limiting factors during the 2010s as a function of latitude (x axis) and altitude (secondary y axis). A normalised frequency of 0 would mean that the factor never limits persistent contrail formation; 1 means that it always does. Droplet freezing (dotted lines) and persistence (dashed lines) are independent of aircraft design. Droplet formation is dependent on aircraft design and is shown for the different designs (colours).
Droplet formation is highly dependent on the slope of the mixing line G and varies between 19.2 % (H2FC-HV) and 89.5 % (WET-75). It varies insignificantly with enhanced humidity. Interesting to note is that the results of the H2FC-HV droplet formation limiting factor closely follow those of the aircraft-design-independent droplet freezing limiting factor. This is due to our definition of Tmax at high mixing line slopes (see Sect. 2.1): the higher the aircraft mixing line slope, the steeper the threshold mixing line slope and thus the more closely it resembles the vertical droplet freezing limit at 235.15 K.
3.2 Boundaries of persistent contrail formation regions
Persistence is also found to be more limiting compared to the other factors at the region boundaries. Figure 5 shows the sum over all pressure levels of the horizontal (panel a) and vertical (panel b) boundary lengths/areas of potential persistent contrail formation regions as a function of the limiting factor and aircraft design. We show the total in absolute terms and the individual limiting factors relative to the total for ease of comparison. Because more than one limiting factor may simultaneously be responsible for a boundary, the sum of the individual limiting factors may be larger than 100 %. Since the horizontal and vertical directions cannot be directly compared, we have visually aligned the y axes for the CON-37 total limiting factor such that at least the shapes of the responses can be compared. In both cases, the persistence limiting factor dominates for all aircraft designs and increases with increasing G. This is because as G increases, contrails can form in larger proportions of ice supersaturated regions.
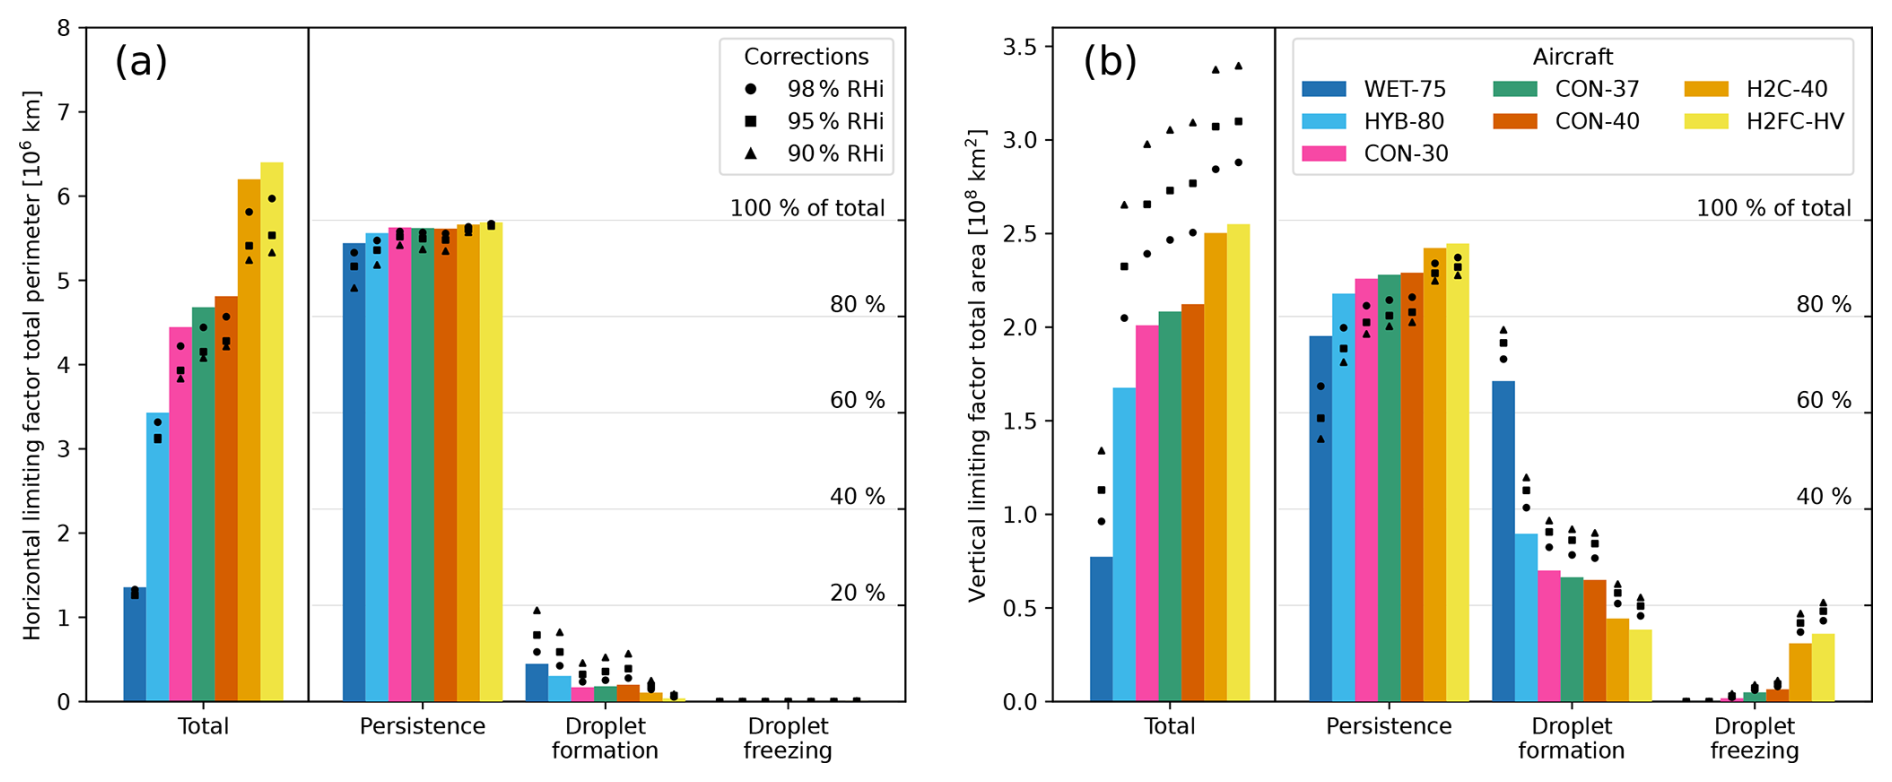
Figure 5Horizontal (a) and vertical (b) total limiting factor results. The “total” limiting factors are shown in absolute values, visually aligned for CON-37 such that the shapes of the responses can be compared; the individual limiting factors are shown relative to the corresponding total value and are given in percentages. Because more than one factor may simultaneously be limiting, the sum of the individual percentages may be larger than 1. The RHi enhancements are shown as scatter points.
Droplet formation can be limiting when the ambient conditions would be sufficient for persistent contrail formation but G is sufficiently low that the exhaust does not become supersaturated with water. The droplet formation limiting factor thus becomes less relevant as G increases. Since G changes with altitude for the same aircraft, droplet formation is responsible for a significantly larger proportion of the persistent contrail formation region boundaries in the vertical direction compared to the horizontal. It is particularly limiting for very low G aircraft such as the WET-75.
In comparison, the droplet freezing limiting factor becomes more important with increasing G. Low mixing line slopes prevent contrails from forming near the freezing boundary. Therefore, droplet freezing is only relevant for aircraft with a high G, in particular hydrogen-powered aircraft. Again due to the changing G with altitude and the larger change in ambient temperature in the vertical compared to the horizontal direction, the droplet freezing limiting factor is also more relevant in the vertical direction.
The RHi correction does not influence which factor is most limiting, with the single exception of WET-75 in the vertical direction. It also does not, on a climatological timescale, influence the areas in which persistent contrails form: as the humidity is enhanced, the probability that a persistent contrail will form increases where the probability was already greater than zero (cf. Fig. S5). However, the persistence results show that many ambient conditions in ERA5 are close to being saturated with ice. Our results thus only add to the consensus that improving ISSR forecasting is vital for estimating persistent contrail formation (Gierens et al., 2020; Hofer et al., 2024b).
In the horizontal direction, enhancing humidity seems to reduce the total edge length, even though the potential persistent contrail formation regions are larger. A significant reduction in edge length can be identified by enhancing humidity by only 2 %, in particular for hydrogen-powered aircraft. This suggests that the potential persistent contrail formation regions, predominantly described by ice supersaturation, grow and coalesce with enhancing humidity, reducing the total length of their boundaries. Further work would be required to prove this theory. In the horizontal direction, the RHi correction has virtually no influence on the droplet freezing but has a major influence on the droplet formation limiting factor. In both cases, however, the perimeter remains 2 orders of magnitude smaller than that of the persistence limiting factor. In the vertical direction, enhancing humidity increases the boundary area significantly for the total. Seemingly, the boundary between different pressure levels is emphasised by the enhanced humidity, notably for the droplet formation limiting factor.
3.3 Spatial variability in persistent contrail formation
The summation of the region edges does not provide any information about where persistent contrails form. Therefore, we now explore the altitude, latitude and aircraft dependence of persistent contrail formation regions. Figure 6a shows that aircraft design is only ever limiting at lower altitudes; except for aircraft with very low mixing line slopes (HYB-80, WET-75), whether a contrail forms and persists for pressure levels < 200 hPa (altitudes above FL385) depends solely on the ambient conditions.
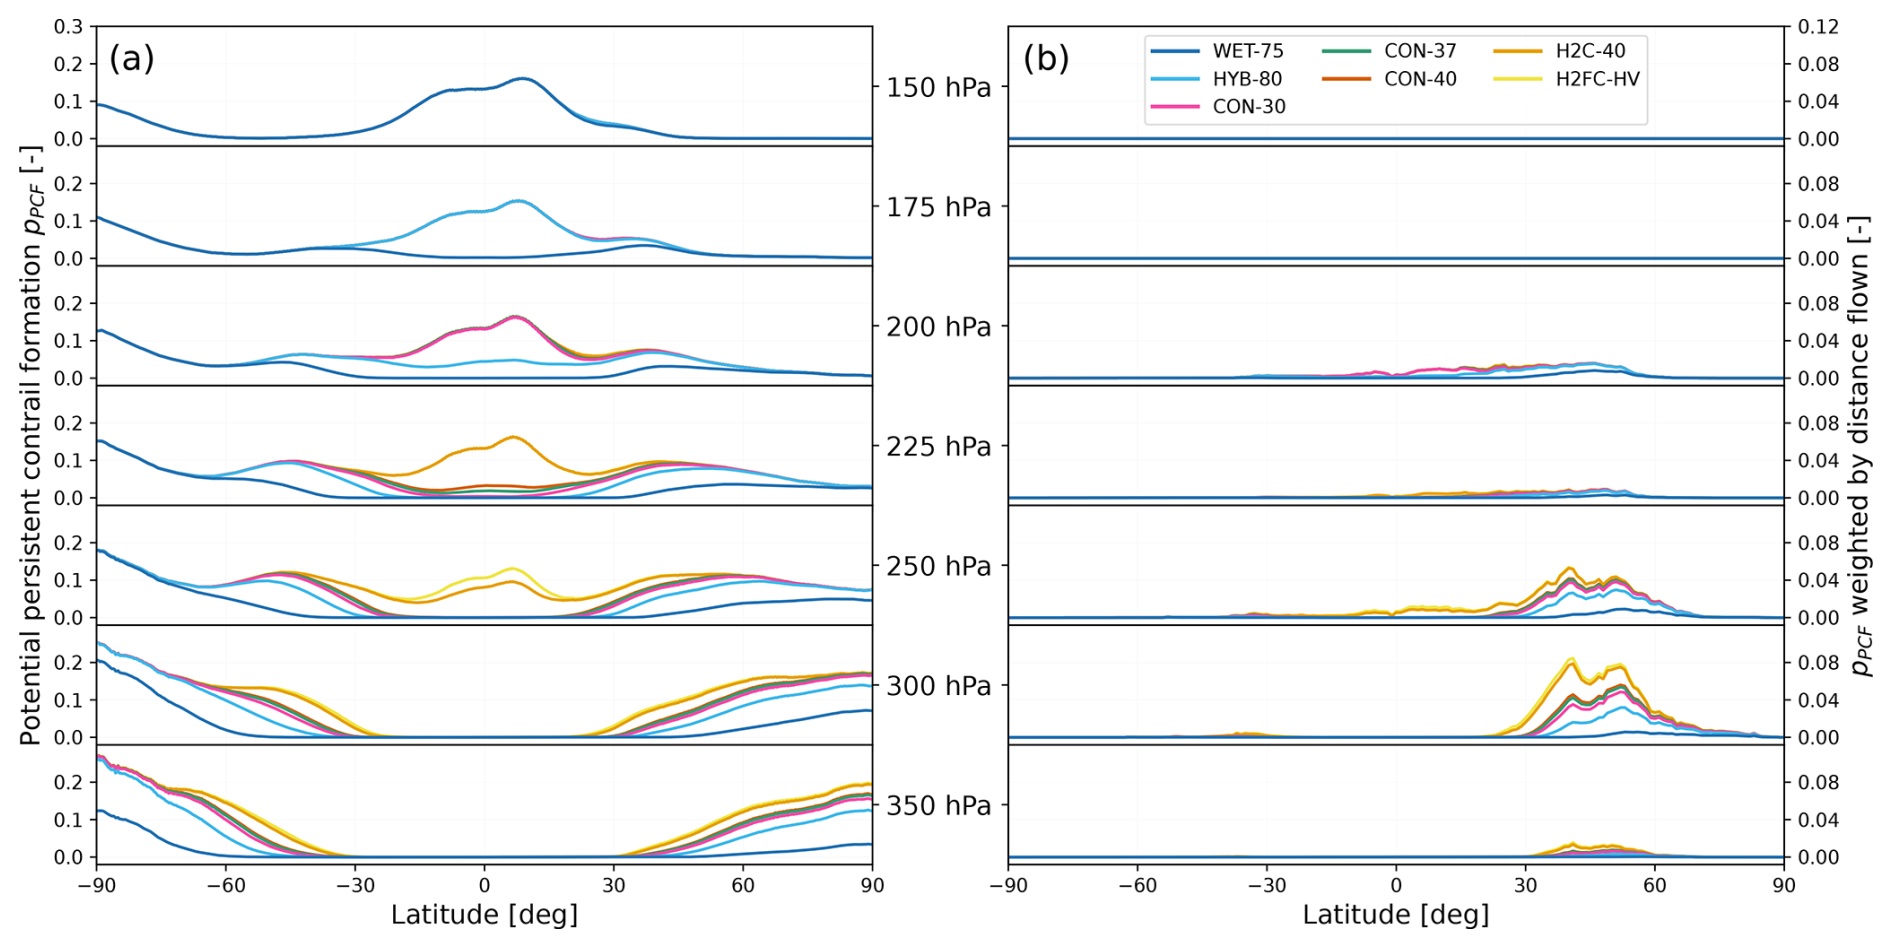
Figure 6Potential persistent contrail formation ppcf (a) as a function of latitude (x axis) and altitude (secondary y axis). We then weight ppcf by the distance flown in the DEPA 2050 air traffic scenario in the year 2050 (b) to identify important areas for persistent contrail formation.
It has been widely assumed that the introduction of hydrogen-powered aircraft would result in a significant increase in the formation of persistent contrails. Our results show that hydrogen-powered aircraft could indeed form many more persistent contrails than existing conventional aircraft do. Comparing H2C-40 and H2FC-HV with CON-37, our results match those of Kaufmann et al. (2024, the right side of their Fig. 5): at low altitudes (350 to 300 hPa), a large difference in persistent contrail formation (Kaufmann et al., 2024, call this “potential contrail cirrus cover”) can be seen between 30 to 60° S and 30 to 60° N, incidentally coinciding with significant air traffic over Europe and the USA. In total, across all latitudes and altitudes considered, hydrogen-powered aircraft have the potential to produce between 18.3 % (H2C) and 20.8 % (H2FC) more persistent contrails than conventional aircraft do (CON-37; see Table S1).
Since these results do not consider where aircraft actually fly, we have also used the DEPA 2050 air traffic scenario to weight the results, as shown in Fig. 6b. DEPA 2050 is only available with a 1° latitude resolution, so we conservatively regrid the limiting factor results to match this resolution (conserving the total sum of the distance flown). The tropical increase in persistent contrail formation at 250 to 225 hPa is now less pronounced because there are few aircraft flying in this region. Instead, of particular importance are the northern extratropics between 300 and 250 hPa (FL300 to FL340), which are the lower cruising altitudes of typical airliners. In total, our simple distance-weighted proxy shows a globally averaged increase of 46.5 % to 54.7 % for hydrogen-powered aircraft (H2C and H2FC respectively) compared to conventional aircraft (CON-37; see Table S1). This indicates that replacing existing aircraft along existing and expected flight routes with hydrogen-powered designs would significantly increase persistent contrail formation on a climatological timescale whilst ignoring any real-time avoidance strategies.
Significant reductions in persistent contrail formation could be gained by reducing the water vapour emission index: globally, WET-50 achieves a 26.0 % reduction and WET-75 a 56.6 % reduction. Along the DEPA 2050 flight routes, this further improves to 51.7 % and 85.1 % respectively. There is also clearly potential for the targeted introduction of aircraft with very low mixing line slopes, in particular at higher altitudes (225 to 200 hPa; FL360 to FL385) in the tropics. Here, the WET aircraft considered would produce few to no persistent contrails at all, with unweighted reductions of 83.2 %–91.4 % (WET-50) and 99.5 %–99.96 % (WET-75).
For all aircraft designs, persistent contrail formation increases with altitude in the tropics and decreases in the extratropics, in line with previous studies (e.g. Matthes et al., 2021). Among others, Barton et al. (2023) suggest designing hydrogen-powered aircraft capable of flying at higher altitudes in the extratropics – around 14 km (140 hPa) – to avoid forming persistent contrails. We find that very few persistent contrails are formed at 150 hPa north of 30° N and between 30° S and 60° S (very few flight tracks extend south of 60° S). Since this is due to a lack of ice supersaturation in these regions (see Fig. 4), this concept does not need to be limited to hydrogen-powered aircraft. However, these altitudes are above the local tropopause, and releasing significant amounts of water vapour and NOx into the stratosphere can result in a significant increase in the climate impact (Grewe et al., 2010; Matthes et al., 2021). We therefore stress that these results should not be used in isolation to determine a possible optimum cruise altitude. Rather, the full climate impact of a given design must be considered.
3.4 Climatological potential of persistent contrail formation
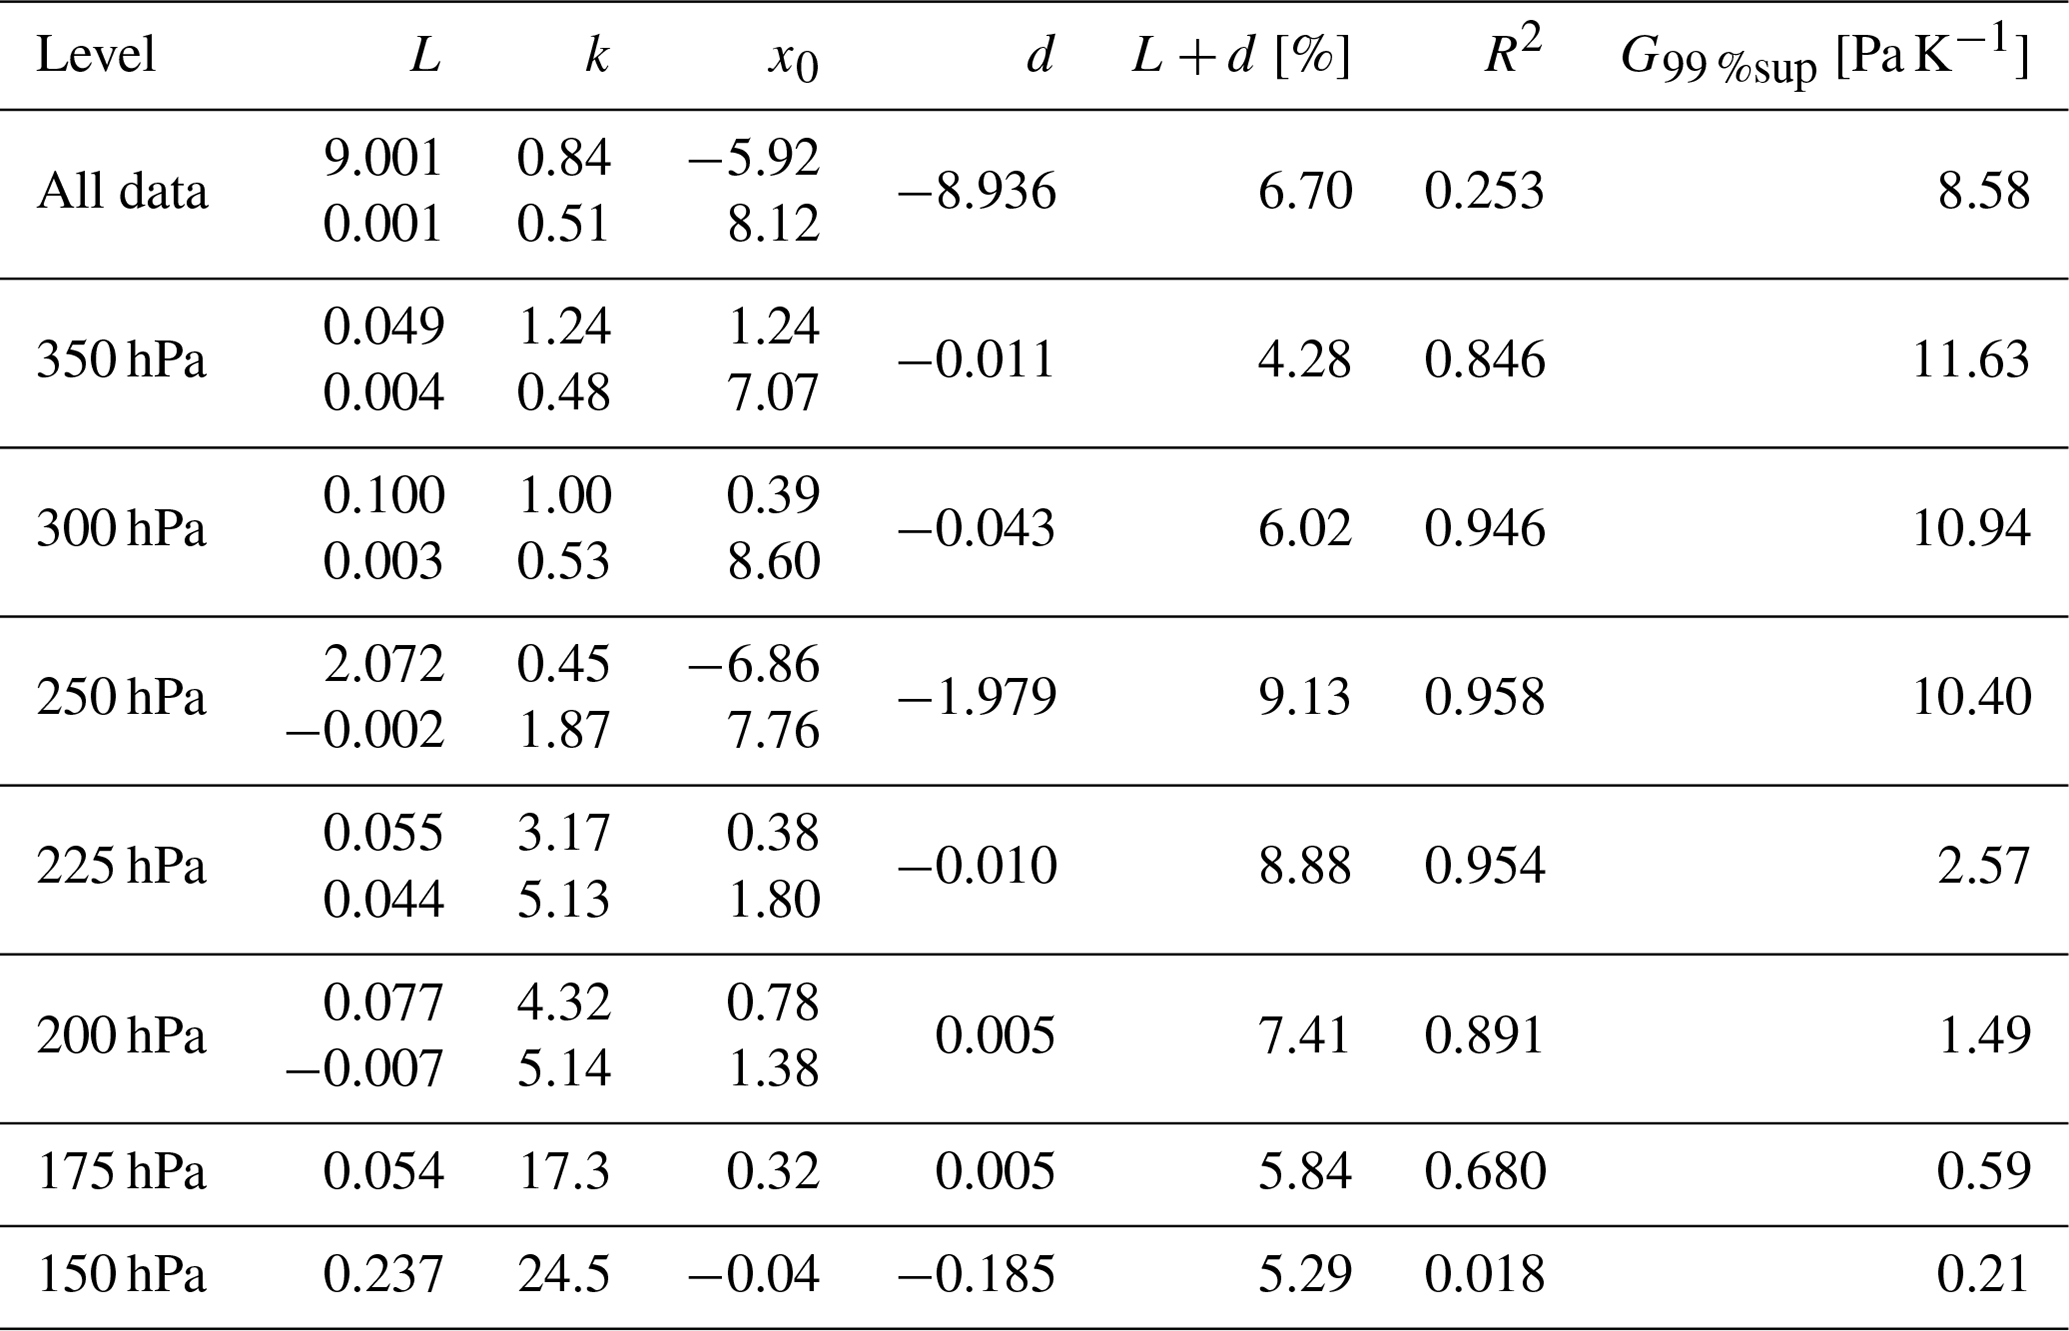
We now aim to determine whether there is a climatological relationship between the mixing line slope G and the potential persistent contrail formation ppcf. Figure 7 shows ppcf as a function of G for each pressure level and for all data together, without RHi enhancement. The results for all RHi enhancements are shown in Fig. S6. The supremum value for each pressure level and time can be determined by ignoring the droplet formation limiting factor since it resembles the droplet freezing limiting factor as G→∞. For many pressure levels, 99 % of that supremum value is achieved at much lower mixing line slopes (G99 %sup in Table 2 and black circular markers in Fig. 7). Generally, the higher the altitude, the earlier the results become asymptotic and the less influence the aircraft design has. This also matches the results found in Fig. 6.
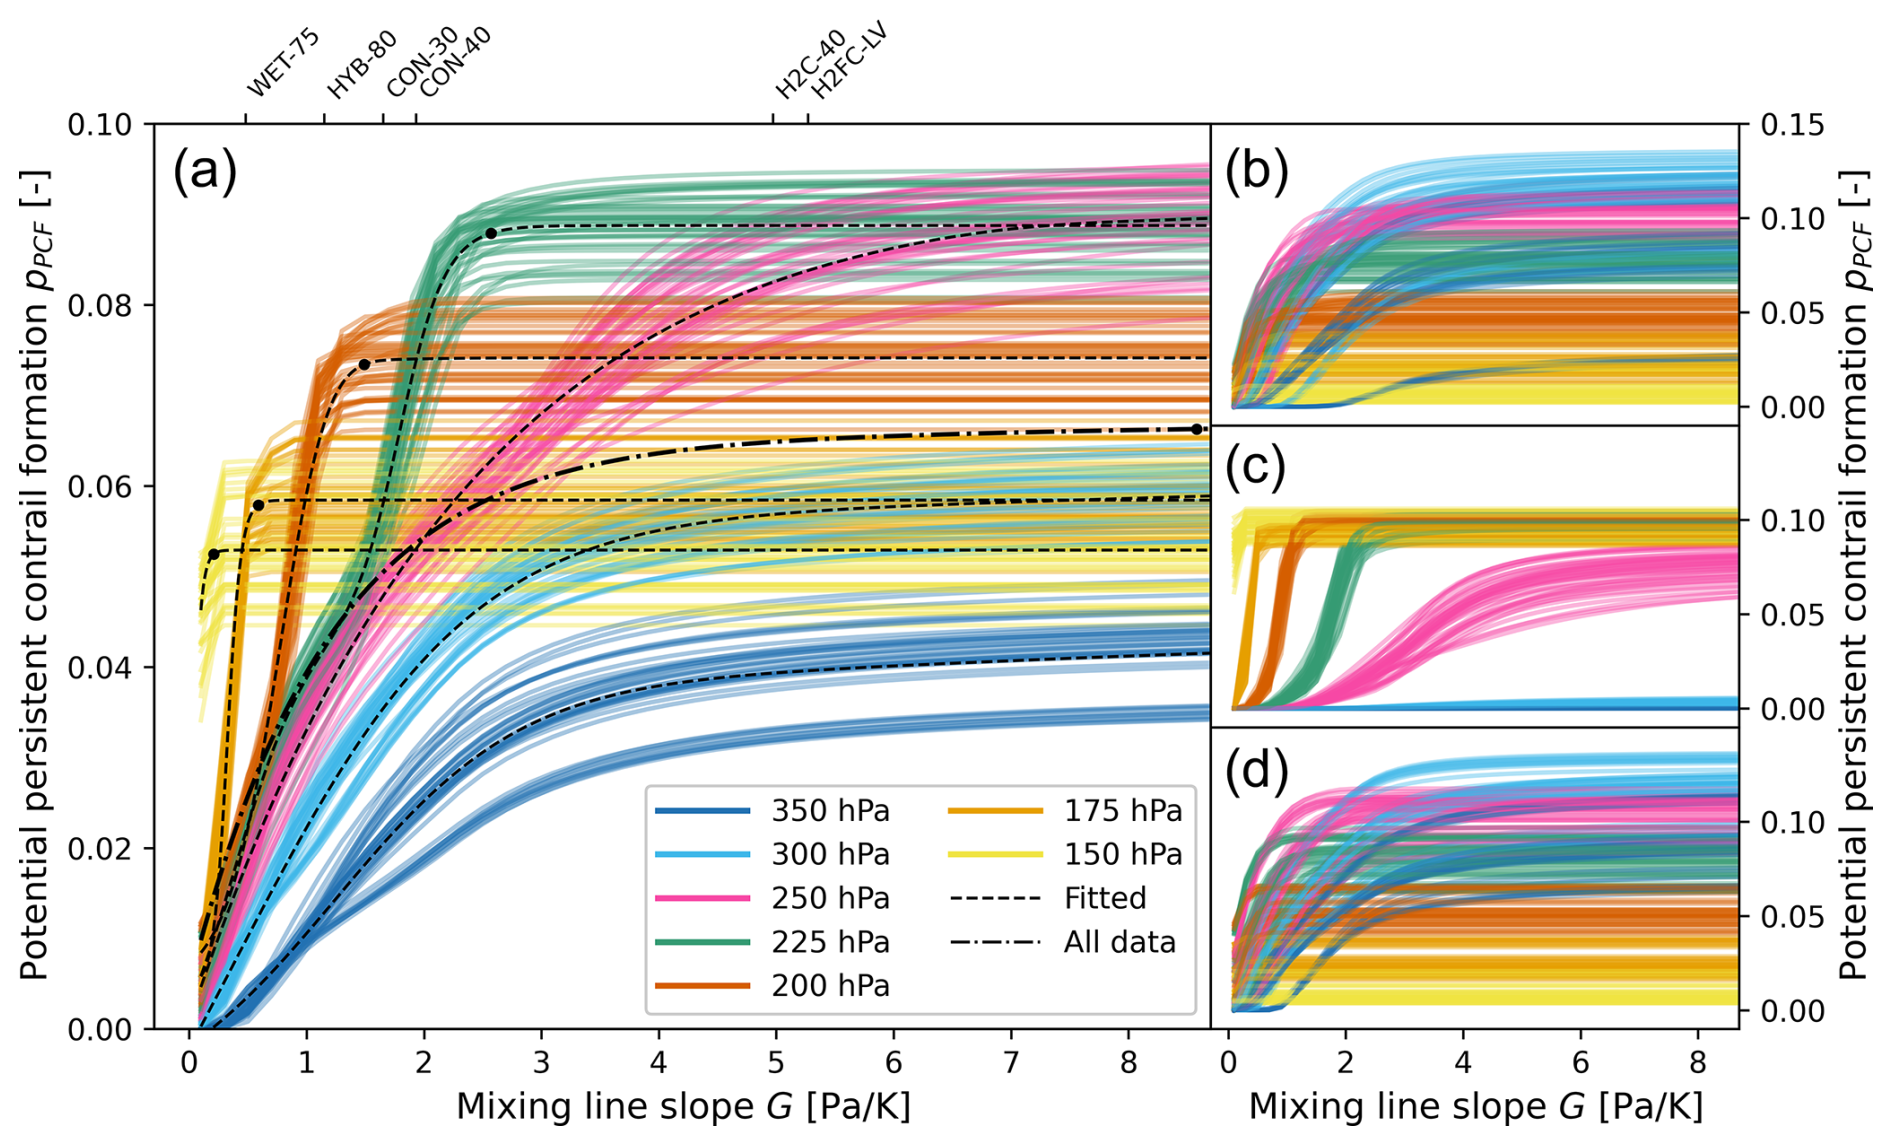
Figure 7Potential persistent contrail formation ppcf as a function of the mixing line slope G on a climatological timescale for pressure levels 350 to 150 hPa (a) at a global scale and for (b) the northern extratropics, (c) the tropics and (d) the southern extratropics. Each coloured line corresponds to a single season within the 2010s. The dashed lines are the fitted responses using the modified logistic function in Eq. (6) and parameters as defined in Table 2 for each pressure level individually (fitted) and for all pressure levels together (all data). The markers show at which value of G the corresponding ppcf comes within 1 % of the supremum. The mixing line slopes of the different aircraft designs are shown for the 250 hPa pressure level for reference.
For very low G, persistent contrails form only at very high altitudes. As G increases, more persistent contrails are formed at lower altitudes (higher pressure levels). The pressure levels with the highest ppcf are likely between 250 and 225 hPa (FL340–FL360) at G>7 Pa K−1. For these two pressure levels in particular, the results seem to be the addition of two different responses. We find that the initial slope is the extratropical response (both northern and southern), and the second slope is the tropical response (the right side of Fig. 7). Given the higher tropopause and ambient temperature in the tropics, persistent contrails generally form at higher values of G compared to the extratropics.
We fit the responses using the sum of two logistic functions, one representing the response from the tropics and the other from the extratropics. A conventional logistic function includes the supremum L, the growth rate k and the midpoint of the growth x0, with limits 0 for and L for . We have allowed the extratropical logistic function to be shifted vertically by d for a better fit, noting that the fitting function is only valid for G>0 Pa K−1. To find the optimal parameters, we consider the tropical logistic function to be an addition to the extratropical function. Therefore, we split the data into two at a certain value of G: we use the values of G up until this split to create the extratropical response and the values after the split to create the tropical response. We subsequently use a minimisation function to determine the best value for the split.
The result is that the value of the maximum for the full equation can be read as . For the 175 and 150 hPa pressure levels, we find that there is no need to use a second logistic function because persistent contrails do not form at these pressures in the extratropics. For these pressure levels, therefore, the value of the asymptote is simply L+d.
The parameters found by the minimisation function are shown in Table 2. We generally find a good fit and a high coefficient of determination (R2), except for 150 hPa and all level data together. At 150 hPa, the seasonal responses reach an asymptote at a very low G such that the response is essentially horizontal and thus by definition cannot have a good R2 value. By considering all level data together, the differentiation between the extratropical and tropical responses is essentially no longer visible. The R2 value is thus not high, clearly showing that including level information is beneficial in determining ppcf. We note that the all data response in Fig. 7 has a similar shape to the gentle sloping curve in Fig. 2 of Hofer et al. (2024a), who consider persistent contrail formation from potential SAF aircraft using IAGOS/MOZAIC data, irrespective of the altitude.
Table 2Optimal parameters for potential persistent contrail formation ppcf as a function of the mixing line slope G (Eq. 6) on a climatological timescale for 350 to 150 hPa pressure levels and for all pressure levels together (all data). The supremum value of the function L+d is shown as a percentage. For each pressure level, the top values of L, k and x0 are for the first logistic function (extratropical response) and the bottom values for the second logistic function (tropical response). The 175 and 150 hPa pressure levels are primarily driven by the tropical response (cf. Fig. 7) and thus did not benefit from the second logistic function. The variable G99 %sup corresponds to the lowest value of G for which the corresponding ppcf is within 1 % of the supremum L+d.
As Fig. 3 demonstrated, ppcf increases with enhanced relative humidity because a larger proportion of ambient conditions, in particular closer to the freezing temperature limit, are conducive to persistent contrail formation. The same analysis as above is conducted for all RHi enhancements and is shown in Fig. S6. The fitted results are stretched to higher ppcf but maintain the same general shape, including the marked difference in the extratropical and tropical responses. This again suggests that on a climatological timescale, as relative humidity is enhanced, the probability that a persistent contrail forms increases where the probability was already greater than zero (cf. Fig. S5).
3.5 Competition between limiting factors
We find that for all aircraft designs, persistence is the most limiting factor and most responsible for the borders of persistent contrail formation regions (Figs. 3 and 5 respectively). At first glance, this seems counter-intuitive: persistence is independent of aircraft design, but the size of the potential persistent contrail formation regions do depend on the aircraft design and vary significantly. In this section, we discuss the interplay and competition between the different limiting factors.
Consider the analysis of persistent contrail formation regions in the horizontal direction for H2FC-HV, a high-G aircraft. Since most region boundaries are defined by persistence and we do not change the operating conditions of the aircraft between grid cells, the difference between two neighbouring cells must therefore mostly be a slight increase in relative humidity – a vertical shift in Fig. 1. If we lower G, both neighbouring cells could then be to the right of the limiting slope, preventing a persistent contrail from forming in the cell that is supersaturated with ice and thus also preventing the border. In this case, our analysis does not recognise formation being limiting because the formation boundary was not crossed. If we now consider a horizontally contiguous ice supersaturated region and an arbitrary aircraft, this implies that this aircraft will or will not form a contrail, independently of where it crosses the region boundary. Furthermore, at high values of G, the limiting slope acts much like a vertical boundary. Indeed, the droplet freezing and H2FC-HV droplet formation limiting factors show very similar results (cf. Figs. 3 and 4).
How should the competition between the persistence and droplet formation limiting factors be viewed? The persistence and droplet freezing limiting factors together create an upper bound for the potential persistent contrail formation region size. The droplet formation limiting factor then controls the proportion of this region that is available for persistent contrails to form. Figure 7 shows that the level of control varies with latitude and altitude: at high altitudes, aircraft design has barely any influence.
3.6 Uncertainties and limitations
As with all climatological analyses and models, there are a number of limitations on the use of our results. For example, consider the latitude-dependent results in Fig. 7. In theory, more information could be gained by including two distinct extratropical and tropical responses. No persistent contrails are produced in the tropics at 350 hPa, and essentially none are produced at 300 hPa, but if the globally averaged fits were to be used, persistent contrails would be assumed to form in these regions. However, the results in the individual latitude bands also have a higher seasonal dependence (notably in the tropics at 250 hPa). There is thus a trade-off in the level of detail that can be included if persistent contrail formation is to be climatologically modelled. Clearly, it would be inappropriate to analyse the climate impact of an aviation scenario that only considers aircraft flying in one latitude region using the globally fitted responses. Similarly, it would also be inappropriate to use the fits to analyse aircraft flying only in a single season. Instead, our results are useful for global aviation or aircraft-specific scenarios with a time step of at least 1 year.
It is also important to underline the difference between persistent contrail formation and the resulting contrail cirrus coverage and climate impact. The results presented in this study are valid only for static persistent contrail formation; i.e. we do not consider contrail spreading or temporal changes in the local ambient conditions. We assume a contrail to be persistent if the ambient conditions are supersaturated with ice at the time of formation; however, since the water vapour field is highly heterogeneous and can vary rapidly with time, the contrail may not actually persist. We are not able to consider dynamic conditions such as the subsidence of the local air mass that may lead to contrail sublimation. It is also possible that persistent contrails formed in one grid cell spread to neighbouring cells due to mixing. Particularly interesting are neighbouring cells that are limited by the droplet formation limiting factor, i.e. are themselves not conducive to persistent contrail formation, but are supersaturated with ice and are below the homogeneous freezing temperature. In a previous study, these regions were defined as “reservoirs” for persistent contrails (Wolf et al., 2023). As contrails spread vertically and/or horizontally over time, they may persist in grid cells that our analysis identified as limited by droplet formation. Such spreading is certainly important for the calculation of contrail cirrus coverage, but since it is a secondary, dynamic effect, we have not included it in this study on persistent contrail formation.
Care should also be taken when using our results to inform aircraft design or flight trajectories. For example, we show that replacing kerosene with hydrogen along assumed future flight trajectories could result in around 50 % more persistent contrails (cf. Table S1) on a climatological timescale without considering contrail avoidance strategies. This does not, however, translate to a 50 % larger radiative forcing or temperature change due to differing contrail properties. For example, Rap et al. (2023) find a 70 % increase in contrail coverage from hydrogen-powered aircraft compared to conventional aircraft but also find a 25 % reduction in contrail cirrus effective radiative forcing (ERF). Similar results were found by Grewe et al. (2017a). Persistent contrail formation should thus not be used as a direct proxy for climate impact, and more research is required into contrail properties from novel aviation fuels and propulsion technologies. We also reiterate that contrails are only part of the equation and that the full climate impact, including other non-CO2 effects, should be used to inform aircraft design or flight trajectories.
The globally averaged climatological results presented in this study are not expected to change significantly due to a changing climate. Our results show that persistence is the most limiting factor for all aircraft designs. Therefore, the probability of persistent contrail formation should vary in tandem with the frequency and location of ISSRs. Climate models predict a generally warmer upper troposphere and generally cooler lower stratosphere, leading to a decrease in relative humidity in the tropics and an increase towards the poles (Irvine and Shine, 2015; Benetatos et al., 2024). This is reflected in the results of both Chen and Gettelman (2016) and Bock and Burkhardt (2019), who find a decrease in the probability of persistent contrail formation (here ppcf) in the tropics and an increase in the northern extratropics for a future atmosphere. Chen and Gettelman (2016) find a net reduction in contrail cirrus radiative forcing, whereas Bock and Burkhardt (2019) expect the radiative forcing to approximately even out.
If the global ppcf remains approximately the same, then the limiting factor results (Fig. 5) and the competition between the limiting factors should also remain unchanged. However, the regional differences in ISSR location may modify the shape of the responses in Fig. 7, lowering the maximum ppcf values in the tropics and raising them in the extratropics. For the 250 to 200 hPa pressure levels, which are driven by both a tropical and an extratropical response, the global result will likely have a steeper initial slope and a shallower secondary slope, shifted slightly to higher mixing line slopes. Nevertheless, the maximum values and the general shape of the responses are not expected to change significantly.
Finally, we do not expect the choice of global aviation scenario to have significantly affected the weighted results. In this study, we used the DEPA 2050 progressive scenario for the year 2050 since it is representative of a future multi-fuel global fleet and since there are no restrictions on its publication. Other global scenarios may produce slightly different weighted results, but the focus should nevertheless remain on the northern extratropics at 300–250 hPa.
Persistent contrail formation is limited by three main factors: droplet formation, droplet freezing and persistence. Our investigation using ERA5 data in the 2010s finds persistence (ice supersaturation) to be the most limiting factor. Of the grid cells considered, 92.3 % are not supersaturated with ice and thus are not conducive to persistent contrail formation. Droplet freezing is found to be limiting 18.2 % of the time and droplet formation between 19.2 % (high-voltage hydrogen fuel cell) and 89.5 % (water-enhanced turbofan with 75 % water vapour reduction) of the time. The boundaries of persistent contrail formation regions are also generally defined by the persistence limiting factor, regardless of aircraft design. In other words, should an aircraft – without changing its operating conditions – start producing a persistent contrail, generally it is because the air mass it has entered is supersaturated with ice. Our results thus underscore the importance of accurately estimating ice supersaturated regions (Gierens et al., 2020; Hofer et al., 2024b).
We demonstrate the feasibility of developing high-quality climatological relationships between the mixing line slope G and the potential persistent contrail formation ppcf for individual pressure levels. We create these relationships using the sum of two modified logistic functions, one representing the response from the tropics and the other from the extratropics. The combination of the persistence and droplet freezing limiting factors creates an upper bound for the size of persistent contrail formation regions, which varies by latitude, altitude and season. We find that due to the distribution of ice supersaturation with altitude, aircraft design becomes less limiting with increasing altitude (decreasing pressure level). For very low G, persistent contrails form only at very high altitudes. As G increases, more persistent contrails are also formed at lower altitudes. These climatological relationships are the first step in the development of a computationally inexpensive method to analyse the contrail climate impact of novel aviation fuels and propulsion technologies on a climatological timescale.
Novel aviation fuels and propulsion technologies will have a major impact on persistent contrail formation. Across all flight levels considered, improving overall propulsion efficiency from 0.30 to 0.40 increases persistent contrail formation by 13.6 % along representative flight trajectories (from 0.37 to 0.40, a 4.0 % increase). A significant reduction in persistent contrail formation could be achieved using a water vapour emission reduction system such as the water-enhanced turbofan concept – up to 85.1 % – by reducing the water vapour emission index by 75 %, compared to a reference conventional aircraft with an overall propulsion system efficiency of 0.37. On the other hand, compared to the same reference aircraft, hydrogen combustion or fuel cell aircraft could result in a 46.5 % or 54.7 % increase respectively. It is, however, important to keep in mind which aircraft is taken as a reference – an overall propulsion system efficiency of 0.37 is representative of the current state of the art but is likely higher than the global average. Compared to the global average, the increase may be even higher.
Persistent contrail formation, as analysed here, is not synonymous with the contrail climate impact. Contrails produced by aircraft using alternative fuels such as hydrogen are expected to have very different optical and radiative properties. Although such aircraft may produce significantly more persistent contrails, their overall contrail climate impact may in fact be lower than that of conventional aircraft (Gierens, 2021; Rap et al., 2023; Bier et al., 2024). More research is required to better understand this effect. Nevertheless, our results point to a clear potential for the targeted introduction of aircraft with low mixing line slopes to significantly reduce persistent contrail formation.
The Python code and the processed and compiled data used to perform all analyses are provided in the 4TU.ResearchData repository at https://doi.org/10.4121/cdb4e3bb-d6f4-4422-a715-b6187098a314 (Megill and Grewe, 2025). The DEPA air traffic scenarios for 2020 to 2050 are available from Zenodo at https://doi.org/10.5281/zenodo.11442323 (German Aerospace Center, 2024); ERA5 data are available from ECMWF at https://doi.org/10.24381/cds.bd0915c6 (Hersbach et al., 2023).
The supplement related to this article is available online at https://doi.org/10.5194/acp-25-4131-2025-supplement.
Conceptualisation – LM and VG. Methodology, investigation and visualisation – LM. Supervision – VG. Original draft – LM. Review and editing – LM and VG. Both authors read and approved the final paper.
The contact author has declared that neither of the authors has any competing interests.
The funding bodies providing support played no role in the study design, data collection, analysis and interpretation of data, or writing of the paper. Publisher’s note: Copernicus Publications remains neutral with regard to jurisdictional claims made in the text, published maps, institutional affiliations, or any other geographical representation in this paper. While Copernicus Publications makes every effort to include appropriate place names, the final responsibility lies with the authors.
The authors thank Klaus Gierens for his suggestions and advice, Sina Hofer for providing data comparing ERA5 with MOZAIC/IAGOS, and Luca Bugliaro for providing an internal review. The authors are thankful for the support of the German Climate Computing Centre (DKRZ) under project Ökoluft (bd1062).
This research has been supported by the Bundesministerium für Wirtschaft und Klimaschutz under the German Aviation Research Program LuFo VI-2, projects DINA2030+ and 328H2-FC.
The article processing charges for this open-access publication were covered by the German Aerospace Center (DLR).
This paper was edited by Fangqun Yu and reviewed by three anonymous referees.
Agarwal, A., Meijer, V. R., Eastham, S. D., Speth, R. L., and Barrett, S. R. H.: Reanalysis-Driven Simulations May Overestimate Persistent Contrail Formation by 100 %–250 %, Environ. Res. Lett., 17, 014045, https://doi.org/10.1088/1748-9326/ac38d9, 2022. a
Appleman, H.: The Formation of Exhaust Condensation Trails by Jet Aircraft, B. Am. Meteorol. Soc., 34, 14–20, https://doi.org/10.1175/1520-0477-34.1.14, 1953. a
Barton, D. I., Hall, C. A., and Oldfield, M. K.: Design of a Hydrogen Aircraft for Zero Persistent Contrails, Aerospace, 10, 688, https://doi.org/10.3390/aerospace10080688, 2023. a
Benetatos, C., Eleftheratos, K., Gierens, K., and Zerefos, C.: A Statistically Significant Increase in Ice Supersaturation in the Atmosphere in the Past 40 Years, Scientific Reports, 14, 24760, https://doi.org/10.1038/s41598-024-75756-9, 2024. a
Bier, A. and Burkhardt, U.: Variability in Contrail Ice Nucleation and Its Dependence on Soot Number Emissions, J. Geophys. Res.-Atmos., 124, 3384–3400, https://doi.org/10.1029/2018JD029155, 2019. a
Bier, A., Unterstrasser, S., and Vancassel, X.: Box model trajectory studies of contrail formation using a particle-based cloud microphysics scheme, Atmos. Chem. Phys., 22, 823–845, https://doi.org/10.5194/acp-22-823-2022, 2022. a, b
Bier, A., Unterstrasser, S., Zink, J., Hillenbrand, D., Jurkat-Witschas, T., and Lottermoser, A.: Contrail formation on ambient aerosol particles for aircraft with hydrogen combustion: a box model trajectory study, Atmos. Chem. Phys., 24, 2319–2344, https://doi.org/10.5194/acp-24-2319-2024, 2024. a, b, c, d
Bock, L. and Burkhardt, U.: Contrail cirrus radiative forcing for future air traffic, Atmos. Chem. Phys., 19, 8163–8174, https://doi.org/10.5194/acp-19-8163-2019, 2019. a, b
Bräuer, T., Voigt, C., Sauer, D., Kaufmann, S., Hahn, V., Scheibe, M., Schlager, H., Huber, F., Le Clercq, P., Moore, R. H., and Anderson, B. E.: Reduced ice number concentrations in contrails from low-aromatic biofuel blends, Atmos. Chem. Phys., 21, 16817–16826, https://doi.org/10.5194/acp-21-16817-2021, 2021. a
Brock, C. A., Froyd, K. D., Dollner, M., Williamson, C. J., Schill, G., Murphy, D. M., Wagner, N. J., Kupc, A., Jimenez, J. L., Campuzano-Jost, P., Nault, B. A., Schroder, J. C., Day, D. A., Price, D. J., Weinzierl, B., Schwarz, J. P., Katich, J. M., Wang, S., Zeng, L., Weber, R., Dibb, J., Scheuer, E., Diskin, G. S., DiGangi, J. P., Bui, T., Dean-Day, J. M., Thompson, C. R., Peischl, J., Ryerson, T. B., Bourgeois, I., Daube, B. C., Commane, R., and Wofsy, S. C.: Ambient aerosol properties in the remote atmosphere from global-scale in situ measurements, Atmos. Chem. Phys., 21, 15023–15063, https://doi.org/10.5194/acp-21-15023-2021, 2021. a
Burkhardt, U. and Kärcher, B.: Global Radiative Forcing from Contrail Cirrus, Nat. Clim. Change, 1, 54–58, https://doi.org/10.1038/nclimate1068, 2011. a
Burkhardt, U., Bock, L., and Bier, A.: Mitigating the Contrail Cirrus Climate Impact by Reducing Aircraft Soot Number Emissions, npj Climate and Atmospheric Science, 1, 37, https://doi.org/10.1038/s41612-018-0046-4, 2018. a
Caiazzo, F., Agarwal, A., Speth, R. L., and Barrett, S. R. H.: Impact of Biofuels on Contrail Warming, Environ. Res. Lett., 12, 114013, https://doi.org/10.1088/1748-9326/aa893b, 2017. a
Chen, C.-C. and Gettelman, A.: Simulated 2050 aviation radiative forcing from contrails and aerosols, Atmos. Chem. Phys., 16, 7317–7333, https://doi.org/10.5194/acp-16-7317-2016, 2016. a, b
Filippone, A.: Assessment of Aircraft Contrail Avoidance Strategies, J. Aircraft, 52, 872–877, https://doi.org/10.2514/1.C033176, 2015. a
German Aerospace Center: DEPA 2050 aviation emission inventories, 1.0.0, Zenodo [data set], https://doi.org/10.5281/zenodo.11442323, 2024. a
Gierens, K.: Theory of Contrail Formation for Fuel Cells, Aerospace, 8, 164, https://doi.org/10.3390/aerospace8060164, 2021. a, b, c, d, e, f, g
Gierens, K., Lim, L., and Eleftheratos, K.: A Review of Various Strategies for Contrail Avoidance, The Open Atmospheric Science Journal, 2, 1–7, https://doi.org/10.2174/1874282300802010001, 2008. a
Gierens, K., Matthes, S., Rohs, S., and Susanne Rohs: How Well Can Persistent Contrails Be Predicted, Aerospace, 7, 169, https://doi.org/10.3390/aerospace7120169, 2020. a, b, c, d
Grewe, V., Plohr, M., Cerino, G., Muzio, M. D., Deremaux, Y., Galerneau, M., Martin, P. d. S., Chaika, T., Hasselrot, A., Tengzelius, U., and Korovkin, V. D.: Estimates of the Climate Impact of Future Small-Scale Supersonic Transport Aircraft – Results from the HISAC EU-project, Aeronaut. J., 114, 199–206, https://doi.org/10.1017/S000192400000364X, 2010. a
Grewe, V., Champougny, T., Matthes, S., Frömming, C., Brinkop, S., Søvde, O. A., Irvine, E. A., and Halscheidt, L.: Reduction of the Air Traffic's Contribution to Climate Change: A REACT4C Case Study, Atmos. Environ., 94, 616–625, https://doi.org/10.1016/j.atmosenv.2014.05.059, 2014. a
Grewe, V., Bock, L., Burkhardt, U., Dahlmann, K., Gierens, K., Hüttenhofer, L., Unterstrasser, S., Rao, A. G., Bhat, A., Yin, F., Reichel, T. G., Paschereit, O., and Levy, Y.: Assessing the Climate Impact of the AHEAD Multi-Fuel Blended Wing Body, Meteorol. Z., 26, 711–725, https://doi.org/10.1127/metz/2016/0758, 2017a. a, b
Grewe, V., Dahlmann, K., Flink, J., Frömming, C., Ghosh, R., Gierens, K., Heller, R., Hendricks, J., Jöckel, P., Kaufmann, S., Kölker, K., Linke, F., Luchkova, T., Lührs, B., Van Manen, J., Matthes, S., Minikin, A., Niklaß, M., Plohr, M., Righi, M., Rosanka, S., Schmitt, A., Schumann, U., Terekhov, I., Unterstrasser, S., Vázquez-Navarro, M., Voigt, C., Wicke, K., Yamashita, H., Zahn, A., and Ziereis, H.: Mitigating the Climate Impact from Aviation: Achievements and Results of the DLR WeCare Project, Aerospace, 4, 34, https://doi.org/10.3390/aerospace4030034, 2017b. a
Grewe, V., Matthes, S., Frömming, C., Brinkop, S., Jöckel, P., Gierens, K., Champougny, T., Fuglestvedt, J., Haslerud, A., Irvine, E., and Shine, K.: Feasibility of Climate-Optimized Air Traffic Routing for Trans-Atlantic Flights, Environ. Res. Lett., 12, 034003, https://doi.org/10.1088/1748-9326/aa5ba0, 2017c. a
Haywood, J. M., Allan, R. P., Bornemann, J., Forster, P. M., Francis, P. N., Milton, S., Rädel, G., Rap, A., Shine, K. P., and Thorpe, R.: A Case Study of the Radiative Forcing of Persistent Contrails Evolving into Contrail-induced Cirrus, J. Geophys. Res.-Atmos., 114, 2009JD012 650, https://doi.org/10.1029/2009JD012650, 2009. a, b
Hersbach, H., Bell, B., Berrisford, P., Hirahara, S., Horányi, A., Muñoz-Sabater, J., Nicolas, J., Peubey, C., Radu, R., Schepers, D., Simmons, A., Soci, C., Abdalla, S., Abellan, X., Balsamo, G., Bechtold, P., Biavati, G., Bidlot, J., Bonavita, M., De Chiara, G., Dahlgren, P., Dee, D., Diamantakis, M., Dragani, R., Flemming, J., Forbes, R., Fuentes, M., Geer, A., Haimberger, L., Healy, S., Hogan, R. J., Hólm, E., Janisková, M., Keeley, S., Laloyaux, P., Lopez, P., Lupu, C., Radnoti, G., De Rosnay, P., Rozum, I., Vamborg, F., Villaume, S., and Thépaut, J.-N.: The ERA5 Global Reanalysis, Q. J. Roy. Meteor. Soc., 146, 1999–2049, https://doi.org/10.1002/qj.3803, 2020. a
Hersbach, H., Bell, B., Berrisford, P., Biavati, G., Horányi, A., Muñoz Sabater, J., Nicolas, J., Peubey, C., Radu, R., Rozum, I., Schepers, D., Simmons, A., Soci, C., Dee, D., and Thépaut, J.-N.: ERA5 hourly data on pressure levels from 1940 to present, Copernicus Climate Change Service (C3S) Climate Data Store (CDS) [data set], https://doi.org/10.24381/cds.bd0915c6, 2023. a
Hofer, S., Gierens, K., and Rohs, S.: Contrail Formation and Persistence Conditions for Alternative Fuels, Meteorol. Z., 33, 43–49, https://doi.org/10.1127/metz/2024/1178, 2024a. a, b
Hofer, S., Gierens, K., and Rohs, S.: How well can persistent contrails be predicted? An update, Atmos. Chem. Phys., 24, 7911–7925, https://doi.org/10.5194/acp-24-7911-2024, 2024b. a, b, c, d, e, f
Irvine, E. A. and Shine, K. P.: Ice supersaturation and the potential for contrail formation in a changing climate, Earth Syst. Dynam., 6, 555–568, https://doi.org/10.5194/esd-6-555-2015, 2015. a
Kaiser, S., Schmitz, O., Ziegler, P., and Klingels, H.: The Water-Enhanced Turbofan as Enabler for Climate-Neutral Aviation, Applied Sciences, 12, 12431, https://doi.org/10.3390/app122312431, 2022. a
Kärcher, B.: Formation and Radiative Forcing of Contrail Cirrus, Nat. Commun., 9, 1824–1824, https://doi.org/10.1038/s41467-018-04068-0, 2018. a, b, c, d, e
Kärcher, B. and Yu, F.: Role of Aircraft Soot Emissions in Contrail Formation, Geophys. Res. Lett., 36, L01804, https://doi.org/10.1029/2008GL036649, 2009. a
Kärcher, B., Burkhardt, U., Bier, A., Bock, L., and Ford, I. J.: The Microphysical Pathway to Contrail Formation, J. Geophys. Res.-Atmos., 120, 7893–7927, https://doi.org/10.1002/2015JD023491, 2015. a, b, c
Kaufmann, S., Dischl, R., and Voigt, C.: Regional and Seasonal Impact of Hydrogen Propulsion Systems on Potential Contrail Cirrus Cover, Atmospheric Environment: X, 24, 100298, https://doi.org/10.1016/j.aeaoa.2024.100298, 2024. a, b, c, d
Krämer, M., Schiller, C., Afchine, A., Bauer, R., Gensch, I., Mangold, A., Schlicht, S., Spelten, N., Sitnikov, N., Borrmann, S., de Reus, M., and Spichtinger, P.: Ice supersaturations and cirrus cloud crystal numbers, Atmos. Chem. Phys., 9, 3505–3522, https://doi.org/10.5194/acp-9-3505-2009, 2009. a
Lee, D., Fahey, D., Skowron, A., Allen, M., Burkhardt, U., Chen, Q., Doherty, S., Freeman, S., Forster, P., Fuglestvedt, J., Gettelman, A., De León, R., Lim, L., Lund, M., Millar, R., Owen, B., Penner, J., Pitari, G., Prather, M., Sausen, R., and Wilcox, L.: The Contribution of Global Aviation to Anthropogenic Climate Forcing for 2000 to 2018, Atmos. Environ., 244, 117834, https://doi.org/10.1016/j.atmosenv.2020.117834, 2021. a, b, c
Leipold, A., Aptsiauri, G., Ayazkhani, A., Bauder, U., Becker, R.-G., Berghof, R., Claßen, A., Dadashi, A., Dahlmann, K., Dzikus, N., Flüthmann, N., Grewe, V., Göhlich, L., Grimme, W., Günther, Y., Jaksche, R., Jung, M., Knabe, F., Kutne, P., Le Clercq, P., Pabst, H., Poggel, S., Staggat, M., Wicke, K., Wolters, F., Zanger, J., and Zill, T.: DEPA 2050 – Development Pathways for Aviation up to 2050 (Final Report), Berichtsreihe, https://elib.dlr.de/142185/ (last access: 5 February 2025), 2021. a
Marenco, A., Thouret, V., Nédélec, P., Smit, H., Helten, M., Kley, D., Karcher, F., Simon, P., Law, K., Pyle, J., Poschmann, G., von Wrede, R., Hume, C., and Cook, T.: Measurement of Ozone and Water Vapor by Airbus In-service Aircraft: The MOZAIC Airborne Program, an Overview, J. Geophys. Res.-Atmos., 103, 25631–25642, https://doi.org/10.1029/98JD00977, 1998. a
Matthes, S., Lim, L., Burkhardt, U., Dahlmann, K., Dietmüller, S., Grewe, V., Haslerud, A. S., Hendricks, J., Owen, B., Pitari, G., Righi, M., and Skowron, A.: Mitigation of Non-CO2 Aviation's Climate Impact by Changing Cruise Altitudes, Aerospace, 8, 36, https://doi.org/10.3390/aerospace8020036, 2021. a, b
Meerkötter, R., Schumann, U., Doelling, D. R., Minnis, P., Nakajima, T., and Tsushima, Y.: Radiative forcing by contrails, Ann. Geophys., 17, 1080–1094, https://doi.org/10.1007/s00585-999-1080-7, 1999. a
Megill, L. and Grewe, V.: Data and code underlying the publication “Investigating the limiting aircraft design-dependent and environmental factors of persistent contrail formation”, Version 2, 4TU.ResearchData [code and data set], https://doi.org/10.4121/cdb4e3bb-d6f4-4422-a715-b6187098a314, 2025. a
Moore, R. H., Thornhill, K. L., Weinzierl, B., Sauer, D., D'Ascoli, E., Kim, J., Lichtenstern, M., Scheibe, M., Beaton, B., Beyersdorf, A. J., Barrick, J., Bulzan, D., Corr, C. A., Crosbie, E., Jurkat, T., Martin, R., Riddick, D., Shook, M., Slover, G., Voigt, C., White, R., Winstead, E., Yasky, R., Ziemba, L. D., Brown, A., Schlager, H., and Anderson, B. E.: Biofuel Blending Reduces Particle Emissions from Aircraft Engines at Cruise Conditions, Nature, 543, 411–415, https://doi.org/10.1038/nature21420, 2017. a
Petzold, A., Thouret, V., Gerbig, C., Zahn, A., Brenninkmeijer, C. A. M., Gallagher, M., Hermann, M., Pontaud, M., Ziereis, H., Boulanger, D., Marshall, J., Nédélec, P., Smit, H. G. J., Friess, U., Flaud, J.-M., Wahner, A., Cammas, J.-P., Volz-Thomas, A., and Team, I.: Global-Scale Atmosphere Monitoring by in-Service Aircraft – Current Achievements and Future Prospects of the European Research Infrastructure IAGOS, Tellus B, 67, 28452, https://doi.org/10.3402/tellusb.v67.28452, 2015. a
Pouzolz, R., Schmitz, O., and Klingels, H.: Evaluation of the Climate Impact Reduction Potential of the Water-Enhanced Turbofan (WET) Concept, Aerospace, 8, 59, https://doi.org/10.3390/aerospace8030059, 2021. a
Rap, A., Feng, W., Forster, P., Marsh, D., and Murray, B.: The climate impact of contrails from hydrogen combustion and fuel cell aircraft, EGU General Assembly 2023, Vienna, Austria, 23–28 Apr 2023, EGU23-5520, https://doi.org/10.5194/egusphere-egu23-5520, 2023. a, b
Reutter, P., Neis, P., Rohs, S., and Sauvage, B.: Ice supersaturated regions: properties and validation of ERA-Interim reanalysis with IAGOS in situ water vapour measurements, Atmos. Chem. Phys., 20, 787–804, https://doi.org/10.5194/acp-20-787-2020, 2020. a, b
Rojo, C., Vancassel, X., Mirabel, P., Ponche, J.-L., and Garnier, F.: Impact of Alternative Jet Fuels on Aircraft-Induced Aerosols, Fuel, 144, 335–341, https://doi.org/10.1016/j.fuel.2014.12.021, 2015. a
Rosenow, J. and Fricke, H.: Individual Condensation Trails in Aircraft Trajectory Optimization, Sustainability, 11, 6082, https://doi.org/10.3390/su11216082, 2019. a
Sanogo, S., Boucher, O., Bellouin, N., Borella, A., Wolf, K., and Rohs, S.: Variability in the properties of the distribution of the relative humidity with respect to ice: implications for contrail formation, Atmos. Chem. Phys., 24, 5495–5511, https://doi.org/10.5194/acp-24-5495-2024, 2024. a
Sausen, R., Hofer, S., Gierens, K., Bugliaro, L., Ehrmanntraut, R., Sitova, I., Walczak, K., Burridge-Diesing, A., Bowman, M., and Miller, N.: Can We Successfully Avoid Persistent Contrails by Small Altitude Adjustments of Flights in the Real World?, Meteorol. Z., 33, 83–98, https://doi.org/10.1127/metz/2023/1157, 2024. a
Schmidt, E.: Die Entstehung von Eisnebel aus den Auspuffgasen von Flugmotoren, Schriften der Deutschen Akademie der Luftfahrtforschung, 44, 1–15, 1941. a
Schmitz, O., Klingels, H., and Kufner, P.: Aero Engine Concepts Beyond 2030: Part 1 – The Steam Injecting and Recovering Aero Engine, J. Eng. Gas Turb. Power, 143, 021001, https://doi.org/10.1115/1.4048985, 2021. a
Schumann, U.: On Conditions for Contrail Formation from Aircraft Exhausts, Meteorol. Z., 5, 4–23, https://doi.org/10.1127/metz/5/1996/4, 1996. a, b, c, d
Schumann, U.: A contrail cirrus prediction model, Geosci. Model Dev., 5, 543–580, https://doi.org/10.5194/gmd-5-543-2012, 2012. a
Schumann, U. and Heymsfield, A. J.: On the Life Cycle of Individual Contrails and Contrail Cirrus, Meteor. Mon., 58, 3.1–3.24, https://doi.org/10.1175/AMSMONOGRAPHS-D-16-0005.1, 2017. a
Schumann, U., Poll, I., Teoh, R., Koelle, R., Spinielli, E., Molloy, J., Koudis, G. S., Baumann, R., Bugliaro, L., Stettler, M., and Voigt, C.: Air traffic and contrail changes over Europe during COVID-19: a model study, Atmos. Chem. Phys., 21, 7429–7450, https://doi.org/10.5194/acp-21-7429-2021, 2021. a
Teoh, R., Schumann, U., Majumdar, A., and Stettler, M. E. J.: Mitigating the Climate Forcing of Aircraft Contrails by Small-Scale Diversions and Technology Adoption, Environ. Sci. Technol., 54, 2941–2950, https://doi.org/10.1021/acs.est.9b05608, 2020. a, b
Teoh, R., Schumann, U., Gryspeerdt, E., Shapiro, M., Molloy, J., Koudis, G., Voigt, C., and Stettler, M. E. J.: Aviation contrail climate effects in the North Atlantic from 2016 to 2021, Atmos. Chem. Phys., 22, 10919–10935, https://doi.org/10.5194/acp-22-10919-2022, 2022a. a, b
Teoh, R., Schumann, U., Voigt, C., Schripp, T., Shapiro, M., Engberg, Z., Molloy, J., Koudis, G., and Stettler, M. E. J.: Targeted Use of Sustainable Aviation Fuel to Maximize Climate Benefits, Environ. Sci. Technol., 56, 17246–17255, https://doi.org/10.1021/acs.est.2c05781, 2022b. a
Teoh, R., Engberg, Z., Schumann, U., Voigt, C., Shapiro, M., Rohs, S., and Stettler, M. E. J.: Global aviation contrail climate effects from 2019 to 2021, Atmos. Chem. Phys., 24, 6071–6093, https://doi.org/10.5194/acp-24-6071-2024, 2024. a, b
Ungeheuer, F., Caudillo, L., Ditas, F., Simon, M., Van Pinxteren, D., Kılıç, D., Rose, D., Jacobi, S., Kürten, A., Curtius, J., and Vogel, A. L.: Nucleation of Jet Engine Oil Vapours Is a Large Source of Aviation-Related Ultrafine Particles, Communications Earth & Environment, 3, 319, https://doi.org/10.1038/s43247-022-00653-w, 2022. a
Voigt, C., Kleine, J., Sauer, D., Moore, R. H., Bräuer, T., Le Clercq, P., Kaufmann, S., Scheibe, M., Jurkat-Witschas, T., Aigner, M., Bauder, U., Boose, Y., Borrmann, S., Crosbie, E., Diskin, G. S., DiGangi, J., Hahn, V., Heckl, C., Huber, F., Nowak, J. B., Rapp, M., Rauch, B., Robinson, C., Schripp, T., Shook, M., Winstead, E., Ziemba, L., Schlager, H., and Anderson, B. E.: Cleaner Burning Aviation Fuels Can Reduce Contrail Cloudiness, Communications Earth & Environment, 2, 114, https://doi.org/10.1038/s43247-021-00174-y, 2021. a
Voigt, C., Lelieveld, J., Schlager, H., Schneider, J., Curtius, J., Meerkötter, R., Sauer, D., Bugliaro, L., Bohn, B., Crowley, J. N., Erbertseder, T., Groß, S., Hahn, V., Li, Q., Mertens, M., Pöhlker, M. L., Pozzer, A., Schumann, U., Tomsche, L., Williams, J., Zahn, A., Andreae, M., Borrmann, S., Bräuer, T., Dörich, R., Dörnbrack, A., Edtbauer, A., Ernle, L., Fischer, H., Giez, A., Granzin, M., Grewe, V., Harder, H., Heinritzi, M., Holanda, B. A., Jöckel, P., Kaiser, K., Krüger, O. O., Lucke, J., Marsing, A., Martin, A., Matthes, S., Pöhlker, C., Pöschl, U., Reifenberg, S., Ringsdorf, A., Scheibe, M., Tadic, I., Zauner-Wieczorek, M., Henke, R., and Rapp, M.: Cleaner Skies during the COVID-19 Lockdown, B. Am. Meteorol. Soc., 103, E1796–E1827, https://doi.org/10.1175/BAMS-D-21-0012.1, 2022. a
Wang, Z., Bugliaro, L., Gierens, K., Hegglin, M. I., Rohs, S., Petzold, A., Kaufmann, S., and Voigt, C.: Machine learning for improvement of upper-tropospheric relative humidity in ERA5 weather model data, Atmos. Chem. Phys., 25, 2845–2861, https://doi.org/10.5194/acp-25-2845-2025, 2025. a
Wilhelm, L., Gierens, K., and Rohs, S.: Meteorological Conditions That Promote Persistent Contrails, Applied Sciences, 12, 4450, https://doi.org/10.3390/app12094450, 2022. a
Wolf, K., Bellouin, N., and Boucher, O.: Long-term upper-troposphere climatology of potential contrail occurrence over the Paris area derived from radiosonde observations, Atmos. Chem. Phys., 23, 287–309, https://doi.org/10.5194/acp-23-287-2023, 2023. a, b
Wolf, K., Bellouin, N., Boucher, O., Rohs, S., and Li, Y.: Correction of ERA5 temperature and relative humidity biases by bivariate quantile mapping for contrail formation analysis, Atmos. Chem. Phys., 25, 157–181, https://doi.org/10.5194/acp-25-157-2025, 2025. a, b
Yin, F., Grewe, V., and Gierens, K.: Impact of Hybrid-Electric Aircraft on Contrail Coverage, Aerospace, 7, 147, https://doi.org/10.3390/aerospace7100147, 2020. a, b
Yu, F., Kärcher, B., and Anderson, B. E.: Revisiting Contrail Ice Formation: Impact of Primary Soot Particle Sizes and Contribution of Volatile Particles, Environ. Sci. Technol., 58, 17650–17660, https://doi.org/10.1021/acs.est.4c04340, 2024. a