the Creative Commons Attribution 4.0 License.
the Creative Commons Attribution 4.0 License.
 | 09 Apr 2025
One-year continuous observations of near-surface atmospheric water vapor stable isotopes at Matara, Sri Lanka, reveal a strong link to moisture sources and convective intensity
Yuqing Wu
Aibin Zhao
Xiaowei Niu
Yigang Liu
Disna Ratnasekera
Tilak Priyadarshana Gamage
Amarasinghe Hewage Ruwan Samantha
Atmospheric water vapor stable isotopes are crucial for understanding hydrological cycle processes under climate change. This study presents the results from a year-long in situ monitoring of atmospheric water vapor stable isotopes (δ18O, δD) at Matara, Sri Lanka, from March 2020 to February 2021 to assess how oceanic sources and moisture transport influence coastal atmospheric moisture isotopic composition. We identified clear seasonal patterns in the isotopic composition, with δ18O, δD, and d-excess showing substantial variation between the southwest and northeast monsoon periods. The primary moisture sources were the Arabian Sea and the Indian Ocean during the southwest monsoon (May to September), characterized by small amplitude fluctuations of δ18O (−20.4 ‰ to −9.1 ‰). During the northeast monsoon, the northern Bay of Bengal, the Indian subcontinent, and Southeast Asia were primary moisture sources, resulting in large-amplitude fluctuations in δ18O (−23.9 ‰ to −7.5 ‰) and higher d-excess values (up to 25 ‰). The study also identified significant influences of sea surface temperature and sea surface relative humidity on the isotopic composition of water vapor. Additionally, we could use outgoing longwave radiation (OLR) to gauge the intensity of convective activity. Observational periods with low OLR, indicative of stronger and deeper convection, were associated with air masses that were more depleted in δ18O than periods with high OLR. These findings facilitate a better understanding of how the monsoon and local meteorological conditions affect water vapor isotope compositions in tropical regions. Furthermore, the new dataset will enable us to improve water vapor isotopic modeling and projections of atmospheric processes in coastal regions.
- Article
(5582 KB) - Full-text XML
-
Supplement
(3269 KB) - BibTeX
- EndNote


The Indian summer monsoon (ISM), occurring from June to September, is a pivotal component of the Asian climate system, serving as the primary moisture transport system from the Indian Ocean to the Indian subcontinent and the Tibetan Plateau (TP). Monsoonal precipitation plays a crucial role in agriculture and water resource availability, affecting the welfare of over 1.9 billion people in surrounding countries (Webster et al., 1998; Goswami et al., 2006). The Tibetan climate and hydrology are profoundly influenced by the ISM, as it contributes significantly to the regional water cycle by delivering substantial rainfall during the summer months. This rainfall is essential for maintaining the glaciers and permafrost in the TP, a key water catchment area for many of Asia's largest rivers (Bookhagen and Burbank, 2010). The ISM's intensity and variability can lead to significant fluctuations in water availability, affecting both agriculture and hydropower generation in the region (Singh and Bengtsson, 2004; Gao et al., 2014). Furthermore, the interaction between the ISM and the TP's topography creates unique climatic conditions that influence weather patterns and extreme events in the region (Liu and Chen, 2000).
The seasonal precipitation and its origins over the TP are inextricably linked to the dynamics of the ISM (Dai et al., 2021). Previous studies have provided evidence that precipitation over the TP offers insights into the climatic fluctuations and distinct moisture attributes associated with the ISM (Gao et al., 2013; Guo et al., 2017). The summer monsoon brings significant moisture from the Indian Ocean, leading to substantial rainfall over the TP, primarily during the monsoon months of June–September (Yao et al., 2012). This seasonal influx of moisture is critical for maintaining the regional hydrological balance and supporting ecosystems. Furthermore, the ISM's intensity and variability significantly influence the interannual and decadal precipitation patterns over the TP, affecting the overall water availability and climatic stability of the region (Kaushal et al., 2018).
Amidst the backdrop of global climate change, observing stable isotopes in atmospheric water vapor is vital for monitoring and understanding climate shifts in low-latitude areas (Rahul et al., 2016b). Such research is instrumental for providing a deeper understanding of near-surface water vapor dynamics, pinpointing vapor sources and transport routes, and differentiating between various contributions of atmospheric water vapor to the water cycle. The stable isotopic composition of precipitation (Rahul et al., 2016a; Cai et al., 2017) and water vapor (Risi et al., 2008; Steen-Larsen et al., 2013; Rahul et al., 2016b; Lekshmy et al., 2022) serves as a valuable tool for identifying the origins and understanding transmission processes of atmospheric water vapor. Fractionation occurs during various phase transitions, such as sea surface evaporation, condensation in clouds, re-evaporation of raindrops beneath clouds, and diffusive exchanges between water vapor and raindrops in different environments (Stewart, 1975; Benetti et al., 2018; Graf et al., 2019). The occurrence of fractionation unveils investigatable spatiotemporal distribution patterns in the water isotopic composition, encompassing water vapor and precipitation. In this context, deuterium excess (d-excess = δD − 8×δ18O) is a useful parameter for studying kinetic fractionation effects (Dansgaard, 1964). Recent studies have significantly enhanced our understanding of isotopic signals in convective regions, elucidating the complex interactions between moisture processes and isotopic composition in tropical deep convection (Risi et al., 2008; Blossey et al., 2010). Around Barbados, during the winter trade winds, vertical transport and large-scale circulation have been identified as primary drivers of isotopic variability at the cloud base, acting over timescales from hours to days (Bailey et al., 2023; Villiger and Aemisegger, 2024). Investigations into water vapor isotopes in the West African troposphere reveal that both convection and mixing highlight the important role played by large-scale atmospheric circulation processes in the variations of water vapor isotopes (Diekmann et al., 2021; de Vries et al., 2022). The precise mechanisms by which convective activity depletes water vapor and precipitation of heavy isotopes are still under debate. Some researchers have emphasized the significance of condensation levels (Cai and Tian, 2016; Permana et al., 2016; Thompson et al., 2017), while others suggested raindrop re-evaporation and raindrop–vapor isotope exchanges during strong convection as crucial factors (Galewsky et al., 2016). Additionally, unsaturated or mesoscale descending airflows that transport vapor depleted in heavy isotopes to the lower atmosphere also contribute to lower isotope values (Risi et al., 2008; Kurita, 2013). The influence of these processes varies with the intensity of convective activity.
Research on water vapor stable isotopes in the marine boundary layer aims to elucidate the processes associated with evaporation in different conditions of vertical stability, wind, sea surface temperature (SST), and relative humidity with respect to the SST (RHSST). The d-excess of evaporated water vapor is mainly impacted by kinetic fractionation and sensitive to SST, RHSST, the wind speed, and the turbulence regime in the boundary layer (Merlivat and Jouzel, 1979; Benetti et al., 2015, 2018). Investigations into the water vapor stable isotopic composition within the marine boundary layer have been principally focused on regions such as the North Atlantic (e.g., Greenland, Iceland, Bermuda) (Steen-Larsen et al., 2014; Bonne et al., 2014; Benetti et al., 2018; Bonne et al., 2019), the Bay of Bengal (BoB) (Lekshmy et al., 2022), and the Arctic Ocean (Kurita, 2011). Several studies could confirm the existence of a negative relationship between d-excess and RHSST (Uemura et al., 2008; Steen-Larsen et al., 2015), with wind speed and SST exerting a limited influence on this correlation (Benetti et al., 2015). Observations from the North Atlantic support this theory (Benetti et al., 2014). Other studies argue that the SST does have an influence via the weak dependence of the d-excess on temperature during equilibrium fractionation based on theoretical arguments (Aemisegger and Sjolte, 2018) as well as observations in the marine boundary layer covering a large latitudinal gradient over the Atlantic Ocean and Southern Ocean (Thurnherr et al., 2020). In addition, studies found significant variations in d-excess values in vapor that originated at different moisture sources (Pfahl and Wernli, 2008; Kurita, 2011; Steen-Larsen et al., 2013; Delattre et al., 2015). Subsequently, Benetti et al. (2015) introduced a multi-layer mixing model, which is expected to improve the accuracy of d-excess and water vapor isotope simulations. Due to the impact of kinetic fractionation on sea surface water evaporation, some studies have focused on simulating observed d-excess under the closure assumption (Merlivat and Jouzel, 1979). Others have used isotope atmospheric circulation models to assess mixing and transport processes within the marine boundary layer at different resolutions (Steen-Larsen et al., 2017; Risi et al., 2020; Thurnherr et al., 2021). In addition, previous studies have used single-column analytical mixing models (Risi et al., 2019), as well trajectory-based box models (Thurnherr and Aemisegger, 2022). Owing to the minor influence of transport-induced fractionation, d-excess in the marine boundary layer is typically employed to deduce moisture sources (Benetti et al., 2018).
Located in the northern Indian Ocean, Sri Lanka is impacted by both the southwest and northeast monsoons (Fig. 1a, b) and has been identified as an important origin region for monsoonal water vapor over the TP. However, only few studies have focused on the Indian Ocean and even fewer on the area around Sri Lanka. This knowledge gap underscores the need to explore isotopic signals in this region and to place them into their appropriate contexts, e.g., the findings by Risi et al. (2008). For instance, more recent studies on water stable isotopes in the southern Indian Ocean and the South Asian region have uncovered connections between local processes and large-scale atmospheric circulation, shedding light on sea surface dynamics (Midhun et al., 2013; Rahul et al., 2016b; Bonne et al., 2019). Unlike precipitation and surface water, atmospheric water vapor stable isotopes can be monitored continuously, regardless of season, weather, or location (Angert et al., 2008). This potentially full temporal and spatial coverage allows for a more comprehensive and continuous monitoring of atmospheric water vapor dynamics and transport, which should in turn facilitate a deeper understanding of isotope transformation processes within the water cycle. Therefore, investigating the dynamics of near-surface atmospheric water vapor stable isotopes at coastal stations is not only pivotal for identifying monsoonal water vapor source regions but will facilitate a better understanding of precipitation processes over the Indian Ocean. Oceanic evaporation represents the first of many phase transitions that occur during the global water cycle. The primary objective of researching water vapor stable isotopes is to comprehend the processes and controlling factors of water isotopic variations.
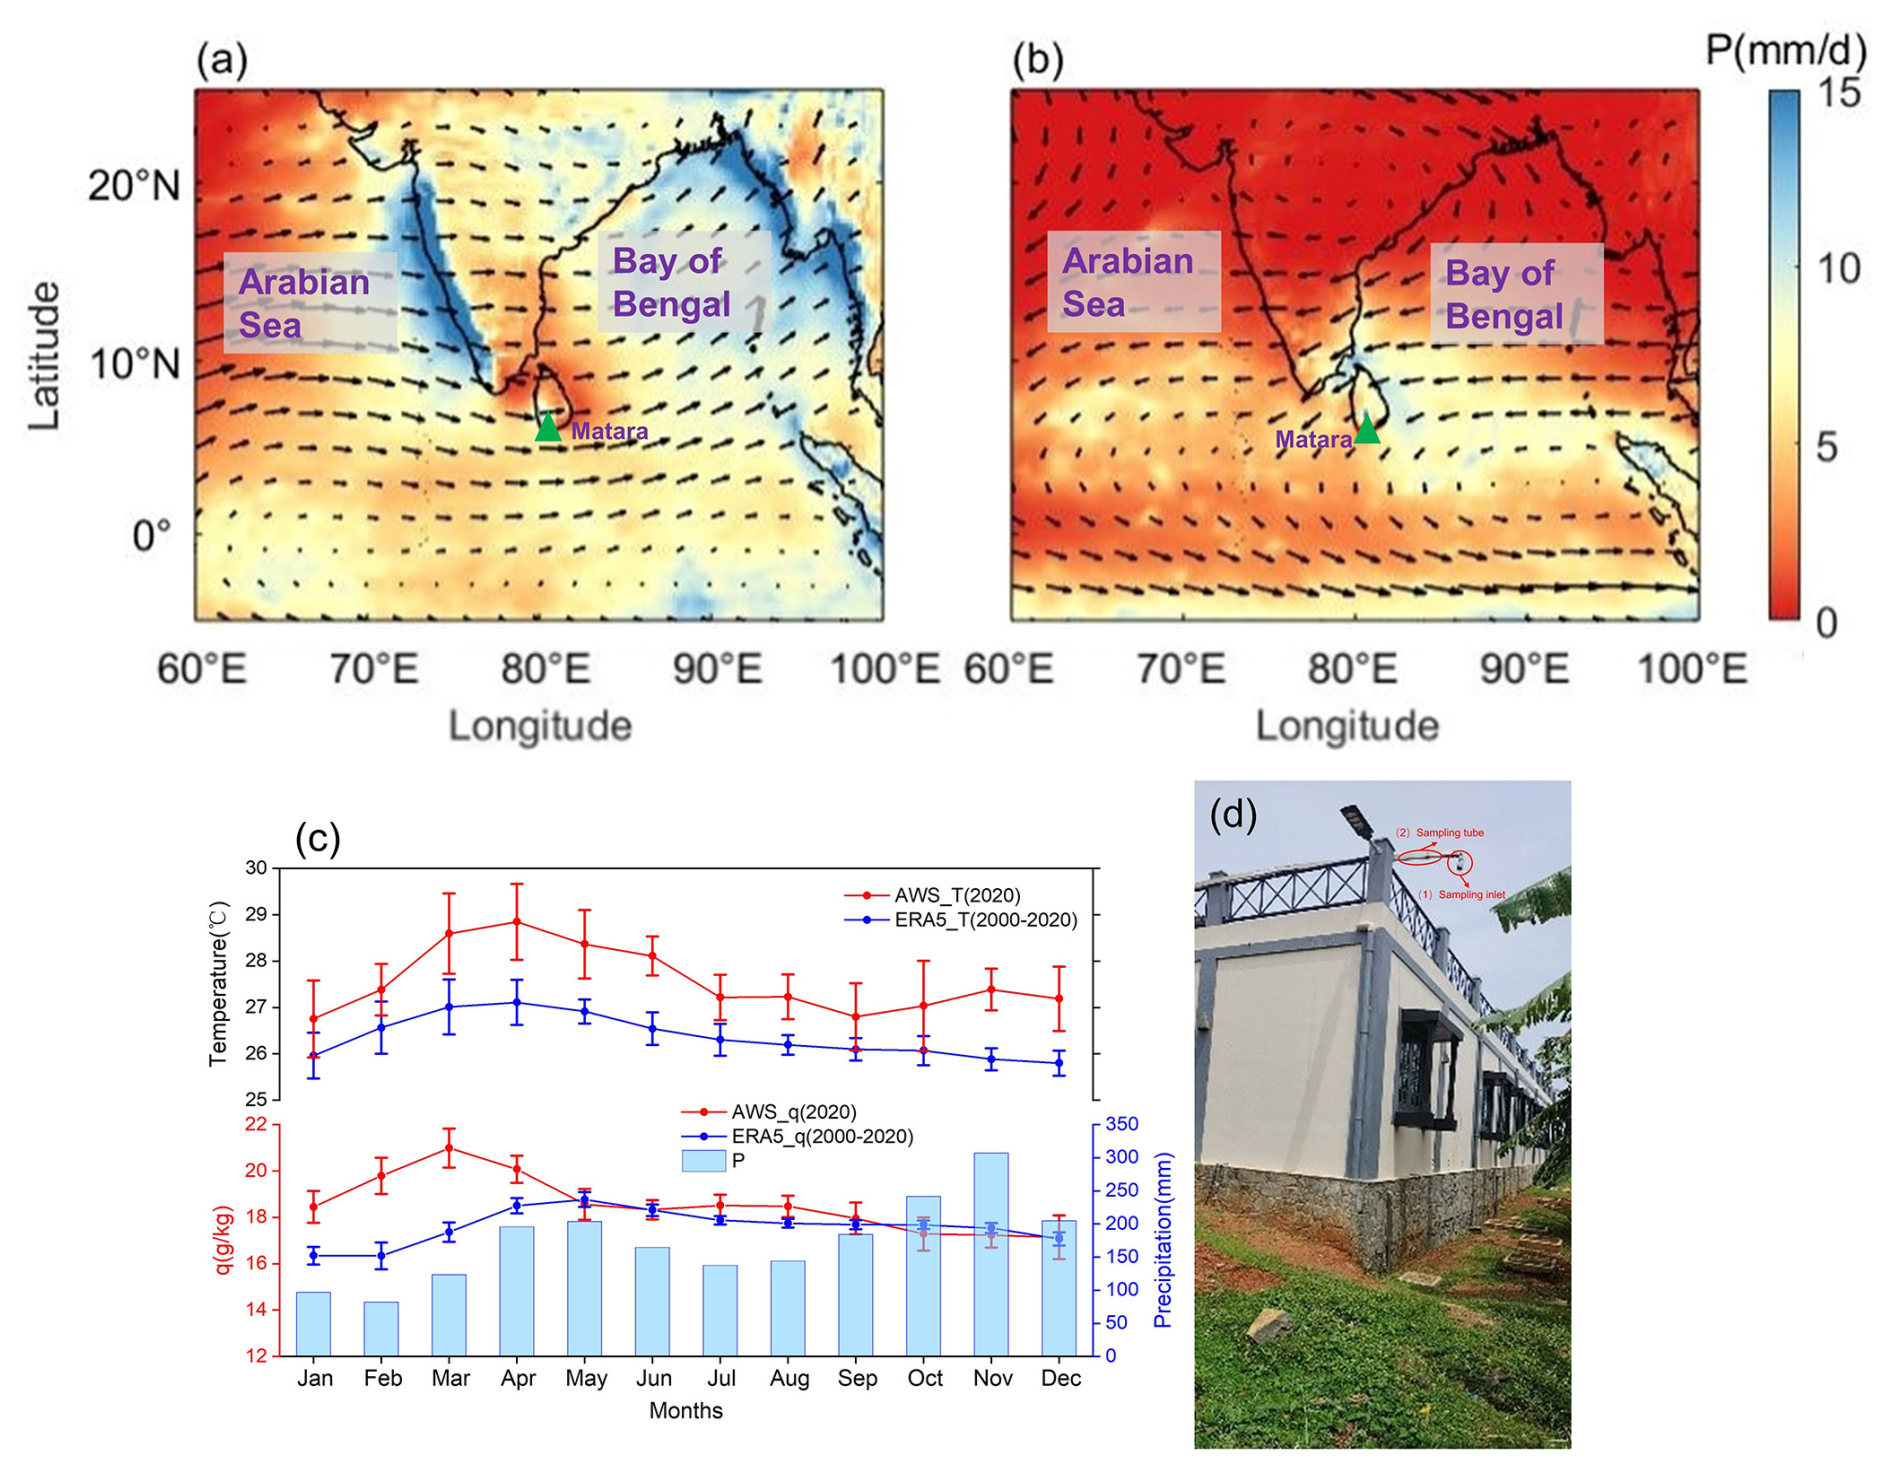
Figure 1Mean wind vectors (arrows) at 850 hPa during the (a) 2020 southwest monsoon and (b) 2020/2021 northeast monsoon seasons, along with mean precipitation (P, base colors) from ERA5 averaged for the same period. (c) Monthly mean temperature and specific humidity (q) obtained from the automated weather station at Matara (January and February are from 2021, while March–December are from 2020), with monthly average temperature, specific humidity, and precipitation from ERA5 (averaged for the years 2000–2020) plotted for comparison. (d) Photograph of the roof-mounted weather station at the University of Ruhuna, Sri Lanka.
In this study, we present the results from continuous observations of near-surface atmospheric water vapor stable isotopes in Matara, Sri Lanka, collected from 1 March 2020 to 28 February 2021. We analyze the observational data to gain a better understanding of the variations in moisture sources and main transmission processes in tropical coastal regions. Furthermore, we explore how sea surface processes, convective activity, and local meteorological factors affect near-surface atmospheric water vapor stable isotopes at a coastal station, across daily, monthly, and seasonal (monsoonal) timescales. Section 2 gives an overview of the study site and presents the meteorological and water vapor observations, calibration protocols, and analysis methods. In Sect. 3, we illustrate the variability of isotopic and meteorological parameters; analyze moisture sources; assess the impact of sea surface processes on water vapor isotopes; and explore the relationship between water vapor isotopes, convective activity, and local meteorological observations.
2.1 Study site and meteorological data
Sri Lanka (located between approximately 6 to 10° N and 79 to 82° E) is the southernmost country on the Indian subcontinent and a key region for identifying the moisture source of the South Asian summer monsoon (Lekshmy et al., 2015). Featuring a tropical climate, Sri Lanka experiences four distinct monsoon seasons annually: the northeast monsoon from December to February, the first inter-monsoon from March to April, the southwest monsoon from May to September, and the second inter-monsoon from October to November (Malmgren et al., 2003; Jayasena et al., 2008). For the analyses, we combined the first and second inter-monsoon periods into a single non-monsoon period. Most of the precipitation in Sri Lanka comes from the southwest and northeast monsoon systems, accounting for over 78 % of the total annual precipitation (Fig. 1c). Precipitation formation in Sri Lanka primarily relies on organized convection associated with the Intertropical Convergence Zone (ITCZ) and low-pressure systems (Gadgil, 2003), while the associated moisture primarily originates in the Indian Ocean and BoB (Bandara et al., 2022). The southwest monsoon transports moisture from the Indian Ocean to southwestern Sri Lanka (Fig. 1a), where it leads to increased rainfall (Rahul et al., 2016b). In contrast, the northeast monsoon carries water vapor from the BoB to northern and northeastern Sri Lanka (Fig. 1b) (Dhar and Rakhecha, 1983; Chang et al., 2006).
An automated weather station (AWS) was installed at the University of Ruhuna, Matara (located at 5.94° N, 80.57° E), on the southern coast of Sri Lanka (Fig. 1d). It collected real-time meteorological observations, including air temperature, precipitation, relative humidity, air pressure, wind speed, and wind direction from 1 March 2020 to 28 February 2021.
In this study, we used hourly data of 2 m air temperature, 2 m dew temperature, air pressure, precipitation, SST, atmospheric boundary layer height (BLH), wind speed, wind direction, and outgoing longwave radiation (OLR), obtained from ERA5 for the years 2000 to 2021, with a spatial resolution of 0.25° × 0.25° and a temporal resolution of 1 h. Meteorological data are compared with water vapor isotopic data measured during the same period. Based on the European Centre for Medium-Range Weather Forecasts (ECMWF, https://cds.climate.copernicus.eu/eu/, last access: 4 May 2024) reanalysis dataset (ERA5), the annual average precipitation and air temperature for the period from 2000 to 2020 are 2085 mm and 27.6 °C, respectively (Fig. 1c) (Hersbach et al., 2020). Studies have shown that ERA5 data provide good representations of the Matara equatorial climate and can be used in lieu of missing observational data (Fig. S3 in the Supplement) (Bandara et al., 2022). Due to weather conditions and instrument trouble, specific humidity measured by the isotopic measurement instrument and computed by the AWS are missing from March to April 2020. Therefore, we chose to present both variables obtained from ERA5 as they complement each other, providing a clearer picture of humidity changes at Matara station.
For the atmosphere above open sea regions, RHSST is obtained using the following (Bonne et al., 2019):
where RH2 m air is the relative humidity 2 m above the ocean surface, qsat(T2 m air) is the specific humidity at a saturated condition for a given 2 m air temperature, and qsat(SST) is the specific humidity calculated for seawater with a salinity of 35 practical salinity units (PSU) (Curry and Webster, 1999).
The formulas to calculate air saturation specific humidity qsat(T2 m air) and sea-surface-saturation specific humidity qsat(SST) with a salinity of 35 PSU are the following:
where qs represents specific humidity with a salinity of 35 PSU and is calculated in the same way as qsat(T2 m air). E is the saturated water vapor pressure, obtained from the improved Goff–Gratch formula (Goff and Gratch, 1946). P is atmospheric pressure. We take the sea surface pressure as the atmospheric pressure to participate in the above calculation (Eq. 2).
2.2 In situ observations of atmospheric water vapor isotopic composition
Near-surface atmospheric water vapor isotope measurements at Matara were collected using a sampling frequency of 1Hz with the instrument located approximately 5m from the AWS. We used a water vapor isotope analyzer (Los Gatos Research (LGR) Inc.) in conjunction with an LGR water vapor isotope standard source (WVISS) model. The LGR instrument employs a mirrored sampling chamber in which the laser traverses the sample volume thousands of times, effectively amplifying the water vapor absorption signal which facilitates the detection of low concentrations of D and 18O (Liu et al., 2015). Compared to traditional methods, this spectroscopic technique offers three advantages: (i) it is compact and portable, enabling real-time field monitoring; (ii) it can simultaneously measure δ18O and δD; and (iii) it has lower measurement costs and requires less operator expertise.
The instrumental setup was situated approximately 100 m from the sea shore (5.94° N, 80.57° E; 10 m) and consisted of four primary components: (1) a sampling inlet, positioned approximately 5 m above the ground (Fig. 1d), equipped with a stainless-steel mesh to prevent interference from insects and facing downward to avoid direct impacts from rain; (2) a in. outer diameter stainless-steel sampling tube, insulated with heating tape and a 2 cm thick pipe for thermal insulation; (3) the calibration unit to generate a constant flow of water vapor with known isotopic composition and at different humidity levels; and (4) a water vapor isotope analyzer, delivering measurement precisions for δ18O and δD of 0.25 ‰ and 0.5 ‰, respectively (a concentration of 2500 ppmv). This setup has been designed to minimize external influences and maintain the integrity of the sampled water vapor.
The spatial proximity between the water vapor analyzer and AWS ensures a high level of synchronicity between the isotope and meteorological measurements. We define wind directions from 60 to 330° N as oceanic, while those from 330 to 60° N are defined as terrestrial winds (Fig. 1a, b).
Atmospheric water vapor stable isotopes are expressed using the δ notation (in per mil, ‰), using the following equations:
Here, δsample represents either δ18O or δD (18O or D isotope ratio) relative to Vienna Standard Mean Ocean Water (VSMOW). Rsample and RVSMOW are the 18O or D and VSMOW isotope ratios, respectively.
2.3 Calibration protocol
In this study, we adhere to the calibration protocol proposed by Steen-Larsen et al. (2013). Briefly, the instrument calibration and data processing consist of three major steps: (1) humidity–isotope response calibration, (2) VSMOW and Standard Light Antarctic Precipitation (VSMOW-SLAP) calibration, and (3) drift correction (see Sect. S1 in the Supplement).
The water vapor concentration can influence the measured water vapor isotopic composition, known as concentration- or humidity-isotope dependency characterization. By adding a constant stream of water vapor with known isotopic composition at different humidity levels, we can establish the humidity-isotope response function (Sturm and Knohl, 2010; Aemisegger et al., 2012). As this function can vary over time, its calibration was repeated monthly, using two standard samples of known isotopic compositions measured at humidity levels ranging from 16 000 to 38 000 ppmv at intervals of 1000 ppmv. Each level was measured for at least 25 min using the LGR WVISS. Our results are referenced to a humidity level of 20 000 ppmv. We compared our measurements to the international VSMOW-SLAP scale, assuming a linear drift between calibration points.
To compensate for instrumental drift, we measured the water vapor from a drift–standard bottle for 25 min after each 12 h performed an ambient air measurement. Furthermore, we tested for instrument drift as part of the routine instrument maintenance, assuming a linear drift between each drift-standard measurement. Laboratory analyses of liquid isotopes have confirmed the stability of its isotopic composition over time.
2.4 Rayleigh distillation model and marine boundary layer (MBL) mixing model
The Rayleigh distillation model is employed to quantify isotopic variations during phase changes (Dansgaard, 1964), by which the residual air mass becomes drier with a depletion in heavy isotopes following moist adiabatic vertical ascent (Gat, 1996):
Here, Rr and R0 represent the isotopic ratio of residual vapor and initial vapor, respectively. denotes the equilibrium fractionation factor, and f is the fraction of residual water vapor.
By integrating the definition of isotope ratios as given in Eq. (6), the Rayleigh distillation model can be expressed in terms of isotopic content as follows:
where δr and δ0 are the isotope ratios relative to VSMOW in residual and initial vapor, respectively.
We employ the mixing model to examine the isotopic characteristics after the mixing of two air masses (Galewsky and Hurley, 2010):
where Rmix represents the isotopic ratio of the mixed air mass, while [HDO], [H2O], and [H2 18O] denote isotopic water vapor volume mixing ratios. f is the mixing fraction. The isotopic ratio and isotopic δ in Eqs. (9) and (10) have been calibrated by VSMOW.
We use water vapor isotopes to characterize the mixing processes in the marine boundary layer (MBL) (Benetti et al., 2018), using the following equation (Craig and Gordon, 1965):
where represents the equilibrium fractionation factor between vapor and liquid, and αk is the kinetic fractionation factor. δOC denotes the isotopic composition of the ocean surface. We utilize from Wahl et al. (2022) and αk for the smooth regime (αk18O = 1.006 and αkD = 1.0053) (Merlivat and Jouzel, 1979).
2.5 Qualitative trajectory-based moisture source analysis
To delineate water vapor transport paths and pinpoint moisture sources, we employed the HYbrid Single-Particle Lagrangian Integrated Trajectory (HYSPLIT) model from the US National Oceanic and Atmospheric Administration (NOAA) to compute backward trajectories of air masses arriving at Matara station during the southwest and northeast monsoons. The Global Data Assimilation System (GDAS) with 1° × 1° and 3 h spatial and temporal resolutions provided the background meteorological data from May to September 2020 and December 2020 to February 2021 (ftp://arlftp.arlhq.noaa.gov/archives/gdas1/, last access:19 January 2024). The HYSPLIT model uses GDAS reanalysis data, which contains 37 (vertical) pressure levels and a 1° × 1° horizontal resolution. Atmospheric water vapor primarily resides at altitudes below 2 km (Wallace and Hobbs, 2006). In this study, particles were released four times daily (at 00:00, 06:00, 12:00, and 18:00 UTC) at 20 different locations within a rectangular area extending 0.2° in each direction (north, south, east, and west) from Matara station and at four heights above the ground (50, 500, 1200, and 2000 m). Each trajectory was back-traced for 168 h, recording data at 1 h intervals. The HYSPLIT model outputs latitude, longitude, elevation, pressure, temperature, precipitation, relative humidity, and specific humidity. Backward trajectory clustering analysis was conducted, using the corresponding meteorological data. We averaged the trajectories of four times per day to obtain a daily mean trajectory, combined with water vapor stable isotope values on precipitation days. These daily mean trajectories were clustered by moisture source using K-means clustering. By analyzing the variations in latitude, elevation, and specific humidity along the trajectories, the influence of different moisture sources on local vapor content and isotopic composition was evaluated.
These analyses yielded concentration-weighted trajectory (CWT) fields (resolution of 0.5° × 0.5°) (Hsu et al., 2003) using the in situ daily average δ18O and d-excess, which in turn facilitated the identification of potential moisture sources and an assessment of the potential influence of recirculation on d-excess in water vapor (Salamalikis et al., 2015; Bedaso and Wu, 2020; Xu et al., 2022). CWT (Ci,j) was calculated as
where the set (i,j) denotes grid coordinates, k the trajectory index, K the total number of trajectories analyzed, Ck the concentration (here δ18O and d-excess) at the end of the trajectory k, and the residence time of trajectory k in grid cell (i,j). We substituted the residence time by the number of trajectory endpoints in each grid cell (i,j).
3.1 Seasonal variability of water vapor stable isotope
During a year-long observational period (1 March 2020 to 28 February 2021), the seasonal and synoptic variations observed in water vapor isotopes (δ18O, δD, and d-excess) and key meteorological parameters (temperature, relative humidity, atmospheric pressure, specific humidity, and SST) are explored (Fig. 2), aiming to provide insights into the interactions between atmospheric and oceanic conditions at Matara. The tropical setting at Matara leads to relatively modest temperature fluctuations, with the 12-month average at 27.6 °C, dipping to 22.3 °C and reaching 33.5 °C at extremes. The amplitude of temperature remains around 10 °C between monsoon and non-monsoon periods. Specific humidity is ranging from 16 to 21 g kg−1 and shows marked oscillations during the southwest and northeast monsoons, with amplitudes of approximately 1.3 and 2.3 g kg−1, respectively. Relative humidity also shows clear seasonal pattern, peaking at 95 % in May (southwest monsoon) and falling to 49.2 % in January (northeast monsoon). Monthly trends (Fig. S4 and Table 1) reveal a steady decrease in both air temperature and specific humidity from May to September, culminating in their lowest values (26.9 °C and 18.5 g kg−1, respectively). During the southwest monsoon, temperatures and specific humidity in May (monthly averages of 28.4 ± 1.4 °C and 21.0 ± 1.1 g kg−1) reflect the influx of warm, moist air from the Indian Ocean. In contrast, February stands out as the coldest and driest period (27.4 ± 2.6 °C and 17.1 ± 1.3 g kg−1), corresponding to the northeast monsoon (Fig. S4). Among them, daily average SSTs consistently exceed the daily average 2 m air temperatures recorded by the AWS, indicating the ocean's significant role in modulating near-surface atmospheric conditions (Fig. 2).
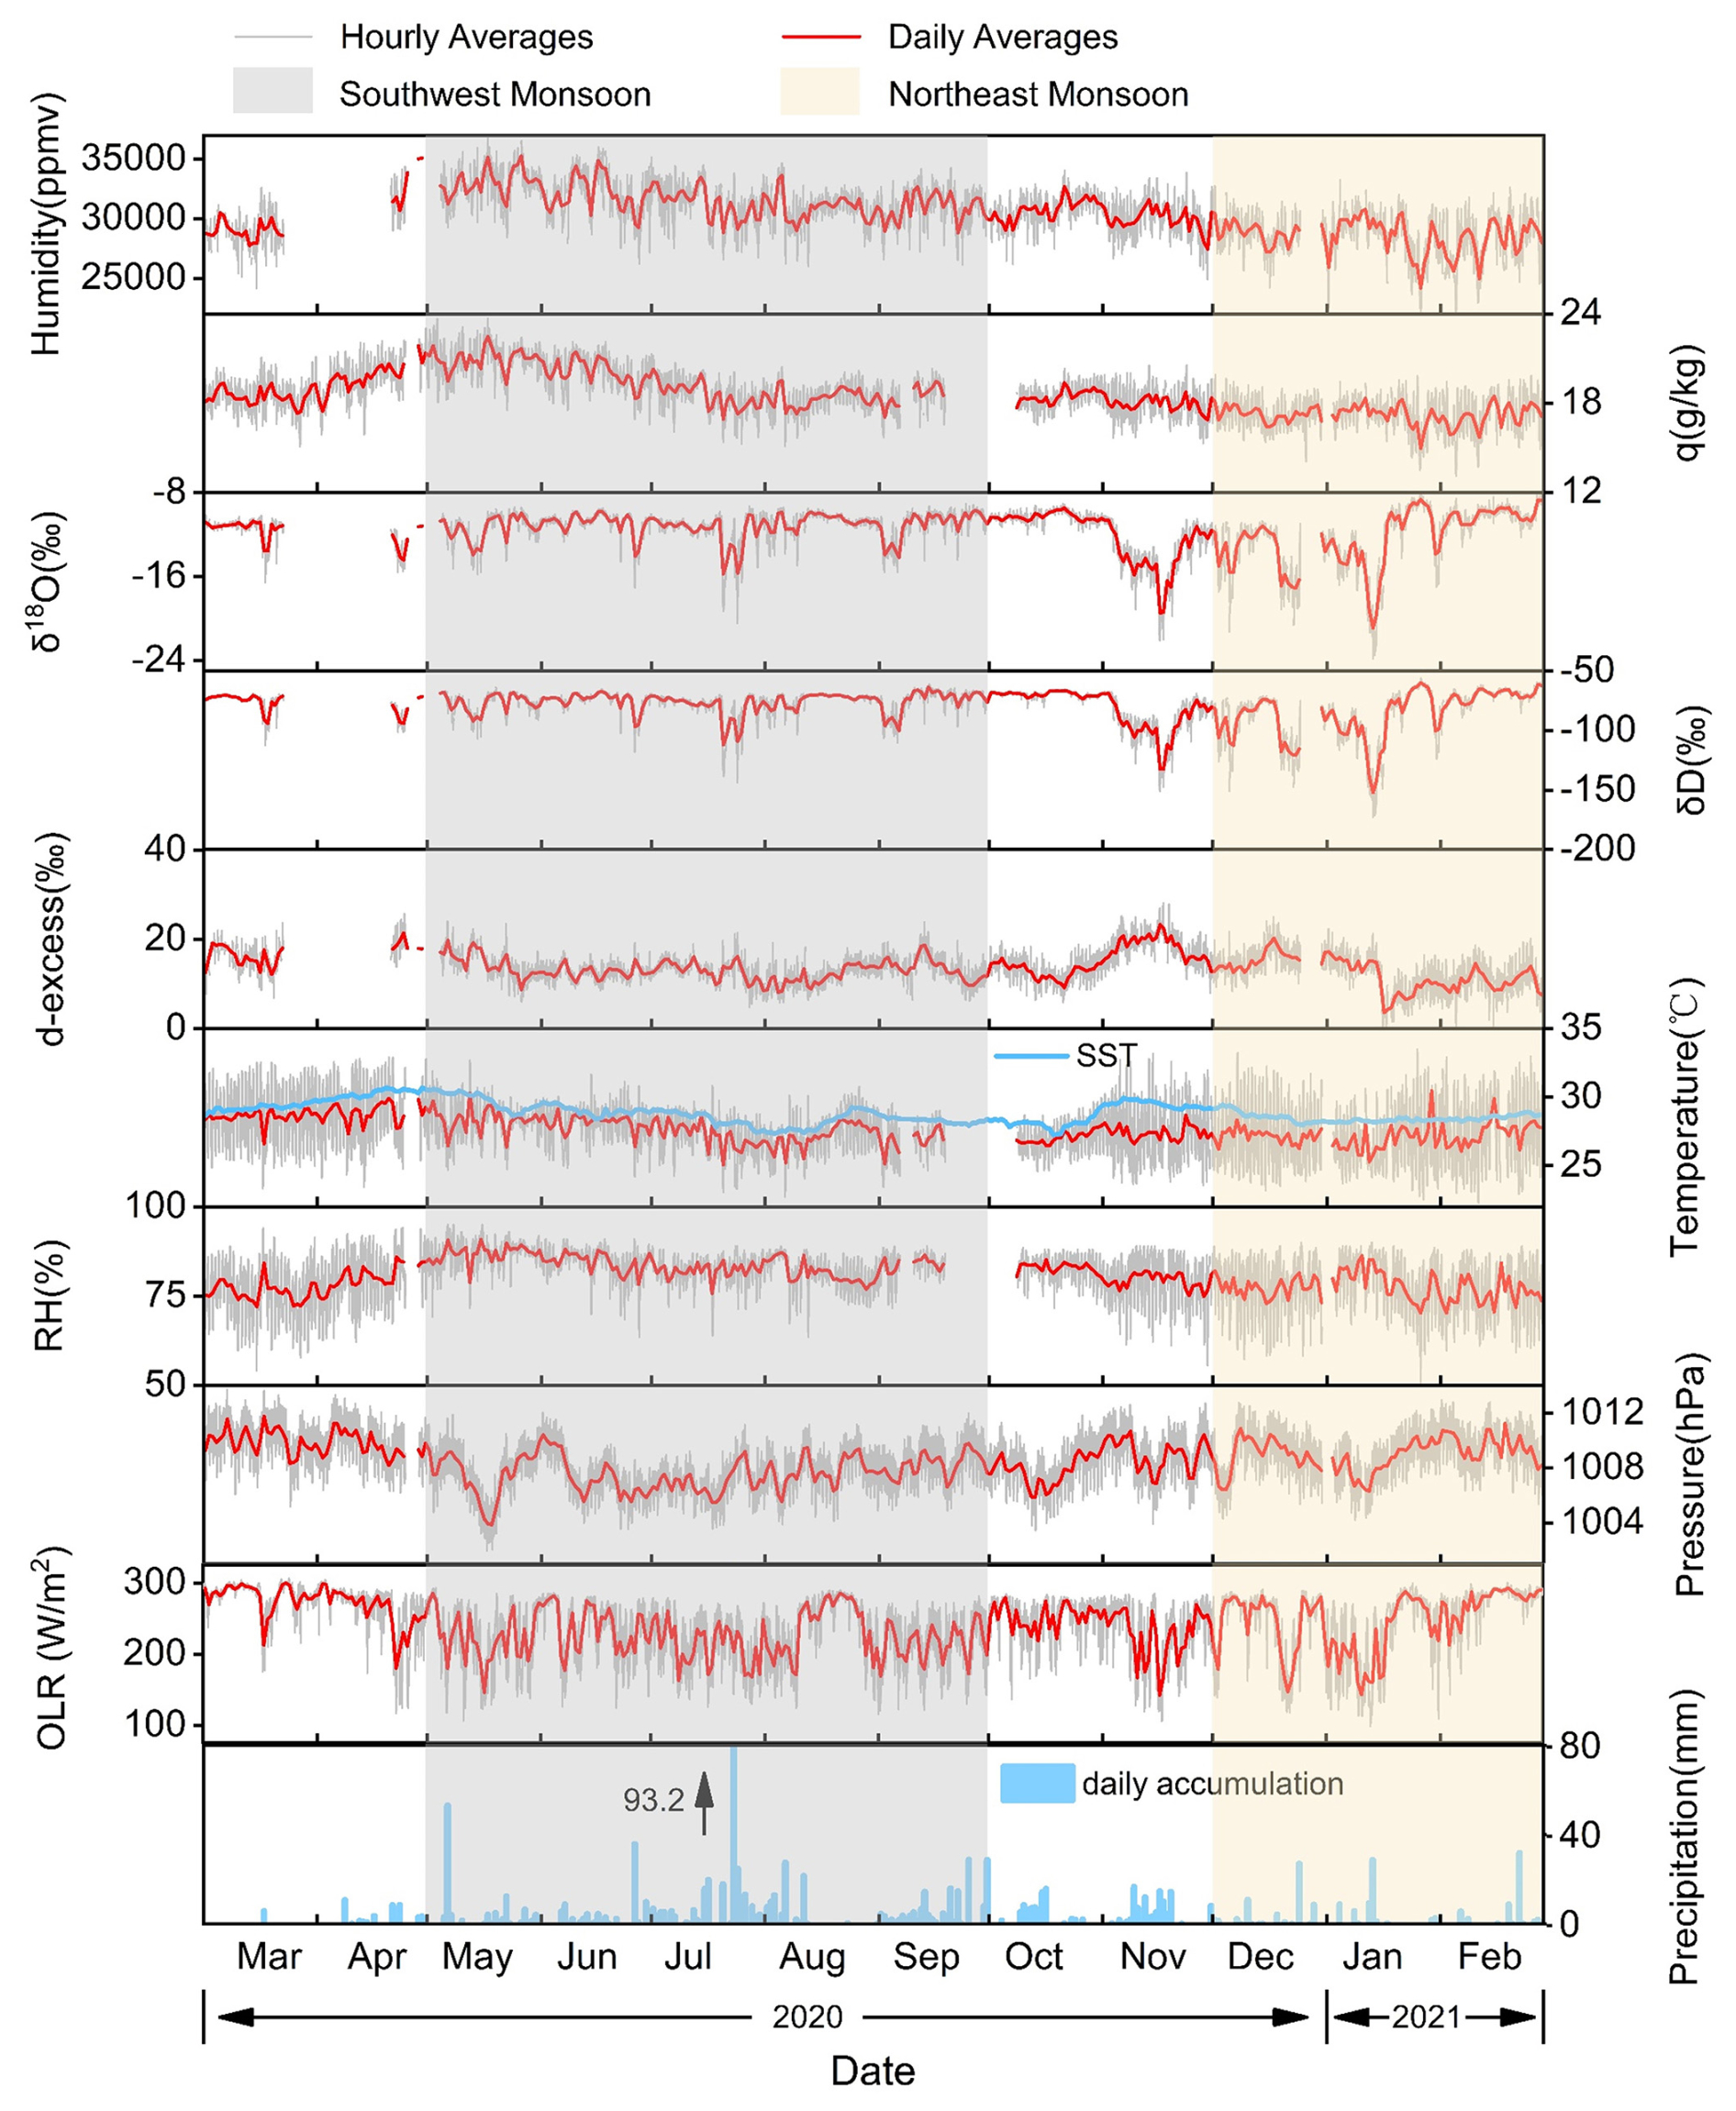
Figure 2Near-surface observations at Matara station of water vapor isotopes (δ18O, δD, and d-excess) and meteorological parameters (humidity, specific humidity (q), temperature, relative humidity (RH), pressure, outgoing longwave radiation (OLR, obtained from the National Centers for Environmental Prediction (NCEP)), and precipitation) from 1 March 2020 to 28 February 2021. Local sea surface temperature at Matara (SST, obtained from ERA5) is plotted in blue.
Table 1Summary of hourly-averaged data collected at Matara station from 1 March 2020 to 28 February 2021. Averages are shown in bold. N indicates the number of observations of δ18O, δD, d-excess, temperature (T), relative humidity (RH), specific humidity (q), and atmospheric boundary layer height (BLH). Yearly maxima and minima for each parameter are highlighted using italics.
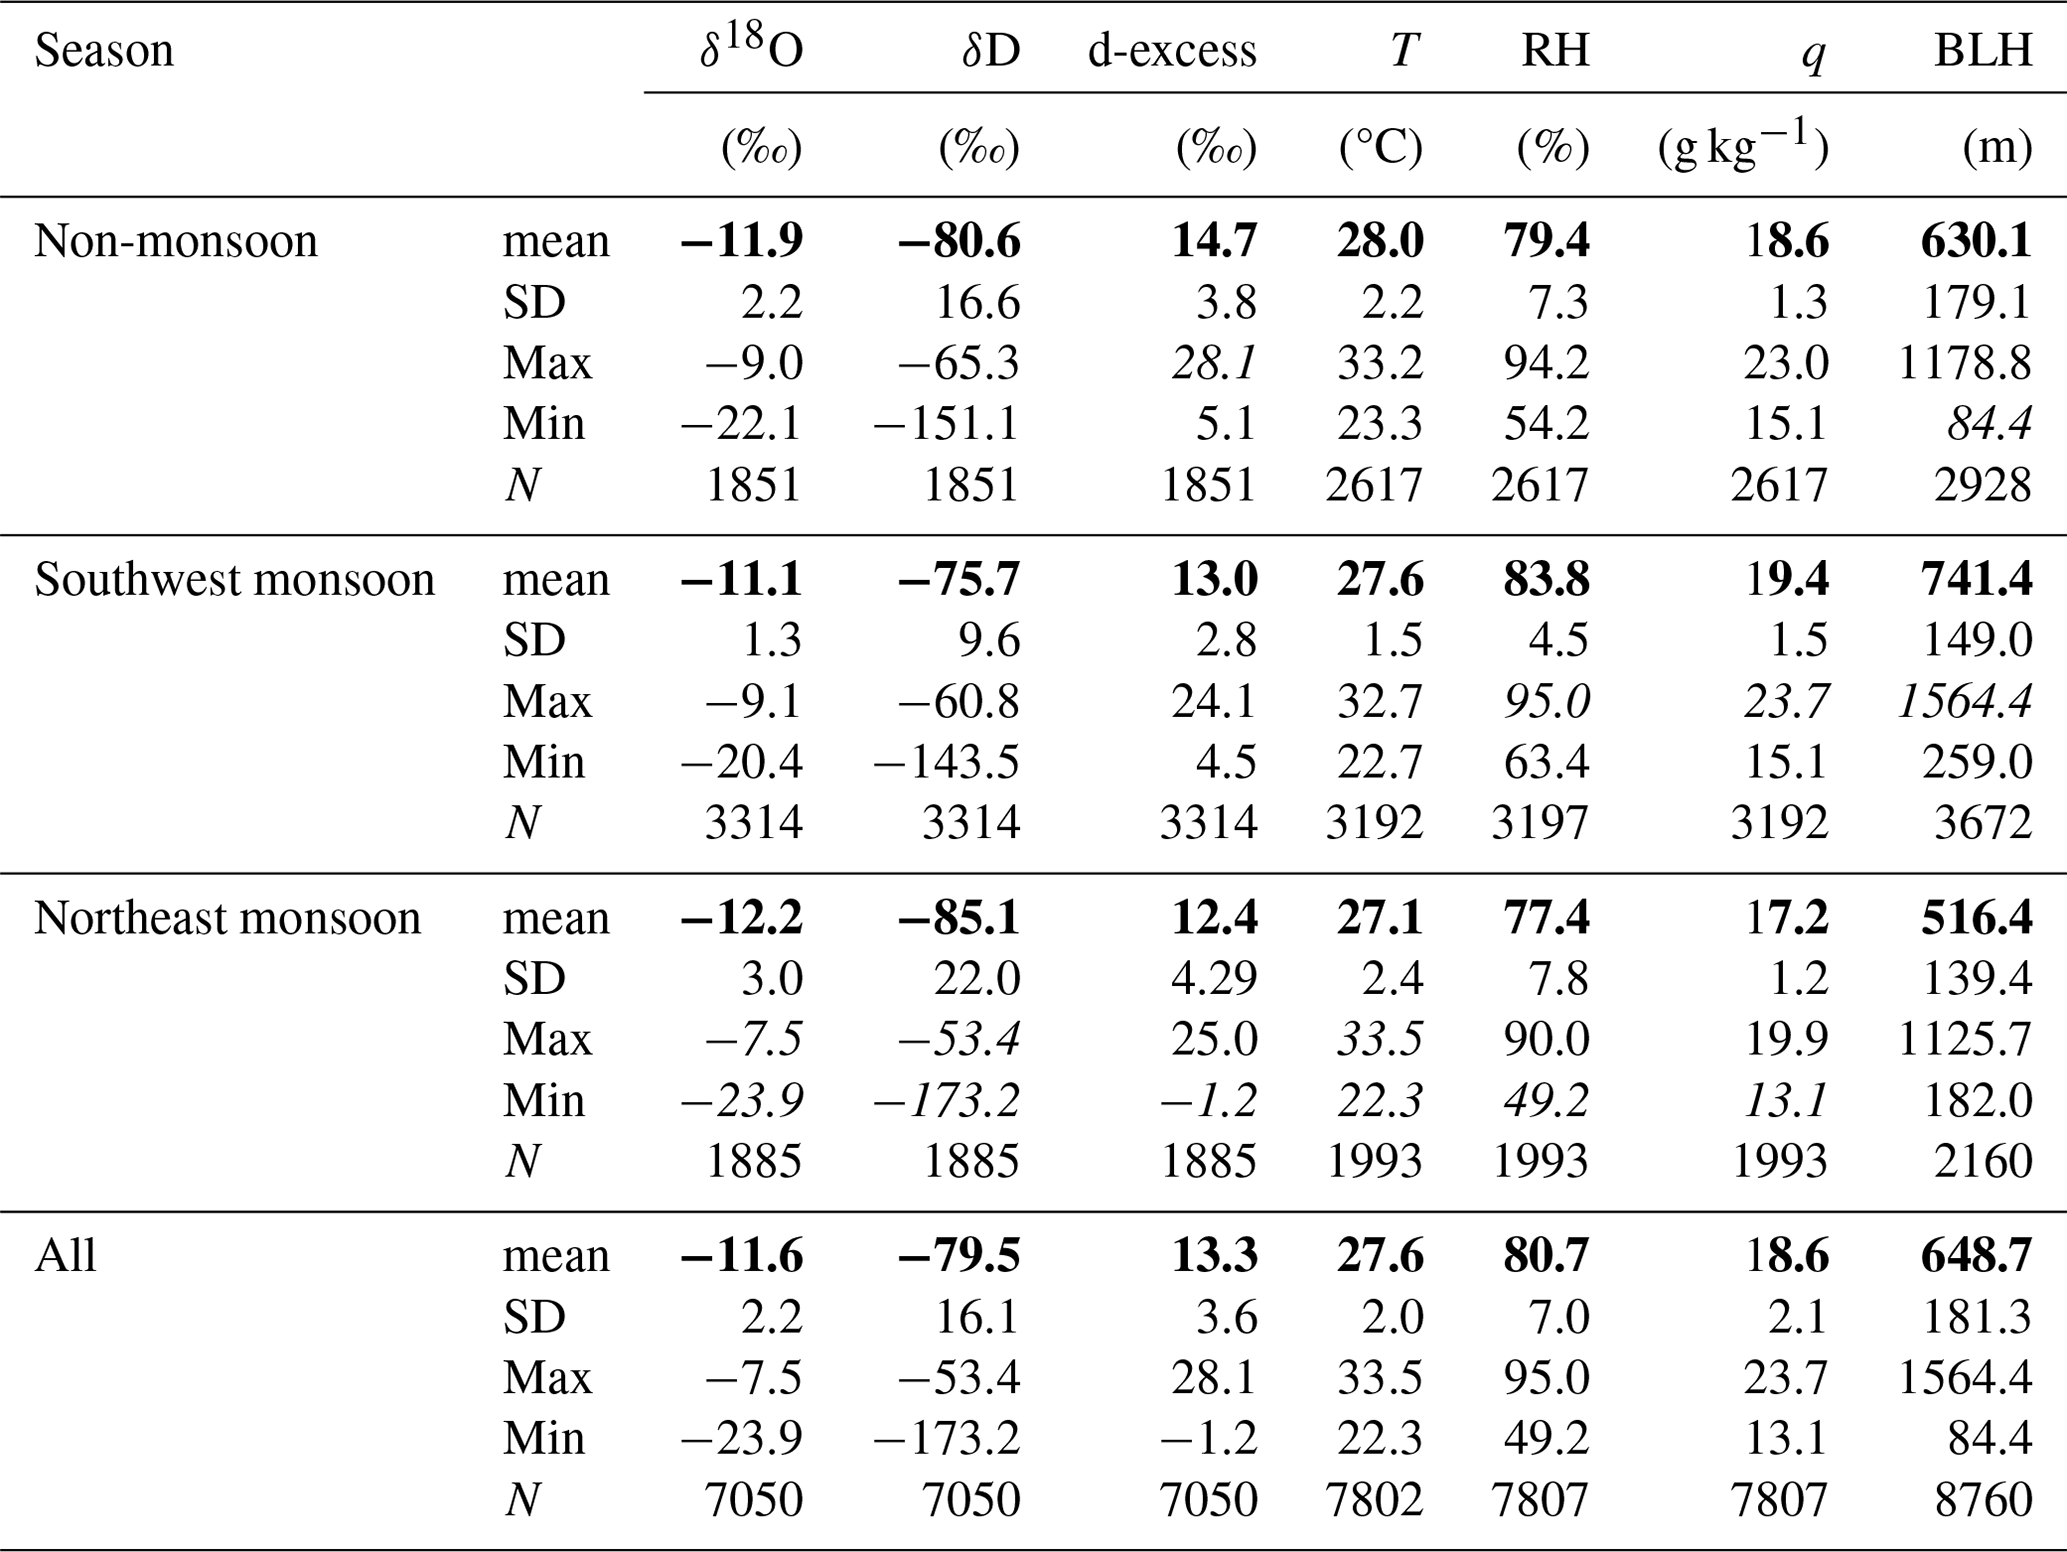
Yearly averages for water vapor isotopic values are −11.6 ‰ for δ18O, −79.5 ‰ for δD, and 13.3 ‰ for d-excess, respectively. Isotopic composition ranges from −23.9 ‰ to −7.5 ‰ for δ18O, −173.2 ‰ to −53.4 ‰ for δD, and −1.2 ‰ to 28.1 ‰ for d-excess (Table 1). Monthly averages of water vapor isotopes (δ18O and d-excess) exhibit stability from March to October, followed by sudden decreases. δ18O and δD show distinct seasonal variations, with higher values during the southwest monsoon and lower values during the northeast monsoon (Table 1). Therefore, the subsequent analysis will concentrate on the variations in δ18O. During the southwest monsoon, the northeast monsoon, and the non-monsoon periods, the average values of δ18O are −11.1 ‰, −12.2 ‰, and −11.9 ‰, respectively. Extreme values of δ18O are observed during the northeast monsoon, with a maximum of −7.5 ‰ and a minimum of −23.9 ‰. Conversely, d-excess exhibits a reverse pattern to δ18O on both seasonal and monthly scales, characterized by lower values during the southwest monsoon and higher values during the non-monsoon period. Furthermore, during the northeast monsoon, the southwest monsoon, and the non-monsoon periods, the average values of d-excess are 12.4 ‰, 13 ‰, and 14.7 ‰, respectively. The d-excess maximum occurs in November at 28.1 ‰ (monthly average of 15.2 ± 4.3 ‰), while the minimum of −1.2 ‰ was recorded in January (monthly average of 11.3 ± 4.5 ‰). The high values of d-excess are related to moisture recycling. Low specific humidity corresponds to depleted δ18O and elevated d-excess, indicating a strong depletion during the long-distance transport from the source regions to the observation station. Coastal stations such as Bengaluru, Ponmudi, and Wayanad also show similar water vapor isotopic depletion in autumn and winter, reflecting the observations made at Matara (Table 2).
Table 2Summary of observed water vapor isotope concentrations at various stations in India and the Bay of Bengal.
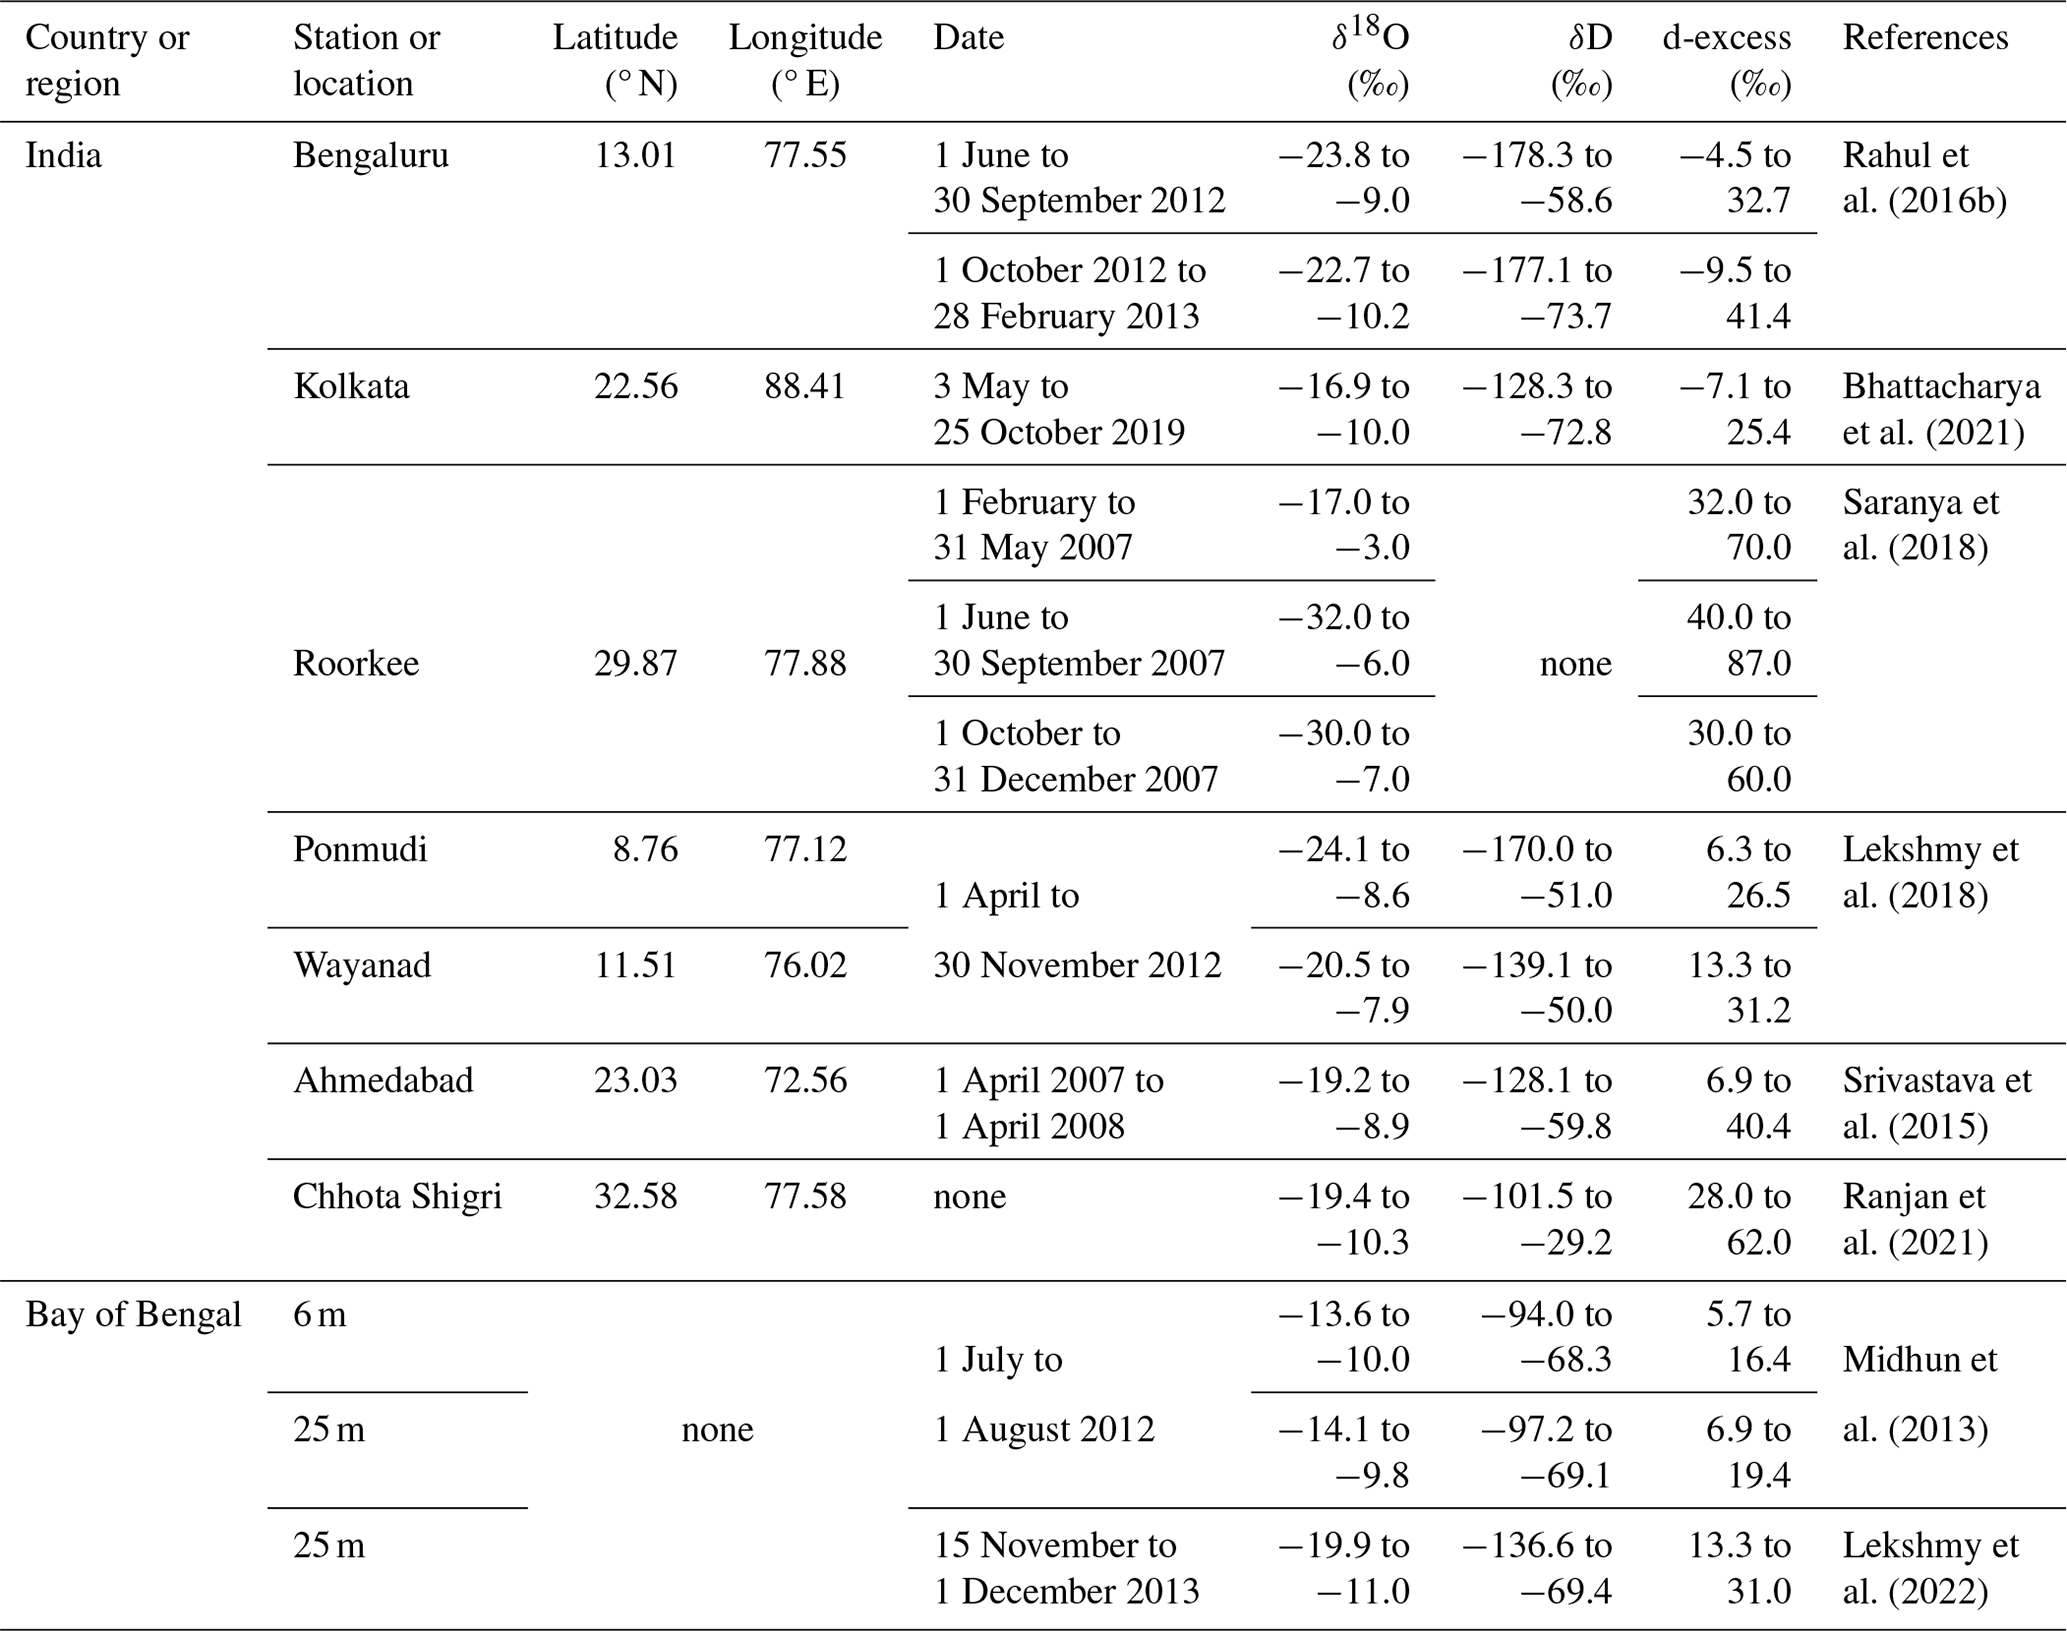
For δ18O, δD, and d-excess, synoptic variations were recorded (Fig. 2). Abrupt changes occurred in late July 2020 and from November 2020 to January 2021, associated with synoptic events. Cumulative precipitation in July 2020 reached 451.8 mm, with a notable rainfall event in late July recording daily rainfall of 93.2 mm. Isotopic δ18O values show a sharp depletion from −10.4 ‰ to −20.4 ‰ within 20 h of isolated rainfall events, lasting for 6 d. Over the 75 d period spanning from the late southwest monsoon to the mid-northeast monsoon, significant fluctuations can be seen in isotopic δ18O between −22 ‰ and −11 ‰. During the southwest monsoon from 12 July to 7 August, δ18O values varied from −20.4 ‰ to −9.2 ‰, and δD values ranged from −143.5 ‰ to −68.6 ‰. This finding is consistent with water vapor isotopic δ18O (−14.1 ‰ to −9.8 ‰) and δD (−97.2 ‰ to 69.1 ‰) values measured from 12 July to 7 August 2012, near the Bay of Bengal, although the local minimum at Matara station is below the minimum in the Bay of Bengal (Midhun et al., 2013).
The atmospheric water vapor line serves as an indicator of the humidity conditions at the vapor source and the fractionation processes along the transport path. The slope reflects the extent of vapor kinetic fractionation, while the intercept indicates the humidity levels at the vapor source. Comparing the local meteoric water line (LMWL) for δ18O and δD with the global meteoric water line (GMWL), we obtain a slope of < 8 during both monsoon periods (Fig. 3a). Seasonal variations are also visible in δ18O and δD distribution patterns. Daily averages of water vapor isotopic δ18O and δD demonstrate a strong correlation (r = 0.96, slope = 7.26) with a lower intercept at 4.68. The LMWL slope and intercept vary significantly between monsoon and non-monsoon seasons, peaking in the northeast monsoon with values of 7.3 and 3.86, and reaching a nadir in the southwest monsoon with 6.93 and 1.18, respectively. This suggests increased humidity over sea surface vapor sources from the northeast to southwest monsoon, attributed to heightened evaporation and reduced dynamic fractionation effects. During the northeast monsoon, LMWL slope and intercept are higher compared to other periods, indicating significant moisture recirculation.
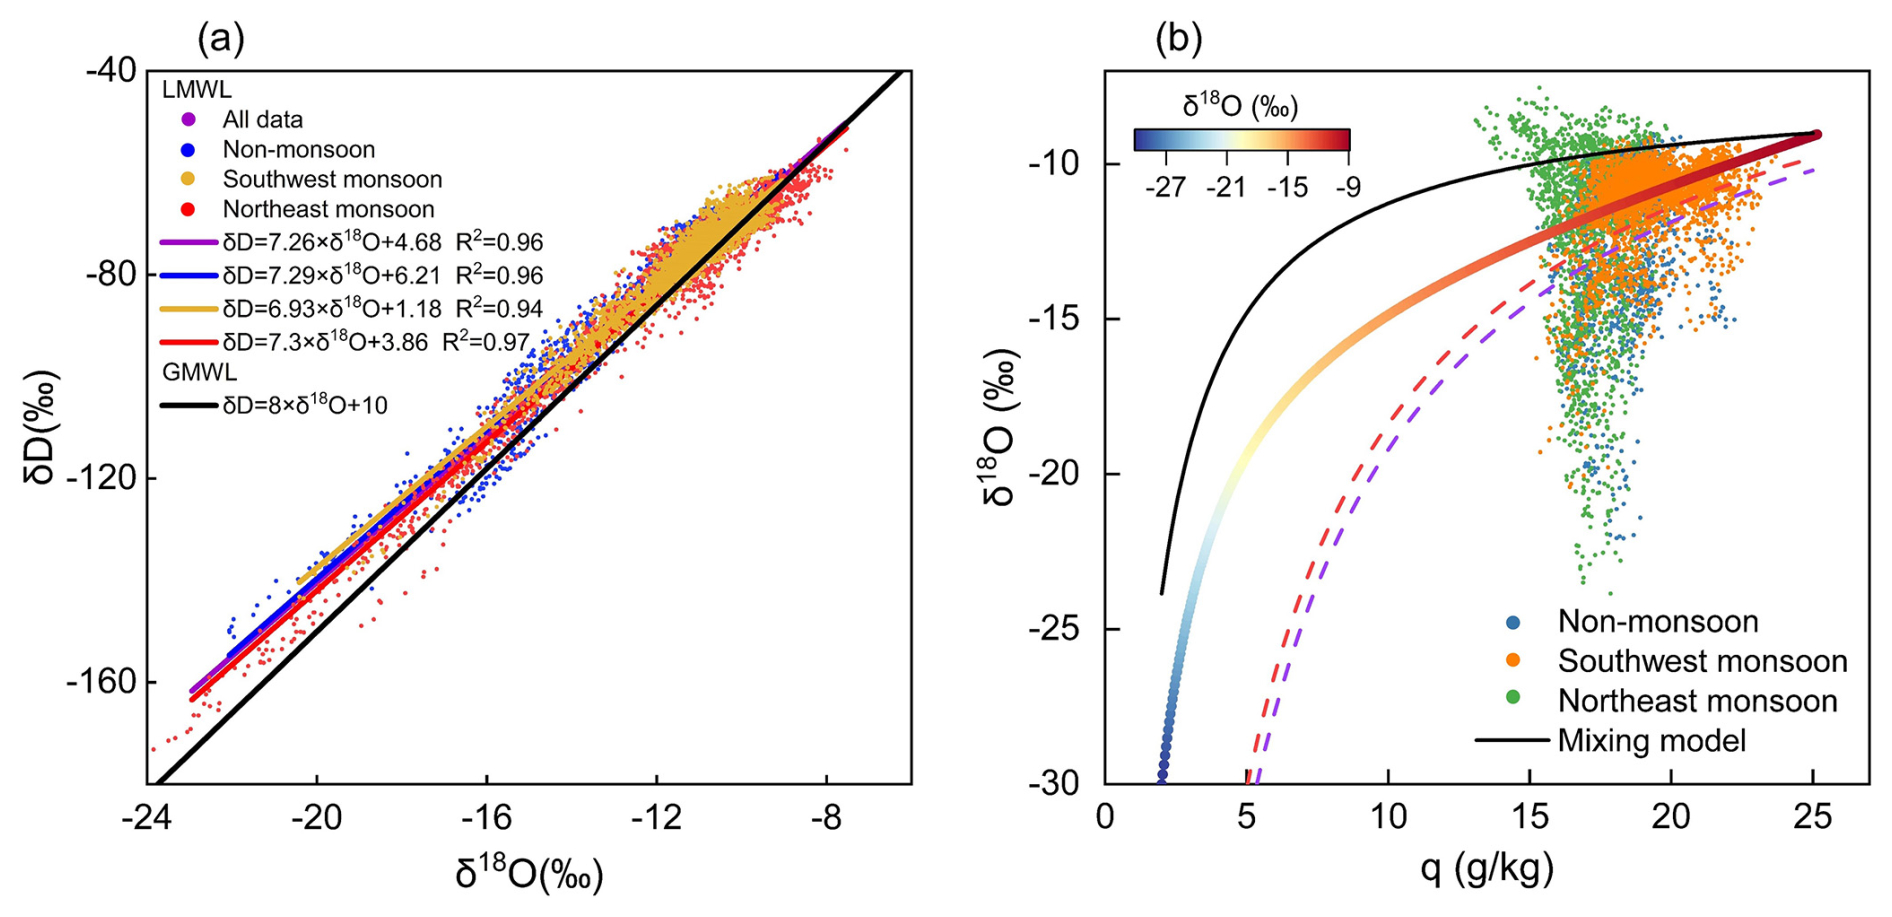
Figure 3(a) Co-variation of water vapor isotopic composition and meteorological parameters during different monsoon and non-monsoon periods between 1 March 2020 and 28 February 2021. The lines represent linear least-square regressions (LMWL and GMWL) of δD (‰) as a function of δ18O (‰). (b) Scatterplot of observed hourly water vapor isotopic δ18O vs. specific humidity (q). The dashed red and blue curves represent the Rayleigh distillation line during the southwest and northeast monsoon. The solid black curve represents the mixing line. The colored curve represents the MBL mixing line.
We found a significant negative relationship between d-excess and δ18O, with the rate of change for d-excess with δ18O being −0.68 ‰ ‰−1 (r = −0.55) (Fig. S5a). This rate is below the −0.05 ‰ ‰−1 value recorded at Bengaluru station (Rahul et al., 2016b). Seasonally, the correlation between both variables weakened during the southwest, northeast, and non-monsoon periods, with respective rates of change of −0.94 ‰ ‰−1 (r = −0.49), −0.69 ‰ ‰−1 (r = −0.54), and −0.65 ‰ ‰−1 (r = −0.44). Similar patterns are detected for temperature–d-excess and specific humidity–d-excess correlations, showing gradual increases in the slopes and intercepts of the water vapor line. Moreover, the concentrated distribution of vapor values during the southwest monsoon and the highly scattered distribution during the northeast monsoon are indicative of the corresponding seasonal distributions of the water vapor line.
Plots of q–δ18O (i.e., the theoretical Rayleigh distillation curves, the mixing line, and the MBL mixing curve) were used to assess mixing conditions during the study period (Fig. 3b). During the southwest monsoon, most measurements are clustered between the Rayleigh and mixing curve, indicating isotopic variability dominated by effects of precipitation and moisture mixing process. Limited water vapor measurements are scattered below the Rayleigh fractionation line, implying a discernible impact of raindrop re-evaporation. Similarly, during the non-monsoon period, most measurements lie between the Rayleigh and mixing curves, with only a few located below the Rayleigh line. During the northeast monsoon, δ18O spans from the upper to the lower extreme of the mixing and Rayleigh distillation curves. The measurements substantially deviate from the Rayleigh curve and show a higher depletion than predicted by the Rayleigh model, likely due to the influence of convective processes.
3.2 The variation characteristics of diurnal cycles
To look for diurnal cycles in isotopic composition and meteorological parameters, we analyzed hourly averages (Fig. 4c–e). All isotopic (δ18O, δD, and d-excess) and meteorological parameters exhibit strong diurnal variations during both monsoon and non-monsoon periods (Fig. 4). Overall, the diurnal variations in local meteorological parameters of solar radiation during the day and the resulting development of a boundary layer led to the increasing of temperature and wind speed between noon and afternoon, accompanied by a decrease in relative humidity due to significant evapotranspiration. At night, surface radiative cooling causes temperatures to drop, resulting in calmer conditions near the surface and gradual air saturation, indicating a relatively stable atmospheric boundary layer. During the southwest monsoon, δ18O, δD, relative humidity, wind speed, specific humidity, and BLH are generally higher than during the northeast and non-monsoon periods, while d-excess is lower. In the early morning, δ18O steadily decreases, reaching a minimum (−11.26 ‰) around sunrise (∼ 09:00 LT local time). Subsequently, it increases throughout the day, peaking (−10.87 ‰) in the afternoon (∼ 15:00 LT), yielding a diurnal fluctuation of merely 0.45 ‰. Increased specific humidity between 10:00 and 14:00 LT coincides with increasing air temperatures and wind speeds and decreasing relative humidity (Fig. 4c–f). BLH peaks between 14:00 and 16:00 LT, slightly later than other meteorological parameters. The same diurnal variations for each parameter were observed during the northeast monsoon, with maximum changes in δ18O and d-excess of 1.1 ‰ and 6.8 ‰, respectively. Specific humidity peaks between 10:00 and 16:00 LT, accompanied by increases in air temperature, wind speed, and BLH. After 16:00 LT, specific humidity decreases alongside isotopic δ values and other meteorological parameters. The d-excess peaks (14.81 ‰) at 09:00 LT and fluctuates until 23:00 LT, contrasting with the period from 04:00 to 09:00 LT (Fig. 4b). The d-excess exhibits a W-shaped variability, reaching similar highs at 09:00 and 21:00 LT. Specific humidity exhibits a diurnal variation that aligns closely with the δ18O pattern, reaching its minimum before sunrise and peaking around midday (10:00–15:00 LT). Between afternoon and evening, specific humidity remains relatively high and stable. The diurnal variation during the southwest and northeast monsoon periods are 1.28 and 2.32 g kg−1, respectively. Similarities with patterns observed at Lena River station in eastern Siberia (Bonne et al., 2020) suggest potential influences from moisture exchange between the atmosphere and ocean surface, particularly during the northeast monsoon.
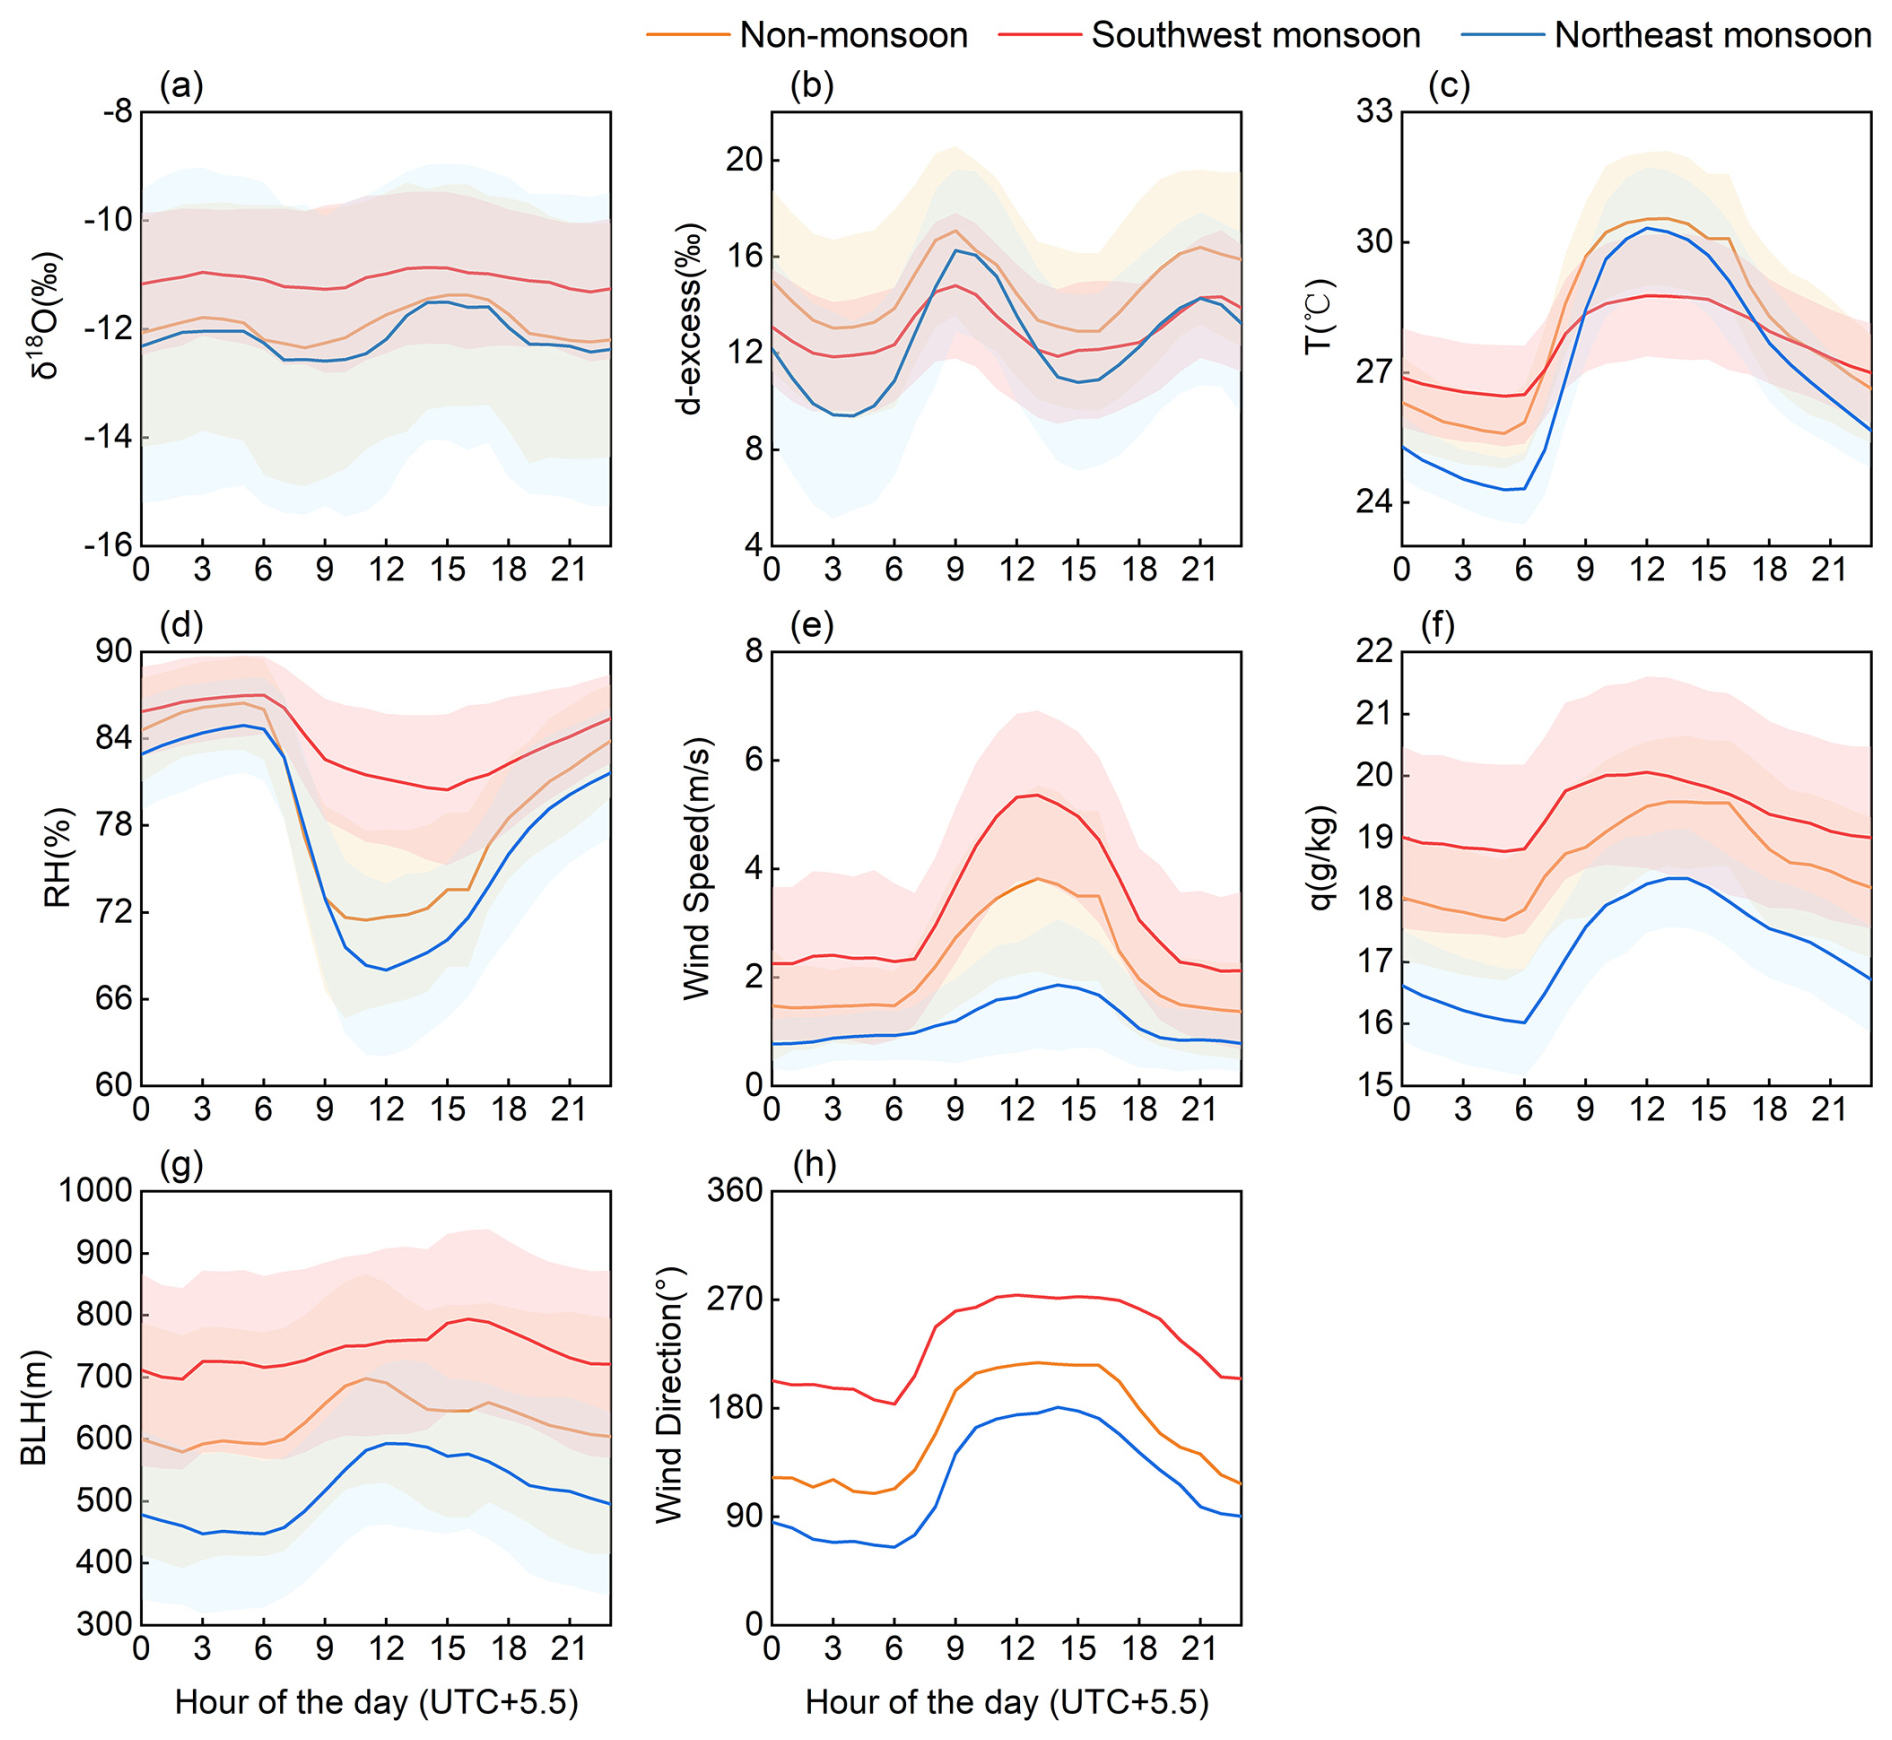
Figure 4Average diurnal cycles of (a) δ18O, (b) d-excess, (c) temperature (T), (d) relative humidity (RH), (e) wind speed, (f) specific humidity (q), (g) atmospheric boundary layer height (BLH), and (h) wind direction during the non-monsoon, southwest monsoon, and northeast monsoon periods. Shaded areas correspond to ± 1 standard deviation.
3.3 Sea surface evaporation conditions in the moisture source region
To be able to explore water vapor isotopic variations in the sea surface boundary layer, we must first understand the processes and factors that affect isotope variations during ocean surface water evaporation. The primary determinant governing water vapor stable isotope shifts across different regions is the regional moisture transport process, characterized by differences in isotopic variations in the moisture source region, variations in meteorological conditions during the evaporation processes, and divergences of the moisture transport pathways (Bonne et al., 2020). Thus, this section aims to identify factors that drive the seasonal variations of near-surface atmospheric water vapor stable isotopes at Matara, including water vapor origin, transmission routes, and sea surface evaporation conditions in the source regions.
To further understand the different seasonal relationships between δ18O, d-excess, and meteorological parameters, we analyzed potential seasonal differences between the main moisture sources using HYSPLIT. Backward trajectories from the southwest and northeast monsoons were spatially clustered and analyzed for changes in air mass heights and specific humidity (Fig. S6), facilitating the identification of air mass origins. The specific humidity values along the path have been gridded, and we define the end points of trajectories as indicative of the moisture sources. Trajectories that reach Matara during the southwest and northeast monsoons have different origins. During the southwest monsoon, wind directions span from 60 to 360°, and the main origin regions are therefore the Arabian Sea (AS) and Indian Ocean (Fig. 5a). Due to the northward movement of the warm South Equatorial Current, these winds gather significant amounts of moisture along the way, bringing heavy rainfall to Matara (Fig. 5a and b). Conversely, during the northeast monsoon, the main wind direction shifts to 0–225 and 330–360°, such that most trajectories originate in northeast India, where specific humidity is lower (overland), and only a short portion of the trajectory passes over the BoB. The long transport distance results in a greater depletion in water vapor isotopes once the air mass arrives at Matara station.
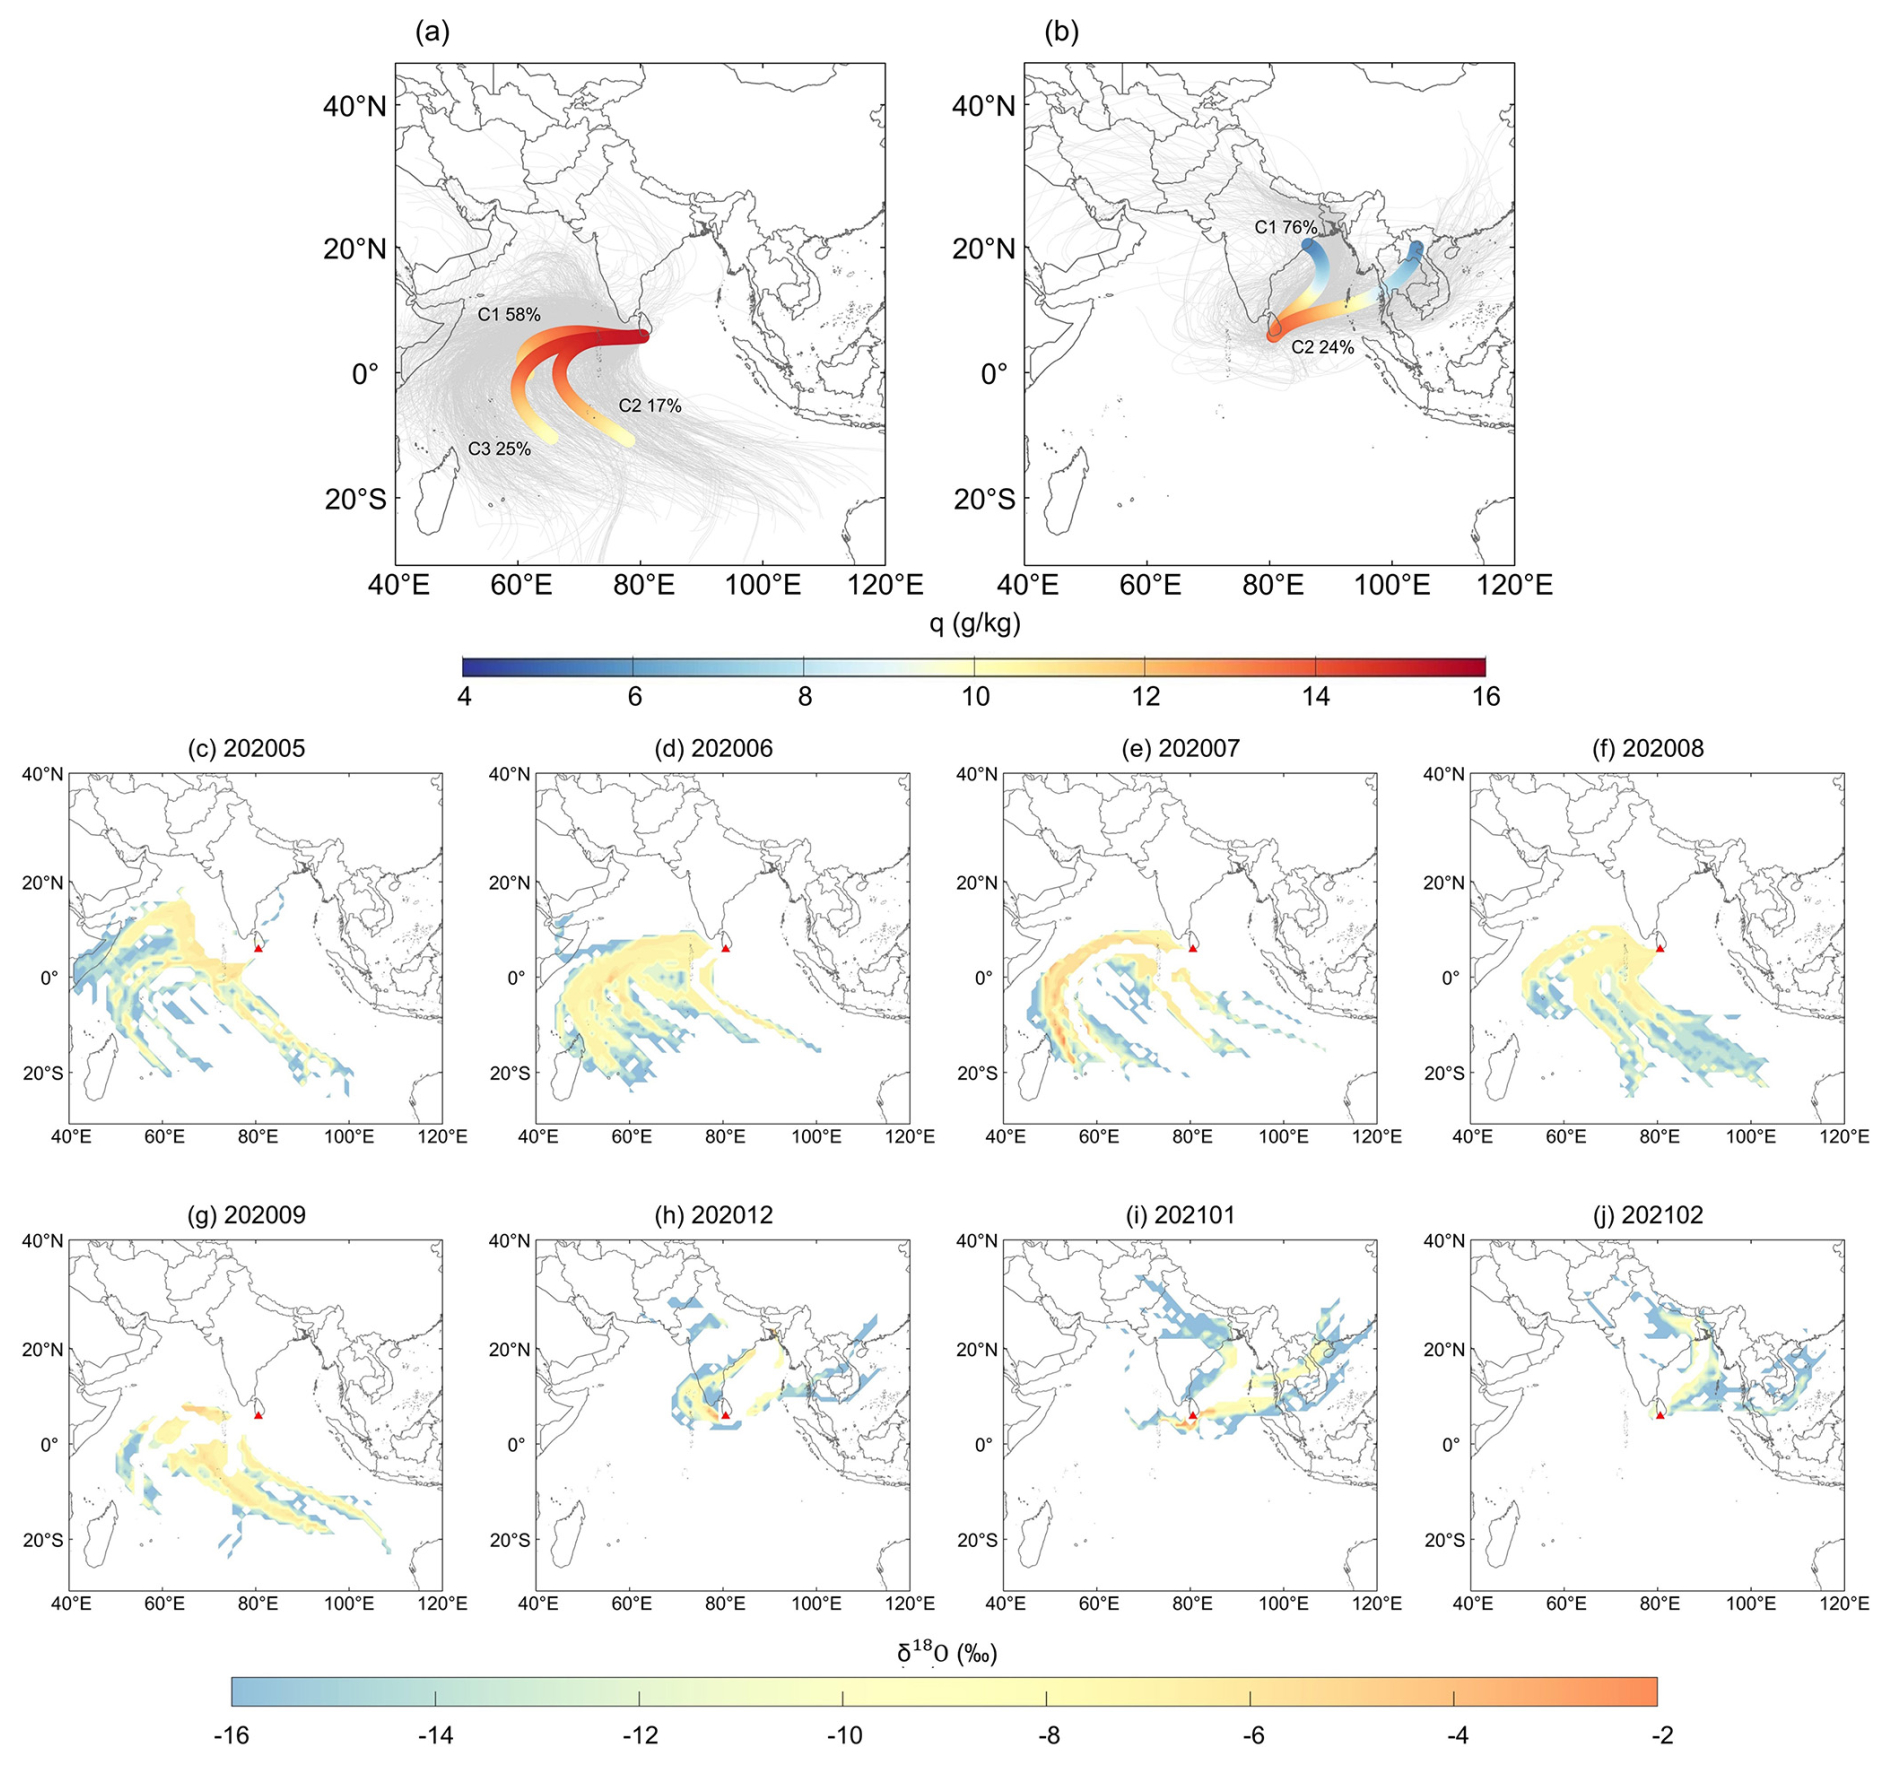
Figure 5Backward trajectories of water vapor tracks reaching Matara station and its four surrounding sites (heights: 50, 500, 1200, and 2000 m) during (a) the southwest monsoon and (b) the northeast monsoon. The changes in specific humidity (q) along each clustered trajectory are shown in color. Numbers indicate the proportion (%) of trajectories represented by each clustered trajectory. Monthly concentration fields of water vapor isotopic δ18O from a 168 h HYSPLIT simulation of backward trajectories are shown for the two monsoon seasons (c–j). The red triangle marks the study site.
Moisture from all sources shows seasonal variations, with δ18O values higher during the southwest monsoon than during the northeast monsoon. The shift in water vapor source from the AS in May to the southern Indian Ocean in September leads to δ18O-enriched water vapor from August to September. Enhanced convective activity and rainfall during the southwest monsoon result in δ18O depletion, while tropical storms and hurricanes also contribute to δ18O depletion.
To assess how seasonal shifts in moisture sources impact the isotopic composition of water vapor, we analyzed the relationship between specific humidity, isotope variations, and wind direction at Matara station (Fig. S7). During the southwest monsoon, wind directions were predominantly WNW, correlating with peak specific humidity and highest δ18O values and lowest d-excess, suggesting a westerly moisture source. Conversely, air masses from the east exhibited δ18O depletion and higher d-excess. The northeast monsoon brought drier air from the BoB, leading to specific humidity between 14 and 17 g kg−1 and significantly depleted δ18O values. These air masses likely experienced substantial isotopic fractionation during their overland passage.
We also investigated the influence of water vapor flux, evaporation, and precipitation on isotopic variations. The southwest monsoon saw lower evaporation rates compared to precipitation at Matara station, contrasting with the northern Indian Ocean and western BoB where evaporation surpassed precipitation. The northeast monsoon, influenced by moisture from the BoB and South Asia, showed higher evaporation rates and increasing water vapor flux. Overall, the water vapor flux and budget varied markedly between monsoons, with the upstream vapor budget significantly affecting stable isotope changes, particularly δ18O. The southwest monsoon's increased precipitation and moisture transport from the northeast led to enriched δ18O at Matara. In contrast, the northeast monsoon's moisture transport resulted in a washing effect, causing a gradual δ18O depletion due to continuous condensation and fractionation along the transport pathway (Figs. 6 and S8).
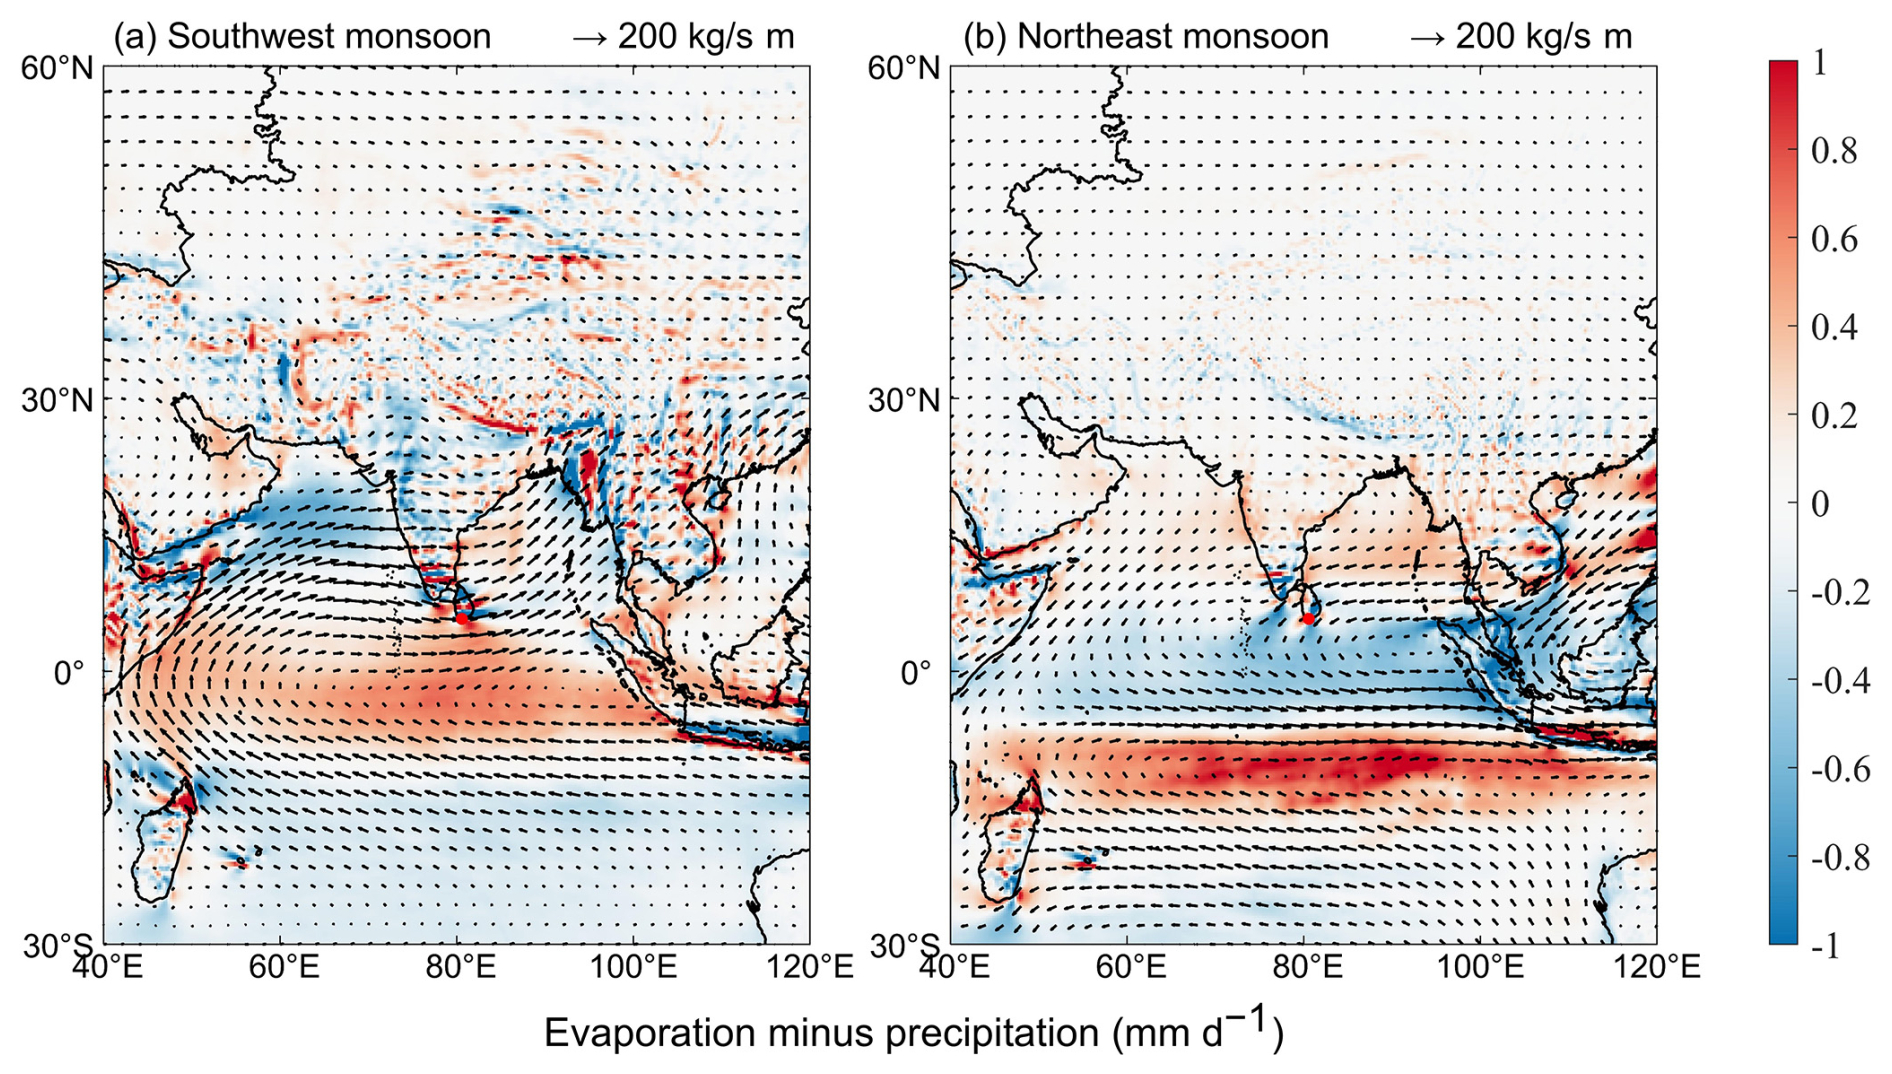
Figure 6Average water vapor flux and budget during the (a) southwest monsoon and (b) northeast monsoon, with the red dot marking Matara station.
The d-excess exhibits similar seasonal variations at Matara station, with lower values during the two monsoon seasons and higher values during the non-monsoon periods (Table 2, Fig. 4). This seasonal variation may stem from changes in relative humidity in the moisture source areas and further modifications during transport.
Ocean evaporation represents the starting point of the phase transformations that occur within the global water cycle. Identifying the isotopic variations and controlling factors of oceanic evaporation is essential for understanding isotopic shifts in the marine boundary layer. Previous coastal observational studies focusing on the marine boundary layer have confirmed a significant association between d-excess and RHSST (Pfahl and Wernli, 2009; Steen-Larsen et al., 2015). In cases where kinetic fractionation during air mass transport is either absent or minimal, d-excess can serve as an indicator of the moisture source region (Bonne et al., 2014).
The map of the moisture sources (Fig. 5) identified the Indian Ocean and BoB as the main source areas for moisture arriving at Matara station. To gauge the impact of more local influences, we investigated how changes in sea surface meteorological conditions in the sea around Matara station affects near-surface water vapor isotope concentrations (Fig. S9). During the southwest monsoon, RHSST in region A (located to the south of Matara between 3–7° N and 56–65° E) ranged from 64 % to 86 %, with SST fluctuating between 27.9 and 31.5 °C. During the northeast monsoon, RHSST in region B (located to the east of Matara between 6–8° N and 82–85°E) ranged from 54 % to 84 %, with SST fluctuating between 28.1 and 29.1 °C. In comparison with the southwest monsoon, RHSST is slightly lower, accompanied by less-pronounced variability in SST. The rate of change in d-excess under the influence of RHSST in the BoB (during the northeast monsoon) is −0.34 ‰ %−1. In comparison, the rate of change in d-excess with the RHSST of the northern Indian Ocean (during the southwest monsoon) is −0.32 ‰ %−1, suggesting that evaporation over the northern Indian Ocean significantly impacts local d-excess. Studies focused on the BoB's sea surface revealed that RHSST explains only 25 % of the d-excess variation (d-excess = (−0.55 ± 0.14) × RHSST + (56 ± 12); r = −0.5). The limited variation in relative humidity during the monsoon period led to a low correlation, indicating that monsoon moisture plays a crucial role in the isotopic composition of water vapor in the BoB (Midhun et al., 2013). Conversely, the observed relationship between near-surface water vapor d-excess at Matara and relative humidity in the surrounding oceanic region during the observational period, with correlation coefficients of −0.56 and −0.62 (p < 0.01), respectively (Fig. 7), reveals a marked negative correlation between d-excess and relative humidity in the nearby Indian Ocean and BoB, indicating that water vapor at Matara is predominantly supplied by nearby oceans. Notably, SST amplitude near the Matara station is smaller than the variations in near-surface air temperature (Fig. 2).
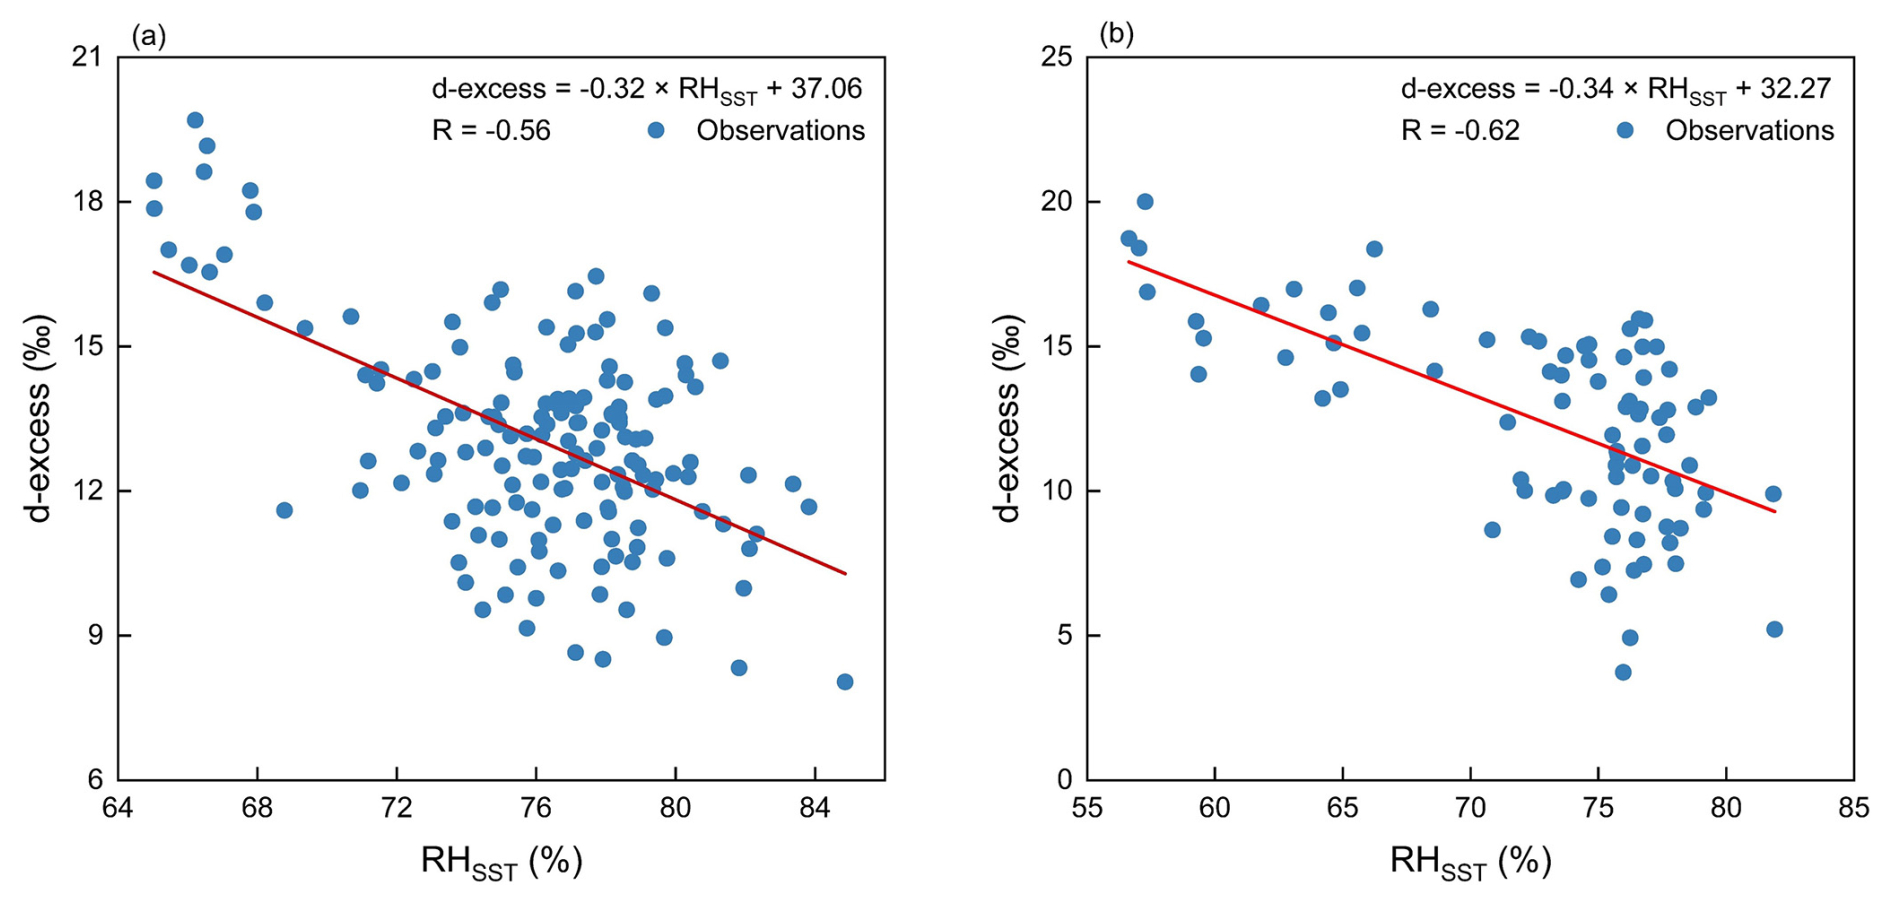
Figure 7Relationship between d-excess and RHSST during the (a) southwest monsoon and (b) northeast monsoon. Specific sea regions (Fig. S10) to the south (region A: 3–7° N and 56–65° E) and east (region B: 6–8° N and 82–85° E) of the observation station were selected to investigate the impact of sea surface meteorological conditions on near-surface water vapor isotopes during the two monsoon periods.
3.4 The influence of regional convective activity
In the equatorial tropics, OLR mainly results from convective activity and cloud cover, which can impact the stable isotope composition of precipitation (Ohring et al., 1984; Gao et al., 2013; Guo et al., 2017). Generally, higher OLR values are associated with weaker convective activity. Examining the correlation between stable isotopes of water vapor and OLR helps to understand the impact of convective activities along near-surface trajectories of water vapor stable isotopes at Matara station.
We calculated the spatiotemporal correlation between OLR and precipitation amount using the measured water vapor isotopic compositions at Matara station. Specifically, we calculated the average precipitation amount and average OLR for each grid point by averaging over different numbers of days (n = 1, 2, up to 30) preceding each day. Lower OLR values indicate the presence of deep convective clouds in this region and higher precipitation associated with lower δ values.
Figure 8a shows the strong positive correlation (red regions) between rainfall and δ18O during the southwest monsoon, mainly in the northern BoB and over India. This correlation strengthens and extends over wider areas as n increases from 1 to 5. Additionally, a strong negative correlation is evident in the northern Indian Ocean and southern Arabian Sea, reaching a maximum for n = 2 d. During the northeast monsoon, the spatial correlation distribution differs, with a negative correlation observed over the southern Indian Ocean and BoB (Fig. 8b), reaching a maximum for n = 5 d. Lower OLR values in the Arabian Sea and the northern part of the India Ocean correspond to a decrease in water vapor isotopic δ18O at Matara station (Fig. 8c, d). This pattern indicates that water vapor δ18O during the northeast monsoon period is influenced by convective activities over the southern BoB and Southeast Asian regions. The stronger this convective activity, the more depleted the air reaching Matara in water vapor isotopic δ18O.
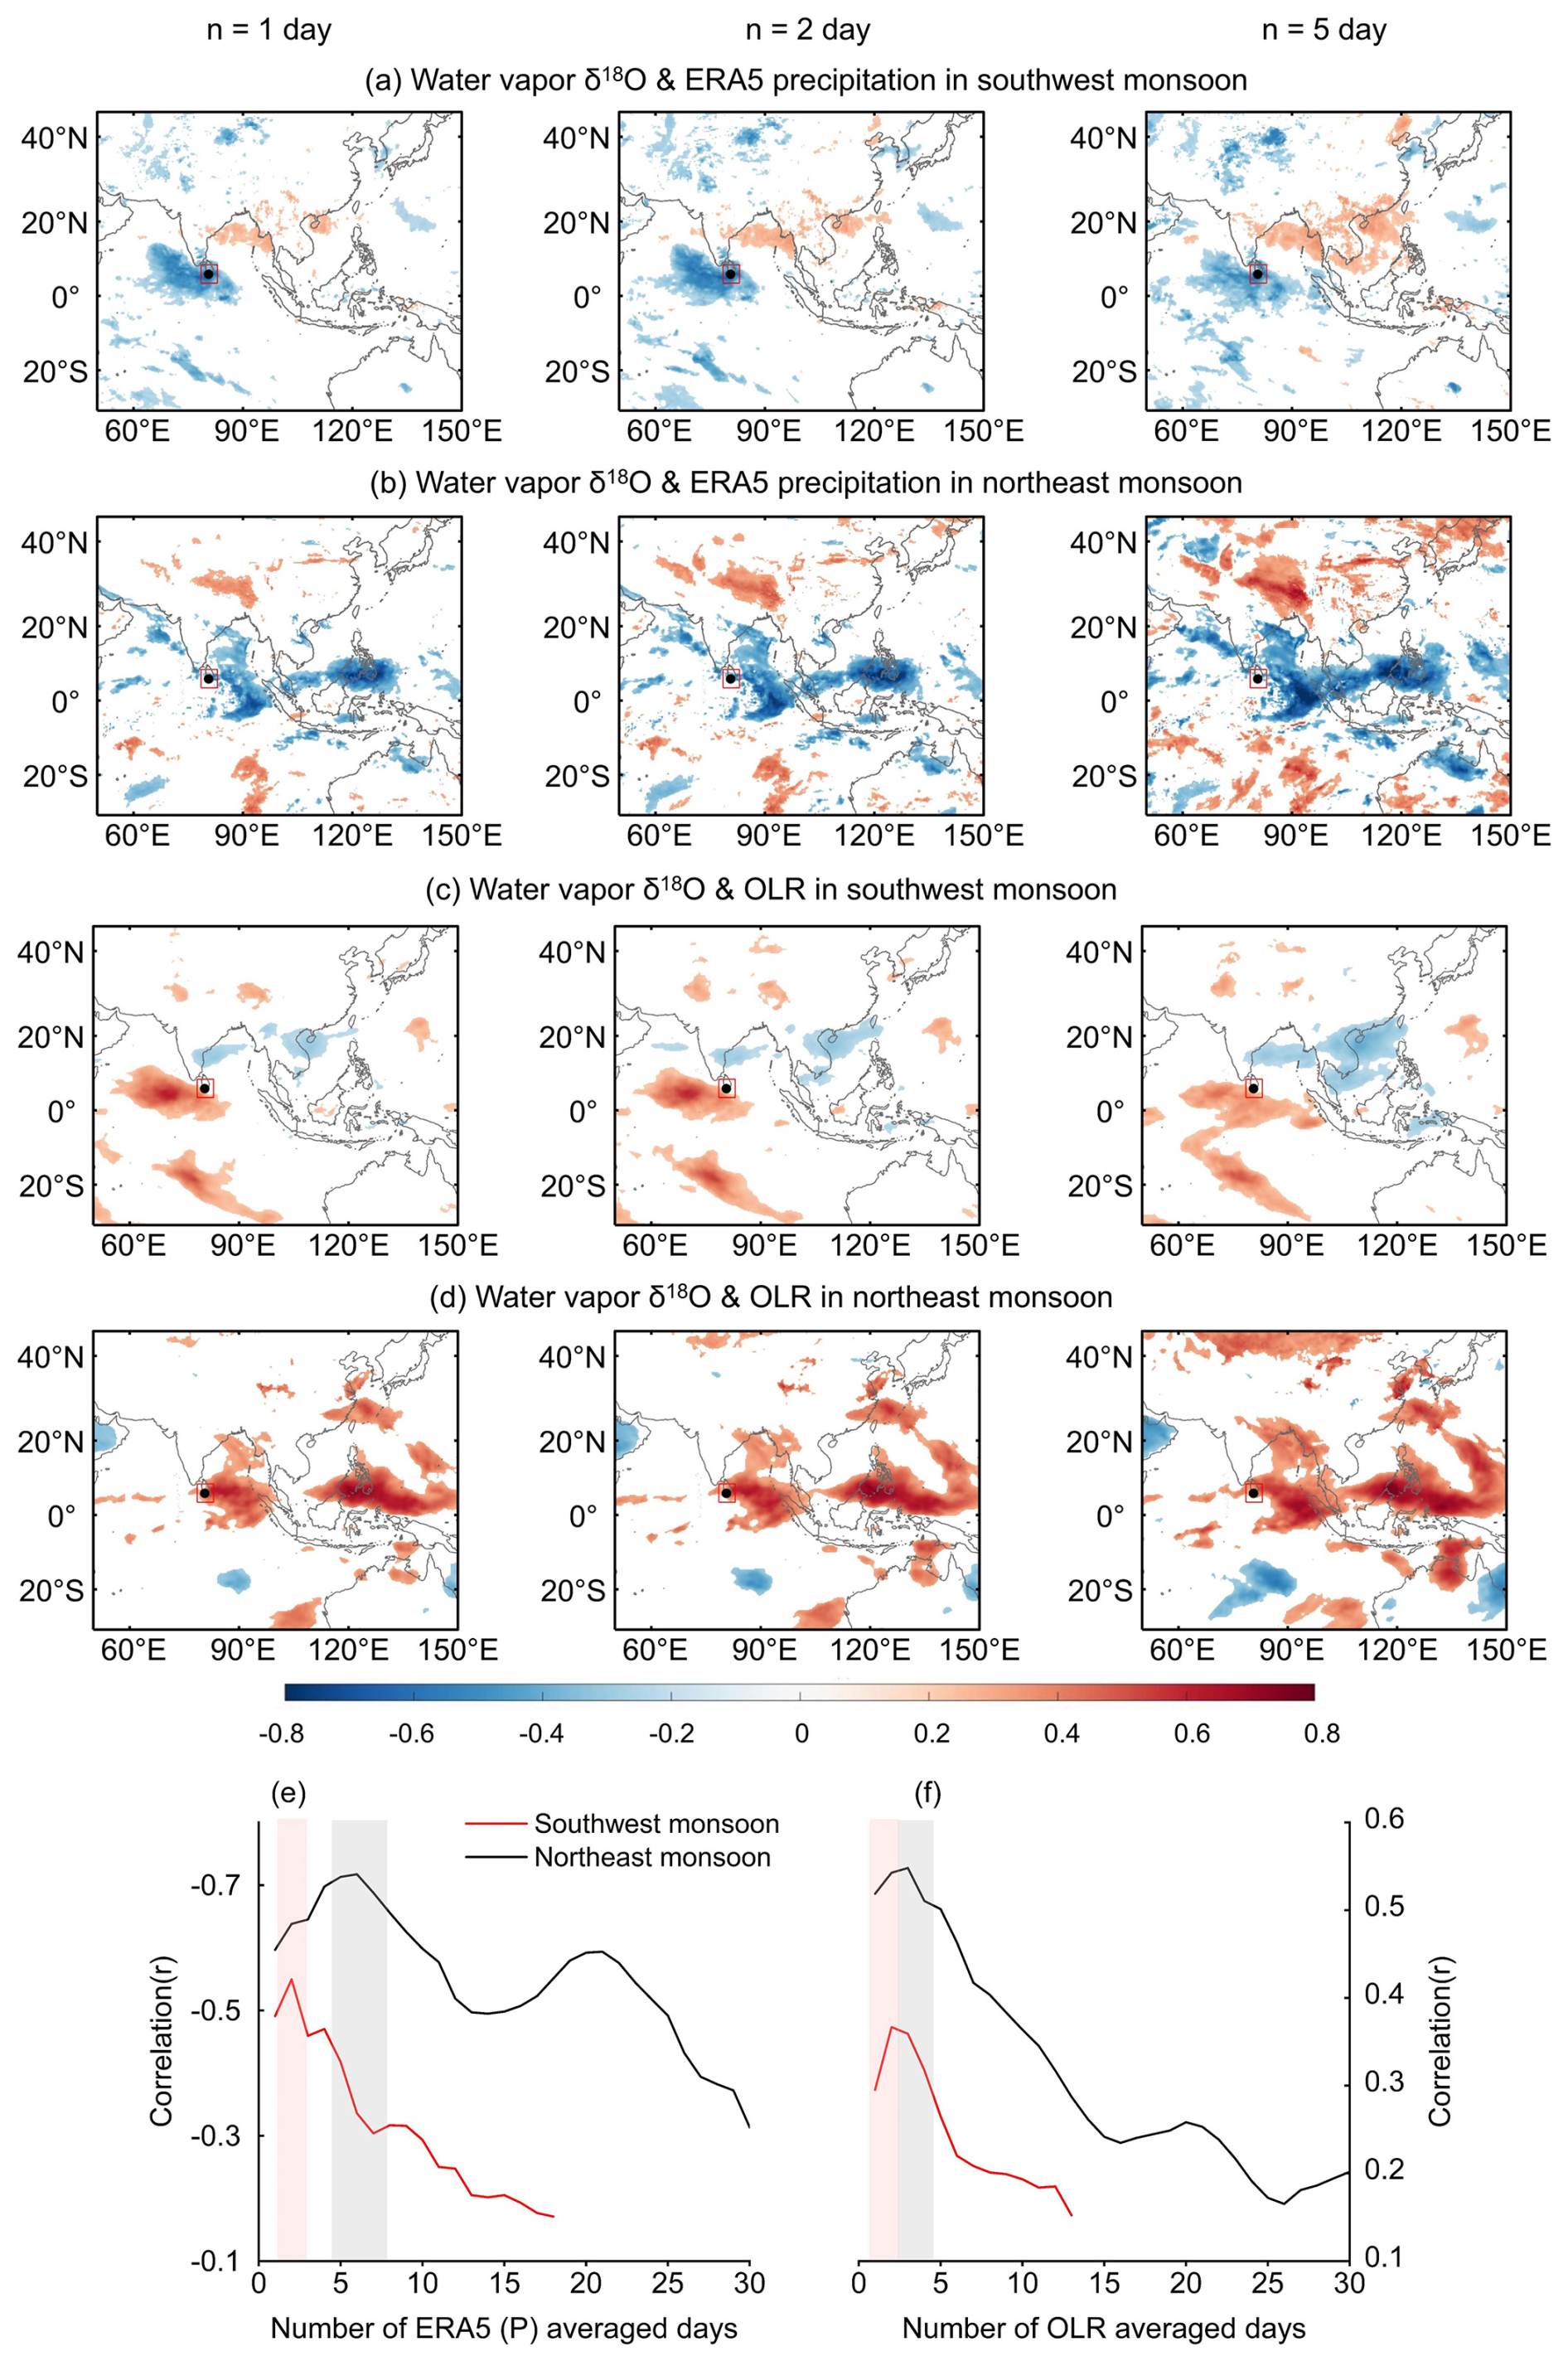
Figure 8Isotopic composition correlations with precipitation and OLR during monsoon periods. (a, b) Spatial correlations between water vapor δ18O and ERA5–precipitation for the southwest (a) and northeast (b) monsoons. (c, d) Spatial correlations between water vapor δ18O and average OLR for the southwest (c) and northeast (d) monsoons. (e) Correlation between δ18O and ERA5-precipitation (P) across different averaging periods (n = 1 to 30 d) for southwest (red line) and northeast (black line) monsoons. (f) Correlation between δ18O and OLR across southwest (red line) and northeast (black line) monsoons over varying averaging periods. Red areas indicate significant negative correlations, while grey areas indicate significant positive correlations. Note that only correlations surpassing the 99 % confidence threshold are displayed. The red box denotes the Matara station's region of interest.
To examine the correlation between water vapor isotopic δ18O and local precipitation (Fig. 8e) and OLR (Fig. 8f), we selected a small region of 5° × 5° around Matara and calculated the temporal correlation for all grid points as described above. The results show that the correlation with precipitation is negative during both monsoon seasons as expected. The depletion of low-level water vapor δ18O is related to the transport and deposition of water vapor into the lower atmosphere through convective activity (Kurita, 2013; Midhun et al., 2013; Lekshmy et al., 2014). The air masses are resupplied to the convective system through moisture recycling. This results in a strong correlation between the isotopic composition of water vapor and the convective activity during the previous day (Fig. 8f). Residual water vapor is more depleted in strong convective systems. In our study, the correlation reaches a high value after about 5 d, indicating that the convective activity is sufficiently established to affect the isotopic composition of water vapor. In fact, the correlation (for p < 0.05 and in absolute terms) is high for all n values, with maxima of about 0.37 for n = 2 d during the southwest monsoon and 0.55 for n = 2 to 5 d during the northeast monsoon.
The OLR correlation peaks at smaller timescales (approximately n = 2–5 d; Fig. 8f) than precipitation (n = 3–7 d). We attribute this difference to the effect of cloud distribution on precipitation and OLR. OLR has a stronger response to shallow clouds, while precipitation is more responsive to both deep convective clouds and shallow clouds (Masunaga and Kummerow, 2006; Schumacher, 2006). The OLR minimum occurs when thunderstorm clouds result in more precipitation. Additionally, deep thunderstorm clouds, with short lifetimes and consequently very low OLR (corresponding to highly depleted water vapor isotopic δ), exhibit a short memory effect on the correlation (peak occurs at smaller timescales) (Gambheer and Bhat, 2000).
This study presented the results from a 1-year (March 2020 to February 2021) in situ measurement campaign of near-surface atmospheric water vapor isotopes (δ18O, δD) at Matara station, Sri Lanka. These high-temporal-resolution water vapor isotopic composition and meteorological observations provided a good opportunity to investigate the water vapor isotopic dynamics from synoptic to seasonal scales. The variability of water vapor isotopes at Matara station is influenced by local meteorological factors, oceanic evaporation processes, and regional convective activities, depending on the water sources and moisture transport. The measurements provided insights into multi-timescale variations in near-surface atmospheric water vapor in an equatorial region and provided information about the interactions between large-scale atmospheric moisture transport and oceanic evaporation.
During both monsoon periods, specific humidity and stable water isotope composition showed a clear diurnal cycle at Matara station, primarily due to the significant contribution of local evapotranspiration to the overall moisture balance. In equatorial regions, seasonal variations in stable water vapor isotopes are largely governed by changes in moisture sources and the transport processes. Ponmudi station, located in southern India (Lekshmy et al., 2018), shares many characteristics with Matara station, in that it is also a coastal city, influenced by both the southwest and northeast monsoons. During the summer, moisture sources for air arriving at Ponmudi are mostly located in the southern Arabian Sea and equatorial Indian Ocean, with relative humidity levels exceeding 70 %. This high relative humidity, combined with a continuous supply of moisture from the Arabian Sea, results in significant rainfall in the Ponmudi region, exceeding 2040 mm yr−1.
Fluctuations of water vapor stable isotopes at shorter (weather) timescales are closely associated with regional convective activities. Research conducted on precipitation and water vapor stable isotopes at Bengaluru, another coastal city in southern India, indicates that local meteorological parameters do not influence isotope ratios (Rahul et al., 2016b). Rather, these ratios are affected by the integrated regional convective activity, characterized by large-scale rainfall or outgoing longwave radiation flux. Like Matara station, Bengaluru is also affected by both the southwest and northeast monsoons. The observed depletion in heavy isotopes may be due to the influx of moisture from the Bay of Bengal, depleted due to the rainout effect, mixing with air that has traveled overland crossing the Indian subcontinent.
Overall, the long-term monitoring of water vapor stable isotopes in South Asian equatorial regions could highlight the importance of both seasonal and sub-seasonal (weather-scale) variations, mostly due to changes in moisture sources and processes that occur during the air mass transport at the circulation scale. Matara station served as a good location to study the effects of moisture transport processes over the Indian Ocean. We could also identify seasonal patterns that in general agree with previous findings for tropical equatorial regions (Midhun et al., 2013; Rahul et al., 2016b; Lekshmy et al., 2018).
One-year (March 2020 to February 2021) in situ meteorological observations and measurements of water vapor isotopic composition were conducted at Matara station, Sri Lanka. Meteorological parameters exhibited diurnal variations during both monsoon and non-monsoon periods. The new dataset provides detailed information on the isotopic composition of near-surface atmospheric water vapor, which complements the local precipitation isotopic dataset by including periods without rainfall. Additionally, it enables a comparative analysis of water vapor isotopic variations across the two monsoon periods. Research findings indicate that during the northeast monsoon diurnal fluctuations in δ18O, temperature, and specific humidity were observed, with maximum values reaching 1.1 ‰, 6.0 °C, and 2.3 g kg−1, respectively. In contrast, during the southwest monsoon these parameters exhibit only small-magnitude fluctuations of 0.45 ‰, 2.3 °C, and 1.3 g kg−1. Atmospheric temperature affects isotopic composition through its effect on isotope fractionation. Additionally, a weak seasonal variability in near-surface water vapor isotopes was observed, with δ18O typically showing high values (−11.1 ‰) during the monsoon period and low values (−11.9 ‰) during the non-monsoon period. The d-excess exhibited a lower value (12.7 ‰) during the monsoon period than during the non-monsoon period (14.7 ‰).
An evaluation of water vapor sources using HYSPLIT indicates small but notable seasonal variations in air mass origins. The source regions differ seasonally, with the northern Indian Ocean serving as the primary source during the southwest monsoon, and the Bay of Bengal dominating as the source during the northeast monsoon. Significant variations in water vapor flux and budget occur during the monsoon periods, with upstream water vapor budgets exerting a pronounced impact on isotopic signatures, especially δ18O. Evaporation over the northern Indian Ocean significantly impacts local d-excess at Matara. Contrary to previous research indicating a weak correlation (r = −0.5) between d-excess in the Bay of Bengal and the sea surface relative humidity (RHSST) (Midhun et al., 2013), we found a slightly stronger negative correlation with RHSST during the monsoon periods, with values of −0.61 and −0.62 (p < 0.01) for the northern Indian Ocean and Bay of Bengal, respectively. This study underscores the capability of near-surface d-excess to reflect the evaporation conditions over these oceanic source regions. However, the impact of raindrop evaporation is yet to be thoroughly explored.
Consistent with previous research (Rahul et al., 2016b), large-scale rainfall and regional convective activity (OLR) significantly impact isotope ratios at Matara station. Notably, significant changes in δ18O were observed during a heavy rainfall event in July 2020, with a sharp decline in isotopic values from −10.4 ‰ to −20.4 ‰ within 20 h. During the southwest monsoon, strong cloud cover and high humidity over the ocean may lead to δ18O enrichment at Matara station. The water vapor isotope compositions observed during the southwest monsoon are similar as those observed in the Bay of Bengal (Midhun et al., 2013). The depleted of water vapor isotope values at Matara station in autumn and winter is consistent with findings from other coastal stations, such as Bengaluru, Ponmudi, and Wayanad (Rahul et al., 2016b; Lekshmy et al., 2018). Current investigations into convection activities and evaporation processes in tropical and subtropical regions offer fresh perspectives on the stable isotopic composition of water vapor in these regions (Landshuter et al., 2024; Galewsky et al., 2023; Bailey et al., 2015). The re-evaporation of raindrops in deep convection (Risi et al., 2019) and the formation of ice clouds in tropical regions (de Vries et al., 2022), which influence the tropopause, provide critical insights into the factors governing isotopic variability during shallow and deep convection. Simulations that incorporate entrainment and mixing processes highlight the importance of accurately quantifying the effects of hydrometeor evaporation on water vapor stable isotopes (Risi et al., 2019; Benetti et al., 2015). These findings form a basis for deeper exploration of the distinctive isotopic characteristics of tropical water vapor during the different monsoon periods. Our study is the first to point out that the correlation between OLR and δ18O peaks around 2–5 d before the observation, which we attribute to the impacts of cloud distribution.
This study examines the origins of moisture arriving at Matara station and the associated atmospheric transport, with a focus on the substantial impact of cloud distribution on the stable isotopic composition of water vapor, driven by regional convection. Therefore, these insights are crucial for refining our grasp of isotopic dynamics, particularly in relation to cloud microphysics and atmospheric mixing processes within the broader water cycle (de Vries et al., 2022). This comprehensive dataset containing synchronous water vapor isotope and meteorological measurements offers extensive opportunities for further analyses, e.g., of the typical weather events, atmospheric patterns, and ocean–atmosphere interactions in the equatorial region. Given that only 1 year of observations is currently available, there is a pressing need for supplementary and sustained measurements of water vapor stable isotopes in this region to support multi-year studies and interannual variabilities. Furthermore, given the anticipated changes in numerous weather and hydrological processes in equatorial regions, future research should explore the impacts of typical weather events, as well as ocean–atmosphere interactions, to deepen our understanding of extreme events and large-scale atmospheric modes (e.g., El Niño–Southern Oscillation (ENSO), Madden–Julian Oscillation (MJO), and Indian Ocean Dipole (IOD)). Considering the temporal and spatial variability in the dynamics of tropical ocean–atmosphere systems, high-resolution isotope models and satellite datasets should be combined for a more comprehensive analysis in the future.
The ERA5 dataset is the latest reanalysis dataset published by the European Centre for Medium-Range Weather Forecasts (ECMWF) available at https://doi.org/10.24381/cds.adbb2d47 (Hersbach et al., 2023). The Global Data Assimilation System (GDAS) has been published by the US National Oceanic and Atmospheric Administration (NOAA) (ftp://arlftp.arlhq.noaa.gov/archives/gdas1, NOAA, 2024). The water vapor isotopic composition dataset is available in the Zenodo at https://doi.org/10.5281/zenodo.12736892 (Gao and Wu, 2025).
The supplement related to this article is available online at https://doi.org/10.5194/acp-25-4013-2025-supplement.
WYQ: data curation, formal analysis, writing (original draft preparation). GJ: data curation, conceptualization, methodology, supervision, writing (review and editing), funding acquisition. ZAB: writing (review and editing), project administration. NXW: data curation. LYG: data curation. RD: project administration. GTP: project administration. SAHR: data curation.
The contact author has declared that none of the authors has any competing interests.
Publisher’s note: Copernicus Publications remains neutral with regard to jurisdictional claims made in the text, published maps, institutional affiliations, or any other geographical representation in this paper. While Copernicus Publications makes every effort to include appropriate place names, the final responsibility lies with the authors.
This work was funded by The Second Tibetan Plateau Scientific Expedition and Research (STEP) program (grant no. 2019QZKK0208) and the National Natural Science Foundation of China (grant nos. 41922002 and 41988101-03), as well as the Innovation Program for Young Scholars of TPESER (QNCX2022ZD-01). We thank staff in the China-Sri Lanka Joint Center for Education and Research, Charith Madusanka Widanage, and Di Dai for their invaluable support and assistance with measurements.
This research has been supported by the Second Tibetan Plateau Scientific Expedition and Research (STEP) program (grant no. 2019QZKK0208) and the National Natural Science Foundation of China (grant no. 41922002), as well as the Innovation Program for Young Scholars of TPESER (QNCX2022ZD-01).
This paper was edited by Franziska Aemisegger and reviewed by three anonymous referees.
Aemisegger, F. and Sjolte, J.: A Climatology of Strong Large-Scale Ocean Evaporation Events. Part II: Relevance for the Deuterium Excess Signature of the Evaporation Flux, J. Climate, 31, 7313–7336, https://doi.org/10.1175/JCLI-D-17-0592.1, 2018.
Aemisegger, F., Sturm, P., Graf, P., Sodemann, H., Pfahl, S., Knohl, A., and Wernli, H.: Measuring variations of δ18O and δ2H in atmospheric water vapour using two commercial laser-based spectrometers: an instrument characterisation study, Atmos. Meas. Tech., 5, 1491–1511, https://doi.org/10.5194/amt-5-1491-2012, 2012.
Angert, A., Lee, J. E., and Yakir, D.: Seasonal variations in the isotopic composition of near-surface water vapour in the eastern Mediterranean, Tellus B, 60, 674–684, https://doi.org/10.1111/j.1600-0889.2008.00357.x, 2008.
Bailey, A., Aemisegger, F., Villiger, L., Los, S. A., Reverdin, G., Quiñones Meléndez, E., Acquistapace, C., Baranowski, D. B., Böck, T., Bony, S., Bordsdorff, T., Coffman, D., de Szoeke, S. P., Diekmann, C. J., Dütsch, M., Ertl, B., Galewsky, J., Henze, D., Makuch, P., Noone, D., Quinn, P. K., Rösch, M., Schneider, A., Schneider, M., Speich, S., Stevens, B., and Thompson, E. J.: Isotopic measurements in water vapor, precipitation, and seawater during EUREC4A, Earth Syst. Sci. Data, 15, 465–495, https://doi.org/10.5194/essd-15-465-2023, 2023.
Bailey, H. L., Kaufman, D. S., Henderson, A. C. G., and Leng, M. J.: Synoptic scale controls on the δ18O in precipitation across Beringia, Geophys. Res. Lett., 42, 4608–4616, https://doi.org/10.1002/2015GL063983, 2015.
Bandara, U., Agarwal, A., Srinivasan, G., Shanmugasundaram, J., and Jayawardena, I. M. S.: Intercomparison of gridded precipitation datasets for prospective hydrological applications in Sri Lanka, Int. J. Climatol., 42, 3378–3396, https://doi.org/10.1002/joc.7421, 2022.
Bedaso, Z. and Wu, S.-Y.: Daily precipitation isotope variation in Midwestern United States: Implication for hydroclimate and moisture source, Sci. Total Environ., 713, 136631, https://doi.org/10.1016/j.scitotenv.2020.136631, 2020.
Benetti, M., Aloisi, G., Reverdin, G., Risi, C., and Sèze, G.: Importance of boundary layer mixing for the isotopic composition of surface vapor over the subtropical North Atlantic Ocean, J. Geophys. Res.-Atmos., 120, 2190–2209, https://doi.org/10.1002/2014JD021947, 2015.
Benetti, M., Lacour, J.-L., Sveinbjörnsdóttir, A. E., Aloisi, G., Reverdin, G., Risi, C., Peters, A. J., and Steen-Larsen, H. C.: A Framework to Study Mixing Processes in the Marine Boundary Layer Using Water Vapor Isotope Measurements, Geophys. Res. Lett., 45, 2524–2532, https://doi.org/10.1002/2018GL077167, 2018.
Benetti, M., Reverfdin, G., Pierre, C., Merlivat, L., Risi, C., Steen-Larsen, H. C., and Vimeux, F.: Deuterium excess in marine water vapor: Dependency on relative humidity and surface wind speed during evaporation, J. Geophys. Res.-Atmos., 119, 584–593, https://doi.org/10.1002/2013JD020535, 2014.
Bhattacharya, S., Pal, M., Panda, B., and Pradhan, M.: Spectroscopic investigation of hydrogen and triple-oxygen isotopes in atmospheric water vapor and precipitation during Indian monsoon season, Isot. Environ. Healt. S., 57, 368–385, https://doi.org/10.1080/10256016.2021.1931169, 2021.
Blossey, P. N., Kuang, Z., and Romps, D. M.: Isotopic composition of water in the tropical tropopause layer in cloud-resolving simulations of an idealized tropical circulation, J. Geophys. Res.-Atmos., 115, D24309, https://doi.org/10.1029/2010JD014554, 2010.
Bonne, J.-L., Masson-Delmotte, V., Cattani, O., Delmotte, M., Risi, C., Sodemann, H., and Steen-Larsen, H. C.: The isotopic composition of water vapour and precipitation in Ivittuut, southern Greenland, Atmos. Chem. Phys., 14, 4419–4439, https://doi.org/10.5194/acp-14-4419-2014, 2014.
Bonne, J.-L., Behrens, M., Meyer, H., Kipfstuhl, S., Rabe, B., Schönicke, L., Steen-Larsen, H. C., and Werner, M.: Resolving the controls of water vapour isotopes in the Atlantic sector, Nat. Commun., 10, 1632, https://doi.org/10.1038/s41467-019-09242-6, 2019.
Bonne, J.-L., Meyer, H., Behrens, M., Boike, J., Kipfstuhl, S., Rabe, B., Schmidt, T., Schönicke, L., Steen-Larsen, H. C., and Werner, M.: Moisture origin as a driver of temporal variabilities of the water vapour isotopic composition in the Lena River Delta, Siberia, Atmos. Chem. Phys., 20, 10493–10511, https://doi.org/10.5194/acp-20-10493-2020, 2020.
Bookhagen, B. and Burbank, D. W.: Toward a complete Himalayan hydrological budget: Spatiotemporal distribution of snowmelt and rainfall and their impact on river discharge, J. Geophys. Res., 115, F03019, https://doi.org/10.1029/2009JF001426, 2010.
Cai, Z., Tian, L., and Bowen, G. J.: ENSO variability reflected in precipitation oxygen isotopes across the Asian Summer Monsoon region, Earth Planet. Sc. Lett., 475, 25–33, https://doi.org/10.1016/j.epsl.2017.06.035, 2017.
Cai, Z. and Tian, L.: Atmospheric Controls on Seasonal and Interannual Variations in the Precipitation Isotope in the East Asian Monsoon Region, J. Climate, 29, 1339–1352, https://doi.org/10.1175/JCLI-D-15-0363.1, 2016.
Chang, C. P., Wang, Z., and Hendon, H.: The Asian winter monsoon, in: The Asian Monsoon, Springer Praxis Books, Springer, Berlin, Heidelberg, 89–127, https://doi.org/10.1007/3-540-37722-0_3, 2006.
Craig, H. and Gordon, L. I.: Deuterium and oxygen 18 variations in the ocean and the marine atmosphere, in: Stable Isotopes in Oceanographic Studies and Paleotemperatures, edited by: Tongiorgi, E., Lab. Geol. Nucl., Pisa, Italy, 9–130, 1965.
Curry, J. A. and Webster, P. J.: Thermodynamics of atmospheres and oceans, Academic Press, Elsevier, New York, 65, 471 pp., 1999.
Dai, D., Gao, J., Steen-Larsen, H. C., Yao, T., Ma, Y., Zhu, M., and Li, S.: Continuous monitoring of the isotopic composition of surface water vapor at Lhasa, southern Tibetan Plateau, Atmos. Res., 264, 105827, https://doi.org/10.1016/j.atmosres.2021.105827, 2021.
Dansgaard, W. F.: Stable Isotopes in Precipitation, Tellus, 16, 436–468, https://doi.org/10.3402/tellusa.v16i4.8993, 1964.
Delattre, H., Vallet-Coulomb, C., and Sonzogni, C.: Deuterium excess in the atmospheric water vapour of a Mediterranean coastal wetland: regional vs. local signatures, Atmos. Chem. Phys., 15, 10167–10181, https://doi.org/10.5194/acp-15-10167-2015, 2015.
de Vries, A. J., Aemisegger, F., Pfahl, S., and Wernli, H.: Stable water isotope signals in tropical ice clouds in the West African monsoon simulated with a regional convection-permitting model, Atmos. Chem. Phys., 22, 8863–8895, https://doi.org/10.5194/acp-22-8863-2022, 2022.
Dhar, O. N. and Rakhecha, P. R.: Foreshadowing Northeast Monsoon Rainfall Over Tamil Nadu, India, Mon. Weather Rev., 111, 109, https://doi.org/10.1175/1520-0493(1983)111<0109:FNMROT>2.0.CO;2, 1983.
Diekmann, C. J., Schneider, M., Knippertz, P., de Vries, A. J., Pfahl, S., Aemisegger, F., Dahinden, F., Ertl, B., Khosrawi, F., Wernli, H., and Braesicke, P.: A Lagrangian Perspective on Stable Water Isotopes During the West African Monsoon, J. Geophys. Res.-Atmos., 126, e2021JD034895, https://doi.org/10.1029/2021JD034895, 2021.
Gadgil, S.: The Indian Monsoon and Its Variability, Rev. Earth Pl. Sc., 31, 429–467, https://doi.org/10.1146/annurev.earth.31.100901.141251, 2003.
Galewsky, J. and Hurley, J. V.: An advection-condensation model for subtropical water vapor isotopic ratios, J. Geophys. Res. Atmos., 115, D16116, https://doi.org/10.1029/2009JD013651, 2010.
Galewsky, J., Schneider, M., Diekmann, C., Semie, A., Bony, S., Risi, C., Emanuel, K., and Brogniez, H.: The Influence of Convective Aggregation on the Stable Isotopic Composition of Water Vapor, AGU Advances, 4, e2023AV000877, https://doi.org/10.1029/2023AV000877, 2023.
Galewsky, J., Steen-Larsen, H. C., Field, R. D., Worden, J., Risi, C., and Schneider, M.: Stable isotopes in atmospheric water vapor and applications to the hydrologic cyclem, Rev. Geophys., 54, 809–865, https://doi.org/10.1002/2015RG000512, 2016.
Gambheer, A. V. and Bhat, G. S.: Life Cycle Characteristics of Deep Cloud Systems over the Indian Region Using INSAT-1B Pixel Data, Mon. Weather Rev., 128, 4071–4083, https://doi.org/10.1175/1520-0493(2000)129<4071:LCCODC>2.0.CO;2, 2000.
Gao, J. and Wu, Y.: One-year Continuous Observations of Near-Surface Atmospheric Water Vapor Stable Isotopes at Matara, Sri Lanka, Version v1, Zenodo [data set], https://doi.org/10.5281/zenodo.12736892, 2025.
Gao, J., Masson-Delmotte, V., Risi, C., He, Y., and Yao, T.: What controls precipitation δ18O in the southern Tibetan Plateau at seasonal and intra-seasonal scales? A case study at Lhasa and Nyalam, Tellus B, 65, 21043, https://doi.org/10.3402/tellusb.v65i0.21043, 2013.
Gao, Y., Li, X., Leung, L. R., Chen, D., and Xu, J.: Aridity changes in the Tibetan Plateau in a warming climate, Environ. Res. Lett., 9, 104013, https://doi.org/10.1088/1748-9326/10/3/034013, 2014.
Gat, J.: Oxygen and hydrogen isotopes in the hydrologic cycle, Annu. Rev. Earth Pl. Sc., 24, 225–262, https://doi.org/10.1146/ANNUREV.EARTH.24.1.225, 1996.
Goff, J. A. and Gratch, S.: Low-pressure properties of water from −160 to 212 F, Transactions of the American Society of Heating and Ventilating Engineers, 52, 95–122, 1946.
Goswami, B. N., Venugopal, V., Sengupta, D., Madhusoodanan, M. S., and Xavier, P. K.: Increasing Trend of Extreme Rain Events Over India in a Warming Environment, Science, 314, 1442–1445, https://doi.org/10.1126/science.1132027, 2006.
Graf, P., Wernli, H., Pfahl, S., and Sodemann, H.: A new interpretative framework for below-cloud effects on stable water isotopes in vapour and rain, Atmos. Chem. Phys., 19, 747–765, https://doi.org/10.5194/acp-19-747-2019, 2019.
Guo, X., Tian, L., Wen, R., Yu, W., and Qu, D.: Controls of precipitation δ18O on the northwestern Tibetan Plateau: A case study at Ngari station, Atmos. Res., 189, 141–151, https://doi.org/10.1016/j.atmosres.2017.02.004, 2017.
Hersbach, H., Bell, B., Berrisford, P., Hirahara, S., Horányi, A., Muñoz Sabater, J., Nicolas, J., Peubey, C., Radu, R., Schepers, D., Simmons, A., Soci, C., Abdalla, S., Abellan, X., Balsamo, G., Bechtold, P., Biavati, G., Bidlot, J., Bonavita, M., and Thépaut, J. N.: The ERA5 global reanalysis, Q. J. Roy. Meteor. Soc., 146, 1999–2049, https://doi.org/10.1002/qj.3803, 2020.
Hersbach, H., Bell, B., Berrisford, P., Biavati, G., Horányi, A., Muñoz Sabater, J., Nicolas, J., Peubey, C., Radu, R., Rozum, I., Schepers, D., Simmons, A., Soci, C., Dee, D., and Thépaut, J.-N.: ERA5 hourly data on single levels from 1940 to present, Copernicus Climate Change Service (C3S) Climate Data Store (CDS) [data set], https://doi.org/10.24381/cds.adbb2d47, 2023.
Hsu, Y.-K., Holsen, T. M., and Hopke, P. K.: Comparison of hybrid receptor models to locate PCB sources in Chicago, Atmos. Environ., 37, 545–562, https://doi.org/10.1016/S1352-2310(02)00886-5, 2003.
Jayasena, H. A. H., Chandrajith, R., and Dissanayake, C. B.: Spatial variation of isotope composition in precipitation in a tropical environment: a case study from the Deduru Oya river basin, Sri Lanka, Hydrol. Process., 22, 4565–4570, https://doi.org/10.1002/hyp.7060, 2008.
Kaushal, N., Breitenbach, S. F. M., Lechleitner, F. A., Sinha, A., Tewari, V. C., Ahmad, S. M., Berkelhammer, M., Band, S., Yadava, M., Ramesh, R., and Henderson, G. M.: The Indian Summer Monsoon from a Speleothem δ18O Perspective – A Review, Quaternary, 1, 29, https://doi.org/10.3390/quat1030029, 2018.
Kurita, N.: Origin of Arctic water vapor during the ice-growth season, Geophys. Res. Lett., 38, L02709, https://doi.org/10.1029/2010GL046064, 2011.
Kurita, N.: Water isotopic variability in response to mesoscale convective system over the tropical ocean, J. Geophys. Res.-Atmos., 118, 10376–10390, https://doi.org/10.1002/jgrd.50754, 2013.
Landshuter, N., Aemisegger, F., and Mölg, T.: Stable Water Isotope Signals and Their Relation to Stratiform and Convective Precipitation in the Tropical Andes, J. Geophys. Res.-Atmos., 129, e2023JD040630, https://doi.org/10.1029/2023JD040630, 2024.
Lekshmy, P. R., Midhun, M., and Ramesh, R.: Influence of stratiform clouds on δD and δ18O of monsoon water vapour and rain at two tropical coastal stations, J. Hydrol., 563, 354–362, https://doi.org/10.1016/j.jhydrol.2018.06.001, 2018.
Lekshmy, P. R., Midhun, M., and Ramesh, R.: Role of moisture transport from Western Pacific region on water vapor isotopes over the Bay of Bengal, Atmos. Res., 265, 105895, https://doi.org/10.1016/j.atmosres.2021.105895, 2022.
Lekshmy, P. R., Midhun, M., Ramesh, R., and Jani, R. A.: 18O depletion in monsoon rain relates to large scale organized convection rather than the amount of rainfall, Sci. Rep., 4, 5661, https://doi.org/10.1038/srep05661, 2014.
Lekshmy, P. R., Midhun, M., and Ramesh, R.: Spatial variation of amount effect over peninsular India and Sri Lanka: Role of seasonality, Geophys. Res. Lett., 42, 5500–5507, https://doi.org/10.1002/2015GL064517, 2015.
Liu, J., Ding, M., and Xiao, C.: Review on atmospheric water vapor isotopic observation and research: theory, method and modeling, Progress In Gography, 34, 340–353, https://doi.org/10.11820/dlkxjz.2015.03.009, 2015.
Liu, X. and Chen, B.: Climatic warming in the Tibetan Plateau during recent decades, Int. J. Climatol., 20, 1729–1742, https://doi.org/10.1002/1097-0088(20001130)20:14<1729::AID-JOC556>3.0.CO;2-Y, 2000.
Malmgren, B. A., Hulugalla, R., Hayashi, Y., and Mikami, T.: Precipitation trends in Sri Lanka since the 1870s and relationships to El Niño-southern oscillation, Int. J. Climatol., 23, 1235–1252, https://doi.org/10.1002/joc.921, 2003.
Masunaga, H. and Kummerow, C. D.: Observations of tropical precipitating clouds ranging from shallow to deep convective systems, Geophys. Res. Lett., 33, L16805, https://doi.org/10.1029/2006GL026547, 2006.
Merlivat, L. and Jouzel, J.: Global climatic interpretation of the deuterium-oxygen 18 relationship for precipitation, J. Geophys. Res.-Oceans, 84, 5029–5033, https://doi.org/10.1029/JC084iC08p05029, 1979.
Midhun, M., Lekshmy, P. R., and Ramesh, R.: Hydrogen and oxygen isotopic compositions of water vapor over the Bay of Bengal during monsoon, Geophys. Res. Lett., 40, 6324–6328, https://doi.org/10.1002/2013GL058181, 2013.
Ohring, G., Gruber, A., and Ellingson, R.: Satellite Determinations of the Relationship between Total Longwave Radiation Flux and Infrared Window Radiance, J. Appl. Meteorol. Clim., 23, 416–425, https://doi.org/10.1175/1520-0450(1984)023<0416:SDOTRB>2.0.CO;2, 1984.
Permana, D. S., Thompson, L. G., and Setyadi, G.: Tropical West Pacific moisture dynamics and climate controls on rainfall isotopic ratios in southern Papua, Indonesia, J. Geophys. Res.-Atmos., 121, 2222–2245, https://doi.org/10.1002/2015JD023893, 2016.
Pfahl, S. and Wernli, H.: Air parcel trajectory analysis of stable isotopes in water vapor in the eastern Mediterranean, J. Geophys. Res., 113, D20104, https://doi.org/10.1029/2008JD009839, 2008.
Pfahl, S. and Wernli, H.: Lagrangian simulations of stable isotopes in water vapor: An evaluation of nonequilibrium fractionation in the Craig-Gordon model, J. Geophys. Res. Atmos., 114, D20108, https://doi.org/10.1029/2009JD012054, 2009.
Rahul, P., Ghosh, P., and Bhattacharya, S. K.: Rainouts over the Arabian Sea and Western Ghats during moisture advection and recycling explain the isotopic composition of Bangalore summer rains, J. Geophys. Res.-Atmos., 121, 6148–6163, https://doi.org/10.1002/2015JD024579, 2016a.
Rahul, P., Ghosh, P., Bhattacharya, S. K., and Yoshimura, K.: Controlling factors of rainwater and water vapor isotopes at Bangalore, India: Constraints from observations in 2013 Indian monsoon, J. Geophys. Res.-Atmos., 121, 13936–13952, https://doi.org/10.1002/2016JD025352, 2016b.
Ranjan, S., Al, R., Keesari, T., Singh, V., Kumar, P., and Manish Leuenberger, M.: Triple Water Vapour-Isotopologues Record from Chhota Shigri, Western Himalaya, India: A Unified Interpretation based on δ17O, δ18O, δD and Comparison to Meteorological Parameters, Front. Earth Sci., 8, 599–632, https://doi.org/10.3389/feart.2020.599632, 2021.
Risi, C., Bony, S., and Vimeux, F.: Influence of convective processes on the isotopic composition (δ18O and δD) of precipitation and water vapor in the tropics: 2. Physical interpretation of the amount effect, J. Geophys. Res.-Atmos., 113, 306, https://doi.org/10.1029/2008JD009943, 2008.
Risi, C., Galewsky, J., Reverdin, G., and Brient, F.: Controls on the water vapor isotopic composition near the surface of tropical oceans and role of boundary layer mixing processes, Atmos. Chem. Phys., 19, 12235–12260, https://doi.org/10.5194/acp-19-12235-2019, 2019.
Risi, C., Muller, C., and Blossey, P.: What controls the water vapor isotopic composition near the surface of tropical oceans? Results from an analytical model constrained by large-eddy simulations, J. Adv. Model. Earth Sy., 12, e2020MS002106, https://doi.org/10.1029/2020MS002106, 2020.
Salamalikis, V., Argiriou, A. A., and Dotsika, E.: Stable isotopic composition of atmospheric water vapor in Patras, Greece: A concentration weighted trajectory approach, Atmos. Res., 152, 93–104, https://doi.org/10.1016/j.atmosres.2014.02.021, 2015.
Saranya, P., Krishan, G., Rao, M. S., Kumar, S., and Kumar, B.: Controls on water vapor isotopes over Roorkee, India: Impact of convective activities and depression systems, J. Hydrol., 557, 679–687, https://doi.org/10.1016/j.jhydrol.2017.12.061, 2018.
Schumacher, C.: Shallow tropical convection: How often does it rain?, B. Am. Meteorol. Soc., 87, 23–25, 2006.
Singh, P. and Bengtsson, L.: Hydrological sensitivity of a large Himalayan basin to climate change, Hydrol. Process., 18, 2363–2385, https://doi.org/10.1002/hyp.1468, 2004.
Srivastava, R., Ramesh, R., Gandhi, N., Jani, R. A., and Singh, A. K.: Monsoon onset signal in the stable oxygen and hydrogen isotope ratios of monsoon vapor, Atmos. Environ., 108, 117–124, https://doi.org/10.1016/j.atmosenv.2015.02.062, 2015.
Steen-Larsen, H. C., Johnsen, S. J., Masson-Delmotte, V., Stenni, B., Risi, C., Sodemann, H., Balslev-Clausen, D., Blunier, T., Dahl-Jensen, D., Ellehøj, M. D., Falourd, S., Grindsted, A., Gkinis, V., Jouzel, J., Popp, T., Sheldon, S., Simonsen, S. B., Sjolte, J., Steffensen, J. P., Sperlich, P., Sveinbjörnsdóttir, A. E., Vinther, B. M., and White, J. W. C.: Continuous monitoring of summer surface water vapor isotopic composition above the Greenland Ice Sheet, Atmos. Chem. Phys., 13, 4815–4828, https://doi.org/10.5194/acp-13-4815-2013, 2013.
Steen-Larsen, H. C., Masson-Delmotte, V., Hirabayashi, M., Winkler, R., Satow, K., Prié, F., Bayou, N., Brun, E., Cuffey, K. M., Dahl-Jensen, D., Dumont, M., Guillevic, M., Kipfstuhl, S., Landais, A., Popp, T., Risi, C., Steffen, K., Stenni, B., and Sveinbjörnsdottír, A. E.: What controls the isotopic composition of Greenland surface snow?, Clim. Past, 10, 377–392, https://doi.org/10.5194/cp-10-377-2014, 2014.
Steen-Larsen, H. C., Sveinbjörnsdottir, A. E., Jonsson, T., Ritter, F., Bonne, J.-L., Masson-Delmotte, V., Sodemann, H., Blunier, T., Dahl-Jensen, D., and Vinther, B. M.: Moisture sources and synoptic to seasonal variability of North Atlantic water vapor isotopic composition, J. Geophys. Res.-Atmos., 120, 5757–5774, https://doi.org/10.1002/2015JD023234, 2015.
Steen-Larsen, H. C., Risi, C., Werner, M., Yoshimura, K., and Masson-Delmotte, V.: Evaluating the skills of isotope-enabled general circulation models against in situ atmospheric water vapor isotope observations, J. Geophys. Res.-Atmos., 122, 246–263, https://doi.org/10.1002/2016JD025443, 2017.
Stewart, M. K.: Stable isotope fractionation due to evaporation and isotopic exchange of falling waterdrops: Applications to atmospheric processes and evaporation of lakes, J. Geophys. Res., 80, 1133–1146, https://doi.org/10.1029/JC080i009p01133, 1975.
Sturm, P. and Knohl, A.: Water vapor δ2H and δ18O measurements using off-axis integrated cavity output spectroscopy, Atmos. Meas. Tech., 3, 67–77, https://doi.org/10.5194/amt-3-67-2010, 2010.
Thompson, L. G., Davis, M. E., Mosley-Thompson, E., Beaudon, E., Porter, S. E., Kutuzov, S., Lin, P. N., Mikhalenko, V. N., and Mountain, K. R.: Impacts of Recent Warming and the 2015/2016 El Niño on Tropical Peruvian Ice Fields, J. Geophys. Res.-Atmos., 122, 12688–12701, https://doi.org/10.1002/2017JD026592, 2017.
Thurnherr, I. and Aemisegger, F.: Disentangling the impact of air–sea interaction and boundary layer cloud formation on stable water isotope signals in the warm sector of a Southern Ocean cyclone, Atmos. Chem. Phys., 22, 10353–10373, https://doi.org/10.5194/acp-22-10353-2022, 2022.
Thurnherr, I., Hartmuth, K., Jansing, L., Gehring, J., Boettcher, M., Gorodetskaya, I., Werner, M., Wernli, H., and Aemisegger, F.: The role of air–sea fluxes for the water vapour isotope signals in the cold and warm sectors of extratropical cyclones over the Southern Ocean, Weather Clim. Dynam., 2, 331–357, https://doi.org/10.5194/wcd-2-331-2021, 2021.
Thurnherr, I., Kozachek, A., Graf, P., Weng, Y., Bolshiyanov, D., Landwehr, S., Pfahl, S., Schmale, J., Sodemann, H., Steen-Larsen, H. C., Toffoli, A., Wernli, H., and Aemisegger, F.: Meridional and vertical variations of the water vapour isotopic composition in the marine boundary layer over the Atlantic and Southern Ocean, Atmos. Chem. Phys., 20, 5811–5835, https://doi.org/10.5194/acp-20-5811-2020, 2020.
Uemura, R., Matsui, Y., Yoshimura, K., Motoyam, H., and Yoshida, N.: Evidence of deuterium excess in water vapor as an indicator of ocean surface conditions, J. Geophys. Res.-Atmos., 113, D19114, https://doi.org/10.1029/2008JD010209, 2008.
US National Oceanic and Atmospheric Administration (NOAA): Global Data Assimilation System (GDAS1), ftp://arlftp.arlhq.noaa.gov/archives/gdas1, last access: 19 January 2024.
Villiger, L. and Aemisegger, F.: Water isotopic characterisation of the cloud–circulation coupling in the North Atlantic trades – Part 2: The imprint of the atmospheric circulation at different scales, Atmos. Chem. Phys., 24, 957–976, https://doi.org/10.5194/acp-24-957-2024, 2024.
Wahl, S., Steen-Larsen, H. C., Hughes, A., Dietrich, L. J., Zuhr, A., Behrens, M., Faber, A. K., and Hörhold, M.: Atmosphere-snow exchange explains surface snow isotope variability, Geophys. Res. Lett., 49, e2022GL099529, https://doi.org/10.1029/2022gl099529, 2022.
Wallace, J. M. and Hobbs, P. V.: 3 – Atmospheric Thermodynamics, in: Atmospheric Science, 2nd edn., Academic Press, San Diego, 63–111, https://doi.org/10.1016/B978-0-12-732951-2.50008-9, 2006.
Webster, P. J., Magana, V. O., Palmer, T. N., Shukla, J., Tomas, R. A., Yanai, M., and Yasunari, T.: Monsoons: Processes, predictability, and the prospects for prediction, J. Geophys. Res.-Oceans, 103, 14451–14510, https://doi.org/10.1029/97JC02719, 1998.
Xu, T., Pang, H., Zhan, Z., Zhang, W., Guo, H., Wu, S., and Hou, S.: Water vapor isotopes indicating rapid shift among multiple moisture sources for the 2018–2019 winter extreme precipitation events in southeastern China, Hydrol. Earth Syst. Sci., 26, 117–127, https://doi.org/10.5194/hess-26-117-2022, 2022.
Yao, T., Thompson, L. G., Mosbrugger, V., Zhang, F., Ma, Y., Luo, T., Xu, B., Yang, X., Joswiak, D. R., Wang, W., Joswiak, M. E., Devkota, L. P., Tayal, S., Jilani, R., and Chen, F.: Third Pole Environment (TPE), Environ. Dev., 7, 52–64, https://doi.org/10.1016/j.envdev.2012.04.002, 2012.