the Creative Commons Attribution 4.0 License.
the Creative Commons Attribution 4.0 License.
 | 01 Apr 2025
Measurement report: Sources and meteorology influencing highly time-resolved PM2.5 trace elements at three urban sites in the extremely polluted Indo-Gangetic Plain in India
Ashutosh K. Shukla
Shamitaksha Talukdar
Vishnu Murari
Sreenivas Gaddamidi
Manousos-Ioannis Manousakas
Vipul Lalchandani
Kuldeep Dixit
Vinayak M. Ruge
Peeyush Khare
Mayank Kumar
Vikram Singh
Neeraj Rastogi
Suresh Tiwari
Atul K. Srivastava
Dilip Ganguly
Kaspar Rudolf Daellenbach
André S. H. Prévôt
High-time-resolution aerosol measurements across various Indo-Gangetic Plain (IGP) regions are critical due to these regions' dense populations, intense industrial activities, recurring pollution episodes, and agricultural practices, as well as the associated health impacts and broader climate implications of aerosol. However, studies (mostly offline) have been predominantly concentrated in the upper IGP (U-IGP), with limited spatial coverage across the central IGP (C-IGP). This study aims to bridge the gap by examining both U-IGP and C-IGP regions, offering an in-depth analysis of elemental concentrations, source apportionment, inter-regional comparisons, seasonal variations, meteorological influences, and health risks through high-resolution Xact measurements conducted at three urban locations. During the colder seasons, elements such as sulfur (S), chlorine (Cl), and potassium (K) were found to dominate elemental PM2.5 concentrations, while the warm seasons showed notable changes in aluminum (Al), silica (Si), strontium (Sr), and barium (Ba) concentrations. These variations underscore the influence of meteorological conditions and different emission sources on pollution levels. From a health perspective, average levels of carcinogenic elements (lead (Pb), nickel (Ni), arsenic (As), and chromium (Cr)) were usually kept below reference levels. However, Pb concentrations exceeded these thresholds by 40 %–50 % during both periods in the U-IGP, largely attributed to coal combustion and lead smelting activities. Using the Multilinear Engine 2 (ME-2) solver, positive matrix factorization (PMF) deconvolved Cl-rich, coal combustion, Cu-rich, dust, solid fuel combustion 1 (SFC1), SFC2, and S-rich components. In both IGP regions, Cl-rich sources, S-rich sources, and SFC1 dominated the elemental sources, with differences observed in their relative contributions, indicating the influence of regional emissions. The role of meteorology in elemental PM2.5 variations during both clean and polluted episodes in the IGP regions was observed. During pollution episodes, the relative contribution of Cl-rich sources increased when PM2.5 concentrations showed a sharp increase as compared to clean periods, especially during cold periods, indicating the role of emissions from trash burning (plastic and PVC) and steel industries along with favorable meteorological conditions in the formation and accumulation of pollutants. During the warm period, the relative contribution of Cl-rich sources in the C-IGP is less, but during the cold period, both the U-IGP and the C-IGP have significant Cl-rich source contributions (44 %), indicating the role of chlorine in extreme haze air pollution in the whole IGP region. During warm periods, high-pollution events occurred across the IGP with major contributions from SFC1 (crop residue burning), indicating that severe pollution events also depend on seasonal emission sources despite less favorable meteorological conditions. These findings provide valuable insights into the spatial and temporal dynamics of elemental pollution across the IGP, offering a robust foundation for devising targeted mitigation strategies and regulatory policies to safeguard public health in this densely populated region.
- Article
(3535 KB) - Full-text XML
-
Supplement
(5457 KB) - BibTeX
- EndNote


Air pollution, responsible for seven million deaths annually, is a major hazard to the world's health (Fuller et al., 2022). In India, ambient particulate matter (PM) pollution is a primary contributor, accounting for 1.67 million deaths in 2019, or 17.8 % of the country's total mortality (Pandey et al., 2021). Though elements make up a small portion of PM2.5, they are helpful in source apportionment (SA) as they are unique markers of air pollution sources (Rai et al., 2020). Some elements, such as Pb, cadmium (Cd), and mercury (Hg), are particularly worrisome because of their toxicity and possibility for bioaccumulation in vital organs once absorbed into the bloodstream (Kastury et al., 2017; Rehman et al., 2018; Giordano et al., 2013). The toxicity and exposure risks of these elements are influenced by both meteorological conditions and emission sources (Tchounwou et al., 2012; Holden et al., 2016).
The Indo-Gangetic Plain (IGP) of India frequently experiences alarming PM concentrations, which can exceed 500 µg m−3 during extreme pollution episodes. For instance, during 31 October–8 November 2016, hourly PM2.5 levels in the IGP surpassed 500 µg m−3 on multiple days (Agarwal et al., 2024). This pollution is driven by rapid urbanization, industrial emissions, and biomass burning (Pant et al., 2015). These sources are collectively responsible for extreme haze events. Pollution levels are influenced by major meteorological variations between the warm and cold seasons (Bhat et al., 2017; Kumar et al., 2020; Dumka et al., 2021). Recent studies highlight Indian cities, particularly those in the IGP, as being among the top global PM2.5 hotspots (IQAir, 2022). Although most PM-based research has focused on the upper IGP (U-IGP), notably on particulate-bound organic aerosols, there is still a major knowledge gap with respect to elemental contributions, particularly using high-time-resolution observations. Conversely, the central IGP (C-IGP) has gotten even less attention, with only a few offline research studies on either organic or elemental PM. This study aims to address these knowledge gaps by exploring elemental sources, their seasonal variations, and the influence of meteorological conditions on pollution levels across both the U-IGP and the C-IGP. The U-IGP is characterized by a high population density and high levels of industrial emissions, traffic exhaust, and biomass burning, while the C-IGP is influenced by additional factors such as long-range mineral dust transport, crop residue burning, and power plant emissions. These contributions vary significantly with meteorological conditions. Most SA studies in the U-IGP rely on offline filter analyses (Jain et al., 2017; Sharma et al., 2016; Nagar et al., 2017). Road dust and garbage burning are among the several causes of pollution found by offline elemental PM studies in the U-IGP (Das et al., 2020; Jain et al., 2020). Positive matrix factorization (PMF) analysis on offline elements by Sharma and Mandal (2017) identifies major elemental sources such as secondary aerosols, soil dust, vehicle emissions, fossil fuel burning, biomass burning, industrial emissions, and sea salts. While in the C-IGP, only a few offline elemental studies indicate dominance of crustal elements and significant anthropogenic contributions (Pandey and Soni, 2017; Rai et al., 2016). Offline sampling limitations underscore the need for real-time monitoring to capture short-term pollution events (Cooper et al., 2010). Most source apportionment investigations of elemental sources have been based on offline filters using statistical multivariate analytical methods like receptor models, which can have additional benefits from significant inter-sample variability in source contributions by real-time monitoring of ambient elemental species. This is particularly crucial for understanding elemental sources and their impacts on human health.
A few investigations on elemental data with high time resolution have recently been conducted in the U-IGP (Delhi) exclusively (Manchanda et al., 2021; Rai et al., 2020; Shukla et al., 2021). Rai et al. (2020) found that during the warm season, crustal elements contributed more to elemental PM2.5 due to higher temperatures and reduced relative humidity (RH), which could facilitate its resuspension. The dust factor is reported to be dominated by Si, Ca, Fe, Al, and K. These elements have been used as markers for crustal dust/soil (Sharma et al., 2016; Sun et al., 2019). In contrast, the Cl-rich factor dominated by Cl, linked to combustion and industrial activities, was more prominent during the cold period (Ding et al., 2020). Shukla et al. (2021) reported that during the summer (June) period, dust sources were prominent, as several dust storms occurred that were associated with high wind speed and temperature and low RH. Similarly, in this study, dust made a major contribution during warm seasons in the C-IGP. Furthermore, chloride and sulfate (classified as secondary oxidized aerosols) contributed 27 %, which emphasizes the significance of lowering secondary aerosol precursors in the U-IGP. Manchanda et al. (2022) investigated an episodic firework factor linked to the festival of Diwali in India that resulted in a sharp increase in K, Al, Sr, Ba, S, and Bi concentrations; these elements act as tracers for fireworks. Further SA study by Manchanda et al. (2022) has revealed that during Diwali, fireworks represented 95 % of the elemental fraction of PM2.5 (El-PM2.5). The existing literature discussed above has primarily focused on the U-IGP (mostly offline), particularly Delhi, and lacks comprehensive studies that include multiple sites in different parts of the IGP region.
In our study, we performed measurements at three distinct urban sites in the IGP region, with two sites in the U-IGP (Delhi-NCR) and the other site in the C-IGP (Lucknow), to understand the variation in El-PM2.5 in the IGP region. We also performed PMF using ME-2 for source apportionment of elements to further understand the spatial and temporal variation in elemental sources within the U-IGP (between two sites in Delhi through the Indian Institute of Technology Delhi (IITD), and the Indian Institute of Tropical Meteorology, New Delhi branch (IITMD)) region and variation between the U-IGP and C-IGP regions. For the investigation of the role of meteorology, we discuss the variation in sources between cold and warmer periods at these three sites. We also compare the diurnal variation in sources during the warm and cold periods in the U-IGP and C-IGP regions to understand the dynamic behavior of these sources. This study focuses on identifying key elemental pollution sources and their relationships with meteorological conditions during episodes of elevated PM2.5 mass loadings. The findings aim to enhance the understanding of elemental pollution sources, their spatial and temporal dynamics, and their health impacts in the IGP region. Ultimately, this research will provide critical insights for designing targeted mitigation strategies and policies to combat air pollution and safeguard public health in this severely impacted region.
2.1 Sampling details
Figure S1 in the Supplement illustrates that the IGP is a densely populated region encompassing more than 255×106 ha of fertile land in northern and eastern India, Pakistan, and Bangladesh (Singh et al., 2017). The IGP can be categorized into three distinct regions based on their geographical location: the U-IGP, C-IGP, and L-IGP. A high population density, traffic exhaust emissions, industries, brick kilns, biomass-based energy, and extensive agricultural land define the U-IGP region. It encompasses the Indus plain of Pakistan and the Indian states of Punjab, Haryana, and Delhi. The C-IGP region, which encompasses the states of Uttar Pradesh, Bihar, and portions of Jharkhand, is impacted by the long and regional transport of mineral dust, power plant emissions, crustal resuspension, crop residue burning, domestic cooking, industries, and vehicular emissions. The L-IGP region is the culminating region in the IGP and includes all of West Bengal and Bangladesh.
The Indian Institute of Technology Delhi, Hauz Khas (U-IGP1), and the Indian Institute of Tropical Meteorology, New Delhi branch, Pusa Forest (U-IGP2), were the two sampling locations in the U-IGP. U-IGP1 is located in southern Delhi, among residential neighborhoods, educational establishments, and a major highway (Outer Ring Road). This site displays urban emissions, specifically those originating from industrial sources, vehicular traffic, and residential cooking. The residential, industrial, and transportation sectors influence U-IGP2 in downtown Delhi. Delhi's urban emissions are documented in both sites and also indicate including seasonal agricultural burning from neighboring regions as a major air pollution source. The sampling location (C-IGP1) in Lucknow is located in a diverse urban environment, adjacent to residential zones, business sectors, and major roads within the C-IGP. This site is indicative of typical urban industrial pollution sources, as adjacent industries, such as steel, cement, and chemical factories, contribute to a combination of emissions. These sampling sites offer a comprehensive overview of pollution throughout the IGP.
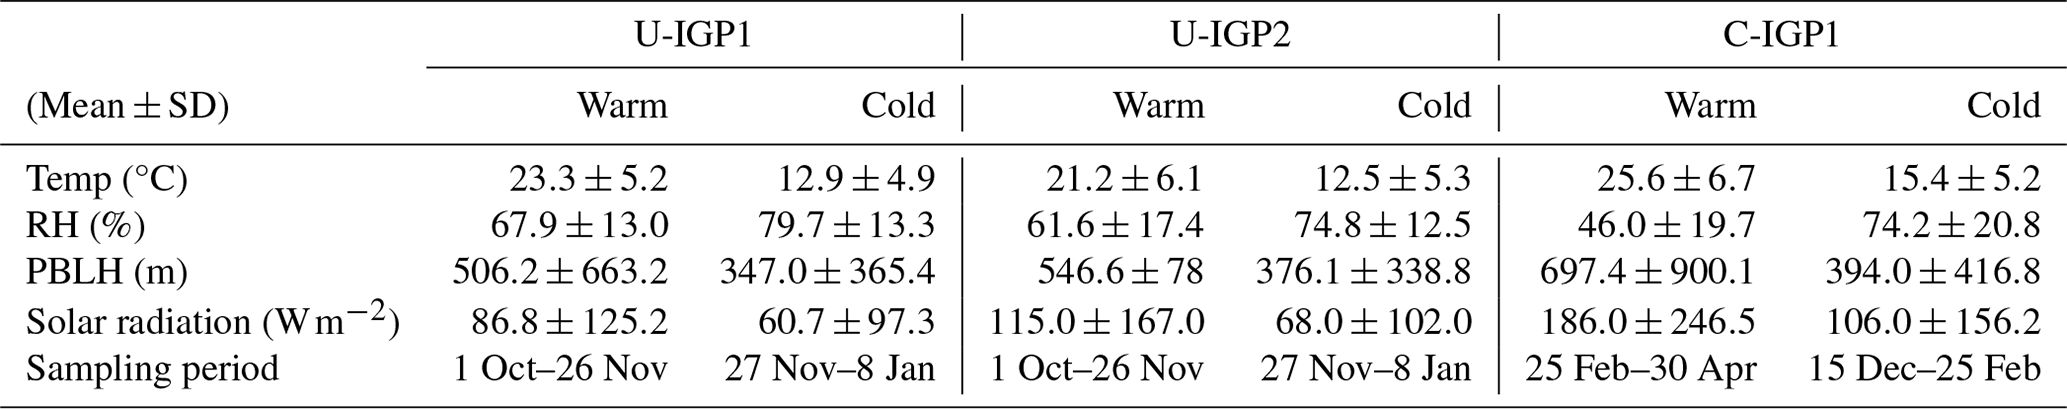
To quantify the chemical composition of ambient PM with high temporal resolution, we deployed a combination of aerosol instruments with high-time-resolution measurements at three distinct locations. Further, to understand the role of meteorology and its effect on the elements and their sources, the sampling period was divided into cold and warm periods, and a summary of the sampling and meteorological details for the cold and warm periods is provided in Table 1. Elemental species were monitored at all three locations between 1 October 2019 and 30 April 2021. The U-IGP1 sampling site was located on the third floor of the Centre for Atmospheric Sciences (CAS) building at IITD, and aerosols were collected using a PM2.5 cutoff cyclone mounted on the rooftop. The U-IGP2 location housed similar instrumentation on the second floor within a temperature-controlled laboratory and used an expanded PM2.5 sampling tube. Instruments were situated on the rooftop of the laboratory at the C-IGP1 site, located within the office building (∼12 m above ground level) of the Uttar Pradesh Pollution Control Board (UPPCB). These sampling sites provide a summary of emissions driven by local traffic and residential, industrial, and institutional activities.
Table 1Summary of the meteorological parameters and sampling for the warm and cold periods at the three sites in the IGP region.
2.2 Instruments
At each of the three sites in the IGP, the Xact ambient metal monitor was employed to sample aerosols with a PM2.5 cutoff cyclone. The sampling system included a heater to maintain a relative humidity (RH) of 45 % within a temperature-regulated laboratory at U-IGP1 and U-IGP2, while at C-IGP1, an enclosure maintaining a temperature range of 20 to 25 °C was used at the rooftop. Elaborate discussions of the sampling site and instrumentation can be found in our earlier work (Shukla et al., 2023; Lalchandani et al., 2022; Manchanda et al., 2022; Jain et al., 2023).
The Xact ambient metal monitor provides a continuous, near-real-time measurement of elemental concentrations in particulate matter. The instrument and its operating procedures are described in detail in the literature (Kelly and Fussell, 2012). In brief, the ambient aerosol is sampled at a rate of 16.7 L min−1, and it deposits on the filter tape (deposit area of 0.487 cm2) and is transported to the analysis area for energy-dispersive X-ray fluorescence (EDXRF). This method uses three distinct energy conditions (ECs) to irradiate the deposit area. Excited X-ray fluorescence is detected using a silicon drift detector (SDD). After determining which element contributed to the spectral peak intensity using the spectral deconvolution method, the elemental concentrations are acquired utilizing analysis software. The elements Al, Si, S, Cl, K, Ca, Ti, Cr, Mn, Fe, Co, Ni, Cu, Zn, As, Se, Br, Rb, Sr, Zr, Mo, Cd, In, Sn, Sb, Te, Ba, Pb, Bi, and Bi were all measured using the Xact metal monitor at a half-hourly temporal resolution. The flow rate was calibrated with a standard flowmeter (field flow calibrator, Alicat Scientific), and the instrument's setup was regulated with measurements of the surrounding temperature and pressure to provide quality assurance and quality control (QA and QC). During the energy alignment procedure, a Cr and niobium (Nb) rod is used to place the spectral peaks for each element at the appropriate energy levels and thus calibrate the energy spectrum. Daily QA upscale statistics for these metals were within 10 %. Each sample of ambient air is compared to a known value from the instrument's internal Nb source. Leak and flow checks were done at the beginning and end of the campaign, and the XRF calibration check was performed using thin film standards of elements, yielding a result well below the 5 % limit. Since the cyclone was subject to heavy loadings from the frequent pollution events, it was periodically cleaned.
Supporting measurements at these three locations include non-refractory (NR) PM2.5 concentrations measured in real time using high-resolution time-of-flight aerosol mass spectrometers (AMSs) (Aerodyne Research Inc., USA). Additionally, the BC concentration was monitored in real time across all three locations using Aethalometers (AE33, Aerosol Magee Scientific, Berkeley, CA, USA). We only use AMS and BC data for comparison to the factor time series of the elements, as the AMS and BC data are the focus of other research studies.
Other supplementary data of precipitation and planetary boundary layer height (PBLH) were extracted from the grid over Delhi and Lucknow for all three sites using the MERRA-2 satellite, while temperature (only at U-IGP1) and RH (at C-IGP1 only) were also used from the satellite data (Gelaro et al., 2017). Wind speed (WS) and wind direction (WD) data for U-IGP1 were acquired using GFS model simulations with a horizontal resolution of 25 km×25 km. CO and NOx data for U-IGP1 were measured using gas analyzers (ECOTECH Serinus 30 CO analyzer; ECOTECH Serinus 40 nitrogen oxide analyzer). Data for O3, SO2, and solar radiation (SR) at U-IGP1 were acquired from the nearest Central Pollution Control Board (CPCB) air quality monitoring site at R. K. Puram (Fig. 1). PM2.5 concentrations are measured at U-IGP1 using a beta-attenuation monitor (BAM). At U-IGP2 and C-IGP1, other parameters, such as CO, NOx, O3, SO2, SR, WS, WD, and PM2.5, and temperature were acquired from the nearest air quality monitoring site administered by CPCB (from Mandir Marg at U-IGP2) and UPPCB (at C-IGP1).

Figure 1Detailed map with the sampling locations and the nearest government monitoring continuous ambient air quality monitoring station (CAAQMS) (shown with the red circle) in the IGP region. The possible trace element sources are also shown in the map. The inset picture zooms in on the sampling sites and industrial emission sources in the U-IGP region.
2.3 Source apportionment (SA) using ME-2 solver
The element-based ME-2 model was applied in this study to perform source apportionment. It is a bilinear receptor model that enforces non-negative constraints and has been widely used in the scientific community (Paatero and Tapper, 1994). Mathematically, PMF can be described by Eq. (1), which represents a bilinear factor analysis model:
where the measured concentration of species (xij) is represented as the sum of the product of the source profile (fkj) and its time series (gik), along with a residual matrix (eij). PMF uses the least squares technique to minimize the objective function (Q) and solve for the bilinear equation. This objective function (Q), Eq. 2, involves the squared ratio of residuals (eij) and the measured uncertainty (σ), summed across all samples:
where m and n represent the number of samples and variables (species), respectively. In the field of source apportionment of ambient measurements, PMF is a popular bilinear unmixing receptor model that does not require any prior information. However, the ME-2 implementation of PMF takes advantage of the a-value approach, allowing for more efficient exploration of the rotational space by incorporating a priori information. This approach is advantageous as it allows for greater control of rotations and access to the full rotational space compared to PMF alone. Details on factor selection and constraints are discussed in Sect. S1 in the Supplement. By using scalar a values ranging from 0 to 1, one or more factor profiles can be constrained, as outlined in Eq. (3). Recent studies (Belis et al., 2019; Paatero and Hopke, 2009) have also demonstrated the effectiveness of the a-value approach in enhancing the accuracy and precision of source apportionment results.
The bilinear unmixing receptor model ME-2 was applied to the ambient data, utilizing the Source Finder tool (SoFi Pro v6.8, Datalystica Ltd, Villigen, Switzerland), which offers a user-friendly interface for implementing and investigating various rotational techniques with ease (Canonaco et al., 2013, 2021). The analysis was conducted using Igor Pro v6.37 software (Wavemetrics, Inc., Portland, OR, USA). By utilizing this approach, we were able to gain a deeper understanding of the underlying sources and their respective contributions to the measured concentrations.
For the input data matrix preparation, the elemental data detected at half-hourly time resolution were filtered based on the percentage of data points below their minimum detection limit (MDL) (supplied by manufacturer: Cooper Environmental Services). A total of 19 elements were found to have 80 % of their data points above the MDL and were used in the PMF input (Si, S, Cl, K, Ca, Ti, V, Cr, Mn, Fe, Ni, Cu, Zn, As, Se, Br, Rb, Sr, and Pb at all three sites; additional four elements: Al, Zr, Sb, and Ba at U-IGP1; and additional three elements: Al, Sn, and Ba at U-IGP2). The spectrum deconvolution and the measurement uncertainty were used to generate the error matrix, which was then obtained directly from the Xact software (Tremper et al., 2018). The input matrix for U-IGP1 consists of 4532 data points (same time resolution as raw data) and 23 elements (for U-IGP2, 4190 timestamps × 22 elements and for C-IGP1, 4047 timestamps × 19 elements). Variables with ratios below 2 had their weights reduced by swapping out their individual values with the appropriate 2signal to noise ratio (SNR) value. It has been shown that data periods with high SNR in a variable are unaffected by down-weighting the value of individual cells (Rai et al., 2020).
The unconstrained PMF was executed from 3 to 11 factors and applied to the elemental dataset. In brief, the first point of investigation of the optimum number of the factor solution was to observe the change in Qexp (7-factor solution at all three sites). Further, the final environmentally feasible solution was selected by observing the criterion of physical meaningful factors, time series, diurnal variation, scaled residual, Q_residual, unexplained variation, and correlation with external tracers. Detailed discussions of the optimum factor selection and the final ME-2 results can be found in Sects. S1 and S2 in the Supplement, respectively.
2.4 Uncertainty estimate of elemental SA results
To capture the statistical dependence on random variations in the data, the bootstrapping analysis creates numerous bootstrap (BS) distributions with the exact same dimensions as the original dataset and then computes the necessary statistics from each bootstrap distribution (Brown et al., 2015; Stefenelli et al., 2019). Random values of the constrained information were also employed, in addition to the random resampling of the PMF input (bootstrap), and the random a value seeks to accurately quantify the rotational uncertainty of the solution (Tobler et al., 2020). To evaluate statistical and rotational uncertainty, the input data matrix was repeatedly (n=500) and randomly resampled (bootstrap approach), with a random a value for the constrained variables selected each time. A set of criteria (R–Pearson correlation between base factor time series and BS-resolved factor time series) was utilized to select environmentally meaningful and stable solutions because there were so many PMF runs to investigate manually. According to Canonaco et al. (2021), the time series for each bootstrap iteration is reduced to a single point (score) for each criterion. A threshold is established for each criterion using the evolution of the score for the base case. Only when the correlation between the bootstrapped factor and its base case factor was noticeably higher than that of the bootstrapped factor to another base case factor were the bootstrapped runs retained for final mapping.
A significance level p from a t test was further selected to assess the statistical significance of the chosen threshold. The findings were evaluated using a low p value of 0.05, and the BS mapping for each base factor time series criterion was then given. Due to random resampling (bootstrapping) and the random a value for constrained factors, numerous solutions exist at various time points, allowing us to assess the rotational and statistical uncertainty of the averaged PMF solution. The averaged PMF solution's linear fit through zero between each point's standard deviation and its corresponding time point's mean defines this uncertainty. The slope of the linear fit, which was mentioned previously, determines the reported uncertainty (in percentage terms) for each factor and is described in detail in Sect. S3 in the Supplement. The 500 bootstrapping runs were performed for the 8-factor solution at U-IGP1 and U-IGP2 and the 7-factor solution at C-IGP1. Further results are described in Sect. 3.2, while a detailed description of the result is provided in Sect. S3.
2.5 Back-trajectory analysis using potential source contribution function (PSCF)
PSCF is used in the atmospheric sciences to track the geographical origin of air pollution sources. The PSCF model evaluates the possibility of using conditional probabilities applied to air parcels and evaluates the probability of the air parcel originating from a certain grid cell, which may thus influence a receptor location. PSCF finds the probability of a particular grid cell operating as a pollution source location for any reasonable path that might cross it. A larger likelihood indicates greater potential for the cell. The PSCF model breaks conditional probabilities for every grid cell to create successful, customized plans to decrease pollution. The contribution function is determined by an arbitrary criterion value C (typically 50 % to 90 % of the highest concentration). The contribution value of an endpoint on a back trajectory with a receptor concentration greater than C is 1; otherwise it will be 0. The multi-site PSCF model is defined as
where Cs is the criterion value of the site, ps,I is the result of the conditional value for trajectory I from site s, and cs,I is the receptor concentration of back trajectory I from site s.
PSCFij is the PSCF value of grid i,j (latitude, longitude), S is the total site number, LS is the total back-trajectory line number from site s, and is the endpoint number of back trajectory I from site s in grid i,j.
In this study, 120 h (5 d) of backward air mass trajectories arriving at the sampling site was computed. Back-trajectory analysis was performed by Hybrid Single-Particle Lagrangian Integrated Trajectory (HYSPLIT) v4.1 (Draxler et al., 2023) software using Global Data Assimilation System (GDAS) meteorological files as inputs for the backward-trajectory computation. The backward trajectories were computed every 3 h (ending at 00:00, 03:00, 06:00, 09:00, 12:00, 15:00, 18:00, and 00:00 UTC) for each day of the period of study at 500 m above ground level. All heights over 1500 m were filtered out as it was assumed that air masses at this height will not affect ground level observations. The time series of all sites were combined into a single PSCF run. Openair was used to plot the PSCF graph, which operates in R (Carslaw, 2019).
3.1 Mass composition of elements
Sub-hourly average El-PM2.5 concentrations were measured, for which Fig. 2a–c (also Table S2 in the Supplement) summarize the results of elements measured at all three sites in the IGP region. The elemental data were subdivided into warm and cold periods to analyze the variations in meteorological factors, emission sources, and probable formation mechanisms, particularly sulfur and chlorine (Fig. S3 in the Supplement). This subdivision was based on the distinct temporal changes observed in the resolved factors across both U-IGP and C-IGP sites. Despite differences in IGP regions, emission sources, and meteorological conditions, similar factor profiles were identified at both sites (Figs. S10a, S11a, and S12a in the Supplement). This provided a basis for a detailed examination of how meteorology and source contributions vary between the two periods, providing deeper insights into regional source characteristics. The summarized results in Table S2 further demonstrate this temporal division's importance for interpreting elemental concentrations.
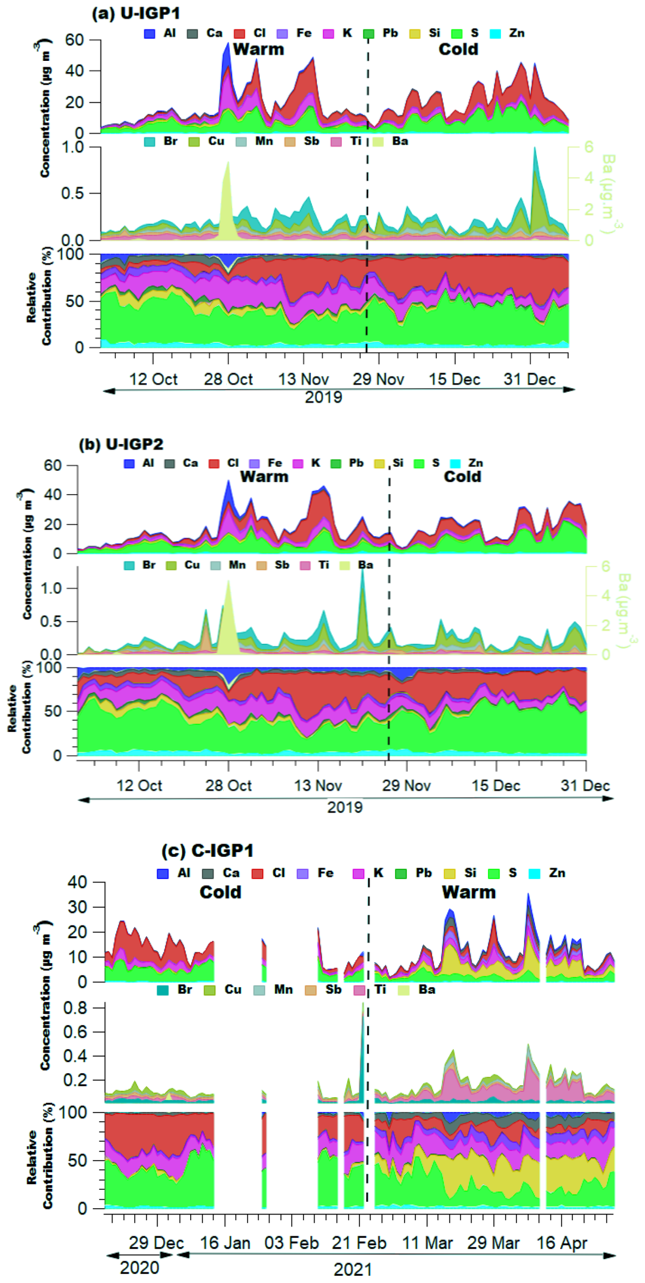
Figure 2Time series of elemental concentrations measured by Xact and the relative contribution of elements at the (a) U-IGP1, (b) U-IGP2, and (c) C-IGP1 sites.
The measured elemental concentrations during both periods at two sites in the U-IGP region were nearly identical (cold period: U-IGP1, 22.9 µg m−3; U-IGP2, 19.2 µg m−3; warm period: U-IGP1, 19.2 µg m−3; U-IGP2, 17.4 µg m−3). When comparing a U-IGP site with a higher average concentration (U-IGP1) to C-IGP1 (12.6 µg m−3; 13.5 µg m−3), the elemental concentrations were 1.5–1.7 times greater. At the U-IGP, in a study by Rai et al. (2021), it was observed that during the colder period, the measured concentrations in Delhi (32 µg m−3) were 3 times higher than those observed at the other sites globally (Beijing, Krakow, and London). When comparing the C-IGP region (this study) concentrations with both the U-IGP (as per this study) and the other three global cities (study by Rai et al., 2020), it was found that although the C-IGP concentrations were lower than those in the U-IGP, they were significantly higher than the mean concentration measured in Beijing (2.6 times), Krakow (3.1 times), and London (15 times). The high concentrations in the C-IGP region underscore the need for policymakers and scientists to direct their attention not only towards the U-IGP regions but also towards other downwind areas of the IGP regions for a comprehensive characterization of the real-time PM (particularly elements) to reduce disparity in air pollution studies.
Across the IGP regions, S, Cl, and K were the predominant contributors, accounting for over 83 % of the elemental part of PM2.5 (El-PM2.5) during the cold period (Fig. 2). In the warm period, these elements contributed over 73 % in the U-IGP region and 52 % in the C-IGP region. All of these elements are associated with combustion-related sources, such as power plants, along with the burning of garbage (including plastic and PVC) and crop residue (Gani et al., 2019; Nalbandian, 2012; Rai et al., 2020; Shukla et al., 2021). In both IGP regions, during the warm period, S and Cl decreased by a factor of 2 compared to the cold period. During the cold period, elevated levels of S and Cl can be attributed to increased anthropogenic combustion activities, including emissions from power plants and steel industries, respectively.
However, specific winter meteorological conditions, such as higher RH, lower temperatures, reduced planetary boundary layer height (PBLH), and decreased wind speed (Fig. S3), enhance the formation and accumulation of sulfate and chloride. Higher RH promotes secondary aerosol formation through heterogeneous reactions (Seinfeld and Pandis, 2006), whereas lower temperatures increase particulate-phase partitioning of semi-volatile compounds (Pathak et al., 2011). A reduced PBLH limits vertical mixing, trapping pollutants near the surface (Zhang et al., 2014), and decreased wind speed limits pollutant dispersion, leading to accumulation (Wang et al., 2014). We also examined the variations between the IGP regions and found that the mean concentration of El-PM2.5 in the U-IGP region was 1.5 times higher than in the C-IGP region. When comparing the mean concentrations of all the elements, we observed that the C-IGP region generally had lower concentrations, except during the cold period where K and Rb were enhanced at C-IGP1 (Fig. 2c), which is associated with biomass burning (Simoneit et al., 1999).
3.2 Enrichment factor analysis and health impacts of elements
Using Ti as a reference element (Majewski and Rogula-Kozłowska, 2016; Fomba et al., 2013), the enrichment factor (EF) was computed for each measured element to assess the effect of anthropogenic emissions on atmospheric elemental levels. The EF helps to evaluate the role of human activities by acting as a quantitative indicator of how much some elements are raised above their native crustal levels. Although source apportionment is covered in the next section, the EF offers an initial estimate of crustal versus anthropogenic impacts and is also used to support the source apportionment results. Al, Si, Fe, and Zr displayed EF values between 0.4 and 2, indicating a high correlation with crustal sources across the IGP areas and time periods (Fig. S14 in the Supplement). By contrast, K, Cr, Mn, and Ni displayed EF values ranging from 2 to 20, implying a mix of crustal and anthropogenic emissions, particularly from industrial and combustion activities. S, Cl, Cu, Zn, As, Se, Br, Cd, Sn, Sb, and Pb showed EF values surpassing 20, suggesting major anthropogenic influences. Although the EF emphasizes anthropogenic causes, climatic aspects also affect the transit and deposition of these elements; therefore, this interaction is discussed in the section on source apportionment results. Section S4 in the Supplement offers further thorough investigation details on the EF of the elements.
Following US Environmental Protection Agency (EPA) guidelines, we concentrated our health impact study on four main carcinogens: Pb, Ni, As, and Cr; only these elements have known inhalation reference concentrations (RfCs) for household air. Previous research by Rai et al. (2021) has also investigated these metals in the U-IGP only, thereby offering a chance to investigate their spatial variance between the U-IGP and C-IGP areas. The source apportionment results discussed in the next section attributed the measured concentrations of Pb, Ni, As, and Cr to specific sources. Pb is mostly connected with coal combustion and industrial sources, including emissions from thermal power plants and lead smelting operations (Cui et al., 2019; Swanson et al., 2013). Ni and Cr, linked to industrial waste burning and metallurgical operations, helped to identify the SFC2 factor having high signals of Zn, Cr, and Ni (Rai et al., 2020; Sharma et al., 2022). As was present in the coal combustion factor along with Pb and Se; these elements are widely known to be mostly emitted from coal combustion. Identification of the sources for the elements with high health impacts from source apportionment is very important for restricting the emissions to reduce health risks.
Compared with the standards by the International Agency for Research on Cancer (IARC, 2020), the average concentrations of these elements (except Pb) are below the inhalation reference concentrations (RfCs) recommended by the US EPA for residential air (0.2, 0.02, 0.015, and 0.1 µg m−3; USEPA, 2020). The exceedance of the mean concentration of Pb was higher at U-IGP1 (2.1–2.5) compared to U-IGP2 (1.9–2.2), with almost similar exceedances observed during warm periods as compared with cold periods at both the U-IGP sites. The exceedance of the mean concentration of the other three elements (Ni, Cr, and As) was under the RfCs in the U-IGP, and all the four elements (Pb, Ni, Cr, and As) in the C-IGP region during both periods were below the RfCs.
Examining individual exceedances, however, the percentage of data points above the US EPA's suggested RfCs for Pb was very high (41 % to 50 % over both the periods in the U-IGP) as compared with other carcinogens (Fig. 3). Lead can have important impacts on our brain system, kidneys, immune system, and reproductive system. Therefore these findings point to a major threat to human health (Mitra et al., 2022; Wani et al., 2015). Children may also suffer as a result of lead exposure, including behavioral issues, learning difficulties, and lower intellect (Al Osman et al., 2019; Reyes, 2015; Sanders et al., 2009). At U-IGP2, the exceedance of As was observed to be 10 %–32 %, most likely resulting from coal combustion pollutants. Ni and Cr exhibited a smaller number of data points (less than 1 %) exceeding the RfCs (Fig. 3). Still, their importance stems from industrial activity that influences the SFC2 factor. We found an interesting pattern of high exceedances of these carcinogenic elements during the warm seasons. Particularly, Pb levels surpassed hazardous criteria at the C-IGP1 site, Ni and As levels exceeded the criteria at both the U-IGP2 and the C-IGP1 sites, and Cr levels exceeded the criteria at the U-IGP2 site only during the warm period. These results show that although the accumulation of pollutants resulting from a low boundary layer may cause the concentration of carcinogens to be higher during cold periods, the individual exceedances might also be larger during warm periods. This implies that public health is always at risk since emissions from sources include waste burning, coal combustion, and industrial processes throughout periods with different meteorological conditions.
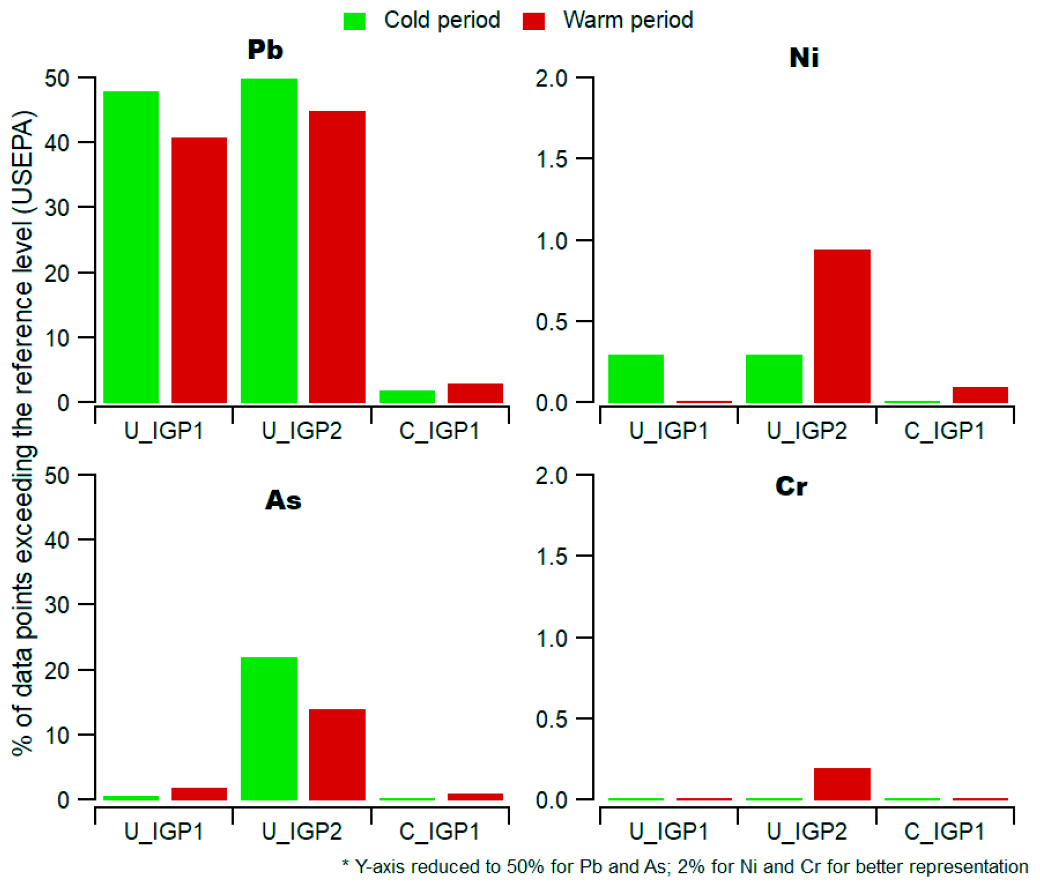
Figure 3Individual exceedance percentage for each of the carcinogenic elements (Pb, Ni, As, and Cr) during two periods and at the three sites.
3.3 Elemental source apportionment (SA)
The source apportionment of elements using highly time-resolved El-PM2.5 measurements using Xact was conducted at the three sites in the IGP region. Variations in warm- to cold-period sources were investigated for all three sites (two sites in the U-IGP and one in the C-IGP). The elemental data of the C-IGP were analyzed for this study, while the U-IGP data were included from our earlier study by Shukla et al. (2023), who have used the data as supporting information only. The optimal solution selection process is described in detail in Sect. S1.
Based on the characteristics and correlation among source profiles (as discussed in detail in Sect. S2 (Table S5 in the Supplement)), similar resolved sources were identified, including Cl-rich (steel industry, trash burning) coal combustion, Cu-rich (metal industry/e-waste burning) dust, SFC1 (biomass burning), SFC2 (industrial waste burning), and S-rich (power plant and coal combustion) sources, across all three sites. The characteristics of the resolved factors are discussed in subsequent sections, as well as in Sect. S2. Briefly, the Cl-rich factor was primarily dominated by Cl (Figs. S10–S12), with minor contributions from Br and K. This profile is associated with combustion-related processes, mainly from the steel industry, trash burning (specifically plastic and PVC), and brick kilns. According to several studies (Almeida et al., 2015; Ding et al., 2020; Gani et al., 2019), metallurgical activities and incomplete burning of plastic and PVC mostly influence Cl-rich emissions. The S-rich factor was defined by a high S content, together with Se and V (Figs. S10–S12), which are suggestive of coal combustion emissions, especially from fly ash generated by thermal power plants (Li et al., 2023). The S-rich profile correlates well with (measured using AMS at 44), indicating it to be aged and regionally transported (Fig. S13 in the Supplement). Cu, Pb, and Br each made significant contributions to the Cu-rich factor (Figs. S10–S12). Lead-acid battery recycling, electronic waste burning (Kolenčík et al., 2013), and industrial metal processing emit significant Cu and Pb (Julander et al., 2014).
Pb and Se dominated the coal combustion factor, supported by As and Se (Figs. S10–S12). The coal combustion factor may be related to lead smelting or coal burning (home and industries) (Manchanda et al., 2021; Rai et al., 2020). The SFC1 factor is mostly comprised of K and S (Figs. S10–S12), with small contributions from Rb, Br, and Se. A strong connection between this profile and polycyclic aromatic hydrocarbons (PAHs) (measured using AMS) (Fig. S13) indicates biomass burning, especially crop residue burning, which is linked to agricultural residue burning (Lalchandani et al., 2022), is further supported by the presence of K together with Rb, a marker of biomass burning (Shukla et al., 2021). High contributions of Zn, Cr, and Ni – which have been linked to industrial waste burning in earlier studies at the U-IGP (Rai et al., 2020; Sharma and Mandal, 2017) – define the SFC2 factor. Unlike SFC1, which is connected to biomass burning, SFC2 is more heavily influenced by industrial activities, including the burning of electronic waste materials. High concentrations of Si, Ca, and Fe were found in the dust-related source; however, diurnal variation and the meteorology helped us define the dust source as road dust resuspension in the U-IGP (both periods) and C-IGP (only cold period). During the warm period at the C-IGP, it was related to dust storms. In summary, S-rich and Cl-rich sources are connected to combustion activities (coal burning and garbage burning). SFC1 and SFC2 represent distinct combustion-related activities and are mostly linked to biomass burning and industrial waste burning, respectively. Section S2 addresses the thorough information of these sources backed by elemental composition and association with external tracers (Figs. S10–S13).
Out of the 500 bootstrapping runs, 100 % of runs passed the criterion at U-IGP1, 97 % at U-IGP2, and 90 % at C-IGP1, according to the bootstrapping analysis. Apart from Cu-rich sources at U-IGP2 (14 %) and C-IGP1 (26.5 %) and coal combustion at C-IGP1 (32.5 %), the PMF error for every factor was assessed and determined to be less than 10 %, at all three sites. Section S3 contains detailed and comprehensive bootstrapping analysis results.
3.3.1 Variation in elemental sources during warm and cold periods
The U-IGP region
At U-IGP1, significant differences were observed in the relative contribution of the elemental sources (Fig. 4). The contribution of SFC1 (25 % to 9 %) and dust (12 % to 5 %) sources decreased significantly from the warm to cold period (Figs. 4 and 5). In contrast, the contribution of Cl-rich (28 % to 44 %) and S-rich (22 % to 31 %) sources increased during the cold period as compared to the warm period (Figs. 4 and 5). These differences indicate meteorology's influence and distinct emission sources during different periods, which are discussed in detail in Sect. 3.4.
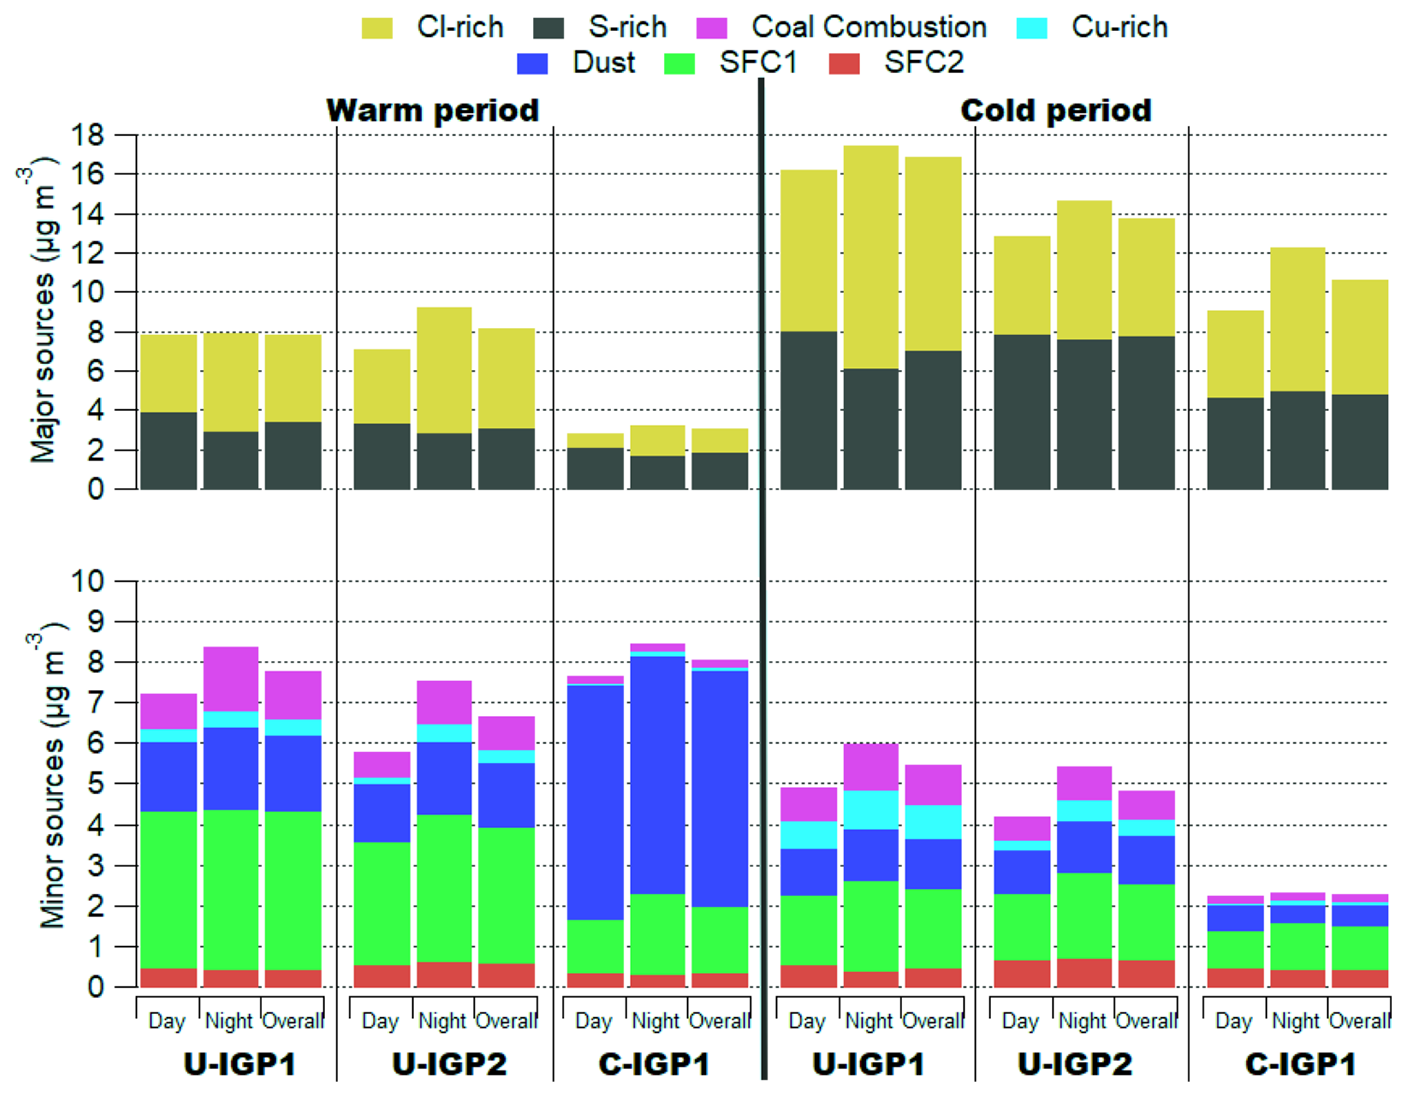
Figure 4Variation in composition (µg m−3) of elemental sources at the three sites in the IGP region: U-IGP1, U-IGP2, and C-IGP1 between the day, night, and overall period during the warm and cold periods.
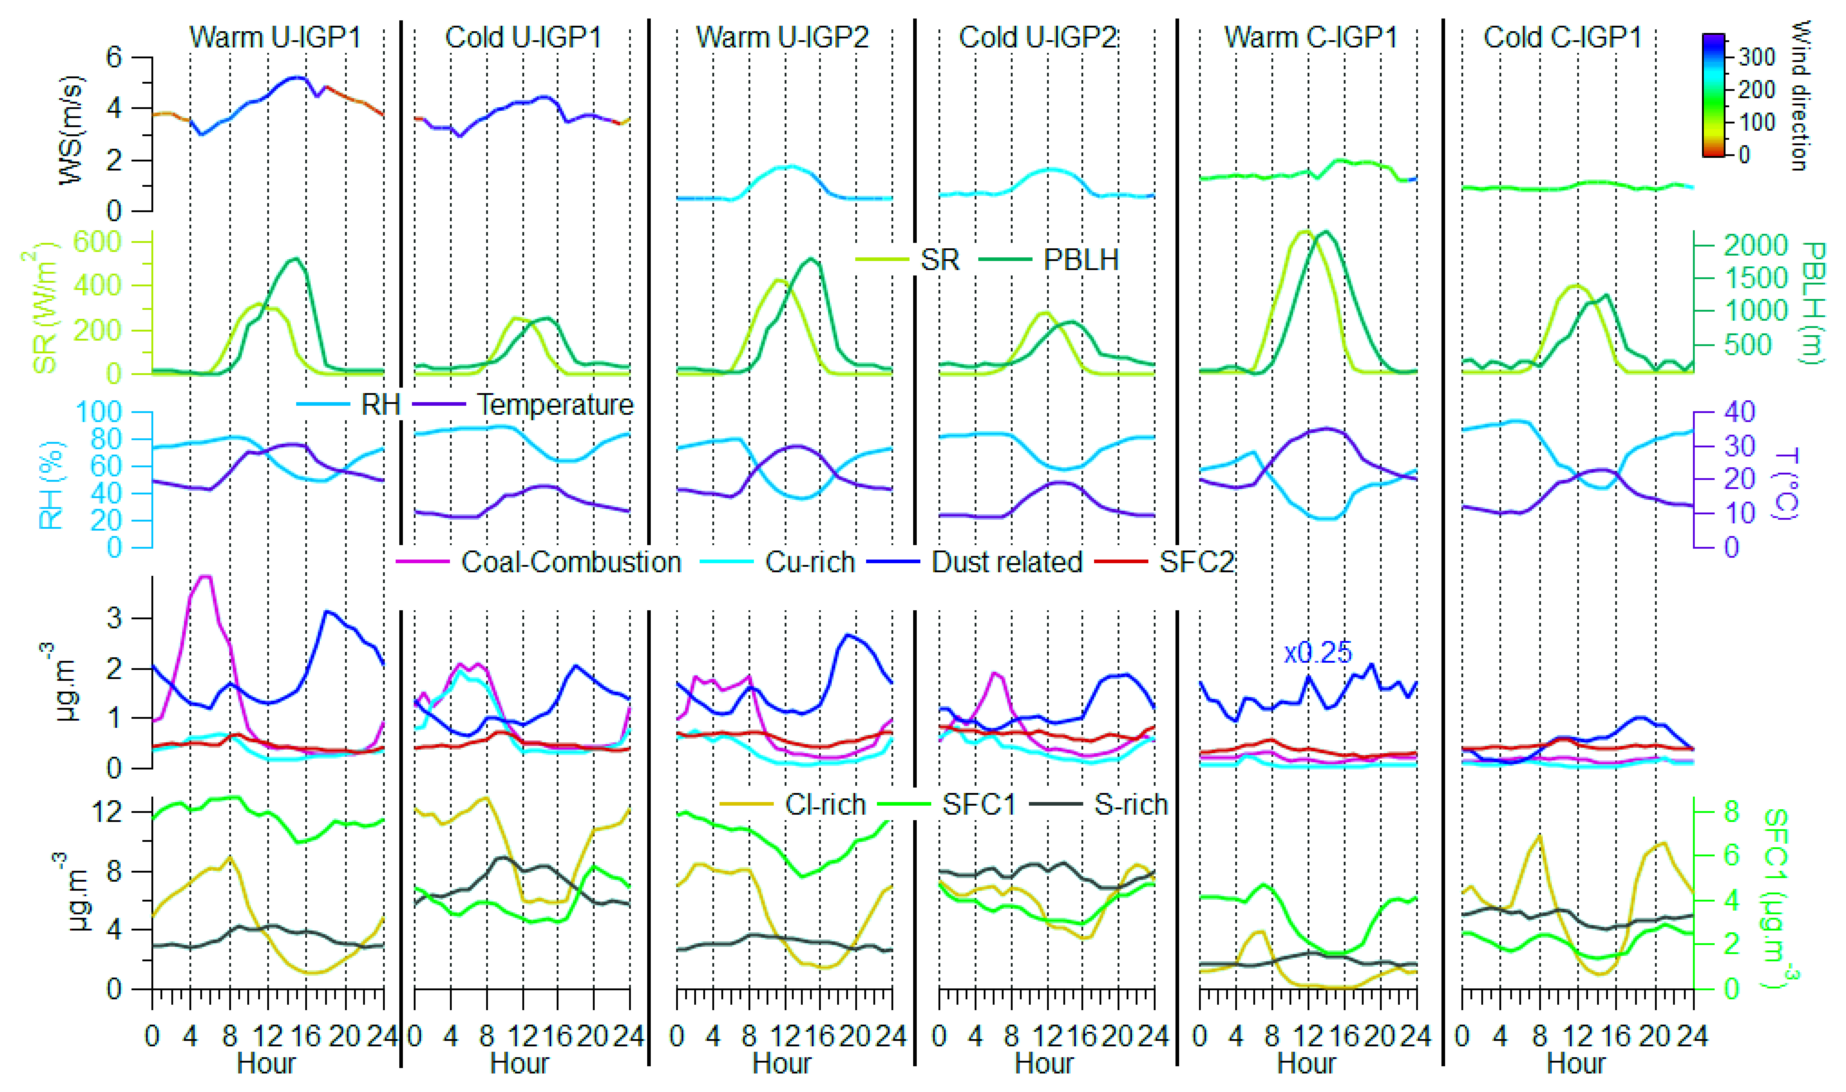
Figure 5Diurnal variation in elemental sources and meteorological parameters (SR, PBLH, WS, WD, RH, and Temp) at the three sites in the IGP region: U-IGP1, U-IGP2, and C-IGP1 during the warm and cold periods.
As compared from the warm to the cold period, the absolute concentration of SFC1 and dust decreased by a factor of 2 and 1.6, respectively, while the concentrations of Cl-rich and S-rich sources increased by a factor of 2 each (Fig. 4). The increased Cl-rich and S-rich sources during the cold period can be due to the fact that the high-RH conditions favor the rapid formation of these secondary inorganic sources through aqueous-phase reactions (Gunthe et al., 2021) along with the low PBLH effect, as also reported by Lalchandani et al. (2022) (Fig. 5).
At U-IGP2, there was a similar variation to that observed for U-IGP1. Cu-rich and coal combustion sources exhibited minimal variation from the warm to cold periods, indicating a consistent emission source, such as industries, irrespective of the period. The warmcold ratio for the average concentration of SFC1, dust, Cu-rich sources, S-rich sources, Cl-rich sources, and coal combustion was 1.7, 1.3, 1.2, 1.2, 0.8, and 0.4, respectively. At the U-IGP a similar nightday ratio for average concentrations was found for Cu-rich sources (2–2.6), followed by Cl-rich sources (1.4–1.7), coal combustion (1.4–1.7), dust (1.2–1.3), SFC1 (1.1–1.3), and SFC2 (1.1) (Table S3 in the Supplement) during both periods, indicating the role of low PBLH in the accumulation of pollutants near the surface. Only the S-rich concentration during the warm period exhibited higher daytime concentrations by a factor of 1.2 compared to nighttime concentrations, indicating the role of photochemical formation influenced by high solar radiation (Fig. S3). In contrast, during the cold period, the average concentration of the S-rich source was nearly equal during both the day and the night, which may be attributed to the role of aqueous-phase oxidation occurring at night during the cold period due to the high-RH conditions along with some increased emissions (heating activities due to low temperature), while it was absent during the warm period (Fig. S3).
The C-IGP region
At C-IGP1, there was a significant decrease in the relative contribution of the dust source, decreasing from 52 % to 4 % (ratio of average concentration from the warm to the cold period was 11) (Fig. S16 in the Supplement), prominently due to the occurrence of multiple dust storms during the warm period (prominent on 7, 8, 13, and 21 April (Fig. S9 in the Supplement)). In comparison, the concentration during the cold periods was primarily due to road dust resuspension (the diurnal concentration (Fig. 6) is similar to that of peak traffic hours). The warmcold ratios of the average concentration for SFC1, SFC2, Cl-rich sources, S-rich sources, Cu-rich sources, and coal combustion are 1.6, 0.8, 0.2, 0.4, 0.8, and 1.2, respectively (Fig. 4). SFC1 shows distinct behavior (higher during the warm period as compared to the cold period) compared to other sources due to the seasonal crop residue burning emissions during warm periods (April) in the C-IGP region. The S-rich and Cl-rich sources exhibited similar variations from the warm to the cold period, showing similar patterns to those observed at the U-IGP sites. This indicates the regional characteristics of the sources, which can be attributed to favorable meteorological conditions during the cold period and additional emissions from anthropogenic heating activities due to extremely cold weather, explored in further sections.
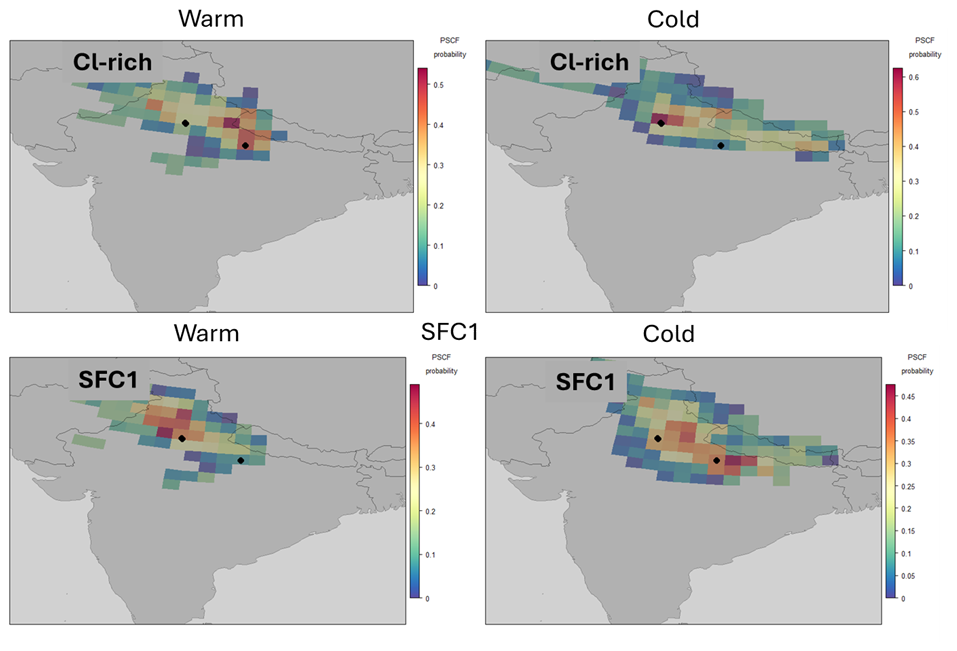
Figure 6PSCF plot for multiple sites (using three IGP sites' elemental source data) for the warm and cold periods of the Cl-rich and SFC1 sources (PSCF plot for the rest of the sources is shown in Fig. S4).
During the warm period, SFC1, Cl-rich sources, Cu-rich sources, coal combustion, and dust showed higher average concentrations at night compared to daytime, with nightday ratios of 1.5, 2, 2.3, 1.2, and 1.02, respectively (Fig. 4). On the other hand, SFC2 and S-rich sources had higher concentrations during the day by factors of 1.1 and 1.2, respectively. From day to night, significant changes in relative source contributions are observed during both warm and cold periods across the different IGP regions, as shown in Fig. S16. The S-rich source showed a higher cold-daytime contribution (∼40 %) as compared to the warm-daytime contribution (∼24 %). The Cl-rich source showed a significant increase at nighttime (50 %) compared to daytime (39 %) at the U-IGP1 and C-IGP1 sites. The relative contribution of other sources was almost consistent, as shown in Fig. S16. In the cold period, a similar trend in day-to-night variations was observed for Cl-, S-, and Cu-rich sources, but the opposite trend was observed for SFC1, SFC2, coal combustion, and dust. However, the difference in the mean concentration from day to night was much lower during the cold period compared to the warm period (Fig. 5). The dust source exhibited higher concentrations at night (with an average night to day concentration ratio of 1.8) only during the cold season, as the dust source was primarily attributed to road dust suspension, which is higher at night when the entry restrictions of heavy-duty vehicles (HDVs) are lifted.
3.3.2 Diurnal variation in elemental sources
Substantial diurnal variations in source patterns were observed between warm and cold intervals throughout the IGP regions (Fig. 5). During the warm period, daytime SFC1 concentrations were elevated. In contrast, favorable climatic conditions in the cold period, including reduced boundary layer height and minimal wind speeds, coupled with intensified heating activities, resulted in increasing nocturnal concentrations (Fig. 5). SFC2, linked to industrial waste combustion, reached its maximum in the early morning in both IGP regions in both periods. Elevated chlorine concentrations were observed between 06:00 and 08:00 LT in both IGP regions (Fig. 5) due to the semi-volatile characteristics of ammonium chloride, which transitions to a gaseous state as temperatures increase. Warm and cold periods showed a distinct diurnal trend in Cl-rich variation (Fig. 5). Cl-rich concentrations started to increase at about 20:00 LT during the warm period; in the cold period, they started to peak around 16:00 LT, again showing the impact of meteorological conditions.
In the warm period, both IGP regions had elevated afternoon concentrations of sulfur-rich sources, with U-IGP1 displaying the highest levels, followed by U-IGP2 and C-IGP1. Nevertheless, unique diurnal patterns manifested during the cold season in both areas. U-IGP2 and C-IGP1 demonstrated elevated overnight concentrations, indicating possible sulfate production through the aqueous-phase oxidation of SO2 by NO2 under high-RH conditions, hence facilitating new particle formation (Lalchandani et al., 2022). Additional details regarding diurnal variations from various sources are presented in Sect. S5 in the Supplement.
3.3.3 Spatial variation in elemental sources
In this section, we observe variations in the elemental sources first within the U-IGP region (between the two sites in the U-IGP) and then between the U-IGP and C-IGP regions. Within the U-IGP region, during the warm period, Cl-rich sources (28.3 %–34.2 %) dominated the other sources at both sites, followed by SFC1 (28.3 %–34.2 %), S-rich sources (21 %–22 %), dust (10.6 %–12 %), coal combustion (5.7 %–7.8 %), SFC2 (2.9 %–4.1 %), and Cu-rich sources (2.1 %–2.4 %) (Fig. S16). A similar pattern of source contribution was observed within the U-IGP sites during the cold period, with an increased relative contribution from Cl-rich and S-rich sources, while the contribution from other sources decreased. The difference in average concentration between the sites was minimal during the warm period, but it increased sharply during the cold period, indicating the role of increased local (site-specific) anthropogenic emission sources and dilution of transported sources as the U-IGP2 site is upstream of the U-IGP1 site (Fig. 1). The remaining sources exhibited similar variations in day and night concentrations at both sites during both periods and are discussed in Sect. S6 in the Supplement.
When comparing the variations between the U-IGP and C-IGP regions, it was found that the relative contribution of sources followed the same sequence in both regions, with Cl-rich, S-rich, and SFC1 sources dominating the other sources, except for the dust source at C-IGP1 during the warm period due to several dust storms, as already discussed in the previous section. During the cold period, the dust source was comparable in the two IGP regions, as only road dust resuspension contributed at all the sites, as shown in the diurnal pattern (Fig. 5). There was a significant variation in the average concentrations between the U-IGP and C-IGP regions during the warm period. The concentrations of SFC1, SFC2, Cl-rich sources, S-rich sources, Cu-rich sources, coal combustion, and dust were found to be rather lower in the C-IGP sites when compared to the U-IGP sites. The variations were noted to be 2.2, 1.5, 4, 1.7, 4.8, 5.1, and 0.3, respectively. During the warm period, the Cl-rich sources, Cu-rich sources, and coal combustion levels in the U-IGP region were far greater than those in the C-IGP region. This implies that industrial pollutants have more impact on the U-IGP region. Multi-site PSCF plots for Cl-rich pollutants show distinct source regions (Fig. 6). In the warm period, primary source regions were mainly in the northeast of U-IGP sites and from the north at C-IGP1. Conversely, during the cold period, Cl-rich pollutants predominantly originated from the northwest within the IGP regions. There are several steel manufacturing industries in both the Punjab and the Haryana regions as well as Moradabad (Rai et al., 2020). Possible geographical regions of SFC1 varied noticeably, with northern contributions in the warm period and northwestern and eastern contributions in the cold period (Fig. 6). The PSCF plots of the other sources are shown in Fig. S4 in the Supplement.
During the cold period, the ratios of average concentrations at the U-IGP to the C-IGP (U-IGP/C-IGP) reduced significantly. The ratios for SFC1, SFC2, Cl-rich sources, S-rich sources, Cu-rich sources, coal combustion, and dust were 1.8, 1.3, 1.1, 1.6, 6.6, 5, and 2.3, respectively. The Cu-rich factor showed the highest concentration ratio and relative contribution to El-PM2.5 (4 % in the U-IGP as compared to 1 % in the C-IGP), indicating the role of industrial pollution in the U-IGP. The probable geographical region of SFC1 emission varied noticeably, with northern contributions in the warm period and northwestern and eastern contributions in the cold period (Fig. 6). There was a significantly higher increase in Cl-rich sources at the C-IGP (26 % increase) compared to the U-IGP (16 %) from the warm to the cold period (Fig. S16). This variation in the relative contribution of Cl-rich sources indicates that although during warm periods, the C-IGP has a lower contribution, during the cold period, both the U-IGP and the C-IGP have equal Cl-rich sources, which is mostly responsible for extreme haze air pollution in the whole IGP region. Similarly, dust also decreased significantly from the warm to the cold period at the C-IGP, with a U-IGPC-IGP ratio of greater than 2 during the cold period. Dust similarly dropped noticeably from the warm to the cold period at the C-IGP. Indicating a lower impact of industries in the C-IGP region than in the U-IGP region, the other industrial sources, Cu-rich sources, and coal combustion were also considerably greater in concentration at the U-IGP sites.
3.4 Role of meteorology and pollution episodes of elemental sources
There were frequent instances of high pollution (with the average daily concentration of PM2.5 reaching 6 times the NAAQS of 60 µg m−3). We observed two distinct episodes of air pollution, each during the warm (EP1 and EP2) and cold (EP3 and EP4) periods, characterized by unique meteorological conditions (Fig. S3), as well as distinct emission sources that significantly elevated the levels of PM2.5 when compared to clean periods (two clean periods were also identified during both the warm and the cold periods to make comparisons with their respective pollution episodes). The durations of these episodes are outlined in Table S6 in the Supplement. During both warm (C1) and cold (C2) clean periods at both U-IGP sites, the average concentration of PM2.5 remained relatively low, around 43 µg m−3. A detailed discussion about the variation in sources during the clean period can be found in Sect. S7 in the Supplement.
The elevation of PM2.5 during the warm-period pollution episodes (EP1 and EP2) as compared to the clean period C1 can be due to the change in meteorological parameters, such as a decrease in PBLH (465–657 m) during pollution episodes as compared to a warm clean period (C1 with PBLH 500–840 m). Higher PBLH reduced pollution concentrations on the surface by means of vertical dispersion of pollutants. Dust-related sources, especially at C-IGP1 during EP2, were mainly from wind-induced dust resuspension, which in turn contributed to the increase in PM2.5 during warm-period pollution episodes. Conversely, during clean periods, S-rich and dust sources (road dust resuspension) dominated. In EP1, during the last week of October, agricultural residue burning (SFC1) and other combustion source emissions are rather prevalent, as also reported by Manchanda et al. (2022), especially in significant dispersion conditions. These observations during warm periods across the IGP indicate severe pollution events also depend on seasonal emission sources along with meteorological conditions (Fig. 8).
As we investigated the variation in elemental sources from C1 to EP1, we found that Cl-rich sources at U-IGP1 and U-IGP2 contribution increased significantly. Furthermore, SFC1 increased significantly during EP1, which was explained by increased agricultural residue burning. Although the temperature and PBLH are high and favorable for dispersion during the warm period, Lalchandani et al. (2022) and Manchanda et al. (2022) found that this seasonal contribution from biomass combustion was a major source of air pollution. Again, from C1 to EP1, secondary aerosol formation mechanisms had a considerable influence, as the relative contribution of S-rich sources reduced, but overall concentrations increased. During the warm period, the sharp rise in dust-related contributions at C-IGP1 can be ascribed to the dust storms during EP2 resulting from the dry (RH=46 %) and windy (WS=2–6 m s−1) conditions. During EP2, the average concentration of the SFC1 source increased, indicating a shift in emission pattern even if its percentage contribution to El-PM2.5 decreased. These findings highlight how the burning of agricultural residue and other factors impact pollution levels, even during the warm period with less favorable meteorological conditions.
Lower temperatures (average 9–24 °C), higher relative humidity (69 %–87 %), lower planetary boundary layer height (as low as 167–386 m), and slower wind velocities during the cold phase (EP3 and EP4) as compared to C2 establish conditions favorable for aqueous-phase formation of secondary inorganic aerosols and pollutant accumulation (Seinfeld and Pandis, 2006). The PM2.5 increase with the increase in Cl-rich sources during cold periods further indicates the role of aqueous-phase production of secondary aerosols at high relative humidity, as shown in Fig. 7. Moreover, the increase in the Cl-rich contribution may be due to the contribution from burning roadside trash (PVC- and plastic-related waste) for heating purposes. Similarly, secondary aerosol formation from coal combustion emissions with reduced dispersion conditions might have caused the increase in the S-rich factor. The daily fluctuations in the sulfur-rich source have a distinct trend, especially at the C-IGP during the cold period (Fig. 8). Photochemical oxidation processes usually caused the afternoon increase in the S-rich sources during C2. The late-evening increase in sulfur-rich sources during the EP3 and EP4 pollution episodes suggests that higher relative humidity helped aqueous-phase formation (Seinfeld and Pandis, 2006), which was not observed during warm periods when temperatures were high and relative humidity was low (photochemical oxidation paths were more favorable).
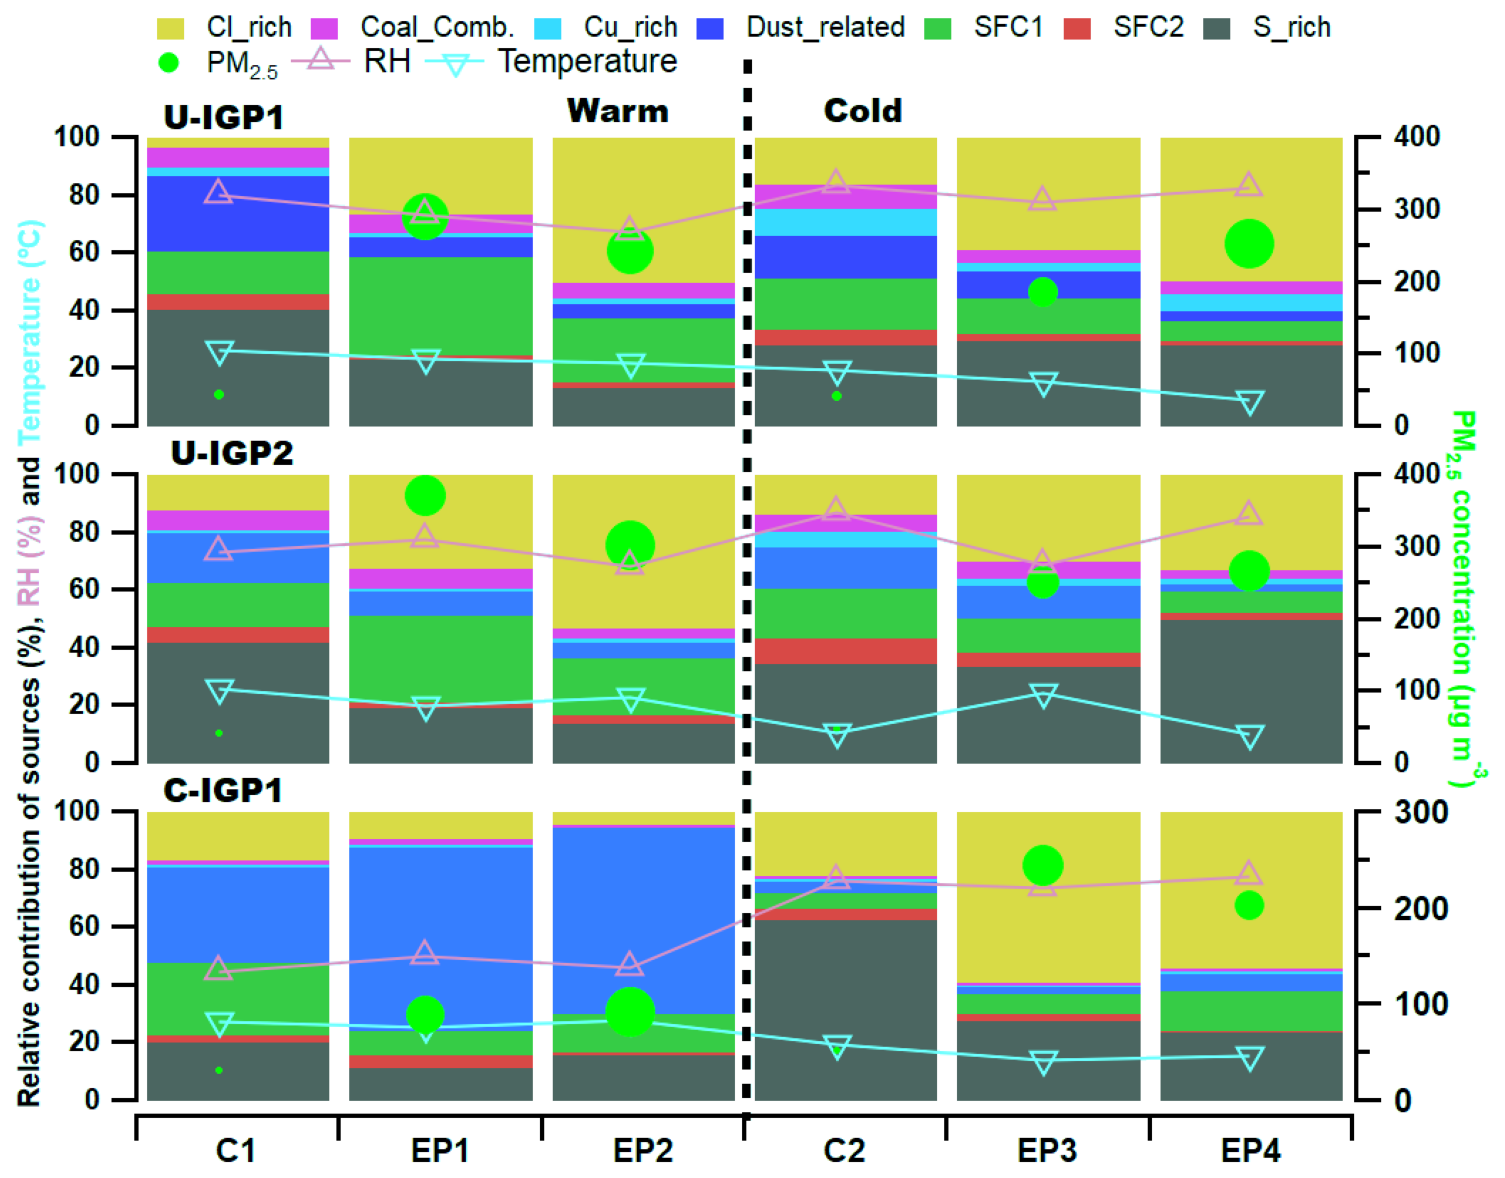
Figure 7The variation in the RC of elemental sources, PM2.5, RH, and temperature during the clean and polluted episodes C1, EP1, EP2, C2, EP3, and EP4 during both warm and cold periods.
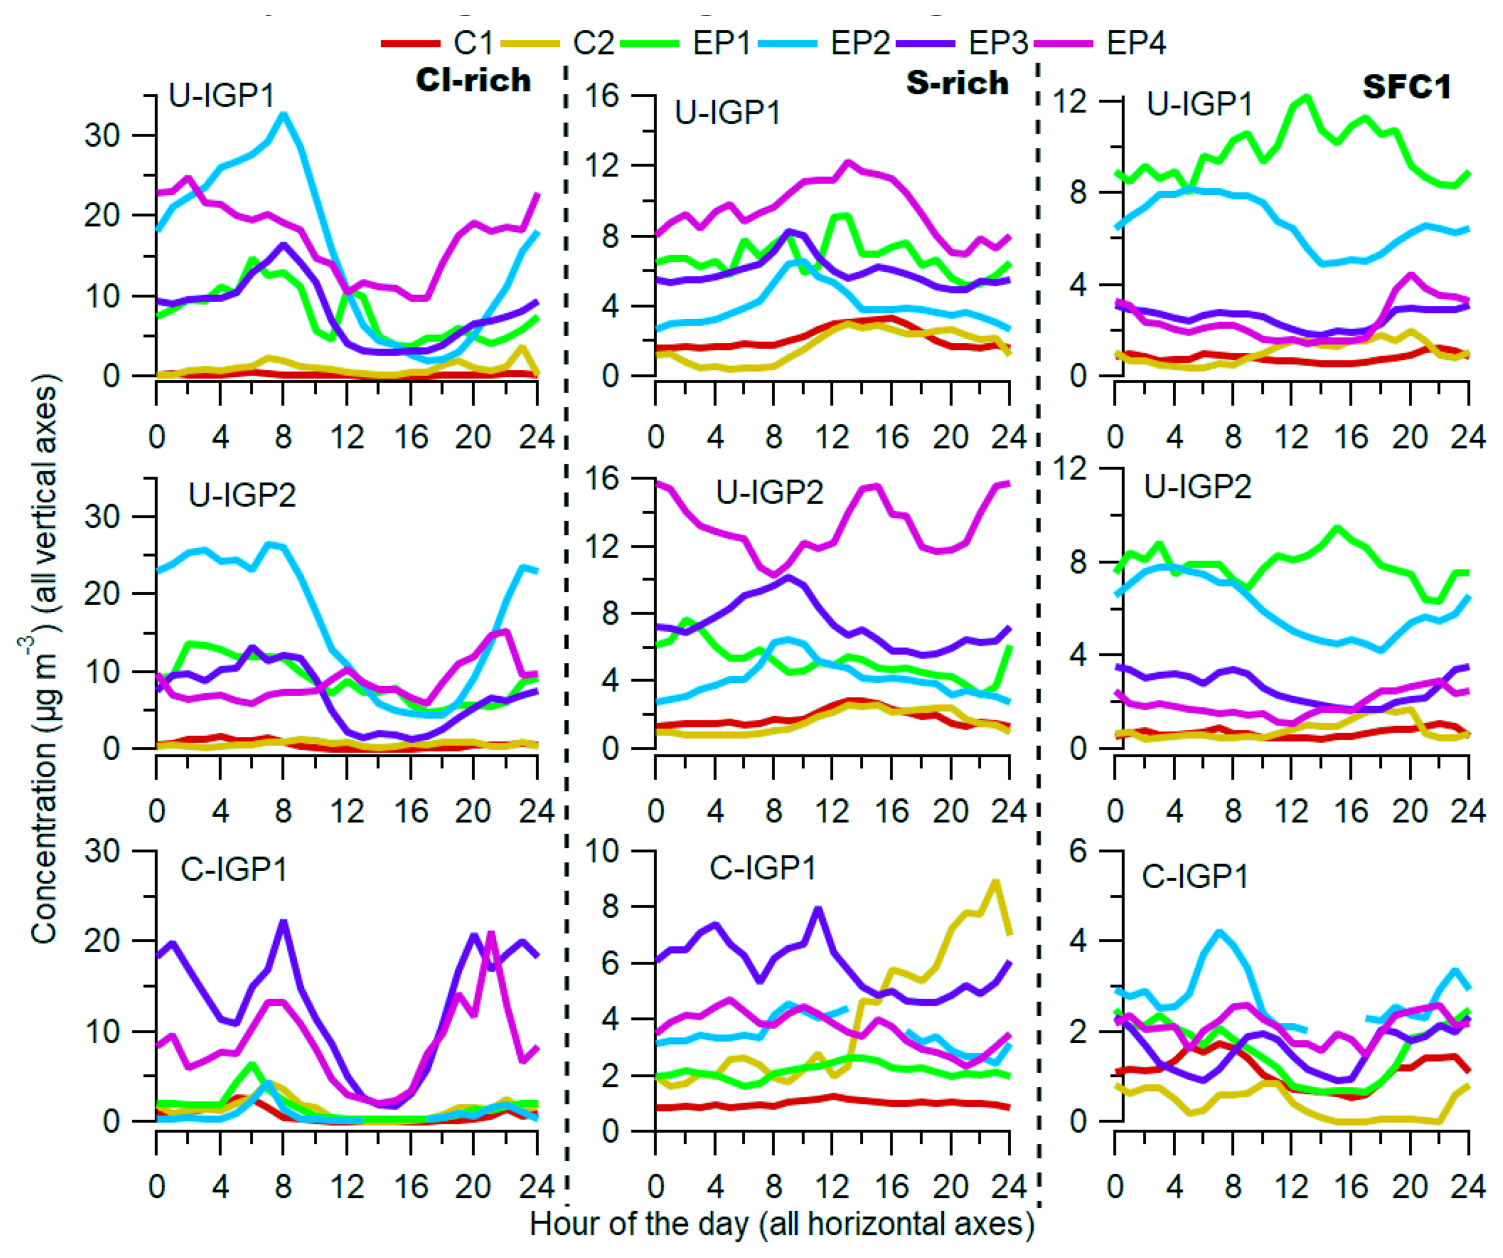
Figure 8The diurnal variation in Cl-rich, S-rich, and SFC1 sources having a major role in the variation in El-PM2.5 during the clean and polluted episodes C1, EP1, EP2, C2, EP3, and EP4 during both warm and cold periods.
In most pollution episodes and IGP locations, the results show that wind speed, PBLH, temperature, and relative humidity significantly impact the amounts of El-PM2.5 and, further, the elemental source contributions. Low temperatures, high relative humidity, lower wind speeds, and reduced PBL height all contributed to an increase in Cl-rich and S-rich factors during cold seasons, highlighting the importance of pollution accumulation and secondary production processes. The importance of dispersion mechanisms was highlighted during mild seasons when dust resuspension was more noticeable owing to drier conditions and stronger winds. However, it is impossible to overlook the significant impact that is caused by consistent shifts in emission sources. The variations in pollution levels seen can be ascribed to events more often occurring in particular periods. Among these are industrial processes, the combustion of trash and wood for domestic heating, and agricultural residue burning. Our results show that fluctuations in emissions during different periods along with meteorological conditions explain the variations between these two periods seen in the IGP region. Variations in emissions across the period also highlight the dynamic feature of the elemental sources in the IGP region along with observed weather patterns.
In this study, we characterized the high-time-resolution elemental composition (El-PM2.5) in the Indo-Gangetic Plain region. The elemental concentrations measured at the two sites in the U-IGP region were similar, while they were lower in the C-IGP as compared to U-IGP sites during both warm and cold periods. S, Cl, and K are the primary contributors to El-PM2.5 in the IGP during the cold season and are associated with combustion sources such as power plants, waste incineration (PVC and plastics), and agricultural burning, highlighting the substantial influence of anthropogenic activities on regional air quality. Elements such as Al, Si, Sr, and Ba showed a 3- to 10-fold increase during the warm period, indicating the influence of seasonal factors on pollution levels.
From a health perspective, concentrations of carcinogenic elements (Pb, Ni, As, Cr) generally remained below recommended levels, but lead concentrations exceeded the limits during warm periods in the U-IGP. This finding raises concerns about human health, as lead exposure, even during warm weather, can lead to severe health effects. Further, we identified elemental sources using the ME-2 solver, including Cl-rich sources, coal combustion, Cu-rich sources, dust, SFC1, SFC2, and S-rich sources. The cold period decreased SFC1 and dust contributions while increasing Cl-rich and S-rich sources. During the cold period, the Cl-rich source had higher concentrations at night, indicating increased emissions from garbage burning (including PVC and plastics) and the involvement of low PBLH and high RH in pollutant accumulation and formation of secondary aerosols. S-rich source concentrations were mostly high during the afternoon, possibly due to photochemical sulfate production, despite the dilution conditions. This was likely caused by increased emissions from industrial processes and biomass burning, along with favorable meteorological conditions that enhanced accumulation, leading to pollution episodes.
The U-IGP region showed higher concentrations of industrial-related sources, such as the Cu-rich factor associated with industrial metal processing and lead-acid battery recycling. Coal combustion was also higher in the U-IGP and linked to thermal power plants and industrial emissions, highlighting spatial variability influenced by local emissions and meteorological factors in the two IGP regions. The multi-site potential source contribution function (PSCF) analysis demonstrated the role of regional transport and local emissions in contributing to variations in source origin regions, emphasizing the need for coordinated regional air quality management strategies. During pollution episodes, the relative contribution of Cl-rich sources increased when PM2.5 concentrations showed a sharp increase as compared to clean periods, especially during cold periods, indicating the role of emissions from trash burning (plastic and PVC) and steel industries along with favorable meteorological conditions in the formation and accumulation of pollutants.
During the warm period, the relative contribution of Cl-rich sources in the C-IGP is lower, but during the cold period, both the U-IGP and the C-IGP have a significant Cl-rich source contribution, indicating the role of chlorine in extreme haze air pollution in the whole IGP region. During warm periods, high-pollution events occurred across the IGP, with major contributions from SFC1 (crop residue burning) indicating that severe pollution events also depend on seasonal emission sources despite less favorable meteorological conditions. These findings underscore the significant impact of both meteorological conditions and seasonal emission sources, such as industrial activities, waste burning, and agricultural residue burning, on air quality.
Overall, this study highlights the complex nature of air pollution in the IGP, with multiple factors influencing the composition and characteristics of El-PM2.5. Compared to other sites, the significant pollutant concentrations observed in the C-IGP region highlights the urgency for policymakers and scientists to expand their focus beyond the U-IGP regions. The findings underscore the need for targeted mitigation strategies, improved understanding of seasonal variations, and proactive measures to safeguard public health and mitigate the region's detrimental effects of air pollution.
The data used in this study can be found online at https://doi.org/10.5281/zenodo.12212768 (Shukla et al., 2024).
The supplement related to this article is available online at https://doi.org/10.5194/acp-25-3765-2025-supplement.
AsKS: methodology, software, validation, formal analysis, investigation, writing (original draft), writing (review and editing), visualization. SNT: conceptualization, writing (review and editing), supervision, project administration, funding acquisition. ShT: methodology, validation, software, validation, formal analysis, writing (review and editing). VM: investigation, data curation, writing (review and editing). SG: investigation, data curation, writing (review and editing). MIM: formal analysis, validation, writing (review and editing). VL: investigation, writing (review and editing). KD: methodology, validation, writing (review and editing). VMR: instrumentation, writing (review and editing). PK: validation, writing (review and editing). MK: resources, writing (review and editing). VS: resources, writing (review and editing). NR: resources, writing (review and editing). SUT: resources, writing (review and editing). AtKS: resources, writing (review and editing). DG: resources, writing (review and editing). KRD: validation, writing (review and editing). ASHP: formal analysis, validation, writing (review and editing), funding acquisition.
Vinayak M. Ruge is employed by Tesscorn AeroFluid Inc., which holds the contract with Cooper Environmental Services for the service and maintenance of Xact® 625 in India.
Publisher's note: Copernicus Publications remains neutral with regard to jurisdictional claims made in the text, published maps, institutional affiliations, or any other geographical representation in this paper. While Copernicus Publications makes every effort to include appropriate place names, the final responsibility lies with the authors.
The authors would like to acknowledge the support from the Uttar Pradesh Pollution Control Board (UPPCB) for setting up the campaign site at Lucknow. Sachchida N. Tripathi would like to acknowledge the support of PSI and the Centre of Excellence (ATMAN), approved by the Office of the Principal Scientific Adviser to the Government of India. The CoE is supported by philanthropies including Bloomberg Philanthropies, the Children's Investment Fund Foundation (CIFF), Open Philanthropy, and the Clean Air Fund. Ashutosh K. Shukla acknowledges Tondapu V. Ramesh Reddy for his help in processing the meteorological data.
This research has been supported by the Central Pollution Control Board (CPCB), government of India (AQM/Source apportionment_EPC Project/2017); the Swiss Agency for Development and Cooperation, Switzerland (project no. 7F 10093.01.04, contract no. 81062452); and a J. C. Bose grant (no. JCB/2020/000044).
This paper was edited by Ryan Sullivan and reviewed by three anonymous referees.
Agarwal, P., Stevenson, D. S., and Heal, M. R.: Quantifying the dominant sources influencing the 2016 particulate matter pollution episode over northern India, Environmental Science: Atmospheres, 4, 655–669, https://doi.org/10.1039/D3EA00174A, 2024.
Almeida, S. M., Lage, J., Fernández, B., Garcia, S., Reis, M. A., and Chaves, P. C.: Chemical characterization of atmospheric particles and source apportionment in the vicinity of a steelmaking industry, Sci. Total Environ., 521–522, 411–420, https://doi.org/10.1016/J.SCITOTENV.2015.03.112, 2015.
Al Osman, M., Yang, F., and Massey, I. Y.: Exposure routes and health effects of heavy metals on children, BioMetals, 32, 563–573, https://doi.org/10.1007/S10534-019-00193-5, 2019.
Belis, C. A., Favez, O., Mircea, M., Diapouli, E., Manousakas, M. I., Vratolis, S., Gilardoni, S., Paglione, M., Decesari, S., Mocnik, G., Mooibroek, D., Salvador, P., Takahama, S., Vecchi, R., and Paatero, P.: European Guide on Air Pollution Source Apportionment with Receptor Models – Revised Version 2019, https://doi.org/10.2760/439106, 2019.
Bhat, M. A., Romshoo, S. A., and Beig, G.: Aerosol black carbon at an urban site-Srinagar, Northwestern Himalaya, India: Seasonality, sources, meteorology and radiative forcing, Atmos. Environ., 165, 336–348, https://doi.org/10.1016/J.ATMOSENV.2017.07.004, 2017.
Brown, S. G., Eberly, S., Paatero, P., and Norris, G. A.: Methods for estimating uncertainty in PMF solutions: Examples with ambient air and water quality data and guidance on reporting PMF results, Sci. Total Environ., 518–519, 626–635, https://doi.org/10.1016/j.scitotenv.2015.01.022, 2015.
Canonaco, F., Crippa, M., Slowik, J. G., Baltensperger, U., and Prévôt, A. S. H.: SoFi, an IGOR-based interface for the efficient use of the generalized multilinear engine (ME-2) for the source apportionment: ME-2 application to aerosol mass spectrometer data, Atmos. Meas. Tech., 6, 3649–3661, https://doi.org/10.5194/amt-6-3649-2013, 2013.
Canonaco, F., Tobler, A., Chen, G., Sosedova, Y., Slowik, J. G., Bozzetti, C., Daellenbach, K. R., El Haddad, I., Crippa, M., Huang, R.-J., Furger, M., Baltensperger, U., and Prévôt, A. S. H.: A new method for long-term source apportionment with time-dependent factor profiles and uncertainty assessment using SoFi Pro: application to 1 year of organic aerosol data, Atmos. Meas. Tech., 14, 923–943, https://doi.org/10.5194/amt-14-923-2021, 2021.
Carslaw, D. C.: The Openair Manual – Open-Source Tools for Analysing Air Pollution Data, Manual for version 2.6-5, University of York, https://davidcarslaw.com/files/openairmanual.pdf (last access: 10 December 2019), 2019.
Cooper, J. A., Petterson, K., Geiger, A., Siemers, A., and Rupprecht, B.: Guide for Developing a Multi-Metals, Fence-Line Monitoring Plan for Fugitive Emissions Using X-Ray Based Monitors Guide for Developing a Multi-Metals, Fence-Line Based Monitors, Cooper Environmental Services, Portland, Oregon, 1–42, 2010.
Cui, W., Meng, Q., Feng, Q., Zhou, L., Cui, Y., and Li, W.: Occurrence and release of cadmium, chromium, and lead from stone coal combustion, Int. J. Coal Sci. Technol., 6, 586–594, https://doi.org/10.1007/S40789-019-00281-4, 2019.
Das, A., Singh, G., Habib, G., and Kumar, A.: Non-carcinogenic and Carcinogenic Risk Assessment of Trace Elements of PM2.5 During Winter and Pre-monsoon Seasons in Delhi: A Case Study, Expo Health, 12, 63-77, https://doi.org/10.1007/s12403-018-0285-y, 2020.
Ding, X., Li, Q., Wu, D., Huo, Y., Liang, Y., Wang, H., Zhang, J., Wang, S., Wang, T., Ye, X., and Chen, J.: Gaseous and Particulate Chlorine Emissions From Typical Iron and Steel Industry in China, J. Geophys. Res.-Atmos., 125, e2020JD032729, https://doi.org/10.1029/2020JD032729, 2020.
Draxler, R., Stunder, B., Rolph, G., Stein, A., and Taylor, A.: HYSPLIT user's guide, Version 5, NOAA, https://www.arl.noaa.gov/documents/reports/hysplit_user_guide.pdf (last access: 28 March 2025), last revision: November 2023.
Dumka, U. C., Kaskaoutis, D. G., Mihalopoulos, N., and Sheoran, R.: Identification of key aerosol types and mixing states in the central Indian Himalayas during the GVAX campaign: the role of particle size in aerosol classification, Sci. Total Environ., 761, 143188, https://doi.org/10.1016/J.SCITOTENV.2020.143188, 2021.
Fomba, K. W., Müller, K., van Pinxteren, D., and Herrmann, H.: Aerosol size-resolved trace metal composition in remote northern tropical Atlantic marine environment: case study Cape Verde islands, Atmos. Chem. Phys., 13, 4801–4814, https://doi.org/10.5194/acp-13-4801-2013, 2013.
Fuller, R., Landrigan, P. J., Balakrishnan, K., Bathan, G., Bose-O’Reilly, S., Brauer, M., Caravanos, J., Chiles, T., Cohen, A., Corra, L., Cropper, M., Ferraro, G., Hanna, J., Hanrahan, D., Hu, H., Hunter, D., Janata, G., Kupka, R., Lanphear, B., Lichtveld, M., Martin, K., Mustapha, A., Sanchez-Triana, E., Sandilya, K., Schaefli, L., Shaw, J., Seddon, J., Suk, W., Téllez-Rojo, M. M., and Yan, C.: Pollution and health: a progress update, Lancet Planet Health, 6, e535–e547, https://doi.org/10.1016/S2542-5196(22)00090-0, 2022.
Gani, S., Bhandari, S., Seraj, S., Wang, D. S., Patel, K., Soni, P., Arub, Z., Habib, G., Hildebrandt Ruiz, L., and Apte, J. S.: Submicron aerosol composition in the world's most polluted megacity: the Delhi Aerosol Supersite study, Atmos. Chem. Phys., 19, 6843–6859, https://doi.org/10.5194/acp-19-6843-2019, 2019.
Gelaro, R., McCarty, W., Suárez, M. J., Todling, R., Molod, A., Takacs, L., Randles, C. A., Darmenov, A., Bosilovich, M. G., Reichle, R., Wargan, K., Coy, L., Cullather, R., Draper, C., Akella, S., Buchard, V., Conaty, A., da Silva, A. M., Gu, W., Kim, G. K., Koster, R., Lucchesi, R., Merkova, D., Nielsen, J. E., Partyka, G., Pawson, S., Putman, W., Rienecker, M., Schubert, S. D., Sienkiewicz, M., and Zhao, B.: The Modern-Era Retrospective Analysis for Research and Applications, Version 2 (MERRA-2), J. Climate, 30, 5419–5454, https://doi.org/10.1175/JCLI-D-16-0758.1, 2017.
Giordano, S., Adamo, P., Spagnuolo, V., Tretiach, M., and Bargagli, R.: Accumulation of airborne trace elements in mosses, lichens and synthetic materials exposed at urban monitoring stations: Towards a harmonisation of the moss-bag technique, Chemosphere, 90, 292–299, https://doi.org/10.1016/J.CHEMOSPHERE.2012.07.006, 2013.
Gunthe, S. S., Liu, P., Panda, U., Raj, S. S., Sharma, A., Darbyshire, E., Reyes-Villegas, E., Allan, J., Chen, Y., Wang, X., Song, S., Pöhlker, M. L., Shi, L., Wang, Y., Kommula, S. M., Liu, T., Ravikrishna, R., McFiggans, G., Mickley, L. J., Martin, S. T., Pöschl, U., Andreae, M. O., and Coe, H.: Enhanced aerosol particle growth sustained by high continental chlorine emission in India, Nat. Geosci., 14, 77–84, https://doi.org/10.1038/s41561-020-00677-x, 2021.
Holden, P. A., Gardea-Torresdey, J. L., Klaessig, F., Turco, R. F., Mortimer, M., Hund-Rinke, K., Cohen Hubal, E. A., Avery, D., Barceló, D., Behra, R., Cohen, Y., Deydier-Stephan, L., Ferguson, P. L., Fernandes, T. F., Herr Harthorn, B., Henderson, W. M., Hoke, R. A., Hristozov, D., Johnston, J. M., Kane, A. B., Kapustka, L., Keller, A. A., Lenihan, H. S., Lovell, W., Murphy, C. J., Nisbet, R. M., Petersen, E. J., Salinas, E. R., Scheringer, M., Sharma, M., Speed, D. E., Sultan, Y., Westerhoff, P., White, J. C., Wiesner, M. R., Wong, E. M., Xing, B., Steele Horan, M., Godwin, H. A., and Nel, A. E.: Considerations of Environmentally Relevant Test Conditions for Improved Evaluation of Ecological Hazards of Engineered Nanomaterials, Environ. Sci. Technol., 50, 6124–6145, https://doi.org/10.1021/ACS.EST.6B00608, 2016.
IARC: Agents classified by the IARC monographs, 1–127, https://monographs.iarc.fr/agents-classified-by-the-iarc/, last access: 4 July 2020.
IQAir: World air quality report 2021, p. 9, https://www.iqair.com/dl/pdf-reports/world-air-quality-report-2021-en.pdf?srsltid=AfmBOorSd1wxhn1aanPtczVkiRt8y85ccgyf2_WGapj71hrKUOu4dQsE, last access: 4 December 2022.
Jain, S., Sharma, S. K., Choudhary, N., Masiwal, R., Saxena, M., Sharma, A., Mandal, T. K., Gupta, A., Gupta, N. C., and Sharma, C.: Chemical characteristics and source apportionment of PM2.5 using PCA/APCS, UNMIX, and PMF at an urban site of Delhi, India, Environ. Sci. Pollut. Res., 24, 14637–14656, https://doi.org/10.1007/S11356-017-8925-5, 2017.
Jain, S., Sharma, S. K., Vijayan, N., and Mandal, T. K.: Seasonal characteristics of aerosols (PM2.5 and PM10) and their source apportionment using PMF: A four year study over Delhi, India, Environ. Pollut., 262, 114337, https://doi.org/10.1016/J.ENVPOL.2020.114337, 2020.
Jain, V., Tripathi, N., Tripathi, S. N., Gupta, M., Sahu, L. K., Murari, V., Gaddamidi, S., Shukla, A. K., and Prevot, A. S. H.: Real-time measurements of non-methane volatile organic compounds in the central Indo-Gangetic basin, Lucknow, India: source characterisation and their role in O3 and secondary organic aerosol formation, Atmos. Chem. Phys., 23, 3383–3408, https://doi.org/10.5194/acp-23-3383-2023, 2023.
Julander, A., Lundgren, L., Skare, L., Grandér, M., Palm, B., Vahter, M., and Lidén, C.: Formal recycling of e-waste leads to increased exposure to toxic metals: An occupational exposure study from Sweden, Environ. Int., 73, 243–251, https://doi.org/10.1016/J.ENVINT.2014.07.006, 2014.
Kastury, F., Smith, E., and Juhasz, A. L.: A critical review of approaches and limitations of inhalation bioavailability and bioaccessibility of metal(loid)s from ambient particulate matter or dust, Sci. Total Environ., 574, 1054–1074, https://doi.org/10.1016/J.SCITOTENV.2016.09.056, 2017.
Kelly, F. J. and Fussell, J. C.: Size, source and chemical composition as determinants of toxicity attributable to ambient particulate matter, Atmos. Environ., 60, 504–526, https://doi.org/10.1016/j.atmosenv.2012.06.039, 2012.
Kolenčík, M., Urík, M., Čerñanský, S., Molnárová, M., and Matúš, P.: Leaching of zinc, cadmium, lead and copper from electronic scrap using organic acids and the aspergillus niger strain, Fresen. Environ. Bull., 22, 3673–3679, 2013.
Kumar, R. R., Soni, V. K., and Jain, M. K.: Evaluation of spatial and temporal heterogeneity of black carbon aerosol mass concentration over India using three year measurements from IMD BC observation network, Sci. Total Environ., 723, 138060, https://doi.org/10.1016/J.SCITOTENV.2020.138060, 2020.
Lalchandani, V., Srivastava, D., Dave, J., Mishra, S., Tripathi, N., Shukla, A. K., Sahu, R., Thamban, N. M., Gaddamidi, S., Dixit, K., Ganguly, D., Tiwari, S., Srivastava, A. K., Sahu, L., Rastogi, N., Gargava, P., and Tripathi, S. N.: Effect of Biomass Burning on PM2.5 Composition and Secondary Aerosol Formation During Post-Monsoon and Winter Haze Episodes in Delhi, J. Geophys. Res.-Atmos., 127, e2021JD035232, https://doi.org/10.1029/2021JD035232, 2022.
Li, R., Gao, Y., Chen, Y., Peng, M., Zhao, W., Wang, G., and Hao, J.: Measurement report: Rapid changes of chemical characteristics and health risks for highly time resolved trace elements in PM2.5 in a typical industrial city in response to stringent clean air actions, Atmos. Chem. Phys., 23, 4709–4726, https://doi.org/10.5194/acp-23-4709-2023, 2023.
Majewski, G. and Rogula-Kozłowska, W.: The elemental composition and origin of fine ambient particles in the largest Polish conurbation: first results from the short-term winter campaign, Theor Appl Climatol, 125, 79–92, https://doi.org/10.1007/s00704-015-1494-y, 2016.
Manchanda, C., Kumar, M., Singh, V., Faisal, M., Hazarika, N., Shukla, A., Lalchandani, V., Goel, V., Thamban, N., Ganguly, D., and Tripathi, S. N.: Variation in chemical composition and sources of PM2.5 during the COVID-19 lockdown in Delhi, Environ. Int., 153, 106541, https://doi.org/10.1016/j.envint.2021.106541, 2021.
Manchanda, C., Kumar, M., Singh, V., Hazarika, N., Faisal, M., Lalchandani, V., Shukla, A., Dave, J., Rastogi, N., and Tripathi, S. N.: Chemical speciation and source apportionment of ambient PM2.5 in New Delhi before, during, and after the Diwali fireworks, Atmos. Pollut. Res., 13, 101428, https://doi.org/10.1016/J.APR.2022.101428, 2022.
Mitra, S., Chakraborty, A. J., Tareq, A. M., Emran, T. Bin, Nainu, F., Khusro, A., Idris, A. M., Khandaker, M. U., Osman, H., Alhumaydhi, F. A., and Simal-Gandara, J.: Impact of heavy metals on the environment and human health: Novel therapeutic insights to counter the toxicity, J. King. Saud. Univ. Sci., 34, 101865, https://doi.org/10.1016/J.JKSUS.2022.101865, 2022.
Nagar, P. K., Singh, D., Sharma, M., Kumar, A., Aneja, V. P., George, M. P., Agarwal, N., and Shukla, S. P.: Characterization of PM2.5 in Delhi: role and impact of secondary aerosol, burning of biomass, and municipal solid waste and crustal matter, Environ. Sci. Pollut. Res., 24, 25179–25189, https://doi.org/10.1007/s11356-017-0171-3, 2017.
Nalbandian, H.: Trace element emissions from coal, IEA clean coal centre, CCC/203 ISBN 978-92-9029-523-5, 2012.
Paatero, P. and Hopke, P. K.: Rotational tools for factor analytic models, J. Chemometr., 23, 91–100, https://doi.org/10.1002/cem.1197, 2009.
Paatero, P. and Tapper, U.: Positive matrix factorization: A non‐negative factor model with optimal utilization of error estimates of data values, Environmetrics, 5, 111–126, https://doi.org/10.1002/env.3170050203, 1994.
Pandey, P. and Soni, D.: Enrichment of Heavy Metal in Ambient Air of Lucknow City and its Potential Health Hazards, Int. J. Adv. Res. (Indore), 5, 299–309, https://doi.org/10.21474/IJAR01/5533, 2017.
Pandey, A., Brauer, M., Cropper, M. L., Balakrishnan, K., Mathur, P., Dey, S., Turkgulu, B., Kumar, G. A., Khare, M., Beig, G., Gupta, T., Krishnankutty, R. P., Causey, K., Cohen, A. J., Bhargava, S., Aggarwal, A. N., Agrawal, A., Awasthi, S., Bennitt, F., Bhagwat, S., Bhanumati, P., Burkart, K., Chakma, J. K., Chiles, T. C., Chowdhury, S., Christopher, D. J., Dey, S., Fisher, S., Fraumeni, B., Fuller, R., Ghoshal, A. G., Golechha, M. J., Gupta, P. C., Gupta, R., Gupta, R., Gupta, S., Guttikunda, S., Hanrahan, D., Harikrishnan, S., Jeemon, P., Joshi, T. K., Kant, R., Kant, S., Kaur, T., Koul, P. A., Kumar, P., Kumar, R., Larson, S. L., Lodha, R., Madhipatla, K. K., Mahesh, P. A., Malhotra, R., Managi, S., Martin, K., Mathai, M., Mathew, J. L., Mehrotra, 5 R., Mohan, B. V. M., Mohan, V., Mukhopadhyay, S., Mutreja, P., Naik, N., Nair, S., Pandian, J. D., Pant, P., Perianayagam, A., Prabhakaran, D., Prabhakaran, P., Rath, G. K., Ravi, S., Roy, A., Sabde, Y. D., Salvi, S., Sambandam, S., Sharma, B., Sharma, M., Sharma, S., Sharma, R. S., Shrivastava, A., Singh, 10 S., Singh, V., Smith, R., Stanaway, J. D., Taghian, G., Tandon, N., Thakur, J. S., Thomas, N. J., Toteja, G. S., Varghese, C. M., Venkataraman, C., Venugopal, K. N., Walker, K. D., Watson, A. Y., Wozniak, S., Xavier, D., Yadama, G. N., Yadav, G., Shukla, D. K., Bekedam, H. J., Reddy, K. S., Guleria, R., Vos, T., Lim, S. S., Dandona, R., Kumar, S., Kumar, P., Landrigan, P. J., and Dandona, L.: Health and economic impact of air pollution in the states of India: the Global Burden of Disease Study 2019, Lancet Planet Health, 5, e25–e38, https://doi.org/10.1016/S2542-5196(20)30298-9, 2021.
Pant, P., Shukla, A., Kohl, S. D., Chow, J. C., Watson, J. G., and Harrison, R. M.: Characterization of ambient PM2.5 at a pollution hotspot in New Delhi, India and inference of sources, Atmos Environ, 109, 178–189, https://doi.org/10.1016/j.atmosenv.2015.02.074, 2015.
Pathak, R. K., Wang, T., Ho, K. F., and Lee, S. C.: Characteristics of summertime PM2.5 organic and elemental carbon in four major Chinese cities: Implications of high acidity for water-soluble organic carbon (WSOC), Atmos. Environ., 45, 318–325, https://doi.org/10.1016/J.ATMOSENV.2010.10.021, 2011.
Rai, P., Chakraborty, A., Mandariya, A. K., and Gupta, T.: Composition and source apportionment of PM1 at urban site Kanpur in India using PMF coupled with CBPF, Atmos. Res., 178–179, 506–520, https://doi.org/10.1016/J.ATMOSRES.2016.04.015, 2016.
Rai, P., Furger, M., El Haddad, I., Kumar, V., Wang, L., Singh, A., Dixit, K., Bhattu, D., Petit, J. E., Ganguly, D., Rastogi, N., Baltensperger, U., Tripathi, S. N., Slowik, J. G., and Prévôt, A. S. H.: Real-time measurement and source apportionment of elements in Delhi's atmosphere, Sci. Total Environ., 742, 140332, https://doi.org/10.1016/J.SCITOTENV.2020.140332, 2020.
Rai, P., Slowik, J. G., Furger, M., El Haddad, I., Visser, S., Tong, Y., Singh, A., Wehrle, G., Kumar, V., Tobler, A. K., Bhattu, D., Wang, L., Ganguly, D., Rastogi, N., Huang, R.-J., Necki, J., Cao, J., Tripathi, S. N., Baltensperger, U., and Prévôt, A. S. H.: Highly time-resolved measurements of element concentrations in PM10 and PM2.5: comparison of Delhi, Beijing, London, and Krakow, Atmos. Chem. Phys., 21, 717–730, https://doi.org/10.5194/acp-21-717-2021, 2021.
Rehman, K., Fatima, F., Waheed, I., and Akash, M. S. H.: Prevalence of exposure of heavy metals and their impact on health consequences, J. Cell. Biochem., 119, 157–184, https://doi.org/10.1002/JCB.26234, 2018.
Reyes, J. W.: LEAD EXPOSURE AND BEHAVIOR: EFFECTS ON ANTISOCIAL AND RISKY BEHAVIOR AMONG CHILDREN AND ADOLESCENTS, Econ. Inq., 53, 1580–1605, https://doi.org/10.1111/ECIN.12202, 2015.
Sanders, T., Liu, Y., Buchner, V., and Tchounwou, P. B.: Neurotoxic effects and biomarkers of lead exposure: A review, Rev. Environ. Health., 24, 15–45, https://doi.org/10.1515/REVEH.2009.24.1.15, 2009.
Seinfeld, J. H. and Pandis, S. N.: Atmospheric Chemistry and Physics: From Air Pollution to Climate Change, 2nd edn., John Wiley & Sons, Hoboken, NJ, Inc., 139–152, ISBN-13 978-0471720188, 2006.
Sharma, S. K. and Mandal, T. K.: Chemical composition of fine mode particulate matter (PM2.5) in an urban area of Delhi, India and its source apportionment, Urban Clim., 21, 106–122, https://doi.org/10.1016/j.uclim.2017.05.009, 2017.
Sharma, S. K., Sharma, A., Saxena, M., Choudhary, N., Masiwal, R., Mandal, T. K., and Sharma, C.: Chemical characterization and source apportionment of aerosol at an urban area of Central Delhi, India, Atmos. Pollut. Res., 7, 110–121, https://doi.org/10.1016/j.apr.2015.08.002, 2016.
Sharma, S. K., Mandal, T. K., Banoo, R., Rai, A., and Rani, M.: Long-Term Variation in Carbonaceous Components of PM2.5 from 2012 to 2021 in Delhi, Bull. Environ. Contam. Toxicol., 109, 502–510, https://doi.org/10.1007/s00128-022-03506-6, 2022.
Shukla, A. K., Lalchandani, V., Bhattu, D., Dave, J. S., Rai, P., Thamban, N. M., Mishra, S., Gaddamidi, S., Tripathi, N., Vats, P., Rastogi, N., Sahu, L., Ganguly, D., Kumar, M., Singh, V., Gargava, P., and Tripathi, S. N.: Real-time quantification and source apportionment of fine particulate matter including organics and elements in Delhi during summertime, Atmos. Environ., 261, 118598, https://doi.org/10.1016/J.ATMOSENV.2021.118598, 2021.
Shukla, A. K., Tripathi, S. N., Canonaco, F., Lalchandani, V., Sahu, R., Srivastava, D., Dave, J., Thamban, N. M., Gaddamidi, S., Sahu, L., Kumar, M., Singh, V., and Rastogi, N.: Spatio-temporal variation of C-PM2.5 (composition based PM2.5) sources using PMF*PMF (double-PMF) and single-combined PMF technique on real-time non-refractory, BC and elemental measurements during post-monsoon and winter at two sites in Delhi, India, Atmos. Environ., 293, 119456, https://doi.org/10.1016/J.ATMOSENV.2022.119456, 2023.
Shukla, A. K., Tripathi, S. N., Talukdar, S., Murari, V., Gaddamidi, S., Manousakas, M. I., Lalchandani, V., Dixit, K., Ruge, V. M., Khare, P., Kumar, M., Singh, V., Rastogi, N., Tiwari, S., Srivastava, A. K., Ganguly, D., Dallenbach K. R., and Prevot, A. S. H.: Sources and meteorology influencing highly-time resolved PM2.5 trace elements at 3 urban sites in extremely polluted Indo Gangetic Plain in India, Measurement_Report_Data_21-06-2024, https://doi.org/10.5281/zenodo.12212768, 2024.
Simoneit, B. R. T., Schauer, J. J., Nolte, C. G., Oros, D. R., Elias, V. O., Fraser, M. P., Rogge, W. F., and Cass, G. R.: Levoglucosan, a tracer for cellulose in biomass burning and atmospheric particles, Atmos. Environ., 33, 173–182, https://doi.org/10.1016/S1352-2310(98)00145-9, 1999.
Singh, N., Mhawish, A., Deboudt, K., Singh, R. S., and Banerjee, T.: Organic aerosols over Indo-Gangetic Plain: Sources, distributions and climatic implications, Atmos. Environ., 157, 59–74, https://doi.org/10.1016/J.ATMOSENV.2017.03.008, 2017.
Stefenelli, G., Pospisilova, V., Lopez-Hilfiker, F. D., Daellenbach, K. R., Hüglin, C., Tong, Y., Baltensperger, U., Prévôt, A. S. H., and Slowik, J. G.: Organic aerosol source apportionment in Zurich using an extractive electrospray ionization time-of-flight mass spectrometer (EESI-TOF-MS) – Part 1: Biogenic influences and day–night chemistry in summer, Atmos. Chem. Phys., 19, 14825–14848, https://doi.org/10.5194/acp-19-14825-2019, 2019.
Sun, J., Shen, Z., Zhang, L., Lei, Y., Gong, X., Zhang, Q., Zhang, T., Xu, H., Cui, S., Wang, Q., Cao, J., Tao, J., Zhang, N., and Zhang, R.: Chemical source profiles of urban fugitive dust PM2.5 samples from 21 cities across China, Sci. Total Environ., 649, 1045–1053, https://doi.org/10.1016/J.SCITOTENV.2018.08.374, 2019.
Swanson, S. M., Engle, M. A., Ruppert, L. F., Affolter, R. H., and Jones, K. B.: Partitioning of selected trace elements in coal combustion products from two coal-burning power plants in the United States, Int. J. Coal Geol., 113, 116–126, https://doi.org/10.1016/J.COAL.2012.08.010, 2013.
Tchounwou, P. B., Yedjou, C. G., Patlolla, A. K., and Sutton, D. J.: Heavy metal toxicity and the environment, EXS, 101, 133–164, https://doi.org/10.1007/978-3-7643-8340-4_6/COVER, 2012.
Tobler, A., Bhattu, D., Canonaco, F., Lalchandani, V., Shukla, A., Thamban, N. M., Mishra, S., Srivastava, A. K., Bisht, D. S., Tiwari, S., Singh, S., Močnik, G., Baltensperger, U., Tripathi, S. N., Slowik, J. G., and Prévôt, A. S. H.: Chemical characterization of PM2.5 and source apportionment of organic aerosol in New Delhi, India, Sci. Total Environ., 745, 140924, https://doi.org/10.1016/j.scitotenv.2020.140924, 2020.
Tremper, A. H., Font, A., Priestman, M., Hamad, S. H., Chung, T.-C., Pribadi, A., Brown, R. J. C., Goddard, S. L., Grassineau, N., Petterson, K., Kelly, F. J., and Green, D. C.: Field and laboratory evaluation of a high time resolution x-ray fluorescence instrument for determining the elemental composition of ambient aerosols, Atmos. Meas. Tech., 11, 3541–3557, https://doi.org/10.5194/amt-11-3541-2018, 2018.
USEPA: Regional Screening Levels (RSL's), https://www.epa.gov/risk/regional-screening-levels-rsls-generic-tables, last access: 20 June 2020.
Wang, Y., Zhang, Q., Jiang, J., Zhou, W., Wang, B., He, K., Duan, F., Zhang, Q., Philip, S., and Xie, Y.: Enhanced sulfate formation during China's severe winter haze episode in January 2013 missing from current models, J. Geophys. Res.-Atmos., 119, 10425–10440, https://doi.org/10.1002/2013JD021426, 2014.
Wani, A. L., Ara, A., and Usmani, J. A.: Lead toxicity: a review, Interdiscip. Toxicol., 8, 55, https://doi.org/10.1515/INTOX-2015-0009, 2015.
Zhang, R. H., Li, Q., and Zhang, R. N.: Meteorological conditions for the persistent severe fog and haze event over eastern China in January 2013, Sci. China Earth Sci., 57, 26–35, https://doi.org/10.1007/S11430-013-4774-3, 2014.