the Creative Commons Attribution 4.0 License.
the Creative Commons Attribution 4.0 License.
 | 20 Mar 2025
Size-resolved hygroscopicity and volatility properties of ambient urban aerosol particles measured by a volatility hygroscopicity tandem differential mobility analyzer system in Beijing
Aoyuan Yu
Xiaojing Shen
Qianli Ma
Jiayuan Lu
Xinyao Hu
Yangmei Zhang
Linlin Liang
Lei Liu
Shuo Liu
Hongfei Tong
Huizheng Che
Xiaoye Zhang
Junying Sun
The hygroscopicity and volatility of submicron ambient aerosol particles with diameters of 50, 80, 110, and 150 nm and the hygroscopicity of their non-volatile cores were measured using a volatility hygroscopicity tandem differential mobility analyzer (VH-TDMA) system at a relative humidity of 90 % and a thermal denuder temperature of 270 °C from 11 October to 6 November 2023 in Beijing. The mean hygroscopic growth factor (HGF) for particles of 50, 80, 100, and 150 nm diameter was 1.15 ± 0.07, 1.24 ± 0.08, 1.30 ± 0.09, and 1.36 ± 0.10, respectively, while the mean volatile shrink factor (VSF) was 0.51 ± 0.05, 0.55 ± 0.04, 0.56 ± 0.05, and 0.56 ± 0.07, respectively. Both the HGF probability density function (HGF PDF) and the VSF probability density function (VSF PDF) for all selected particle sizes exhibited a pronounced bimodal distribution, indicating that the particles were primarily in an external mixing state. Hygroscopicity was observed to increase with particle size in both clean and pollution periods, while volatility decreased slightly with particle size during the clean period, without an apparent trend during the pollution period. A positive correlation was identified between hygroscopicity and volatility, as well as between the number fraction of nearly hydrophobic (NH) and non-volatile (NV) particles. Furthermore, this study measured the HGF of the non-volatile core (HGFcore) of submicron ambient aerosol particles heated at 270 °C and derived the HGF of the volatile coating (HGFcoating). The mean HGFcoating for particles of 50, 80, 100, and 150 nm diameter was 1.17 ± 0.08, 1.27 ± 0.10, 1.35 ± 0.10, and 1.41 ± 0.10, respectively, which is 2 % to 7 % higher than the mean HGF for the same particle sizes. The mean HGFcore for particles of 50, 80, 100, and 150 nm diameter was 1.08 ± 0.03, 1.07 ± 0.03, 1.07 ± 0.03, and 1.09 ± 0.04, respectively. The HGFcore values were increased when the air mass passed over or originated from the Bohai Sea.
- Article
(10345 KB) - Full-text XML
-
Supplement
(1543 KB) - BibTeX
- EndNote


Atmospheric aerosols significantly influence the radiation balance and climate change (IPCC, 2013), play a crucial role in reducing visibility (Zhang et al., 2012), and affect public health (Ou et al., 2020; Lippmann and Albert, 1969). The impact of atmospheric aerosols on global climate, human health, and air quality depends largely on their physicochemical properties (Pöschl, 2005; Buseck and Posfai, 1999). A deep understanding of aerosol particles' physicochemical properties, including hygroscopicity and volatility, is crucial for determining their potential impacts. Hygroscopicity, the ability of aerosols to take up water vapor (Su et al., 2010), determines the size and optical properties of aerosol particles, thus affecting visibility and direct radiative forcing (Zhao et al., 2019; Xia et al., 2019; Freney et al., 2010). Moreover, hygroscopicity significantly influences cloud condensation nuclei (CCN) activation and cloud droplet formation (Zhang et al., 2023; Tang et al., 2016; Reutter et al., 2009), and the degree of aerosol particle mixing can also be determined by measuring the particles' hygroscopicity distribution (Wang et al., 2019; Ye et al., 2013). The humidity tandem differential mobility analyzer (H-TDMA) is extensively used to measure aerosol hygroscopicity in various field studies (Tang et al., 2019; Swietlicki et al., 2008).
Volatility affects the gas–particle distribution of aerosol particles and influences their dry and wet deposition rates (Hakala et al., 2016; Bidleman, 1988), as well as their atmospheric lifetimes (Huffman et al., 2009). Therefore, studying particle volatility across different regions and environments is essential. The volatility properties of atmospheric aerosols have been investigated using several instruments and techniques (Xu et al., 2019; Jiang et al., 2018; Karnezi et al., 2014). The volatility tandem differential mobility analyzer (V-TDMA) is a commonly used instrument for measuring the volatility of particles. By comparing changes in the diameters of particles before and after being heated at a certain temperature, the volatility of particles can be inferred. Most organic compounds evaporate at relatively low temperatures, and 98 % of secondary organic aerosols evaporated at approximately 75 °C (An et al., 2007; Tritscher et al., 2011). Ammonium nitrate and ammonium chloride volatilize completely at temperatures below 150 °C, while ammonium sulfate volatilizes entirely between 180 and 230 °C (Huffman et al., 2008; Feng et al., 2023). However, some compounds like black carbon (BC), soot, sea salt, and crustal materials do not volatilize even at higher temperatures (Massling et al., 2009; Wehner et al., 2009; Zhang et al., 2016). The V-TDMA is usually used to assess the mixing state of typically non-volatile BC particles (Chen et al., 2022; Wehner et al., 2009) and to determine the number and volume fractions of non-volatile material at a selected temperature for particles (Zhang et al., 2016; Jiang et al., 2018; Ghadikolaei et al., 2020). Studies indicate that BC's internal mixing is higher in winter than in summer (Chen et al., 2022) and increases significantly during the pollution period compared to the cleaner period (Wehner et al., 2009; Z. Wang et al., 2017).
Although previous studies have focused on the hygroscopicity or volatility of aerosol particles at different sampling locations under varying atmospheric conditions using an H-TDMA or V-TDMA (Zhang et al., 2023; Wang et al., 2019; Jiang et al., 2018; Wu et al., 2016; Ye et al., 2013), simultaneous measurements of both properties, particularly in China, have been scarce. The volatility hygroscopicity tandem differential mobility analyzer (VH-TDMA) combines the measurement characteristics of the V-TDMA and H-TDMA systems, providing an opportunity to simultaneously study the hygroscopicity and volatility of particles, as well as the hygroscopicity of the particle core after volatilization (Häkkinen et al., 2012; Villani et al., 2008; Johnson et al., 2005). This instrument has been applied in different environments such as oceans (Modini et al., 2009; Johnson et al., 2005), forests (Ristovski et al., 2010; Hong et al., 2014), and urban areas (Enroth et al., 2018; Hakala et al., 2016; Villani et al., 2013) to investigate aerosol mixing states and reveal correlations between hydrophobic and non-volatile particles (Modini et al., 2009; Ristovski et al., 2010; Enroth et al., 2018). For instance, a study in Budapest (Hungary) demonstrated that while hygroscopic particles are generally volatile, hydrophobic and low-volatility particles are predominantly combustion particles emitted from vehicles (Enroth et al., 2018). Zhang et al. (2016) observed strong correlations between hydrophobic and non-volatile particles at a suburban site in Beijing. However, a weak linear relationship was reported between hydrophobic and non-volatile particles in urban Beijing (Y. Wang et al., 2017). Four cases in a previous study by Villani et al. (2008) showed that gentle thermodesorption has a significant impact on the hygroscopicity of particles at a given RH. This suggests that the loss of volatile material from the particle surface may significantly increase or decrease the hygroscopic growth, depending on the nature of the condensed material. Research on forest aerosol particles shows that hygroscopic materials remain in the particles even after being heated at 280 °C (Hong et al., 2014). Simultaneous measurement of the hygroscopicity and volatility of aerosol particles remains scarce. To our knowledge, no study in China has yet focused on the hygroscopicity of particles after heating. Investigating the hygroscopicity of the particle core after volatilization is crucial for understanding the particles' composition and sources. In recent years, China has made significant progress in air pollution control. However, atmospheric aerosol pollution events still frequently occur in major cities (Zhang et al., 2018; Wang et al., 2019; Fan et al., 2020b; Miao et al., 2021; Lu et al., 2024). Beijing, the capital of China, regularly experiences haze events due to its large population, substantial industrial emissions, and an increasing number of vehicles (Zhong et al., 2018; Huang et al., 2021; Yang et al., 2023). In this study, we utilized the VH-TDMA system for the first time to investigate the hygroscopicity and volatility of submicron aerosols and the hygroscopicity of their non-volatile cores in urban Beijing during the autumn of 2023. We explored the variations in hygroscopicity, volatility, and particle mixing states under different atmospheric conditions and further analyzed the relationship between the hygroscopicity and volatility of aerosol particles. We also studied the hygroscopicity of non-volatile particles after being heated at 270 °C, a temperature at which atmospheric sulfates, nitrates, and most organic compounds are typically volatile, whereas soot, sea salt, or certain organic polymers would remain refractory (Enroth et al., 2018; Johnson et al., 2005).
2.1 Sampling site
This study was conducted in the Beijing urban area, with the sampling site located at the Chinese Academy of Meteorological Sciences (CAMS; 39.97° N, 116.37° E), situated on the campus of the China Meteorological Administration in Beijing, China. The site is located between the 2nd Ring Road and 3rd Ring Road of Beijing. To the west of the site is a major road with heavy traffic, located less than 200 m away, and the site is predominantly affected by residential and traffic emissions (Wang et al., 2018). Measurements of aerosol hygroscopicity and volatility were conducted from 11 October to 6 November 2023 in a laboratory on the second floor (∼6 m above ground level (a.g.l.)) of the CAMS building. The particle number size distribution and mass concentrations of the main chemical composition of non-refractory PM1 were simultaneously measured on the observation platform located on the roof of the CAMS building, where ambient aerosols were pumped through a PM10 impactor (URG Corporation at a flow rate of 16.7 L min−1) and were then dried to less than 30 % RH using an automatic aerosol dryer. The dried sample was then split through a manifold to different instruments, including a twin scanning mobility particle sizer (TSMPS, TROPOS, Germany) and a high-resolution time-of-flight aerosol mass spectrometer (HR-ToF-AMS, Aerodyne Research Inc., USA). For the VH-TDMA system, a silica dryer and a Nafion dryer in series were used to dry the sample air to less than 30 % RH. A more detailed description of the instruments used in this study is provided below.
2.2 Experimental setup
The schematic diagram of the volatility hygroscopicity tandem differential mobility analyzer (VH-TDMA) (TROPOS, Germany) is shown in Fig. 1. The VH-TDMA components mainly consist of three medium Hauke-type differential mobility analyzers (DMA1, DMA2, and DMA3, TROPOS, Germany), two condensation particle counters (CPC1 and CPC2; CPC 3772, TSI Inc., USA), an X-ray aerosol neutralizer (model 3088, TSI Inc., USA), custom-made Nafion dryers, thermal denuders (TDs), and humidifiers. DMA1 is utilized for the size selection of monodisperse particles, while DMA2–CPC1 and DMA3–CPC2 are used to measure thermally treated and humidified aerosols, respectively. The thermal denuder includes four columns, whose temperatures can be individually controlled from ambient temperature up to 350 °C, whereas the RH of the aerosol and sheath air can be controlled up to 90 % and is monitored by two humidity and temperature probes (HMP7, Vaisala, Finland) and regulated by adjusting the proportion of dry and wet air using mass flow controllers (MKS Instruments, USA). DMA3 and the humidifiers are placed inside a temperature-controlled box to maintain a temperature stable. The system also includes a nebulizer setup for routine hygroscopicity checks using ammonium sulfate solution, as well as ball valves, which control the system operation modes through a homemade program.
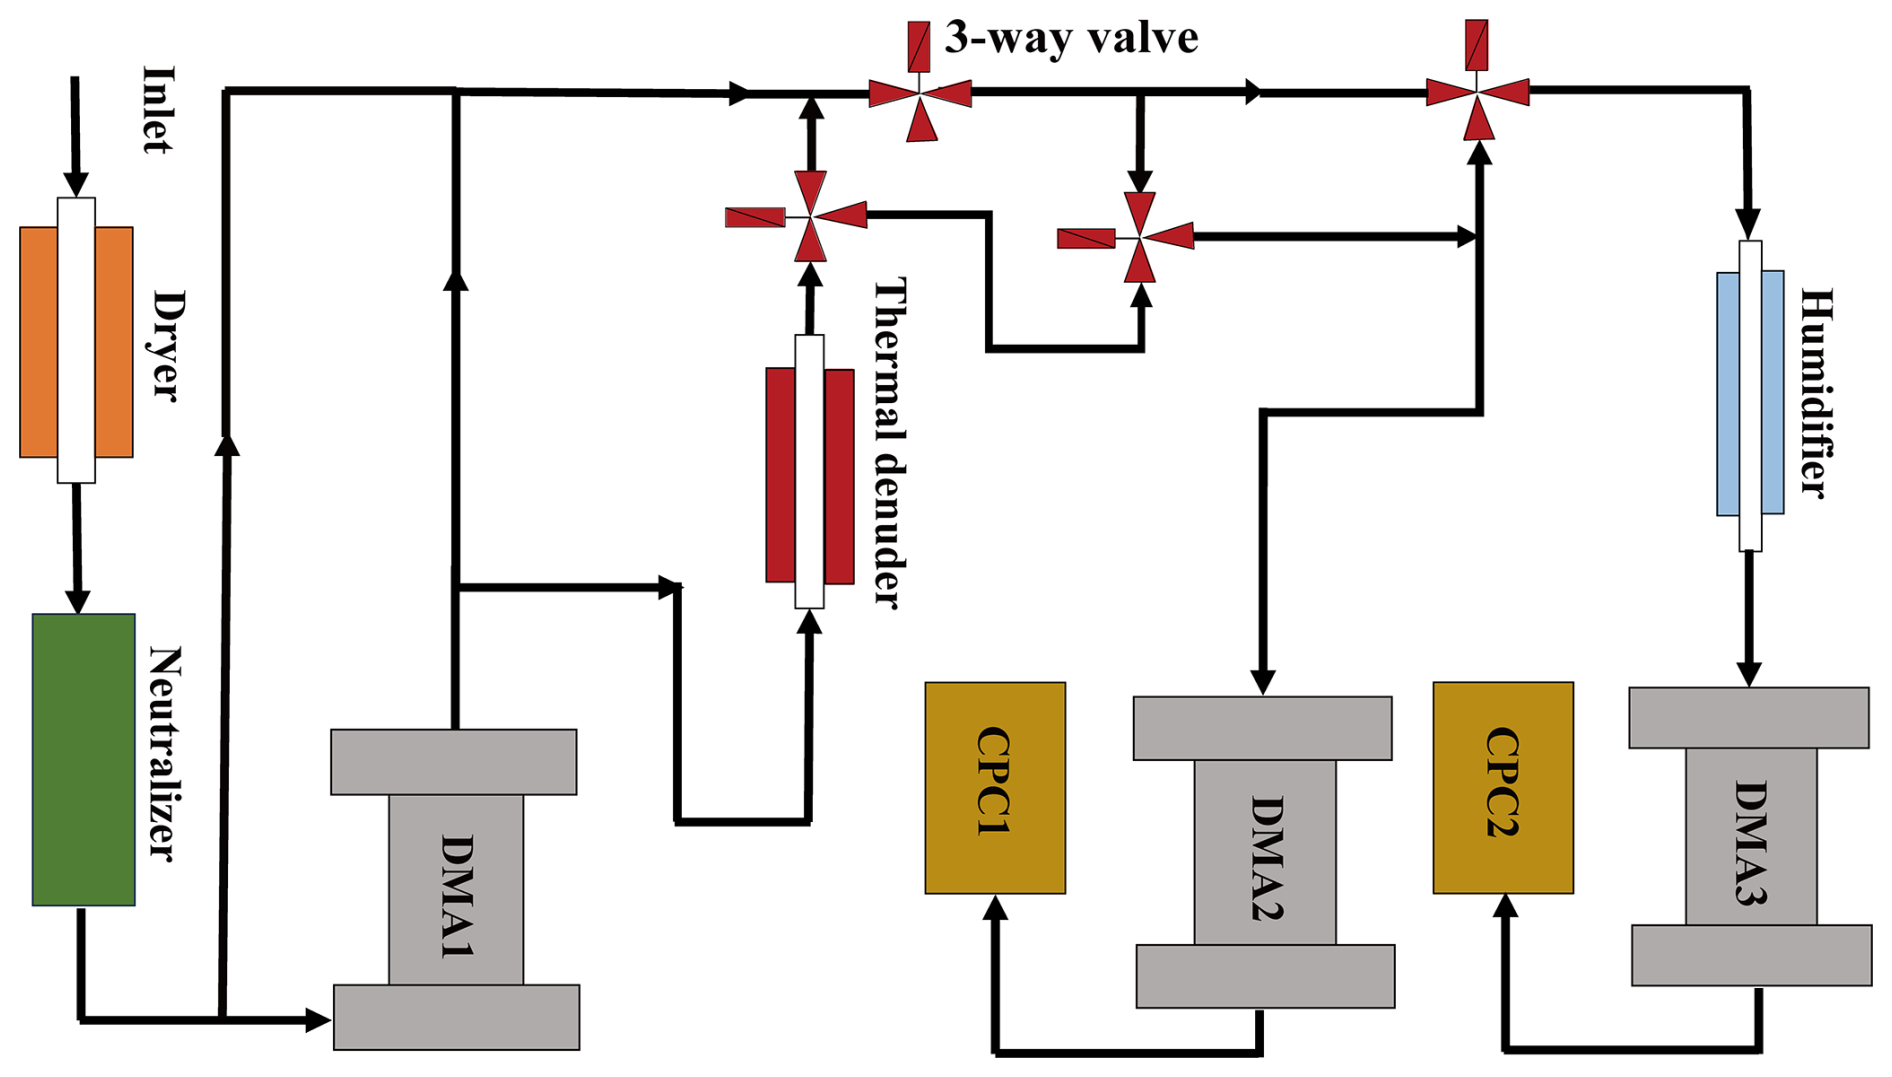
In this study, the VH-TDMA was alternately operated in combinations of V-TDMA mode and H-TDMA mode or V-TDMA mode and VH-TDMA mode. In the first combination, the monodisperse particles from DMA1 were equally split into two flows. One flow went to the thermal denuder set at 270 °C and then to DMA2–CPC1 for measuring the size distribution of heated particles. The other flow went to the aerosol humidifier set at 90 % RH and then to DMA3–CPC2 for measuring the size distribution of humidified particles. Therefore, the volatility and hygroscopicity of particles were simultaneously measured in this combination. Similarly, in the latter combination, the particles from DMA1 went through the thermal denuder first and then were equally split into two flows. One flow went directly to DMA2–CPC1 for measuring the size distribution of heated particles, and another flow went to the aerosol humidifier at 90 % RH and then to DMA3–CPC2 for measuring hygroscopicity of these particles after heating. The sample air for the VH-TDMA was dried to an RH of less than 30 % using a silica dryer and a Nafion dryer in series and was then neutralized with an X-ray aerosol neutralizer. All DMAs were operated with a sheath-to-aerosol flow ratio of 5:1. For DMA1, the sheath flow was 10 L min−1 with an aerosol flow of 2 L min−1, while for DMA2 and DMA3, the sheath flow was 5 L min−1 and the aerosol flow was 1 L min−1. The particle diameters selected by DMA1 were 50, 80, 110, and 150 nm, which were scanned using different size ranges after hydration or volatilization. Detailed information is provided in Table S1 in the Supplement. Each particle size was sampled for approximately 15 min, including about 8 min for measurement and 6 min for system flushing between combination changes or size changes, with each cycle lasting about 1 h. The thermal denuder is a well-insulated cylindrical metal tube and maintained a consistent heating temperature at 270 ± 0.5 °C. The RH of the aerosol flow and sheath flow in the humidification system was set to 90 % and maintained at 90 ± 1 %. The hygroscopicity of 100 nm ammonium sulfate ((NH4)2SO4) particles generated by the nebulizer was measured regularly to check the accuracy of RH measurement or system performance. Size calibration was also conducted for DMAs using polystyrene latex (PSL) sphere particles with a nominal size of 203 nm. Data inversion was accomplished using the TDMAinv program package (Gysel et al., 2009) in Igor Pro software.
The particle number size distribution (PNSD) in the range of 3–850 nm is measured by a twin scanning mobility particle sizer (TSMPS, TROPOS, Germany). This system is comprised of two differential mobility analyzers (DMA and UDMA, TROPOS, Germany) and two CPCs (CPC 3772 and ultrafine CPC 3776, TSI Inc., St Paul, MN, USA). The combination of CPCs and DMAs can measure the PNSD in the size ranges of 3–80 and 40–850 nm, respectively. The combined PNSD covers the size range of 3–850 nm with 40 size bins at a 10 min time resolution. More information about the instrument setup and data evaluation can be found in Shen et al. (2018).
In addition, a high-resolution time-of-flight aerosol mass spectrometer (HR-ToF-AMS, Aerodyne Research Inc., USA) was used to measure the mass concentrations of the main chemical composition of non-refractory PM1, including organic matter, sulfate, nitrate, ammonium, and chloride, from 24 October to 6 November 2023, with a time resolution of 5 min. For more detailed information on the working principles of the instrument and data processing, refer to Zhang et al. (2012).
The mass concentrations of hourly PM2.5 and PM10 in this study were from the Guanyuan air quality monitoring site, China National Environmental Monitoring Center (CNEMC, http://www.cnemc.cn, last access: 10 January 2024), located ∼3 km from the CAMS site. Hourly meteorological data used in this study were from the Haidian National Basic Meteorological Station (station no. 54399) of the Beijing Meteorological Bureau, located ∼ 5 km northwest of the CAMS site. Global Data Assimilation System (GDAS) data from the National Centers for Environmental Prediction (NCEP) were used to derive 48 h backward trajectories at an altitude of 500 m a.g.l. of the CAMS station, using the trajectory calculation software TrajStat developed by Wang et al. (2011) at the Chinese Academy of Meteorological Sciences. All data in this study are in Beijing time (UTC+8, also known as China standard time).
3.1 Parameters derived from the VH-TDMA
The hygroscopic growth factor (HGF) is defined as the ratio of the particle's electrical mobility diameter at a given relative humidity to its diameter under dry conditions at room temperature:
In this study, Dp(Troom,RHdry) is the particle diameter selected by DMA1 at room temperature and an RH below 30 %, while Dp(Troom,RH) is the diameter of the same particle after being humidified at an RH of 90 %.
The volatile shrink factor (VSF) is defined as the ratio of the particle's electrical mobility diameter at a given temperature to its diameter at room temperature under dry conditions:
In this study, Dp(T,RHdry) is the particle diameter at a set heating temperature of 270 °C, which lies in the middle of the optimum temperature range of 250–300 °C to avoid size-dependent effects (Villani et al., 2007).
The volatility hygroscopic growth factor (VHGF) is defined as the ratio of a particle's electrical mobility diameter after humidification following heating to its diameter under dry conditions:
In this study, Dp(T,RH) is the diameter of particle after humidification at 90 % RH following heating at 270 °C.
The hygroscopic growth factor of the non-volatile core of the aerosol particle after heating, denoted HGFcore, is derived as (Hong et al., 2014)
The volume fraction remaining (VFR) after heating was calculated from the VSF assuming a spherical shape of particles both before and after heating:
Thus, 1 − VFR is the volume fraction of the volatile coating for particles.
According to the Zdanovskii–Stokes–Robinson (ZSR) relation (Stokes and Robinson, 1966), the hygroscopic growth factor of a particle can be estimated from the HGFs of its components according to their volume fractions (Gysel et al., 2009; Swietlicki et al., 2008). Therefore, the mean hygroscopic growth factor of volatile fraction of particles in this study can be calculated as follows:
where HGFmean, HGFcore, and HGFcoating are the mean hygroscopic growth factors at 90 % RH for dry particles, the non-volatile core, and the volatile coating, respectively.
The HGF PDF, VSF PDF, and VHGF PDF (volatile hygroscopic growth factor probability density function) were retrieved from the measured number size distributions of humidified aerosol particles, volatile aerosol particles, and particles following humidification after heating. c(HGF, Dp), c(VSF, Dp), and c(VHGF, Dp) are the probability density functions of the particle HGF, VSF, and VHGF, respectively. They describe the probability that particles with a dry diameter Dp exhibit a certain HGF, VSF, or VHGF under a defined treatment. The inverted probability density functions are normalized such that the total probability equals unity: (Gysel et al., 2009). The number-weighted mean hygroscopic growth factor was calculated as follows:
The mean VSF (VSFmean) and mean VHGF (VHGFmean) were calculated in the same way as the HGFmean.
According to κ-Köhler theory (Petters and Kreidenweis, 2007), the single hygroscopic parameter κ can be calculated as follows:
where RH is the relative humidity; HGF is the mean hygroscopic growth factor from Eq. (7); Dp is the diameter of dry particles; σ is the droplet surface tension (assumed to be that of pure water, ); Mw is the molecular mass of water; R is the universal gas constant; and T and ρw are the temperature (in K) and density of water, respectively.
Based on the measured HGF PDFs and VSF PDFs, aerosol particles were classified into two hygroscopic groups and two volatile groups in this study, i.e., nearly hydrophobic (NH) mode particles (HGF≤1.2) and more hygroscopic (MH) mode particles (HGF>1.2), as well as non-volatile (NV) mode particles (VSF≥0.8) and very volatile (VV) mode particles (VSF<0.8).
The number fraction (NF) is defined as the proportion of the number of particles with an HGF in the boundary of (a,b) and is computed as follows:
The number of particles with a VSF in the boundary was calculated in the same way as the number of particles with an HGF.
The standard deviation (σ) of the HGF PDF is used as a measure for the spread of hygroscopic growth factors (Liu et al., 2011; Sjogren et al., 2008) and is defined as follows:
σHGF PDF≤0.10 indicates that particles are in a state of internal mixing with limited spread of hygroscopic growth factors, while σHGF PDF≥0.15 indicates substantial external mixing (Sjogren et al., 2008).
3.2 Interference of multi-charged aerosol particles
The DMA selects aerosol particles based on their electrical mobility, which depends on both their physical diameter and the charge they carry. Therefore, aerosol particles selected by DMA1 can have different physical diameters if they carry different numbers of charges, which could potentially lead to inaccuracies in the measured hygroscopic growth factor (Gysel et al., 2009; Duplissy et al., 2009). Based on the simultaneously measured particle number size distribution of the dry ambient aerosol, the charge probability and the transfer function of DMA, the number fraction of particles with different charges was calculated using Petters' program and is shown in Fig. S1 in the Supplement (Petters, 2018; Wiedensohler, 1988). The results indicate that the number fraction of singly charged particles among the 50, 80, 110, and 150 nm particles selected by DMA1 was 94 %, 89 %, 84 %, and 84 %, respectively, during the clean period, whereas during the pollution periods, the value was 91 %, 81 %, 74 %, and 72 %, respectively. Duplissy et al. (2009) mentioned that when the ratio of singly charged aerosol particles exceeds 80 % of the total particles, H-TDMA data analysis is straightforward and not biased by the multiply charged aerosol particles. Since singly charged particles dominated in our study, the effect of multiply charged particles should be insignificant, although the number fraction of singly charged particles for some sizes during pollution periods was slightly lower than 80 %.
To further investigate the impact of multi-charged particles on the hygroscopicity of singly charged particles, the apparent electrical mobility diameters of doubly and triply charged particles after hygroscopic growth were calculated and are shown in Table S2 and Fig. S2. During the calculation, we considered the variation in hygroscopicity with both particle diameter and pollution level. Supposing that multi-charged particles have the same HGF as singly charged particles with the same electrical mobility, the apparent mobility diameter of doubly or triply charged particles was a few percent smaller (less than 5 % for the size range of 50–150 nm) than that of singly charged particles after hydration. This difference was increased for particles with higher charges and larger particle size (Table S2). However, supposing that an HGF of the multi-charged particles equals that of particles with the same physical diameter under a different pollution level, the apparent mobility diameter of doubly or triply charged particles could be either larger or smaller by a few percent (less than 12 % for the size range of 50–150 nm) compared to singly charged particles after hydration. In this case, the difference was larger for smaller particle sizes (Table S2, Fig. S2), which is contrary to the results obtained under the above assumption. It is worth noting that the HGF of multi-charged particles was interpolated from the measured size-resolved HGF. When a particle's physical diameter exceeded the maximum of the measured size (150 nm), the HGF (150 nm) was used in the latter assumption. For particles with the same electrical mobility but different charges, it is clear that the apparent mobility diameter of doubly or triply charged particles after hydration could be either larger or smaller than that of singly charged particles after hydration, which is related to the mobility size and the assumed hygroscopicity of multi-charged particles.
4.1 Meteorological conditions during the sampling period
Time series of hourly meteorological parameters and PM2.5 PM10 mass concentrations from 11 October to 6 November 2023 are shown in Fig. 2a. The average mass concentrations of PM2.5 and PM10 were 50.7 ± 51.7 and 95.0 ± 72.2 µg m−3, respectively. Temperature and relative humidity ranged from 1.8 to 28.4 °C and 14 % to 100 %, with averages of 13.9 ± 5.1 °C and 66.3 ± 25.8 %, respectively. The average wind speed was 0.9 ± 0.9 m s−1 during the sampling period, predominantly from the northeast. Pollution periods were defined as times when hourly PM2.5 concentrations exceeded 75 µg m−3, based on Grade II standard values of Chinese ambient air quality standards (GB3095-2012). Three pollution periods are identified as PI (12 October at 09:00–13 October at 09:00), PII (23 October at 09:00–25 October at 13:00), and PIII (28 October at 10:00–2 November at 17:00). It is worth mentioning that for more than 90 % of the time period, an orange alert for severe air pollution (30 October at 12:00–2 November at 24:00) was included in PIII. We classified the periods with hourly PM2.5 concentrations below 30 µg m−3 during new-particle-formation (NPF) event days as clean periods (13 October at 11:00–16 October at 23:00; 18 October at 05:00–21 October at 23:00; 26 October, 00:00–23:00; 3 November, 00:00–23:00; and 6 November, 00:00–23:00), during which 11 NPF events were observed (Fig. 2b). The mean PNSD during the NPF days and PNSD during each NPF day are shown in Fig. S6, which indicates that NPF typically occurred around 10:00.
During the pollution period, average concentrations of PM10 and PM2.5 were 185.2 ± 41.6 and 118.7 ± 33.1 µg m−3, respectively, compared to 32.3 ± 24.3 µg m−3 for PM10 and 9.2 ± 6.5 µg m−3 for PM2.5 during the clean period. The average wind speed during the pollution period (0.7 ± 0.6 m s−1) was lower than that during the clean period (1.2 ± 1.1 m s−1), which facilitates the accumulation of pollutants (Wehner et al., 2008). Analysis of air mass back trajectories during the pollution period (Fig. S3b) reveals that 76 % of the air masses passed through the densely populated southern region of Beijing (such as Hebei, northwestern Shandong, and northern Shanxi) and 98.5 % of the air masses traveled below 1.0 km before reaching the sampling site. In contrast, air masses originated from the northwest during the clean period (Fig. S3a). Air masses from the northwest moved more quickly and accumulated fewer pollutants during the transport before reaching the sampling site.
4.2 Time series of HGF PDFs and VSF PDFs and averages of hygroscopicity and volatility
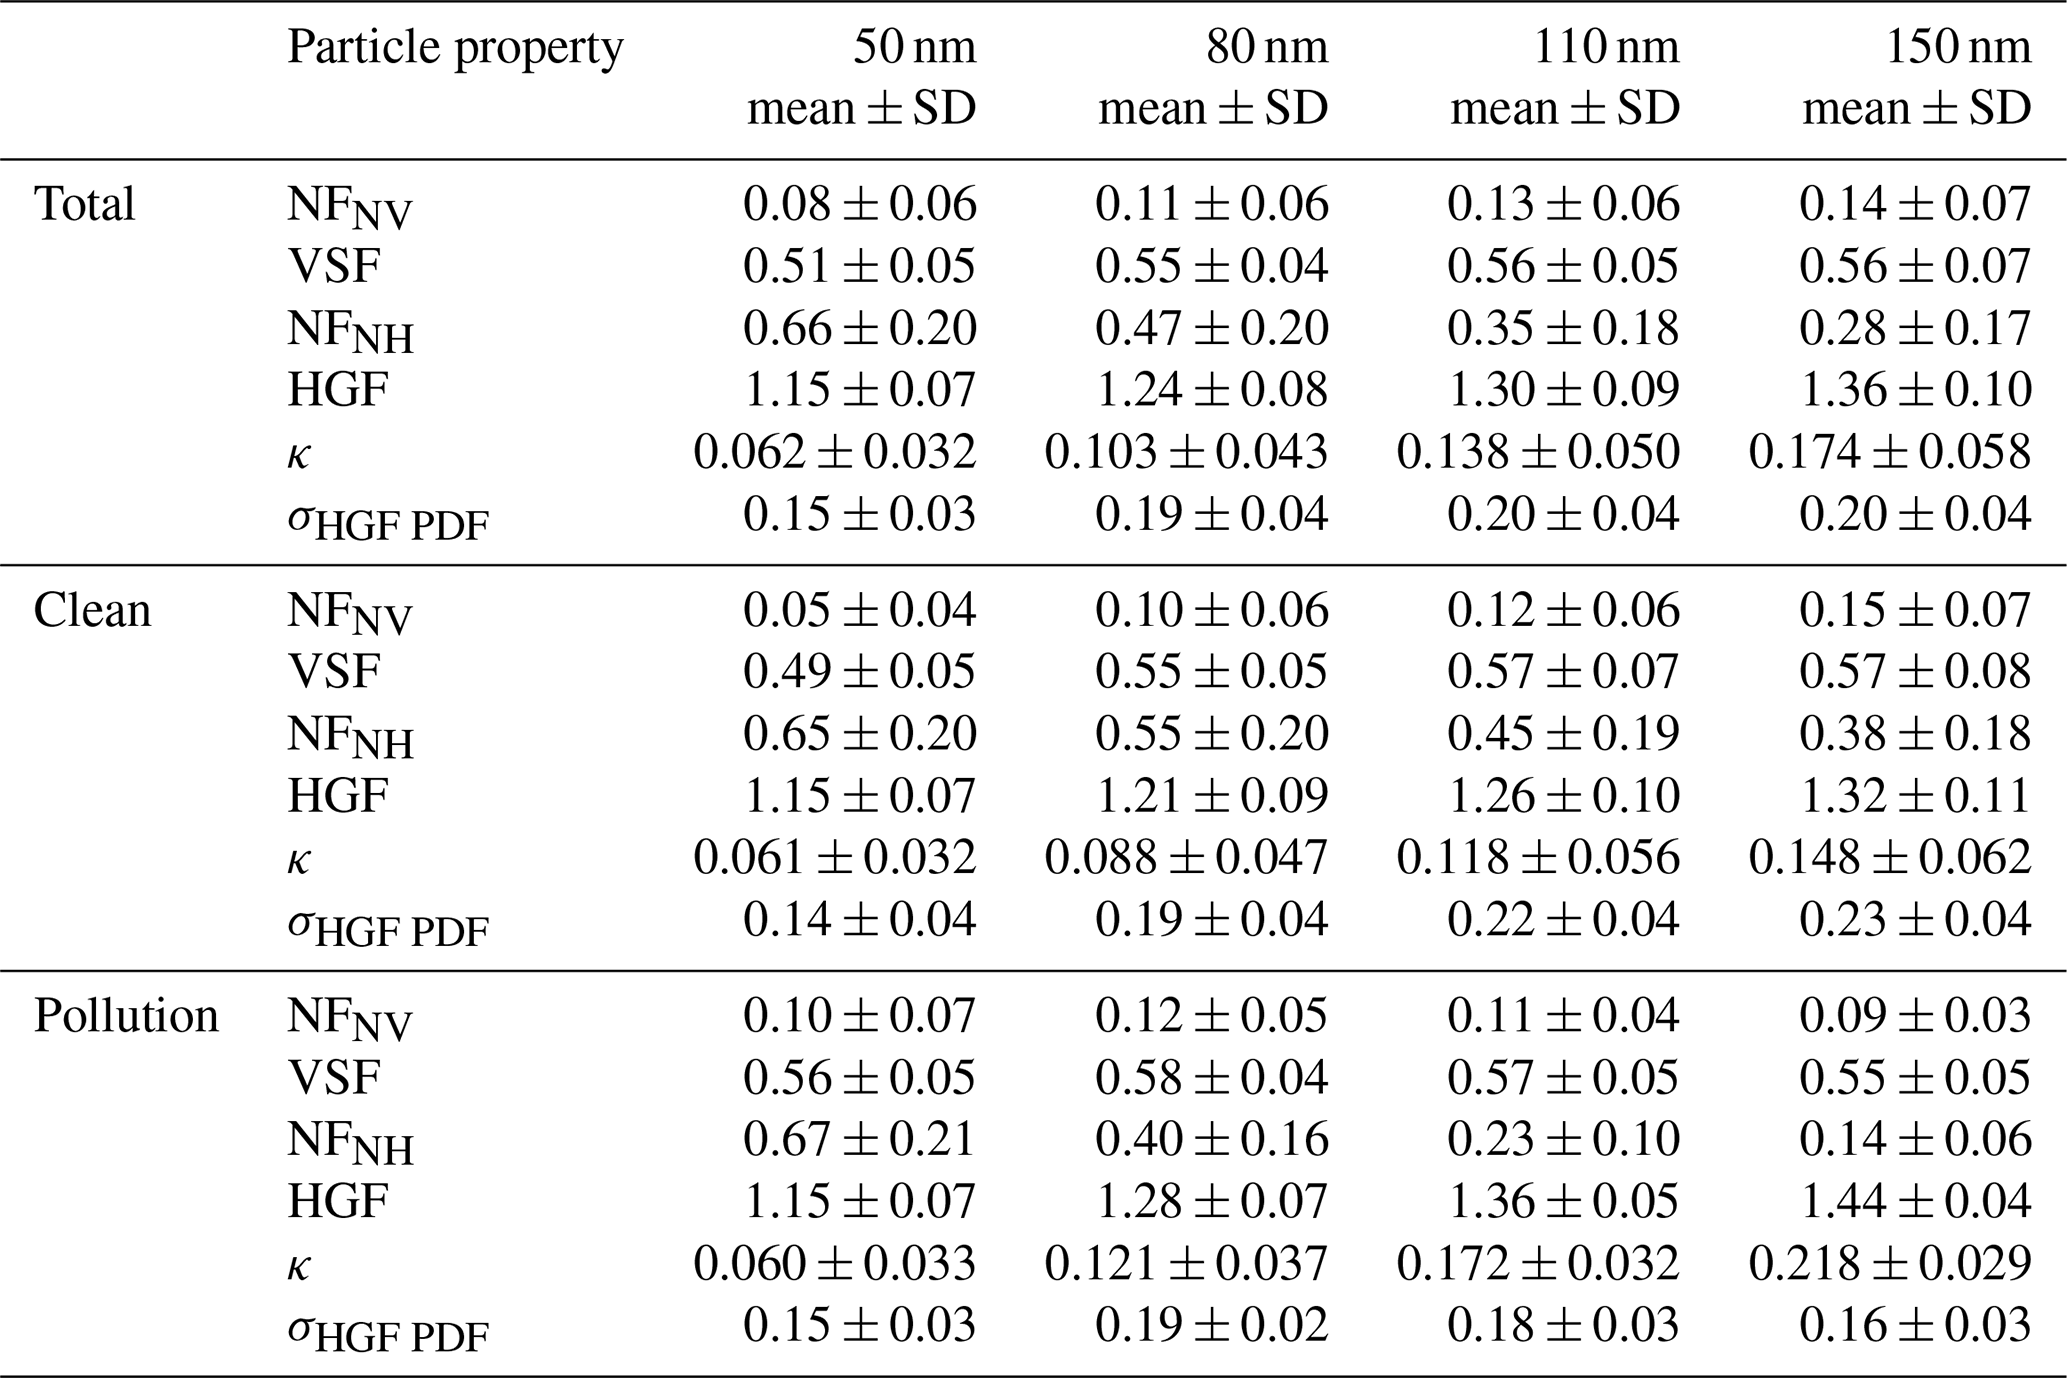
Figures 2 and S4 show the time series of HGF PDFs and VSF PDFs for different size particles throughout the sampling period. Both HGF PDFs and VSF PDFs exhibited clearly bimodal distributions for 50 and 150 nm particles (Fig. 2), similar to those for 80 and 110 nm particles shown in Fig. S4. As mentioned above, the lower (HGF≤1.2) and higher modes (HGF>1.2) of HGF PDFs are referred to as NH and MH modes, respectively. The lower (VSF<0.8) and higher mode (VSF≥0.8) of VSF PDFs correspond to the VV and NV mode, respectively. As shown in Fig. 2c–f, the MH mode for HGF PDFs and the VV mode for VSF PDFs showed larger variations than the NH mode and NV mode during the course of the sampling period. However, HGF PDFs and VSF PDFs for 150 nm particles exhibited smaller variations and higher proportions of more hygroscopic (MH) and very volatile (VV) modes during the pollution period, especially during PIII (Fig. 2d and f). The variations in the HGF PDFs and VSF PDFs over time could be influenced by different emission sources, atmospheric processes, meteorological factors, and air mass origins (Enroth et al., 2018). Although the unimodal or bimodal distribution of the HGF PDFs and VSF PDFs could give some information on the mixing state of particles, the standard deviation of the HGF PDF is used to quantify the degree of external mixing of particles (Sjogren et al., 2008; Liu et al., 2011). A value of σHGF PDF≥0.15 indicates an externally mixed state, as defined by Sjogren et al. (2008). In this study, more than 85 % of the HGF PDF for 80, 110, and 150 nm aerosol particles was exhibited a σHGF PDF≥ 0.15, while it was 46 % for the 50 nm aerosol particles. The mean σHGF PDF for 50, 80, 110, and 150 nm particles was 0.15 ± 0.03, 0.19 ± 0.04, 0.20 ± 0.04, and 0.20 ± 0.04, respectively. These results indicate a stronger degree of external mixing for larger particles.
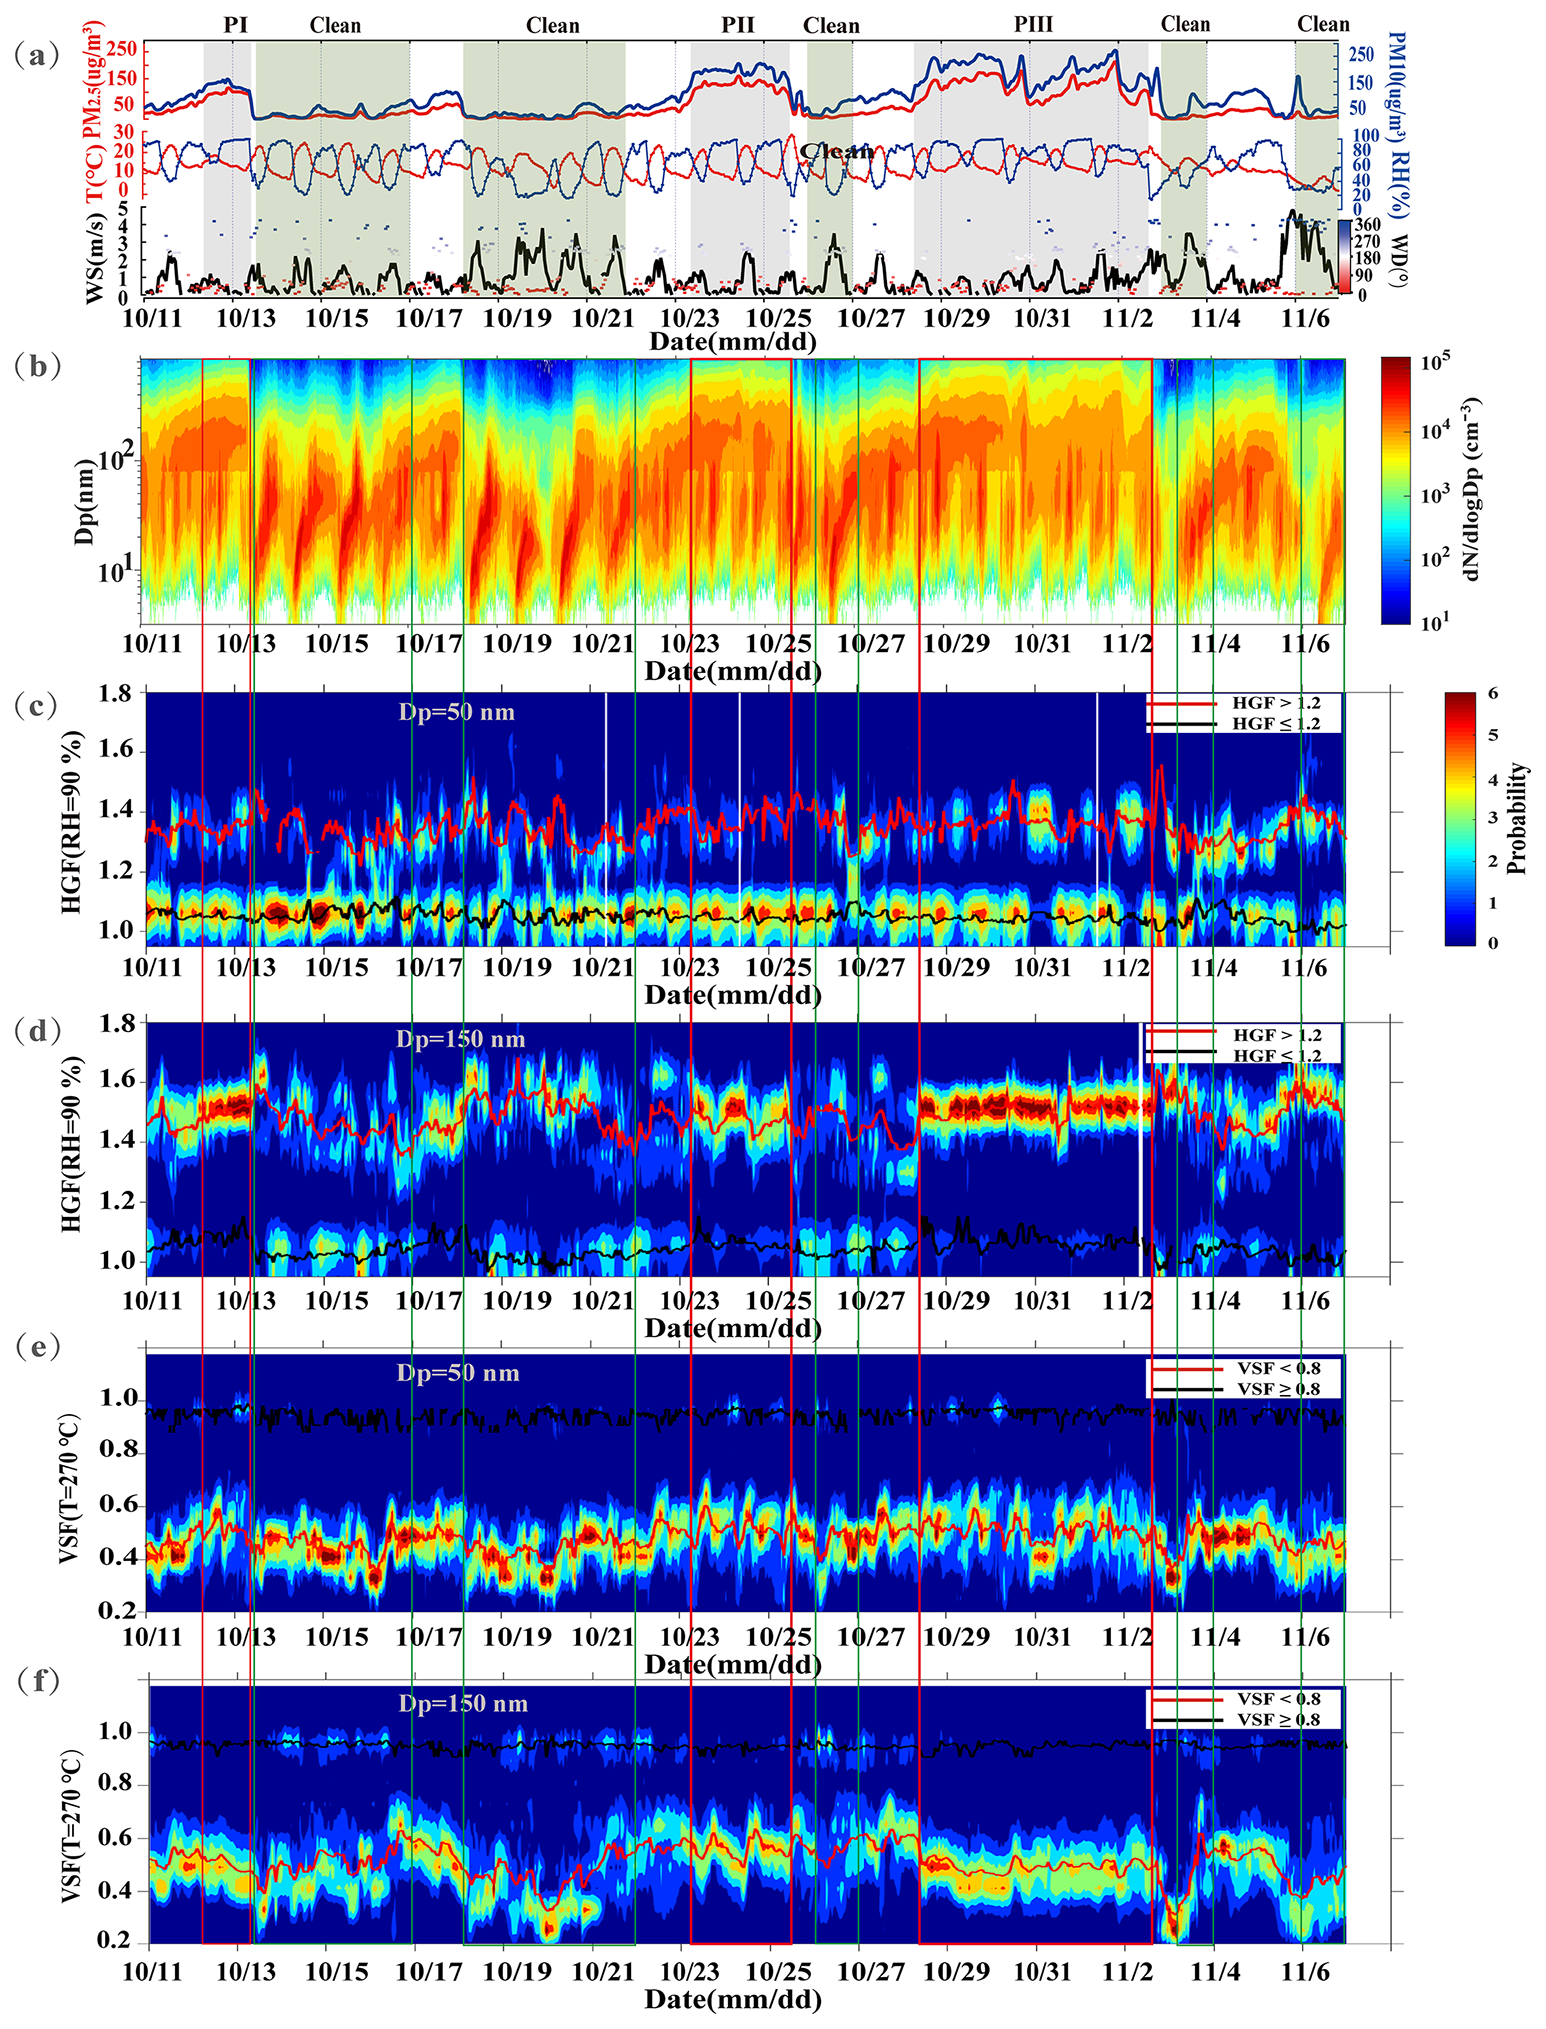
Figure 2Time series of the PM2.5 and PM10 mass concentrations and meteorological parameters (WS and WD denote wind speed and wind direction, respectively) (a), PNSD from the TSMPS (b), hygroscopic growth factor probability density function (HGF PDF) for 50 nm (c) and 150 nm (d) particles at RH=90 %, and volatile shrink factor probability density function (VSF PDF) for 50 nm (e) and 150 nm (f) particles at T=270 °C. In the HGF PDFs, the black line represents the mean HGF of the nearly hydrophobic mode (HGFNH) and the red line represents the mean HGF of the more hygroscopic mode (HGFMH). In the VSF PDFs, the black line represents the mean VSF of the non-volatile mode (VSFNV) and the red line represents the mean VSF of the very volatile mode (VSFVV).
Figure 3 displays the size-resolved mean HGF PDFs and VSF PDFs for the sampling periods. As mentioned above, both the HGF PDFs and the VSF PDFs exhibited a clearly bimodal distribution. Table 1 summarizes the size-resolved mean HGF, VSF, κ, the number fraction of nearly hydrophobic particles, the number fraction of non-volatile particles, and the growth spread factor (σHGF PDF) of the HGF PDF during different periods. The averaged HGF PDFs at 90 % RH typically show a minimum at an HGF of around 1.2 (Fig. 3a), which is why we use HGF=1.2 as the separation between NH and MH mode in this study. The contribution of the NH mode in the HGF PDF decreased with increasing particle diameter, with the average number fraction of NH (NFNH) decreasing monotonically from 66 % to 28 % as the particle diameter increased from 50 to 150 nm (Fig. 3a and Table 1). The peak values of the NH mode remained around 1.06, independent of particle diameter. The peak values of the MH mode increased from 1.33 to 1.52 as particle size increased from 50 to 150 nm. A previous study has found that the proportion of the NH mode is higher in Beijing than that in Shanghai and Guangzhou, resulting from higher emissions of hydrophobic primary aerosols in Beijing likely due to a higher number of vehicles (Ye et al., 2013). The strength of the MH mode increased with particle size, indicating that the proportion of strongly hygroscopic particles gradually increases with particle size. MH mode particles are mainly from secondary formation or the aging of primary particles (Wang et al., 2019).
The averaged VSF PDFs typically showed a minimum at a VSF of around 0.8 (Fig. 3b); thus we use VSF=0.8 as the separation between NV and VV mode. The contribution of the NV mode in the VSF PDF increased with particle diameter, and the average number fraction of NV (NFNV) increased from 8 % to 14 % (Fig. 3b). This trend aligns with observations in Beijing and Shanghai (Jiang et al., 2018; Wehner et al., 2009). Particles in the NV mode contained non-volatile species, likely BC, highly oxidized organics, or polymers (Hong et al., 2014). Larger particles showed stronger NV modes, which are significantly influenced by highly oxidized organics aerosols, and volatility is generally inversely correlated with the oxidation state (Y. Wang et al., 2017). The size-resolved VSF PDFs exhibited an NV mode peak near 0.95 and a broad, approximately symmetric VV mode peak ranging between 0.47 and 0.52 for all measured particle diameters. Unlike the MH mode, the peak values in the VV mode showed no clear dependency on diameter. Additionally, NFNV was observed to be lower than NFNH in this study, indicating a significant presence of hydrophobic but volatile particles. Previous research suggests that NFNH and NFNV are predominantly influenced by the same component, associated with newly emitted combustion particles (Liu et al., 2013; Cheung et al., 2016; Zhang et al., 2016). The lower proportion of NFNV observed in this study could be attributed to Beijing's recent restrictions on coal burning, which have led to a reduction in non-volatile and non-hygroscopic carbon emissions (Hu et al., 2024). Currently, traffic emissions are the primary pollution source in Beijing, characterized by freshly emitted organics from vehicles with a low-oxidation state, high volatility, and low hygroscopicity (Tiitta et al., 2010; Feng et al., 2023; Liu et al., 2023).
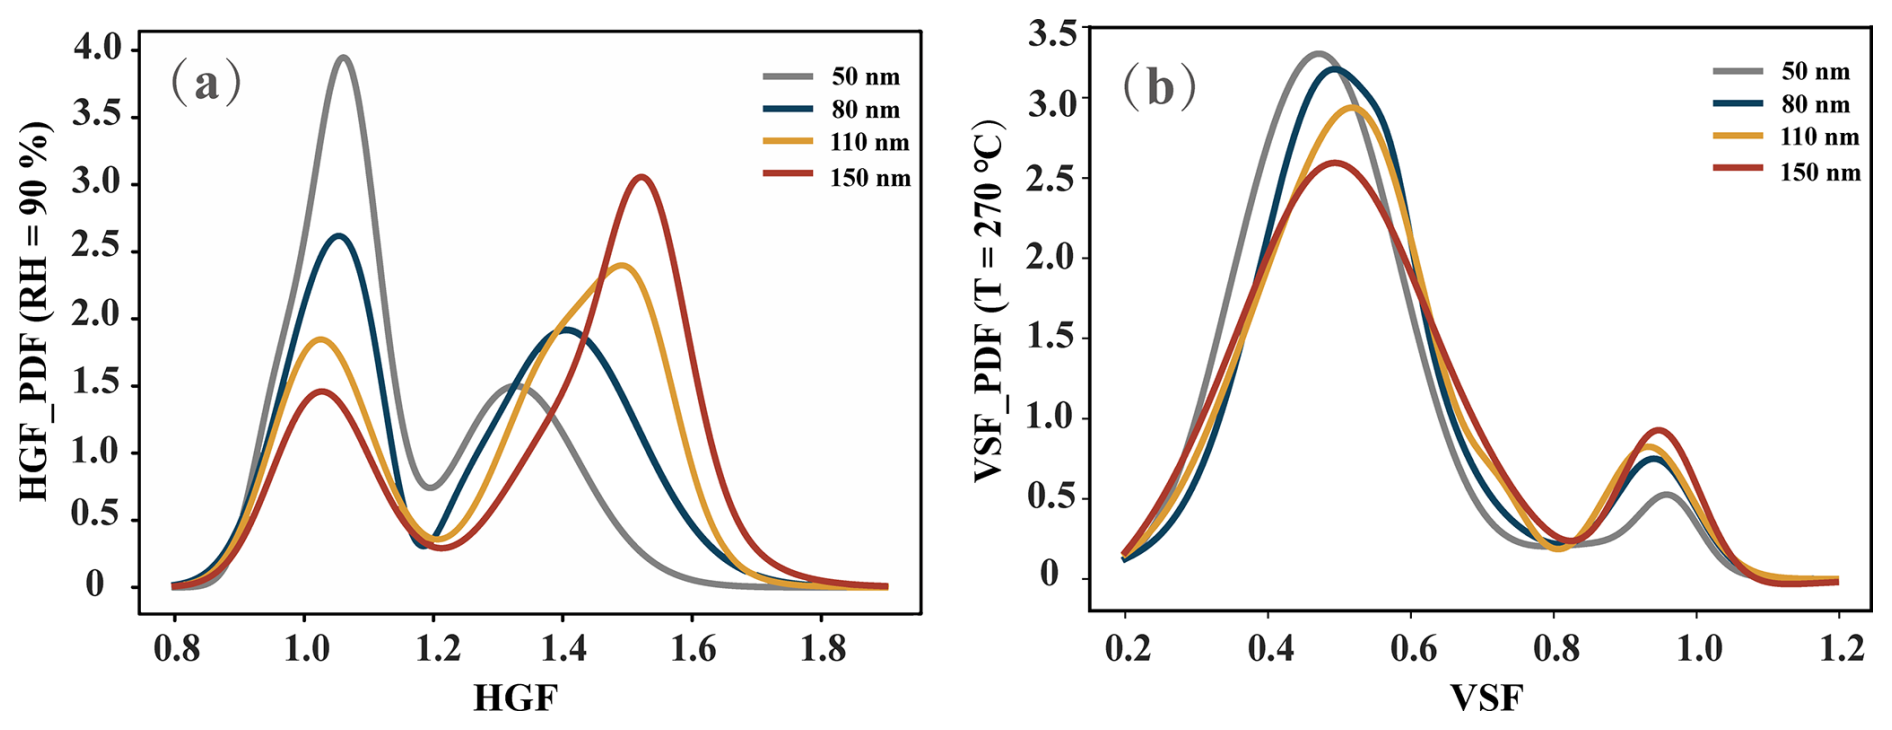
Figure 3Size-resolved mean hygroscopicity growth factor probability density functions (HGF PDFs) (a) and volatility shrink factor probability density functions (VSF PDFs) (b) for particles ranging from 50 to 150 nm throughout the sampling period.
Table 1Summary of the hygroscopicity and volatility parameters throughout the sampling period from 11 October to 6 November 2023, as well as during the clean and pollution periods.
4.3 Diurnal variations in the single hygroscopicity parameter and VSFmean
Figure 4a and b display the diurnal variation in the mean single hygroscopicity parameter (κmean) for particles of different sizes during the clean and the pollution periods, respectively. The κmean shows similar diurnal patterns during both periods, increasing in the afternoon and early morning and decreasing at noon and during the evening rush hours. However, peak values of κmean occurred at different times: in the late afternoon (15:00–16:00) during the clean period (Fig. 4a) and in the early morning (05:00–06:00) during the pollution period (Fig. 4b). This discrepancy is likely due to an increase in aged particles from daytime photochemical reactions during the clean period, consistent with findings from the same sampling site (Zhang et al., 2023). During the pollution period, the early-morning peak in κmean can be attributed to more active heterogeneous hydrolysis reactions of N2O5, which rapidly convert into hygroscopic nitrates at lower temperatures (Zhou et al., 2018; Zhao et al., 2017), coupled with lower wind speeds and higher humidity that enhance condensation on aerosol particles. This results in the transformation of low-hygroscopicity primary particles into more hygroscopic and internally mixed aerosol particles (Fan et al., 2020a; Zhang et al., 2016). The two low κmean values occurred at noon (12:00–13:00) and evening rush hour (19:00–20:00) (Fig. 4). During these periods, the average organic mass fraction of PM1 increased (Fig. S5). The decrease in hygroscopicity around noon was more pronounced for Aitken mode particles compared to accumulation mode particles, which could be attributed to the cooking emissions. HGF values of 1.13 and 1.17 were observed for 50 and 80 nm particles, respectively, at noon during the clean period, while HGF values of 1.10 and 1.25 were observed during the pollution period. These findings are consistent with the previous results that reported an HGF value of 1.17 ± 0.11 for 40 and 80 nm particles during cooking activities in Beijing (Ren et al., 2023). The lowest particle hygroscopicity was observed at evening rush hour, likely due to the reduction in the boundary layer at night, which traps local pollutants from cooking and vehicle emissions and leads to decreases in aerosol hygroscopicity (Zhang et al., 2016).
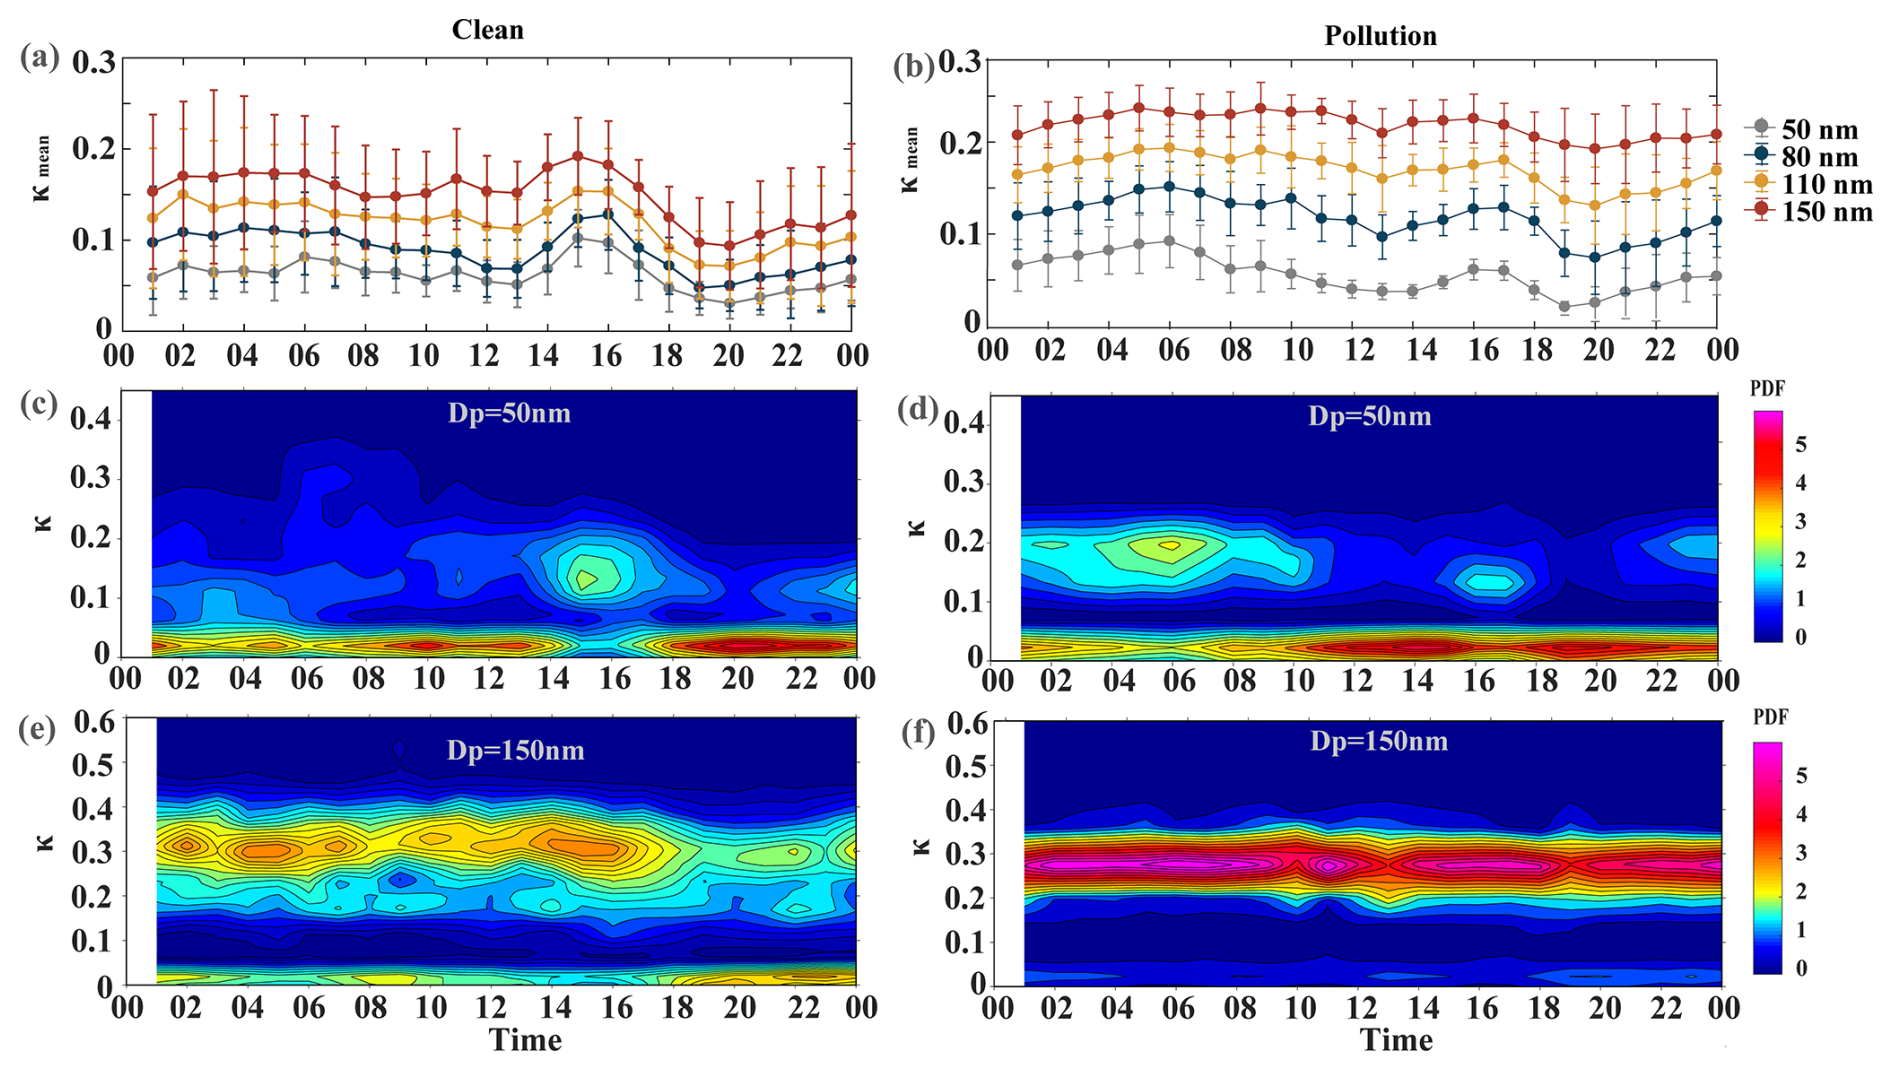
Figure 4Diurnal variation in mean κ for different diameters with the error bars representing the standard deviations (a, b); the κ PDF for particles with Dp=50 nm (c, d) and the κ PDF for particles with Dp=150 nm (e, f) during the clean and pollution periods, respectively.
Figure 4c and d show notable differences in the diurnal variations in the κ PDF for 50 nm aerosol particles during clean and pollution periods. During the clean period, coinciding with the NPF event at approximately 10:00 (Fig. S6a), the number fraction of the MH mode for 50 nm particles increased (Fig. 4c). This suggests that intense photochemical reactions generate condensable species such as sulfuric species, nitrate, and organics, which condense onto pre-existing aerosol particles, transforming them from externally mixed into internally mixed states (Wang et al., 2019). The MH mode was predominantly observed in the afternoon (14:00–16:00). After 16:00, the number fraction of NH mode particles increased, peaking at 20:00 (Figs. 4c and S7), primarily due to substantial traffic emissions during evening rush hour. During the pollution period, the κ PDF of 50 nm aerosol particles exhibited a bimodal distribution throughout the day. A higher number fraction of MH mode particles was observed in the early morning (Fig. 4d), likely due to intensified heterogeneous reactions of NOx during this period.
For 150 nm particles, the κ PDF showed a similar diurnal variation pattern during both clean and pollution periods, displaying a bimodal distribution throughout the day (Fig. 4e and f). During the clean period, the number fraction of MH for 150 nm particles was higher during the daytime than at nighttime (Fig. 4e). As the sun rises, the elevation of the boundary layer allows more solar radiation to reach the ground, resulting in enhanced photochemical reactions and consequently an increase in aged particles, thereby enhancing hygroscopicity of particles and the number fraction of MH. Influenced by local primary emissions, the number fraction of NH increased after 18:00 (Fig. 4e). During the pollution period, the MH mode for 150 nm particles was stronger and more stable throughout the day compared to the clean period (Fig. 4f). The number fraction of NH consistently remained below 25 % throughout the day (Fig. S7). This could be attributed to the heterogeneous NOx reactions on the surface of aerosol particles, which significantly contributed to hygroscopicity by increasing the proportion of inorganic materials (Sun et al., 2016; Wang et al., 2016). AMS results show that the proportion of nitrate increased significantly during the pollution period (Fig. 8a), further supporting this viewpoint. The average nitrate mass fraction in PM1 increased from 13 ± 8 % before PIII to 33 ± 4 % during PIII, indicating that the increase in nitrate is the main cause of heavy pollution in Beijing in autumn. Previous research in Beijing has shown that inorganic nitrate dominated the total nitrate mass, while organic nitrate accounted for approximately 10 % of the total nitrate mass during autumn (Xu et al., 2018). In recent years, with the implementation of strict air pollution control strategies, there has been a significant reduction in the concentrations of gaseous pollutants, especially SO2 (Wang et al., 2022; Chu et al., 2020). During pollution events in Beijing, nitrates have replaced sulfates as the predominant inorganic component (Chen et al., 2019; Wang et al., 2019, 2022).
Figure 5a and b show the significant differences in the diurnal variation in VSFmean for particles with diameters ranging from 50 to 150 nm during two different periods. During the clean period, the highest VSFmean was observed in the morning (09:00–10:00), while the lowest was observed at midnight and in the afternoon. Conversely, during the pollution period, the highest VSFmean was observed in the afternoon (15:00–16:00) and the lowest was observed in the morning for all particle sizes. During the clean period, particle volatility increased dramatically, starting from 10:00 (VSFmean decreased), along with the occurrence of NPF events, indicating that the newly formed matter was more volatile. The VSFmean for 50 nm particles was noticeably lower than that for larger particles throughout the day. The volatility of 80, 100, and 150 nm particles reached a peak at around 14:00 (lowest VSF) and that for 50 nm particles 2 h later during the daytime. During the pollution period, the volatility of different diameters exhibited similar diurnal variation patterns (Fig. 5b). In addition, the variability in volatility for Aitken mode particles was greater than that for accumulation mode particles, consistent with findings from previous studies (Y. Wang et al., 2017; Zhang et al., 2016). The highest volatility for 50 and 80 nm particles occurred during the morning and evening rush hours, while it was lower in the afternoon and at night. This result was likely influenced by traffic emissions and meteorological conditions. The CAMS station, located approximately 200 m from a major road to the west, indicated significant influence of traffic emissions. The median diameter range of exhaust particles from gasoline vehicles is between 55 and 73 nm, with an average diameter of 65 nm (Momenimovahed and Olfert, 2015). Thus, the volatility of 50 and 80 nm aerosol particles was particularly impacted by traffic emissions in this study. Additionally, the lower boundary layer height and wind speed during the pollution period hindered the dispersion of primary emissions. Several studies have demonstrated that the volatility of organic compounds from traffic emissions decreases as the oxidation level increases (Huffman et al., 2009; Cao et al., 2018; Zhu et al., 2021; Yang et al., 2023). Therefore, the reduced volatility of particles in the afternoon and at night could be attributed to the increased oxidation degree of the organic components, leading to the production of more refractory organics (Cheung et al., 2016; Y. Wang et al., 2017; Wang et al., 2022).
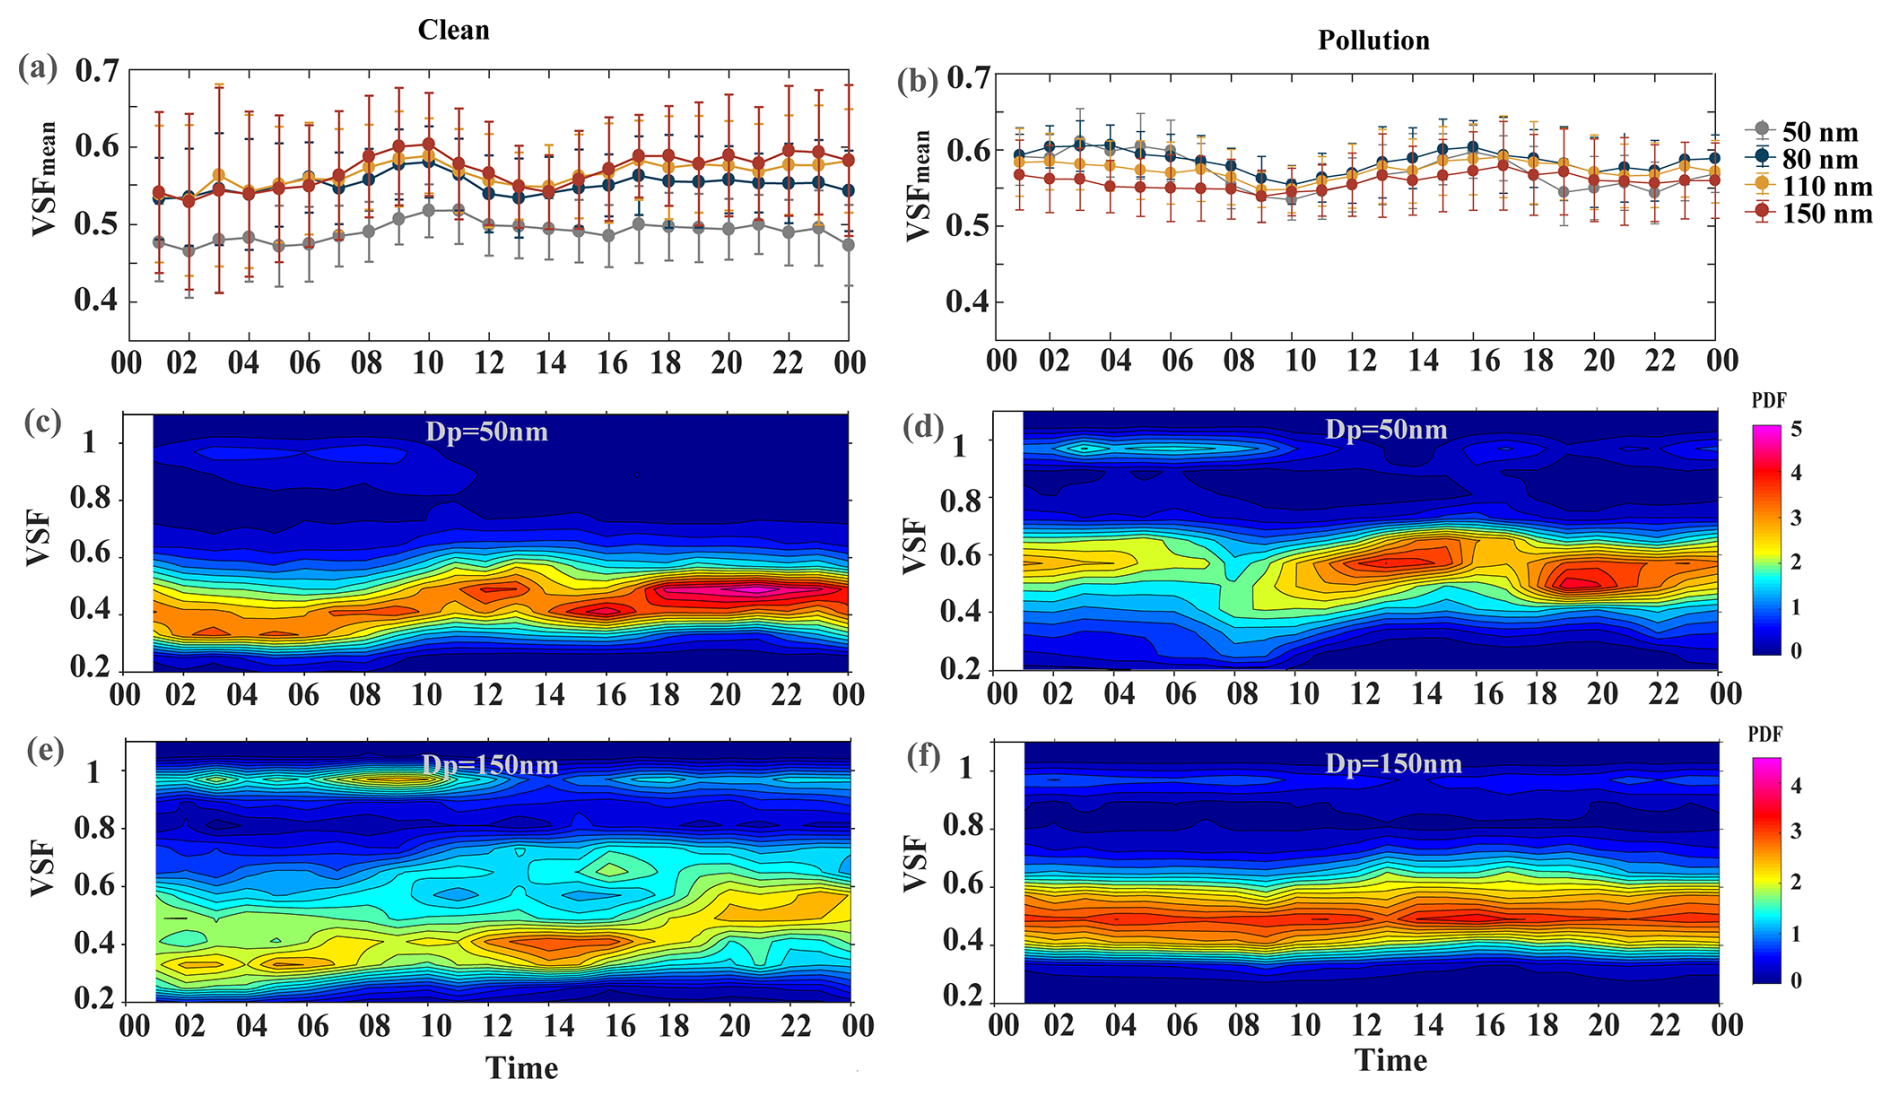
Figure 5Diurnal variation in the mean VSF for different diameters with the error bars representing the standard deviations (a, b); the VSF PDF for particles with Dp=50 nm (c, d) and the VSF PDF for particles with Dp=150 nm (e, f) during the clean and pollution periods, respectively.
Figure 5c–f show the diurnal variation in VSF PDFs for 50 and 150 nm particles during the clean and pollution periods, indicating that all VSF PDFs exhibited both the NV mode and the VV mode. Notably, external mixing was more apparent during the night and early morning, especially for 150 nm particles during the clean period and 50 nm particles during the pollution period (Fig. 5d and e). This phenomenon could be attributed to the reduced boundary layer height, which leads to the accumulation of non-volatile particulate matter emissions (e.g., BC, soot aggregates) from cooking or vehicle emissions. Diesel trucks are permitted to enter Beijing's 5th Ring Road from 00:00 to 06:00 (Beijing Municipal Bureau of Transportation, 2017), resulting in elevated non-volatile particulate matter emissions during the night and early morning (Hakkarainen et al., 2023). As the boundary layer develops during the day, promoting vertical mixing, the number fraction of NV mode particles decreases. During the clean period, the number fraction of NV mode particles for 50 nm particles decreases at around 10:00 (Fig. 5c), as these newly formed particles are primarily composed of volatile substances such as sulfates, ammonium, and organic matter during NPF days (Yue et al., 2010; Wu et al., 2016; Yang et al., 2021). During the pollution period, external mixing of 50 nm particles with volatile (e.g., organic compounds) and non-volatile matter is primarily due to local primary emissions (Wehner et al., 2009; Wang et al., 2019).
The VSF PDF of 150 nm aerosol particles during the pollution period exhibits a stronger and more stable VV mode and a lower NV mode compared to the clean period (Fig. 5e and f). During the pollution period, primary emitted particles can be rapidly coated and aged through heterogeneous reactions (Hakala et al., 2016; Wang et al., 2016), causing the non-volatile particles to transition from an externally mixed mode with volatile particles to an internally mixed mode (Wehner et al., 2009; Yue et al., 2009; Hong et al., 2018). During the clean period, the active aging process in the afternoon promotes the mixing of primary particles with secondary particles, increasing the number fraction of the VV mode for 150 nm particles. Influenced by primary emissions, the volatility of the VV mode began to weaken after 18:00.
4.4 Size-resolved hygroscopicity and volatility during the clean and pollution periods
Figure 6 shows the statistics of size-resolved hygroscopicity and volatility, as well as the number fraction of nearly hydrophobic mode particles (NFNH) and non-volatile mode particles (NFNV) during the clean and pollution periods. As particle diameter increases, both the mean and the median values of the HGF showed noticeable increases during both periods. Furthermore, for particles ranging from 80 to 150 nm, the hygroscopicity exhibited significant increases (p<0.0001) during the pollution period compared to the clean period (Fig. 6a). The mean HGF increased from 1.15 to 1.32 for particle sizes ranging from 50 to 150 nm during the clean period and from 1.15 to 1.44 during the pollution period (Table 1). In contrast to the HGF, both the mean and the median values of NFNH decreased with increasing particle size (Fig. 6b). The NFNH for particles ranging from 80 to 150 nm exhibited significant decreases (p<0.0001) during the pollution period compared to the clean period. The mean NFNH decreased from 0.65 to 0.38 and from 0.67 to 0.14 for particle sizes ranging from 50 to 150 nm during the clean period and the pollution period, respectively (Table 1). Larger particles during the pollution period typically comprised more inorganic salts, enhancing their hygroscopicity. The variation in parameters for different particle sizes was much larger during the clean period than during the pollution period, as shown in Fig. 6. Additionally, we found more externally mixed larger particles during the clean period, as indicated by larger σHGF PDF values (Table 1). Thus, the chemical composition may deviate significantly during the clean period. During the clean period, NPF events occur frequently, and larger particles are likely formed by the condensation of different substances (such as sulfate, ammonium, and organics) on pre-existing particles, leading to a more complex chemical composition (Cheung et al., 2016; Y. Wang et al., 2017). However, during the pollution period, the larger particles are more aged and contain a higher inorganic fraction, resulting in a more homogeneous chemical composition (Wehner et al., 2009; Sun et al., 2016; Wu et al., 2016).
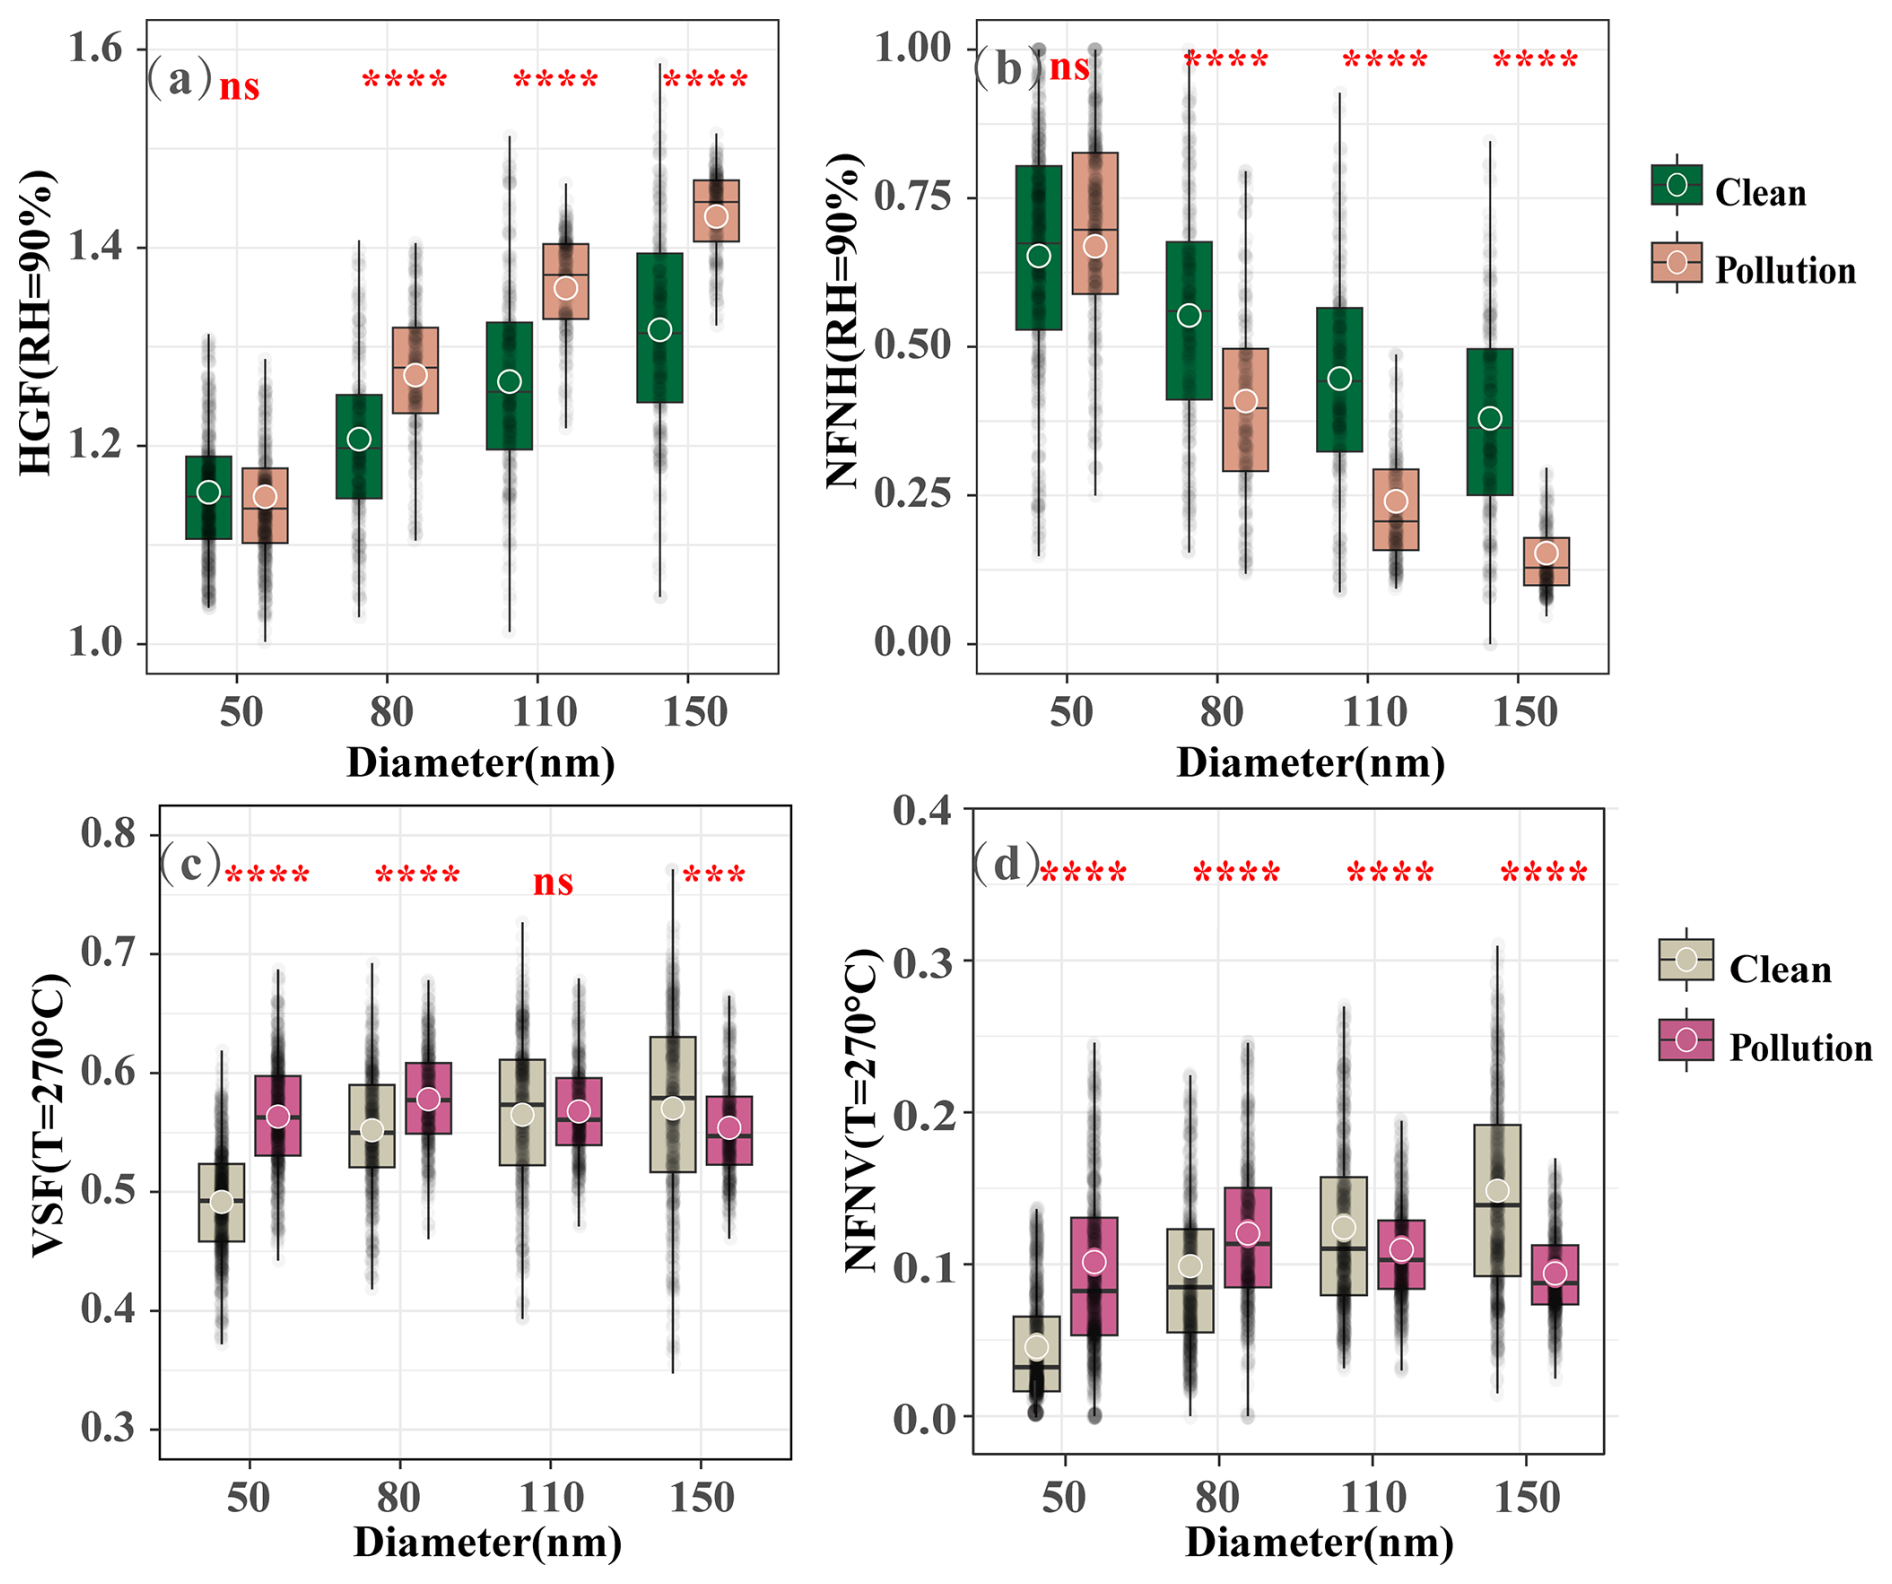
Figure 6Boxplot of (a) the size-resolved hygroscopic growth factor (HGF) and (b) the number fraction of nearly hydrophobic mode particles (NFNH) during the clean and pollution periods. Panels (c) and (d) are the same as panels (a) and (b) but for the volatile shrink factor (VSF) and number fraction of non-volatile mode particles (NFNV), respectively. The two borders of the box indicate the 25th and 75th percentiles, the line in the box represents the median, whiskers indicate the 5th and 95th percentiles, and the circle in each box indicates the mean. The term ns means the observed difference is not statistically significant, and means P value ≤0.0001.
In terms of aerosol volatility, the mean and median values of the VSF slightly increased with particle size during the clean period, indicating reduced volatility (a higher VSF corresponds to lower volatility). However, no distinct trend was observed during the pollution period (Fig. 6c). The NFNV followed a similar trend to that of the VSF (Fig. 6d). During the clean period, the mean VSF increased from 0.49 to 0.57, and NFNV increased from 0.05 to 0.15 for particles ranging from 50 to 150 nm. However, during the pollution period, the mean VSF was around 0.56 for all selected sizes, with less than 5 % variability among different particle sizes (Table 1). Notably, Aitken mode particles exhibited higher volatility and a lower NFNV during the clean period compared to the pollution period (Fig. 6c and d). This difference was more pronounced for 50 nm particles compared to 80 nm particles. For accumulation mode particles, the situation was the opposite, and the difference between two periods for 150 nm particles was greater than that for 110 nm particles. Previous research has shown that particles smaller than 100 nm exhibit lower NFNV on nucleation days than non-nucleation days, while results are reversed for particles larger than 100 nm (Wehner et al., 2009). During the clean period, nucleation events primarily contribute to the volatility of Aitken mode particles, while the growth of larger particles is mainly due to the coating effect of condensed vapors (primarily organic vapors) on pre-existing particles during NPF events (Y. Wang et al., 2017). Wu et al. (2017) suggest that during NPF events, the increase in non-volatile materials with particle size is caused by photochemically induced nucleation of condensing vapors or rapid chemical transformations occurring within the particle phase. The volatility observed in this study is higher than that of previous results from Beijing in 2015, where Y. Wang et al. (2017) reported that the VSF of particles ranging from 40 to 150 nm was between 0.6 and 0.72 during the clean period and 0.65 during the pollution period. This increase in volatility could be attributed to the continuous reduction in BC concentration, which decreased significantly from 6.25 ± 5.73 µg m−3 in 2012 to 1.80 ± 1.54 µg m−3 in 2020 and further to 0.79 ± 0.63 µg m−3 in 2022 due to the implementation of the Clean Air Action Plan in 2013 (Sun et al., 2022; Hu et al., 2024).
4.5 Relationship of hygroscopic and volatile properties
In order to understand the relationship between the hygroscopicity and volatility of particles, we investigated the correlation between the HGF and VSF, as well as NFNH and NFLV, across different aerosol sizes during the clean and pollution periods. As shown in Fig. 7a and b, except for 50 nm particles, the VSF exhibited a decreasing trend with an increasing HGF for all selected particle sizes during both periods, indicating that volatility increases with an increase in hygroscopicity. This trend suggests that the higher-hygroscopicity and higher-volatility components within aerosol particles are predominantly inorganics. Furthermore, the correlations between the HGF and VSF were size-dependent, exhibiting stronger correlation and higher absolute slope values for larger particles, likely due to their higher proportion of inorganic components. A previous study has shown that as particle size increases, the inorganic mass fraction increases from approximately 35 % to 70 % (Wu et al., 2016). Another notable observation from Fig. 7a and b is that the hygroscopicity and volatility of particles during the pollution period were less scattered compared to those during the clean period. This could be attributed to a higher degree of aging and the more uniform chemical composition of particles during the pollution period. However, 50 nm particles, which primarily consist of freshly emitted particulates, exhibited significant chemical composition variability due to contributions from different emission sources (Wang et al., 2019).
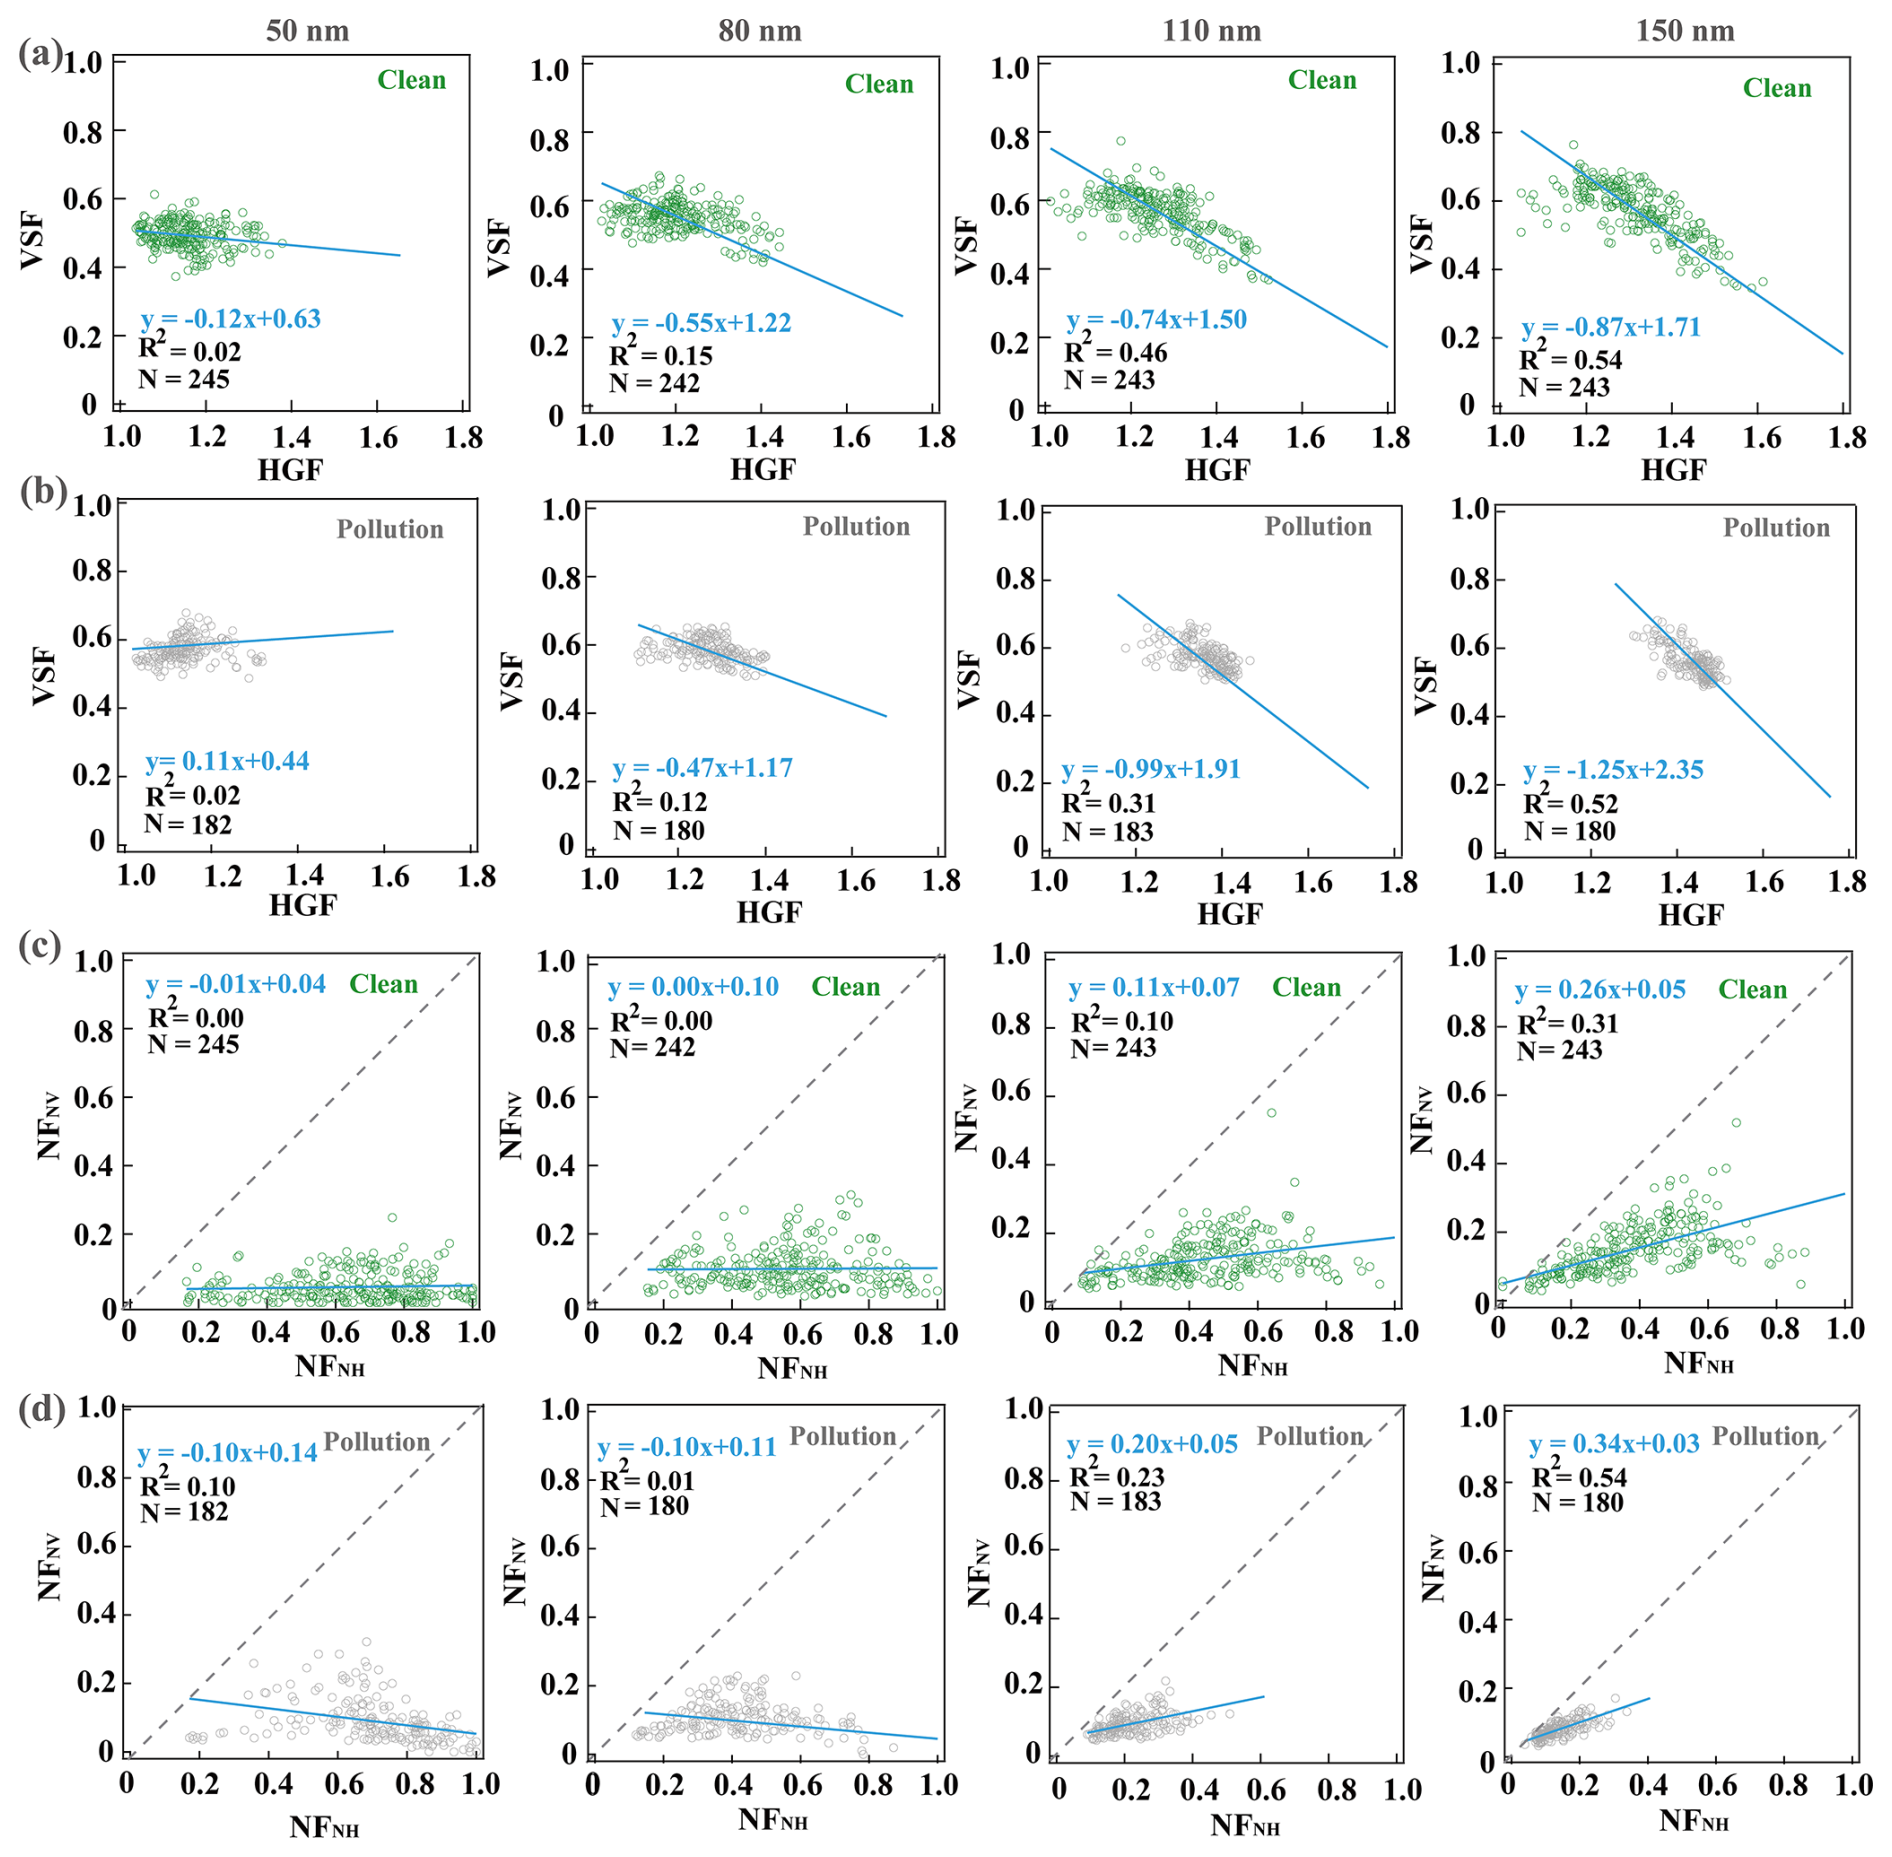
Figure 7Relationship between the hygroscopic growth factors (HGFs) and the volatility shrink factors (VSFs) during the clean and pollution periods for different dry-particle diameters (a, b); relationship between the NFNH and the NFNV during the clean and pollution periods for different dry-particle diameters (c, d).
To further understand the relationship between hygroscopicity and volatility, we also investigated the correlation between NFNH and NFNV during the clean and pollution periods (Fig. 7c and d). For submicron particles, those remaining non-volatile particles after being heated to 250–300 °C are generally considered nearly hydrophobic particles, primarily consisting of soot, carbonaceous particles, and organic polymers in previous research (Cui et al., 2021; Enroth et al., 2018; Massling et al., 2009; Wehner et al., 2009; Zhang et al., 2016; Mendes et al., 2018). Our result shows a weak correlation between NFNH and NFNV, especially for Aitken mode particles. This finding is consistent with a previous study in Beijing (Y. Wang et al., 2017). However, the R2 values from our study are lower than those for particles of the same diameter in the suburban Xianghe station. This discrepancy is influenced by the presence of more soot and local light-absorbing carbonaceous aerosols in Xianghe, and these materials are neither hygroscopic nor volatile (Zhang et al., 2016). As shown in Fig. 7c and d, all the points are below the 1:1 line, indicating that a certain proportion of nearly hydrophobic particles are volatile. NFNV for all particles was lower than 0.4; NFNH for Aitken mode particles mainly ranged from 0.2 to 1.0; and for accumulation mode particles, it was focused below 0.8 and 0.4 during the clean and pollution periods, respectively. This indicates that NFNH and NHNV for accumulation mode particles were composed of similar components during the pollution period, likely BC and soot. A larger proportion of hydrophobic and volatile particles was found in the Aitken mode, which can be attributed to particles from NPF events and traffic emissions. These particles contain a variety of organic materials that are typically highly volatile but exhibit low hygroscopicity (Cai et al., 2022; Feng et al., 2023).
4.6 Hygroscopicity of non-volatile core and volatile coating
For ambient aerosols, most compounds can volatilize below 270 °C (Enroth et al., 2018). However, certain compounds, such as BC, sea salt, and crustal materials, do not volatilize even at higher temperatures. Previous research has shown that submicron atmospheric aerosols contain non-volatile components other than BC, possibly including organic polymers (Backman et al., 2010; Häkkinen et al., 2012; Hong et al., 2014). Furthermore, even newly nucleated particles retain a non-volatile core (Wehner et al., 2005; Ehn et al., 2007; Wu et al., 2017). This section presents the measured hygroscopic growth of the non-volatile core after being heated at 270 °C during the sampling period. Based on the simultaneously measured hygroscopic growth factor of particles and their non-volatile core, we also calculated the hygroscopic growth factor of volatile coatings under the assumption that the particles are a two-component system composed of a non-volatile core and a volatile coating. The VFR intuitively shows the variations in the volume fraction of non-volatile core for different size particles (Fig. 8b). The mean VFR of particles of 50, 80, 100, and 150 nm diameter was 0.15 ± 0.05, 0.19 ± 0.05, 0.20 ± 0.06, and 0.20 ± 0.07, respectively. These results are slightly lower than those of an earlier study at an urban site at the same heating temperature (Enroth et al., 2018); the study investigated the volatile properties of atmospheric aerosol particles (20–145 nm) and found a VFR of approximately 0.2–0.25. During the pollution period, especially during PIII, the VFR exhibits minimal variation. The mean HGFcoating for particles of 50, 80, 100, and 150 nm diameter was 1.17 ± 0.08, 1.27 ± 0.10, 1.35 ± 0.10, and 1.41 ± 0.10, respectively, which was 2 %–7 % higher than the mean HGF for corresponding particle sizes. As shown in Fig. 8c, variations in HGFcoating are basically similar to the hygroscopicity of unheated particles (HGFmean) (Fig. S8) and exhibit significant size dependency. It is clear that the particle coating exhibits higher hygroscopicity during the pollution period. Figure 9 shows that HGFcoating was influenced by the volume fraction of the coating in particles during the pollution period. The correlations between the HGFcoating and the volume fraction of the coating in particles were stronger for the largest particles, suggesting that these particles were typically highly aged and had a higher proportion of inorganic components with a greater volume proportion of the coating. AMS data also show that the relative mass fraction of inorganic components in the particulate phase significantly increases during the pollution period (Fig. 8a). The nitrate content dominated the inorganic components of aerosol particles during the pollution period, reaching 33 % during PIII and likely being the major contributor to the increase in HGFcoating.
Figure 8Time series of the main mass fraction of chemical components in PM1 during the sampling period based on the available AMS data (a), The volume fraction of non-volatile core (VFR) (b), calculated HGFcoating (c), and measured HGFcore (d) for particles from 50 to 150 nm during the sampling period. The shading represents the pollution periods, and the dashed lines represent the periods during which the hygroscopicity of the non-volatile core was relatively high.
Figure 9Correlations between the hygroscopic growth factor of volatile coating and its volume fraction for different particle sizes during the pollution period.
The mean HGFcore for particles of 50, 80, 100, and 150 nm diameter in this study was 1.08 ± 0.03, 1.07 ± 0.03, 1.07 ± 0.03, and 1.09 ± 0.04, respectively. Unlike HGFcoating, HGFcore showed no size-dependent variation, likely due to the similar proportions of residual hygroscopic components in particles across different sizes (Fig. 8d). Given that BC and mineral dust are not hygroscopic, the non-volatile fraction of particles still contains other hygroscopic components, likely highly oxidized organic polymers (Liu et al., 2021; Hong et al., 2014). Studies on forest aerosols have shown that the mass fraction of non-BC material accounts for 13 %–45 % of the total remaining mass after being heated at 280 °C, correlating significantly with the mass fraction of organic nitrates (Häkkinen et al., 2012). The organic nitrates were effectively quantified and were shown to contribute a notable fraction to organic aerosol (OA), namely 9 %–20 % in autumn (Yu et al., 2019). Additionally, such non-volatile organic compounds may also be related to humic-like substances (Wu et al., 2009), which are significant components of fine particulate matter in Beijing (Ma et al., 2018). These oxygenated organic aerosols do not volatilize even after being heated to 270 °C, remaining as part of the non-volatile components contributing to the core's hygroscopicity.
Figure 8d shows two significant increases in the hygroscopicity of the non-volatile core during periods of severe pollution. The first increase, referred to as event I, occurred from 30 October at 15:00 to 31 October at 15:00. The second, event II, occurred from 1 November at 17:00 to 2 November at 17:00. To further investigate these events, we analyzed the 48 h backward trajectories reaching the sampling site at a height of 500 m a.g.l. (Fig. 10). During event I, the air mass originated from Shanxi (Fig. 10a), and 4 h later, the air mass passed over Shandong, the Bohai Sea, and Tianjin before reaching the sampling site, eventually shifting to northwest Mongolia at the end of event I. The early stage of event II was initiated by a short-distance air mass from Hebei (Fig. 10b). Subsequently, the air mass shifted to the Bohai Sea and Shanxi and then transitioned into a long-range, clean air mass from the northwest at the end of event II. During these two events, a part of the air masses reached the sampling site, either passing over or originating from the Bohai Sea. Moreover, these air masses traveled below 1 km at lower speeds, enhancing the possibility of marine aerosol entering the atmosphere (Fig. 10c and d). Thus, the observed increases in the hygroscopicity of non-volatile core particles were probably influenced by marine aerosol. To investigate the enhanced hygroscopicity of the non-volatile core, we further analyzed the mean VSF PDF and mean VHGF PDF during the periods when air masses reached the sampling site by both passing over and originating from the Bohai Sea.
Figure 10The 48 h back trajectories arriving at the height of 500 m a.g.l. at the CAMS site calculated every 2 h, from 30 October at 15:00 to 31 October at 15:00 including event I (a) and from 1 November at 17:00 to 2 November at 17:00 including event II (b). Panels (c) and (d) show the air mass heights of the backward trajectories corresponding to panels (a) and (b), respectively. The color scale represents the time that the air mass backward trajectory arrived at the sampling site.
Figure 11Representative case studies of VH-TDMA measurements. The mean VSF PDF and mean VHGF PDF of 150 nm particles from 30 October at 21:00 to 31 October at 03:00 in event I (a) and on 2 November, 01:00–05:00, in event II (b).
Figure 11 displays the mean VSF PDF and mean VHGF PDF for 150 nm particles during the periods when the air mass passed over (30 October at 21:00 to 31 October at 03:00 in event I) and originated from (2 November, 01:00 to 05:00, in event II) the Bohai Sea. The top axis of the plot denotes the particle diameter. The VSF PDF in Fig. 11 shows a minor non-volatile (NV) mode and a major very volatile (VV) mode (marked by Dp(270 °C, RHdry)), while the VHGF PDF displaced three modes, marked by Dp1(270 °C, 90 % RH), Dp2(270 °C, 90 % RH), and Dp3(270 °C, 90 % RH), respectively. Since the NV mode was smaller than the Dp3(270 °C, 90 % RH) mode, we assume the three modes in the VHGF PDF result from the hygroscopic growth of VV mode particles after heating. When the air mass passed over the Bohai Sea in event I (Fig. 11a), the particle size at the peak of the VV mode in the VSF PDF was 75 nm (Dp(270 °C, RHdry)). After hygroscopic growth, the peaks of the three modes in the VHGF PDF were observed at a Dp1(270 °C, 90 % RH) of 77 nm, Dp2(270 °C, 90 % RH) of 96 nm, and Dp3(270 °C, 90 % RH) of 135 nm. Therefore, the hygroscopic growth factor of the hygroscopic components in the non-volatile core was calculated as follows: , , and . When the air mass originated from the Bohai Sea during event II (Fig. 11b), the particle size at the peak of the VV mode in the VSF PDF was 77 nm (Dp(270 °C, RHdry)), and the VHGF PDF also exhibited a trimodal distribution after rehydration. Using the same calculation method as described above, the HGFs corresponding to the three peaks were 1.21, 1.41, and 1.81, respectively. While this estimate carries some uncertainty, it provides valuable insights into the complexity of aerosol hygroscopicity and volatilization.
Sea-spray aerosol (SSA) consists of particles directly produced at the sea surface and suspended in the air, with sizes ranging from less than 10 nm to several millimeters (Bates et al., 2012; De Leeuw et al., 2011), and SSA can even stay in the atmosphere for days (Grythe et al., 2014). Sub-100 nm SSA non-volatile components at temperatures of 250–550 °C include sea salt and non-sea-salt components, which could be an organic fraction, biological materials, BC, or minerals (Xu et al., 2020; Mallet et al., 2016; Cravigan et al., 2015). Even when heated at 550 °C, 29 % to 48 % of the non-volatile organic fraction still remains in 60 nm SSA (Mallet et al., 2016). The HGFs of SSA ranging from 1.0 to 1.1 are typically composed of biological organic components or anthropogenic emissions such as BC (Kim et al., 2015), while HGFs between approximately 1.1 and 1.4 are associated with organics aerosols (Gantt and Meskhidze, 2013; Ovadnevaite et al., 2011; Asmi et al., 2010). In the Aitken mode, the HGF of 1.8 in non-volatile marine particles is likely due to the presence of sea salt (Sellegri et al., 2008). In summary, the non-volatile SSA from these two events likely comprises a mixture of sea salt, non-volatile organic compounds, and BC. Before reaching the sampling site, SSA particles in the air masses were further aged and grown during transport, forming a volatile coating on their surface that reduced their hygroscopic properties. Therefore, no significant increase in particle hygroscopicity was found before heating (Fig. S8). However, this study cannot definitively identify the specific components of marine aerosols transported by the air masses due to available measurements.
A volatility hygroscopicity tandem differential mobility analyzer (VH-TDMA) was used to measure the hygroscopicity and volatility of aerosol particles (50, 80, 110, and 150 nm) in Beijing from 11 October to 6 November 2023. The HGF PDF and VSF PDF for different particle sizes displayed a bimodal distribution, indicating a clear state of external mixing throughout the study. The mean HGF for particles of 50, 80, 100, and 150 nm diameter during the sampling period was 1.15 ± 0.07, 1.24 ± 0.08, 1.30 ± 0.09, and 1.36 ± 0.10, respectively, while the mean VSF was 0.51 ± 0.05, 0.55 ± 0.04, 0.56 ± 0.05, and 0.56 ± 0.07, respectively. To better compare the hygroscopic and volatile properties of particles under different weather conditions, the sampling period was divided into clean periods and pollution periods. The air mass arriving at the sampling site was mainly from the northwest and the south during the clean period and pollution period, respectively. Hygroscopicity increased with particle size in both clean and pollution periods, with a more pronounced increase during the pollution period, when the mean HGF rose from 1.15 to 1.44 compared to 1.15 to 1.32 during the clean period. In contrast, the mean NFNH decreased with an increase in particle size, from 0.65 to 0.38 during the clean period and from 0.67 to 0.14 during the pollution period. The average nitrate mass fraction in PM1 increased from 13 ± 8 % before PIII to 33 ± 4 % during PIII, reflecting the increased hygroscopicity of larger particles, which could be attributed to their greater age and higher proportion of the inorganic component. Volatility decreased and NFNV increased slightly with an increase in particle size during the clean period; no apparent trend was observed for the pollution period.
The κmean exhibited similar diurnal variations during both clean and pollution periods. However, it peaked in the late afternoon during the clean period and in the early morning during the pollution period. This result could be due to the dominance of photochemical reactions during the daytime in the clean period and stronger heterogeneous reactions at night during the polluted period. The mean VSF displayed the different diurnal variations during the clean and pollution periods. The highest VSF was observed in the morning, while the lowest was observed at midnight and in the afternoon for particles during the clean period. Conversely, the highest VSF was in the afternoon and the lowest was observed in the morning during the pollution period. During the clean period, increased volatility was observed during the daytime due to NPF events, driven by the formation of volatile matter and the coating effect of condensable vapors. During the pollution period, the reduced volatility of particles in the afternoon could be attributed to an enhanced oxidation degree of organic components. Accumulation mode particles exhibited stronger and less variable VV and MH modes due to the particles becoming aged and mixed with newly emitted particles during the pollution period. Additionally, a positive correlation was identified between hygroscopicity and volatility, as well as between the number fraction of nearly hydrophobic and non-volatile particles, during both the clean and the pollution periods.
Furthermore, the study calculated the HGFcore and HGFcoating of particles after heating. The mean HGFcoating for particles of 50, 80, 100, and 150 nm diameter was 1.17 ± 0.08, 1.27 ± 0.10, 1.35 ± 0.10, and 1.41 ± 0.10, respectively, which is 2 %–7 % higher than the mean HGF for similarly sized particles. The mean HGFcore for particles of 50, 80, 100, and 150 nm diameter is 1.08 ± 0.03, 1.07 ± 0.03, 1.07 ± 0.03, and 1.09 ± 0.04, respectively. The HGFcore values were influenced by marine aerosols during air mass passages and originating from the Bohai Sea. These findings provide valuable scientific data for comprehensively understanding the hygroscopic and volatile properties of urban aerosols in Beijing. In the future, obtaining information on the hygroscopic properties of low-volatility organics will be important and will aid in interpreting the VH-TDMA results, thus improving our understanding of the chemical properties of submicron aerosol. Additionally, investigating the hygroscopicity of aerosol particles heated at different temperatures and locations will further elucidate the structure and formation mechanisms of aerosol particles.
The data in the study are available from the corresponding author upon request (jysun@cma.gov.cn).
The supplement related to this article is available online at https://doi.org/10.5194/acp-25-3389-2025-supplement.
AY analyzed the observational data and prepared the figures of the manuscript. JS designed the study and outlined the manuscript. JS, AY, and JL performed the instrument deployment and operation. All co-authors discussed the results and commented on the manuscript. AY prepared the manuscript with contributions from all authors.
The contact author has declared that none of the authors has any competing interests.
Publisher's note: Copernicus Publications remains neutral with regard to jurisdictional claims made in the text, published maps, institutional affiliations, or any other geographical representation in this paper. While Copernicus Publications makes every effort to include appropriate place names, the final responsibility lies with the authors.
This research was supported by the National Key Research and Development Program of China (grant no. 2023YFC3706305), the China Meteorological Administration (grant no. CXFZ2024J039), the National Natural Science Foundation of China (grant nos. 42075082 and 42275121), the Chinese Academy of Meteorological Sciences (grant nos. 2023Z012, 2022KJ002, and 2024Z006), and the Innovation Team for Haze-fog Observation and Forecasts of MOST.
This research has been supported by the National Key Research and Development Program of China (grant no. 2023YFC3706305), the China Meteorological Administration (grant no. CXFZ2024J039), the National Natural Science Foundation of China (grant nos. 42075082 and 42275121), and the Chinese Academy of Meteorological Sciences (grant nos. 2023Z012, 2022KJ002, and 2024Z006).
This paper was edited by Imre Salma and reviewed by Junteng Wu and one anonymous referee.
An, W. J., Pathak, R. K., Lee, B.-H., and Pandis, S. N.: Aerosol volatility measurement using an improved thermodenuder: Application to secondary organic aerosol, J. Aerosol Sci., 38, 305–314, https://doi.org/10.1016/j.jaerosci.2006.12.002, 2007.
Asmi, E., Frey, A., Virkkula, A., Ehn, M., Manninen, H. E., Timonen, H., Tolonen-Kivimäki, O., Aurela, M., Hillamo, R., and Kulmala, M.: Hygroscopicity and chemical composition of Antarctic sub-micrometre aerosol particles and observations of new particle formation, Atmos. Chem. Phys., 10, 4253–4271, https://doi.org/10.5194/acp-10-4253-2010, 2010.
Backman, J., Virkkula, A., Petäjä, T., Aurela, M., Frey, A., and Hillamo, R.: Impacts of volatilisation on light scattering and filter-based absorption measurements: a case study, Atmos. Meas. Tech., 3, 1205–1216, https://doi.org/10.5194/amt-3-1205-2010, 2010.
Bates, T., Quinn, P., Frossard, A., Russell, L., Hakala, J., Petäjä, T., Kulmala, M., Covert, D., Cappa, C., and Li, S. M.: Measurements of ocean derived aerosol off the coast of California, J. Geophys. Res., 117, D00V15, https://doi.org/10.1029/2012JD017588, 2012.
Beijing Municipal Bureau of Transportation: Notice on measures to reduce pollutant emissions from partial trucks by traffic management, http://www.beijing.gov.cn/zhengce/zhengcefagui/201905/t20190522_60418.html (last access: 20 May 2024), 2017.
Bidleman, T. F.: Atmospheric processes – wet and dry deposition of organic-compounds are controlled by their vapor particle partitioning, Environ. Sci. Technol., 22, 361–367, https://doi.org/10.1021/es00169a002, 1988.
Buseck, P. R. and Posfai, M.: Airborne minerals and related aerosol particles: Effects on climate and the environment, P. Natl. Acad. Sci. USA, 96, 3372–3379, https://doi.org/10.1073/pnas.96.7.3372, 1999.
Cai, M., Huang, S., Liang, B., Sun, Q., Liu, L., Yuan, B., Shao, M., Hu, W., Chen, W., Song, Q., Li, W., Peng, Y., Wang, Z., Chen, D., Tan, H., Xu, H., Li, F., Deng, X., Deng, T., Sun, J., and Zhao, J.: Measurement report: Distinct size dependence and diurnal variation in organic aerosol hygroscopicity, volatility, and cloud condensation nuclei activity at a rural site in the Pearl River Delta (PRD) region, China, Atmos. Chem. Phys., 22, 8117–8136, https://doi.org/10.5194/acp-22-8117-2022, 2022.
Cao, L.-M., Huang, X.-F., Li, Y.-Y., Hu, M., and He, L.-Y.: Volatility measurement of atmospheric submicron aerosols in an urban atmosphere in southern China, Atmos. Chem. Phys., 18, 1729–1743, https://doi.org/10.5194/acp-18-1729-2018, 2018.
Chen, J., Li, Z., Lv, M., Wang, Y., Wang, W., Zhang, Y., Wang, H., Yan, X., Sun, Y., and Cribb, M.: Aerosol hygroscopic growth, contributing factors, and impact on haze events in a severely polluted region in northern China, Atmos. Chem. Phys., 19, 1327–1342, https://doi.org/10.5194/acp-19-1327-2019, 2019.
Chen, L., Zhang, F., Collins, D., Ren, J., Liu, J., Jiang, S., and Li, Z.: Characterizing the volatility and mixing state of ambient fine particles in the summer and winter of urban Beijing, Atmos. Chem. Phys., 22, 2293–2307, https://doi.org/10.5194/acp-22-2293-2022, 2022.
Cheung, H. H. Y., Tan, H., Xu, H., Li, F., Wu, C., Yu, J. Z., and Chan, C. K.: Measurements of non-volatile aerosols with a VTDMA and their correlations with carbonaceous aerosols in Guangzhou, China, Atmos. Chem. Phys., 16, 8431–8446, https://doi.org/10.5194/acp-16-8431-2016, 2016.
Chu, B., Ma, Q., Liu, J., Ma, J., Zhang, P., Chen, T., Feng, Q., Wang, C., Yang, N., Ma, H., Ma, J., Russell, A. G., and He, H.: Air Pollutant Correlations in China: Secondary Air Pollutant Responses to NOx and SO2 Control, Environ. Sci. Tech. Let., 7, 695–700, https://doi.org/10.1021/acs.estlett.0c00403, 2020.
Cravigan, L. T., Ristovski, Z., Modini, R. L., Keywood, M. D., and Gras, J. L.: Observation of sea-salt fraction in sub 100 nm diameter particles at Cape Grim, J. Geophys. Res., 120, 1848–1864, https://doi.org/10.1002/2014JD022601, 2015.
Cui, F., Pei, S., Chen, M., Ma, Y., and Pan, Q.: Absorption enhancement of black carbon and the contribution of brown carbon to light absorption in the summer of Nanjing, China, Atmos. Pollut. Res., 12, 480–487, https://doi.org/10.1016/j.apr.2020.12.008, 2021.
De Leeuw, G., Andreas, E. L., Anguelova, M. D., Fairall, C., Lewis, E. R., O'Dowd, C., Schulz, M., and Schwartz, S. E.: Production flux of sea spray aerosol, Rev. Geophys., 49, RG2001, https://doi.org/10.1029/2010RG000349, 2011.
Duplissy, J., Gysel, M., Sjogren, S., Meyer, N., Good, N., Kammermann, L., Michaud, V., Weigel, R., Martins dos Santos, S., Gruening, C., Villani, P., Laj, P., Sellegri, K., Metzger, A., McFiggans, G. B., Wehrle, G., Richter, R., Dommen, J., Ristovski, Z., Baltensperger, U., and Weingartner, E.: Intercomparison study of six HTDMAs: results and recommendations, Atmos. Meas. Tech., 2, 363–378, https://doi.org/10.5194/amt-2-363-2009, 2009.
Ehn, M., Petäjä, T., Birmili, W., Junninen, H., Aalto, P., and Kulmala, M.: Non-volatile residuals of newly formed atmospheric particles in the boreal forest, Atmos. Chem. Phys., 7, 677–684, https://doi.org/10.5194/acp-7-677-2007, 2007.
Enroth, J., Mikkilä, J., Németh, Z., Kulmala, M., and Salma, I.: Wintertime hygroscopicity and volatility of ambient urban aerosol particles, Atmos. Chem. Phys., 18, 4533–4548, https://doi.org/10.5194/acp-18-4533-2018, 2018.
Fan, X., Liu, J., Zhang, F., Chen, L., Collins, D., Xu, W., Jin, X., Ren, J., Wang, Y., Wu, H., Li, S., Sun, Y., and Li, Z.: Contrasting size-resolved hygroscopicity of fine particles derived by HTDMA and HR-ToF-AMS measurements between summer and winter in Beijing: the impacts of aerosol aging and local emissions, Atmos. Chem. Phys., 20, 915–929, https://doi.org/10.5194/acp-20-915-2020, 2020a.
Fan, H., Zhao, C., and Yang, Y.: A comprehensive analysis of the spatio-temporal variation of urban air pollution in China during 2014–2018, Atmos. Environ., 220, 117066, https://doi.org/10.1016/j.atmosenv.2019.117066, 2020b.
Feng, T., Wang, Y., Hu, W., Zhu, M., Song, W., Chen, W., Sang, Y., Fang, Z., Deng, W., Fang, H., Yu, X., Wu, C., Yuan, B., Huang, S., Shao, M., Huang, X., He, L., Lee, Y. R., Huey, L. G., Canonaco, F., Prevot, A. S. H., and Wang, X.: Impact of aging on the sources, volatility, and viscosity of organic aerosols in Chinese outflows, Atmos. Chem. Phys., 23, 611–636, https://doi.org/10.5194/acp-23-611-2023, 2023.
Freney, E. J., Adachi, K., and Buseck, P. R.: Internally mixed atmospheric aerosol particles: Hygroscopic growth and light scattering, J. Geophys. Res., 115, D19210, https://doi.org/10.1029/2009JD013558, 2010.
Gantt, B. and Meskhidze, N.: The physical and chemical characteristics of marine primary organic aerosol: a review, Atmos. Chem. Phys., 13, 3979–3996, https://doi.org/10.5194/acp-13-3979-2013, 2013.
Ghadikolaei, M. A., Yung, K. F., Cheung, C. S., Ho, S. S. H., and Wong, P. K.: Non-polar organic compounds, volatility and oxidation reactivity of particulate matter emitted from diesel engine fueled with ternary fuels in blended and fumigation modes, Chemosphere, 249, 126086, https://doi.org/10.1016/j.chemosphere.2020.126086, 2020.
Grythe, H., Ström, J., Krejci, R., Quinn, P., and Stohl, A.: A review of sea-spray aerosol source functions using a large global set of sea salt aerosol concentration measurements, Atmos. Chem. Phys., 14, 1277–1297, https://doi.org/10.5194/acp-14-1277-2014, 2014.
Gysel, M., Mcfiggans, G. B., and Coe, H.: Inversion of tandem differential mobility analyser (TDMA) measurements, J. Aerosol Sci., 40, 134–151, https://doi.org/10.1016/j.jaerosci.2008.07.013, 2009.
Hakala, J., Mikkilä, J., Hong, J., Ehn, M., and Petäjä, T.: VH-TDMA: A description and verification of an instrument to measure aerosol particle hygroscopicity and volatility, Aerosol Sci. Tech., 51, 97–107, https://doi.org/10.1080/02786826.2016.1255712, 2016.
Hakkarainen, H., Järvinen, A., Lepistö, T., Salo, L., Kuittinen, N., Laakkonen, E., Yang, M., Martikainen, M.-V., Saarikoski, S., Aurela, M., Barreira, L., Teinilä, K., Ihalainen, M., Aakko-Saksa, P., Timonen, H., Rönkkö, T., and Jalava, P.: Toxicity of exhaust emissions from high aromatic and non-aromatic diesel fuels using in vitro ALI exposure system, Sci. Total. Environ., 890, 164215, https://doi.org/10.1016/j.scitotenv.2023.164215, 2023.
Häkkinen, S. A. K., Äijälä, M., Lehtipalo, K., Junninen, H., Backman, J., Virkkula, A., Nieminen, T., Vestenius, M., Hakola, H., Ehn, M., Worsnop, D. R., Kulmala, M., Petäjä, T., and Riipinen, I.: Long-term volatility measurements of submicron atmospheric aerosol in Hyytiälä, Finland, Atmos. Chem. Phys., 12, 10771–10786, https://doi.org/10.5194/acp-12-10771-2012, 2012.
Hong, J., Häkkinen, S. A. K., Paramonov, M., Äijälä, M., Hakala, J., Nieminen, T., Mikkilä, J., Prisle, N. L., Kulmala, M., Riipinen, I., Bilde, M., Kerminen, V.-M., and Petäjä, T.: Hygroscopicity, CCN and volatility properties of submicron atmospheric aerosol in a boreal forest environment during the summer of 2010, Atmos. Chem. Phys., 14, 4733–4748, https://doi.org/10.5194/acp-14-4733-2014, 2014.
Hong, J., Xu, H., Tan, H., Yin, C., Hao, L., Li, F., Cai, M., Deng, X., Wang, N., Su, H., Cheng, Y., Wang, L., Petäjä, T., and Kerminen, V.-M.: Mixing state and particle hygroscopicity of organic-dominated aerosols over the Pearl River Delta region in China, Atmos. Chem. Phys., 18, 14079–14094, https://doi.org/10.5194/acp-18-14079-2018, 2018.
Hu, X., Liu, Q., Zhang, Y., Shen, X., Lu, J., Yu, A., Liu, S., Che, H., Zhang, X., and Sun, J.: Significant influence of nitrate on light absorption enhancement of refractory black carbon in the winter of 2022 in Beijing, Atmos. Environ., 319, 120311, https://doi.org/10.1016/j.atmosenv.2023.120311, 2024.
Huang, X., Zhang, J., Liu, B., Liu, C., Zhang, J., Cong, L., Cheng, M., Yan, G., Gao, W., Wang, Y., and Wang, Y.: Characteristics of PM2.5 pollution in Beijing after the improvement of air quality, J. Environ Sci., 100, 1–10, https://doi.org/10.1016/j.jes.2020.06.004, 2021.
Huffman, J. A., Ziemann, P. J., Jayne, J. T., Worsnop, D. R., and Jimenez, J. L.: Development and characterization of a fast-stepping/scanning thermodenuder for chemically-resolved aerosol volatility measurements, Aerosol Sci. Tech., 42, 395–407, https://doi.org/10.1080/02786820802104981, 2008.
Huffman, J. A., Docherty, K. S., Aiken, A. C., Cubison, M. J., Ulbrich, I. M., DeCarlo, P. F., Sueper, D., Jayne, J. T., Worsnop, D. R., Ziemann, P. J., and Jimenez, J. L.: Chemically-resolved aerosol volatility measurements from two megacity field studies, Atmos. Chem. Phys., 9, 7161–7182, https://doi.org/10.5194/acp-9-7161-2009, 2009.
IPCC: Climate Change 2013: The Physical Science Basis: Summary for Policymakers, Cambridge University Press, Cambridge, UK, ISBN: 978-1-107-05799-1, 2013.
Jiang, S., Ye, X., Wang, R., Tao, Y., Ma, Z., Yang, X., and Chen, J.: Measurements of nonvolatile size distribution and its link to traffic soot in urban Shanghai, Sci. Total Environ., 615, 452–461, https://doi.org/10.1016/j.scitotenv.2017.09.176, 2018.
Johnson, G. R., Ristovski, Z. D., D'Anna, B., and Morawska, L.: Hygroscopic behavior of partially volatilized coastal marine aerosols using the volatilization and humidification tandem differential mobility analyzer technique, J. Geophys. Res., 110, D20203, https://doi.org/10.1029/2004JD005657, 2005.
Karnezi, E., Riipinen, I., and Pandis, S. N.: Measuring the atmospheric organic aerosol volatility distribution: a theoretical analysis, Atmos. Meas. Tech., 7, 2953–2965, https://doi.org/10.5194/amt-7-2953-2014, 2014.
Kim, G., Cho, H.-j., Seo, A., Kim, D., Gim, Y., Lee, B. Y., Yoon, Y. J., and Park, K.: Comparison of hygroscopicity, volatility, and mixing state of submicrometer particles between cruises over the Arctic Ocean and the Pacific Ocean, Environ. Sci. Technol., 49, 12024–12035, https://doi.org/10.1021/acs.est.5b01505, 2015.
Lippmann, M. and Albert, R. E.: The effect of particle size on the regional deposition of inhaled aerosols in the human respiratory tract, Am. Ind. Hyg. Assoc. J., 30, 257–275, https://doi.org/10.1080/00028896909343120, 1969.
Liu, D., Allan, J., Whitehead, J., Young, D., Flynn, M., Coe, H., McFiggans, G., Fleming, Z. L., and Bandy, B.: Ambient black carbon particle hygroscopic properties controlled by mixing state and composition, Atmos. Chem. Phys., 13, 2015–2029, https://doi.org/10.5194/acp-13-2015-2013, 2013.
Liu, J., Zhang, F., Xu, W., Sun, Y., Chen, L., Li, S., Ren, J., Hu, B., Wu, H., and Zhang, R.: Hygroscopicity of Organic Aerosols Linked to Formation Mechanisms, Geophys. Res. Lett., 48, e2020GL091683, https://doi.org/10.1029/2020gl091683, 2021.
Liu, P. F., Zhao, C. S., Göbel, T., Hallbauer, E., Nowak, A., Ran, L., Xu, W. Y., Deng, Z. Z., Ma, N., Mildenberger, K., Henning, S., Stratmann, F., and Wiedensohler, A.: Hygroscopic properties of aerosol particles at high relative humidity and their diurnal variations in the North China Plain, Atmos. Chem. Phys., 11, 3479–3494, https://doi.org/10.5194/acp-11-3479-2011, 2011.
Liu, Q., Sheng, J., Wu, Y., Ma, Z., Sun, J., Tian, P., Zhao, D., Li, X., Hu, K., Li, S., Shen, X., Zhang, Y., He, H., Huang, M., Ding, D., and Liu, D.: Source characterization of volatile organic compounds in urban Beijing and its links to secondary organic aerosol formation, Sci. Total Environ., 860, 160469, https://doi.org/10.1016/j.scitotenv.2022.160469, 2023.
Lu, J., Shen, X., Ma, Q., Yu, A., Hu, X., Zhang, Y., Liu, Q., Liu, S., Che, H., Zhang, X., and Sun, J.: Size-resolved effective density of ambient aerosols measured by an AAC–SMPS tandem system in Beijing, Atmos. Environ., 318, 120226, https://doi.org/10.1016/j.atmosenv.2023.120226, 2024.
Ma, Y., Cheng, Y., Qiu, X., Cao, G., Fang, Y., Wang, J., Zhu, T., Yu, J., and Hu, D.: Sources and oxidative potential of water-soluble humic-like substances (HULISWS) in fine particulate matter (PM2.5) in Beijing, Atmos. Chem. Phys., 18, 5607–5617, https://doi.org/10.5194/acp-18-5607-2018, 2018.
Mallet, M., Cravigan, L., Miljevic, B., Vaattovaara, P., Deschaseaux, E., Swan, H., Jones, G., and Ristovski, Z.: Sea spray aerosol in the Great Barrier Reef and the presence of nonvolatile organics, J. Geophys. Res., 121, 7088–7099, https://doi.org/10.1002/2016JD024966, 2016.
Massling, A., Stock, M., Wehner, B., Wu, Z. J., Hu, M., Brüggemann, E., Gnauk, T., Herrmann, H., and Wiedensohler, A.: Size segregated water uptake of the urban submicrometer aerosol in Beijing, Atmos. Environ., 43, 1578–1589, https://doi.org/10.1016/j.atmosenv.2008.06.003, 2009.
Mendes, L., Gini, M. I., Biskos, G., Colbeck, I., and Eleftheriadis, K.: Airborne ultrafine particles in a naturally ventilated metro station: Dominant sources and mixing state determined by particle size distribution and volatility measurements, Environ. Pollut., 239, 82–94, https://doi.org/10.1016/j.envpol.2018.03.067, 2018.
Miao, Y., Che, H., Zhang, X., and Liu, S.: Relationship between summertime concurring PM2.5 and O3 pollution and boundary layer height differs between Beijing and Shanghai, China, Environ. Pollut., 268, 115775, https://doi.org/10.1016/j.envpol.2020.115775, 2021.
Modini, R. L., Ristovski, Z. D., Johnson, G. R., He, C., Surawski, N., Morawska, L., Suni, T., and Kulmala, M.: New particle formation and growth at a remote, sub-tropical coastal location, Atmos. Chem. Phys., 9, 7607–7621, https://doi.org/10.5194/acp-9-7607-2009, 2009.
Momenimovahed, A. and Olfert, J. S.: Effective Density and Volatility of Particles Emitted from Gasoline Direct Injection Vehicles and Implications for Particle Mass Measurement, Aerosol Sci. Tech., 49, 1051–1062, https://doi.org/10.1080/02786826.2015.1094181, 2015.
Ou, C., Hang, J., and Deng, Q.: Particle deposition in human lung airways: effects of airflow, particle size, and mechanisms, Aerosol Air Qual. Res., 20, 2846–2858, https://doi.org/10.4209/aaqr.2020.02.0067, 2020.
Ovadnevaite, J., Ceburnis, D., Martucci, G., Bialek, J., Monahan, C., Rinaldi, M., Facchini, M. C., Berresheim, H., Worsnop, D. R., and O'Dowd, C.: Primary marine organic aerosol: A dichotomy of low hygroscopicity and high CCN activity, Geophys. Res. Lett., 38, L21806, https://doi.org/10.1029/2011GL048869, 2011.
Petters, M. D.: A language to simplify computation of differential mobility analyzer response functions, Aerosol Sci. Tech., 52, 1437–1451, https://doi.org/10.1080/02786826.2018.1530724, 2018.
Petters, M. D. and Kreidenweis, S. M.: A single parameter representation of hygroscopic growth and cloud condensation nucleus activity, Atmos. Chem. Phys., 7, 1961–1971, https://doi.org/10.5194/acp-7-1961-2007, 2007.
Pöschl, U.: Atmospheric aerosols: composition, transformation, climate and health effects, Angew. Chem. Int. Edit., 44, 7520–7540, https://doi.org/10.1002/anie.200501122, 2005.
Ren, J., Zhang, F., Chen, L., Cao, G., Liu, M., Li, X., Wu, H., Cheng, Y., and Li, Z.: Identifying the hygroscopic properties of fine aerosol particles from diverse sources in urban atmosphere and the applicability in prediction of cloud nuclei, Atmos. Environ., 298, 119615, https://doi.org/10.1016/j.atmosenv.2023.119615, 2023.
Reutter, P., Su, H., Trentmann, J., Simmel, M., Rose, D., Gunthe, S. S., Wernli, H., Andreae, M. O., and Pöschl, U.: Aerosol- and updraft-limited regimes of cloud droplet formation: influence of particle number, size and hygroscopicity on the activation of cloud condensation nuclei (CCN), Atmos. Chem. Phys., 9, 7067–7080, https://doi.org/10.5194/acp-9-7067-2009, 2009.
Ristovski, Z. D., Suni, T., Kulmala, M., Boy, M., Meyer, N. K., Duplissy, J., Turnipseed, A., Morawska, L., and Baltensperger, U.: The role of sulphates and organic vapours in growth of newly formed particles in a eucalypt forest, Atmos. Chem. Phys., 10, 2919–2926, https://doi.org/10.5194/acp-10-2919-2010, 2010.
Sellegri, K., Villani, P., Picard, D., Dupuy, R., O'Dowd, C., and Laj, P.: Role of the volatile fraction of submicron marine aerosol on its hygroscopic properties, Atmos. Res., 90, 272–277, https://doi.org/10.1016/j.atmosres.2008.04.004, 2008.
Shen, X., Sun, J., Zhang, X., Zhang, Y., Wang, Y., Tan, K., Wang, P., Zhang, L., Qi, X., and Che, H.: Comparison of Submicron Particles at a Rural and an Urban Site in the North China Plain during the December 2016 Heavy Pollution Episodes, J. Meteorol. Res.-PRC, 32, 26–37, https://doi.org/10.1007/s13351-018-7060-7, 2018.
Sjogren, S., Gysel, M., Weingartner, E., Alfarra, M. R., Duplissy, J., Cozic, J., Crosier, J., Coe, H., and Baltensperger, U.: Hygroscopicity of the submicrometer aerosol at the high-alpine site Jungfraujoch, 3580 m a.s.l., Switzerland, Atmos. Chem. Phys., 8, 5715–5729, https://doi.org/10.5194/acp-8-5715-2008, 2008.
Stokes, R. H. and Robinson, R. A.: Interactions in Aqueous Nonelectrolyte Solutions. I. Solute-Solvent Equilibria, J. Phys. Chem.-US, 70, 2126–2131, https://doi.org/10.1021/j100879a010, 1966.
Su, H., Rose, D., Cheng, Y. F., Gunthe, S. S., Massling, A., Stock, M., Wiedensohler, A., Andreae, M. O., and Pöschl, U.: Hygroscopicity distribution concept for measurement data analysis and modeling of aerosol particle mixing state with regard to hygroscopic growth and CCN activation, Atmos. Chem. Phys., 10, 7489–7503, https://doi.org/10.5194/acp-10-7489-2010, 2010.
Sun, J., Wang, Z., Zhou, W., Xie, C., Wu, C., Chen, C., Han, T., Wang, Q., Li, Z., Li, J., Fu, P., Wang, Z., and Sun, Y.: Measurement report: Long-term changes in black carbon and aerosol optical properties from 2012 to 2020 in Beijing, China, Atmos. Chem. Phys., 22, 561–575, https://doi.org/10.5194/acp-22-561-2022, 2022.
Sun, Y., Chen, C., Zhang, Y., Xu, W., Zhou, L., Cheng, X., Zheng, H., Ji, D., Li, J., Tang, X., Fu, P., and Wang, Z.: Rapid formation and evolution of an extreme haze episode in Northern China during winter 2015, Sci. Rep.-UK, 6, 27151, https://doi.org/10.1038/srep27151, 2016.
Swietlicki, E., Hansson, H.-C., Hämeri, K., Svenningsson, B., Massling, A., McFiggans, G., McMurry, P., Petäjä, T., Tunved, P., and Gysel, M.: Hygroscopic properties of submicrometer atmospheric aerosol particles measured with H-TDMA instruments in various environments—a review, Tellus B, 60, 432–469, https://doi.org/10.1111/j.1600-0889.2008.00350.x, 2008.
Tang, M., Cziczo, D. J., and Grassian, V. H.: Interactions of water with mineral dust aerosol: water adsorption, hygroscopicity, cloud condensation, and ice nucleation, Chem. Rev., 116, 4205–4259, https://doi.org/10.1021/acs.chemrev.5b00529, 2016.
Tang, M., Chan, C. K., Li, Y. J., Su, H., Ma, Q., Wu, Z., Zhang, G., Wang, Z., Ge, M., Hu, M., He, H., and Wang, X.: A review of experimental techniques for aerosol hygroscopicity studies, Atmos. Chem. Phys., 19, 12631–12686, https://doi.org/10.5194/acp-19-12631-2019, 2019.
Tiitta, P., Miettinen, P., Vaattovaara, P., Joutsensaari, J., Petäjä, T., Virtanen, A., Raatikainen, T., Aalto, P., Portin, H., and Romakkaniemi, S.: Roadside aerosol study using hygroscopic, organic and volatility TDMAs: Characterization and mixing state, Atmos. Environ., 44, 976–986, https://doi.org/10.1016/j.atmosenv.2009.06.021, 2010.
Tritscher, T., Dommen, J., DeCarlo, P. F., Gysel, M., Barmet, P. B., Praplan, A. P., Weingartner, E., Prévôt, A. S. H., Riipinen, I., Donahue, N. M., and Baltensperger, U.: Volatility and hygroscopicity of aging secondary organic aerosol in a smog chamber, Atmos. Chem. Phys., 11, 11477–11496, https://doi.org/10.5194/acp-11-11477-2011, 2011.
Villani, P., Picard, D., Marchand, N., and Laj, P.: Design and Validation of a 6-Volatility Tandem Differential Mobility Analyzer (VTDMA), Aerosol Sci. Tech., 41, 898–906, https://doi.org/10.1080/02786820701534593, 2007.
Villani, P., Picard, D., Michaud, V., Laj, P., and Wiedensohler, A.: Design and Validation of a Volatility Hygroscopic Tandem Differential Mobility Analyzer (VH-TDMA) to Characterize the Relationships Between the Thermal and Hygroscopic Properties of Atmospheric Aerosol Particles, Aerosol Sci. Tech., 42, 729–741, https://doi.org/10.1080/02786820802255668, 2008.
Villani, P., Sellegri, K., Monier, M., and Laj, P.: Influence of semi-volatile species on particle hygroscopic growth, Atmos. Environ., 79, 129–137, https://doi.org/10.1016/j.atmosenv.2013.05.069, 2013.
Wang, G., Zhang, R., Gómez, M. E., Yang, L., Zamora, M. L., Hu, M., Lin, Y., Peng, J., Guo, S., and Meng, J.: Persistent sulfate formation from London Fog to Chinese haze, P. Natl. Acad. Sci. USA, 113, 13630–13635, https://doi.org/10.1073/pnas.1616540113, 2016.
Wang, J., Gao, J., Che, F., Wang, Y., Lin, P., and Zhang, Y.: Decade-long trends in chemical component properties of PM2.5 in Beijing, China (2011–2020), Sci. Total Environ., 832, 154664, https://doi.org/10.1016/j.scitotenv.2022.154664, 2022.
Wang, X., Shen, X. J., Sun, J. Y., Zhang, X. Y., Wang, Y. Q., Zhang, Y. M., Wang, P., Xia, C., Qi, X. F., and Zhong, J. T.: Size-resolved hygroscopic behavior of atmospheric aerosols during heavy aerosol pollution episodes in Beijing in December 2016, Atmos. Environ., 194, 188–197, https://doi.org/10.1016/j.atmosenv.2018.09.041, 2018.
Wang, Y., Stein, A., Draxler, R., de la Rosa, J. D., and Zhang, X.: Global sand and dust storms in 2008. Observation and HYSPLIT model verification, Atmos. Environ., 45, 6381, https://doi.org/10.1016/j.atmosenv.2011.08.035, 2011.
Wang, Y., Zhang, F., Li, Z., Tan, H., Xu, H., Ren, J., Zhao, J., Du, W., and Sun, Y.: Enhanced hydrophobicity and volatility of submicron aerosols under severe emission control conditions in Beijing, Atmos. Chem. Phys., 17, 5239–5251, https://doi.org/10.5194/acp-17-5239-2017, 2017.
Wang, Y., Li, Z., Zhang, R., Jin, X., Xu, W., Fan, X., Wu, H., Zhang, F., Sun, Y., Wang, Q., Cribb, M., and Hu, D.: Distinct Ultrafine- and Accumulation-Mode Particle Properties in Clean and Polluted Urban Environments, Geophys. Res. Lett., 46, 10918–10925, https://doi.org/10.1029/2019gl084047, 2019.
Wang, Z., Birmili, W., Hamed, A., Wehner, B., Spindler, G., Pei, X., Wu, Z., Cheng, Y., Su, H., and Wiedensohler, A.: Contributions of volatile and nonvolatile compounds (at 300 °C) to condensational growth of atmospheric nanoparticles: An assessment based on 8.5 years of observations at the Central Europe background site Melpitz, J. Geophys. Res., 122, 485–497, https://doi.org/10.1002/2016jd025581, 2017.
Wehner, B., Petaja, T., Boy, M., Engler, C., Birmili, W., Tuch, T., Wiedensohler, A., and Kulmala, M.: The contribution of sulfuric acid and non-volatile compounds on the growth of freshly formed atmospheric aerosols, Geophys. Res. Lett., 32, L17810, https://doi.org/10.1029/2005GL023827, 2005.
Wehner, B., Birmili, W., Ditas, F., Wu, Z., Hu, M., Liu, X., Mao, J., Sugimoto, N., and Wiedensohler, A.: Relationships between submicrometer particulate air pollution and air mass history in Beijing, China, 2004–2006, Atmos. Chem. Phys., 8, 6155–6168, https://doi.org/10.5194/acp-8-6155-2008, 2008.
Wehner, B., Berghof, M., Cheng, Y. F., Achtert, P., Birmili, W., Nowak, A., Wiedensohler, A., Garland, R. M., Pöschl, U., Hu, M., and Zhu, T.: Mixing state of nonvolatile aerosol particle fractions and comparison with light absorption in the polluted Beijing region, J. Geophys. Res., 114, D00G17, https://doi.org/10.1029/2008jd010923, 2009.
Wiedensohler, A.: An approximation of the bipolar charge distribution for particles in the submicron size range, J. Aerosol Sci., 19, 387–389, https://doi.org/10.1016/0021-8502(88)90278-9, 1988.
Wu, Z., Poulain, L., Wehner, B., Wiedensohler, A., and Herrmann, H.: Characterization of the volatile fraction of laboratory-generated aerosol particles by thermodenuder-aerosol mass spectrometer coupling experiments, J. Aerosol Sci., 40, 603–612, https://doi.org/10.1016/j.jaerosci.2009.03.007, 2009.
Wu, Z. J., Zheng, J., Shang, D. J., Du, Z. F., Wu, Y. S., Zeng, L. M., Wiedensohler, A., and Hu, M.: Particle hygroscopicity and its link to chemical composition in the urban atmosphere of Beijing, China, during summertime, Atmos. Chem. Phys., 16, 1123–1138, https://doi.org/10.5194/acp-16-1123-2016, 2016.
Wu, Z. J., Ma, N., Größ, J., Kecorius, S., Lu, K. D., Shang, D. J., Wang, Y., Wu, Y. S., Zeng, L. M., Hu, M., Wiedensohler, A., and Zhang, Y. H.: Thermodynamic properties of nanoparticles during new particle formation events in the atmosphere of North China Plain, Atmos. Res., 188, 55–63, https://doi.org/10.1016/j.atmosres.2017.01.007, 2017.
Xia, C., Sun, J., Qi, X., Shen, X., Zhong, J., Zhang, X., Wang, Y., Zhang, Y., and Hu, X.: Observational study of aerosol hygroscopic growth on scattering coefficient in Beijing: A case study in March of 2018, Sci. Total Environ., 685, 239–247, https://doi.org/10.1016/j.scitotenv.2019.05.283, 2019.
Xu, P., Zhang, J., Ji, D., Liu, Z., Tang, G., Jiang, C., and Wang, Y.: Characterization of submicron particles during autumn in Beijing, China, J. Environ. Sci., 63, 16–27, https://doi.org/10.1016/j.jes.2017.03.036, 2018.
Xu, W., Xie, C., Karnezi, E., Zhang, Q., Wang, J., Pandis, S. N., Ge, X., Zhang, J., An, J., Wang, Q., Zhao, J., Du, W., Qiu, Y., Zhou, W., He, Y., Li, Y., Li, J., Fu, P., Wang, Z., Worsnop, D. R., and Sun, Y.: Summertime aerosol volatility measurements in Beijing, China, Atmos. Chem. Phys., 19, 10205–10216, https://doi.org/10.5194/acp-19-10205-2019, 2019.
Xu, W., Ovadnevaite, J., Fossum, K. N., Lin, C., Huang, R.-J., O'Dowd, C., and Ceburnis, D.: Aerosol hygroscopicity and its link to chemical composition in the coastal atmosphere of Mace Head: marine and continental air masses, Atmos. Chem. Phys., 20, 3777–3791, https://doi.org/10.5194/acp-20-3777-2020, 2020.
Yang, S., Liu, Z., Clusius, P. S., Liu, Y., Zou, J., Yang, Y., Zhao, S., Zhang, G., Xu, Z., Ma, Z., Yang, Y., Sun, J., Pan, Y., Ji, D., Hu, B., Yan, C., Boy, M., Kulmala, M., and Wang, Y.: Chemistry of new particle formation and growth events during wintertime in suburban area of Beijing: Insights from highly polluted atmosphere, Atmos. Res., 255, 105553, https://doi.org/10.1016/j.atmosres.2021.105553, 2021.
Yang, X., Wang, L., Ma, P., He, Y., Zhao, C., and Zhao, W.: Urban and suburban decadal variations in air pollution of Beijing and its meteorological drivers, Environ. Int., 181, 108301, https://doi.org/10.1016/j.envint.2023.108301, 2023.
Ye, X., Tang, C., Yin, Z., Chen, J., Ma, Z., Kong, L., Yang, X., Gao, W., and Geng, F.: Hygroscopic growth of urban aerosol particles during the 2009 Mirage-Shanghai Campaign, Atmos. Environ., 64, 263–269, https://doi.org/10.1016/j.atmosenv.2012.09.064, 2013.
Yu, K., Zhu, Q., Du, K., and Huang, X.-F.: Characterization of nighttime formation of particulate organic nitrates based on high-resolution aerosol mass spectrometry in an urban atmosphere in China, Atmos. Chem. Phys., 19, 5235–5249, https://doi.org/10.5194/acp-19-5235-2019, 2019.
Yue, D., Hu, M., Wu, Z., Wang, Z., Guo, S., Wehner, B., Nowak, A., Achtert, P., Wiedensohler, A., Jung, J., Kim, Y. J., and Liu, S.: Characteristics of aerosol size distributions and new particle formation in the summer in Beijing, J. Geophys. Res., 114, D00G12, https://doi.org/10.1029/2008JD010894, 2009.
Yue, D. L., Hu, M., Zhang, R. Y., Wang, Z. B., Zheng, J., Wu, Z. J., Wiedensohler, A., He, L. Y., Huang, X. F., and Zhu, T.: The roles of sulfuric acid in new particle formation and growth in the mega-city of Beijing, Atmos. Chem. Phys., 10, 4953–4960, https://doi.org/10.5194/acp-10-4953-2010, 2010.
Zhang, S., Shen, X., Sun, J., Che, H., Zhang, Y., Liu, Q., Xia, C., Hu, X., Zhong, J., Wang, J., Liu, S., Lu, J., Yu, A., and Zhang, X.: Seasonal variation of particle hygroscopicity and its impact on cloud-condensation nucleus activation in the Beijing urban area, Atmos. Environ., 302, 119728, https://doi.org/10.1016/j.atmosenv.2023.119728, 2023.
Zhang, S. L., Ma, N., Kecorius, S., Wang, P. C., Hu, M., Wang, Z. B., Größ, J., Wu, Z. J., and Wiedensohler, A.: Mixing state of atmospheric particles over the North China Plain, Atmos. Environ., 125, 152–164, https://doi.org/10.1016/j.atmosenv.2015.10.053, 2016.
Zhang, Y., Sun, J., Zhang, X., Shen, X., Wang, T., and Qin, M.: Seasonal characterization of components and size distributions for submicron aerosols in Beijing, Sci. China Earth Sci., 56, 890–900, https://doi.org/10.1007/s11430-012-4515-z, 2012.
Zhang, Y., Wang, Y., Zhang, X., Shen, X., Sun, J., Wu, L., Zhang, Z., and Che, H.: Chemical Components, Variation, and Source Identification of PM1 during the Heavy Air Pollution Episodes in Beijing in December 2016, J. Meteorol. Res.-PRC, 32, 1–13, https://doi.org/10.1007/s13351-018-7051-8, 2018.
Zhao, C., Yu, Y., Kuang, Y., Tao, J., and Zhao, G.: Recent progress of aerosol light-scattering enhancement factor studies in China, Adv. Atmos. Sci., 36, 1015–1026, https://doi.org/10.1007/s00376-019-8248-1, 2019.
Zhao, J., Du, W., Zhang, Y., Wang, Q., Chen, C., Xu, W., Han, T., Wang, Y., Fu, P., Wang, Z., Li, Z., and Sun, Y.: Insights into aerosol chemistry during the 2015 China Victory Day parade: results from simultaneous measurements at ground level and 260 m in Beijing, Atmos. Chem. Phys., 17, 3215–3232, https://doi.org/10.5194/acp-17-3215-2017, 2017.
Zhong, J., Zhang, X., Wang, Y., Liu, C., and Dong, Y.: Heavy aerosol pollution episodes in winter Beijing enhanced by radiative cooling effects of aerosols, Atmos. Res., 209, 59–64, https://doi.org/10.1016/j.atmosres.2018.03.011, 2018.
Zhou, W., Zhao, J., Ouyang, B., Mehra, A., Xu, W., Wang, Y., Bannan, T. J., Worrall, S. D., Priestley, M., Bacak, A., Chen, Q., Xie, C., Wang, Q., Wang, J., Du, W., Zhang, Y., Ge, X., Ye, P., Lee, J. D., Fu, P., Wang, Z., Worsnop, D., Jones, R., Percival, C. J., Coe, H., and Sun, Y.: Production of N2O5 and ClNO2 in summer in urban Beijing, China, Atmos. Chem. Phys., 18, 11581–11597, https://doi.org/10.5194/acp-18-11581-2018, 2018.
Zhu, Q., Cao, L. M., Tang, M. X., Huang, X. F., and He, L. Y.: Characterization of Organic Aerosol at a Rural Site in the North China Plain Region: Sources, Volatility and Organonitrates, Adv. Atmos. Sci., 38, 1115–1127, https://doi.org/10.1007/s00376-020-0127-2, 2021.